


Abstract
Increasingly, residents prioritize diverse needs for residential buildings, hoping they can provide safe, comfortable, and healthy living environments. User satisfaction-based evaluation can significantly contribute to improving construction quality and optimizing construction management. Considering the strong subjectivity of existing assessment methods and the unreasonable allocation of indicator weights, this study establishes a feasible user satisfaction-based evaluation index system to provide a more objective evaluation of residential construction quality. By integrating the Analytic Hierarchy Process with the Fuzzy Comprehensive Evaluation method, a user satisfaction evaluation model is developed. A case study of a typical residential community in Zhongshan, Guangdong Province, was conducted to verify the scientific validity and applicability of the proposed model, demonstrating that it can effectively reduce the influence of subjective expert judgment. The results show that residents pay particular attention to leakage prevention and residential comfort, which is consistent with the current development trend of residential construction toward enhanced waterproofing performance and green development. The study provides real estate developers with theoretical support for improving construction quality management and optimizing residential living experience; contractors with practical references in optimizing the construction process; and urban–rural development departments with a scientific basis for strengthening supervision, creating acceptance standards, and implementing differentiated management policies.
1. Introduction
Since the beginning of the twenty-first century, the acceleration of urbanization in China has spurred continuous improvements in living standards. Accordingly, residential construction quality has become a major social concern and a widely discussed research topic [1,2]. Residential construction quality not only affects the safety, applicability, and durability of housing buildings but is also directly related to residents’ safety, comfort, and quality of life [1,2]. Nevertheless, quality problems relating to structural safety, functional defects, construction workmanship, and environmental and supporting facilities remain common during project delivery and even after occupancy, making residential construction quality a focal point of consumer complaints and, in some cases, a trigger for social conflict. Meanwhile, residents’ expectations of housing have evolved from basic shelter to diversified demands for multifunctional, intelligent, safe, livable, comfortable, and healthy housing [3]. Against this background, improving residential construction quality from the perspective of occupants while delivering high-quality housing has become an urgent priority for the construction industry.
User satisfaction evaluations of residential projects can reflect housing performance, safety, durability, and overall user experience, while providing valuable feedback for developers, contractors, and regulatory authorities. The key to revealing latent construction quality problems from the resident’s perspective lies in the scientific and objective assessment of residential user satisfaction [4]. Existing domestic studies on residential engineering quality have mainly focused on hard indicators such as construction technology, material performance, and acceptance criteria, whereas systematic analysis of user satisfaction remains insufficient, especially with respect to a unified indicator system and a rigorous evaluation model.
The current approaches to evaluating residential construction quality include both qualitative and quantitative approaches [5]. Common qualitative methods include questionnaire surveys and interviews, while quantitative approaches include standardized scoring, quantification of technical inspection data, multi-indicator comprehensive evaluation [6,7], grey theory [8,9], and big data analytics [10,11,12]. Among quantitative methods, multi-indicator evaluation approaches have been widely adopted because they can integrate multiple quality indicators into a comprehensive assessment framework. Current popular multi-indicator evaluation approaches include the Analytic Hierarchy Process (AHP) [13,14], the Fuzzy Comprehensive Evaluation (FCE) method [15,16], the Japanese building structural performance evaluation framework [17], and Singapore’s CONQUAS system [18]. AHP and FCE have become the most widely adopted approaches because they effectively account for the interactions among factors influencing residential construction quality while requiring relatively simple modeling procedures and readily obtainable data [19,20]. In the future, by leveraging process data from property maintenance systems, social media complaints, and smart home sensors, residential construction quality assessment will increasingly rely on next-generation technologies such as the Internet of Things (IoT) and big data analytics, gradually shifting from a “result-oriented acceptance” model to a “whole-process participation” model.
The goal of this paper is to promote the transformation of residential construction quality evaluation in Guangdong Province, China, from a “code-compliant” approach to a “user-satisfaction-oriented approach”, thereby fostering the high-quality development of the construction industry and achieving mutual benefits for residents, developers, and society. To accomplish this goal, this paper proposes a user-satisfaction-based evaluation index system, which integrates AHP and the FCE method to assess the quality of a residential construction project in Zhongshan, Guangdong Province. The proposed evaluation index system for residential construction quality effectively reduces the influence of subjective factors in both residents’ judgments and expert assessments.
2. Related Work
Existing studies on residential quality assessment are shown in Table 1 and can be classified into three broad categories. First, data statistical approaches, including factor analysis, regression analysis, and performance indices, are commonly used to identify important residential quality attributes [4,21,22]. However, these studies are always code-compliance oriented and focus on physical and technical indicators measured at delivery, rather than on residents’ post-occupancy satisfaction. Additionally, their results and indicator weights may be highly dependent on the survey sample, while professional judgments regarding the technical importance of different indicators are insufficiently incorporated. Second, AHP-based weighted scoring and post-occupancy evaluation approaches establish hierarchical indicator systems and determine the relative importance of indicators through pairwise comparisons [1,6,23], but conventional weighted scoring, importance performance analysis, and gap analysis cannot effectively represent the ambiguity of residents’ satisfaction evaluations. AHP provides a systematic, consistency-checked mechanism for deriving indicator weights, while FCE handles the fuzziness of construction performance evaluation data through membership functions and fuzzy synthesis. The integration of AHP and FCE can effectively reduce the influence of subjective judgments and yields a more transparent, objective, and resident-centered evaluation. The integrated AHP–FCE approaches [15,19], as the third category, have been applied to assess residential construction performance. However, these studies are based on single-case projects and rely mainly on subjective surveys and expert evaluations, without comprehensive evaluation from the perspective of users of general residential buildings. Additionally, relatively few studies have applied an integrated AHP–FCE framework to evaluate ordinary residential buildings in non-core urban areas, particularly third- and fourth-tier cities, where construction practices, management capacity, and residents’ expectations may differ from those in major metropolitan areas. This study contributes to the existing body of knowledge in four ways: (i) it derives the indicator system from an official provincial evaluation handbook, enhancing its practical applicability; (ii) it provides full details of the AHP weighting process, including expert demographics and aggregation rules; (iii) it incorporates sensitivity and importance performance analyses to identify priority indicators; and (iv) it validates the fuzzy evaluation result against an independent third-party quality assessment, providing external credibility.
Table 1.
Existing studies on residential construction quality assessment.
3. Data Sources and Residential Construction Quality Evaluation Indicators
The basic data used in this study were drawn from the 2024 construction project quality evaluation report of Zhongshan City, Guangdong Province. The report was compiled with reference to the Guangdong Handbook for the Implementation of Construction Project Quality Evaluation (Trial) issued by the Guangdong Department of Housing and Urban–Rural Development in 2022.
The handbook indicates that the major issues covered by the user satisfaction questionnaire for residential construction quality in Guangdong Province focus on seven aspects: leakage; cracking; pipeline and plumbing facilities; installation of doors, windows, glass, railings, and cabinets; public-area facilities; installation of water, electricity, ventilation systems, and intelligent equipment; and residential comfort. In this study, these seven aspects are treated as first-level indicators. They are further refined into 29 second-level indicators, including common-area water seepage, to establish the evaluation index system in Table 2.
Table 2.
Evaluation index system for user satisfaction with residential construction quality.
Survey data on residential user satisfaction were collected through a combination of household visits and telephone interviews. With support from the Zhongshan Municipal Housing and Urban–Rural Development Bureau, three representative town districts—Xiqu, Torch Development Zone, and Sanxiang Town—were initially selected. Within these districts, residential projects that had been delivered for more than one year but less than two years were identified as the sampling frame.
Ultimately, one representative residential community located near a railway line was selected for detailed investigation. The community consists of high-rise residential buildings (18–24 stories) completed approximately 18 months before the survey. A total of 569 households were contacted. For questionnaires with only a small number of missing responses, the affected entries were imputed using the median for numerical variables and the mode for categorical variables. Plausibility checks were also conducted to remove questionnaires containing patterned responses or obvious inconsistencies. Participation was voluntary and anonymous. No compensation was provided, and no sensitive personal information, such as identification numbers, was collected. As a result, 429 valid questionnaires were recovered, yielding a valid response rate of 75.4%. Five experts were selected by the Zhongshan municipal construction authority from its Construction Quality and Safety Expert Database. All five experts held senior engineer titles, had more than 15 years of professional experience, and served as key technical personnel in their respective organizations.
Table 3 summarizes the demographic and housing characteristics of the respondents. The sample included residents from different floor levels, tenure types, and household sizes. To assess representativeness, the distribution of key variables (e.g., floor level, tenure) was compared with the community’s overall household register provided by the property management office; the results may not be generalizable to other regions or building types.
Table 3.
Demographic and housing characteristics of the respondents.
4. Determination of Indicator Weights Based on the Analytic Hierarchy Process
AHP, proposed by Professor Thomas L. Saaty of the University of Pittsburgh in the 1970s, is a hierarchical decision-making method for determining weights. The essential procedure is to build a hierarchical structure model and determine the relative importance of factors using the 1–9 scale method, as shown in Table 4. Based on expert judgments, a comparison matrix is then constructed, as shown in Table 5. The eigenvalue method is used to calculate the relative weights of the matrix. To verify the rationality of the assigned weights, a consistency test of the judgment matrix was conducted. Assuming that an indicator consists of evaluation factors, the judgment matrix is expressed as
where . The consistency index (CI) is calculated as
where is the maximum eigenvalue of the judgment matrix. The consistency ratio (CR) is then calculated as
where denotes the random consistency index. When If , the consistency of the judgment matrix is considered acceptable. The weights of the evaluation indicators at each level were determined using the AHP and are denoted by , satisfying
Table 4.
Scale criteria for the judgment matrix.
Table 5.
The judgment matrix and the derived priority vector. Each cell value represents the relative importance of the row indicator over the column indicator (i.e., row/column).
The weight vector represents the influence of the first-level indicators on the overall objective, while represents the influence of the second-level indicators on the corresponding first-level indicator. The weight set corresponds to the evaluation factor set and is expressed as follows:
By calculating the weights and comprehensive weights of all levels, the final indicator weights are determined and shown in Table 2. Using the same procedure, the consistency ratios for the seven sets of second-level indicators are 0.0003, 0.0025, 0.0079, 0.0058, 0.0089, 0.0517, and 0.0036, respectively; all are below 0.1, indicating that the consistency requirement is satisfied.
We conducted a brief sensitivity analysis. Perturbations of ±10% were applied to the off-diagonal elements of the judgment matrix that had a relatively large influence on the weights, and the first-level indicator weights were recalculated. The results showed that the maximum change in any first-level indicator weight was less than 0.015, and the ranking of indicator importance remained unchanged. This indicates that the weight results are insensitive to minor changes in the judgment matrix and are therefore robust.
5. Determination of the Fuzzy Comprehensive Evaluation Model
Fuzzy comprehensive evaluation is based on fuzzy mathematics and derives from the concept of fuzzy sets proposed by Professor L. A. Zadeh [24]. Fuzzy comprehensive evaluation describes the fuzzy boundaries among factors by membership degrees, constructs a fuzzy matrix, and performs multi-level synthesis so that multiple evaluation objects can be comprehensively compared and ranked according to the resulting evaluation grades. In the residential user satisfaction index system, indicators differ in their influence on overall satisfaction. Weight assignment therefore highlights the effect of important indicators and makes the evaluation more objective. The indicator weights were derived from AHP based on the constructed index system, and an FCE model was established for the comprehensive evaluation of user satisfaction.
5.1. Evaluation Set
An evaluation factor set is established as , and an evaluation set is defined as , where represents the evaluation grade in the evaluation set (). Five linguistic evaluation grades—“Very Dissatisfied”, “Dissatisfied”, “Fair”, “Good”, and “Excellent”—are adopted to determine the evaluation result for each evaluation indicator. Accordingly, the evaluation set is defined as follows:
To facilitate the quantitative analysis of the qualitative evaluation results, the five evaluation grades are assigned numerical scores of 60, 70, 80, 90, and 100, respectively, using a 100-point scale. For each evaluation factor, the upper bound is taken as the maximum value of the corresponding interval, while the lower bound is taken as the minimum value. The resulting quantitative evaluation set is expressed as follows:
5.2. Determination of Fuzzy Membership Matrix
After establishing the evaluation factor set and the evaluation set, a fuzzy membership function is defined. Let denote the possibility that the evaluation indicator is classified into the evaluation grade, that is, the membership degree of indicator with respect to grade . Based on the membership function, the fuzzy membership matrix for each group of evaluation indicators is constructed as
where represents the fuzzy evaluation matrix of the first-level indicator, and the membership degrees are determined using the grade evaluation method. also represents the fuzzy membership degree of the evaluation indicator , belonging to evaluation grade . The satisfaction ratings obtained from the questionnaire survey were adopted as the linguistic evaluation set for the fuzzy evaluation model. The membership function transformation method was employed to convert the proportion of respondents selecting each satisfaction level for a given indicator into its corresponding membership degree with respect to the evaluation set. Accordingly, the fuzzy membership matrix for each second-level evaluation indicator was established, as shown in Table 6.
Table 6.
Fuzzy evaluation matrix of membership degrees for Level-2 indicators.
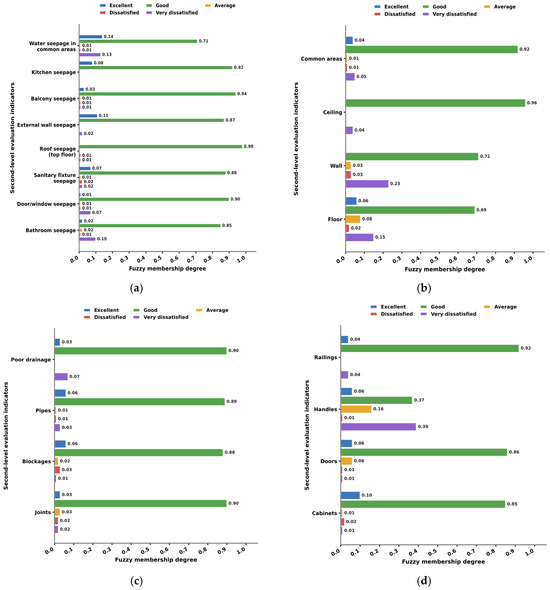
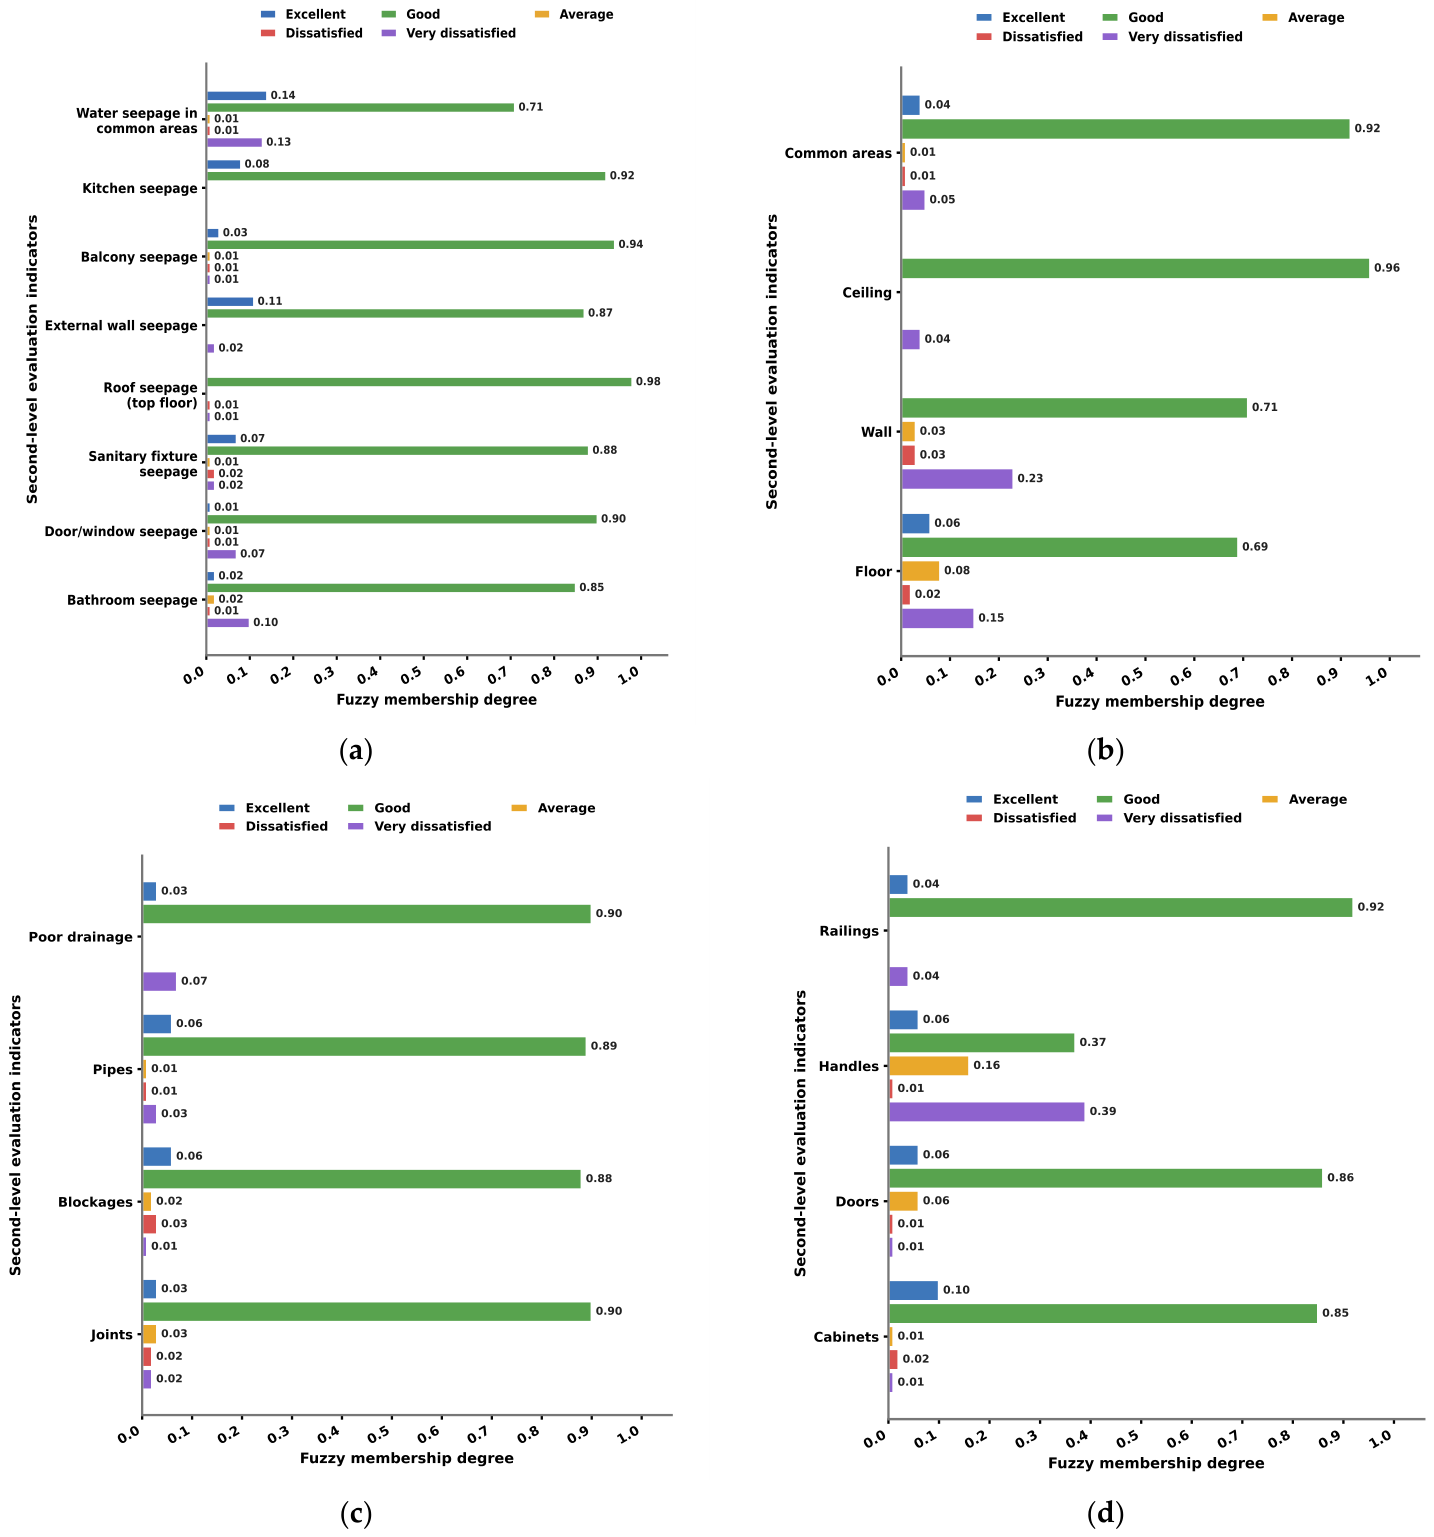
Figure 1 illustrates the fuzzy membership distributions of the Level-2 evaluation indicators for residential construction quality. Assuming that a higher combined fuzzy membership degree for “Excellent” and “Good” indicates higher user satisfaction, Figure 1a shows that users were generally satisfied with the leakage-related aspects of residential construction quality. The leakage indicator has the highest primary weight (0.2928) in this study, reflecting great emphasis on waterproofing quality. In terms of resident satisfaction, the membership degrees of “good” for indicators such as kitchen leakage, balcony leakage, and exterior wall leakage all exceed 0.87, indicating that the overall waterproofing construction quality is generally recognized by residents. However, satisfaction with roof leakage (top floor) and bathroom leakage is relatively lower; in particular, roof leakage affects only top-floor residents, yet the proportion of dissatisfaction among the effective sample is relatively high. This suggests that vulnerable waterproofing areas are mainly concentrated in structurally complex zones such as roof joints and bathrooms, which is related to construction difficulty and inadequate treatment of joints. Therefore, construction units should focus on strengthening the quality of detailed waterproofing structures in these areas, rather than merely satisfying compliance with specifications in large-scale zones.
Figure 1.
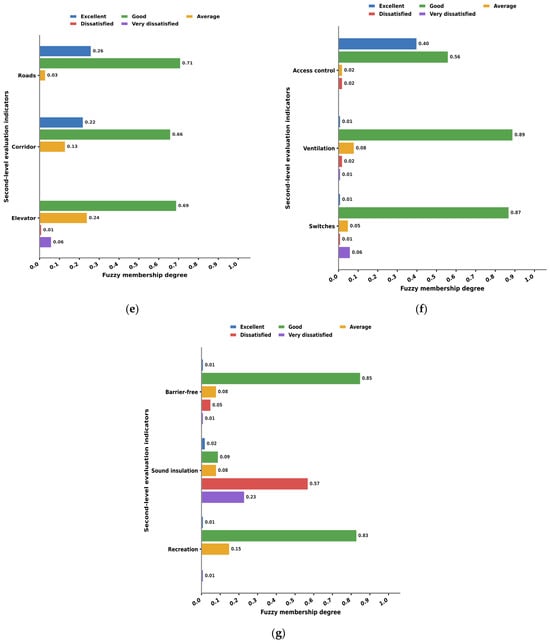
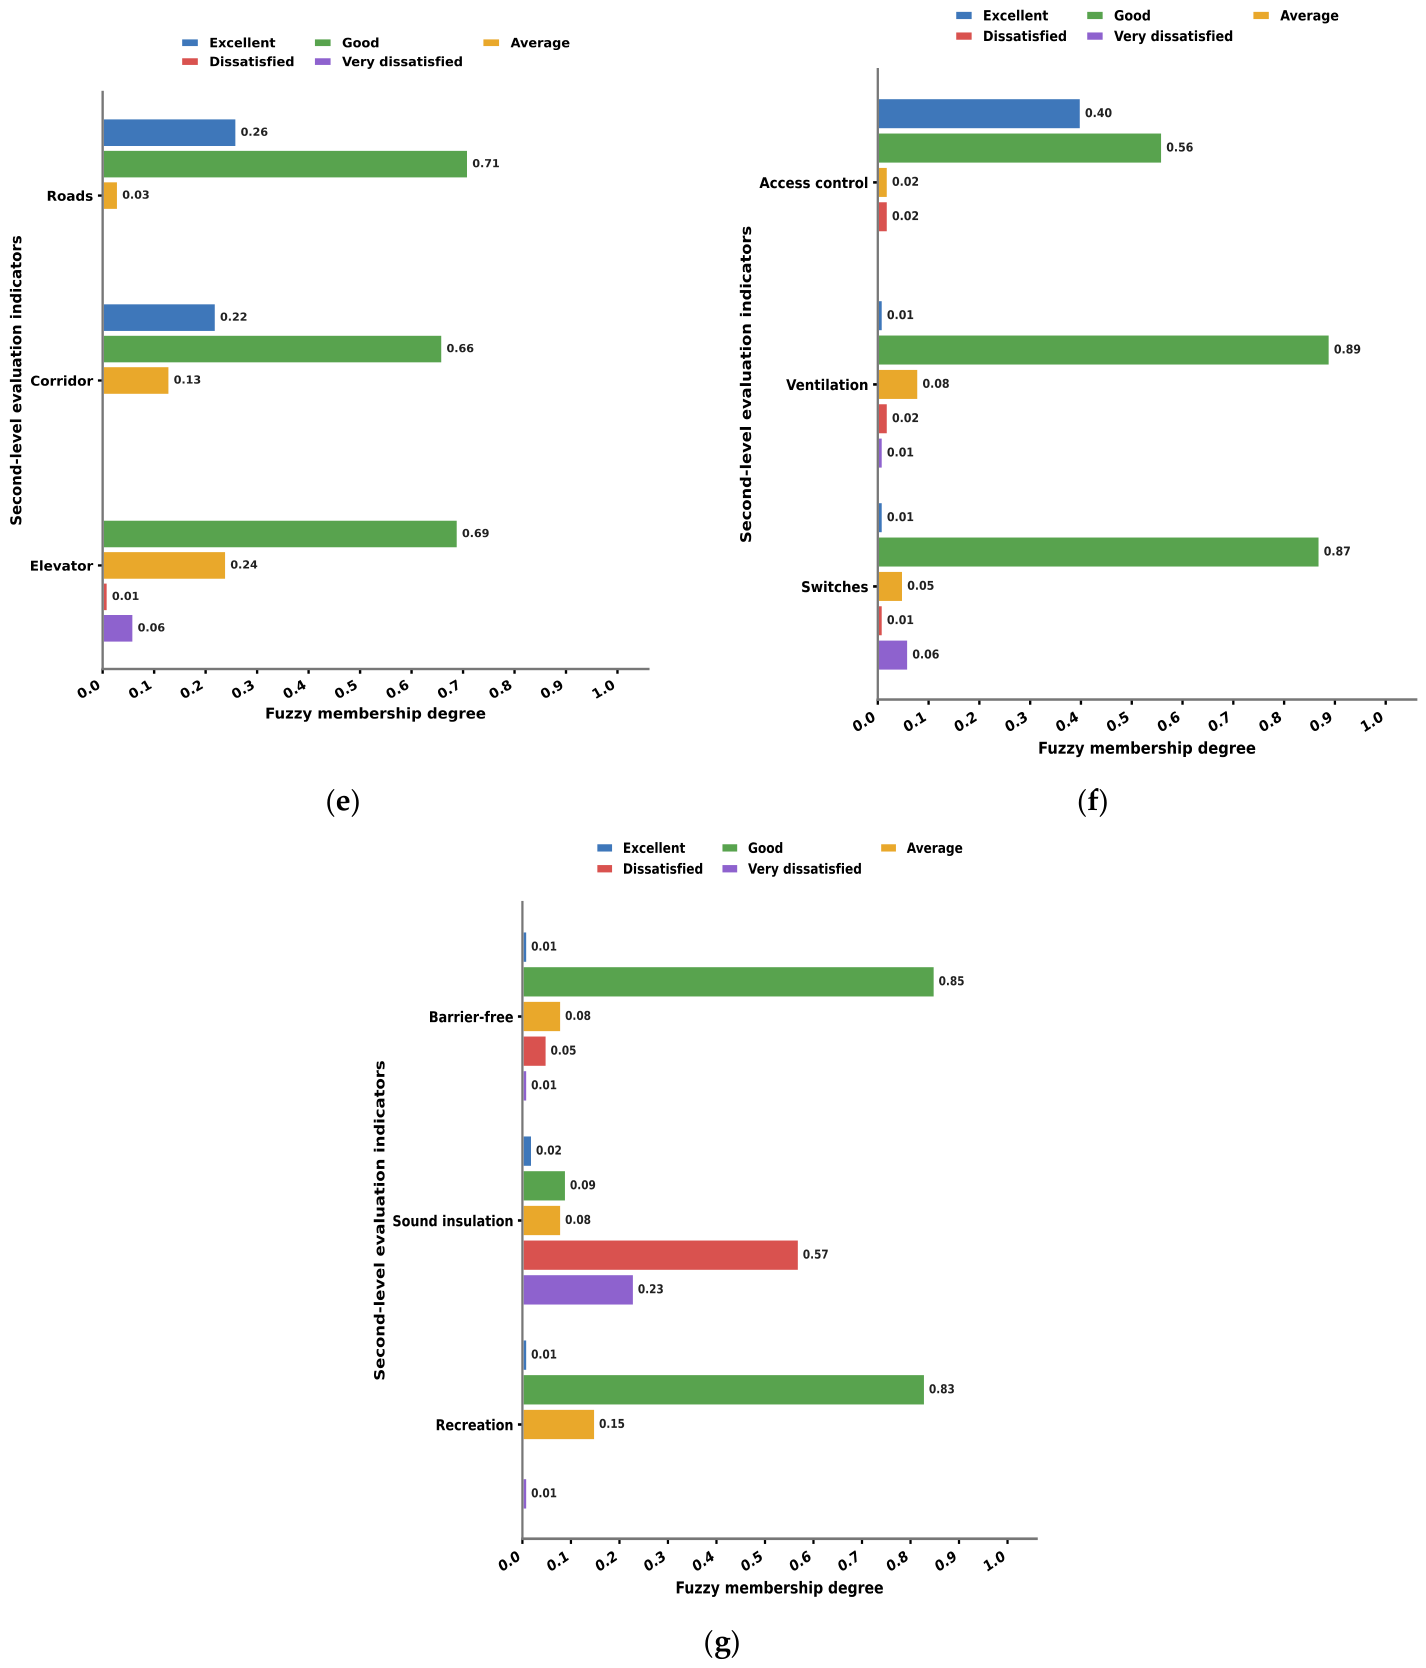
Fuzzy membership distributions of Level-2 evaluation indicators for residential construction quality: (a) leakage; (b) cracking; (c) pipeline and plumbing facilities; (d) doors/windows/glass/railings/cabinet; (e) public-area facilities; (f) utilities, ventilation, and intelligent equipment; (g) residential comfort.
Figure 1b indicates that users reported relatively high satisfaction with cracking performance, particularly for ceiling and common-area cracking, whereas wall and floor cracking received comparatively lower satisfaction ratings. Figure 1c demonstrates that pipeline and plumbing facilities achieved the highest overall user satisfaction, with all level-2 indicators exhibiting consistently high combined membership degrees for “Excellent” and “Good”. Figure 1d shows that users were generally satisfied with doors, windows, glass, railings, and cabinets. Figure 1e reveals that public-area facilities also achieved relatively high satisfaction, with road conditions receiving the highest rating, followed by corridors, while elevator operation showed comparatively lower satisfaction. Figure 1f indicates that users expressed high satisfaction with utilities, ventilation, and intelligent equipment, especially access control systems, while ventilation and electrical facilities also performed well.
Figure 1g shows that residential comfort received the lowest overall user satisfaction among all first-level indicators. The sound insulation indicator has the highest comprehensive weight (0.1095) in this study, yet its satisfaction score ranks the lowest, making it a typical high-importance, low-performance indicator. The community is adjacent to a railway line, but the window and door sound insulation design did not account for the significant noise generated by passing trains, which is the primary objective reason for the low satisfaction with sound insulation. This phenomenon reveals a common issue in current residential construction: inadequate consideration of the surrounding noise environment during the design phase, insufficient quality control over door and window sealing and sound insulation structures during the construction phase, and ultimately, concentrated complaints from residents after occupancy. Therefore, sound insulation design should be integrated at the preliminary planning stage; designers should visit the project’s surrounding environment on site and ensure implementation during construction and acceptance inspections.
5.3. Calculation of the First-Level Evaluation Result Matrix
In each secondary evaluation indicator, the corresponding indicator weights must be incorporated to accurately reflect the overall influence of all evaluation indicators. The comprehensive evaluation model for each factor is expressed as
where is the fuzzy membership vector (or matrix) of indicator , i.e., . The symbol ‘’ denotes the fuzzy synthesis operator, which performs the fuzzy operation between the weight vector and the fuzzy membership matrix . represents the evaluation result vector of the evaluation indicator, while denotes the degree to which the evaluation indicator belongs to the evaluation grade. According to the above illustration, the first-level indicator Cracking () is taken as an example to calculate its fuzzy membership vector:
Similarly, the fuzzy membership vectors , , , , , can be determined using the same procedure. Subsequently, the fuzzy comprehensive evaluation model is established to calculate the fuzzy membership vectors of the first-level evaluation indicators. The results are presented in Table 7.
Table 7.
Fuzzy membership degrees for first-level evaluation indicators.
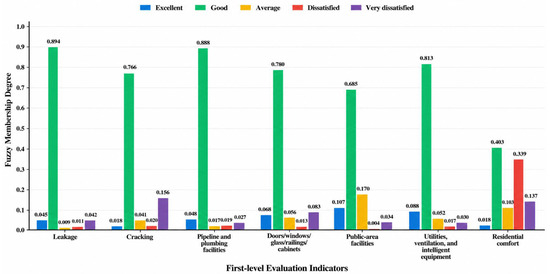
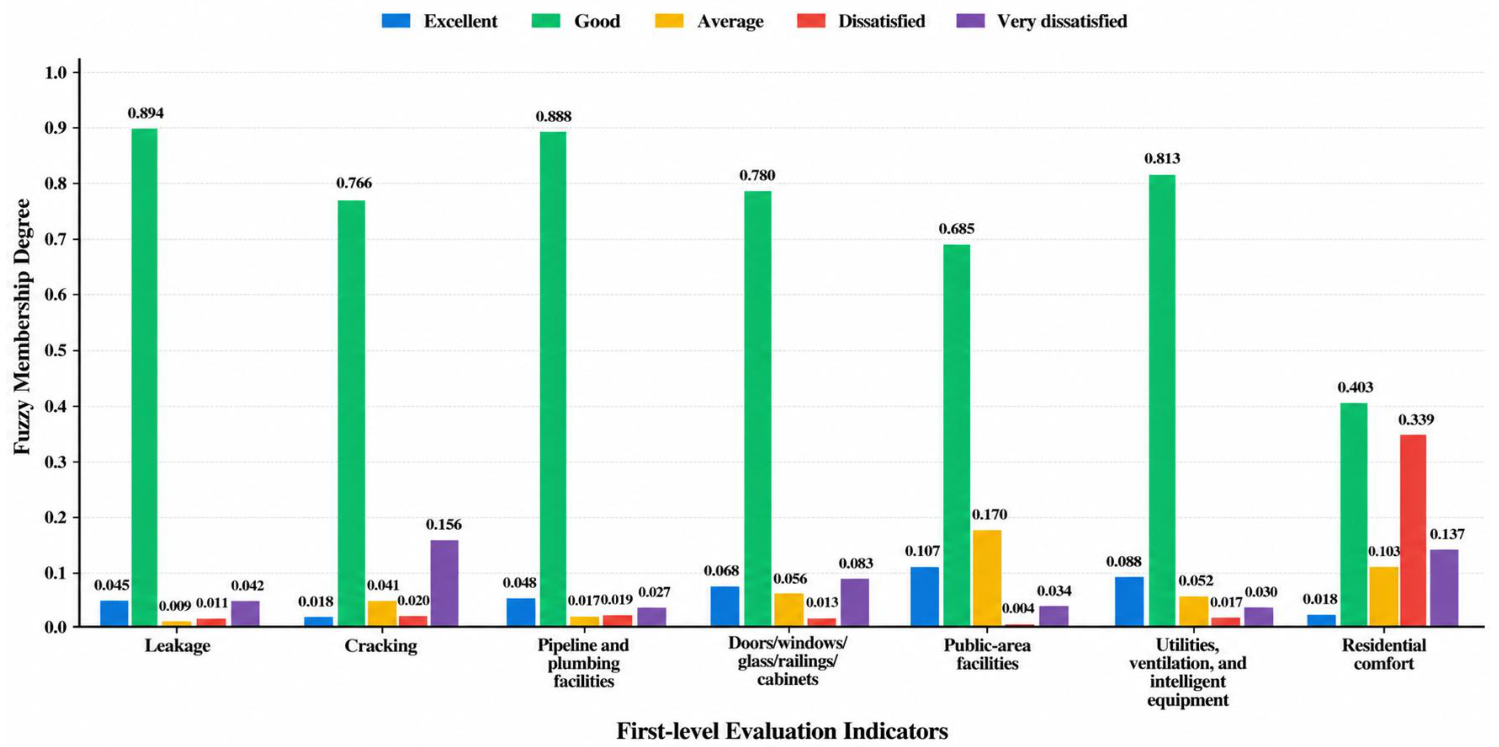
Suppose that a higher combined fuzzy membership degree for “Excellent” and “Good” indicates higher user satisfaction with a particular aspect of residential construction quality. Figure 2 reveals clear differences among the first-level evaluation indicators. Pipeline and plumbing facilities achieved the highest level of user satisfaction, with a fuzzy membership degree of 0.0476 for “Excellent” and 0.8880 for “Good”. This was followed by utilities, ventilation, and intelligent equipment, with membership degrees of 0.0878 for “Excellent” and 0.8129 for “Good”, indicating similarly high user satisfaction. In contrast, residential comfort exhibited the highest combined fuzzy membership degree for “Dissatisfied” and “Very dissatisfied” (0.3387 + 0.1371 = 0.4758), suggesting that residential comfort is the aspect with the greatest user dissatisfaction. This finding highlights the need for more human-centered residential building design and construction, with greater emphasis on improving occupants’ comfort, livability, and overall residential experience.
Figure 2.
Fuzzy membership degrees of first-level evaluation indicators for residential construction quality.
5.4. Higher-Level Fuzzy Comprehensive Evaluation
Based on the fuzzy membership degrees of the first-level evaluation indicators, the fuzzy evaluation matrix , which maps the evaluation factor set to the evaluation set , is determined. Similarly, using the indicator weight vector obtained from the AHP, the comprehensive user satisfaction evaluation vector is calculated using the same fuzzy synthesis operator as in Formula (9). The final evaluation result is obtained by performing fuzzy synthesis of the evaluation matrix and the corresponding indicator weights. Accordingly, the fuzzy membership vector of the target layer is calculated as follows:
The membership degree corresponding to the evaluation grade “Excellent” is 0.0486, while the membership degrees for “Good,” “Fair,” “Dissatisfied,” and “Very Dissatisfied” are 0.7520, 0.0502, 0.0750, and 0.0744, respectively. Since the highest membership degree is associated with the “Good” evaluation grade, the overall satisfaction of residents with the quality of the residential construction project can be considered good.
5.5. Comprehensive Evaluation of User Satisfaction on Residential Construction Quality
The final evaluation results are determined from the fuzzy evaluation set, which qualitatively reflects the membership degree of each evaluation grade. According to the scoring rule for the user satisfaction evaluation grades, the comprehensive evaluation score is calculated as
The calculated comprehensive satisfaction score for the quality of the residential construction project is 86.27, which falls between 80 and 90. According to the user satisfaction evaluation criteria, the overall evaluation grade is classified as “Good”. This evaluation is consistent with the quality rating obtained through the standard assessment procedures conducted by an independent third-party inspection agency, which also classified the residential construction project as “Good.” The strong agreement between the fuzzy comprehensive evaluation results and the independent third-party assessment demonstrates the reliability and validity of the proposed evaluation method. Overall, the results suggest that the residential construction projects in the investigated areas have achieved satisfactory overall construction quality, and residents report a relatively high level of satisfaction.
6. Conclusions
This study combines the analytic hierarchy process and the fuzzy comprehensive evaluation method to develop a user-satisfaction-based evaluation model for residential construction quality. A case study was conducted to verify the scientific validity and practical applicability of the proposed model. The model effectively reduces the influence of subjective factors in expert judgment, and its evaluation results provide a more objective and comprehensive reflection of residents’ actual perceptions and satisfaction with residential construction quality. The main conclusions are as follows:
- (1)
- The overall user satisfaction score of the representative residential community is 86.27, corresponding to the grade “Good”, which is broadly consistent with the independent third-party assessment result.
- (2)
- Among the first-level indicators, pipeline and plumbing facilities show the highest user satisfaction. Their membership degree for “Excellent” is 0.0476, while the membership degree for “Good” reaches 0.8880. This is consistent with the actual condition of the community, which was delivered only slightly more than one year earlier and therefore had relatively new pipeline equipment with limited aging or damage.
- (3)
- Among the second-level indicators, the lowest user satisfaction is associated with the acoustic environment involving upstairs and downstairs units, neighboring units, corridors, and indoor–outdoor sound insulation. The proportion of “Dissatisfied” users is 57%, and that of “Very Dissatisfied” users is 24%. According to the survey, the community is located near a railway line, and its doors and windows were not specially designed for sound insulation, resulting in substantial train noise. Influenced by this second-level indicator, the first-level indicator with the lowest user satisfaction is residential comfort. Its membership degree for “Dissatisfied” is 0.3387, and that for “Very Dissatisfied” is 0.1371, indicating that contemporary residents are paying increasing attention to sound insulation performance, residential comfort, and green-building quality.
In summary, the results highlight that residents are particularly concerned with leakage prevention and residential comfort, which is consistent with the current trend in housing products toward stronger anti-leakage functionality and green building practice. The study also provides real estate developers with theoretical support for improving construction quality management and optimizing residential living experience; contractors with practical references in optimizing the construction process; and urban–rural development departments with a scientific basis for strengthening supervision, creating acceptance standards, and implementing differentiated management policies. Research on user satisfaction with residential construction quality can be further integrated with digital technologies so that the evaluation system evolves from “static diagnosis” to “dynamic governance” and ultimately achieves the concept that user demand drives construction quality improvement.
The survey in this study was conducted solely within a single residential community in Zhongshan City, where the residential buildings had been in use for less than two years. Although different floor levels and unit layouts were covered, the building type was limited to residential housing, and the geographic scope was limited to Zhongshan City alone; consequently, long-term usage issues beyond the warranty period were not addressed. Therefore, the findings may not fully apply to other cities in Guangdong Province. On the other hand, the indicator framework adopted in this study primarily focuses on quality issues directly perceptible to occupants after project completion and handover, while it does not provide in-depth analysis of aspects such as energy performance or long-term maintenance costs. In future research, the sample scope can be expanded to include residential projects in different cities, of various structural types, and with different delivery ages. Moreover, an evaluation model combining objective testing indicators with subjective satisfaction indicators could be introduced to further enhance the applicability and explanatory power of the model.
Author Contributions
X.C.: Conceptualization, Data Curation, Methodology, Writing—Original Draft, and Writing—Review and Editing. J.L. (Junrong Lu): Investigation, Methodology, and Writing—Review and Editing. W.Z.: Investigation, Methodology, and Writing—Review and Editing. C.M.: Methodology and Writing. J.D.: Validation and Writing—Review and Editing. J.L. (Jian Liu): Data Curation and Writing—Original Draft. All authors have read and agreed to the published version of the manuscript.
Funding
This research received no external funding.
Institutional Review Board Statement
The study was conducted in accordance with the Declaration of Helsinki. Ethical review and approval were waived because this study involved a non-interventional and anonymous resident-satisfaction survey conducted as part of a residential construction quality assessment. The survey did not collect personally identifiable, sensitive, or clinical information and posed no foreseeable risk to the participants.
Informed Consent Statement
Informed consent for participation was obtained from all participants involved in the study. Before completing the questionnaire, participants were informed of the purpose of the research, the voluntary nature of their participation, the anonymity of their responses, and how the collected data would be used. No personally identifiable information was collected, and the results are reported only in an aggregated form. Consent for publication was not applicable because the manuscript contains no identifiable participant information, images, or personal details.
Data Availability Statement
The data that support the findings of this study are available from the corresponding author upon reasonable request.
Conflicts of Interest
The authors declare no conflicts of interest.
References
- Lai, J.H.; Yik, F.W. Perception of importance and performance of the indoor environmental quality of high-rise residential buildings. Build. Environ. 2009, 44, 352–360. [Google Scholar] [CrossRef] [Scilit]
- Sulaiman, Z.; Ali, A.S.; Ahmad, F. Abandoned housing project: Assessment on resident satisfaction toward building quality. Open House Int. 2012, 37, 72–80. [Google Scholar] [CrossRef] [Scilit]
- Preece, J.; Crawford, J.; McKee, K.; Flint, J.; Robinson, D. Understanding changing housing aspirations: A review of the evidence. Hous. Stud. 2020, 35, 87–106. [Google Scholar] [CrossRef] [Scilit]
- Zhu, C.; Jin, S.; Zhang, J.; Zhang, H. Construction of residential quality assessment system using factor analysis method based on residents’ satisfaction survey: Case study of Beijing, China. J. Asian Archit. Build. Eng. 2023, 22, 3253–3270. [Google Scholar] [CrossRef] [Scilit]
- Sinha, R.C.; Sarkar, S.; Mandal, N.R. An overview of key indicators and evaluation tools for assessing housing quality: A literature review. J. Inst. Eng. Ser. A 2017, 98, 337–347. [Google Scholar] [CrossRef] [Scilit]
- Kim, S.-S.; Yang, I.-H.; Yeo, M.-S.; Kim, K.-W. Development of a housing performance evaluation model for multi-family residential buildings in Korea. Build. Environ. 2005, 40, 1103–1116. [Google Scholar] [CrossRef] [Scilit]
- Zhang, L.; Liang, T.; Wei, X.; Wang, H. An improved indicator standardization method for multi-indicator composite evaluation: A case study in the evaluation of ecological civilization construction in China. Environ. Impact Assess. Rev. 2024, 108, 107600. [Google Scholar] [CrossRef] [Scilit]
- Chen, Y.; Liu, E.; Shao, Y. The study on synthetic evaluation method for service quality of property management of residence based on a hierarchical grey analysis. In Proceedings of the 2009 6th International Conference on Service Systems and Service Management, Xiamen, China, 8–10 June 2009; pp. 415–419. [Google Scholar]
- Bai, L.; Wang, H.; Shi, C.; Du, Q.; Li, Y. Assessment of SIP buildings for sustainable development in rural China using AHP-grey correlation analysis. Int. J. Environ. Res. Public Health 2017, 14, 1292. [Google Scholar] [CrossRef] [Scilit]
- Gulghane, A.; Sharma, R.; Borkar, P. Quantification analysis and prediction model for residential building construction waste using machine learning technique. Asian J. Civ. Eng. 2023, 24, 1459–1473. [Google Scholar] [CrossRef] [Scilit]
- Liu, C.; Zhang, Q.; Fan, Y.; Lin, G.; Huang, Z. Research on diagnosis and assessment processes and methods for existing residential buildings based on intelligent assistance models. Buildings 2024, 14, 3062. [Google Scholar] [CrossRef] [Scilit]
- Kostyshyna, N.; Chernyshev, D.; Tsiutsiura, M.; Yerukaiev, A.; Rusan, N.; Jawad, A.M.; Al-Athari, F.M. An Evaluation Approach Enhancing Apartment Building Comfort through Artificial Intelligence. In Proceedings of the 2024 35th Conference of Open Innovations Association (FRUCT), Tampere, Finland, 24–26 April 2024; pp. 380–387. [Google Scholar]
- Raut, R.D.; Mahajan, V.C. A new strategic approach of fuzzy-quality function deployment and analytical hierarchy process in construction industry. Int. J. Logist. Syst. Manag. 2015, 20, 260–290. [Google Scholar] [CrossRef] [Scilit]
- Zhang, K.; Lee, J.E. Assessing the operational capability of disaster and emergency management resources: Using analytic hierarchy process. Sustainability 2024, 16, 3933. [Google Scholar] [CrossRef] [Scilit]
- Zhang, S.; Xu, N. Application of the Post-Evaluation of Residential Real Estate Projects Based on Fuzzy Comprehensive Evaluation. In ICCREM 2013: Construction and Operation in the Context of Sustainability; American Society of Civil Engineers: Reston, VA, USA, 2013; pp. 1227–1231. [Google Scholar]
- Xue, B.; Lu, F.; Guo, J.; Wang, Z.; Zhang, Z.; Lu, Y. Research on energy efficiency evaluation model of substation building based on AHP and fuzzy comprehensive theory. Sustainability 2023, 15, 14493. [Google Scholar] [CrossRef] [Scilit]
- Hiraishi, H.; Midorikawa, M.; Teshigawara, M.; Gojo, W.; Okawa, I. Performance-based building code of Japan-framework of seismic and structural provisions. In Proceedings of the 12th World Conference on Earthquake Engineering, Auckland, New Zealand, 30 January–4 February 2000. [Google Scholar]
- Kam, C.; Tang, S. Development and implementation of quality assurance in public construction works in Singapore and Hong Kong. Int. J. Qual. Reliab. Manag. 1997, 14, 909–928. [Google Scholar] [CrossRef] [Scilit]
- Hou, H.C.; Wang, Y.; Lan, H. Student residential apartment performance evaluation using integrated AHP-FCE method. J. Build. Eng. 2023, 67, 106000. [Google Scholar] [CrossRef] [Scilit]
- Sun, J.; Wu, Y.; Dai, Z.; Hao, Y. Fuzzy comprehensive evaluation model and influence factors analysis on comprehensive performance of green buildings. In Proceedings of the Sixth International Conference for Enhanced Building Operations, Shenzhen, China, 6–9 November 2006. [Google Scholar]
- Zhong, Z.; Gou, Z. High-rise apartment quality evaluation and related demographic factors: Lesson from RentSafeTO programme. Build. Res. Inf. 2023, 51, 430–445. [Google Scholar] [CrossRef] [Scilit]
- Ibem, E.O.; Opoko, A.P.; Adeboye, A.B.; Amole, D. Performance evaluation of residential buildings in public housing estates in Ogun State, Nigeria: Users’ satisfaction perspective. Front. Archit. Res. 2013, 2, 178–190. [Google Scholar] [CrossRef] [Scilit]
- Hou, H.C.; Lai, J.H.; Edwards, D. Gap theory based post-occupancy evaluation (GTbPOE) of dormitory building performance: A case study and a comparative analysis. Build. Environ. 2020, 185, 107312. [Google Scholar] [CrossRef] [Scilit]
- Zadeh, L.A. Fuzzy sets. Inf. Control 1965, 8, 338–353. [Google Scholar] [CrossRef] [Scilit]

Disclaimer/Publisher’s Note: The statements, opinions and data contained in all publications are solely those of the individual author(s) and contributor(s) and not of MDPI and/or the editor(s). MDPI and/or the editor(s) disclaim responsibility for any injury to people or property resulting from any ideas, methods, instructions or products referred to in the content. |
© 2026 by the authors. Licensee MDPI, Basel, Switzerland. This article is an open access article distributed under the terms and conditions of the Creative Commons Attribution (CC BY) license.