


Abstract
Digital ceramic printing enables visually versatile, coloured building-integrated photovoltaics (BIPV) for architecturally sensitive contexts. However, printed frontglass patterns attenuate incident light and introduce local shading, increasing hotspot risk and efficiency losses. Designers currently lack integrated methods to evaluate these trade-offs prior to module fabrication. To bridge this gap, we present an end-to-end workflow that predicts the relative efficiency (RE), layer composition, and effective colour of printed PV modules directly from printer-ready RIP files. A physically motivated multilayer printing simulation determines the ink layer surface coverage and resulting RE. Preliminary tests show low bias, with simulated RE deviations within ca. ±5% (mean 0.28%, = 3.26%). Inverting the simulated RE through multivariate regression yields the layer compositions for a target RE. The effective colour is predicted in colourspace by a trained neural network with a mean CIE difference of 1.86 ( = 0.92). Effective colours may be grouped into equificiency classes with an RE difference of 5–10% to support flexible design exploration within target efficiency margins and hotspot mitigation. Three case studies demonstrate the workflow’s applicability across educational, design, and built domains, including a full-scale façade installation.
1. Introduction
As the demand for renewable energy grows, building-integrated photovoltaics (BIPVs) offer a means to combine energy generation with architectural function and appearance [1]. While a rooftop PV installation is desirable for optimal power generation, roof space on buildings—particularly high-rises—is limited. Building façades, on the other hand, expose far more area to sunlight that can be leveraged for energy generation by integrating the PV modules directly into the façade. Building façades play a two-fold role: a functional role by protecting the building against the elements, and an aesthetic role in the form of architectural expression. However, the black or mottled blue appearance of standard mono- and polycrystalline PV modules, respectively, can visually degrade the aesthetics of the façade, leading to poor acceptance by architects and stakeholders. This conflict is particularly challenging when retrofitting existing buildings, particularly in sensitive urban or heritage settings which mandate visual harmony [2].
Coloured BIPVs offer an effective solution to address this issue by concealing the PV modules behind a coloured layer that visually blends in with the façade and its surroundings when observed from a distance. Depending on the specific colouring solution, BIPV modules can be either monochromatic or polychromatic motifs, with the latter including patterns, continuous tone images and photographs. This expands the architectural potential of BIPVs by supporting visual integration with façades to preserve the general appearance of the building.
Coloured BIPVs consist of a colouring layer laminated with a PV module. The colouring layer reflects part of the visual solar irradiation as perceived colour, while transmitting the remaining irradiation—notably in the infra-red band—to the underlying PV cells for power generation. In addition, some energy is also absorbed by the colouring layer [3]. Consequently, the colouring layer results in energy loss, the magnitude of which depends on the specific colouring technology. A central challenge in successfully deploying BIPVs therefore entails reconciling the aesthetics (colour range, lightness and saturation) with energy yield.
Digital ceramic printing is a popular BIPV colouring technology due to its low cost and aesthetic flexibility, as it enables the application of polychromatic motifs such as repeating patterns and continuous-tone images. The technology is also durable against UV exposure as well as moisture and is compatible with standard prefabricated PV cells. A disadvantage of this technology is a higher energy loss compared to other colouring technologies (typically 10–50%) [4]. These losses are particularly significant if polychromatic motifs and patterns impart local shading on the underlying PV cells. Persistent local shading can lead to current imbalances (“hotspots”) among the PV cells, causing overheating with temperatures in excess of 130 °C and premature failure of the module [5].
Standardised European colour systems such as RAL (Reichs-Ausschuss für Lieferbedingungen und Gütesicherung) [6] and NCS (Natural Colour System) [7] are widely used in practice for communication and selection of BIPV colour options, particularly when balancing aesthetic and performance considerations [8,9]. However, the observed or effective post-lamination colour of a ceramically printed PV module depends on complex interactions between the ceramic layer, glass substrate, encapsulants, and cell background (Figure 1), with additional shifts introduced during firing and lamination [10,11].
Figure 1.
(Left) Digital ceramic print file using the primary colours green and black; the grey lines print transparently and appear black after lamination, while the green regions darken in the final module. (Centre) Standard PV module (MegaSlate by 3S Swiss Solar Solutions AG, 195 Wp) with visible busbars. (Right) Simulated effective colours after lamination of printed glass and PV module.
In established processes, physical coloured BIPV modules are fabricated and laminated for visual inspection and electrical measurement to determine the effective colour and RE, respectively. More exacting processes may also objectively assess the effective colour through colourimetry. Colourimetric models in spaces such as CIE (Commission Internationale de l’Éclairage) are therefore required to assess visual outcomes under realistic conditions [3,12].
The fabrication of physical samples—particularly in limited numbers for bespoke orders—is costly and wastes resources if the modules are rejected. It is therefore desirable to predict the energy losses and effective colour of the finished product through computational simulation, at the design stage, significantly reducing the need for physical prototypes. In the context of ceramic printing, this also enables exploring different polychromatic designs in terms of energy losses and potential hotspot formation. This, in turn, enables the designer to optimise the motifs to balance losses with aesthetics, and minimise hotspots. Furthermore, the appearance of the laminated module can be assessed and adapted to achieve a particular desired colour, saturation or lightness.
This paper proposes such a computational simulation as part of an end-to-end workflow for ceramically printed BIPV. The workflow is driven by a ceramic printing simulation that accepts the printer-ready raster image process (RIP) data from the motifs. Based on the simulation, the workflow predicts both the relative efficiency (RE), compared to transparent glass, as a measure of energy loss incurred by the ceramic inks. In addition, the workflow also predicts the effective colour of the laminated module. In doing so, the workflow links design parameters to performance and appearance within a unified framework.
A central concept to this approach is the use of equificient colours, i.e., distinct colours that are energetically matched with respect to their RE within an adequately defined tolerance. Equificient colours enable flexible exploration of design alternatives without significantly compromising performance. Grouping colours into equificiency classes supports RE equalisation and hotspot mitigation while preserving visual intent.
The proposed workflow was developed in close collaboration with an experienced industrial partner and is positioned alongside existing simulation-based approaches as a practical, design-oriented extension. Its applicability is demonstrated through three case studies spanning design, education and full-scale realisation. Overall, the proposed approach enables prediction of RE and effective colour directly from RIP files, leveraging equificient colours to reconcile the constraints imposed by a given target RE with architectural design flexibility.
2. Related Work and Contributions
A multitude of BIPV colouring technologies are available both in research and commercial settings and have been comprehensively reviewed [4,13,14,15]. Subsets of these have also been directly compared in smaller studies [3,16]. Among these, the most popular colouring technologies include multilayer antireflective coatings with spectrally selective reflectance [17], multilayer interferential thin films [18,19,20], Bragg reflectors inspired by the Morpho butterfly [21,22], coloured encapsulants [23,24] and UV lithography [25].
Each colouring technology has specific advantages and drawbacks pertaining to perceived colour range and quality, energy loss, cost, durability under exposure to UV radiation and the elements, and compatibility with standard PV production pipelines. While these technologies yield vibrant (monochromatic) colours and low energy losses, some suffer from limited durability, angular dependence of observed colour, complex fabrication, and relatively high cost.
Post-fabrication colouring technologies consist of laminating the colouring layer to a standard PV module, making these solutions more flexible and compatible with existing production lines. This significantly lowers costs, particularly for limited-run, bespoke BIPV modules. Unlike some of the aforementioned colouring technologies, notably interferential films, post-fabrication colouring does not shift with the incident and observation angles with respect to hue or lightness. Post-fabrication colouring solutions include printed foils [4], printed textiles [26], and ceramic printing (including deposition by screen, roller, or digital means) [9,10,27,28,29,30,31,32,33,34].
Digital ceramic printing enables visually versatile coloured BIPV at low cost, allowing customised patterns and continuous-tone images to be applied directly to the PV frontglass. To this end, ceramic inks, typically consisting of metal oxides or frit-based pigments, are applied by an inkjet printer to the PV module’s frontglass prior to lamination. The inks are then subsequently fused onto the frontglass through firing at high temperature (around 650 °C). The result is a very durable, semitransparent colouring layer that is subsequently laminated with the PV module, thus protecting it from the elements. Unlike some other PV colouring technologies, ceramic printing is not limited to homogeneous colours, but can also accommodate continuous-tone motifs such as photographs. This flexibility and durability however comes at the cost of reduced RE and an increased risk of hotspot formation [3,4,31,34].
Several studies have characterised different PV colouring technologies in terms of energy losses and colour rendition through measurement and visual assessment of physical samples [1,9]. In response to the cost involved in fabricating these samples, there is a growing body of work on the optical simulation of coloured PV to predict energy losses. This includes theoretical PV models irrespective of colouring technology [8,35,36], as well as models for specific colouring solutions using approaches such as raytracing [37], regression [32], and machine learning [33].
In contrast to energetic simulations, there is a paucity of studies that predict the appearance and observed colour of coloured PV. The majority of approaches use raytracing to simulate the angular behaviour of colouring solutions [38], ideally based on bidirectional reflection distribution functions (BRDFs) obtained from physical samples via goniophotometry [22,39]. Other approaches include the transfer matrix method (TMM) for Bragg reflectors [21] and a spectral simulation based on a modified Clapper–Yule model to determine the surface coverage of inks [26]. Schregle et al. [10,28] explored the colour range and perceptual limits in ceramic printing for BIPV using imaging techniques. They noted significant colour shifts due to firing and the use of satinated frontglass, as well as an asymmetric printer gamut.
In the interest of objectively assessing and comparing coloured PV in terms of efficiency and appearance regardless of colouring technology, Li et al. [3] proposed a set of standardised metrics that include the CIE coordinates, maximum colour difference due to angular dependency, and relative loss of short-circuit current. Similarly, in a study quantifying the efficiency losses of spectrally selective multilayer interference coatings, Røyset et al. [20] proposed a colour performance index (CPI) as figure of merit. This CPI is proportional to the colour lightness and inversely proportional to the relative efficiency loss.
Several publications have pointed out a disparity between simulations that predict coloured PV efficiency vs. appearance, noting a dearth of the latter and a particular need for an integrated simulation framework that supports the optimisation of both efficiency and aesthetics [16,33,39,40]. This would enable designers to explore alternative colour combinations already in the planning stage without the expense of physical prototypes.
Particularly in the context of ceramic printing, there is still little support for an integrated, manufacturing-driven framework that links design data, firing, lamination, colour prediction and photovoltaic yield. Reddy’s ColorBlast system [31] addressed this gap through a ceramic printing model that blends a gamma-corrected printed foreground colour and the PV background. This model is then inverted to solve for an optimised colour that approximates the desired appearance. Saw et al. [34] addressed the specific issue of hotspot formation in conjunction with ceramic printing through the use of spectrally matched colours and a repeating Peranakan pattern. Pfau et al. [41] characterised ceramic inks based on their measured spectra to develop a colour synthesis model based on the subtractive primaries CMYK + W, with white having the greatest impact on the perceived lightness but also efficiency loss. The model is then used to evaluate the short circuit current as a measure of efficiency.
As an outcome of a comprehensive study comparing ceramic printing against two other colouring technologies, Li et al. [3] proposed an elaborate method to forwardly predict the colour and efficiency of a coloured PV module with a known colouring layer configuration. This leads to an inverse design process to achieve a targeted colour while maximising the efficiency. This involves minimising an objective function that considers the power conversion efficiency loss and the difference to the target colour. However, the method does not indicate how the colour is to be achieved with a given colouring technology.
Our proposed simulation framework addresses the abovementioned points in the form of a ceramic printing simulation based directly on the printer-ready RIP data bearing the design for the colouring layer. From this simulation, the framework predicts a suitable “recipe” to achieve a target colour. The recipe takes the form of the composition of overlapping ceramic ink layers, which are specified as fractional surface coverage. This also enables the specificaton of custom process colours beyond those found in established catalogues.
The proposed workflow combines techniques from other frameworks and studies. Similar to ColorBlast [31], the proposed printing simulation uses a blending model to determine the RE, but considers overlapping ink layers due to inkdrop spread. Furthermore, the framework uses a multivariate regression and machine learning in the manner of Saw et al. [32,33] to predict the ink layer composition and effective colour to achieve a given target efficiency, respectively. Furthermore, the predicted colours are specified in CIE coordinates as recommended by Li et al. [3] but also visualised interactively in the corresponding colourspace. Finally, instead of spectrally matching colours as demonstrated by Saw et al. [34], we address the issue of potential hotspot formation by incorporating equificient colours into a design to balance local RE mismatches. We believe this affords the designer a greater choice of colours and more creative flexibility.
In aggregate, this provides designers with a suite of essential decision-making tools early on during the design stage prior to module manufacture. The tool enables the designer to explore “what-if” scenarios with candidate designs in terms of overall RE and local mismatches, as well as perceived colour. In summary, the main contributions of this paper are:
- A RIP-based simulation workflow for predicting the RE of ceramically printed BIPV modules.
- Prediction of effective colour from laminated-module colourimetric reference data using machine learning.
- Introduction of equificient colour classes for flexible colour selection, enabling hotspot mitigation and efficiency-aware design choices.
- Demonstration through case studies covering a full-scale façade application and transfer to educational and architectural design contexts.
3. Methodology
The proposed workflow consists of three major stages: an initial calibration stage, followed by a validation stage, both requiring the fabrication of physical coloured PV samples. These stages provide reference data for a simulation and prediction framework at the core of the workflow. Once these preparations are complete, the third stage of the workflow consists only of a simulation and prediction stage, bypassing the need to fabricate prototypes until the design is optimised and finalised. These stages are detailed below:
- Calibration: A set of coloured PV samples is designed and prepared for printing. Initially, the designs contain samples of primary colours printed at different opacities (typically in 10–20% increments), arranged in a grid of tiles. From these designs, laminated physical samples are produced. The physical samples are measured with a colourimetre to obtain reference values of the primary colours. These are used to train the effective colour prediction. In addition, the RE of each primary is electrically measured at all printed opacities. The per-primary transparencies are determined from the RE measurements as fundamental parameters for the simulation.
- Validation: A further set of coloured PV samples is designed and prepared for printing, this time consisting of process colours resulting from combinations of the primaries. Once again, laminated physical samples are produced, this time to validate the now calibrated simulation and prediction framework. These samples, too, undergo colourimetric and electric measurements. The resulting reference data is compared against the effective colours and RE obtained from the simulation and prediction framework. The simulation is driven directly by the same printer-ready designs (RIP files) that are also sent to the ceramic printer during physical sample fabrication.
- Simulation and prediction: Once the simulation and prediction framework has been calibrated and validated, arbitrary motifs may be analysed in terms of effective colour and RE. At this stage, the printer-ready RIP files are fed directly into the simulation and prediction framework, obviating further physical prototyping and measurement until the design is optimised and ready to print.
The sample preparation and fabrication, optical and electrical measurements and the simulation and prediction framework are described in detail in the following sections.
3.1. Sample Preparation and RIP-Based Input
The workflow begins with a digital design consisting of a selected set of colours, created in-house or provided by the client. These may be selected from a standard catalogue such as RAL or NCS, or specified as a custom layer composition. As described above for the initial stages of workflow development, the designs may be fabricated as laminated modules for measurement, providing reference data to calibrate the printing simulation and prediction framework.
3.1.1. Digital Design
Digital designs consist of selected sample colours arranged into a grid of tiles (Figure 2) and processed via raster image processing (RIP), producing printer-ready files that explicitly encode spatially resolved layer compositions per primary colour channel. These RIP files constitute the primary input to the workflow. They can be used for initial fabrication and measurement to calibrate the printing simulation. Once calibrated, the simulation can ingest the RIP files directly to derive layer compositions for each sample colour. Based on these layer compositions, the calibrated workflow can predict the spatially resolved RE and post-lamination effective colour. The benefit of the calibrated workflow is that it consequently reduces the reliance on physical prototyping.
Figure 2.
Design for a catalogue consisting of 188 sample colours selected from the RAL series, arranged in a 14×14 grid.
3.1.2. Printing and Lamination
For the fabrication of physical samples, RIP files were printed onto glass by the industrial partner with a DipTech inkjet printer using ceramic inks at a resolution of 720 DPI. The physical samples were then subsequently processed into laminated PV modules (Figure 3).
Figure 3.
(Left) Printed glass panels prior to module assembly and displayed against a black foil simulating the PV cell background. (Right) Laminated PV modules in a roof mock-up. The semi-transparent busbars are visible depending on the design’s integration level.
The industrial partner’s current printing pipeline uses the six printer primary colours black (K), white (W), orange (O), red (R), green (G), and blue (B). All process colours in subsequent workflow steps are obtained by specific combinations of these six primaries, which may overlap spatially. Fabricated samples with primary and process colours underwent optical and electrical measurements for calibration and validation as described in the following section.
3.2. Optical and Electrical Measurements
Colourimetric measurements were conducted on more than 100 laminated PV modules for calibration and exemplary validation. The device used was a model SPH860 spectrophotometer (Colorlite GmbH, Katlenburg-Lindau, Germany) under a D65 illuminant, configured for a 2° CIE standard observer. For each of the printer’s six primary colours, a series of modules was fabricated in nominal opacity increments of 10%, ranging from 10% to 100%. In addition, process colours (combinations of primary colours) from the NCS hue circle were included in the yellow/red, red/blue, blue/green, and green/yellow transition regions. Notably, the measurements were always carried out on the finished PV modules rather than on the printed frontglass alone. The measured effective colour therefore represented the combined optical effect of the printed glass, the underlying photovoltaic cells, and the electrical interconnectors visible through the laminated module. As the appearance of coloured PVs is subject to incidence and reflection/transmission angles [30,39], this effective colour should be interpreted as the effective colour under diffuse lighting at normal viewing angle to the glass surface. Furthermore, the effective colour is significantly influenced by the type of glass used. In particular, satinated frontglass for glare reduction results in a substantial desaturation of the observed colours [10,19,24,39]. This implies that the calibration is very much specific to the particular glass type used, and that the results of the simulation and prediction framework are not readily transferrable to other glass types.
Several methodological challenges had to be addressed in order to obtain robust and reproducible colour values. First, although the printed surface was uniform within each sample, the measurement area was not fully homogeneous. The field of view included both dark cell regions and reflective strips formed by the electrical interconnectors (busbars). These interconnectors accounted on average for approximately 8% of the module surface and thus also for a similar share of the measurement spot. To account for this heterogeneity, a measurement head with a large spot diametre of 4 cm was selected. In addition, each reported colour value was obtained from three separate measurements taken at different positions within areas of identical layer composition on the same module. The three readings were then averaged into one final documented value. The largest deviations between individual readings were noted for the black primary with a mean of 0.46 ( = 0.18, max = 0.6), followed by red with a mean of 0.15 ( = 0.09, max = 0.29). The remaining primaries fared better with a mean under 0.1.
A second challenge arose from the fact that the measurements were performed on glass surfaces. Part of the incident light is reflected directly at the outer glass surface and would otherwise contribute to the measured signal, even though this specular component does not represent the actual colour impression generated by the ceramic print and the underlying PV components. To suppress this unwanted contribution, a measurement head with gloss trap was used. A further refinement was the use of an integrating sphere (Colorlite probe head adapter MA35-UK), which enabled the measurement of hemispherically integrated reflectance rather than only the directly reflected component [3,9,17,30,39,42]. This made the colour assessment less sensitive to directional surface reflections and more representative of the overall visual appearance of the module.
A third challenge was specific to measurements on glass: part of the light propagates laterally within the glass thickness and exits through the glass edges, resulting in a reduced signal at the sensor. If uncorrected, this would lead to systematically darker measured values. To compensate for this effect, the measuring device was calibrated using the same type of glass on which the samples had been printed, placed between the sensor and the reference standards [9]. This ensured that the lateral light losses within the glass were consistently accounted for during the measurements.
For reasons of consistency, all measurements were performed from the outer visible side of the finished PV module, i.e., from the same viewing direction as that of the observer in the realised façade. Alternative procedures, such as measuring only the printed glass or measuring directly on the printed pigment side, were deliberately avoided because they would have produced different colour values. All results were reported in CIE coordinates, since this colourspace provides a perceptually meaningful basis for comparison [3] and can be converted into other colour systems if required. The entire protocol was applied consistently throughout the full dataset: the same measurement head, spot size, three-point averaging procedure, integrating sphere and gloss trap configuration, and glass-based calibration were used for all samples.
The electrical performance was measured directly after module production at the manufacturer’s facility. These measurements followed standard flasher test procedures routinely used by manufacturers to determine the technical ratings of photovoltaic modules. In each case, the actual electrical output of the finished coloured PV module was recorded and compared against a reference module of identical construction and cell type, but equipped with transparent frontglass. This reference module was therefore defined as having an RE of 100%. The RE of a coloured PV module was then calculated from the deviation of its measured output relative to that of the transparent reference module.
In summary, the measurement campaign yielded a structured dataset comprising more than 100 PV modules, where each sample was uniquely defined by the printed primary colour, the corresponding nominal opacity (defining the layer composition), the measured RE, and the measured CIE values. This dataset formed the basis for calibrating and validating the simulation and prediction framework within the proposed workflow.
Colourimetric Reference Data
As part of the calibration, a selected set of colourimetric data from the abovementioned measurement campaign was used to train a neural network for effective colour prediction (see Section 3.4.2). The set of colours was selected to cover the printer gamut and included the printer primaries and a full cycle of the NCS colour disc in staggered opacities. Fully saturated colours (100% opacity) delineate the limits of the printer gamut, and some hues exhibit a skewed or compressed response in the colourspace (see Figure 4), which is consistent with earlier findings for similar setups [10]. It should be emphasised that the predicted effective colour conveys the appearance of a laminated coloured PV module under conditions consistent with the measurement, i.e., at normal view angle and under diffuse lighting.
Figure 4.
Colourimetric reference dataset for effective colour prediction, visualised as scatter plot in the CIE colourspace. Each effective colour sample is represented by a point located at its corresponding chromaticity coordinate in the plane. The 3D colourspace is “flattened” in this 2D visualisation, with the Luminance axis being projected onto the chromaticity plane. The background serves as orientation and shows the plane for a fixed = 50. Note the plane is enlarged to cover the range [−30, 30]2 for clarity; by definition, the full chromaticity range is [−100, 100]2. The dataset comprises measurements of the six printer primaries and eight NCS colours. Neutral colours with low opacity lie near the origin. More saturated colours radiate from the origin with increasing opacity. Different opacities of a colour manifest themselves as radial curves. These skewed trajectories, along with the compressed response in the blue/magenta range along the axis, are specific to the printing process and inks.
3.3. Equificient Colours
Two printed colours are defined as being equificient if their relative efficiencies are reasonably similar as expressed by their RE difference . In this paper, we propose a of 5–10% as equificiency margin to compromise between engineering tolerances, efficiency, aesthetic diversity and simulation accuracy. This offers the designer a broad palette of distinct candidate colours to choose from (depending on the target RE). At the same time, this margin does not significantly degrade efficiency, yet accommodates the tolerances of the simulation model and actual PV installations [43]. The following exposition and results are based on an exemplary of 5% as equificiency metric, although the proposed workflow is not explicitly limited to this margin.
The workflow is designed to support the identification of equificient colours by grouping these in an optional postprocessing step. The designer may then select suitable candidate colours from the group of equificient colours with minimal impact on the overall RE. Equificient colours are thus energetically interchangeable, yet aesthetically diverse, affording the designer considerable flexibility within the constraints of a given target RE.
This flexibility is desirable in a number of situations. For example, if a client is dissatisfied with a particular colour in a proposed design that has already been optimised for a target RE, the designer may simply select an alternative, equificient colour that meets the client’s approval. This satisfies the client’s aesthetic preference without significantly impacting the RE.
A more critical situation arises if potential hotspots are detected on the laminated PV module due to locally varying RE, leading to unwanted shading effects and possible damage to the module. By identifying outlying colours with a difference from the target RE, and replacing these with equificient ones, the designer can balance the RE over the module while still having a palette to choose from—subject to the constraints of the target RE, of course.
Section 4.3 describes in detail how the proposed workflow’s optional postprocesses support the designer in identifying equificient colours and using these to optimise his/her composition, while Section 4.4 describes how the case studies benefit from equificient colours in their respective contexts.
3.4. Simulation and Prediction Framework
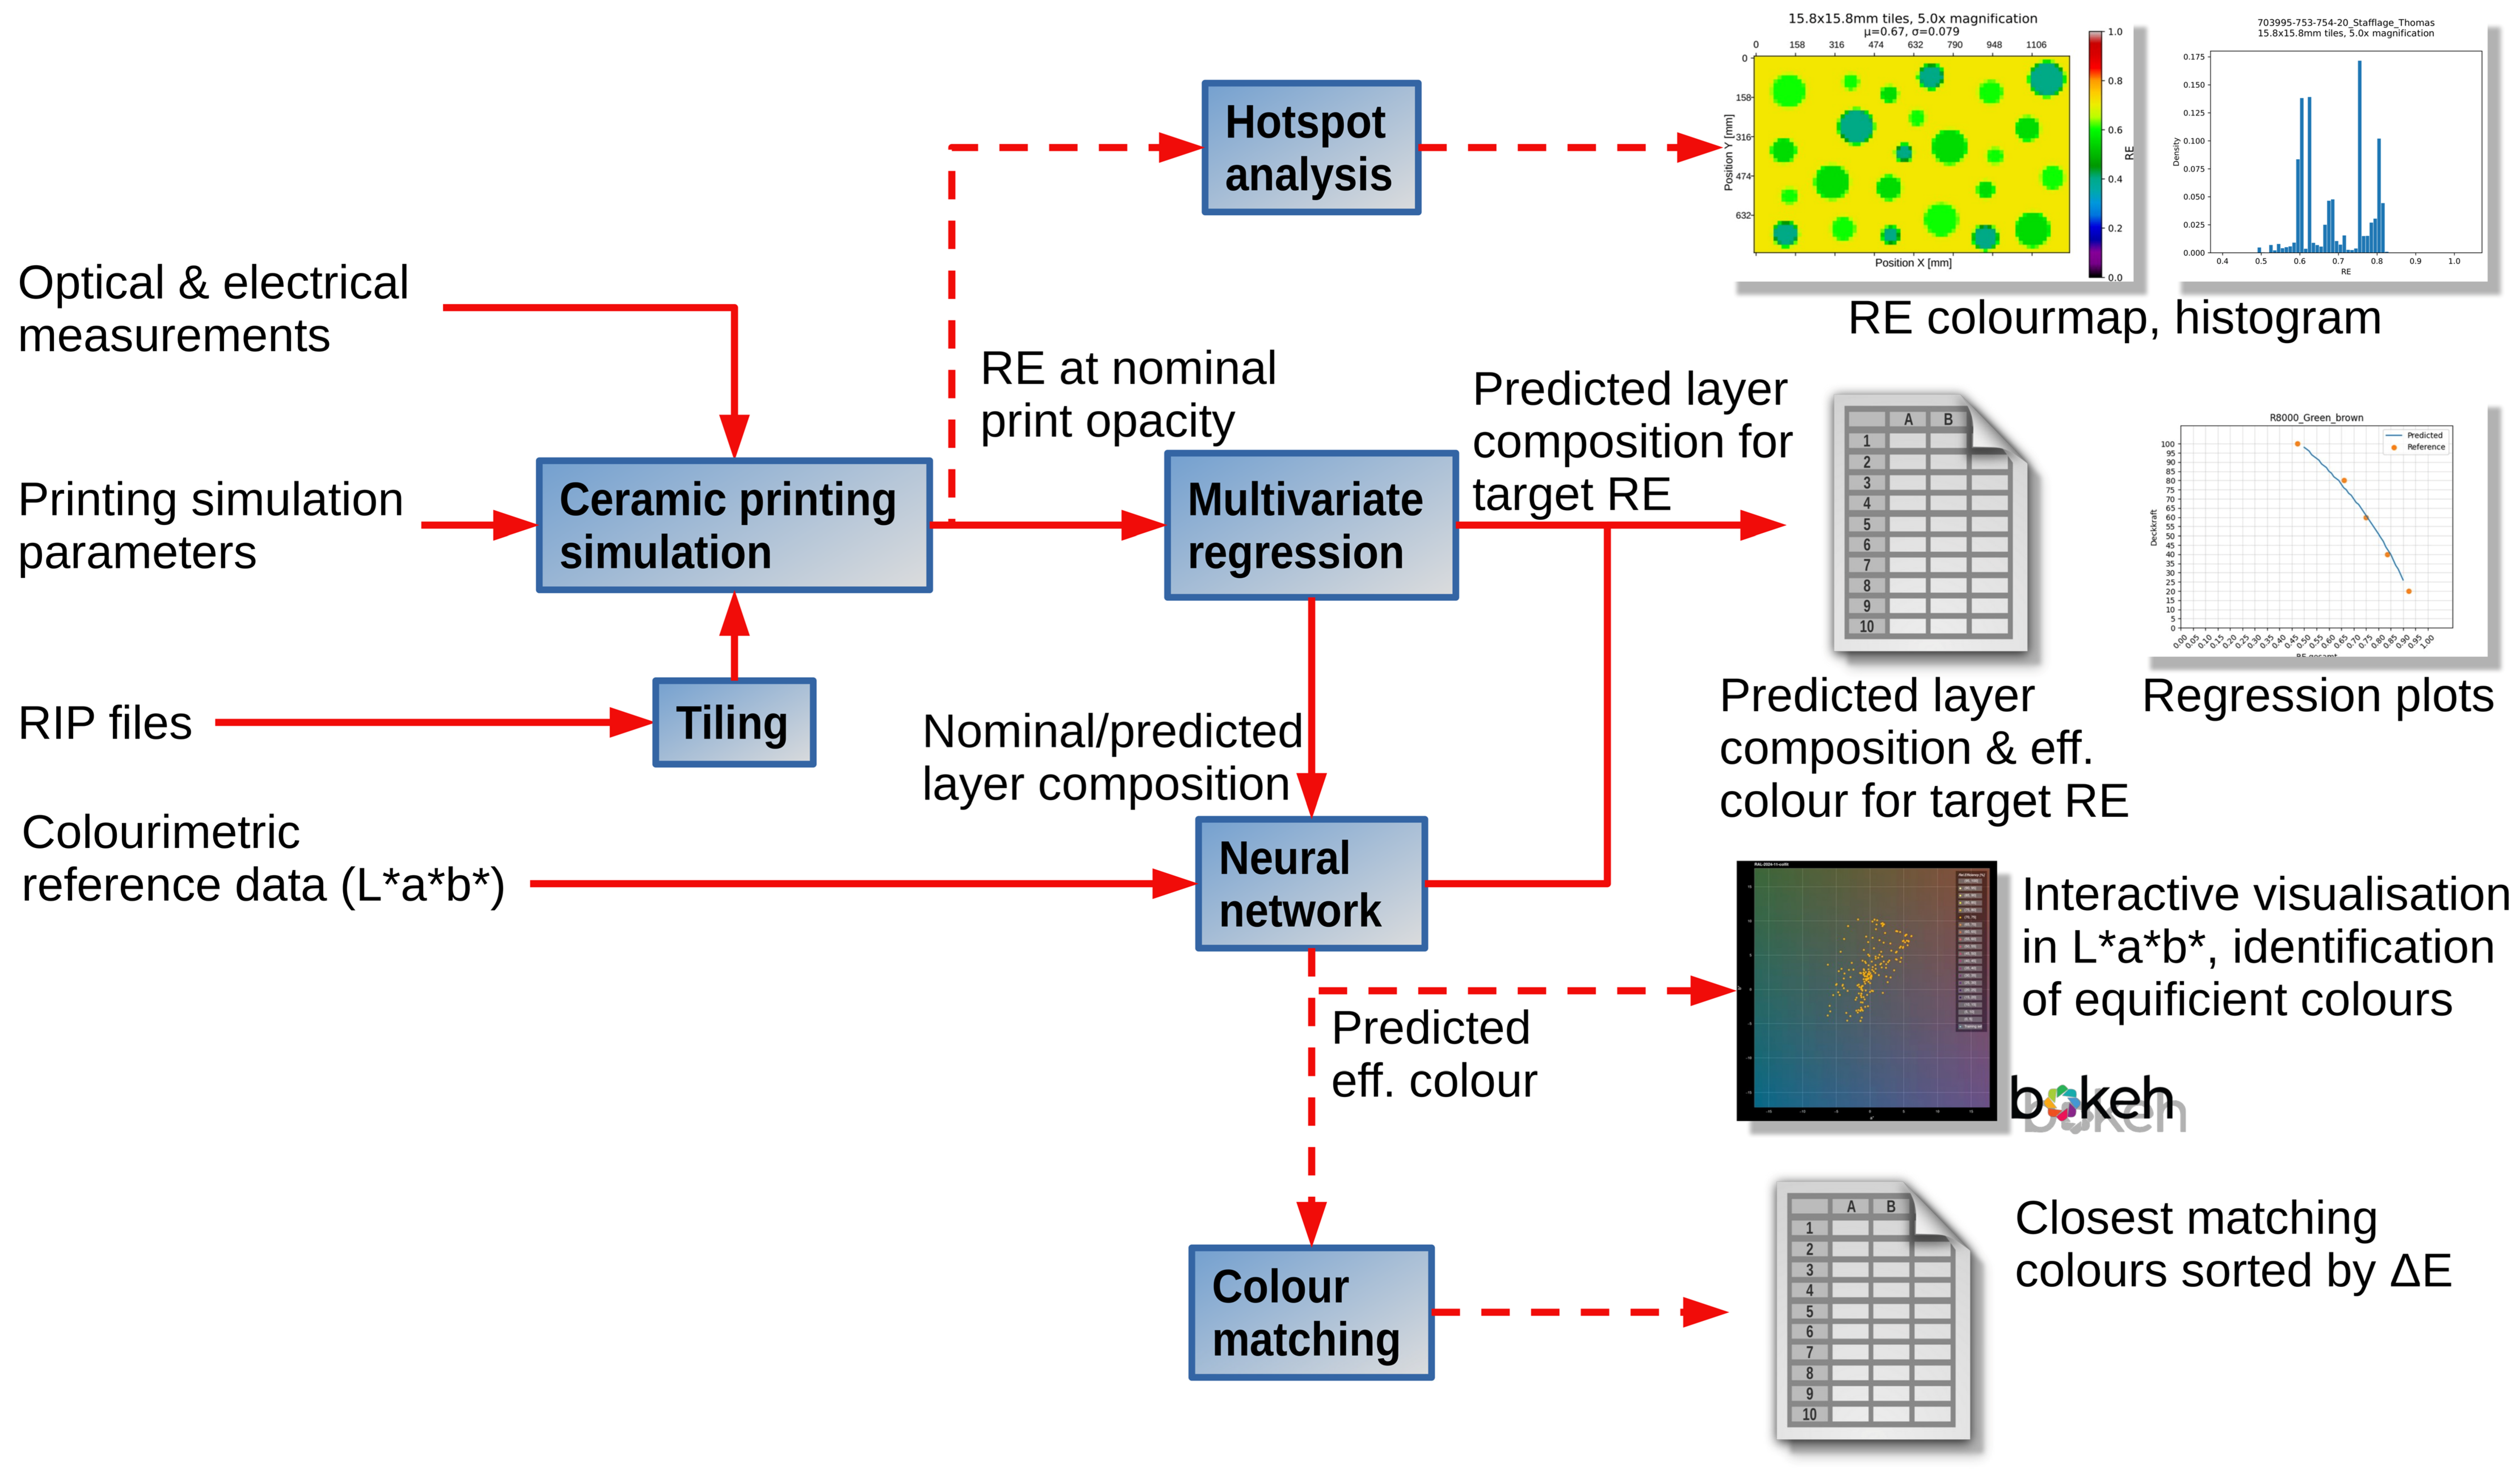
The simulation and prediction framework constitutes the core of the proposed workflow. It predicts the RE and effective colour of ceramically printed BIPV modules directly from printer-ready RIP data. Figure 5 outlines the framework, including its inputs, parameters, and outputs. The framework consists of the following components, which are numbered in the order they are applied:
- A scalable ceramic printing simulation accepts printer-ready RIP files and discretises them into individual tiles. These may correspond to distinct colours in a gridded colour catalogue, or arbitrary cells in a continuous-tone image. The simulation is primarily calibrated with the transmittance per primary colour obtained from the RE measurements during the calibration stage. For each tile, the printing simulation calculates the layer composition (per-primary surface coverage) and the resulting RE. These are passed to the subsequent prediction stage.
- A multivariate regression in the prediction stage uses the nominal layer composition and RE output from the printing simulation and interpolates these responses. This enables the prediction of a suitable layer composition for a given target RE. The results are output in tabular form. In addition, optional plots of the regression can be generated to assess the goodness-of-fit.
- A neural network in the prediction stage is trained on the colourimetric data obtained at the calibration and validation stages of the workflow. Once trained, it uses the nominal layer composition obtained from the printing simulation to predict the effective colour for each tile. In addition, it can predict the effective colour for a target RE based on the corresponding layer composition interpolated by the multivariate regression. The output is combined with the tabular output of the multivariate prediction. The predicted colours may optionally also be interactively visualised in the colourspace. This visualisation groups colours by equificiency classes and facilitates their identification.
- An optional colour matching postprocess uses the predicted effective colours from the neural network and sorts these according to their colour difference relative to a given target colour. The results are output in tabular form.
- An optional hotspot analysis uses the discrete RE calculated for each tile by the printing simulation to statistically evaluate local mismatches. The results are output in the form of a falsecolour RE plot (heatmap) and a histogram of the RE distribution over all tiles.
Figure 5.
Overview of the simulation and prediction framework, consisting of ceramic printing simulation, prediction via regression and neural network, and their outputs as tables, plots, and interactive scatterplot in the colourspace. Dashed arrows denote optional steps.
All software tools implementing the simulation and prediction framework are provisioned within a portable, open-source Python environment using the essential NumPy library (1.23.5) [44]. The SciPy (1.6.0) [45] and SciKit-Learn library (1.2.0) [46] are used for the RE and effective colour prediction, respectively, while the tabular output is handled by the Pandas library (2.0.3) [47,48]. In addition, the Python Imaging Library (PIL 9.4.0) [49] supports the image-based ceramic printing simulation. Finally, operations in the colourspace are handled through the Python Colormath library (3.0.0) [50].
3.4.1. Ceramic Printing Simulation
The ceramic printing simulation uses a multilayer model of successive printing passes for each primary colour and accepts six per-primary RIP files as input for each design. The simulation is image-based and renders magnified semi-transparent inkdrops onto a virtual glass substrate. It is parametrised with the calibrated transmittance per primary colour, a pair of elliptical inkdrop radii for each primary, and a user-defined magnification factor for the rendered inkdrops.
A tiling scheme discretises each RIP file into a grid of user-specified tiles for individual processing. The input designs may consist of colour catalogues arranged as tiles as shown in Figure 2, grouped by opacity either within one panel or distributed over separate panels. In this case, the user-specified tiles coincide with the individual catalogued colours on each panel. Optional margins and borders may be defined to omit surrounding labels or annotations within each tile. Alternatively, the designs may consist of continuous-tone images, typically for hotspot analysis. The tile size is then freely selectable based on the desired resolution. Each tile is converted into binary masks per primary colour and processed independently.
A unit drop is modelled as an ellipse with radii of 60 × 20 µm (fixed 3:1 ratio), estimated from microscopic images of printed samples. At a printing resolution of 720 DPI, this corresponds to ca. 1.7 × 0.567 pixels at unit magnification. The elliptical drop geometry accounts for the lateral acceleration caused by the movement of the print head. It also captures the effects of inkdrop inertia and surface tension, which partially counteract this dispersion. To account for colour-dependent variations of this behaviour, these dimensions are scaled individually for each primary colour through a production-oriented calibration pipeline. Magnification enables accurate resolution of overlap between neighbouring inkdrops, including multiple overlapping layers of the same primary colour.
The RE is calculated independently for each tile from the cumulative attenuation caused by overlapping primary colour layers, where an RE of 1.0 corresponds to clear glass. At each pixel, the attenuation is computed through alpha accumulation as the product of layer transparencies. Averaging the accumulated alpha over all pixels yields the RE for the tile.
In addition, the layer composition for each tile is calculated from the rendered inkdrops as the surface coverage, i.e., the fractional tile area occupied by each primary colour layer, via a histogram. This result is used for the subsequent data-driven effective colour prediction. It is also used together with the calculated RE in the subsequent regression to predict the layer composition for a target RE.
An optional RGB visualisation may additionally be generated using Porter-Duff alpha-over compositing [51,52,53]. Unlike RE accumulation, alpha-over is non-commutative, and primary colour layers are therefore composited in printing order. These renderings provide a qualitative visualisation and inspection of the layer composition (Figure 6), but are not used for any prediction or postprocessing.
Figure 6.
Ellipsoid inkdrops rendered by the ceramic printing simulation at 8× magnification for RAL colour R6009 (Fir Green). All six printer primaries contribute to the layer composition, with increasing overlap at opacities of 20%, 40%, 60%, 80%, and 100% (left to right). Inkdrops are alpha-blended using the calibrated transmittance of each primary colour.
3.4.2. Prediction of Relative Efficiency and Effective Colour
This workflow stage forms the confluence of the predictive logic, combining the simulation-driven regression model to estimate the layer composition with a back-propagation neural network to estimate the effective colour. The underlying inputs are the simulated printing results obtained from the RIP-based layer compositions and the measured colourimetric reference data acquired from laminated samples during calibration.
Multivariate Regression
The printing simulation yields spatially averaged RE values for each tile colour and opacity configuration. These results are used to fit two response functions (Figure 7). The first is a monotonically decreasing exponential model relating print opacity to RE. The second is a third-degree polynomial model relating RE to the surface coverage of the primary colours.
Figure 7.
Multivariate regression for sample colour R6009 (Fir Green) from RAL series. (Left) Print opacity as a function of target RE. (Right) Surface coverage per primary colour (layer composition) as a function of target RE.
Both fitted functions are subsequently inverted to predict the opacity and per-primary layer composition required to achieve a target RE. Configurations exceeding the physical limits of the printing process, such as a surface coverage above 1.0, are discarded. This interpolation-based approach avoids the need to fabricate and measure large numbers of physical samples with finely incremented opacity variations.
Neural Network
To predict the effective colour, a fully connected Multilayer Perceptron (MLP) was trained with 110 samples from the colourimetric reference data obtained from printed and laminated PV modules (see Figure 4). In particular, the training dataset includes a sample measured with clear glass to minimise extrapolation for very low opacities.
The MLP is a popular choice for colour and hyperspectral prediction using low input and output dimensions and small training datasets [54]. Typical MLP architectures for these applications range from a single hidden layer containing 5 neurons [55] to one or two layers of approximately 30 neurons each [56,57]. More elaborate architectures with more than two hidden layers halve the number of neurons in each layer with increasing depth for efficiency [54].
Because the coefficients and biases of an MLP are randomly initialised, the fitted model is nondeterministic, and the resulting predictions are consequently subject to fluctuation and a potentially high standard deviation. To mitigate this effect, Hansen et al. [58] suggest averaging the predictions from an ensemble of MLPs trained with different initial coefficients and biases. This results in a more robust prediction at higher computational cost during training.
The MLP was implemented using SciKit-Learn’s MLPRegressor class [46,59]. Its input layer consists of six neurons receiving a 6-dimensional feature vector which corresponds to the surface coverages for the six printer primaries; these are obtained from the abovementioned multivariate regression for a given target RE. Because the surface coverages are not normalised, they comprise six independent parameters for the prediction model, which implies the model is non-redundant. The output layer consists of three neurons emitting the 3-dimensional response vector corresponding to the effective colour. This is the colour that would be observed for the target RE under the calibrated module fabrication and measurement conditions.
The MLP architecture was tuned by iteratively increasing the number of neurons from 4 to 64, and adding a second layer with half the number of neurons. In addition, ensemble sizes of 1, 4, and 8 independently trained MLPs were investigated. Each such configuration was evaluated in terms of its residual error after fitting, and in terms of its generalisation through cross-validation, as discussed below.
The hyperparameters for the MLP fit were also investigated, mainly the regularisation strength . Increasing this hyperparameter from its default 10−4 to ca. 0.2 significantly lowered deviations during validation, indicating a strong tendency for the model to overfit if left unchecked. Regularisation also tended to reduce the number of iterations and increase the overall efficiency of the fit. If set too high, however, the solver may fail to converge.
A quasi-Newton L-BFGS solver was used to fit the MLP, as it tends to converge faster than the default ADAM stochastic optimiser with small training datasets [60]. With the 110 colourimetric samples and regularisation strength of 0.2, L-BFGS typically converged within 1300 iterations, as opposed to ca. 4300 with ADAM. In order to obtain reproducible results, the MLP coefficients and biases were initialised with a fixed random state that can be passed as parameter to MLPRegressor. In an ensemble, each constituent MLP is assigned this state plus a unique offset.
A low residual error such as mean squared error (MSE), or a coefficient of determination close to 1, merely indicates how well the fitted model approximates the training dataset. It does not necessarily indicate how well the model responds to novel samples outside the dataset, i.e., how well it generalises. This is particularly the case if the model is overfitted and follows the responses from the training set too closely [61]. Assessing the generalisation of a fitted model requires validating it against a subset of the reference data.
Due to the small volume of available reference data, each MLP configuration was evaluated using leave-one-out cross-validation (LOOCV) [62]. This validation method iteratively removes and sets aside one sample from the training dataset for validation, fits the model with the remaining data, then predicts the response for the single validation sample and evaluates its deviation from the corresponding known reference response. This is repeated for every sample in the dataset, using the average deviation (possibly also the median, maximum, or a percentile) as a metric for the fitted model’s generalisation.
Various configurations of the MLP were cross-validated using the CIE colour difference as error metric, resulting in the plotted validation protocol shown in Figure 8. As an expected result, plateaus with increasing number of hidden neurons. The plot also reveals that adding a second hidden layer results in poorer performance up to about 12 hidden neurons (in layer 1), but then settles with a lower mean of about 0.51 versus 0.73 for a single layer. A similar behaviour was observed with the maximum beyond 28 hidden neurons in layer 1, settling at just above 2.0. In addition, the second hidden layer reduces the standard deviation. The ensemble size (4 or 8) had a lesser effect overall, and a set of 4 MLPs was deemed sufficient given the diminishing returns with a larger ensemble. Tests with different activation functions, namely ReLU (Rectified Linear Unit) and tanh, revealed that the former consistently yielded lower deviations by a significant margin.
Figure 8.
LOOCV results for effective colour prediction. An ensemble of 4 resp. 8 MLPs consisting of 1 or 2 hidden layers was trained on the colourimetric reference dataset after omitting a single validation sample. The effective colour is then predicted for each validation sample in turn, and compared against its reference based on the CIE colour difference . The plot depicts averaged over all validation samples as a function of the number of hidden neurons for each MLP configuration. The vertical lines with tick marks surrounding each marker indicate the standard deviation of over the validated set. Note the markers are horizontally offset to the right from their actual hidden neuron count to reduce overlap.
Based on the results of the cross-validation, an ensemble of 4 MLPs was selected, with an optimal architecture of two hidden layers of 32 and 16 neurons with ReLU activation functions. These findings align with architectures for similar applications cited in the literature. The validated model was subsequently tested using a set of custom process colours. These samples required the MLP to extrapolate beyond the training set, which further tested that model’s generalisation. These results are documented in Section 4.1.2.
Together, the multivariate regression and neural network thus enable the prediction of layer composition and effective colour for a target RE directly from RIP files. These are predicted for each input tile and made available in tabular form. They may also be ingested for optional postprocessing as presented in the results under Section 4.3.
3.5. Assumptions and Limitations
The proposed multilayer model adopts several simplifying assumptions informed by measurements and microscopy images of production samples. As discussed in Section 3.4.1, inkdrops are modelled as ellipses, motivated both by the observed morphology of printed ceramic droplets and by the dynamics of the printing process. Microscopy images of fabricated samples exhibit strong qualitative agreement with the simulated layer structures seen in Figure 6.
Since the printing simulation is image-based, the prediction accuracy depends on the rendering resolution used to resolve overlapping inkdrops. Increasing the magnification improves the convergence of the predicted RE at the expense of computational load. In practice, an 8–16× magnification was found sufficient for stable RE prediction within 5% of the measured reference. In situations that require higher accuracy, the magnification may be increased to 16–20×. The effects of magnification and other parameters are quantified in a parameter sensitivity analysis and a preliminary error analysis in Section 4.1, below. The authors are aware that a systematic quantitative validation is warranted, and planned as future work.
The runtime and memory footprint of the simulation is directly proportional to the input RIP size and the magnification factor used to render the simulated inkdrops. It is also dependent on the opacity, as this relates directly to the rendered inkdrop density. Defining an optional crop border around each RIP tile to reduce its bitmap size is an effective measure to improve performance with homogeneous designs.
The current implementation uses process-level parallelism within the Python environment and therefore benefits from multi-core systems. However, the image-based printing simulation processes very large bitmaps and is therefore highly memory-bound. As a consequence, CPU utilisation scales poorly. For example, the process colours in Figure 12 were simulated with a 16× magnification and a 70% tile border (=30% effective tile size). This simulation completed in ca. 10 min utilising 16 CPU cores and ca. 10 Gb of memory. On 64 cores, however, the runtime for the same simulation only reduces to just under 7 min. Therefore, a more efficient and scalable, fine-grained (threaded) parallel implementation using GPU accelerators would be desirable. This remains as possible future work.
The calibrated simulation parameters, including inkdrop dimensions and transmittance per primary colour, are specific to the employed production setup, including glass type, printing, firing, and lamination. The current calibration is based on SINA float glass and the DIPTech ceramic printing system; changes in substrate, printer, or primary colour inks therefore require recalibration using corresponding reference measurements from new physical prototypes.
Finally, the workflow is intended as a design-support tool rather than a fully automated optimisation system. While it enables prediction, comparison, and selection of equificient colours for RE optimisation and hotspot mitigation, aesthetic and architectural decisions remain with the designer.
4. Results
In this section, we present quantitative and qualitative results obtained with the workflow. These consist of an error and parameter sensitivity analysis, examples of predicted layer compositions and equficient colours, and optional postprocessing results including colour matching and interactive scatterplots. Finally, we present applications of the workflow in three case studies which demonstrate its versatility from a design perspective.
4.1. Error Analysis
As the proposed workflow is still a prototype, the simulation and prediction framework at its core have not yet been subjected to a rigorous and systematic validation. Instead, we present the results of the calibration and validation stages of the workflow using primary and process colours. In these stages, the parametrisation of the simulation and prediction framework underwent iterative refinement and a parameter sensitivity analysis. The results of these error analyses are discussed in the following subsections.
In the calibration stage, the predicted RE of the six primary colours was compared against measurements from laminated physical samples. The ceramic printing simulation was driven by the same RIP files that are used to print the physical samples. During this stage, the printing simulation model underwent the parameter sensitivity analysis to assess its sensitivity to miscalibration, and how this affected the predicted RE.
Once the calibration was satisfactory, the validation stage involved comparing the predicted RE of a set of selected custom process colours against measurements from a corresponding set of laminated physical samples. In addition to the RE, the validation with process colours also encompassed the effective colour prediction. As with the primary colours, these predictions were based on the same printer-ready RIP files that were sent to the printer during the fabrication of the physical samples.
4.1.1. Parameter Sensitivity
A series of systematic analyses was conducted to assess the printing simulation model’s response to its calibration parameters. Such a parameter analysis is helpful in identifying the optimal set of calibration parameters for a particular combination of printing and fabrication process. The model is primarily sensitive to three parameters: the per-primary inkdrop elliptical radii and its corresponding transparency, and the magnification factor of the rendered inkdrops.
Sensitivity to Inkdrop Radius and Transparency
In a first such analysis, the effect of the inkdrop radius and transparency on the simulated RE was assessed for each of the six primary colours at opacities of 20–100%, in 10% increments. The inkdrop radii varied in the range ±10% relative to the unit drop dimension (see Section 3.4.1), in 5% increments, maintaining the 3:1 aspect ratio. For each of these inkdrop radii, the calibrated transparency of the corresponding primary colour was offset by ±0.04 in increments of 0.02. This resulted in 25 parameter combinations, including the baseline calibration with zero offsets. The printing simulation was run for each such parameter combination using a fixed 16× magnification. The resulting simulated RE was compared against the measured reference and plotted as difference in Figure 9.
Figure 9.
Results of printing simulation parameter analysis for the primary colour Orange (O). Each line represents the simulated RE using a combination of parameters (inkdrop radius, transparency) offset relative to the baseline calibration. The simulated RE is expressed as difference to the measured reference RE, represented by the horizontal dashed centreline.
Sensitivity to Magnification
A second parameter analysis investigated the effect of the rendered inkdrop magnification on the resulting RE (Figure 10). While this is strictly not a calibration factor specific to the printing process, it significantly impacts the ability of the printing simulation to resolve overlapping ink layers. Too low a magnification will tend to underresolve the overlapping layers, particularly at high opacities, resulting in aliasing and an underestimated RE. Too high a magnification, on the other hand, leads to excessive runtimes.
Figure 10.
Results of printing simulation parameter analysis for a custom process colour. Each line represents the simulated RE using a different magnification factor for the rendered inkdrops. The discontinuities in the plots are not an artefact of the simulation, but of the manual layer compositions selected by the designer for the different opacities.
4.1.2. Calibration Checks: RE and Effective Colour
During calibration, basic checks were conducted using the printer’s individual primary colours. Figure 11 shows plots of the measured vs. predicted RE of each printer primary as a function of print opacity. The printing simulation rendered inkdrops with 32× magnification using the standard calibration parameters (inkdrop radii, transparencies).
Figure 11.
Plots of predicted vs. measured RE as a function of print opacity for the six printer primary colours black (K), white (W), red (R), green (G), blue (B), and orange (O). The printing simulation rendered inkdrops with 32× magnification using the standard calibration parameters (inkdrop radii, transparencies).
The basic checks with individual primary colours were followed up by more elaborate checks of the effective colour prediction using selected process colours obtained by combining primaries. These colours were specified as custom layer compositions to obtain three target efficiencies (70%, 80%, and 90%) at three opacities each, by directly modulating the surface coverage of the white primary. This resulted in nine colours which were novel to the effective colour prediction as they were not included in the neural network’s training set.
Figure 12 compares the predicted and reference (measured) RE and effective colours for the process colour set. The printing simulation parameters are the same as in the previous check with primary colours. The effective colour prediction was trained using the colourimetric reference data from Figure 4.
4.1.3. Discussion
The parameter sensitivity analysis in Figure 9 reveals an obvious divergence in the predicted RE as its parameters—the inkdrop radius and transparency per primary—are modulated. It also reveals that the model is more sensitive to the transparency than the inkdrop radius. As exemplified in the figure, offsetting the parameters results in significant RE deviations ranging from −12.1% up to 15.6%.
In general, the ceramic printing simulation exhibits increased errors with higher print opacities. This is because the underlying multilayer model responds more sensitively to its parameters with increasing inkdrop density and overlap. This effect is readily apparent in Figure 9, where the simulated RE divergence increases with opacity, exacerbated by intentionally offsetting the parameters. The larger overlap, in turn, amplifies any errors in the surface coverages calculated for each primary. Since the surface coverage is the basis for both the RE and effective colour, both predicted values, as well as any output further downstream in the workflow, are affected.
Figure 10 reveals the clear tendency for the printing simulation to underestimate the RE at low magnification, again with a slight divergence towards higher opacities. With increasing magnification, the RE converges to a stable value. In particular, increasing the magnification from 16× to 32× yields diminishing returns, but quadruples the runtime and memory consumption. For practical applications, 16–20× magnification is deemed to be a reasonable compromise between simulation accuracy and performance.
With the baseline calibration, the average error of the predicted RE for primary colours in Figure 11 is 0.416% with a standard deviation of 0.968%. For the process colours shown in Figure 12, the mean error for the RE is 0.28% with a standard deviation and RMSE of 3.26% and 3.25%, indicating a very low bias. The maximum RE error was 5.23%, which falls within the electrical measurement tolerances.
The average colour difference for the predicted effective colour in Figure 12 is 1.859 with a standard deviation of 0.918. For reference, a < 1 is imperceptible even for trained observers, while a > 3 is noticeable to an average observer. The maximum of 4.486 observed in Figure 12 therefore suggests that the training dataset still needs to be optimised by including more measurements near the gamut limits.
4.2. Predicted Layer Composition and Equificient Colours for Target RE
This section presents examples of typical results obtained from the simulation and prediction framework. Figure 13 shows a tabular output of the predicted layer compositions and effective colours for a set of selected NCS colours with a target RE in the range of 50–90%. The effective colours are depicted by RGB patches converted from space. For reasons of commercial sensitivity, the predicted layer composition is only shown for one primary colour (orange).
Figure 13.
Predicted layer compositions and effective colours for selected NCS colours with target RE of 50–90%, in increments of = 5% . Commercially sensitive layer composition data is only shown for the orange primary colour (coverage O).
Figure 14 shows a tabular grouping of equificient colours for a target RE of 75% ± 5%. These colours are selected from the RAL series depicted as a scatterplot in Figure 15. The table includes the predicted layer compositions (shown here for the orange primary) and the corresponding effective colour. Shades of blue dominate this selection as the blue primary exhibits the least attenuation, while the more opaque red and orange are underrepresented. A reduction in the target RE would result in a larger selection of the latter hues.
Figure 14.
Selected equificient colours with RE = 75% from the RAL series. The predicted layer composition is only shown for the orange primary colour.
Figure 15.
Interactive identification of equificient colours as scatter plot in the CIE colourspace. Each point is coloured according to the RE predicted for its corresponding effective colour. A high RE results in low saturation, which causes the corresponding points to cluster around the (neutral) origin. Conversely, a lower RE results in saturated/opaque colours, which places the corresponding points further from the origin. Note that the chromaticity plane is enlarged to the range [−25, 25]2 for clarity. (Left) Effective colours from the RAL series predicted for target REs of 15–95%. The colours are grouped into equificiency intervals with = 5%. Increasing the opacity of the same RAL colour (and consequently decreasing its RE) results in the curved trajectories radiating from the origin. These are particularly evident along the axis. Note the predicted effective colours exhibit the same asymmetric response along the axis as the training set in Figure 4. (Right) The equificiency interval (70%, 75%] is selected and can be interactively inspected using the hover tool.
4.3. Optional Postprocessing: Visualisation, Colour Matching, and Hotspot Analysis
The layer compositions, RE, and effective colours predicted by the printing simulation and prediction framework may be used for several optional postprocesses to support the designer. These include interactive visualisation, colour matching, and hotspot analysis. The following subsections present exemplary results from each of these postprocesses.
4.3.1. Interactive Visualisation in Colourspace
Predicted effective colours may be visualised in a web browser as a scatterplot in colourspace, as shown in Figure 15 for a selection of RAL colours. In the current workflow, this interactive scatterplot is produced by the Python Bokeh library [63] as standalone HTML output. Bokeh also supports dynamic generation through a web server backend, but this is currently not implemented in our workflow.
Details of individual colours, notably their predicted layer compositions, may be inspected interactively. Equificient colours are grouped into RE intervals of which may be filtered to support exploration of alternative colour choices with equivalent performance. In addition, the corresponding numeric data, as shown in Figure 14, is available for further analysis outside the workflow.
4.3.2. Colour Matching
To address client-defined target colours, a colour matching postprocess can identify the visually closest simulated colours based on predicted effective values and colour difference (Figure 16). Their corresponding predicted layer compositions consequently yield a “recipe” which approximates the desired effective colour. The client or designer may then select a candidate by prioritising either RE or colour fidelity.
Figure 16.
Closest matches to an effective target colour (highlighted in the red box) from a simulated RAL series, sorted by colour difference . The predicted opacity and per-primary surface coverage (shown here for orange) define the layer compositions for each candidate colour. A colour difference < 3 is typically imperceptible to a casual observer.
4.3.3. Hotspot Analysis
The RE output by the printing simulation can be analysed spatially to assess local mismatches and potential hotspot formation in polychromatic designs. Hotspots should be detected and avoided early on at the design stage as they may lead to overheating and shorten the life of the laminated PV module [31]. To this end, the printing simulation subdivides the RIP input into tiles, each yielding a locally averaged RE value that may be visualised as a heatmap (Figure 17). The resulting RE distribution is characterised by its mean and standard deviation , which serve as decision variables for optimisation. Ideally, approaches the target RE while is minimised to reduce local shading mismatches and mitigate hotspot risk. In this context, equificient colours provide a mechanism for substitution with an alternative colour to equalise RE while preserving overall design intent.
Figure 17.
Hotspot analysis of a design with a targeted RE of ca. 70%. (Left) Simulated laminated module preview with actual printed colours. (Right) Corresponding heatmap visualisation of predicted local mean RE () using ca. 16 × 16 mm tiles. A high local RE mismatch ( up to 30%) and standard deviation indicate potential hotspot formation.
4.4. Application and Transfer Case Studies
The following sections document the application and transfer of the workflow to three case studies addressing different contexts and requirements. More specifically, these examples demonstrate that the workflow is applicable not only in realised façade projects, but also in teaching, design experimentation, and research on alternative colour-generation strategies.
In general, the case studies highlight the workflow’s modularity and flexibility, and how they address the needs of the designer in selecting colours to balance aesthetics and efficiency losses or mismatches. Because the tools at the core of the workflow are still in a prototype stage, we present these case studies as pilot projects.
4.4.1. Case Study 1: Application to Full-Scale Demonstrator Façade (NEST)
The proposed workflow was applied to a design of a coloured BIPV façade installation at the NEST modular research, testing, and demonstration building in Dübendorf, Switzerland. The installation comprised ten square photovoltaic façade modules of 1.2 × 1.2 m each, arranged around a building corner (Figure 18). The interdisciplinary setting made the project particularly suitable as a case study. This reconciled communicative, architectural, constructive, and photovoltaic requirements in one realised façade application.
Figure 18.
Full-scale demonstrator façade installation in NEST building, comprising ten PV modules in a corner unit of the building.
Design Brief and Constraints
In contrast to applications that primarily aim to imitate conventional façade materials, this project pursued a communication-oriented design strategy based on simplified icons, action-driven keywords, and strong visual contrast [64]. The design objective was therefore not to maximise electrical yield, but to achieve a visually clear and expressive façade composition while maintaining acceptable photovoltaic performance.
Selection of Equificient Colours
To support the aforementioned goal, a reduced colour palette was adopted, consisting of black, white, red, green, and orange. Rather than exploring the full accessible colourspace, the workflow was used here to tune this predefined palette toward approximately equificient behaviour. This was important because several modules contained multiple coloured regions; strong local differences in RE could otherwise have increased spatial mismatch and hotspot risk. Furthermore, both icons and text elements had to remain readable from a considerable distance and under changing outdoor light conditions. This requirement strongly influenced the colour strategy and selection of equificient colours. A target RE in the range of approximately 60–65% was therefore selected as a compromise between visual lightness and energetic performance.
Realised Module Performance and Discussion
The case study also illustrates an important boundary condition of the workflow. For architectural reasons, the realised modules were fabricated using satinated glass to improve brightness and readability under outdoor viewing conditions. However, the prediction workflow had originally been calibrated for float glass. Despite this transfer beyond the original calibration setting, the workflow proved sufficiently robust for design support and colour balancing, the desaturation effected by the satinated finish notwithstanding.
The realised modules were measured with a flasher and achieved a mean output of approximately 158 Wp (Figure 19), corresponding to an RE of about 61–63%, slightly below the nominal design target but still within a practically plausible range for the demonstrator application. This deviation is plausibly explained by the changed glazing condition, which highlights both the usefulness of the workflow and the need for glass-specific calibration in future applications.
Figure 19.
Results of flash test for NEST case study.
Overall, the NEST case study demonstrates that the proposed workflow can support colour selection, efficiency balancing, and design decision-making in a realised full-scale façade project. It further shows that the concept of equificient colours is not merely of theoretical interest, but can directly inform the practical development of coloured BIPV installations under real architectural and manufacturing constraints.
4.4.2. Case Study 2: Transfer into Teaching/Education (CAS Photovoltaics)
The CAS Photovoltaics programme is a professional continuing-education course for specialists in the construction sector, combining technical and design-oriented aspects of photovoltaic integration. Within the programme, coloured BIPV modules are used as a teaching case to explore the relationship between architectural appearance and photovoltaic performance. Participants develop individual PV module designs that are subsequently fabricated with the industrial partner, providing a direct link between digital design, simulation, and realised modules.
Design Brief and Constraints
Participants design coloured PV modules within predefined production constraints, including fixed module dimensions and the six primary colours supported by the ceramic printing system. Designs consist of uniformly coloured regions covering the module surface and typically include logos, heraldic motifs, or abstract graphic compositions.
In addition to the visual design, participants specify a target RE, usually within the range of 60–80%, requiring consideration of the trade-off between colour opacity and photovoltaic performance. The workflow supports this process by predicting RE and effective colour directly from the RIP-derived layer compositions.
Hotspot Mitigation Using Equificient Colours
The workflow further enables hotspot analysis by evaluating local RE mismatches across the module design (Figure 20). Based on the predicted RE distribution, equificient colours can be selected to replace colours with diverging RE. The overall RE in the design is thus equalised while preserving the intended visual appearance, thereby reconciling hotspot mitigation with design flexibility. The concept of equificiency proved particularly valuable in the educational context, as it made the interaction between colour choice, manufacturability, photovoltaic performance and local shading effects directly visible and actionable for participants.
Figure 20.
(Left) Hotspot analysis of a CAS PV design before optimisation, showing local of up to 10%—already a very good result and close to equificent. The analysis was parametrised with a resolution of ca. 16 × 16 mm tiles and 5× magnification. (Right) Optimised design for a target RE of 55%; the use of equificient colours results in a more uniform RE ( < 3%) and significantly lower standard deviation of ca. 0.0058 as opposed to 0.0229 before optimisation.
4.4.3. Case Study 3: Transfer into Design Domain Research (Solar Design Tools)
The principle of equificient colours was further explored in the Solar Design Tools research project conducted at the Department of Design, Film and Art of the Lucerne University of Applied Sciences and Arts [65]. This project investigated design-oriented strategies for coloured photovoltaics, with a particular focus on optical colour blending using patterned arrangements of ceramic printing primaries.
Design Brief and Constraints
Rather than physically blending primary colours during printing, the project generated perceived process colours through the spatial juxtaposition of discrete primary-colour regions (Figure 21). At a sufficient viewing distance, the neighbouring colour regions visually merge into a single perceived hue. For example, green and orange regions can be arranged such that they are perceived as yellow-green from approximately 10 m. A similar technique was also used for the ceramically printed Colorblast system [31].
Figure 21.
Demonstration wall for case study Solar Design Tools, consisting of 78 PV modules. Each module is composed of discrete regions populated by individual printer primary colours. Viewed at a distance, these regions are perceived as an optical blend.
Based on this principle, a colour canon of approximately 120 optically blended colours was developed using combinations of the six available printer primaries. The design challenge was to define spatial distributions and area proportions that achieved the intended visual blend. At the same time, the designs had to remain compatible with the constraints of ceramic printing and photovoltaic integration.
Application of Equificiency
In this context, equificient colour selection was essential to avoid locally varying relative efficiencies within visually blended regions. Combining colours with substantially different RE would introduce non-uniform current generation and increase hotspot risk.
The workflow was therefore used to identify equificient combinations of primary colours with comparable RE characteristics, enabling visually blended compositions while maintaining locally uniform performance. This allowed optical blending strategies to be explored without compromising photovoltaic behaviour.
The case study demonstrates the transfer of the workflow into the design research domain and highlights the value of equificient colours as a design mechanism for achieving optical blending together with hotspot-aware efficiency optimisation.
5. Conclusions and Future Work
This paper presented an end-to-end workflow for the design and assessment of ceramically printed coloured photovoltaic modules. It addresses a known gap prevalent in the literature, namely the need for integrated frameworks that combine photovoltaic efficiency and appearance modelling to reduce the reliance on physical prototyping.
The workflow associates printer-ready RIP data with two outputs that are critical in architectural practice, namely predicted RE and predicted post-lamination effective colour. The simulation framework embedded in the workflow features a physically motivated multilayer ceramic printing simulation. This is complemented by a prediction framework using multivariate regression to estimate layer compositions for specific RE, and a post-lamination colour prediction based on a neural network trained with colourimetric reference data.
The initial results with custom process colours indicated RE deviations within ca. ±5% ( = 3.26%) with a simulated print magnification of 8–16×, while the effective colour prediction revealed a mean colour difference of = 1.86 ( = 0.92). These figures suggest that the workflow can support informed design decisions in evaluating performance/aesthetic trade-offs, thereby reducing the reliance on physical prototyping.
A central contribution of the study is the introduction of equificient colours, defined here as visually distinct colours with matched RE within a specified tolerance, as demonstrated in this paper for = 5%. This concept expands the design space by allowing alternative colour choices without significantly changing the energetic target. In practical terms, it is particularly relevant for reducing local RE mismatches and thereby mitigating hotspot risk in multi-coloured module designs. In one example, we presented a reduction in RE mismatches from an already low 10% to under 3%.
The presented case studies highlight the workflow’s applicability and transfer to different contexts. The NEST façade case study demonstrates the practical usefulness of the workflow in a realised full-scale architectural installation, where visual, constructive, and energetic requirements had to be balanced simultaneously. The CAS Photovoltaics and Solar Design Tools case studies further show that the same principles can be transferred to educational settings and to optically blended colour compositions.
At the same time, several limitations remain. The multilayer model relies on simplified assumptions regarding inkdrop geometry and transparency accumulation, and calibration is specific to a given combination of printer, ink set, and glazing. Prediction accuracy also depends on simulation resolution and remains computationally demanding in its current implementation. Moreover, the workflow supports decision-making rather than autonomous design optimisation; final aesthetic choices remain with the designer. Lastly, the developed software tools currently constitute a prototype and proof of concept rather than a production-ready system. The implementation was intentionally designed to remain flexible and modular, prioritising experimentation, validation, and knowledge transfer over large-scale industrial optimisation.
Future work should focus on three areas. (a) The workflow requires stronger systematic validation across different glazing and module configurations. This also includes extending the colour prediction training to include more measured samples near the printer gamut limits. (b) The computational performance could be improved through fine-grained parallelism by leveraging GPUs. The printing simulation maps naturally to a GPU topology using kernel threads which operate in parallel on individual pixels of the rendered inkdrops. (c) The workflow should be extended to additional printing systems and realised projects.
Author Contributions
Conceptualisation, industrial relations, funding acquisition, project administration, and paper review: S.W. Technical workflow development, implementation of software tools, postprocessing, error analysis, literature research, and writing: R.S. All authors have read and agreed to the published version of the manuscript.
Funding
This research was funded by the Department of Engineering and Architecture at the Lucerne University of Applied Sciences and Arts (Hochschule Luzern Technik & Architektur), the Swiss Innovation Agency (Innosuisse) and Glas Trösch AG under the grant number 120.455 IP-EE: Colour-efficiency model for coloured frontglass of building integrated photovoltaic modules (https://www.aramis.admin.ch/Grunddaten/?ProjectID=48324, accessed on 20 August 2026).
Data Availability Statement
The datasets presented in this article are not readily available because they are subject to commercial restrictions. Requests to access the datasets should be directed to Prof. Dr. Stephen Wittkopf (Email: stephen.wittkopf@hslu.ch).
Acknowledgments
The authors acknowledge the contribution of the industrial partner Glas Trösch AG, Bützberg (CH) for sample preparation, measurement and analysis. The authors also thank EMPA for use of the NEST building as a case study. Finally, the authors thank Prof. Tina Moor and the Department of Design, Film and Art at the Lucerne University of Applied Sciences and Arts for their collaboration on the case study Solar Design Tools.
Conflicts of Interest
Author Dr. Roland Schregle acted as consultant with RS SciComp. The remaining authors declare that the research was conducted in the absence of any commercial or financial relationships that could be construed as a potential conflict of interest.
References
- Wilson, H.R.; Frontini, F.; Bonomo, P.; Eder, G.C.; Babin, M.; Thorsteinsson, S.; Adami, J.; Maturi, L.; Yang, R.J.; Weerasinghe, N.; et al. Multi-dimensional evaluation of BIPV installations: Development of a tool to assess the performance as building component and electricity generator. Energy Build. 2024, 312, 114207. [Google Scholar] [CrossRef] [Scilit]
- Bao, Y.; Xiang, C. Energy performance and aesthetic perception of colored building-integrated photovoltaic application—A case study in Hong Kong. Energy Build. 2025, 344, 116038. [Google Scholar] [CrossRef] [Scilit]
- Li, Z.; Li, S.; Yan, J.; Peng, J.; Ma, T. Balancing aesthetics and efficiency of coloured opaque photovoltaics. Nat. Rev. Clean Technol. 2025, 1, 216–226. [Google Scholar] [CrossRef] [Scilit]
- Borja Block, A.; Escarre Palou, J.; Courtant, M.; Virtuani, A.; Cattaneo, G.; Roten, M.; Li, H.Y.; Despeisse, M.; Hessler-Wyser, A.; Desai, U.; et al. Colouring solutions for building integrated photovoltaic modules: A review. Energy Build. 2024, 314, 114253. [Google Scholar] [CrossRef] [Scilit]
- Zhang, Q.; Li, Q. Temperature and reverse voltage across a partially shaded Si PV cell under hot spot test condition. In Proceedings of the 2012 38th IEEE Photovoltaic Specialists Conference, Austin, TX, USA, 3–8 June 2012; pp. 001344–001347. [Google Scholar] [CrossRef] [Scilit]
- RAL Gemeinnützige GmbH. The RAL CLASSIC Colour Collection. Available online: https://www.ral-farben.de/en/ral-classic (accessed on 20 August 2026).
- Hård, A.; Sivik, L. NCS—Natural Color System: A Swedish Standard for Color Notation. Color Res. Appl. 1981, 6, 129–138. [Google Scholar] [CrossRef] [Scilit]
- Peharz, G.; Ulm, A. Quantifying the influence of colors on the performance of c-Si photovoltaic devices. Renew. Energy 2018, 129, 299–308. [Google Scholar] [CrossRef] [Scilit]
- Riedel, B.; Messaoudi, P.; Assoa, Y.B.; Thony, P.; Hammoud, R.; Perret-Aebi, L.-E.; Tsanakas, J.A. Color coated glazing for next generation BIPV: Performance vs aesthetics. EPJ Photovolt. 2021, 12, 11. [Google Scholar] [CrossRef] [Scilit]
- Schregle, R.; Wittkopf, S. An Image-Based Gamut Analysis of Translucent Digital Ceramic Prints for Coloured Photovoltaic Modules. Buildings 2018, 8, 30. [Google Scholar] [CrossRef] [Scilit]
- Brachlow, H. An Empirical Approach to Colour in Glass. Arts 2019, 8, 15. [Google Scholar] [CrossRef] [Scilit]
- Wyszecki, G.; Stiles, W.S. Color Science: Concepts and Methods, Quantitative Data and Formulae, 2nd ed.; Wiley-Interscience: New York, NY, USA, 1982. [Google Scholar]
- IEA PVPS Task 15, Subtask E. COLOURED BIPV: Market, Research and Development; Technical Report IEA-PVPS T15-07: 2019; IEA International Energy Agency: Paris, France, 2019.
- Slooff-Hoek, L.; Reinders, A. Colored PV Modules. In Photovoltaic Solar Energy; John Wiley & Sons, Ltd.: Chichester, UK, 2024; Chapter 23; pp. 373–392. [Google Scholar] [CrossRef] [Scilit]
- Xie, Y.; You, T.; Dai, B.; Cui, H. A review of colored building-integrated photovoltaics (BIPV) for building decarbonization: Technological and market perspectives. Renew. Sustain. Energy Rev. 2026, 235, 116924. [Google Scholar] [CrossRef] [Scilit]
- Song, M.J.; Yoon, H.E.; Choi, G.; Jung, Y.C.; Lee, S.Y. A study on the microstructure and power generation performance of colored BIPV modules. Renew. Energy 2024, 237, 121558. [Google Scholar] [CrossRef] [Scilit]
- Selj, J.H.; Mongstad, T.T.; Søndenå, R.; Marstein, E.S. Reduction of optical losses in colored solar cells with multilayer antireflection coatings. Sol. Energy Mater. Sol. Cells 2011, 95, 2576–2582. [Google Scholar] [CrossRef] [Scilit]
- Macleod, H.A. Thin-Film Optical Filters, 5th ed.; CRC Press: Boca Raton, FL, USA, 2017. [Google Scholar] [CrossRef] [Scilit]
- Jolissaint, N.; Hanbali, R.; Hadorn, J.C.; Schüler, A. Colored solar façades for buildings. Energy Procedia 2017, 122, 175–180. [Google Scholar] [CrossRef] [Scilit]
- Røyset, A.; Kolås, T.; Jelle, B.P. Coloured building integrated photovoltaics: Influence on energy efficiency. Energy Build. 2020, 208, 109623. [Google Scholar] [CrossRef] [Scilit]
- Bläsi, B.; Kroyer, T.; Kuhn, T.; Höhn, O. The MorphoColor Concept for Colored Photovoltaic Modules. IEEE J. Photovolt. 2021, 11, 1305–1311. [Google Scholar] [CrossRef] [Scilit]
- Wessels, A.; Leonard, C.; Kroyer, T.; Bläsi, B.; Höhn, O. Structured interference layer systems for the color design of integrated PV systems. In Proceedings of the EU PVSEC, Lisbon, Portugal, 18–22 September 2023. [Google Scholar]
- Slooff, L.; van Roosmalen, J.; Okel, L.; Minderhoud, T.; Gijzen, G.; Polinder, L.; Goethals, F.; Sepers, T. Dutch solar design BIPV: Optimizing power output and aesthetic performance in architectural design. In Proceedings of the 35th International Conference for Photovoltaic Research EUPVSEC, ECN Solar Energy, Brussels, Belgium, 24–28 September 2018; Volume 24, pp. 1483–1487. [Google Scholar]
- Chen, Y.; Duan, K.; Li, S.; Liu, J.; Li, Z.; Ma, T. Efficiency prediction and experimental validation of anti-glare coloured photovoltaic modules for building integration. Appl. Energy 2026, 420, 128167. [Google Scholar] [CrossRef] [Scilit]
- Basher, M.K.; Nur-E-Alam, M.; Alameh, K.; Hinckley, S. Beyond aesthetics to elevate sustainable architectures: Selective micropatterning enhanced efficiency in colored photovoltaic modules. J. Mater. Sci. Mater. Electron. 2024, 35, 2058. [Google Scholar] [CrossRef] [Scilit]
- Gewohn, T.; Schinke, C.; Lim, B.; Brendel, R. Predicting color and short-circuit current of colored BIPV modules. AIP Adv. 2021, 11, 095104. [Google Scholar] [CrossRef] [Scilit]
- Slooff, L.; van Roosmalen, J.; Okel, L.; de Vries, T.; Minderhoud, T.; Gijzen, G.; Sepers, T.; Versluis, A.; Frumau, F.; Rietbergen, M.; et al. An Architectural Approach for Improving Aesthetics of PV. In Proceedings of the 33rd International Conference for Photovoltaic Research EUPVSEC. ECN Solar Energy, Amsterdam, The Netherlands, 25–29 September 2017. [Google Scholar]
- Schregle, R.; Krehel, M.; Wittkopf, S. Computational Colour Matching of Laminated Photovoltaic Modules for Building Envelopes. Buildings 2017, 7, 72. [Google Scholar] [CrossRef] [Scilit]
- Wittkopf, S. Farbiges Abdeckglas für Photovoltaikmodul. Patent DE 102016001628 A1, 17 August 2017. Available online: https://www.google.com/patents/DE102016001628A1 (accessed on 20 August 2026).
- Helen Rose Wilson, M.E. Spot Landing: Determining the Light and Solar Properties of Fritted and Coated Glass. In Proceedings of the Challenging Glass Conference 6, Delft, The Netherlands, 17–18 May 2018. [Google Scholar] [CrossRef]
- Reddy, C.R. ColorBlast: Performance of Ceramic Ink Printed Colour Photovoltaic Technology. Master’s Thesis, Delft University of Technology, Delft, The Netherlands, 2018. Available online: https://resolver.tudelft.nl/uuid:a7c2f6a5-d23a-4224-ae5c-21bef4a3756f (accessed on 20 August 2026).
- Saw, M.H.; Singh, J.P.; Wang, Y.; Birgersson, K.E.; Khoo, Y.S. Electrical Performance Study of Colored c-Si Building-Integrated PV Modules. IEEE J. Photovolt. 2020, 10, 1027–1034. [Google Scholar] [CrossRef] [Scilit]
- Saw, M.H.; Pravettoni, M.; Birgersson, E. STC Short-Circuit Current Prediction and I–V Simulation of Colored BIPV Modules With Machine Learning and One-Diode Equivalent Circuit Models. IEEE J. Photovolt. 2022, 12, 1533–1542. [Google Scholar] [CrossRef] [Scilit]
- Saw, M.H.; Nalluri, S.; Pravettoni, M. Design of “Hotspot-Free” BIPV Modules—Peranakan PV. In Proceedings of the Proceedings WCPEC-8, Milan, Italy, 26–30 September 2022; pp. 1024–1027. [Google Scholar] [CrossRef]
- Halme, J.; Mäkinen, P. Theoretical efficiency limits of ideal coloured opaque photovoltaics. Energy Environ. Sci. 2019, 12, 1274–1285. [Google Scholar] [CrossRef] [Scilit]
- Pearce, P.M.; Halme, J.; Jiang, J.Y.; Ekins-Daukes, N.J. Efficiency limits and design principles for multi-junction coloured photovoltaics. Energy Environ. Sci. 2024, 17, 1189–1201. [Google Scholar] [CrossRef] [Scilit]
- Walker, L.; Hofer, J.; Schlueter, A. High-resolution, parametric BIPV and electrical systems modeling and design. Appl. Energy 2019, 238, 164–179. [Google Scholar] [CrossRef] [Scilit]
- McIntosh, K.R.; Amara, M.; Mandorlo, F.; Abbott, M.D.; Sudbury, B.A. Advanced simulation of a PV module’s color. AIP Conf. Proc. 2018, 1999, 020017. [Google Scholar] [CrossRef] [Scilit]
- Wilson, H.R.; Bueno Unzeta, B.; Eisenlohr, J.; Kuhn, T. Evaluating BIPV Modules with Respect to Textural Appearance, Glare, Colour and Electricity Yield. In Proceedings of the 36th PV-Symposium, Bad Staffelstein, Germany, 18–26 May 2021; Available online: https://www.semanticscholar.org/paper/Evaluating-BIPV-modules-with-respect-to-textural-Wilson-Bueno/17707e601329281312d32b9b4aa989912c579204 (accessed on 20 August 2026).
- Pelle, M.; Causone, F.; Maturi, L.; Moser, D. Opaque Coloured Building Integrated Photovoltaic (BIPV): A Review of Models and Simulation Frameworks for Performance Optimisation. Energies 2023, 16, 1991. [Google Scholar] [CrossRef] [Scilit]
- Pfau, C.; Bangash, A.; Hagendorf, C.; Turek, M. Simulation Tool for the Performance Optimization of Colored PV Modules. In Proceedings of the 38th European Photovoltaic Solar Energy Conference and Exhibition, Online, 6–10 September 2021; pp. 769–772. [Google Scholar]
- Milburn, D.; Hollands, K. Solar transmittance measurements using an integrating sphere with broad area irradiation. Sol. Energy 1994, 52, 497–507. [Google Scholar] [CrossRef] [Scilit]
- Oh, M.; Kim, J.Y.; Kim, B.; Yun, C.Y.; Kim, C.K.; Kang, Y.H.; Kim, H.G. Tolerance angle concept and formula for practical optimal orientation of photovoltaic panels. Renew. Energy 2021, 167, 384–394. [Google Scholar] [CrossRef] [Scilit]
- Harris, C.R.; Millman, K.J.; van der Walt, S.J.; Gommers, R.; Virtanen, P.; Cournapeau, D.; Wieser, E.; Taylor, J.; Berg, S.; Smith, N.J.; et al. Array programming with NumPy. Nature 2020, 585, 357–362. [Google Scholar] [CrossRef] [Scilit] [PubMed]
- Virtanen, P.; Gommers, R.; Oliphant, T.E.; Haberland, M.; Reddy, T.; Cournapeau, D.; Burovski, E.; Peterson, P.; Weckesser, W.; Bright, J.; et al. SciPy: Open Source Scientific Tools for Python. Nat. Methods 2020, 17, 261–272. [Google Scholar] [CrossRef] [Scilit] [PubMed]
- Pedregosa, F.; Varoquaux, G.; Gramfort, A.; Michel, V.; Thirion, B.; Grisel, O.; Blondel, M.; Prettenhofer, P.; Weiss, R.; Dubourg, V.; et al. Scikit-learn: Machine Learning in Python. J. Mach. Learn. Res. 2011, 12, 2825–2830. Available online: https://jmlr.csail.mit.edu/papers/v12/pedregosa11a.html (accessed on 20 August 2026).
- McKinney, W. Data Structures for Statistical Computing in Python. In Proceedings of the 9th Python in Science Conference; van der Walt, S., Millman, J., Eds.; 2010; pp. 56–61. [Google Scholar] [CrossRef] [Scilit]
- Pandas Development Team. Pandas: The Python Data Analysis Library. 2026. Available online: https://pandas.pydata.org/ (accessed on 20 August 2026).
- Clark, J.; The Pillow Contributors. Pillow (Python Imaging Library Fork). 2026. Available online: https://pillow.readthedocs.io/en/stable/ (accessed on 20 August 2026).
- Taylor, G. Python-Colormath 3.0.0. 2014. Available online: https://zenodo.org/records/16011 (accessed on 20 August 2026).
- Porter, T.; Duff, T. Compositing digital images. In Proceedings of the 11th Annual Conference on Computer Graphics and Interactive Techniques (SIGGRAPH), Minneapolis, MN, USA, 23–27 July 1984; pp. 253–259. [Google Scholar] [CrossRef] [Scilit]
- Levoy, M. Display of Surfaces from Volume Data. IEEE Comput. Graph. Appl. 1988, 8, 29–37. [Google Scholar] [CrossRef] [Scilit]
- Pharr, M.; Jakob, W.; Humphreys, G. Physically Based Rendering: From Theory to Implementation, 3rd ed.; Morgan Kaufmann: San Francisco, CA, USA, 2016. [Google Scholar]
- Liu, L.; Miteva, T.; Delnevo, G.; Mirri, S.; Walter, P.; de Viguerie, L.; Pouyet, E. Neural Networks for Hyperspectral Imaging of Historical Paintings: A Practical Review. Sensors 2023, 23, 2419. [Google Scholar] [CrossRef] [Scilit]
- Hua, Y.; Ni, J.; Lu, H. An eye-tracking technology and MLP-based color matching design method. Sci. Rep. 2023, 13, 1294. [Google Scholar] [CrossRef] [Scilit]
- Le, H.M.; Price, B.; Cohen, S.; Brown, M.S. GamutMLP: A Lightweight MLP for Color Loss Recovery. In Proceedings of the 2023 IEEE/CVF Conference on Computer Vision and Pattern Recognition (CVPR), Vancouver, BC, Canada, 18–22 June 2023; pp. 18268–18277. [Google Scholar] [CrossRef] [Scilit]
- Wang, Y.; Zhao, Q.; Chen, J.; Wang, W.; Yu, S.; Yang, X. Color Design Decisions for Ceramic Products Based on Quantification of Perceptual Characteristics. Sensors 2022, 22, 5415. [Google Scholar] [CrossRef] [Scilit]
- Hansen, L.; Salamon, P. Neural network ensembles. IEEE Trans. Pattern Anal. Mach. Intell. 1990, 12, 993–1001. [Google Scholar] [CrossRef] [Scilit]
- SciKit-Learn Developers. Sklearn.Neural_Network.MLPRegressor. 2026. Available online: https://scikit-learn.org/stable/modules/generated/sklearn.neural_network.MLPRegressor.html (accessed on 20 August 2026).
- Taylor, J.; Wang, W.; Bala, B.; Bednarz, T. Optimizing the optimizer for data driven deep neural networks and physics informed neural networks. arXiv 2022. [Google Scholar] [CrossRef] [Scilit]
- Scott, D.; Coveney, P.; Kilner, J.; Rossiny, J.; Alford, N.N. Prediction of the functional properties of ceramic materials from composition using artificial neural networks. J. Eur. Ceram. Soc. 2007, 27, 4425–4435. [Google Scholar] [CrossRef] [Scilit]
- Hastie, T.; Tibshirani, R.; Friedman, J. The Elements of Statistical Learning: Data Mining, Inference, and Prediction, 2nd ed.; Springer: London, UK, 2009. [Google Scholar] [CrossRef]
- Bokeh Development Team. Bokeh: Python Library for Interactive Visualization. 2026. Available online: https://bokeh.pydata.org (accessed on 20 August 2026).
- Wittkopf, J. PV-Module Design—Visual Communication Through Pictograms. Available online: https://www.empa.ch/documents/d/nest/design_pv-module (accessed on 20 August 2026).
- Hochschule Luzern Design, Film and Art. Solar Design Tools. Innosuisse grant no. 104.388 IP-SBM. 2025. Available online: https://www.hslu.ch/en/lucerne-university-of-applied-sciences-and-arts/research/projects/detail/?pid=6308 (accessed on 20 August 2026).


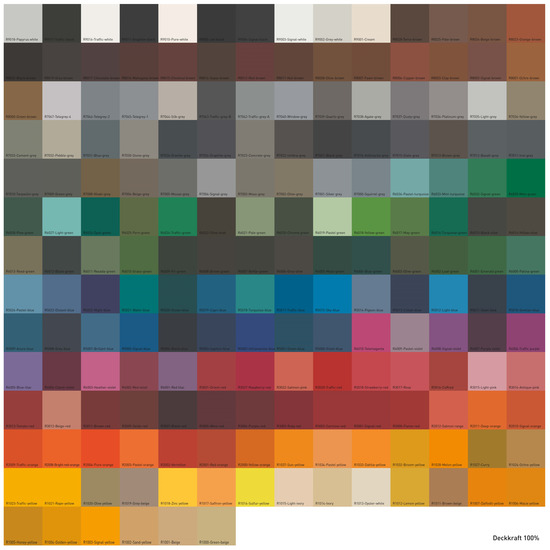
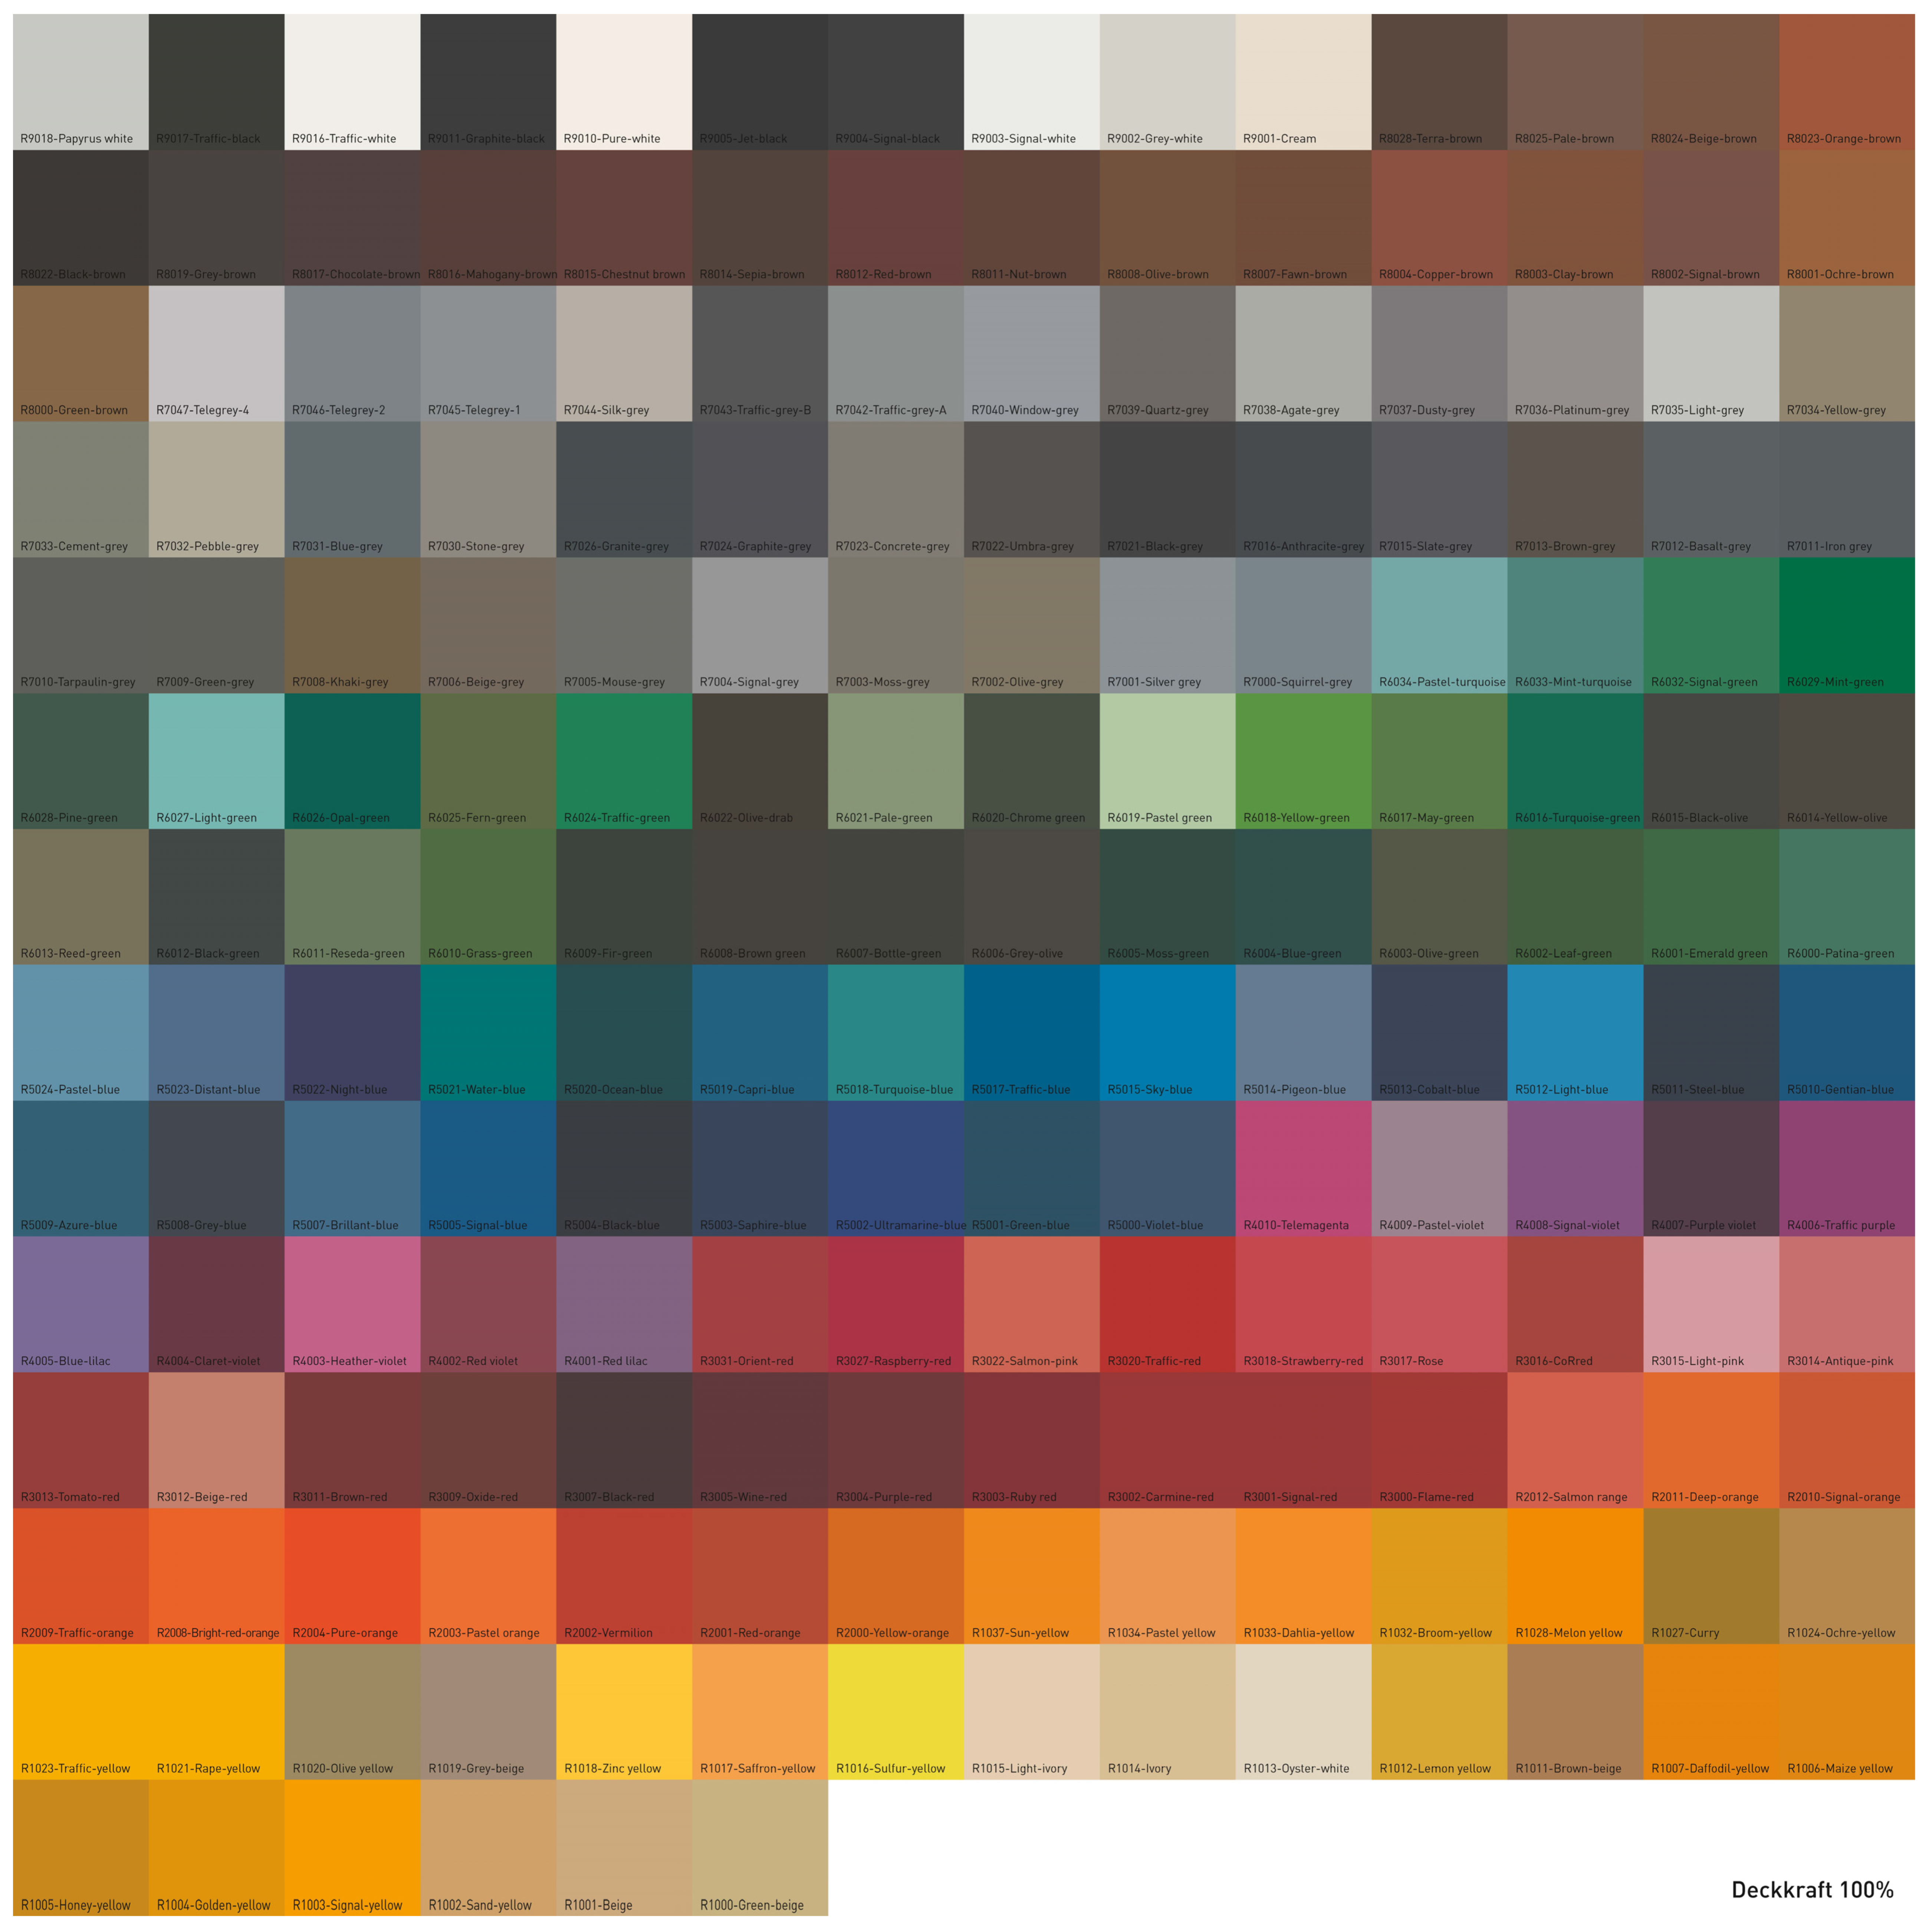
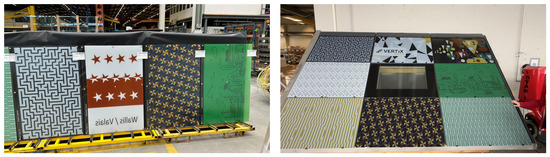
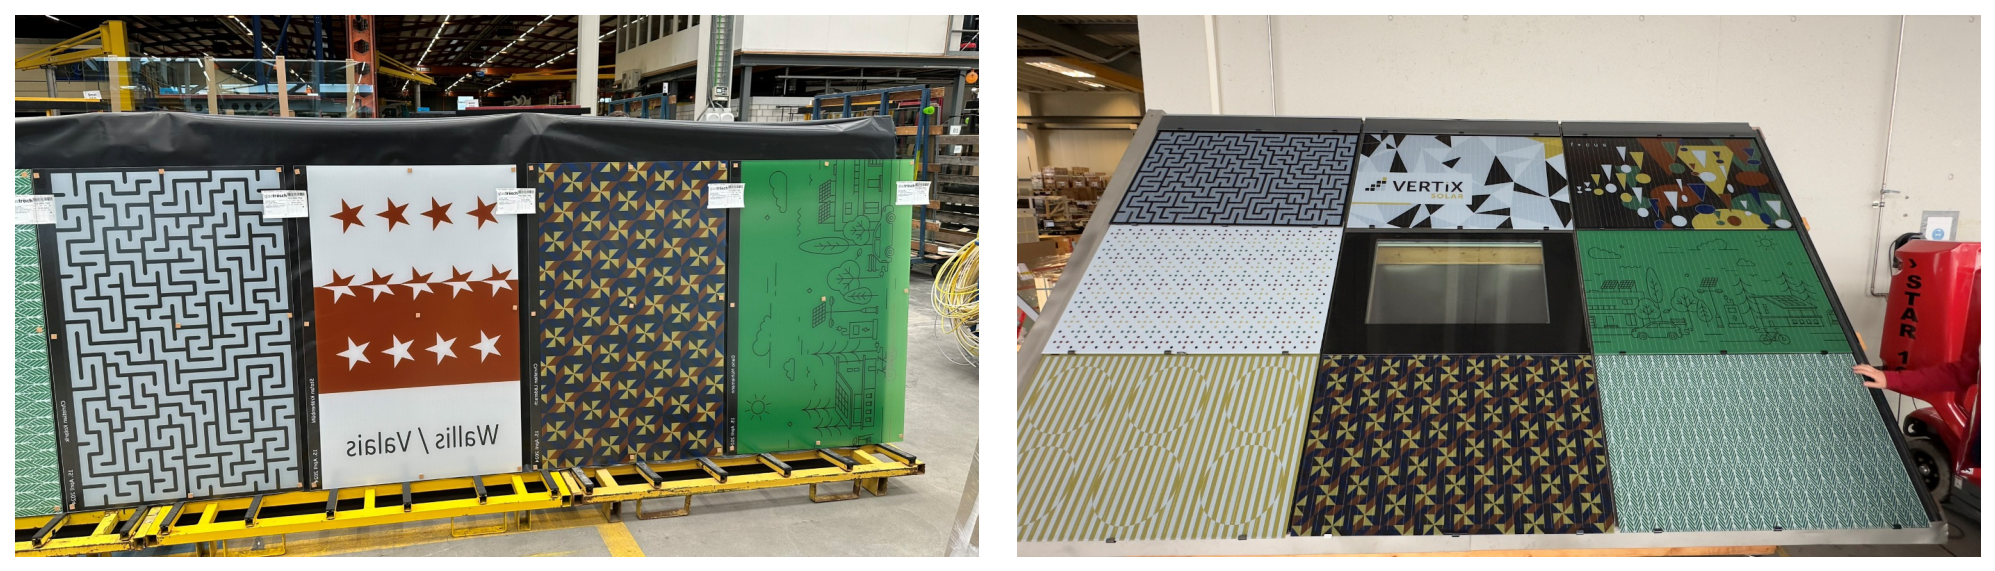
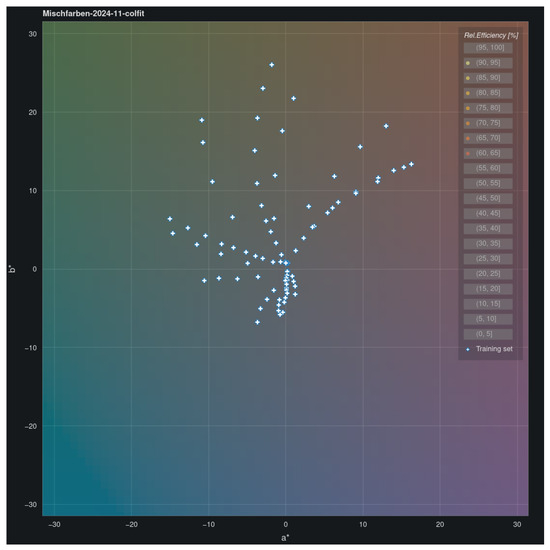
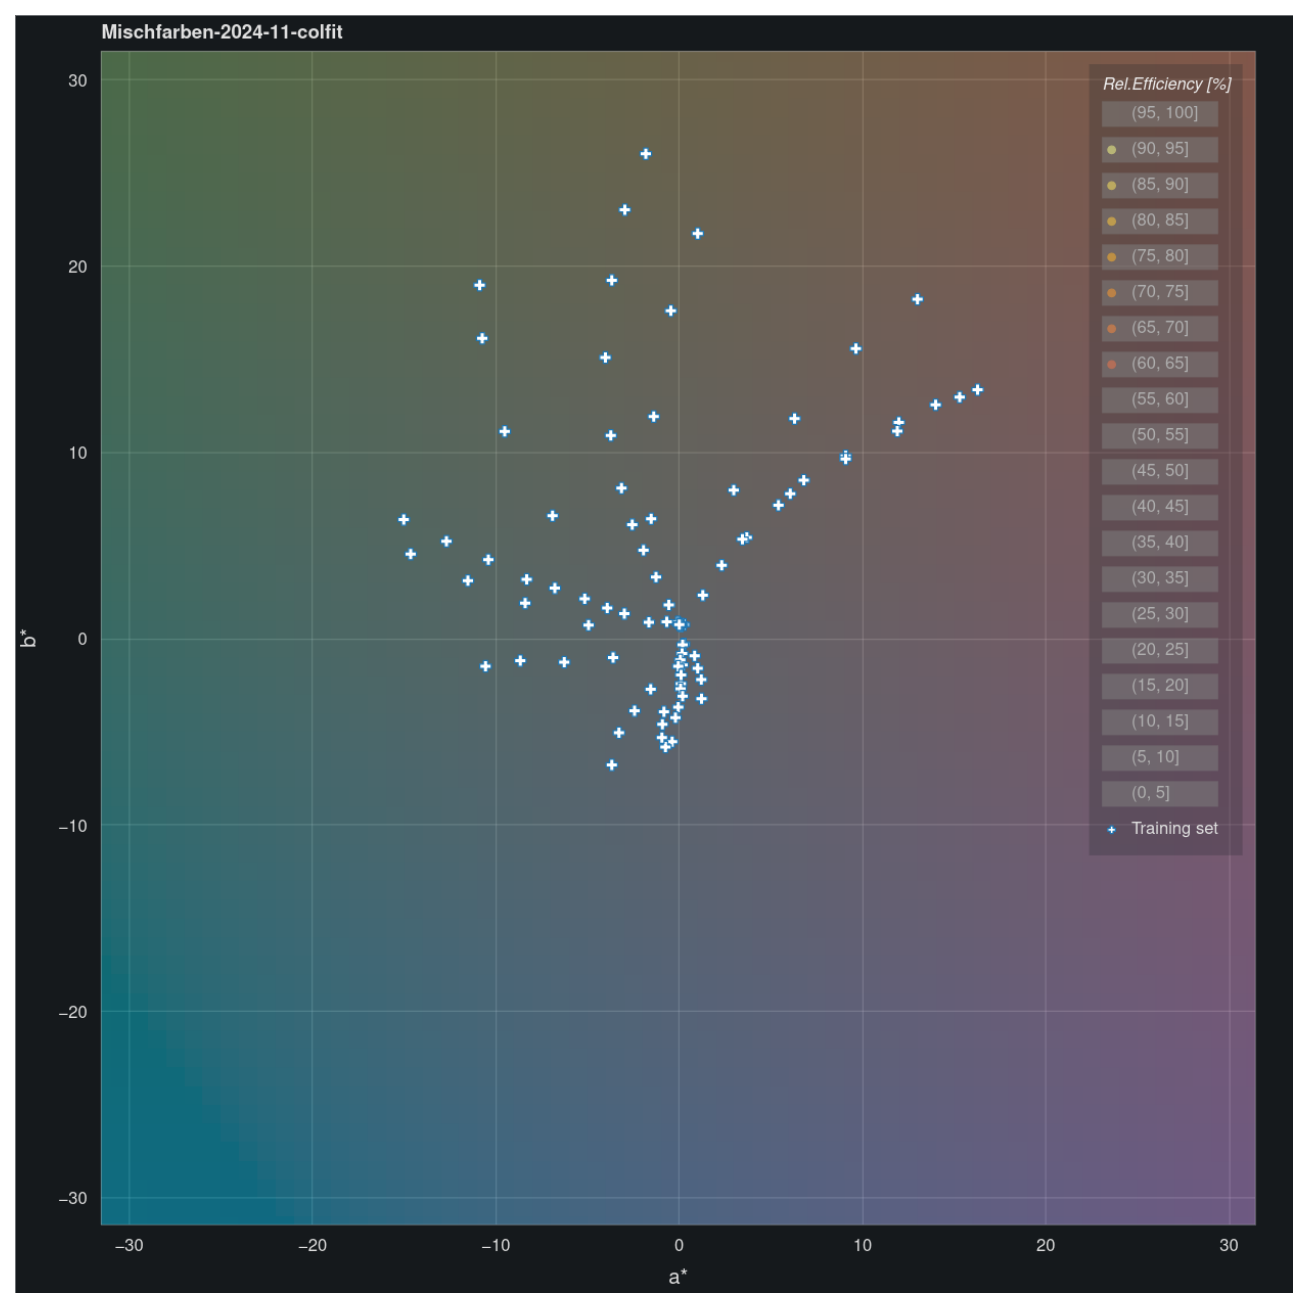
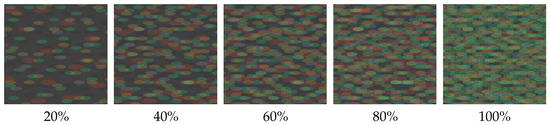
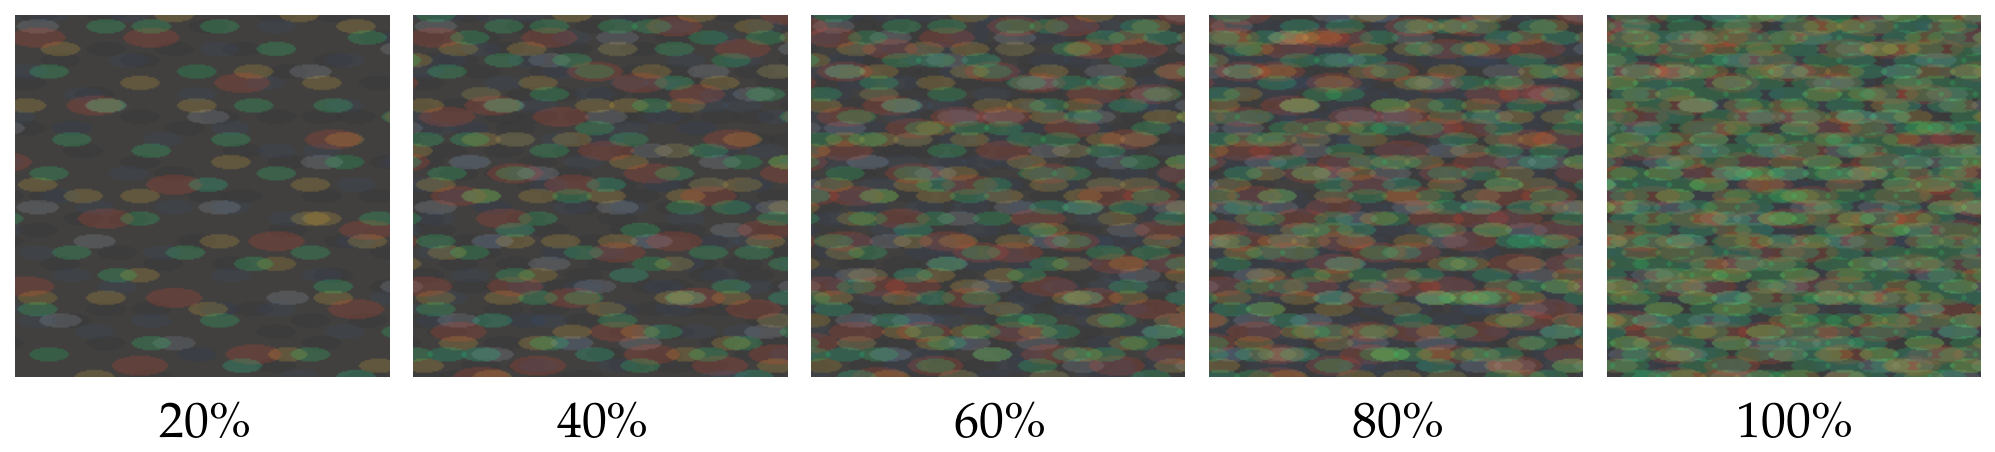
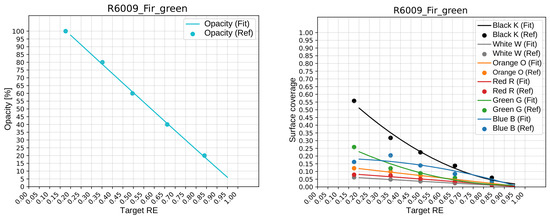
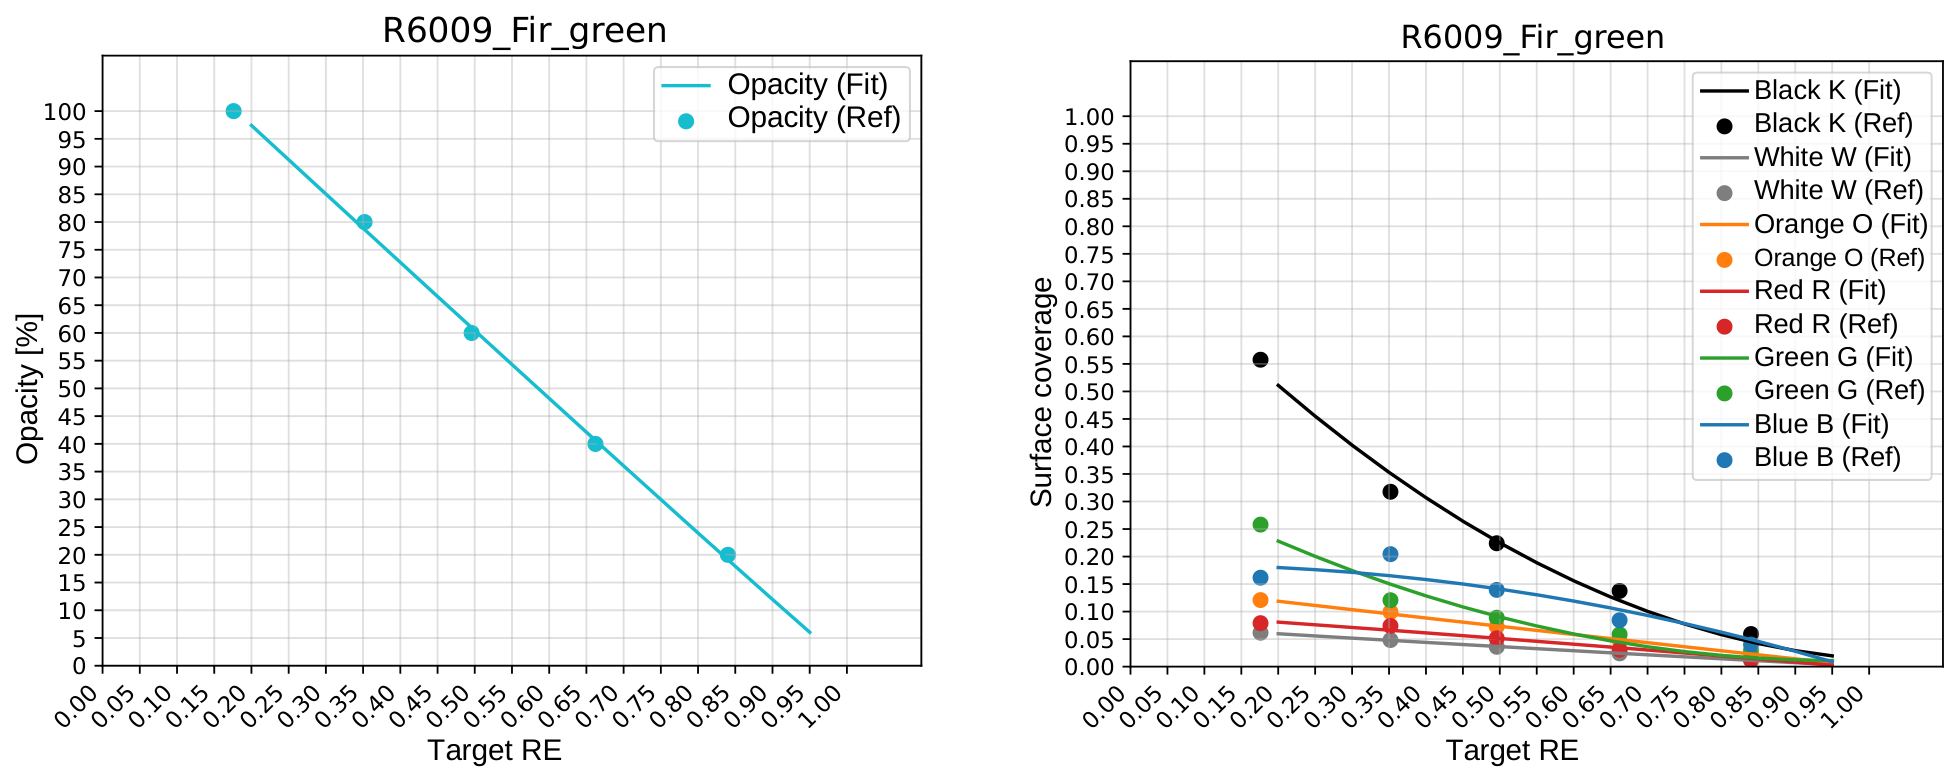
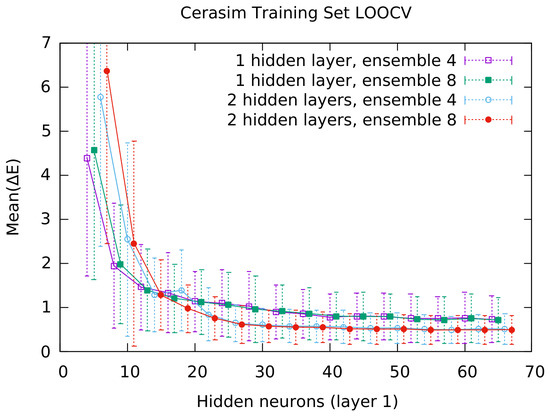
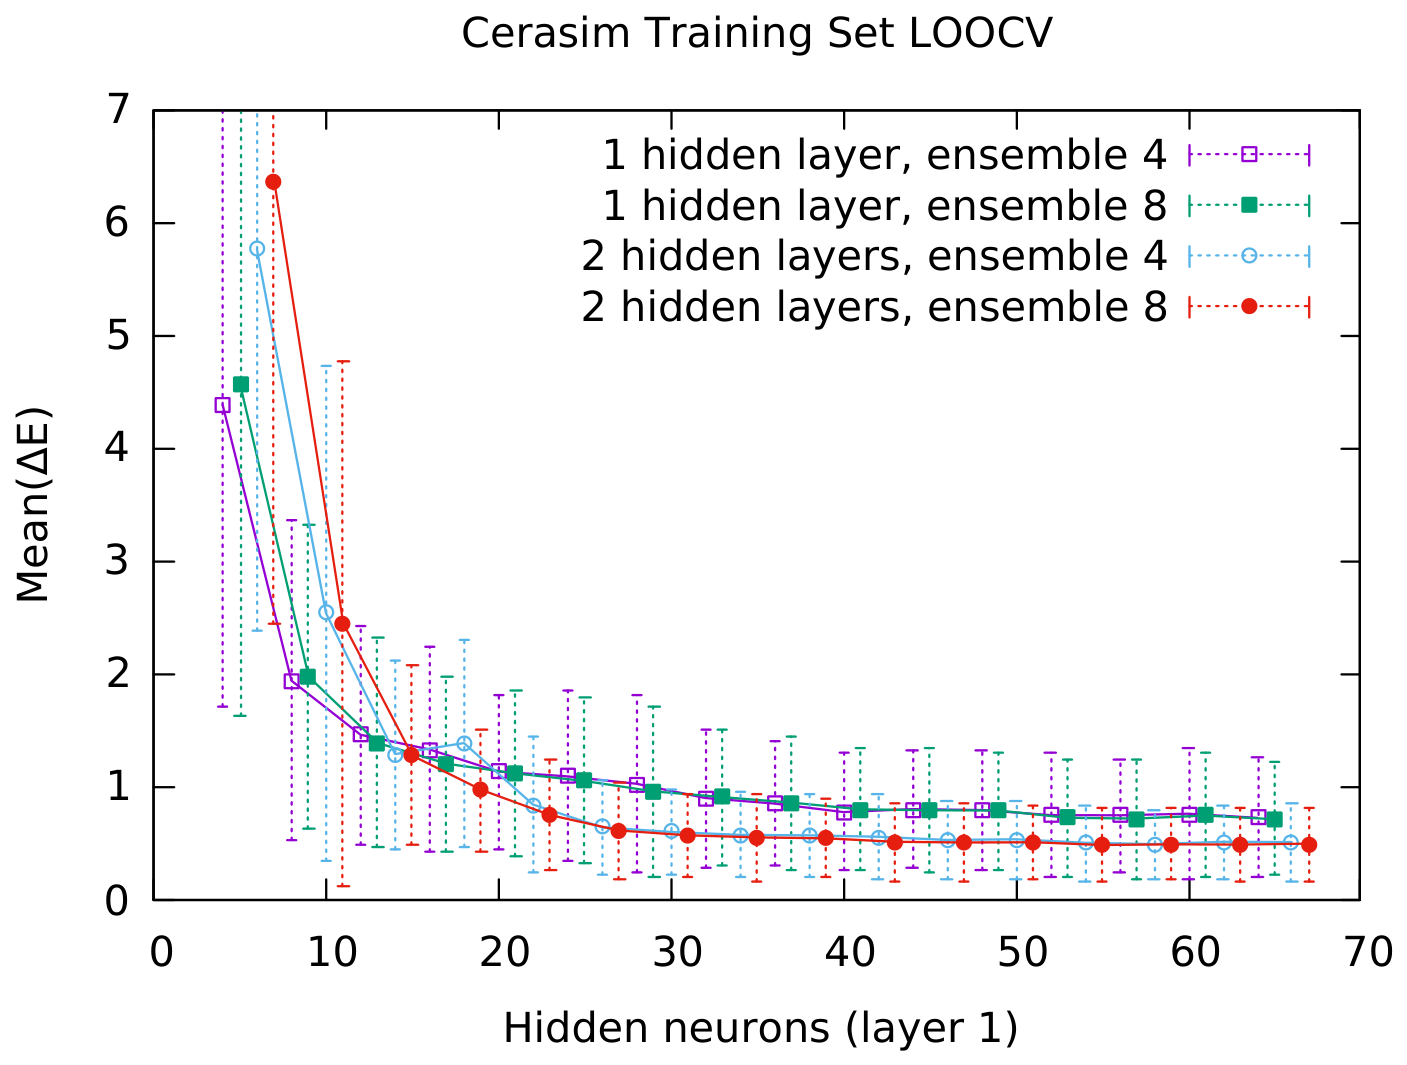
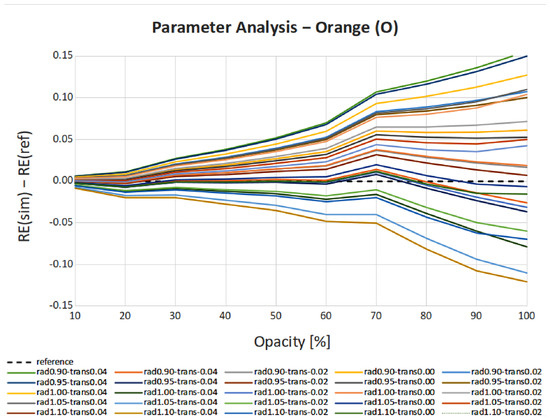
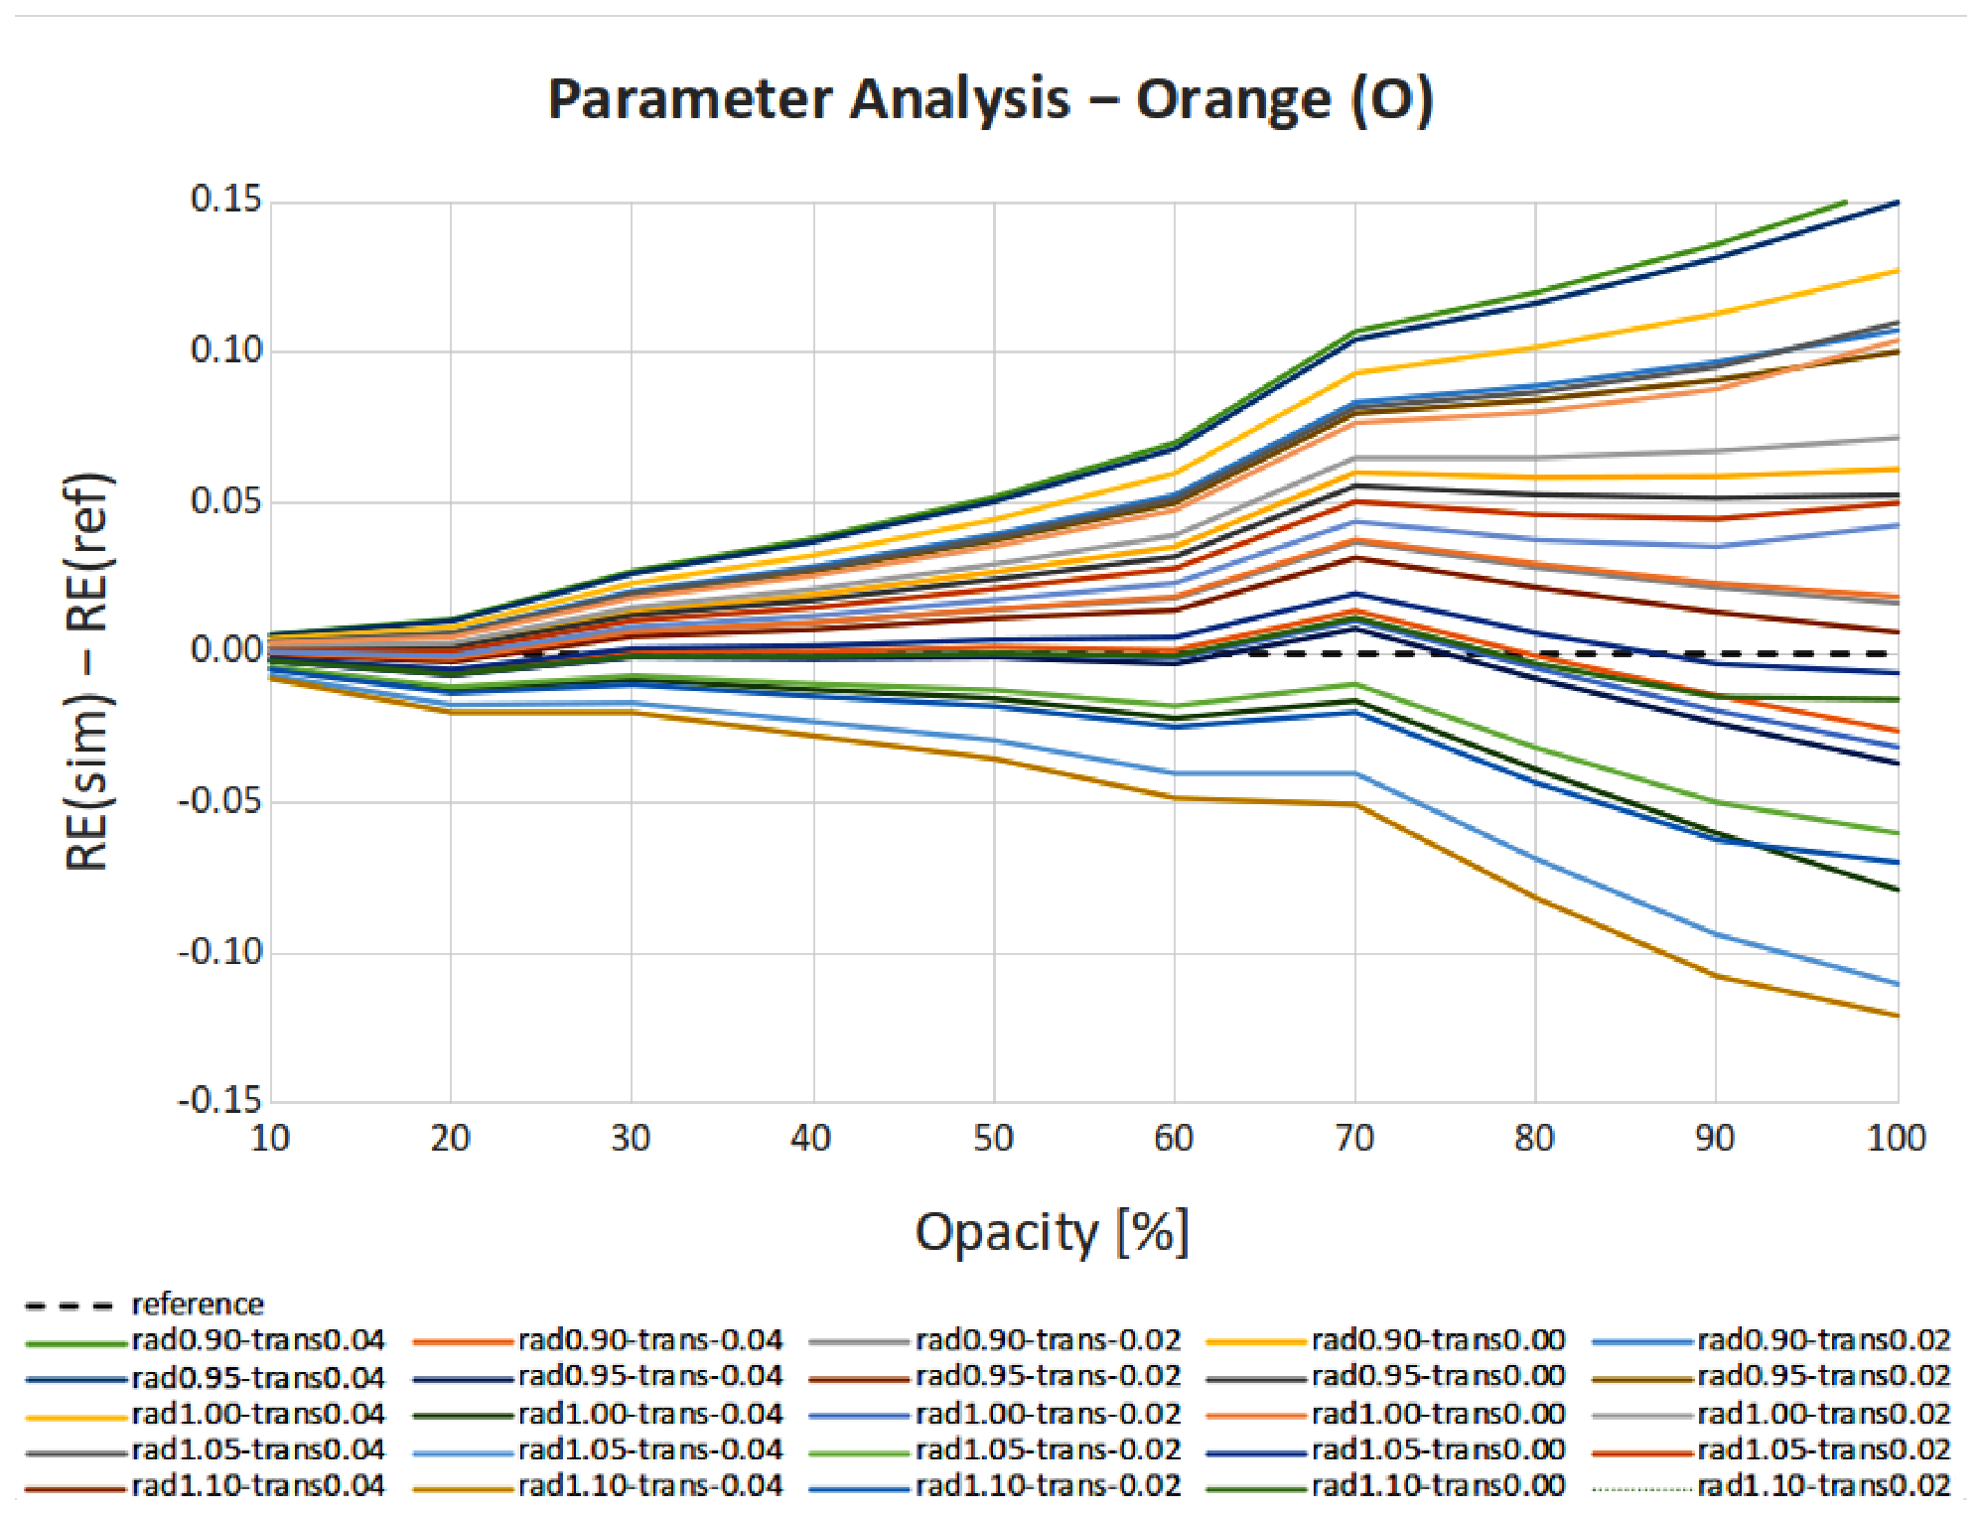
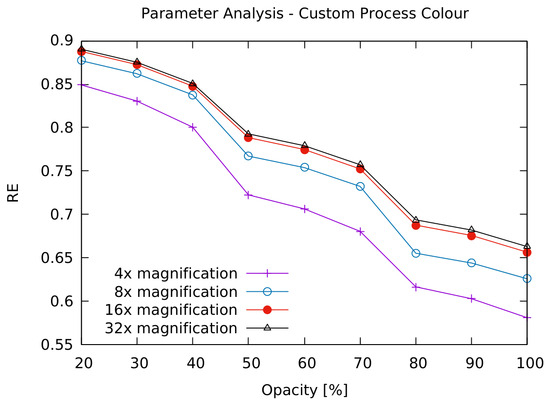
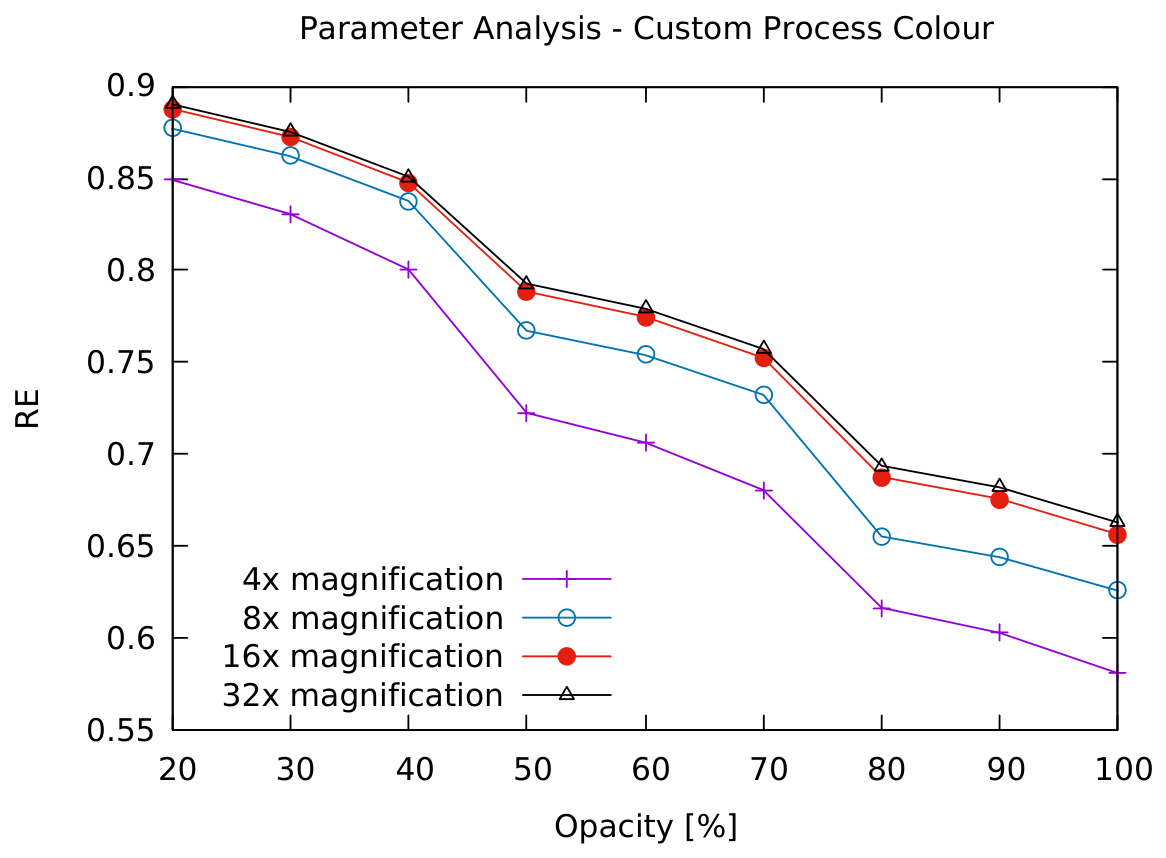
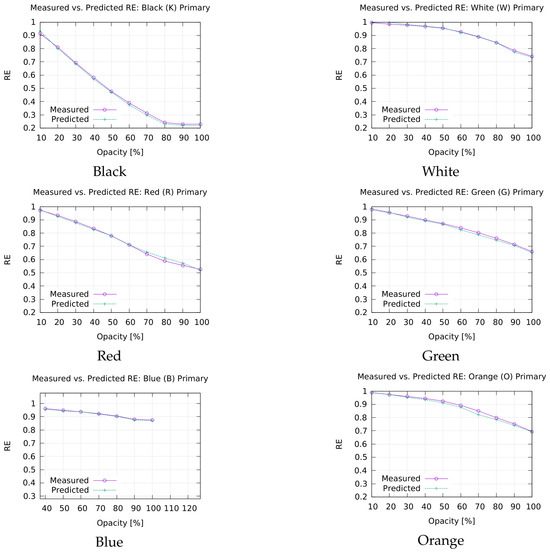
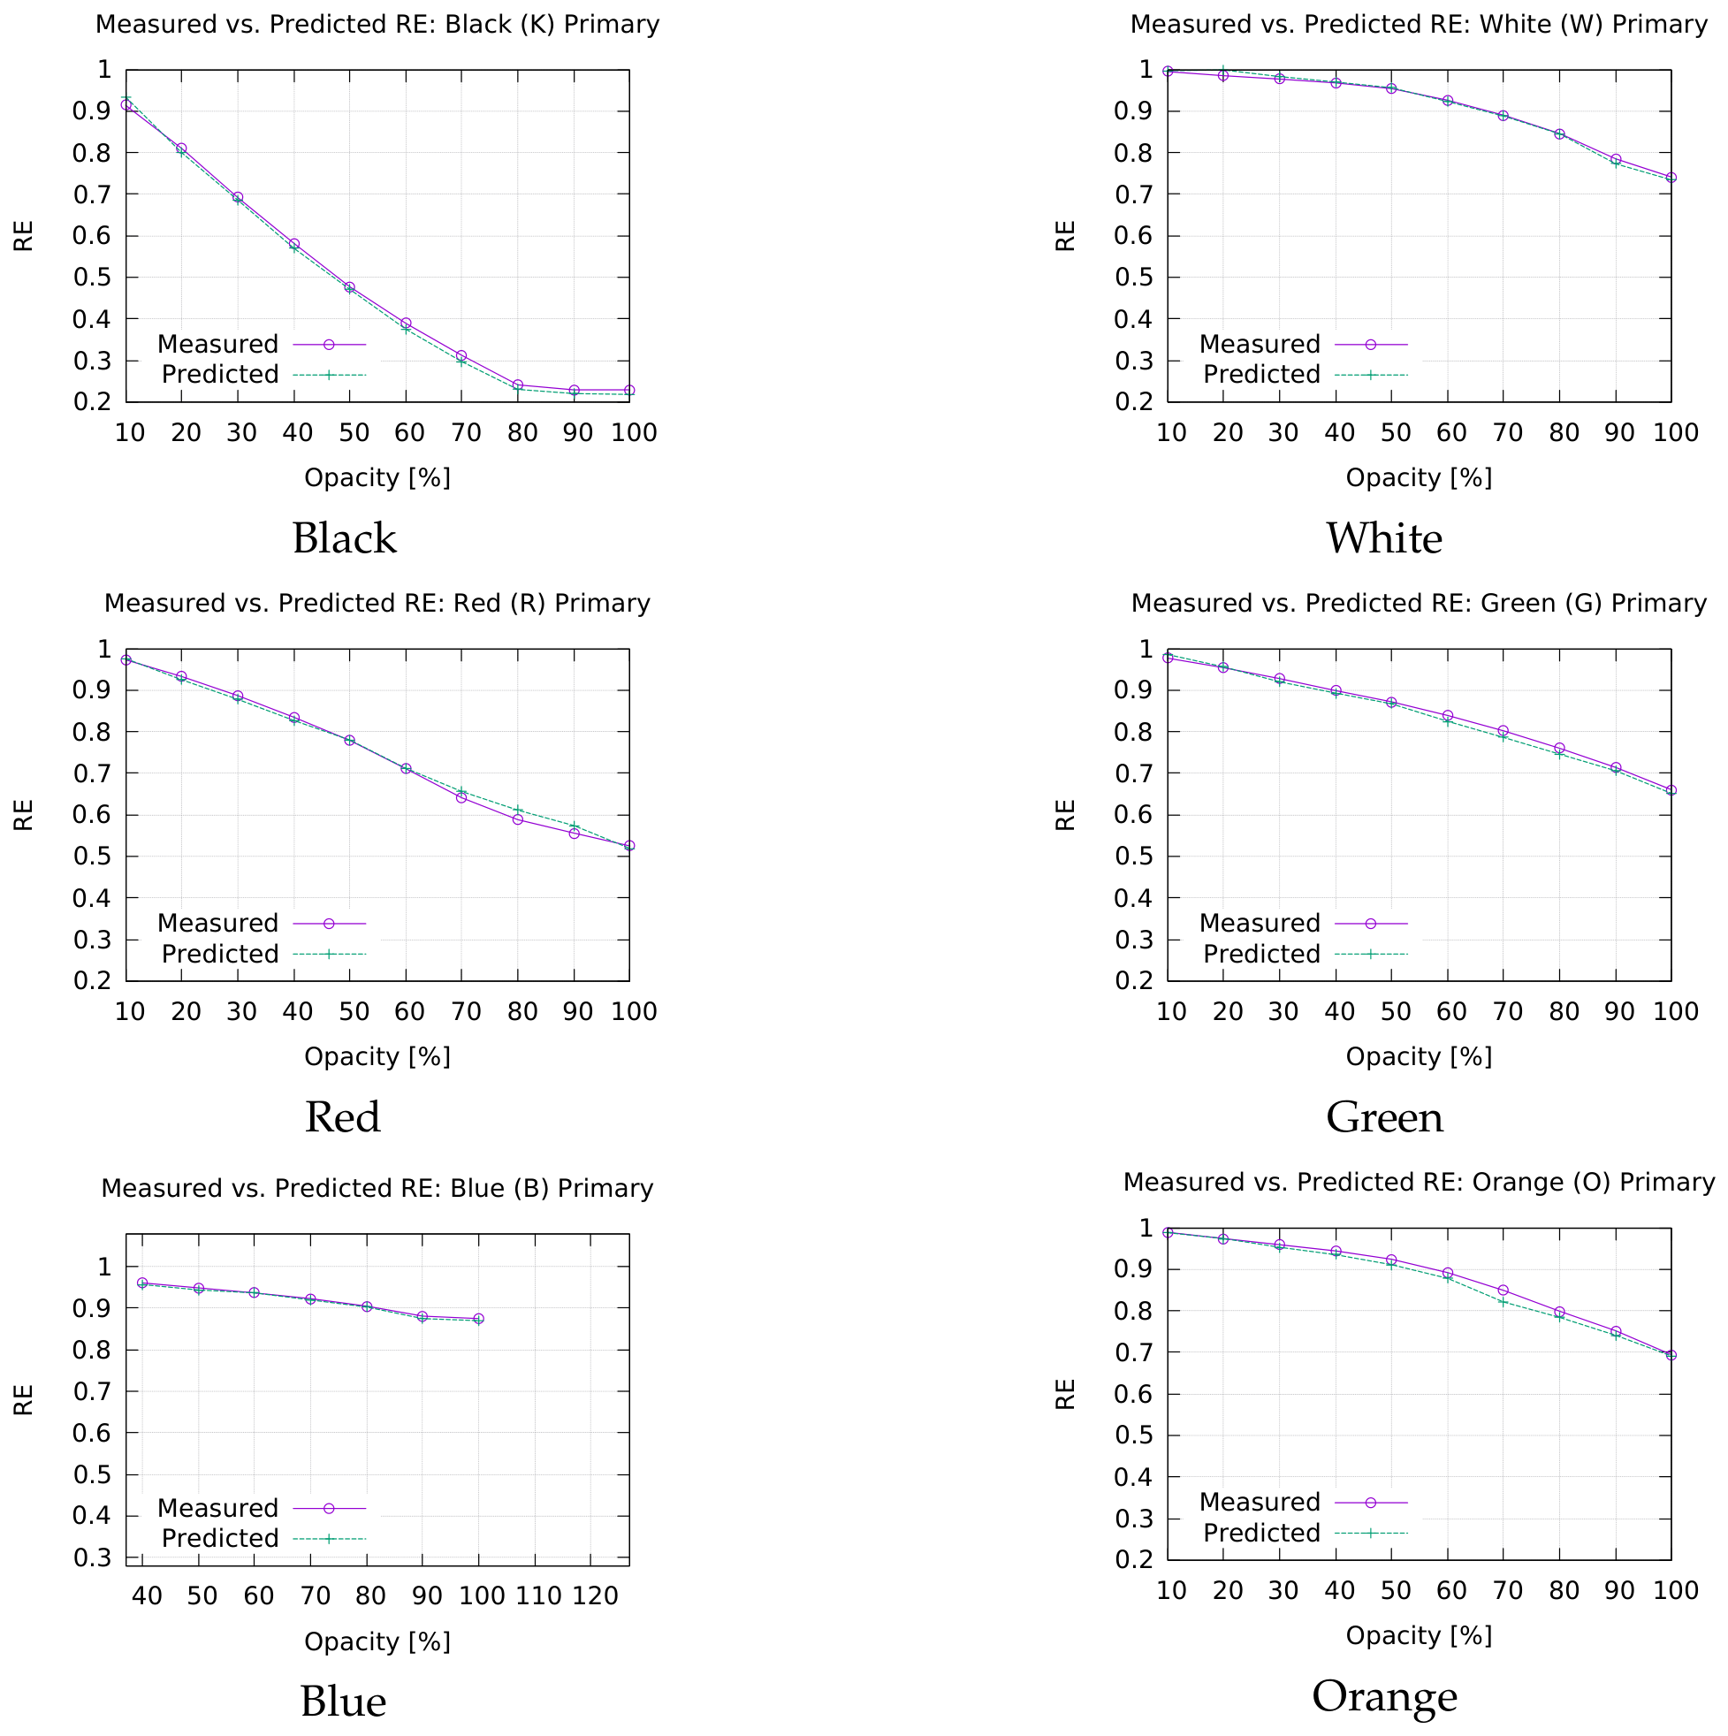
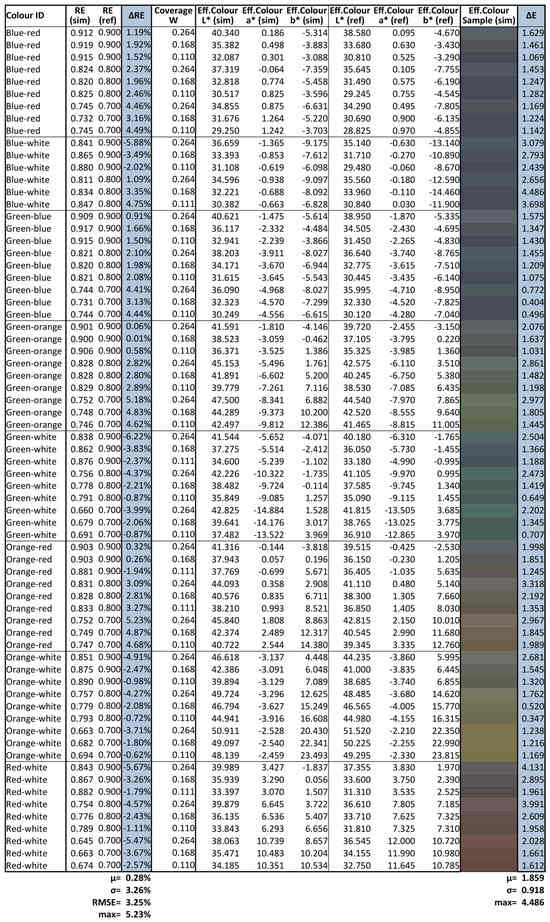
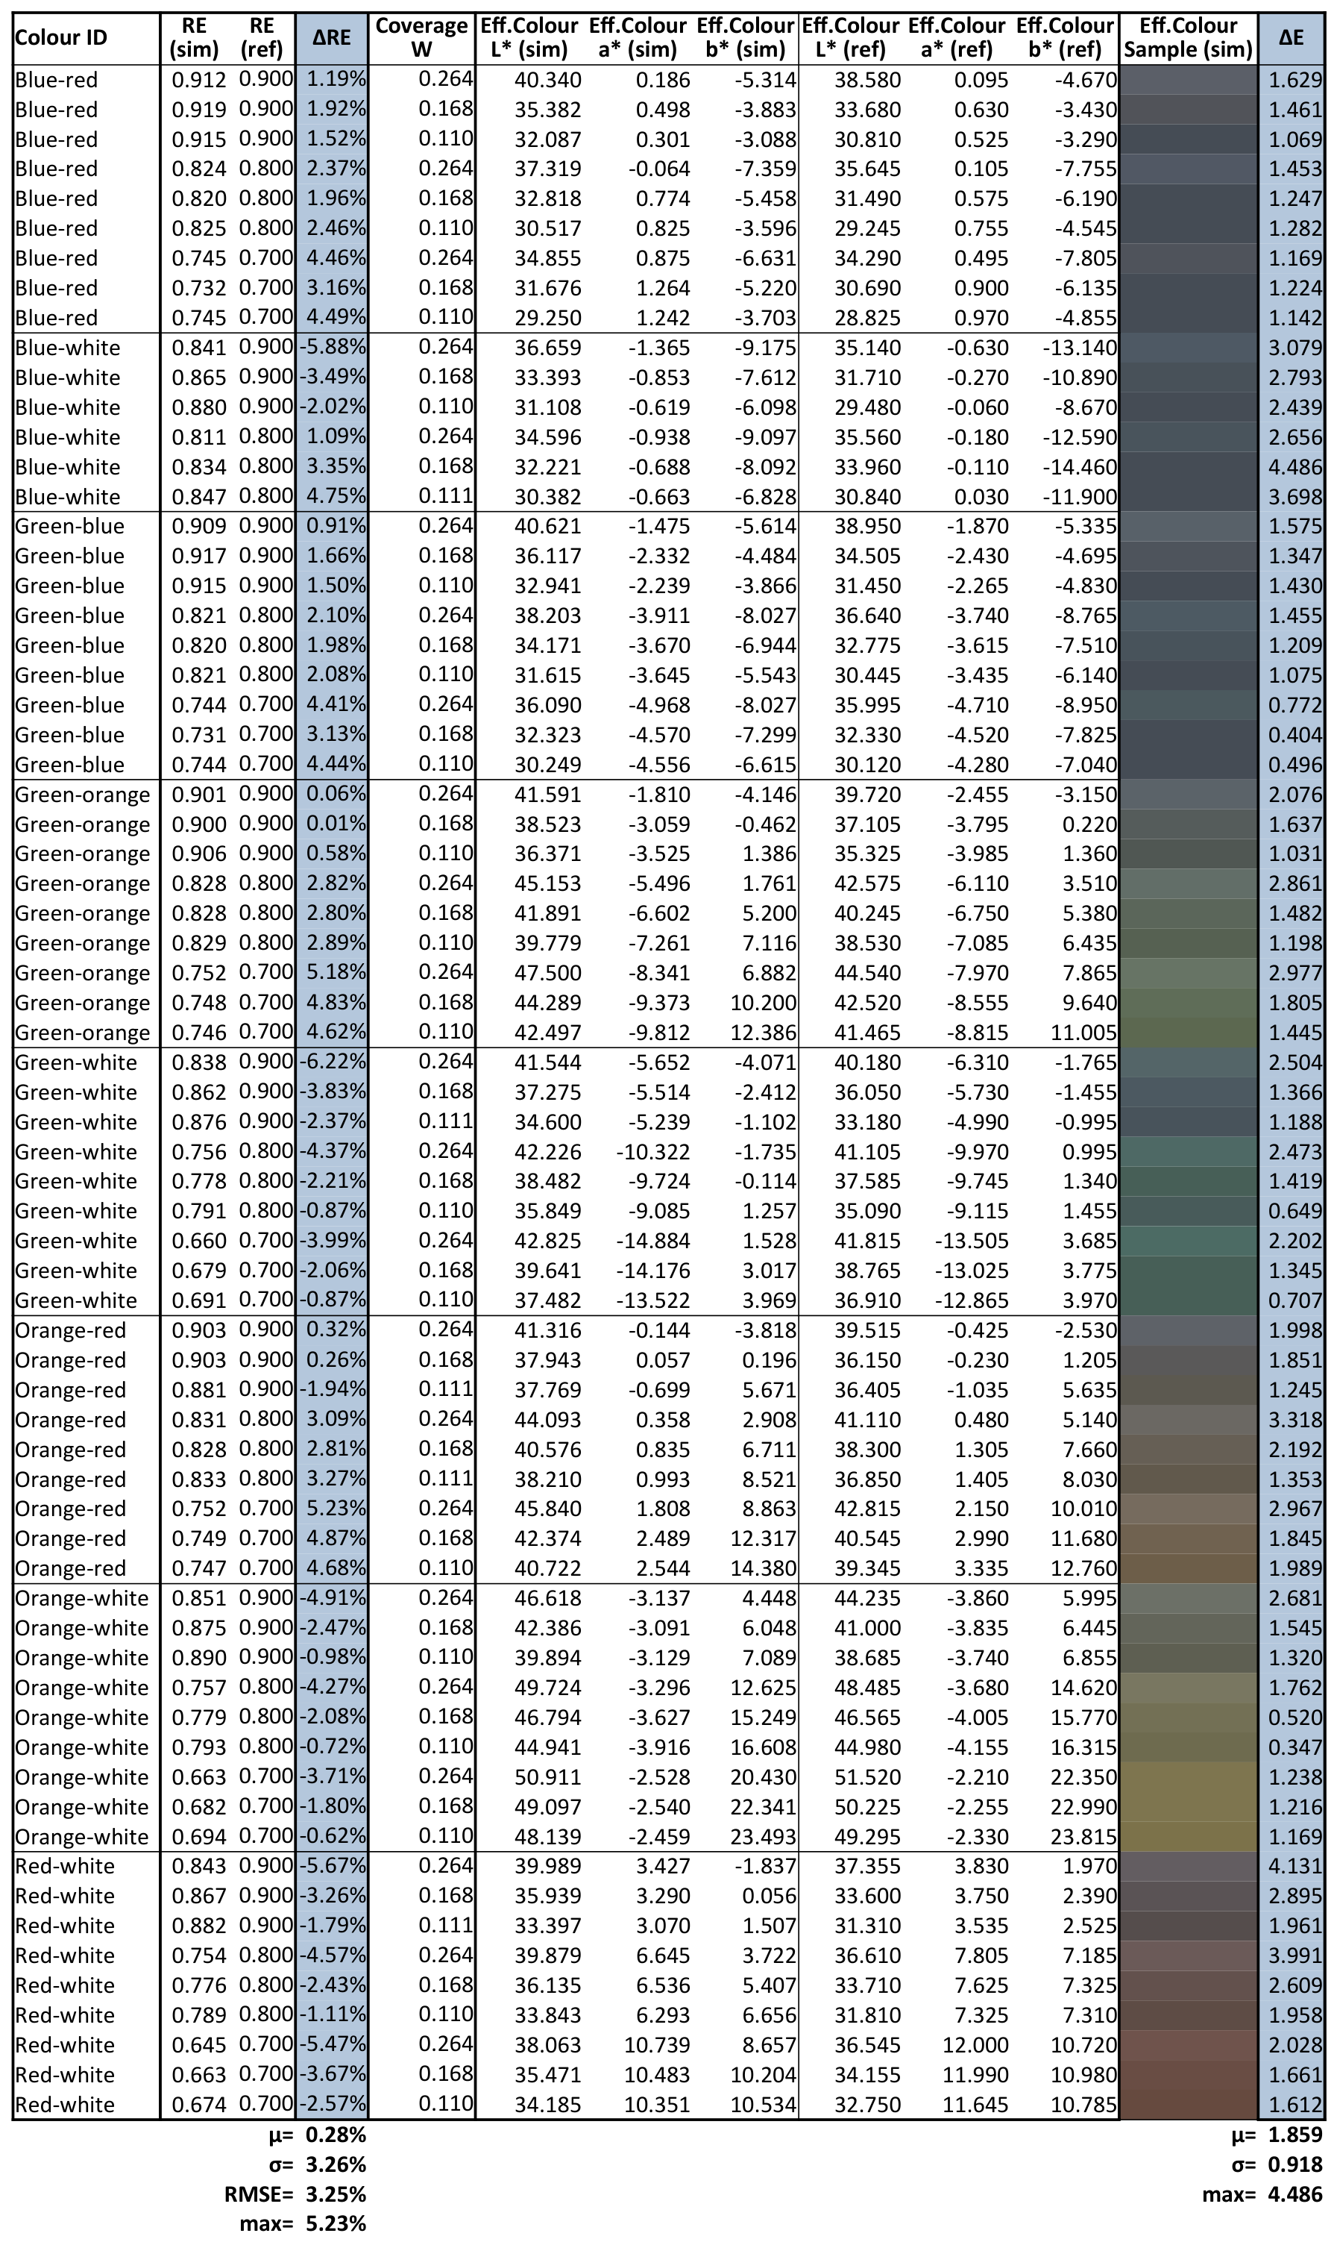
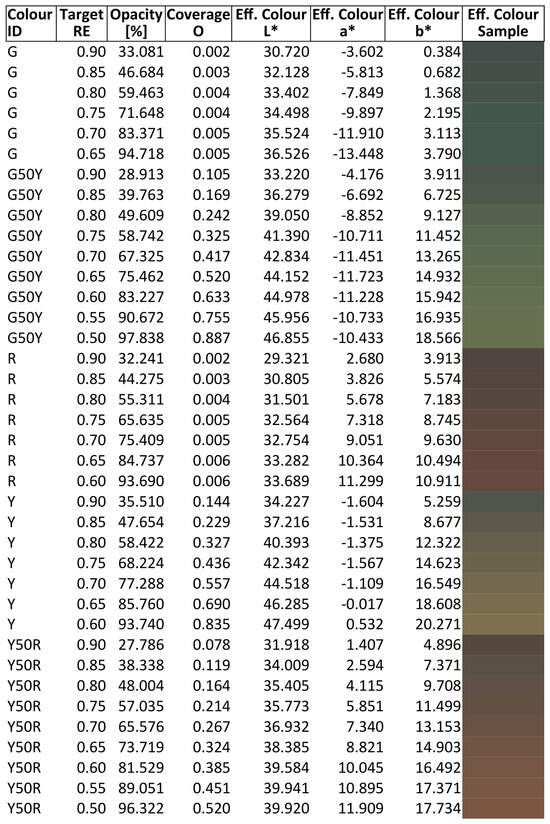
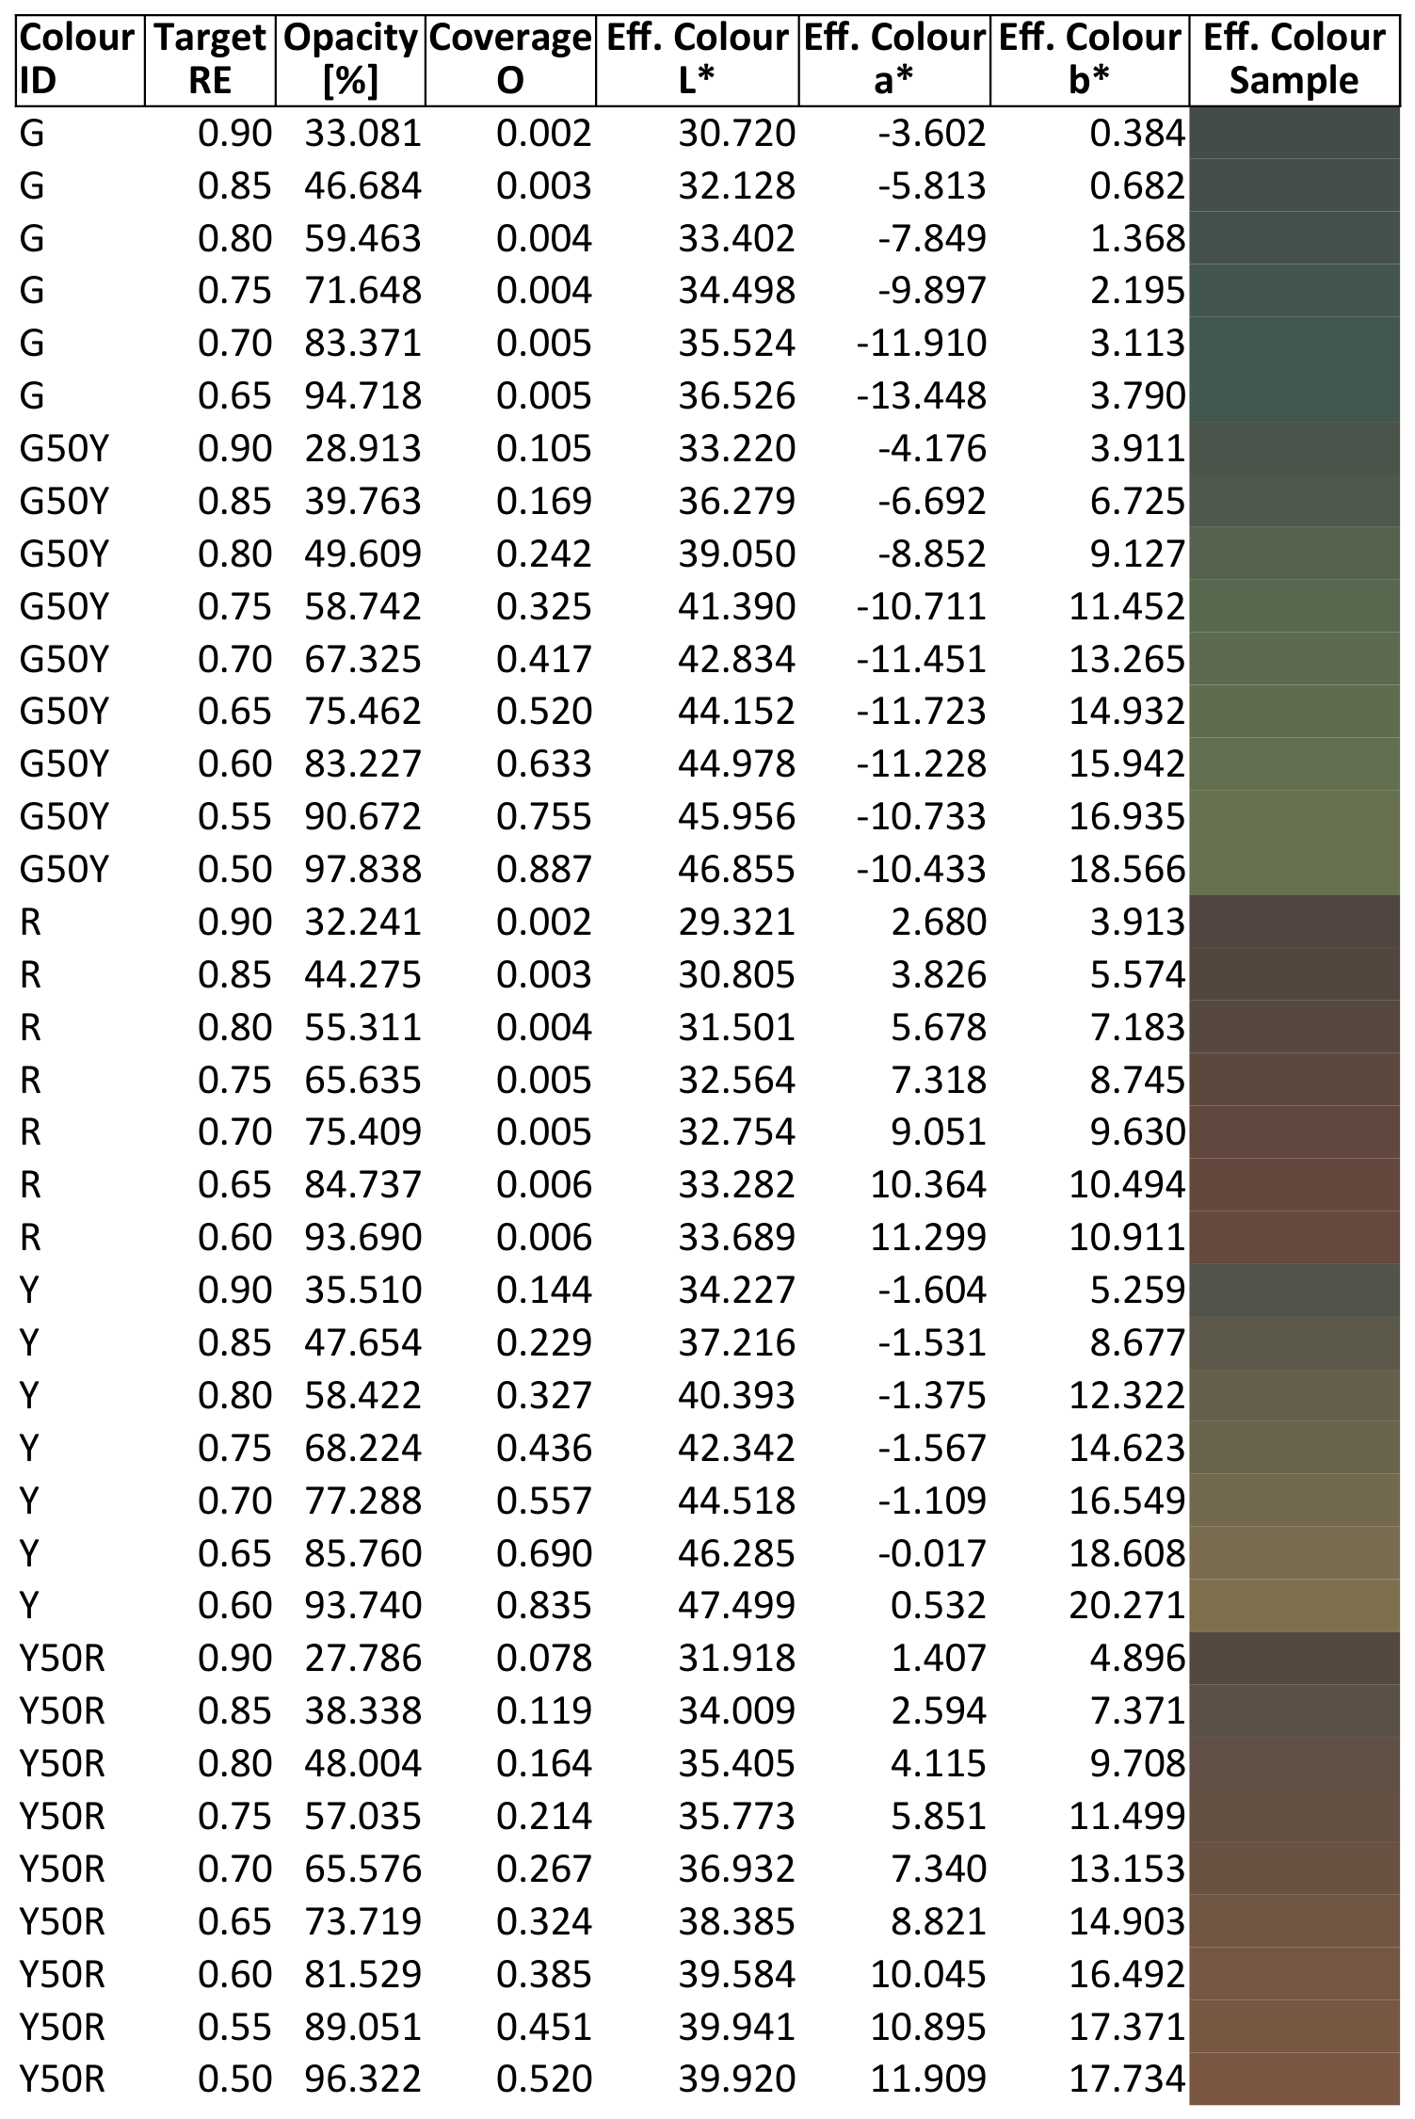
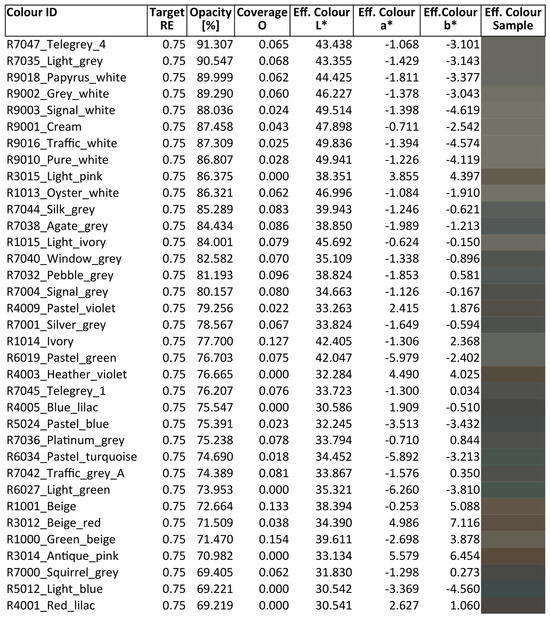
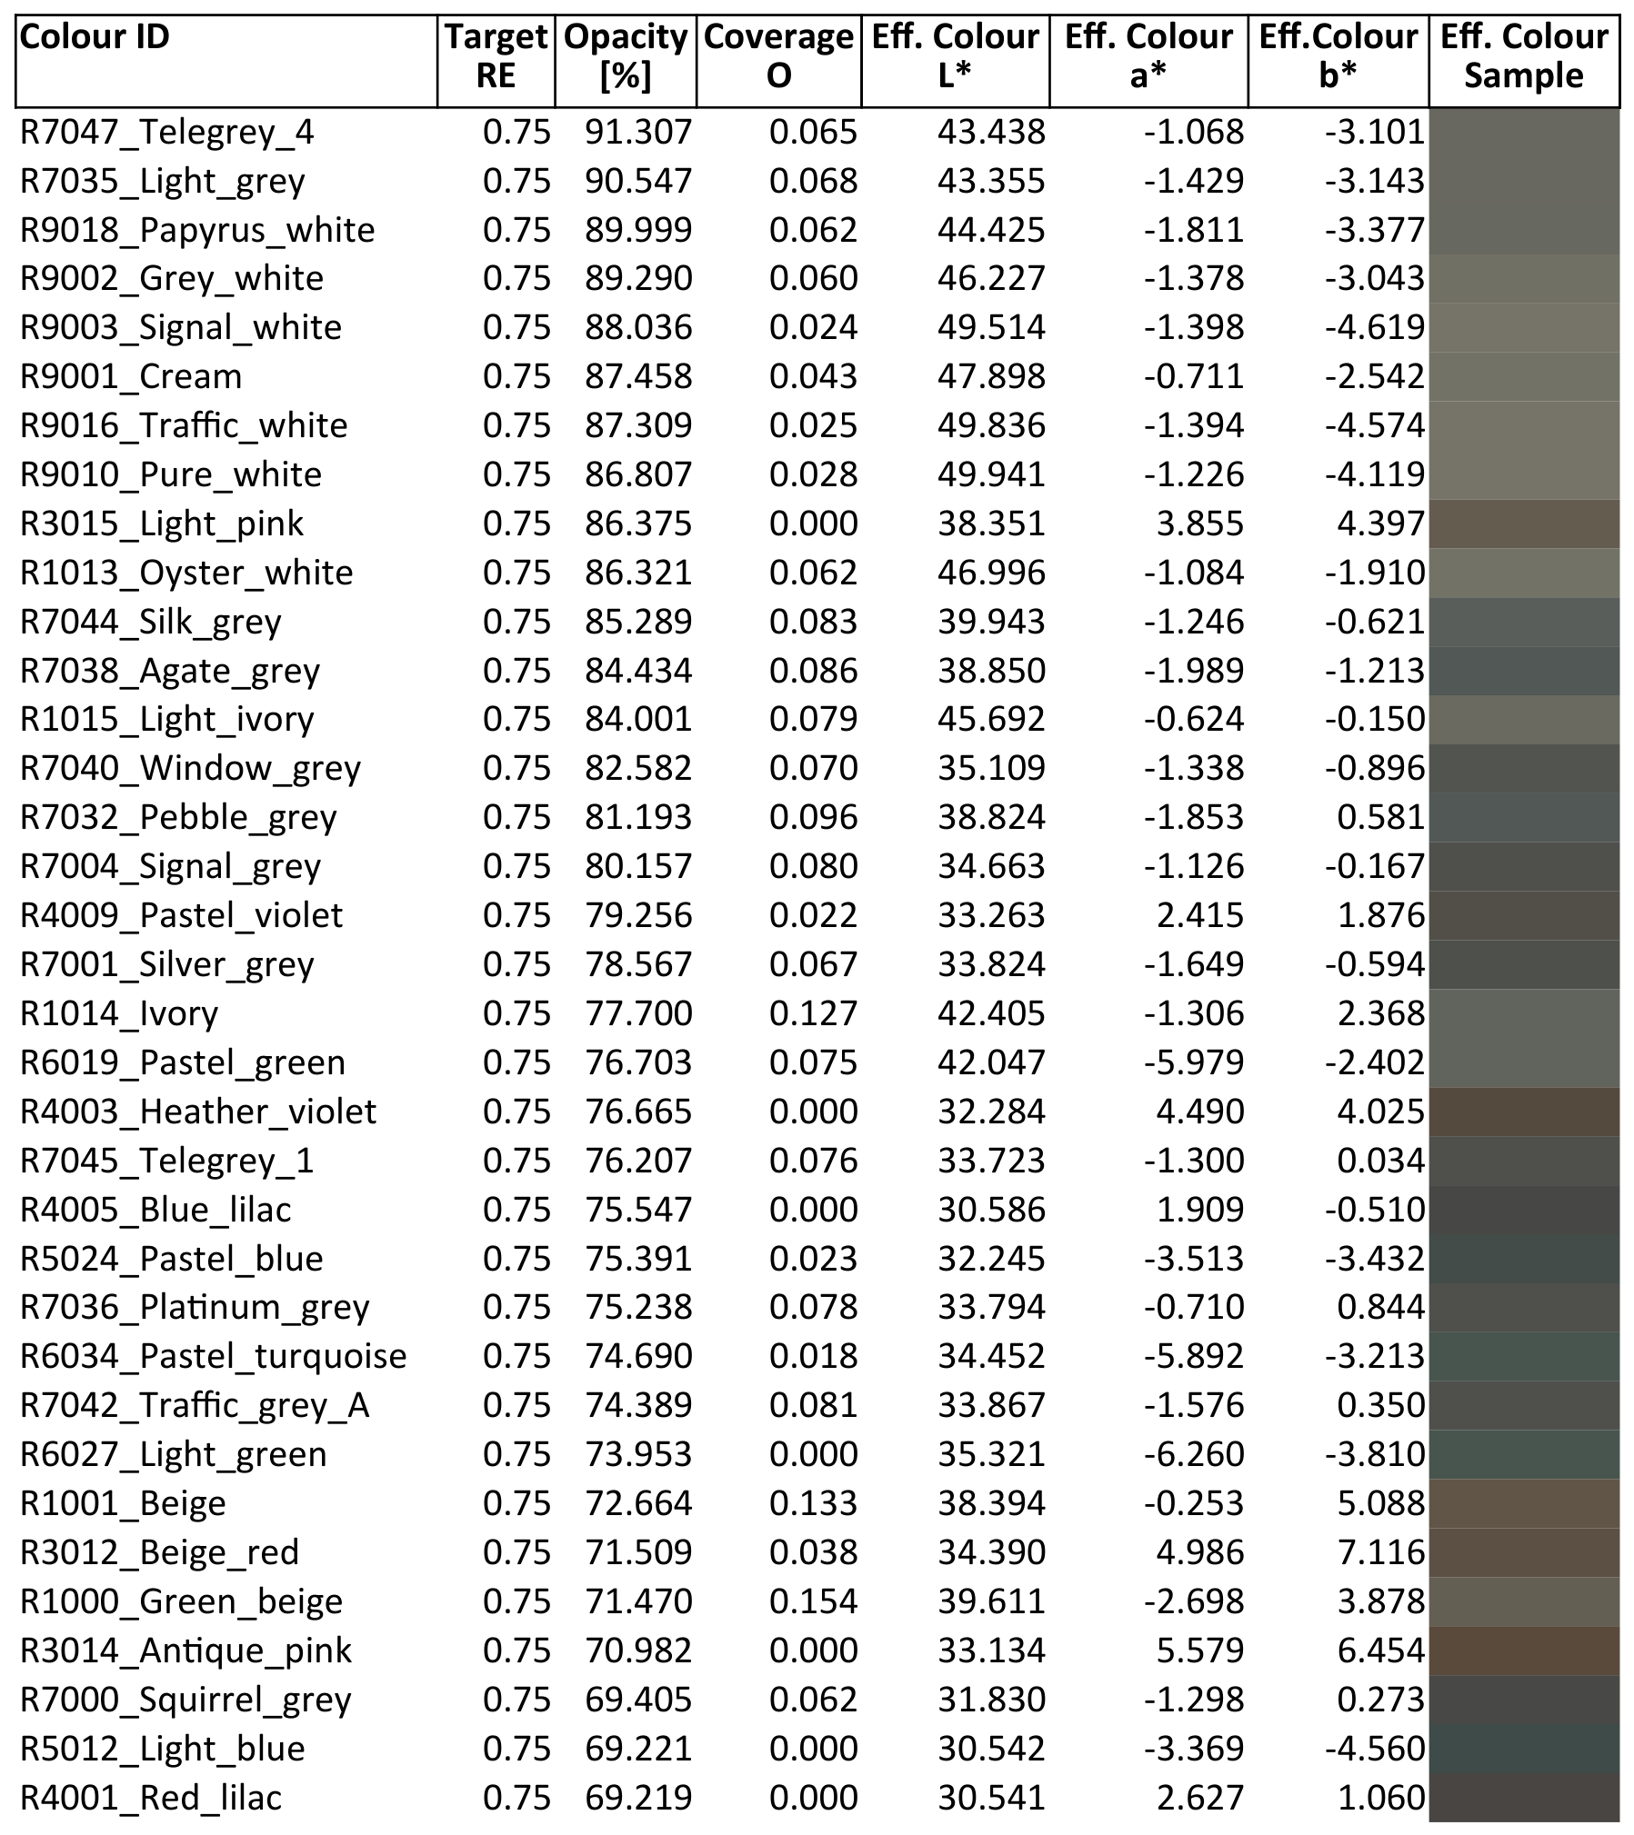
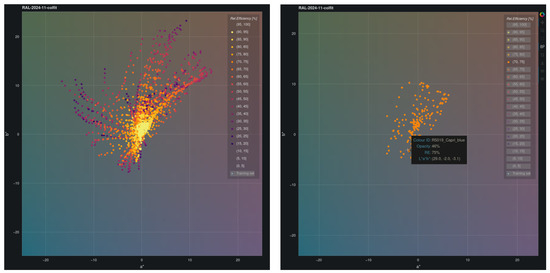
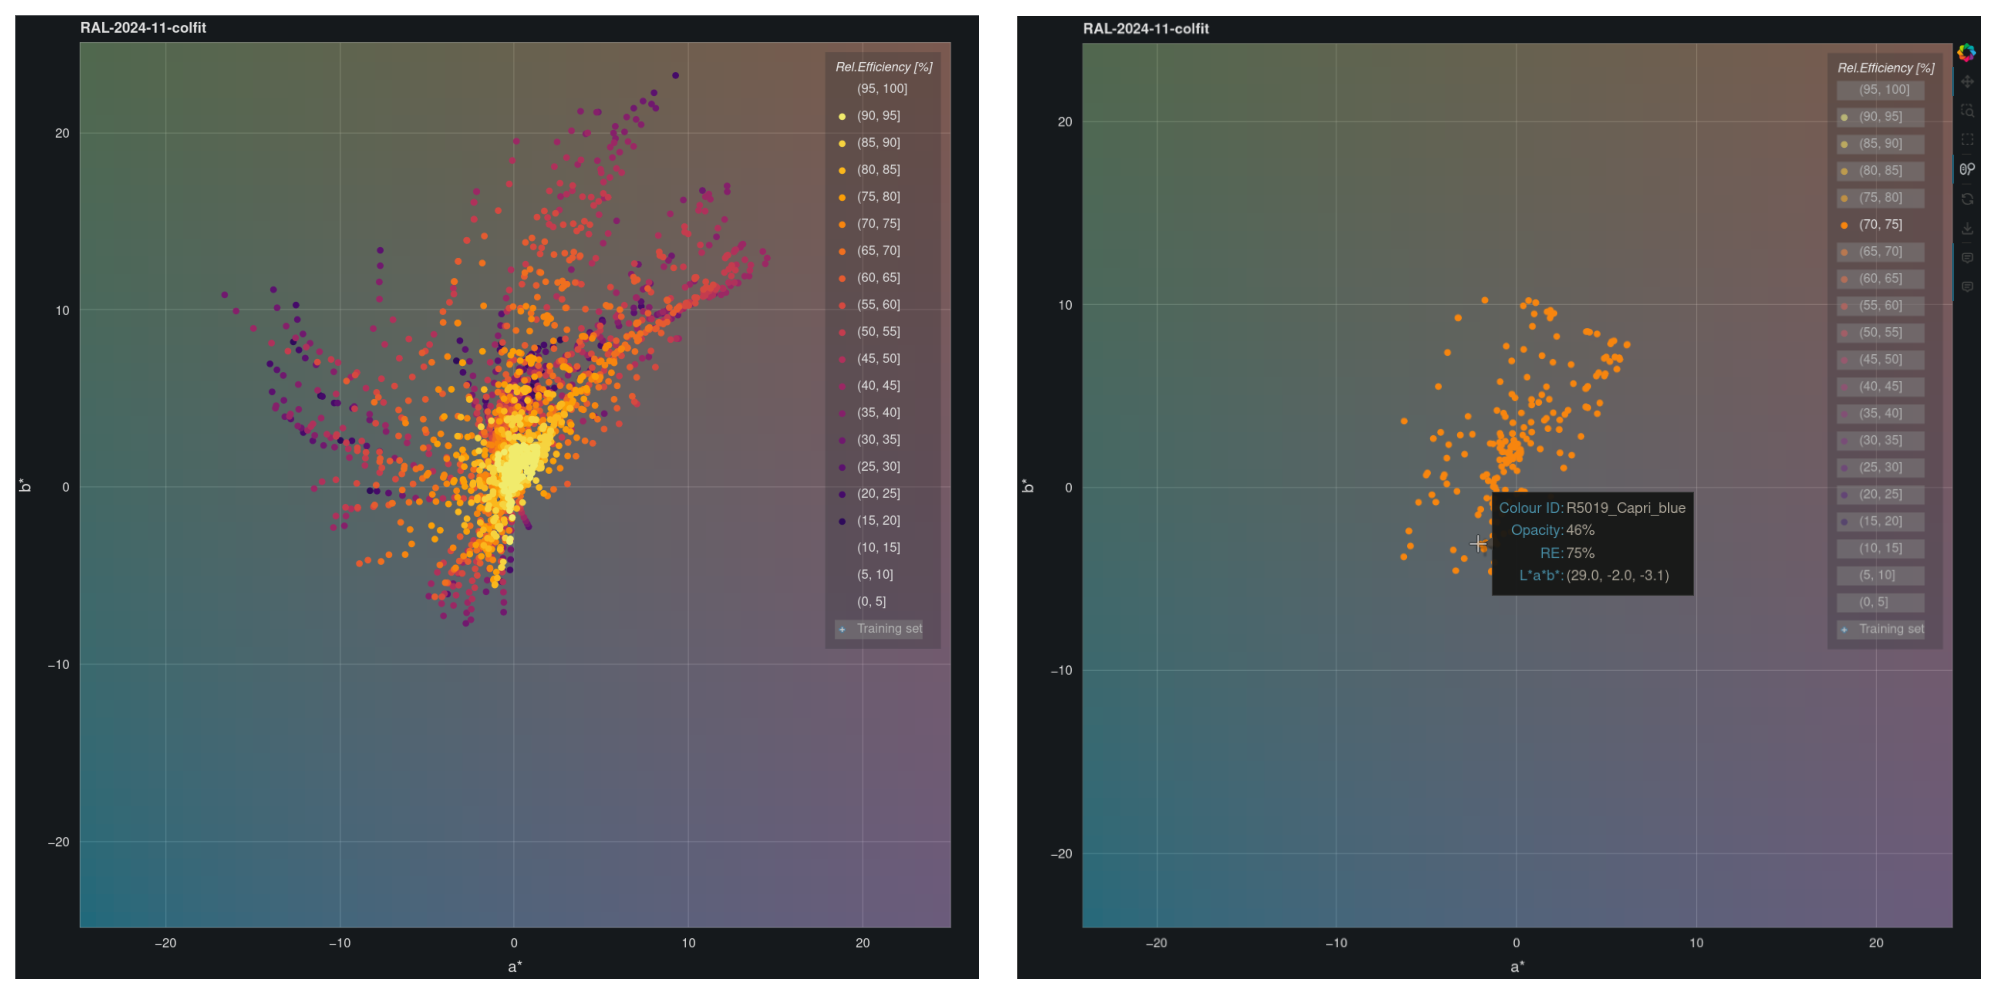
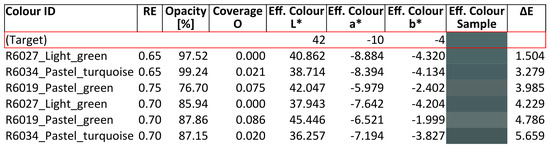
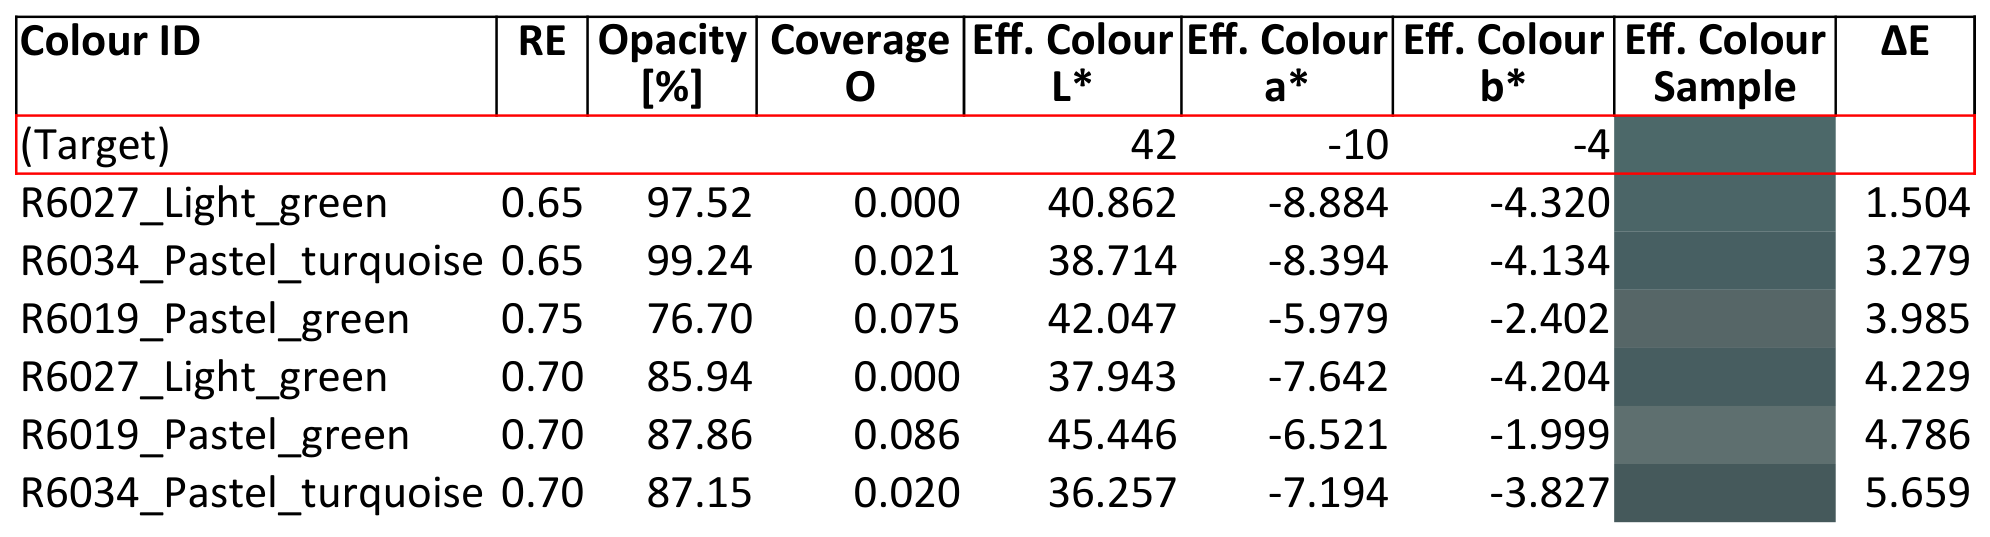
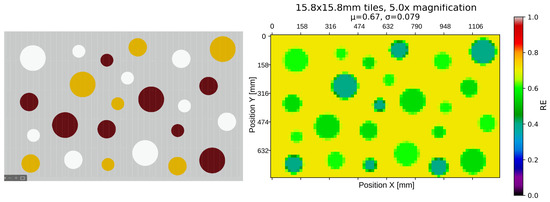
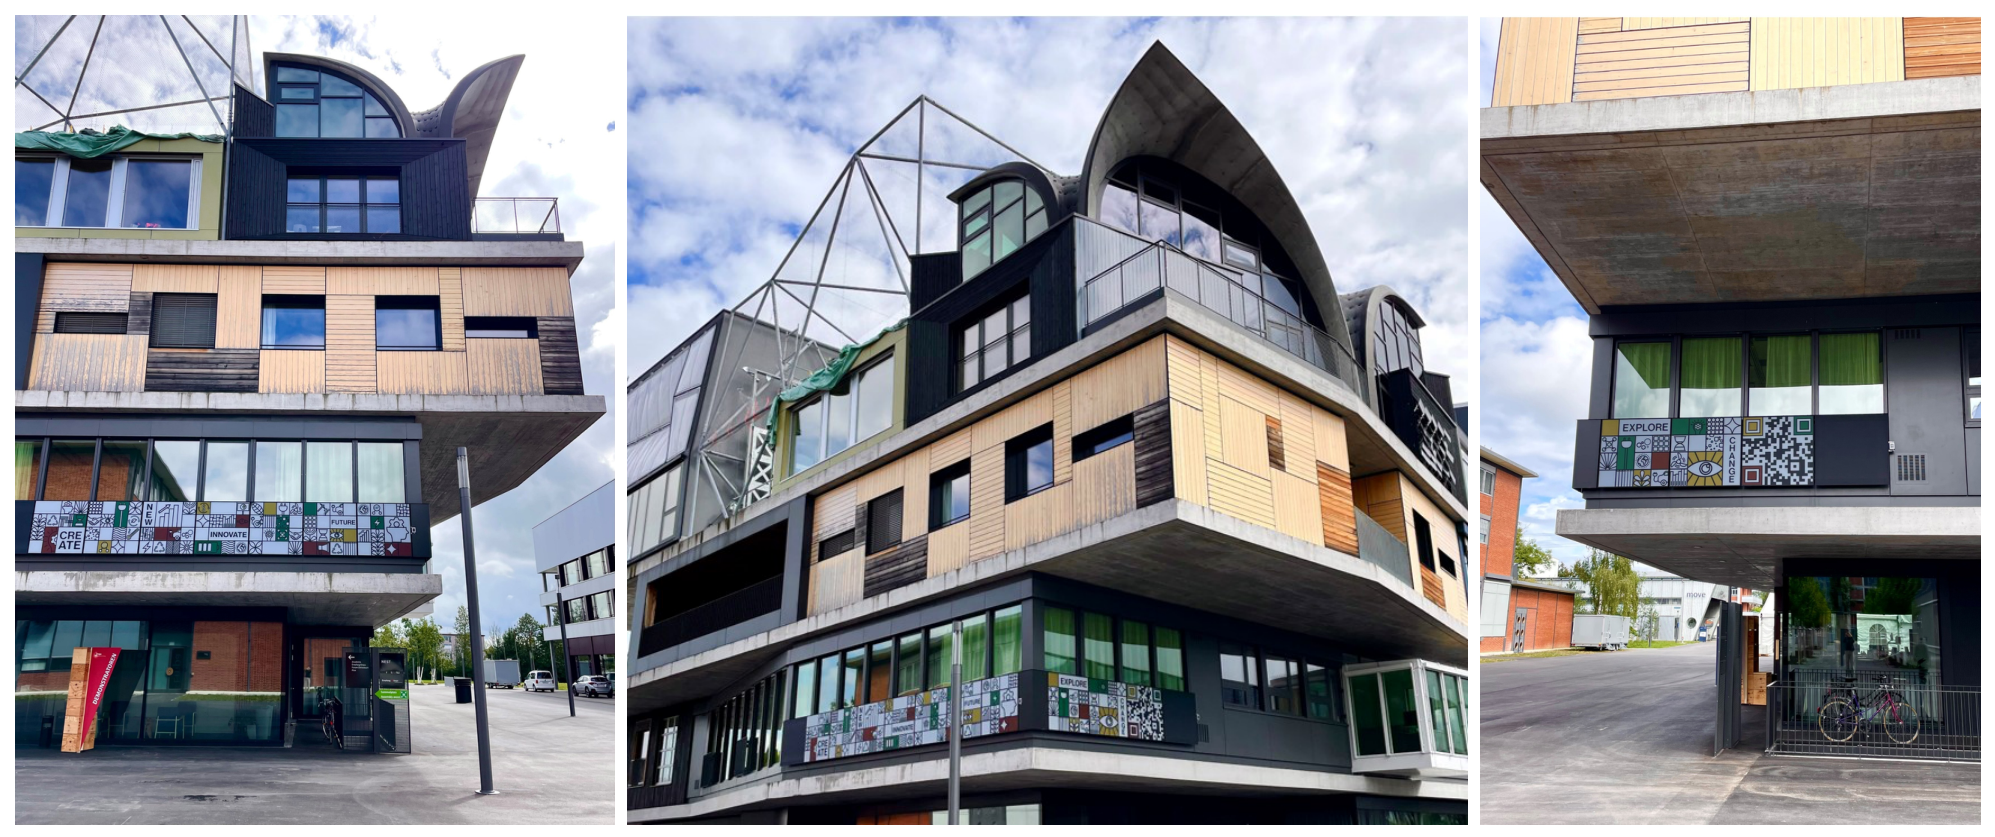
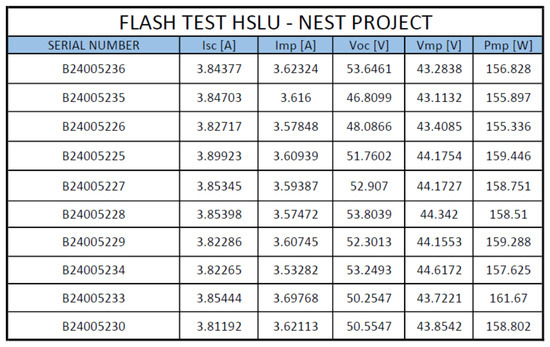
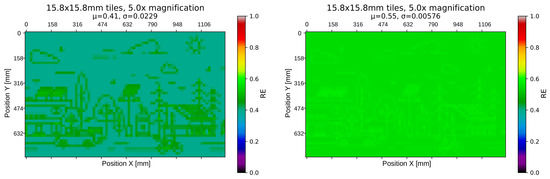
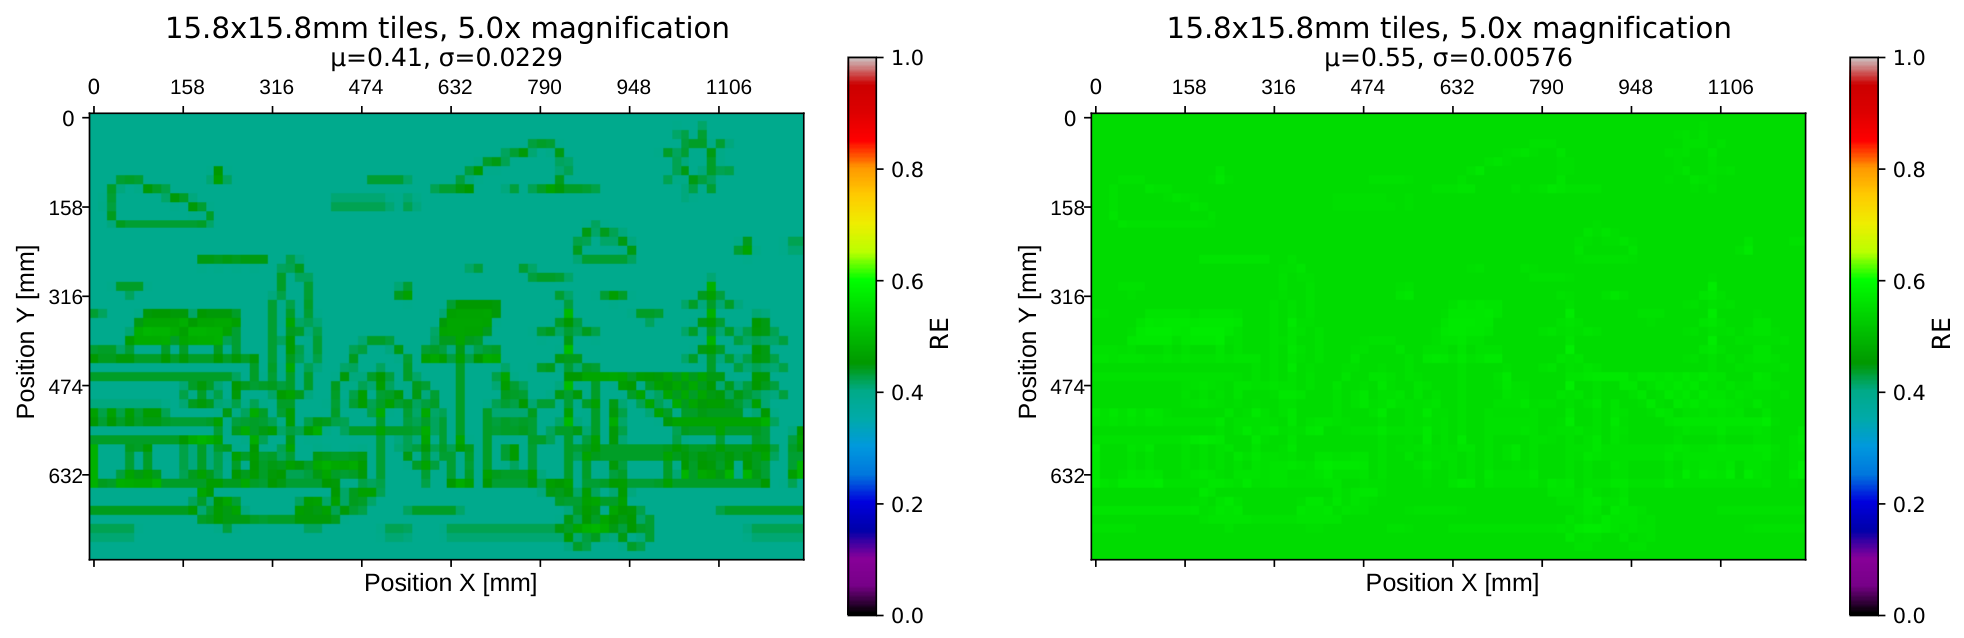
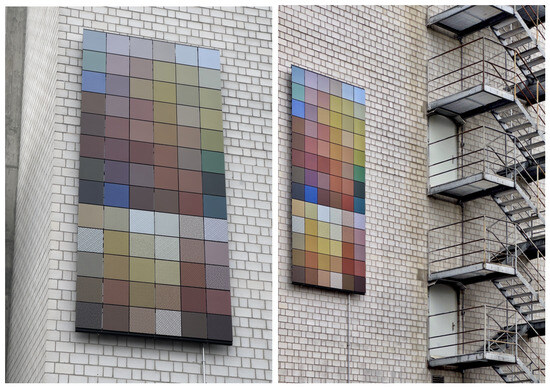
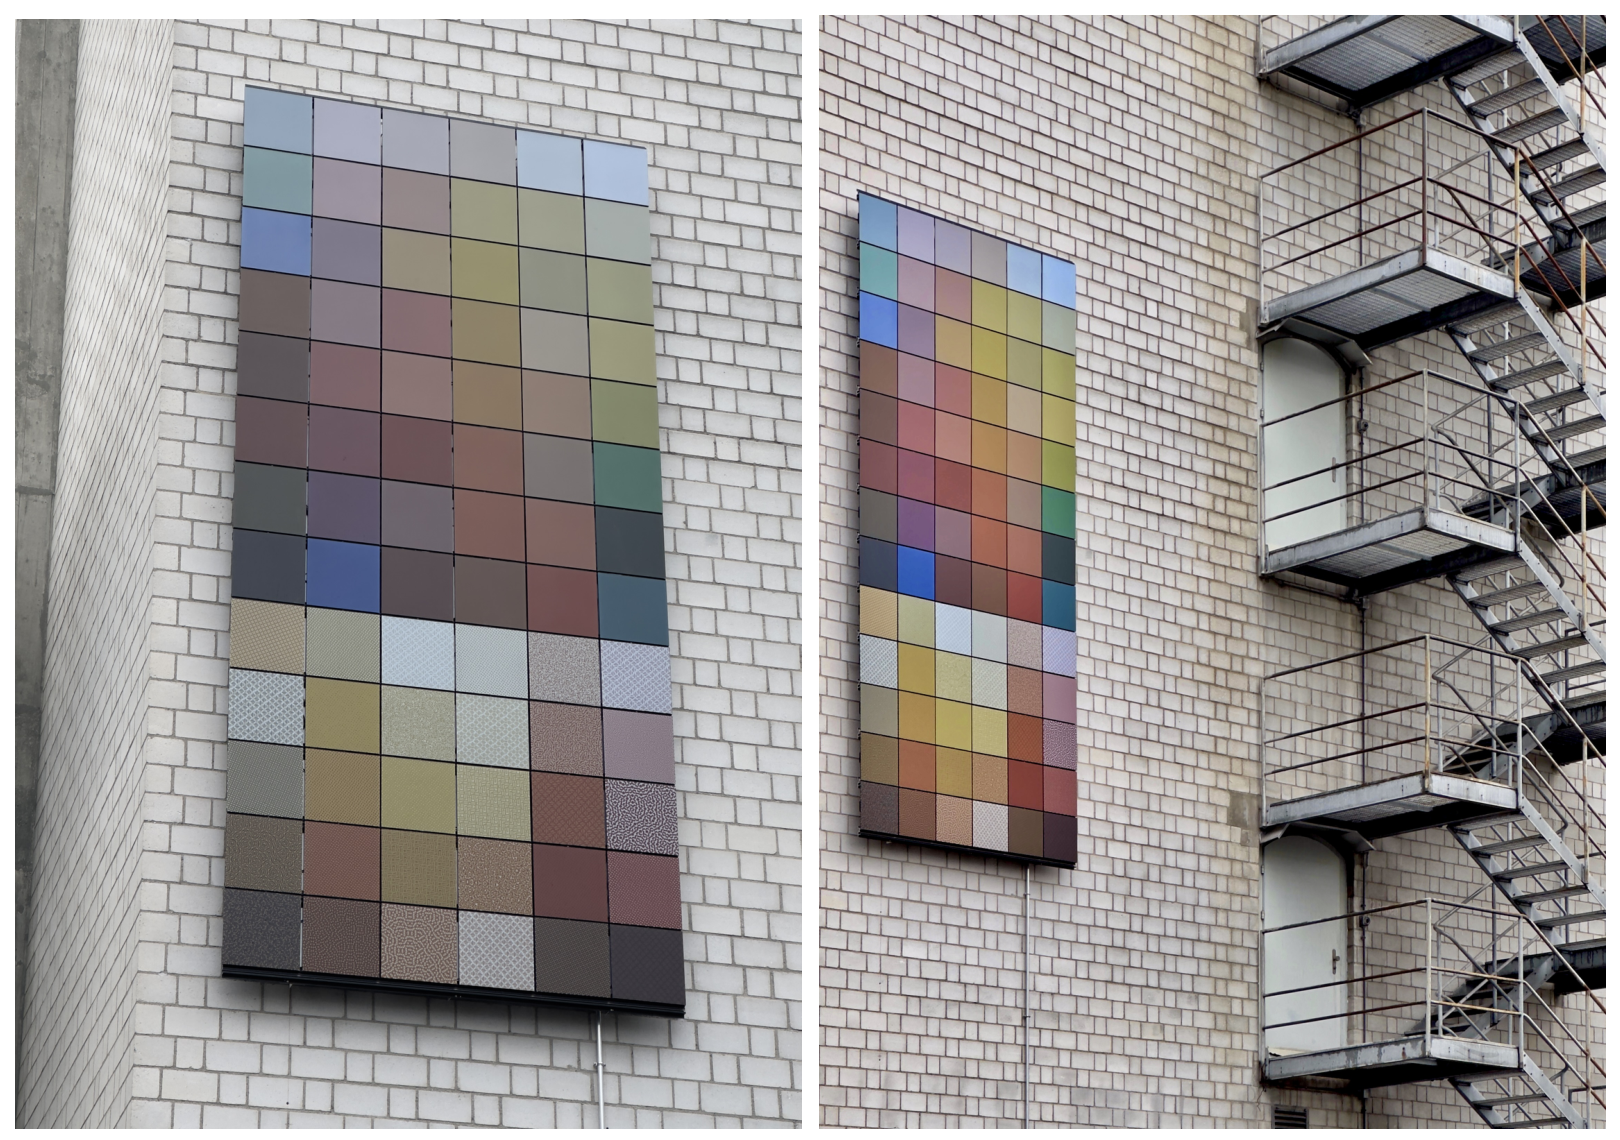
Disclaimer/Publisher’s Note: The statements, opinions and data contained in all publications are solely those of the individual author(s) and contributor(s) and not of MDPI and/or the editor(s). MDPI and/or the editor(s) disclaim responsibility for any injury to people or property resulting from any ideas, methods, instructions or products referred to in the content. |
© 2026 by the authors. Licensee MDPI, Basel, Switzerland. This article is an open access article distributed under the terms and conditions of the Creative Commons Attribution (CC BY) license.