


Abstract
Additive manufacturing (AM) technologies are increasingly being integrated into work environments, making the coexistence of production and office activities within hybrid workplaces more common and raising concerns regarding indoor air quality (IAQ) in shared or adjacent workplace environments. Although emissions associated with AM processes have been examined, limited attention has been given to IAQ conditions in hybrid workplaces where production and office functions share the same indoor environment. This study investigates the IAQ conditions associated with selected powder bed fusion and vat photopolymerization operations in a hybrid workplace through real-time environmental monitoring and employee perception analysis. Field experiments were conducted during pre-printing, printing, post-printing, and post-processing phases. Two custom-designed instruments, the Indoor Network-Based Air-Sensing Ecosystem (INBASE) and the Indoor Air Quality Polling Instrument (AIRPOLL), were developed to monitor particulate matter, volatile organic compounds, formaldehyde, benzene, ethanol, nitrogen dioxide, carbon dioxide, and oxygen and collect employee feedback. Findings showed that pollutant concentrations varied by process type, operational phase, and monitored space. Higher concentrations, particularly of volatile organic compounds, were observed in production spaces, while most other parameters remained within reference values. Employee feedback indicated positive perceptions in office spaces and greater concerns in production spaces. The findings support the importance of ventilation, spatial separation, and continuous monitoring in AM-integrated hybrid workplaces.
1. Introduction
People spend a significant portion of their time indoors [1], with workplaces playing a central role in daily life. The transformation of workplaces with Industry 4.0 [2] has introduced novel manufacturing techniques such as additive manufacturing (AM), an emerging technology that fabricates three-dimensional objects through an additive process [3]. Unlike traditional manufacturing processes, AM enables flexible, small-scale production without molds or large facilities, making it feasible to integrate production activities within office environments [4]. This shift enhances operational efficiency but also raises concerns about indoor air quality (IAQ) due to the emission of pollutants [5]. The integration of additive manufacturing into office environments introduces a hybrid workplace concept in which production and non-production functions coexist in the indoor ecosystem. Unlike conventional industrial facilities, where manufacturing activities are spatially separated from administrative areas, hybrid AM workplaces may involve adjacent zones, shared circulation paths, and overlapping occupancy patterns. These conditions may create IAQ concerns as pollutants generated during AM operations may extend beyond production zones and influence the environmental conditions experienced by non-production occupants. Consequently, IAQ assessment in such environments requires consideration of process-related pollutant variations within production spaces and potential changes in office spaces.
The nature and intensity of AM emissions depend on the process type, operational phase, and working environment [6], and the associated hazards, including inhalation of fine and ultrafine particles, exposure to volatile organic compounds, and dermal exposure to powders, binders, resins, solvents, and radiation, are well-documented [7,8]. Despite the expanding use of AM applications and the growing body of literature in this field, existing studies have predominantly focused on isolated laboratory or production settings [9], with emphasis on particle and VOC emissions [10,11], material-related exposure [10,12], occupational hygiene [6,9,13], and ventilation or control strategies [14,15,16]. Additionally, some studies have investigated the potential transfer of pollutants [9,13,17], phase-dependent changes in IAQ [18,19], and employee perceptions [17,20]. However, despite this initial focus, limited attention has been paid to hybrid workplaces where office and production activities coexist within indoor environments [21]. As AM moves from industrial facilities into smaller, mixed-use workplaces, further research is needed to understand how IAQ conditions vary across production and office spaces and whether conventional spatial separation and ventilation strategies are sufficient for these settings. To this end, this research investigates the IAQ conditions associated with selected AM operations in an operational hybrid workplace by combining real-time environmental monitoring with employee perception feedback. Two custom-designed instruments were developed and deployed to monitor IAQ variations associated with powder bed fusion (PBF) and vat photopolymerization (VP) operations across the monitored operational phases in both production and office spaces. The contribution of the present study is threefold. First, it develops and implements two tailored, low-cost IAQ assessment instruments for AM-integrated hybrid workplaces. Second, it evaluates real-time IAQ conditions together with employee perceptions in an operational AM-integrated hybrid workplace. Third, it provides a case- and phase-based comparison of monitored pollutant concentrations across separately monitored production and office spaces during selected AM operations.
The rest of the paper is structured as follows. Section 2 reviews the relevant literature. Section 3 details the methodology and the field experiments, whereas Section 4 presents the results and discusses the findings. The paper is concluded in Section 5 by summarizing the findings, limitations, and future research directions.
2. Research Background
2.1. Integrated Production–Office Spaces
Although work spaces such as office spaces and production spaces [22] were historically distinct entities, these divisions have begun to blur with the advent of Industry 4.0, which accelerates methods like advanced manufacturing. AM enables production in flexible, multipurpose, or smaller spaces, increasing the overlap between office and production environments and driving their convergence.
2.2. Additive Manufacturing
Additive manufacturing (AM) is an emerging manufacturing field in which three-dimensional objects are fabricated through additive processes [3], enabling complex geometries at lower cost, weight, and time [4]. According to the American Society for Testing and Materials (ASTM), AM processes have seven categories [23,24]: binder jetting, directed energy deposition, material extrusion, material jetting, powder bed fusion, sheet lamination, and vat photopolymerization [6,24,25], each involving distinct operations for pre-printing, printing, post-printing, and post-processing stages. This study focuses on powder bed fusion and vat photopolymerization, which were selected based on their availability for monitoring at the workplace under real operating conditions, their relevance to fabrication through different materials, and their distinct emission profiles.
2.2.1. Powder Bed Fusion
In powder bed fusion (PBF), powder-based materials are solidified using a heat source, offering high dimensional accuracy and desirable mechanical properties. PBF technologies include electron beam melting (EBM), direct metal laser sintering (DMLS), selective laser sintering (SLS), and selective laser melting (SLM) [24].
In PBF, pre-printing involves powder preparation and loading into the printer. Printing consists of repeated powder spreading and selective melting or sintering until the build cycle is completed. During post-printing, the printed component is retrieved, the surplus powder is removed, and used powder is sieved and replenished. During post-processing, the printed part is detached from the build platform, and necessary finishing treatments are applied [6].
2.2.2. Vat Photopolymerization
In vat photopolymerization (VP), a liquid photopolymer is selectively cured into a solid state in a vat through light-induced polymerization [25]. VP technologies include digital light processing (DLP), liquid crystal display (LCD), and stereolithography (SLA) [25,26].
In VP, pre-printing operations involve resin mixing, dispensing, and vat loading [6]. Printing consists of the layer-by-layer photopolymerization process. During printing in stereolithography (SLA), a scanning laser beam selectively cures resin in the prescribed geometry [25,26]. During post-printing, the printed component is retrieved. Post-processing activities include washing and curing to enhance final part properties. Additional steps include removing supports, grinding, gluing, sealing, painting, polishing, coating, varnishing, sterilizing, inspecting, and measuring [27].
2.3. Indoor Air Quality
Essential for maintaining a healthy indoor environment [28], indoor air quality (IAQ) refers to air free of harmful contaminant levels that satisfies most occupants [29]. The World Health Organization (WHO) reported that 90% of the global population is exposed to inadequate air quality [30]. Given its effects on comfort, productivity, and well-being [31], IAQ represents a major public health concern.
As AM continues to gain widespread adoption, concerns regarding health and safety have emerged [5]. Although all AM processes involve certain risks, the nature and severity of these hazards depend on the utilized technology, process stage, and working environment [7,8,32]. Key health concerns include inhalation of IAQ pollutants, dermal exposure to AM materials, and radiation [7,8]. The relevant IAQ pollutants are summarized in Table 1 with their main characteristics, health relevance, and guideline values.
Table 1.
Characteristics, health relevance, and reference values of monitored IAQ parameters.
2.4. Indoor Air Quality in Additive Manufacturing Environments
While all AM processes present hazards, exposure levels and types vary by process type, phase, and environment [7,8,32]. As this research focuses on PBF and VP in hybrid workplaces, related studies are presented to contextualize the findings.
Studies on IAQ in PBF environments examine emissions from metal and polymer feedstocks across process stages. Accordingly, operational tasks such as powder handling, post-processing, and equipment cleaning increase exposure risks due to the release of ultrafine particles, airborne nanoparticles, and potentially hazardous substances [51,52,53,54,55]. Research on laser powder bed fusion demonstrated that transient emission peaks occur during cleaning and maintenance stages, emphasizing the phase-dependent exposure behavior [56]. For instance, pre-printing and post-processing stages significantly exceed IAQ threshold limits [57]. Similarly, in laser metal deposition (LMD) processes, the release of metal nanoparticles is associated with applied laser power, with powder-based feedstocks releasing considerably higher nanoparticle concentrations than wire-based alternatives [56]. Studies on nylon-based materials have reported elevated dust and respirable particle levels during post-printing [58]. Recent research identifies the polymer powders used in SLS, such as polyamide and polyurethane, as intentionally engineered microplastics [59]. Although these fuse during printing, residual and recycled material can still emit airborne microplastic particles during handling and post-processing [36,59]. Furthermore, the reuse of powders may alter emission characteristics [60,61]. In metal and polymer environments, formaldehyde and particulate concentrations increase, particularly with reinforced powders [62]. Beyond feedstock characteristics, emission behavior is also influenced by process parameters and environmental conditions, such as extrusion temperature, thermal decomposition behavior, filament feed rate, and air exchange conditions [63]. Studies conducted in non-industrial AM environments have demonstrated that indoor particle and VOC concentrations were affected by simultaneous machine operation, inadequate ventilation, and filtration performance [64,65]. While several studies report pollutant levels below occupational exposure limits, improved ventilation, personal protective equipment, and other control measures are recommended [66,67,68]. Continuous monitoring and preventive strategies are also emphasized due to nanoscale particles and metal residues generated during AM operations [69,70,71,72].
Studies investigating IAQ during VP operations highlight emissions from photopolymer resins during printing and post-processing stages. Researchers have shown that exposure risks persist beyond printing due to chemical residues and cleaning agents [73] associated with post-processing tasks involving isopropyl alcohol rinsing, soaking, and drying [74]. Emission modeling studies have further demonstrated that printing and post-curing contribute to VOC release, varying by process parameters and resin type [75]. Investigations comparing different machines, feedstocks, and ventilation setups have reported elevated VOC and PM levels, especially during post-processing [76]. While some studies have reported minimal particle emissions under well-ventilated conditions, common VOC types such as acetone and isopropanol were still detected at measurable levels [58]. To proactively control these emissions, studies indicate that retrofitted activated carbon adsorbents or photocatalytic oxidation systems can reduce TVOC levels [72].
Owing to the impact of AM operations on IAQ, previous studies have proposed various approaches for monitoring and mitigating indoor air pollution in AM environments, including structured environmental management frameworks [64,77], real-time and low-cost monitoring systems [78], and simulation-based airflow and ventilation optimization methods [79].
3. Methodology
This study employs field experiments to examine IAQ conditions associated with operations of PBF-SLM, PBF-SLS, and VP-SLA processes using two custom-designed instruments. The experiments were conducted in a workplace specializing in AM. The 375 m2 and 3.7 m high AM facility represents a hybrid workplace in which office and production activities operate within the same indoor environment, as illustrated in Figure 1.
Figure 1.
The plan of the hybrid workplace showing the office zone in the blue frame; production zones, AM equipment, and post-processing area in the pink frame; and INBASE/AIRPOLL monitoring locations in the red circles.
The plan documents the spatial configuration of the monitored hybrid AM workplace, including production and office spaces, room areas, circulation zones, doors/spatial connections, AM equipment, post-processing equipment, and INBASE/AIRPOLL monitoring locations. Detailed ventilation and airflow characteristics, including supply and exhaust airflow rates, local exhaust capture velocity, pressure differences, airflow direction, and return-air configuration, were not quantitatively measured. Therefore, these features are treated as contextual limitations.
Field measurements were performed in production and office spaces for each AM process. This configuration enabled the comparison of IAQ parameters in production and office spaces occupied by employees with different work patterns and occupancy durations.
Although the study was conducted in a single operational facility, the research is composed of a structured phase-based monitoring approach, including real-time environmental monitoring and gathering employee perception during selected AM technologies, operational phases, and workplace zones in a hybrid workplace. The experimental setup is illustrated in Figure 2.
Figure 2.
The diagram of the field experiments.
Ventilation and spatial characteristics were documented descriptively based on the existing workplace configuration. However, air exchange rates, supply and exhaust airflow rates, local exhaust capture velocity, pressure differences between rooms, airflow direction, door and window opening conditions, shared or separate return-air systems, outdoor pollutant concentrations, and detailed occupancy/activity levels were not measured during the field experiments. Therefore, ventilation and spatial features are treated as contextual workplace characteristics.
3.1. Development of INBASE and AIRPOLL
Two instruments, the Indoor Network-Based Air-Sensing Ecosystem (INBASE) and the Indoor Air Quality Polling Instrument (AIRPOLL), were custom-designed to be used in field experiments.
INBASE, illustrated in Figure 3, is an IoT-based multi-sensor-arrayed real-time IAQ monitor developed to record pollutant-related sensor outputs for PM1.0, PM2.5, PM10, TVOC, HCHO, C6H6, C2H5OH, CO2, O2, and NO2. However, the system does not measure ultrafine particle number concentration, particle-size distribution below 1 μm, particle chemical composition, metal nanoparticles, polymeric micro- or nanoparticles, resin-specific VOCs, or individual solvent compounds using analytical methods. The hardware includes quantitative sensors for PM (HM3301) (Seeed Studio, Shenzhen, China), TVOC (SGP30) (Seeed Studio, Shenzhen, China), HCHO (SFA30) (Seeed Studio, Shenzhen, China), CO2 (SCD30) (Seeed Studio, Shenzhen, China), and O2, (ME2-O2-Φ20) (Seeed Studio, Shenzhen, China); a qualitative sensor (Multichannel V2) (Seeed Studio, Shenzhen, China) for C6H6, C2H5OH, and NO2; and a Wi-Fi module (ESP8266) (Seeed Studio, Shenzhen, China), a display unit (SSD1306) (Solomon Systech, Hong Kong), a base shield (Grove Base Shield V2.0) (Seeed Studio, Shenzhen, China), a breadboard (Robolink, Ankara, Turkey), and a development board (Arduino Mega 2560 Rev3) (Arduino S.r.l., Monza, Italy).
Figure 3.
Indoor Network-Based Air-Sensing Ecosystem (INBASE).
The software of INBASE was developed using Arduino IDE (Version 2.3.2). The configuration included installing open-source sensor libraries, defining connection methods for each sensor, and entering Wi-Fi credentials, server IP addresses, and API keys. Sensor readings were formatted and transmitted to the ThingSpeak (MathWorks, Natick, MA, USA) server over TCP through the ESP8266 module for real-time storage, visualization, and remote data access. Additionally, when the system was connected via USB, measurements were displayed on the Arduino IDE for local data access.
Sensor calibration procedures were performed in accordance with the manufacturer’s guidelines to maintain accuracy and consistency. The factory-calibrated sensors, including HM3301 and SFA30, were operated by integrating manufacturer demo codes into the configuration code. Sensors requiring user-calibration, including SGP30, Multichannel V2, SCD30, and ME2-O2-Φ20, underwent different procedures in line with the recommended calibration protocols. For SGP30, a baseline calibration procedure, consisting of initialization and continuous operation for 12 h to store baseline values, was applied. The Multichannel V2 module was recalibrated by using manufacturer calibration curves. By using inverse equations derived from these curves, voltage outputs were converted into concentration values, which were embedded in the configuration code. Additionally, the sensor was preheated for 168 h to reach equilibrium. For SCD30, the Automatic Self-Calibration algorithm was utilized while the sensor was operated continuously for 168 h with daily fresh-air exposure, after which the calculated parameters were stored in memory. ME2-O2-Φ20 was preheated for 30 min and exposed to fresh air; voltage readings were recorded as reference and converted to percentage concentrations using the manufacturer’s sample code.
The performance characteristics of the sensors were taken from manufacturer specifications. HM3301 provided PM1.0, PM2.5, and PM10 concentrations with a 1 µg/m3 resolution. SGP30 reported TVOC values from 0–60,000 ppb with stepwise resolutions ranging from 1–32 ppb. The SGP30 TVOC output was converted from ppb to mg/m3 using ethanol as the reference compound. The conversion followed the ideal gas relationship at 25 °C and 1 atm: TVOC (mg/m3) = TVOC (ppb) × 46.07/24,450, where 46.07 g/mol is the molecular weight of ethanol, and 24.45 L/mol is the molar volume at 25 °C and 1 atm. Dynamic temperature and pressure corrections were not applied. Therefore, the reported TVOC values should be interpreted as ethanol-equivalent TVOC concentrations used for contextual comparison. SFA30 detected HCHO with 1 ppb resolution and ±20 ppb or ±20% accuracy at low concentrations. SCD30 measured CO2 within 400–10,000 ppm at ±30 ppm + 3% accuracy. ME2-O2-Φ20 covered 0–25% O2 volume with ≤15 s response time. Multichannel V2 was qualitative at the sensor level; therefore, ppm values for C6H6, C2H5OH, and NO2 were obtained through interpolation equations derived from the manufacturer’s calibration curves. These converted values were interpreted as semi-quantitative sensor outputs to identify possible phase-related changes. As the sensor may respond to multiple gases and VOC mixtures rather than to a single target compound, cross-sensitivity may affect the C6H6, C2H5OH, and NO2 channels, particularly in solvent-rich environments. These reported sensor specifications and conversion procedures form the basis of interpreting measurements in this study.
Detection and quantification limits, repeatability, drift, cross-sensitivity, and uncertainty ranges were not independently determined for the assembled INBASE system; therefore, the related measurements were interpreted as indicative environmental monitoring data.
The operational checks and calibration procedures adopted in this study primarily followed manufacturer-recommended protocols for each sensor. These procedures comprised (i) determining background baselines before each session; (ii) performing bench checks: HM3301 zero-check in clean air, SGP30 baseline storage, Multichannel V2 preheating to data-sheet durations, SCD30 ASC with daily outdoor referencing, and ME2-O2-Φ20 fresh-air reference; and (iii) ensuring procedural controls: ESD-safe operation during calibration and fixed instrument placement on a 1.2 m stand at 1 m from the active printer, consistent across sessions. In addition, the study design included background, pre-printing, printing, post-printing, and post-processing phases, enabling phase-wise validation of expected emission patterns against baselines. However, the INBASE system was not validated against reference-grade analytical instruments. Environmental conditions, including temperature and humidity, which may affect low-cost sensor responses, were not independently corrected in this study. Therefore, the measurements obtained should be interpreted as indicative and comparative environmental monitoring data intended to characterize relative variations, operational trends, and phase-based IAQ patterns within the monitored hybrid workplace environment rather than as regulatory-grade exposure measurements.
AIRPOLL, illustrated in Figure 4, is a simplified real-time voting device developed by the authors for perception feedback, enabling employees to rate perceived IAQ conditions during their routine work. It consisted of five tact switches (Robolink, Ankara, Türkiye), five resistors (Robolink, Ankara, Türkiye) to keep the input signal at logic 0 when the corresponding switch was not pressed, a card shield (SD Card Shield V4) (Seeed Studio, Shenzhen, China), a real-time clock (DS1302) (Analog Devices, Wilmington, MA, USA), a display unit (SSD1306) (Solomon Systech, Hong Kong, China), a breadboard (Robolink, Ankara, Türkiye), and a development board (Arduino Mega 2560 Rev3) (Arduino S.r.l., Monza, Italy).
Figure 4.
Indoor Air Quality Polling Instrument (AIRPOLL).
The software of AIRPOLL was developed in Arduino IDE (Version 2.3.2). The configuration code included the connections of switches, resistors, the clock, and the display to the development board and formatting of the vote records for storage. Each button press was recorded on an SD card with a timestamp in a structured format and displayed in OLED screen.
Field experiments in production and office spaces were conducted separately due to spatial and infrastructural conditions of the facility. Therefore, the production and office measurements were not simultaneous, and the results were not used to calculate direct pollutant transfer rates between spaces. Comparisons between production and office spaces were interpreted as phase-based and case-specific IAQ observations under the monitored operational conditions. Data collection followed the facility’s workflow based on received orders, leading to variations in printed components and experiment durations, even for the same AM method. Therefore, the monitored operations should be interpreted as case-based field observations rather than controlled repeated trials. Each monitored case reflected the specific combination of equipment, material, room volume, ventilation condition, filtration system, phase duration, occupancy, and workplace activity present during the measurement period. As the field experiments were conducted under active workplace operating conditions, occupant presence and routine workplace activities were not experimentally controlled. Instead, the monitoring sessions were designed to capture realistic IAQ conditions associated with ongoing AM operations within the hybrid workplace environment. During the experiments, production-related activities, operational phases, and employee presence within the monitored spaces were observed and documented to support contextual interpretation of the measurements. For confidentiality reasons, details of the printed components cannot be disclosed. The timeline of the field experiments is illustrated in Figure 5.
Figure 5.
Timeline of the field experiments.
3.2. Field Experiments in Production Spaces
IAQ was monitored in real-time in the production spaces using INBASE during various operational phases of PBF-SLM, PBF-SLS, and VP-SLA, while the employee perceptions of IAQ were captured in real-time using AIRPOLL. Both instruments were positioned on a 1.2-m-tall movable stand, approximately corresponding to the seated breathing-zone height of occupants and 1 m away from the relevant printers, marked by the burgundy circles in Figure 1. These positions were selected to characterize IAQ conditions at fixed workplace locations. However, the measurements represent area monitoring rather than personal breathing-zone sampling. The following sections detail the monitoring sessions for each AM technology.
3.2.1. Powder Bed Fusion—Selective Laser Melting
PBF-SLM operations took place in a 127.7 m3 (34.5 m2 × 3.7 m) PBF-SLM production space, highlighted in green in Figure 1. This space accommodates two SLM printers, with different building volumes and brands, and a pre-printing workspace. The monitored SLM printer features a 160 mm × 160 mm × 100 mm build volume, 10–40 μm layer thickness, and 500 W laser power. Titanium alloy (Ti-6Al-4V) and cobalt–chromium alloy powders were used as feedstock materials. The monitoring process covered four phases:
- Background Phase: Baseline IAQ measurements were taken during the period of inactivity;
- Pre-printing Phase: Titanium alloy powder (Ti-6Al-4V) was measured, mixed, and introduced into the printer. The build platform was cleaned to eliminate debris or residue and fixed into the build chamber, and the design file was uploaded to the control software;
- Printing Phase: The SLM printer operated continuously to fabricate the component;
- Post-printing Phase: The printer cover was opened. As the printed component was embedded within the uncured powder, the excess powder was vacuumed, and the build platform was removed. Any remaining powder on the build platform was transferred into a tray, sieved, and replenished for reuse.
Following the post-printing phase, as the printed component with the build platform was sent to another facility for post-processing activities, the post-processing phase was not monitored.
3.2.2. Powder Bed Fusion—Selective Laser Sintering
PBF-SLS operations were conducted in a 49.2 m3 (13.3 m2 × 3.7 m) PBF-SLS production space, indicated in purple in Figure 1. This space is equipped with an SLS printer with 165 mm × 165 mm × 300 mm building volume, 110 microns layer thickness, intake and exhaust filters to control air contaminants, an SLS powder management station equipped with a HEPA filter and negative air pressure system for powder recovery, debris filtration, and material storage, and an FDM printer. The monitoring process covered five phases:
- Background Phase: Baseline IAQ measurements were taken during the period of inactivity;
- Pre-printing Phase: The powder cartridge was filled with recovered Nylon 12 powder, loaded into the hopper, and prepared for printing. The cleaned optical cassette and the build chamber were inserted, and the design file was uploaded;
- Printing Phase: The printing phase comprised three subsequent steps occurring inside the SLS printer. These steps were pre-heating (51 min), where the building chamber was heated up to 179 °C; printing (105 min), where the plastic powder was fused layer by layer to print the intended object; and cooling (313 min), where the printed object remained inside the printer to acquire the desired mechanical properties until the bed temperature decreased to 40 °C;
- Post-printing Phase: The build chamber was extracted and transferred to the powder management station;
- Post-processing Phase: The print cake, consisting of printed components and unfused and semi-fused powder, was removed from the build chamber and transferred to the powder management station. The excess powder was scrubbed and brushed off from the components, and the components were collected in a wire basket. The remaining powder on the station was collected into a sifter, filtered, and reclaimed for reuse. Any leftover powder was removed using a vacuum system.
3.2.3. Vat Photopolymerization—Stereolithography
VP-SLA operations took place in a 48.1 m3 (13.0 m2 × 3.7 m) VP-SLA production space for pre-printing, printing, and post-printing phases and in a 51.4 m3 (13.9 m2 × 3.7 m) post-processing atelier for the post-processing phase, shown in turquoise and pink in Figure 1, respectively.
The VP-SLA production space housed seven SLA printers with varying build volumes, a DLP printer, and an open-shelf system for sealed resin cartridges. The monitored SLA printer has a 145 mm × 145 mm × 193 mm build volume, 25–300 μm layer thickness, and 250 mW laser power. It does not include a filter or other form of emissions capture. The post-processing atelier includes UV cure equipment, large and small wash equipment, two workstations, an air compressor, and post-processing tools. The utilized wash equipment features a wash bucket, wash basket, electric solvent pump, flexible scraper, scraper, flush cutters, rinse bottle, build platform adaptor, and gloves, while the cure system uses 500 W dual heaters to reach 80 °C for curing. The monitoring process covered five phases:
- Background Phase: Baseline IAQ measurements were taken during the period of inactivity;
- Pre-printing Phase: The design file was uploaded to the printer, and the standard grey resin cartridge was shaken and inserted into the printer;
- Printing Phase: The SLA printer continuously operated to fabricate the component;
- Post-printing Phase: The printer cover was opened, and the resin tank and build platform were removed;
- Post-processing Phase: The printed component was transferred to the post-processing atelier, where it was washed with isopropyl alcohol to remove residual resin, dried with an air compressor, cured for 60 min under heat and UV light, detached from the build platform, and had its supports removed. Sanding was not required and was therefore not performed.
3.3. Field Experiments in Office Space
The field experiments in office space, marked in blue in Figure 1, involved real-time IAQ monitoring during various operational phases of PBF-SLM, PBF-SLS, and VP-SLA using INBASE and collection of real-time employee feedback on IAQ perception via AIRPOLL. Both instruments were positioned on an office desk accessible to employees and located within the routinely occupied working area to support representative monitoring of indoor conditions and facilitate real-time AIRPOLL feedback collection during daily workplace activities, highlighted by the burgundy circle in Figure 1. AM operations took place in the respective production spaces using the same equipment and procedures described in production-spaces experiments. For PBF-SLM operations, four operational phases, including background, pre-printing, printing, and post-printing, were monitored. For PBF-SLS and VP-SLA operations, five operational phases, including background, pre-printing, printing, post-printing, and post-processing, were monitored.
3.4. Data Processing and Quality Control
INBASE generated real-time sensor records at a recording interval of 15 s and transmitted the data to the ThingSpeak server. The raw time-series data were exported as CSV files and assigned to operational phases using the documented start and end times of each monitored phase.
Operational phase boundaries were defined according to AM activities recorded during the field experiments. However, other routine workplace activities occurring during the same monitoring periods were not separated from AM-related activities. Therefore, phase averages represent combined IAQ conditions during the monitored phase. Accordingly, the background phase referred to the period before AM-related activity began in the monitored space. The pre-printing phase included preparation activities before printer operation, such as material preparation, machine setup, powder handling, resin preparation, or loading procedures, depending on the AM process. The printing phase began when the printer operation started and ended when the print job was completed. The post-printing phase included activities immediately after print completion, such as printer opening, cooling, part removal, powder removal, or initial handling of the printed component. The post-processing phase referred to additional finishing or cleaning procedures performed after part removal, such as washing, cleaning, or other process-specific treatment steps. Since not all AM operations included all phases, only the phases observed during each monitored operation were reported.
Sensor response time and possible carryover between operational phases were not corrected quantitatively. Therefore, short-term changes recorded around phase transitions were interpreted descriptively as transient observations and were considered together with the documented operational activity at that time.
For each pollutant and phase, the number of valid observations and phase average value were calculated. Missing timestamps caused by communication interruptions were treated as missing data and were not interpolated. Duplicate timestamps and physically implausible values caused by communication or recording errors were removed before analysis. No smoothing was applied to the raw time-series data. Because consecutive sensor readings were temporally autocorrelated, individual real-time observations were not treated as independent replicates. Therefore, no inferential statistical testing, analysis of variance, or confidence interval calculation was conducted. Phase averages were used only as descriptive summaries of the monitored operational phases because independent repeated trials under standardized equipment, material, ventilation, occupancy, and print-job conditions were not available. Reported concentration values represent calculated phase averages derived from INBASE sensor outputs. The displayed decimal places were retained to preserve calculation transparency; however, they should not be interpreted as certified analytical precision. Since measurement uncertainty was not independently quantified through laboratory calibration or co-location with reference-grade instruments, interpretation focused on relative changes, phase-based trends, transient peaks, and contextual reference comparisons. Possible effects of environmental conditions, including temperature and humidity, were considered as part of the overall measurement uncertainty and were not corrected quantitatively.
Sensor warm-up and stabilization procedures followed the manufacturer-based protocols described in Section 3.1. Before each monitoring session, background measurements were collected to document baseline conditions. No additional drift correction was applied because the assembled INBASE system was not co-located with certified reference-grade instruments. Sensor lag at phase transitions was not corrected quantitatively; therefore, short-term peaks occurring around operational transitions, such as printer opening, powder handling, washing, cleaning, or component removal, were interpreted descriptively as transient observations.
AIRPOLL responses were collected voluntarily and anonymously using five response categories: “very good”, “good”, “neutral”, “bad”, and “very bad”. Before the field experiments, employees were informed about the purpose of AIRPOLL and the meaning of the five response categories. The device was used as a simplified practical feedback tool and was not psychometrically validated. These responses were scored from 5 to 1, respectively, for descriptive summary purposes. Because the AIRPOLL scale is ordinal, response distributions, total vote counts, median, and range were used as descriptive indicators. Weighted averages and standard deviations were retained only as supplementary descriptive summaries and were not interpreted as inferential statistics. Because AIRPOLL did not collect personal identifiers, the same employee could potentially vote more than once during a monitoring period. Individual participant identity, participant-level vote frequency, exact task, and exact location at the time of voting were not recorded. A fixed minimum interval between votes was not imposed beyond the device recording procedure.
4. Results and Discussion
Real-time IAQ measurements from INBASE were evaluated for production and office spaces during PBF-SLM, PBF-SLS, and VP-SLA operations. The reference values given in Table A3 were used to contextualize the measured parameters. Where the averaging period of a reference value differed from the monitored phase duration, the comparison was interpreted only as a contextual benchmark. The interpretation was limited to the parameters measured by INBASE and did not represent a comprehensive assessment of all possible AM-related emissions. Additionally, production and office results were compared descriptively because the two spaces were monitored during different time periods.
AIRPOLL responses were scored on a five-point scale ranging from 1 for “very bad” to 5 for “very good” to calculate the weighted averages of IAQ perception values. These responses were used as supportive perception feedback. Because the dataset was limited, anonymous, and ordinal and potentially included repeated votes from the same employees, the observed correspondences between AIRPOLL scores and monitored IAQ parameters were interpreted as exploratory co-occurrences.
4.1. Field Experiments for Powder Bed Fusion—Selective Laser Melting
Indoor air quality pollutant concentrations, operational phase durations, temperature, and relative humidity in the PBF-SLM production space and the office space during PBF-SLM operations are summarized in Table 2.
Table 2.
IAQ pollutant concentrations in production and office spaces during Powder Bed Fusion–Selective Laser Melting (PBF-SLM) operations.
In the PBF-SLM production space, every monitored parameter except for TVOC remained within the reference thresholds across all operational phases. In the office space, all parameters remained within the reference values used for interpretation, indicating that the influence of PBF-SLM operations on the office environment was limited. Although PM1.0 levels showed variations across operational phases in both production and office spaces, they remained close to background levels. Similarly, PM2.5 and PM10 concentrations exhibited short-term increases during pre-printing and post-printing in the production space due to powder handling and cleaning operations. The values remained below the selected contextual reference concentrations during the monitored periods.
The principal exception was TVOC, which rose to concentrations of Level 2 based on phase-average concentrations in the production space during the printing and post-printing phases. Real-time measurements showed higher transient peaks at Level 3 during these phases, which are reported separately from the phase-average classification. These increases may reflect thermal degradation and emissions associated with powder fusion and part removal processes. This indicates potential hygienic concerns and a need for increased local ventilation in the PBF-SLM production space. In the office space, TVOC remained within reference ranges. The IAQ pollutant concentrations during PBF-SLM operations are presented in Figure 6 for the production space and in Figure 7 for the office space.
Figure 6.
IAQ pollutant concentrations measured in the production space during Powder Bed Fusion–Selective Laser Melting (PBF-SLM) operations (PM: Particulate Matter; TVOC: Total Volatile Organic Compounds; HCHO: Formaldehyde; C6H6: Benzene; C2H5OH: Ethyl Alcohol; NO2: Nitrogen Dioxide; CO2: Carbon Dioxide; O2: Oxygen).
Figure 7.
IAQ pollutant concentrations measured in the office space during Powder Bed Fusion–Selective Laser Melting (PBF-SLM) operations (PM: Particulate Matter; TVOC: Total Volatile Organic Compounds; HCHO: Formaldehyde; C6H6: Benzene; C2H5OH: Ethyl Alcohol; NO2: Nitrogen Dioxide; CO2: Carbon Dioxide; O2: Oxygen).
Employee ratings from AIRPOLL for the PBF-SLM production and office spaces are summarized in Table 3, including vote counts, response distributions, weighted averages, and standard deviations across operational phases. AIRPOLL responses were interpreted as supportive perception feedback. Although the limited AIRPOLL dataset did not permit robust statistical interpretation of relationships between employee perception and IAQ parameters, the declining trend from good to very bad was observed in IAQ perception in the PBF-SLM production space across operational phases. This pattern co-occurred with increases in TVOC levels in the PBF-SLM production space and may suggest a possible association between TVOC variation and perceived discomfort. In contrast, IAQ perception in the office space was generally positive across operational phases, which can correspond to the environmental conditions observed in the office space. The IAQ perception of employees for the PBF-SLM production space and the office space is presented in Figure 8.
Table 3.
IAQ ratings in production and office spaces during Powder Bed Fusion–Selective Laser Melting (PBF-SLM) operations.
Figure 8.
Employee perception of IAQ in production and office spaces during Powder Bed Fusion–Selective Laser Melting (PBF-SLM) operations.
4.2. Field Experiments for Powder Bed Fusion—Selective Laser Sintering
IAQ pollutant concentrations from INBASE for the PBF-SLS production space and the office space were presented in Table 4, with corresponding phase durations, temperature, and relative humidity.
Table 4.
IAQ pollutant concentrations in production and office spaces during Powder Bed Fusion–Selective Laser Sintering (PBF-SLS) operations.
During PBF-SLS operations, most pollutant concentrations in both the production space and the office space remained below the selected contextual reference concentrations during the monitored periods. Particulate matter concentrations remained relatively low in the production space. In the office space, PM2.5 and PM10 showed short-term increases during post-printing. HCHO, C6H6, C2H5OH, and O2 stayed within the reference values used for interpretation throughout; NO2 showed only a brief rise during printing in the production space; and CO2 varied with powder-handling activity while remaining within the reference values used for interpretation. Although the room configuration and existing filtration system may have contributed to this pattern, ventilation parameters were not measured quantitatively, and causal attribution is therefore not possible.
TVOC again emerged as the most active parameter. Based on phase-average concentrations, TVOC reached Level 2 during printing in the production space and Level 2 during printing, post-printing, and post-processing in the office space. However, transient real-time peaks reached Level 3 during post-printing and post-processing, revealing short-term increases not reflected by the phase-average values and suggesting a need for enhanced ventilation and source investigation. The IAQ pollutant concentrations during PBF-SLS operations are presented in Figure 9 for the production space and in Figure 10 for the office space.
Figure 9.
IAQ pollutant concentrations measured in production space during Powder Bed Fusion–Selective Laser Sintering (PBF-SLS) operations (PM: Particulate Matter; TVOC: Total Volatile Organic Compounds; HCHO: Formaldehyde; C6H6: Benzene; C2H5OH: Ethyl Alcohol; NO2: Nitrogen Dioxide; CO2: Carbon Dioxide; O2: Oxygen).
Figure 10.
IAQ pollutant concentrations measured in the office space during Powder Bed Fusion–Selective Laser Sintering (PBF-SLS) operations (PM: Particulate Matter; TVOC: Total Volatile Organic Compounds; HCHO: Formaldehyde; C6H6: Benzene; C2H5OH: Ethyl Alcohol; NO2: Nitrogen Dioxide; CO2: Carbon Dioxide; O2: Oxygen).
AIRPOLL ratings for the PBF-SLS production space and the office space are summarized in Table 5, including vote counts, response distributions, weighted averages, and standard deviations across operational phases. The responses were interpreted as supportive perception feedback. The rating indicated that IAQ was perceived as above neutral in the PBF-SLS production space and positive in the office space across all operational phases. Therefore, the feedback may suggest that employees did not perceive significant IAQ deterioration during PBF-SLS operations. The IAQ perception of employees for the PBF-SLS production space and the office space is presented in Figure 11.
Table 5.
IAQ ratings in production and office spaces during Powder Bed Fusion–Selective Laser Sintering (PBF-SLS) operations.
Figure 11.
Employee perception of IAQ in production and office spaces during Powder Bed Fusion–Selective Laser Sintering (PBF-SLS) operations.
4.3. Field Experiments for Vat Photopolymerization—Stereolithography
IAQ pollutant concentrations gathered from INBASE for the VP-SLA production spaces and the office space, with duration, temperature, and relative humidity, are given in Table 6.
Table 6.
IAQ pollutant concentrations in production and office spaces during Vat Photopolymerization–Stereolithography (VP-SLA) operations.
During VP-SLA operations, pollutant concentrations in the production and office spaces generally remained within the reference concentrations. However, certain indicators approached or were higher than the contextual reference values.
Particulate matter showed slight increases during post-processing, and HCHO, CO2, and O2 remained within the reference values used for interpretation. Multichannel V2 sensor responses assigned to the C6H6 and C2H5OH channels were observed only during VP-SLA post-processing in the production space and were not observed in the office space. Because isopropyl alcohol was used during this phase, the C2H5OH channel response was interpreted cautiously as an alcohol-related sensor response. NO2 showed intermittent short-term sensor responses in the production space during pre-printing, printing and post-processing and was not detected in the office space.
TVOC dominated the VP-SLA emission profile. During post-processing, the phase-average TVOC concentration reached Level 4, while transient peak concentrations exceeded Level 5 in the real-time measurements, underscoring the need for effective emission control and ventilation during this phase. In the office space, phase-average TVOC concentrations remained at Level 1 across all monitored phases, with transient real-time peaks reaching Level 2, indicating no hygienic concern. The IAQ pollutant concentrations during VP-SLA operations are presented in Figure 12 for the production space and in Figure 13 for the office space.
Figure 12.
IAQ pollutant concentrations measured in the production spaces during Vat Photopolymerization–Stereolithography (VP-SLA) operations (PM: Particulate Matter; TVOC: Total Volatile Organic Compounds; HCHO: Formaldehyde; C6H6: Benzene; C2H5OH: Ethyl Alcohol; NO2: Nitrogen Dioxide; CO2: Carbon Dioxide; O2: Oxygen).
Figure 13.
IAQ pollutant concentrations measured in the office space during Vat Photopolymerization–Stereolithography (VP-SLA) operations (PM: Particulate Matter; TVOC: Total Volatile Organic Compounds; HCHO: Formaldehyde; C6H6: Benzene; C2H5OH: Ethyl Alcohol; NO2: Nitrogen Dioxide; CO2: Carbon Dioxide; O2: Oxygen).
Employee ratings gathered from AIRPOLL for the VP-SLA production and office spaces, along with vote counts, response distributions, weighted averages, and standard deviations across operational phases, are given in Table 7. AIRPOLL responses were interpreted as supportive perception feedback. Employee perception of IAQ in the VP-SLA production spaces, given in Figure 14, demonstrated below-neutral ratings across phases except for the background. Due to the short duration of the post-printing, no feedback was collected. Despite the insufficiency of the AIRPOLL dataset for statistical assessment of relationships between perceived IAQ and pollutant concentrations, the below-neutral ratings recorded during operational phases suggest that emissions associated with VP-SLA activities may have led to an uncomfortable environment.
Table 7.
IAQ ratings in production and office spaces during Vat Photopolymerization–Stereolithography (VP-SLA) operations.
Figure 14.
Employee perception of IAQ in production and office spaces during Vat Photopolymerization–Stereolithography (VP-SLA) operations.
To illustrate, elevated TVOC levels during operational phases, together with sensor responses in the C6H6, C2H5OH, and NO2 channels, may have contributed to perceived IAQ discomfort. However, the Multichannel V2 outputs should be interpreted as indicative sensor responses. In contrast, the office space, given in Figure 14, was rated positively, with no feedback collected during post-printing due to its two-minute duration. Although the available observations were insufficient for detailed statistical interpretation of relationships between measured IAQ parameters and employee perception, the generally stable pollutant concentrations within acceptable thresholds may have contributed to the positive IAQ perception.
4.4. Case-Based Comparison of Monitored AM Operations and Discussion
The following discussion distinguishes between measured observations and plausible interpretations. The measured observations refer to the monitored IAQ parameters and AIRPOLL responses recorded during the selected operational phases. Explanations related to emission sources, filtration, ventilation, negative pressure, spatial separation, or pollutant movement are interpreted as plausible mechanisms consistent with the observed patterns. Additionally, because the study was conducted in an active workplace, the observed IAQ patterns may reflect combined effects of AM-related activities, occupancy variation, cleaning, equipment use, door openings, and other routine tasks.
Across the monitored AM operations, TVOC was the parameter that most consistently exceeded the reference levels. It breached its reference thresholds in every production space, and its magnitude differed sharply by technology. Among the monitored cases, the VP-SLA operation showed the highest concentrations. During VP-SLA post-processing, the phase-average concentration reached Level 4, while transient real-time peaks exceeded Level 5. By comparison, PBF-SLM production-space TVOC reached Level 2 based on phase-average values, and PBF-SLS production- and office-space TVOC increases also remained at Level 2 based on phase-average values. Perception ratings declined during the phases in which these elevated concentrations were recorded. Employee ratings declined most, falling below neutral, in the VP-SLA and PBF-SLM production spaces, whereas the PBF-SLS production space, where TVOC peaked at lower levels and the unit incorporated filtration and negative-pressure powder handling, retained above-neutral ratings. On the other hand, the office environment stayed within the reference values used for interpretation and was rated positively during all operations, with only moderate TVOC rises during PBF-SLS and VP-SLA. Because AIRPOLL responses were anonymous, ordinal, and limited in number and because participant identity, repeated voting, task, and exact location were not recorded, the perception data were used only to support interpretation of phase-based IAQ observations.
These findings are well-positioned against earlier research on IAQ in AM environments. In PBF processes, previous studies reported PM and VOC emissions, particularly during powder handling, machine cleaning, and post-processing phases [51,52,54,55]. Our monitoring also showed increases in PM and TVOC during pre- and post-printing activities in SLM and SLS operations, which indicates a similar trend. Other studies generally reported concentrations below occupational exposure limits [66,69,71]; however, concerns related to cobalt exposure, nanoparticle peaks, and recycled powder behavior were also highlighted [60,61,70]. These exposure types were outside the scope of this study due to differences in monitored parameters.
For polymer-based SLS, Damanhuri et al. [67,68] and Zisook et al. [58] reported increases in PM2.5, CO2, and TVOC. The concentration levels were higher with recycled powders than virgin powders. In this study, PBF-SLS operations resulted in TVOC increases occasionally, which is consistent with their observation that post-printing and powder recovery stages contribute to emissions. CO2 and PM2.5 levels occasionally exceeded guideline values in their study, whereas relatively lower levels of PM2.5 and CO2 were observed in this study. Moreover, Väisänen et al. [62] reported higher PM and HCHO concentrations with reinforced nylon powders. By comparison, the results of this research showed moderate increases in PM. These variances can be attributed to the differences in feedstock material, powder condition, printer configuration, room volume, ventilation context, filtration, differences in monitoring design, and workplace conditions.
In the case of vat photopolymerization, prior studies highlighted TVOC increases during cleaning and curing steps [73,75,76]. This study also recorded significant TVOC rises during SLA post-processing, along with sensor responses in the C6H6 and C2H5OH channels during the same phase, which is consistent with their findings on solvent- and resin-related emissions. However, they should not be interpreted as confirmed compound-specific concentrations because TVOC composition was not analytically identified, and Multichannel V2 cross-sensitivity could not be excluded. By contrast, Zisook et al. [58] reported relatively stable conditions in a well-ventilated laboratory, whereas our results in a production atelier indicated higher levels, suggesting that ventilation differences may account for this divergence. They may also reflect occupancy, time of day, ventilation state, door conditions, cleaning, or other routine workplace activities.
Overall, the monitored cases were consistent with earlier research that emission activity may increase during material handling, cleaning, and post-processing tasks. Where differences occur, they appear to reflect variations in feedstock material, process configuration, and ventilation practices across facilities. However, because the present study did not include controlled repetitions, the results should be interpreted as case-based observations.
4.5. Implications for Hybrid Workplace Design and Monitoring
These findings carry practical implications for the design and operation of hybrid AM workplaces, but the recommendations should be interpreted as precautionary design and operational strategies. These implications are drawn from the monitored cases and the existing body of literature and should be adapted to the specific equipment, materials, ventilation systems, and spatial layouts of other AM workplaces. As higher pollutant concentrations were mainly observed in production spaces, while office-space increases were more limited, enclosing fabrication activities in dedicated rooms with buffer zones and controlled circulation paths can be an effective first line of defense. Ventilation should be zoned to the source, prioritizing the production and post-processing areas where TVOC peaks rather than relying on general office ventilation. Phase-specific peaks, particularly during VP-SLA post-processing and powder-handling stages, warrant localized exhaust and source capture, which can substantially reduce TVOC at the breathing zone [10]. Finally, the phase- and process-dependent variation in IAQ conditions demonstrates the need for continuous IAQ monitoring rather than spot checks, ideally paired with occupant feedback to capture VOC-driven discomfort that instruments alone may underprioritize.
5. Conclusions
This study investigated IAQ conditions and employee perception during selected PBF-SLM, PBF-SLS, and VP-SLA operations, within an AM-integrated hybrid workplace. Field experiments captured real-time pollutant data on PM1.0, PM2.5, PM10, TVOC, HCHO, C6H6, C2H5OH, NO2, CO2, and O2, together with employee feedback across various operational phases using custom-designed instruments, INBASE and AIRPOLL. The results are summarized in Table 8. However, these results refer only to the monitored parameters and do not establish comprehensive safety conditions for all AM-related emissions. The labels summarize measurements according to the reference values used for contextual interpretation in this study. As there is no reference value for PM1.0, it is excluded from the table.
Table 8.
Summary of the Results of the Research.
Across all technologies and spaces, PM2.5, PM10, HCHO, CO2, and O2 levels remained within reference values. C6H6, C2H5OH, and NO2 were generally not observed except for the VP-SLA production spaces. TVOC showed the clearest process- and phase-dependent variation. In production spaces, phase-average TVOC concentrations reached Level 2 during PBF-SLM and PBF-SLS operations and Level 4 during VP-SLA post-processing, with transient real-time peaks exceeding Level 5. In office spaces, phase-average TVOC concentrations remained at Level 1 during PBF-SLM and VP-SLA monitoring and reached Level 2 during PBF-SLS monitoring. Employee perception of IAQ was positive in the office space during all operations. While the employee feedback was positive in PBF-SLS production space, it declined below neutral in the production spaces of PBF-SLM and VP-SLA, suggesting a perceived impact of emissions in those environments.
To summarize, IAQ conditions varied across the monitored cases, operational phases, and workplace spaces, with higher pollutant concentrations observed in production spaces. Office spaces maintained a more stable IAQ and received positive perceptions, while production spaces raised concerns during specific phases. Although the employee feedback dataset was too limited to conduct statistical analysis to interpret relationships between IAQ parameters and IAQ perception, the observations were used to acquire insights to address IAQ challenges in hybrid workplaces. The impact of many IAQ pollutants was limited in the office space, while certain exceptions were captured with TVOC concentrations. These observations indicate that IAQ conditions in office spaces should also be monitored in hybrid AM workplaces; however, direct pollutant transfer could not be confirmed because production and office spaces were not monitored simultaneously. The observations support the consideration of facility adjustments; spatial organization, including enclosed fabrication rooms, buffer zones, and controlled circulation paths; improvements for ventilation conditions, such as localized exhaust ventilation and negative pressure containment; maintenance of the fabrication and filtration equipment; and encouraging the use of PPE during AM operations as precautionary strategies for reducing potential pollutant movement and occupant exposure.
This study has several limitations. The field experiments were conducted in a single hybrid workplace specializing in AM and covered selected PBF-SLM, PBF-SLS, and VP-SLA operations. Independent repetitions under standardized equipment, material, ventilation, occupancy, and print-job conditions were not conducted. Therefore, analysis of variance, confidence intervals, and statistical generalization across AM processes were not performed. The reported phase averages were interpreted as descriptive summaries of monitored case-specific IAQ conditions. The monitoring process was conducted following the facility’s production schedule; therefore, monitoring durations, printed components, material conditions, and occupant activities could not be fully standardized, limiting the temporal and spatial representativeness of the results. Although AM-related activities defining each operational phase were documented, a detailed time–activity log covering all occupant movements, door openings, cleaning activities, non-AM equipment use, and unrelated workplace tasks was not recorded. Therefore, these variables were treated as contextual workplace conditions that may have contributed to the observed IAQ variation. Accordingly, the findings should be interpreted as a case-based assessment of IAQ behavior in the monitored hybrid workplace under operational conditions.
Several reference values used for contextual interpretation have annual, 24 h, or 30 min averaging periods that did not always correspond to the monitored phase durations. Therefore, these comparisons were not used to determine compliance or safety. Due to the availability of only one air quality monitor, production and office spaces were not monitored simultaneously. Therefore, production–office comparisons should be interpreted as case-specific observations.
The sensors utilized for INBASE were commercially available low-cost sensors, which are calibrated according to manufacturer protocols and may introduce accuracy and precision limitations since the system was not validated against certified reference-grade analytical instruments. In addition, detection and quantification limits, repeatability, drift, cross-sensitivity, temperature- and humidity-related response effects, and uncertainty ranges were not independently determined for the assembled INBASE system. This limitation is particularly relevant for the Multichannel V2 sensor. Therefore, the results should be considered indicative and comparative environmental measurements. In addition, TVOC values were converted from SGP30 ppb output to ethanol-equivalent mg/m3 values using a fixed conversion basis. The TVOC classification used in this study was originally intended as a hygiene-evaluation guide and was not treated as a health-based limit. Because TVOC composition was not analytically identified, the TVOC results should be interpreted as relative VOC-related variation. Drift correction was not applied beyond the manufacturer-based calibration and stabilization procedures. Overall, the real-time sensor data were used as descriptive time-series records to identify relative changes, phase-based trends, and transient peaks.
INBASE monitored selected IAQ parameters but did not provide a complete characterization of all AM-related emissions. The measurements were based on fixed-location area monitoring. Individual time–activity patterns and the duration employees spent in different spaces were not recorded. Therefore, the results should not be interpreted as personal exposure measurements, exposure-dose estimates, or occupational health-risk assessments. Instead, they represent monitored indoor concentrations for the monitored parameters only at selected workplace locations.
AIRPOLL employee feedback was limited by the small number of participants and operational constraints. The device was developed as a simplified practical feedback tool and was not psychometrically validated. Responses were anonymous and ordinal, and the same employee could potentially vote more than once. Participant identity, participant-level vote frequency, exact task, and exact location at the time of voting were not recorded. Therefore, the independence of individual votes could not be verified. The data were also subjective and may have been affected by individual sensitivity, task type, and location within the workplace. Therefore, inferential statistical analysis was not conducted, and AIRPOLL results were interpreted as supportive, phase-based perception observations.
Ventilation and spatial performance were not quantitatively evaluated in this study. Air exchange rates, supply and exhaust airflow, local exhaust capture velocity, pressure differences between rooms, airflow direction, door and window conditions, return-air configuration, outdoor pollutant concentrations, and detailed occupancy/activity levels were not measured. Therefore, differences between production and office spaces cannot be directly attributed to specific ventilation, filtration, negative-pressure, or spatial-separation strategies. The design recommendations presented in this study should be interpreted as precautionary strategies informed by the monitored case and previous literature.
Future research should address the methodological limitations of this case-based study through longer monitoring periods, repeated measurements, simultaneous multi-location monitoring, and validation against reference-grade instruments. Such studies should document occupancy, time–activity patterns, door conditions, ventilation state, airflow direction, pressure differences, and other relevant spatial and operational variables to better evaluate temporal relationships and possible pollutant movement between spaces. Future work should also include additional AM technologies, materials, and workplace configurations to improve the generalizability of the findings.
Further validation of INBASE is also needed. Laboratory calibration, uncertainty analysis, and cross-sensitivity testing would be particularly important for improving the interpretation of Multichannel V2 gas sensor outputs. Indicative sensor responses should be verified using reference-grade analytical methods such as GC-MS, calibrated electrochemical comparison, or laboratory co-location. Future studies should include personal breathing-zone sampling, ultrafine particle number concentration, particle-size distribution below 1 μm, particle composition analysis, metal and polymeric particle characterization, and reference-grade analytical VOC measurements. In addition, the effectiveness of mitigation strategies such as enclosure, buffer zones, localized exhaust ventilation, filtration, and controlled circulation using airflow measurements, pressure-difference monitoring, capture-efficiency assessment, simultaneous multi-location IAQ monitoring, and personal exposure measurements should be evaluated. Larger AIRPOLL datasets would also support stronger analysis of relationships between IAQ parameters and perceived air quality.
Author Contributions
Conceptualization, E.U., M.K.P. and F.T.; methodology, E.U., M.K.P. and F.T.; formal analysis, E.U.; investigation, E.U., M.K.P. and F.T.; data curation, E.U.; writing—original draft, E.U.; writing—review and editing, E.U., M.K.P. and F.T.; visualization, E.U.; supervision, M.K.P. and F.T. All authors have read and agreed to the published version of the manuscript.
Funding
This research received no external funding.
Institutional Review Board Statement
This research was conducted in accordance with institutional and national ethical guidelines. Ethical approval for the study, including anonymous collection of employee perception data through AIRPOLL, was granted by the Human Subjects Ethics Committee of Middle East Technical University (Approval No: 0374-ODTUİAEK-2024), with no personally identifiable participant information recorded during the study. All participants provided written and verbal informed consent prior to participation in the study.
Data Availability Statement
The anonymized and processed time-series datasets generated during the current study, together with the Arduino code used for INBASE and AIRPOLL, are available from the corresponding author upon request. Data sharing is subject to institutional data protection policies and participant confidentiality requirements.
Acknowledgments
The authors acknowledge the financial support by TU Wien Bibliothek for open access publishing.
Conflicts of Interest
The authors declare no conflicts of interest.
Appendix A
Table A1.
Air quality guidelines for PM [38].
Table A2.
Air quality guidelines for NO2 [38].
Table A3.
Reference values used for contextual interpretation of IAQ parameters.
References
- Kosonen, R.; Tan, F. The Effect of Perceived Indoor Air Quality on Productivity Loss. Energy Build. 2004, 36, 981–986. [Google Scholar] [CrossRef] [Scilit]
- Vaidya, S.; Ambad, P.; Bhosle, S. Industry 4.0—A Glimpse. Procedia Manuf. 2018, 20, 233–238. [Google Scholar] [CrossRef] [Scilit]
- Mathur, R. 3D Printing in Architecture. Int. J. Innov. Sci. Eng. Technol. 2016, 3, 583–591. [Google Scholar]
- Gibson, I.; Rosen, D.; Stucker, B. Additive Manufacturing Technologies 3D Printing, Rapid Prototyping, Direct Digital Manufacturing, 2nd ed.; Springer: New York, NY, USA, 2015. [Google Scholar]
- Minář, J.; Pilnaj, D.; Uřičář, J.; Veselý, P.; Dušek, K. Application of Solid-Phase Microextraction Arrows for Characterizing Volatile Organic Compounds from 3D Printing of Acrylonitrile-Styrene-Acrylate Filament. J. Chromatogr. A 2023, 1705, 464180. [Google Scholar] [CrossRef] [Scilit]
- Stefaniak, A.B.; Du Preez, S.; Du Plessis, J. Additive Manufacturing for Occupational Hygiene: A Comprehensive Review of Processes, Emissions & Exposures. J. Toxicol. Environ. Health Part B 2021, 24, 173–222. [Google Scholar] [CrossRef] [Scilit]
- Roth, G.A.; Geraci, C.L.; Stefaniak, A.; Murashov, V.; Howard, J. Potential Occupational Hazards of Additive Manufacturing. J. Occup. Environ. Hyg. 2019, 16, 321–328. [Google Scholar] [CrossRef] [Scilit]
- Petretta, M.; Desando, G.; Grigolo, B.; Roseti, L. 3D Printing of Musculoskeletal Tissues: Impact on Safety and Health at Work. J. Toxicol. Environ. Health A 2019, 82, 891–912. [Google Scholar] [CrossRef] [Scilit]
- Chan, F.L.; Hon, C.-Y.; Tarlo, S.M.; Rajaram, N.; House, R. Emissions and Health Risks from the Use of 3D Printers in an Occupational Setting. J. Toxicol. Environ. Health A 2020, 83, 279–287. [Google Scholar] [CrossRef] [Scilit]
- Davis, A.Y.; Zhang, Q.; Wong, J.P.S.; Weber, R.J.; Black, M.S. Characterization of Volatile Organic Compound Emissions from Consumer Level Material Extrusion 3D Printers. Build. Environ. 2019, 160, 106209. [Google Scholar] [CrossRef] [Scilit]
- Azimi, P.; Zhao, D.; Pouzet, C.; Crain, N.E.; Stephens, B. Emissions of Ultrafine Particles and Volatile Organic Compounds from Commercially Available Desktop Three-Dimensional Printers with Multiple Filaments. Environ. Sci. Technol. 2016, 50, 1260–1268. [Google Scholar] [CrossRef] [Scilit]
- Wojtyła, S.; Klama, P.; Baran, T. Is 3D Printing Safe? Analysis of the Thermal Treatment of Thermoplastics: ABS, PLA, PET, and Nylon. J. Occup. Environ. Hyg. 2017, 14, D80–D85. [Google Scholar] [CrossRef] [Scilit]
- Runström Eden, G.; Tinnerberg, H.; Rosell, L.; Möller, R.; Almstrand, A.C.; Bredberg, A. Exploring Methods for Surveillance of Occupational Exposure from Additive Manufacturing in Four Different Industrial Facilities. Ann. Work Expo. Health 2022, 66, 163–177. [Google Scholar] [CrossRef] [Scilit]
- Azimi, P.; Fazli, T.; Stephens, B. Predicting Concentrations of Ultrafine Particles and Volatile Organic Compounds Resulting from Desktop 3D Printer Operation and the Impact of Potential Control Strategies. J. Ind. Ecol. 2017, 21, S107–S119. [Google Scholar] [CrossRef] [Scilit]
- Gu, J.; Uhde, E.; Wensing, M.; Xia, F.; Salthammer, T. Emission Control of Desktop 3D Printing: The Effects of a Filter Cover and an Air Purifier. Environ. Sci. Technol. Lett. 2019, 6, 499–503. [Google Scholar] [CrossRef] [Scilit]
- Zontek, T.L.; Scotto, N.; Hollenbeck, S. Controls for University Fabrication Laboratories—Best Practices for Health and Safety. ACS Chem. Health Saf. 2021, 28, 119–128. [Google Scholar] [CrossRef] [Scilit]
- Pavlovska, I.; Martinsone, Z.; Klaviņa, A.; Akūlova, L.; Paegle, L. Emissions from 3D Printers as Occupational Environmental Pollutants. Environ. Clim. Technol. 2021, 25, 1018–1031. [Google Scholar] [CrossRef] [Scilit]
- Dhiman, R.; Prakash, A.; Saroj, S.; Sahoo, P.; Ambekar, A.; Kore, S.D.; Thajudeen, T.; Guttikunda, S.K. Comprehensive Analysis of the Fine and Ultrafine Particulate Emissions from Various Welding Sources in an Industrial Environment. Atmos. Pollut. Res. 2025, 16, 102666. [Google Scholar] [CrossRef] [Scilit]
- Karayannis, P.; Saliakas, S.; Kokkinopoulos, I.; Damilos, S.; Koumoulos, E.P.; Gkartzou, E.; Gomez, J.; Charitidis, C. Facilitating Safe FFF 3D Printing: A Prototype Material Case Study. Sustainability 2022, 14, 3046. [Google Scholar] [CrossRef] [Scilit]
- Romanowski, H.; Bierkandt, F.S.; Luch, A.; Laux, P. Summary and Derived Risk Assessment of 3D Printing Emission Studies. Atmos. Environ. 2023, 294, 119501. [Google Scholar] [CrossRef] [Scilit]
- Hayes, A.C.; Osio-Norgaard, J.; Miller, S.; Whiting, G.L.; Vance, M.E. Air Pollutant Emissions from Multi Jet Fusion, Material-Jetting, and Digital Light Synthesis Commercial 3D Printers in a Service Bureau. Build. Environ. 2021, 202, 108008. [Google Scholar] [CrossRef] [Scilit]
- Felstead, A.; Jewson, N.; Walters, S. Changing Places of Work; Red Globe Press: London, UK, 2003. [Google Scholar]
- Monzón, M.D.; Ortega, Z.; Martínez, A.; Ortega, F. Standardization in Additive Manufacturing: Activities Carried out by International Organizations and Projects. Int. J. Adv. Manuf. Technol. 2015, 76, 1111–1121. [Google Scholar] [CrossRef] [Scilit]
- Tofail, S.A.M.; Koumoulos, E.P.; Bandyopadhyay, A.; Bose, S.; O’Donoghue, L.; Charitidis, C. Additive Manufacturing: Scientific and Technological Challenges, Market Uptake and Opportunities. Mater. Today 2018, 21, 22–37. [Google Scholar] [CrossRef] [Scilit]
- Wu, H.; Fahy, W.P.; Kim, S.; Kim, H.; Zhao, N.; Pilato, L.; Kafi, A.; Bateman, S.; Koo, J.H. Recent Developments in Polymers/Polymer Nanocomposites for Additive Manufacturing. Prog. Mater. Sci. 2020, 111, 100638. [Google Scholar] [CrossRef] [Scilit]
- Gupta, V.; Nesterenko, P.; Paull, B. 3D Printing in Chemical Science: Applications Across Chemistry; Royal Society of Chemistry: Cambridge, UK, 2019. [Google Scholar]
- Pagac, M.; Hajnys, J.; Ma, Q.-P.; Jancar, L.; Jansa, J.; Stefek, P.; Mesicek, J. A Review of Vat Photopolymerization Technology: Materials, Applications, Challenges, and Future Trends of 3D Printing. Polymers 2021, 13, 598. [Google Scholar] [CrossRef] [Scilit]
- Fanger, P.O. What Is IAQ? Indoor Air 2006, 16, 328–334. [Google Scholar] [CrossRef] [Scilit]
- ASHRAE, Standard 62.1. Available online: https://ashrae.iwrapper.com/ASHRAE_PREVIEW_ONLY_STANDARDS/STD_62.1_2022 (accessed on 31 January 2024).
- World Health Organization. Ambient Air Pollution: A Global Assessment of Exposure and Burden of Disease; Inis Communication, Ed.; WHO Document Production Services: Geneva, Switzerland, 2016. [Google Scholar]
- Kamaruzzaman, S.N.; Sabrani, N.A. The Effect of Indoor Air Quality (IAQ) towards Occupants’ Psychological Performance in Office Buildings. J. Des. Built 2011, 4, 49–61. [Google Scholar]
- Bours, J.; Adzima, B.; Gladwin, S.; Cabral, J.; Mau, S. Addressing Hazardous Implications of Additive Manufacturing: Complementing Life Cycle Assessment with a Framework for Evaluating Direct Human Health and Environmental Impacts. J. Ind. Ecol. 2017, 21, S25–S36. [Google Scholar] [CrossRef] [Scilit]
- ASHRAE. ASHRAE Handbook Fundamentals; ASHRAE: Peachtree Corners, GA, USA, 2013. [Google Scholar]
- Aybay, P. PM1: Küçük ama Tehlikeli. Tesisat Mark. 2017, 218, 38–40. [Google Scholar]
- Yu, C. Research of Time Series Air Quality Data Based on Exploratory Data Analysis and Representation. In Proceedings of the 2016 Fifth International Conference on Agro-Geoinformatics (Agro-Geoinformatics); IEEE: New York, NY, USA, 2016; pp. 1–5. [Google Scholar]
- Murashov, V.; Geraci, C.L.; Schulte, P.A.; Howard, J. Nano- and Microplastics in the Workplace. J. Occup. Environ. Hyg. 2021, 18, 489–494. [Google Scholar] [CrossRef] [Scilit]
- World Health Organization. WHO Guidelines for Indoor Air Quality: Selected Pollutants; Theakston, F., Ed.; WHO Regional Office for Europe: Copenhagen, Denmark, 2010. [Google Scholar]
- World Health Organization WHO. Global Air Quality Guidelines. In Particulate Matter (PM2.5 and PM10), Ozone, Nitrogen Dioxide, Sulfur Dioxide, and Carbon Monoxide; World Health Organization: Geneva, Switzerland, 2021. [Google Scholar]
- Wolkoff, P. Volatile Organic Compounds—Sources, Measurements, Emissions, and The Impact on Indoor Air Quality. Indoor Air 1995, 3, 11–16. [Google Scholar] [CrossRef] [Scilit]
- Hansen, D.L. Indoor Air Quality Issues; Taylor & Francis: Oxford, UK, 2010. [Google Scholar]
- Umweltbundesamt. Beurteilung von Innenraumluftkontaminationen Mittels Referenz- Und Richtwerten. Bundesgesundheitsblatt Gesundheitsforschung Gesundheitsschutz 2007, 50, 990–1005. [Google Scholar] [CrossRef] [Scilit]
- Shaham, J.; Bomstein, Y.; Meltzer, A.; Kaufman, Z.; Palma, E.; Ribak, J. DNA-Protein Crosslinks, a Biomarker of Exposure to Formaldehyde—In Vitro and in Vivo Studies. Carcinogenesis 1996, 17, 121–125. [Google Scholar] [CrossRef] [Scilit]
- Myers, G.E. The Effects of Temperature and Humidity on Formaldehyde Emission from UF-Bonded Boards: A Literature Critique. For. Prod. J. 1985, 35, 20–31. [Google Scholar]
- Hines, A.L.; Ghosh, T.K.; Loyalka, S.K.; Warder, R.C. Indoor Air Quality & Control; Prentice Hall: Englewood Cliffs, NJ, USA, 1993. [Google Scholar]
- Jones, A.P. Indoor Air Quality and Health. Atmos. Environ. 1999, 33, 4535–4564. [Google Scholar] [CrossRef] [Scilit]
- World Health Organization. Air Quality Guidelines for Europe, 2nd ed.; World Health Organization: Geneva, Switzerland, 2000. [Google Scholar]
- New Jersey Department of Health. Right to Know Hazardous Substance Fact Sheet: Ethyl Alcohol; revised 2016; New Jersey Department of Health: Trenton, NJ, USA, 2011; pp. 1–6. Available online: https://www.nj.gov/health/eoh/rtkweb/documents/fs/0844.pdf (accessed on 23 August 2026).
- Occupational Safety and Health Administration. Ethyl Alcohol (Ethanol). Available online: https://www.osha.gov/chemicaldata/1034 (accessed on 22 May 2024).
- Volk, T. CO2 Rising: The World’s Greatest Environmental Challenge; MIT Press: Cambridge, MA, USA, 2010. [Google Scholar]
- López, L.R.; Dessì, P.; Cabrera-Codony, A.; Rocha-Melogno, L.; Kraakman, B.; Naddeo, V.; Balaguer, M.D.; Puig, S. CO2 in Indoor Environments: From Environmental and Health Risk to Potential Renewable Carbon Source. Sci. Total Environ. 2023, 856, 159088. [Google Scholar] [CrossRef] [Scilit]
- Beisser, R.; Buxtrup, M.; Fendler, D.; Hohenberger, L.; Kazda, V.; von Mering, Y.; Niemann, H.; Pitzke, K.; Weiss, R. Inhalative Exposition Gegenüber Metallen Bei Additiven Verfahren (3D-Druck). Gefahrstoffe—Reinhalt. Der Luft 2017, 77, 487–496. [Google Scholar]
- Graff, P.; Ståhlbom, B.; Nordenberg, E.; Graichen, A.; Johansson, P.; Karlsson, H. Evaluating Measuring Techniques for Occupational Exposure during Additive Manufacturing of Metals: A Pilot Study. J. Ind. Ecol. 2017, 21, S120–S129. [Google Scholar] [CrossRef] [Scilit]
- Gomes, J.F.; Miranda, R.M.; Oliveira, J.P.; Esteves, H.M.; Albuquerque, P.C. Evaluation of the Amount of Nanoparticles Emitted in LASER Additive Manufacture/Welding. Inhal. Toxicol. 2019, 31, 125–130. [Google Scholar] [CrossRef] [Scilit]
- Kolb, T.; Schmidt, P.; Beisser, R.; Tremel, J.; Schmidt, M. Safety in Additive Manufacturing: Fine Dust Measurements for a Process Chain in Laser Beam Melting of Metals. RTe J. 2017, 14. [Google Scholar]
- Philippot, C.; L’allain, C.; Artous, S.; Locatelli, D.; Jacquinot, S.; Derrough, S.; Mougenel, P.; Gallet, Y. Potential Workers Exposure to Ultrafine Particles in Metal Additive Manufacturing. In Proceedings of the 6th International Conference on Health and Safety Issues Related to Nanomaterials for a Socially Responsible Approach; Platform Nano Safety: Grenoble, France, 2018. [Google Scholar]
- Pernetti, R.; Maffia, S.; Previtali, B.; Oddone, E. Assessment of Nanoparticle Emission in Additive Manufacturing: Comparing Wire and Powder Laser Metal Deposition Processes. J. Occup. Environ. Hyg. 2023, 20, 329–335. [Google Scholar] [CrossRef] [Scilit]
- Ding, S.; Ng, B.F. Particle Emission Levels in the User Operating Environment of Powder, Ink and Filament-Based 3D Printers. Rapid Prototyp. J. 2021, 27, 1124–1132. [Google Scholar] [CrossRef] [Scilit]
- Zisook, R.E.; Simmons, B.D.; Vater, M.; Perez, A.; Donovan, E.P.; Paustenbach, D.J.; Cyrs, W.D. Emissions Associated with Operations of Four Different Additive Manufacturing or 3D Printing Technologies. J. Occup. Environ. Hyg. 2020, 17, 464–479. [Google Scholar] [CrossRef] [Scilit]
- Kühnel, D.; Steska, T.; Schlich, K.; Wolf, C.; Wohlleben, W.; Hund-Rinke, K. Polymers of Low Concern? Assessment of Microplastic Particles Used in 3D Printing Regarding Their Toxicity on Raphidocelis subcapitata and Daphnia magna. Microplastics Nanoplastics 2023, 3, 29. [Google Scholar] [CrossRef] [Scilit]
- Mellin, P.; Jönsson, C.; Åkermo, M.; Fernberg, P.; Nordenberg, E.; Brodin, H.; Strondl, A. Nano-Sized by-Products from Metal 3D Printing, Composite Manufacturing and Fabric Production. J. Clean. Prod. 2016, 139, 1224–1233. [Google Scholar] [CrossRef] [Scilit]
- Sutton, A.T.; Kriewall, C.S.; Karnati, S.; Leu, M.C.; Newkirk, J.W. Characterization of AISI 304L Stainless Steel Powder Recycled in the Laser Powder-Bed Fusion Process. Addit. Manuf. 2020, 32, 100981. [Google Scholar] [CrossRef] [Scilit]
- Väisänen, A.; Alonen, L.; Ylönen, S.; Hyttinen, M. Organic Compound and Particle Emissions of Additive Manufacturing with Photopolymer Resins and Chemical Outgassing of Manufactured Resin Products. J. Toxicol. Environ. Health A 2022, 85, 198–216. [Google Scholar] [CrossRef] [Scilit]
- Sittichompoo, S.; Kanagalingam, S.; Thomas-Seale, L.E.J.; Tsolakis, A.; Herreros, J.M. Characterization of Particle Emission from Thermoplastic Additive Manufacturing. Atmos. Environ. 2020, 239, 117765. [Google Scholar] [CrossRef] [Scilit]
- Khaki, S.; Rio, M.; Marin, P. Characterization of Emissions in Fab Labs: An Additive Manufacturing Environment Issue. Sustainability 2022, 14, 2900. [Google Scholar] [CrossRef] [Scilit]
- Bravi, L.; Murmura, F.; Santos, G. Additive Manufacturing: Possible Problems with Indoor Air Quality. Procedia Manuf. 2019, 41, 952–959. [Google Scholar] [CrossRef] [Scilit]
- Walter, J.; Baumgärtel, A.; Hustedt, M.; Hebisch, R.; Kaierle, S. Inhalation Exposure to Hazardous Substances during Powder-Bed Processes. Procedia CIRP 2018, 74, 295–299. [Google Scholar] [CrossRef] [Scilit]
- Damanhuri, A.A.M.; Subki, A.S.A.; Hariri, A.; Tee, B.T.; Fauadi, M.H.F.M.; Hussin, M.S.F.; Mustafa, M.S.S. Comparative Study of Selected Indoor Concentration from Selective Laser Sintering Process Using Virgin and Recycled Polyamide Nylon (PA12). IOP Conf. Ser. Earth Environ. Sci. 2019, 373, 012014. [Google Scholar] [CrossRef] [Scilit]
- Damanhuri, A.A.M.; Hariri, A.; Alkahari, M.R.; Md Fauadi, M.H.F.; Zainal Bakri, S.F. Indoor Air Concentration from Selective Laser Sintering 3D Printer Using Virgin Polyamide Nylon (PA12) Powder: A Pilot Study. Int. J. Integr. Eng. 2019, 11, 140–149. [Google Scholar] [CrossRef] [Scilit]
- Ljunggren, S.A.; Karlsson, H.; Ståhlbom, B.; Krapi, B.; Fornander, L.; Karlsson, L.E.; Bergström, B.; Nordenberg, E.; Ervik, T.K.; Graff, P. Biomonitoring of Metal Exposure During Additive Manufacturing (3D Printing). Saf. Health Work 2019, 10, 518–526. [Google Scholar] [CrossRef] [Scilit]
- du Preez, S.; de Beer, D.J.; du Plessis, J.L. Titanium Powders Used in Powder Bed Fusion: Their Relevance to Respiratory Health. S. Afr. J. Ind. Eng. 2018, 29, 94–102. [Google Scholar] [CrossRef] [Scilit]
- Jensen, A.C.Ø.; Harboe, H.; Brostrøm, A.; Jensen, K.A.; Fonseca, A.S. Nanoparticle Exposure and Workplace Measurements During Processes Related to 3D Printing of a Metal Object. Front. Public Health 2020, 8, 608718. [Google Scholar] [CrossRef] [Scilit]
- du Plessis, J.; du Preez, S.; Stefaniak, A.B. Identification of Effective Control Technologies for Additive Manufacturing. J. Toxicol. Environ. Health Part B 2022, 25, 211–249. [Google Scholar] [CrossRef] [Scilit]
- Freiser, M.E.; Ghodadra, A.; Hart, L.; Griffith, C.; Jabbour, N. Safety of Drilling 3-Dimensional–Printed Temporal Bones. JAMA Otolaryngol.–Head Neck Surg. 2018, 144, 797. [Google Scholar] [CrossRef] [Scilit]
- Bowers, L.N.; Stefaniak, A.B.; Knepp, A.K.; LeBouf, R.F.; Martin, S.B.; Ranpara, A.C.; Burns, D.A.; Virji, M.A. Potential for Exposure to Particles and Gases throughout Vat Photopolymerization Additive Manufacturing Processes. Buildings 2022, 12, 1222. [Google Scholar] [CrossRef] [Scilit]
- Yang, Y.; Li, L. Total Volatile Organic Compound Emission Evaluation and Control for Stereolithography Additive Manufacturing Process. J. Clean. Prod. 2018, 170, 1268–1278. [Google Scholar] [CrossRef] [Scilit]
- Väisänen, A.J.K.; Hyttinen, M.; Ylönen, S.; Alonen, L. Occupational Exposure to Gaseous and Particulate Contaminants Originating from Additive Manufacturing of Liquid, Powdered, and Filament Plastic Materials and Related Post-Processes. J. Occup. Environ. Hyg. 2019, 16, 258–271. [Google Scholar] [CrossRef] [Scilit]
- Khaki, S.; Rio, M.; Marin, P. Monitoring Indoor Air Quality in Additive Manufacturing Environment. Procedia CIRP 2020, 90, 455–460. [Google Scholar] [CrossRef] [Scilit]
- Valino, A.; Chua, A. Controlling Indoor Air Quality in an Additive Manufacturing Laboratory Using Arduino-Based Monitoring. In Proceedings of the 2025 10th International Conference on Control and Robotics Engineering (ICCRE); IEEE: New York, NY, USA, 2025; pp. 241–244. [Google Scholar]
- MacCuspie, R.I.; Hill, W.C.; Hall, D.R.; Korchevskiy, A.; Strode, C.D.; Kennedy, A.J.; Ballentine, M.L.; Rycroft, T.; Hull, M.S. Prevention through Design: Insights from Computational Fluid Dynamics Modeling to Predict Exposure to Ultrafine Particles from 3D Printing. J. Toxicol. Environ. Health Part A 2021, 84, 458–474. [Google Scholar] [CrossRef] [Scilit]
- Spelce, D.; McKay, R.T.; Johnson, J.S.; Rehak, T.R.; Metzler, R.W. Respiratory Protection for Oxygen Deficient Atmospheres. J. Int. Soc. Respir. Prot. 2016, 33, 2016. [Google Scholar] [CrossRef] [Scilit]
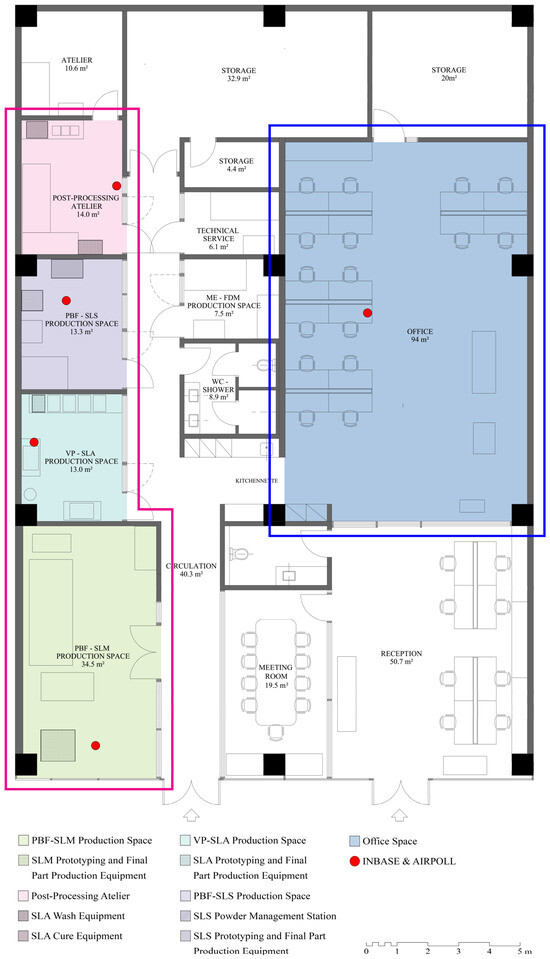
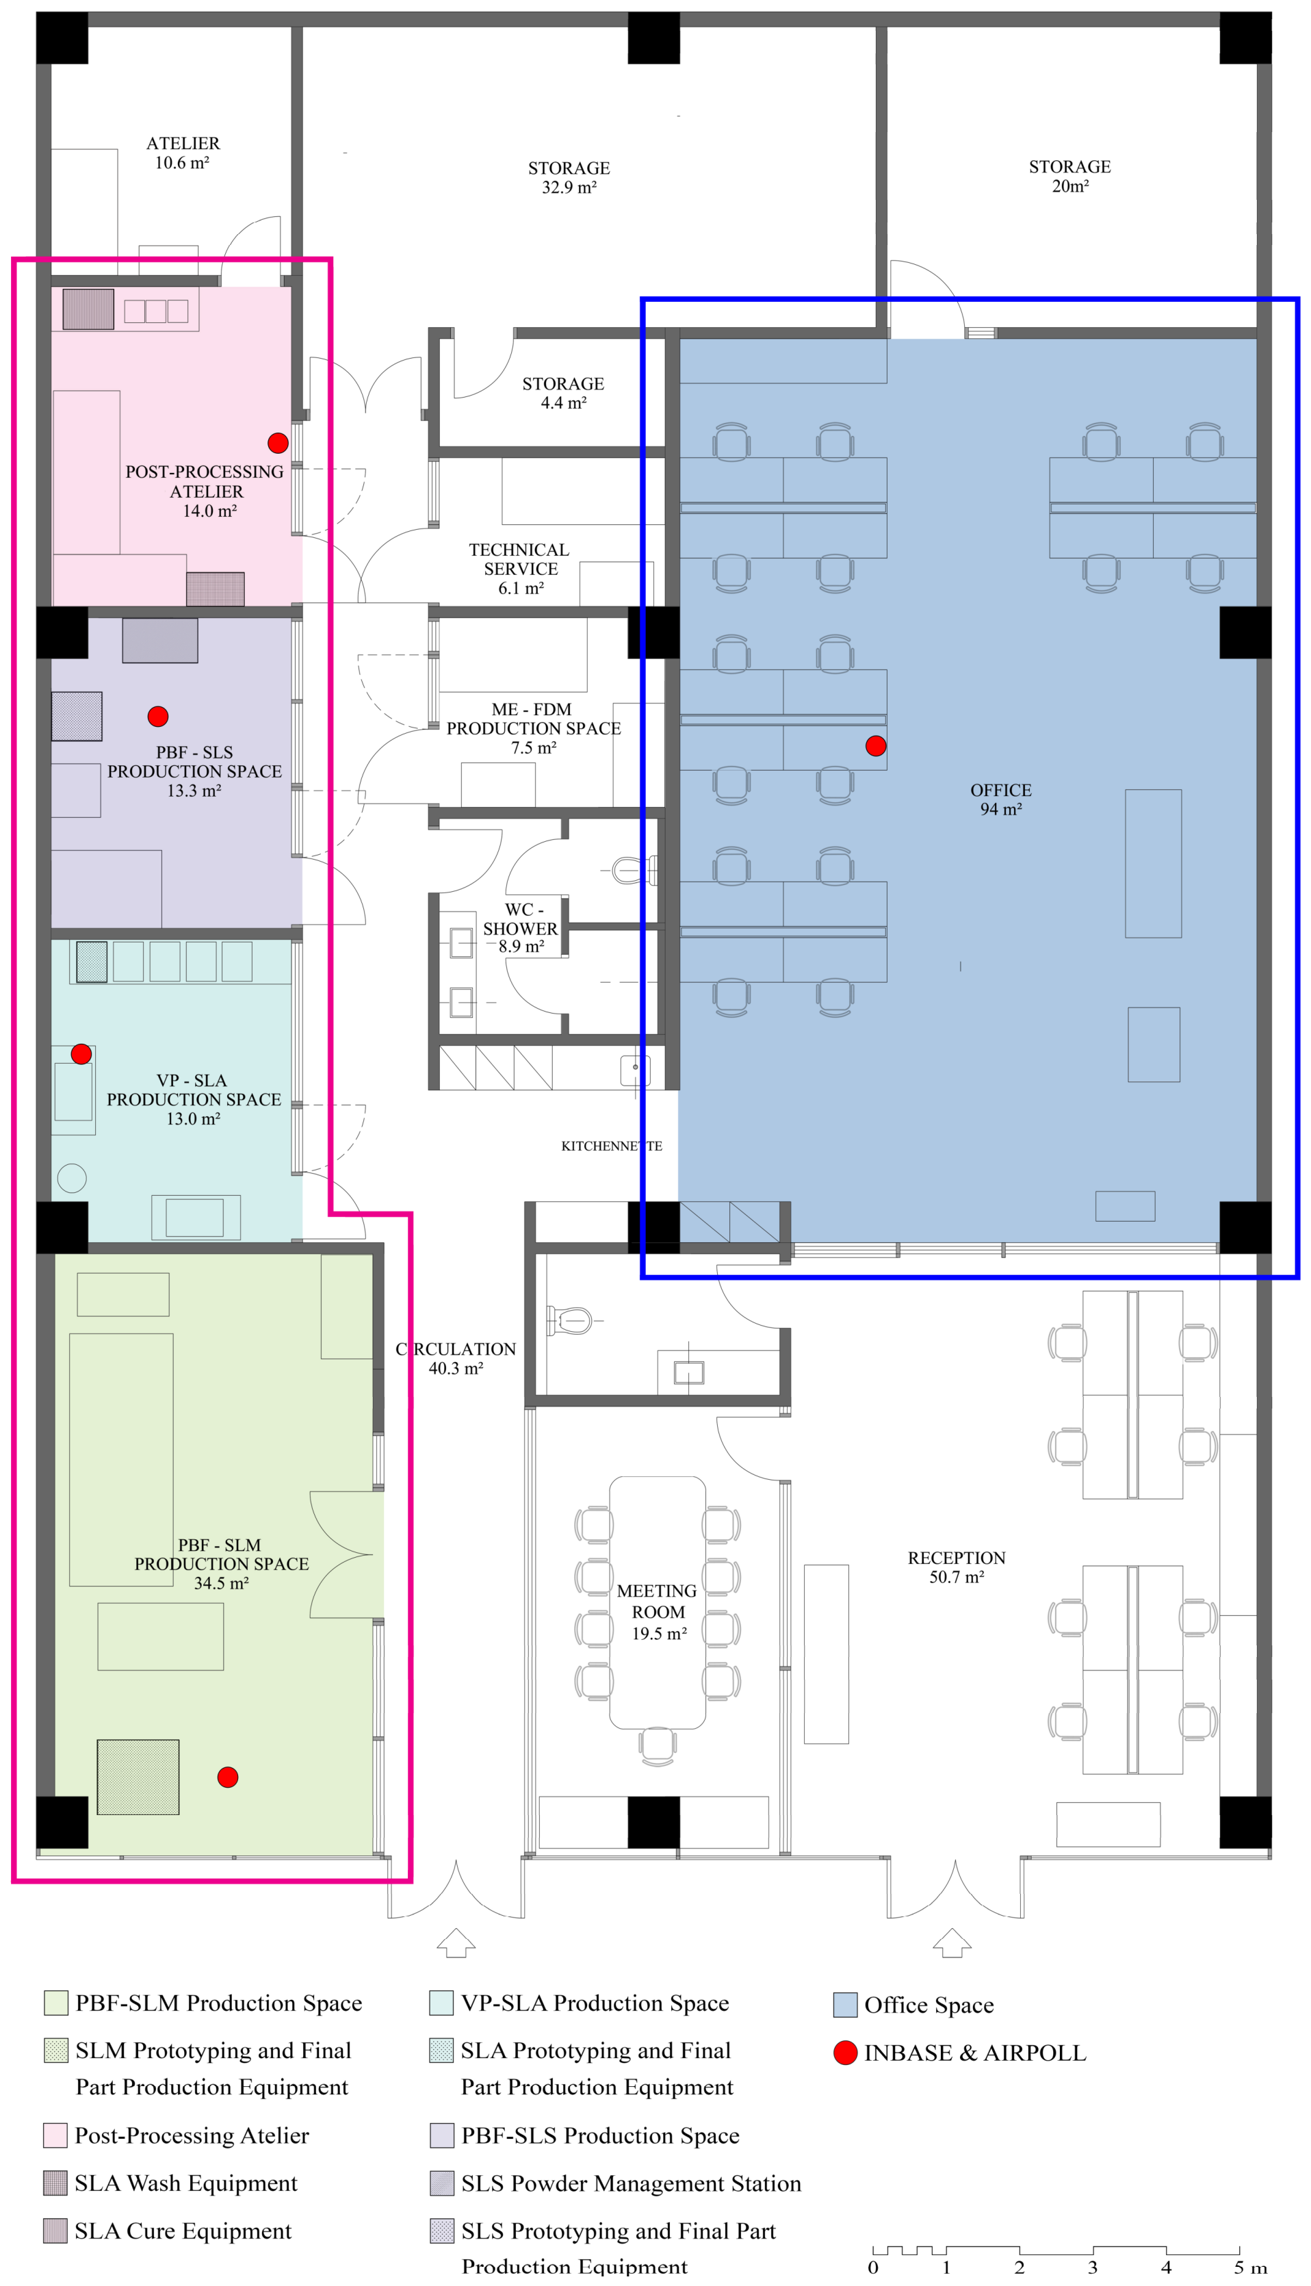
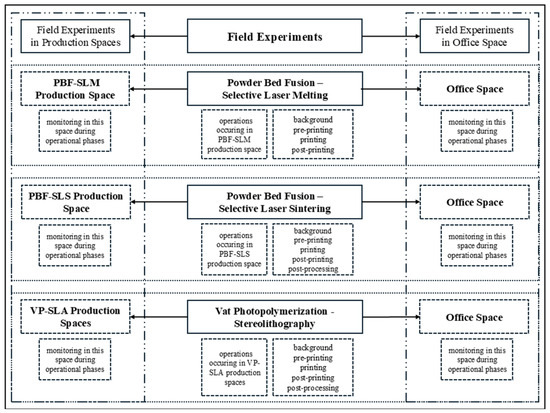
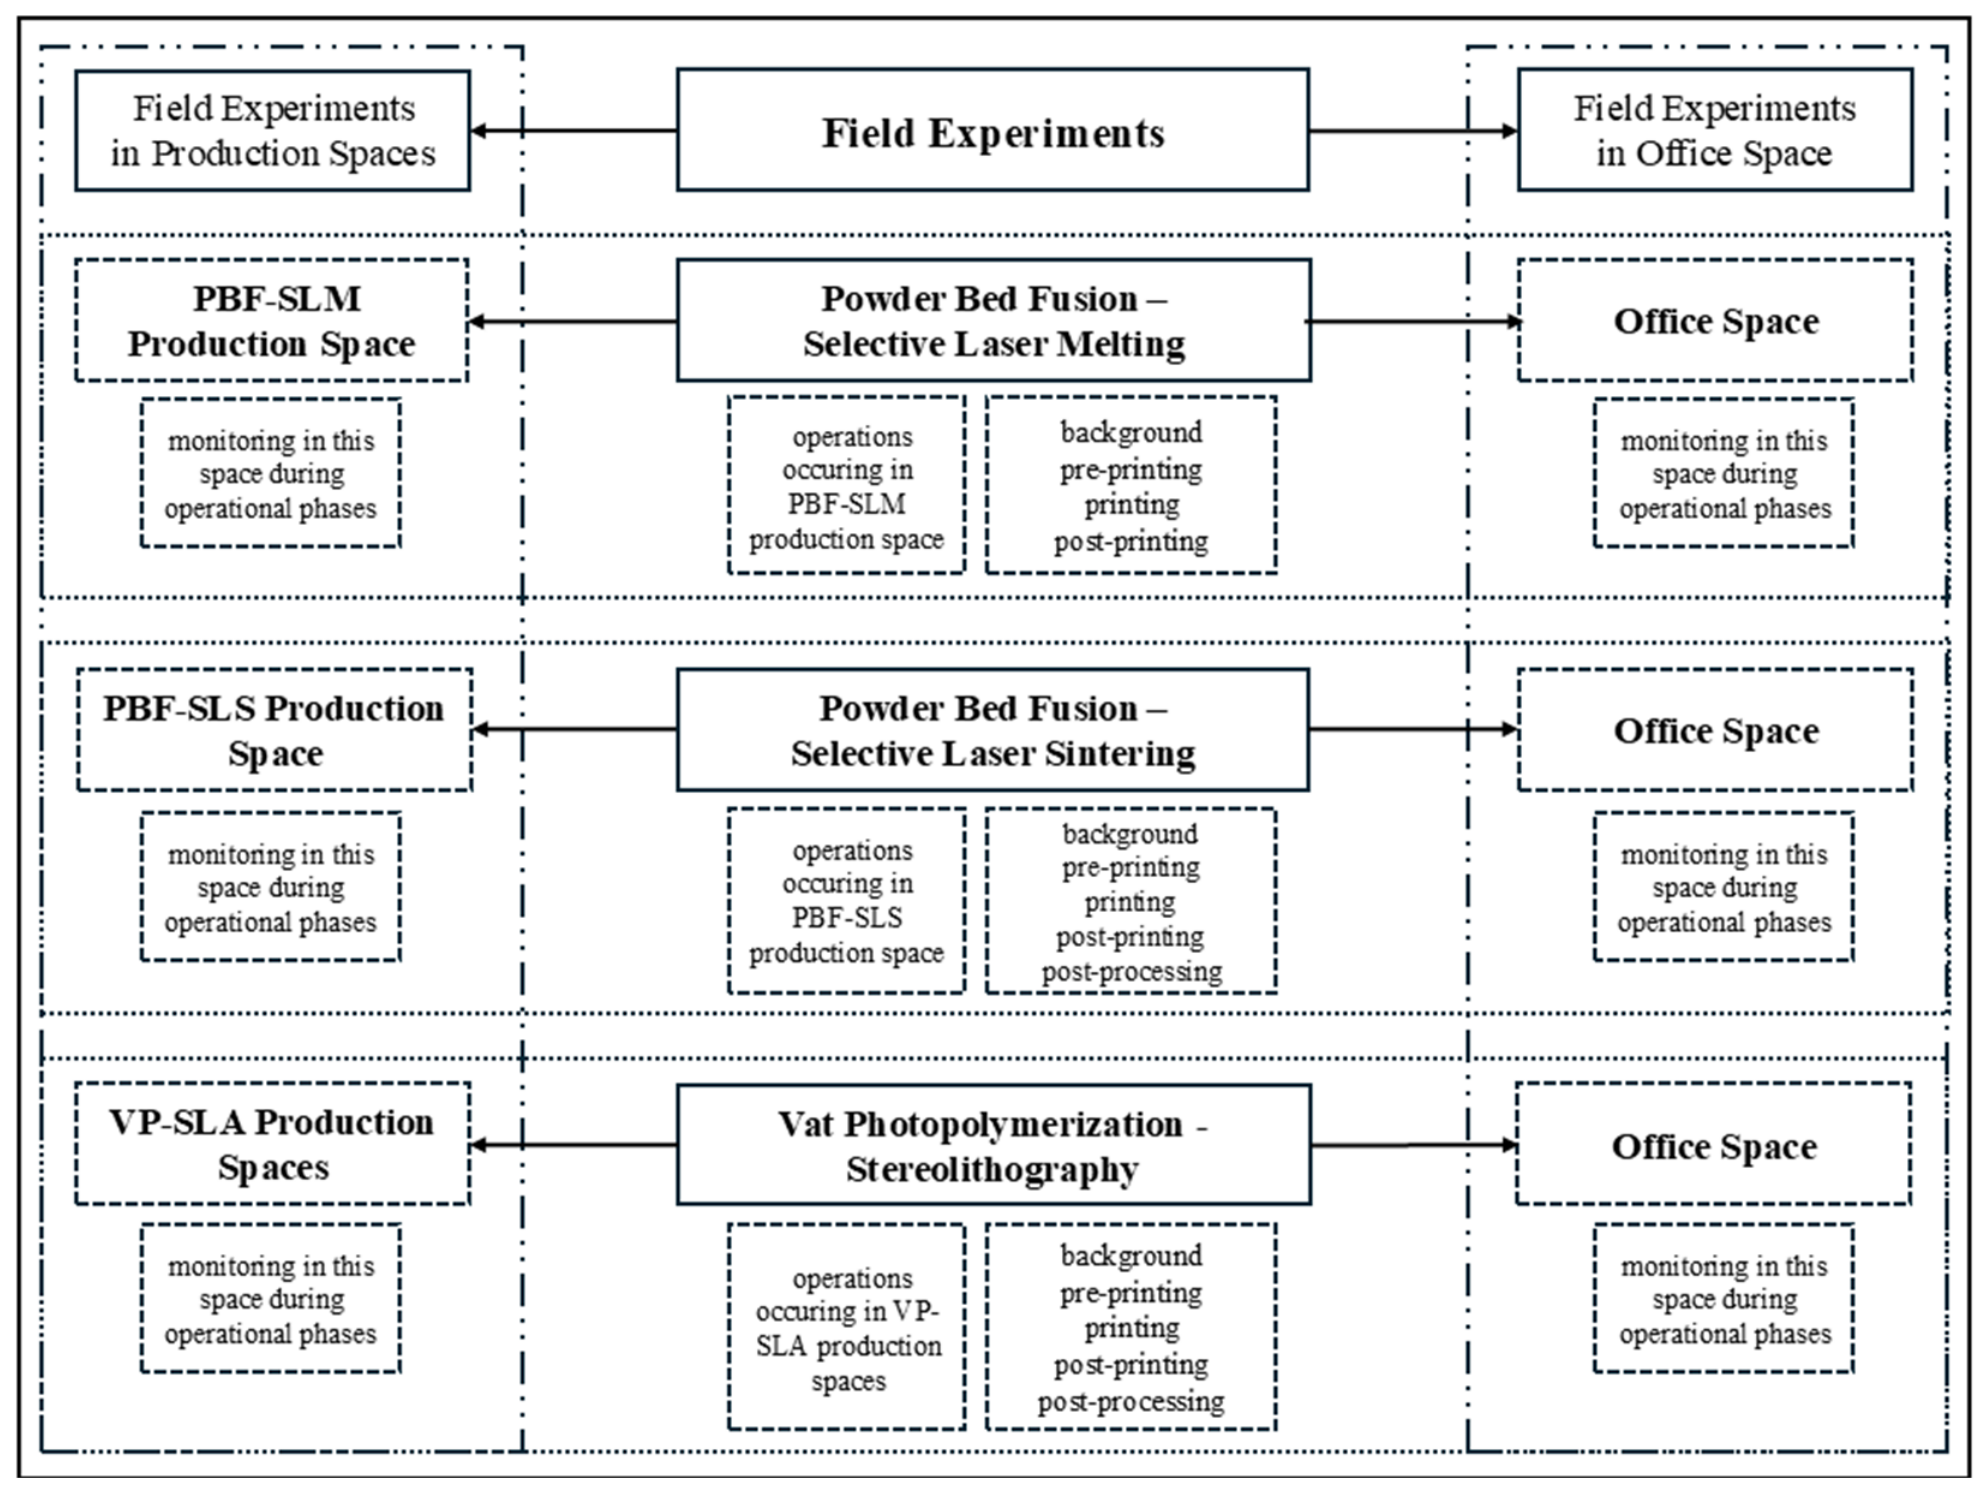
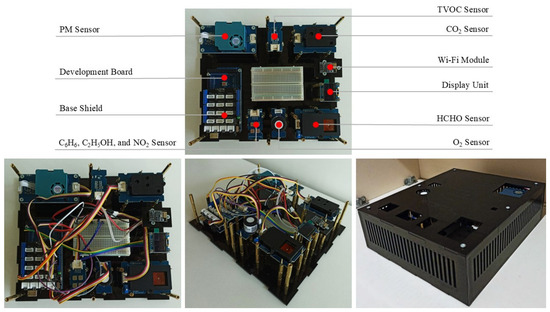
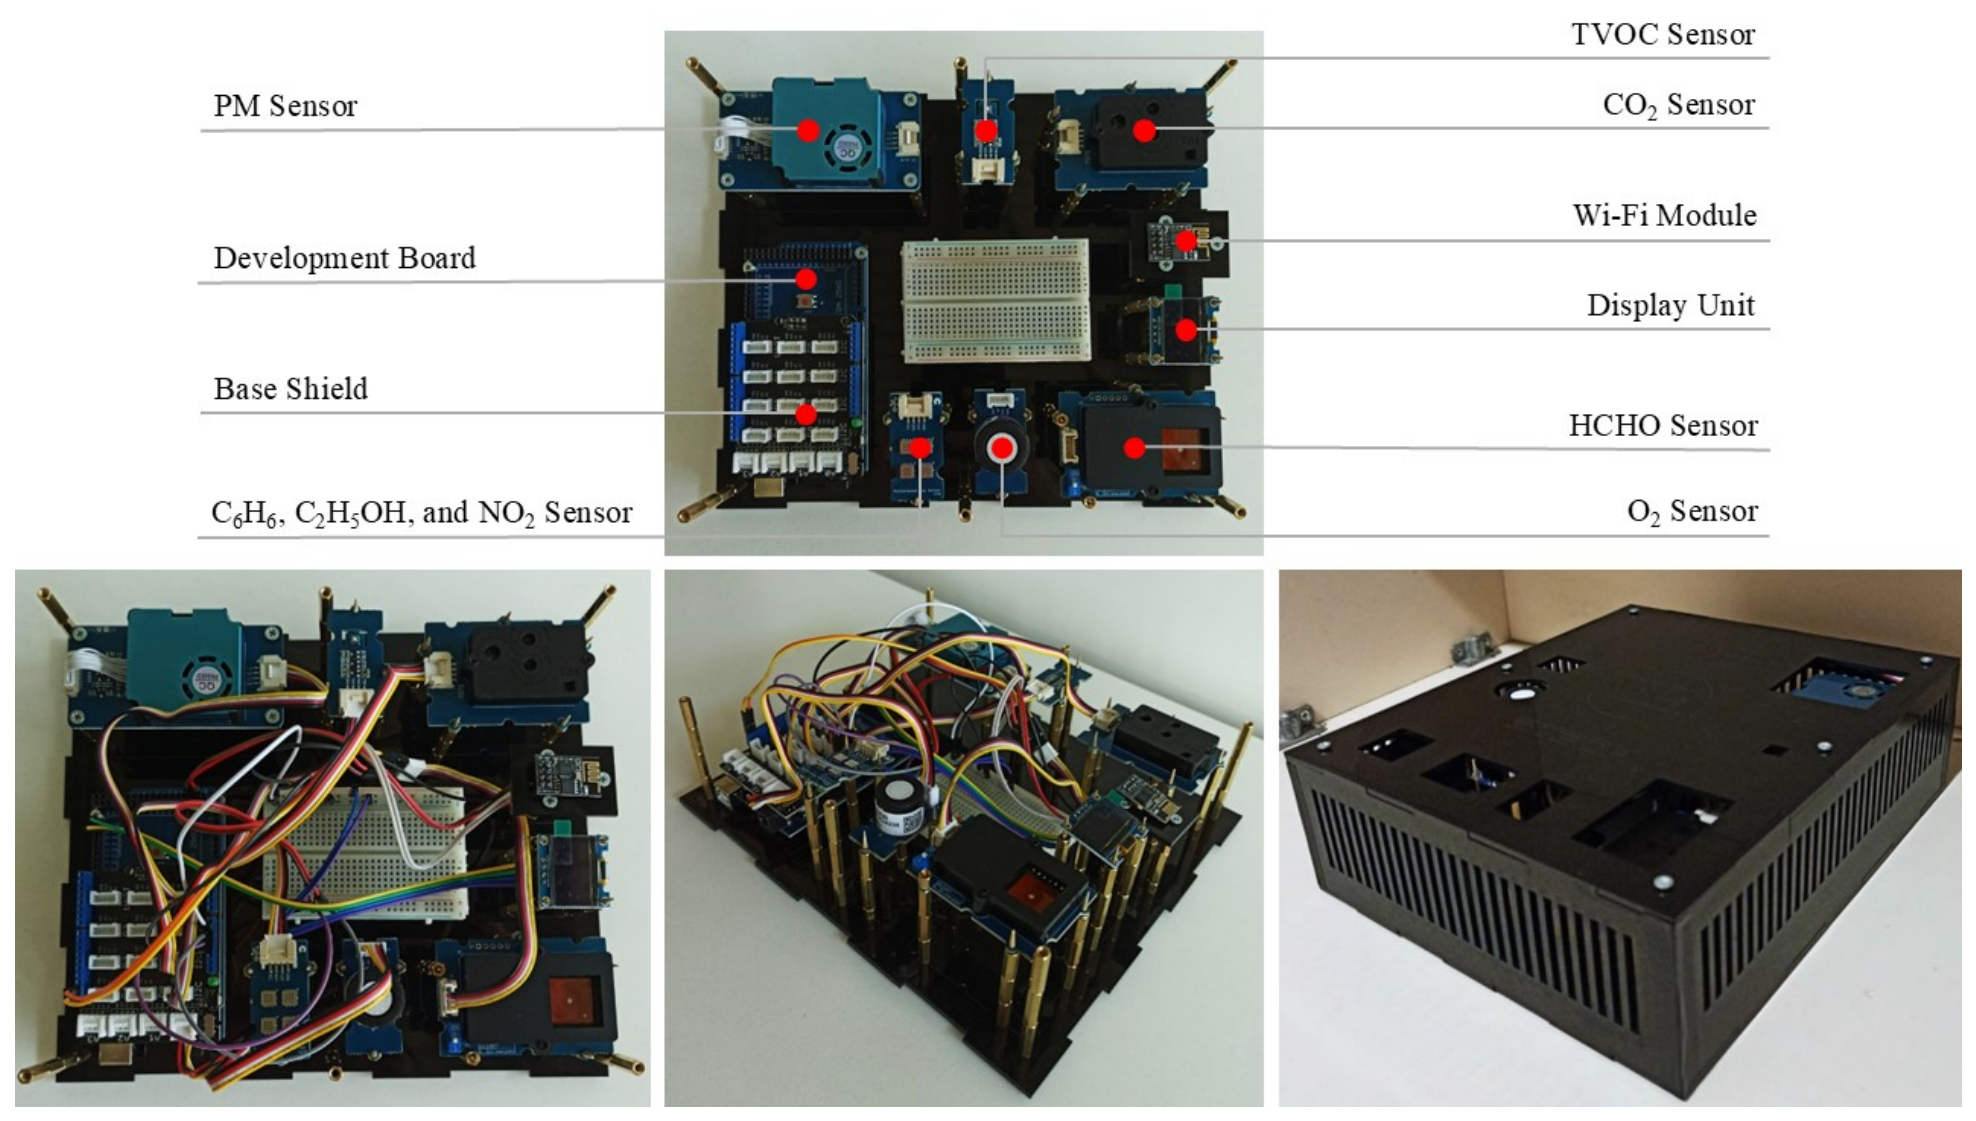
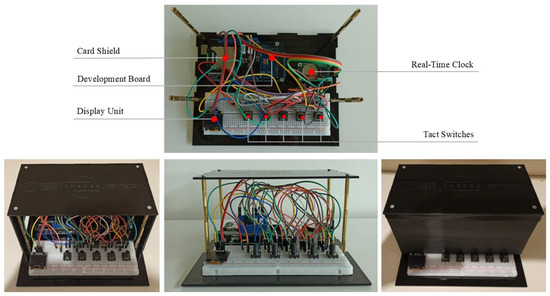
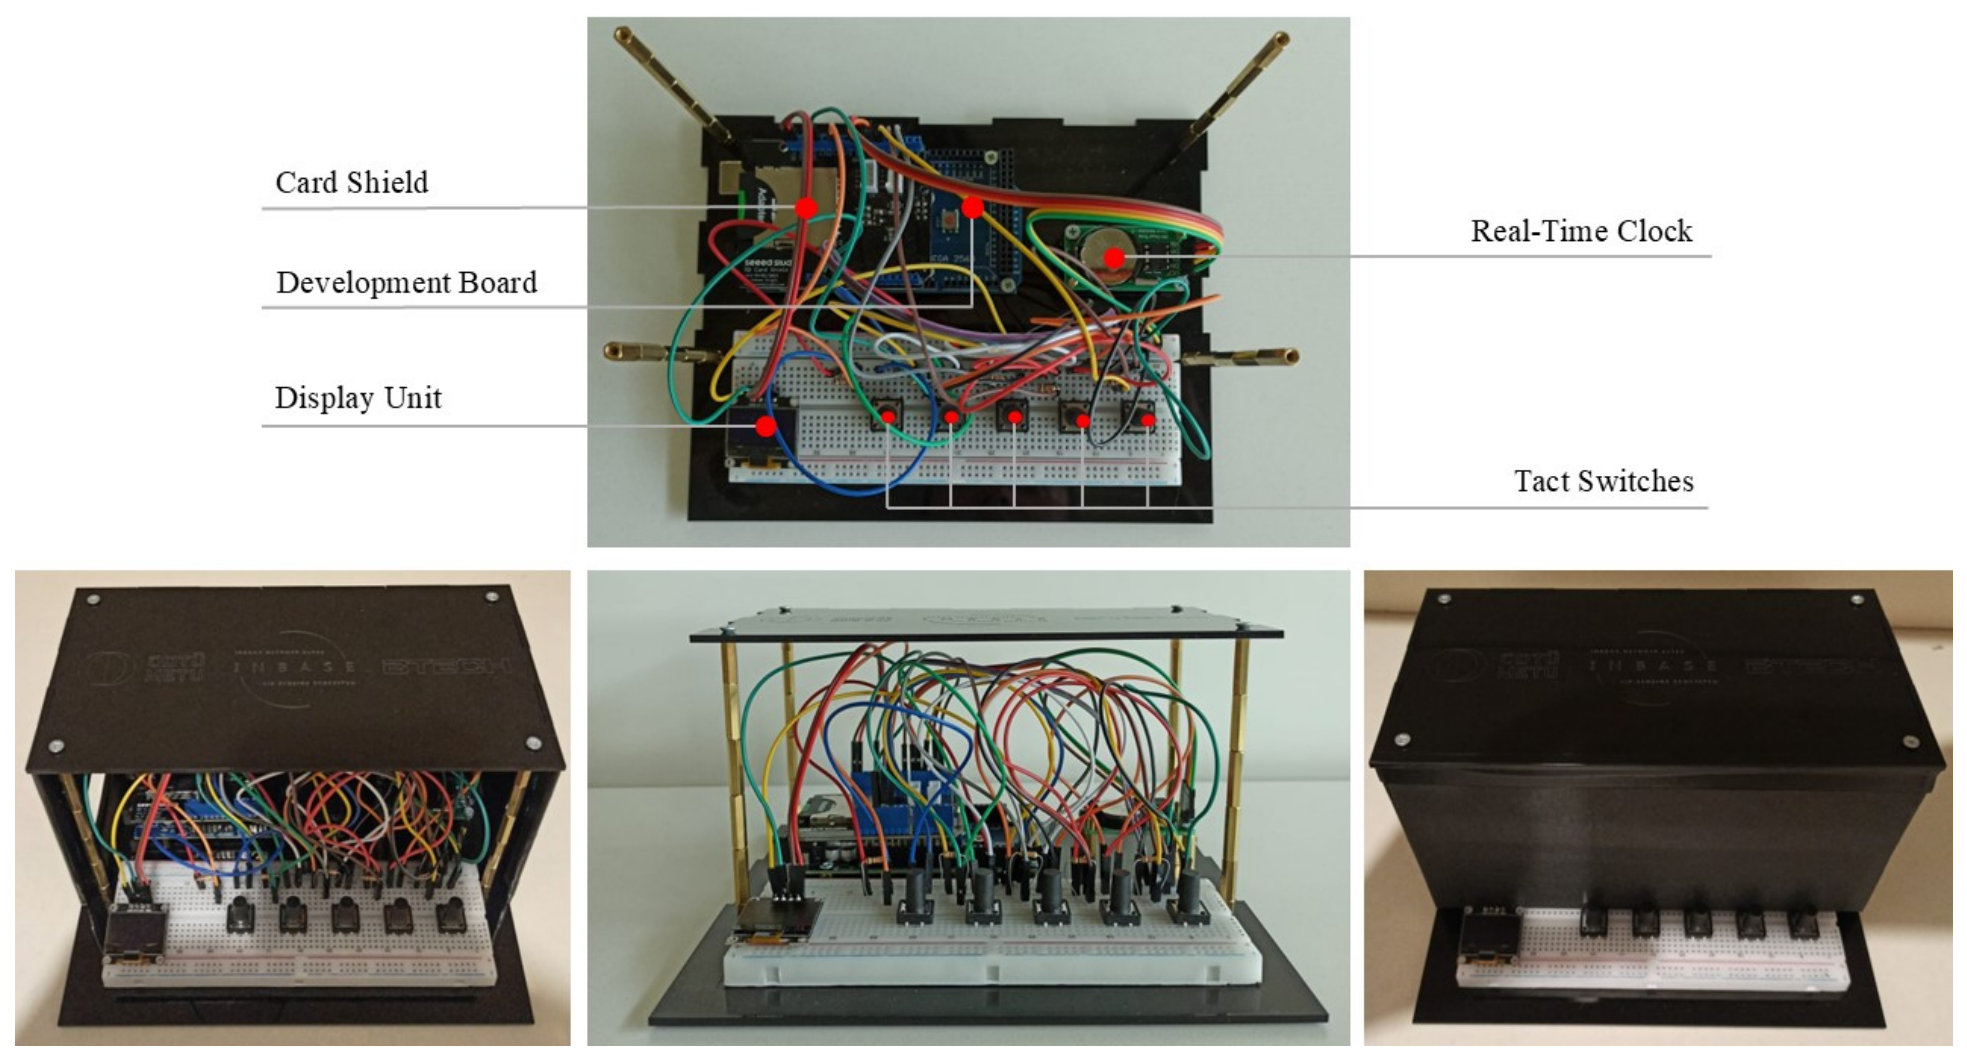
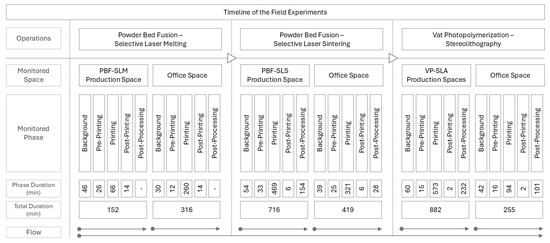
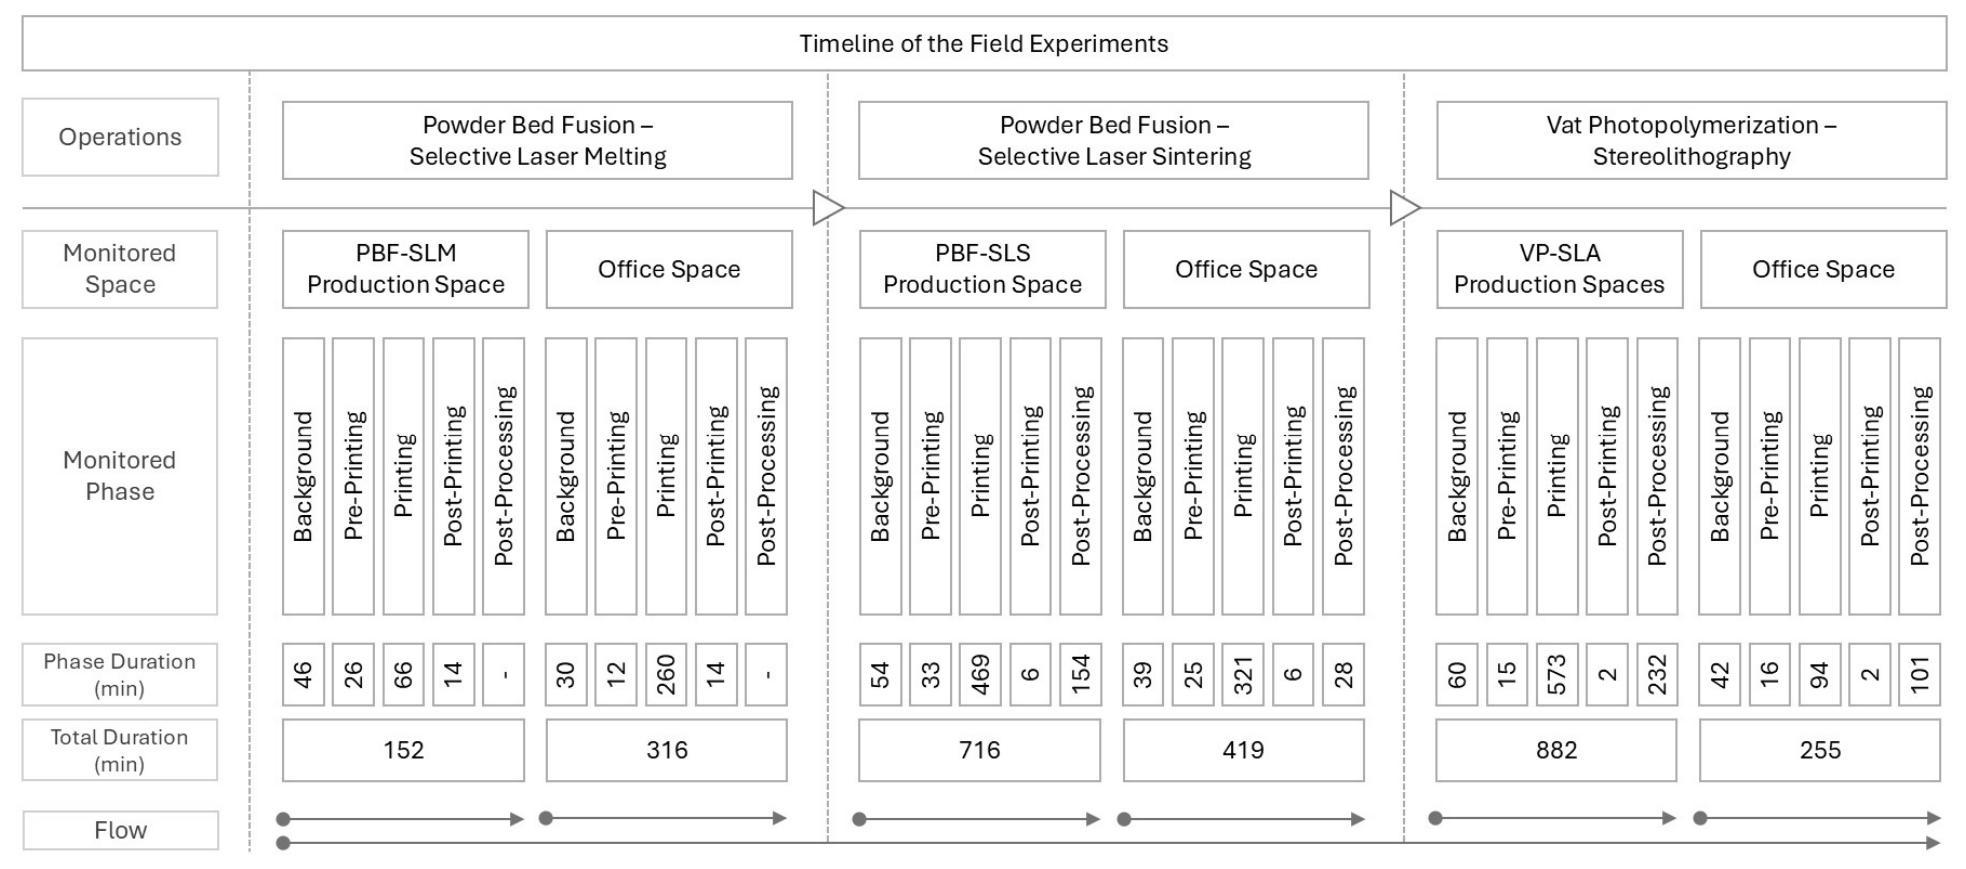
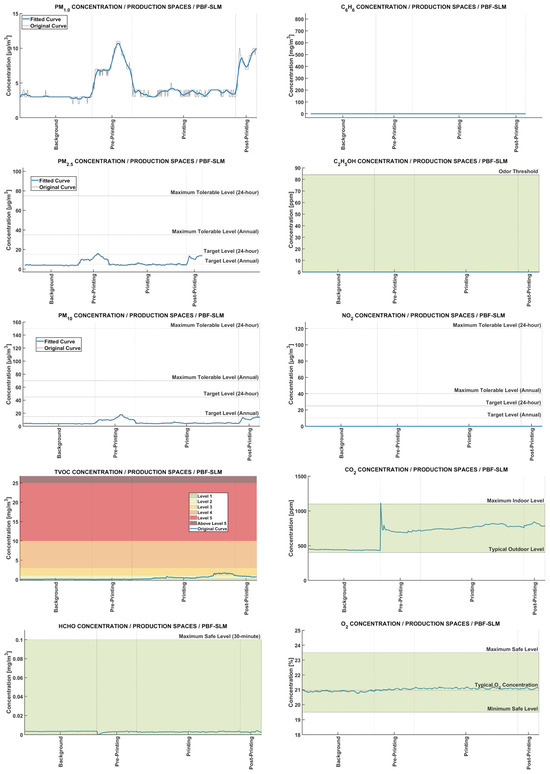
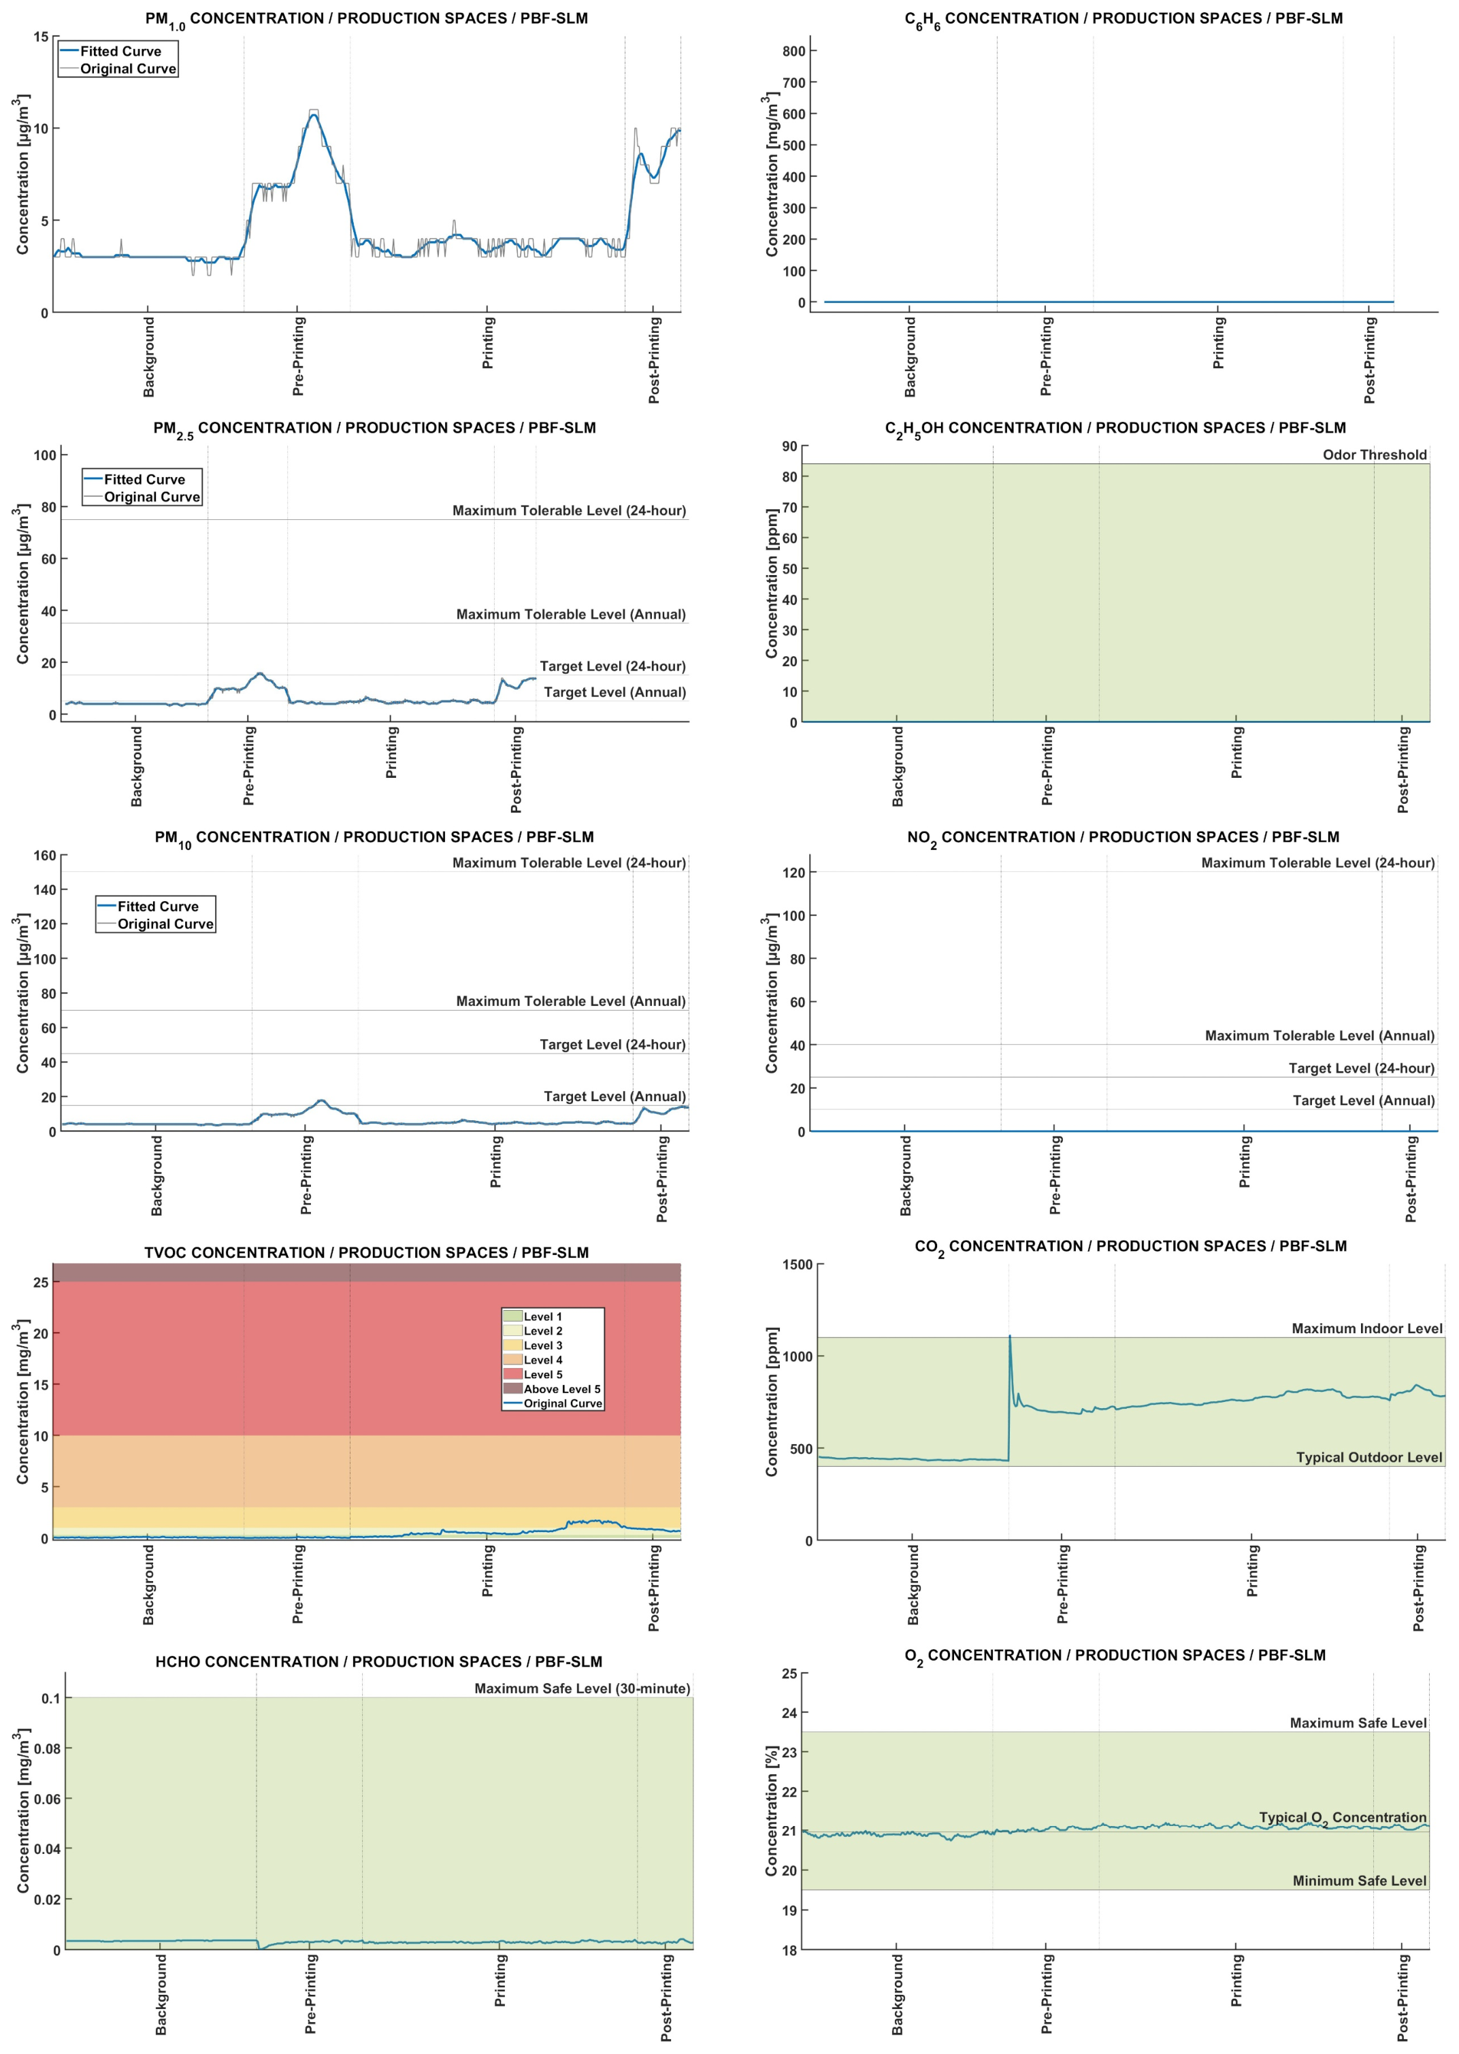
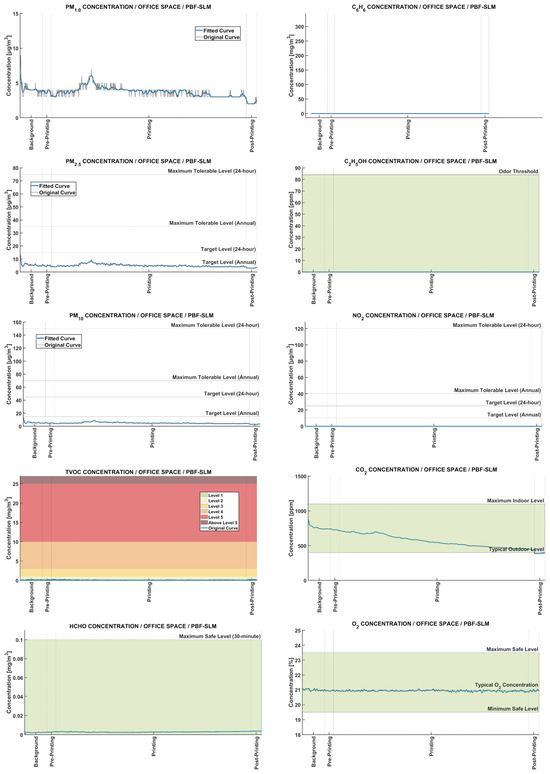
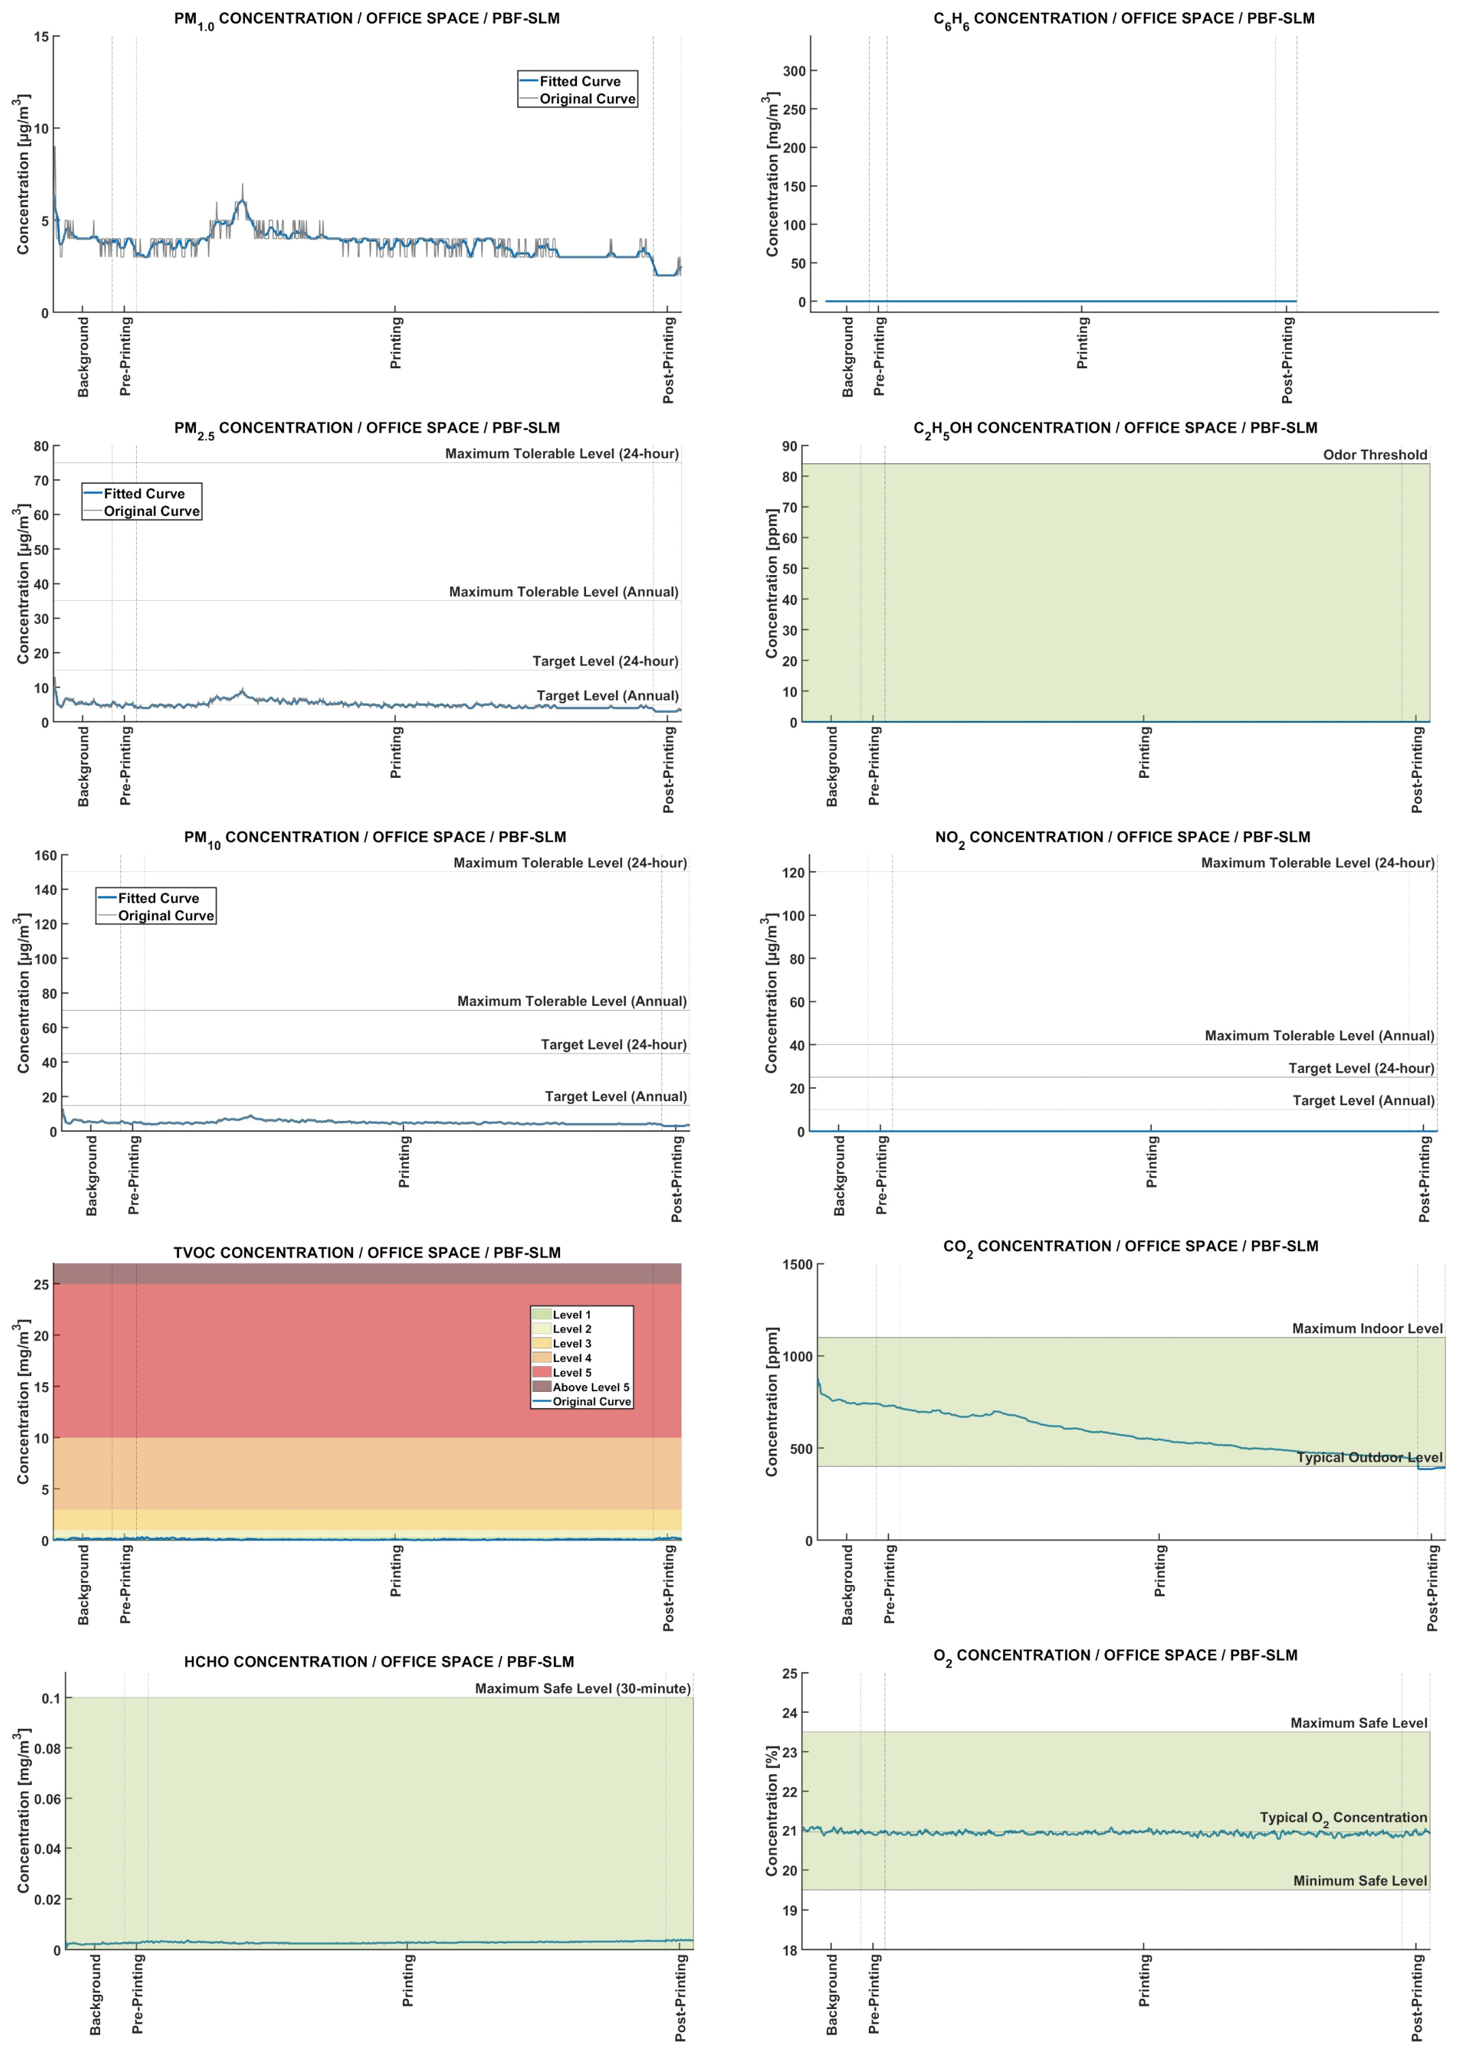
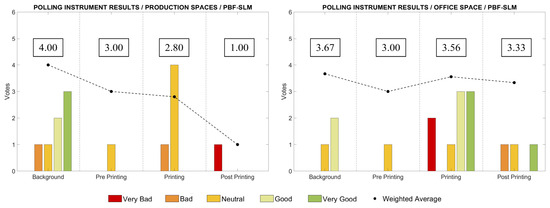
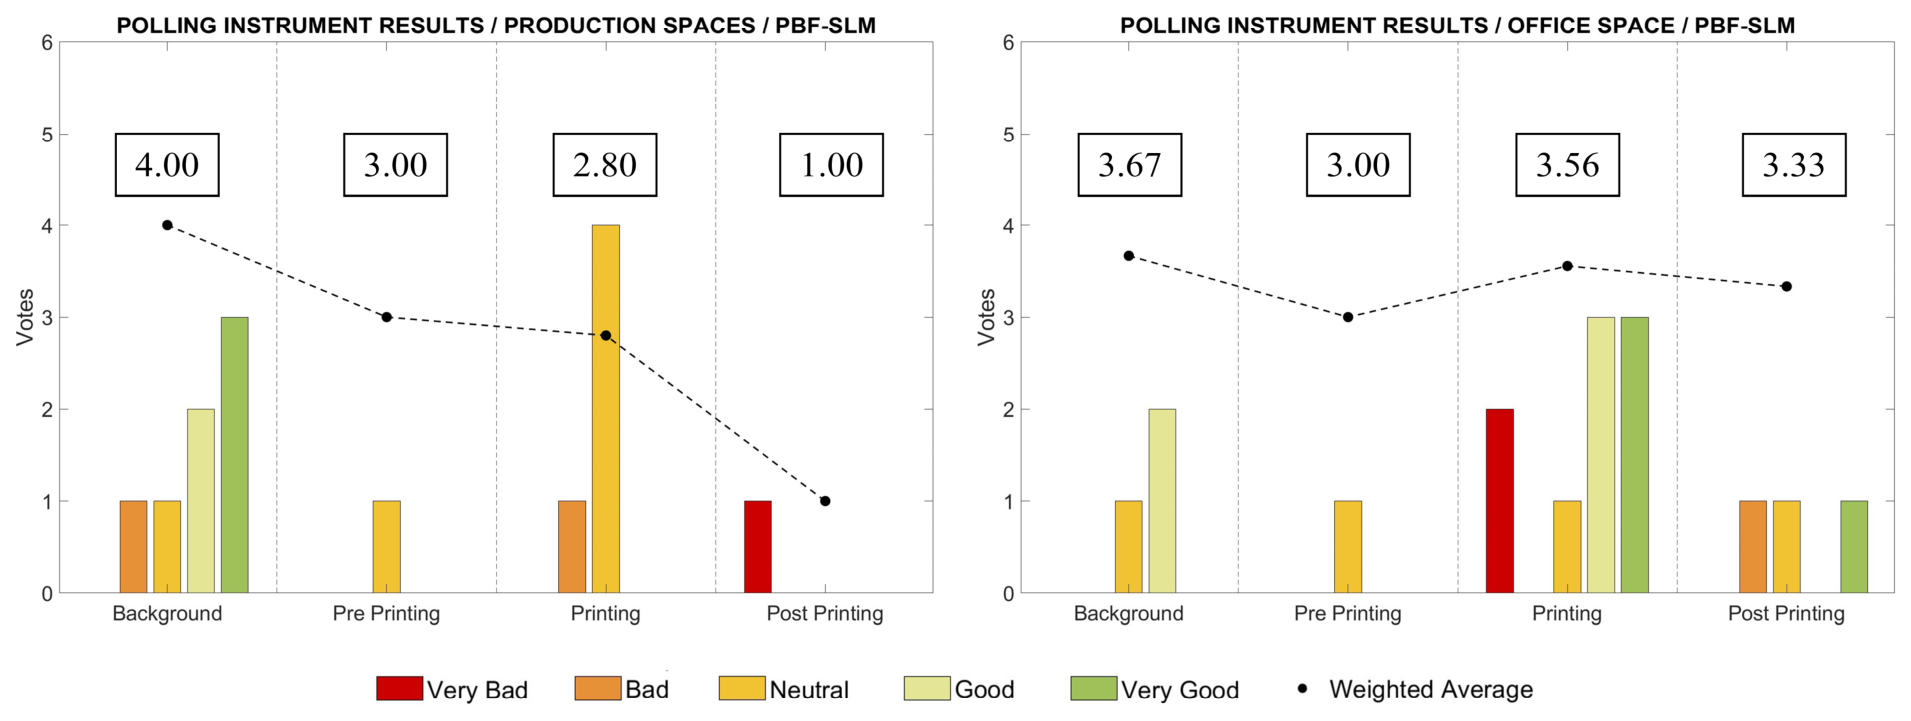
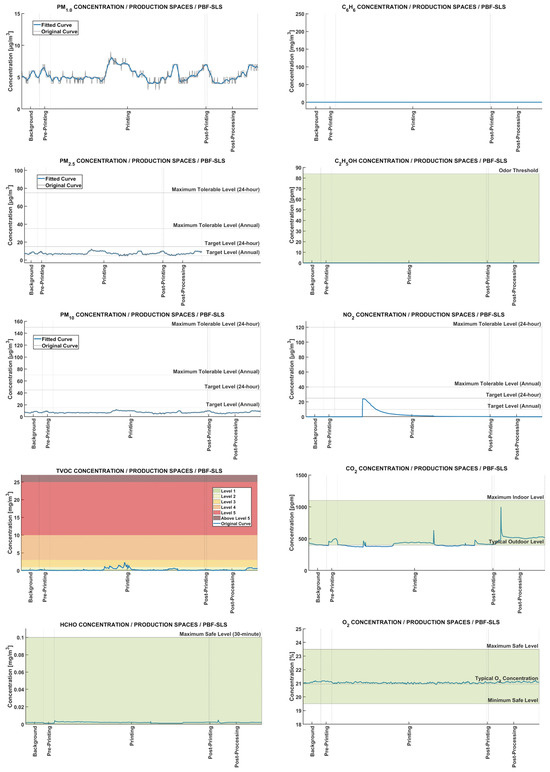
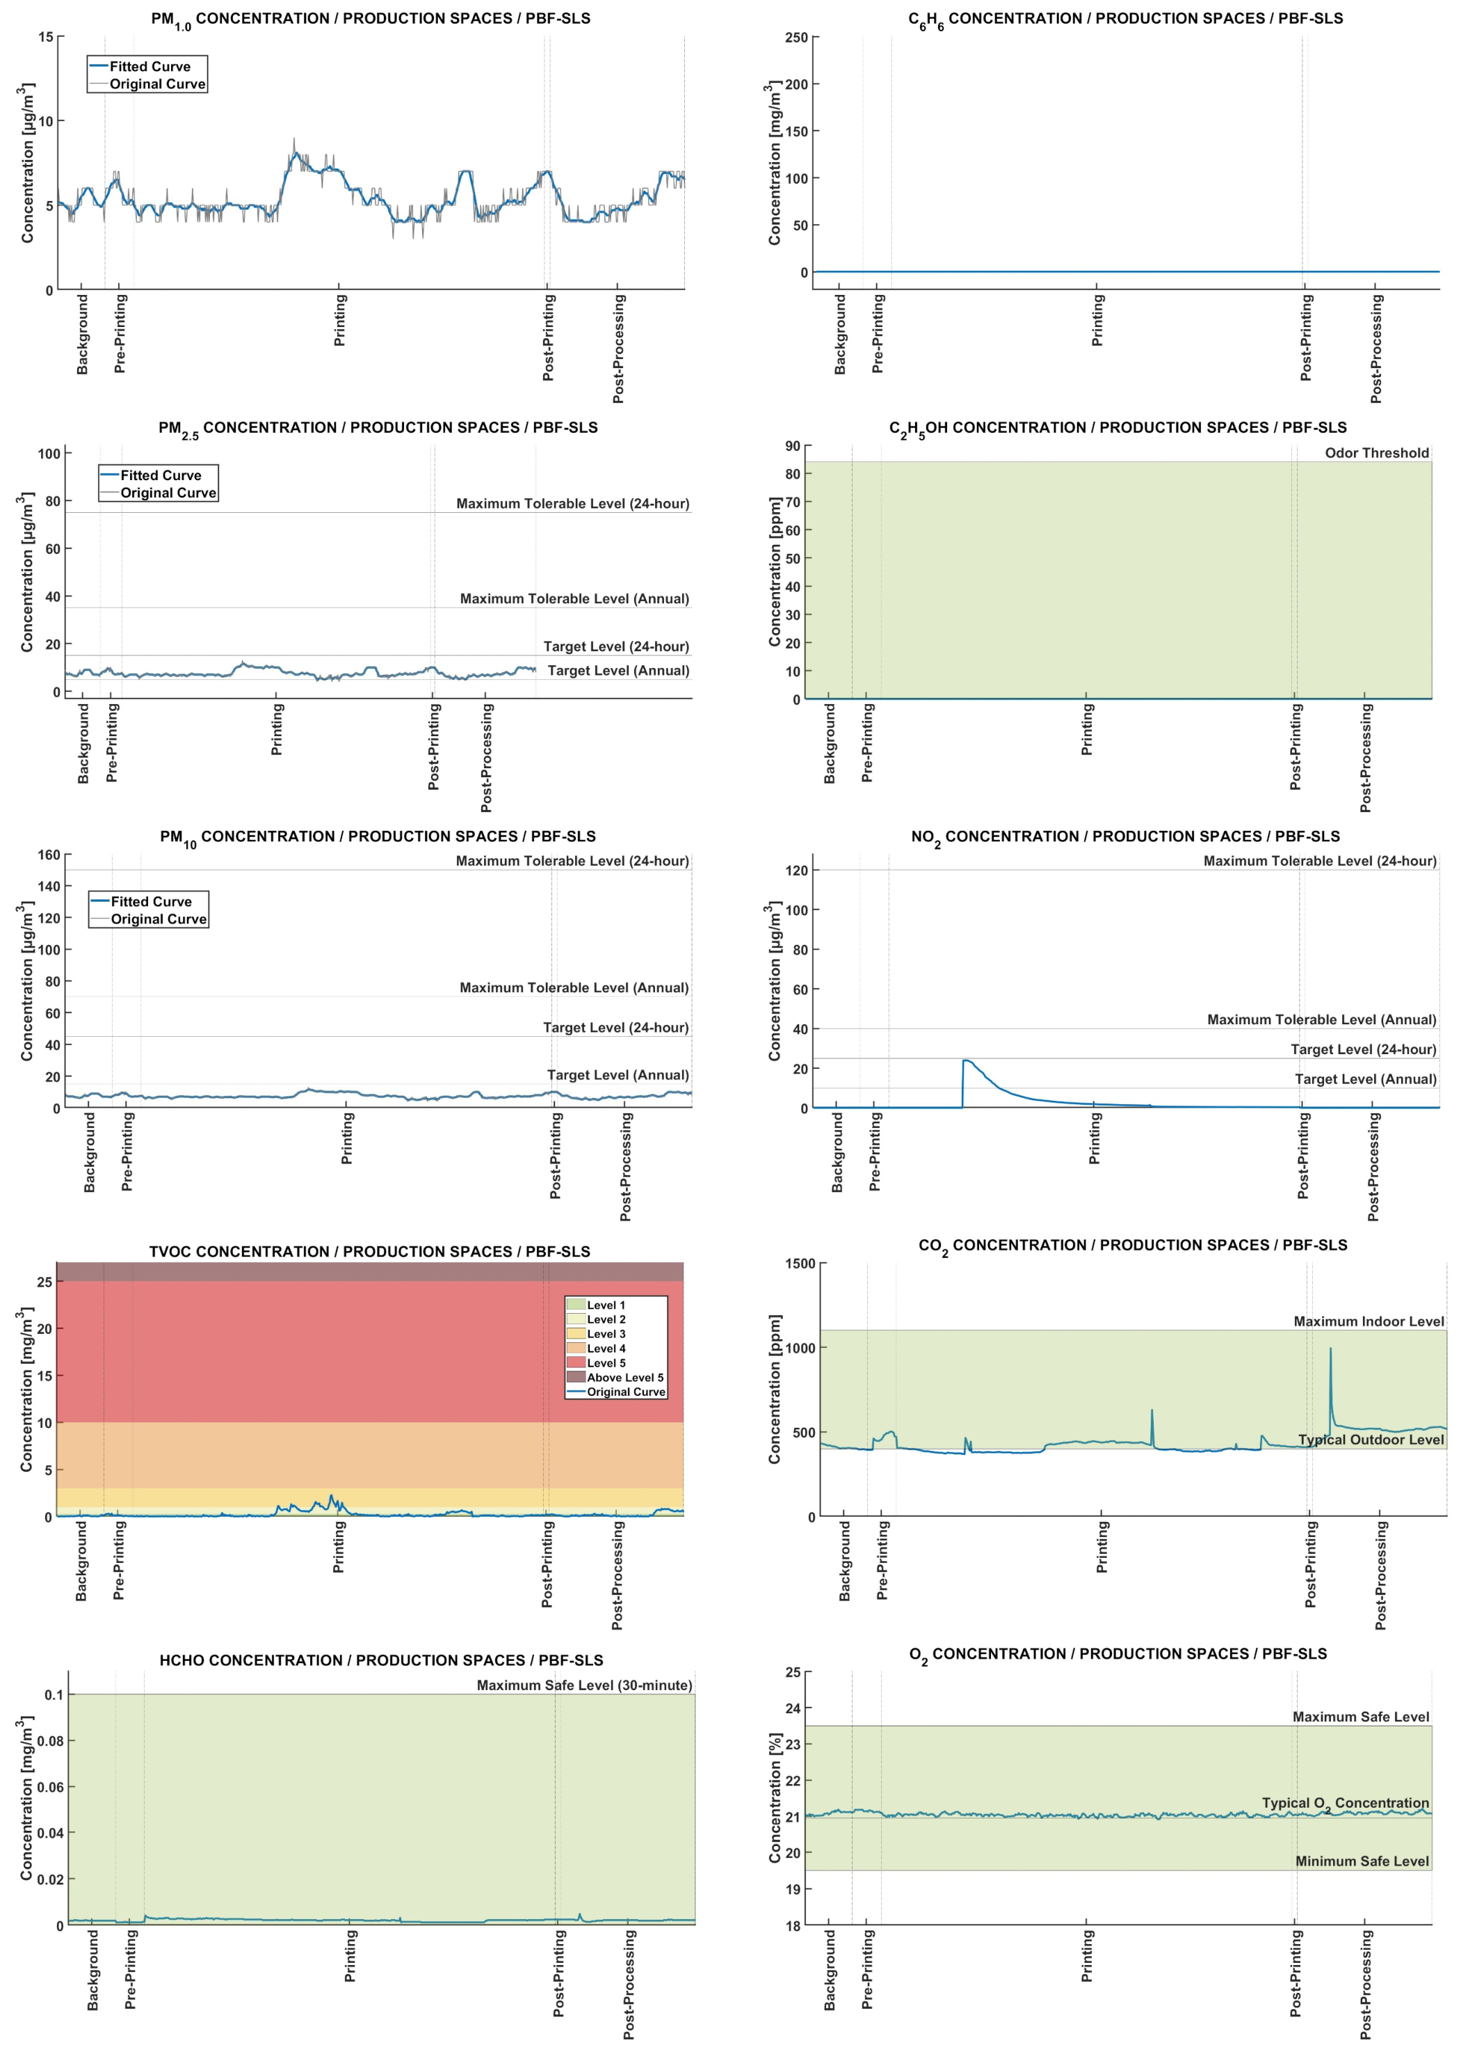
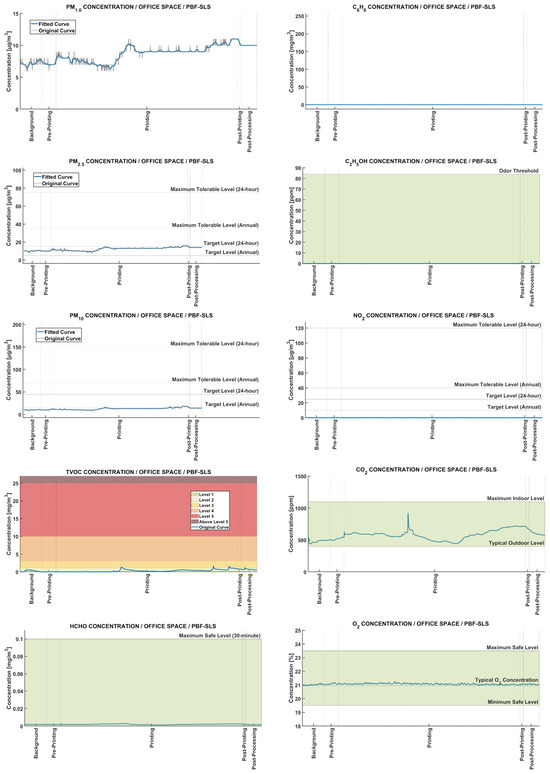
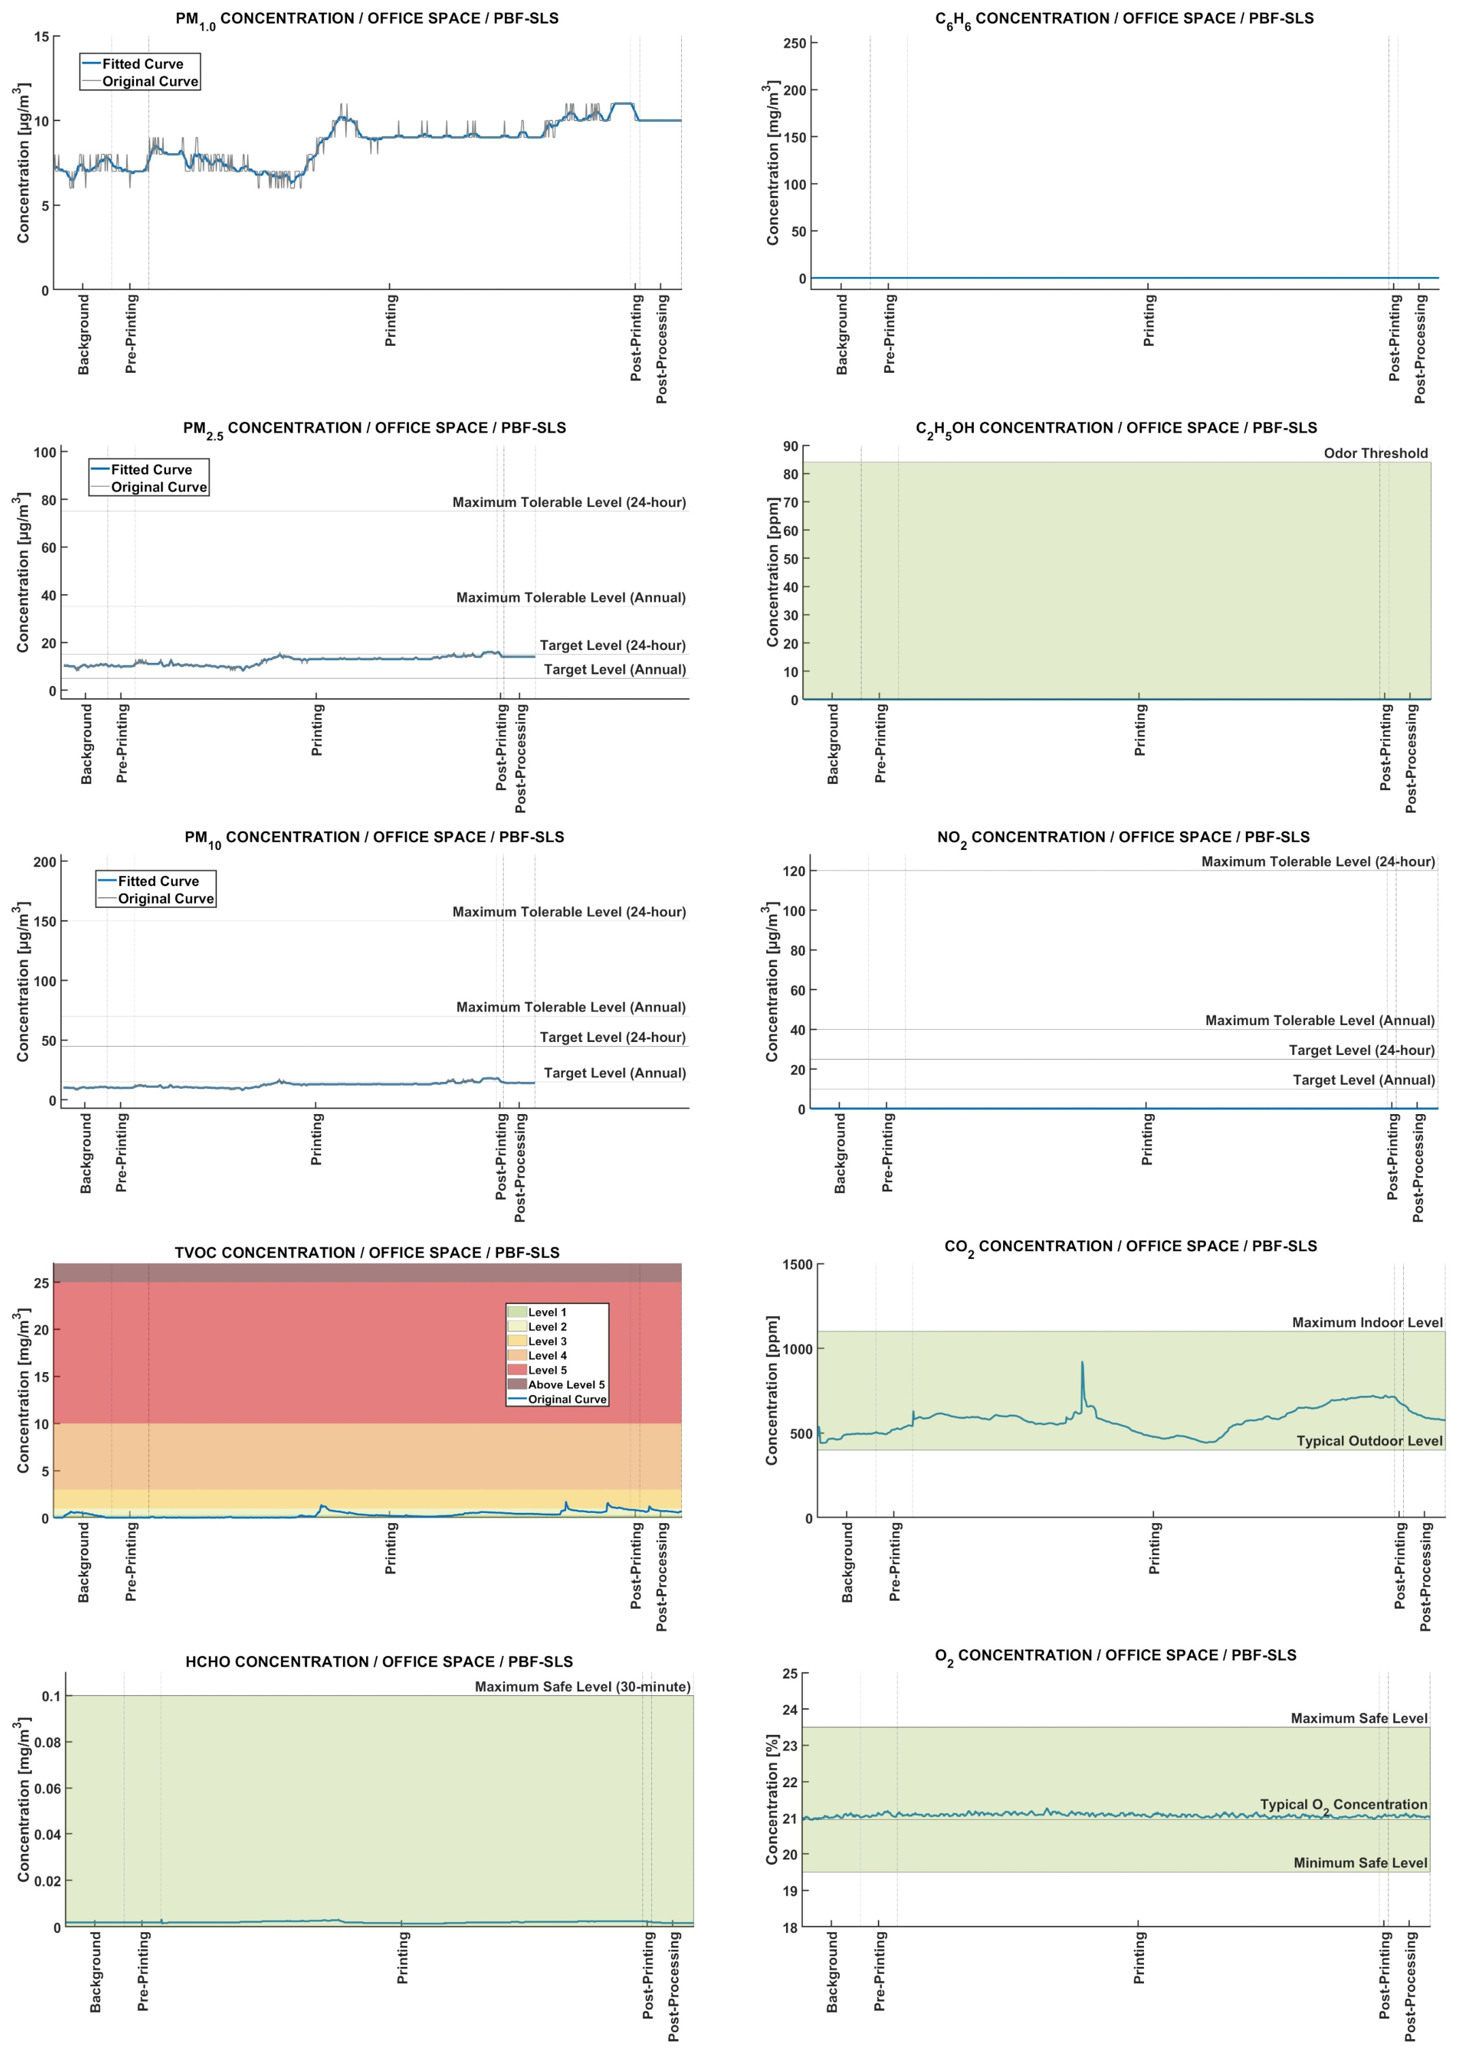
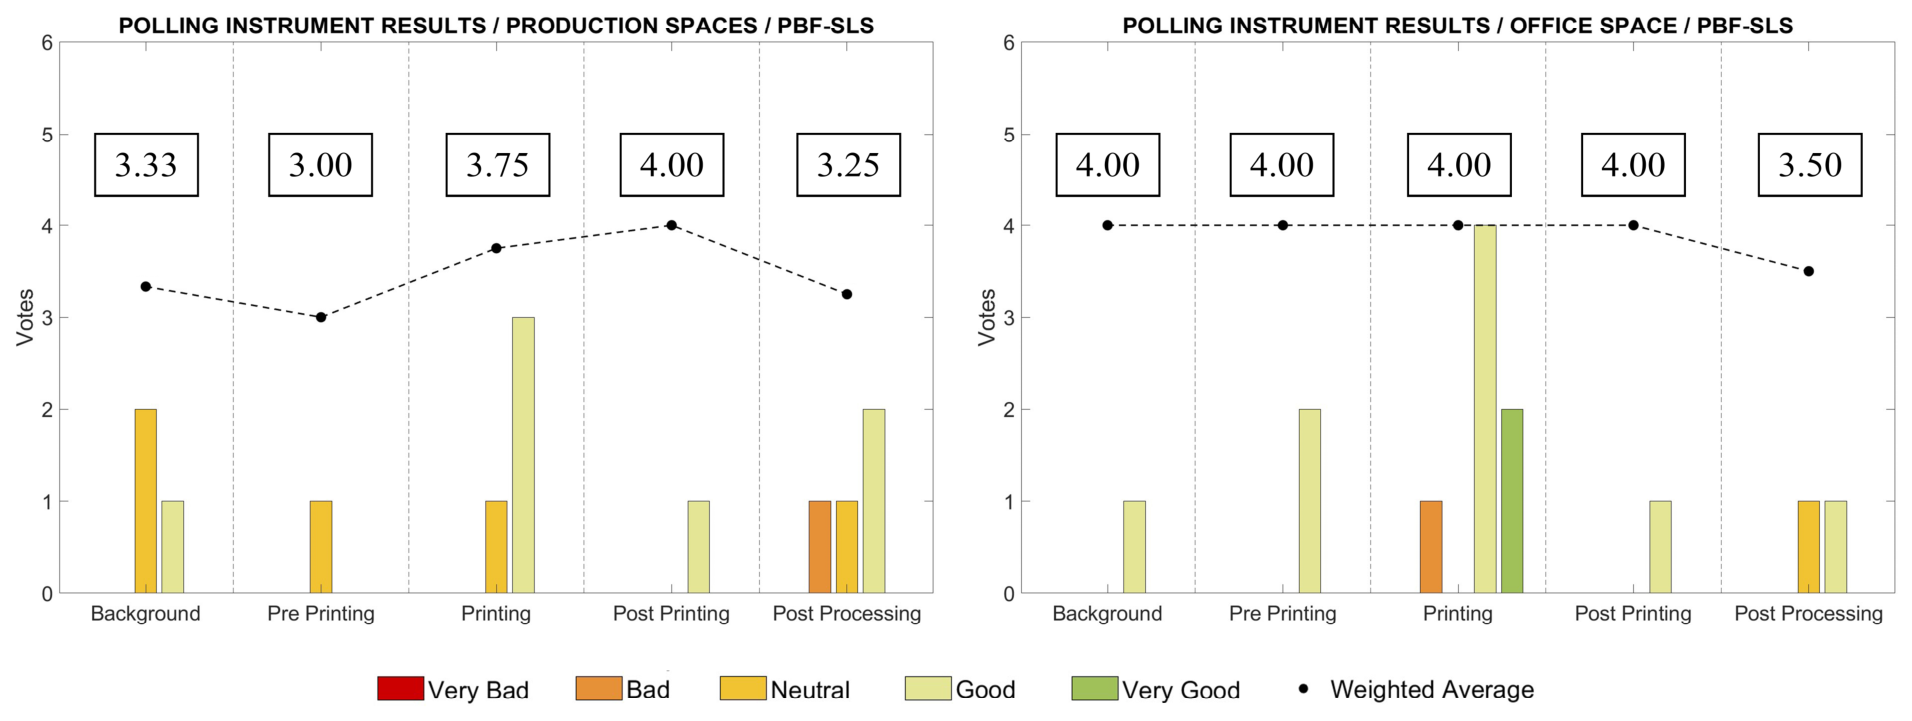
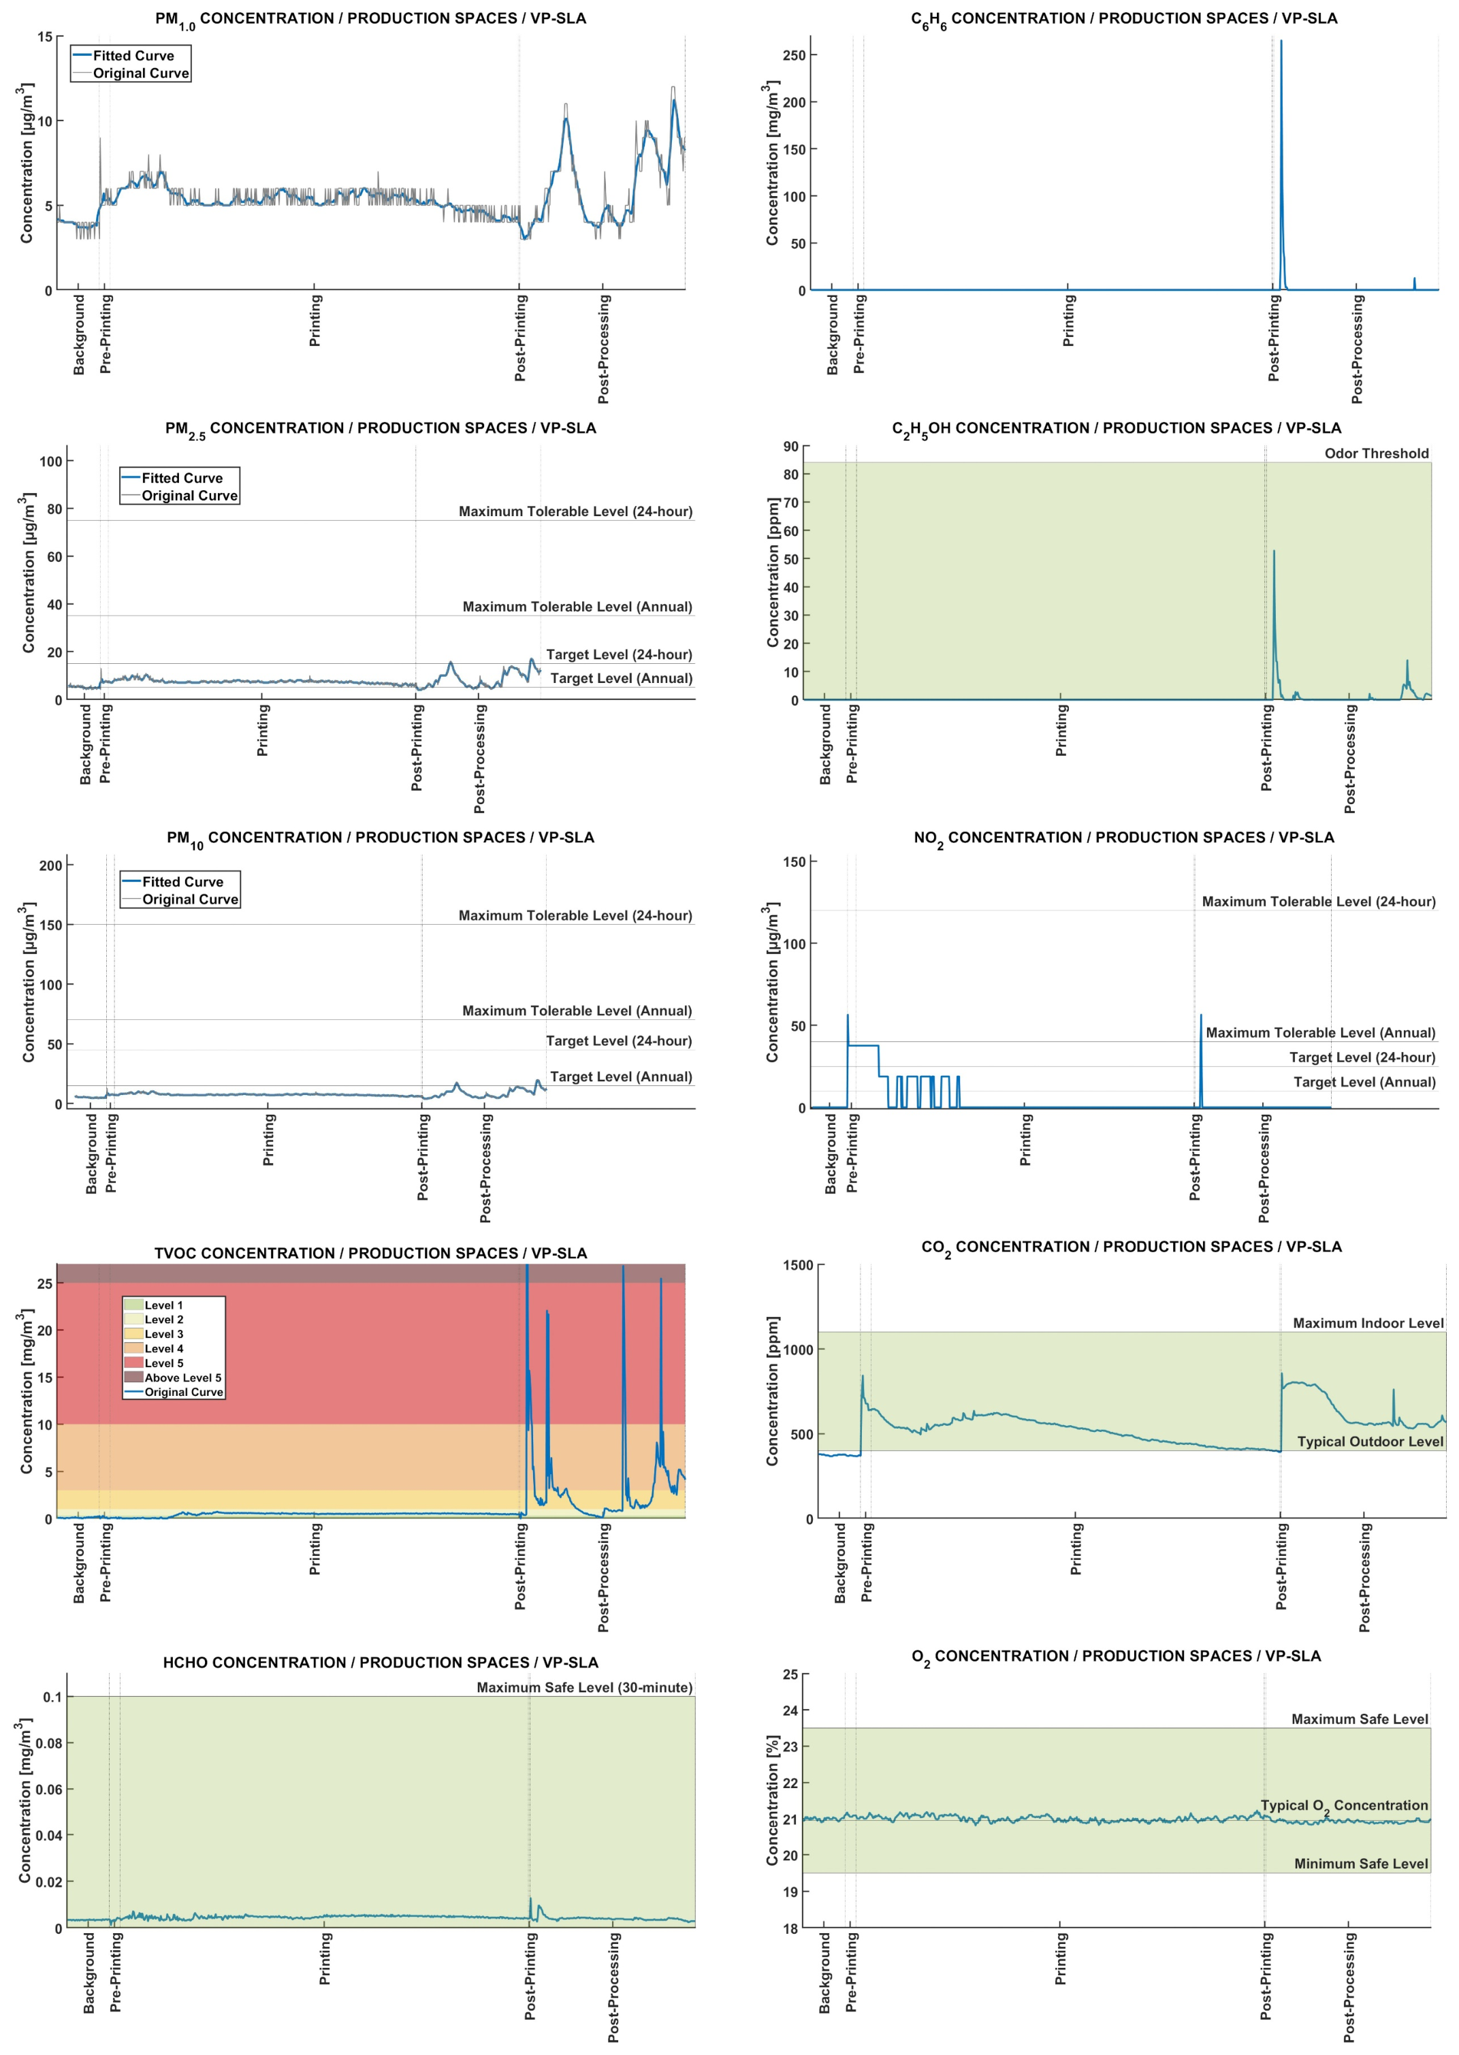
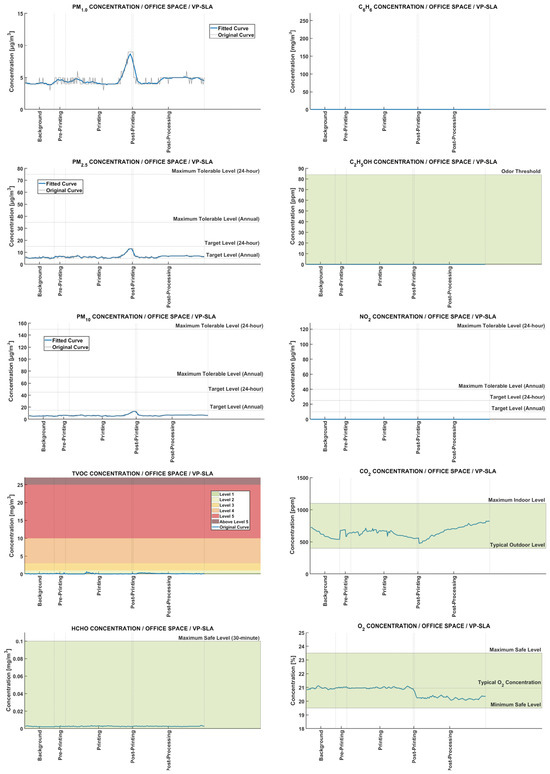
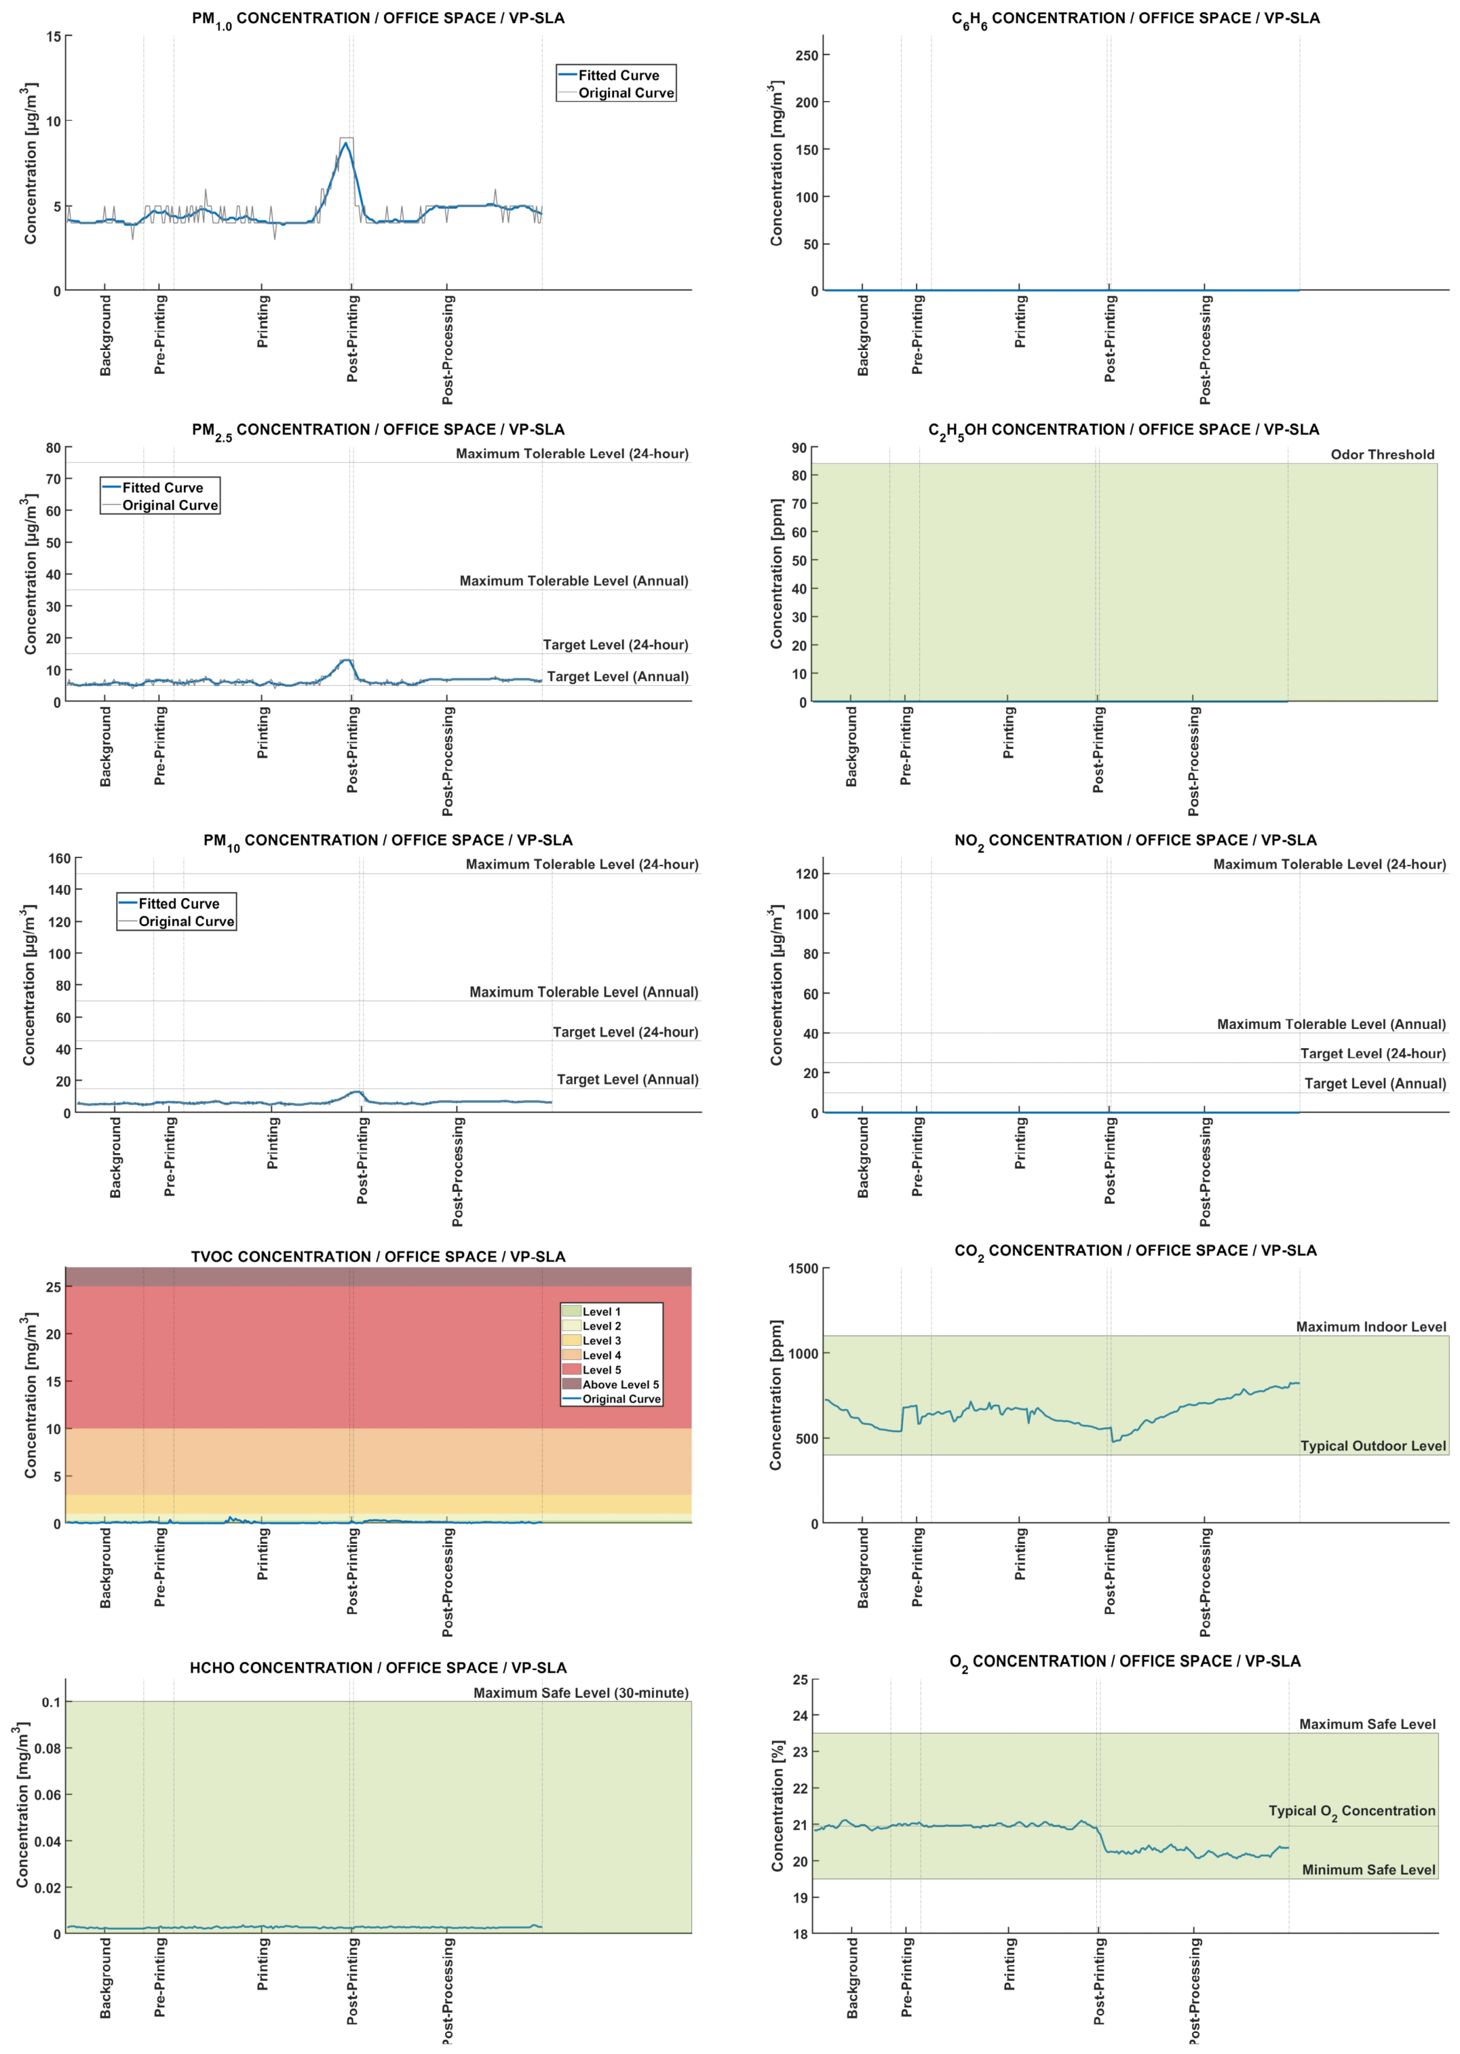
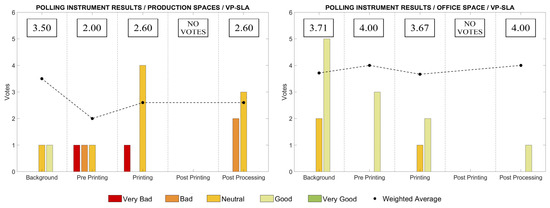
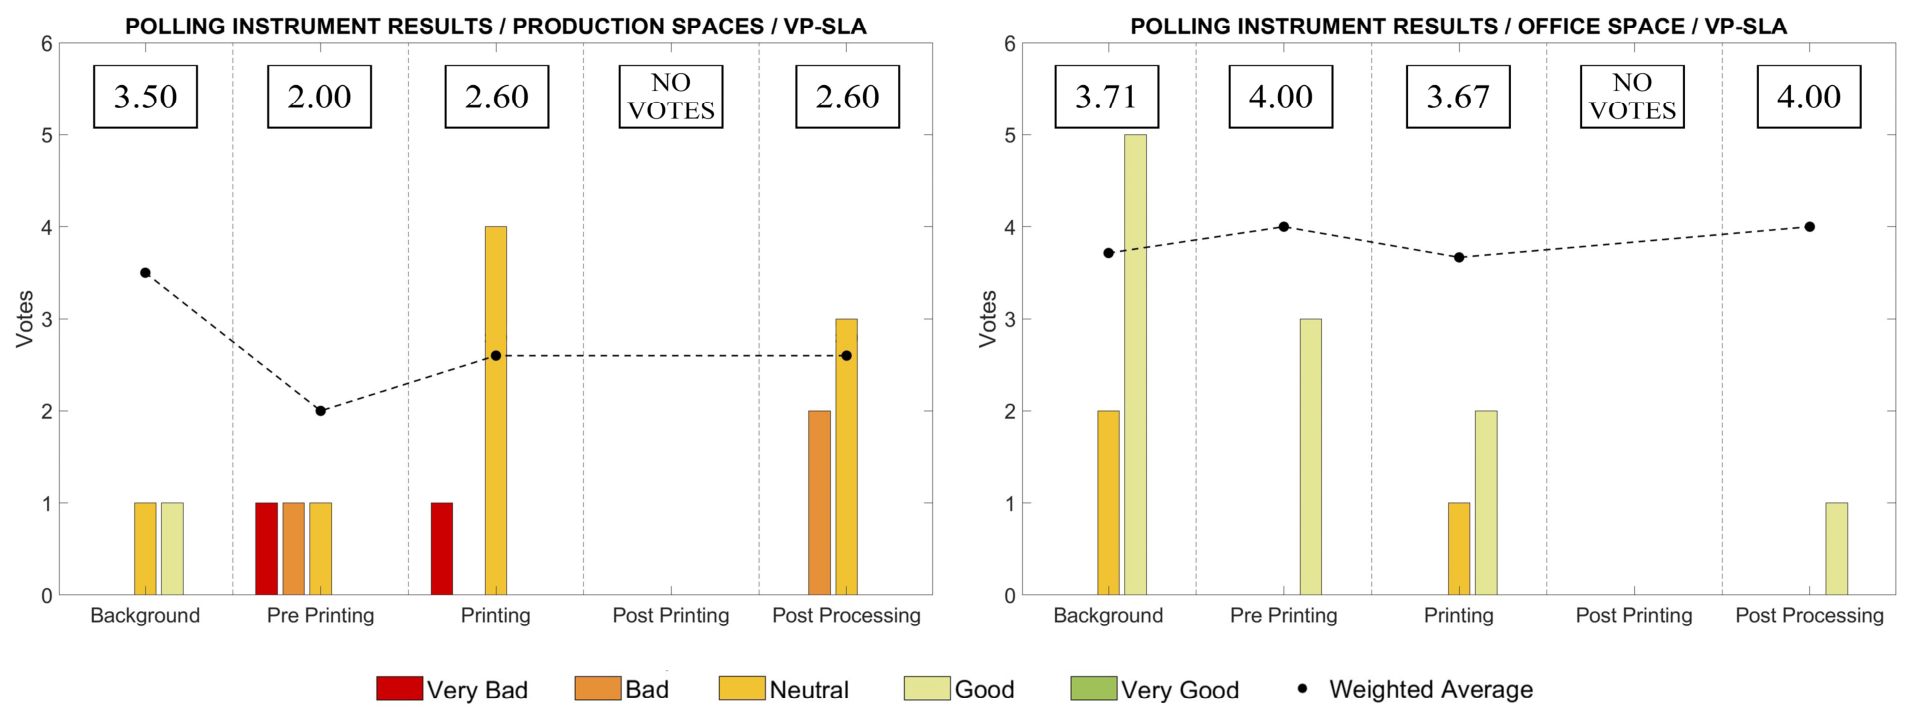

Disclaimer/Publisher’s Note: The statements, opinions and data contained in all publications are solely those of the individual author(s) and contributor(s) and not of MDPI and/or the editor(s). MDPI and/or the editor(s) disclaim responsibility for any injury to people or property resulting from any ideas, methods, instructions or products referred to in the content. |
© 2026 by the authors. Licensee MDPI, Basel, Switzerland. This article is an open access article distributed under the terms and conditions of the Creative Commons Attribution (CC BY) license.