


Abstract
Monolithic precast reinforced concrete (RC) frames with cast-in-place joint cores and grouted-sleeve splices are increasingly adopted in seismic regions, yet connection degradation is not carried through to system-level fragility: existing studies take hinge properties from code tables or one test, or stop at the joint. This study closes that gap with a reproducible transfer route in which the degrading, pinched M–θ hysteresis identified from a refined joint model becomes structure-level hinge parameters, with every intermediate quantity reported so that the route can be reproduced elsewhere. The joint model is an explicit finite-element interface-spring/contact strategy with Mohr–Coulomb interface behavior, tension cut-off, local spring failure, and sleeve–grout–rebar bond slip. Incremental dynamic analysis and fragility assessment of a six-story monolithic precast frame and a comparable cast-in-place frame show larger inter-story drift demands in the precast frame. At PGA = 0.40 g, its collapse exceedance probabilities are higher by 0.73 and 0.44 percentage points in X and Y, respectively. Global performance is broadly comparable, but the precast frame shows a consistent, modest unfavorable tendency caused by connection pinching and reduced ultimate rotation. Interface treatment, sleeve grouting quality, and connection-level ductility should therefore be explicitly considered in seismic performance assessment and design.
1. Introduction
Driven by tightening resource and environmental constraints, rising labor costs, and carbon-reduction targets, the construction industry is shifting from cast in situ toward industrialized building systems. This shift is increasingly supported by quantitative life-cycle evidence rather than by qualitative argument: comparative assessments of off-site prefabrication against conventional construction report reductions on the order of 10–30% in embodied greenhouse-gas emissions, together with marked reductions in on-site labor demand, construction waste, and construction duration [1,2,3,4]. These drivers are strongest where structural geometry is repetitive and erection speed governs project cost, which is why precast concrete has become the dominant structural solution for industrial facilities—factories, warehouses, and logistics halls—in Southern Europe, Türkiye, and East Asia [5,6].
Monolithic precast reinforced concrete (RC) frames—assembled from precast beams and columns with cast-in-place joint cores and grouted-sleeve rebar splices—aim to combine this construction efficiency with force transfer continuity close to that of cast-in-place (CIP) construction, and are therefore classified as emulative systems [7]. As their application extends from low-rise industrial facilities to multi-story buildings in regions of moderate-to-high seismic intensity, the seismic safety margin of this specific structural system must be quantified at the system level rather than assumed by analogy with CIP frames. Throughout this paper, “precast frame” refers exclusively to this monolithic precast system, abbreviated as PC in the tables; dry-connected or prestressed precast systems are outside the scope.
Seismic fragility describes the probability that a structure reaches or exceeds a given damage state under a specified ground-motion intensity measure and is a cornerstone of seismic risk assessment and performance-based design [8,9]. For precast construction, the international field record shows unambiguously where that fragility originates. Post-earthquake surveys following the 1999 Kocaeli and Düzce earthquakes [10,11], the 2012 Emilia earthquakes [12,13], and the February 2023 Kahramanmaraş earthquake sequence [14] attribute the severe damage and collapse of precast industrial buildings principally to loss of support at beam-to-column connections, inadequate connection detailing, and cladding-fastening failure, rather than to insufficient member flexural capacity. Damage investigations of precast structures in the 2008 Wenchuan earthquake [15] and earlier reviews of precast seismic design practice [16,17] reach the same conclusion regarding the connection region and the interface between precast and post-cast concrete.
Analytical vulnerability studies confirm this field evidence and provide the probabilistic framework within which the present research is situated. Senel and Palanci [5] characterized the structural attributes and seismic performance of the Turkish one-story precast building stock, and Palanci et al. [6] derived fragility curves for existing one-story precast industrial buildings on that basis. Palanci and Senel [18] subsequently extended the assessment into a fully probabilistic risk framework by constructing damage probability matrices (DPMs) from more than three hundred real ground-motion records, adopting peak ground velocity as the reference intensity measure, comparing three analytical probabilistic approaches that bound the damage probabilities from above and below, and combining them through a logic tree so that structural, methodological, and damage-ratio uncertainties are carried explicitly; the resulting damage ratios were shown to agree well with site investigation data from the 1999 Kocaeli earthquake. That study is also a reminder that fragility curves and damage probability matrices are complementary representations of the same probabilistic information [18,19], which is one reason why both are reported in Section 4.5 of the present paper. For the European precast stock, Casotto et al. [20] developed fragility functions for Italian RC precast industrial structures using a large population of randomly generated index buildings, and Babič and Dolšek [21] derived fragility functions for four classes of pre-code single-story precast buildings and showed that a higher seismic design force may even worsen performance when connections and cladding fastenings are not capacity designed. The consistent message of these studies is that the fragility of a precast system is governed by its connections, and that a system-level fragility estimate is credible only if connection behavior is represented explicitly.
Two distinctions follow from this literature. First, the structures assessed above are predominantly single-story, hinged or dry-connected industrial buildings whose critical mechanism is the loss of frictional or dowel support at the beam-to-column interface. The present study addresses the complementary case of multi-story monolithic precast frames in which the connection is detailed to restore continuity, and the governing mechanisms are instead new-to-old interface bond-slip and friction degradation, bond slip within the grouted sleeves, and the composite action of the joint core. Under moderate-to-strong cyclic excitation, these mechanisms degrade hysteretic behavior, reduce energy dissipation, and accelerate stiffness and strength deterioration, thereby increasing the probability of severe damage or collapse; treating monolithic precast frames as equivalent to CIP frames in system-level analysis may therefore underestimate seismic risk. Second, the probabilistic machinery—IDA, PSDM, fragility curves, and DPMs—transfers directly from the single-story industrial case to the multi-story emulative case, which allows the results reported here to be compared with the international precast database on a common basis.
At the connection level, the international experimental literature on emulative precast connections is extensive and largely consistent. Kurama et al. [7] summarize the state of the art and identify grouted emulative connections as the principal route to CIP-comparable seismic behavior. Im et al. [22] tested RC-emulated beam-column connections of precast moment frames and reported strength and drift capacity comparable to monolithic references. For grouted splice sleeves specifically, Ameli et al. [23] evaluated precast column-to-cap-beam joints under reversed cyclic loading and found that the stiff sleeve region shifts and shortens the plastic-hinge zone so that damage concentrates over a reduced length and the available plastic rotation is smaller than in the monolithic reference; Popa et al. [24] reported the same tendency for columns connected with grouted corrugated steel sleeves; and Yan et al. [25] tested precast beam-column connections with grout sleeves and found load capacity close to that of cast-in-place specimens but distinctly different crack distribution, reinforcement strain, and joint deformation. Liu et al. [26] and Fan et al. [27] report broadly comparable observations for related connection details. The recurring pattern—CIP-comparable strength combined with reduced ultimate rotation and more pronounced pinching—is precisely the connection-level signature whose system-level consequences this paper sets out to quantify.
Existing studies have combined experiments, numerical simulation, and incremental dynamic analysis (IDA) to develop fragility curves for a range of precast systems [20,21]. However, a persistent tension remains between engineering practicability and mechanistic fidelity: high-resolution solid-element models capture local behavior but are computationally prohibitive for large suites of nonlinear time-history analyses, whereas conventional simplified frame models cannot explicitly represent connection and interface degradation, slip, and pinching, which may undermine the reliability and discriminating power of fragility estimates. In particular, for grouted-sleeve monolithic precast frames, a transparent and reproducible procedure is still lacking for transferring joint-level degrading hysteresis—identified from refined models or tests—into structure-level plastic-hinge parameters.
In summary, two specific gaps remain for grouted-sleeve monolithic precast frames: (i) a transparent and reproducible route from joint-level degrading hysteresis—identified from refined models or tests—to structure-level plastic-hinge parameters; and (ii) a quantitative assessment of how grouted-sleeve and new-to-old-interface degradation propagates into system-level fragility relative to CIP construction. This paper closes both gaps through a five-stage framework: Stage 1 builds and validates refined explicit finite-element interface-spring/contact joint models with explicit interface and bond-slip laws (Section 2); Stage 2 identifies equivalent M–θ backbones and hysteretic parameters through explicit normalization and least-squares fitting (Section 3.1 and Section 3.2); Stage 3 back-calibrates concentrated plastic hinges in three-dimensional SAP2000 models and verifies them at the subassembly level (Section 3.3); Stage 4 performs IDA on a code-designed six-story prototype and its CIP counterpart (Section 4.1, Section 4.2 and Section 4.3); and Stage 5 constructs PSDMs with quantified dispersion treatment and derives fragility curves and matrices (Section 4.4 and Section 4.5). Therefore, the novelty of this research lies not in any single stage but in the closed, auditable transfer chain that links a refined joint model to a system-level fragility estimate, with every intermediate quantity reported so that the route can be reproduced for other connection types. Section 5 discusses mechanisms, sensitivity, design implications, and limitations.
2. Refined Numerical Modeling of Precast Beam–Column Joints
2.1. Explicit Finite-Element Interface-Spring/Contact Model
In monolithic precast frames the new-to-old concrete interface at the joint and the grouted-sleeve splice are the two features that distinguish the system from CIP construction, and both are potential weak links: interface roughness, cohesion and friction govern the force transfer path in the joint region, while sleeve geometry, grout quality and rebar anchorage govern connection reliability and cyclic energy dissipation. Both are therefore represented explicitly.
The strategy is implemented in ABAQUS/Explicit (V 6.14) (Figure 1). Unlike a general combined finite–discrete element method [28,29,30,31,32], discontinuities are prescribed only at the new-to-old interfaces: each precast or post-cast region is a continuum mesh, and the construction joints are zero-thickness contact surfaces carrying normal–tangential spring pairs at matched node pairs. The interface can therefore evolve from a bonded, continuum-like state, through local spring failure and debonding, to purely frictional contact within a single FE-contact framework. Central-difference integration is used with contact detection and penalty enforcement updated at every increment, and the loading rate is kept low enough that the kinetic-to-internal energy ratio remains below 5% throughout the quasi-static cyclic analyses.
Figure 1.
Refined explicit finite-element interface-spring/contact modeling strategy for beam–column joints of monolithic precast RC frames: concrete, grout, sleeves and reinforcement are modeled with finite elements; new-to-old concrete interfaces are represented by zero-thickness normal–tangential spring pairs and hard contact obeying a Mohr–Coulomb law with tension cut-off (Equation (1)); sleeve–grout–rebar bond is represented by the bond-slip springs of Equation (2).
The interface constitutive law couples the normal and tangential responses and is defined graphically in Figure 2a–c; its governing relation is the Mohr–Coulomb envelope:
where c is the cohesion of the roughened construction joint, μ the friction coefficient and σn the normal stress, positive in compression. Equation (1) applies only while the interface is in contact, and the envelope is truncated at σn = −min(ft, c/μ); for the values of Table 1, this is c/μ = 0.67 MPa, so pure tensile separation is governed instead by the normal spring at ft (Figure 2b). Failure is evaluated locally at each node pair so that partial debonding and crack propagation along the joint emerge from stress redistribution rather than being prescribed. The penalty stiffnesses are kn = Eeff/ti and kt = Geff/ti, with ti the characteristic interface thickness; sensitivity checks confirmed that they introduce no artificial compliance.
τcrit = c + μ σn
Figure 2.
Constitutive laws of the interface and bond-slip springs used in the refined model. (a) Failure envelope in σn–τ space, drawn to scale for c = 0.4 MPa and μ = 0.6: solid lines are the Mohr–Coulomb envelope of Equation (1), valid while the cohesive spring is intact and truncated at σn = −min(ft, c/μ); dashed lines are the residual envelope τ = μσn that remains after cohesive failure (c = 0); the shaded area is the admissible stress region after failure, and the vertical gap between the two envelopes equals c. (b) Normal spring/contact law (schematic, ft < fc): stiffness kn in both directions, brittle separation in tension at ft, and a compressive limit at fc, the lower compressive strength of the adjacent concrete regions, with hard contact retained on re-closure. (c) Tangential spring law for two levels of normal stress: the two loading branches coincide because the stiffness kt is common, the peak is τcrit = c + μσn, the strength drop at cohesive failure equals c in both cases, and the residual branch is the Coulomb friction μσn. (d) Sleeve–grout–rebar bond stress–slip law of fib Model Code 2010, Equation (2), for ribbed bars under good bond conditions (α = 0.4, s1 = 1.0 mm, s2 = 2.0 mm, s3 = clear rib spacing, τf = 0.4τmax); the dashed curve is the cyclically degraded envelope obtained by scaling the entire monotonic envelope, residual branch included, by a damage factor D that increases with the accumulated slip.
Bond slip of the sleeve–grout–rebar system, and of bars crossing the interface, is represented by nonlinear springs connecting reinforcement nodes to the surrounding concrete or grout, following the fib Model Code 2010 law [33] plotted in Figure 2d:
with a plateau at τmax for s1 < s ≤ s2, linear softening to the residual bond strength τf = 0.4τmax at s = s3, and a constant residual branch thereafter. Cyclic degradation is applied as a damage factor that scales the entire envelope, residual branch included, in proportion to the accumulated slip (dashed curve in Figure 2d), consistent with the damage formulation of the Model Code.
τ = τmax (s/s1)^α for 0 ≤ s ≤ s1
All interface and bond-slip parameters and their provenance are listed in Table 1; none are free fitting parameters. In particular μ = 0.6 and c = 0.4 MPa are lower-bound values from push-off and cyclic shear tests on intentionally roughened construction joints [34,35,36], and the bond constants are the fib Model Code 2010 recommendations for ribbed bars under good bond conditions.
Table 1.
Key parameters of the interface contact model and the sleeve–grout–rebar bond-slip model.
2.2. Material Constitutive Models and Hysteresis Extraction
Concrete is described by the ABAQUS concrete damaged plasticity model, with compressive and tensile stress–strain backbones defined by the Mander model [37]; damage variables in compression and tension control stiffness recovery upon load reversal (wc = 1, wt = 0), thereby reproducing crack closing and re-opening under cyclic loading.
The cyclic response of RC joints is sensitive to reinforcement yielding, bar slip, crack closure and interface slip. In the refined model, the reinforcement is not assigned a phenomenological hysteresis law: steel bars are modeled with cyclic elastoplastic reinforcement elements and are connected to the surrounding concrete or grout by the bond-slip springs of Section 2.1, wherever relative slip is permitted. Pinching and unloading-stiffness degradation in the joint-level load–displacement loops therefore emerge from crack opening and closure, interface debonding and sliding, and sleeve–grout–rebar bond slip, rather than being prescribed.
For the subsequent transfer to concentrated hinges (Section 3), the extracted cyclic M–θ loops are described by a degrading and pinched idealization with three terms. The first is unloading-stiffness degradation:
where K0 is the initial elastic stiffness, θm the maximum rotation reached in the loading direction, θy the yield rotation, and γ the degradation exponent. Equation (3) is the unloading rule of the Takeda model [38] in the exponential form introduced by Otani [39], in which the exponent is usually denoted α; international calibrations of that rule bracket reinforced concrete flexural members between 0.30 for full loops and 0.50 for pinched loops [40,41,42], so the value adopted here is the midpoint of that range. The second is pinched reloading: instead of aiming directly at the previous peak, the reloading branch first targets a pinching point located at pF times the previous peak moment and pD times the previous peak rotation, and only then re-orients toward the previous peak. The third is cyclic strength deterioration: the strength at a given rotation decays between successive cycles in proportion to the dissipated hysteretic energy. The three terms, their parameters, the adopted values and the provenance of each value are collected in Table 2; together, they reproduce yielding and hardening, bar-slip-induced pinching, and the stiffness and strength degradation of the sleeve-spliced connection. The sensitivity of the joint and system response to γ, pF and pD is quantified in Section 5.2.
Ku = K0 (θm/θy)^(−γ)
Table 2.
Terms of the degrading and pinched hysteretic idealization, adopted values and provenance.
2.3. Validation Against Cyclic Tests of Precast Joints
The modeling strategy was validated against two representative monolithic precast beam–slab–column joint specimens tested under quasi-static cyclic loading and reported by Chen et al. [43,44,45]: an exterior joint (PC-J2) and an interior joint (PC-JZM). Specimen geometry is given in Table 3. The column and joint-core concrete is grade C60 (measured cube strength 62.0 MPa), and the beam and slab concrete is grade C30 (33.5 MPa); the axial load ratio is 0.6. Longitudinal bars of columns, beams and slabs are HRB400; column ties are HRB400 and beam stirrups HRB335; the sleeves are Q400 steel. The precast members and the post-cast composite slab layer are both 80 mm thick.
Table 3.
Dimensions of the validation specimens (mm).
Concrete is meshed with C3D8R solid elements, sleeves and other thin steel components with S4R shell elements, and longitudinal bars, stirrups and slab reinforcement with truss or beam reinforcement elements. Where bond slip is represented explicitly, reinforcement nodes are connected to the surrounding concrete or grout by the nonlinear bond-slip springs of Equation (2); elsewhere, the reinforcement is embedded. Element sizes are 150 mm for the precast column, 100 mm for the precast beam, slab and post-cast layer, and 200 mm for reinforcement and sleeves; a mesh-sensitivity check with a 30% finer mesh changed the peak load by less than 3%. The loading protocol and boundary conditions replicate the tests.
The simulated failure modes are consistent with the experimental observations shown in Figure 3. The exterior joint fails predominantly through crushing of the joint-core concrete, accompanied by cracking of the composite slab near the joint, interface cracking, and compressive damage at the junction between the upper column and the slab. Similarly, the interior joint fails primarily by crushing of the joint core, while cracks at the slab end and along the composite interface progressively develop with increasing load. Table 4 provides a quantitative comparison in terms of initial stiffness, yield load, peak load, displacement at peak load, ultimate displacement, displacement ductility, and the equivalent viscous damping ratio in the ultimate loading cycle. All strength-related quantities are predicted within 5% of the experimental values, deformation-related quantities within 9%, and cumulative energy dissipation within 11%. The largest discrepancy occurs in the initial stiffness, which is overestimated by approximately 13% because of the idealized boundary conditions. Nevertheless, the models closely reproduce both the cycle-by-cycle degradation of unloading stiffness and the evolution of strength degradation. They also capture the asymmetry of the exterior-joint hysteretic loops arising from the asymmetric reinforcement arrangement and the T-flange effect of the slab. The validated models therefore provide a reliable mechanical basis for the parametric analysis and parameter identification presented in Section 3.
Figure 3.
Validation of the refined explicit FE interface-spring/contact joint models against cyclic tests of the precast exterior joint (PC−J2) and interior joint (PC−JZM): damage patterns, hysteresis loops and skeleton curves.
Table 4.
Comparison between simulated and measured response of the two validation specimens.
3. From Refined Joints to a Simplified Structure-Level Model
3.1. Parametric Comparison of Precast and Cast-in-Place Joints
Figure 4 presents the overall transfer framework, tracing the sequence from the refined joint model to the structure-level plastic hinge and specifying the governing relationship at each stage. The individual stages are described in Section 3.1, Section 3.2 and Section 3.3, and the complete transfer route is verified at the subassembly level at the end of Section 3.3. Throughout this paper, an exterior joint denotes a T-shaped subassembly, with a beam framing into one side of the column, and an interior joint denotes a cruciform subassembly, with beams framing into both sides. Using the validated refined models, a parametric study examined the influence of axial load ratio, concrete strength and reinforcement strength on joint behavior, and companion CIP joint models with identical layout, reinforcement and material properties were analyzed for comparison. Each companion CIP model differs from its precast counterpart only in the absence of the grouted sleeves and of the new-to-old concrete interface; it is therefore a numerical reference rather than a tested specimen.
Figure 4.
Transfer route from the refined joint model to the structure-level plastic hinge.
Four independent test series were additionally simulated to broaden the experimental basis of the comparison: Im et al. [22], a full-scale interior cruciform connection with a precast column and a U-shaped precast beam shell, the joint core and the beam core being cast in place; Liu et al. [26], an interior cruciform joint with grouted-sleeve bar splices; Yang [46], a precast concrete frame joint; and Fan et al. [27], a self-sustaining beam–column connection.
Figure 5 and Figure 6 show the damage contours obtained for the specimens of Im et al. and Liu et al., respectively. The quantities plotted are the compressive and tensile damage variables dc and dt, respectively, of the concrete damaged plasticity model, which range from 0 for undamaged material to 1 for fully damaged material; all panels of both figures share the color scale given in the legend, and all contours are extracted at the same loading stage, namely the drift ratio at which the peak load is reached, so that the two systems are compared at an equivalent deformation state rather than at an equivalent load. Figure 7 then generalizes the two cases by contrasting the characteristic failure regions of the two systems.
Figure 5.
Damage contours of the interior cruciform beam–column joint of Im et al. [22] at the drift ratio corresponding to peak load: (a) CIP companion model, compressive damage variable dc; (b) CIP companion model, tensile damage variable dt; (c) precast joint, dc; (d) precast joint, dt. Both variables range from 0, undamaged, to 1, fully damaged, and all panels share the color scale shown. In the CIP model, the damage spreads over the beam-end plastic-hinge region; in the precast joint, it concentrates at the two ends of the grouted sleeves and along the new-to-old concrete interface.
Figure 6.
Damage contours of the interior cruciform grouted-sleeve beam–column joint of Liu et al. [26] at the drift ratio corresponding to peak load: (a) CIP companion model, dc; (b) CIP companion model, dt; (c) precast joint, dc; (d) precast joint, dt. Color scale and damage-variable definitions as in Figure 5.
Figure 7.
Characteristic failure regions of RC beam–column joints, generalized from Figure 5 and Figure 6: (a) CIP joint, with damage distributed over the beam-end plastic-hinge region; (b) precast joint, with damage localized at the ends of the grouted sleeves and along the new-to-old concrete interface.
Four systematic differences emerge. (1) In precast joints, damage and cracks concentrate at the two ends of the grouted sleeves and along the new-to-old concrete interface where cracks propagate and may coalesce; in CIP joints, cracks distribute more uniformly over the beam-end plastic-hinge region and develop more fully. This is the contrast visible in panels (a) and (c) of Figure 5 and Figure 6 and summarized in Figure 7. (2) Early interface cracking, slip, and bond degradation in precast joints weaken the deformation compatibility of the joint region and shift the critical section toward the joint core. (3) Owing to sleeve–grout–rebar bond slip and interface slip, precast-joint hysteresis loops exhibit stronger pinching, with correspondingly different energy-dissipation and cyclic-stiffness-degradation characteristics. (4) The yield rotations of the two joint types are close, but the ultimate rotation of precast joints is smaller, indicating more limited post-peak deformation capacity. These differences demonstrate that the connection-region nonlinearity of the two systems is qualitatively different and must be represented by system-specific M–θ relations with degradation and pinching in the structure-level model.
3.2. Identification of Equivalent M–θ Backbones from Tests and Refined Models
For each of the test series and companion refined-model analyses, the measured or computed load–displacement response at the beam tip is first converted into an equivalent moment–rotation relation at the beam end:
where F is the applied beam-tip force, Δ the beam-tip displacement, and Lb the distance from the loading point to the column face, so that θ is the chord rotation of the beam end. In every test series, the specimen is a beam–column subassembly in which the column is pin-supported at its base and laterally restrained at its top. A constant axial load corresponding to the reported axial load ratio is applied at the column top, and the cyclic load F is applied at the free end of the beam, with the displacement Δ measured at the same point. Therefore, the lever arm Lb equals the clear beam length of the subassembly so that F Lb is the bending moment at the beam end taken at the column face, and Δ/Lb is the chord rotation of the beam between the column face and the loading point. For the validation specimens, Lb is 1700 mm for the exterior joint PC-J2 and 1800 mm for the interior joint PC-JZM; these are the clear beam lengths listed in Table 3 and are confirmed by the slab dimensions of the same table, the slab length being the clear beam length plus the column depth for the exterior specimen (1700 + 800 = 2500 mm) and twice the clear beam length plus the column depth for the interior specimen (1800 + 800 + 1800 = 4400 mm). With these exterior and interior lever arms, the measured yield chord rotations are 0.0055 rad and 0.0039 rad, respectively, within the range usually reported for reinforced concrete beams. For the four additional series, Lb is taken as the clear beam length reported in the corresponding source paper, and for the cruciform specimens, in which the two beams are loaded in opposite senses, Lb is measured separately on each side and the two beam ends are treated as separate branches. The yield point (My, θy) of each branch is determined by the equal-energy construction: an elasto-plastic bilinear curve is fitted to the identified backbone, with its initial stiffness taken as the secant stiffness at six tenths of the yield moment and its plateau at My, and My is adjusted until the area enclosed under the bilinear curve up to the peak rotation equals the area under the backbone over the same range; a short iteration is required because the secant stiffness itself depends on My. Each backbone is then normalized as follows:
which removes specimen-to-specimen differences in absolute strength and stiffness and isolates the shape parameters that govern ductility and degradation. The positive and negative branches are normalized independently and are not symmetrized, so that every specimen contributes two normalized curves. The normalized backbones of all series are shown in Figure 8, plotted in the four-branch parametric form of the ASCE/SEI 41 generalized force–deformation relation [47]: parameter a denotes the plastic rotation from yield to the peak point, b the total plastic rotation to loss of gravity-load capacity, and c the residual-strength ratio. Figure 8, Figure 9 and Figure 10 are linked as follows: the normalized experimental/numerical curves of Figure 8 are the data; the ASCE/SEI 41 template of Figure 9 is the parametric model fitted to those data; and Figure 10 shows the resulting four-branch idealization—with separately identified positive and negative branches—in exactly the form entered as the hinge definition in SAP2000.
Figure 8.
Normalized M−θ backbones of CIP and precast beam−column joints identified from the test series of Im et al. [22] (a,b), Liu et al. [26] (c,d), Yang [46] (e,f), and Fan et al. [27] (g,h).
Figure 9.
Generalized force–deformation relation of ASCE/SEI 41 [47] used for the parametric description of the joint backbones.
Figure 10.
Four-branch idealization (yield, hardening, degradation, failure) of the normalized joint backbone adopted for implementation in SAP2000, constructed from the identified parameters of Table 5; positive and negative branches are defined separately to reflect the reinforcement and slab-flange asymmetry.
The identification is carried out with the following explicit procedure. Step 1: Convert each measured or computed load–displacement curve to an M–θ relation with Equation (4) and extract the cyclic-envelope backbone, treating the positive and negative loading directions separately (no symmetrization) so that the reinforcement and slab-flange asymmetry is preserved. Step 2: Determine the yield point of each branch by the equivalent-energy method and normalize with Equation (5). Step 3: Identify the parameter vector p = (a, b, c) of each branch by minimizing the following weighted least-squares objective:
subject to a > 0, b ≥ a, and 0 ≤ c ≤ 1, where k runs over the sampled rotation points of specimen j, and the weights wj = 1/nj give each specimen equal influence regardless of its number of sampled points; the minimization uses a bounded trust-region algorithm from multiple starting points to avoid local minima. Because the parameter vector p contains no strength ratio, the moment at the peak point C is not identified but is taken equal to My so that the branch from the yield point B to the peak point C of the ASCE/SEI 41 relation is flat, and the whole of the post-yield behavior is carried by the rotation parameters a and b; this is also the conservative choice for a fragility study, since no post-yield overstrength is credited. Step 4: Pool the branch-level parameters within each joint type (CIP or precast) and report their means and coefficients of variation. As a worked example, the positive branch of the precast specimen of Liu et al. [26] yields θy = 0.0097 rad, a/θy = 2.1, b/θy = 3.3, c = 0.16, with a root-mean-square misfit of 4.2% of the peak normalized moment. Table 5 lists the pooled results. The statistics confirm the qualitative picture of Section 3.1: the mean yield rotation of the precast joints is 4.4% larger than that of the CIP joints, their mean normalized ultimate plastic rotation b/θy is 21% smaller, the corresponding ultimate rotation θu = θy + b is 13% smaller, and their residual-strength ratio is 25% lower, reflecting interface slip and sleeve bond degradation. The parameter dispersion (coefficients of variation of 0.14–0.24, Table 5) is carried into the discussion of Section 5.2. These ratios, which are tabulated in the last row of Table 5, provide the quantitative basis for the differentiated plastic-hinge parameters of Section 3.3.
Table 5.
Identified normalized backbone parameters.
3.3. Plastic-Hinge Back-Calibration and Hysteresis Model in SAP2000
Three-dimensional models of the prototype frames were built in SAP2000 with concentrated plasticity: beams receive moment (M3) hinges, and columns receive axial-force–biaxial-moment interaction (P–M–M) hinges at member ends. The hinge backbones were constructed by a “normalized-backbone/back-calibration” procedure that ties the section analysis to the identified joint parameters. First, the moment–curvature relation of every beam and column section is computed in XTRACT software (V2.3)with the measured material properties, giving the yield and ultimate curvatures φy and φu. The plastic rotation capacity is then obtained by integrating the plastic curvature over the plastic-hinge length Lp:
where L is the shear span, fy the bar yield strength (MPa), and db the bar diameter (mm), following Paulay and Priestley [48]. Second, the hinge parameters a, b, and c are assigned within the framework of the FEMA 356 and ASCE/SEI 41 modeling tables (Table 6 and Table 7) [47,49], and, as the back-calibration step, the beam-hinge values of the precast frame are scaled by the precast-to-CIP ratios identified in Table 5 so that the hinge-level M–θ backbone of each system reproduces its own normalized experimental backbone rather than a generic code curve. The acceptance criteria for the Immediate Occupancy (IO), Life Safety (LS), and Collapse Prevention (CP) performance levels are retained from the corresponding tables of FEMA 356 and ASCE/SEI 41 [47,49].
Table 6.
Modeling parameters and acceptance criteria adopted for RC beam hinges (flexure-controlled; after FEMA 356 [49]).
Table 7.
Modeling parameters and acceptance criteria adopted for RC column hinges (after ASCE/SEI 41 [47]).
Hysteretic behavior is assigned at the hinge level. CIP beam hinges use the Takeda degrading-stiffness rule [38], which is adequate for well-detailed monolithic members. Precast beam hinges use the Pivot hysteresis model [50], whose parameters map directly onto the pinching and unloading-degradation characteristics identified in Section 2.2: the primary pivot parameter is set to α1 = α2 = 6.0 and the pinching pivot parameter to β1 = β2 = 0.4, values obtained by fitting the pivot rule to the hysteresis loops of the validated refined joint models by minimizing the error in per-cycle dissipated energy. To verify the transfer, a beam–column subassembly identical to specimen PC-J2 was modeled in SAP2000 with the calibrated hinge and subjected to the experimental displacement protocol: the simplified model reproduces the peak strength within 6%, the cumulative dissipated energy within 10%, and the unloading-stiffness degradation trend of both the refined model and the test. This hinge-level verification closes the chain from refined modeling to structure-level analysis and ensures that the ensuing IDA rests on a hysteresis model whose pinching and degradation are evidence based rather than assumed.
4. Seismic Fragility Analysis
4.1. Prototype Structures
A six-story frame is designed in PKPM strictly in accordance with the Chinese Code for Seismic Design of Buildings (GB 50011-2010) [51], the Code for Design of Concrete Structures (GB 50010-2010) [52], the Technical Standard for Assembled Buildings with Concrete Structure (GB/T 51231-2016) [53], and the Technical Specification for Precast Concrete Structures (JGJ 1-2014) [54]. The frame has 5 bays of 6.6 m in the X direction and 3 bays of 6, 2.4, and 6 m in the Y direction. The first-story height is 3.6 m and stories 2–6 are 3.3 m, so that the total height is 20.1 m. The seismic precautionary intensity is 8 (design PGA 0.20 g), with design earthquake group I and site class II. Site classes in GB 50011-2010 are defined by the equivalent shear-wave velocity Vse of the soil layers within the smaller of the overburden thickness and 20 m, together with the overburden thickness dov: site class II comprises 250 < Vse ≤ 500 m/s with dov ≥ 5 m, 150 < Vse ≤ 250 m/s with 3 ≤ dov ≤ 50 m, and Vse ≤ 150 m/s with 3 < dov ≤ 15 m, and is the medium stiff-soil class most commonly encountered in Chinese design practice. Because Vse is averaged over 20 m rather than 30 m, there is no exact equivalence with Vs30, but site class II corresponds approximately to Vs30 between about 180 and 500 m/s, that is, to NEHRP site classes C and D and to Eurocode 8 ground types B and C. For intensity 8 with design earthquake group I, the code assigns a characteristic period Tg = 0.35 s to site class II, and this value defines the design spectrum used for the record selection of Section 4.2. The basic snow and wind pressures are 0.3 and 0.35 kN/m2; floor and roof dead loads are 2.3 and 4.0 kN/m2 and the live load is 2.0 kN/m2. Beams and columns use C30 concrete with HRB400 longitudinal bars and HPB300 ties. The plan layout, the elevation and the member reinforcement are shown in Figure 11. The precast variant adopts the same member sizes and reinforcement, with precast beams and columns, cast-in-place joint cores, and grouted-sleeve column splices; its hinges carry the precast parameters of Section 3.3, while the CIP variant carries the corresponding CIP parameters.
Figure 11.
Prototype RC frame: (a) plan layout; (b) column section and reinforcement; (c) beam section and reinforcement (Units: mm).
The basis of the comparison warrants precise statement. The two three-dimensional models are identical in member dimensions, reinforcement, material properties, gravity loads and seismic masses, rigid-diaphragm assumption, fixed-base boundary conditions, and damping model; they differ only in the beam-hinge backbone parameters (Table 5 ratios) and hysteresis rule (Takeda vs. Pivot). This idealization is justified as follows: in the monolithic precast system, the joint cores are cast in place and the sleeves splice bars are of the same grade and area so the elastic stiffness and mass distributions of the two buildings are nominally identical, and the physical differences—interface slip, sleeve bond slip, and their effect on stiffness degradation, pinching, and ultimate rotation—manifest precisely as the inelastic hinge behavior transferred from the refined models; slab participation is represented identically in both models through effective flange widths. Consequently, any response difference is attributable to the connection representation by construction. Modal analysis gives fundamental periods of T1 = 0.93 s (X) and 0.89 s (Y) for the CIP model, with the precast model within 1% (the hinges are rigid before yield), and first-mode mass-participation ratios above 80% in both directions, so both structures are first-mode dominated in each principal direction. Rayleigh damping with 5% of critical anchored at the first and third translational modes of each direction is used in all nonlinear time-history analyses; the hysteretic energy dissipated by the hinges is thereby kept separate from the viscous part, and no stiffness-proportional damping is assigned to yielded hinge springs to avoid spurious damping forces.
4.2. Ground-Motion Selection
Twenty far-field ground-motion records were selected from the PEER NGA database, corresponding to the far-field record set of FEMA P695 [55] (20 of its 22 records; the two oldest analog recordings, 1971 San Fernando and 1976 Friuli, were omitted); their events, stations, magnitudes, distances, and as-recorded PGAs are listed in Table 8. The recording stations are on stiff-soil sites (NEHRP classes C–D, Vs30 ≈ 250–650 m/s), consistent with Chinese site class II. Figure 12 compares the mean acceleration response spectrum of the processed records with the design spectrum: the mean-to-target spectral ratio remains within ±15% over 0.2T1–1.5T1, the period band that controls the response of both structures, confirming the representativeness of the suite. No spectral matching is applied; each record retains its natural spectral shape and is amplitude-scaled uniformly by PGA in successive increments (0.05 g steps up to 0.2 g, then 0.1 g steps) until the collapse-state threshold is exceeded, so that record-to-record variability is preserved in the IDA.
Table 8.
Ground-motion records used in the IDA: the far-field record set of FEMA P695 [55] (PEER NGA database; 20 of the 22 records, omitting the two oldest analog recordings, 1971 San Fernando and 1976 Friuli). R is the closest site-to-rupture distance and PGA the larger horizontal component.
Figure 12.
Mean acceleration response spectrum of the 20 selected records compared with the design spectrum (site class II, 5% damping).
PGA is retained as the intensity measure for three reasons. First, the deliverable of the study is a code-oriented fragility matrix at the frequent, design-basis, and rare levels of intensity 8, which are defined in GB 50011-2010 directly in terms of PGA (0.07, 0.20, and 0.40 g); an Sa(T1)-based matrix would require an additional, hazard-dependent conversion. Second, the two structures compared have nearly identical fundamental periods, 0.93 s and 0.89 s in the X and Y directions, respectively, the precast and CIP models differing by less than 1%; thus, a period-anchored IM would not change their relative ranking, which is the primary object of the comparison. Third, the efficiency of PGA for this pair of first-mode-dominated, mid-rise frames is verified a posteriori rather than assumed. The four regressions of Table 9, each based on 231 to 238 (record, amplitude) points, give coefficients of determination of 0.93 to 0.94 and demand dispersions βD|IM of 0.29 to 0.31, and their residuals pass the Kolmogorov–Smirnov test for lognormality at the 5% significance level. These dispersions are also the values that enter Equation (11): combined with the HAZUS capacity-and-modeling uncertainty βC = 0.4, they give βtot = 0.50, the value used throughout, so the choice of intensity measure and the choice of total dispersion are consistent with each other. We nevertheless recognize that Sa(T1) is in general the more efficient intensity measure for frame structures, and the point is taken up among the limitations of Section 5.4.
Table 9.
PSDM regression results (Equation (8)) and demand dispersion; n is the number of (record, amplitude) IDA points entering each regression. Residuals passed the Kolmogorov–Smirnov test for lognormality at the 5% significance level.
4.3. Incremental Dynamic Analysis
The records, normalized by PGA, are applied at stepwise-increasing amplitudes to the CIP and precast models, and the maximum inter-story drift ratios in the X and Y directions are taken as the engineering demand parameter (EDP). The resulting IDA curve sets are shown in Figure 13.
Figure 13.
IDA curves: (a) CIP frame, X direction; (b) precast frame, X direction; (c) CIP frame, Y direction; (d) precast frame, Y direction.
At the same PGA, the maximum inter-story drift of the precast frame is consistently larger than that of the CIP frame in both directions, and the precast IDA curves shift as a whole toward larger displacement demand. The cause lies in the connection and interface behavior embedded in the hinges: bond degradation and relative slip at the post-cast interface and in the grouted sleeves reduce stiffness and energy-dissipation capacity under strong cyclic excitation and promote localization of deformation, which raises the global drift demand.
4.4. Probabilistic Seismic Demand Model, Fragility Curves, and Uncertainty Treatment
The fragility functions are evaluated by the direct route, in which a probabilistic demand model is regressed on the intensity measure, and the demand dispersion is then combined with the capacity dispersion; modal-based alternatives for seismic reliability estimation are compared by Rasa et al. [56]. Following Cornell et al. [57] and Aslani and Miranda [58], the median demand D is related to the intensity measure by a power law, i.e., linearly in logarithmic space:
where α and β are obtained by least-squares regression of the IDA data cloud with PGA as the IM. The record-to-record dispersion of demand given intensity is quantified by the standard deviation of the regression residuals:
where di is the peak demand of the i-th IDA point, is the corresponding regression estimate, and n is the number of points entering the regression. The fragility function for damage state DS with capacity threshold C is as follows:
where Φ is the standard normal cumulative distribution function, and βtot combines the record-to-record demand dispersion with the capacity and modeling uncertainty:
lnD = lnα + βln(IM)
The value βtot = 0.5 adopted here is not an arbitrary constant: it follows the HAZUS technical manual [59] for PGA-based building fragility and is consistent with Equation (11) when the computed demand dispersions of Table 9 (βD|IM ≈ 0.30) are combined with the HAZUS capacity-and-modeling uncertainty βC = 0.4, giving βtot = 0.50. The dispersion of the identified connection parameters is propagated in the same way: the coefficients of variation of Table 5, 0.14 to 0.24, enter Equation (11) as a third term and raise the total dispersion to between 0.52 and 0.55, a range that lies inside the interval examined in Table 10, so the sign of the difference between the two systems is unaffected. Because βtot controls the slope of the fragility curves, a sensitivity check over βtot ∈ {0.4, 0.5, 0.6} is reported in Table 10; the absolute probabilities shift as expected, but the precast–CIP ranking and the sign of the differences are unchanged at every level, so the comparative conclusions are insensitive to this choice.
Table 10.
Sensitivity of the collapse-state exceedance probability at PGA = 0.40 g to the total dispersion βtot (values derived from Equation (10) with the Table 9 demand medians).
Damage states are defined using the maximum inter-story drift ratio as the engineering demand parameter. According to GB 50011-2010 [51], the elastic and elasto-plastic inter-story drift-ratio limits for RC frame structures are 1/550 and 1/50, respectively. In the present fragility analysis, these two code values were adopted as the lower and upper reference limits rather than as code-defined damage-state labels. The intermediate drift ratios of 1/275, 1/183, and 1/137 were introduced as analytical classification boundaries for the slight, moderate, and severe damage levels, respectively. These values correspond approximately to two, three, and four times the elastic drift limit of 1/550. Similar numerical drift levels have also been adopted as classification boundaries in previous RC fragility studies [60]. Because intermediate damage thresholds are not uniquely prescribed by the seismic design code, these values should be interpreted as operational thresholds for the present comparative fragility analysis rather than as universal or experimentally identified performance limits. The same thresholds were applied to both the CIP and PC frames, thereby providing a consistent basis for comparison. Table 11 summarizes the adopted damage-state definition.
Table 11.
Adopted damage-state classification based on inter-story drift ratio.
The fragility curves for the four damage states (slight, moderate, severe, collapse) are shown in Figure 14. To account for the finite size of the record suite, 95% confidence bands on the regression line were computed from the standard errors of lnα and β, and the corresponding bands on the fragility curves were obtained by propagating these errors through Equation (10); the bands of the CIP and precast curves overlap over most of the PGA range, which is why the fragility differences reported below are interpreted as consistent tendencies rather than statistically resolved separations.
Figure 14.
Fragility curves of the CIP and precast frames: (a) fragility curves, X direction; (b) fragility curves, Y direction.
4.5. Fragility Matrices and Quantitative Comparison
Evaluating the fragility curves at the frequent (PGA = 0.07 g), design-basis (0.20 g), and rare (0.40 g) earthquake levels of intensity 8 yields the damage-state probability matrices of Table 12 and Table 13.
Table 12.
Fragility matrix in the X direction at the three intensity-8 earthquake levels.
Table 13.
Fragility matrix in the Y direction at the three intensity-8 earthquake levels.
The two systems follow the same overall trend—progression toward higher damage states with increasing intensity—but the precast frame is consistently on the unfavorable side of every comparison. Under the frequent earthquake, the probability of remaining intact is 45.03% (CIP) versus 39.81% (precast) in X (a difference of 5.22 percentage points) and 52.73% versus 48.75% in Y (3.98 points). This early divergence follows directly from the hinge-level calibration rather than being inferred post hoc: the calibrated Pivot hinges of the precast model have a lower reloading secant stiffness at small rotations than the Takeda hinges of the CIP model, so the precast drift demands at low PGA in Figure 13 are already larger, which the fragility integration then converts into a lower probability of remaining intact. Under the design-basis earthquake, the precast probabilities of moderate, severe, and collapse-level damage exceed the CIP values by 1.07, 2.87, and 0.06 points in X and by 1.85, 2.01, and 0.03 points in Y. Under the rare earthquake, both systems are dominated by severe damage, and the precast collapse probability exceeds the CIP value by 0.73 points in X (3.72% vs. 2.99%) and 0.44 points in Y (2.04% vs. 1.60%)—relative increases of 24% and 28%, respectively. Thus, the individual differences range from less than 0.1 to 5.2 percentage points, depending on the damage state and intensity level; they are small in absolute terms and lie within the confidence bands associated with the 20-record suite, but the fact that the precast exceedance probability is higher for every damage state, intensity level, and direction in Table 12 and Table 13 indicates a consistent, mechanism-driven tendency. It must be stressed that this tendency is established under the present modeling assumptions, hinge calibration, and 20-record suite, and its magnitude is small; the results support “a consistent but modest unfavorable tendency” for the precast frame, not a claim of significantly poorer performance.
5. Discussion
5.1. Mechanistic Interpretation of the Fragility Difference
Because the two structure-level models are identical in member dimensions, reinforcement, material properties, gravity loads, seismic masses, boundary conditions, and damping assumptions, the observed fragility difference mainly arises from the connection behavior embedded in the calibrated hinge models. The refined joint analyses and the subsequent M–θ parameter identification indicate that the monolithic precast joints exhibit stronger pinching, lower reloading stiffness, and smaller ultimate plastic rotation than their CIP counterparts. These features are physically associated with interface slip, sleeve–grout–rebar bond degradation, crack opening and closing, and local debonding along the new-to-old concrete interface.
Two mechanisms are particularly important. First, the pinched hysteresis of the precast hinges reduces per-cycle energy dissipation. Under the same ground-motion intensity, less hysteretic energy dissipation leads to larger displacement excursions, which shifts the IDA curves of the precast frame toward higher inter-story drift demands. This mechanism explains why a difference between the CIP and precast frames is already observed at relatively low intensity levels, even before severe strength degradation is fully mobilized. Second, the identified ultimate plastic rotation of the precast hinges is smaller than that of the CIP hinges. Once beam-end hinges enter the degrading branch under rare earthquakes, the reduced rotation capacity accelerates the transition from severe damage to collapse-level response. This explains why the relative increase in collapse probability is more evident at PGA = 0.40 g, although the absolute difference remains small.
The height-wise drift response also supports this interpretation. As the intensity increases, the precast frame tends to develop stronger drift concentration in the lower stories, which is consistent with deformation localization caused by connection degradation. Therefore, the fragility difference should not be interpreted as a global weakness of the monolithic precast system as a whole, but rather as the system-level consequence of localized connection and interface deterioration. This interpretation agrees with the dynamic progressive-collapse analyses of three-dimensional monolithic precast frames reported by Zeng et al. [61], in which the response is likewise governed by the behavior of the connection region and by slab participation rather than by member flexural capacity, although the limit state and the loading scenario differ from those examined here.
5.2. Sensitivity to Selected Connection, Loading, and Hysteretic Parameters
The parametric analyses further indicate that the fragility difference is sensitive to parameters directly related to interface shear transfer and sleeve bond behavior. The key joint- and structure-level sensitivity results are summarized in Table 14. Within the examined range, the interface friction coefficient and the grout-related bond strength have the most direct influence on the precast joint response. Reducing the interface friction coefficient from μ = 0.6 to μ = 0.4 decreases the ultimate rotation of the precast joint by approximately 10% and reduces its dissipated energy by approximately 8%. At the structure level, this change increases the collapse exceedance probability at PGA = 0.40 g by approximately 0.9 percentage points in the X direction.
Table 14.
Sensitivity of key joint- and structure-level indices to selected connection, loading, and hysteretic parameters.
The effect of grout strength is also significant because the peak bond stress τmax in the sleeve region is evaluated from the grout compressive strength according to Equation (2). When the grout compressive strength is increased by 30% and τmax is recalculated accordingly, the dissipated-energy gap between the precast and CIP joints is reduced by approximately 70%, and the collapse exceedance probability at PGA = 0.40 g decreases by approximately 0.8 percentage points in the X direction. This result indicates that grout compactness and sleeve bond reliability are important construction-controlled factors affecting system-level seismic safety.
The axial load ratio influences the deformation capacity of both CIP and precast joints. Increasing the axial load ratio from 0.3 to 0.6 reduces the ultimate rotation by approximately 15% in both systems, but it does not change the relative ranking between the CIP and precast frames. In contrast, the hysteretic calibration parameters pF, pD, and γ mainly affect the detailed shape of the cyclic response. Varying these parameters by ±20% changes the dissipated energy within approximately ±6%, and the corresponding change in the PC–CIP collapse-probability difference at PGA = 0.40 g remains less than 0.5 percentage points. This suggests that the comparative conclusion is not controlled by a single fitted hysteretic parameter.
These sensitivity results identify interface treatment quality and sleeve grouting quality as the most effective measures for narrowing the fragility gap between monolithic precast and CIP frames. They also indicate that the unfavorable tendency of the precast frame is not primarily caused by global member strength or stiffness but by local connection mechanisms that influence cyclic energy dissipation and deformation capacity.
5.3. Design Implications
The results have several implications for seismic design and construction quality control of monolithic precast RC frames. First, the new-to-old concrete interface at beam–column joints should be treated as a critical force transfer region rather than a secondary construction detail. Adequate roughening, cleanliness, and confinement are needed to maintain shear resistance and delay interface slip under cyclic loading. Second, the grouted-sleeve connection should be checked not only for monotonic strength but also for cyclic bond degradation and slip accumulation. Grout compactness, anchorage length, sleeve detailing, and quality inspection are therefore essential for ensuring stable hysteretic performance.
Third, connection-level ductility should be explicitly considered in nonlinear analysis. Although the global seismic capacity of the monolithic precast frame is broadly comparable to that of the CIP frame in this study, the smaller ultimate rotation and stronger pinching of the precast hinges lead to consistently higher fragility estimates. Therefore, assuming equivalence with CIP construction at the connection level may be unconservative. Finally, for structures located in moderate-to-high seismic intensity regions, performance checks at the design-basis and rare earthquake levels should include the possible effects of interface degradation, sleeve bond slip, and reduced cyclic energy dissipation.
5.4. Limitations
The present study is subject to several limitations. First, the analysis is based on a single six-story prototype frame designed for one site class and one seismic design intensity. Consequently, the quantitative differences in fragility between the monolithic precast and cast-in-place frames may vary with building height, structural layout, reinforcement ratio, site condition, and seismic design level. Therefore, the present conclusions are most directly applicable to regular, code-designed, low- to medium-rise monolithic precast moment frames that are first-mode dominated and develop a beam-hinge-dominated inelastic mechanism. They should not be directly extrapolated to tall or plan-irregular buildings, dry-connected or prestressed precast systems, soft-soil sites, or structures subjected predominantly to near-fault ground motions. A broader set of structural archetypes covering different heights, configurations, site classes, and seismic design intensities is required to evaluate the generality of the observed trends.
Second, validation of the refined joint model is based on two representative precast beam–column joint specimens, while the system-level fragility assessment employs a suite of 20 generic far-field ground motions. Although the agreement between the numerical models and the available tests supports the present comparative analysis, a broader experimental database would improve the robustness of the identified hysteretic parameters. Likewise, a larger and more diverse ground-motion suite would reduce the statistical uncertainty of the fragility estimates and allow the influence of record characteristics to be examined more systematically.
Third, PGA is adopted as the intensity measure, in order to maintain consistency with the code-oriented frequent, design-basis, and rare earthquake levels used in the fragility matrices. Although the PSDM regressions exhibit relatively high coefficients of determination and acceptable conditional demand dispersions for the present first-mode-dominated frames, PGA is not necessarily the most efficient intensity measure for other structural configurations. Future studies should therefore examine spectral-acceleration-based measures, such as Sa(T1), as well as vector-valued intensity measures and more comprehensive treatments of modeling, capacity, and connection-parameter uncertainties.
Fourth, only horizontal ground-motion components are considered in the present IDA, whereas the vertical component is neglected. Recent post-earthquake investigations of precast industrial buildings have highlighted the potential importance of vertical excitation in connection-related damage and girder-support response [62]. Although the monolithic precast system investigated herein differs from hinged industrial precast systems, vertical acceleration may still induce transient variations in column axial force and, consequently, in the normal stress acting across the new-to-old concrete interface. Such variations may affect interface opening and closure, frictional shear transfer, local uplift-related response, and sleeve–grout–rebar bond-slip behavior. Because these mechanisms are specific to the precast connection region, the precast system may be more sensitive than the corresponding cast-in-place system to vertical-excitation-induced axial-force fluctuations. Accordingly, inclusion of the vertical component could modify the magnitude of the fragility difference observed in the present horizontal-only analyses. The direction and magnitude of this effect cannot be established from the current results and should be investigated through three-component nonlinear dynamic analyses, particularly using records with significant vertical components and near-fault characteristics.
Finally, the damage-state thresholds adopted in the fragility analysis are intended primarily for comparative assessment. The elastic and elasto-plastic drift limits are anchored to GB 50011-2010, whereas the intermediate drift ratios are analytical classification boundaries rather than universally established or experimentally identified performance limits. Although the same thresholds are applied consistently to both structural systems, future studies should examine the sensitivity of the resulting fragility estimates to alternative damage-state definitions and experimentally calibrated limit states.
Despite these limitations, the proposed framework provides a transparent and reproducible route for transferring joint-level degrading hysteretic behavior into structure-level fragility analysis. The framework can be extended to other precast connection types, broader structural archetype sets, alternative intensity measures, three-component ground-motion input, and more comprehensive uncertainty treatments.
6. Conclusions
This study developed an integrated joint-to-system framework for evaluating the seismic fragility of monolithic precast RC frames with cast-in-place joint cores and grouted-sleeve connections. The framework was applied to a code-designed six-story prototype frame and a comparable cast-in-place frame. The principal contribution lies not in any individual modeling or fragility-analysis procedure, but in the transparent transfer route linking refined joint-level hysteretic behavior to structure-level nonlinear response and fragility, with the intermediate quantities required for reproduction explicitly reported. The main conclusions are as follows.
- (1)
- The refined explicit FE interface-spring/contact model, incorporating Mohr–Coulomb interface behavior and bond-slip springs based on the fib Model Code, reproduces the measured cyclic response of representative exterior and interior precast joints with discrepancies within approximately 13% for the evaluated response indices. Because the principal interface and bond parameters are independently specified rather than fitted to the validation specimens, the comparison provides validation of the modeling strategy rather than specimen-specific calibration.
- (2)
- The proposed identification and transfer procedure provides an auditable link between joint- and structure-level models. The procedure includes conversion of the joint response to equivalent M–θ relations, normalization and parameter identification of the joint backbones, and back-calibration of concentrated plastic hinges in SAP2000. The calibrated simplified hinge model reproduces the peak strength of the validation subassembly within approximately 6% and cumulative dissipated energy within approximately 10%.
- (3)
- At the connection level, the monolithic precast joints exhibit yield strength broadly comparable to that of their cast-in-place counterparts but different post-yield and cyclic characteristics. The identified precast response is characterized by stronger pinching, reduced reloading stiffness, lower residual strength, and smaller ultimate rotation capacity. These differences are associated with new-to-old interface slip, sleeve–grout–rebar bond slip, and localized connection degradation, and they lead to consistently larger maximum inter-story drift demands in the precast frame under the same ground-motion intensity.
- (4)
- At the structural level, the two systems exhibit broadly comparable global seismic performance, while the precast frame shows a consistent but modest unfavorable tendency. Under the frequent earthquake level, the probabilities of remaining intact are lower for the precast frame by 5.22 and 3.98 percentage points in the X and Y directions, respectively. At PGA = 0.40 g, the collapse-level exceedance probability increases from 2.99% to 3.72% in the X direction and from 1.60% to 2.04% in the Y direction, corresponding to absolute differences of 0.73 and 0.44 percentage points. These differences are not statistically resolved at the 95% confidence level for the present 20-record suite; however, their consistent sign across directions, intensity levels, damage states, and the examined dispersion range indicates a systematic but modest tendency rather than a pronounced deterioration in global performance.
- (5)
- Properly detailed monolithic precast frames with cast-in-place joint cores and grouted-sleeve splices can achieve seismic performance close to that of comparable cast-in-place frames. Nevertheless, equivalence at the global structural level should not be interpreted as identical connection behavior. Interface roughness, grout compactness, sleeve bond reliability, and connection-region ductility remain important factors governing cyclic degradation, and should therefore be explicitly considered in nonlinear modeling, seismic performance assessment, design detailing, and construction quality control.
Author Contributions
X.H.: methodology, software, validation, formal analysis, data curation, writing—original draft preparation, and visualization. D.X.: conceptualization, methodology, resources, supervision, project administration, funding acquisition, and writing—review and editing. H.W.: methodology, validation, resources, supervision, funding acquisition, and writing—review and editing. Y.L.: validation, investigation, visualization, and writing—review and editing. J.Y.: investigation, resources, and writing—review and editing. X.Y.: software, formal analysis, data curation, visualization, and writing—review and editing. B.W.: validation, investigation, data curation, and writing—review and editing. All authors have read and agreed to the published version of the manuscript.
Funding
This research was funded by the project “Key Technologies for Creating Life-Saving Passages in Major Earthquake Disaster Rescue in Northwest China” (2025-Earthquake Geology Division-Rescue 22) and by the Open Foundation of the Key Laboratory of Life Search and Rescue Technology for Earthquake and Geological Disaster, Ministry of Emergency Management of China (No. LSR2502).
Data Availability Statement
The data presented in this study are available from the corresponding author upon reasonable request.
Conflicts of Interest
Author Jiaqi Yang is employed by Power China Huadong Engineering Corporation Limited; the company had no role in the design of the study, in the collection, analyses, or interpretation of data, in the writing of the manuscript, or in the decision to publish the results.
References
- Mao, C.; Shen, Q.; Shen, L.; Tang, L. Comparative study of greenhouse gas emissions between off-site prefabrication and conventional construction methods: Two case studies of residential projects. Energy Build. 2013, 66, 165–176. [Google Scholar] [CrossRef] [Scilit]
- Jaillon, L.; Poon, C.S.; Chiang, Y.H. Quantifying the waste reduction potential of using prefabrication in building construction in Hong Kong. Waste Manag. 2009, 29, 309–320. [Google Scholar] [CrossRef] [Scilit]
- Teng, Y.; Li, K.; Pan, W.; Ng, T. Reducing building life cycle carbon emissions through prefabrication: Evidence from and gaps in empirical studies. Build. Environ. 2018, 132, 125–136. [Google Scholar] [CrossRef] [Scilit]
- Cao, X.; Li, X.; Zhu, Y.; Zhang, Z. A comparative study of environmental performance between prefabricated and traditional residential buildings in China. J. Clean. Prod. 2015, 109, 131–143. [Google Scholar] [CrossRef] [Scilit]
- Senel, S.M.; Palanci, M. Structural aspects and seismic performance of 1-story precast buildings in Turkey. J. Perform. Constr. Facil. 2013, 27, 437–449. [Google Scholar] [CrossRef] [Scilit]
- Palanci, M.; Senel, S.M.; Kalkan, A. Assessment of one story existing precast industrial buildings in Turkey based on fragility curves. Bull. Earthq. Eng. 2017, 15, 271–289. [Google Scholar] [CrossRef] [Scilit]
- Kurama, Y.C.; Sritharan, S.; Fleischman, R.B.; Restrepo, J.I.; Henry, R.S.; Cleland, N.M.; Ghosh, S.K.; Bonelli, P. Seismic-resistant precast concrete structures: State of the art. J. Struct. Eng. 2018, 144, 03118001. [Google Scholar] [CrossRef] [Scilit]
- Hu, Y.X. Earthquake Engineering, 2nd ed.; Seismological Press: Beijing, China, 2006. (In Chinese) [Google Scholar]
- Yu, X.H.; Lü, D.G.; Wang, G.Y. Research progress on seismic fragility analysis of civil engineering structures. In Proceedings of the 2nd International Forum on Advances in Structural Engineering, Beijing, China, 10–11 October 2008; pp. 763–774. [Google Scholar]
- Sezen, H.; Whittaker, A.S. Seismic performance of industrial facilities affected by the 1999 Turkey earthquake. J. Perform. Constr. Facil. 2006, 20, 28–36. [Google Scholar] [CrossRef] [Scilit]
- Arslan, M.H.; Korkmaz, H.H.; Gulay, F.G. Damage and failure pattern of prefabricated structures after major earthquakes in Turkey and shortfalls of the Turkish Earthquake Code. Eng. Fail. Anal. 2006, 13, 537–557. [Google Scholar] [CrossRef] [Scilit]
- Bournas, D.A.; Negro, P.; Taucer, F.F. Performance of industrial buildings during the Emilia earthquakes in Northern Italy and recommendations for their strengthening. Bull. Earthq. Eng. 2014, 12, 2383–2404. [Google Scholar] [CrossRef] [Scilit]
- Buratti, N.; Minghini, F.; Ongaretto, E.; Savoia, M.; Tullini, N. Empirical seismic fragility for the precast RC industrial buildings damaged by the 2012 Emilia (Italy) earthquakes. Earthq. Eng. Struct. Dyn. 2017, 46, 2317–2335. [Google Scholar] [CrossRef] [Scilit]
- Avğın, S.; Köse, M.M.; Çınar, M. Critical review of design practices and observed damages in precast industrial buildings: Evidence from the February 2023 Türkiye earthquakes. Bull. Earthq. Eng. 2026, 24, 1151–1188. [Google Scholar] [CrossRef] [Scilit]
- Zhang, P.; Lu, Z.H.; Dan, H. Investigation and analysis of seismic damage of precast assembled monolithic structures during the Wenchuan earthquake. Sichuan Build. Sci. 2010, 36, 129–133. (In Chinese) [Google Scholar]
- Park, R. A perspective on the seismic design of precast concrete structures in New Zealand. PCI J. 1995, 40, 40–60. [Google Scholar] [CrossRef] [Scilit]
- Ghosh, S.K.; Cleland, N. Observations from the February 27, 2010, earthquake in Chile. PCI J. 2012, 57, 52–75. [Google Scholar] [CrossRef] [Scilit]
- Palanci, M.; Senel, S.M. Earthquake damage assessment of 1-story precast industrial buildings using damage probability matrices. Bull. Earthq. Eng. 2019, 17, 5241–5263. [Google Scholar] [CrossRef] [Scilit]
- Whitman, R.V. Seismic Design Decision Analysis, Report No. 8: Damage Probability Matrices for Prototype Buildings; R73-57; Massachusetts Institute of Technology: Cambridge, MA, USA, 1973. [Google Scholar]
- Casotto, C.; Silva, V.; Crowley, H.; Nascimbene, R.; Pinho, R. Seismic fragility of Italian RC precast industrial structures. Eng. Struct. 2015, 94, 122–136. [Google Scholar] [CrossRef] [Scilit]
- Babič, A.; Dolšek, M. Seismic fragility functions of industrial precast building classes. Eng. Struct. 2016, 118, 357–370. [Google Scholar] [CrossRef] [Scilit]
- Im, H.J.; Park, H.G.; Eom, T.S. Cyclic loading test for reinforced-concrete-emulated beam–column connection of precast concrete moment frame. ACI Struct. J. 2013, 110, 115–126. [Google Scholar] [CrossRef] [Scilit]
- Ameli, M.J.; Parks, J.E.; Brown, D.N.; Pantelides, C.P. Seismic evaluation of grouted splice sleeve connections for reinforced precast concrete column-to-cap beam joints in accelerated bridge construction. PCI J. 2015, 60, 80–103. [Google Scholar] [CrossRef] [Scilit]
- Popa, V.; Papurcu, A.; Cotofana, D.; Pascu, R. Experimental testing on emulative connections for precast columns using grouted corrugated steel sleeves. Bull. Earthq. Eng. 2015, 13, 2429–2447. [Google Scholar] [CrossRef] [Scilit]
- Yan, Q.; Chen, T.; Xie, Z. Seismic experimental study on a precast concrete beam-column connection with grout sleeves. Eng. Struct. 2018, 155, 330–344. [Google Scholar] [CrossRef] [Scilit]
- Liu, H.T.; Yan, Q.S.; Du, X.L. Study of seismic performance of reinforced concrete frame beam–column joints connected with grouted sleeves. J. Build. Struct. 2017, 38, 54–61. (In Chinese) [Google Scholar]
- Fan, J.J.; Wu, G.; Feng, D.C.; Zeng, Y.H.; Lu, Y. Seismic performance of a novel self-sustaining beam–column connection for precast concrete moment-resisting frames. Eng. Struct. 2020, 222, 111096. [Google Scholar] [CrossRef] [Scilit]
- Xu, D.F.; Wang, Y.R.; Dai, J.W. Study on numerical simulation method of seismic collapse of reinforced concrete frame structure. Earthq. Eng. Eng. Dyn. 2022, 42, 134–142. (In Chinese) [Google Scholar] [CrossRef]
- Xu, D.; Sun, F.; Zhao, H.; Qi, H.; Chen, L.; Hu, T. Study on secondary collapse of the bottom frame masonry structure in semi-ruined state based on FEM–FDEM. Sci. Rep. 2024, 14, 29405. [Google Scholar] [CrossRef] [Scilit]
- Xu, D.; Dai, J.; Chen, L. Study on construction and optimization of the life-saving passages in building ruins based on numerical simulation. Shock Vib. 2023, 2023, 3670668. [Google Scholar] [CrossRef] [Scilit]
- Wu, B.Y.; Dai, J.W.; Jin, H. Numerical simulation on seismic performance of retrofitted masonry walls based on combined finite–discrete element method. Earthq. Eng. Eng. Vib. 2023, 22, 777–805. [Google Scholar] [CrossRef] [Scilit]
- Xu, D.F.; Dai, J.W.; Yang, Y.Q. Study on numerical simulation of seismic collapse of RC frame structure with infilled wall. Adv. Civ. Eng. 2022, 2022, 1890091. [Google Scholar] [CrossRef] [Scilit]
- Fédération Internationale du Béton (fib). fib Model Code for Concrete Structures 2010; Ernst & Sohn: Berlin, Germany, 2013. [Google Scholar]
- Randl, N. Design recommendations for interface shear transfer in fib Model Code 2010. Struct. Concr. 2013, 14, 230–241. [Google Scholar] [CrossRef] [Scilit]
- Monserrat-López, A.; Nogales, A.; de la Fuente, A. Experimental characterization of concrete-to-concrete interface shear strength: Design-oriented constitutive parameters. Structures 2023, 55, 1172–1185. [Google Scholar] [CrossRef] [Scilit]
- Taklas, M.; Leblouba, M.; Barakat, S.; Fageeri, A.; Mohamad, F. Concrete-to-concrete shear friction behavior under cyclic loading: Experimental investigation. Sci. Rep. 2022, 12, 9451. [Google Scholar] [CrossRef] [Scilit]
- Mander, J.B.; Priestley, M.J.N.; Park, R. Theoretical stress–strain model for confined concrete. J. Struct. Eng. 1988, 114, 1804–1826. [Google Scholar] [CrossRef] [Scilit]
- Takeda, T.; Sozen, M.A.; Nielsen, N.N. Reinforced concrete response to simulated earthquakes. J. Struct. Div. 1970, 96, 2557–2573. [Google Scholar] [CrossRef] [Scilit]
- Otani, S. Hysteresis models of reinforced concrete for earthquake response analysis. J. Fac. Eng. Univ. Tokyo Ser. B 1981, XXXVI, 407–441. [Google Scholar]
- Grant, D.N.; Blandon, C.A.; Priestley, M.J.N. Modelling Inelastic Response in Direct Displacement-Based Seismic Design; Research Report ROSE-2004/02; IUSS Press: Pavia, Italy, 2004. [Google Scholar]
- Priestley, M.J.N.; Grant, D.N.; Blandon, C.A. Direct displacement-based seismic design. In Proceedings of the 2005 NZSEE Conference, Wairakei, New Zealand, 11–13 March 2005. Paper 33. [Google Scholar]
- Priestley, M.J.N.; Calvi, G.M.; Kowalsky, M.J. Displacement-Based Seismic Design of Structures; IUSS Press: Pavia, Italy, 2007. [Google Scholar]
- Chen, S.C.; Yan, W.M.; Wang, W.M. Seismic behavior of exterior beam-to-column joints with layered slab of large precast concrete structures. J. Build. Struct. 2011, 32, 60–67. (In Chinese) [Google Scholar]
- Chen, S.C.; Yan, W.M.; Li, Z.B. Experimental study on seismic performance of precast concrete beam–column composite slab interior joints. Eng. Mech. 2012, 29, 135–141. (In Chinese) [Google Scholar]
- Chen, J.G.; Dai, J.W.; Yang, Y.Q. Numerical simulation analysis on seismic performance of precast concrete beam–column–composite slab joints. Earthq. Eng. Eng. Dyn. 2023, 43, 128–139. (In Chinese) [Google Scholar]
- Yang, H. Experimental Study on Seismic Performance of Precast Concrete Frame Joints. Master’s Thesis, North China University of Technology, Beijing, China, 2014. (In Chinese) [Google Scholar]
- ASCE/SEI 41-13; Seismic Evaluation and Retrofit of Existing Buildings. American Society of Civil Engineers: Reston, VA, USA, 2014. [CrossRef] [Scilit]
- Paulay, T.; Priestley, M.J.N. Seismic Design of Reinforced Concrete and Masonry Buildings; John Wiley & Sons: New York, NY, USA, 1992. [Google Scholar] [CrossRef] [Scilit]
- FEMA. Prestandard and Commentary for the Seismic Rehabilitation of Buildings; FEMA 356; Federal Emergency Management Agency: Washington, DC, USA, 2000.
- Dowell, R.K.; Seible, F.; Wilson, E.L. Pivot hysteresis model for reinforced concrete members. ACI Struct. J. 1998, 95, 607–617. [Google Scholar] [CrossRef] [Scilit]
- GB 50011-2010; Code for Seismic Design of Buildings. China Architecture & Building Press: Beijing, China, 2010. (In Chinese)
- GB 50010-2010; Code for Design of Concrete Structures. China Architecture & Building Press: Beijing, China, 2010. (In Chinese)
- GB/T 51231-2016; Technical Standard for Assembled Buildings with Concrete Structure. China Architecture & Building Press: Beijing, China, 2016. (In Chinese)
- JGJ 1-2014; Technical Specification for Precast Concrete Structures. China Architecture & Building Press: Beijing, China, 2014. (In Chinese)
- FEMA. Quantification of Building Seismic Performance Factors; FEMA P-695; Federal Emergency Management Agency: Washington, DC, USA, 2009.
- Rasa, A.Y.; Song, Y.; Wahab, A.G. Seismic reliability assessment of direct and modal methods: Application to Sarıyar Dam. Earthq. Spectra 2026, 42, e70070. [Google Scholar] [CrossRef] [Scilit]
- Cornell, C.A.; Jalayer, F.; Hamburger, R.O.; Foutch, D.A. Probabilistic basis for 2000 SAC Federal Emergency Management Agency steel moment frame guidelines. J. Struct. Eng. 2002, 128, 526–533. [Google Scholar] [CrossRef] [Scilit]
- Aslani, H.; Miranda, E. Probability-based seismic response analysis. Eng. Struct. 2005, 27, 1151–1163. [Google Scholar] [CrossRef] [Scilit]
- FEMA. Hazus-MH MR4 Multi-Hazard Loss Estimation Methodology, Earthquake Model: Technical Manual; Federal Emergency Management Agency: Washington, DC, USA, 2003.
- Chong, C.; Chen, M.; Wang, M.; Wei, L. A Fast Fragility Analysis Method for Seismically Isolated RC Structures. Buildings 2025, 15, 2449. [Google Scholar] [CrossRef] [Scilit]
- Zeng, Y.; Li, Y.; Sun, M.; Noori, M.; Wei, X. Dynamic progressive collapse response of 3D monolithic precast concrete frame structures considering slab effects. Structures 2024, 60, 105928. [Google Scholar] [CrossRef] [Scilit]
- Senel, S.M.; Kayhan, A.H.; Palanci, M.; Demir, A. Assessment of Damages in Precast Industrial Buildings in the Aftermath of Pazarcık and Elbistan Earthquakes. J. Earthq. Eng. 2025, 29, 3337–3366. [Google Scholar] [CrossRef] [Scilit]
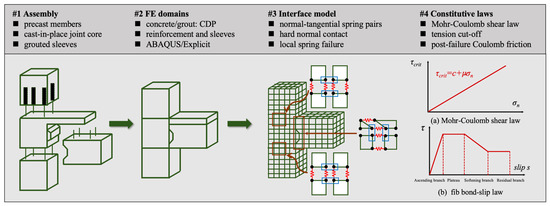
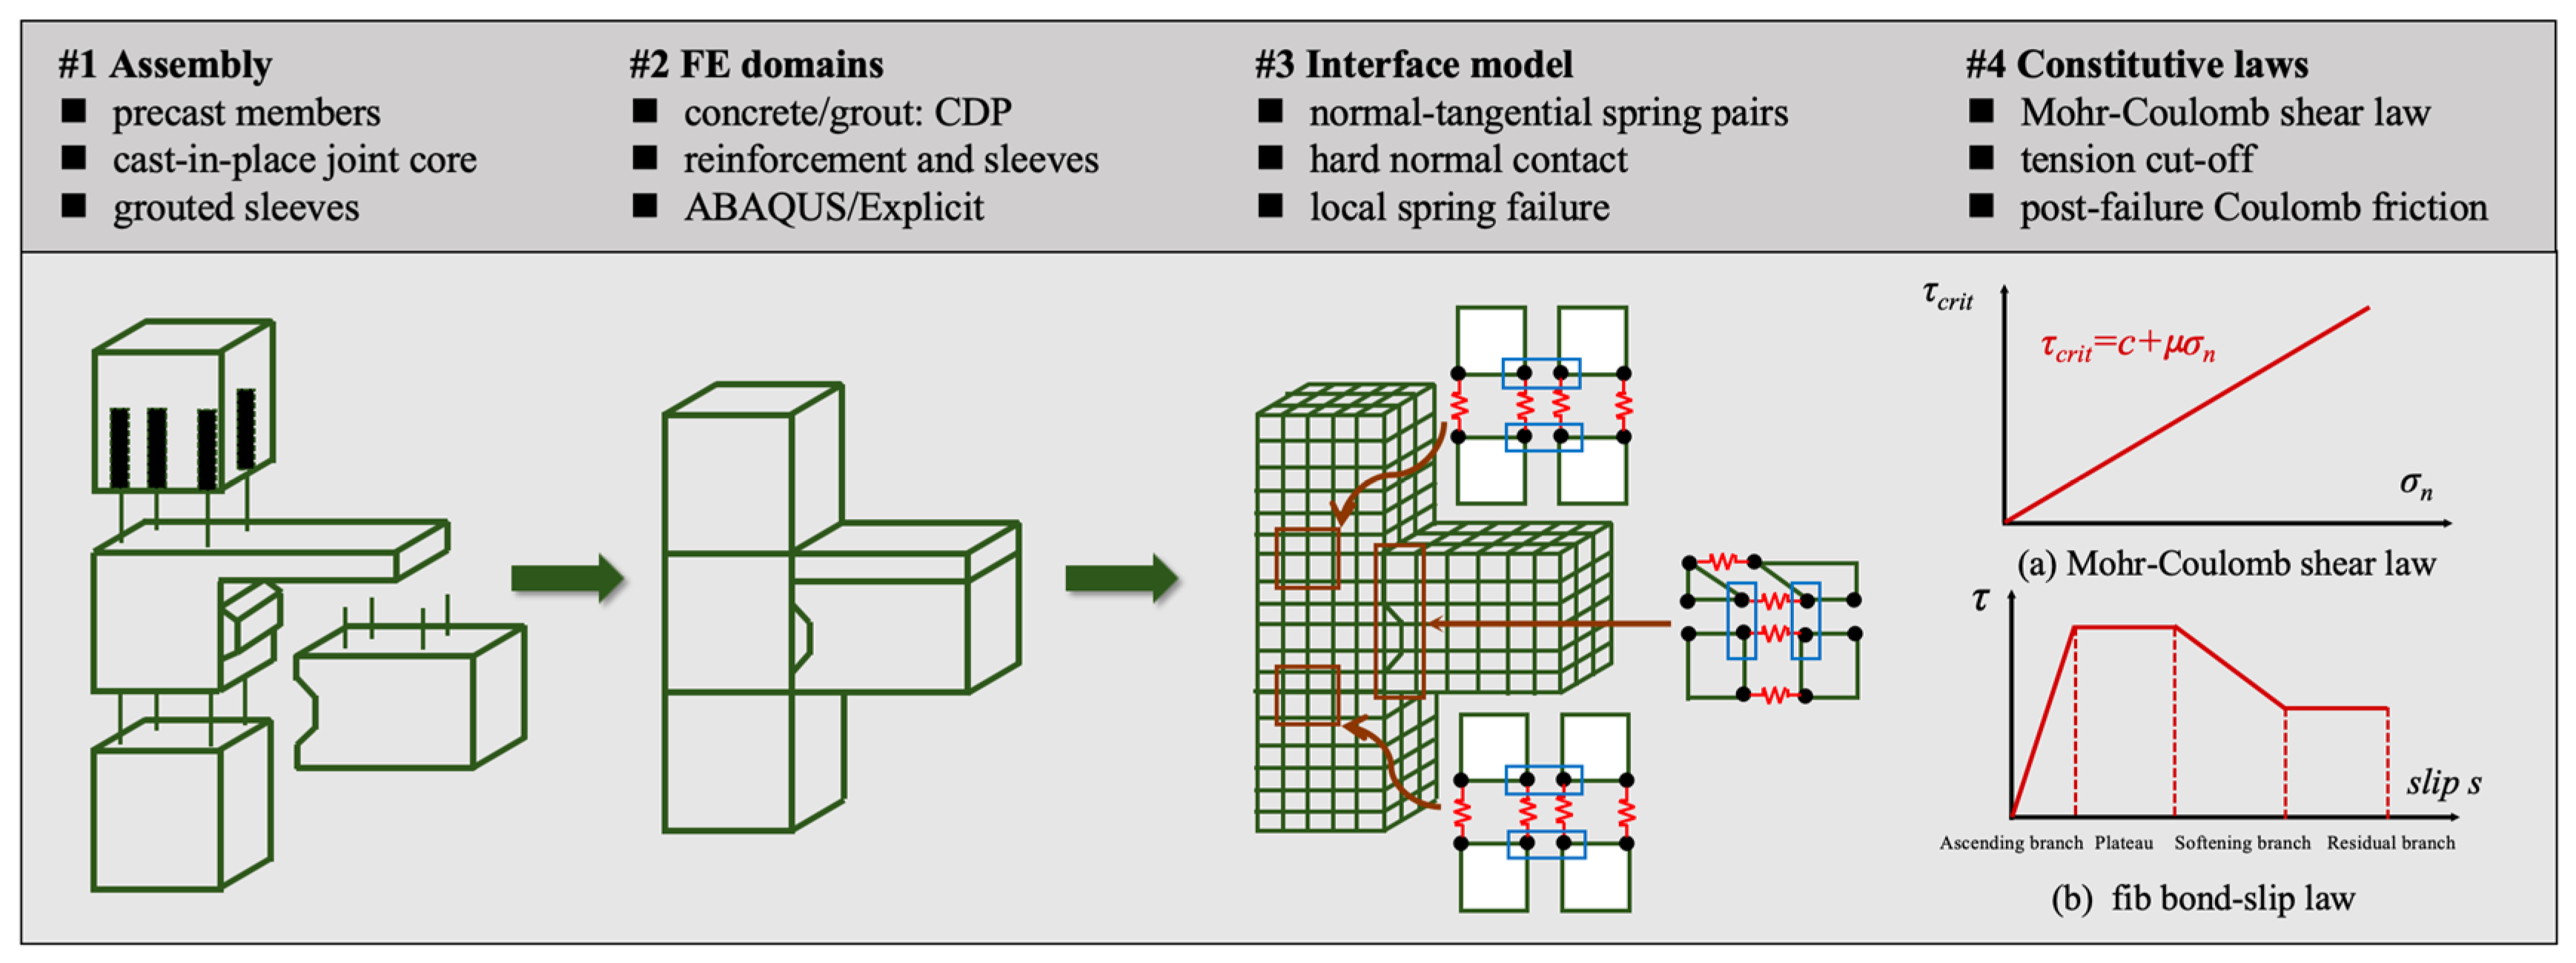
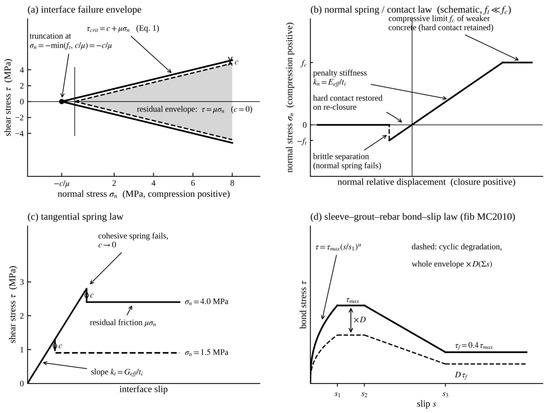
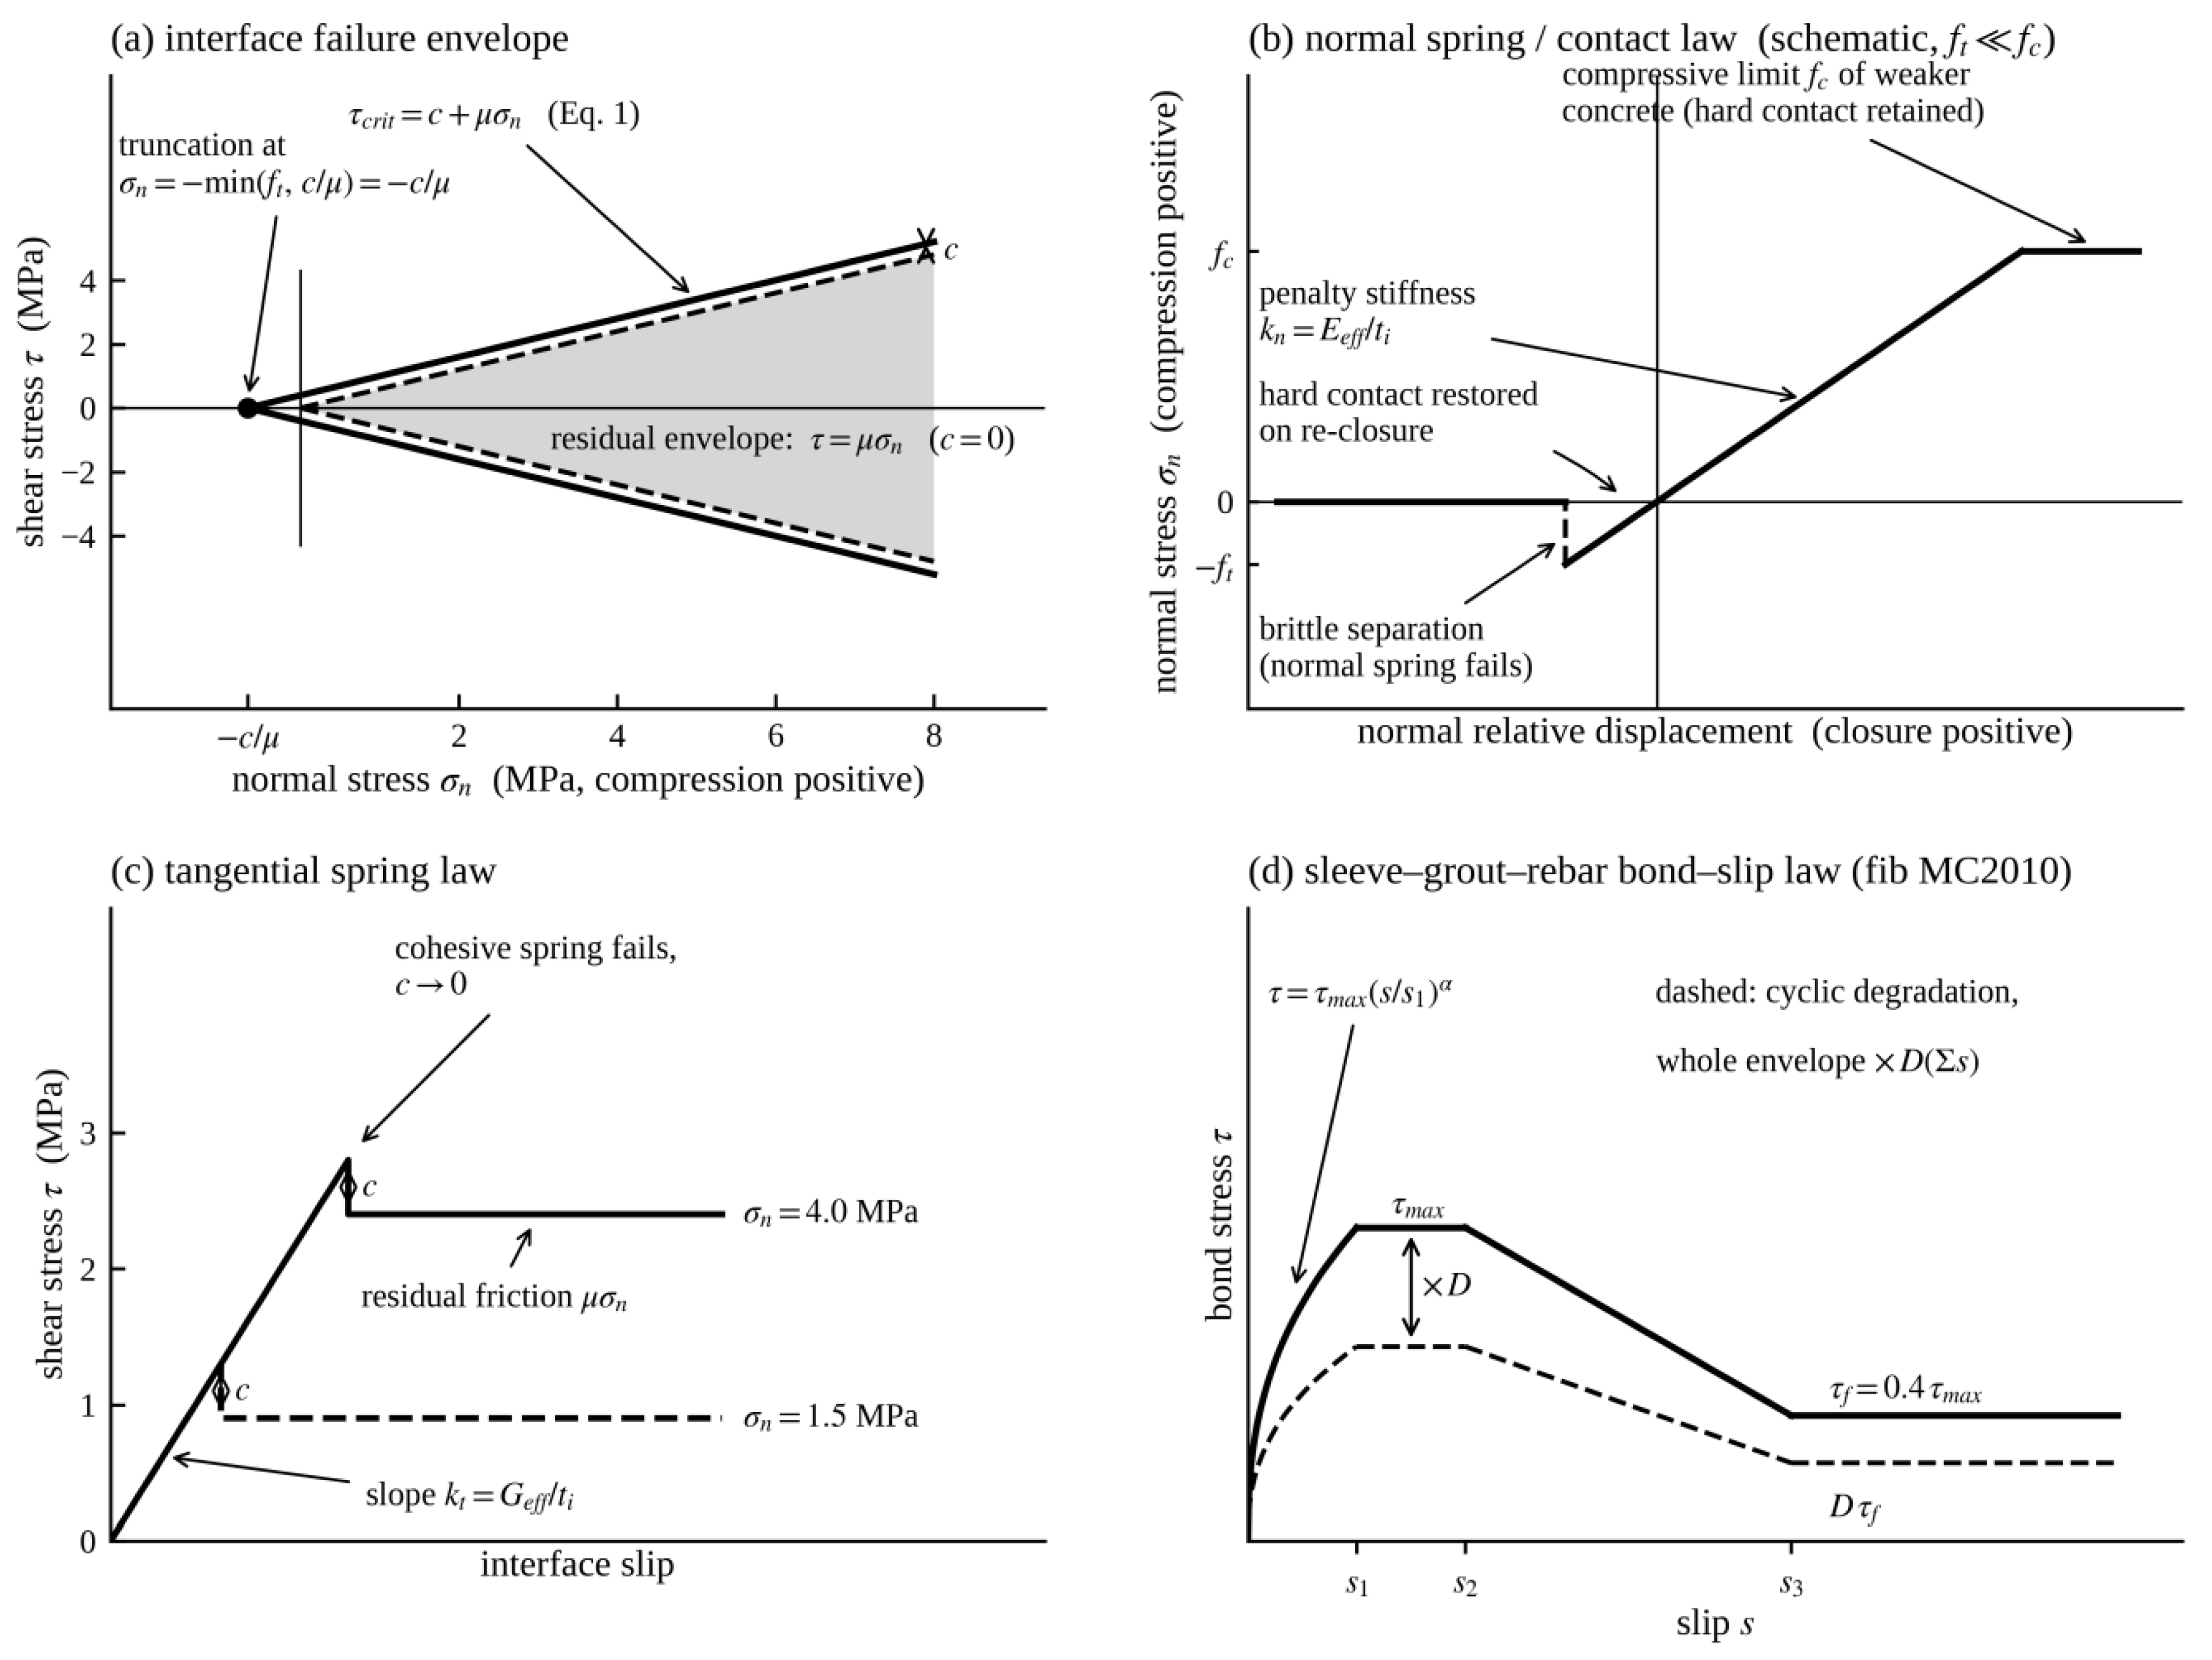
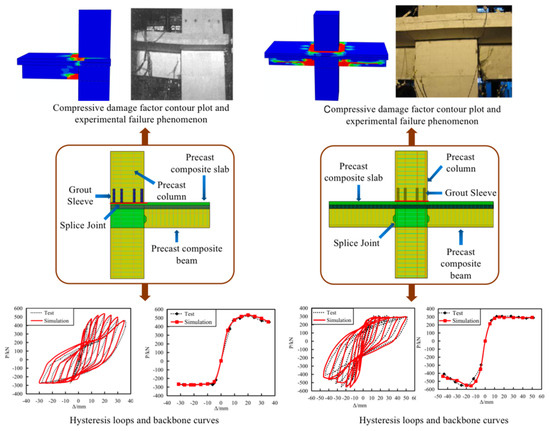
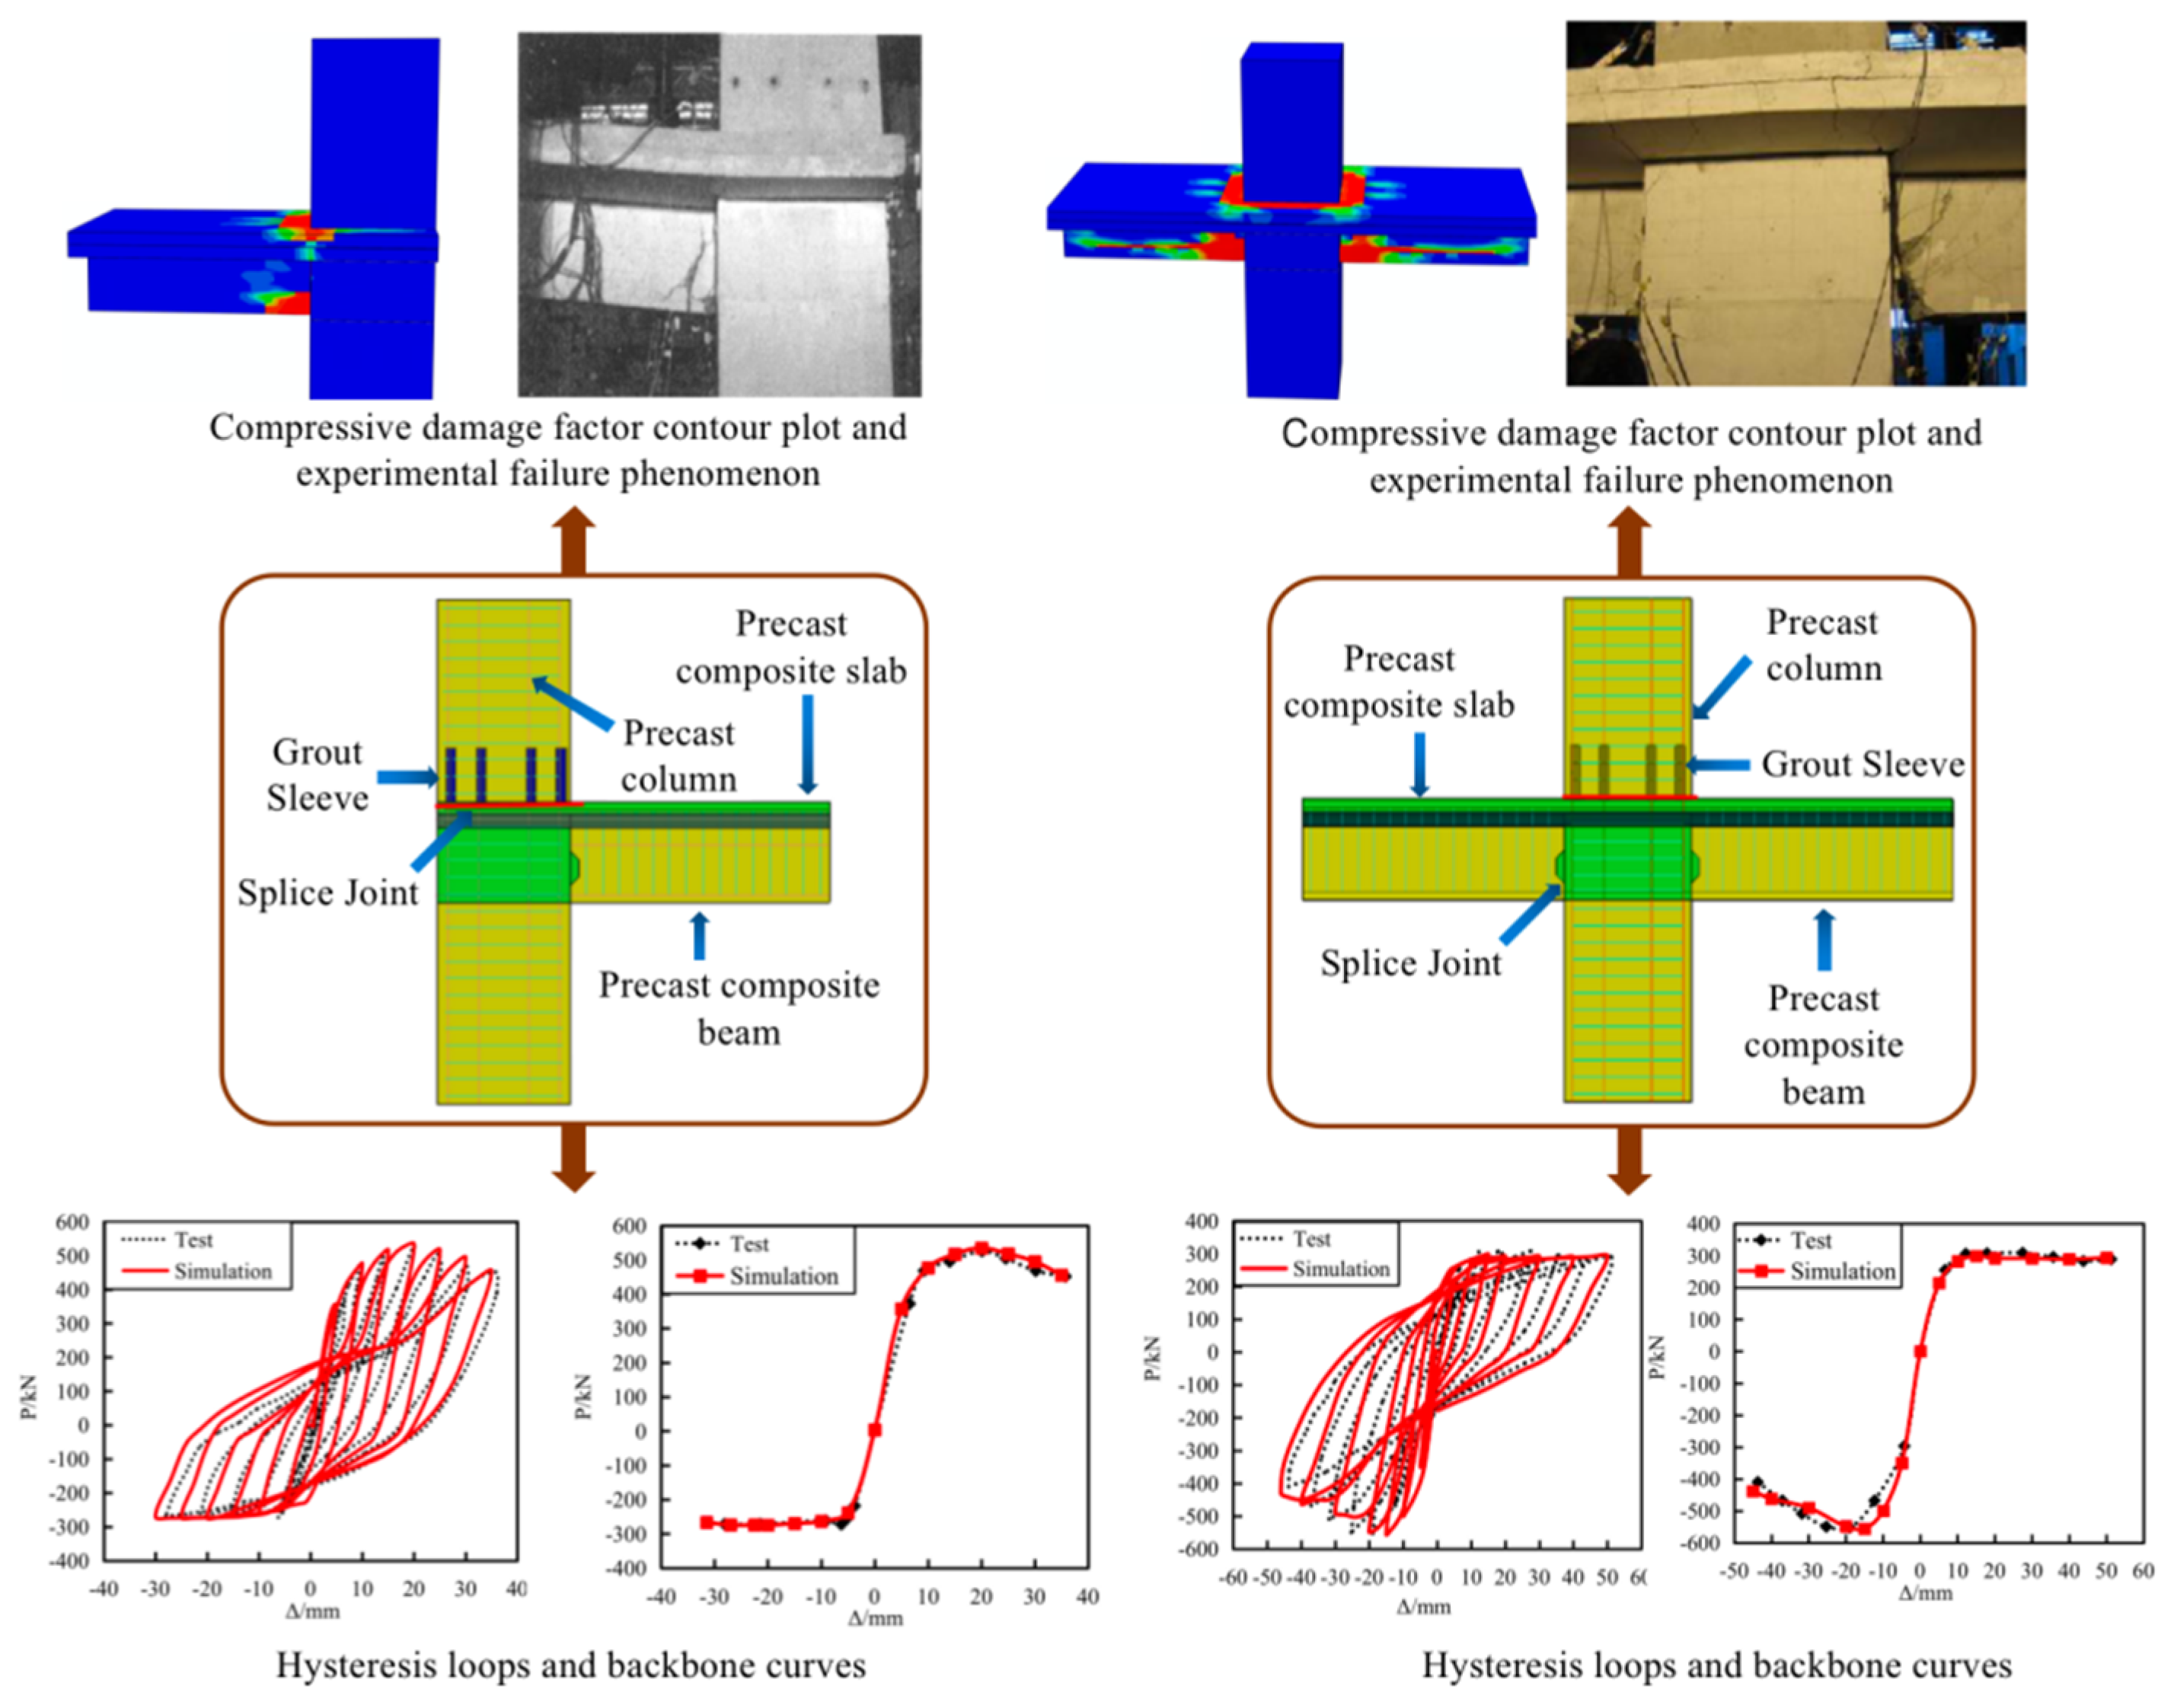
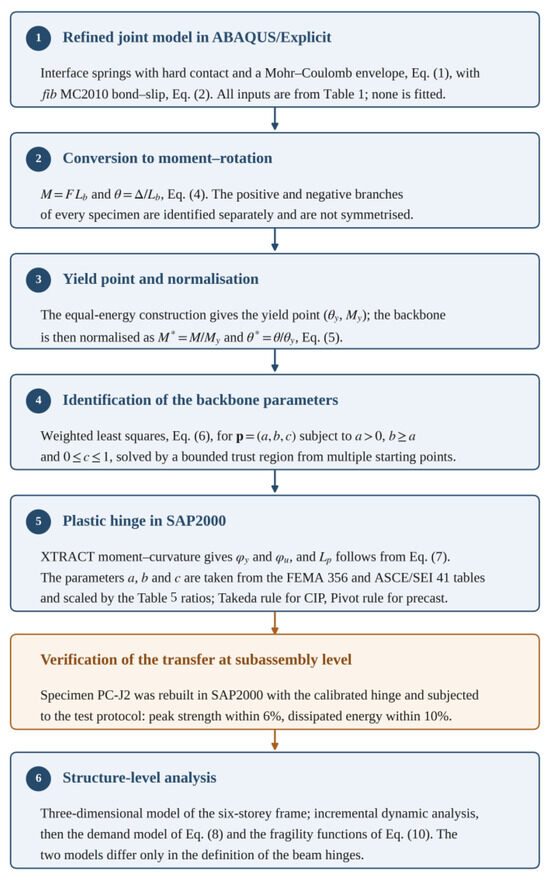
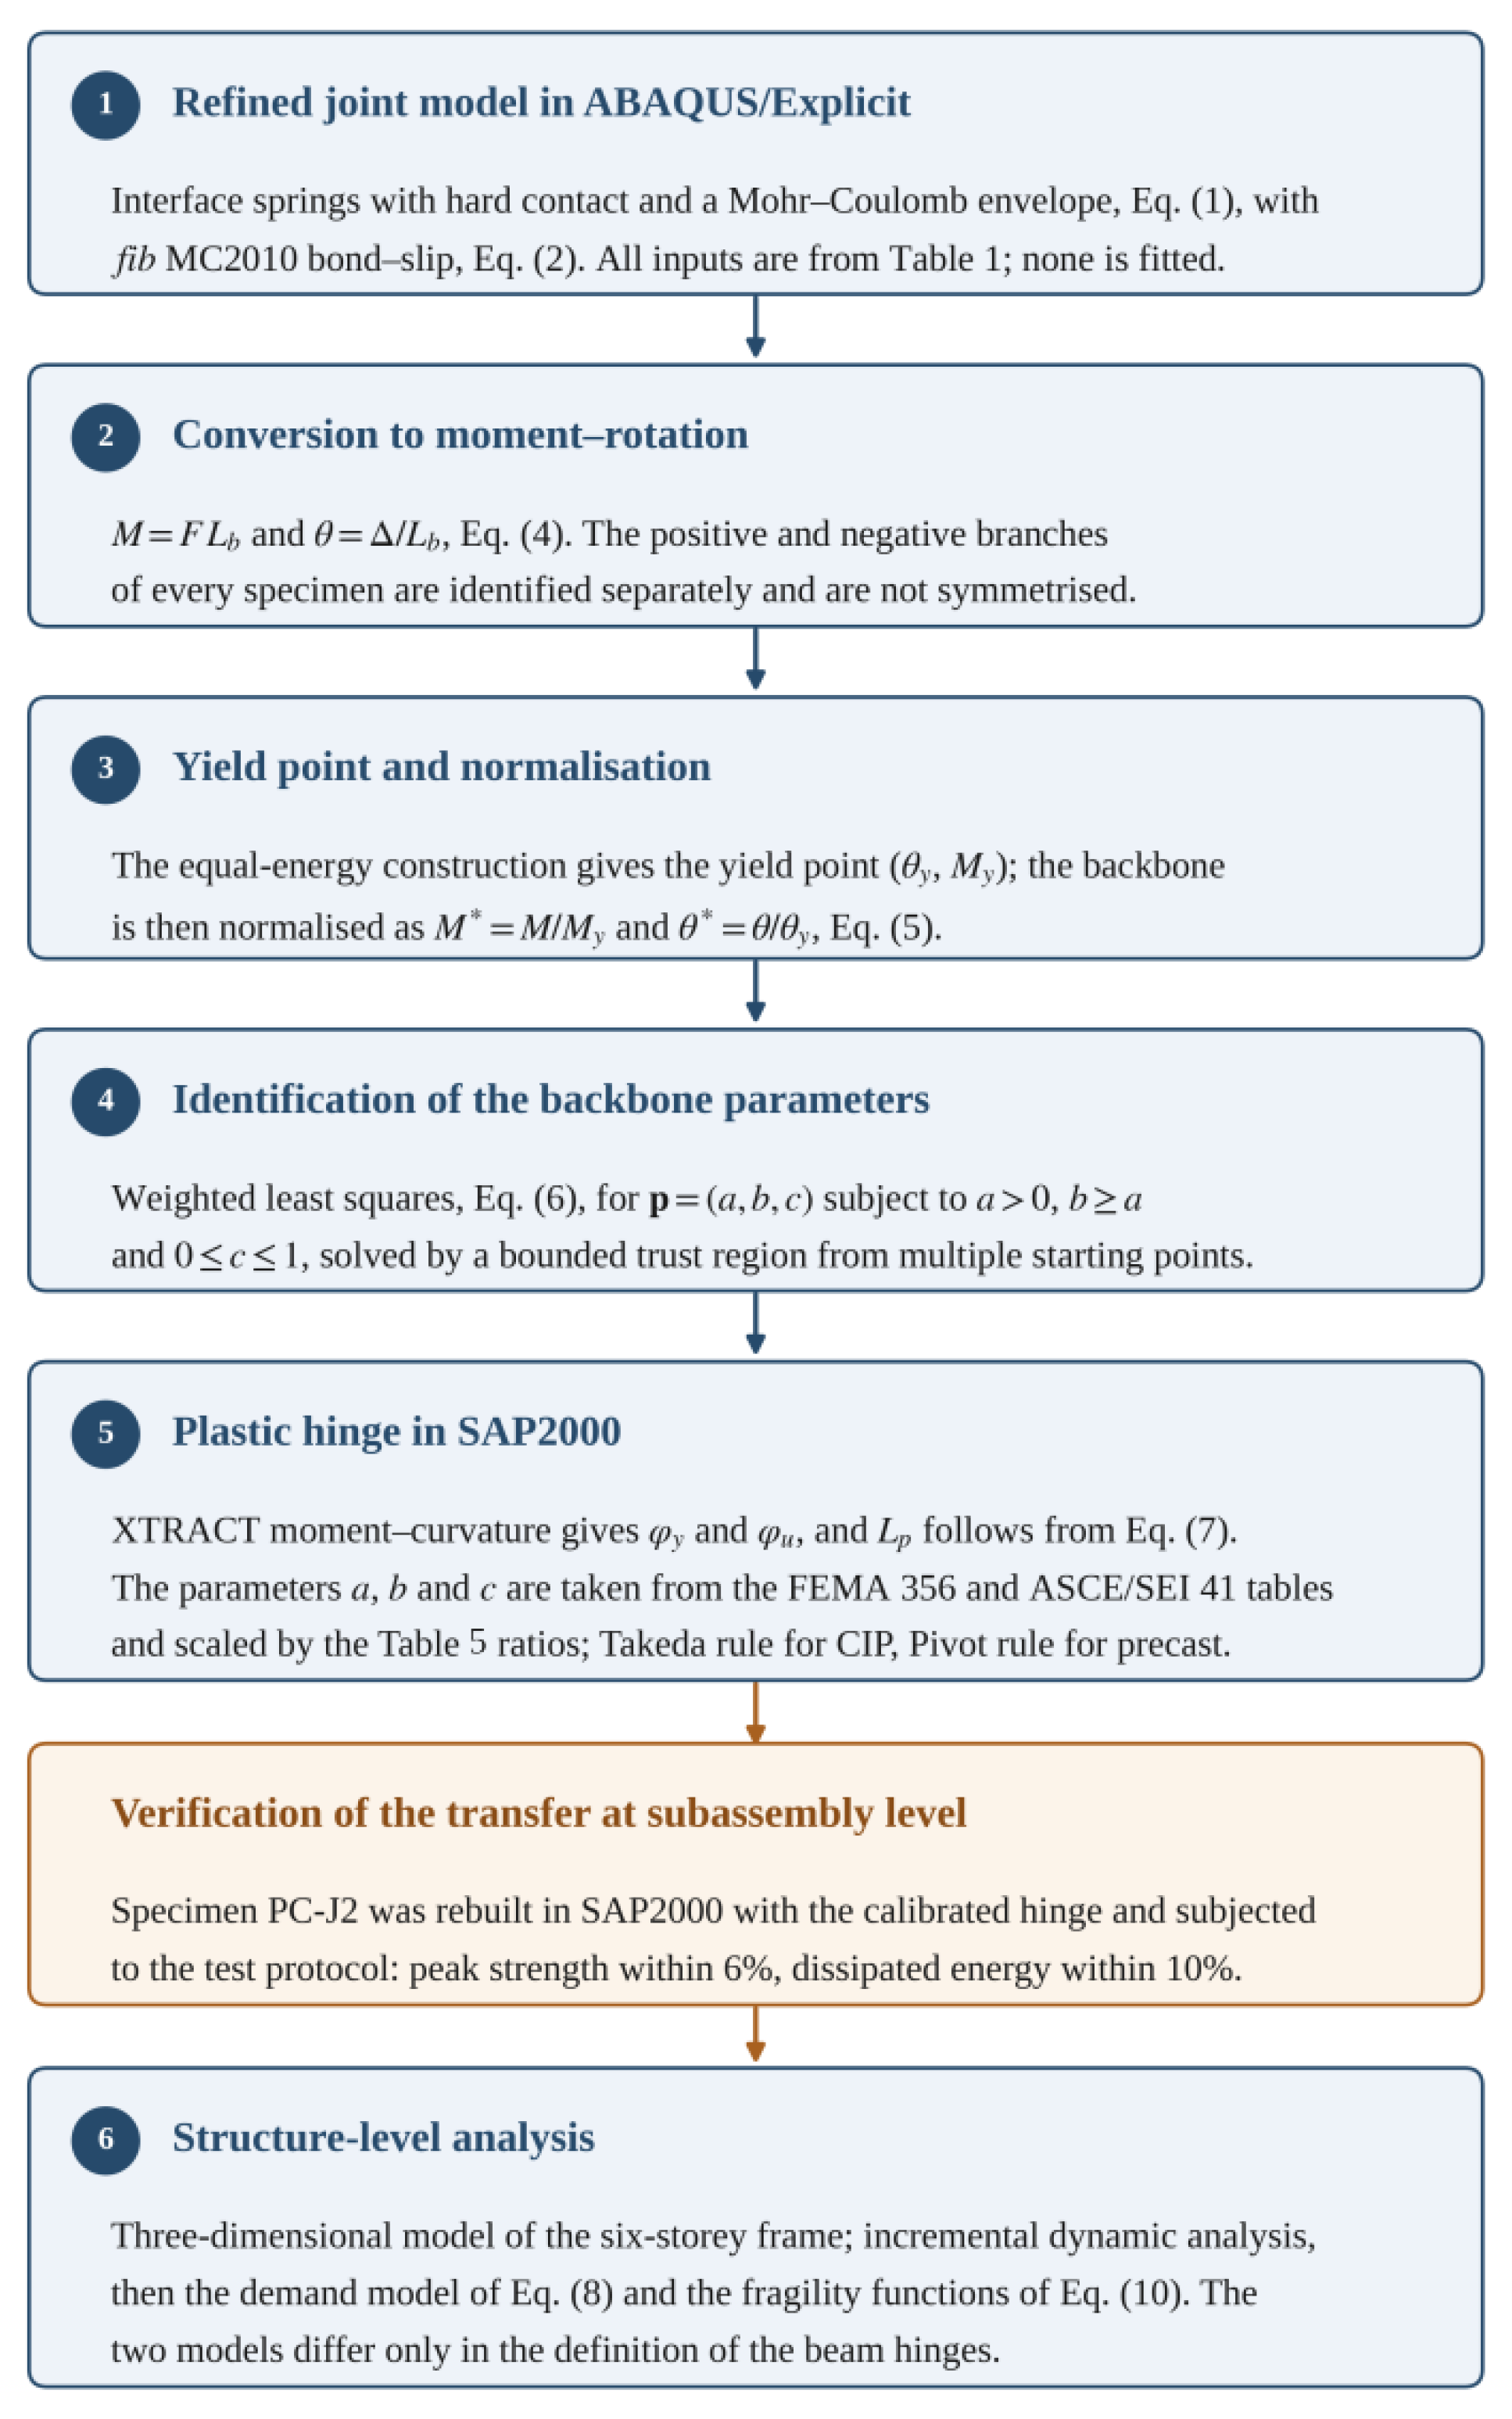
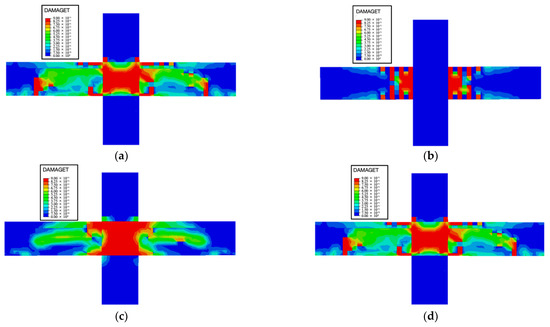
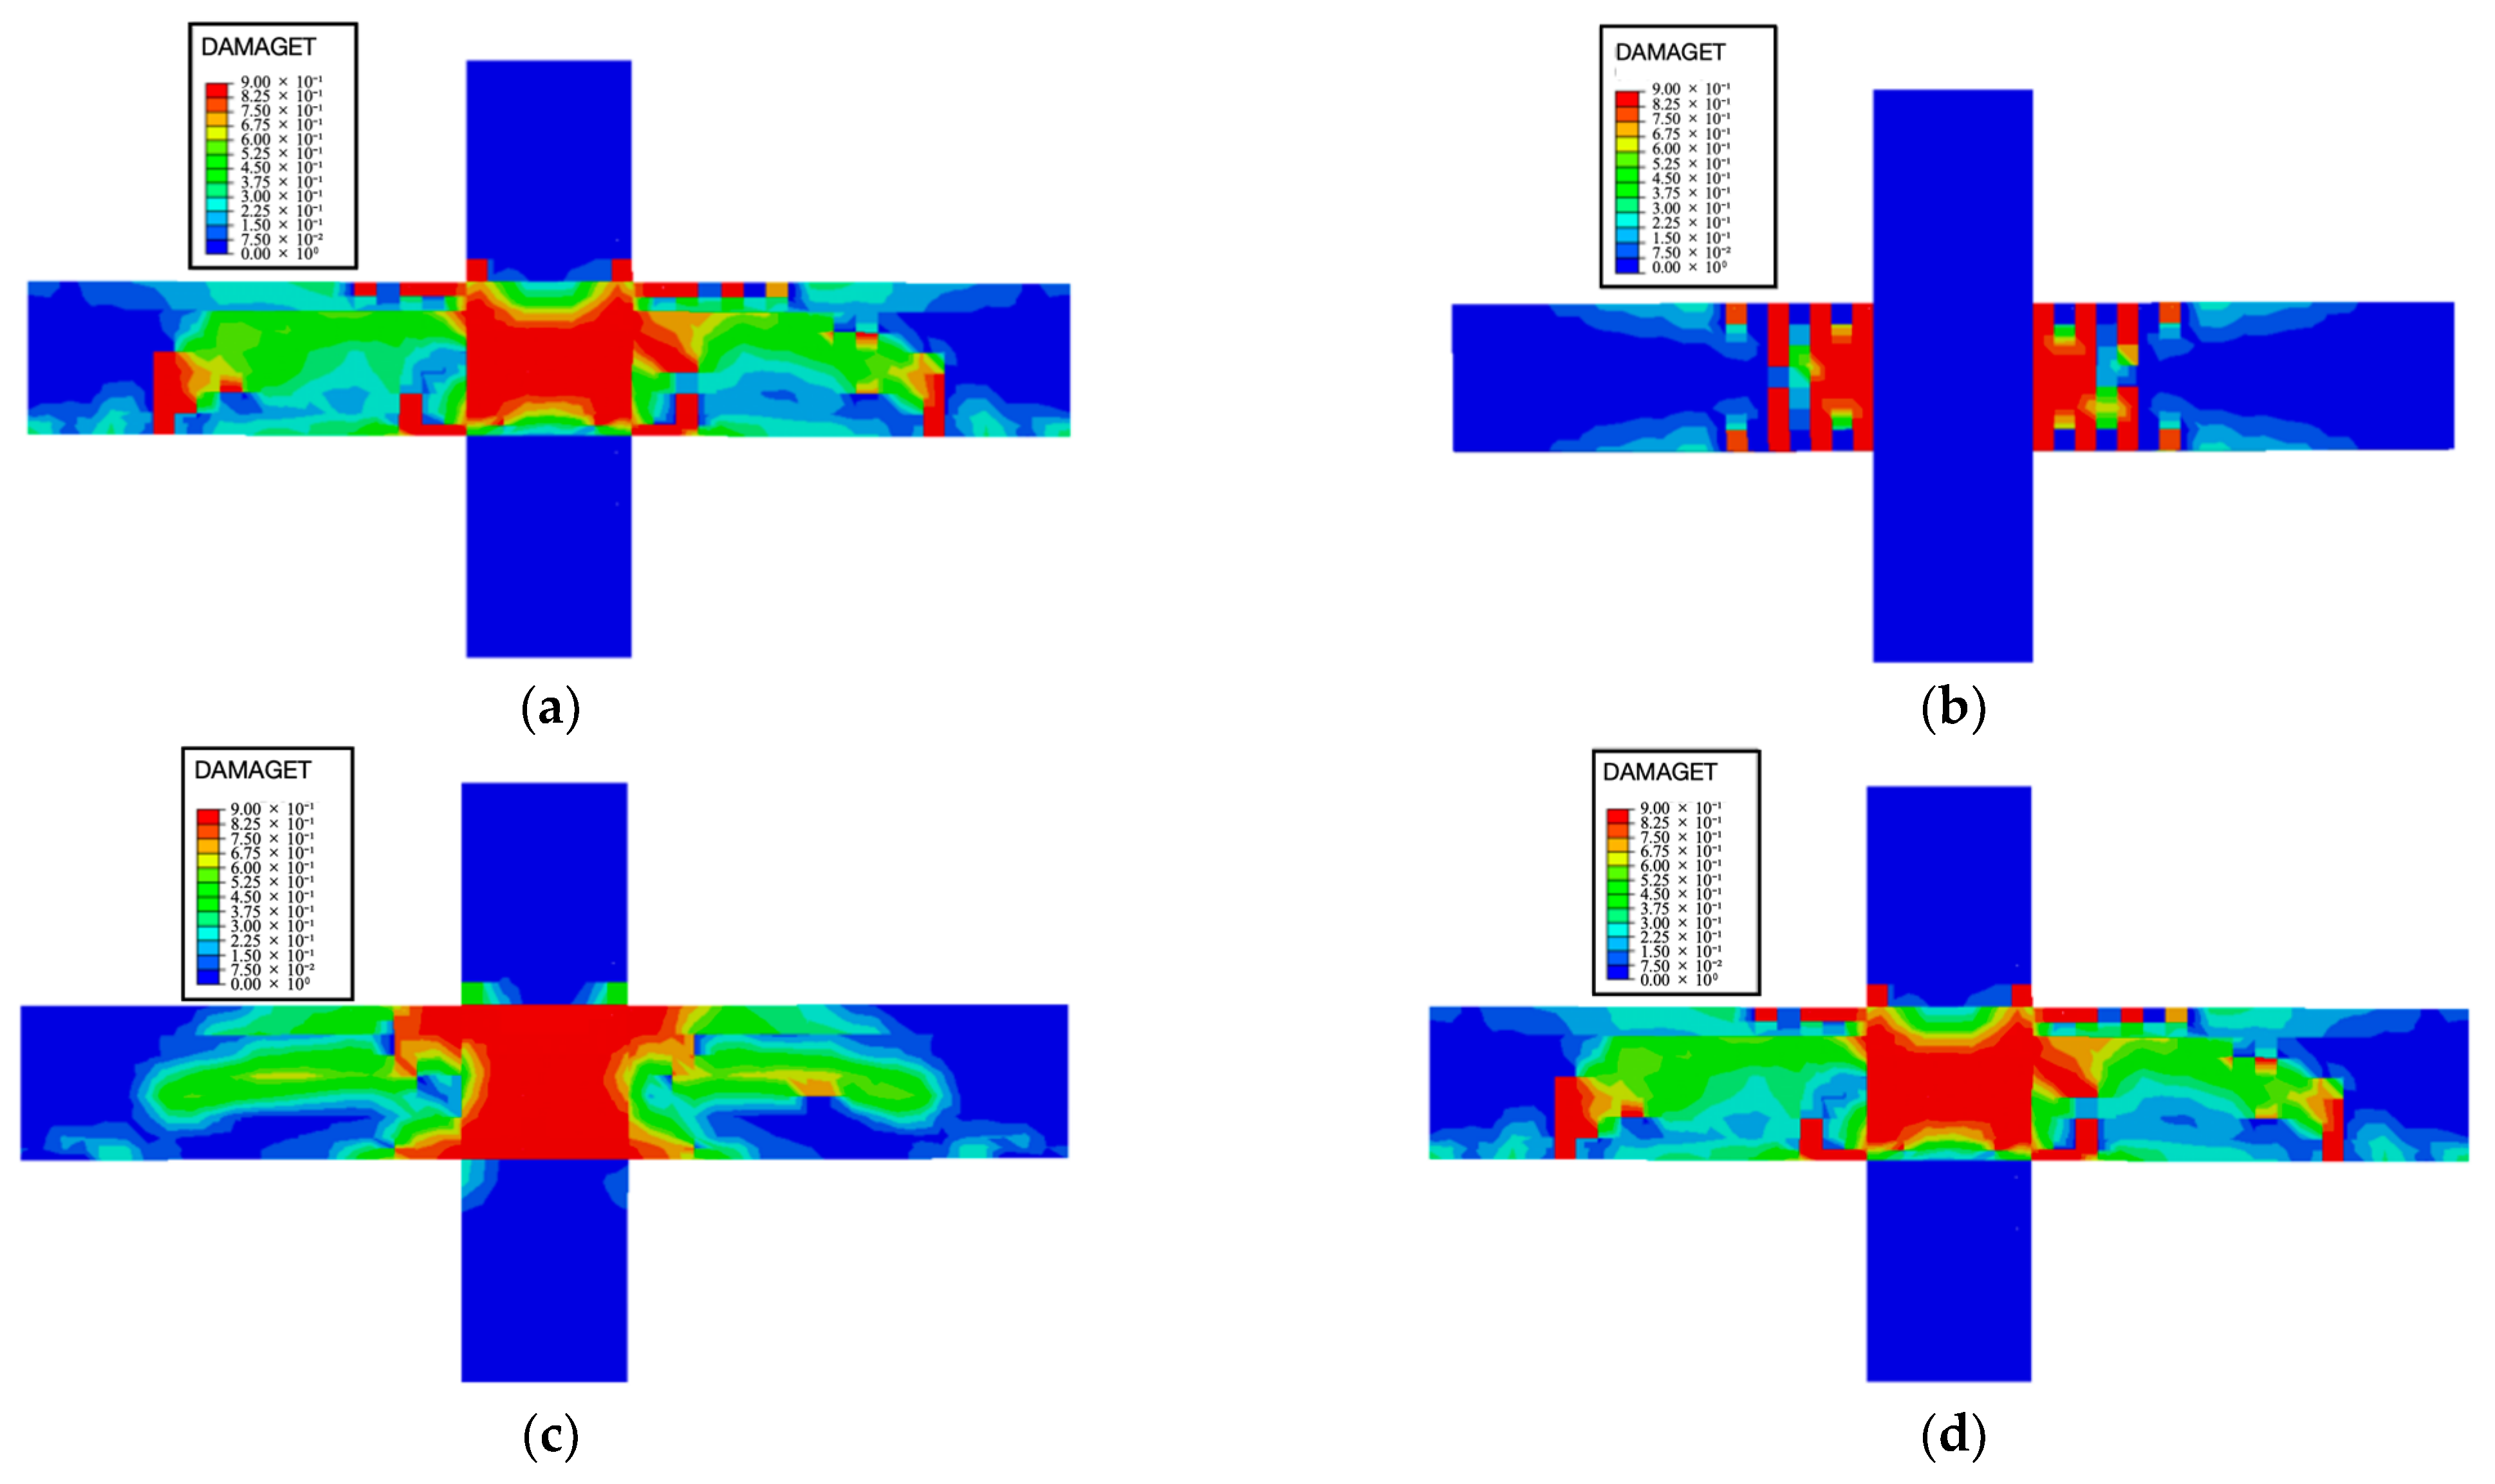
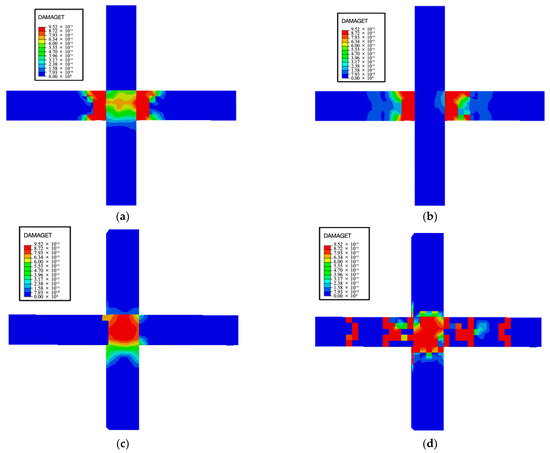
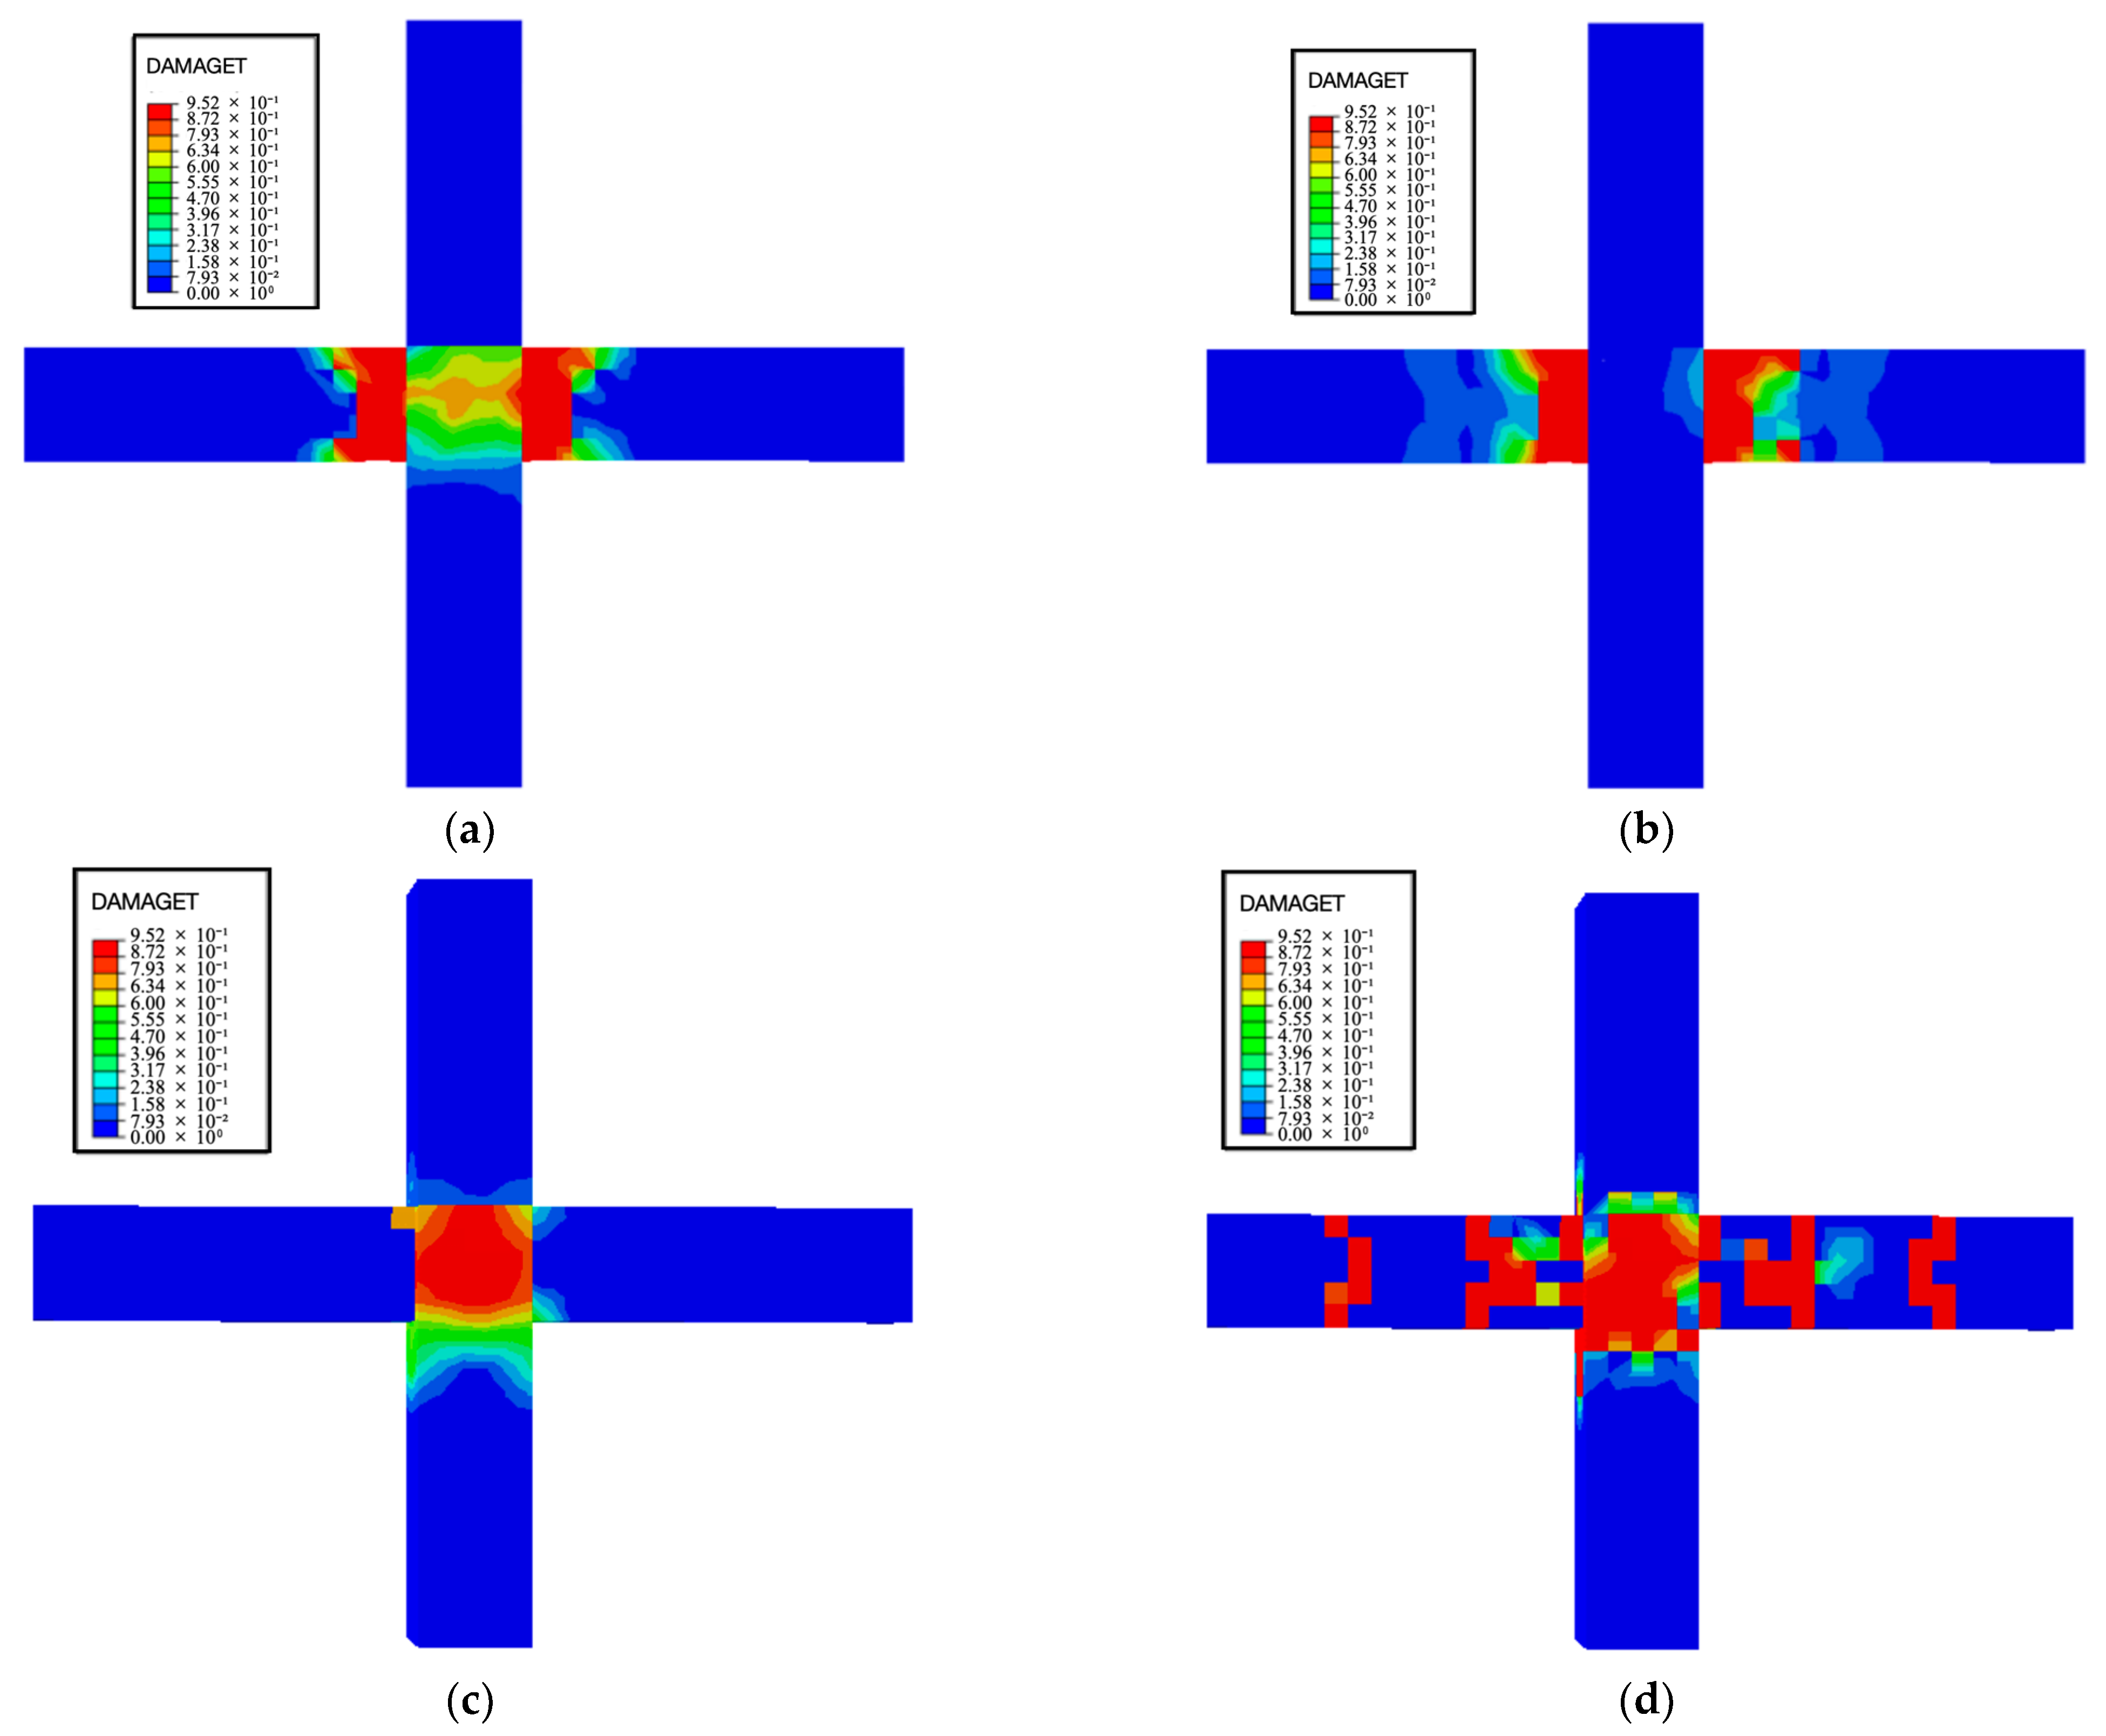
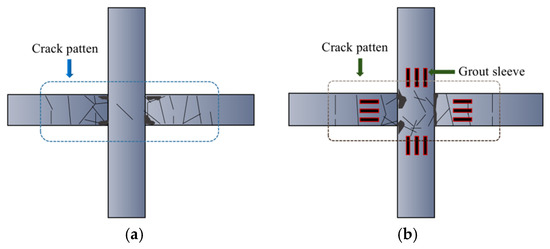
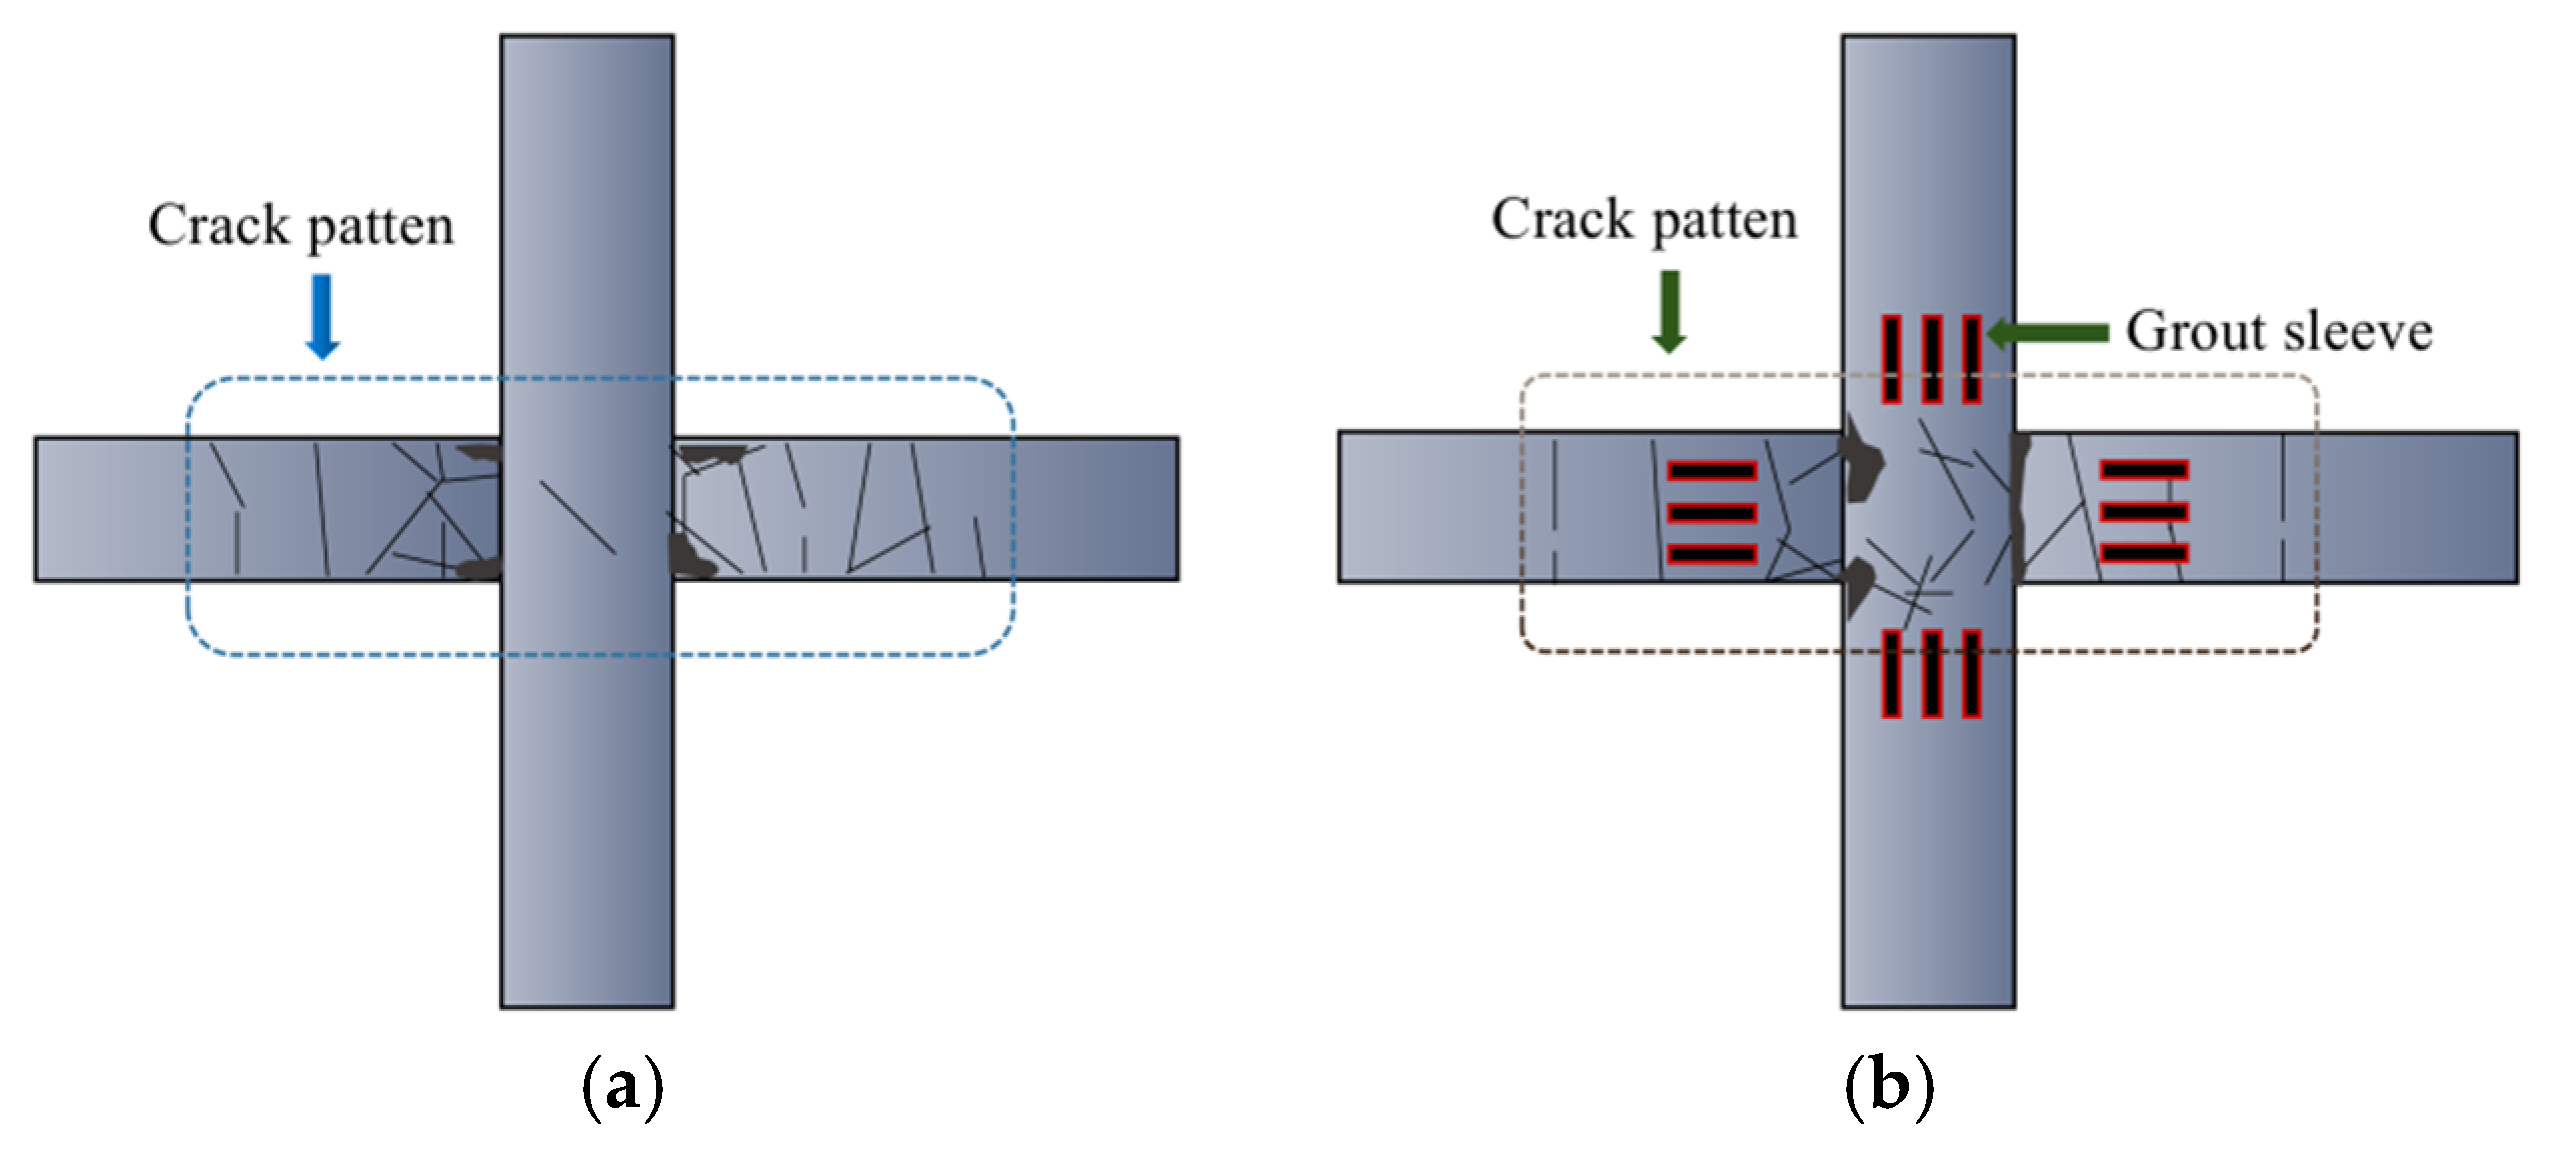
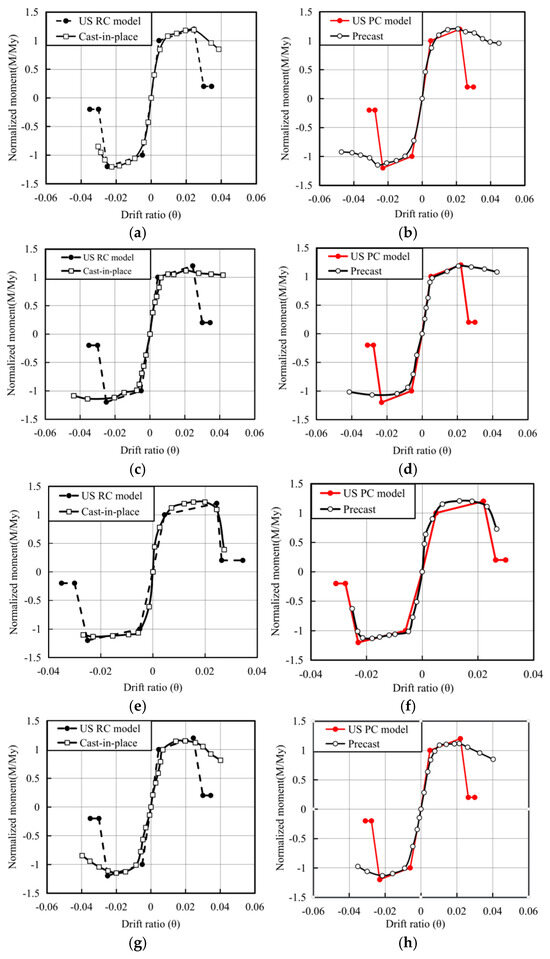
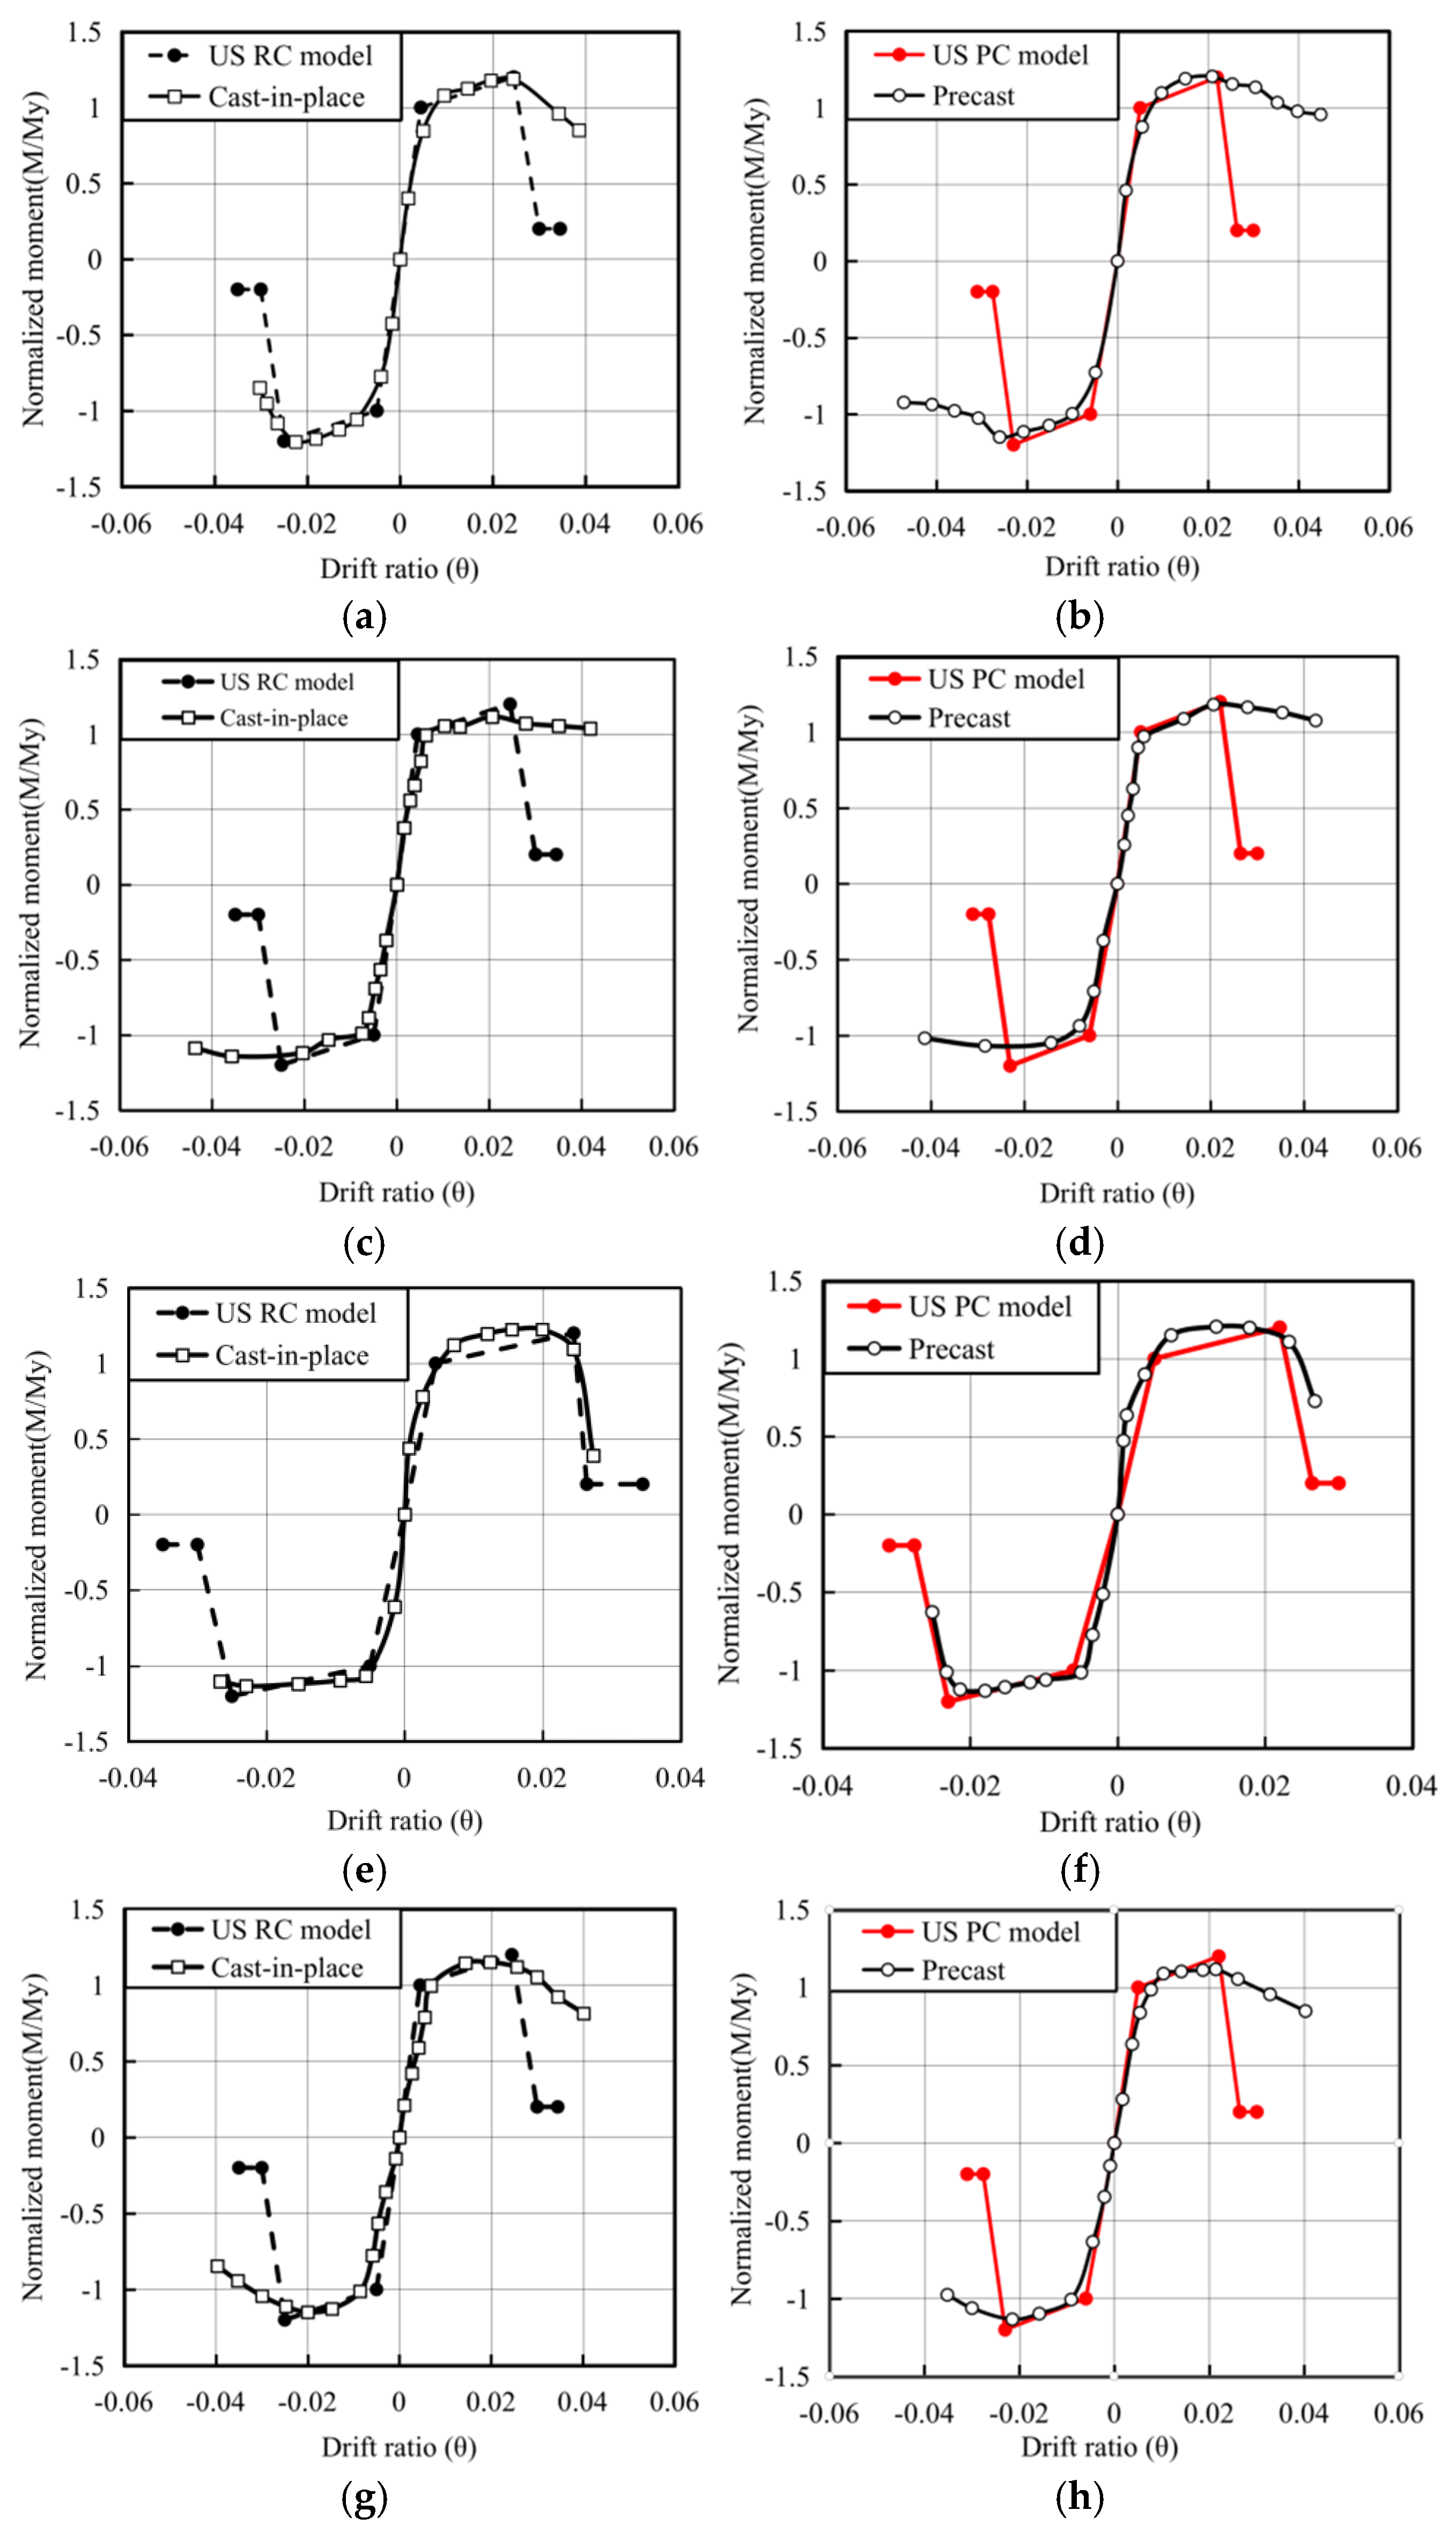
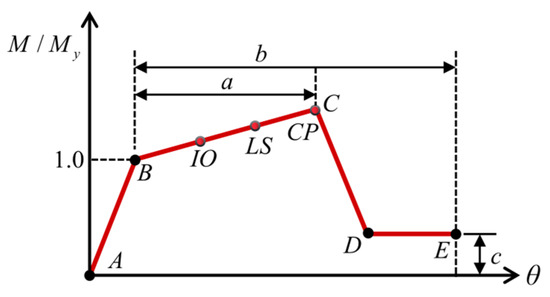
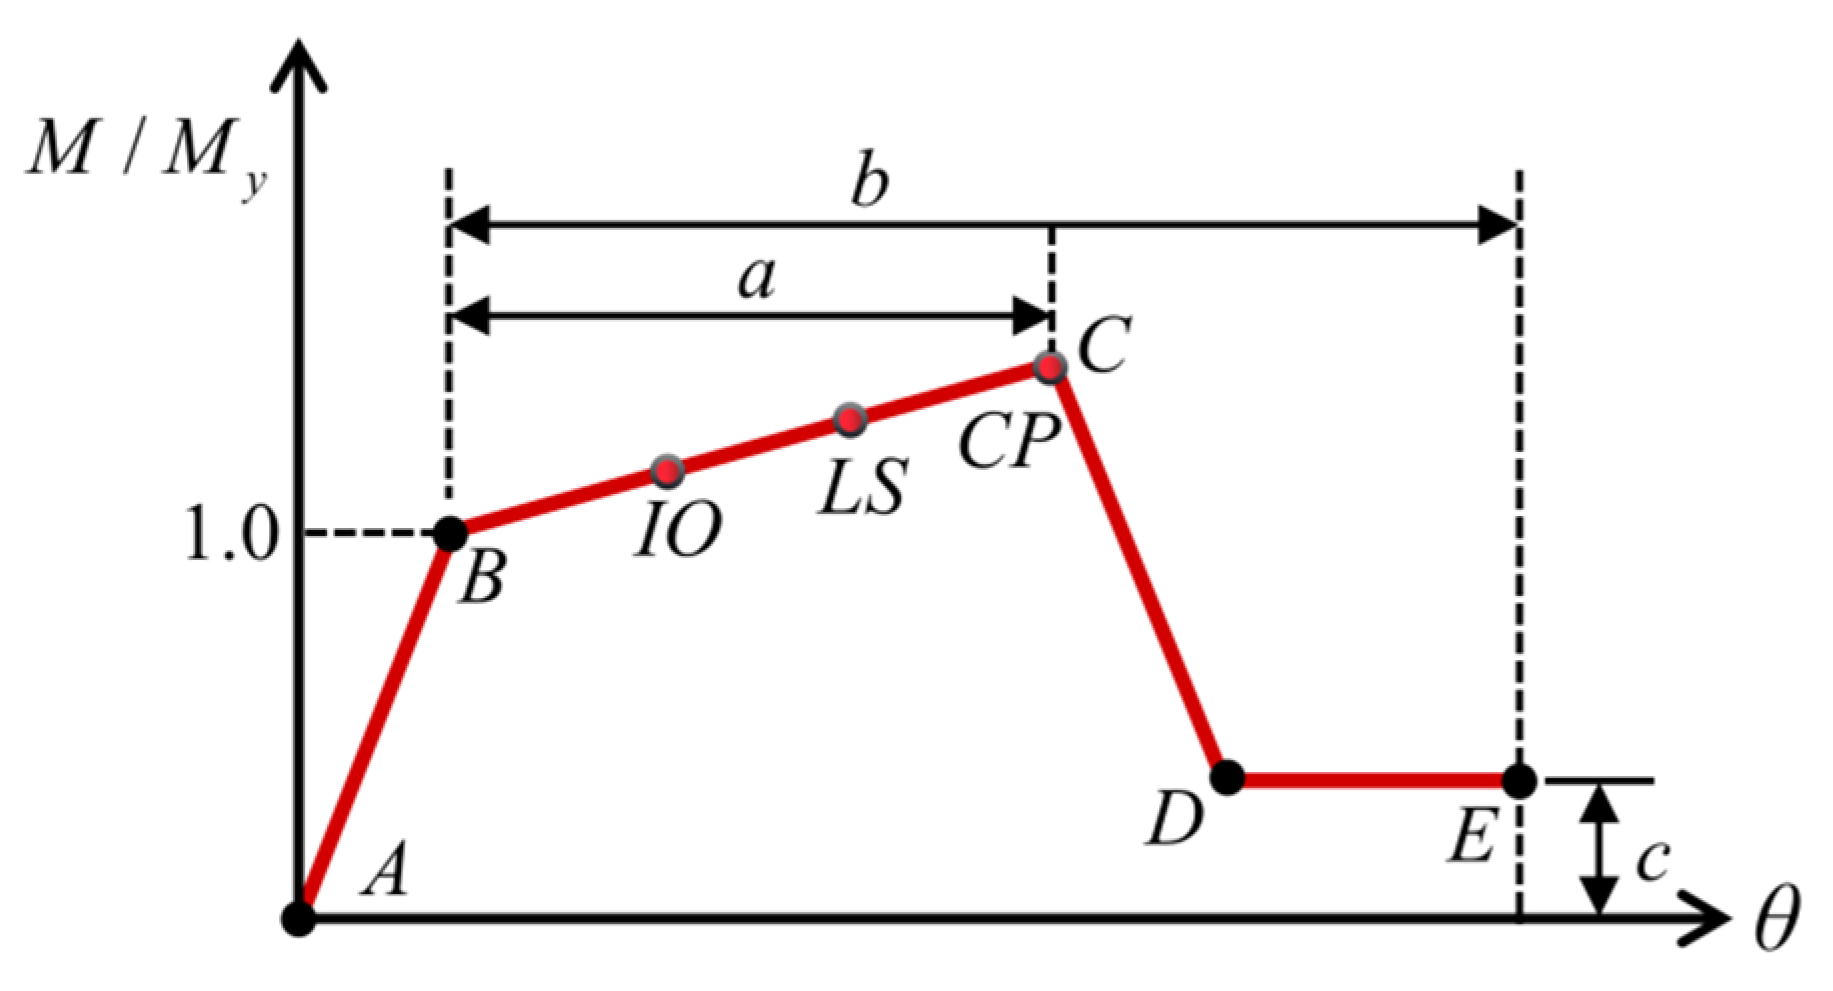
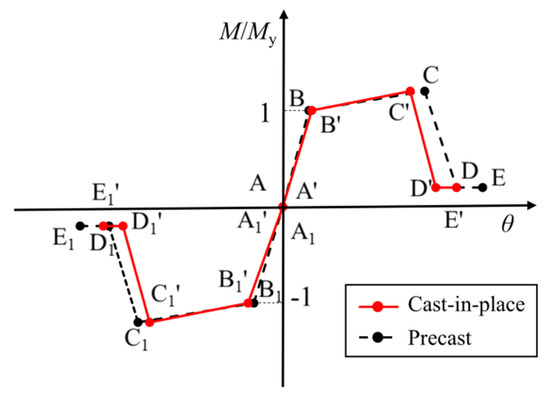
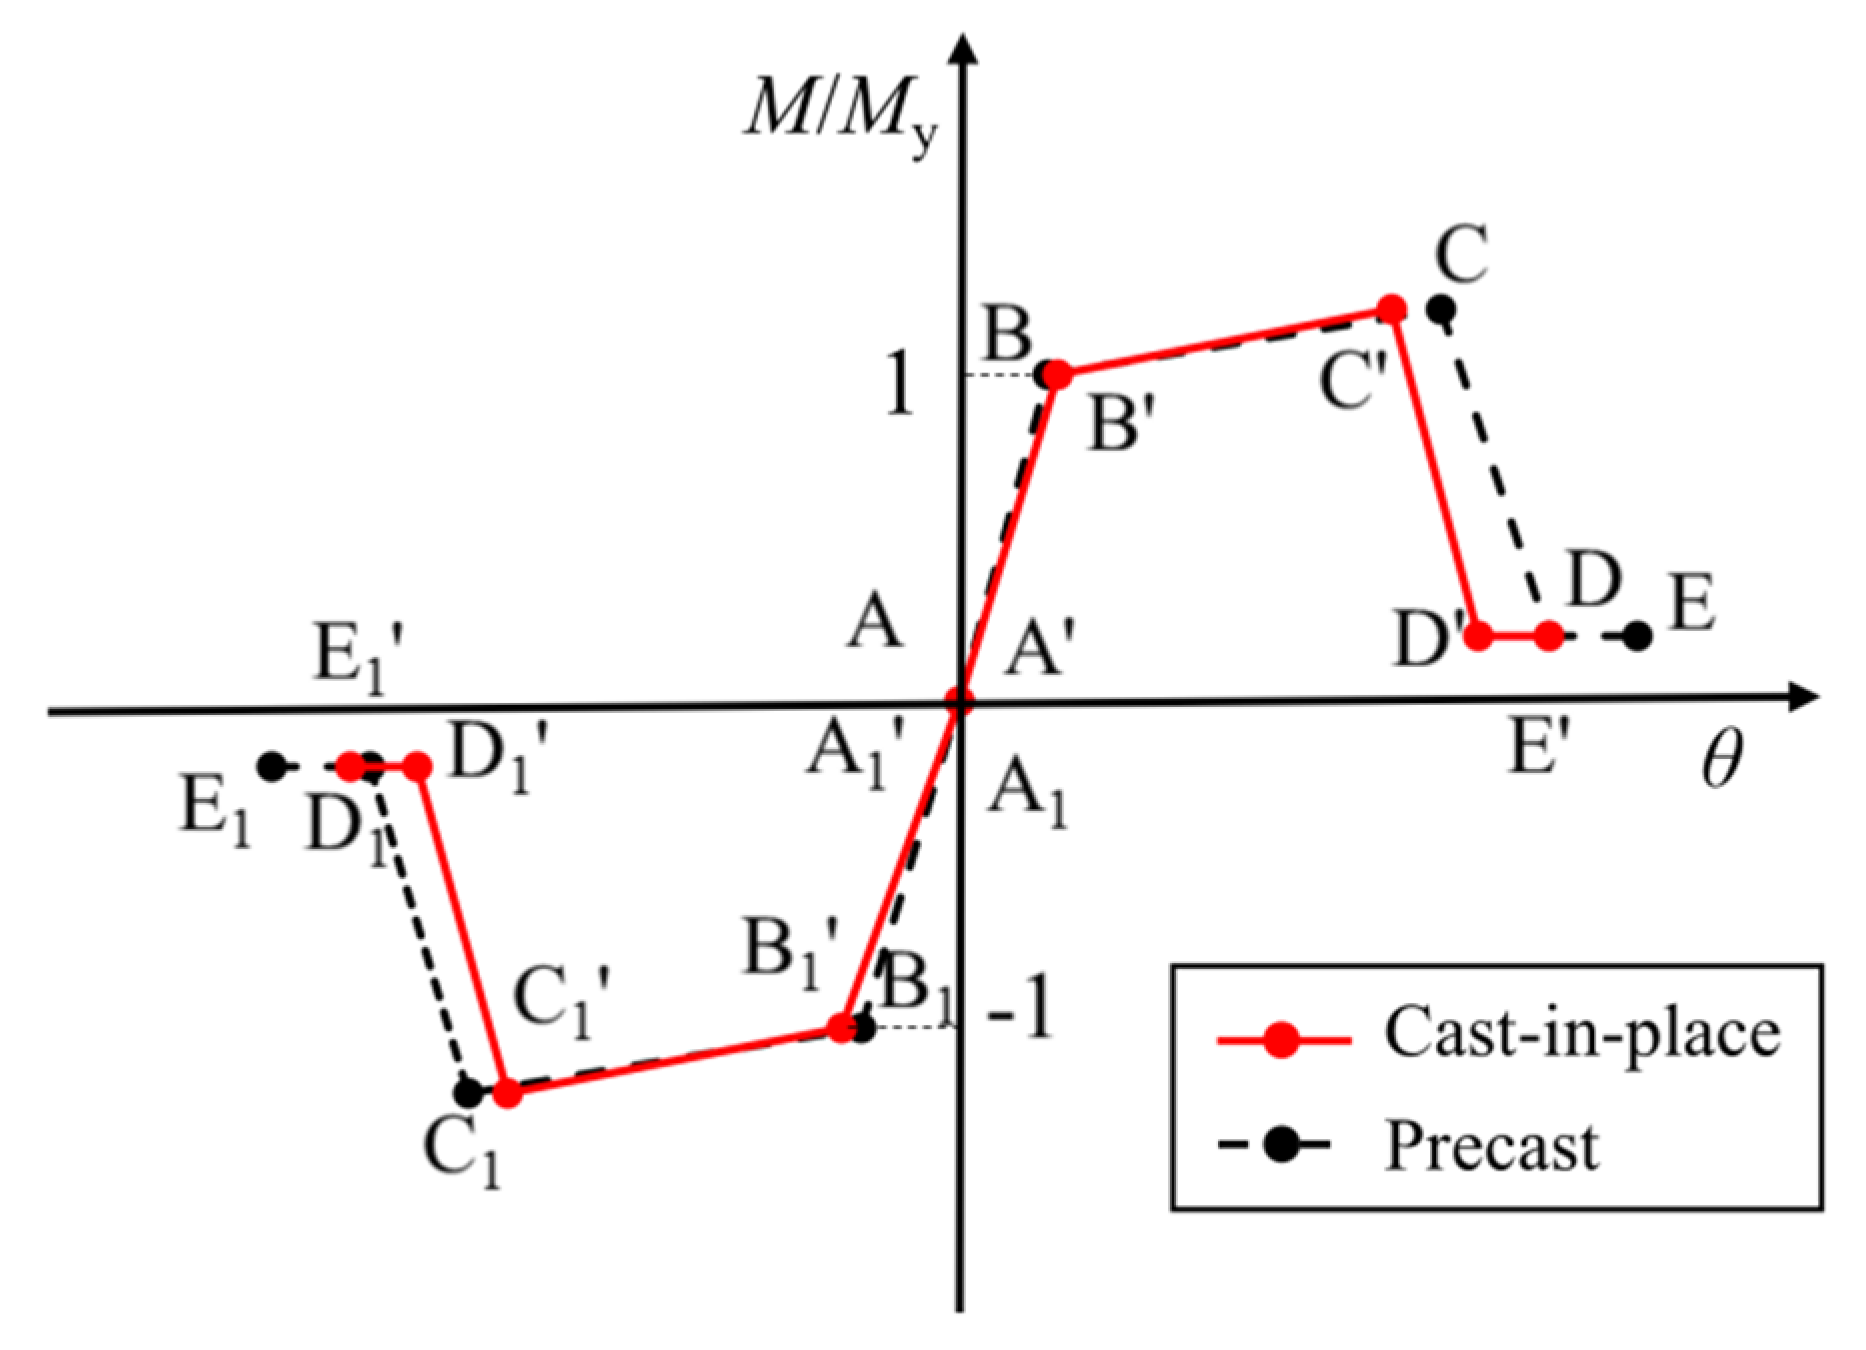
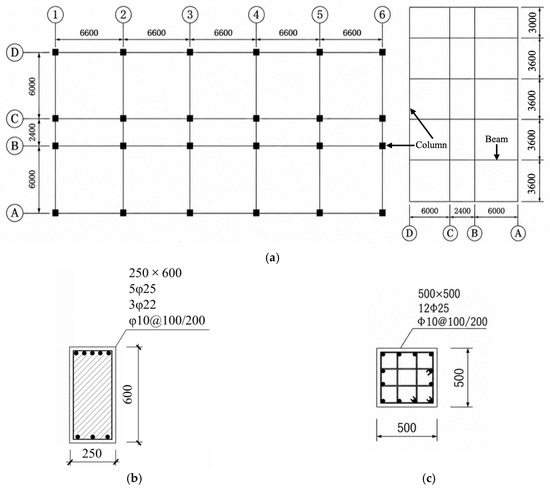
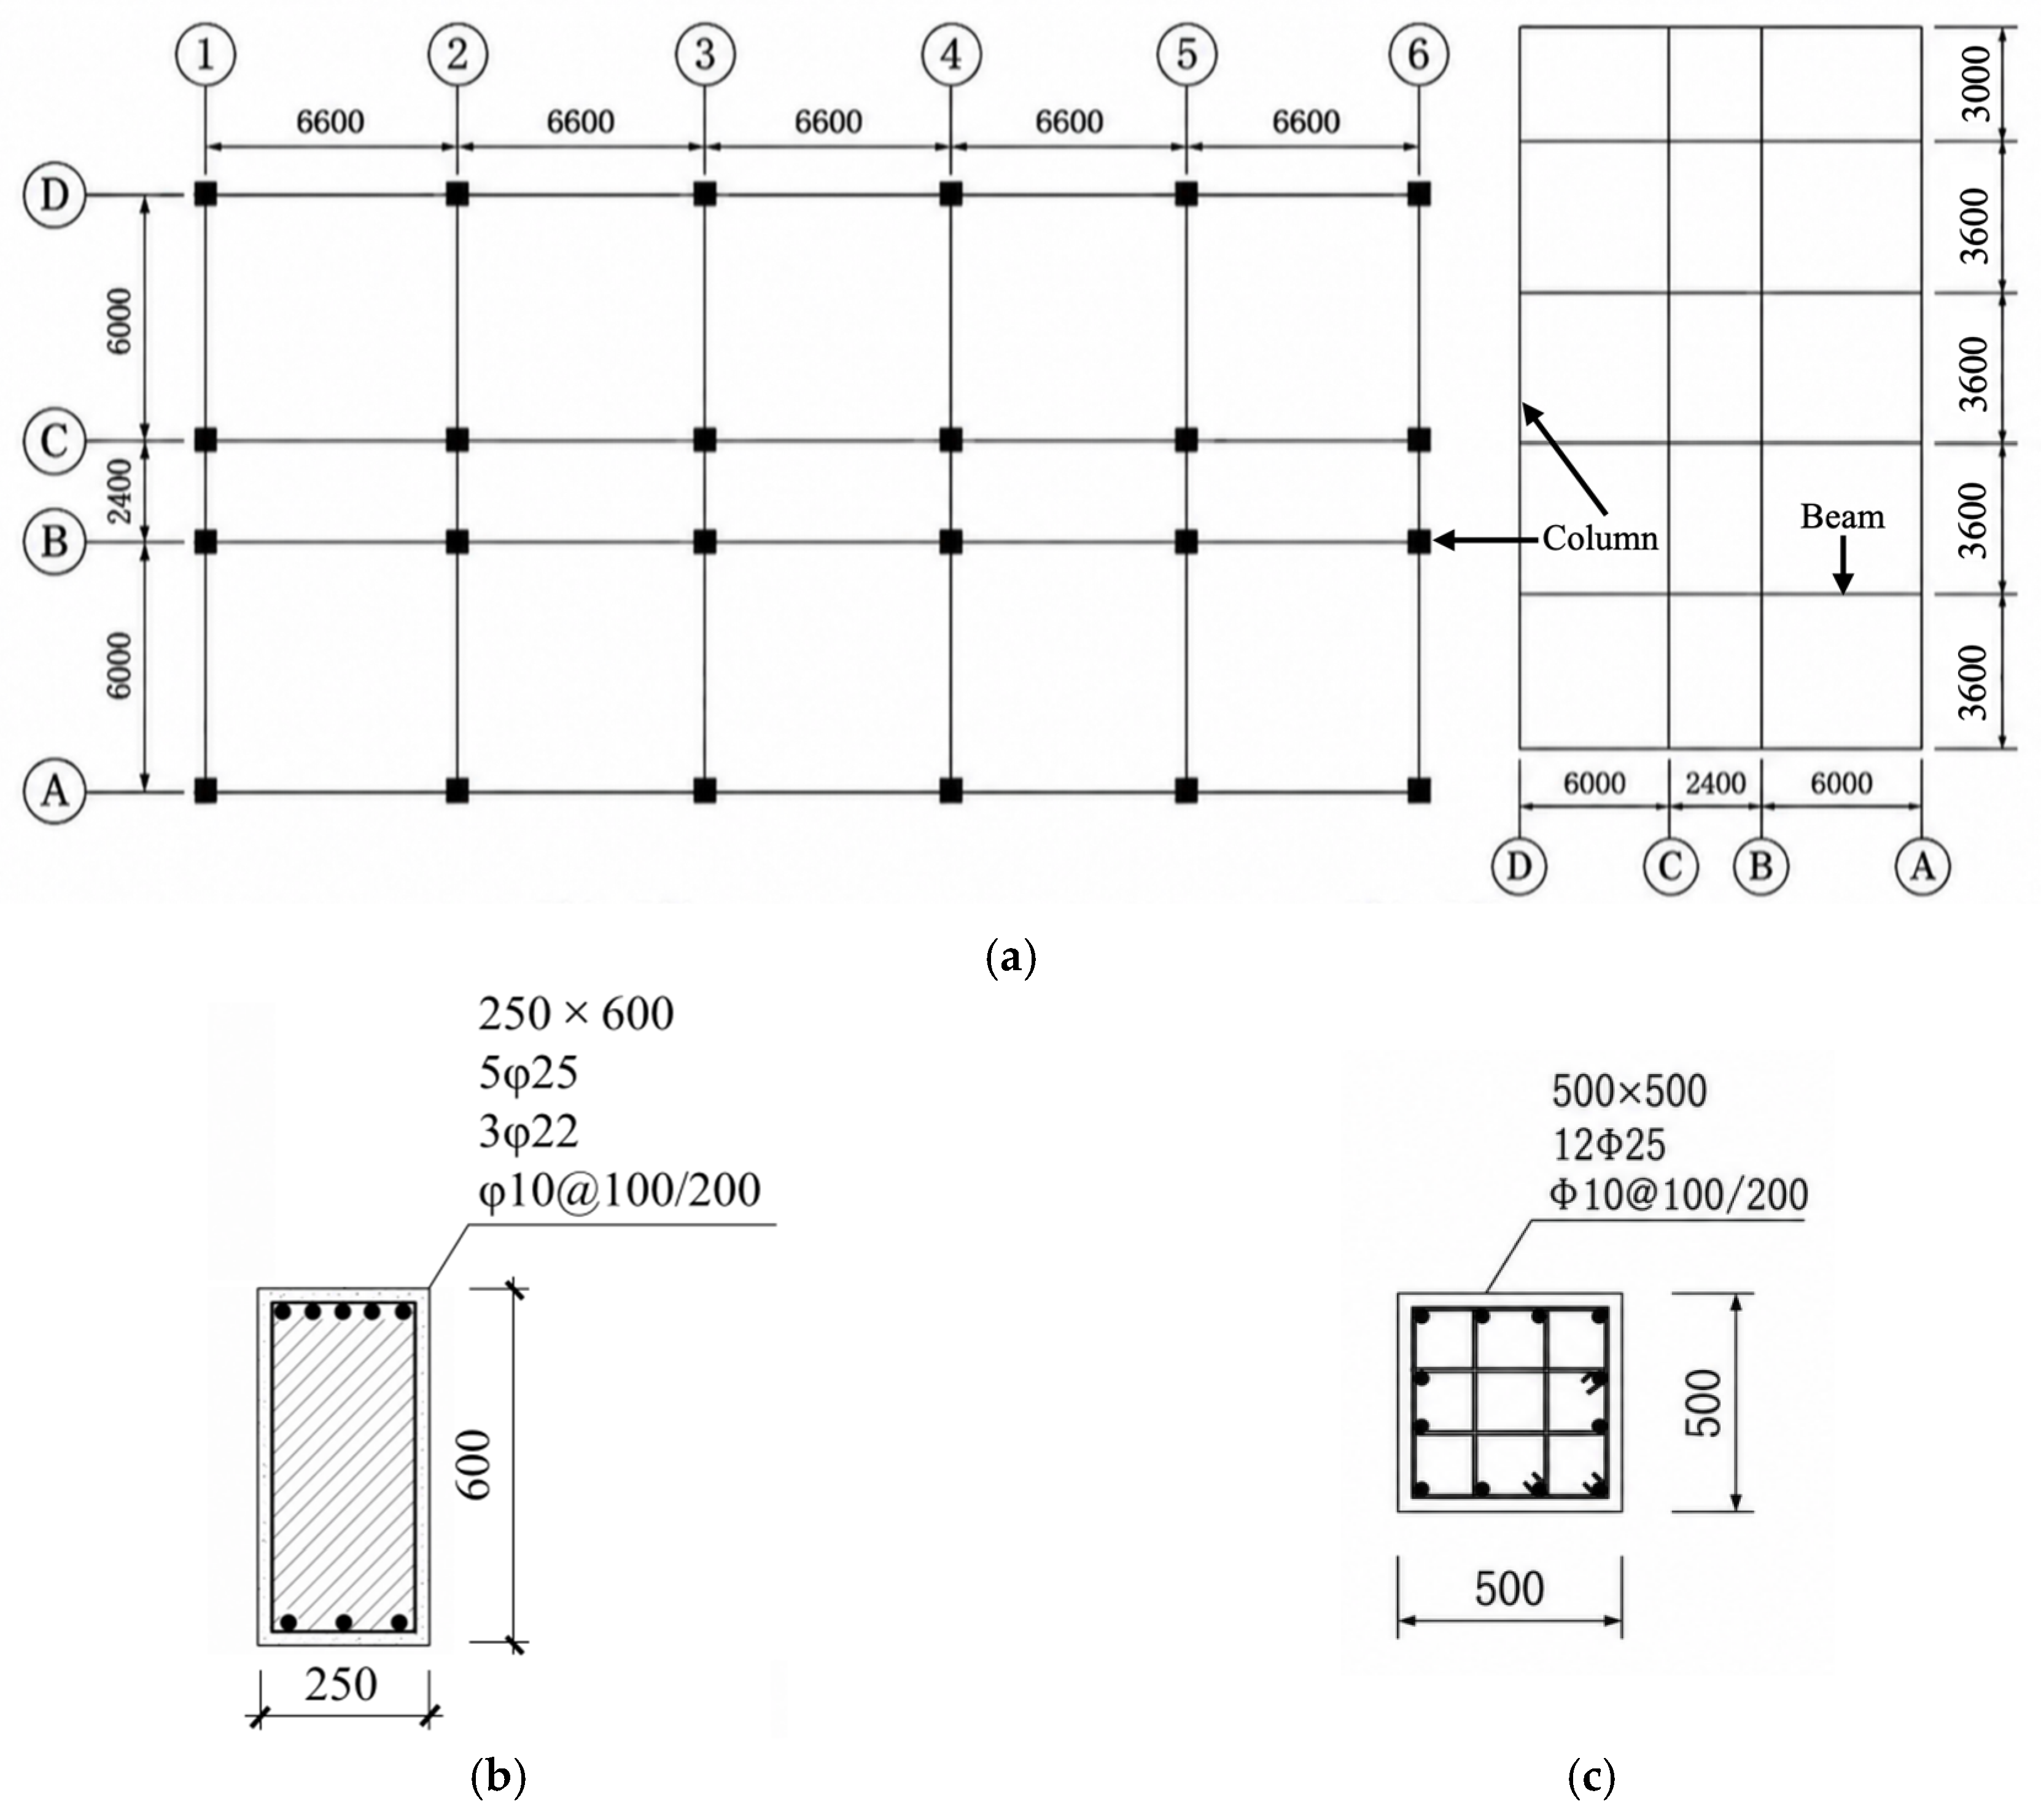
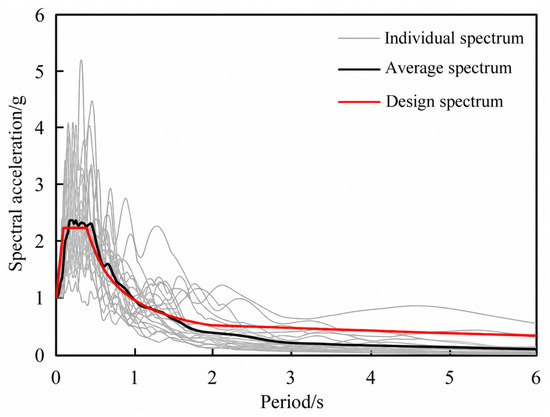
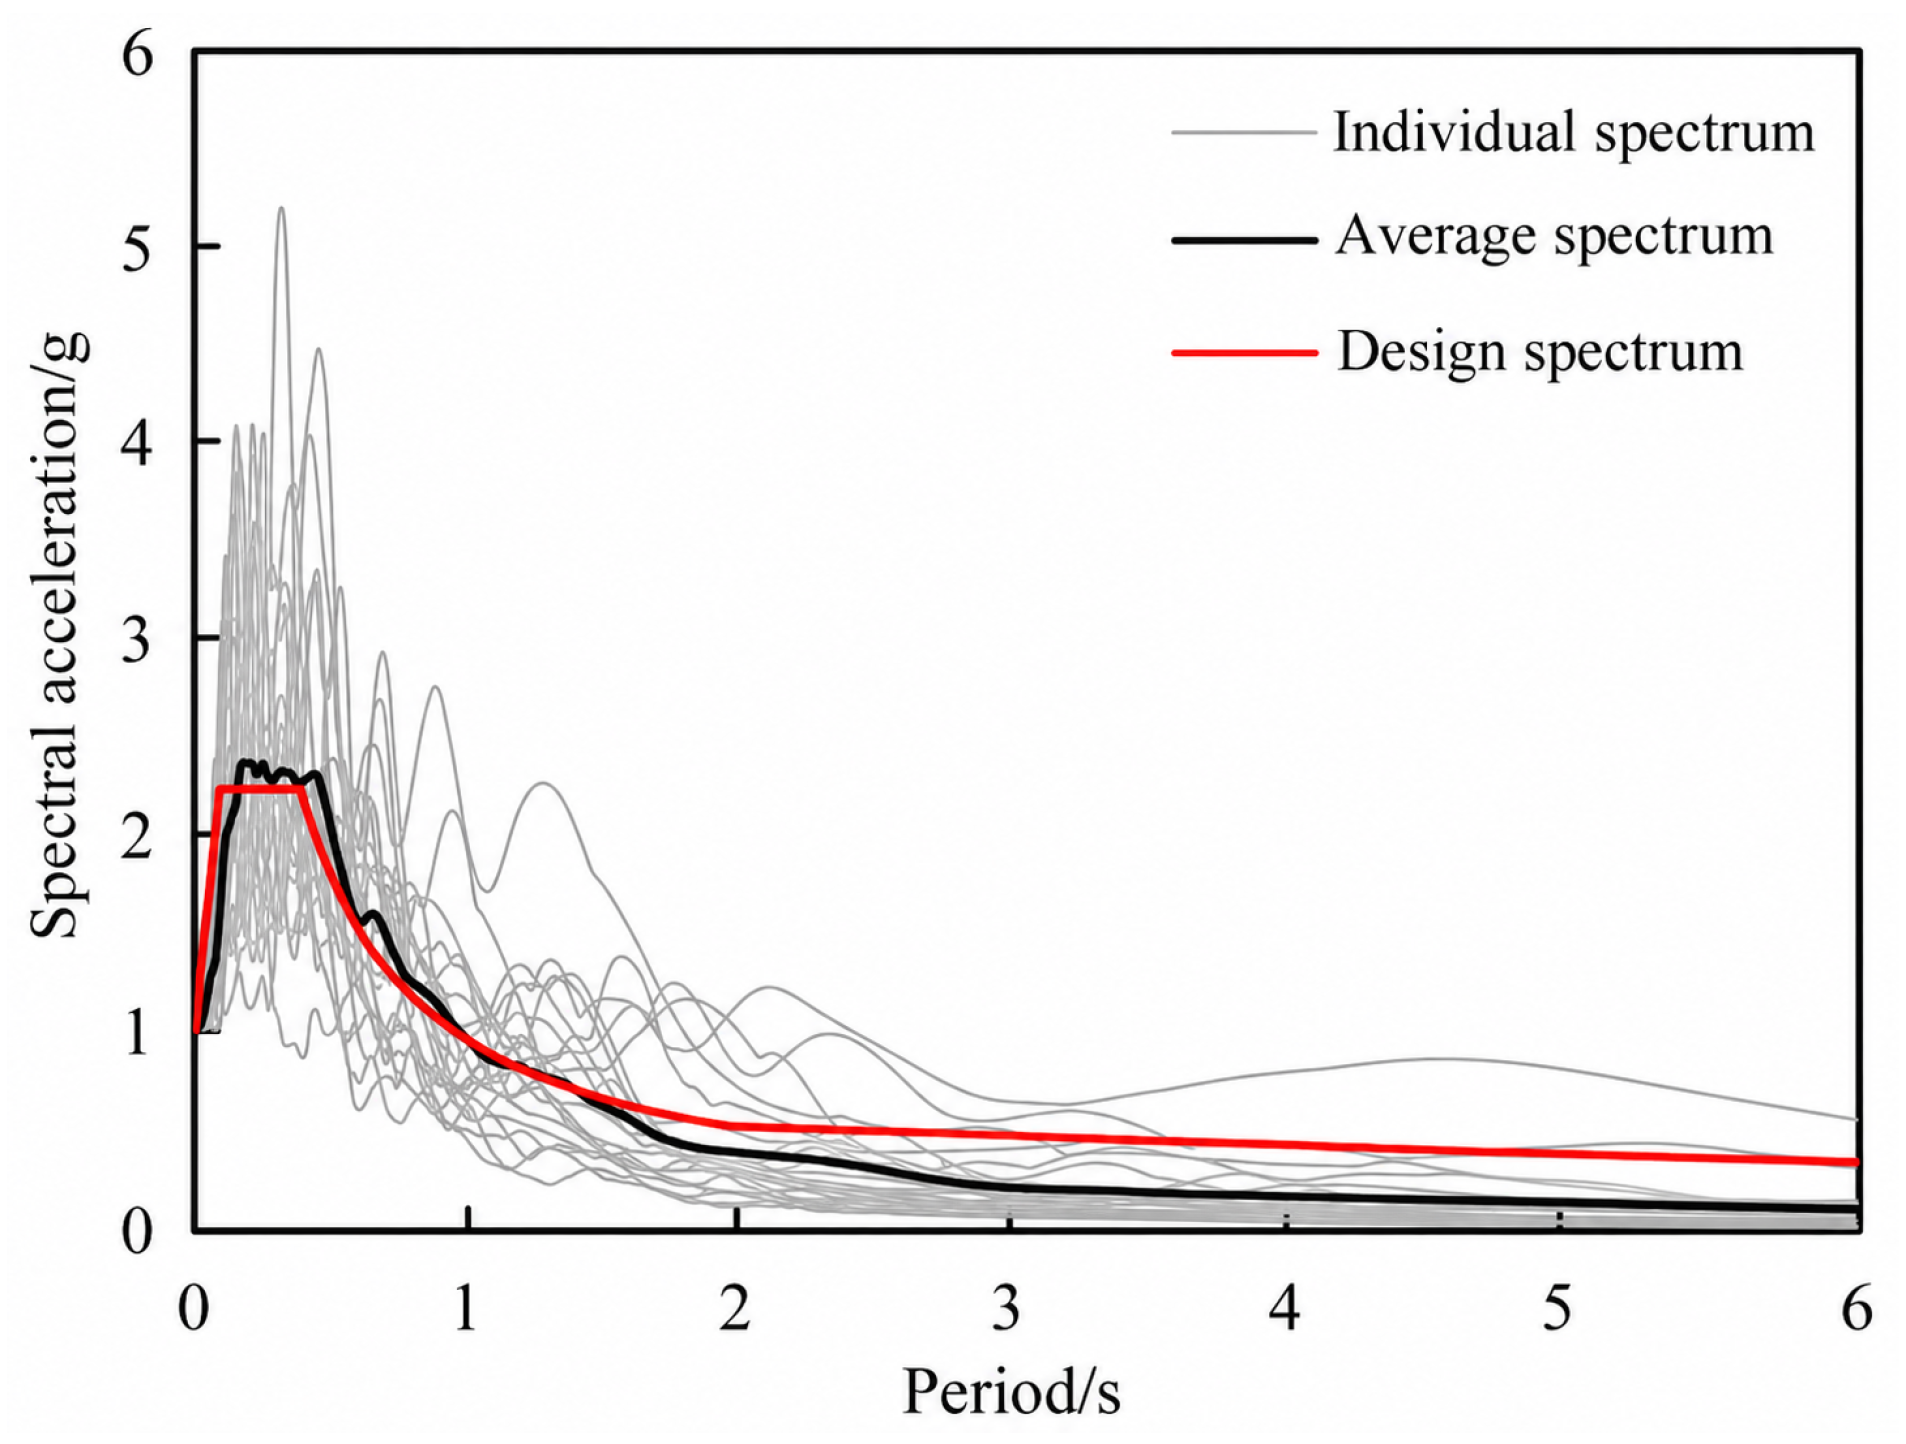
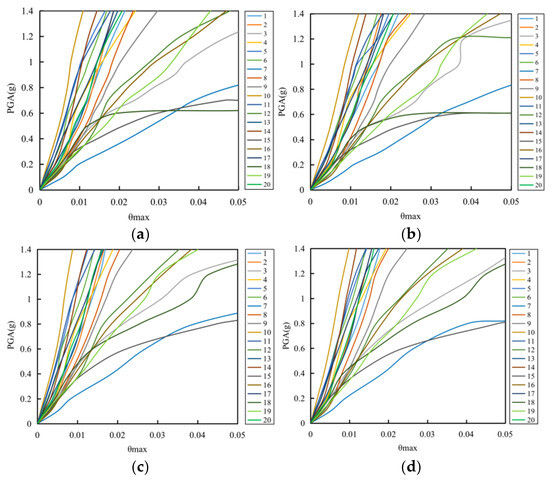
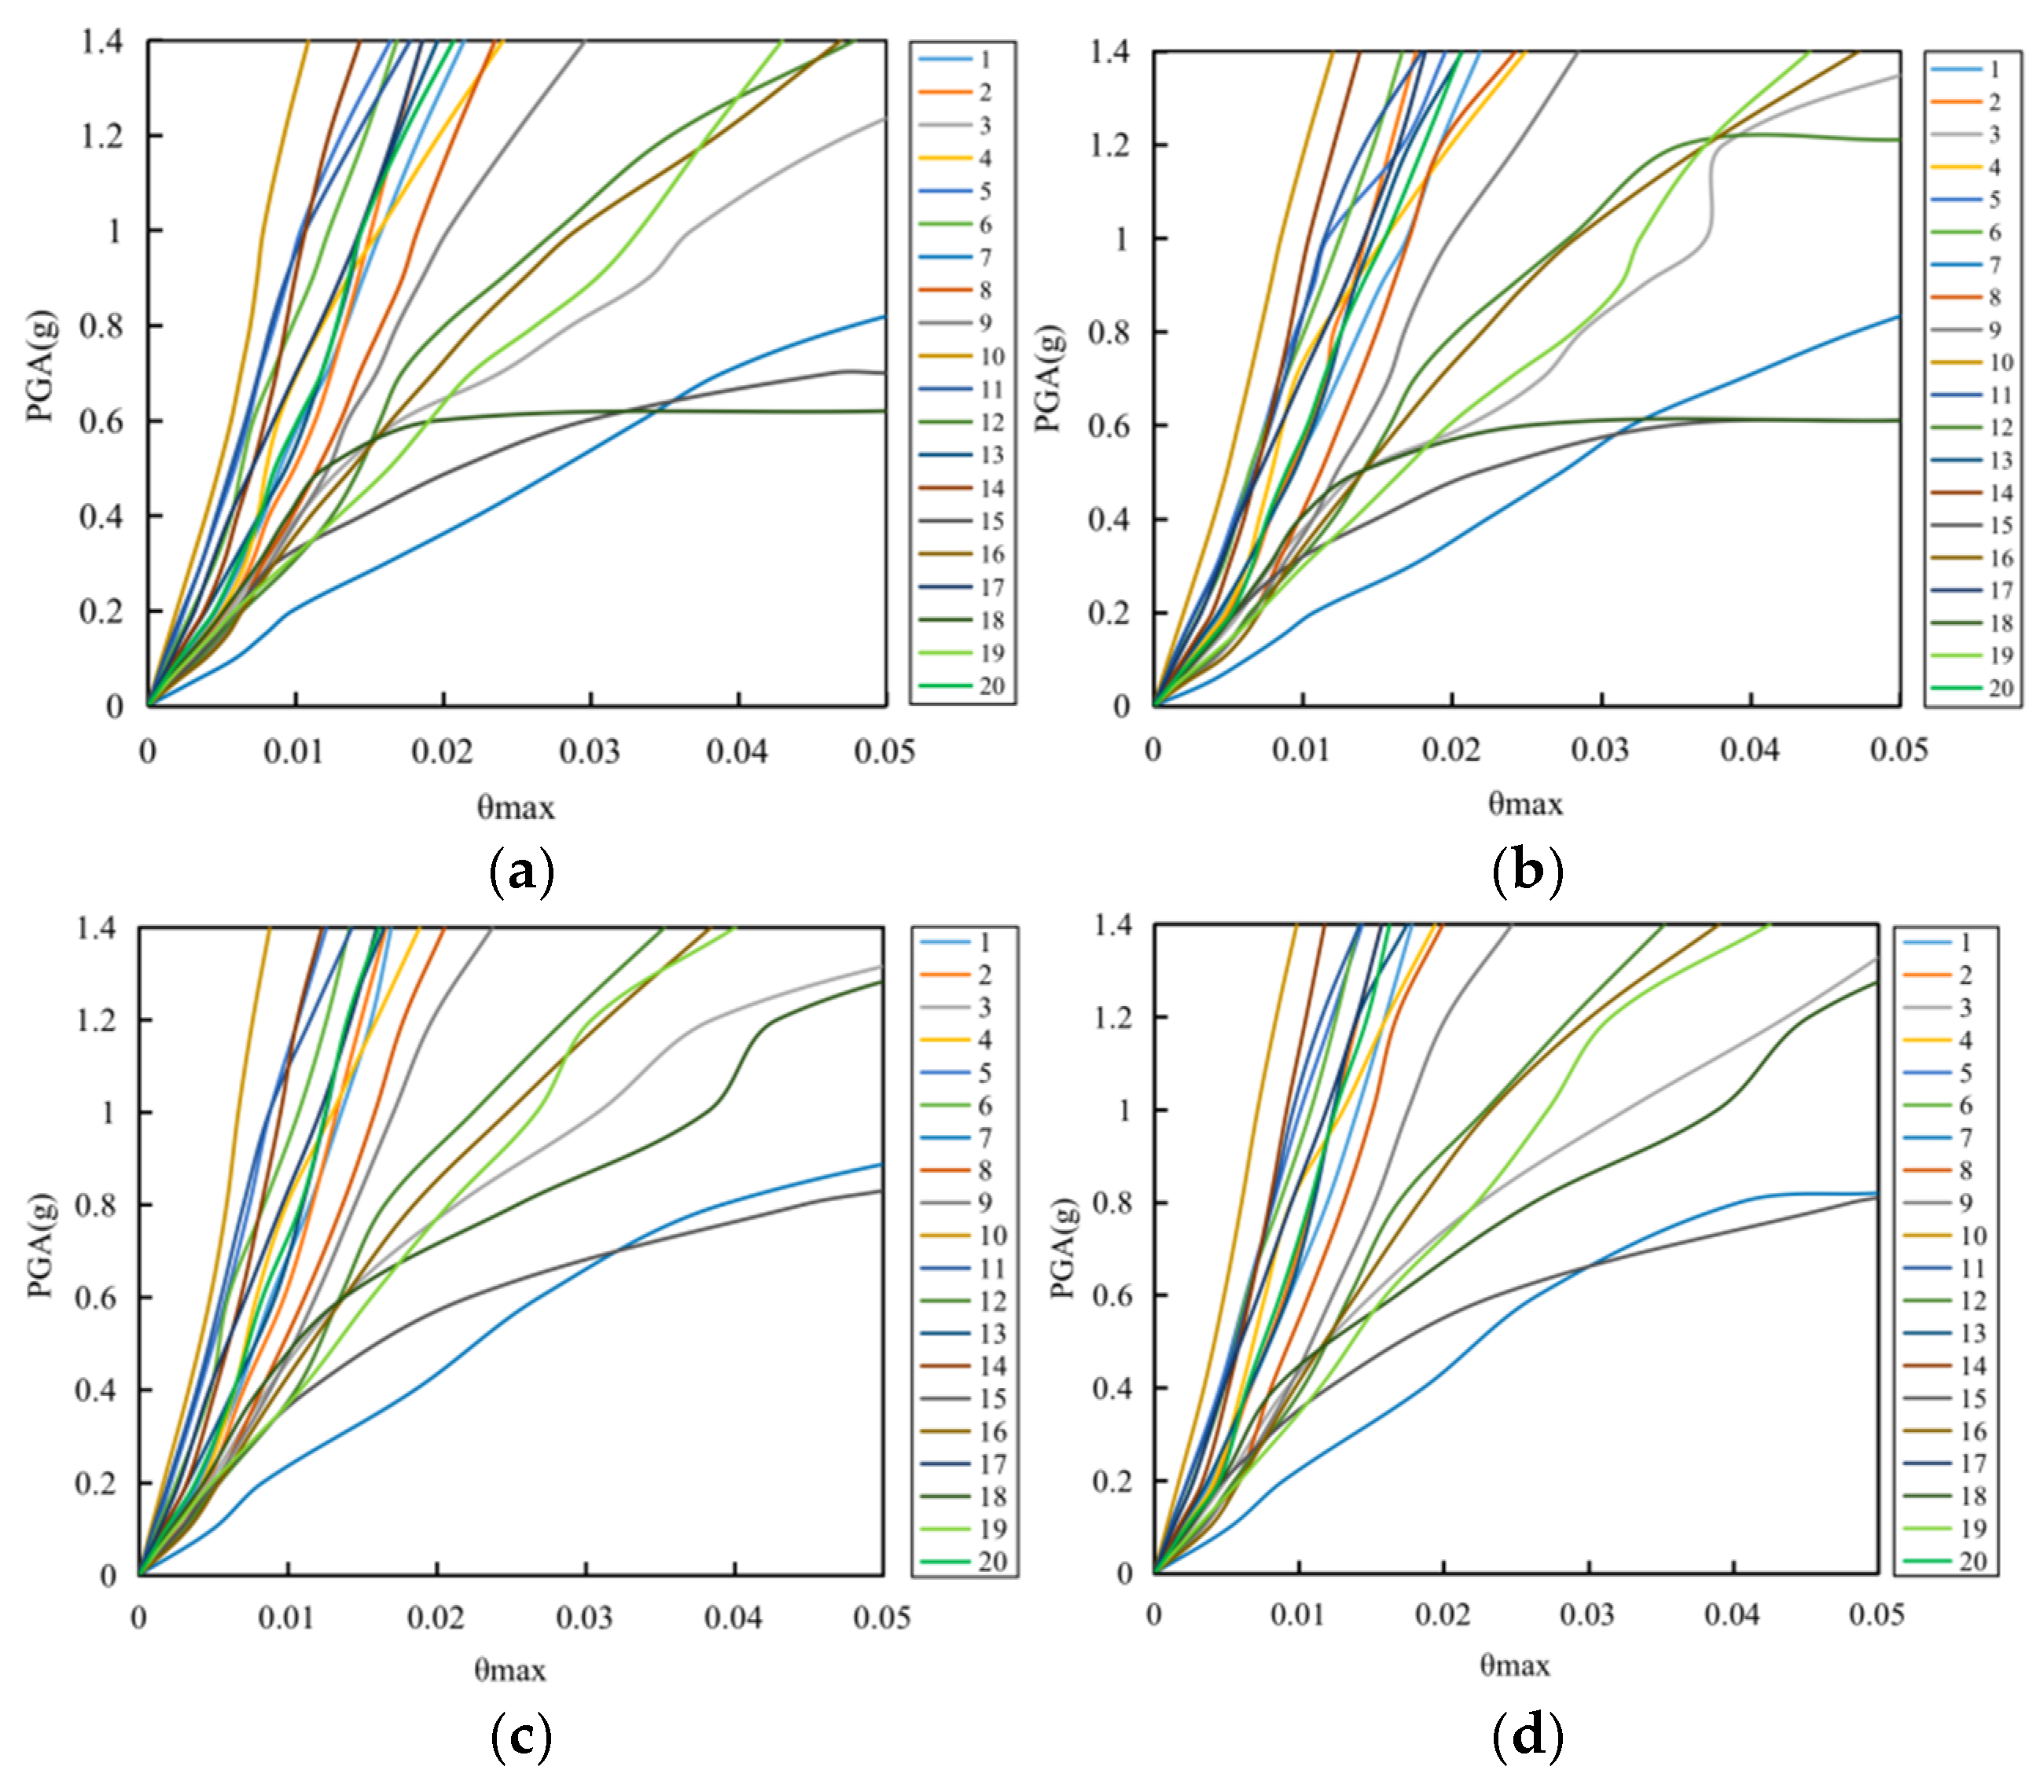
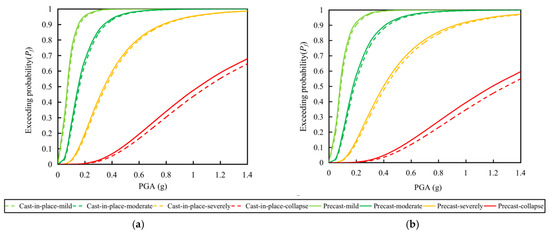
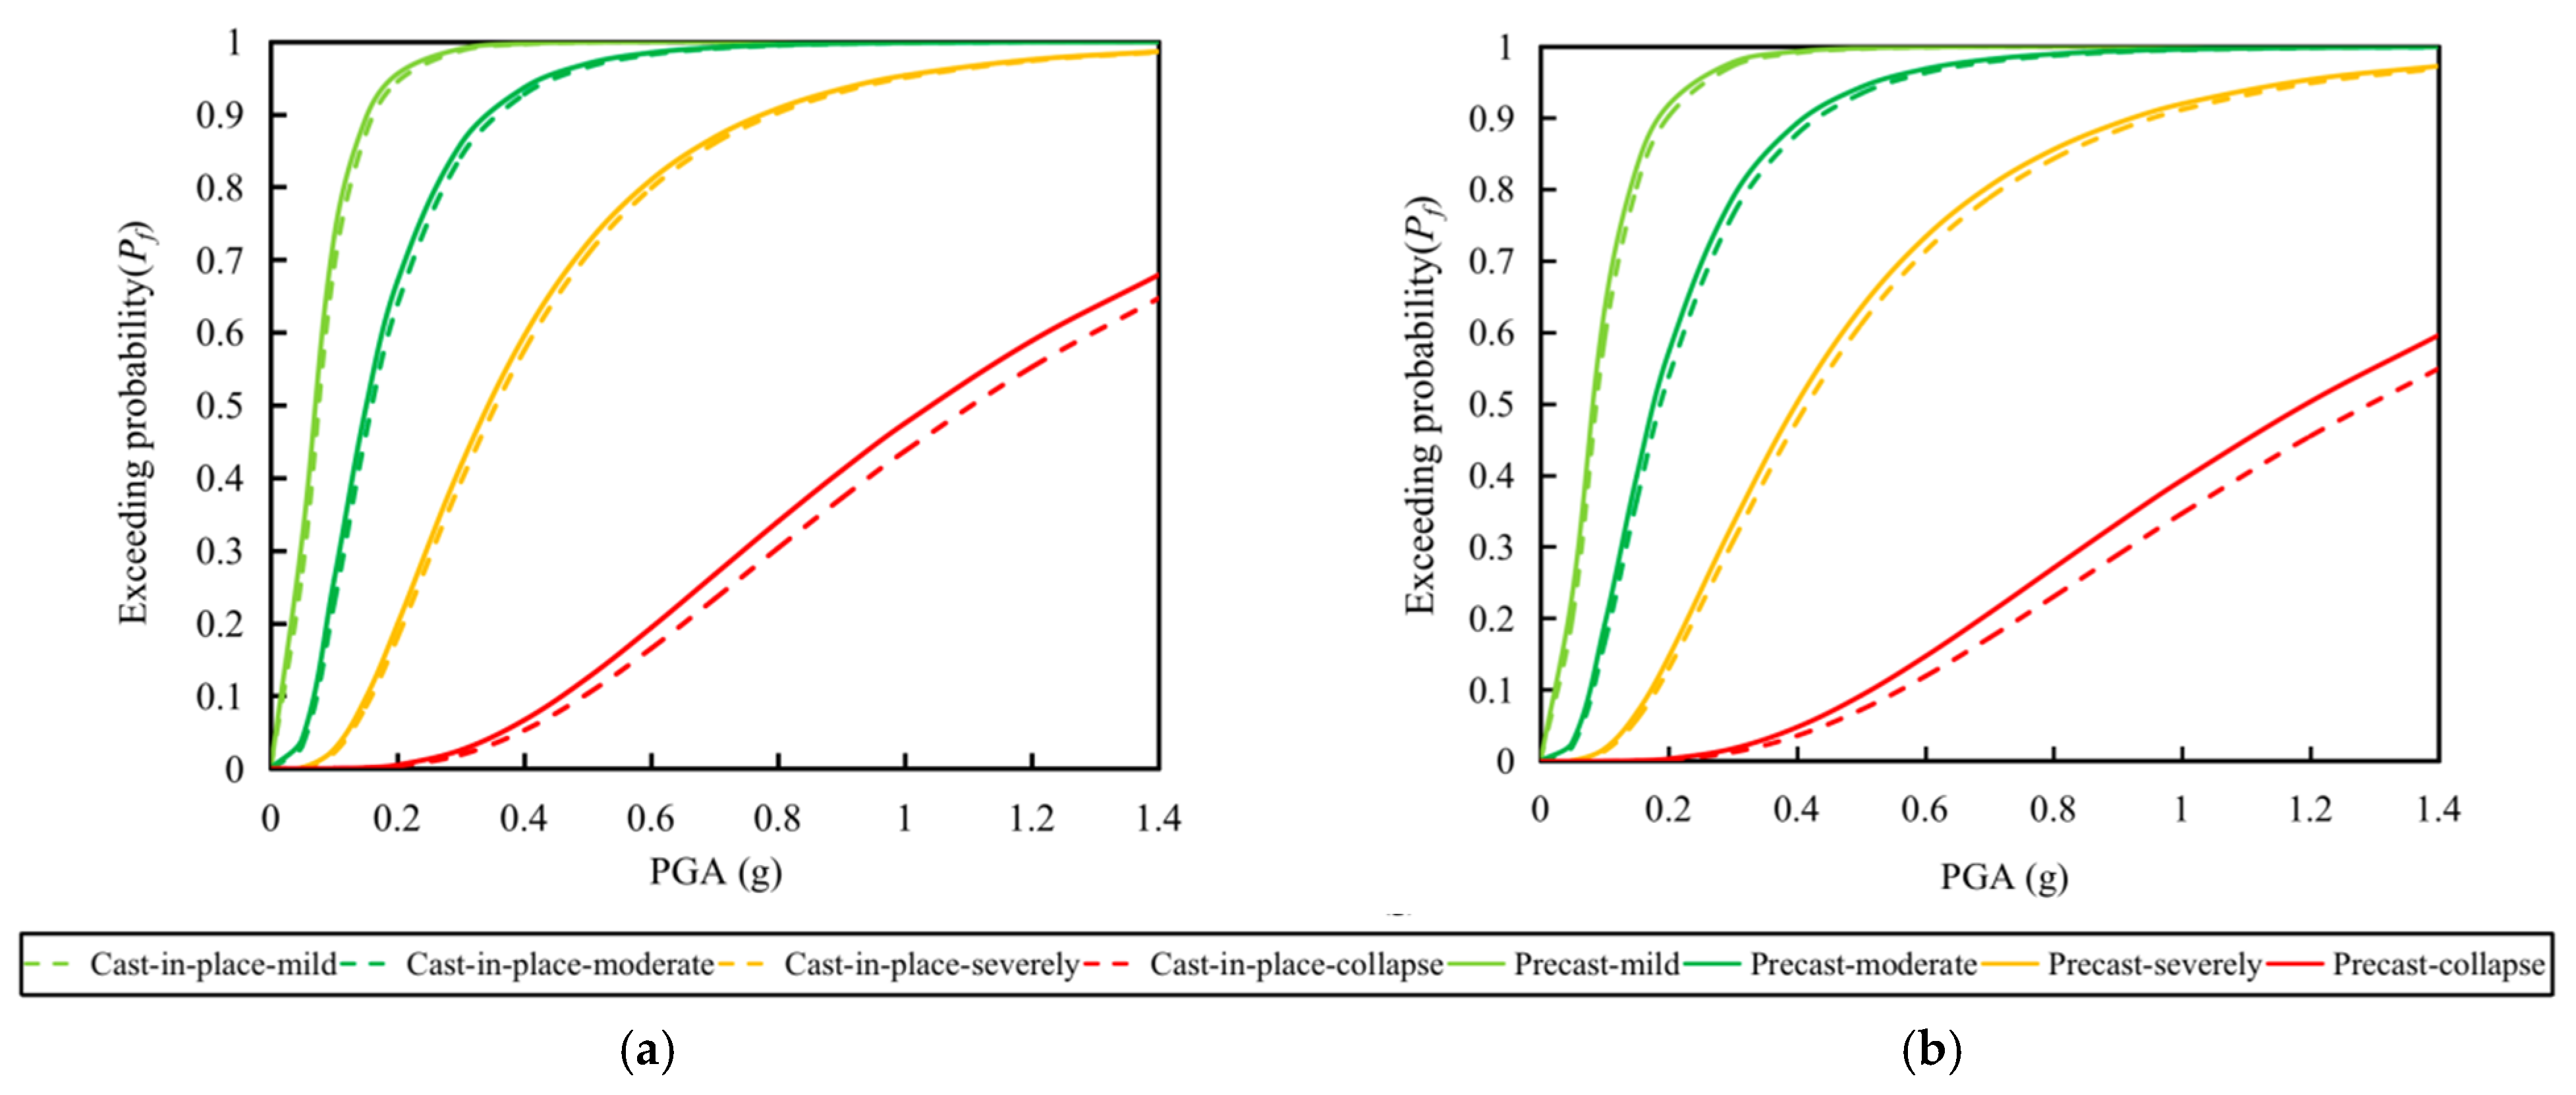

Disclaimer/Publisher’s Note: The statements, opinions and data contained in all publications are solely those of the individual author(s) and contributor(s) and not of MDPI and/or the editor(s). MDPI and/or the editor(s) disclaim responsibility for any injury to people or property resulting from any ideas, methods, instructions or products referred to in the content. |
© 2026 by the authors. Licensee MDPI, Basel, Switzerland. This article is an open access article distributed under the terms and conditions of the Creative Commons Attribution (CC BY) license.