


Abstract
To systematically investigate the effects of C-shaped and rectangular steel frames on the seismic performance of assembled composite shear walls, this paper, based on the validation of existing pseudo-static test results, employs ABAQUS software to establish refined finite element models, and carries out parametric analyses on C-shaped steel-frame composite shear walls (CSCSWs) and rectangular steel-frame composite shear walls (RSCSWs). With shear-span ratio, axial-load ratio, boundary frame steel plate thickness, and concrete strength grade as variables, a total of 28 numerical models are designed to systematically examine the influence laws of each parameter on bearing capacity, ductility, energy dissipation capacity, and failure modes, and to reveal the performance differences in the confinement mechanisms of the two cross-sectional types. The results indicate that: as the shear-span ratio decreases from 3.0 to 1.0, the bearing capacity increases by up to 171%, but the ductility drops by up to 43%, and the failure mode shifts from flexure-dominated to shear-dominated; increasing the steel plate thickness can simultaneously enhance bearing capacity and ductility, with the peak load increasing by up to 52% and cumulative energy dissipation by over 110%, the mechanism being the synergistic enhancement of the flexural contribution of the boundary frame and the passive confinement effect on the core concrete; increasing the axial-load ratio can improve bearing capacity by about 24%, but significantly impairs ductility and energy dissipation capacity, and it is recommended that the design axial-load ratio be controlled between 0.26 and 0.43; the concrete strength grade has a limited effect on bearing capacity, and as the strength increases, brittle characteristics emerge, leading to a ductility decrease of about 12%; therefore, provided that the strength requirements are met, enhancing the concrete strength grade should not be taken as the primary technical approach for improving the seismic performance of such structures. Comparing the two cross-sectional types, the rectangular cross-section, by providing more uniform and effective lateral confinement, exhibits superior bearing capacity, ductility, and energy dissipation to the C-shaped cross-section across the entire parameter domain, and its performance advantages are more pronounced under conditions of high axial-load ratio and large shear-span ratio.
1. Introduction
In recent years, repeated severe earthquake disasters have demonstrated that the seismic performance of reinforced concrete (RC) buildings remains a critical issue in structural engineering. When the lateral resistance, ductility reserve, or detailing provisions of a structure are insufficient, structural components may experience brittle failure and even lead to progressive collapse. The 2023 Kahramanmaraş earthquakes caused extensive damage to numerous RC buildings, while the 2026 Venezuelan earthquake sequence further resulted in regional foundation instability and structural damage [1,2]. These earthquake events highlight that structural lateral-resisting systems should possess not only sufficient load-bearing capacity but also adequate ductility, stable cyclic deformation capacity, and excellent energy dissipation performance to ensure structural safety under severe seismic actions. With the rapid development of industrialized construction, prefabricated buildings have been increasingly adopted due to their advantages in construction quality control, efficiency, and reduced resource consumption [3,4]. As one of the primary lateral-resisting components in medium- and high-rise buildings, shear walls play a crucial role in determining the overall seismic performance of structures. Therefore, developing novel composite shear wall systems with high strength, excellent ductility, and superior energy dissipation capacity has become an important research direction in seismic engineering of prefabricated structures.
To enhance the seismic performance of RC structures, various strengthening and optimization strategies have been proposed from the perspectives of materials, structural components, and structural systems. These approaches include the use of fiber-reinforced polymer (FRP) confinement or strengthening for RC members, steel plate and steel section reinforcement, concrete-filled steel tube (CFST) boundary elements, and self-centering or energy-dissipating connection systems [5,6]. Previous studies have demonstrated that FRP confinement can effectively improve ductility and delay brittle shear failure of RC members, while steel plate and steel section strengthening can enhance load-carrying capacity and stiffness. Moreover, CFST boundary elements and advanced connection systems can further improve deformation capacity, energy dissipation performance, and post-earthquake recoverability. These studies have provided effective approaches for improving the seismic performance of RC structures and have promoted the development of steel–concrete composite shear wall systems.
For steel–concrete composite shear walls, extensive investigations have been conducted worldwide on different boundary restraint configurations and structural systems. Previous studies have demonstrated that steel-reinforced concrete shear walls can enhance tensile resistance and boundary confinement effects, delay concrete crushing, and improve strength, ductility, and energy dissipation capacity [7,8,9,10,11]. Concrete-filled steel tube framed shear walls provide continuous boundary confinement and further enhance cumulative energy dissipation and ultimate deformation capacity [12,13,14,15,16,17,18]. Recently, double-steel-plate and multi-cell composite shear walls have attracted considerable attention. By optimizing steel plate arrangements, connection configurations, and infill materials, these systems can effectively suppress local buckling of steel plates and improve stiffness degradation characteristics and hysteretic energy dissipation performance [19,20,21,22,23,24]. Overall, the seismic performance of composite shear walls is governed by the coupled effects of boundary restraint configuration, steel contribution, concrete confinement, connection details, and geometric parameters. Among these factors, the boundary frame configuration not only determines the overall confinement effect but also directly influences the steel–concrete cooperative load-transfer mechanism, making it a critical factor affecting the seismic behavior of composite shear walls. However, existing studies have mainly focused on composite shear walls with closed-type boundary frame systems.
Although significant progress has been achieved in steel plate composite shear walls, investigations on composite shear walls with open C-shaped boundary frames (CSCSW) remain limited. This is mainly attributed to the discontinuous confinement mechanism, relatively weaker local stability, and more complicated steel–concrete interaction behavior associated with open C-shaped boundary frames, which increase the difficulty of experimental and numerical investigations. Furthermore, previous studies on CSCSW and rectangular steel-frame composite shear walls (RSCSWs) have mainly relied on cyclic loading tests. Due to limitations in specimen quantity and experimental cost, it remains difficult to systematically evaluate the effects of key design parameters, including shear-span ratio, axial-load ratio, steel plate thickness, and concrete strength, on the seismic performance of these two wall systems. More importantly, the relative contributions of boundary-frame configuration, steel consumption, sectional stiffness, and reinforcement detailing to the differences in seismic behavior have not been quantitatively clarified. Therefore, the mechanisms governing the performance differences between different composite shear wall systems and the influence of key design parameters remain insufficiently understood.
Based on previous low-cycle cyclic loading tests, this study develops and validates finite element models for CSCSW and RSCSW. A comprehensive parametric analysis is then conducted to investigate the effects of shear-span ratio, axial-load ratio, steel plate thickness, and concrete strength on the strength, ductility, energy dissipation capacity, and failure modes of the two composite shear wall systems. Furthermore, the steel–concrete cooperative load-transfer characteristics and the influence of engineering detailing differences under different boundary-frame configurations are explored. Compared with previous studies, this study extends investigations to composite shear walls with open C-shaped boundary frames and performs a multi-parameter numerical analysis based on experimentally validated models, providing further insights into the mechanisms responsible for the seismic performance differences between C-shaped and rectangular steel-frame composite shear walls.
2. Review of Experiments
2.1. Specimen Design and Fabrication
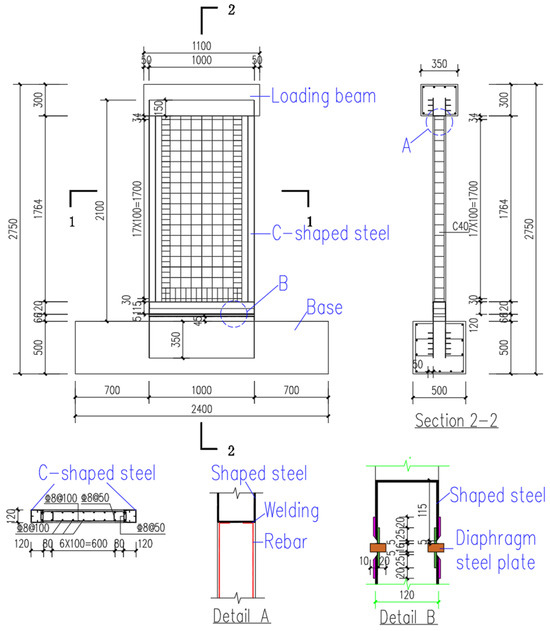
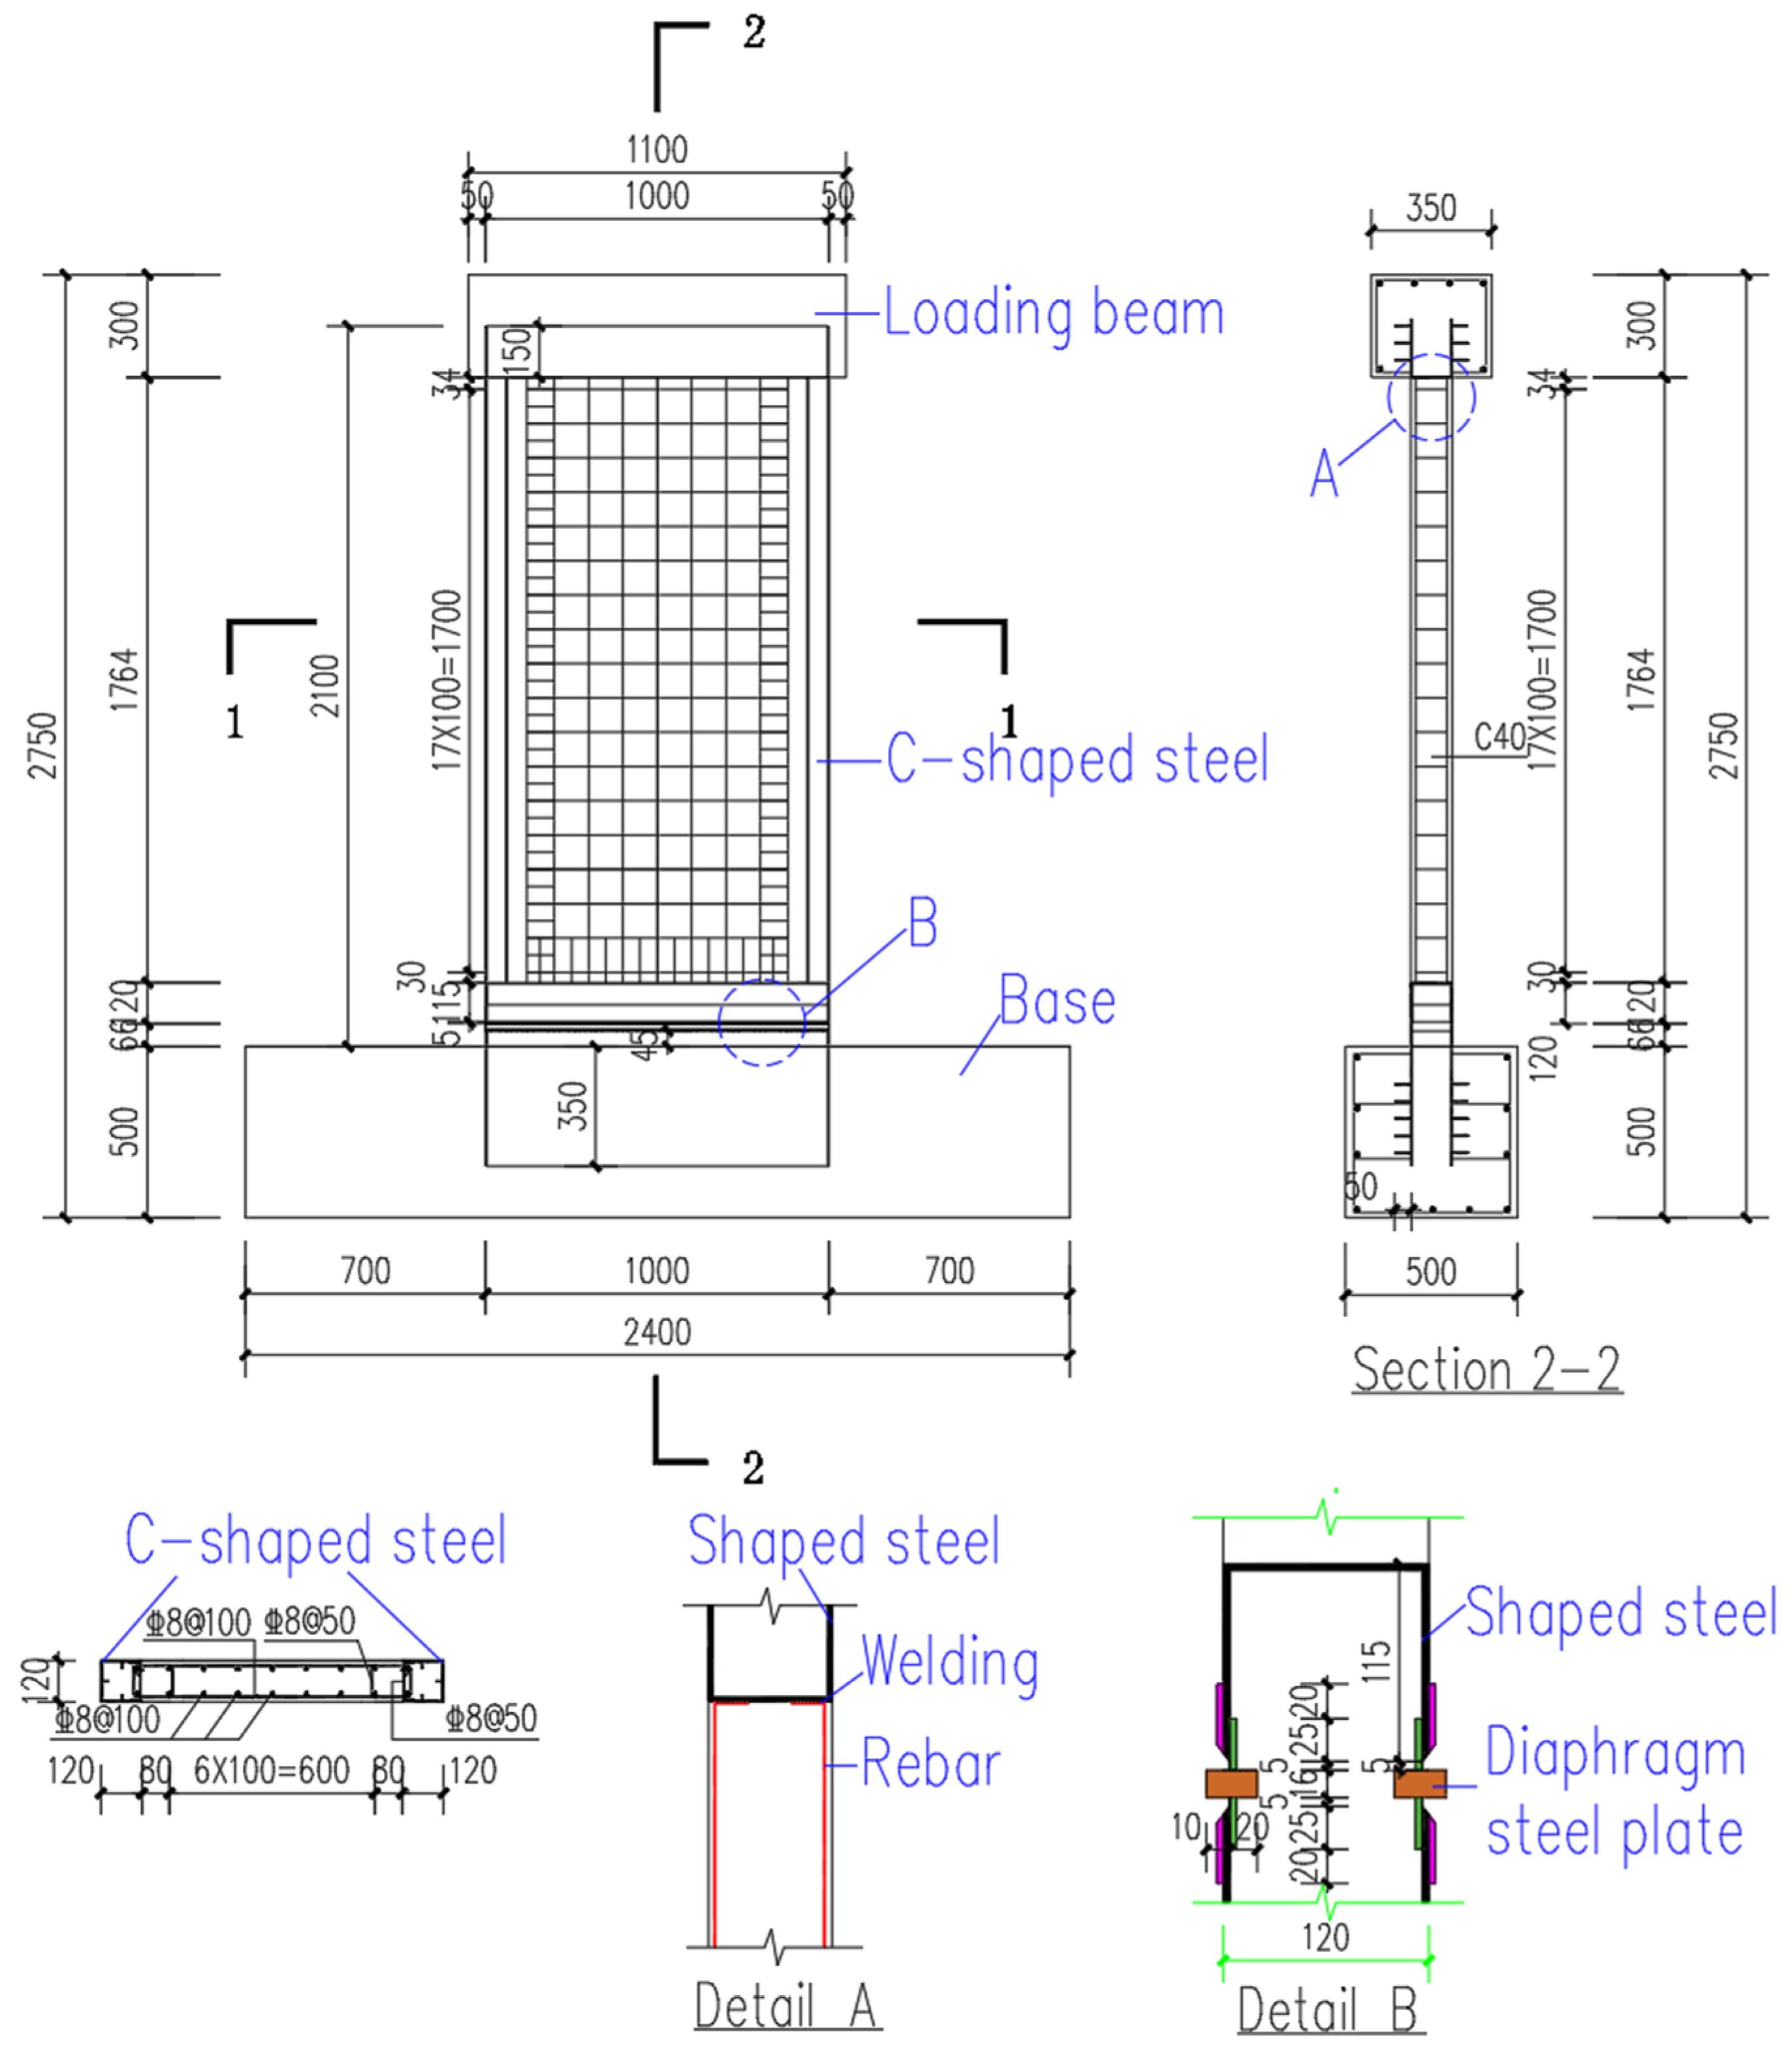
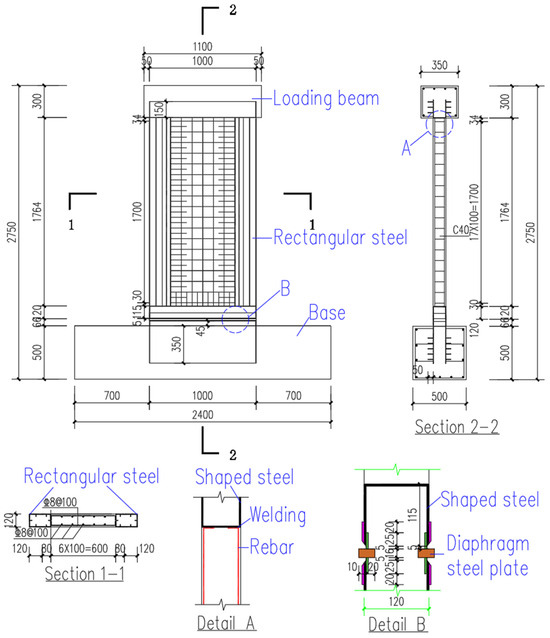
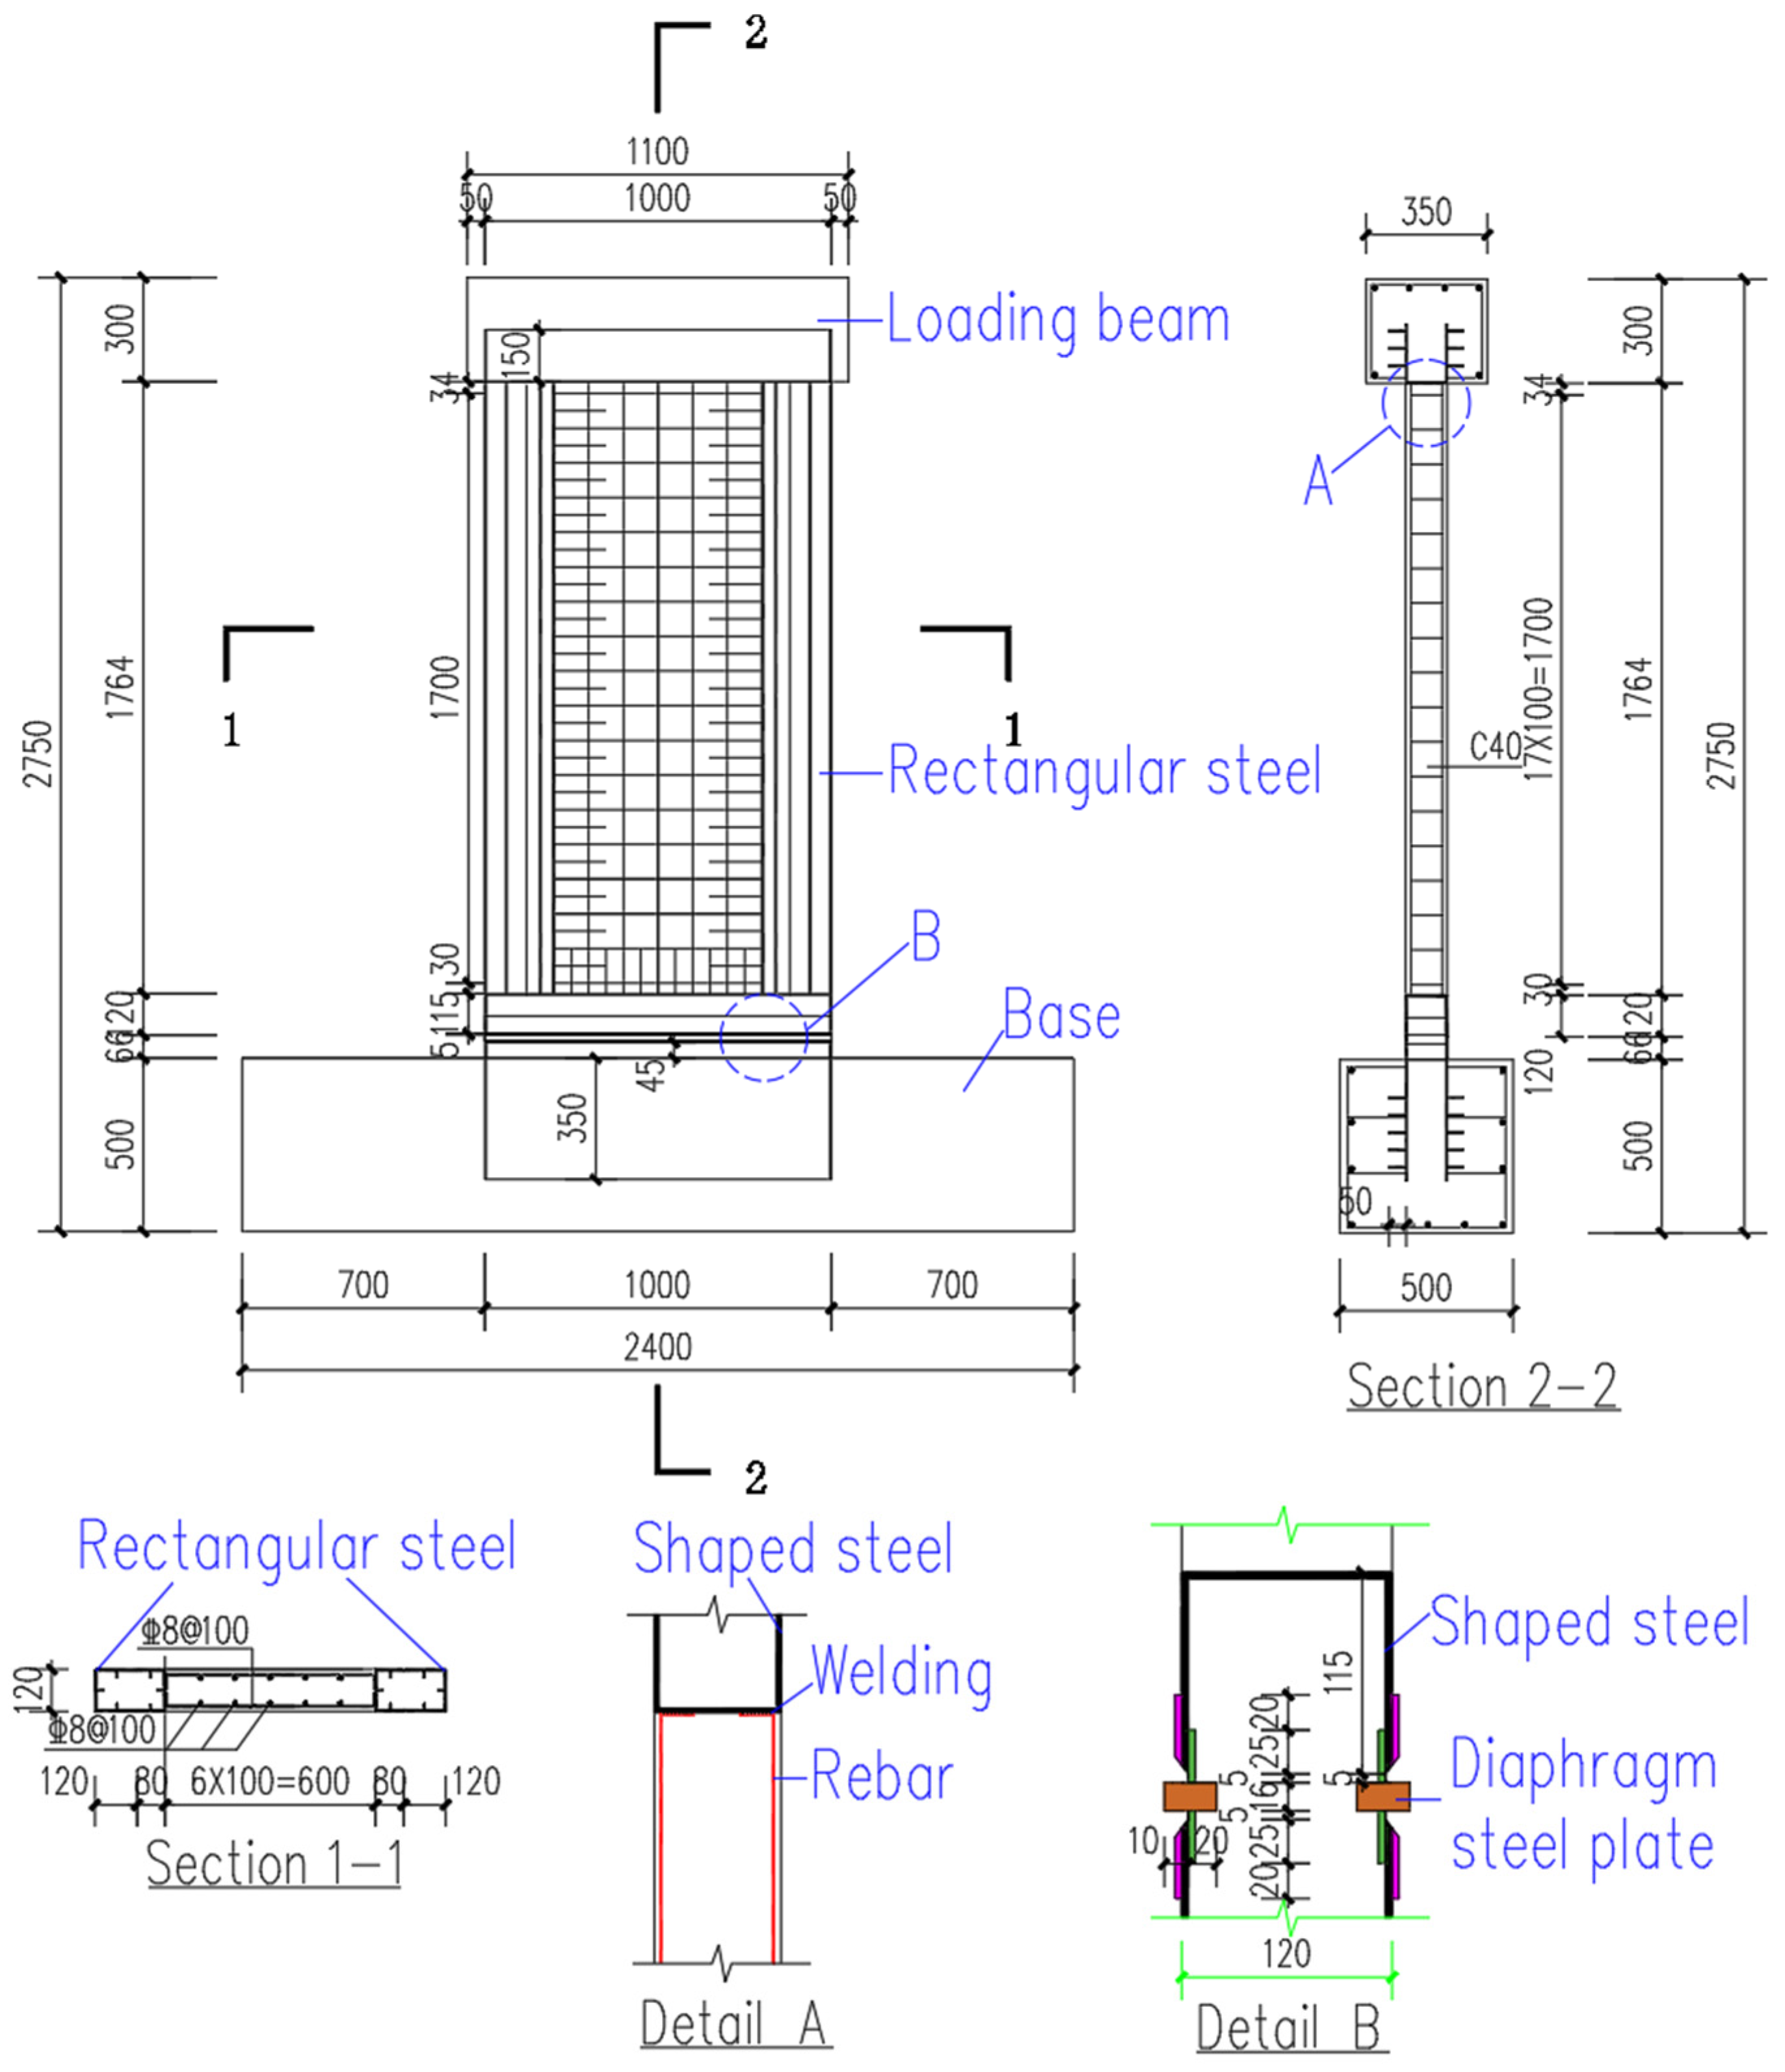
Two 1/2-scale assembled steel-frame composite shear wall specimens, namely CSCSW and RSCSW, were designed and fabricated. The wall panel dimensions were 2000 mm × 1000 mm × 120 mm, and the specimens were rigidly connected to the loading beam and foundation beam to ensure reliable force transfer during cyclic loading. A 1/2 geometric scale ratio was selected to balance the practical constraints associated with laboratory space and actuator capacity while preserving the key mechanical similarity parameters of the prototype wall, including the height-to-width ratio, shear-span ratio, axial-load ratio, reinforcement ratio, plate slenderness, connection configuration, and displacement-controlled loading protocol. Because the present study was based on quasi-static cyclic testing and aimed to evaluate comparative structural behavior rather than satisfy dynamic similitude requirements dominated by inertial effects, the material properties were kept consistent with those of the prototype without artificial scaling. The specimen design and testing methodology followed the relevant Chinese material testing standards and the Code for Seismic Testing of Buildings (JGJ/T 101-2015) [25]. Figure 1 and Figure 2 illustrate the geometric dimensions and detailed configurations of the specimens. The nominal gross-section properties of the boundary steel frames are summarized in Table 1. The specific design parameters of the two specimens are described as follows.
Figure 1.
Details of specimen CSCSW.
Figure 2.
Details of specimen RSCSW.
Table 1.
Nominal gross-section properties of the boundary steel frames.
- (1)
- The design of specimen CSCSW is shown in Figure 1. The longitudinal reinforcement for the foundation beam (JZL) and the loading beam (JC) were both C18 bars, and the stirrups were C10@100. C-shaped steel, measuring 120 mm × 120 mm, was used for the two side boundary frames of CSCSW, with stiffeners placed inside. The vertical distributed reinforcement bars in the wall were bent and welded to the top and bottom steel boundary frames. U-shaped reinforcement was set at the bottom of the wall, with its horizontal segments welded to the bottom steel frame.
- (2)
- The design of specimen RSCSW is shown in Figure 2. The rectangular steel boundary frame of RSCSW was fabricated by welding two C-shaped steel sections mouth-to-mouth, with stiffeners inside. The dimensions of the rectangular steel frame were 120 mm × 200 mm × 2.86 mm. The vertical and horizontal distributed reinforcement bars in the wall were bent and welded to the top and bottom steel frames. U-shaped reinforcement was placed at the bottom and both sides of the wall, with the horizontal segments welded to the bottom and side steel frames.
2.2. Materials
During the fabrication of the specimens, steel plates and reinforcement bars from the same batch as the specimens were used for material property tests. Sampling and testing of the steel were conducted according to Chinese standard GB/T 2975-2018 [26] using an MTS 311.31 testing machine (MTS Systems Corporation, Eden Prairie, MN, USA) for tensile tests. Three specimens were tested for each group, and the average values of the results were taken. The mechanical properties of the steel are shown in Table 2. The concrete material properties were determined according to GB/T 50081-2019 [27]. After curing under the same conditions as the specimens for 28 days, three 150 mm × 150 mm × 150 mm cubic blocks were tested for their mechanical properties. The measured compressive strength of the concrete was 41.8 MPa.
Table 2.
Mechanical properties of steel.
2.3. Test Setup and Loading Protocol
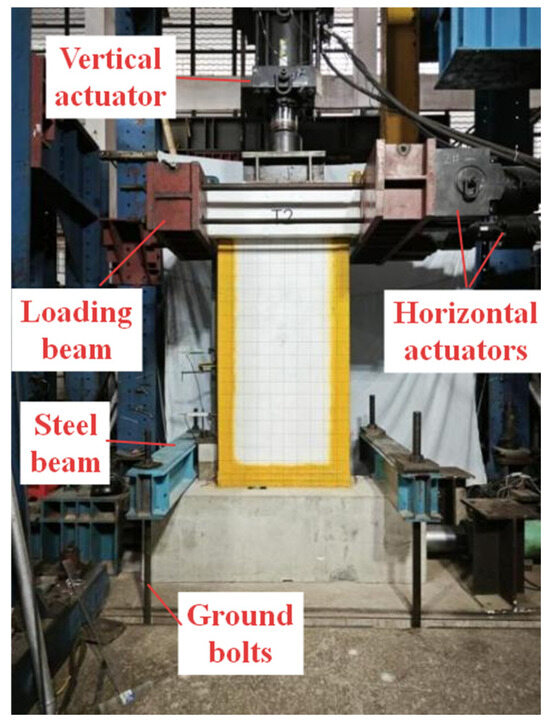
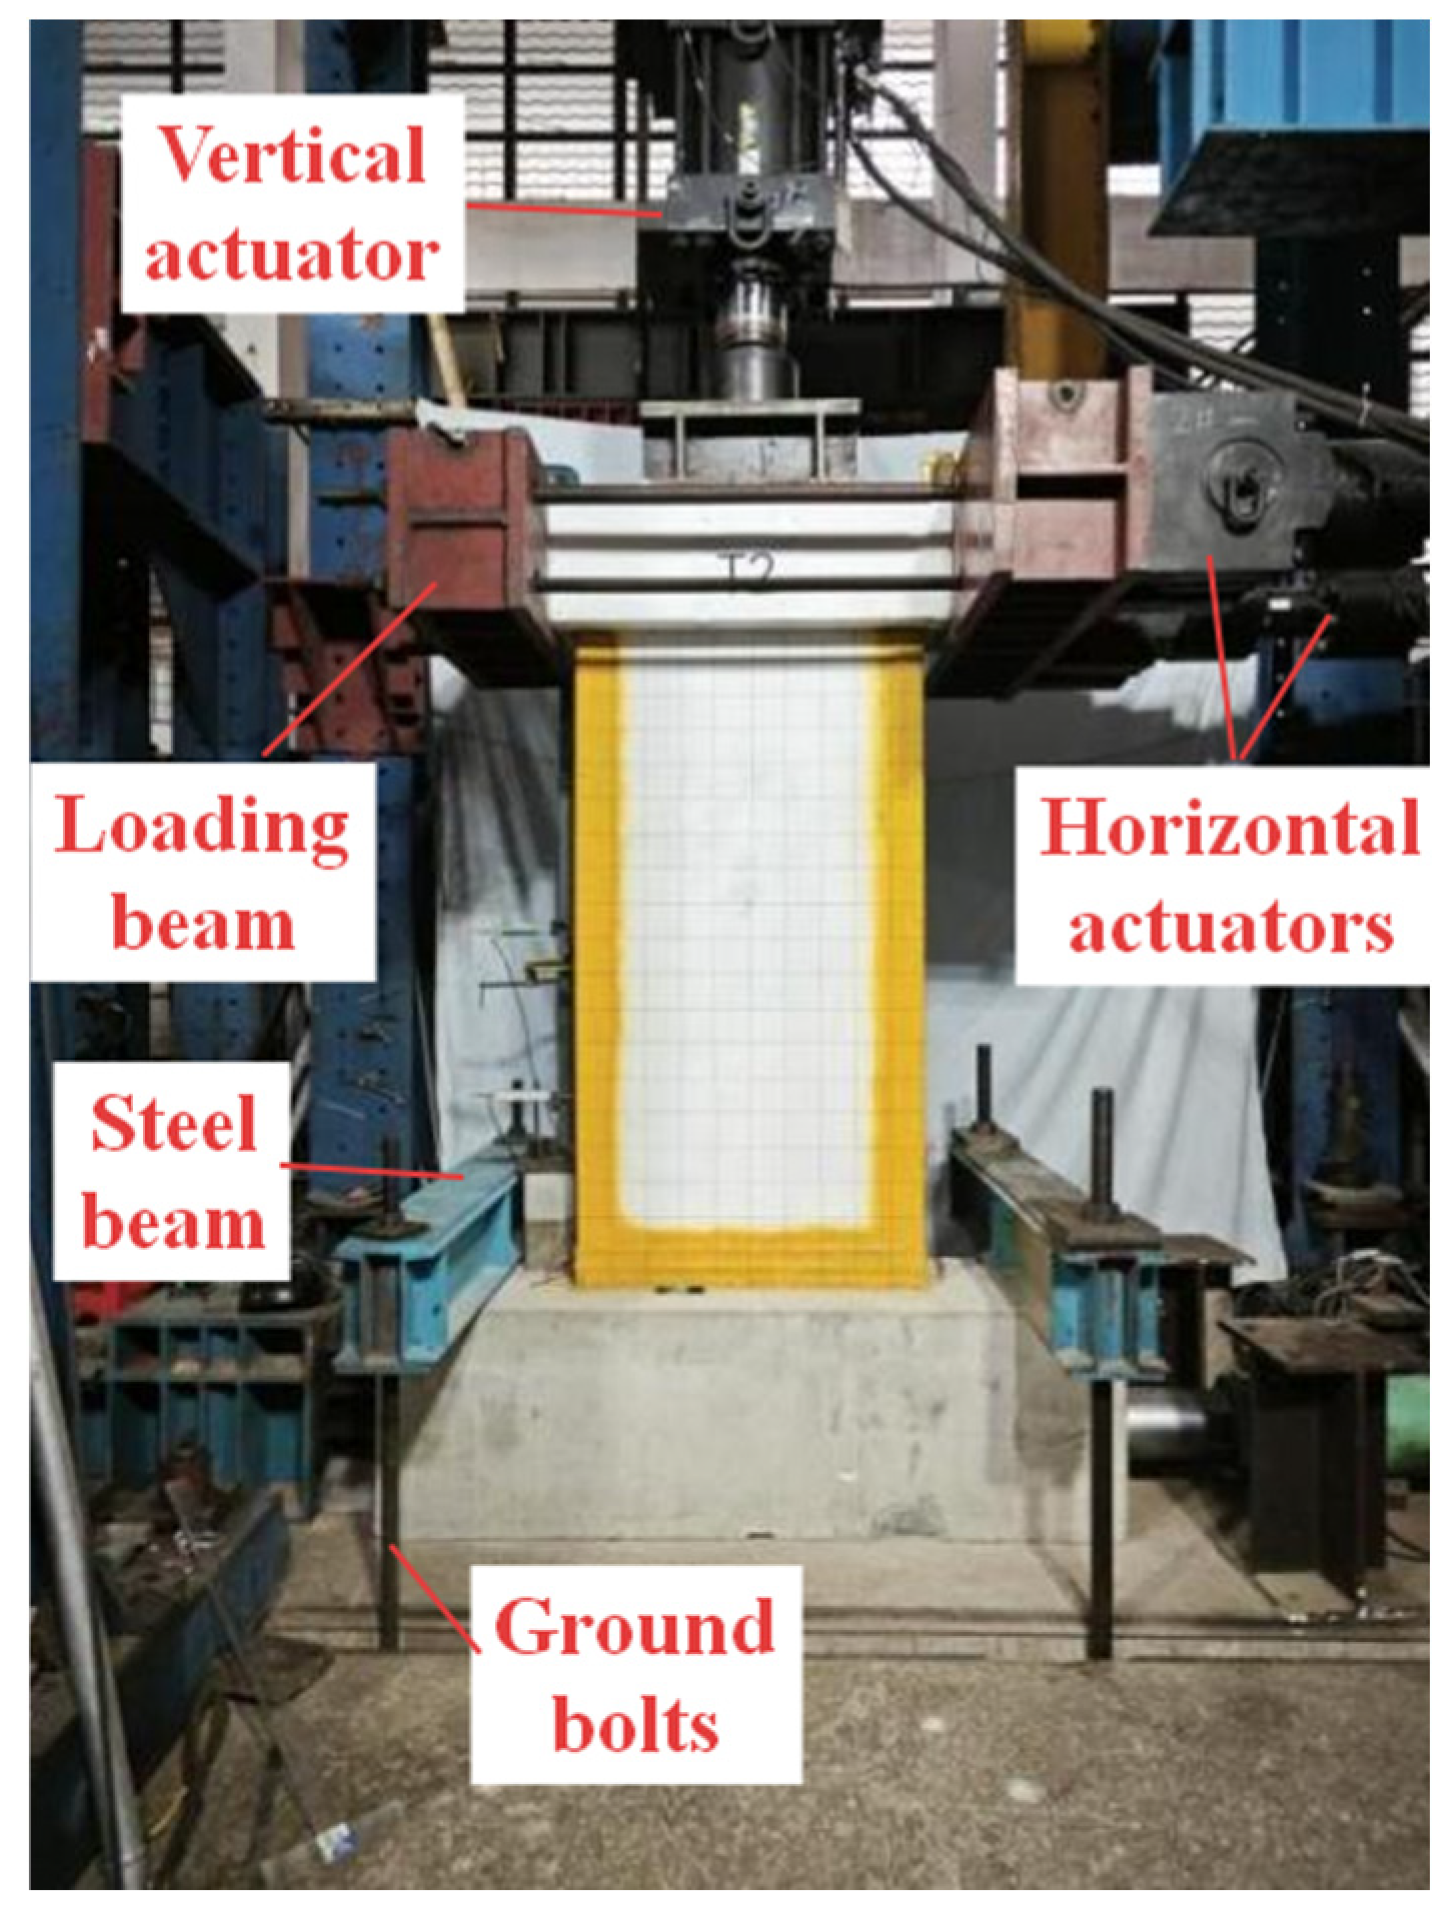
The test setup consisted of a reaction wall, two MTS horizontal actuators (each with a pushing capacity of 1500 kN, pulling capacity of 1300 kN, and a stroke of ±250 mm), a vertical 1000 kN actuator, and a ground beam fixing system, as shown in Figure 3. The rear ends of the horizontal actuators were fixed to the reaction wall, and the front ends were connected to the loading beam via high-strength bolts to apply horizontal reciprocating loads.
Figure 3.
Test setup.
Preloading: A vertical load of 100 kN was first applied, followed by one cycle of horizontal reciprocating load of ±50 kN. Observations were made during loading to check for any sliding or buckling of the ground beam and to verify that all measuring instruments were functioning correctly. After confirming there were no abnormalities, preparations were made for subsequent loading.
Axial loading: Loading was applied according to the designed axial-load ratio of 0.17. This load was maintained constant until the end of the test.
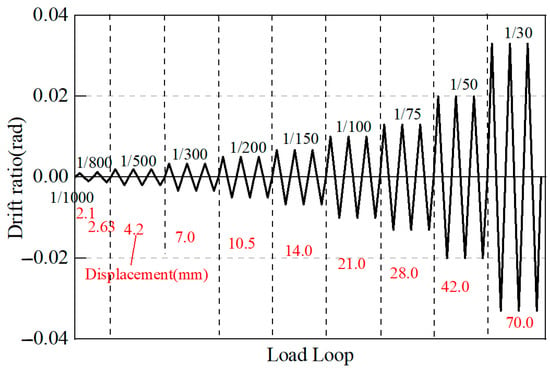
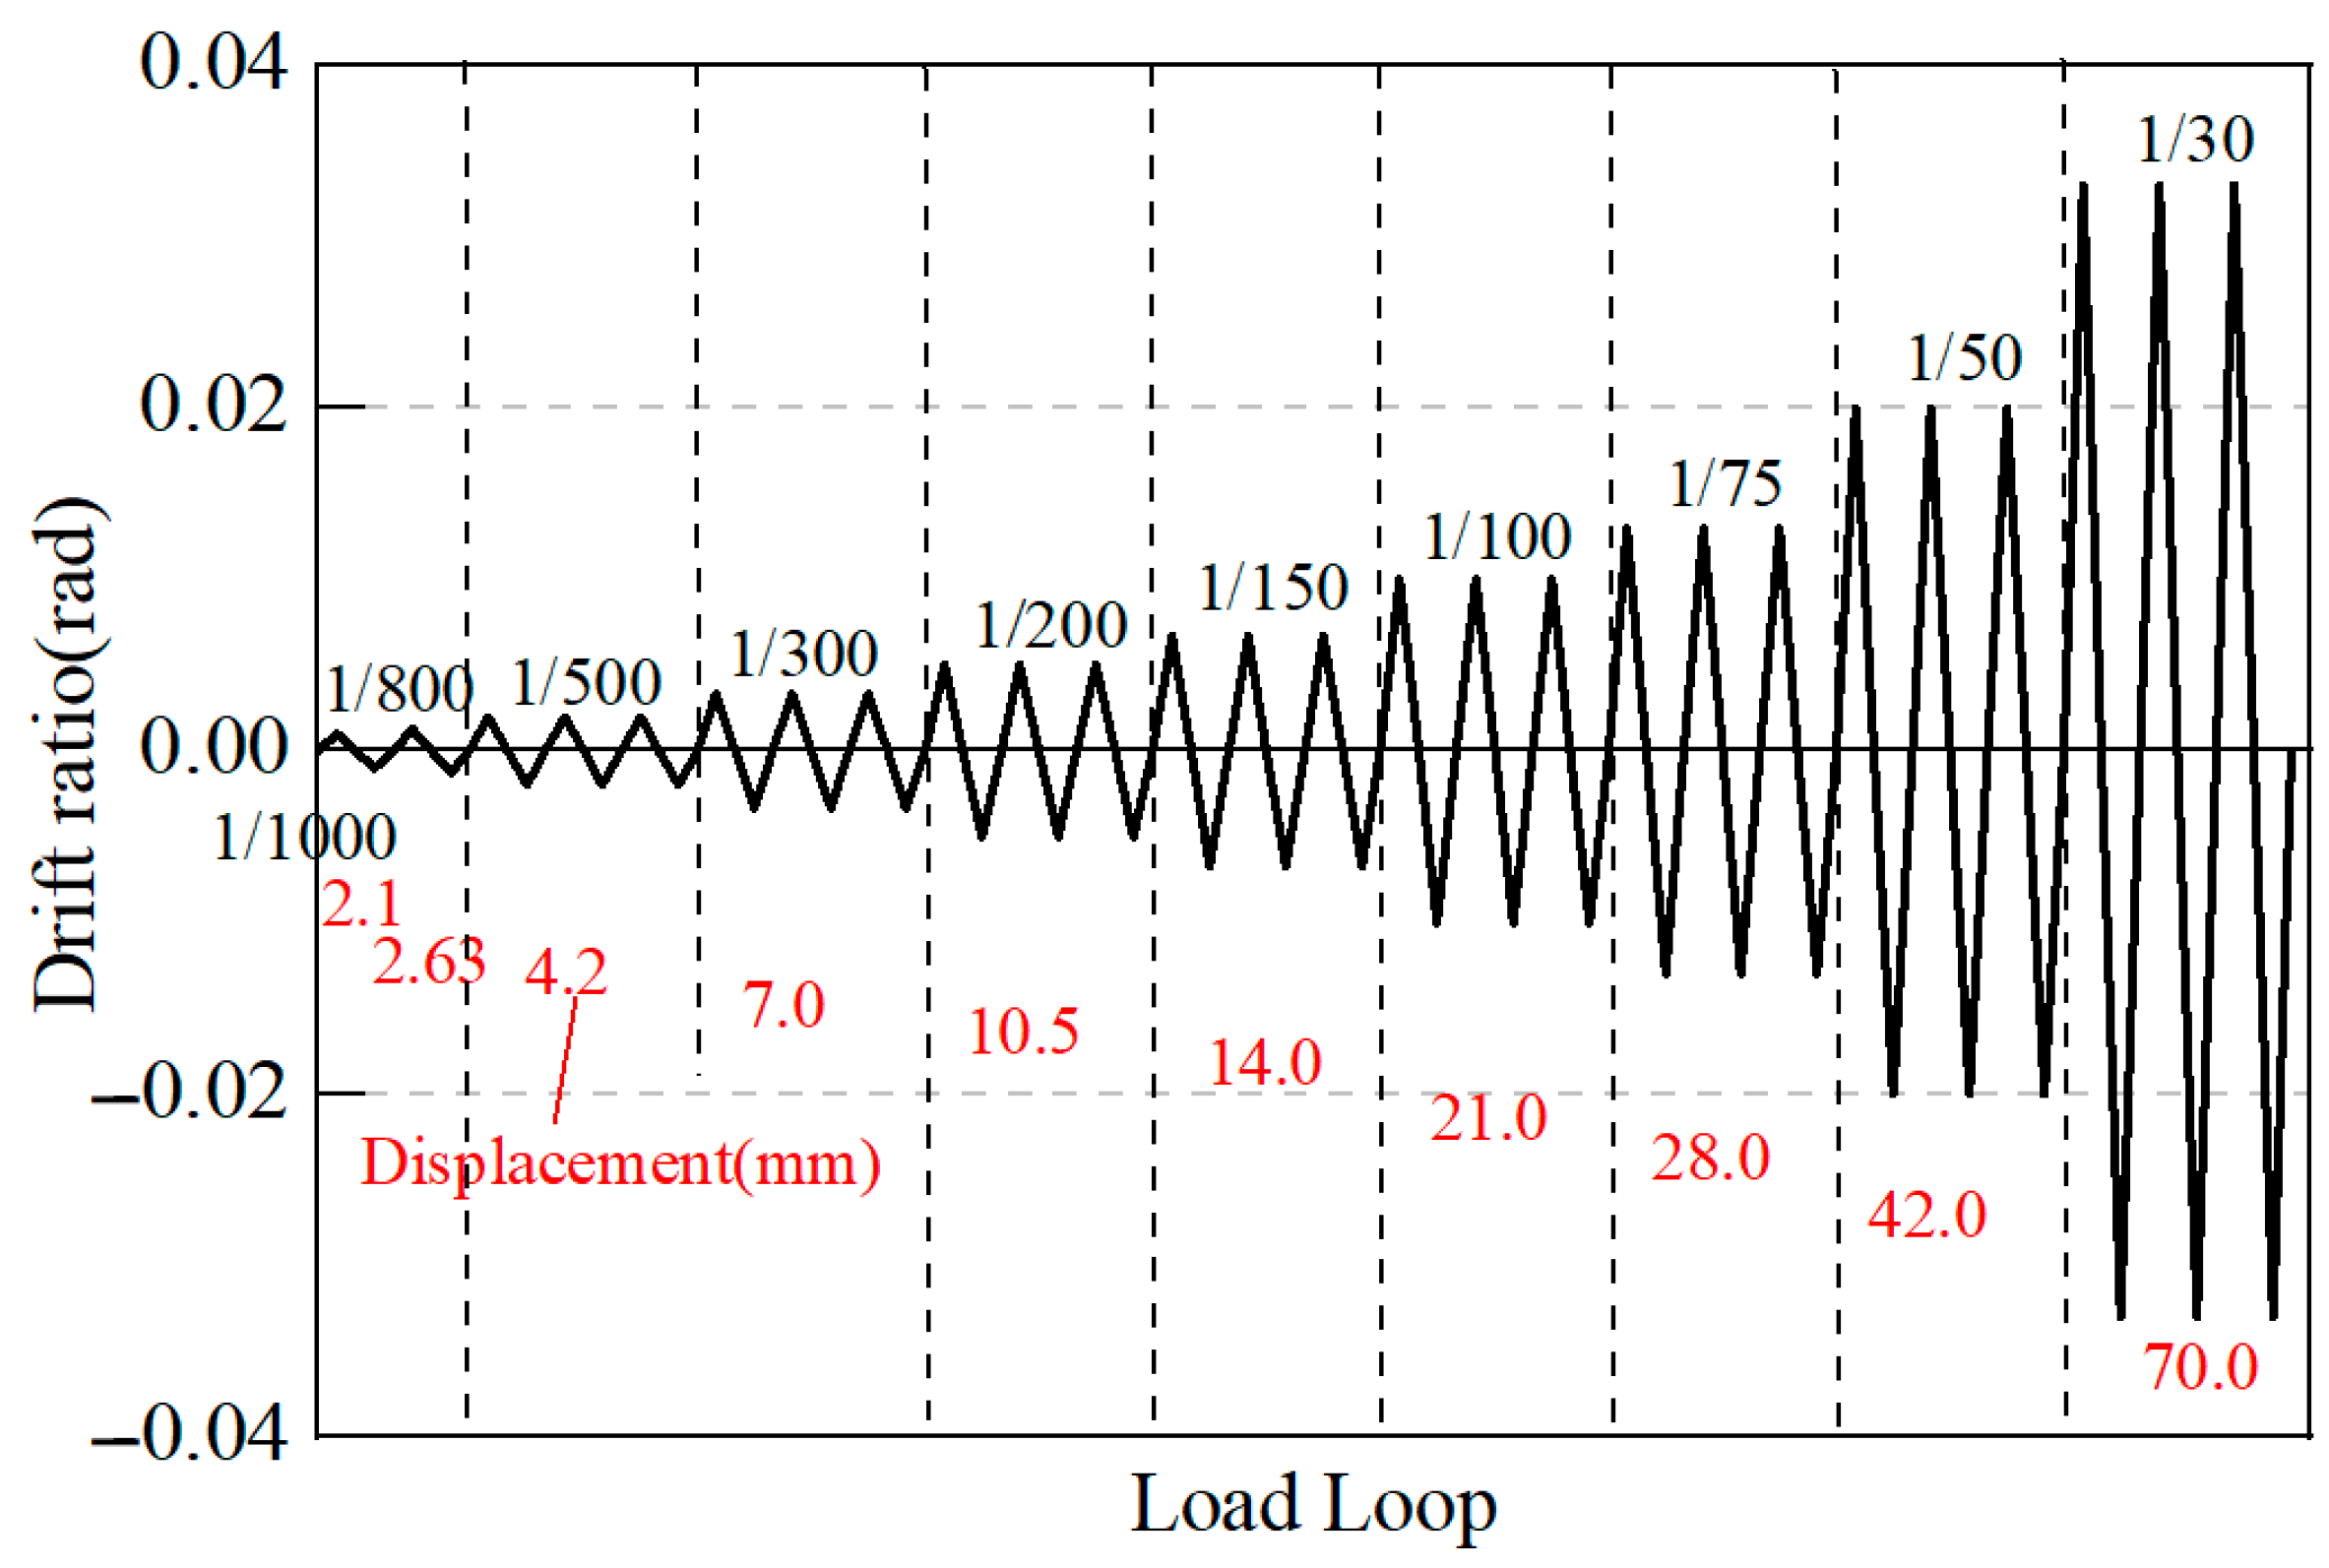
Horizontal loading: The horizontal loading was controlled by displacement corresponding to various drift ratios. The first and second drift levels involved one loading cycle each, and from the third level onwards, three loading cycles were applied. Loading continued until the specimen failed and could no longer sustain the load, or its bearing capacity dropped below 85% of the maximum measured test capacity. The horizontal loading protocol is shown in Figure 4.
Figure 4.
Test loading program.
2.4. Test Results and Analysis
2.4.1. Failure Process and Modes
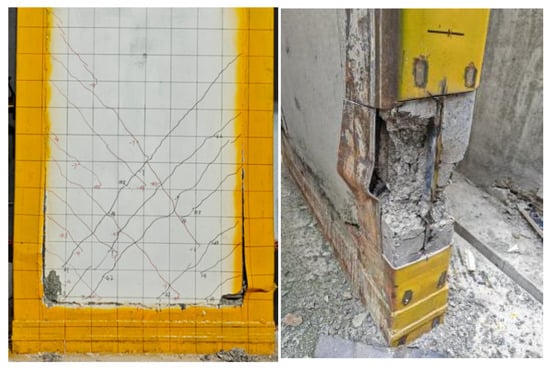
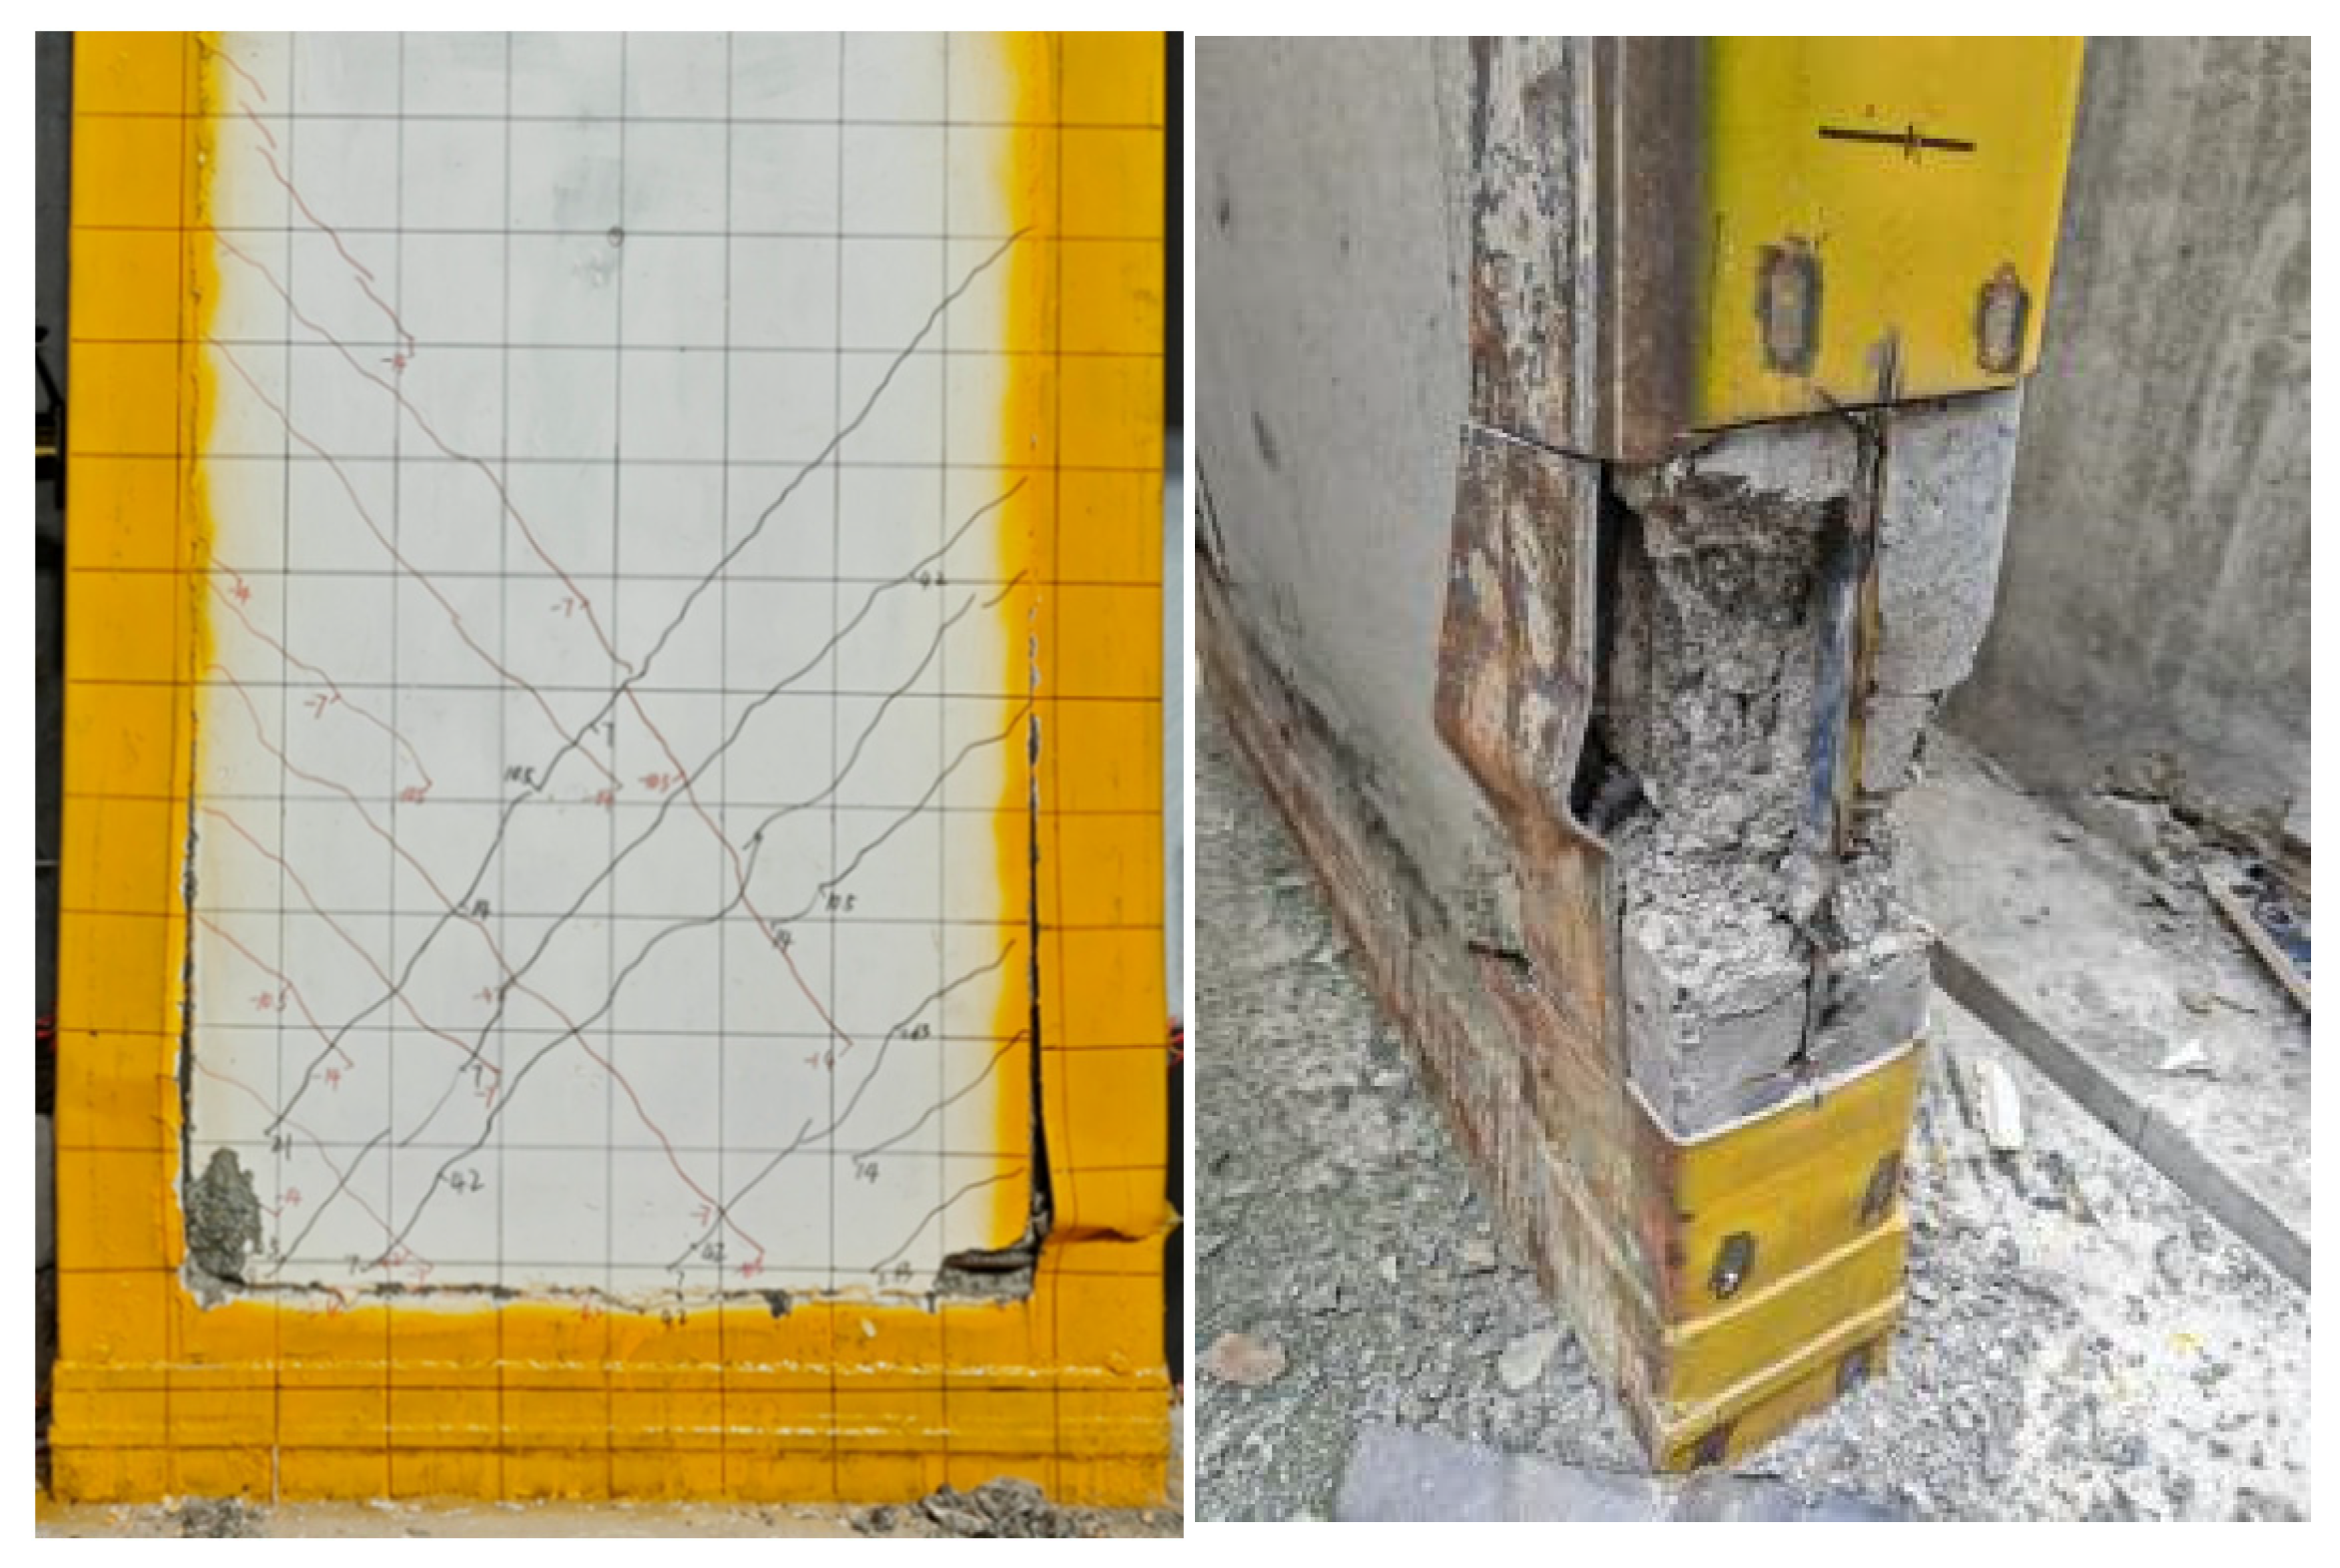
For CSCSW, diagonal cracks and horizontal cracks at the steel–concrete interface appeared at a drift ratio of 1/500. At 1/300, the interface crack penetrated through the section, reaching a width of 0.35 mm. At 1/200, local buckling of the steel plate occurred on the compression side, approximately 240 mm from the wall base. At 1/100, corner concrete spalling was observed. At 1/30, the steel plate tore, and the corner concrete was crushed, as shown in Figure 5.
Figure 5.
CSCSW failure mode.
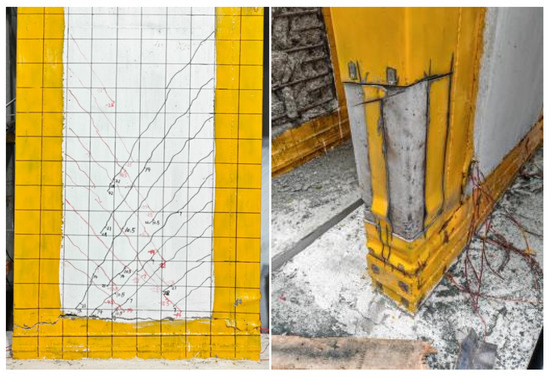
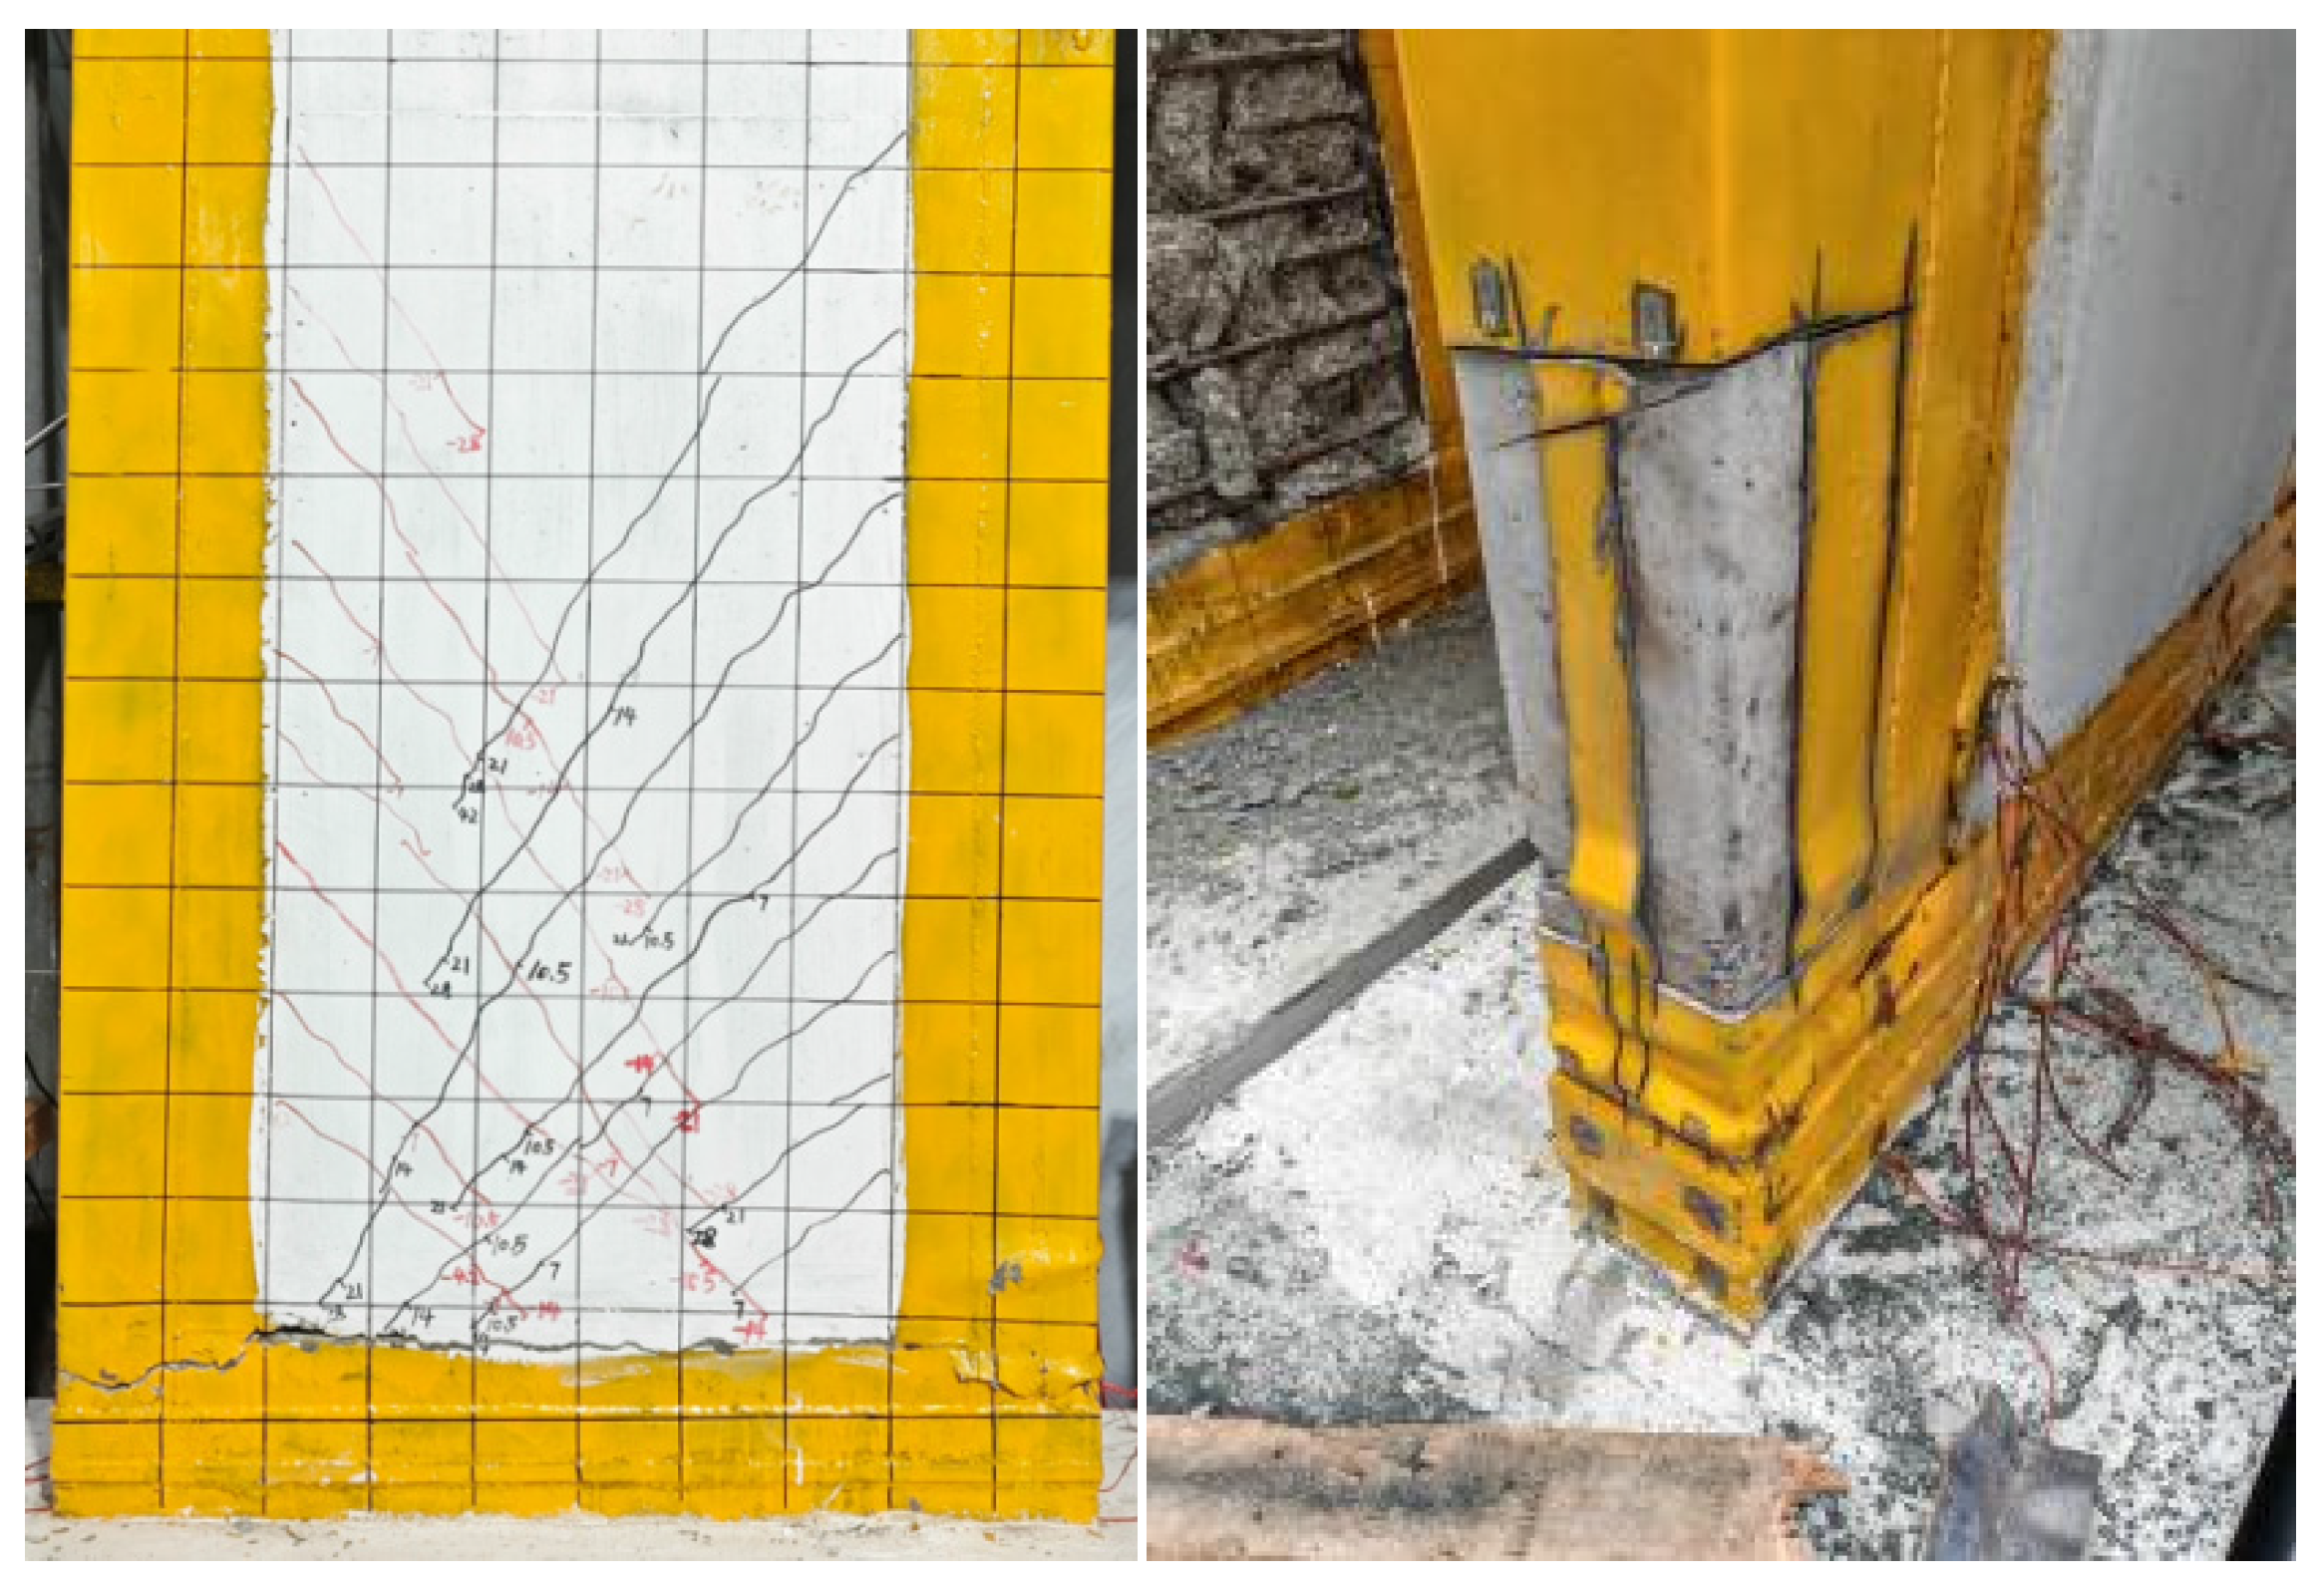
For RSCSW, cracking occurred later than in CSCSW with fewer cracks. At a drift ratio of 1/150, steel plate buckling occurred at a distance of 160 mm from the wall base. Finally, at 1/30, the steel plate fractured in tension, and the extent of the corner crushing zone was smaller, as shown in Figure 6.
Figure 6.
RSCSW failure mode.
2.4.2. Hysteresis Curves
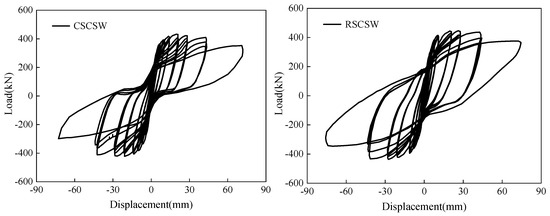
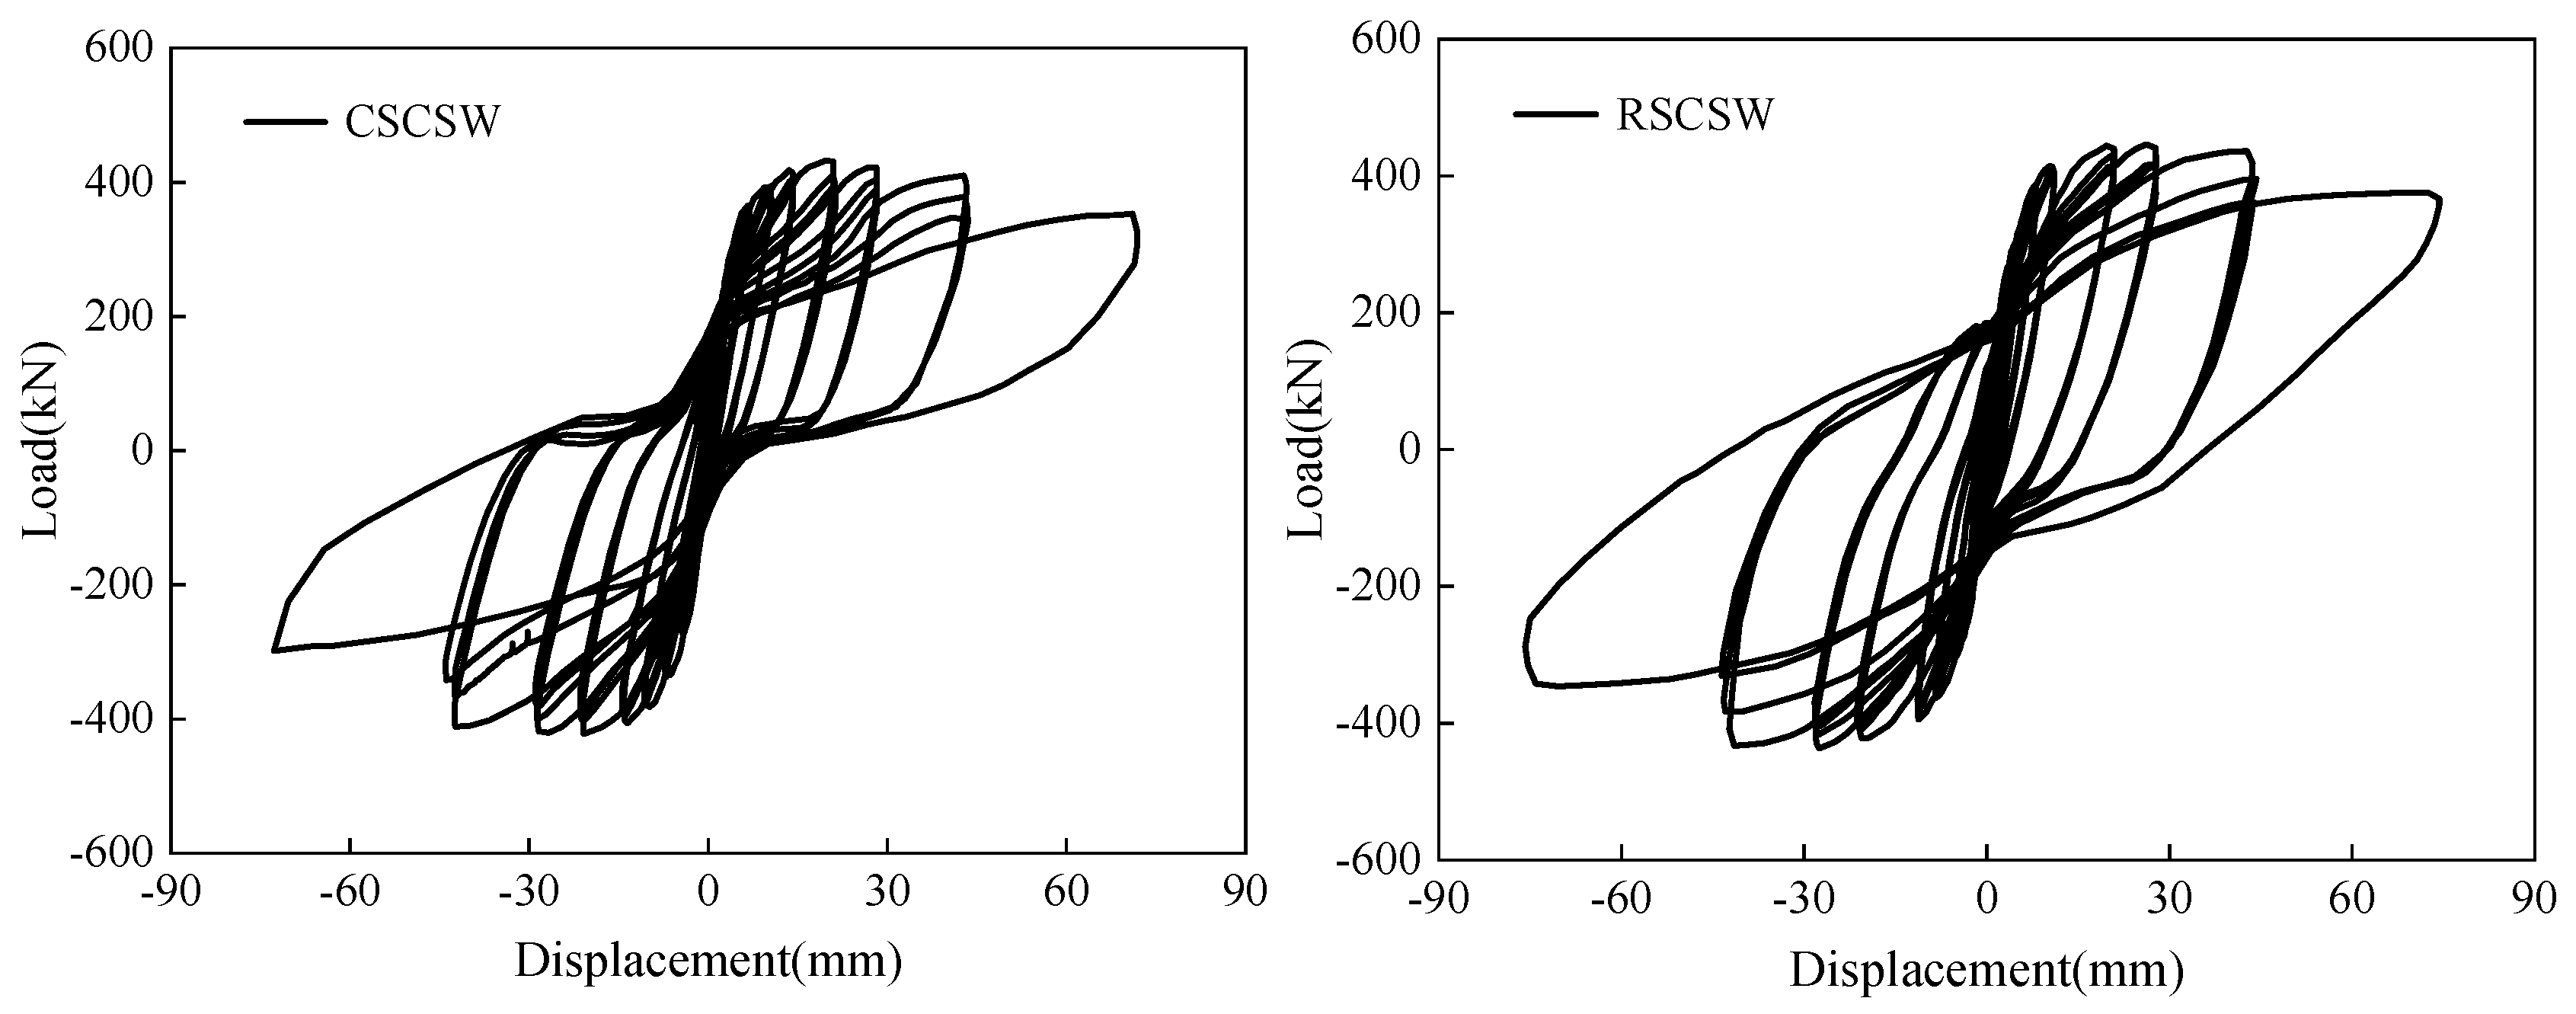
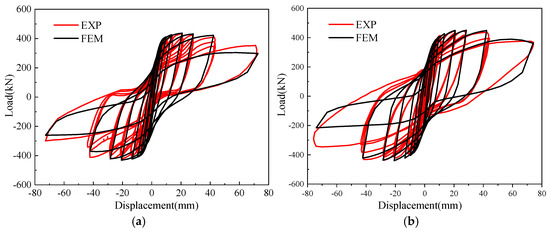
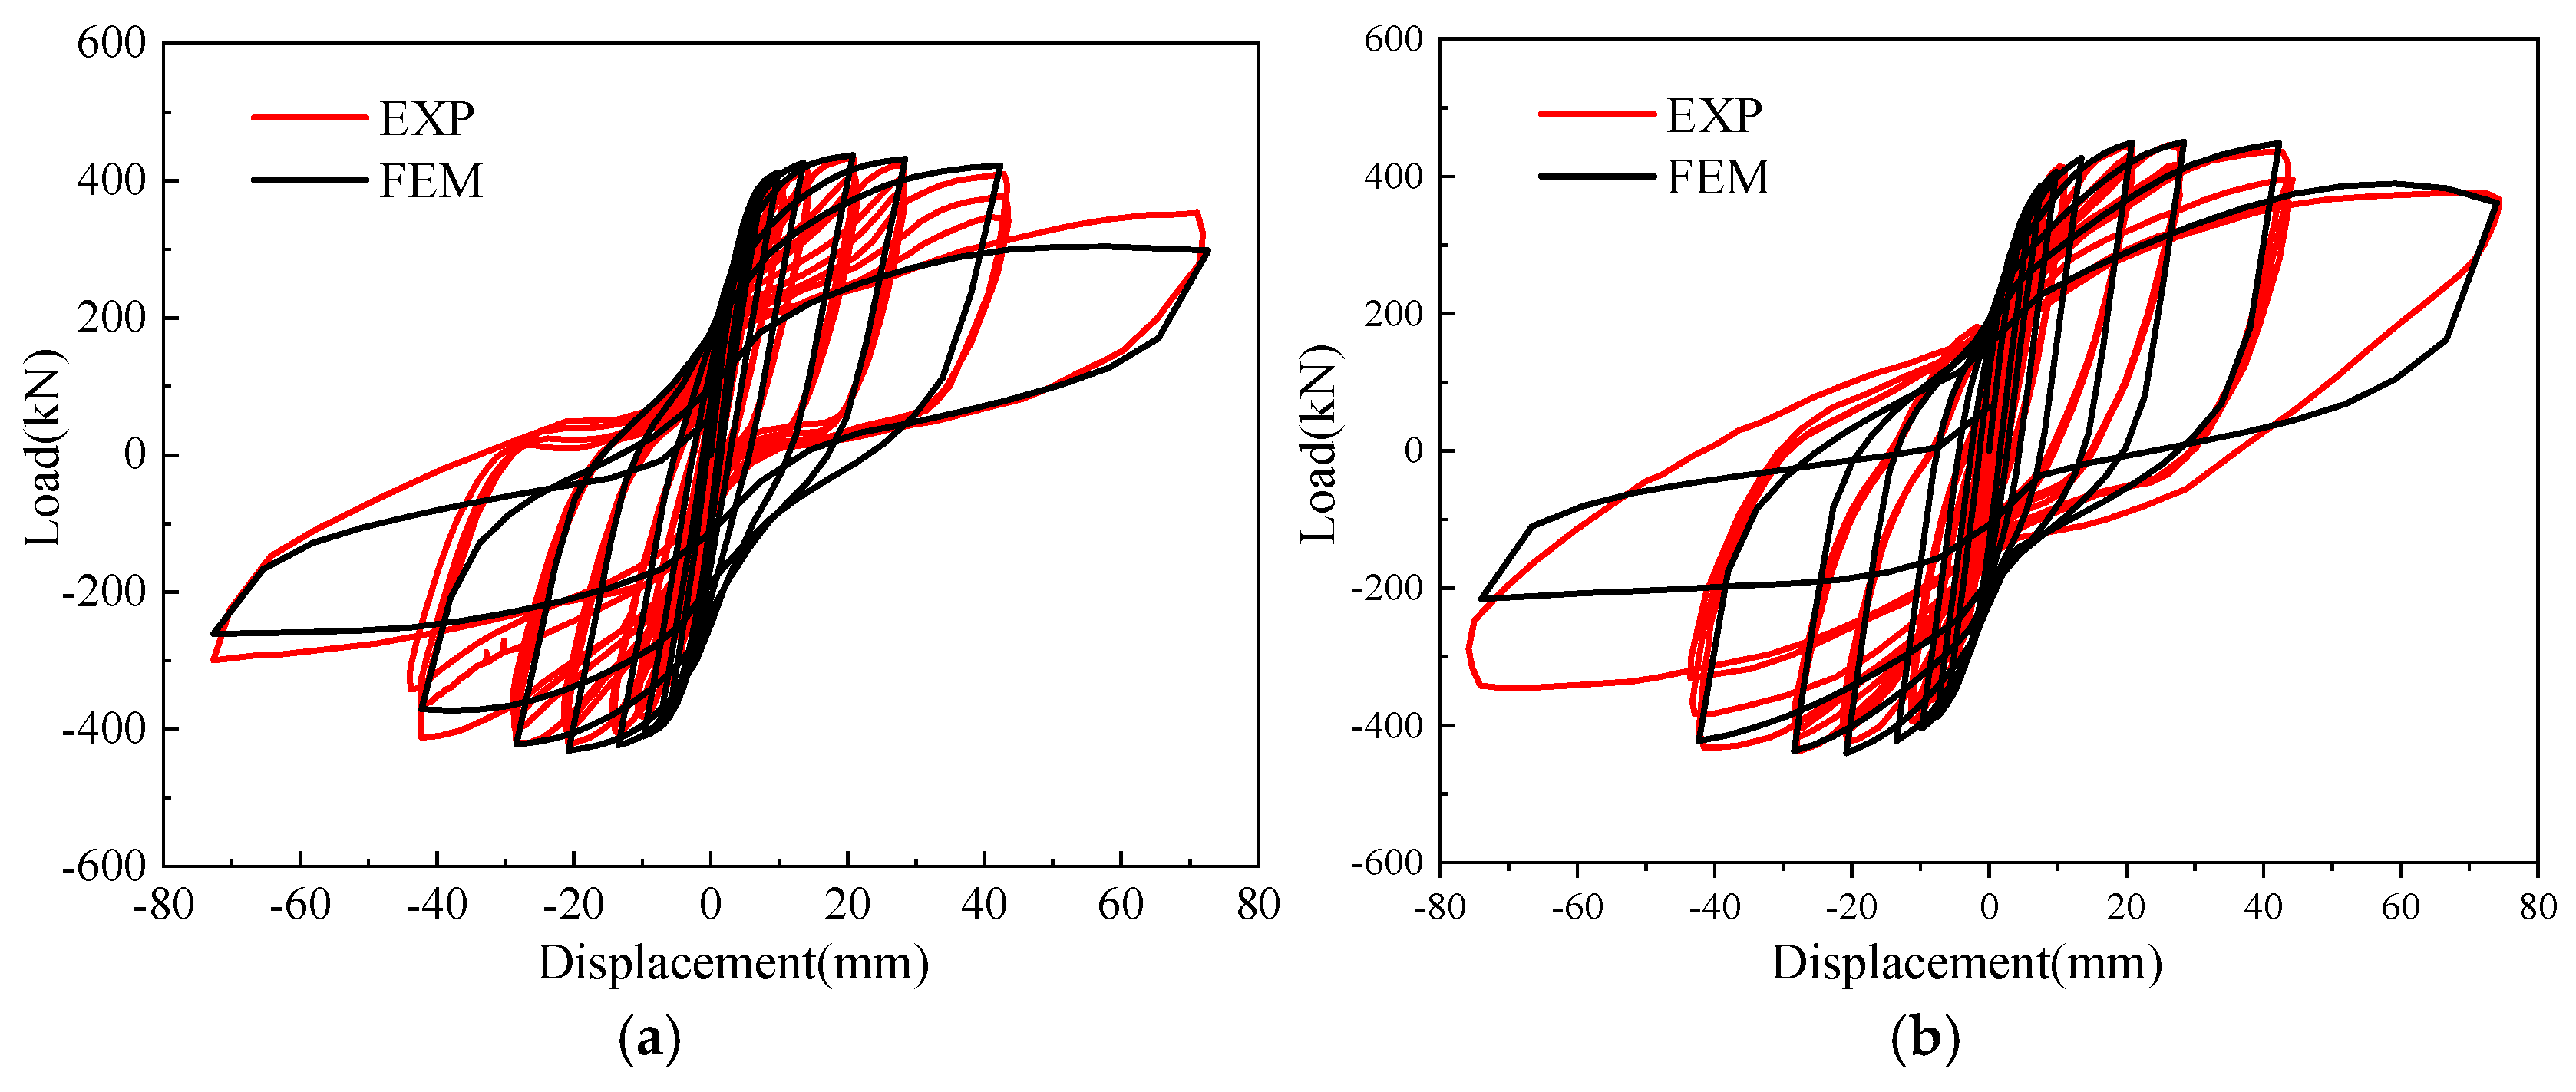
The hysteresis curves of the two specimens are shown in Figure 7. Before cracking, the hysteresis loops of both specimens were essentially linear with very small areas. As the displacement increased, the hysteresis loops gradually opened up and became fuller. The positive and negative peak loads for RSCSW were 445.0 kN and 397.8 kN; for CSCSW, they were 432.0 kN and 384.5 kN.
Figure 7.
Hysteresis curve.
3. Finite Element Model and Validation
3.1. Model Establishment
3.1.1. Element Types of the Finite Element Model
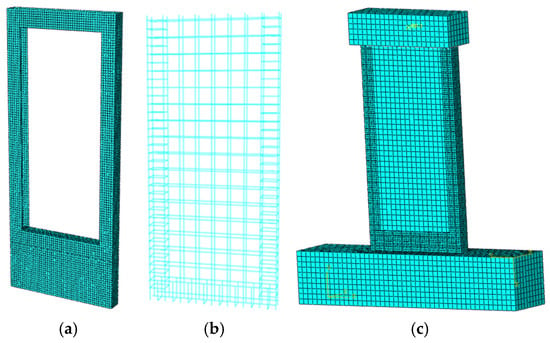
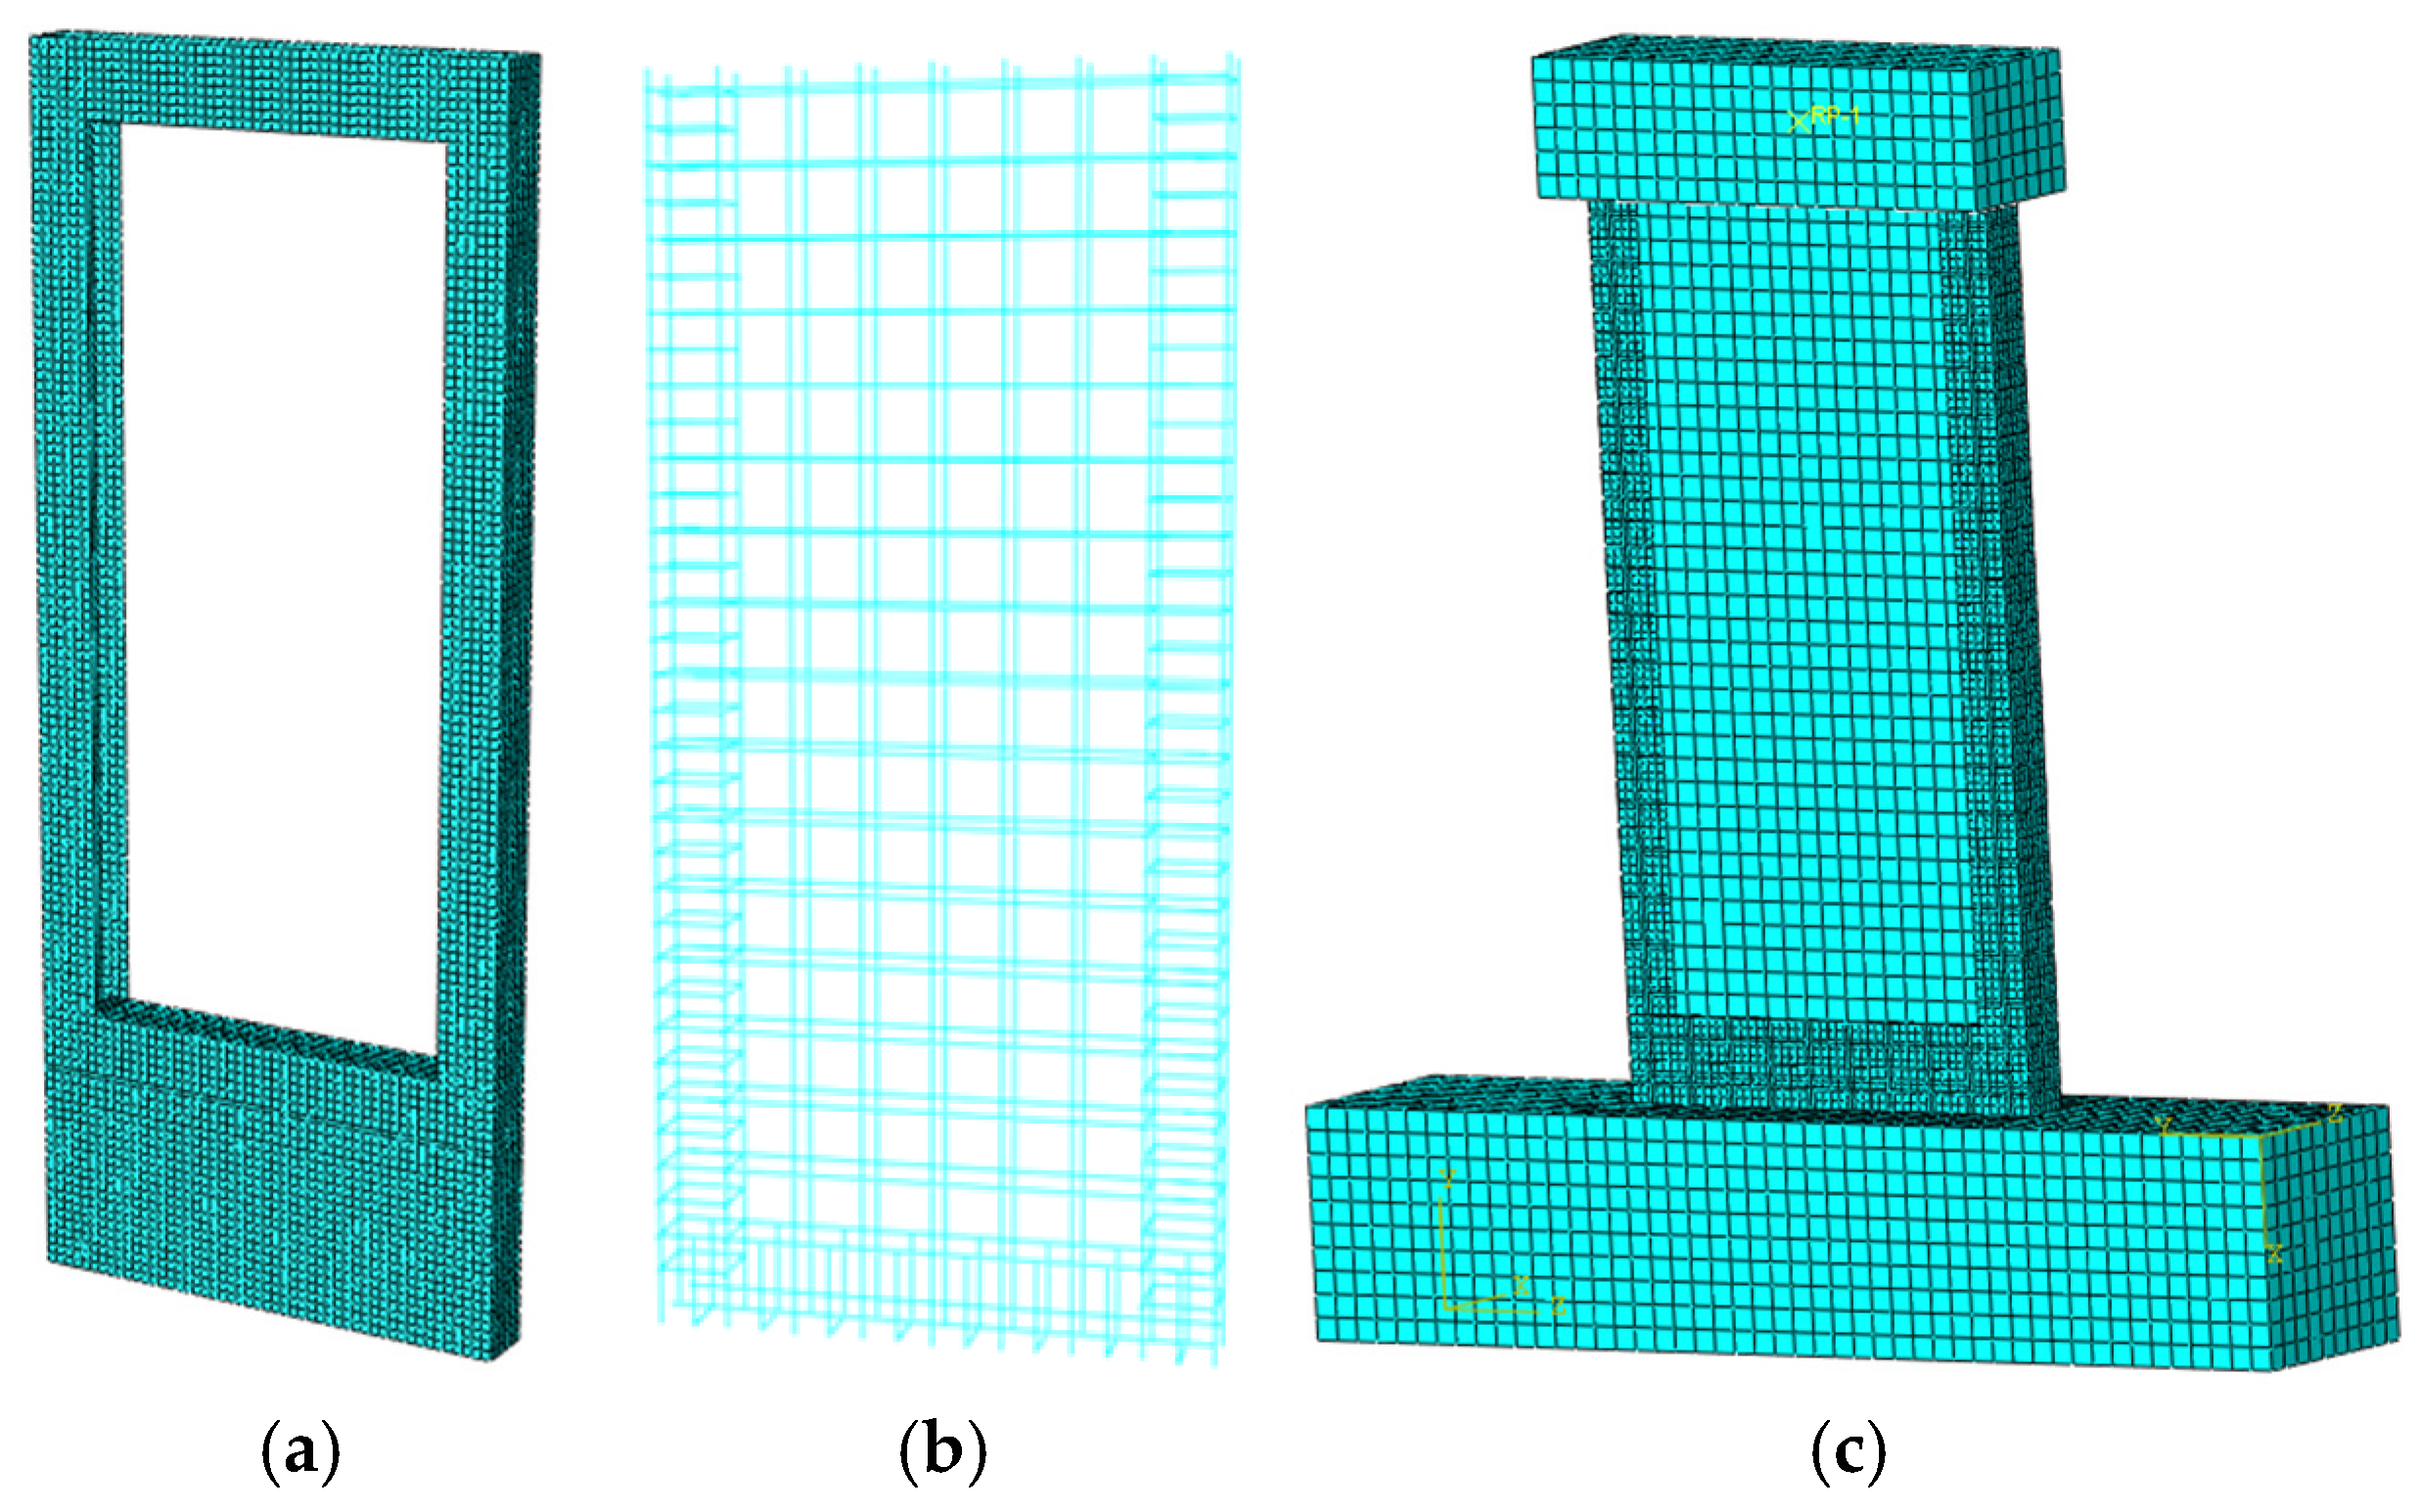
In the finite element model of the steel-frame composite shear walls, the C-shaped steel frames, stiffening plates, and diaphragms were simulated using shell elements (S4R), concrete using solid elements (C3D8R), stirrups using truss elements (T3D2), and horizontal and vertical distributed reinforcement bars using beam elements (B31). The mesh size for the steel frame was 20 mm, while that for the concrete and reinforcement bars was 50 mm. The meshing schematic diagram of each component of the finite element model of the steel-frame composite shear walls is shown in Figure 8.
Figure 8.
Finite element model. (a) Steel frame, (b) rebar model, (c) whole model.
3.1.2. Contact Relationships and Boundary Conditions of the Finite Element Model
The interaction between reinforcement and concrete was simulated using connector elements. The horizontal and vertical distributed reinforcements were connected to the concrete wall through bushing-type connectors, in which all six degrees of freedom were constrained. The stiffness of the bushing connectors was assigned according to the bond–slip relationship to represent the interfacial interaction between reinforcement and concrete. Since the upper and lower ends of the vertical reinforcement were welded to the steel boundary frame, beam-type connectors with all six degrees of freedom constrained were adopted to simulate the welded connection between the reinforcement and steel plates. Similarly, the stirrups within the boundary components were welded to the flange plates of the C-shaped steel frames and were also modeled using beam-type connectors, whereas the embedded portions of the stirrups within the concrete wall were simulated using the embedded constraint. The interaction between the side steel frames and the concrete wall was modeled using a surface-to-surface contact formulation. The tangential behavior was defined using the penalty method with a friction coefficient of 0.2, while hard contact was applied in the normal direction to prevent penetration.
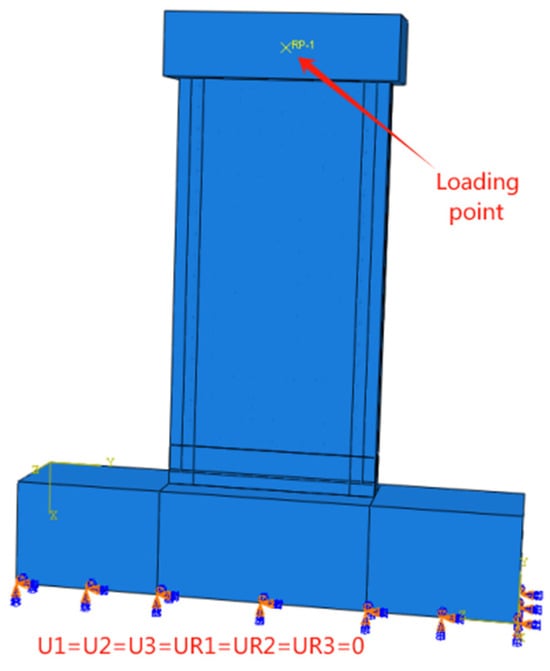
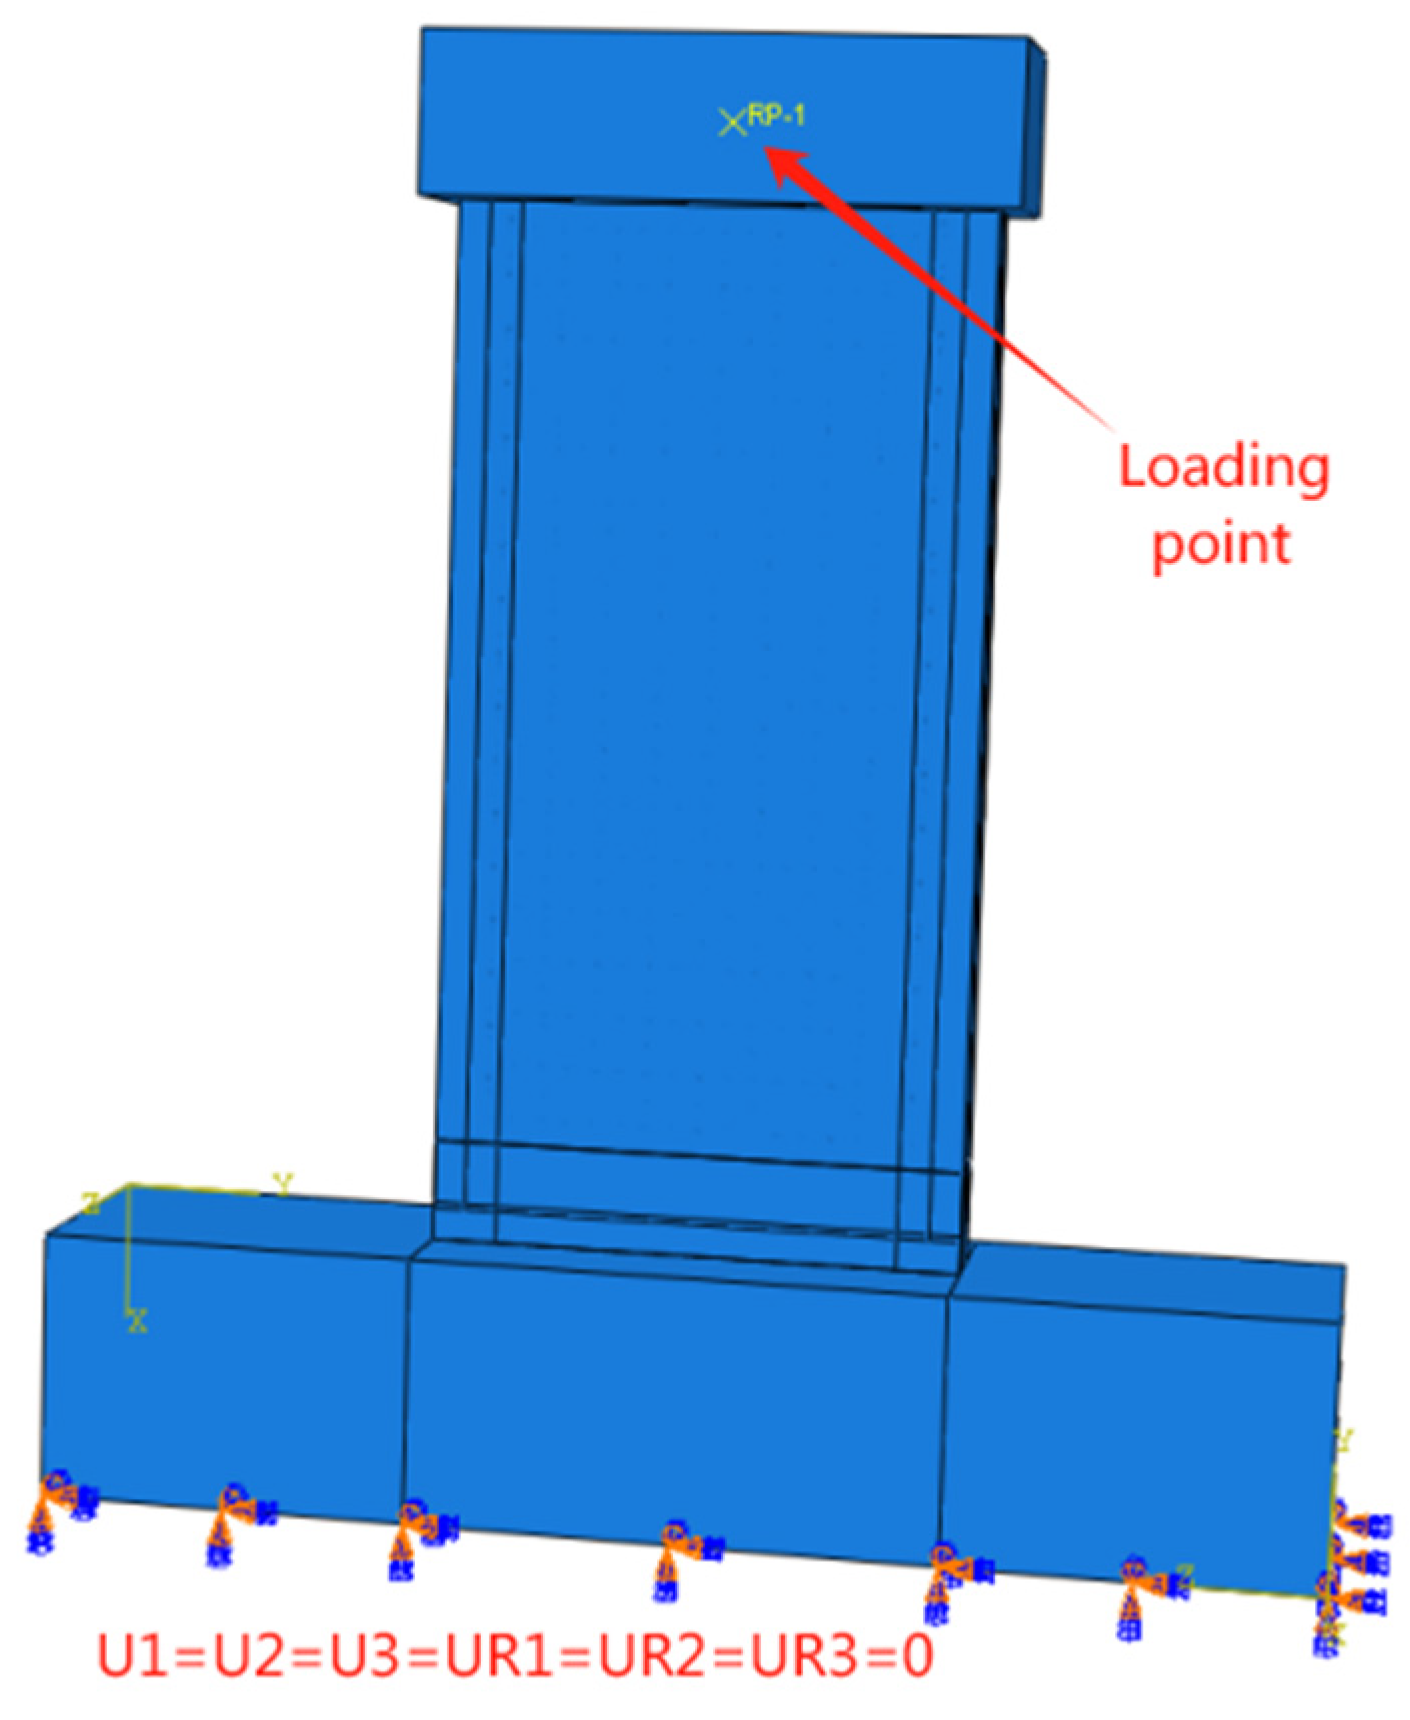
The top steel frame of the composite shear wall was directly embedded into the concrete of the loading beam, while the bottom steel frame was partially embedded into the concrete of the foundation beam. The bottom of the foundation beam of the composite shear wall was fully fixed. The out-of-plane translational degree of freedom of the loading beam was restrained to ensure it could move freely only in the intended loading direction. The finite element model and boundary conditions of the steel-frame composite shear walls are shown in Figure 9.
Figure 9.
Boundary and load conditions of the model.
3.2. Material Constitutive Models
The steel materials in this chapter include reinforcement bars and steel plates. The stress–strain relationship for steel in ABAQUS 2020 was modeled using a bilinear model. The yield strength and elastic modulus values of the steel are listed in Table 2.
The concrete model employed the concrete damaged plasticity model (CDP) in ABAQUS, with a dilation angle of 30°, an eccentricity of 0.1, fb0/fc0 of 1.16, K of 0.6667, a viscosity parameter of 0.0005, a tension recovery coefficient of 0, and a compression recovery coefficient of 0.6.
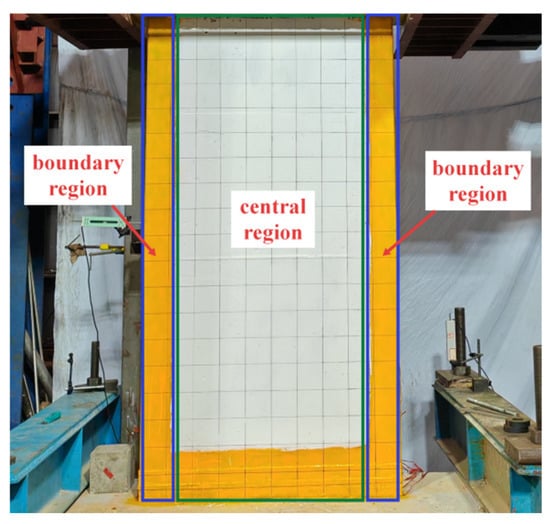
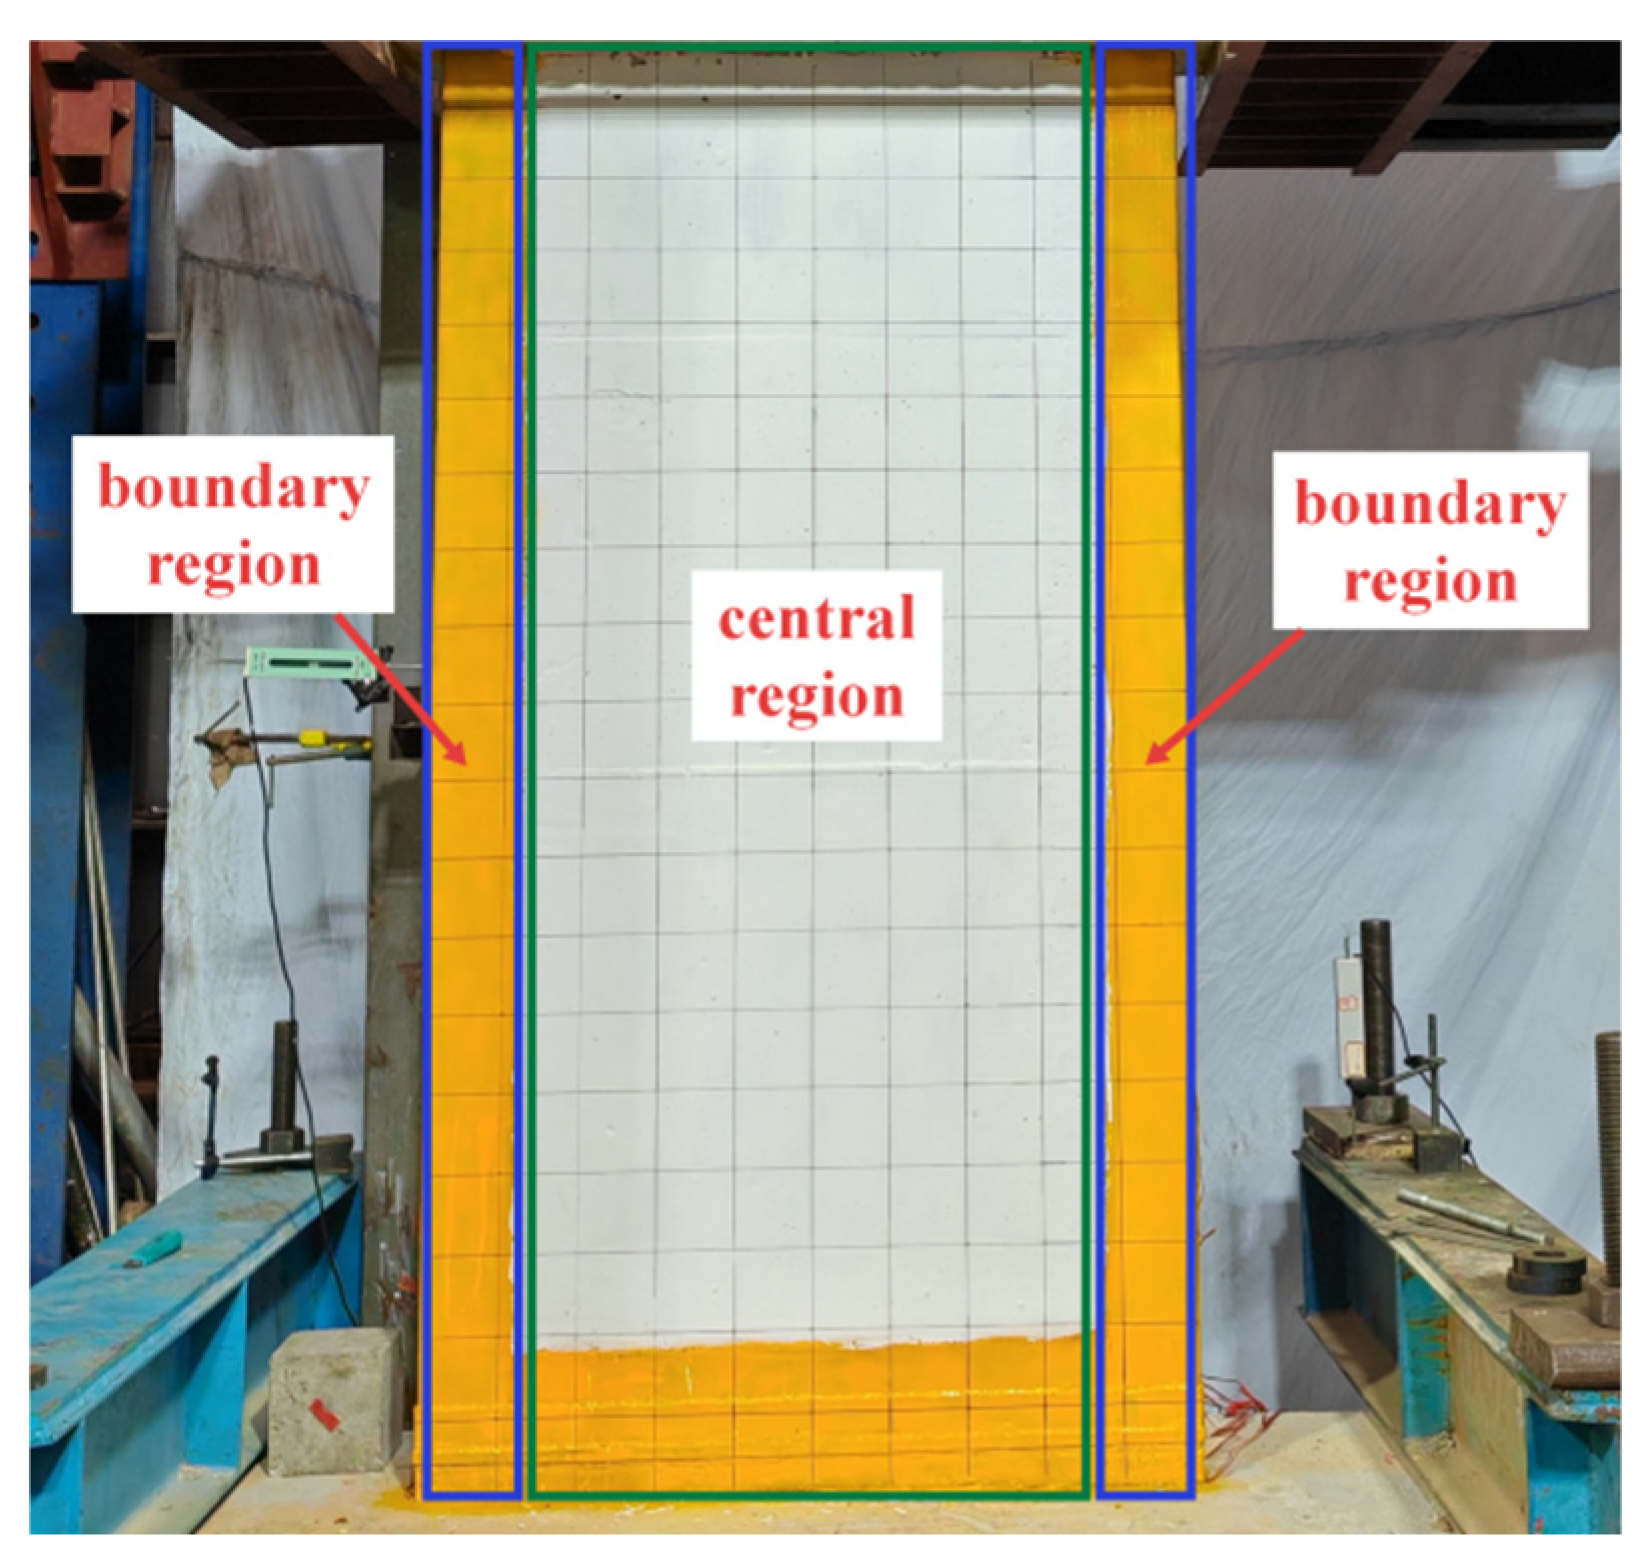
The zone division of the steel-frame composite shear walls is shown in Figure 10. For CSCSW, the stirrup-confined concrete in the central region was modeled using the Mander constitutive model [28], the boundary region concrete using the steel tube-confined concrete constitutive model [29], and the concrete in other regions using the unconfined concrete constitutive model. For RSCSW, the concrete in the central region used the unconfined concrete constitutive model, while the confined concrete in the boundary regions employed the Han Linhai concrete-filled steel tube constitutive model [30].
Figure 10.
Specimen area division.
3.3. Model Validation
The finite element models in this section were constructed in strict accordance with the various parameter settings of the actual tests, including precise simulation of geometric dimensions, accurate representation of physical properties, and high consistency with the loading conditions. The numerical simulations were conducted using the Static, General step in ABAQUS/Standard with the Newton–Raphson iterative algorithm. Geometric nonlinearity (NLGEOM = ON) was activated, and automatic incrementation was adopted during the analysis. The constant axial load was first applied and maintained, followed by the application of the horizontal cyclic displacement history. The default force and displacement convergence tolerances in ABAQUS/Standard were adopted. No mass scaling or artificial stabilization was used in the simulations. This rigorous model construction method ensured a high degree of consistency between the numerical simulation and the test conditions.
3.3.1. Comparison of Hysteresis Curves
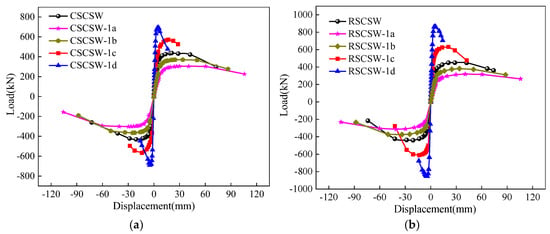
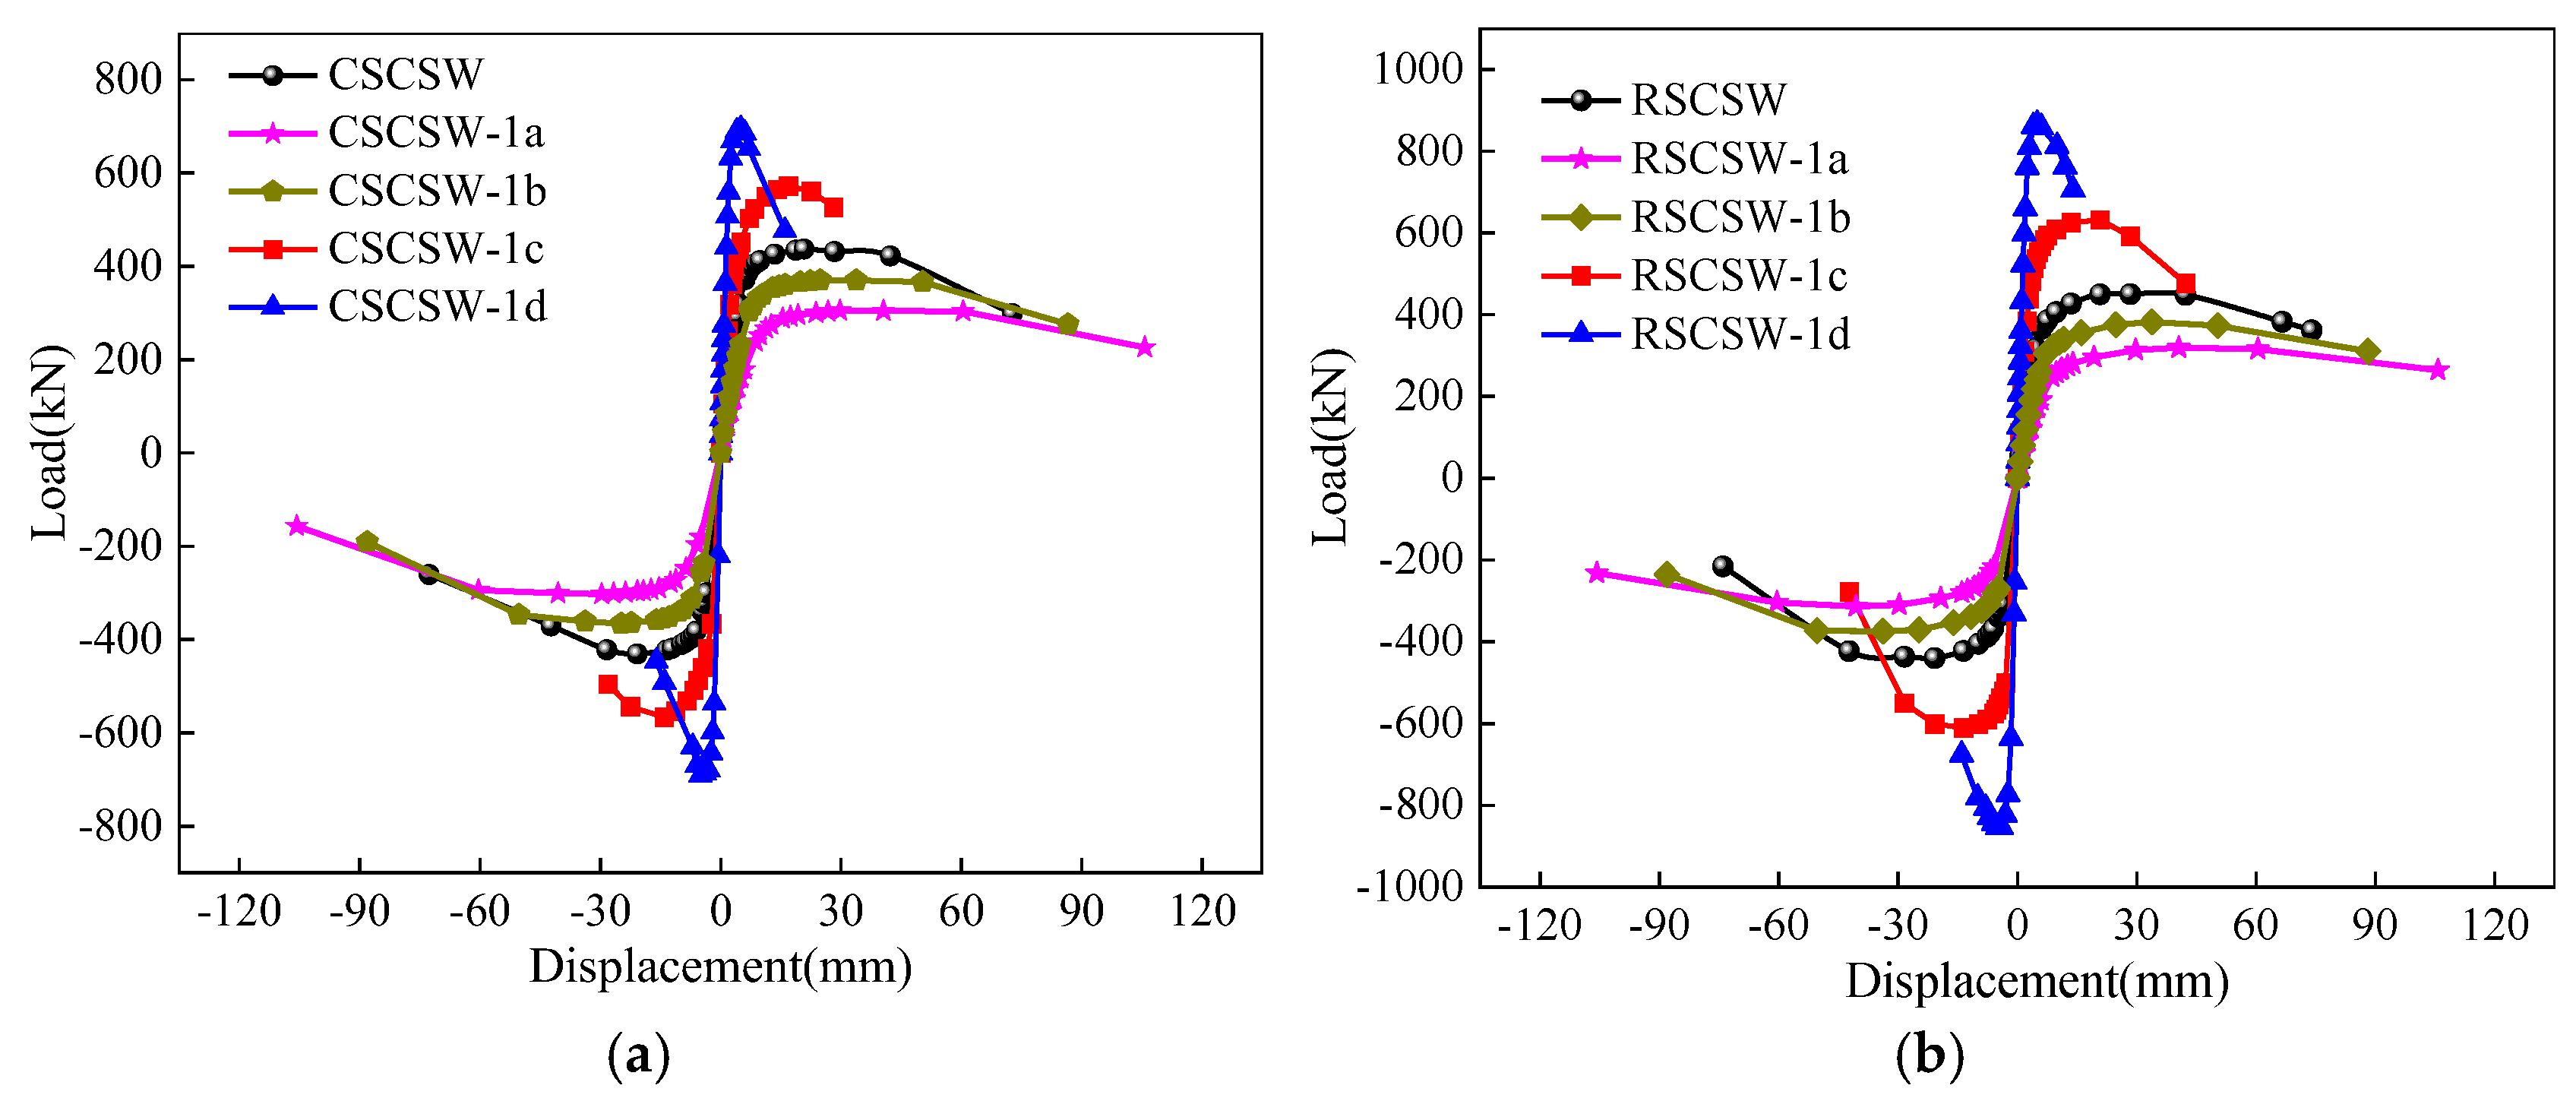
Figure 11 compares the experimental and numerical simulation hysteresis curves. As can be seen from Figure 11, the variation trends of the hysteresis curves obtained from the low-cycle reversed tests for CSCSW and RSCSW are fundamentally consistent with those from the numerical analyses. In the numerical simulation process, the selected constitutive models for steel and concrete fully considered the degradation of mechanical properties due to material damage during testing.
Figure 11.
Comparison of hysteresis curves between experiment and FEM. (a) CSCSW, (b) RSCSW.
Table 3 presents a comparison of the yield loads and peak loads obtained from the low-cycle reversed tests and numerical analyses for CSCSW and RSCSW. As can be seen from Table 3, regarding the accuracy of the simulation results, the maximum discrepancy for yield bearing capacity is 11.88%, while the error for peak bearing capacity is within 6.31%. It should be noted that within the framework of finite element analysis, complex factors such as concrete spalling, fabrication tolerance deviations, and weld cracks are difficult to incorporate completely and accurately, leading to inevitable assumptions and simplifications in the analysis process. Therefore, although there is a certain gap between the numerical simulations and the experimental measurements, the error range does not exceed 12%, which is still within an acceptable range.
Table 3.
Summary of experimental and FEM results.
3.3.2. Concrete Damage and Failure Modes
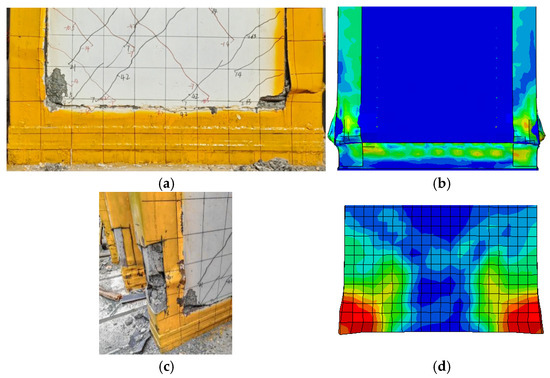
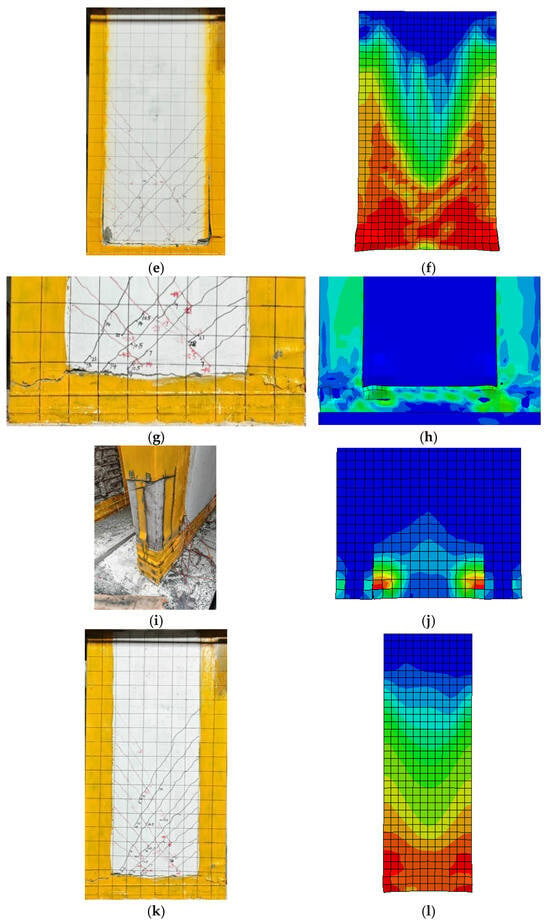
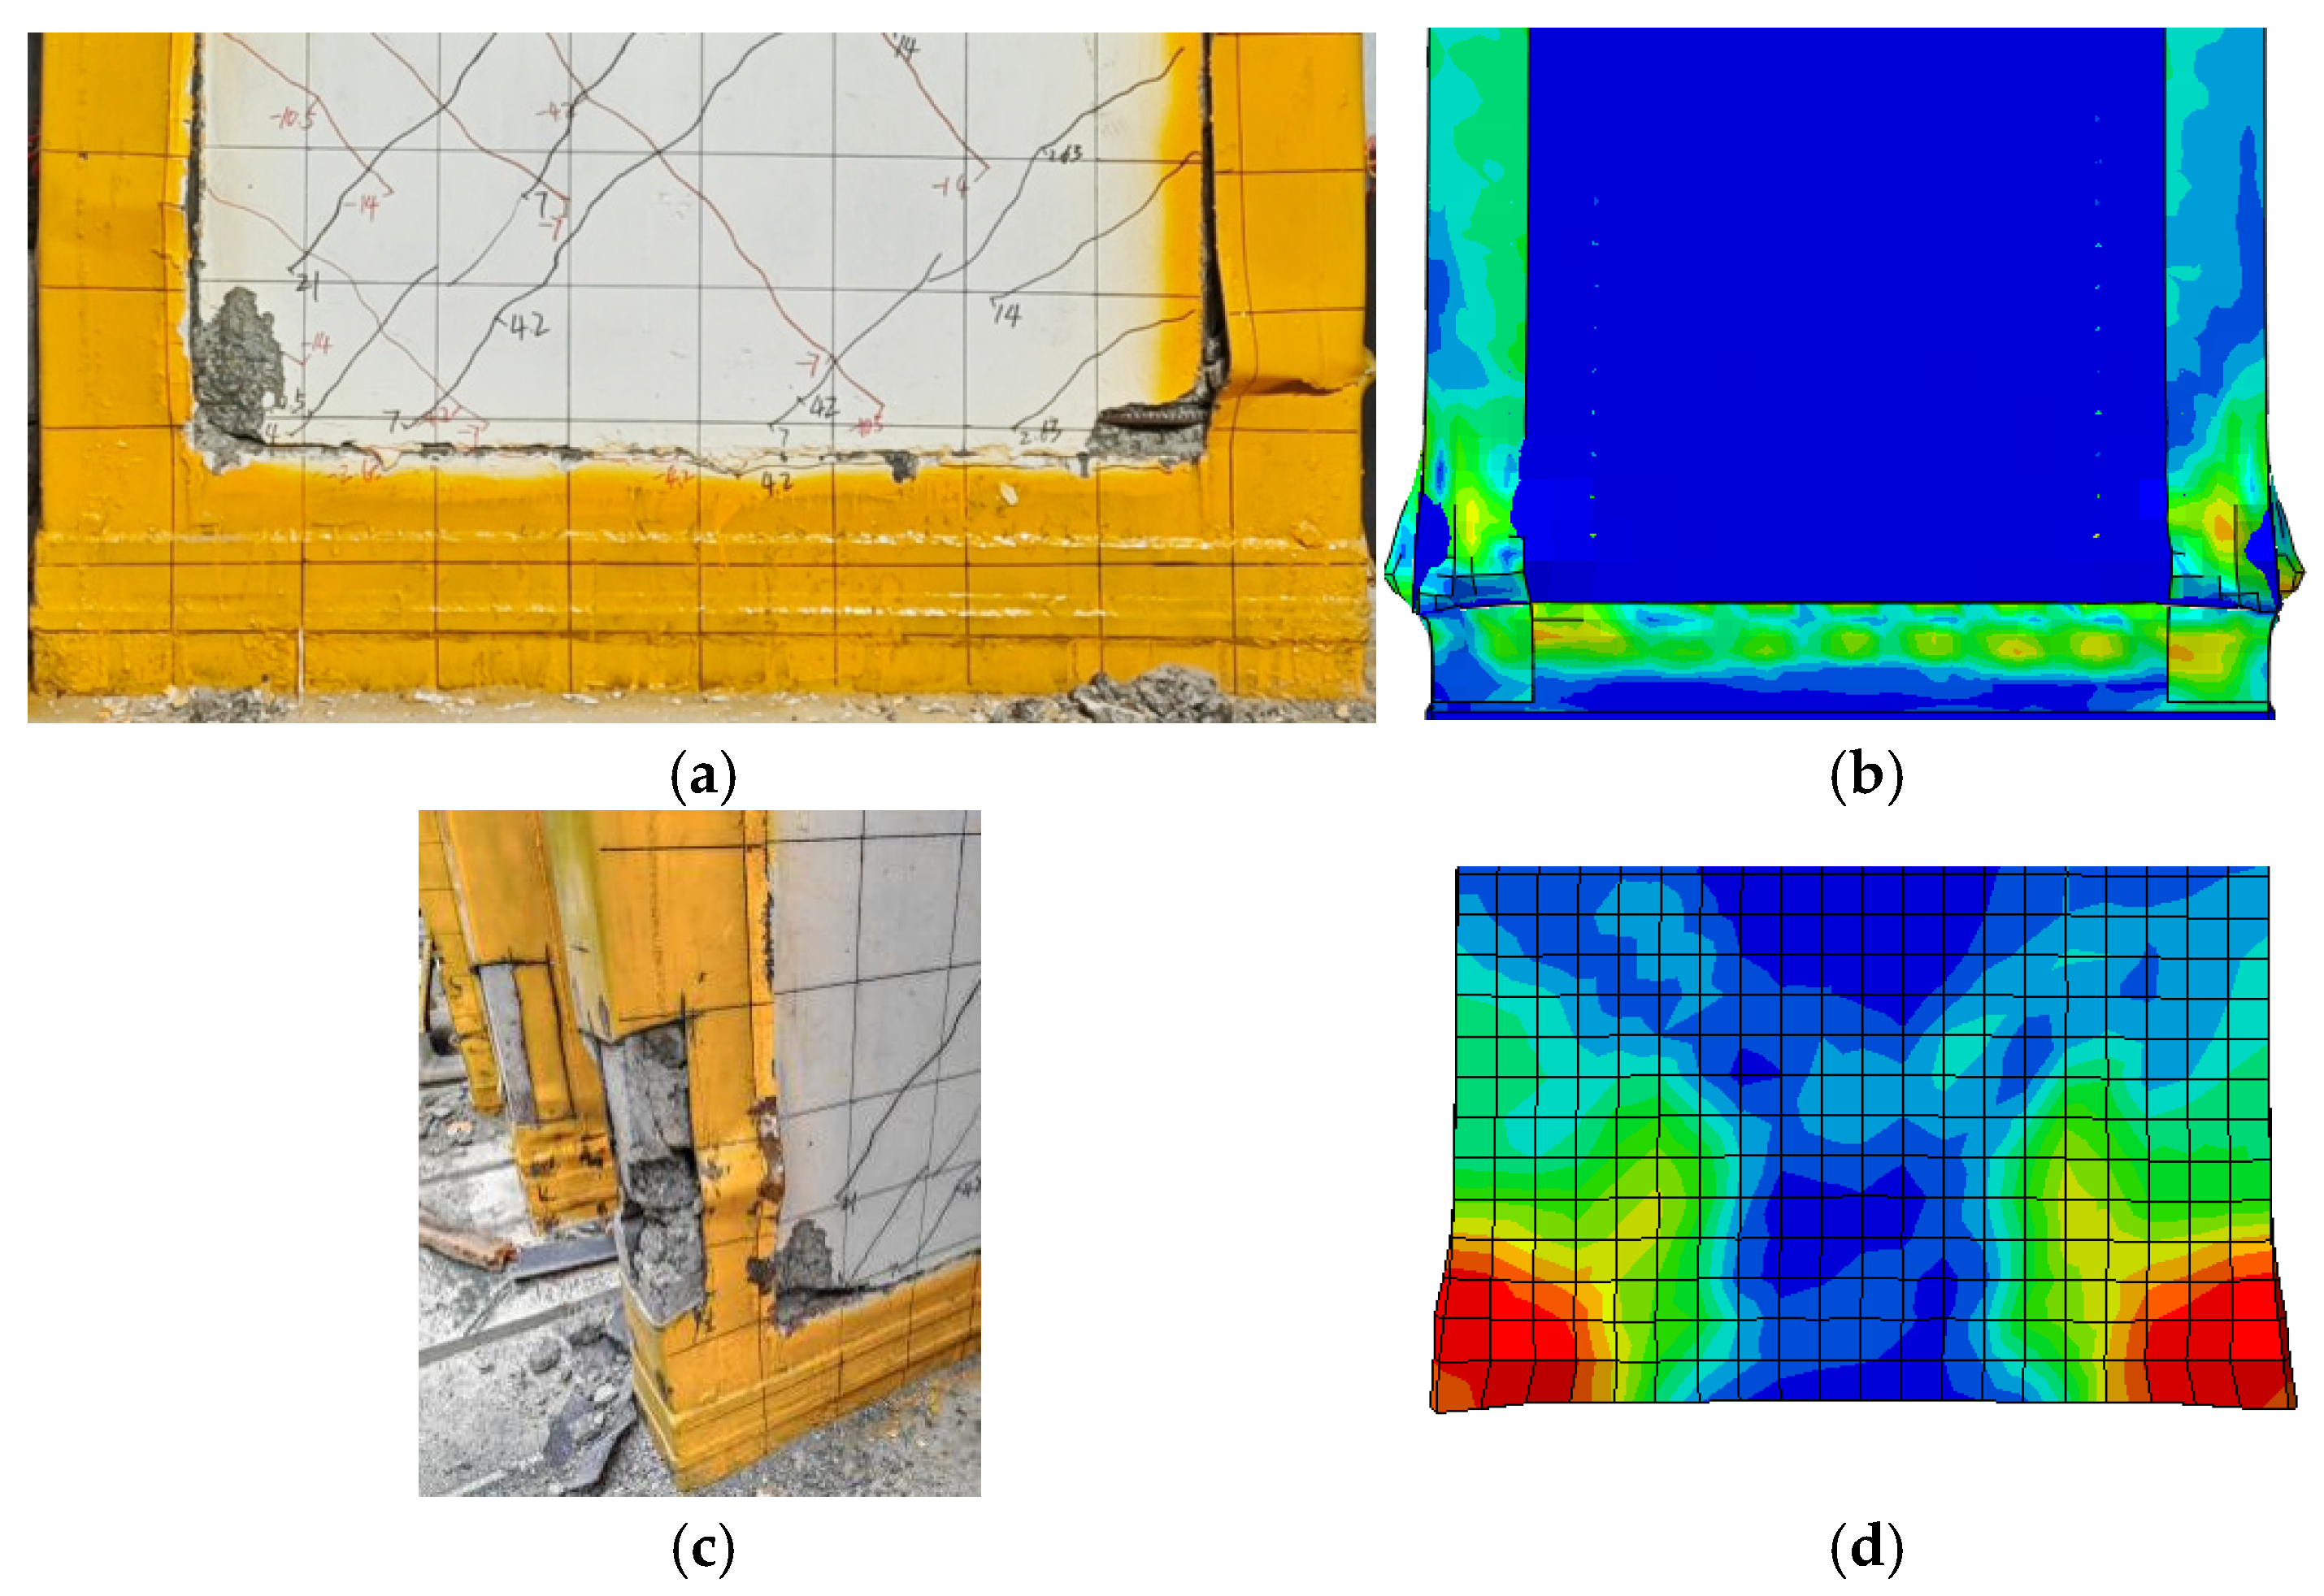
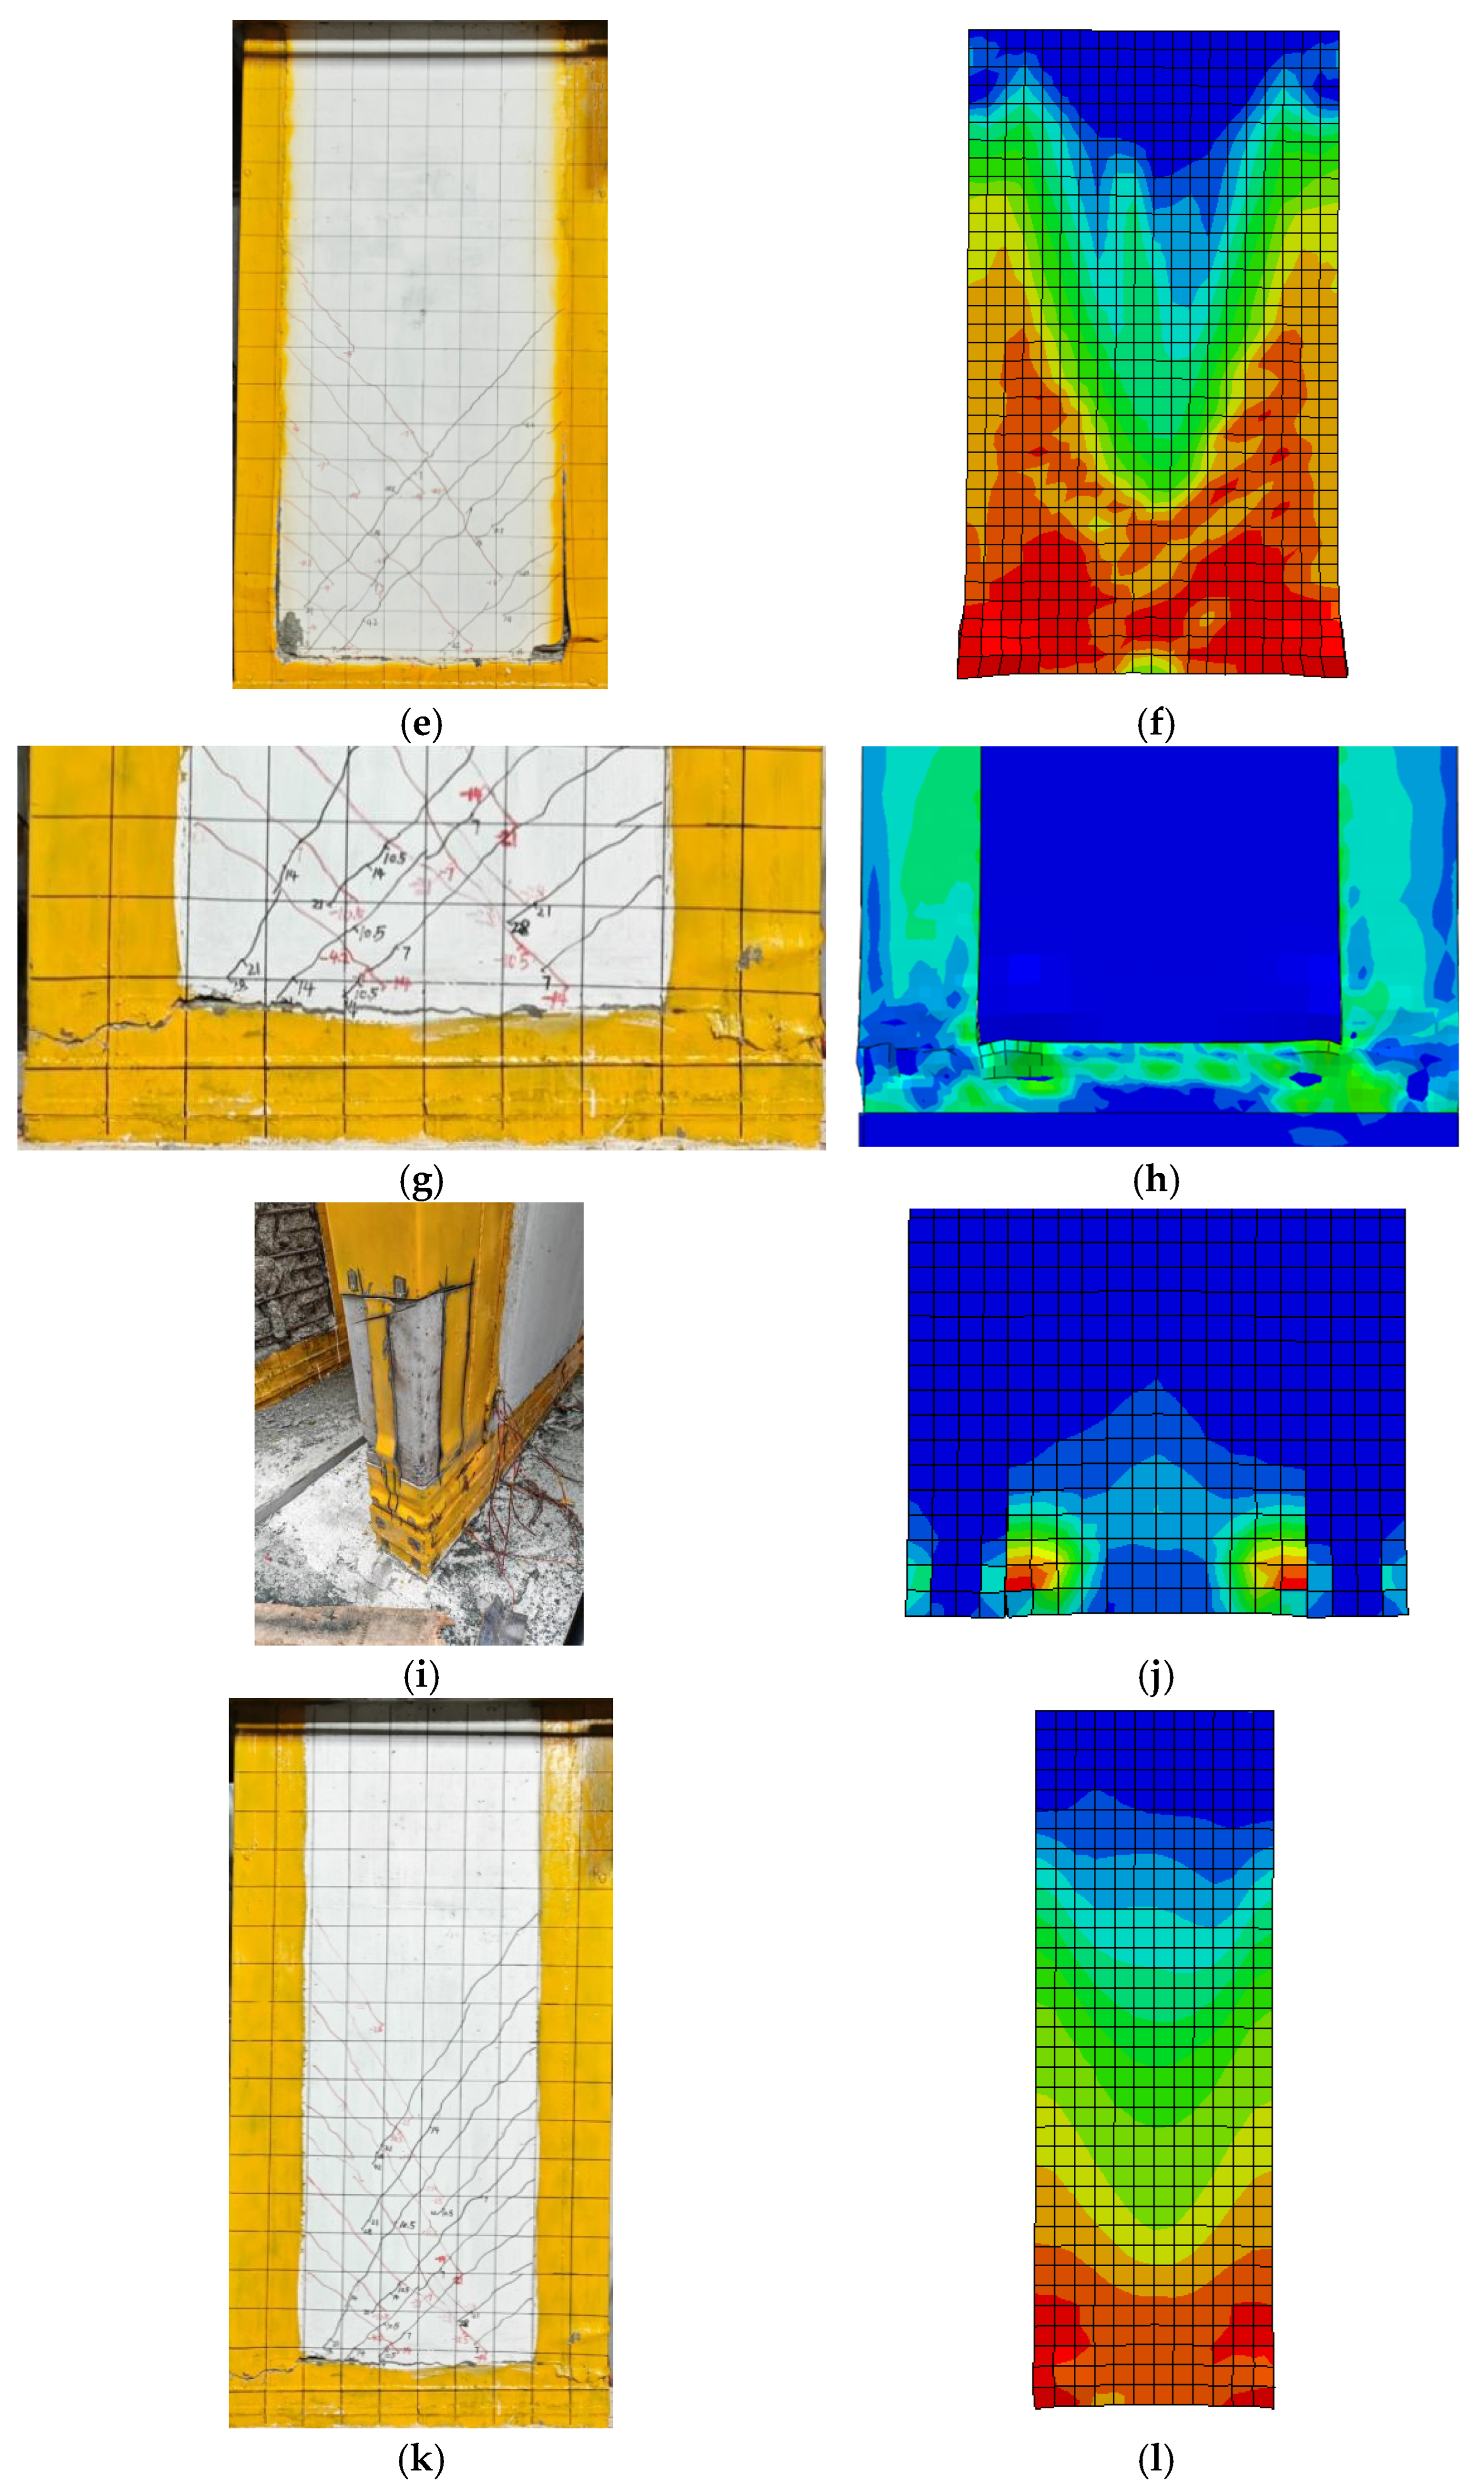
Figure 12 compares the damage nephograms from numerical simulations with the experimental failure phenomena of CSCSW and RSCSW. From Figure 12b,d,f, it can be observed that at the final failure of CSCSW, the steel plate at the corner of the steel frame bulged and fractured, noticeable cracking occurred at the side concrete–steel plate interface, the front steel plate buckled and warped, and the corner concrete was crushed. This is generally consistent with the side steel plate failure modes observed in the experimental Figure 12a,c,e. From Figure 12h,j,l, it can be seen that at the final failure of RSCSW, cracks appeared at the interface between the bottom concrete of the wall panel and the steel plate, the steel plate at the corner of the steel frame fractured, and the corner concrete damage was not pronounced. This is fundamentally consistent with the failure modes in the experimental Figure 12g,i,k.
Figure 12.
Comparison of failure behaviors (EXP vs. FEM). (a) EXP (steel frame); (b) FEM (steel frame); (c) EXP (concrete in compression); (d) FEM (concrete in compression); (e) EXP (concrete in tension); (f) FEM (concrete in tension); (g) EXP (steel frame); (h) FEM (steel frame); (i) EXP (concrete in compression); (j) FEM (concrete in compression); (k) EXP (concrete in tension); (l) FEM (concrete in tension).
By comparing the experimental and numerical simulation results, the finite element model built using ABAQUS and the analysis strategy adopted in this paper are validated to be capable of effectively capturing the mechanical behavior of the steel-frame composite shear wall specimens under realistic loading conditions.
4. Parametric Analysis
Based on the validated models, 14 parametric analysis models for each of CSCSW and RSCSW (28 in total) were established to investigate the effects of shear-span ratio, axial-load ratio, steel plate thickness, and concrete strength on the seismic performance of the structures. The parameter settings are shown in Table 4.
Table 4.
Determined parameters for numerical analysis.
The implementation of the four parameters was defined as follows. The shear-span ratio was varied by adjusting the wall height while keeping the wall width and thickness unchanged. The axial-load ratio was defined as
where is the applied axial load, is the concrete compressive strength, is the cross-sectional area of the concrete wall, is the compressive strength of the steel plate, and is the cross-sectional area of the steel plate. When the concrete strength was varied, the applied axial force was correspondingly adjusted to maintain the prescribed axial-load ratio. Meanwhile, the concrete compressive strength, tensile strength, elastic modulus, ultimate strain, and CDP parameters related to fracture energy were updated consistently according to the adopted concrete constitutive relationship. The steel plate thickness was varied by modifying the geometric parameters, while the other reference parameters remained unchanged.
To provide a consistent evaluation of deformation capacity for both experimental specimens and numerical models, the yield displacement (), ultimate displacement (), and ductility coefficient () were adopted as the primary evaluation indices. The yield displacement was determined using the energy equivalent method. Specifically, an idealized elastic–plastic bilinear curve was established based on the skeleton curves obtained from the experiments and numerical simulations. The yield point was determined by ensuring that the energy dissipated before yielding by the idealized curve was equivalent to that of the actual skeleton curve. The displacement corresponding to the intersection between the initial elastic stiffness line and the yield-strength line was defined as the yield displacement ().
The ultimate displacement () was determined based on the post-peak strength degradation criterion. Specifically, was defined as the displacement corresponding to 85% of the peak strength after the maximum load was reached. This criterion was consistently applied to all experimental specimens and numerical models, and was determined separately for the positive and negative loading directions to ensure consistency and comparability in the ductility evaluation. The ductility coefficient () was calculated as the ratio of ultimate displacement to yield displacement: .
The cumulative hysteretic energy dissipation () was adopted to evaluate the energy dissipation capacity of the specimens under cyclic loading. It was calculated by integrating the area enclosed by the load–displacement hysteresis loops, as expressed by
where is the cumulative hysteretic energy dissipation, represents the applied load in the i-th loading cycle, and is the corresponding displacement increment. Since the load and displacement were expressed in kN and mm, respectively, the unit of the calculated energy dissipation is kN·mm.
To ensure consistency in the evaluation of energy dissipation among different specimens and numerical models, the same ultimate-state criterion was adopted for the calculation. Specifically, the integration was terminated when the post-peak load decreased to 85% of the peak strength. This method provides a consistent evaluation of the hysteretic energy dissipation capacity from the peak strength stage to the ultimate state.
4.1. Effect of Shear-Span Ratio
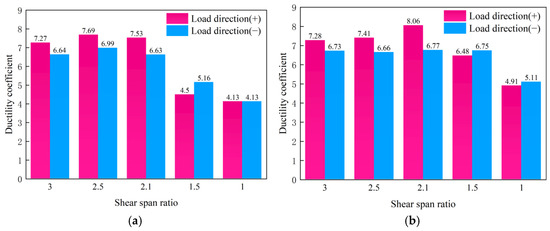
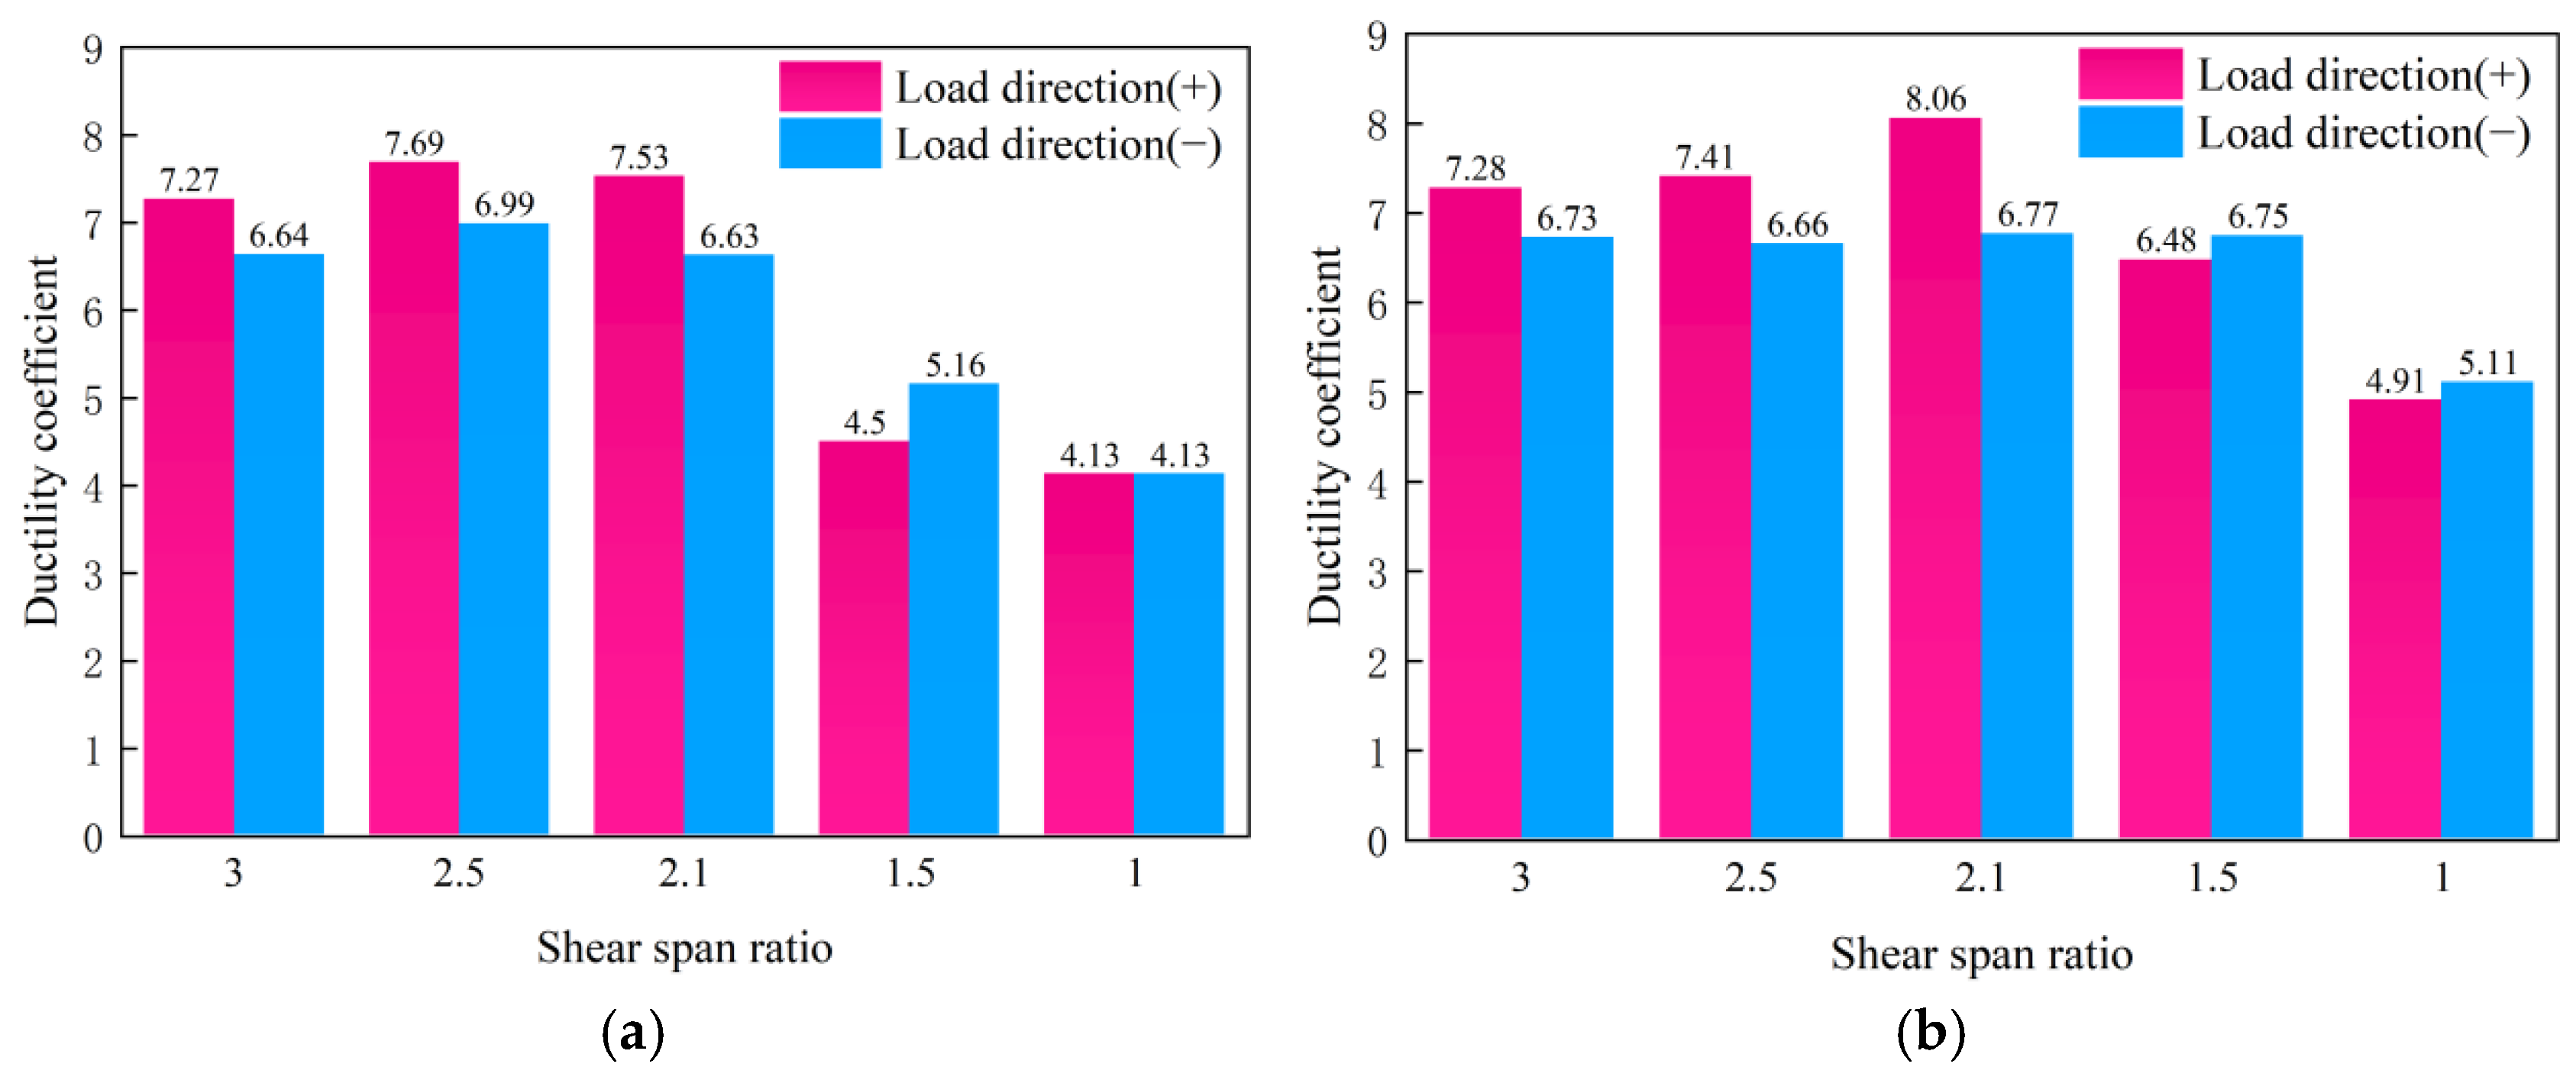
Figure 13 and Figure 14 present the skeleton curves and ductility coefficients of the specimens with different shear-span ratios (λ). As λ decreases, the lateral load-resisting mechanism undergoes a pronounced transition. A larger proportion of the overturning moment is transferred to the boundary steel frames, while the effective shear-transfer path within the wall becomes shorter, leading to an increased contribution of shear resistance to the overall lateral load-carrying capacity. Consequently, when λ decreases from 3.0 to 1.0, the positive peak load increases from 289.31 kN to 753.26 kN (160%) for CSCSW and from 294.96 kN to 800.20 kN (171%) for RSCSW. These results demonstrate that reducing the shear-span ratio can substantially enhance the lateral load capacity of the composite shear wall. However, this increase primarily results from the enhancement of the shear-resisting mechanism and the redistribution of internal force-transfer paths, rather than representing an overall improvement in seismic performance. As the structural response becomes increasingly governed by shear action, the failure mode gradually shifts from ductile flexural behavior to more brittle shear-dominated behavior, resulting in a reduction in deformation capacity and energy dissipation.
Figure 13.
Skeleton curve. (a) CSCSW; (b) RSCSW.
Figure 14.
Ductility coefficient. (a) CSCSW; (b) RSCSW.
The ductility of both specimens decreases consistently with decreasing λ. The positive ductility coefficient decreases from 8.48 to 4.89 (42%) for CSCSW and from 8.81 to 4.98 (43%) for RSCSW. This trend reflects the progressive transition of the governing deformation mechanism from flexure to shear. At relatively large shear-span ratios, the wall response is dominated by flexural deformation, allowing plastic hinges to develop at the wall base and boundary members, thereby promoting a more uniform distribution of plastic deformation and greater ductility. In contrast, as λ decreases, a continuous diagonal compression strut mechanism gradually develops within the wall panel, accompanied by enhanced diagonal compression and shear actions. Premature crushing of the diagonal compression zone and rapid propagation of shear cracks restrict the development of plastic deformation, leading to a significant reduction in ductility. Therefore, Figure 13 and Figure 14 reveal a clear strength–ductility trade-off associated with the evolution of the lateral load-resisting mechanism. As the relative contribution shifts from flexural resistance toward shear resistance, the increase in lateral load capacity is achieved at the expense of reduced ductility.
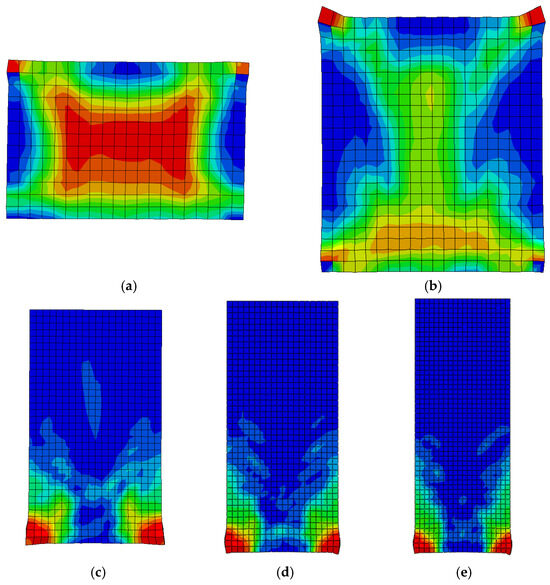
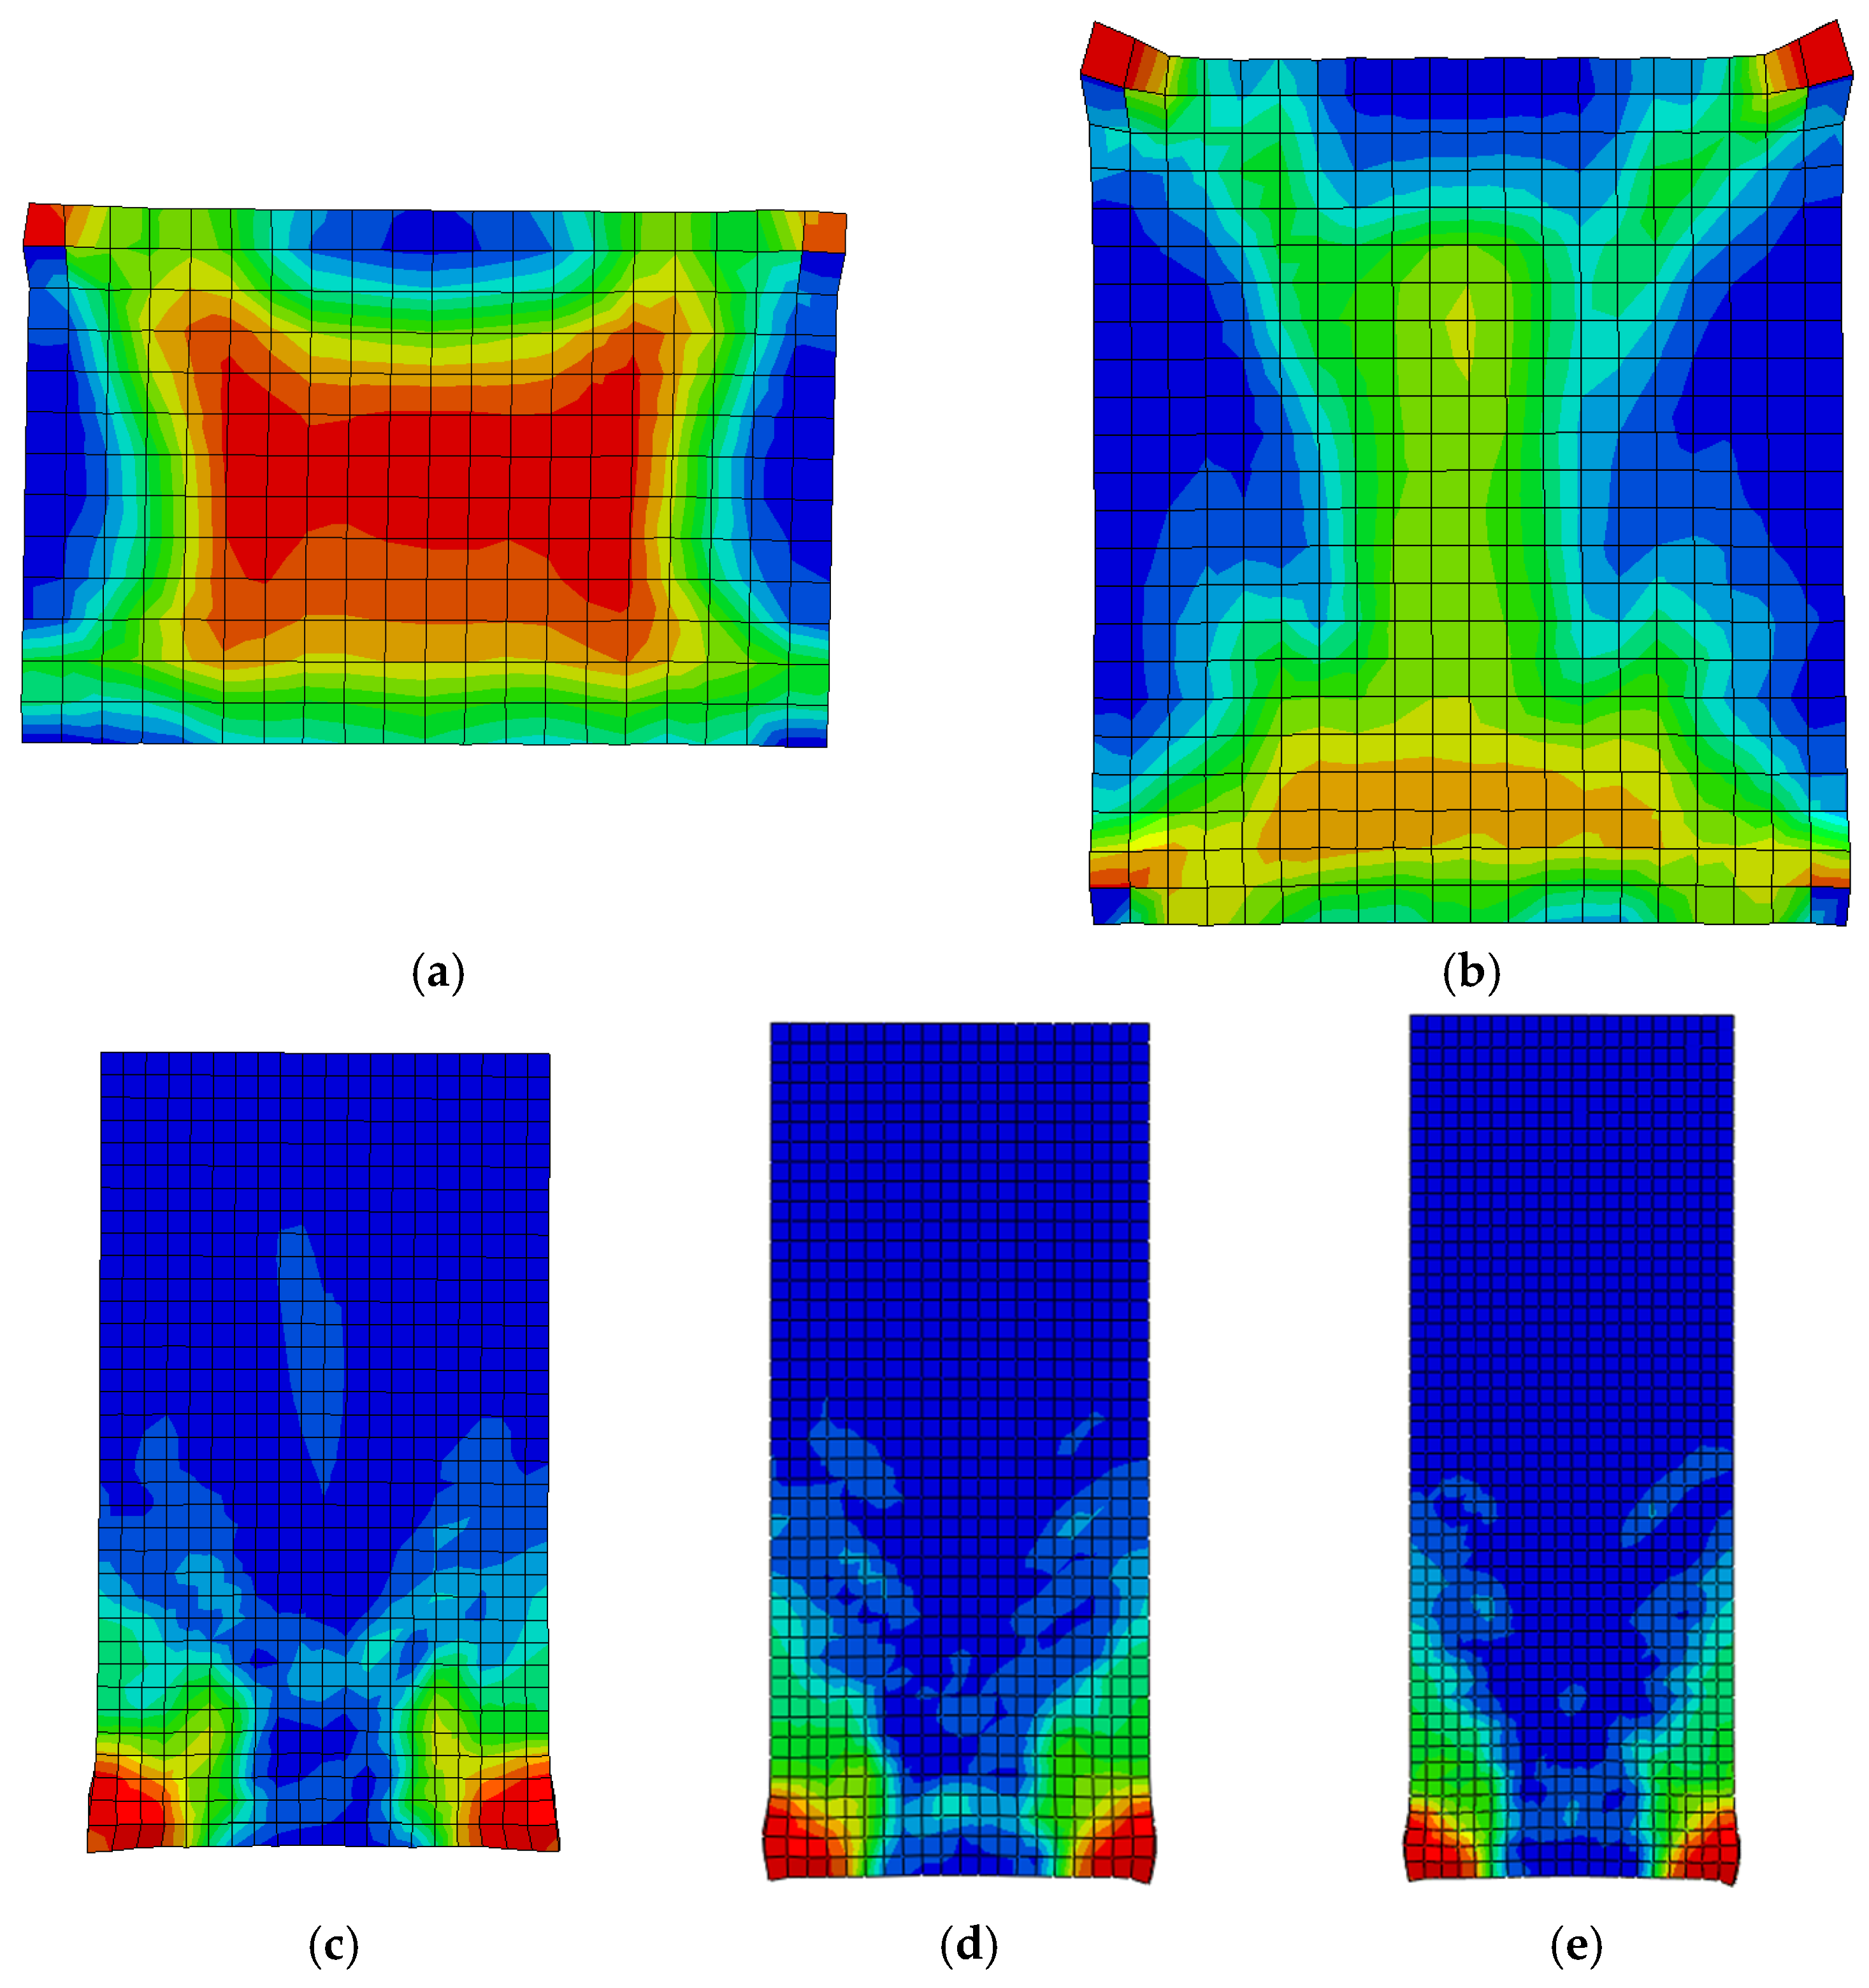
Figure 15 further confirms the corresponding evolution of the failure mechanism. At λ = 1.0, damage propagates extensively along the diagonal compression fields throughout the wall panel, indicating a shear-controlled failure mode. As λ increases, the diagonal damage gradually diminishes and becomes increasingly concentrated near the boundary members and the wall base. When λ reaches 3.0, damage is primarily confined to the tensile and compressive boundary regions at the wall base, exhibiting a typical flexure-controlled response. The observed evolution of the damage pattern is in good agreement with the trends identified from the skeleton curves, providing further evidence that the shear-span ratio governs the seismic response and failure mode by altering the relative contributions of the flexural and shear resisting mechanisms.
Figure 15.
Damage nephogram. (a) Shear-span ratio 1.0; (b) shear-span ratio 1.5; (c) shear-span ratio 2.1; (d) shear-span ratio 2.5; (e) shear-span ratio 3.0.
Table 5 presents the cumulative energy dissipation data for the two types of specimens under different shear-span ratios. The results indicate that a larger shear-span ratio corresponds to a stronger energy dissipation capacity. As the shear-span ratio decreased, the cumulative energy dissipation of CSCSW decreased from 104,631 kN·mm to 52,625 kN·mm, a reduction of approximately 50%. The RSCSW series exhibited the same trend, and its energy dissipation capacity was superior to that of CSCSW under all shear-span ratios, with an increase ranging from 12% to 18%.
Table 5.
Accumulated energy consumption of composite shear walls with different shear-span ratios (kN·mm).
4.2. Effect of Axial-Load Ratio
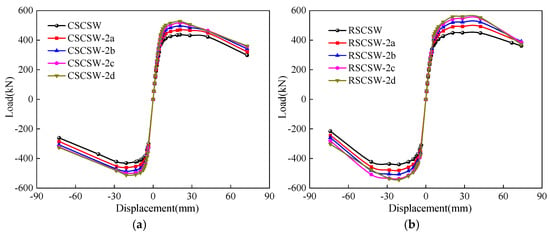
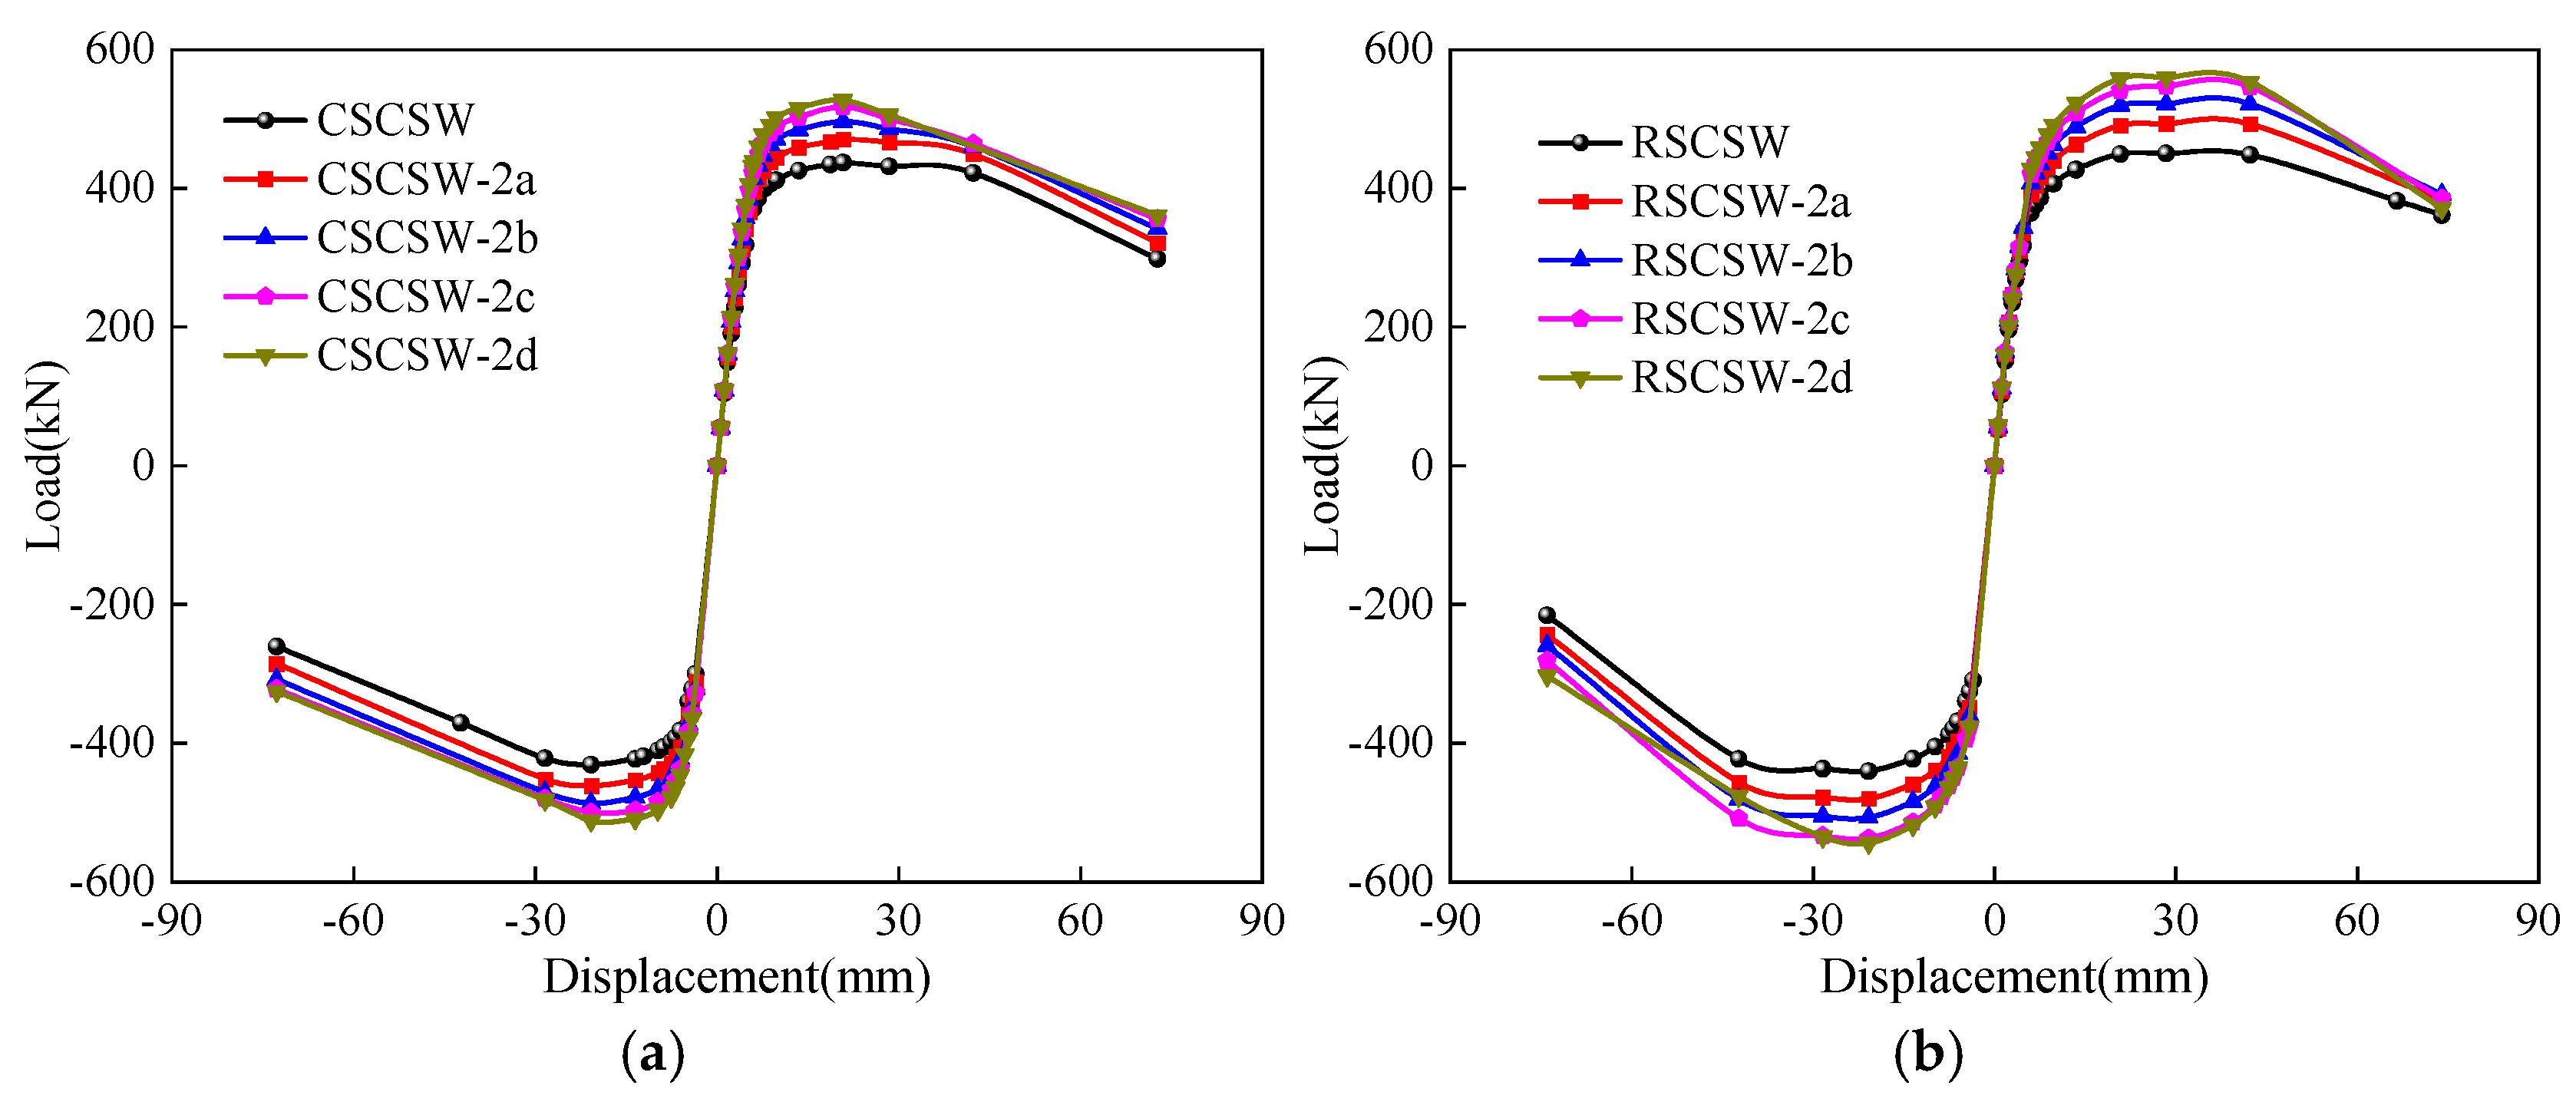
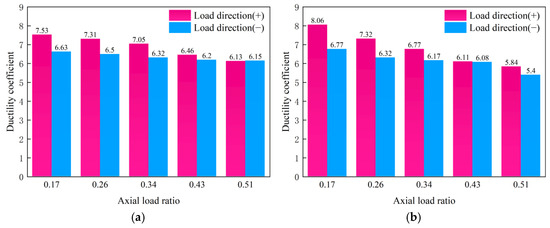
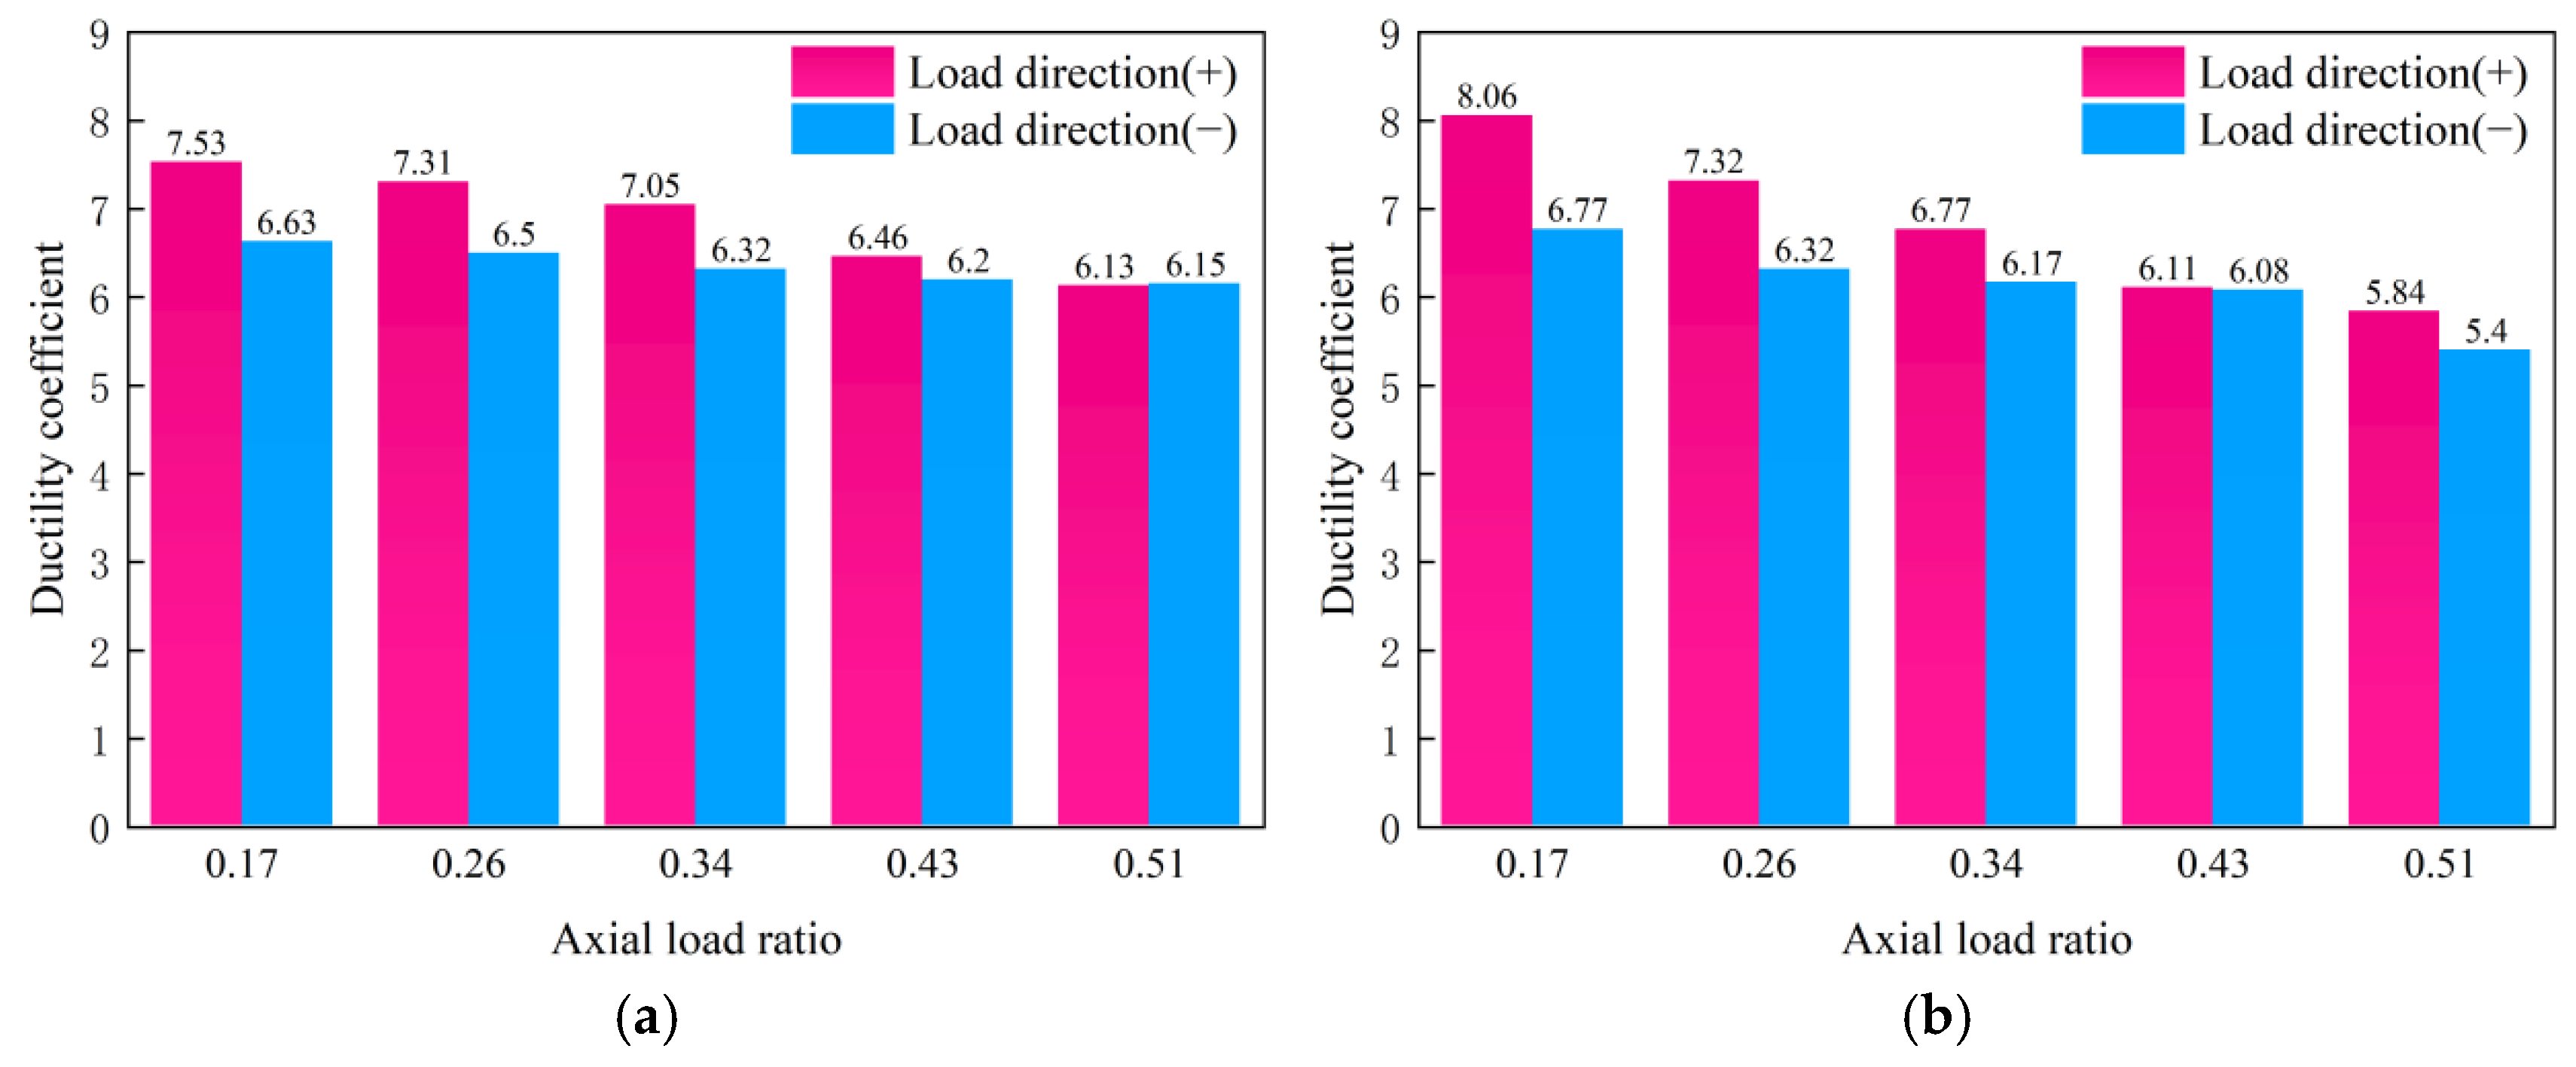
Figure 16 and Figure 17 illustrate the influence of the axial-load ratio (n) on the seismic performance of the composite shear walls. Increasing the axial-load ratio alters the internal force-transfer mechanism by enhancing compressive stress transfer within the compression zone, thereby improving the flexural resistance and overall lateral load-carrying capacity during the initial loading stage. Consequently, as n increases from 0.17 to 0.51, the positive peak load increases by approximately 21% for CSCSW and 24% for RSCSW. However, the beneficial effect of axial compression is not sustained indefinitely. Higher axial compression intensifies stress concentration in the concrete compression zone, accelerates concrete crushing, and restricts the rotational capacity of the neutral axis. Simultaneously, the tensile boundary region is subjected to greater confinement-induced restraint, limiting the stable development of tensile yielding and reducing the extent of plastic deformation. Therefore, although a higher axial-load ratio enhances the lateral load capacity, it also promotes a more brittle structural response, indicating that the improvement in strength is achieved at the expense of deformation capacity.
Figure 16.
Skeleton curve. (a) CSCSW; (b) RSCSW.
Figure 17.
Ductility coefficient. (a) CSCSW; (b) RSCSW.
The deterioration in deformation capacity is further reflected by the ductility and energy dissipation characteristics. As the axial-load ratio increases, the positive ductility coefficient decreases from 7.53 to 6.13 for CSCSW and from 8.06 to 6.56 for RSCSW. A similar trend is observed for the cumulative energy dissipation, which decreases because premature concrete crushing and accelerated stiffness degradation reduce the number of stable large-drift loading cycles that the specimens can sustain before reaching the ultimate limit state. The cumulative energy dissipation data under different axial-load ratios are presented in Table 6. These observations indicate that excessive axial compression suppresses the development of distributed plasticity and shifts the structural response toward compression-controlled failure, thereby compromising the deformation and energy dissipation capacities that are essential for seismic resilience.
Table 6.
Accumulated energy consumption of composite shear walls with different axial-load ratios. (kN·mm).
The combined results demonstrate that the axial-load ratio plays a dual role in governing the seismic behavior of the composite shear wall. Within the investigated parameter range, moderate axial compression effectively enhances the lateral load resistance by improving compressive force transfer and delaying flexural instability, whereas excessive axial compression accelerates compression-zone damage and limits plastic deformation. Consequently, an axial-load ratio in the range of approximately 0.3–0.4 provides a favorable balance between strength enhancement and deformation capacity for the specimens investigated in this study.
4.3. Effect of Steel Plate Thickness
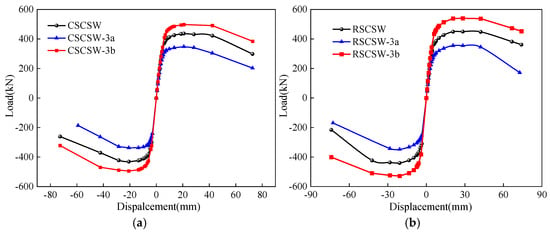
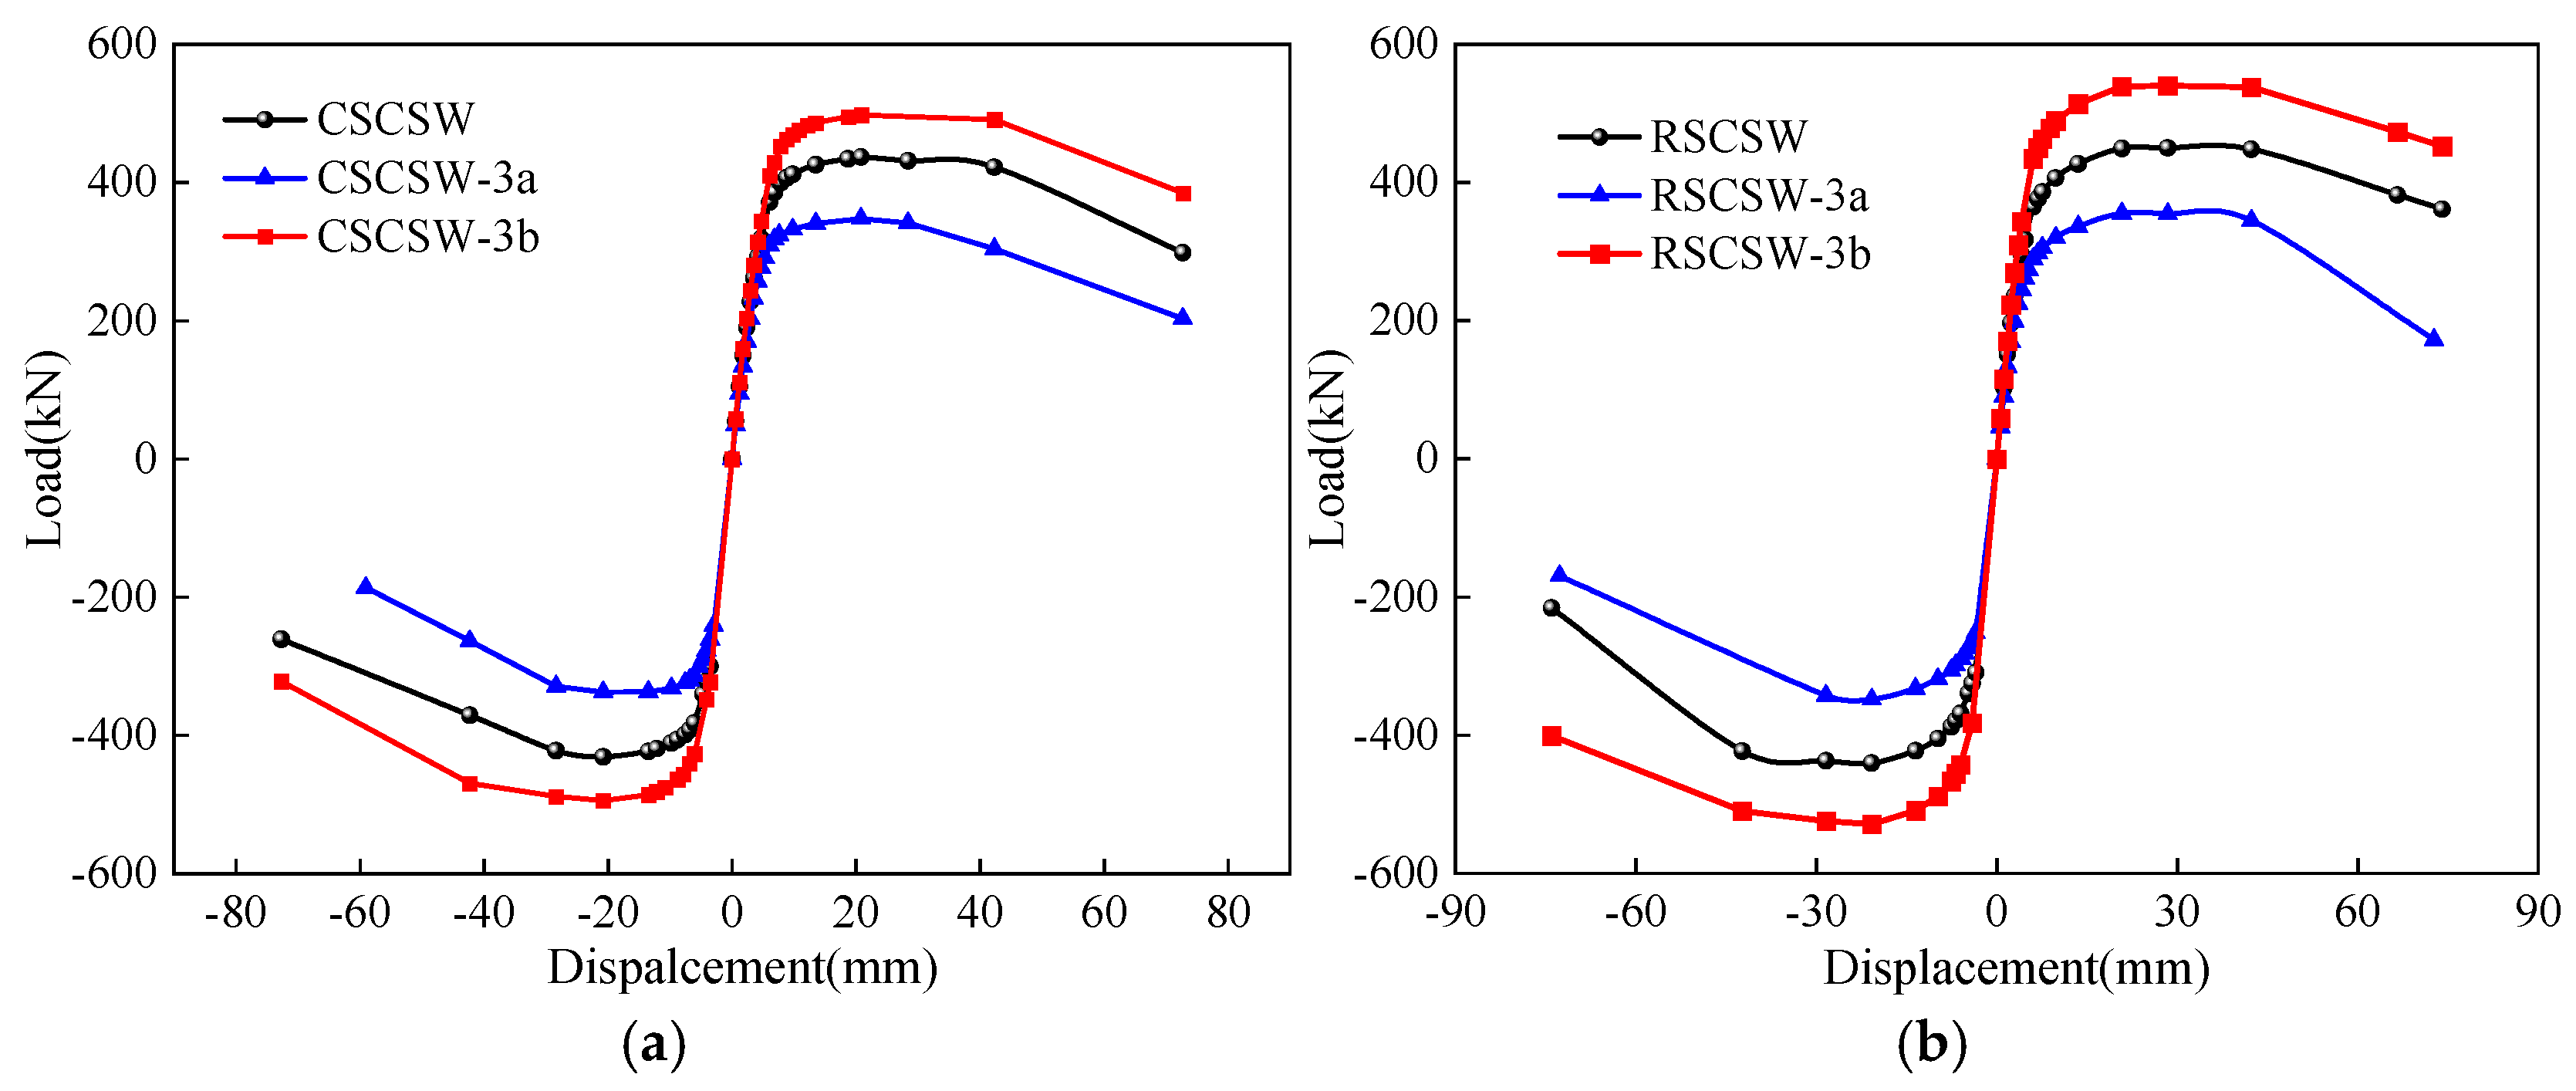
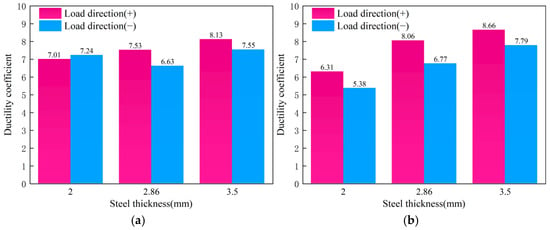
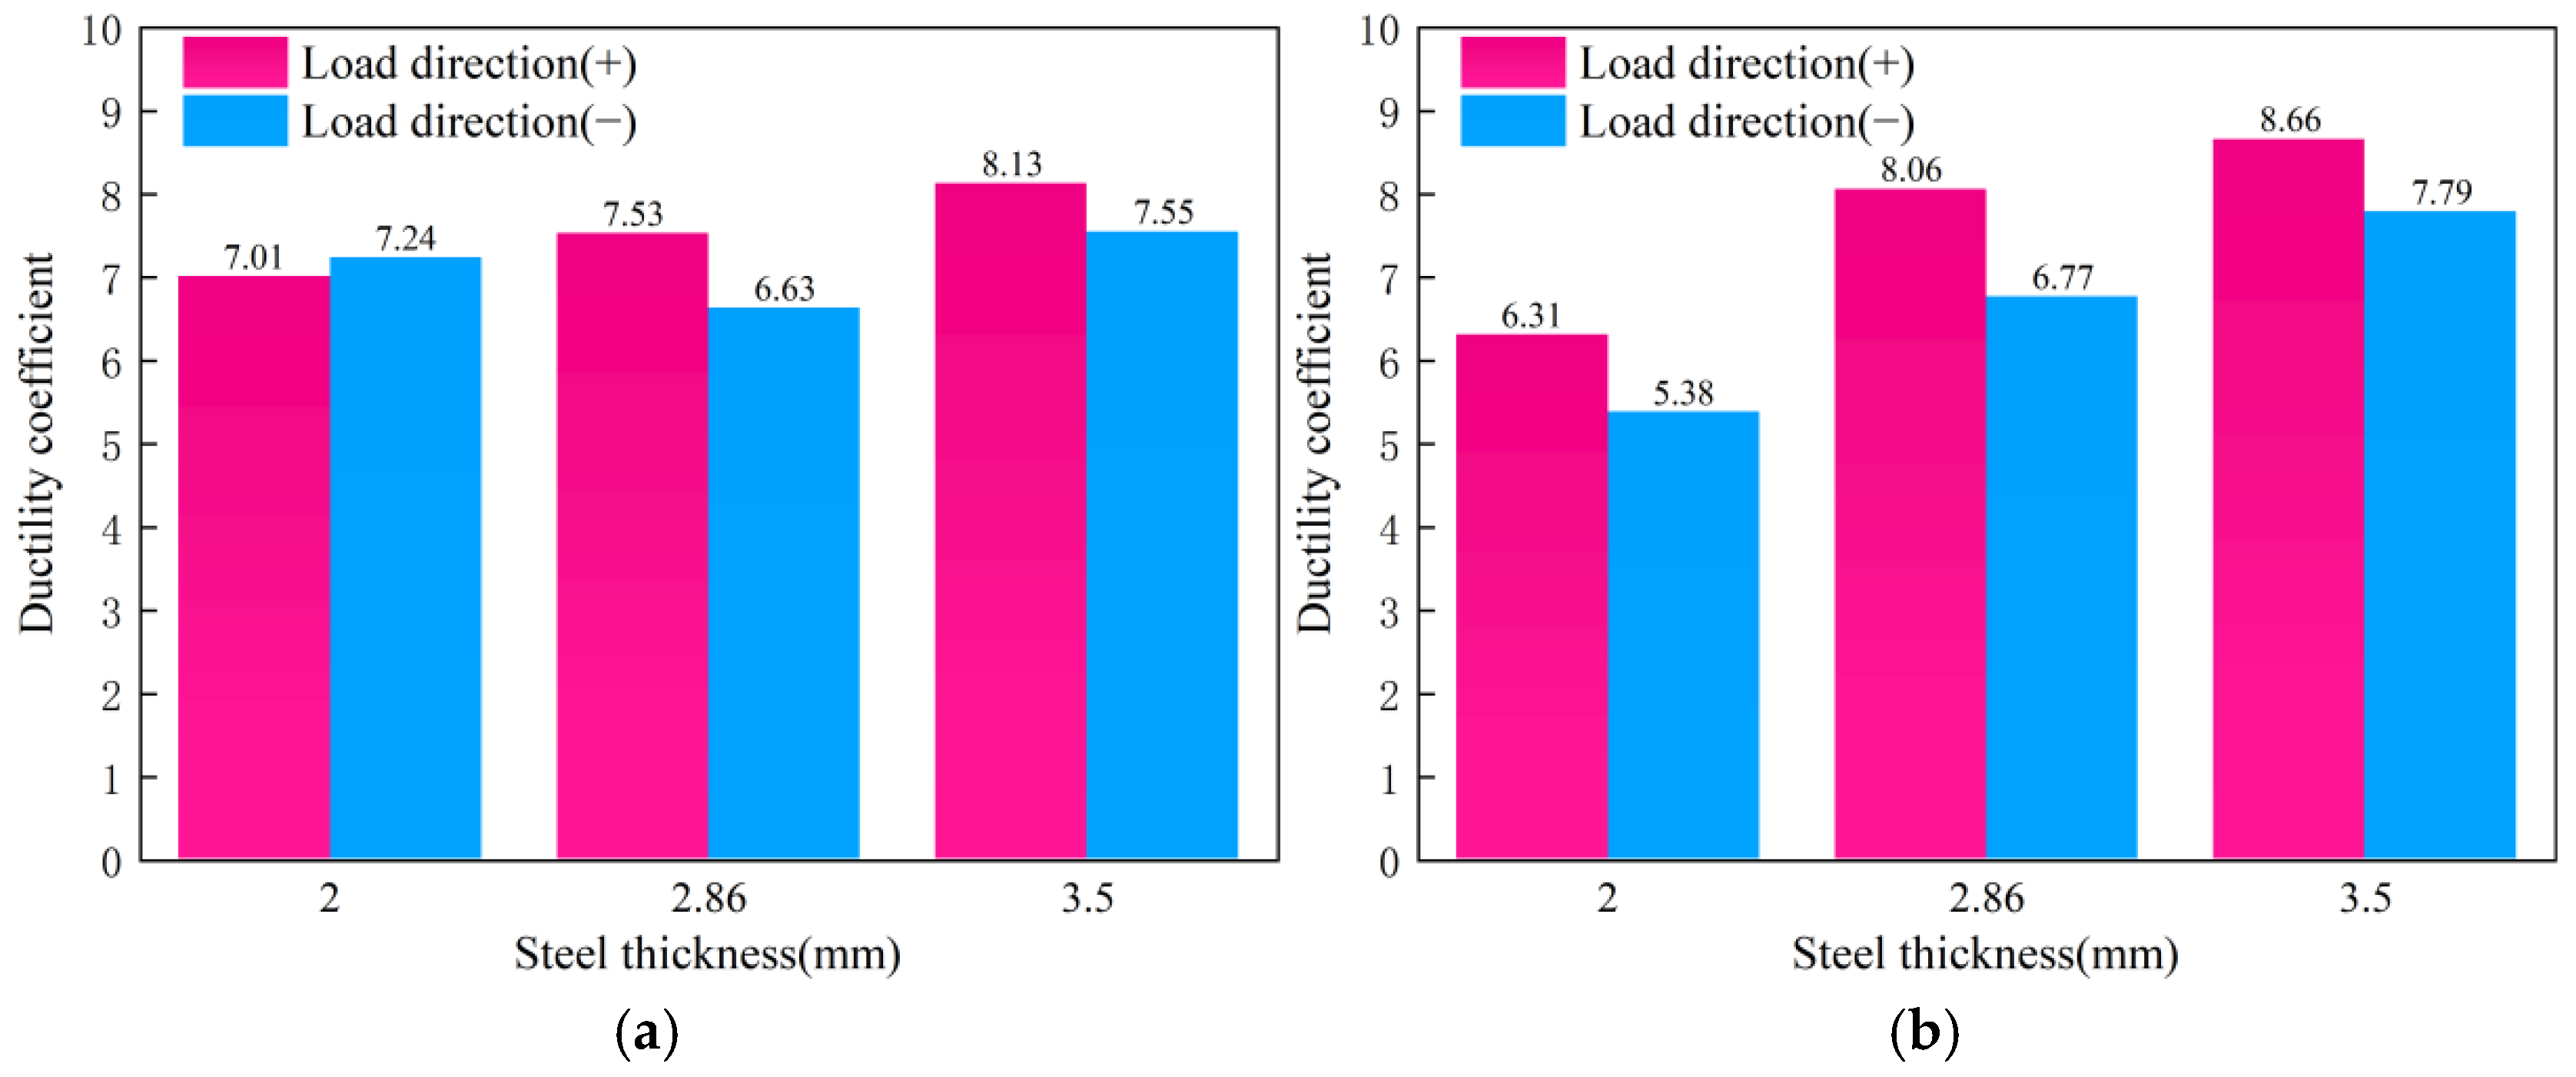
Figure 18 and Figure 19 illustrate the influence of boundary-frame plate thickness on the seismic response of the composite shear walls. Increasing the plate thickness from 2.0 mm to 3.5 mm increases the positive peak load from 347.89 kN to 498.00 kN (43%) for CSCSW and from 355.42 kN to 540.20 kN (52%) for RSCSW. This improvement indicates that increasing the boundary-frame plate thickness effectively enhances the lateral load-carrying capacity of the composite shear wall. Mechanistically, thicker plates improve the flexural and shear resistance of the boundary frame itself, increase its contribution to the global force-transfer mechanism, and delay local buckling of the steel components. Meanwhile, the increased plate thickness provides stronger confinement to the surrounding concrete, thereby enhancing the steel–concrete interaction and improving the deformation compatibility within the boundary region. Therefore, the effect of plate thickness represents a coupled contribution of increased steel cross-sectional capacity and enhanced confinement efficiency rather than a simple material-strength effect.
Figure 18.
Skeleton curve. (a) CSCSW; (b) RSCSW.
Figure 19.
Ductility coefficient. (a) CSCSW; (b) RSCSW.
The improvement in boundary-frame plate thickness also contributes to enhanced ductility and energy dissipation capacity. The positive ductility coefficient increases by approximately 16% for CSCSW and 37% for RSCSW. Meanwhile, the cumulative hysteretic energy increases from 66,725 kN·mm to 127,354 kN·mm for CSCSW (91%) and from 71,142 kN·mm to 150,235 kN·mm for RSCSW (111%). The detailed cumulative energy dissipation data under different steel plate thicknesses are summarized in Table 7. These results demonstrate that increasing plate thickness not only improves the peak resistance but also promotes more stable plastic deformation and energy dissipation under cyclic loading. This behavior can be attributed to the increased stiffness and deformation compatibility of the boundary frame, which facilitates the development of plasticity and delays severe stiffness degradation during large deformation cycles.
Table 7.
Accumulated energy consumption of composite shear walls with different steel thickness. (kN·mm).
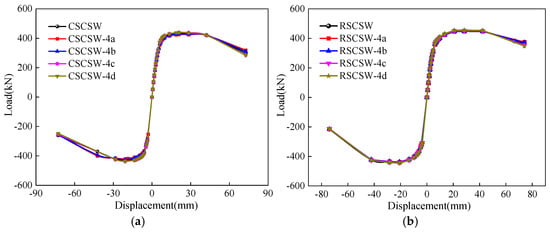
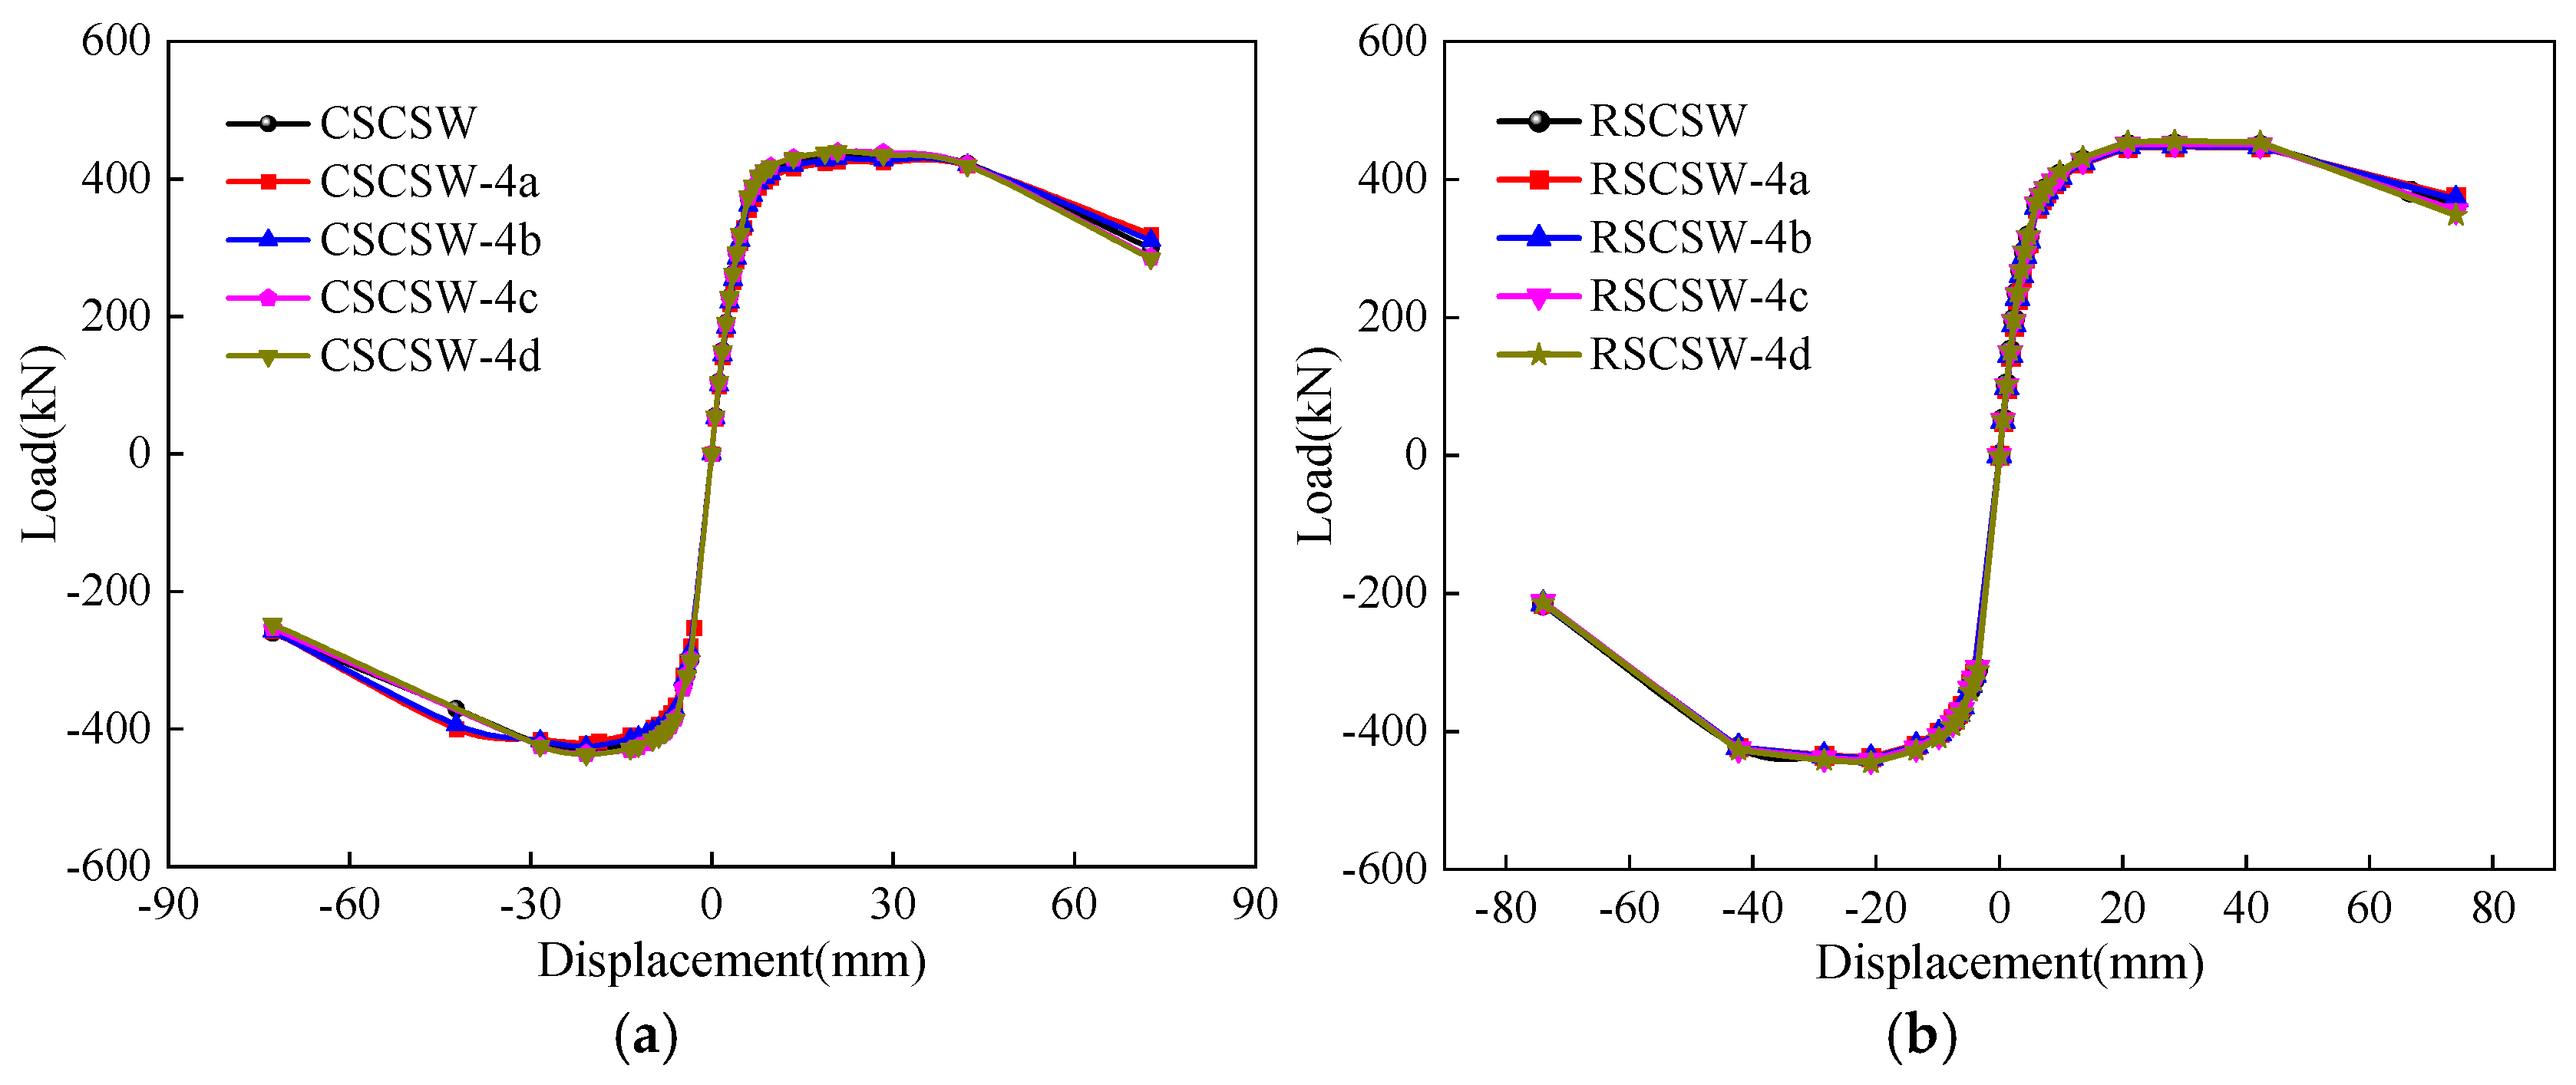
It is noteworthy that RSCSW exhibits a more pronounced improvement in strength, ductility, and energy dissipation compared with CSCSW. This difference may be attributed to the closed restraint path and the larger total amount of boundary steel provided by the RSCSW configuration. The closed steel frame establishes a more continuous confinement system and enhances the interaction between the steel frame and surrounding concrete, while the increased steel quantity further contributes to load resistance and energy dissipation.
4.4. Effect of Concrete Strength
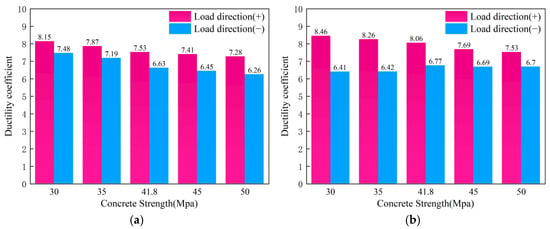
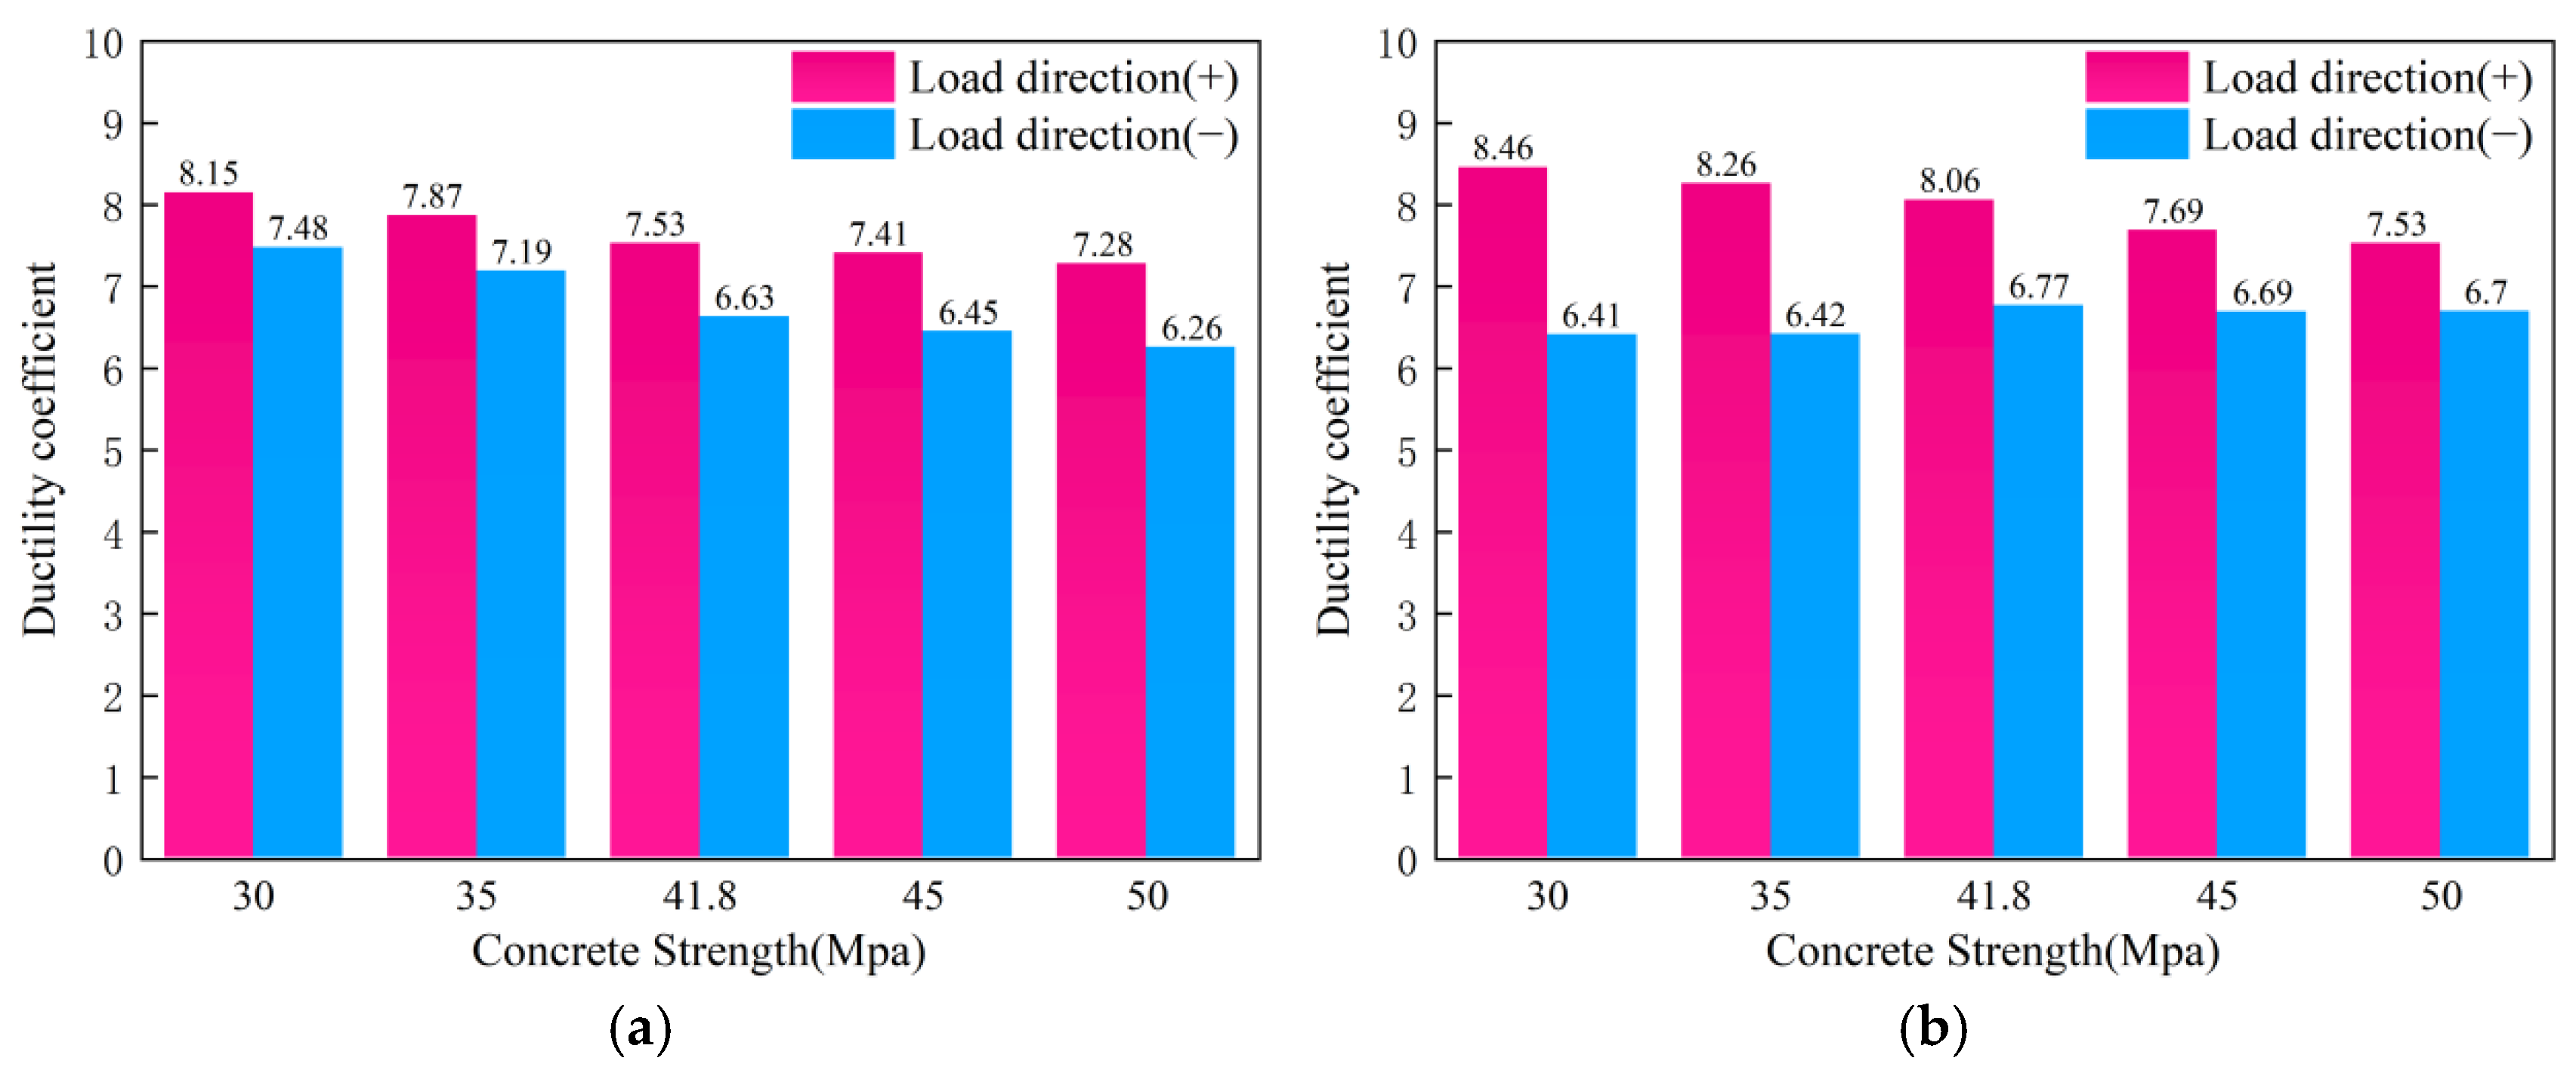
Figure 20 and Figure 21 illustrate the influence of concrete strength on the seismic performance of the composite shear walls. Increasing the concrete grade from C30 to C50 results in only a marginal increase in the peak resistance, with maximum improvements of 3.5% for CSCSW and 2.0% for RSCSW. This limited enhancement indicates that the global lateral resistance of the composite shear walls is not primarily governed by concrete compressive strength alone. Instead, the structural response is controlled by the combined effects of boundary-steel participation, reinforcement yielding, and the behavior of the confined concrete compression zone. Under cyclic loading, the boundary steel frame provides a major contribution to moment and shear transfer, whereas the concrete mainly functions as a load-sharing and confinement component. Therefore, increasing the nominal concrete strength does not result in a proportional increase in the overall resistance of the composite wall.
Figure 20.
Skeleton curve. (a) CSCSW; (b) RSCSW.
Figure 21.
Ductility coefficient. (a) CSCSW; (b) RSCSW.
In contrast to the slight improvement in strength, increasing concrete strength leads to a noticeable reduction in deformation capacity. The positive ductility coefficients decrease by approximately 11% for CSCSW and 12% for RSCSW. Although higher-strength concrete enhances the local compressive resistance of the compression zone, its reduced post-peak deformation capacity and lower damage tolerance restrict the development of plastic deformation after concrete crushing, resulting in a more brittle structural response. The cumulative energy dissipation results further support this observation. The cumulative hysteretic energy decreases by approximately 11% for CSCSW, whereas only a slight variation is observed for RSCSW. The cumulative energy dissipation data under different concrete strength grades are presented in Table 8. This indicates that the closed boundary-frame configuration provides an effective confinement path that partially mitigates, but does not completely eliminate, the adverse influence of higher-strength concrete on deformation capacity.
Table 8.
Accumulated energy consumption of composite shear walls with different concrete strength (kN·mm).
The above results demonstrate that increasing concrete strength provides limited benefits to the overall seismic performance of the composite shear walls. Its contribution is mainly reflected in local compression resistance rather than in the enhancement of global lateral resistance and plastic energy dissipation. Therefore, once the required strength level is satisfied, further increasing concrete grade may not be the most efficient approach for improving seismic performance. Instead, greater emphasis should be placed on boundary-frame detailing, steel component stability, and the enhancement of steel–concrete interactions to achieve a more favorable balance between strength, ductility, and energy dissipation capacity.
5. Limitations and Future Research
Although this study conducted a systematic parametric investigation based on experimentally validated finite element models and revealed the differences in seismic performance and cooperative load-transfer mechanisms between C-shaped steel-frame composite shear walls and rectangular steel-frame composite shear walls, several limitations should be acknowledged.
First, the numerical models developed in this study were validated against existing low-cycle cyclic loading tests. To achieve an effective simulation of the complex steel–concrete composite behavior, reasonable simplifications were adopted for the material constitutive models, interface interactions, and boundary conditions. Therefore, the conclusions obtained in this study are primarily applicable to composite shear wall systems within the investigated parameter ranges. Further validation is required for structures with different dimensions, material properties, and more complex loading conditions.
Second, this study mainly focused on the effects of shear-span ratio, axial-load ratio, steel plate thickness, and concrete strength on seismic performance. However, the actual structural behavior may also be influenced by additional engineering factors, including construction tolerances, connection reliability, fabrication quality, and long-term service conditions. These factors require further investigation through additional experimental studies and engineering applications.
Furthermore, the practical application of seismic enhancement technologies depends not only on structural performance improvement but also on economic feasibility and construction efficiency. The proposed steel-frame composite shear wall system improves load-carrying capacity, ductility, and energy dissipation through enhanced steel confinement and steel–concrete cooperative action; however, it may also involve increased steel consumption, more complicated fabrication processes, and higher construction costs. Therefore, future studies should establish a multi-objective evaluation framework considering seismic performance, material consumption, manufacturing cost, and construction efficiency, and further investigate the performance-economy optimization of composite shear wall systems. In addition, more comprehensive evaluations based on additional experimental data, engineering applications, and life-cycle assessment methods are needed to assess the practical applicability and long-term benefits of these structural systems.
6. Conclusions
This study investigated the seismic performance of assembled composite shear walls with C-shaped steel frames (CSCSW) and rectangular steel frames (RSCSW). Based on experimentally validated finite element models, a systematic parametric analysis was conducted to evaluate the effects of shear-span ratio, axial-load ratio, steel plate thickness, and concrete strength on the strength, deformation capacity, energy dissipation behavior, and failure mechanisms of the two composite shear wall systems. The main conclusions are summarized as follows:
- (1)
- Both CSCSW and RSCSW exhibited favorable seismic performance under cyclic loading, and the numerical models successfully reproduced the main experimental behaviors, including hysteretic response, strength characteristics, and failure modes. Compared with CSCSW, RSCSW achieved approximately 3% higher peak load, 3–7% higher initial stiffness, 6% higher ductility coefficient, and 12% greater cumulative energy dissipation. This improvement was mainly attributed to the closed rectangular boundary configuration, which provides a more continuous confinement path and enhances the steel–concrete cooperative load-transfer mechanism. These results demonstrate that boundary-frame configuration is a critical factor controlling the seismic performance of assembled composite shear walls.
- (2)
- The shear-span ratio was identified as the most influential parameter affecting the seismic behavior of both composite shear wall systems. As the shear-span ratio decreased from 3.0 to 1.0, the peak load increased significantly by 160% for CSCSW and 171% for RSCSW. However, the ductility coefficients decreased by approximately 42% and 43%, respectively, accompanied by a transition from flexure-controlled to shear-dominated failure. This indicates that reducing the shear-span ratio can improve strength but may induce a more brittle failure mechanism. Therefore, excessive reduction in the shear-span ratio should be avoided in practical design to maintain sufficient deformation capacity.
- (3)
- Increasing the boundary-frame steel plate thickness effectively improved both strength and deformation performance. When the steel plate thickness increased from 2.0 mm to 3.5 mm, the peak load increased by 43% for CSCSW and 52% for RSCSW, while cumulative energy dissipation increased by 91% and 111%, respectively. The enhancement mechanism was attributed not only to the increased steel contribution to flexural and shear resistance but also to the improved confinement effect on the core concrete. Therefore, increasing boundary-frame steel thickness represents an effective approach for improving seismic resilience, especially when higher ductility and energy dissipation capacity are required.
- (4)
- The axial-load ratio exhibited a dual influence on seismic performance. Moderate axial compression improved lateral resistance by enhancing compressive force transfer, while excessive axial compression accelerated concrete crushing and restricted plastic deformation development. When the axial-load ratio increased from 0.17 to 0.51, the peak load increased by approximately 21% and 24% for CSCSW and RSCSW, respectively, whereas ductility and energy dissipation capacity decreased continuously. Based on the investigated parameter range, an axial-load ratio of approximately 0.26–0.43 provides a reasonable balance between strength and deformation capacity.
- (5)
- Increasing concrete strength had limited influence on the overall lateral resistance but resulted in reduced deformation capacity. Increasing concrete strength from C30 to C50 improved the peak load by less than 4%, while ductility decreased by approximately 11–12%. This indicates that the seismic performance of composite shear walls is not primarily controlled by concrete compressive strength, but rather by the interaction between boundary steel frames, reinforcement, and confined concrete. Therefore, increasing concrete strength alone is not an efficient strategy for improving seismic performance once the required strength level is satisfied.
- (6)
- From an engineering application perspective, the results provide guidance for the design optimization of assembled composite shear walls. The rectangular steel-frame configuration is recommended when higher ductility and energy dissipation capacity are required, while the C-shaped steel-frame configuration may provide a more material-efficient alternative under conditions where structural demands are relatively moderate. The parametric results also indicate that improving boundary-frame confinement and optimizing steel distribution are more effective than simply increasing concrete strength. These findings provide useful references for the selection of boundary-frame configurations and parameter determination in the seismic design of composite shear walls. Furthermore, the identified relationships between shear-span ratio, axial-load ratio, and steel plate thickness may provide supplementary evidence for future refinement of design provisions related to assembled composite shear wall systems.
Author Contributions
Methodology, T.Z.; Validation, T.Z. and L.L.; Writing—original draft, X.M.; Writing—review and editing, X.M.; Visualization, L.L.; Project administration, D.L.; Funding acquisition, D.L. All authors have read and agreed to the published version of the manuscript.
Funding
Horizontal Research Project: Investment and Financing Models and Risk Control of Construction Technology Enterprises in the Context of Smart City Projects. This research was funded by Hainan Shiyou Technology Co., Ltd. Grant number JC202516.
Data Availability Statement
Experimental data and the numerical datasets generated and analyzed in this study are available from the corresponding author upon reasonable request. The data are not deposited in a public repository because they include large ABAQUS model and output files.
Conflicts of Interest
The authors declare no conflicts of interest.
References
- Vuran, E.; Serhatoğlu, C.; Timurağaoğlu, M.Ö.; Smyrou, E.; Bal, İ.E.; Livaoğlu, R. Damage observations of RC buildings from the 2023 Kahramanmaraş earthquake sequence and discussion on seismic code regulations. Bull. Earthq. Eng. 2025, 23, 1153–1182. [Google Scholar] [CrossRef] [Scilit]
- U.S. Geological Survey. 2026 Venezuela Sequence Earthquake-Triggered Landslide Hazards; U.S. Geological Survey: Reston, VA, USA, 2026.
- Guaygua, B.; Sánchez-Garrido, A.J.; Yepes, V. A systematic review of seismic-resistant precast concrete buildings. Structures 2023, 58, 105598. [Google Scholar] [CrossRef] [Scilit]
- Ghasizadeh, S.; Tabadkani, A.; Hirajasouli, A.; Banihashemi, S. Environmental and economic performance of prefabricated construction: A review. Environ. Impact Assess. Rev. 2022, 97, 106897. [Google Scholar] [CrossRef] [Scilit]
- Djenad, S.; Ait Taleb, S.; Si Salem, A. Finite element modeling of partially-confined concrete and RC columns with embedded hexagonal-FRP strips under axial and horizontal loading. Structures 2023, 54, 369–385. [Google Scholar] [CrossRef] [Scilit]
- Hu, Y.; Sun, Z.; Wu, J. Seismic behavior of composite shear walls with boundary columns using rectangular and U-shaped concrete-filled steel tubes. J. Build. Eng. 2023, 73, 107306. [Google Scholar] [CrossRef] [Scilit]
- Ding, Y.; Zeng, B.; Zhou, Z.; Wei, Y. Seismic behavior of shear walls partially strengthened with UHPC in boundary element. Eng. Struct. 2023, 293, 116660. [Google Scholar] [CrossRef] [Scilit]
- Liao, F.Y.; Han, L.H.; Tao, Z. Performance of reinforced concrete shear walls with steel reinforced concrete boundary columns. Eng. Struct. 2012, 44, 186–209. [Google Scholar] [CrossRef] [Scilit]
- Dan, D.; Fabian, A.; Stoian, V. Nonlinear behavior of composite shear walls with vertical steel encased profiles. Eng. Struct. 2011, 33, 2794–2804. [Google Scholar] [CrossRef] [Scilit]
- Kisa, M.; Yuksel, S.; Özmen, R. Experimentally validated numerical investigation on the behavior of composite shear walls subjected to cyclic loading. Eng. Sci. Technol. Int. J. 2024, 59, 101884. [Google Scholar] [CrossRef] [Scilit]
- Chen, P.; Wang, W.; Cai, W. Seismic behavior of innovative reinforced concrete composite shear wall with PEC boundary columns. Structures 2024, 69, 107306. [Google Scholar] [CrossRef] [Scilit]
- Yang, Z.; Chen, J.; Wang, F.; Wang, J. Seismic performance of circular concrete-filled steel tube columns reinforced with inner latticed steel angles. J. Constr. Steel Res. 2023, 205, 107908. [Google Scholar] [CrossRef] [Scilit]
- Ke, X.-J.; Li, N.; Li, Q.-L.; Tang, Z.-K. Seismic behavior of steel plate concrete composite shear walls with PEC columns and WRGs. Eng. Struct. 2023, 277, 115412. [Google Scholar] [CrossRef] [Scilit]
- Qiao, Q.Y.; Cao, W.L.; Li, X.Y.; Dong, H.Y.; Zhang, W.W.; Yin, F. Seismic behavior of shear walls with boundary CFST columns and embedded multiple steel plates: Experimental investigation. Eng. Struct. 2018, 160, 243–256. [Google Scholar] [CrossRef] [Scilit]
- Hu, H.S.; Nie, J.G.; Fan, J.S.; Tao, M.X.; Wang, Y.H.; Li, S.Y. Seismic behavior of CFST-enhanced steel plate-reinforced concrete shear walls. J. Constr. Steel Res. 2016, 119, 176–189. [Google Scholar] [CrossRef] [Scilit]
- Cheng, Y.; Yang, Y.; Liu, J.; Nie, W.; Chen, Y.F. Seismic performance and design method of T-shaped CFST column to U-shaped steel-concrete composite beam joint with vertical stiffeners. Eng. Struct. 2023, 275, 115270. [Google Scholar] [CrossRef] [Scilit]
- Yu, J.G.; Zhu, S.Q.; Feng, X.T. Seismic Behavior of CFRP-Steel Composite Plate Shear Wall with Edge Reinforcement. J. Constr. Steel Res. 2023, 203, 107816. [Google Scholar] [CrossRef] [Scilit]
- Wang, S.; Zhu, Q.; Zhao, J.H.; Zhang, D.F.; Feng, Z.D.; Hu, J.Y. Performance of multi-ribbed composite wall incorporating reactive powder concrete-filled steel tubular columns under axial compression. Structures 2024, 64, 106528. [Google Scholar] [CrossRef] [Scilit]
- Han, J.; Shu, G.; Qin, Y.; Zhou, G.; Zhou, X. Sectional strength design of a double-skin truss-reinforced composite shear wall. Thin-Walled Struct. 2024, 195, 111377. [Google Scholar] [CrossRef] [Scilit]
- Katrangi, M.; Khanmohammadi, M.; Zare, H. Seismic behavior of resilient composite steel plate shear wall using experimental investigations. Eng. Struct. 2024, 305, 117707. [Google Scholar] [CrossRef] [Scilit]
- Zhang, Y.; Du, Y.; Chen, Z.; Wang, J.; Xu, Y.; Liu, G. Research on seismic performance of ITRAC-filled double steel plate composite shear wall. J. Build. Eng. 2023, 75, 107073. [Google Scholar] [CrossRef] [Scilit]
- Zhao, Q.H.; Li, Y.K.; Tian, Y. Cyclic behavior of double-skin composite walls with flat and corrugated faceplates. Eng. Struct. 2020, 220, 111013. [Google Scholar] [CrossRef] [Scilit]
- Lin, G.; Ma, K.; Xing, G.; Cheng, J.; Cao, X. Experimental study on seismic performance of composite shear walls with end columns. J. Constr. Steel Res. 2024, 223, 109093. [Google Scholar] [CrossRef] [Scilit]
- Mou, X.; Lv, H.; Li, X. Seismic performance of corrugated steel plate composite shear walls with various configurations. Structures 2023, 57, 105133. [Google Scholar] [CrossRef] [Scilit]
- JGJ/T 101-2015; Ministry of Housing and Urban-Rural Development of the People’s Republic of China. Specification for Seismic Test of Buildings: Beijing, China, 2015. (In Chinese)
- GB/T 2975-2018; Steel and Steel Products—Location and Preparation of Samples and Test Pieces for Mechanical Testing. Standards Press of China: Beijing, China, 2018. (In Chinese)
- GB/T 50081-2019; Standard for Test Methods of Concrete Physical and Mechanical Properties. China Architecture & Building Press: Beijing, China, 2019. (In Chinese)
- Mander, J.B.; Priestley, M.J.N.; Park, P. Observed stress-strain behavior of confined concrete. J. Struct. Eng. 1988, 114, 1827–1849. [Google Scholar] [CrossRef] [Scilit]
- Mo, X.; Liang, D.; Zhao, T.; Zhang, L.; Wu, C. Stress-Strain Relationship of CShaped Steel Tube-Confined Concrete Under Axial Compression. Buildings 2026, 16, 1802. [Google Scholar] [CrossRef] [Scilit]
- Han, L.H. Concrete-Filled Steel Tubular Structures: Theory and Practice; Science Press: Beijing, China, 2016; pp. 101–118. (In Chinese) [Google Scholar]

Disclaimer/Publisher’s Note: The statements, opinions and data contained in all publications are solely those of the individual author(s) and contributor(s) and not of MDPI and/or the editor(s). MDPI and/or the editor(s) disclaim responsibility for any injury to people or property resulting from any ideas, methods, instructions or products referred to in the content. |
© 2026 by the authors. Licensee MDPI, Basel, Switzerland. This article is an open access article distributed under the terms and conditions of the Creative Commons Attribution (CC BY) license.