


Abstract
To address the challenges in risk prevention and control of post-earthquake gas explosions in high-rise buildings and the deficiencies of traditional methods in handling uncertainty, this paper conducts a risk evolution analysis from the perspectives of fuzzy Bayesian networks (FBNs) and complex network (CN) theory. First, based on comprehensive risk factor identification, an earthquake-gas explosion disaster chain evolution model was constructed. Subsequently, the nodes and logical relationships of the disaster chain were mapped through Bayesian network (BN) topology, with fuzzy set theory employed to determine prior and conditional probability parameters for causal reasoning and risk diagnosis. Finally, complex network (CN) centrality metrics were introduced to quantify node topological importance, and chain-cutting disaster mitigation strategies were proposed accordingly. The research results indicate that gas overrun (M2) is the node with the highest comprehensive importance, while sensitivity analysis further confirms that it remains the most critical controllable node for interrupting the disaster chain. This method effectively reveals the disaster evolution mechanism and provides a scientific reference for disaster prevention and mitigation decision-making in high-rise buildings.
1. Introduction
Earthquakes, as one of the most intense geological hazards in nature, pose significant threats to human life, property safety, and sustainable social development. According to data from the China Earthquake Networks Center, approximately 520 earthquakes with magnitudes greater than 6.0 have occurred globally over the past three decades. These seismic events are often accompanied by secondary disasters such as fires, explosions, and landslides, which further exacerbate the severity of the catastrophe [1,2,3]. Among these, earthquake-explosion disaster chains are characterized by large instantaneous energy release, high randomness, and severe destructive consequences. For example, the 2011 earthquake off the northeast coast of Japan’s Honshu Island triggered liquefied petroleum gas leaks at a refinery in Chiba Prefecture, resulting in multiple explosions that destroyed 17 storage tanks [4]. Additionally, earthquakes may rupture gas pipelines, causing leaks that could trigger explosions within urban areas or buildings. Similar incidents have been reported during the 1994 Northridge earthquake in the United States [5] and the 2023 Kahramanmaraş earthquake in Turkey [6].
High-rise residential buildings, as primary urban living spaces, are characterized by high population density, intensive gas usage, and complex infrastructure systems. In such environments, post-earthquake gas explosions not only cause catastrophic casualties and structural damage but also significantly impede rescue operations due to the complexity of the disaster site. However, existing studies have predominantly focused on structural risk analysis under single-hazard conditions (i.e., either earthquakes or explosions in isolation). Although progress has been made in probabilistic risk assessment under coupled earthquake-explosion effects, a systematic framework for analyzing the dynamic evolution of these accident chains remains under-explored. For example, Abdollahzadeh and Faghihmaleki [7] employed probabilistic methods to develop multiple scenarios and evaluated the differences in probabilistic risks of dual hazards faced by structures under the combined action of seismic and blast loads. Xie et al. [8] established a joint probability model for earthquake-induced secondary gas explosion hazards, systematically elucidating the occurrence mechanism and potential risks of their coupling effects. Chen et al. [9] evaluated the collapse resistance performance of high-rise reinforced concrete frame structures under blast loading, and quantified the feasibility and effectiveness of two types of external blast-resistant strengthening measures, namely fiber-reinforced polymer and steel plates. Shahzad et al. [10] analyzed the plastic deformation and seismic response of a new mega-subcontrolled structural system (MSCSS) subjected to seismic excitation. Xiao et al. [11] proposed an aseismic optimization method for mega-subcontrolled structures based on a Gaussian process surrogate model. Fan et al. [12] investigated the failure modes and optimization of MSCSS with laminated rubber bearings based on the incremental dynamic analysis method. These studies provide useful references for structural response analysis, seismic performance assessment, and disaster risk evaluation, but they still fail to fully characterize the disaster evolution process or identify the key topological nodes within the accident chain. Therefore, it is essential to comprehensively identify the causal factors of explosion accidents, quantitatively investigate the disaster chain propagation, and pinpoint key nodes for effective risk control.
In recent years, Bayesian networks (BNs) have emerged as a robust risk assessment method due to their effectiveness in identifying potential hazards. Particularly in the research on accident chain evolution, this method exhibits significant advantages in modeling event polymorphism and non-deterministic logical relationships, as well as in probabilistic updating and bidirectional reasoning [13,14,15]. Consequently, BNs have been successfully integrated into various domains, including transportation [16,17], aerospace [18], construction management [19], and energy systems [20,21]. However, influenced by traditional probability approaches, BNs exhibit limitations in uncertainty inference when precise probabilities are required [22]. These limitations become particularly pronounced in the context of multi-hazard coupling, where data scarcity exacerbates the challenges. Furthermore, conducting system risk assessments necessitates quantifying the prior probabilities of root nodes. For this reason, group decision-making techniques are frequently employed in the probability assessment of root nodes [23]. Fuzzy set theory is capable of characterizing uncertainties through intervals or fuzzy numbers, and integrating with BNs represents a tool that is well worth consideration [24,25,26]. Mahmood et al. [27] developed a Fuzzy Bayesian network (FBN) risk assessment framework and by integrating crisp probabilities and fuzzy probabilities, comprehensively analyzed external risk factors (e.g., corrosion, third-party interference) and internal risk factors of natural gas pipelines. To address the limited research on thermal runaway mechanisms in lithium-ion battery warehouses, Xie et al. [28] proposed a risk assessment framework integrating BNs and expert evaluation. The study highlighted human factors as the leading cause of fire incidents and suggested corresponding control measures. Li et al. [29] established a BN model by integrating expert knowledge, with which they assessed the risk level of coal mine gas explosions and identified the key causal factors. However, analyzing gas explosion risks solely from the perspective of probabilistic evolution often fails to uncover the topological characteristics of the system’s elements. With the growing application of Complex Network (CN) theory in disaster evolution research, its advantages in characterizing risk diffusion paths and identifying critical nodes have become increasingly prominent [30,31]. Consequently, the integration of CN theory successfully compensates for the limitations of probabilistic models, providing an effective solution.
To address these challenges, this study proposes a risk assessment framework for post-earthquake gas explosions in high-rise residential buildings based on the integration of BN and CN theory. Initially, a disaster evolution chain is established through the comprehensive identification of accident causative factors. Subsequently, fuzzy set theory is employed to manage data scarcity and inherent uncertainties, while the Cronbach’s coefficient alpha is introduced to verify the reliability of expert evaluations, thereby enhancing the objectivity and accuracy of probability estimations. On this basis, an FBN model is developed to perform bidirectional probabilistic reasoning, quantifying the relative importance of causative factors to pinpoint key triggers. Finally, by leveraging CN theory, the study characterizes the comprehensive importance of nodes within the system to identify critical topological nodes for blocking accident chain propagation, providing a robust scientific basis for regional disaster prevention and mitigation.
2. Methodologies
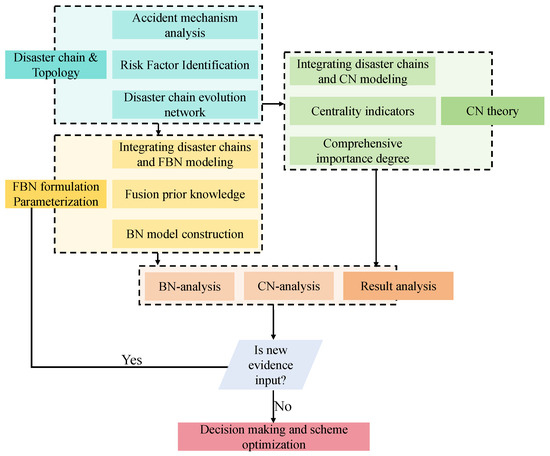
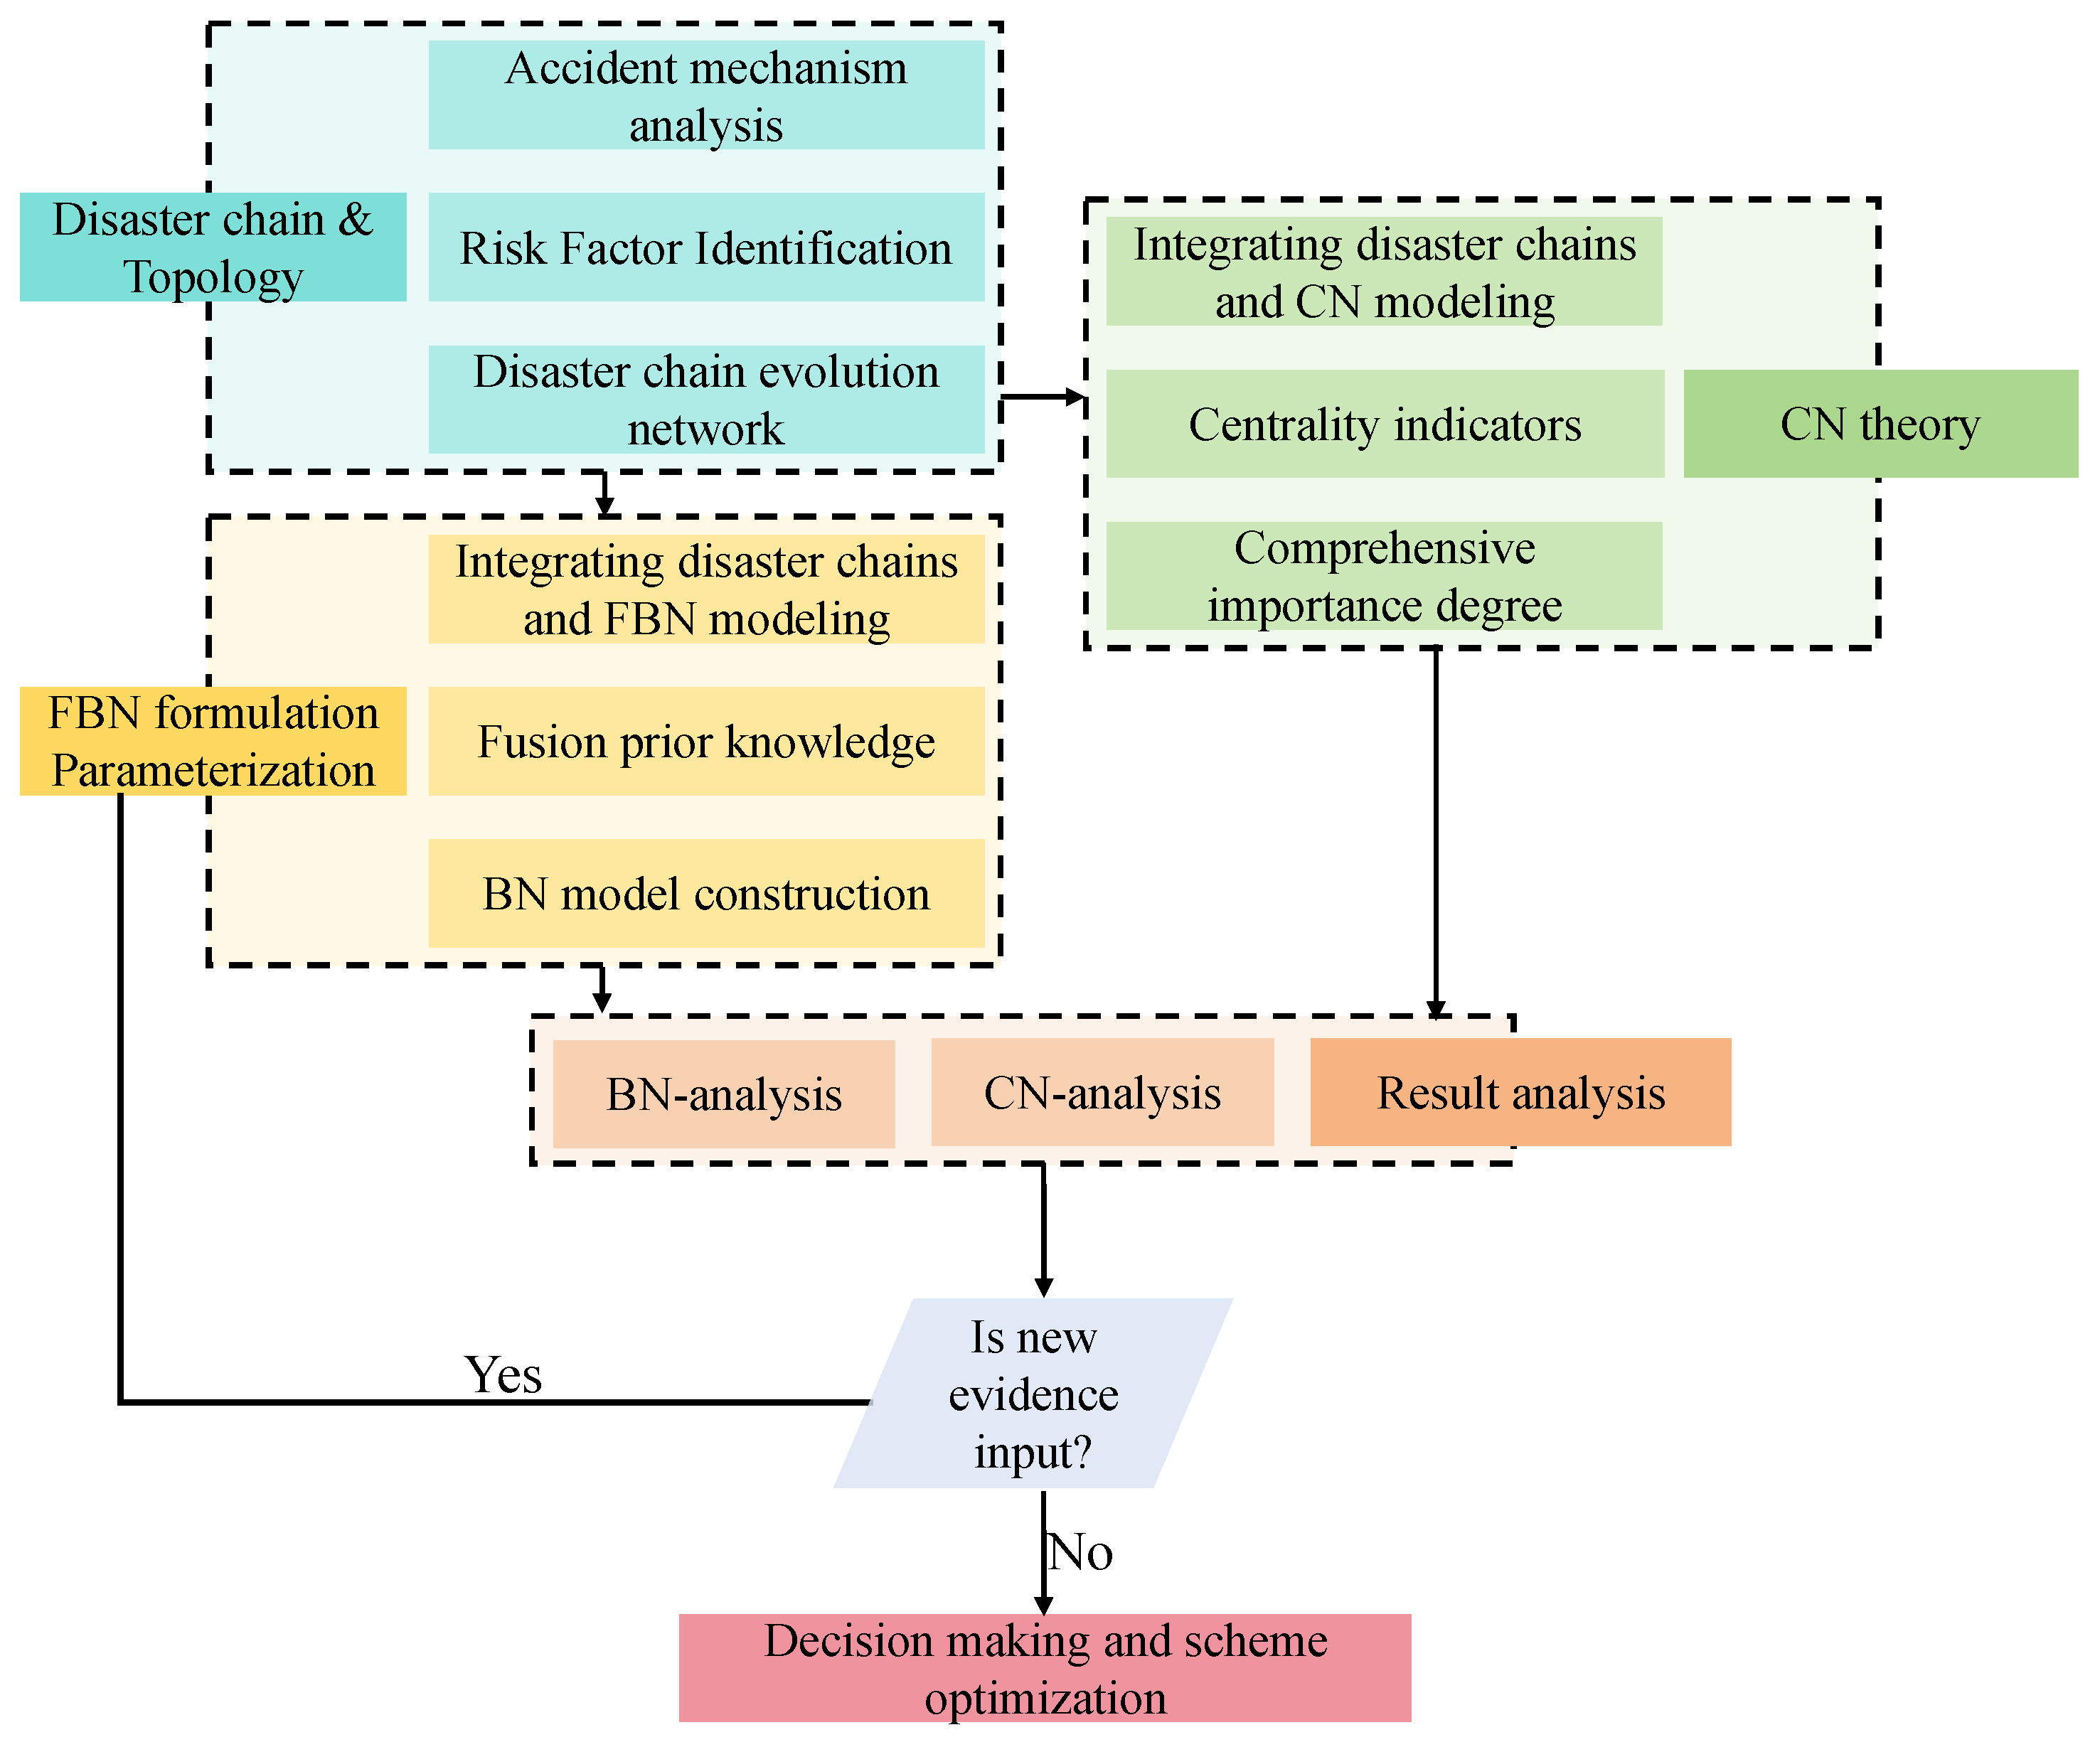
The risk assessment framework proposed in this paper is systematically structured into four phases, as illustrated in Figure 1.
Figure 1.
Integrated framework for the BN-CN-based risk assessment.
2.1. Disaster Chains
2.1.1. Disaster Chain Theory
The concept of the ‘disaster chain’ was initially proposed by Guo [32] and subsequently refined by Shi [33], defined as a sequence of disaster phenomena induced by hazard-formative factors or changes in the ecological environment. This system comprises the disaster-forming environment, hazard-formative factors, and hazard-bearing bodies. Within this system, hazard-formative factors act upon hazard-bearing bodies; when the accumulated energy breaches the threshold of the disaster-forming environment, it generates new hazard-formative factors. This cyclical evolution ultimately results in the formation of a disaster chain.
2.1.2. Extraction of Disaster Chain Nodes
Case retrieval is a pivotal method for elucidating disaster evolution mechanisms. This study extracts risk factors by integrating multi-source data, including web searches, academic literature, and news reports. Furthermore, drawing upon the deductive reasoning logic of fault tree analysis, we clarify the causal relationships among these factors at the level of disaster-causing mechanisms, thereby identifying the critical nodes of the disaster chain.
2.2. Complex Network Theory
CN theory abstracts real-world systems into topological structures, using nodes and edges to represent risk events and propagation paths, respectively. This approach provides an effective perspective for understanding and preventing the further evolution of disasters [34]. Given the distinct sequential causality in disaster evolution, and considering that, for a child node with multiple parent nodes, the CPT describes its conditional probabilities under different combinations of parent-node states rather than providing a unique probability weight for each edge, a directed unweighted network was adopted. Similarly, previous accident disaster-chain studies have employed directed unweighted networks when complex causal relationships could not be accurately represented by specific numerical values [35]. The following metrics were then used to quantify specific nodal properties.
2.2.1. Degree Centrality
This metric quantifies the local connectivity of a node by calculating its number of direct links. A higher value indicates that the node possesses significant influence within the network structure:
where σij denotes the edge count connecting node i and node j, and n represents the total number of nodes.
2.2.2. Closeness Centrality
This metric quantifies the efficiency of a node in reaching all other nodes by calculating the reciprocal of the average shortest path distance. A higher centrality value indicates shorter path lengths to other nodes, facilitating faster risk propagation:
where n represents the total number of nodes, and dij denotes the shortest path length between node i and node j.
2.2.3. Eigenvector Centrality
This metric posits that the significance of a node is a function of the quality of its neighbors, rather than being restricted to the quantity of its direct ties:
where A denotes the adjacency matrix of the network, a is a constant representing the maximum eigenvalue of the adjacency matrix, and N is the number of nodes.
2.3. Fuzzy Bayesian Networks
2.3.1. Bayesian Network
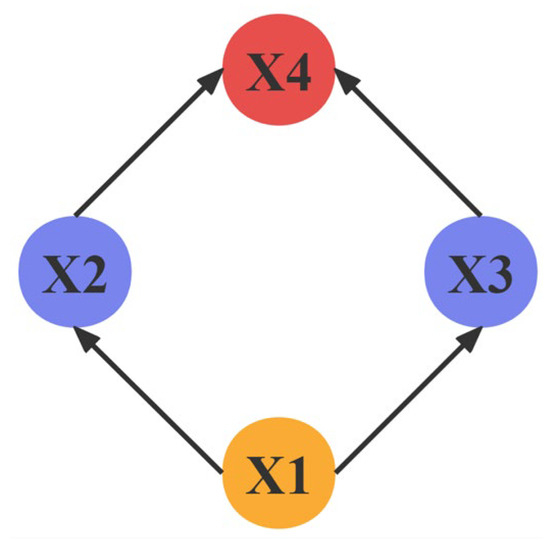
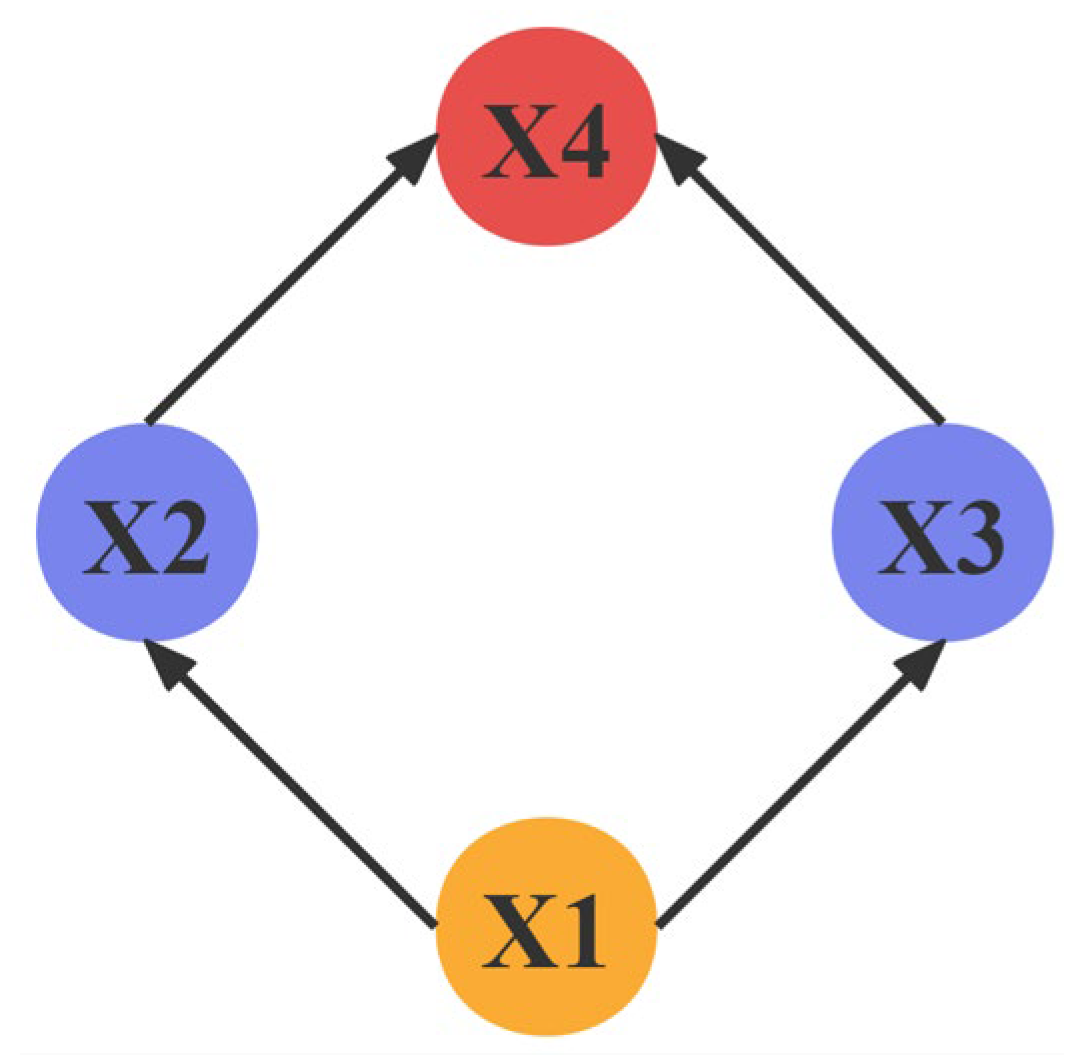
The BN is a graph-theoretic model that enables the computation of complex logic and probabilistic inference of causal relationships, which consists of a directed acyclic graph and a set of conditional probability tables [36,37]. Figure 2 illustrates a typical structure of a BN. In this structure, X1 serves as the parent node that influences both X2 and X3. Consequently, X2 and X3 act as intermediate nodes, which further determine the state of the leaf node X4, while directed arcs characterize the logical relationships between different nodes. When new evidence or information becomes available, the BN can efficiently update node probability distributions, thereby more effectively capturing the dynamic evolution of events. Therefore, BNs are employed in the present study to model relationships among variables and address uncertainties within the system.
Figure 2.
Typical BN structure.
BN is capable of describing the joint probability distribution P(U) over the node set U = {X1, X2, …, Xn} as follow [38]:
where Pa (Xi) denotes the set of parent nodes.
According to Bayes’ theorem, the prior probability of a variable can be updated to the posterior probability upon obtaining new information or evidence E, as expressed in Equation (5):
2.3.2. Fuzzy Set Theory
Once the availability of historical data was limited, it was a challenge to accurately determine the probability values of basic events. In such cases, expert experience can be relied upon to assess the likelihood of event failures through natural language. However, expert judgments are often qualitative, subject to ambiguity, and lacking standardized criteria, making them difficult to directly apply in quantitative analysis. To address this issue, this paper integrates fuzzy set theory to convert expert qualitative assessments into probability values that can be used for quantitative analysis. This approach effectively handles uncertain and imprecise information, providing reliable input for subsequent risk modeling.
To reflect experts’ cognition of event occurrence probabilities and facilitate their judgments, this study introduces seven-level natural linguistic variables for expert evaluation [39,40]. The adopted linguistic variables and their corresponding relationships with fuzzy sets are presented in Table 1. During the evaluation process, the background information of the basic events was first provided to each expert. Considering experts’ own varied educational background, professional position, and experience, specified weight values are accordingly assigned to account for these differences. Trapezoidal fuzzy numbers were applied to defuzzify the collected data thereafter.
Table 1.
Linguistic expressions and numerical representations (adapted from [41]).
To ensure the results are more reasonable, it is necessary to comprehensively process the opinions from experts after obtaining the scores of each evaluation index. For this purpose, the linear opinion pool method was employed for aggregating expert judgments [42], and the corresponding calculation formula is presented as Equation (6):
where Zi denotes the fuzzy aggregation value of basic event i, wj represents the weight assigned to expert j, fij indicates the fuzzy number corresponding to the expert’s opinion, m is the number of basic events, and n is the number of all on-site experts.
After obtaining the expert aggregation results, a trapezoidal fuzzy number is derived. Accordingly, it is essential to convert this trapezoidal fuzzy number into a single probability value to facilitate result analysis and decision-making-a process termed defuzzification. Among various defuzzification methods, the center of area (COA) method is widely adopted due to its simplicity and effectiveness. This paper thus employed the COA method for defuzzification. Specifically, for a trapezoidal fuzzy number Ã= (a1, a2, a3, a4), its defuzzified value can be computed using Equations (7) and (8):
where X∗ corresponds to the fuzzy possibility score FPS, with a and d indicating the lower and upper bounds of the fuzzy number, respectively, and b and c corresponding to its central values.
Through the aforementioned steps, the FPS can be converted into applicable prior probability values to evaluate the relative risk levels of each node. Relevant conversion formulas are provided in Equation (9) [43]:
where K is the probability conversion coefficient.
2.3.3. Inference Analysis
- (1)
- Forward inference
Forward inference refers to predicting the occurrence likelihood of the target node based on the prior probabilities of the root nodes, as detailed in Equation (10) [35]:
where T represents the target node in the risk assessment model, and Tp denotes its p-th state (p = 1, 2, …, k); Xi is the i-th root node (i = 1, 2, …, n), and xj represents its j-th state (j = 1, 2, …, m); P (Xi = xj) signifies the prior probability of the root node Xi being in state xj, while P (T = Tp|Xi = xj) represents the conditional probability of the target node T reaching state Tp given that the root node Xi is in state xj.
- (2)
- Diagnostic inference
Diagnostic inference starts from the known occurrence of the target node, deriving the posterior probability of each root node based on the correlations between nodes, as detailed in Equation (11) [44]:
3. Gas Explosion Accidents Analysis
3.1. Accident Mechanism Analysis
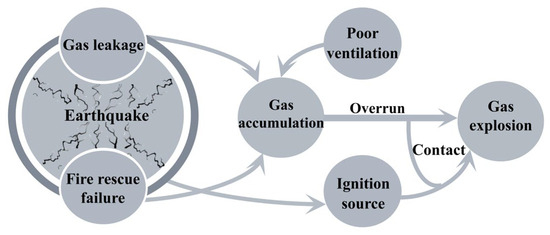
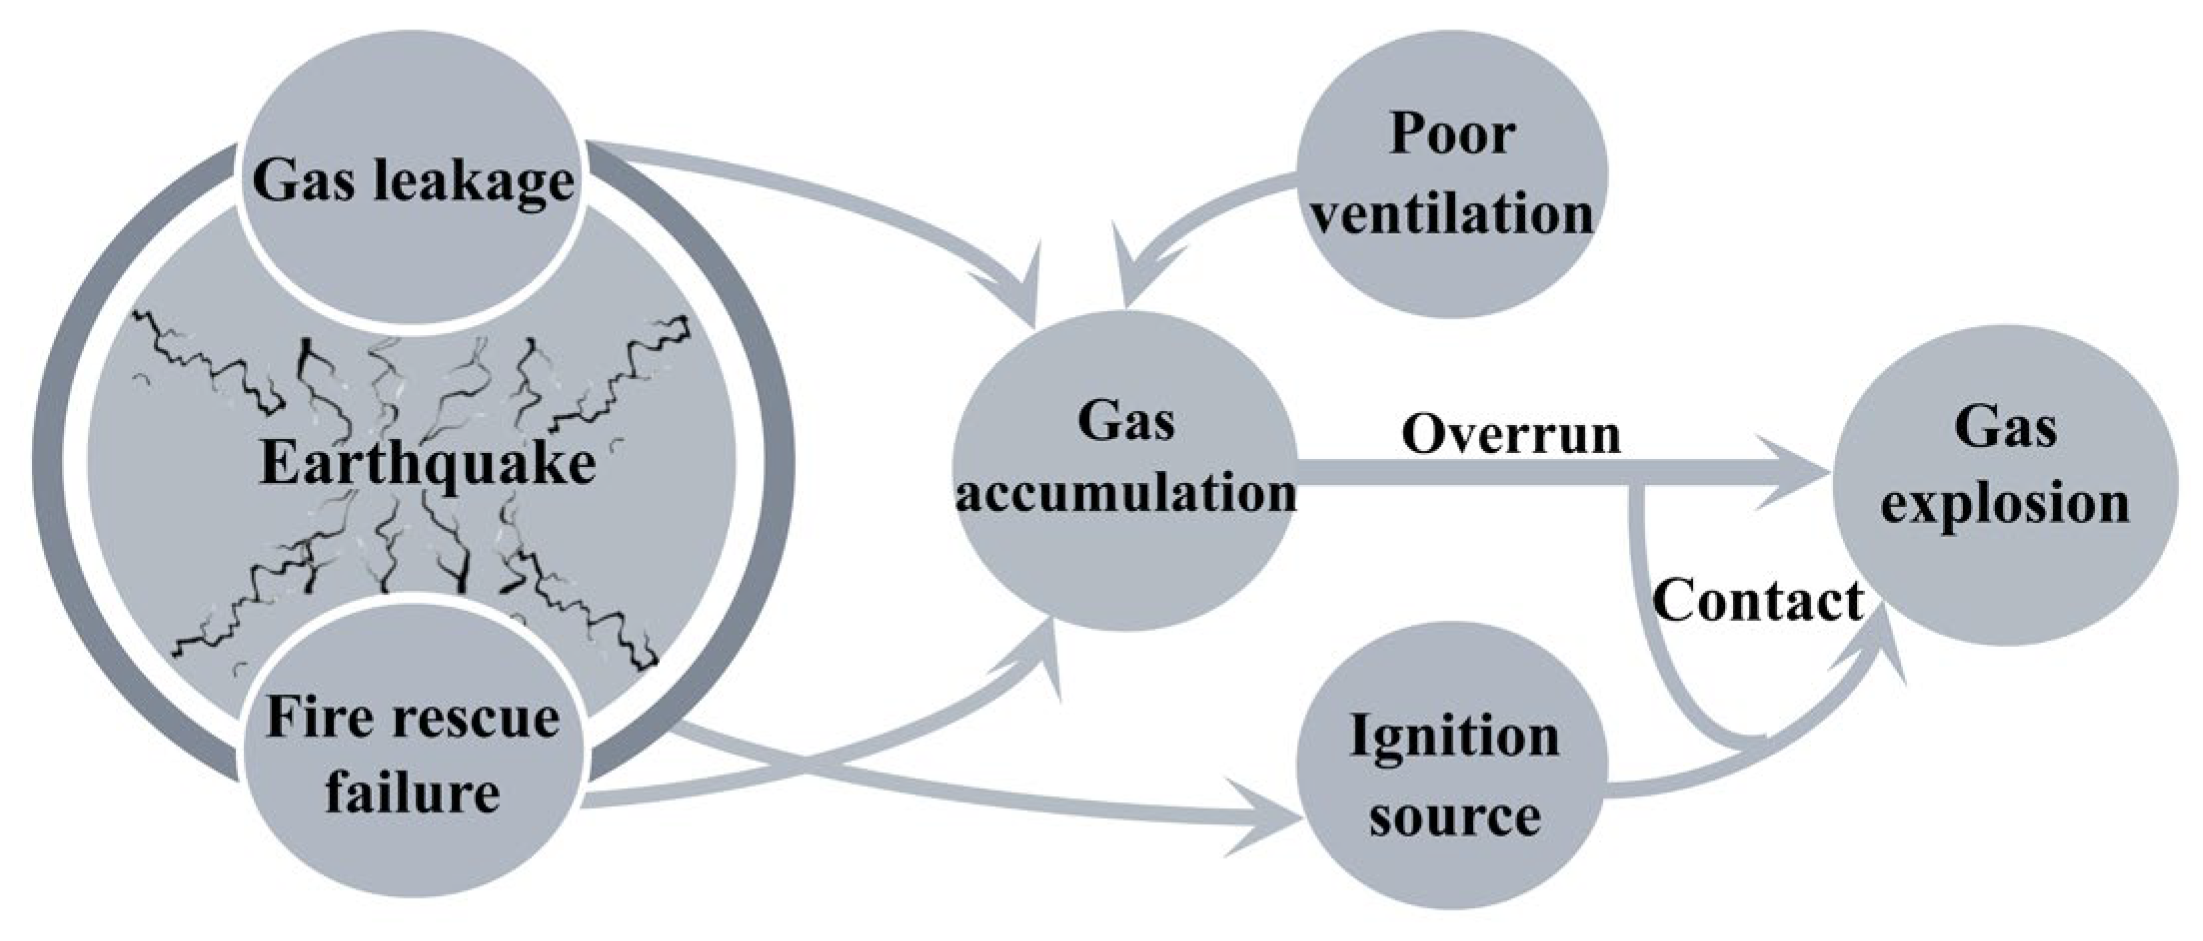
The disaster chain of post-earthquake gas explosions in high-rise buildings is characterized as a typical complex cascading failure process, which is driven by the coupling effects of structural damage, lifeline disruption, and environmental factors. Specifically, buildings and infrastructure (e.g., pipelines and valves) are damaged by seismic activities, thereby elevating the risk of leakage. In the semi-enclosed environment of high-rise buildings, these leakages are further complicated by structural damage, such as wall cracking and ventilation failure, by which the formation of high-concentration gas clouds is facilitated. Furthermore, the rapid deployment of emergency response forces is impeded by the disruption of urban transportation and complex ground conditions (including debris obstruction and secondary fires). If the leakage is not contained within the critical rescue window, gas accumulation is induced, and the explosion risk is significantly increased. Once the state of gas overrun is reached [45], a subsequent explosion can be triggered by any available ignition source. In summary, two prerequisites exist for seismic secondary explosions: (1) gas accumulation to the overrun due to delayed intervention or poor ventilation; and (2) the presence of an ignition source. Figure 3 illustrates this evolutionary process, providing a theoretical basis for preventive strategies.
Figure 3.
Mechanism of post-earthquake indoor gas explosion accidents.
3.2. Disaster Chain Evolution Network Construction
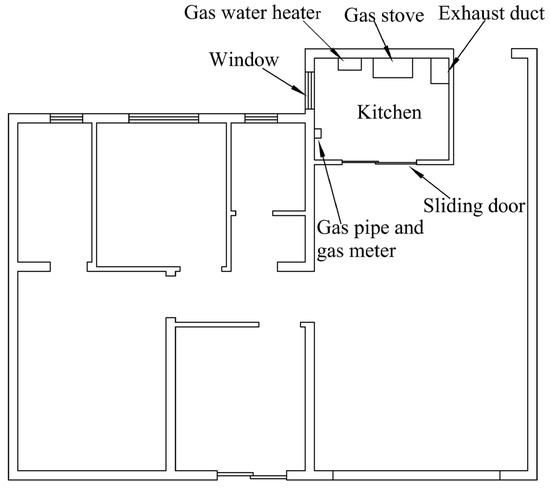
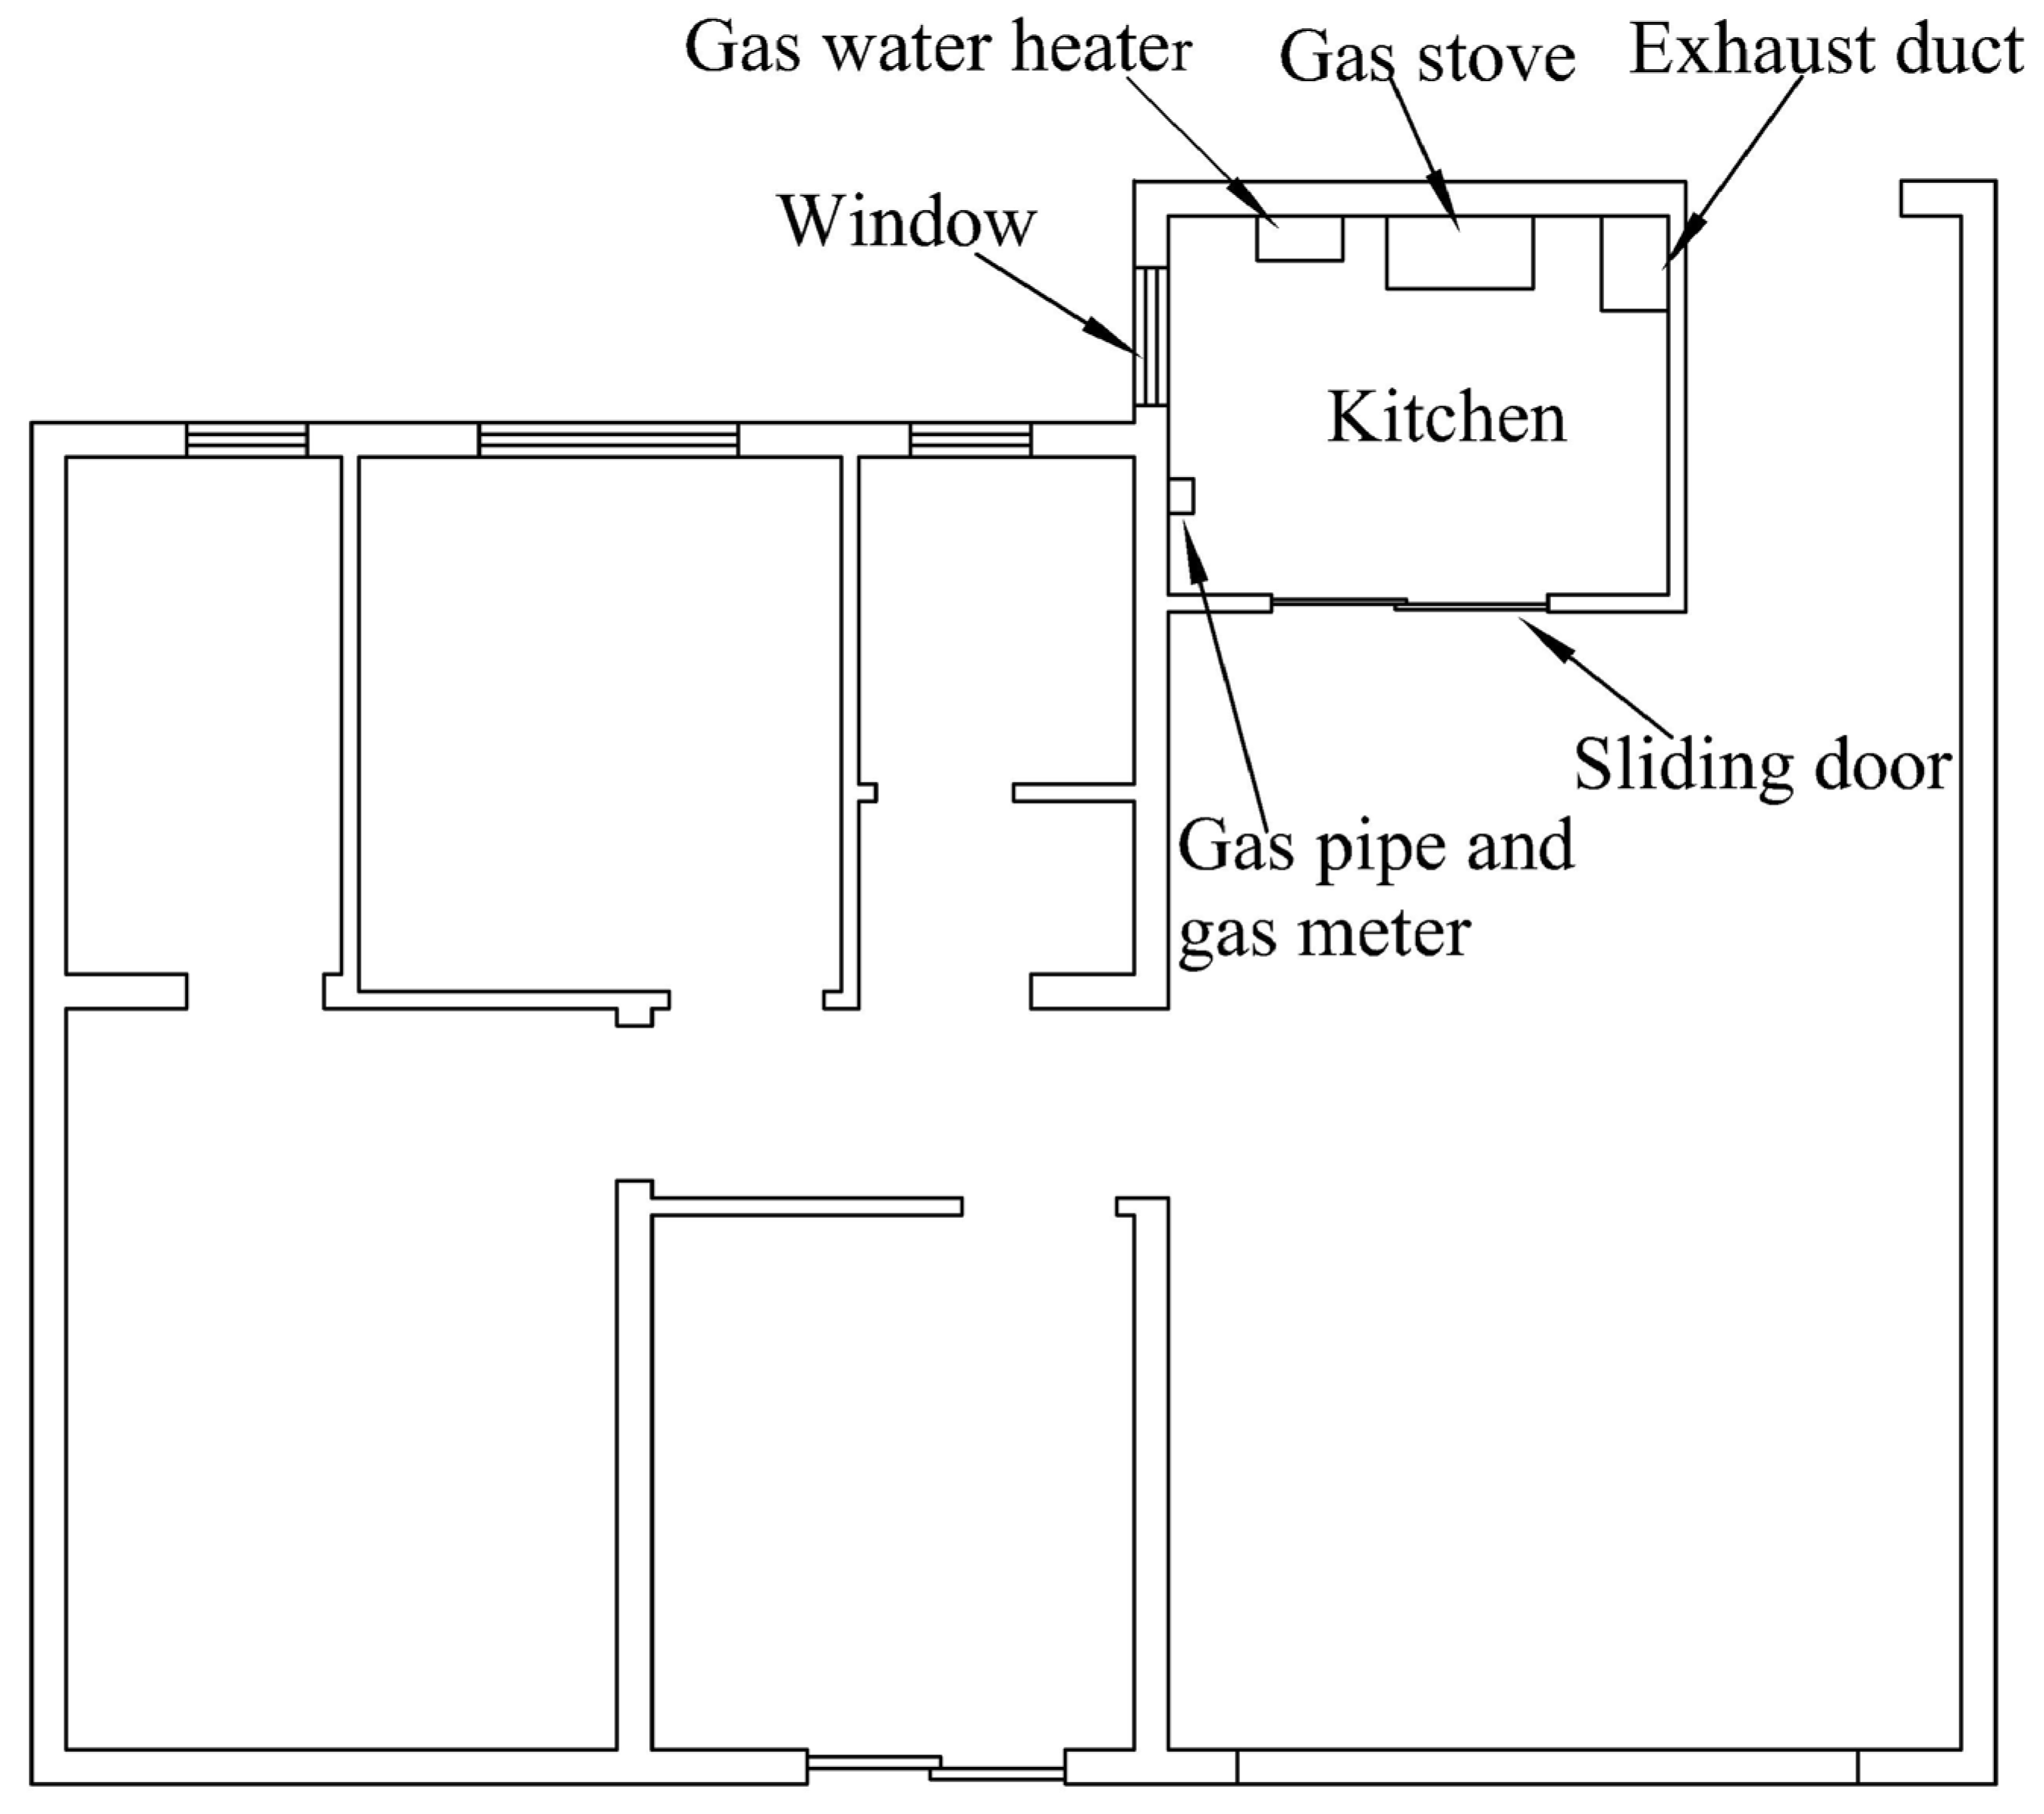
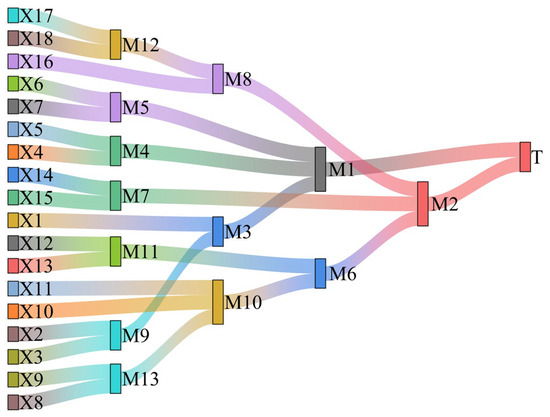
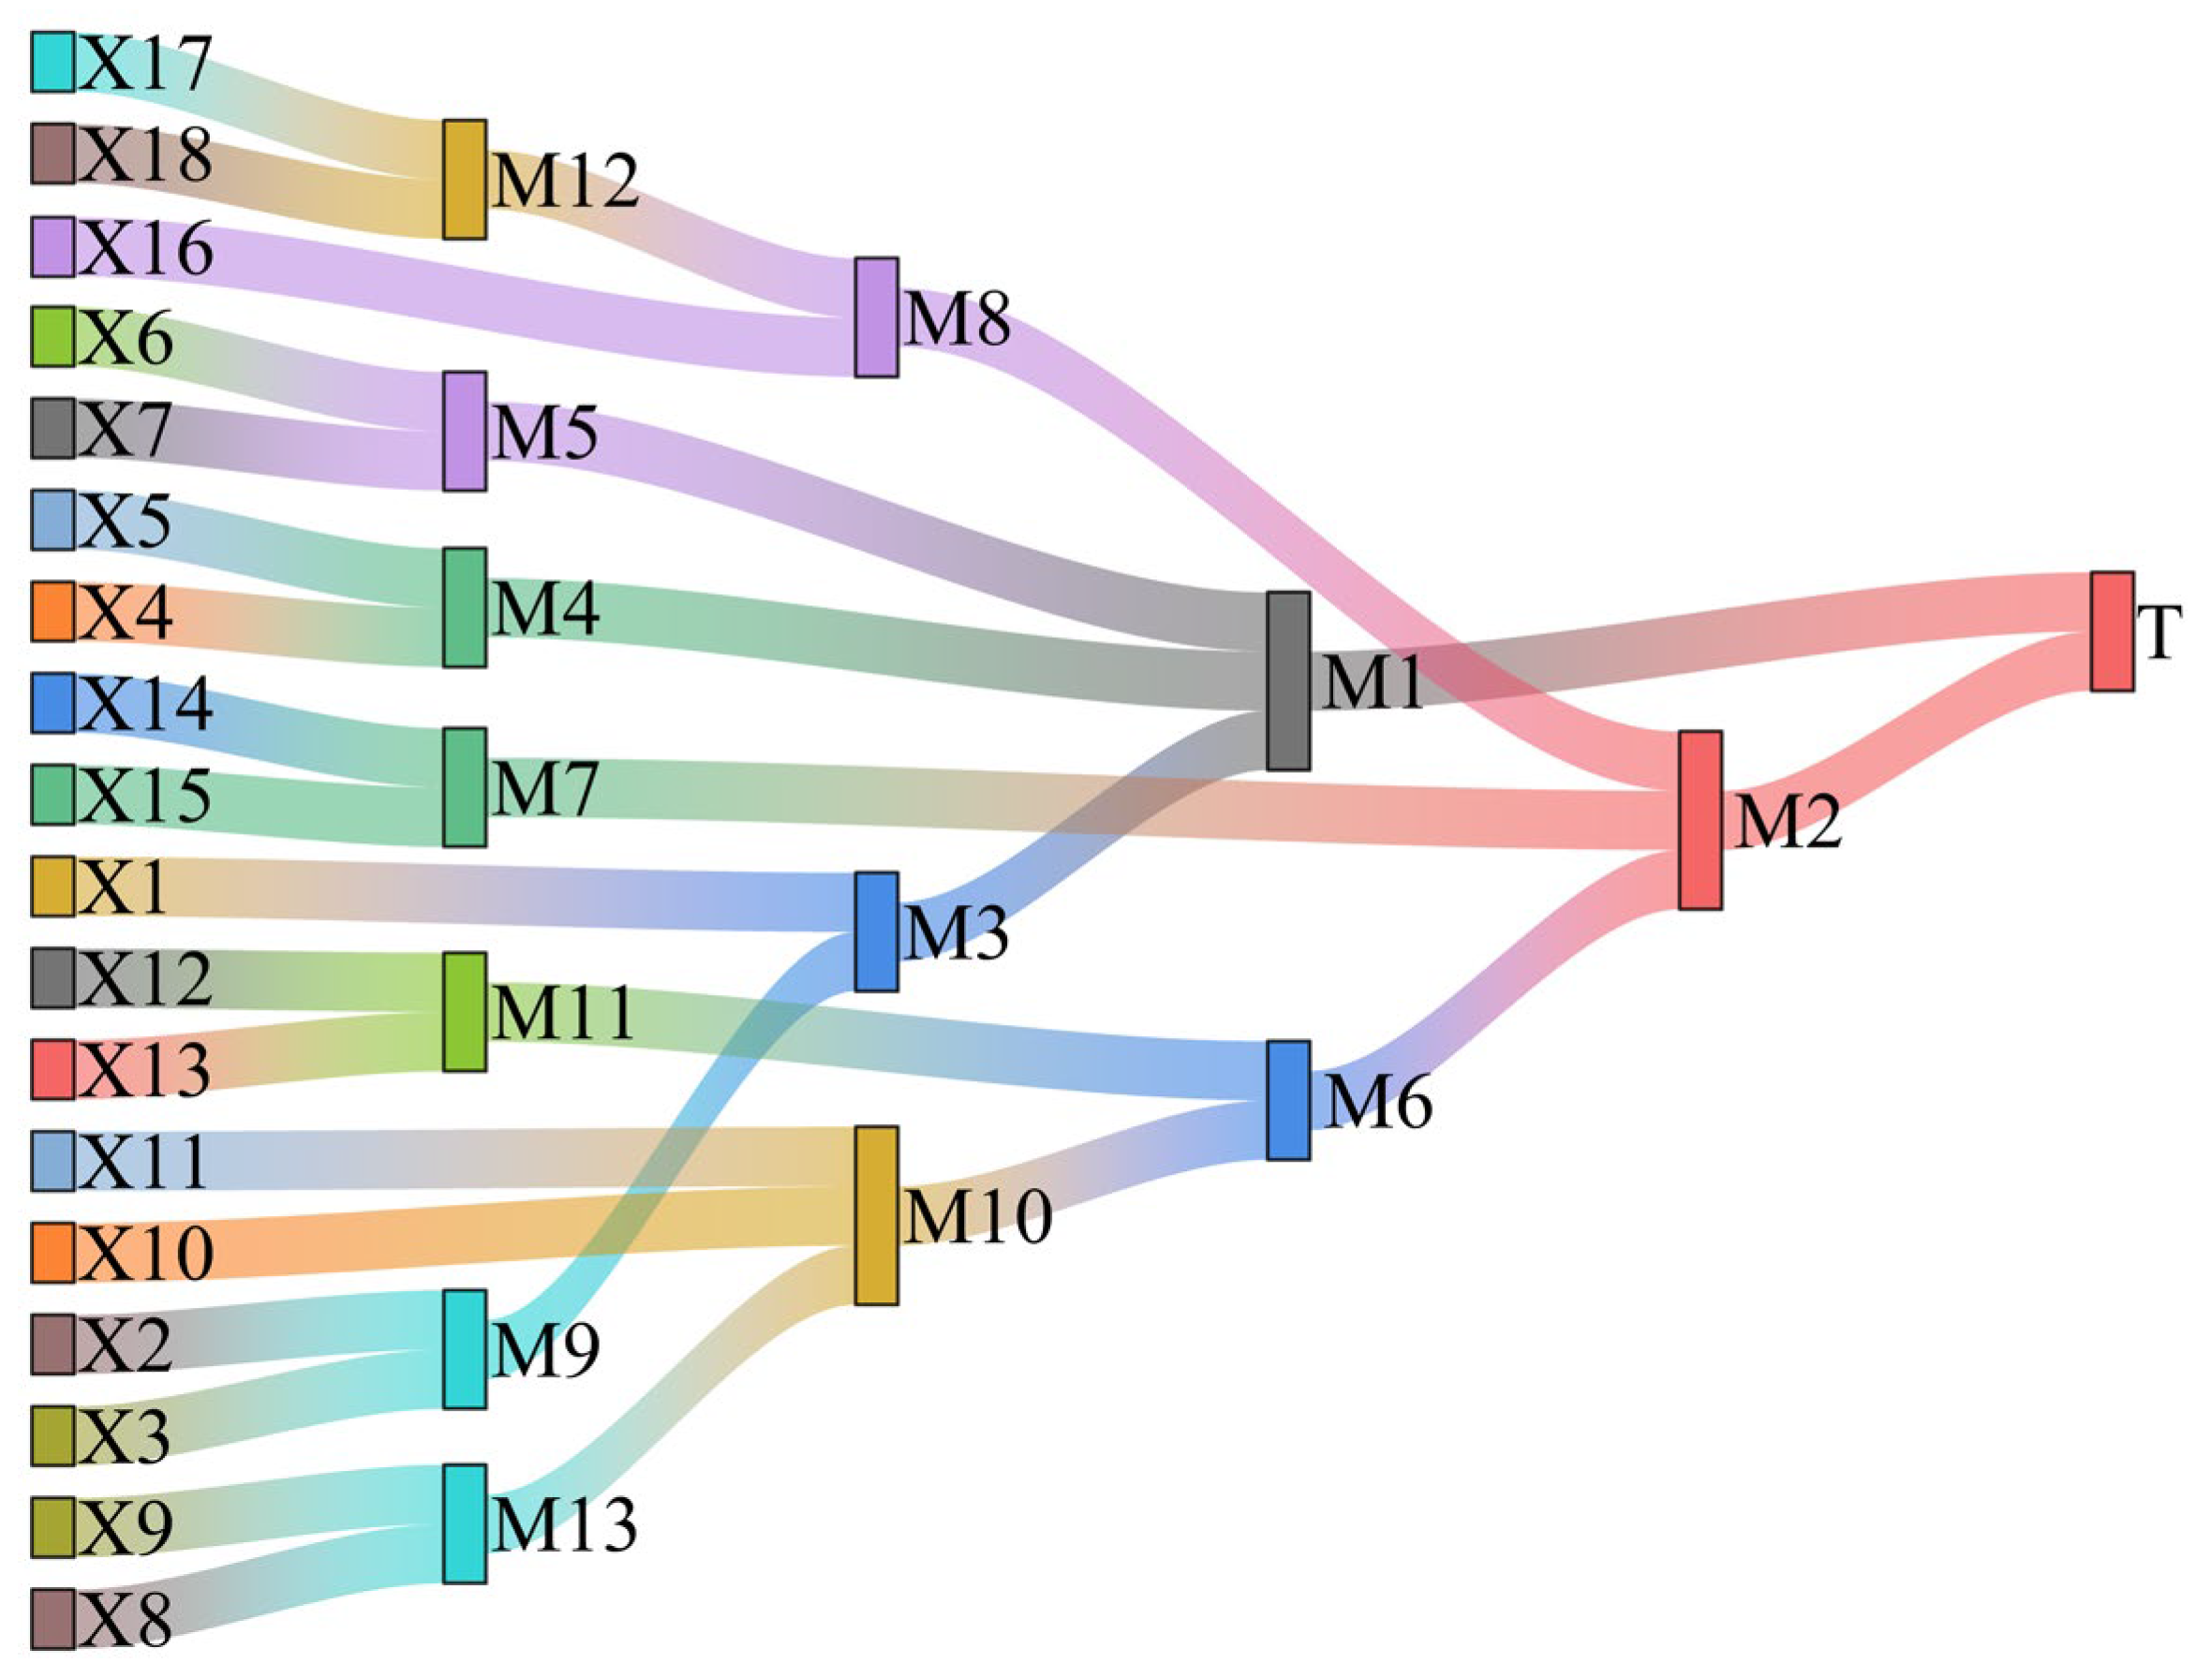
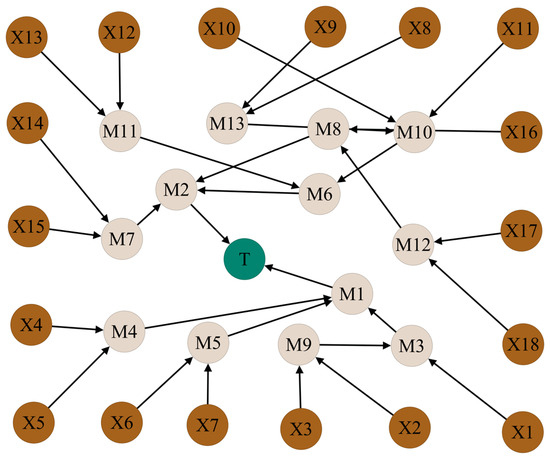
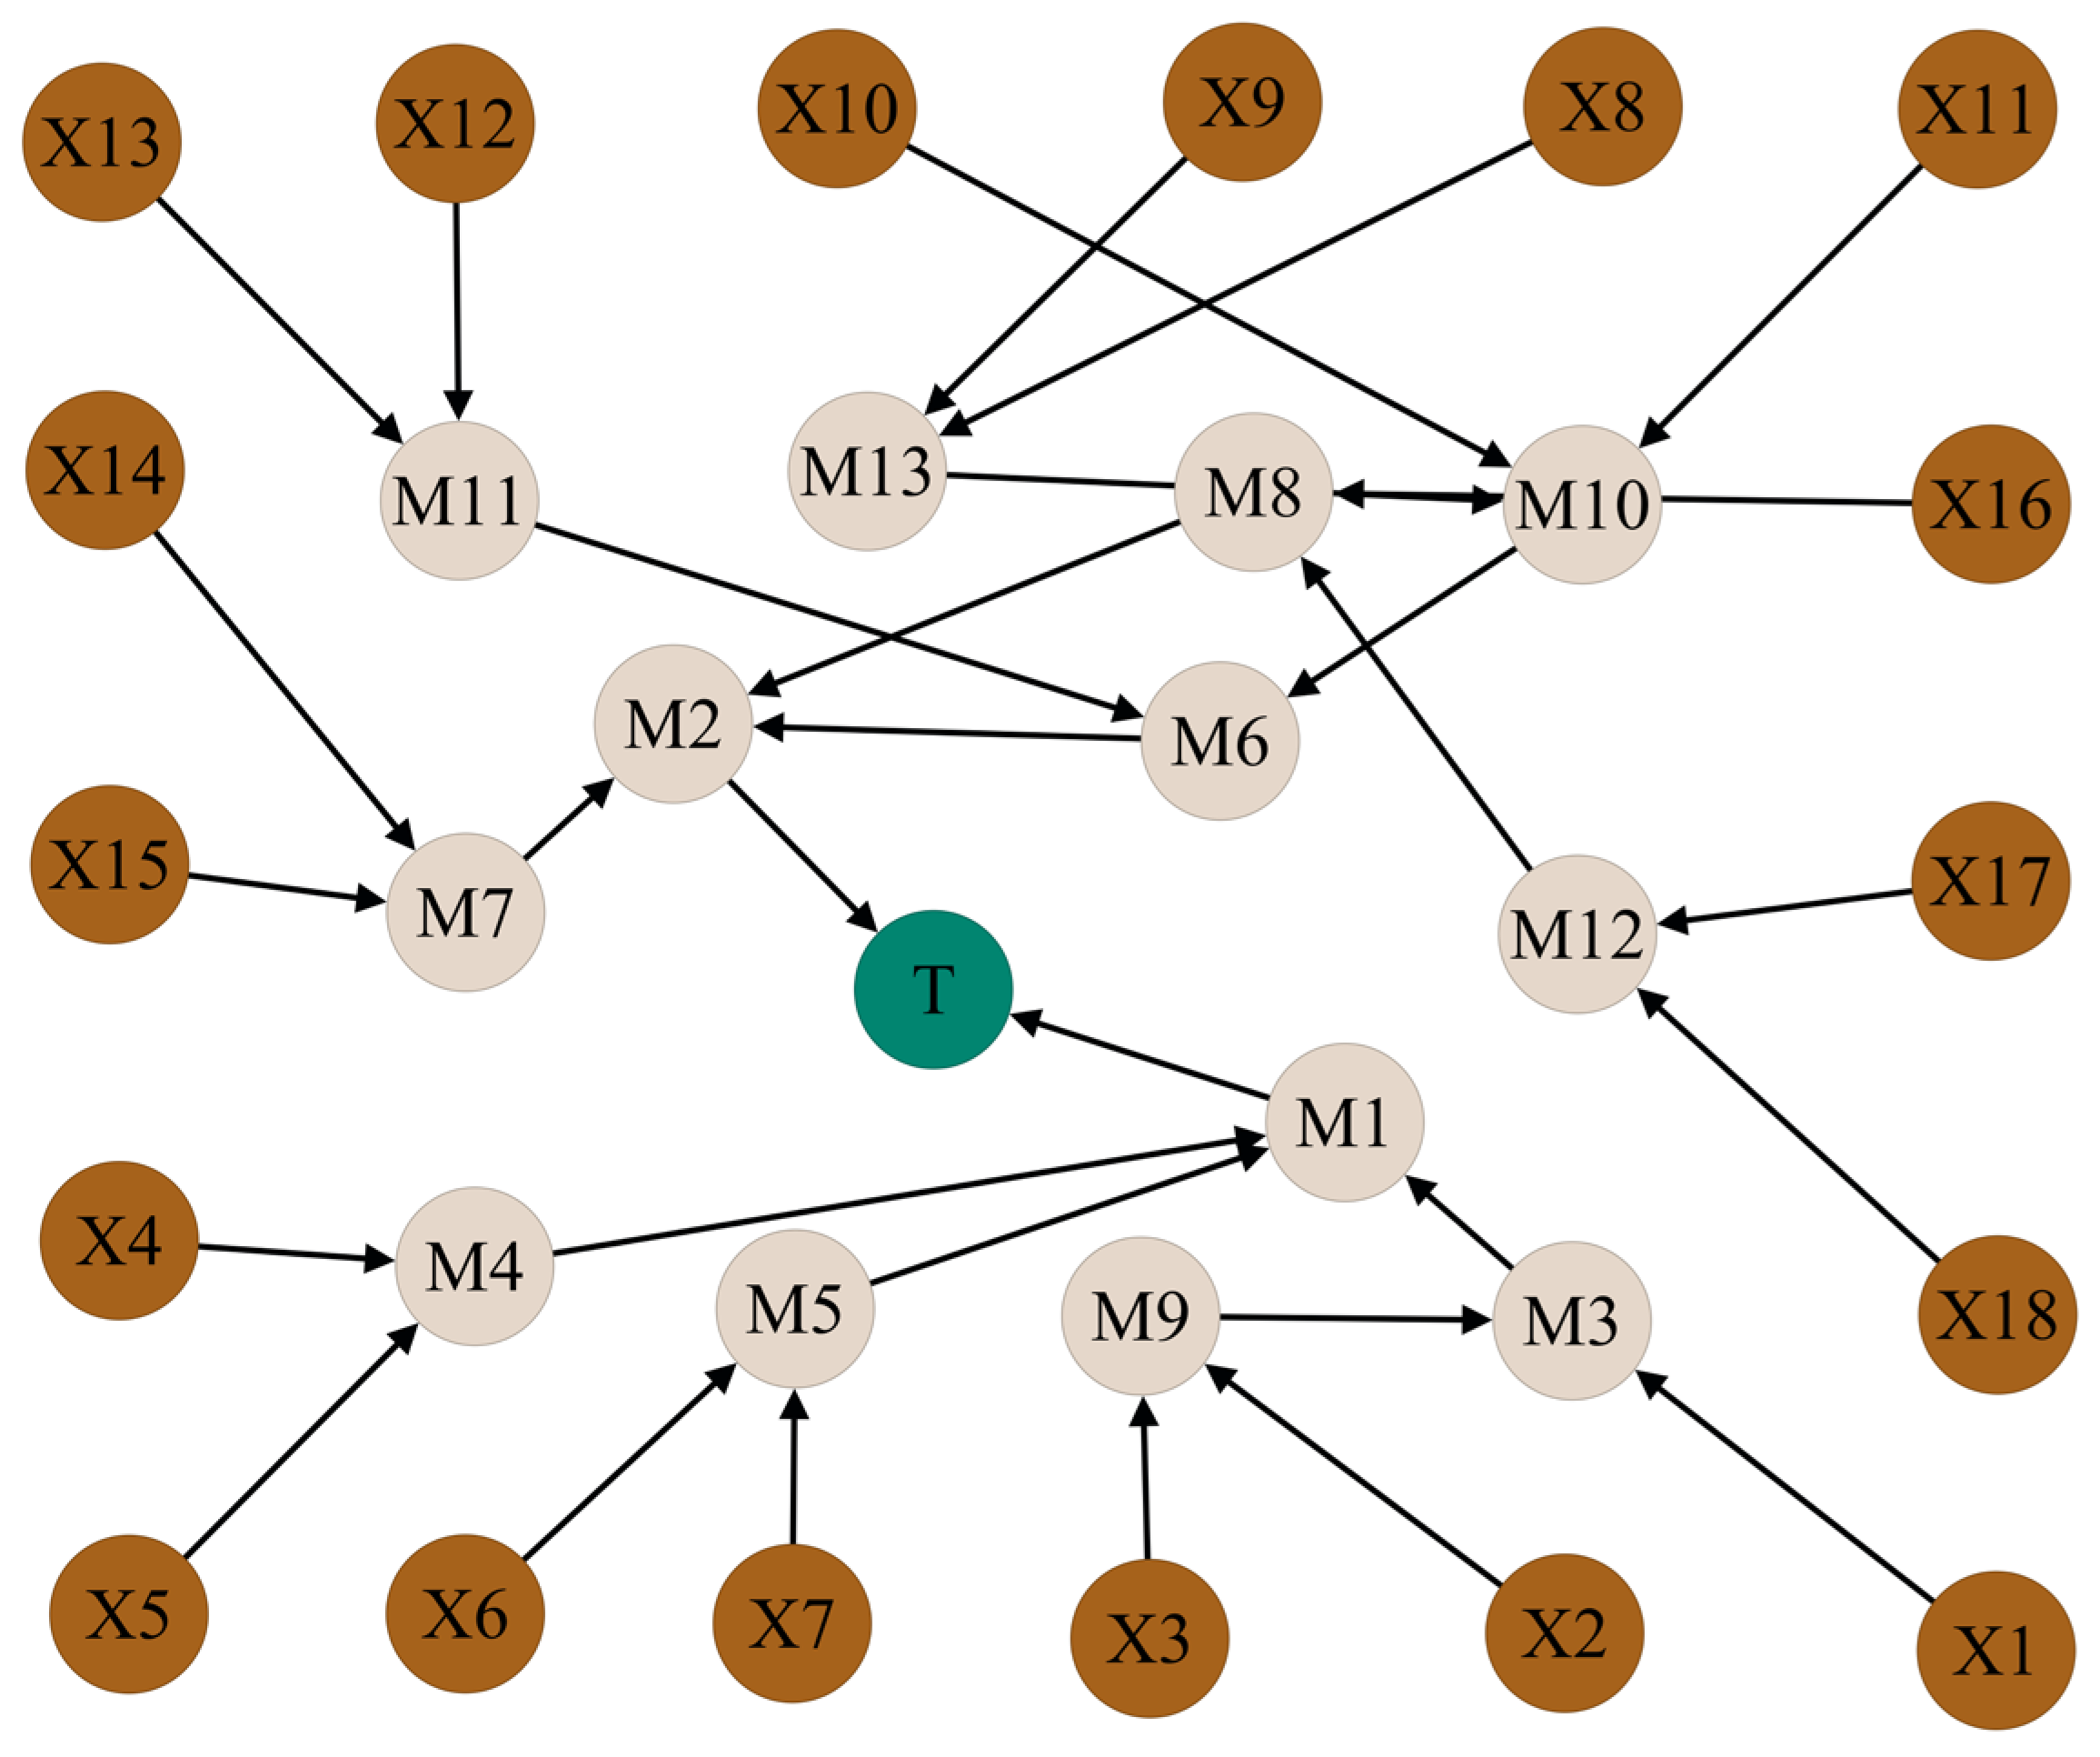
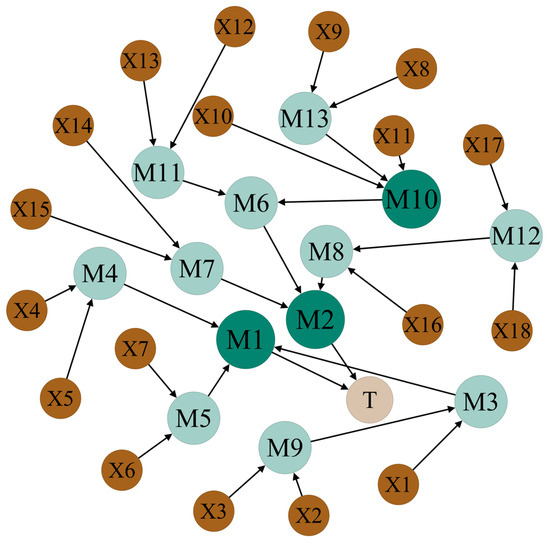
In this section, the proposed method is applied to a typical high-rise residential building. As shown in Figure 4, the floor plan illustrates the functional layout of the residential unit and the locations of gas-related facilities. It is assumed that a rare earthquake occurs in the area during the daytime, resulting in severe damage to the water-supply and power systems, as well as widespread disruption of the communication system. The oxygen volume fraction in air is approximately 21% [46], which is substantially higher than the limiting oxygen concentration for methane flame propagation, approximately 10.7–12.0% [47]. Therefore, the oxygen condition was considered to be satisfied, and the analysis focused on gas overrun and ignition sources. To establish a comprehensive risk evaluation framework, a total of 31 risk events were identified through an in-depth analysis of historical earthquake disaster reports, an extensive literature review, and consultations with domain experts. These causal factors encompass multiple dimensions, including structural damage, lifeline disruption, and emergency response delays, which are detailed in Table 2. The hazard propagation process comprises two primary branches: gas overrun (M2) and ignition-source formation (M1). Along the M2 branch, seismic loading may exacerbate damage to pipelines affected by aging and corrosion (X8) or induce local deformation or loosening of pipelines (X9), thereby causing pipeline gas leakage (M13). As gas pipelines, gas meters, and gas hoses are all components of gas facilities, M13, leakage caused by physical damage to gas meters (X10), or leakage resulting from gas hose off (X11) may give rise to leakage from gas facilities (M10). M10 or user unsafe behavior (M11) may subsequently trigger gas leakage (M6). In addition, restricted natural ventilation in the kitchen (X14), or an exhaust fan that is not activated or is damaged (X15), may result in poor ventilation (M7). Regarding emergency response, road traffic disruption (X17) or alarm receipt delay (X18) may result in failure to arrive in a timely manner (M12), whereas M12 or inappropriate on-site disposal (X16) may further lead to fire-rescue failure (M8). Collectively, M6, M7, and M8 may promote gas accumulation, ultimately leading to M2. Along the other branch, electrical sparks (M3), mechanical sparks (M4), or other sparks (M5) may give rise to M1. When M2 and M1 coexist, an indoor gas explosion (T) may occur. Accordingly, the topological disaster chain of gas explosions was constructed to demonstrate the complex logical relationships among these causal factors, as shown in Figure 5.
Figure 4.
Typical residential unit layout.
Table 2.
Nodes of the gas explosion disaster chain.
Figure 5.
Topology diagram of gas explosion disaster chain evolution network.
3.3. Bayesian Network Construction
Based on the constructed gas explosion disaster chain, combined with its evolutionary characteristics and logical dependencies, it was mapped into the topology of a BN, as shown in Figure 6.
Figure 6.
The BN model of indoor gas explosion accidents.
3.3.1. Prior Probability
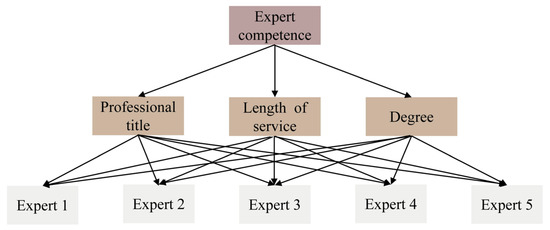
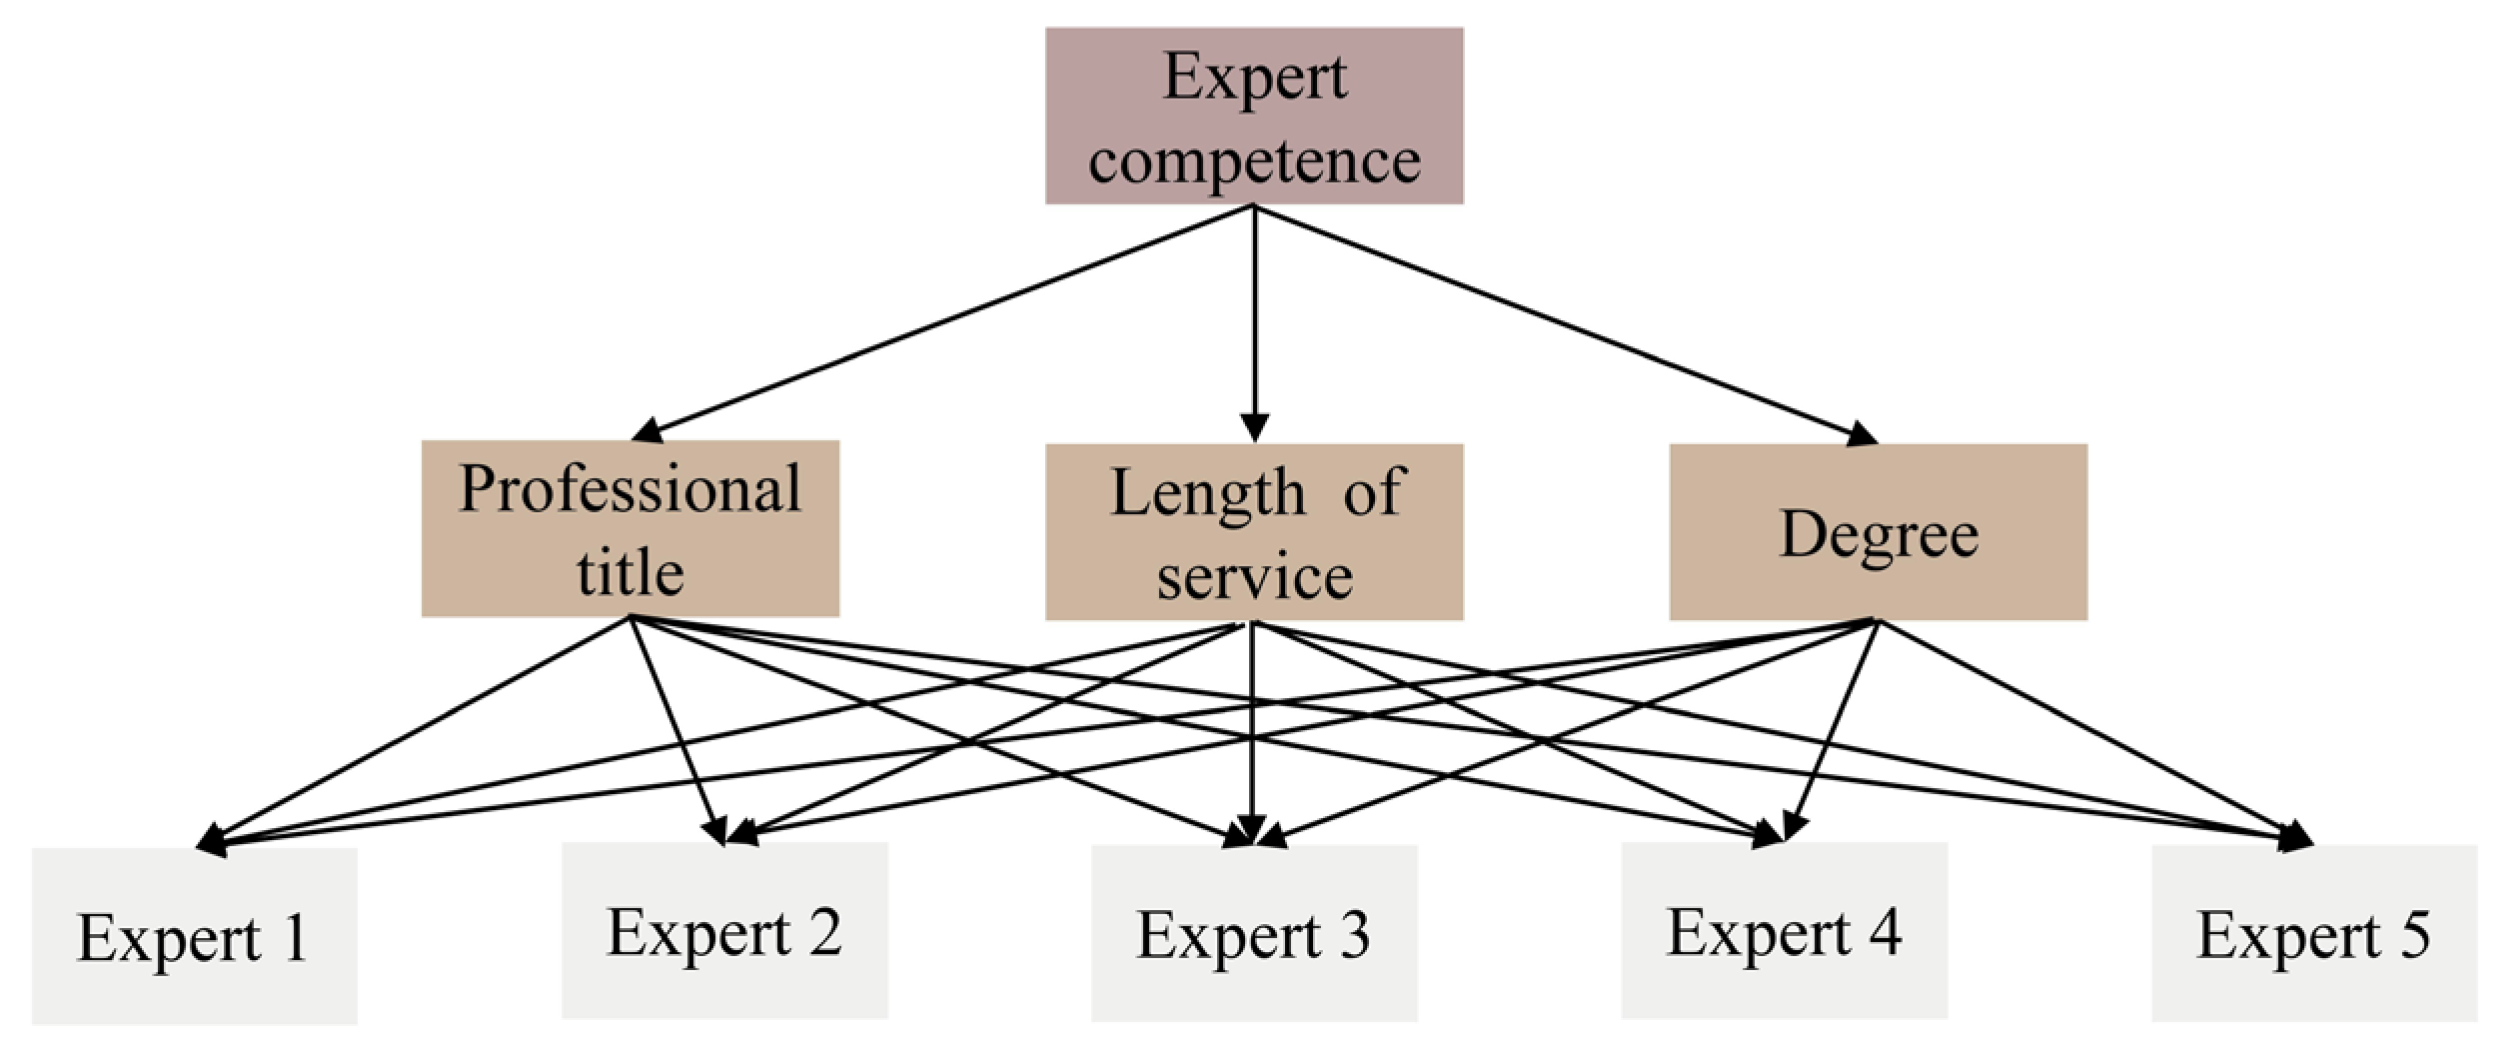
There were five domain experts invited to assess the prior probabilities of risks for the root nodes of the BN. Basic information of these experts is presented in Table 3. Considering the inherent differences in their professional and technical backgrounds, to obtain fair and reasonable evaluation results, it is essential to assign appropriate evaluation weights based on their respective competencies. It is determined through the application of the analytic hierarchy process method, which was proposed by Saaty [48]. The implementation of this approach involves three key steps. Firstly, a hierarchical structure model is established. Indicators such as professional title, length of service, and educational background were selected to construct an expert capability indicator system, as illustrated in Figure 7.
Table 3.
Information of the evaluation experts.
Figure 7.
The indicator system of expert capabilities.
Secondly, the 1–9 scale method [49] was employed to construct the judgment matrix A as illustrated in Table 4, Table 5, Table 6 and Table 7. The specific procedure involves conducting pairwise comparisons of the attributes. Subsequently, given that the judgment matrix is influenced by human subjective factors and thus difficult to achieve complete consistency, a consistency check is required to verify its credibility, with the specific calculation performed using Equation (12).
where CI is the consistency index, RI is the random index, and CR is the consistency ratio.
Table 4.
Pairwise comparison matrix for the criterion layer.
Table 5.
Pairwise comparison matrix of experts based on professional titles.
Table 6.
Pairwise comparison matrix of experts based on length of service.
Table 7.
Pairwise comparison matrix of experts based on degrees.
The consistency ratios (CRs) of all matrices were less than 0.1 according to the calculation results, indicating that the matrices satisfied the consistency requirements. Based on these results, the final expert evaluation weights are presented in Table 8. To illustrate the conversion procedure, X1 is used as an example. The five experts assigned linguistic judgments of MH, MH, H, H, and VH, respectively, which correspond to the trapezoidal fuzzy numbers listed in Table 1. Using the expert weights reported in Table 8, these judgments were aggregated according to Equation (6), yielding ZX1 = (0.5753, 0.6753, 0.7474, 0.8409). Equation (8) was then applied to defuzzify ZX1, giving X* = 0.7094. This value was subsequently substituted into Equation (9) to calculate the probability conversion coefficient K and the corresponding fuzzy probability FP = 0.0195. The same procedure was applied to the other root nodes, and the results are summarized in Table 9.
Table 8.
Evaluation weights of the experts.
Table 9.
Expert judgment and fuzzy probability of basic events.
3.3.2. Conditional Probability Tables
Following the assignment of prior probabilities to root nodes, it is essential to define the probabilistic dependence relationships among nodes. These relationships were quantified using conditional probability tables. In BN models, the logical relationships between most intermediate nodes and their parent nodes are typically represented by referencing the “AND” and “OR” logic gates common in fault tree analysis. However, in real scenarios, even if all parent conditions are satisfied, the child node may not necessarily occur. Conversely, the child event may still occur even if all conditions are not fully satisfied. Therefore, the conditional probability tables for such nodes are generally constructed based on historical accident data or expert assessments.
To address this issue, the five experts were invited to complete the questionnaire again. Furthermore, Cronbach’s coefficient alpha consistency test was conducted to verify the consistency of evaluations among multiple experts and reduce the influence of subjective biases. If α > 0.7, the data are considered acceptable. The relevant calculation formula is as follows.
where α represents Cronbach’s alpha used for consistency reliability testing, K denotes the number of different scenario combinations in the questionnaire, σ2X represents the variance of the total scores across all scenario combinations, and σ2Y refers to the variance of a single scenario combination.
In this study, the CPTs of the intermediate nodes with clear logical relationships were constructed using fixed AND/OR gate logic according to the causal relationships in the disaster-chain network. Specifically, nodes M1, M3–M6, and M8–M13 were represented by OR gates, whereas node M2 was represented by an AND gate. By contrast, the relationship between M7 and its parent nodes was more uncertain and could not be simply represented by deterministic logic. Therefore, the conditional probability table for node M7 was derived from expert evaluation results, as detailed in Table 10. Calculations using Equation (13) yielded a Cronbach’s coefficient alpha of 0.777, indicating reliable data. The weighted average results in Table 10 were adopted as the final input conditional probability values for the BN.
Table 10.
Modified conditional probability table for poor ventilation node.
4. Results and Discussion
4.1. Bayesian Network Analysis
4.1.1. Forward Inference
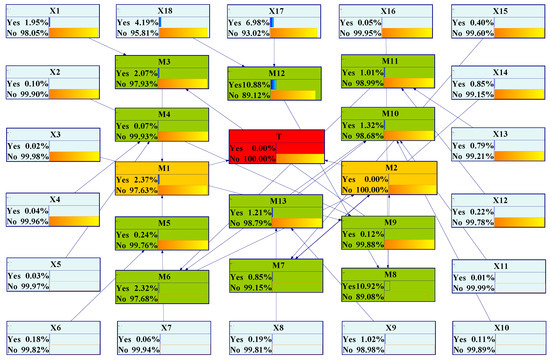
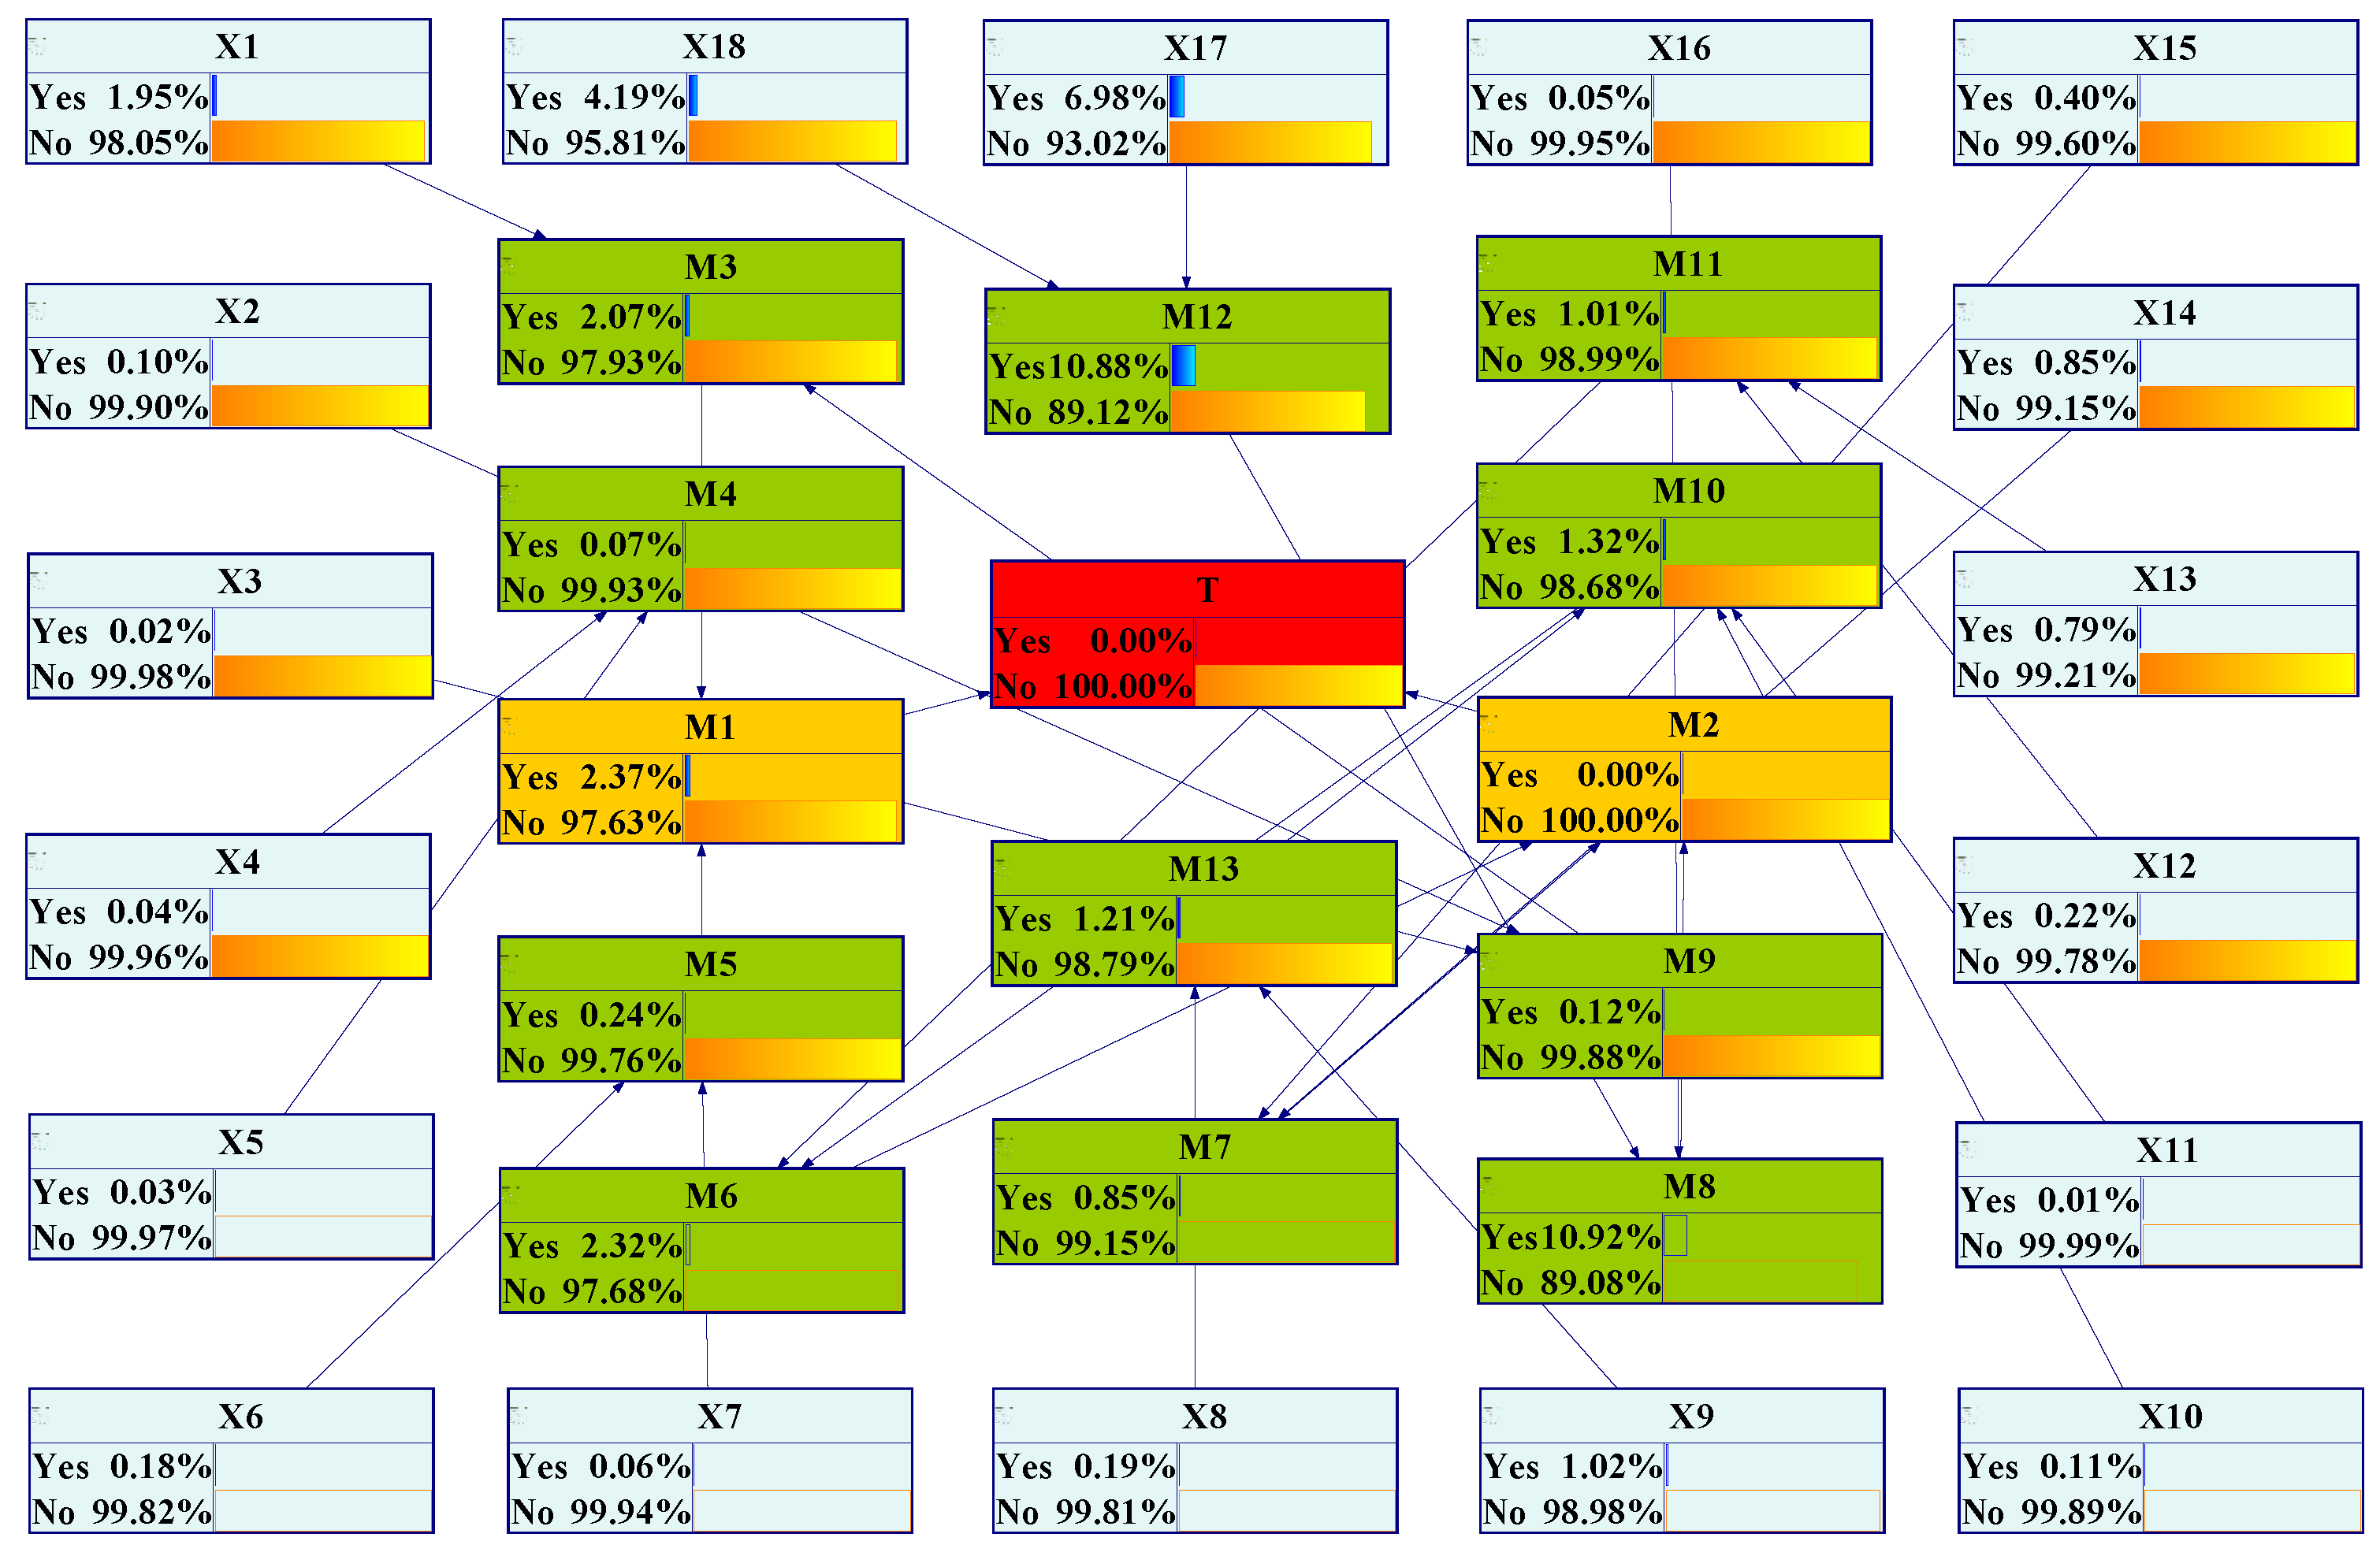
In the pre-event stage, promptly understanding the probability of an accident enables managers to immediately implement necessary preventive measures, thereby reducing the risk of disasters. Based on the gas explosion BN model constructed in Section 3.3, probabilistic inference was performed using GeNIe software (version 4.0). Each node in the applied model was defined in a binary format: “yes” (indicating the event occurs) or “no” (indicating the event does not occur), with the specific results presented in Figure 8. It should be noted that fuzzy probability is determined based on the comparison of various risk factors. It only reflects the relative magnitude of the occurrence probability of each risk factor rather than their specific values. Therefore, independent analysis of the fuzzy probability of a single node in the Bayesian network is not advisable. In this sense, the posterior probability comparisons in Figure 9 and Figure 10 are used for risk diagnosis and key factor identification based on their relative magnitudes, rather than for interpreting each node probability as an absolute occurrence probability.
Figure 8.
BN probabilistic inference results.
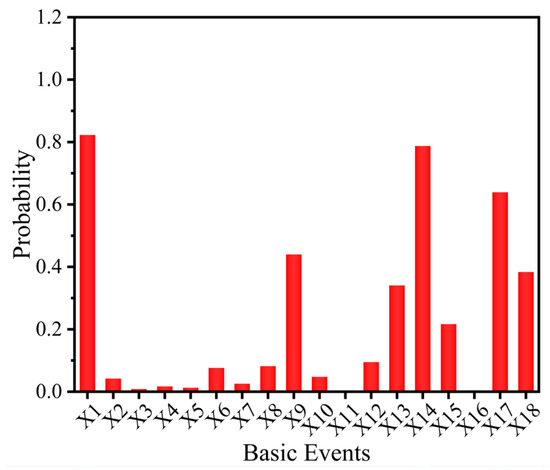
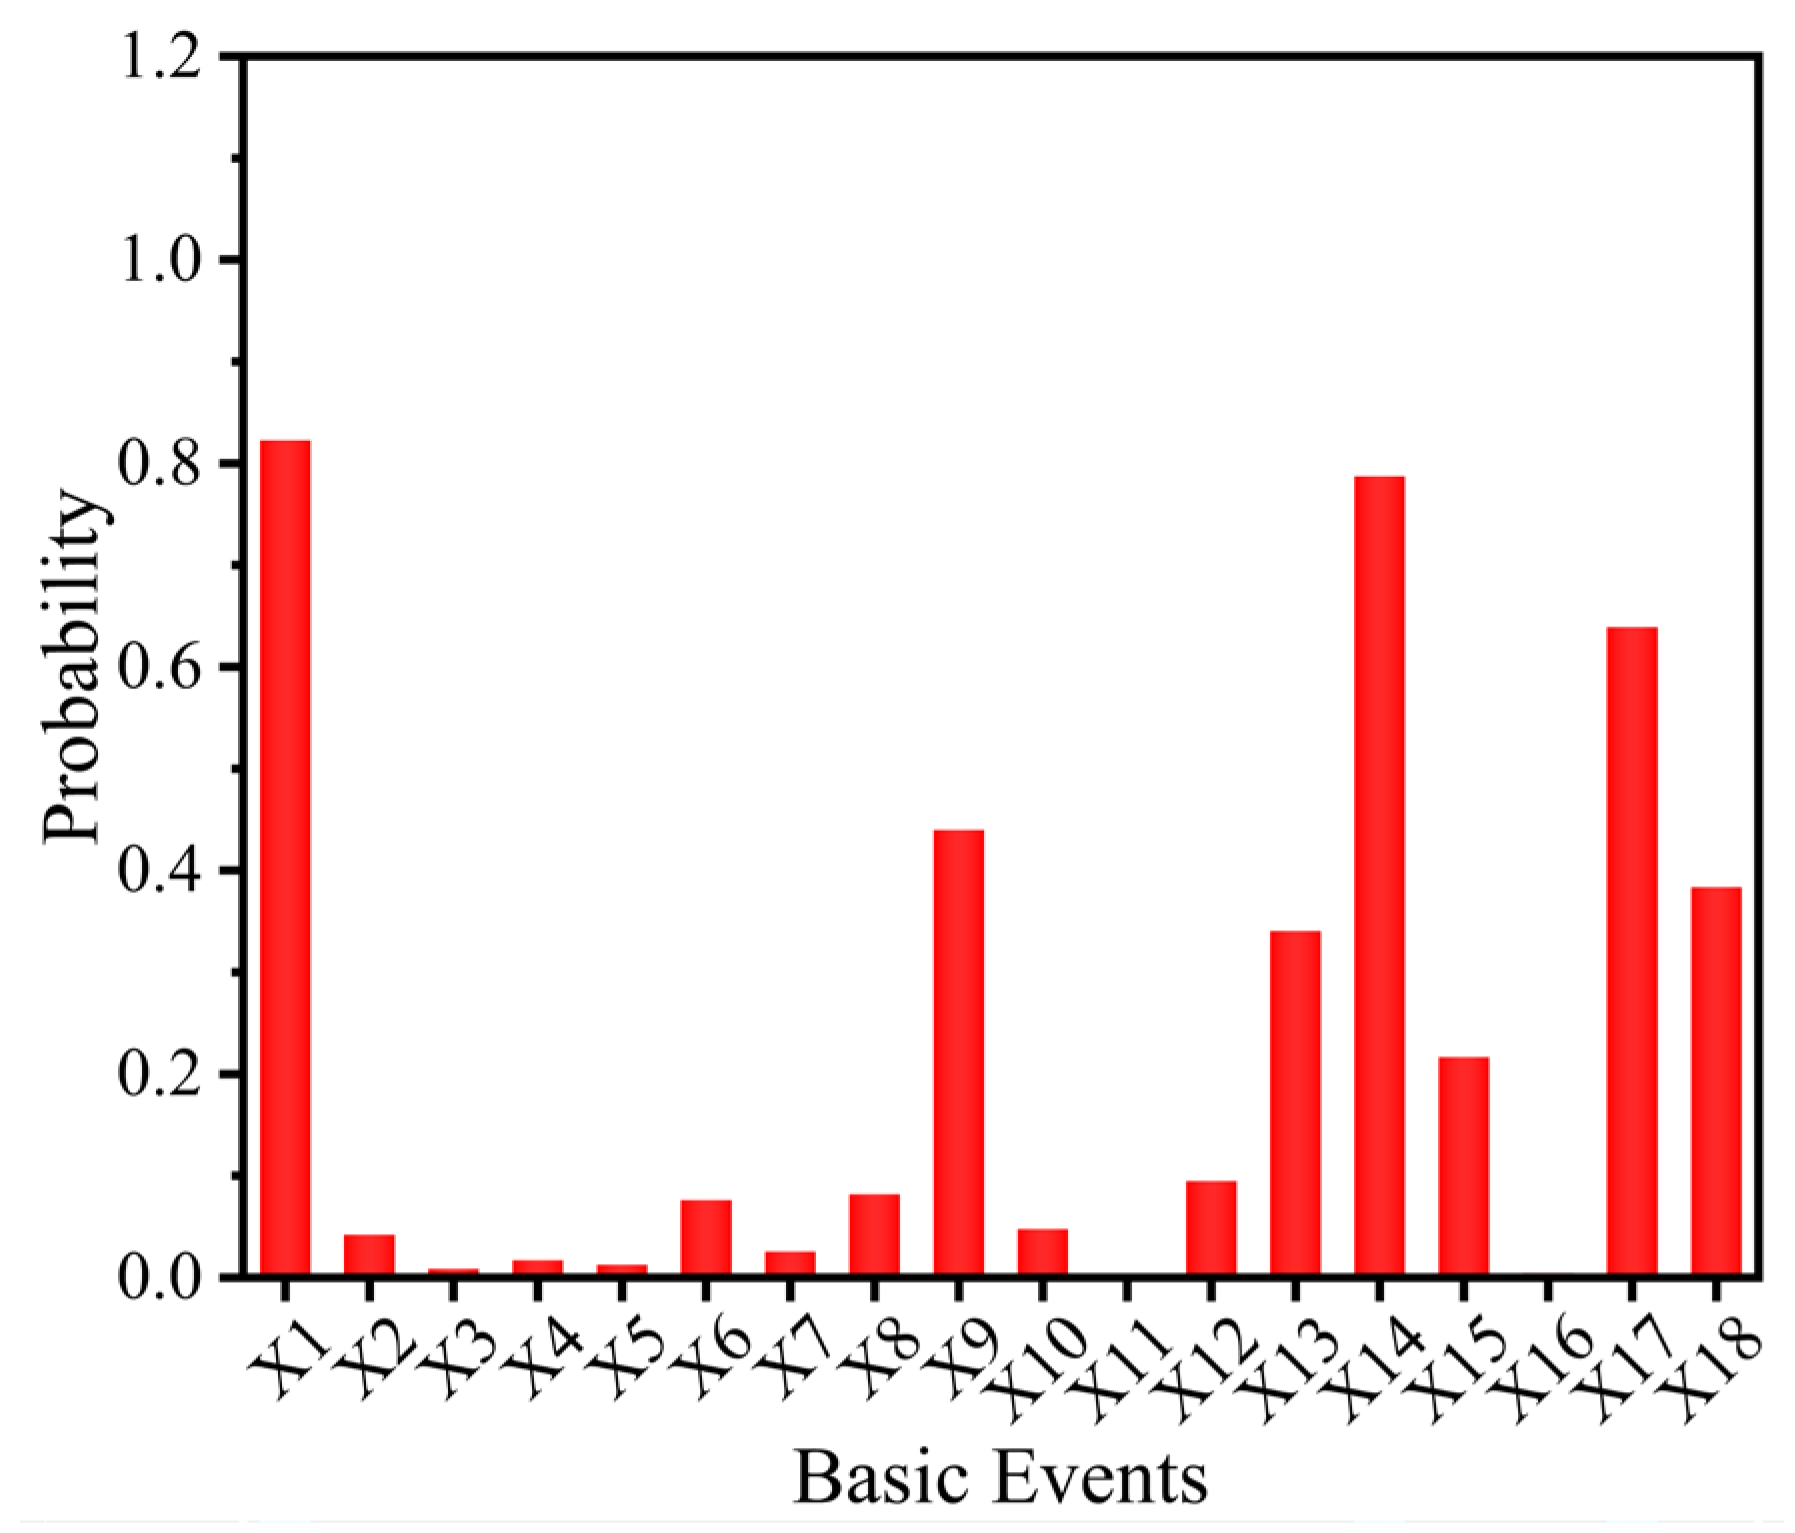
Figure 9.
Posterior probability distributions of relevant factors under gas explosion accidents.
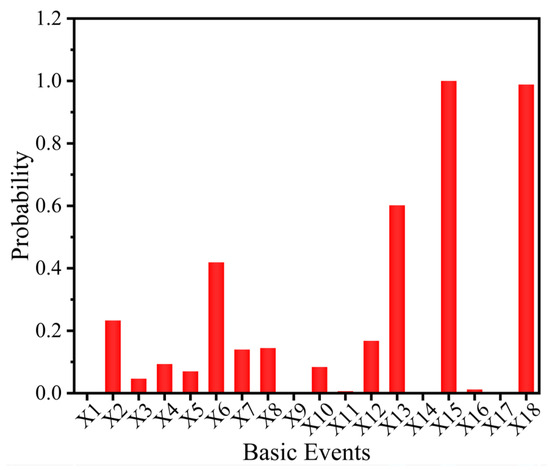
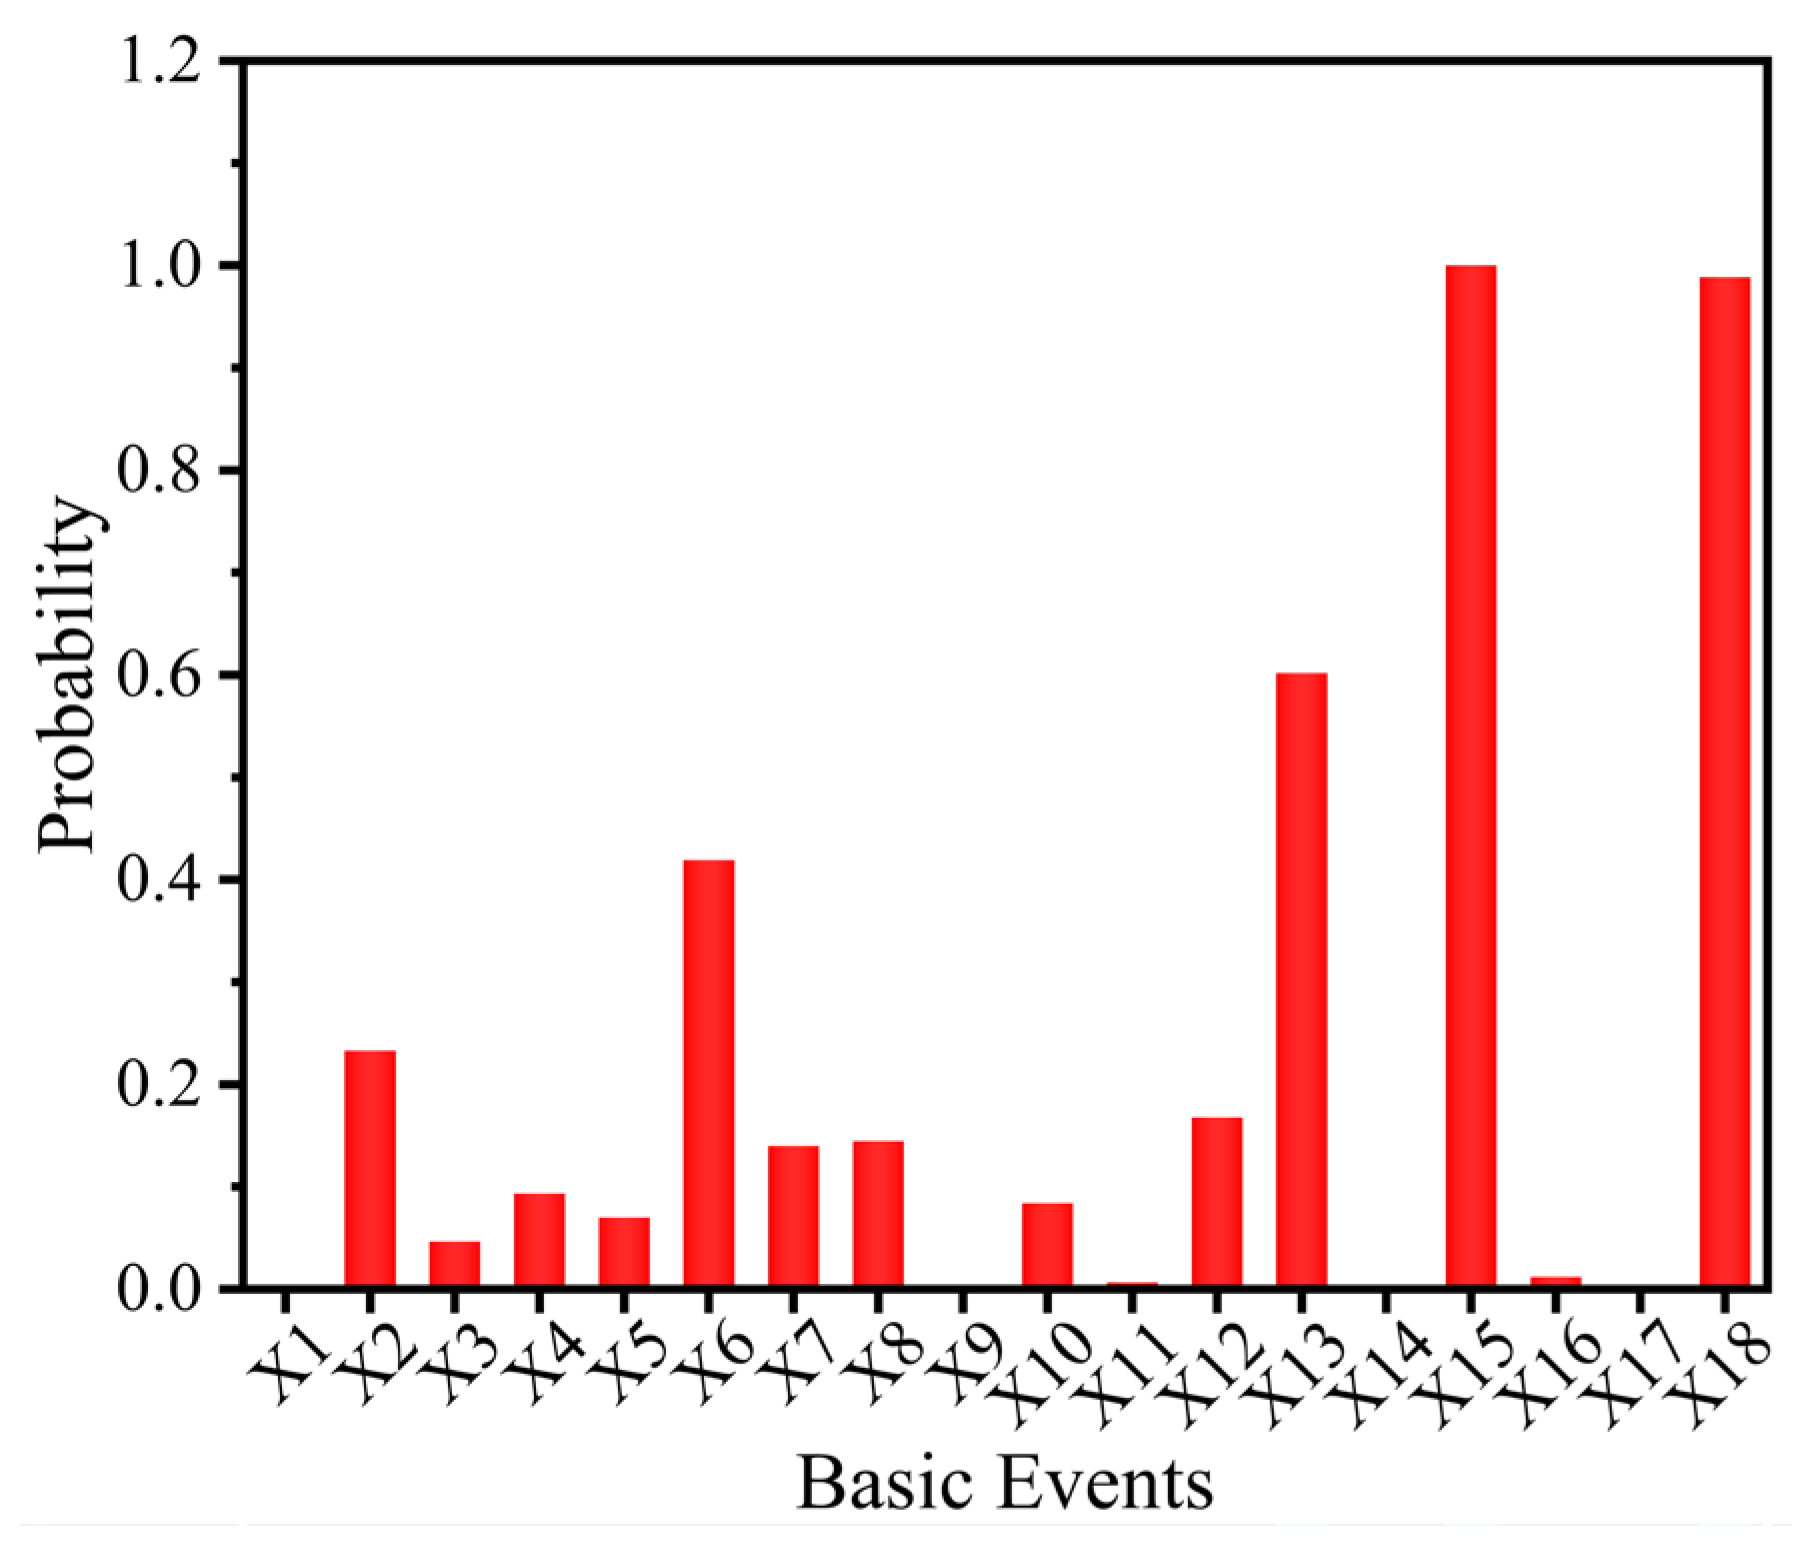
Figure 10.
Posterior probability distributions of nodes under the evidence of X1, X14, X17 and X9.
In Figure 8, the gas explosion event is directly caused by the ignition source (M1) and the gas overrun(M2). The ignition source is triggered by electric sparks (M3), mechanical sparks (M4), and other sparks (M5). The gas overrun occurs due to gas leakage (M6), poor ventilation (M7), and fire rescue failure(M8). Among the six intermediate events, the occurrence probability values of M8, M6, and M3 are higher than those of the other three intermediate events, indicating that their impact on the top event is more significant. Based on causal inference methods, an initial assessment of the risk status can still be conducted even in the absence of measured data after accidents occur, thereby supporting the development of scientific and effective prevention and control strategies.
4.1.2. Diagnostic Inference
The core of diagnostic inference involves identifying the key basic events that are most likely to trigger the target event by calculating the posterior probability distribution of the root node states under the specified evidence nodes (i.e., the observed states associated with the target event).
It is assumed that a gas explosion accident has occurred (i.e., the state probability of the target node T is set to 100%), the posterior probability distributions of various relevant factors are derived, and the results are presented in Figure 9. The electrical damage (X1), restricted natural ventilation in the kitchen (X14), traffic disruption (X17), and Pipeline loosening or deformation (X9) exhibit the highest posterior probabilities. Thus, they are the most likely direct causes of the gas explosion, and targeted investigation and diagnosis can be conducted focusing on these four factors. Electrical damage (X1) typically results from structural shaking that loosens wiring connections or damages equipment casings, generating sparks as ignition sources. Regarding restricted natural ventilation in the kitchen (X14), doors or windows may remain closed or become inoperable because of earthquake-induced deformation, thereby limiting gas dispersion and allowing leaked gas to accumulate to explosive concentrations. Traffic disruption (X17) critically impacts emergency response, as road damage and congestion delay rescue personnel, preventing the control of leaks within the optimal response window. Finally, gas pipelines attached to walls or the ground undergo repeated tensile, compressive, or bending deformation due to the relative inter-story drift of buildings. Once this deformation exceeds the pipeline’s resistance—particularly at joints and supports—leakage occurs. Thus, the seismic performance of buildings largely determines the extent of damage to gas pipelines. Moreover, the posterior probabilities associated with alarm receipt delay (X18) and pipeline design defects (X13) are also notably high. To effectively mitigate these critical vulnerabilities, regular inspections should focus on threaded gas-pipeline joints, gas-meter and valve connections, and the interfaces between gas stoves and connecting hoses. Load-bearing supports, guide supports, and seismic braces should be appropriately arranged along the actual routing of the gas pipelines and securely anchored to the primary structural system. At locations subjected to relatively large lateral deformation, enhanced restraint should be provided to limit lateral pipeline displacement and prevent the loosening of connections, thereby improving the overall seismic performance of the gas system. In addition, stainless-steel corrugated hoses or metal-clad hoses, self-closing valves, and gas appliances equipped with flame-failure protection devices are recommended, and occupants should not relocate, remove, or modify indoor gas pipelines or related equipment without authorization, thereby reducing the risk of gas leakage caused by hose detachment, connection failure, or unauthorized modification. Regarding ventilation, adequate kitchen ventilation should be maintained by opening exterior windows or providing effective ventilation openings and exhaust facilities to promote air circulation. Regarding emergency response, emergency reports should clearly specify the building, floor, residential unit, and any obstructions on surrounding roads, enabling fire and rescue services to promptly assess site conditions and adjust response routes, thereby reducing delays in verifying incident information and reaching the affected site.
Subsequently, the updated parameter values for X1, X14, X17 and X9 are incorporated as new evidence into the Bayesian network model, with this evidence defined as P (T=Yes, X1=No, X14=No, X17=No, X9=No) = 1. This assumption aims to exclude the identified primary causes and further investigate other potential risk factors, while maintaining the premise that a “gas explosion has occurred” (T=Yes). This initiates a new round of risk diagnosis and analysis. The outcomes of diagnostic inference are displayed in Figure 10. This iterative process of identifying and addressing risk factors allows for real-time acquisition of effective risk detection pathways. It also reduces the uncertainty and subjectivity in risk diagnosis, providing more reliable support for post-earthquake gas explosion risk management.
4.2. Complex Network Topology Analysis
4.2.1. Key Node Analysis
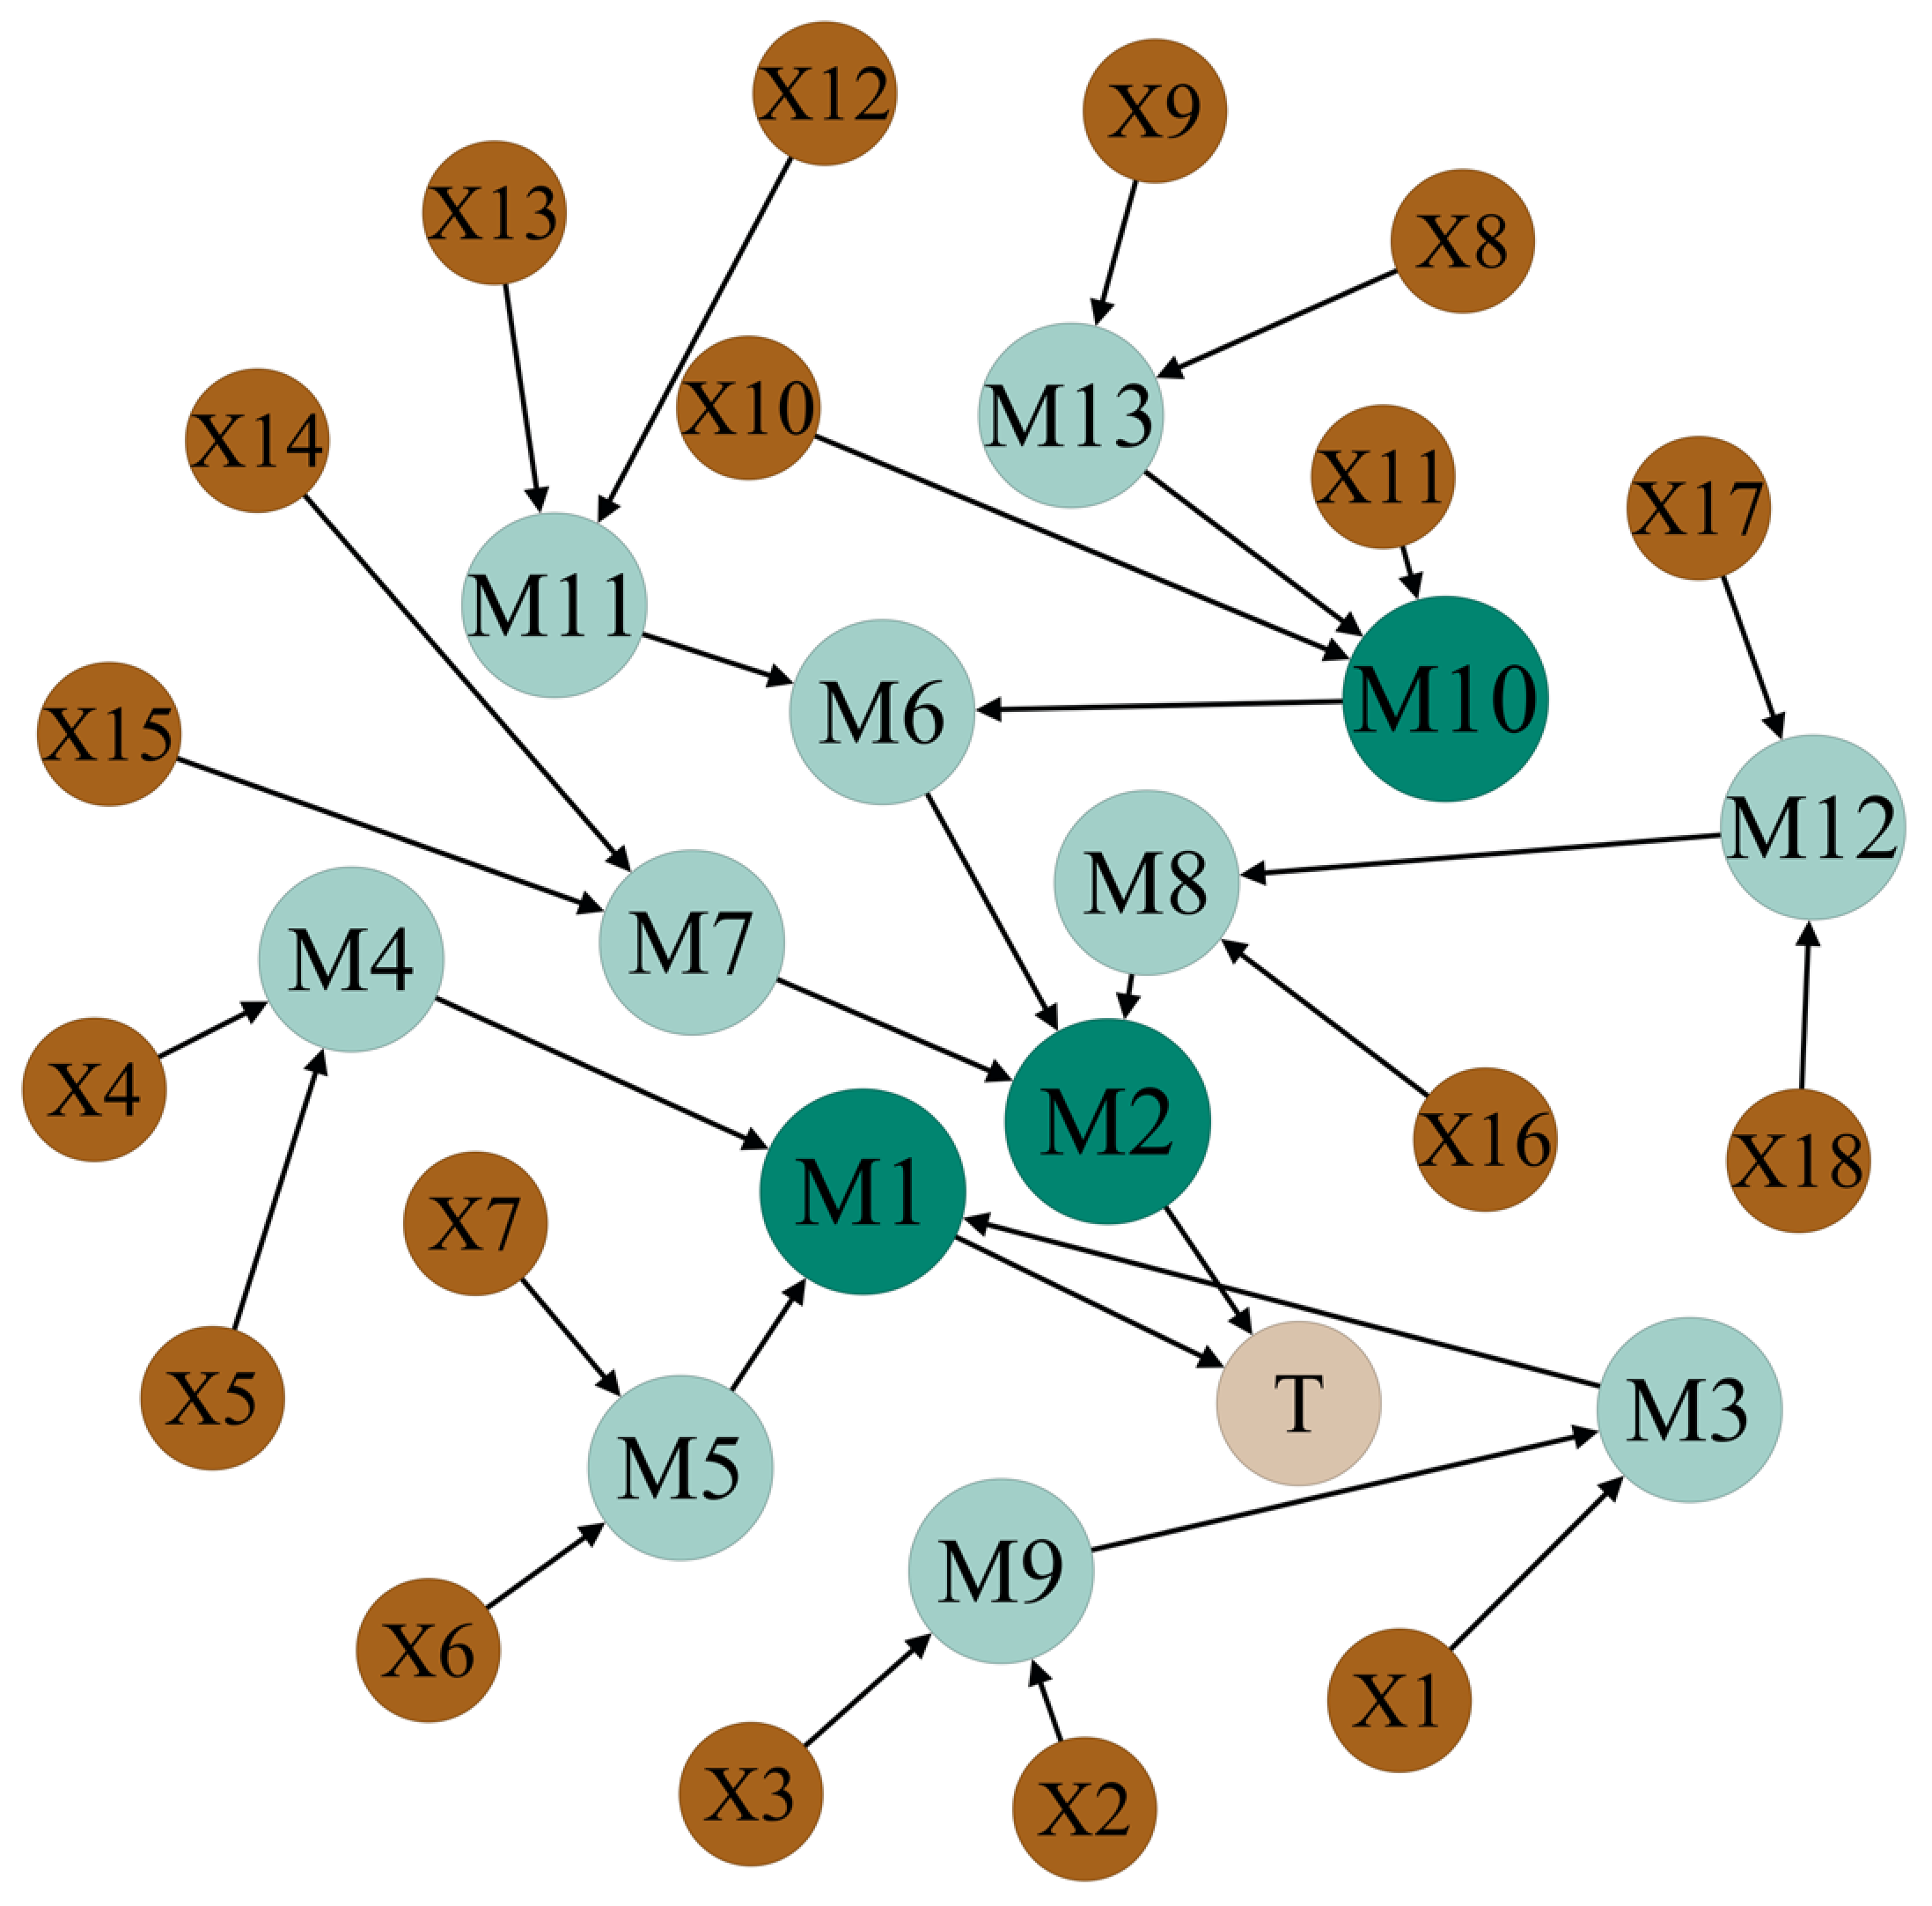
CNs are characterized by numerous nodes interconnected through intricate edge relationships. The construction of such networks facilitates the evaluation of the relative importance of specific nodes and edges, offering theoretical insights for mitigating the propagation of disasters. In this study, the evolution process of the post-earthquake gas explosion disaster chain exhibits significant CN characteristics. By converting the accident causative factors and their logical interrelations into network nodes and directed edges, a topological structure model consisting of 32 nodes and 31 edges was established using Gephi software (version 0.10.1), as shown in Figure 11.
Figure 11.
Topological diagram for the complex network in gas explosion disaster chains.
The topological position of a node within the network dictates its risk profile and the extent of its influence on system evolution. To analyze this, Gephi software (version 0.10.1) was utilized to extract topological metrics reflecting node importance, as detailed in Table 11. The results indicate that nodes M1, M2, M10, and M13 exhibit high degree centrality, signifying their core status within the network and a strong capacity to facilitate disaster propagation. Additionally, the high closeness centrality observed in nodes M1 and M2 implies that these nodes maintain the shortest topological paths to other nodes, suggesting that preventing these specific events can effectively mitigate further disaster escalation. Furthermore, nodes T, M2, and M6 demonstrate significant eigenvector centrality, meaning their failure would critically undermine the structural integrity of the network; consequently, preventive measures should be strategically prioritized for these key nodes.
Table 11.
Characteristic metrics of complex network node.
4.2.2. Comprehensive Analysis of Node Importance
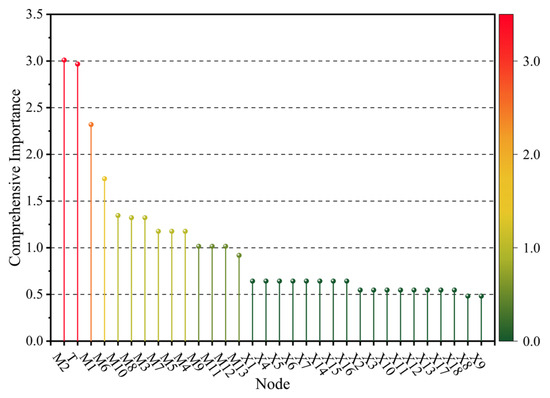
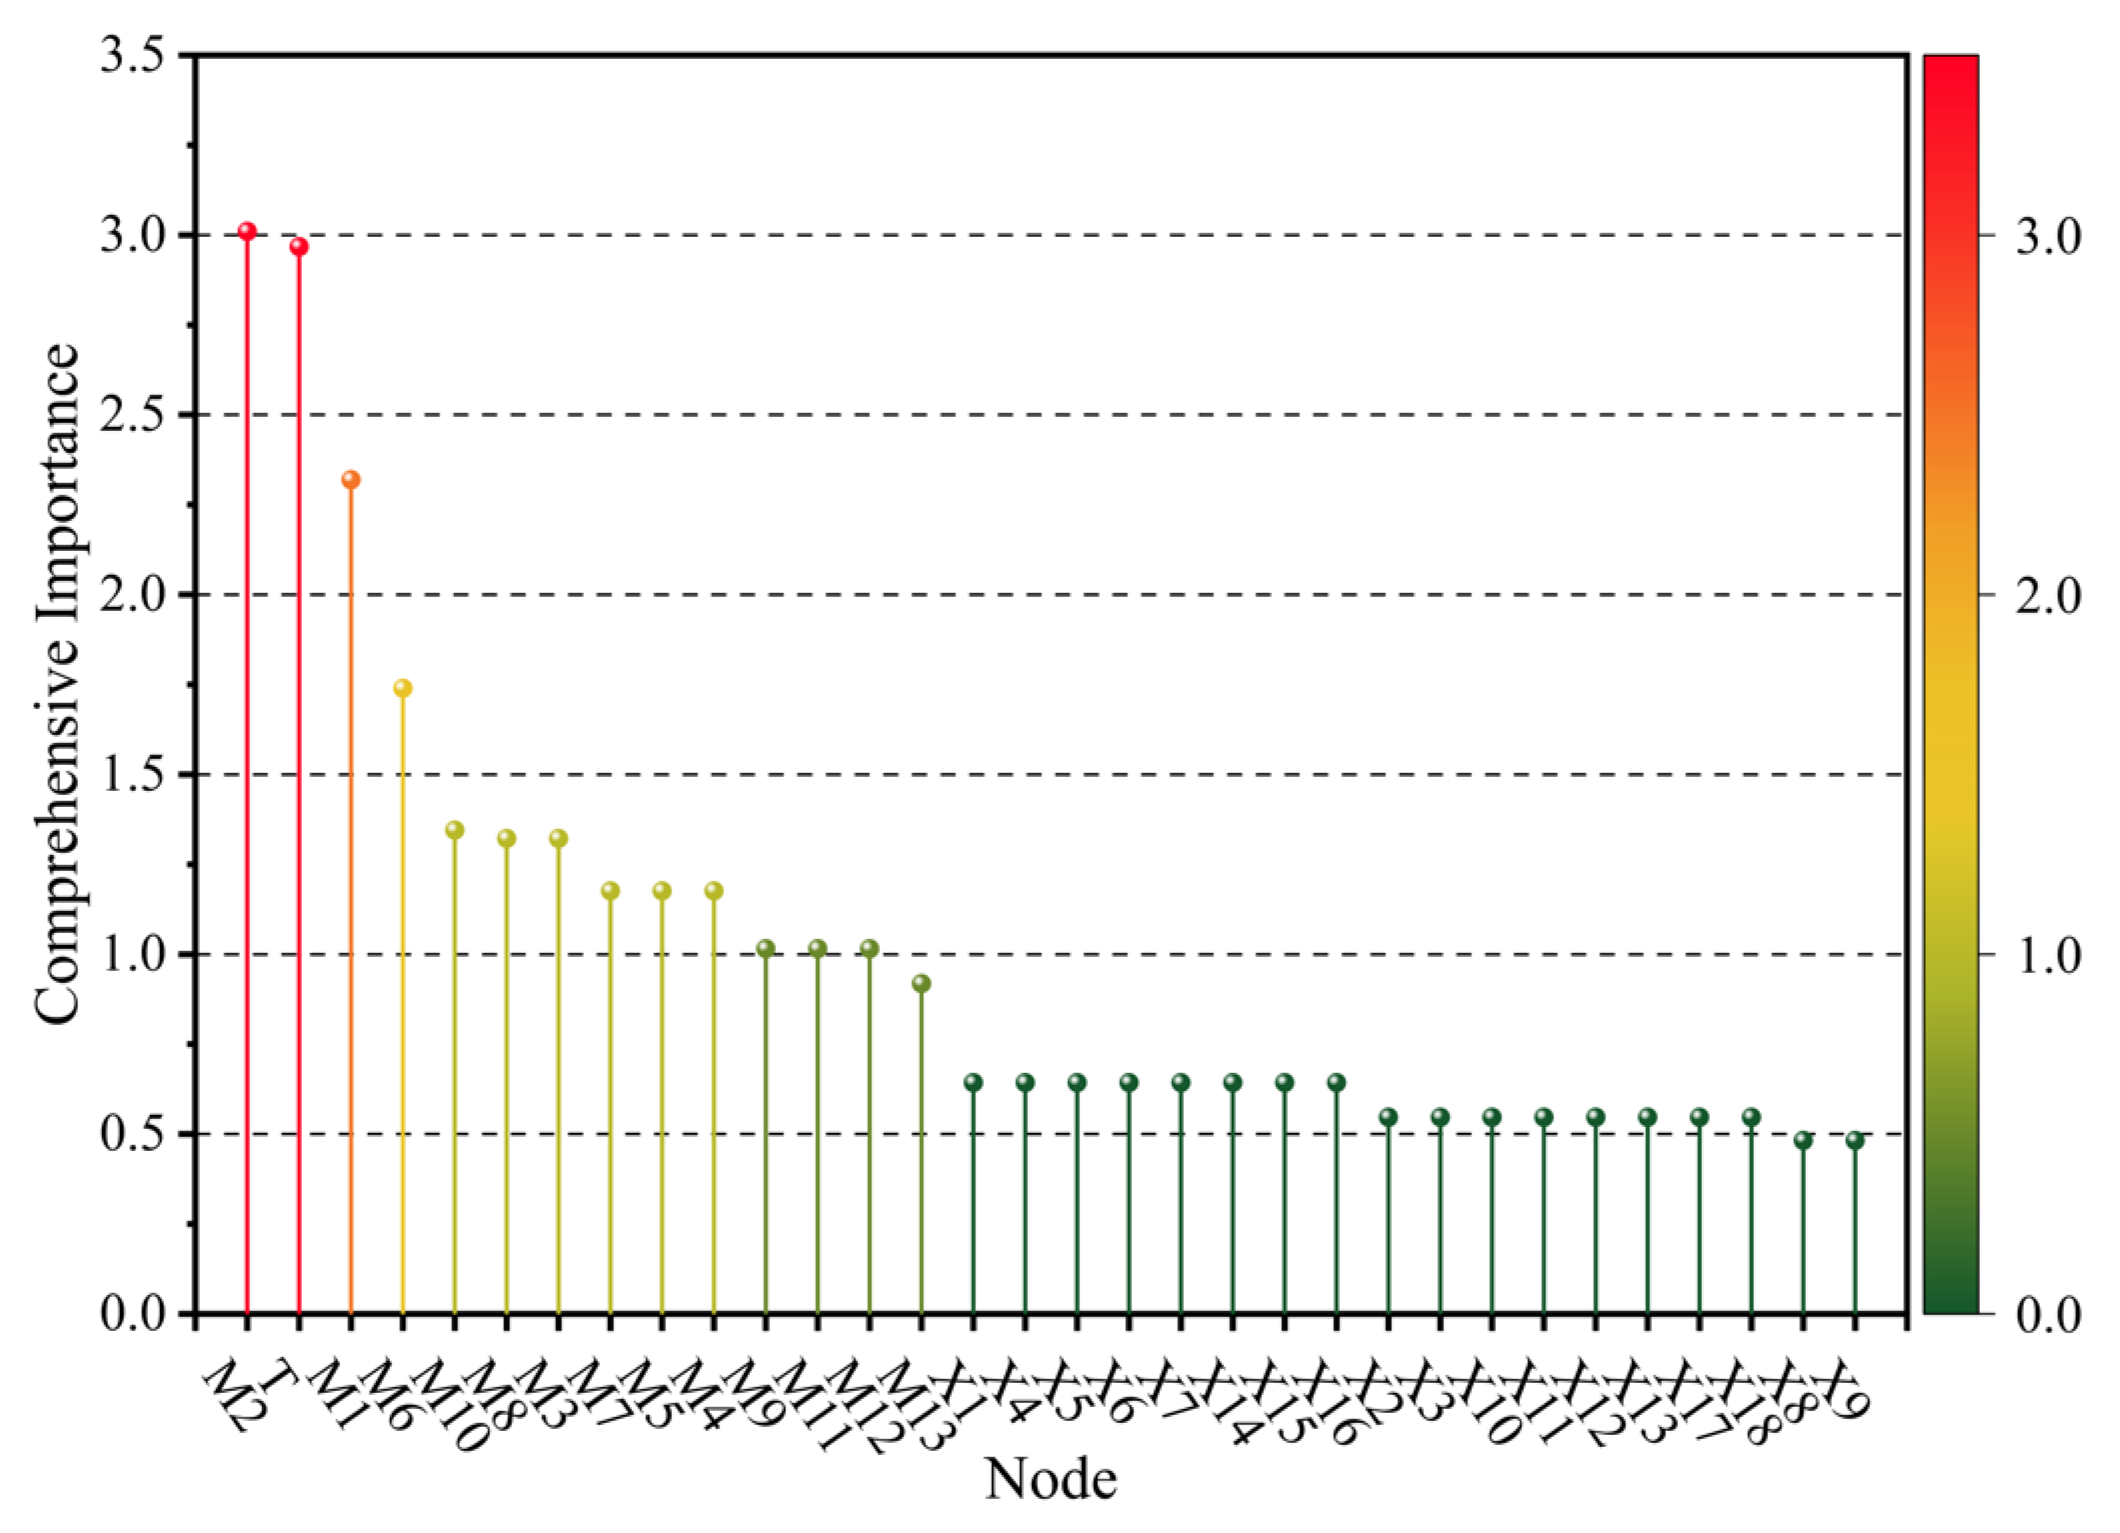
To strictly quantify the relative significance of nodes within the network, the analytic hierarchy process was utilized. Drawing upon expert consultation, a judgment matrix was established focusing on three key metrics: degree centrality, closeness centrality, and eigenvector centrality; the derived weights are listed in Table 12. By substituting the specific metric values of each node and their respective weights into Equation (14), the comprehensive importance was calculated. The final hierarchy of node importance is illustrated in Figure 12.
where Zi denotes the comprehensive importance of node i, Ej represents the weight of the j-th indicator, Kij is the value of the j-th indicator for node i, and Gja signifies the mean value of the j-th indicator across all nodes.
Table 12.
Judgment matrix of the evaluation indicators.
Figure 12.
Importance assessment of node.
Based on the comprehensive ranking of node importance, the values for nodes M2, T, M1, and M6 are significantly superior to those of other nodes, suggesting that they exert a decisive influence on the system’s evolution; therefore, implementing chain-breaking measures targeting these critical nodes is of paramount importance for interrupting disaster propagation. Specifically, node M2 representing gas overrun possesses the highest comprehensive importance, constituting the most critical trigger factor in the accident chain evolution and warranting the highest priority for intervention. Node T, denoting the accident event itself, follows closely in terms of importance. Furthermore, nodes M1 and M6 also demonstrate substantial importance, implying that their activation can readily lead to rapid disaster escalation. Consequently, prioritizing the control of these critical nodes serves as the core strategy for blocking the evolution of the gas explosion accident chain. Compared with the BN forward inference results, the above CN results show differences, which are mainly attributed to the different analytical focuses of the two methods. BN forward inference mainly focuses on probabilistic risk propagation among events, whereas CN analysis mainly focuses on the topological importance of nodes in the disaster-chain network, including their structural positions and connectivity. Therefore, the results of the two methods are complementary rather than contradictory. When the control objective is to block disaster-chain propagation, the CN comprehensive importance ranking is more suitable, and M2 remains the critical control point for blocking the disaster chain. In contrast, the BN forward inference results provide probability-based information on risk propagation. For routine prevention, M8, M6, and M3 should be considered to reduce the probability of accident propagation.
To assess the sensitivity of the node-importance ranking to variations in the centrality weights, a one-at-a-time (OAT) sensitivity analysis was performed [50]. The weights assigned to degree centrality, closeness centrality, and eigenvector centrality were varied individually within ±20% of their baseline values in increments of 2%. When one weight was perturbed, the other two weights were proportionally rescaled while preserving their original ratio, such that the sum of the three weights remained equal to unity. The comprehensive importance of each node was then recalculated using Equation (14). The results show that M2, T, M1, and M6 consistently remained the top four nodes, while M2 and T exchanged their relative rankings only within certain weight ranges. This indicates that the identification of the core nodes is generally robust, although the relative ranking of M2 and T remains somewhat sensitive to variations in the centrality weights. Because T represents the gas explosion event itself rather than a directly controllable causal node, M2 remains the most critical controllable node for interrupting the disaster chain (Table 13).
Table 13.
Sensitivity of node rankings to variations in centrality-metric weights.
5. Conclusions
High-rise buildings may experience gas pipeline ruptures and leakage under earthquake action. It could easily trigger a gas explosion with the occurrence of ignition sources and poor ventilation conditions. The interactions and chain mechanisms involved are extremely difficult to identify, and there are additional potential risk factors often accompanied. Therefore, it is crucial to accurately identify and assess risk factors to prevent such incidents.
This paper proposes a risk assessment framework for post-earthquake gas explosions by integrating FBN and CN. Forward causal inference results show that intermediate events M8, M6, and M3 have higher occurrence probabilities than others and should be the focus of routine prevention. Backward diagnostic inference indicates that X1, X14, X17, and X9 are critical factors for prioritized inspection and control when an explosion occurs. This method leverages the iterative diagnostic advantage of Bayesian Networks to significantly reduce uncertainty in disaster assessment. Furthermore, CN and sensitivity analyses show that M2, T, M1, and M6 consistently remain the four highest-ranked nodes, with M2 serving as the most critical controllable node for interrupting the disaster chain.
The proposed approach addresses the issues of traditional BN over-reliance on precise probabilities and the difficulty in constructing conditional probability tables by means of fuzzy logic. Second, it makes up for the deficiency that traditional CN analysis can only identify critical nodes at the structural level and is unable to realize probabilistic diagnosis and traceability of disaster-causing factors. During model development, the risk-factor taxonomy was established mainly based on relevant literature and expert judgment and has not yet been validated against multiple independent real-world case histories. When applied to other building typologies, seismic-code systems, or gas-infrastructure standards, the taxonomy should be adjusted according to the specific context.
Author Contributions
Conceptualization, B.H.; methodology, B.H.; resources, Y.T. and J.G.; writing—original draft preparation, B.H.; writing—review and editing, B.H., Y.T., J.G. and X.X.; validation, X.X.; supervision, Y.T., J.G. and X.X.; funding acquisition, Y.T. and J.G. All authors have read and agreed to the published version of the manuscript.
Funding
The authors sincerely appreciated the financial support from the National Key Research and Development Program of China (Grant No. 2023YFC3805001); the National Natural Science Foundation of China (Grant No. 52578378); the Scientific Research Project of Shaanxi Provincial Department of Education (Grant No. 25JK0523); and the Natural Science Foundation of Shaanxi Province (Grant No. 2025SYS-SYSZD-068) to carry out this study.
Data Availability Statement
The data and models supporting the findings of this study are available from the corresponding author upon reasonable request.
Conflicts of Interest
The authors declare no conflicts of interest.
References
- China Seismic Network. National Earthquake Data Center. Available online: https://www.cenc.ac.cn (accessed on 10 June 2026).
- Wu, H.; Lu, J.; Cheng, Y. Collapse analysis approach of RC frame structures under earthquake-explosion disaster chains. Eng. Struct. 2025, 338, 120613. [Google Scholar] [CrossRef] [Scilit]
- Zhao, B.; Su, L.; Xu, Q.; Li, W.; Xu, C. A review of recent earthquake-induced landslides on the Tibetan Plateau. Earth-Sci. Rev. 2023, 244, 104534. [Google Scholar] [CrossRef] [Scilit]
- Krausmann, E.; Cruz, A.M. Impact of the 11 March 2011, Great East Japan earthquake and tsunami on the chemical industry. Nat. Hazards 2013, 67, 811–828. [Google Scholar] [CrossRef] [Scilit]
- Bain, C.A.; O’Rourke, T.D.; Bray, J.D. Pipeline response to seismic displacement at Balboa Boulevard during the 1994 Northridge Earthquake. J. Geotech. Geoenvironmental Eng. 2024, 150, 04023139. [Google Scholar] [CrossRef] [Scilit]
- Uckan, E.; Aksel, M.; Atas, O.; Toprak, S.; Kaya, E.S. The performance of transmission pipelines on February 6th, 2023 Kahramanmaras earthquake: A series of case studies. Bull. Earthq. Eng. 2025, 23, 1203–1222. [Google Scholar] [CrossRef] [Scilit]
- Abdollahzadeh, G.; Faghihmaleki, H. Probabilistic two-hazard risk assessment of near-fault and far-fault earthquakes in a structure subjected to earthquake-induced gas explosion. J. Build. Eng. 2017, 13, 298–304. [Google Scholar] [CrossRef] [Scilit]
- Xie, X.; Li, A.; Xu, L.; Tao, Y. Coupling mechanism and probabilistic risk assessment of earthquake-secondary gas explosion disaster in high-rise buildings. J. Southeast Univ. (Nat. Sci. Ed.) 2025, 56, 746–753. (In Chinese) [Google Scholar]
- Chen, G.; Lu, J.; Wu, H. Dynamic behavior and retrofitting of RC frame building under vehicular bomb explosion. Eng. Fail. Anal. 2023, 143, 106925. [Google Scholar] [CrossRef] [Scilit]
- Shahzad, M.M.; Zhang, X.; Wang, X.; Abdulhadi, M.; Xiao, Y. Plastic Deformation Analysis of a New Mega-Subcontrolled Structural System (MSCSS) Subjected to Seismic Excitation. Buildings 2022, 12, 987. [Google Scholar] [CrossRef] [Scilit]
- Xiao, Y.; Yue, F.; Zhang, X.; Shahzad, M.M. Aseismic optimization of mega-subcontrolled structures based on Gaussian process surrogate model. KSCE J. Civ. Eng. 2022, 26, 2246–2258. [Google Scholar] [CrossRef] [Scilit]
- Fan, B.; Zhang, X.; Xiao, Y.; Abdulhadi, M.; Wang, X.; Shahzad, M.M. Failure Mode and Optimization for MSCSS with LRBs Based on IDA Method. Buildings 2022, 12, 998. [Google Scholar] [CrossRef] [Scilit]
- Li, F.; Zhai, C.; Qin, H. Post-earthquake functional state assessment of communication base station using Bayesian network. Reliab. Eng. Syst. Saf. 2024, 252, 110482. [Google Scholar] [CrossRef] [Scilit]
- Wang, W.; Dong, C.; Liu, L.; Li, W.; Mi, H.; Shen, K. Failure probability analysis of shale gas wellhead devices based on FTA-BN model. China Saf. Sci. J. 2019, 29, 89–95. (In Chinese) [Google Scholar] [CrossRef]
- Khakzad, N.; Khan, F.; Amyotte, P. Safety analysis in process facilities: Comparison of fault tree and Bayesian network approaches. Reliab. Eng. Syst. Saf. 2011, 96, 925–932. [Google Scholar] [CrossRef] [Scilit]
- Guan, W.; Zhang, C.; Dong, C.; Xia, Y. Ship fire and explosion accident statistical analysis based on fault tree and Bayesian network. Fire Saf. J. 2025, 153, 104358. [Google Scholar] [CrossRef] [Scilit]
- Kim, J.; Song, J. Bayesian updating methodology for probabilistic model of bridge traffic loads using in-service data of traffic environment. Struct. Infrastruct. Eng. 2022, 19, 77–92. [Google Scholar] [CrossRef] [Scilit]
- Xiao, Q.; Li, Y.; Luo, F.; Liu, H. Analysis and assessment of risks to public safety from unmanned aerial vehicles using fault tree analysis and Bayesian network. Technol. Soc. 2023, 73, 102229. [Google Scholar] [CrossRef] [Scilit]
- Wang, J.; Chen, Z.; Song, Y.; Liu, Y.; He, J. Data-driven dynamic bayesian network model for safety resilience evaluation of prefabricated building construction. Buildings 2024, 14, 570. [Google Scholar] [CrossRef] [Scilit]
- Cui, Y.; Zhu, Z.; Zhao, X.; Li, Z.; Qin, P. Bayesian calibration for office-building heating and cooling energy prediction model. Buildings 2022, 12, 1052. [Google Scholar] [CrossRef] [Scilit]
- Bian, H.; Zhang, J.; Li, R.; Zhao, H.; Wang, X. Risk analysis of tripping accidents of power grid caused by typical natural hazards based on FTA-BN model. Nat. Hazards 2021, 106, 1771–1795. [Google Scholar] [CrossRef] [Scilit]
- Ren, J.; Jenkinson, I.; Wang, J.; Xu, D.L.; Yang, J.B. An offshore risk analysis method using fuzzy Bayesian network. J. Offshore Mech. Arct. Eng. 2009, 131, 041101. [Google Scholar] [CrossRef] [Scilit]
- Zhang, L.; Wu, X.; Skibniewski, M.J.; Zhong, J.; Lu, Y. Bayesian-network-based safety risk analysis in construction projects. Reliab. Eng. Syst. Saf. 2014, 131, 29–39. [Google Scholar] [CrossRef] [Scilit]
- Hanss, M. On the implementation of fuzzy arithmetical operations for engineering problems. In Proceedings of the 18th International Conference of the North American Fuzzy Information Processing Society-NAFIPS (Cat. No. 99TH8397), New York, NY, USA, 10–12 June 1999; IEEE: New York, NY, USA, 1999; pp. 462–466. [Google Scholar] [CrossRef] [Scilit]
- Horčík, R. Solution of a system of linear equations with fuzzy numbers. Fuzzy Sets Syst. 2008, 159, 1788–1810. [Google Scholar] [CrossRef] [Scilit]
- Simon, C.; Weber, P. Evidential networks for reliability analysis and performance evaluation of systems with imprecise knowledge. IEEE Trans. Reliab. 2009, 58, 69–87. [Google Scholar] [CrossRef] [Scilit]
- Mahmood, Y.; Chen, J.; Yodo, N.; Huang, Y. Optimizing natural gas pipeline risk assessment using hybrid fuzzy Bayesian networks and expert elicitation for effective decision-making strategies. Gas Sci. Eng. 2024, 125, 205283. [Google Scholar] [CrossRef] [Scilit]
- Xie, J.; Li, J.; Wang, J.; Jiang, J.; Shu, C.M. Fire risk assessment in lithium-ion battery warehouse based on the Bayesian network. Process Saf. Environ. Prot. 2023, 176, 101–114. [Google Scholar] [CrossRef] [Scilit]
- Li, M.; Wang, H.; Wang, D.; Shao, Z.; He, S. Risk assessment of gas explosion in coal mines based on fuzzy AHP and Bayesian network. Process Saf. Environ. Prot. 2020, 135, 207–218. [Google Scholar] [CrossRef] [Scilit]
- Kang, J.; Wang, H.; Jin, H.; Wang, Z.; Zhang, J. Risk analysis and management of hydrogen station fire and explosion accidents using DEMATEL-ISM and complex network models. Int. J. Hydrogen Energy 2025, 136, 1230–1241. [Google Scholar] [CrossRef] [Scilit]
- Li, J.; Yang, Z.; He, H.; Guo, C.; Chen, Y. Risk causation analysis and prevention strategy of working fluid systems based on accident data and complex network theory. Reliab. Eng. Syst. Saf. 2024, 252, 110445. [Google Scholar] [CrossRef] [Scilit]
- Guo, Z. Brief discussion on disaster physics. Earthq. Res. Plateau 1993, 5, 1–3. (In Chinese) [Google Scholar]
- Shi, P. Theory on disaster science and disaster dynamics. J. Nat. Disasters 2002, 11, 1–9. (In Chinese) [Google Scholar] [CrossRef]
- Wang, X.; Li, X.; Chen, G. Complex Networks and Its Application; Tsinghua University Press: Beijing, China, 2006. [Google Scholar]
- Kang, J.; Su, T.; Jin, H.; Wang, Y.; Wu, L. Risk analysis of boiler overpressure explosion based on complex network and fuzzy Bayesian inference. Eng. Fail. Anal. 2025, 170, 109261. [Google Scholar] [CrossRef] [Scilit]
- Zhu, W.; Wang, D.; Zhang, L. Modeling urban flood susceptibility and identifying key flood-inducing factor chains using Bayesian network. Nat. Hazards 2026, 122, 37. [Google Scholar] [CrossRef] [Scilit]
- Feng, G.; Zhang, J.; Liao, S. A novel method for combining Bayesian networks, theoretical analysis, and its applications. Pattern Recognit. 2014, 47, 2057–2069. [Google Scholar] [CrossRef] [Scilit]
- Wang, N.; Wu, M.; Yuen, K.F. Assessment of port resilience using Bayesian network: A study of strategies to enhance readiness and response capacities. Reliab. Eng. Syst. Saf. 2023, 237, 109394. [Google Scholar] [CrossRef] [Scilit]
- Saaty, T.L.; Ozdemir, M.S. Why the magic number seven plus or minus two. Math. Comput. Model. 2003, 38, 233–244. [Google Scholar] [CrossRef] [Scilit]
- Khan, R.U.; Yin, J.; Wang, X. Fuzzy Bayesian risk assessment of system and component failures in ammonia bunkering. Ocean Eng. 2025, 338, 121960. [Google Scholar] [CrossRef] [Scilit]
- Hu, G.; Huang, P.; Bai, Z.; Wang, Q.; Qi, K. Comprehensively analysis the failure evolution and safety evaluation of automotive lithium-ion battery. ETransportation 2021, 10, 100140. [Google Scholar] [CrossRef] [Scilit]
- Clemen, R.T.; Winkler, R.L. Combining probability distributions from experts in risk analysis. Risk Anal. 1999, 19, 187–203. [Google Scholar] [CrossRef] [Scilit]
- Onisawa, T. An application of fuzzy concepts to modelling of reliability analysis. Fuzzy Sets Syst. 1990, 37, 267–286. [Google Scholar] [CrossRef] [Scilit]
- Sun, B.; Li, Y.; Wang, Z.; Yang, D.; Ren, Y. A combined physics of failure and Bayesian network reliability analysis method for complex electronic systems. Process Saf. Environ. Prot. 2021, 148, 698–710. [Google Scholar] [CrossRef] [Scilit]
- Wang, J.; Li, C.; Duan, W.; Zhang, Q.; Shi, L.; Ma, C. Experimental study on indoor natural gas leakage process. J. Saf. Environ. 2022, 22, 292–297. (In Chinese) [Google Scholar] [CrossRef]
- Lu, Y.Q. Practical Heating Air Conditioning Design Manual, 2nd ed.; China Architecture & Building Press: Beijing, China, 2008. [Google Scholar]
- Zlochower, I.A.; Green, G.M. The limiting oxygen concentration and flammability limits of gases and gas mixtures. J. Loss Prev. Process Ind. 2009, 22, 499–505. [Google Scholar] [CrossRef] [Scilit]
- Saaty, T.L. A scaling method for priorities in hierarchical structures. J. Math. Psychol. 1977, 15, 234–281. [Google Scholar] [CrossRef] [Scilit]
- Subramanian, N.; Ramanathan, R. A review of applications of Analytic Hierarchy Process in operations management. Int. J. Prod. Econ. 2012, 138, 215–241. [Google Scholar] [CrossRef] [Scilit]
- Chen, Y.; Yu, J.; Khan, S. Spatial sensitivity analysis of multi-criteria weights in GIS-based land suitability evaluation. Environ. Model. Softw. 2010, 25, 1582–1591. [Google Scholar] [CrossRef] [Scilit]

Disclaimer/Publisher’s Note: The statements, opinions and data contained in all publications are solely those of the individual author(s) and contributor(s) and not of MDPI and/or the editor(s). MDPI and/or the editor(s) disclaim responsibility for any injury to people or property resulting from any ideas, methods, instructions or products referred to in the content. |
© 2026 by the authors. Licensee MDPI, Basel, Switzerland. This article is an open access article distributed under the terms and conditions of the Creative Commons Attribution (CC BY) license.