


Abstract
From a Historic Urban Landscape (HUL) perspective, varying conservation intensities and statutory boundaries may create “zonal differentiation” within historic districts. However, conventional homogenized renewal strategies frequently overlook this heterogeneity, affecting physical townscapes and human perception. This study analyzes 1714 panoramic street-view images from the Core Protection Zone and Construction Control Zone of Jimei School Village. Eleven objective visual features and six model-predicted perception dimensions were examined, with locally experienced participants providing contextual validation. Integrating K-Means clustering, Random Forest modeling, and SHapley Additive exPlanations (SHAP) feature attribution, the study investigates nonlinear, model-based contribution patterns across the two zones. Results reveal significant but non-binary differences in objective features and predicted perceptions. Street-view typologies show zonal tendencies while also indicating within-zone diversity and cross-zone overlap. Feature attribution shows that color composition, greenery, building interfaces, and vehicle presence are more prominent in the Core Protection Zone, whereas greenery, spatial openness, and road-space organization play stronger roles in the Construction Control Zone. This study establishes an interpretable street-view-based framework for historic-district assessment, providing empirical support for differentiated and human-oriented zonal renewal.
1. Introduction
Historic districts serve as living archives of urban memory, linking cultural context with daily civic life [1]. In China, statutory conservation planning commonly divides historic areas into a Core Protection Zone and a Construction Control Zone. The Core Protection Zone contains the principal heritage resources and historic spatial fabric and is subject to stricter restrictions on new construction and expansion. The Construction Control Zone is located around or adjacent to the Core Protection Zone and serves a transitional function. A certain degree of development may be permitted provided that conservation requirements are met, but building height, volume, color, form, and compatibility with the historic townscape remain subject to control. In functional terms, the Construction Control Zone resembles the World Heritage buffer-zone concept by regulating surrounding development to protect the heritage setting. However, it remains a category within China’s statutory conservation-planning system, whereas World Heritage buffer zones are defined in relation to the setting and Outstanding Universal Value of a designated property [2]. Together, these two zones establish a differentiated regulatory framework for heritage conservation, adaptive development, and environmental improvement. The Historic Urban Landscape (HUL) approach further views historic areas as layered urban systems in which built heritage, spatial form, cultural values, social practices, and ongoing change coexist [3,4]. The two zones should therefore not be understood simply as different levels of development restriction. Their distinct conservation and management conditions may also produce differences in physical form, visual townscape, and everyday experience [5].
However, contemporary regeneration often overlooks this fine-grained heterogeneity. Although spatial governance is shifting from broad townscape control toward quality-oriented renewal, interventions still tend to apply uniform strategies. This may weaken the character of transition areas and expose historic features to generic design treatment [6]. The challenge is therefore to understand zonal differences and respond to them while maintaining heritage value, compatible development, and everyday use. From an HUL perspective, identifying the spatial and perceptual relationships between zones is important for balanced and evidence-based heritage governance [7].
Conventional studies of micro-scale environmental perception have relied mainly on questionnaires and field observations [8]. These methods are often limited in spatial coverage, temporal efficiency, and data granularity [9]. Street view imagery (SVI), computer vision, and machine learning provide a scalable alternative [10]. They allow continuous street interfaces to be quantified through indicators such as color composition, greenery, building proportion, and enclosure, while also supporting district-wide prediction of visual perception.
This study focuses on the Jimei School Village Historic and Cultural District, which has a distinct dual-zone conservation structure. Using street view images and explainable machine learning, it develops a framework for visual perception prediction and zonal comparison. Three questions are addressed. First, how do the Core Protection Zone and the Construction Control Zone differ in objective visual features and model-predicted perceptions? Second, can street view samples form meaningful joint typologies based on physical and perceptual characteristics, and how are these typologies distributed across the two zones? Third, do the contributions of objective visual elements to model-predicted perceptions differ between zones? By interpreting these differentiated contribution patterns within an HUL perspective, the study provides evidence for zonal conservation management, human-oriented townscape assessment, and refined spatial renewal.
2. Literature Review
2.1. Perception Studies in Historic Districts
Historic districts are not only physical settings but also places where people form spatial cognition, emotional attachment, and environmental evaluations. Their perception involves architectural settings, traditional activities, cultural atmosphere, and shared emotional responses rather than isolated physical attributes alone [11]. Traditional architectural patterns, appropriate street and alley scales, and distinctive atmospheres can influence spatial experience and psychological restoration [12]. Alexander’s pattern language [13,14] and Gehl’s human-scale public-space principles [15] likewise show that street micro-morphology shapes pedestrian vitality and comfort. Research has therefore moved beyond townscape aesthetics toward a broader understanding of interactions between people and historic environments.
Early studies mainly used questionnaires, interviews, behavioral observations, and soundwalks to examine psychological, behavioral, and sensory responses. Natural and mechanical sounds can affect neighborhood satisfaction and emotional attachment [16]. Soundscape richness is also related to spatial function, activity intensity, and environmental order [17]. Audiovisual interactions vary across functional settings, showing that perception is strongly context-dependent [18]. Where natural landscapes intersect with historic interfaces, visual and auditory conditions may jointly shape the overall atmosphere [19]. Biophilic and adaptive design studies further associate blue-green infrastructure with microclimate regulation, thermal comfort, and psychological restoration [20,21,22].
Human-centered measurement and spatial quantification have since extended perception research beyond self-reported evaluation. Eye-tracking can record visual-attention patterns and clarify how landscape elements relate to cognitive processing [23]. Cognitive-architecture research similarly examines physiological and attentional responses to traditional facade details and spatial morphology [24,25,26,27]. In heritage regeneration, eye-tracking can reveal how facade details, material textures, and spatial nodes attract attention [28]. Augmented-reality studies have also expanded perception research from static environments to user interaction with digital interfaces [29]. Meanwhile, semantic segmentation enables buildings, roads, greenery, and other elements to be extracted from street images [30]. Image-recognition methods can therefore supplement field surveys by improving coverage and supporting objective feature extraction [31].
Multisource data and artificial intelligence have further broadened this field. Deep learning applied to street-view images and multimodal data supports large-scale perception analysis and comparisons among user groups [32]. Residents and tourists may interpret cultural landscapes differently, particularly in relation to local identity, historical continuity, everyday association, and visible experience [33]. Natural, historical, and cultural attributes also contribute differently to place identity, dependence, and attachment [34]. Social-media reviews and visitor-generated text help capture tourism experience, emotion, and spatial preference [35]. Points of interest and heat maps provide additional evidence on street vitality and functional concentration [36]. Multimodal data can also clarify relationships among sensory elements in real settings. Large vision–language models increasingly support visual description and semantic interpretation [37], although their recognition of local symbols, traditional materials, and distinctive historic townscapes still requires contextual validation. These issues are especially relevant where tourism development, daily life, and conservation create competing demands [38].
Built-environment perception has thus developed into a multidimensional field involving place attachment, perceived authenticity, physiological response, and measurable spatial characteristics. Heritage, memory, familiarity, and social relationships may jointly shape attachment and well-being [39]. Perceived authenticity can link destination image with subjective well-being [40], visitor loyalty [41], and support for environmental conservation. Host–guest differences in cultural perception [33] and the adaptive reuse of small alley spaces [42] further show the importance of diverse stakeholder needs. Post-occupancy evaluation [43] and the stimulus–organism–response framework [44] also help connect specific historic landscape elements with environmental experience. Together, these approaches support fine-grained diagnosis and evidence-based spatial improvement.
Despite this progress, several gaps remain. Cultural atmosphere, stakeholder differences, place attachment, and lived heritage experience are still often examined through surveys, interviews, or selected sites. These methods provide rich contextual evidence but are limited in sample size, survey period, and spatial coverage, making it difficult to represent continuous micro-scale variation. Most studies also examine entire districts or representative locations, with limited attention to visual-perception differences between statutory planning zones. Research on historic districts therefore requires finer-grained, zone-specific, and interpretable measurement while retaining attention to cultural meaning, stakeholder experience, and everyday use.
2.2. Applications of Computer Vision and Machine Learning in Quantitative Urban Research
Research on urban streetscape perception has shifted from extracting isolated physical features toward analysing more complex spatial structures. Foundational studies using street-level imagery and computer vision established a quantitative basis for linking the built environment with social perception [45]. Subsequent work has focused on visual-feature extraction, spatial representation, and multidimensional prediction of safety, restorativeness, vitality, and spatial quality.
Visual-feature analysis has likewise progressed from basic pixel statistics to deep visual representations. Convolutional neural networks were first used to estimate street greenery and evaluate street-space quality [46]. Indicators such as sky-view ratio and building-facade proportion were then adopted to describe openness and landscape quality [47]. Yet single proportional measures often fail to explain complex perceptions such as environmental imageability [48]. Scene-relation models therefore began to capture semantic and spatial relationships within street-view images [49]. Related approaches combining simulated cognition and geospatial structure have supported continuous feature extraction and urban-vitality mapping [50,51,52], while efficient sampling algorithms have improved dataset construction [53]. Structured image representations have also strengthened the prediction of complex spatial perceptions [54]. These advances have encouraged wider use of color contrast, entropy, brightness, and saturation in townscape analysis. Color routes and site-specific visual art may further enhance pedestrian engagement and place identity [55,56,57].
Urban-perception research has also expanded from conventional convolutional models to visual Transformers, foundation models, and vision–language approaches. Vision Transformer (ViT)-based frameworks have been applied to perceived-safety prediction [58], while multimodal models combining large language models with pretrained Contrastive Language–Image Pre-training (CLIP) representations have enabled more automated streetscape assessment [59]. Their transferability to culturally specific and fine-grained historic environments, however, still requires contextual validation. Large vision–language models have also been used for cultural-heritage identification, visual question answering, and the semantic interpretation of architectural elements [60,61]. Some approaches integrate image-based reasoning, textual knowledge, and three-dimensional heritage data to recognize historic features and spatial relationships. Hallucination, limited cultural specificity, and insufficient attention to human-centred perception and internal zonal differentiation nevertheless remain important constraints.
In the fields of health and social well-being, methods integrating deep learning and space syntax have been used to assess perceptions of street-level restorativeness [62]. Further research has suggested that physical environmental characteristics such as urban greenery and road quality are associated with residents’ experiences of psychological restoration [63]. As prediction models become more complex, explainable artificial intelligence (XAI) methods have been increasingly used to clarify model outputs. Local Interpretable Model-Agnostic Explanations (LIME) provides local surrogate explanations [64], while Integrated Gradients attributes deep-learning predictions to input features [65]. Permutation Importance evaluates model dependence on individual variables [66], whereas Counterfactual Explanations identify the changes required to alter a prediction [67]. SHapley Additive exPlanations (SHAP) assigns additive feature contributions to individual predictions [68], and TreeSHAP, a tree-model implementation of SHAP, enables efficient interpretation of tree-based models and the aggregation of local explanations into global patterns [69]. This makes SHAP suitable for comparing feature contributions across spatial groups. It has therefore been applied in urban-perception research to identify visual features associated with model-predicted pedestrian satisfaction [70], although its interpretation remains dependent on the fitted model, selected variables, and analytical objective.
Visual prediction models have also been applied to public safety, urban microclimates, and environmental risk. Street-view features support quantitative assessment of safety perception and its interaction with spatial conditions [71], while deep-learning models allow differences among specific street scenes to be compared [72]. Street-view imagery has also been used to estimate urban surface temperature and complement remote sensing from a pedestrian perspective [73]. Studies of solar radiation further show that street morphology and interface composition affect microclimatic distribution [74]. Together, these applications demonstrate the broader value of street-view imagery and machine learning for built-environment assessment [75].
Spatiotemporal and cross-modal analysis based on multisource data is another emerging direction. Time-series street-view images can track long-term visual change and reveal differences before and after regeneration [76]. Eye-tracking data help explain how users distribute attention across complex scenes [77]. Spatiotemporal graph neural networks have also been used for pedestrian and vehicle trajectory prediction [78,79]. Scene-semantic modelling improves efficiency in dynamic settings such as intersections [80], while advanced deep networks enhance behavioral-prediction stability [81]. Large spatiotemporal datasets now provide a basis for cross-scene training and comparison [82,83].
Despite this progress, the applicability of these methods to historic districts remains insufficiently examined. Most studies focus on entire cities or ordinary streets, where the characteristics of small historic areas may be averaged or obscured. Recent work has begun to assess historic-district quality using street-view imagery and machine learning, but statutory-zone differences and zone-specific feature-contribution patterns remain underexplored. Further research is therefore needed on the visual elements, predicted perceptions, and internal zonal differences of historic districts.
3. Research Methodology
3.1. Research Framework
The methodological workflow consists of five stages (Figure 1). First, panoramic street-view images from the Core Protection Zone and the Construction Control Zone were collected, screened, and organized. Second, computer vision methods were used to extract color and spatial-morphological features. Third, a pretrained urban-perception model generated scores for six perceptual dimensions, and ratings from locally experienced participants with built-environment backgrounds were used for contextual validation. The specific objective visual features and model-predicted perception indicators are presented in Section 3.3. Fourth, statistical comparisons and K-Means clustering were conducted to examine zonal differences and identify representative street-scene typologies. Finally, the Random Forest–SHAP (RF–SHAP) framework was used to analyse nonlinear, model-based associations and compare feature-contribution patterns between the two conservation zones.
Figure 1.
Methodological Workflow. API, application programming interface; MIT, Massachusetts Institute of Technology; OpenCV, Open Source Computer Vision Library; RF, Random Forest; SHAP, SHapley Additive exPlanations.
3.2. Study Area
This study selects the Jimei School Village Historic and Cultural District in Xiamen as the study area. Centered on Tan Kah Kee culture, the district has developed a distinctive integrated “village-school” spatial pattern. It contains a concentration of Tan Kah Kee-style buildings and retains elements of the traditional Southern Fujian townscape. Historic heritage, everyday life, and contemporary urban functions are closely intertwined, making the district a representative case for examining spatial characteristics and perceptual differences under differentiated heritage governance.
The conservation and management of Jimei School Village are guided at the national level by the Cultural Relics Protection Law of the People’s Republic of China and further regulated by local legislation, including the Regulations of the Xiamen Special Economic Zone on the Protection of Historic Features. According to the Conservation Plan for the Jimei School Village Historic and Cultural District in Xiamen, the 138.1-hectare conservation area is divided into a Core Protection Zone and a Construction Control Zone (Figure 2).
Figure 2.
Location and statutory conservation zoning of the study area.
To further illustrate the street environments of Jimei School Village and their relationship with its architectural heritage, representative heritage sites were selected, including the Nanqiao Building Complex, Nanxun Building Complex, Aoyuan Park, Yangzheng Building, and Yungong Building Complex (Figure 3). The upper row shows the surrounding street environments, while the lower row shows the corresponding heritage buildings or sites. All of these heritage sites are designated as Major Historical and Cultural Sites Protected at the National Level.
Figure 3.
Representative street scenes and corresponding heritage sites in Jimei School Village.
Within the study area, the Core Protection Zone covers 73.6 hectares and contains the principal historic buildings, traditional streets and alleys, and coastal heritage spaces of Jimei School Village (Figure 2). This zone is subject to stricter conservation requirements, and new construction and expansion are generally restricted, except for necessary infrastructure and public-service facilities.
The Construction Control Zone covers approximately 64.5 hectares and serves a transitional and coordinating role between the Core Protection Zone and the surrounding urban environment (Figure 2). New construction, reconstruction, and expansion are permitted under the requirements of the conservation plan, but controls apply to building height, volume, color, form, and visual compatibility with the historic townscape.
To capture visual heterogeneity across the two zones, sampling points were established at 20-m intervals using the Baidu Maps Open Platform. This interval is consistent with previous human-scale and fine-grained streetscape studies and was selected to balance spatial detail against potential redundancy between adjacent images [84]. Robustness analyses showed that the principal zonal differences remained broadly stable after spatial thinning to 40-m and 60-m grids (Supplementary Section S1). Moran’s I indicated significant within-zone spatial dependence, which was addressed through zone-specific spatial block cross-validation (Supplementary Section S2). Images with unsuitable weather or lighting conditions, severe visual obstruction, incomplete panoramas, or obvious distortion were excluded during quality screening. A total of 1714 valid panoramic street-view images were collected, including 760 from the Core Protection Zone and 954 from the Construction Control Zone, forming the database for subsequent feature extraction and perception prediction.
3.3. Selection of Model-Predicted Perception and Objective Visual Indicators
This study combines model-predicted visual perception scores with objective visual features to construct a multidimensional indicator system. Here, visual perception refers to the evaluative impressions evoked by the visible streetscape in street-view images. These scores were generated using ZenSVI, a toolkit developed for crowdsourced urban-perception research [85], which applies a pretrained Massachusetts Institute of Technology (MIT) Place Pulse 2.0 model to each street-view image. The model produced continuous scores for six perceptual dimensions: more beautiful, safer, livelier, wealthier, more boring, and more depressing (Table 1). These results mainly reflect perceptual tendencies inferred by the model from the visual characteristics of the images and cannot fully represent actual human perceptions. Therefore, to examine the applicability of the model in the local context, this study further conducted a human perception assessment as a baseline validation.
Table 1.
Indicator system for model-predicted visual perception.
For objective visual features, color analysis and semantic segmentation were employed to extract the color attributes and compositional elements of street view images (Table 2). Specifically, Open Source Computer Vision Library (OpenCV) was used to convert images into the hue–saturation–value (HSV) color space in order to extract brightness and saturation. In addition, the gray-level co-occurrence matrix and Shannon entropy model were used to calculate image contrast and color entropy. For the composition of spatial elements, a semantic segmentation network pretrained on the ADE20K scene-parsing dataset was applied to classify visual elements, from which core physical environmental indicators such as the green view ratio, sky view ratio, and building ratio were calculated.
Table 2.
Objective indicator system.
The spatial enclosure index was calculated as follows:
where was set to 0.001 as a Laplacian smoothing factor to avoid computational overflow when the sky ratio is zero. Building Ratio and Sky Ratio capture the visible proportions of buildings and sky, while the Enclosure Index expresses their relative spatial relationship [86].
3.4. Participants and Human Rating Procedure
To assess the contextual applicability of the pretrained perception model, a locally grounded human-validation assessment was conducted with 10 postgraduate participants majoring in architecture, landscape architecture, and other built-environment-related disciplines. All participants had lived within Jimei School Village for two to three years and were therefore regarded as local residents with sustained everyday familiarity with the historic district.
This purposive selection combined direct and sustained residential experience with professional training in interpreting architectural and streetscape environments. Their period of residence enabled them to develop stable familiarity with local spatial conditions and everyday environmental qualities, while their built-environment backgrounds supported more careful evaluation of the visual characteristics represented in the street-view images. Accordingly, the participants combined resident perspectives with professional knowledge, and their assessments were considered capable of reasonably representing local residents’ visual perceptions within the scope of this study.
A total of 100 street-view images, comprising 50 images randomly selected from each statutory zone, were independently evaluated across the same six perceptual dimensions used by the pretrained model. Inter-rater consistency was assessed using the intraclass correlation coefficient (ICC). Pearson’s correlation was used to examine the correspondence between the mean participant ratings and model-predicted scores.
4. Data Analysis
Prior to the comparative analysis, Mann–Whitney U tests were conducted to examine differences between the Core Protection Zone and the Construction Control Zone (Table 3). To account for multiple comparisons, the resulting p-values were adjusted using the Benjamini–Hochberg false discovery rate (BH-FDR) procedure, while absolute rank-biserial correlation values (|RBC|) were reported to quantify the magnitude of the zonal differences. All differences that were statistically significant based on the raw p-values remained significant after BH-FDR correction. Among the objective visual features, the largest effect sizes were observed for Ratio_Greenery, Ratio_Building, and Enclosure_Index, whereas More depressing, More beautiful, and Livelier exhibited the largest effect sizes among the model-predicted perceptual indicators. These findings provide a statistical basis for the subsequent comparative and explanatory analyses.
Table 3.
Mann–Whitney U test results and effect sizes for zonal differences between the Core Protection Zone and the Construction Control Zone.
4.1. Analysis of Objective Visual Features
From the perspective of objective visual feature data, the Core Protection Zone of the Jimei School Village Historic District shows specific quantifiable characteristics in terms of spatial form and the distribution of natural elements (Table 4). The descriptive statistics indicate that the mean value of the green view ratio is 13.6%, while the mean value of the sky view ratio is 26.6%. Regarding the composition of the spatial interface, the mean building ratio is 15.6%. The Enclosure Index has a mean value of 0.772, a median value of 0.534, and a maximum value of 4.689. These results suggest that, in most street view images within the Core Protection Zone, visual obstruction by physical interfaces is relatively limited, and the overall spatial form tends to be open. In addition, the mean value of Color_Entropy is 7.283, and the average brightness is 152.320, indicating a relatively stable visual environment with moderate brightness. By contrast, the Construction Control Zone shows a different distribution of spatial and visual indicators. The mean sky view ratio in this area remains at 26.6%, whereas the building ratio increases to 20.1%, and the mean green view ratio decreases to 9.9%. In terms of spatial geometry, the mean Enclosure Index in the Construction Control Zone rises to 1.093, with a maximum value of 11.256. This indicates that, compared with the Core Protection Zone, the Construction Control Zone contains a higher proportion of narrow streets and lanes with strong spatial enclosure. In the dimension of visual features, both Color_Entropy and average color saturation are slightly higher than those of the core area. Together with the relatively high maximum proportion of motor vehicles in this zone, these findings suggest that the peripheral environment contains more diverse and complex visual elements.
Table 4.
Descriptive statistics of objective visual features in the two zones.
A cross-sectional comparison of the objective data from the two zones reveals clear differences in their built-environment characteristics. In terms of morphological indicators, the Construction Control Zone generally shows higher building ratio and spatial enclosure than the Core Protection Zone, suggesting a relatively denser physical interface in the Construction Control Zone. By contrast, the core area retains a visual pattern of lower spatial density. Regarding natural elements, the green view ratio shows a declining tendency from the core area toward the periphery. In addition, the relatively higher values of color complexity and certain dynamic elements, such as motor vehicles, in the Construction Control Zone objectively reflect its role in accommodating ordinary urban operation and construction-related functions. Overall, the descriptive statistical results provide an initial picture of the differences in spatial composition between the two landscape layers, and offer a data basis for the subsequent analysis of the relationship between objective visual elements and perception prediction results.
4.2. Analysis of Visual Perception Prediction Results
Before conducting model prediction, the locally grounded human-rating assessment showed good inter-rater reliability, with ICC values ranging from 0.774 to 0.874 (Table 5). Pearson’s correlation coefficients between the mean participant ratings and model-predicted scores ranged from 0.359 to 0.572 and were significantly positive in both statutory zones, indicating a meaningful, although incomplete, degree of correspondence between the two assessment approaches [87,88]. These findings suggest that the pretrained model captures broad perceptual tendencies in the local street-view context and can therefore be used as a scalable and exploratory tool for generating model-predicted perceptual indicators, rather than as a substitute for locally grounded human assessment.
Table 5.
Participant-rating reliability and contextual validation results.
In the visual perception prediction results, the Core Protection Zone of Jimei School Village generally shows a positive and relatively consistent perceptual tendency (Table 6). The data indicate that this zone has the highest mean value in the “wealthier” dimension, reaching 6.352, while its standard deviation is the lowest among all indicators. This suggests that the well-preserved historic building complexes and relatively unified townscape in this zone convey a stable and strong perception of environmental quality. Meanwhile, the mean values of “safer” and “more beautiful” in the core zone reach 5.748 and 5.094, respectively, both remaining at relatively high levels. In the negative perception dimensions, the mean values of “more depressing” and “more boring” are relatively low, at 4.603 and 4.249, respectively. This distribution may be related to the relatively open spatial scale of the core zone and the higher proportion of natural landscape elements.
Table 6.
Descriptive statistics of visual prediction results.
The Construction Control Zone presents different numerical tendencies and more pronounced zonal variations in its perception prediction results (Figure 4). In terms of central tendency, the mean values of “wealthier” and “safer” remain within relatively high ranges, while “livelier” reaches 5.605. This corresponds to the area’s objective role in accommodating more modern commercial functions and everyday urban activities. However, in terms of data dispersion, the Construction Control Zone shows clear internal variation. The standard deviation of “more depressing” is the highest, reaching 1.262, with a range of 7.878. This indicates that some local narrow streets and alleys may be associated with higher scores on the model-predicted “more depressing” dimension. In addition, the standard deviation of “more beautiful” is also relatively high. This reflects fluctuations in the overall visual aesthetic quality of the Construction Control Zone, where high-quality landscape nodes coexist with areas of weaker visual perception.
Figure 4.
Visualization of Predicted Visual Perception Results.
A horizontal comparison of the perception data from the two zones reveals how differences in objective spatial characteristics are reflected at the perceptual level. In the positive perception dimensions, the Core Protection Zone has higher mean values than the Construction Control Zone in “more beautiful,” “safer,” and “wealthier,” indicating that the historic core has advantages in model-predicted visual aesthetics and environmental reassurance. By contrast, the Construction Control Zone scores higher only in “livelier,” while its “more boring” value is relatively lower. This is consistent with its denser building interfaces and higher level of dynamic traffic elements. Differences in negative perception are also evident between the two zones: both the mean value and dispersion of “more depressing” are much higher in the Construction Control Zone than in the core zone. This perceptual gap corresponds logically to the higher spatial enclosure of the peripheral area identified in the previous objective data. Overall, the core zone is characterized by a relatively quiet, visually pleasant, and homogeneous perception pattern, whereas the Construction Control Zone shows a more heterogeneous perceptual profile, with higher predicted liveliness but more pronounced negative perceptual predictions in some locations.
4.3. Street-View Clustering Analysis
To examine the relationship between objective visual features and model-predicted visual perception in the Jimei School Village Historic District, K-Means clustering was applied to the full sample within a 17-dimensional feature space. All variables were standardized using Z-score transformation to reduce the influence of differences in numerical scale. The number of clusters was evaluated using the elbow method, silhouette coefficient, Calinski–Harabasz index, and Davies–Bouldin index, together with a comparison of the structures obtained under K = 3, K = 4, and K = 5. Although the evaluation metrics did not consistently indicate a single preferred solution, K = 3 merged two street-view profiles with distinguishable physical and model-predicted perceptual characteristics. K = 4 retained this meaningful distinction and produced four relatively balanced and interpretable profiles. K = 5 largely preserved these profiles while adding a transitional type, increasing classification complexity without improving the main internal validation results. K = 4 was therefore selected as a preferable interpretive solution that preserved meaningful streetscape differences while maintaining sufficient parsimony for subsequent spatial analysis (Figure 5; Supplementary Section S3).
Figure 5.
Evaluation of candidate cluster solutions for streetscape classification.
Based on the K-Means clustering results, four street-view spatial prototypes with clear heterogeneity were identified. The clusters show a certain degree of correspondence between objective visual features and perception prediction results (Figure 6).
Figure 6.
Clustering results.
Cluster 1: Open and visually permeable space
This type of space shows the highest sky view ratio and relatively high average brightness among all clusters, while its building ratio and spatial enclosure are very low. Such a visually open environment, with limited building obstruction, is reflected in higher predicted levels of “safer” and “more beautiful,” while “more depressing” is notably reduced. However, due to the relatively low density of vehicles and pedestrians, the predicted “livelier” value of this type of space remains comparatively low. Overall, it presents a quiet, safe, and open landscape character.
Cluster 2: Low-color hardscape space
This type of space is characterized by very low color saturation, color entropy, and visual contrast. In terms of objective elements, it has a relatively high road ratio but a severe lack of greenery. The presence of high-exposure grey-white hard paving and the absence of natural elements make this type of space strongly perceived as “more boring” and “more depressing.” Its performance in “more beautiful” and “livelier” is relatively low, typically reflecting passive through-spaces that lack design quality and visual stimulation.
Cluster 3: Highly building-enclosed space
This is the category with the most extreme physical characteristics. It has relatively high building ratio and spatial enclosure, which correspondingly reduce the proportions of sky and natural greenery. The strong sense of spatial closure generated by high-density buildings is associated with higher predicted values of “more depressing” within the full sample, together with very low levels of “safer” and “more beautiful.” Although a certain degree of pedestrian concentration exists in this type of space, it generally shows lower positive perception predictions and higher negative perception predictions.
Cluster 4: High-green-view shaded space
This type of space is a highly enclosed environment formed by natural vegetation cover. Objectively, it has an extremely high green view ratio and rich color entropy, while dense tree canopies reduce both sky view ratio and brightness to the lowest levels. However, this natural shade does not lead to stronger perceived depression. Instead, it is associated with very high predicted values of “more beautiful” and the highest predicted level of “livelier” across the whole study area. This result suggests that, in the model predictions, a high green view ratio and richer natural colors may help moderate the negative perceptual effects associated with low brightness or strong shading.
The proportions of the four cluster types in the two conservation zones provide an intuitive representation of differences in the composition of physical space and model-predicted perceptual characteristics in Jimei School Village (Figure 7). Overall, the street-scene types in the two zones do not form a simple binary opposition but show considerable internal diversity and cross-zone overlap. The spatial distribution of the clustered street-view samples and the representative locations of the four clusters in each zone are separately marked to improve the readability of the results (Figure 8). In Figure 8, red dashed circles indicate the representative sample locations. Core-C1 to Core-C4 correspond to the four clusters in the Core Protection Zone, while Cons-C1 to Cons-C4 correspond to the four clusters in the Construction Control Zone. These locations correspond to the representative street scenes presented in Figure 9 and Figure 10.
Figure 7.
Proportions of the four street-scene clusters in the two conservation zones.
Figure 8.
Spatial distribution of the street-scene clusters and locations of representative samples.Core-C1–Core-C4 denote Clusters 1–4 in the Core Protection Zone, and Cons-C1–Cons-C4 denote Clusters 1–4 in the Construction Control Zone.
Figure 9.
Representative street scenes of the four clusters in the Construction Control Zone.
Figure 10.
Representative street scenes of the four clusters in the Core Protection Zone.
Clusters 3 and 1 account for relatively high proportions in the Construction Control Zone. The higher proportion of Cluster 3 may, to some extent, reflect the influence of urban development, with some areas characterized by larger spatial scales and higher building density. Cluster 1 also accounts for a relatively high proportion and mainly corresponds to wide modern roads, open squares, and other open spaces. These environments generally have a higher sky view ratio and fewer visual obstructions. The coexistence of these two contrasting spatial conditions reflects the complexity of the internal spatial composition of the Construction Control Zone (Figure 9).
By comparison, Clusters 4 and 2 account for relatively high proportions in the Core Protection Zone, reflecting the diversity of street-scene types within the traditional historic environment. Cluster 4 is mainly characterized by the interweaving of ancient and notable trees, greenery, and Tan Kah Kee-style buildings. Its higher green view ratio and color entropy are associated with stronger predicted liveliness. Cluster 2 may correspond to traditional streets and alleys scattered throughout the historic district, together with relatively homogeneous street interfaces. These environments contain relatively limited natural vegetation and receive higher scores for model-predicted boredom, but they also constitute an authentic part of the environmental fabric of the historic district (Figure 10).
5. Discussion
5.1. Nonlinear Contributions of Physical Elements to Model-Predicted Perception
To quantify the influence of objective physical elements on model-predicted visual perception, this study calculated the global mean absolute SHAP values of the Random Forest models for the Core Protection Zone and the Construction Control Zone. Feature-importance rankings were then used to interpret the contribution patterns associated with the six perceptual dimensions.
Before conducting SHAP feature attribution, model performance was evaluated using 10-fold cross-validation (Table 7) and three metrics: the coefficient of determination (R2), root mean square error (RMSE), and mean absolute error (MAE). Hyperparameters were optimized separately for each perceptual dimension and zone through grid search, with the combination producing the lowest cross-validated RMSE selected for the final model. The complete search space, optimal parameter combinations, and fold-level results are provided in the Supplementary Section S4.
Table 7.
10-fold cross-validation performance metrics of the Random Forest models across the two zones.
The results show that “More depressing” achieved the highest goodness-of-fit in both zones, with R2 values of 0.4243 in the Core Protection Zone and 0.5282 in the Construction Control Zone, whereas “Wealthier” exhibited the lowest predictive performance. This suggests that wealth-related perception may depend more strongly on socioeconomic and contextual characteristics that are not directly captured by the selected visual indicators. The models for the Construction Control Zone generally produced higher R2 values than those for the Core Protection Zone. This difference may reflect the stronger role of macroscopic physical morphology in recently developed environments, whereas perception in the historic core may also be shaped by locally specific architectural details, material combinations, cultural associations, and accumulated spatial experience. These cross-validation results provide a quantitative basis for the subsequent comparison of SHAP feature-contribution patterns between the two zones. A supplementary comparison with extreme gradient boosting (XGBoost) showed similar cross-dimensional and inter-zonal performance patterns, together with substantial overlap in the three highest-ranking SHAP features, supporting the general robustness of the main model-based interpretations (Supplementary Sections S5 and S6). Nevertheless, the SHAP results should be interpreted as exploratory, model-based evidence of associations between observable visual characteristics and predicted perception, rather than as direct causal effects on the actual experiences of residents or visitors.
5.1.1. Core Protection Zone
Within the Core Protection Zone, the model predictions for “Livelier” and “More boring” show relatively high sensitivity to color entropy (Figure 11). Higher color entropy is generally associated with higher predicted vitality and lower predicted monotony, whereas a higher sky view ratio shows the opposite tendency. This suggests that the visual layering formed by Tan Kah Kee-style buildings, red-brick and white-stone materials, greenery, and historic street interfaces may contribute to the recognizability and perceived vitality of the historic environment.
Figure 11.
SHAP Summary Plots for the Core Protection Zone.
For “More depressing,” average color saturation, building ratio, and green view ratio make the strongest explanatory contributions. Higher building ratios are generally associated with stronger depressive predictions, while lower saturation, brightness, greenery, and color entropy show similar negative contribution patterns. These results correspond to narrow alleys, ageing interfaces, and insufficiently planted spaces within the historic core, indicating that localized improvements in lighting, vegetation, and facade maintenance may enhance the visual quality of frequently used pedestrian spaces without altering the historic fabric.
In the “Safer” dimension, motor vehicle ratio has the highest feature importance, followed by sky view ratio and road ratio. Visible motor vehicles are mainly associated with lower predicted safety, whereas moderately open views and clearly organized road space tend to contribute positively. This pattern reflects the importance of managing conflicts among resident movement, student activity, and visitor flows in the limited street space of the historic core.
For “More beautiful,” green view ratio, color entropy, road ratio, saturation, and brightness make relatively strong contributions. Vegetation, color layering, and appropriate brightness appear to support the model-predicted aesthetic quality of the core zone, particularly where planting and pedestrian-scale interfaces complement the historic architecture. In the prediction of “Wealthier,” building ratio, visual contrast, enclosure index, and saturation show relatively strong contributions, suggesting that the model mainly captures visual order, spatial definition, and maintenance conditions rather than actual socioeconomic status.
5.1.2. Construction Control Zone
Compared with the Core Protection Zone, the Construction Control Zone shows a stronger dependence on the green view ratio (Figure 12). Greenery makes the highest explanatory contributions to “More depressing,” “More beautiful,” and “Safer.” Higher vegetation visibility is generally associated with lower predicted depressiveness and higher predicted beauty and safety, whereas stronger building dominance and enclosure tend to show the opposite pattern. In these modernized and traffic-oriented areas, vegetation may therefore play an important role in softening hard interfaces and improving the continuity and comfort of everyday walking routes.
Figure 12.
SHAP Summary Plots for the Construction Control Zone.
For “Livelier” and “More boring,” sky view ratio makes the strongest explanatory contribution. Higher sky exposure is generally associated with lower predicted vitality and higher predicted monotony, suggesting that openness alone does not necessarily create a positive spatial experience. Wide roads, large setbacks, and weakly defined edges may appear empty when they lack greenery, shading, active frontages, or sufficient visual layering. By contrast, color diversity, moderate enclosure, and clearly organized road space are more positively associated with vitality.
In the “Safer” dimension, green view ratio and road proportion make the strongest contributions, followed by enclosure index, saturation, and building ratio. Continuous vegetation and clearly organized circulation space are generally associated with higher predicted safety, while stronger enclosure and building dominance are more often associated with negative contributions. This indicates that perceptual quality in the Construction Control Zone depends not only on controlling development intensity, but also on improving pedestrian routes, planting continuity, spatial legibility, and connections to the historic core. Such improvements may better support both residents’ daily movement and visitor access to major heritage destinations.
For “Wealthier,” the contribution pattern mainly reflects the visible condition and organization of the built environment, including building interfaces, spatial definition, color conditions, and streetscape maintenance. Rather than directly representing socioeconomic status, this dimension appears to capture a model-predicted impression of environmental order and prosperity.
5.2. Zonal Renewal Strategies for the Historic District
The combined results of the objective visual-feature comparison, model-predicted perception analysis, and streetscape clustering indicate that the Core Protection Zone and the Construction Control Zone should not be treated as a homogeneous spatial unit. The Core Protection Zone is characterized by relatively higher greenery and a finer-grained historic street environment, whereas the Construction Control Zone generally shows higher building ratios, stronger enclosure, and more pronounced modern development features. Perceptually, the historic core is more sensitive to color layering, historic interfaces, and traffic interference, while the Construction Control Zone depends more strongly on vegetation visibility, spatial openness, and road-space organization. The clustering results further reveal different proportions of streetscape types in the two zones, although these types do not correspond directly to statutory boundaries. These differences support a zonal renewal approach that responds to both conservation context and local street conditions, while coordinating heritage protection, everyday use, visitor experience, and spatial management.
For the Core Protection Zone, renewal should follow a principle of small-scale, context-sensitive intervention, with emphasis on historic color, material authenticity, and slow-mobility experience. The contribution of color entropy to predicted vitality and aesthetic quality suggests that large-scale, homogenized facade repainting should be avoided. Restoration should retain the characteristic red-brick and white-stone palette of Tan Kah Kee-style architecture, together with the material variation that supports the visual identity of the historic environment. Where severe weathering or physical deterioration affects environmental quality, localized cleaning and repair may be undertaken without creating an excessively renewed appearance. Traffic management should also respond to the negative association between visible motor vehicles and predicted safety. Time-based vehicle restrictions, pedestrian-priority streets, controlled parking, and clearer separation of pedestrian and vehicle movement may help improve walking conditions while maintaining necessary access for residents, businesses, and service activities. Greenery interventions should remain restrained because of the compact historic fabric. Small shade trees, courtyard planting, vertical greening, and sparsely arranged shrubs may improve walking and resting conditions without obscuring important facades. These measures may be combined with seating, wayfinding, and small public-use spaces to support both daily activities and visitor circulation.
For the Construction Control Zone, renewal should focus on vegetation continuity, spatial definition, pedestrian accessibility, and the relationship between modern development and the historic core. The strong contribution of greenery to predicted beauty, safety, and depressiveness indicates that planting should be treated as an integral part of street and public-space design. Continuous street trees, shaded pedestrian routes, planted buffers, and appropriately scaled green spaces could soften large building interfaces and improve walking conditions along residential, institutional, commercial, and visitor routes. Greenery provision should nevertheless be adapted to street function and maintenance capacity rather than applied as a uniform numerical standard. The association between high sky view ratios, lower predicted vitality, and higher monotony also suggests that wide roads, large setbacks, and poorly defined open edges require stronger spatial and functional organization. Trees, shaded walkways, seating, small landscape structures, active ground-floor interfaces, and clearly defined pedestrian zones may help create more comfortable and engaging public spaces. New construction and redevelopment should therefore be evaluated not only through height, volume, and facade control, but also through their effects on street continuity, pedestrian comfort, public activity, and visual transitions toward the Core Protection Zone. Clear crossings, identifiable entrances, interpretive signage, and continuous walking connections may further support residents’ daily movement and visitors’ orientation toward major heritage destinations.
Overall, zonal renewal in Jimei School Village should balance conservation management with the needs of residents, students, visitors, businesses, and other local users. The Core Protection Zone should prioritize historic character and fine-grained slow-mobility improvements, while the Construction Control Zone should emphasize vegetation continuity, pedestrian comfort, spatial legibility, and the coordination of modern development with the historic setting. Together, these differentiated strategies can support both long-term conservation and the continued vitality of Jimei School Village.
5.3. Research Limitations and Future Directions
This study has three main limitations. First, open-source street-view imagery mainly represents vehicle-accessible roads and conditions at a specific time. Narrow alleys, courtyards, pedestrian-only spaces, and subsequent changes in vegetation, facades, traffic, or public-space use may therefore be insufficiently captured. Second, although the participants were local residents with built-environment backgrounds, they do not represent the full range of residents and other users. The six Place Pulse dimensions also cannot fully reflect heritage-related experiences such as place identity, cultural attachment, and perceived authenticity. Third, model performance varied across perceptual dimensions, and the SHAP results represent model-dependent contribution patterns rather than causal effects. As the analysis was conducted in a single historic district, the predictive performance and feature-contribution patterns cannot be assumed to remain unchanged in other contexts.
Future research could combine platform imagery with pedestrian-level photography, repeated image collection, and field investigation to improve spatial coverage and temporal verification. A heritage-specific perception framework could be developed through questionnaires, interviews, and participatory methods involving broader resident and user groups, with everyday experiences informing interpretation and design refinement. Comparative studies across historic districts are needed to test the analytical framework under different cultural, spatial, and conservation conditions. Field-based scenario testing could further examine alternative strategies for facade treatment, planting, traffic organization, and pedestrian-space improvement.
These extensions would strengthen the contextual applicability of the analytical framework and support a closer connection between model-based evidence, local experience, and practical heritage renewal.
6. Conclusions
This study developed an integrated framework combining street-view imagery, visual-feature measurement, perception prediction, streetscape clustering, and explainable machine learning to compare the Core Protection Zone and the Construction Control Zone of Jimei School Village. It treats the historic district as a differentiated spatial system and examines how objective visual characteristics, model-predicted perceptions, streetscape types, and feature contributions vary between statutory conservation zones.
The results reveal clear but non-binary zonal differentiation. The Construction Control Zone shows higher building ratios, stronger enclosure, and slightly greater color entropy, while the Core Protection Zone contains more visible greenery. Mean sky view ratios are broadly similar. Streetscape clusters also differ in their zonal distribution, but they do not align directly with statutory boundaries. Internal heterogeneity and cross-zone overlap remain, indicating that conservation zoning is associated with distinct visual tendencies rather than two separate streetscape systems.
SHAP analysis further identifies zone-specific, model-dependent contribution patterns. In the Core Protection Zone, color layering is associated with predicted vitality and aesthetic quality, whereas ageing interfaces, limited greenery, and visible motor vehicles contribute to less favorable predictions. Renewal should therefore retain the red-brick and white-stone character of Tan Kah Kee-style architecture, improve deteriorated interfaces, and reduce conflicts between vehicles and slow movement through small-scale, context-sensitive interventions. In the Construction Control Zone, greenery, spatial openness, and road-space organization play stronger roles. Continuous planting, clearer pedestrian routes, active frontages, and better-defined edges may improve comfort and reduce monotony while strengthening the transition toward the historic core. Across both zones, renewal should balance conservation with the everyday needs of residents and other local users.
The main contribution of this study is an integrated approach to identifying and interpreting internal differentiation within a historic district. By linking objective visual features, model-predicted perceptions, joint streetscape typologies, and zone-specific feature attribution, it shows that the same visual element may play different explanatory roles under different conservation and development conditions. Framing the historic district as a Historic Urban Landscape also helps retain fine-grained cultural, spatial, and experiential differences that may be obscured in city-wide analysis. The framework therefore offers a refined basis for differentiated, human-oriented renewal and a transferable reference for comparable historic districts.
Supplementary Materials
The following supporting information can be downloaded at: https://www.mdpi.com/article/10.3390/buildings16153083/s1. Supplementary File S1: Supplementary Materials (PDF), containing the following six sections: S1. Spatial Thinning Sensitivity Analysis of Multi-modal Streetscape Data; S2. Spatial Autocorrelation Assessment and Zone-Specific Model Robustness Analysis; S3. Cluster-Number Validation and Structural Sensitivity Analysis; S4. Hyperparameter Optimization and Random Forest Model Specifications; S5. Predictive Performance Comparison Between Random Forest and XGBoost; and S6. Cross-Model Robustness of SHAP Feature-Contribution Patterns. Code S1: Supporting_Information_Code, a separate code package containing the Jupyter Notebook Supporting_Information_Code.ipynb.
Author Contributions
Conceptualization, Z.S. and L.L.; methodology, Z.S., X.L. and M.D.; formal analysis, Z.S.; data curation, Z.S.; validation, Z.S., H.Z., X.L. and M.D.; visualization, Z.S.; writing—original draft preparation, Z.S.; writing—review and editing, L.L., H.Z., X.L. and M.D.; supervision, L.L. and H.Z.; funding acquisition, L.L. All authors have read and agreed to the published version of the manuscript.
Funding
This research was funded by the 2026 Social Science Research Project of the Federation of Social Science Circles of Jimei District, Xiamen, grant number 18; and Huaqiao University’s Academic Project Supported by the Fundamental Research Funds for the Central Universities, grant number 2025HQYJ04.
Data Availability Statement
The data presented in this study are available on request from the corresponding author. The original street view images are not publicly available due to third-party map platform licensing restrictions and privacy considerations. However, spatial data, including map extents and geographical zoning used in this study, can be obtained by contacting the corresponding author with a reasonable request, subject to approval.
Acknowledgments
The authors sincerely thank those who provided valuable assistance and support during the preliminary field investigations, which contributed to the establishment of this research. We also extend our sincere gratitude to the participants who contributed to the contextual human-rating assessment. All individuals referred to in this section have consented to being acknowledged. The authors have reviewed and edited the output and take full responsibility for the content of this publication.
Conflicts of Interest
The authors declare no conflicts of interest.
Abbreviations
The following abbreviations are used in this manuscript:
| ADE20K | ADE20K scene-parsing dataset |
| API | Application Programming Interface |
| BH-FDR | Benjamini–Hochberg False Discovery Rate |
| CLIP | Contrastive Language–Image Pre-training |
| HUL | Historic Urban Landscape |
| HSV | Hue, Saturation, and Value |
| ICC | Intraclass Correlation Coefficient |
| LIME | Local Interpretable Model-Agnostic Explanations |
| MAE | Mean Absolute Error |
| MIT | Massachusetts Institute of Technology |
| OpenCV | Open Source Computer Vision Library |
| RBC | Rank-Biserial Correlation |
| RF–SHAP | Random Forest–SHapley Additive exPlanations |
| RMSE | Root Mean Square Error |
| SHAP | SHapley Additive exPlanations |
| SSE | Sum of Squared Errors |
| SVI | Street View Imagery |
| ViT | Vision Transformer |
| XAI | Explainable Artificial Intelligence |
| XGBoost | eXtreme Gradient Boosting |
References
- Li, J.; Luo, J.; Deng, T.; Tian, J.; Wang, H. Exploring Perceived Restoration, Landscape Perception, and Place Attachment in Historical Districts: Insights from Diverse Visitors. Front. Psychol. 2023, 14, 1156207. [Google Scholar] [CrossRef] [Scilit] [PubMed]
- Cao, Y.; Han, R.; Luo, Z. Bridging World Heritage and Local Heritage: Incorporating the Buffer Zone Concept into Chinese Architectural Heritage Protection. Buildings 2025, 15, 3652. [Google Scholar] [CrossRef] [Scilit]
- UNESCO. Recommendation on the Historic Urban Landscape, Including a Glossary of Definitions; UNESCO: Paris, France, 2011. [Google Scholar]
- Rey-Pérez, J.; Pereira Roders, A. Historic Urban Landscape: A Systematic Review, Eight Years after the Adoption of the HUL Approach. J. Cult. Herit. Manag. Sustain. Dev. 2020, 10, 233–258. [Google Scholar] [CrossRef] [Scilit]
- Tian, Y.; Sun, D.; Lyu, M.; Wang, S. Enhancing Pedestrian Satisfaction: A Quantitative Study of Visual Perception Elements. Buildings 2025, 15, 4389. [Google Scholar] [CrossRef] [Scilit]
- Zhang, Y.; Chen, S.; Hoistad, M.A. Sustainable Development Strategy for Historic Neighborhood Shrinkage: Taking Puhuiquan Neighborhood in Yulin, China, as an Example. Herit. Sci. 2024, 12, 67. [Google Scholar] [CrossRef] [Scilit]
- Zhao, P.; Md Ali, Z.; Nik Hashim, N.H.; Ahmad, Y.; Wang, H. Evaluating Social Sustainability of Urban Regeneration in Historic Urban Areas in China: The Case of Xi’an. J. Environ. Manag. 2024, 370, 122520. [Google Scholar] [CrossRef] [Scilit] [PubMed]
- Liu, J.; Yang, L.; Xiong, Y.; Yang, Y. Effects of Soundscape Perception on Visiting Experience in a Renovated Historical Block. Build. Environ. 2019, 165, 106375. [Google Scholar] [CrossRef] [Scilit]
- Cao, Y.; Yang, P.; Xu, M.; Li, M.; Li, Y.; Guo, R. A Novel Method of Urban Landscape Perception Based on Biological Vision Process. Landsc. Urban Plan. 2025, 254, 105246. [Google Scholar] [CrossRef] [Scilit]
- Xie, Q.; Hu, L.; Wu, J.; Shan, Q.; Li, W.; Shen, K. Investigating the Influencing Factors of the Perception Experience of Historical Commercial Streets: A Case Study of Guangzhou’s Beijing Road Pedestrian Street. Buildings 2024, 14, 138. [Google Scholar] [CrossRef] [Scilit]
- Zeng, X.; Zhang, C.; Xu, D. Developing and Validating a Scale to Measure Perceived Cultural Atmosphere in Historic Districts. Asia Pac. J. Tour. Res. 2024, 29, 1152–1169. [Google Scholar] [CrossRef] [Scilit]
- Zhou, J.; Zhou, Y.; Li, D. Exploring the Complex Mechanism of the Influence of a Multisensory Tourism Experience on Tourists’ Mental Restoration in the Research Context of Historical and Cultural Blocks. Curr. Issues Tour. 2024, 27, 2682–2702. [Google Scholar] [CrossRef] [Scilit]
- Mehaffy, M.W.; Haas, T.; Locke, R. Urban Heritage as Embodied Intelligence: The Adaptive Patterns Model. Urban Sci. 2026, 10, 213. [Google Scholar] [CrossRef] [Scilit]
- Mehaffy, M.W.; Jiang, B. Reassessing Christopher Alexander’s Theory of Urban Morphogenesis. Comput. Urban Sci. 2025, 5, 36. [Google Scholar] [CrossRef] [Scilit]
- Gehl, J. Life Between Buildings: Using Public Spaces, 6th ed.; The Danish Architectural Press: Copenhagen, Denmark, 2006. [Google Scholar]
- Zhao, W.; Rui, Q.; Zhu, X.; Xu, H. Effect of Soundscape on Place Attachment for Historical Blocks: A Case Study of Harbin, China. Buildings 2023, 13, 607. [Google Scholar] [CrossRef] [Scilit]
- Hu, Y.; Meng, Q.; Li, M.; Yang, D. Enhancing Authenticity in Historic Districts via Soundscape Design. Herit. Sci. 2024, 12, 396. [Google Scholar] [CrossRef] [Scilit]
- Ye, J.; Li, S.; Chen, Y.; Ma, Y.; Chen, L.; He, T.; Zheng, Y. A Study of the Effects of Historical Block Context on Soundscape Perception. Buildings 2024, 14, 621. [Google Scholar] [CrossRef] [Scilit]
- Lin, J.; Zhang, M.; Wang, Y.; Hong, X.-C.; Liu, J. Factors Influencing Natural and Cultural Soundscape Interactions on Perceptual Experiences in Forested–Historical Interface Areas. Buildings 2025, 15, 4103. [Google Scholar] [CrossRef] [Scilit]
- Nicol, J.F.; Roaf, S. Rethinking Thermal Comfort. Build. Res. Inf. 2017, 45, 711–716. [Google Scholar] [CrossRef] [Scilit]
- McDonald, R.I.; Aronson, M.F.J.; Beatley, T.; Beller, E.; Bazo, M.; Grossinger, R.; Jessup, K.; Mansur, A.V.; Puppim de Oliveira, J.A.; Panlasigui, S.; et al. Denser and Greener Cities: Green Interventions to Achieve Both Urban Density and Nature. People Nat. 2023, 5, 84–102. [Google Scholar] [CrossRef] [Scilit]
- Beatley, T.; Newman, P. Biophilic Cities Are Sustainable, Resilient Cities. Sustainability 2013, 5, 3328–3345. [Google Scholar] [CrossRef] [Scilit]
- Wu, D.; Xiao, X.; Deng, L.; Wu, W. Evaluation of Landscape Elements in Urban Waterfront Parks Based on Visual Perception: Construction and Validation of a Multi-Dimensional Framework Integrating Eye-Tracking Experiments and Semantic Segmentation. Environ. Dev. Sustain. 2026. [Google Scholar] [CrossRef] [Scilit]
- Hollander, J.B.; Naughton, L.; Miller, E.L.; Jacob, R.J.K. The Walkable Neighborhood and Public Art: Using AI to Measure the Impact of Visual Interest on Pedestrian Behavior. Urban Des. Int. 2025, 30, 37–54. [Google Scholar] [CrossRef] [Scilit]
- Hollander, J.B.; Anderson, E.C. The Impact of Urban Facade Quality on Affective Feelings. Archnet-IJAR Int. J. Archit. Res. 2020, 14, 219–232. [Google Scholar] [CrossRef] [Scilit]
- Lavdas, A.A.; Sussman, A. Quantifying Emotional Responses to Traditional and Modern Architecture: The Case of US Federal Buildings. Appl. Sci. 2026, 16, 4406. [Google Scholar] [CrossRef] [Scilit]
- Hollander, J.B.; Sussman, A.; Lowitt, P.; Angus, N.; Situ, M.; Magnuson, A. Insights into Wayfinding: Urban Design Exploration through the Use of Algorithmic Eye-Tracking Software. J. Urban Des. 2023, 28, 274–295. [Google Scholar] [CrossRef] [Scilit]
- Zheng, S.; Zhang, J.; Zu, R.; Li, Y. Visual Perception Differences and Spatiotemporal Analysis in Commercialized Historic Streets Based on Mobile Eye Tracking: A Case Study in Nanchang Wanshou Palace, China. Buildings 2024, 14, 1899. [Google Scholar] [CrossRef] [Scilit]
- Szekely, D.; Vert, S.; Rotaru, O.; Andone, D. Usability Evaluation with Eye Tracking: The Case of a Mobile Augmented Reality Application with Historical Images for Urban Cultural Heritage. Heritage 2023, 6, 3256–3270. [Google Scholar] [CrossRef] [Scilit]
- Chen, L.; Cai, X.; Liu, Z. Multi-Source Data and Semantic Segmentation: Spatial Quality Assessment and Enhancement Strategies for Jinan Mingfu City from a Tourist Perception Perspective. Buildings 2025, 15, 2298. [Google Scholar] [CrossRef] [Scilit]
- Guo, Z.; Xu, H.; Lin, Q.; Li, X. Deep Learning Assessment of Street Spatial Quality in Old Residential Communities of Wuchang, Wuhan, China. Sci. Rep. 2025, 15, 45176. [Google Scholar] [CrossRef] [Scilit] [PubMed]
- Shi, J.; Yan, Y.; Li, M.; Zhou, L. Measuring the Convergence and Divergence in Urban Street Perception among Residents and Tourists through Deep Learning: A Case Study of Macau. Land 2024, 13, 345. [Google Scholar] [CrossRef] [Scilit]
- Jiang, S.; Liu, J. Comparative Study of Cultural Landscape Perception in Historic Districts from the Perspectives of Tourists and Residents. Land 2024, 13, 353. [Google Scholar] [CrossRef] [Scilit]
- Fan, J.; Li, K.; Gu, T. Landscape Character Assessment of Urban Historical and Cultural Blocks and Landscape Design for Place Attachment Enhancement—A Case Study of Sanxuejie Historical and Cultural Block in Xi’an, China. J. Asian Archit. Build. Eng. 2026, 25, 3761–3779. [Google Scholar] [CrossRef] [Scilit]
- Xie, H.; He, Y.; Wu, X.; Lu, Y. Interplay between Auditory and Visual Environments in Historic Districts: A Big Data Approach Based on Social Media. Environ. Plan. B Urban Anal. City Sci. 2022, 49, 1245–1265. [Google Scholar] [CrossRef] [Scilit]
- Yu, B.; Sun, J.; Wang, Z.; Jin, S. Influencing Factors of Street Vitality in Historic Districts Based on Multisource Data: Evidence from China. ISPRS Int. J. Geo-Inf. 2024, 13, 277. [Google Scholar] [CrossRef] [Scilit]
- Wang, Y.; Hou, X.; Wang, X.; Fan, W. Public Perception of Urban Recreational Spaces Based on Large Vision–Language Models: A Case Study of Beijing’s Third Ring Area. Land 2025, 14, 2155. [Google Scholar] [CrossRef] [Scilit]
- Zhu, X.; Chiou, S.-C. A Study on the Sustainable Development of Historic District Landscapes Based on Place Attachment among Tourists: A Case Study of Taiping Old Street, Taiwan. Sustainability 2022, 14, 11755. [Google Scholar] [CrossRef] [Scilit]
- Bowden, J.; Woolrych, R.; Kennedy, C. Heritage, Memory and Well-Being: Exploring Uses and Perceptions of the Historic Environment Amongst Older Adults in Nottinghamshire. Herit. Soc. 2025. [Google Scholar] [CrossRef] [Scilit]
- Wu, D.; Shen, C.; Wang, E.; Hou, Y.; Yang, J. Impact of the Perceived Authenticity of Heritage Sites on Subjective Well-Being: A Study of the Mediating Role of Place Attachment and Satisfaction. Sustainability 2019, 11, 6148. [Google Scholar] [CrossRef] [Scilit]
- Yi, X.; Fu, X.; So, K.K.F.; Zheng, C. Perceived Authenticity and Place Attachment: New Findings from Chinese World Heritage Sites. J. Hosp. Tour. Res. 2023, 47, 800–826. [Google Scholar] [CrossRef] [Scilit]
- Song, Y.; Han, C.; Zhao, Y. A Study on Tourist Satisfaction Based on the Conservation and Reuse of Alleyway Spaces in Urban Historic Neighborhoods. Buildings 2024, 14, 1324. [Google Scholar] [CrossRef] [Scilit]
- Yu, Z.; Zhou, Y.; Wang, H. Walking Environment Satisfaction in an Historic Block Based on POE and Machine Learning: A Case Study of Tianjin Five Avenues. Buildings 2024, 14, 3047. [Google Scholar] [CrossRef] [Scilit]
- Shao, L.; Ma, P.; Zhou, Z. Research on the Impact of Landscape Planning on Visual and Spatial Perception in Historical District Tourism: A Case Study of Laomendong. Land 2024, 13, 1134. [Google Scholar] [CrossRef] [Scilit]
- Seiferling, I.; Naik, N.; Ratti, C.; Proulx, R. Green Streets—Quantifying and Mapping Urban Trees with Street-Level Imagery and Computer Vision. Landsc. Urban Plan. 2017, 165, 93–101. [Google Scholar] [CrossRef] [Scilit]
- Qiu, W.; Li, W.; Liu, X.; Huang, X. Subjectively Measured Streetscape Perceptions to Inform Urban Design Strategies for Shanghai. ISPRS Int. J. Geo-Inf. 2021, 10, 493. [Google Scholar] [CrossRef] [Scilit]
- Qiu, W.; Li, W.; Liu, X.; Huang, X. Subjectively Measured Streetscape Qualities for Shanghai with Large-Scale Application of Computer Vision and Machine Learning. In Proceedings of the 2021 DigitalFUTURES; Yuan, P.F., Chai, H., Yan, C., Leach, N., Eds.; Springer: Singapore, 2022; pp. 242–251. [Google Scholar]
- Li, Y.; Li, Z.; Liu, H.; Wang, Q. ZMNet: Feature Fusion and Semantic Boundary Supervision for Real-Time Semantic Segmentation. Vis. Comput. 2025, 41, 1543–1554. [Google Scholar] [CrossRef] [Scilit]
- Ito, K.; Kang, Y.; Zhang, Y.; Zhang, F.; Biljecki, F. Understanding Urban Perception with Visual Data: A Systematic Review. Cities 2024, 152, 105169. [Google Scholar] [CrossRef] [Scilit]
- Kovacs-Gyoeri, A.; Ristea, A.; Havas, C.; Mehaffy, M.; Hochmair, H.H.; Resch, B.; Juhasz, L.; Lehner, A.; Ramasubramanian, L.; Blaschke, T. Opportunities and Challenges of Geospatial Analysis for Promoting Urban Livability in the Era of Big Data and Machine Learning. ISPRS Int. J. Geo-Inf. 2020, 9, 752. [Google Scholar] [CrossRef] [Scilit]
- Noufe, S.C.; Belaroussi, R.; Dupin, F.; Vandanjon, P.-O. Mapping Urban Vitality: Geospatial Analysis of Commercial Diversity and Tourism. Urban Sci. 2026, 10, 21. [Google Scholar] [CrossRef] [Scilit]
- Belaroussi, R.; Salingaros, N.A. Artificial Intelligence-Simulated Cognition of a Pedestrian Assessing a Built Environment. AI 2026, 7, 110. [Google Scholar] [CrossRef] [Scilit]
- Zhang, G.; Yi, J.; Yuan, J.; Li, Y.; Jin, D. DAS: Efficient Street View Image Sampling for Urban Prediction. ACM Trans. Intell. Syst. Technol. 2023, 14, 1–20. [Google Scholar] [CrossRef] [Scilit]
- Zhang, W.; Zhang, S.; Li, Y.; Li, H.; Song, T. DRMNet: More Efficient Bilateral Networks for Real-Time Semantic Segmentation of Road Scenes. J. Real.-Time Image Process. 2024, 21, 195. [Google Scholar] [CrossRef] [Scilit]
- Mirri, S.; Prandi, C.; Roccetti, M.; Salomoni, P. Walking under a Different Sky: Urban Colored Routes for Creative Engagement and Pleasure. Int. J. Human–Computer Interact. 2017, 33, 1010–1021. [Google Scholar] [CrossRef] [Scilit]
- Januchta-Szostak, A. The Role of Public Visual Art in Urban Space Recognition. In Cognitive Maps; Perusich, K., Ed.; InTech: London, UK, 2010. [Google Scholar]
- Kwon, M. One Place After Another: Site-Specific Art and Locational Identity; The MIT Press: Cambridge, MA, USA, 2002. [Google Scholar]
- Moreno-Vera, F.; Brandoli, B.; Poco, J. What Makes a Place Feel Safe? Analyzing Street View Images to Identify Relevant Visual Elements. In Proceedings of the 2024 IEEE/WIC International Conference on Web Intelligence and Intelligent Agent Technology (WI-IAT), Bangkok, Thailand, 9–12 December 2024; IEEE: New Yok, NY, USA, 2024; pp. 395–399. [Google Scholar]
- Zhang, J.; Li, Y.; Fukuda, T.; Wang, B. Urban Safety Perception Assessments via Integrating Multimodal Large Language Models with Street View Images. Cities 2025, 165, 106122. [Google Scholar] [CrossRef] [Scilit]
- Vitaloni, C.; Shullani, D.; Baracchi, D. A Comparative Study of Vision Language Models for Italian Cultural Heritage. Heritage 2025, 8, 95. [Google Scholar] [CrossRef] [Scilit]
- Guo, M.; Zhu, L.; Wang, G.; Shang, X.; Zhang, Y.; Huang, M.; Zhao, J.; Dong, Y.; Wang, Y.; Wang, R.; et al. Understanding Architectural Heritage: 3D-MELL Framework of Architectural Heritage Large Language Model Based on 3D Point Cloud. J. Cult. Herit. 2026, 77, 265–272. [Google Scholar] [CrossRef] [Scilit]
- Wu, Y.; Liu, Q.; Hang, T.; Yang, Y.; Wang, Y.; Cao, L. Integrating Restorative Perception into Urban Street Planning: A Framework Using Street View Images, Deep Learning, and Space Syntax. Cities 2024, 147, 104791. [Google Scholar] [CrossRef] [Scilit]
- Wang, L.; Han, X.; He, J.; Jung, T. Measuring Residents’ Perceptions of City Streets to Inform Better Street Planning through Deep Learning and Space Syntax. ISPRS J. Photogramm. Remote Sens. 2022, 190, 215–230. [Google Scholar] [CrossRef] [Scilit]
- Ribeiro, M.T.; Singh, S.; Guestrin, C. “Why Should I Trust You?”: Explaining the Predictions of Any Classifier. In Proceedings of the 22nd ACM SIGKDD International Conference on Knowledge Discovery and Data Mining, San Francisco, CA, USA, 13–17 August 2016; Association for Computing Machinery: New York, NY, USA, 2016; pp. 1135–1144. [Google Scholar]
- Sundararajan, M.; Taly, A.; Yan, Q. Axiomatic Attribution for Deep Networks. In Proceedings of the 34th International Conference on Machine Learning, Sydney, Australia, 6–11 July 2017; PMLR: New York, NY, USA, 2017; pp. 3319–3328. [Google Scholar]
- Fisher, A.; Rudin, C.; Dominici, F. All Models Are Wrong, but Many Are Useful: Learning a Variable’s Importance by Studying an Entire Class of Prediction Models Simultaneously. J. Mach. Learn. Res. 2019, 20, 1–81. [Google Scholar]
- Wachter, S.; Mittelstadt, B.; Russell, C. Counterfactual Explanations without Opening the Black Box: Automated Decisions and the GDPR. Harv. J. Law. Technol. Harv. JOLT 2017, 31, 841. [Google Scholar]
- Lundberg, S.M.; Lee, S.-I. A Unified Approach to Interpreting Model Predictions. In Proceedings of the Advances in Neural Information Processing Systems; Curran Associates, Inc.: Red Hook, NY, USA, 2017; Volume 30. [Google Scholar]
- Lundberg, S.M.; Erion, G.; Chen, H.; DeGrave, A.; Prutkin, J.M.; Nair, B.; Katz, R.; Himmelfarb, J.; Bansal, N.; Lee, S.-I. From Local Explanations to Global Understanding with Explainable AI for Trees. Nat. Mach. Intell. 2020, 2, 56–67. [Google Scholar] [CrossRef] [Scilit] [PubMed]
- Lee, J.; Kim, D.; Park, J. A Machine Learning and Computer Vision Study of the Environmental Characteristics of Streetscapes That Affect Pedestrian Satisfaction. Sustainability 2022, 14, 5730. [Google Scholar] [CrossRef] [Scilit]
- Ramírez, T.; Hurtubia, R.; Lobel, H.; Rossetti, T. Measuring Heterogeneous Perception of Urban Space with Massive Data and Machine Learning: An Application to Safety. Landsc. Urban Plan. 2021, 208, 104002. [Google Scholar] [CrossRef] [Scilit]
- Chen, Y.; Tang, Z.-R. Assessing Urban Safety Perception Through Street View Imagery and Transfer Learning: A Case Study of Wuhan, China. Sustainability 2025, 17, 7641. [Google Scholar] [CrossRef] [Scilit]
- Klimenka, M.; Zhao, K.; Hilland, R.; Zhang, F.; Voogt, J.; Ratti, C. Instant Infrared: Estimating Urban Surface Temperatures from Street View Imagery. Build. Environ. 2025, 267, 112122. [Google Scholar] [CrossRef] [Scilit]
- Wang, L.; Hou, C.; Zhang, Y.; He, J. Measuring Solar Radiation and Spatio-Temporal Distribution in Different Street Network Direction through Solar Trajectories and Street View Images. Int. J. Appl. Earth Obs. Geoinf. 2024, 132, 104058. [Google Scholar] [CrossRef] [Scilit]
- Hu, Y.; Qian, F.; Yan, H.; Middel, A.; Wu, R.; Zhu, M.; Han, Q.; Zhao, K.; Wang, H.; Shao, F.; et al. Which Street Is Hotter? Street Morphology May Hold Clues -Thermal Environment Mapping Based on Street View Imagery. Build. Environ. 2024, 262, 111838. [Google Scholar] [CrossRef] [Scilit]
- Zhong, W.; Wang, L.; Han, X.; Gao, Z. Spatiotemporal Analysis of Urban Perception Using Multi-Year Street View Images and Deep Learning. ISPRS Int. J. Geo-Inf. 2025, 14, 390. [Google Scholar] [CrossRef] [Scilit]
- Yang, N.; Deng, Z.; Hu, F.; Chao, Y.; Wan, L.; Guan, Q.; Wei, Z. Urban Perception by Using Eye Movement Data on Street View Images. Trans. GIS 2024, 28, 1021–1042. [Google Scholar] [CrossRef] [Scilit]
- Chen, W.; Sang, H.; Wang, J.; Zhao, Z. DSTCNN: Deformable Spatial-Temporal Convolutional Neural Network for Pedestrian Trajectory Prediction. Inf. Sci. 2024, 666, 120455. [Google Scholar] [CrossRef] [Scilit]
- Yang, S.; Xiao, X. Pedestrian Trajectory Prediction Model Based on Self-Supervised Spatiotemporal Graph Network. Intell. Syst. Appl. 2025, 26, 200533. [Google Scholar] [CrossRef] [Scilit]
- Yang, X.; Wang, S.; Zhu, Y.; Zhou, D.; Li, T. Context CVGN: A Conditional Multimodal Trajectory Prediction Network Based on Scene Semantic Modeling. Inf. Sci. 2024, 666, 120433. [Google Scholar] [CrossRef] [Scilit]
- Shen, G.; Li, P.; Chen, Z.; Yang, Y.; Kong, X. Spatio-Temporal Interactive Graph Convolution Network for Vehicle Trajectory Prediction. Internet Things 2023, 24, 100935. [Google Scholar] [CrossRef] [Scilit]
- Liu, C.; Yu, Y.; Yang, X. Perceptual Evaluation of Street Quality in Underdeveloped Ethnic Areas: A Random Forest Method Combined with Human–Machine Confrontation Framework Provides Insights for Improved Urban Planning—A Case Study of Lhasa City. Buildings 2024, 14, 1698. [Google Scholar] [CrossRef] [Scilit]
- Zhao, T.; Liang, X.; Tu, W.; Huang, Z.; Biljecki, F. Sensing Urban Soundscapes from Street View Imagery. Comput. Environ. Urban Syst. 2023, 99, 101915. [Google Scholar] [CrossRef] [Scilit]
- Zhang, L.; Ye, Y.; Zeng, W.; Chiaradia, A. A Systematic Measurement of Street Quality through Multi-Sourced Urban Data: A Human-Oriented Analysis. Int. J. Environ. Res. Public. Health 2019, 16, 1782. [Google Scholar] [CrossRef] [Scilit] [PubMed]
- Salesses, P.; Schechtner, K.; Hidalgo, C.A. The Collaborative Image of The City: Mapping the Inequality of Urban Perception. PLoS ONE 2013, 8, e68400. [Google Scholar] [CrossRef] [Scilit] [PubMed]
- Cheng, Z.; Fan, B.; Zhang, X.; Hu, H.; Cheng, Y. Linking Urban Morphology to the Spatial Differentiation of Street-Level Visual Exposure. Front. Archit. Res. 2026; in press. [CrossRef] [Scilit]
- Akoglu, H. User’s Guide to Correlation Coefficients. Turk. J. Emerg. Med. 2018, 18, 91–93. [Google Scholar] [CrossRef] [Scilit] [PubMed]
- Patrick, S.; Christa, B.; Lothar, A.S. Correlation Coefficients: Appropriate Use and Interpretation. Anesth. Analg. 2018, 126, 1763–1768. [Google Scholar] [CrossRef] [Scilit] [PubMed]
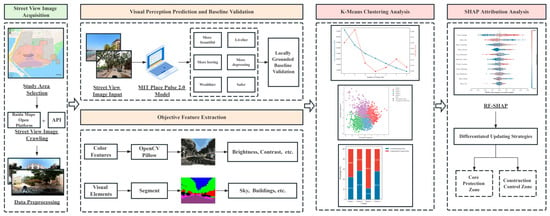
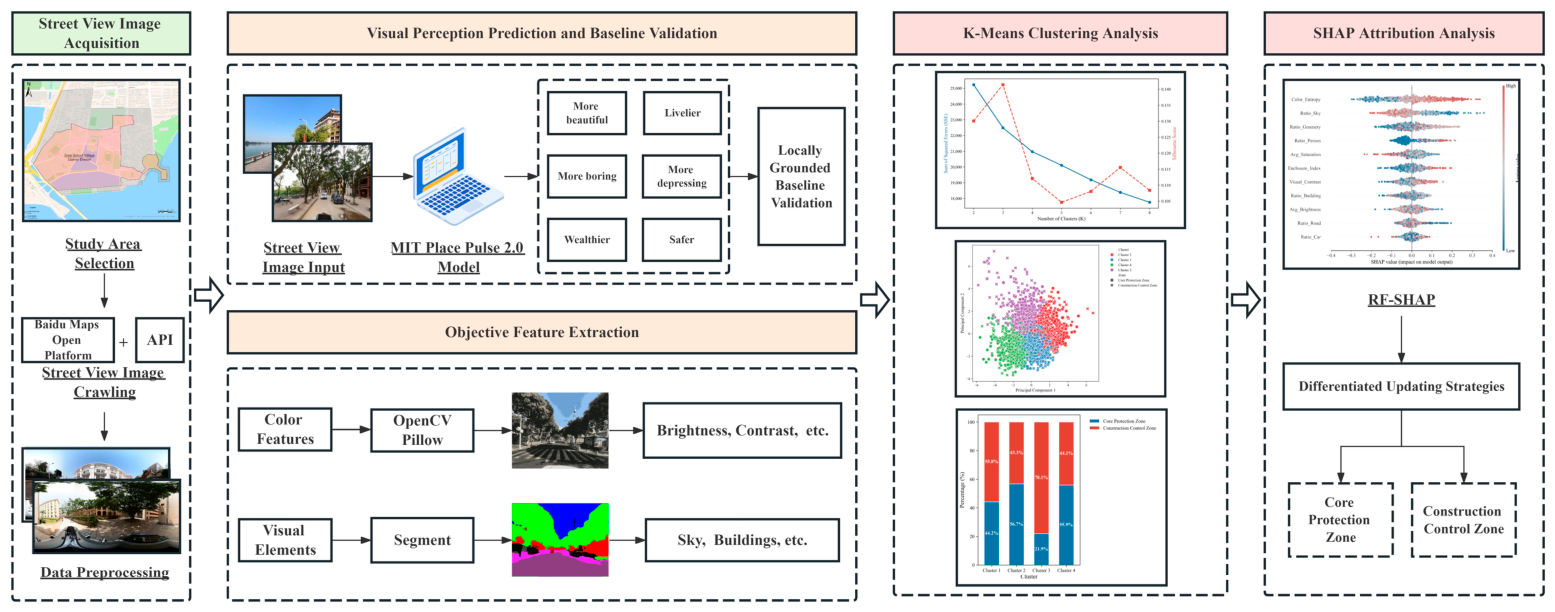
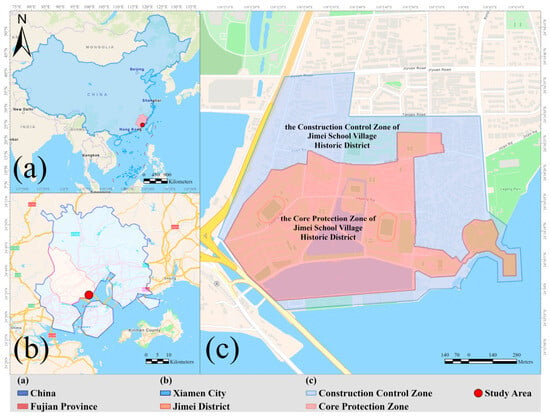
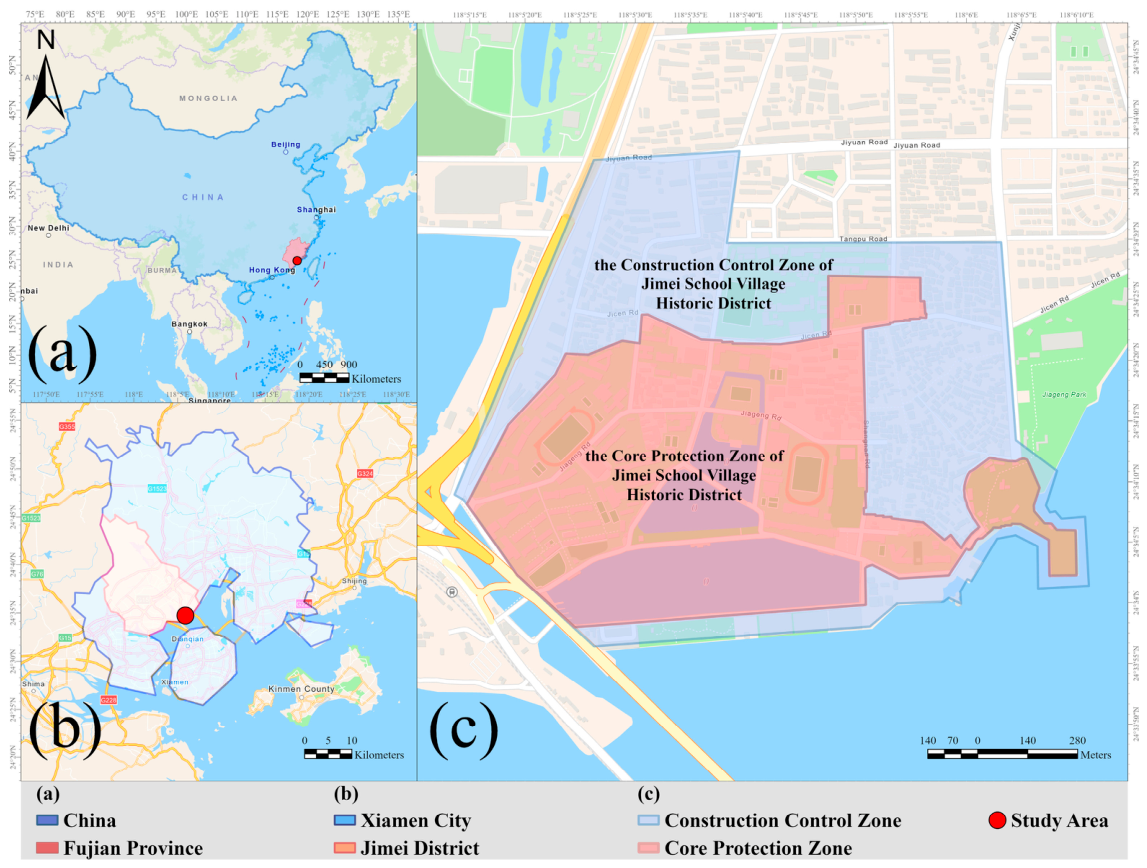
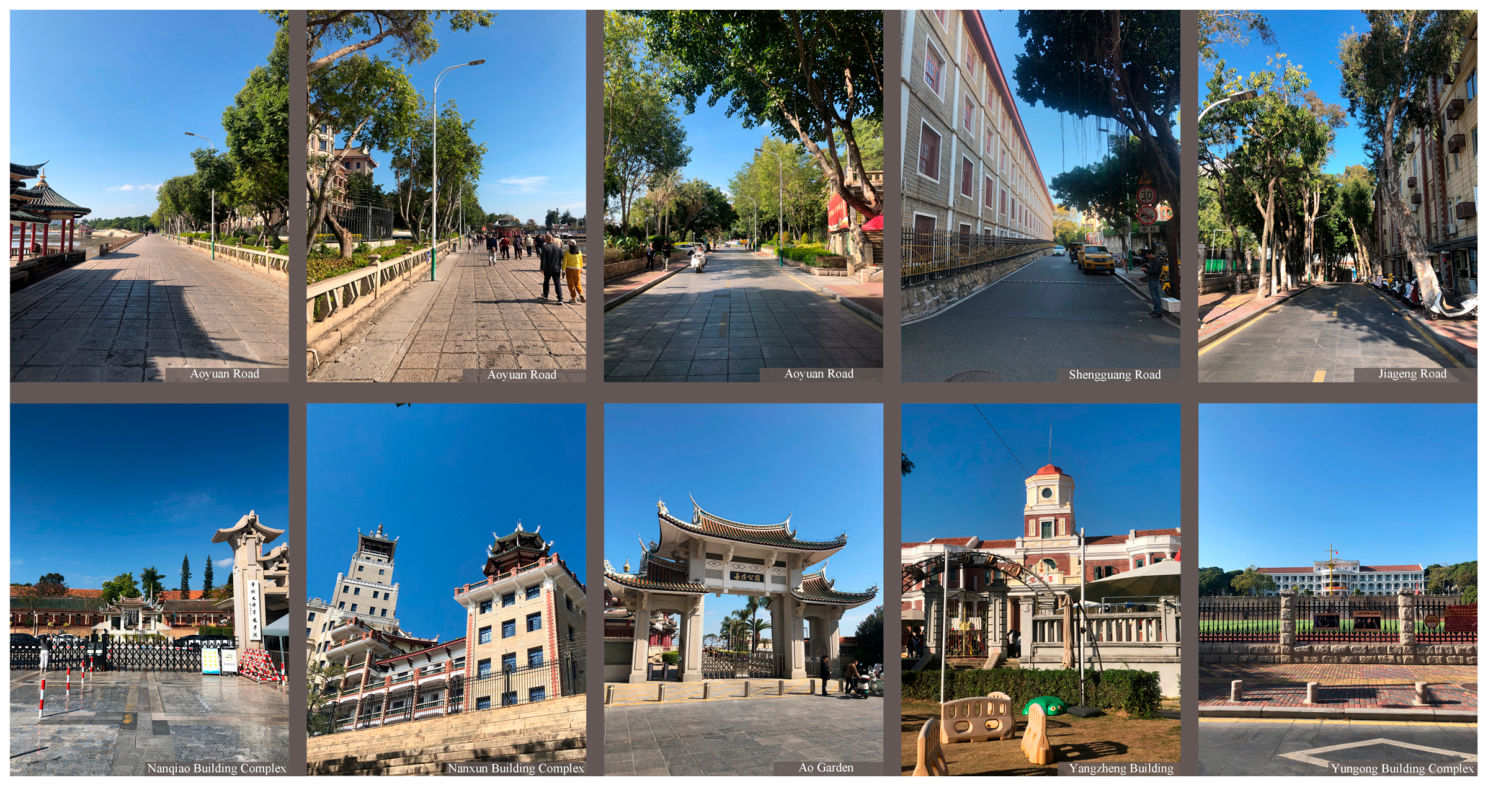
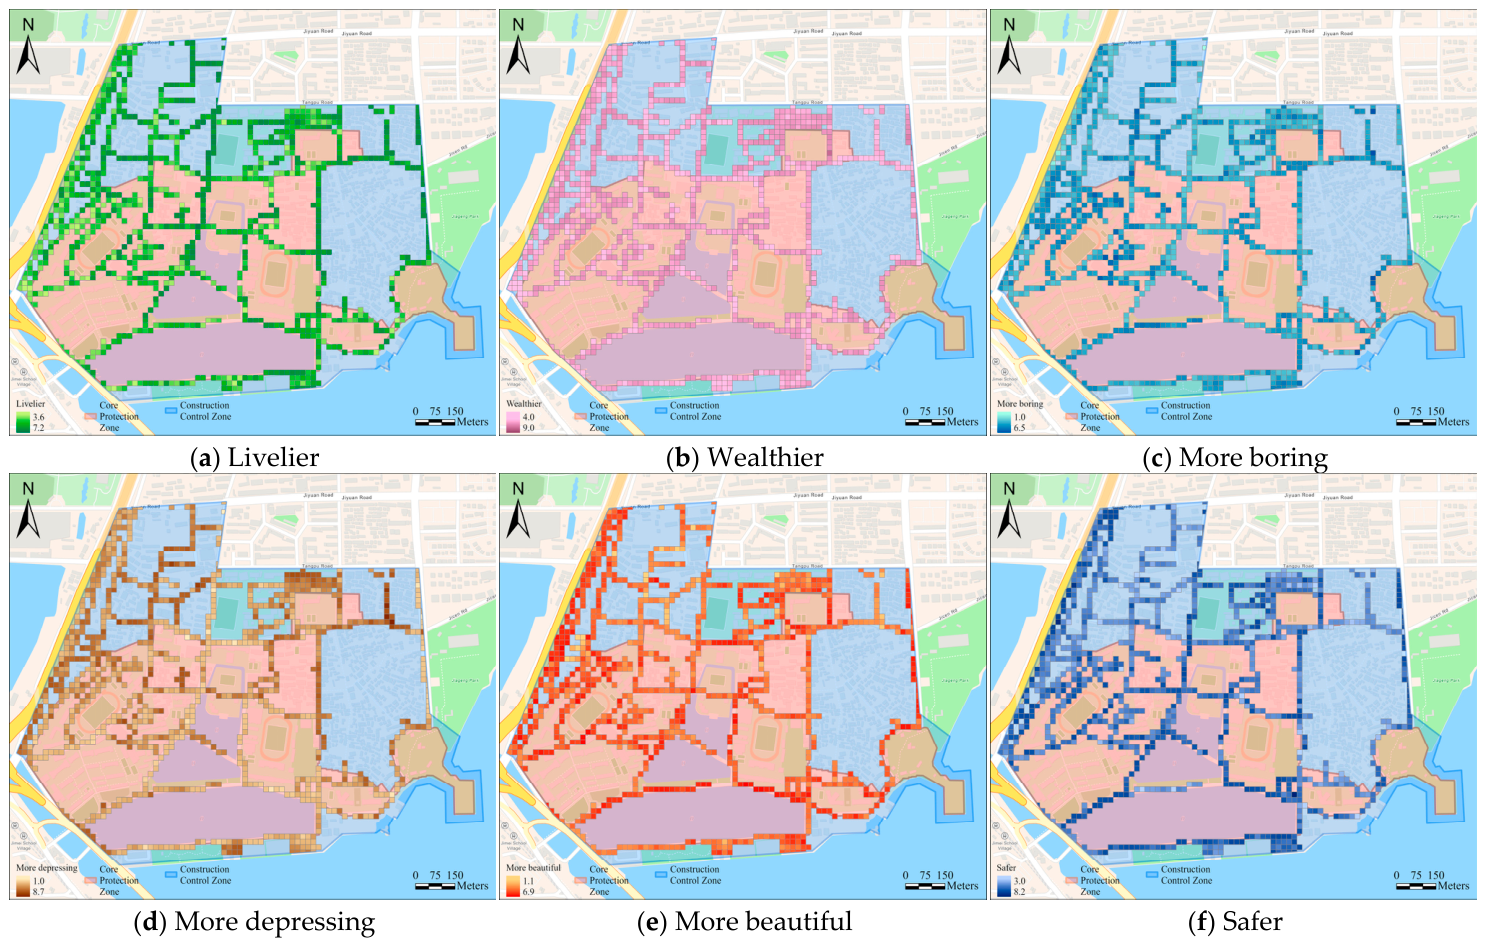
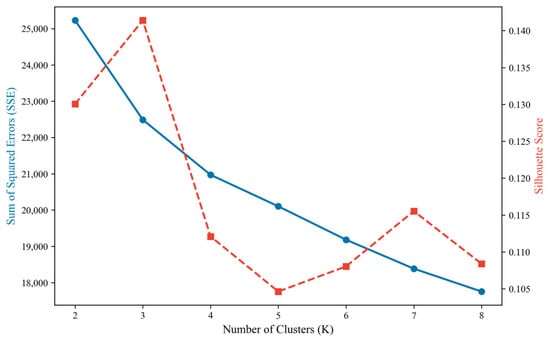
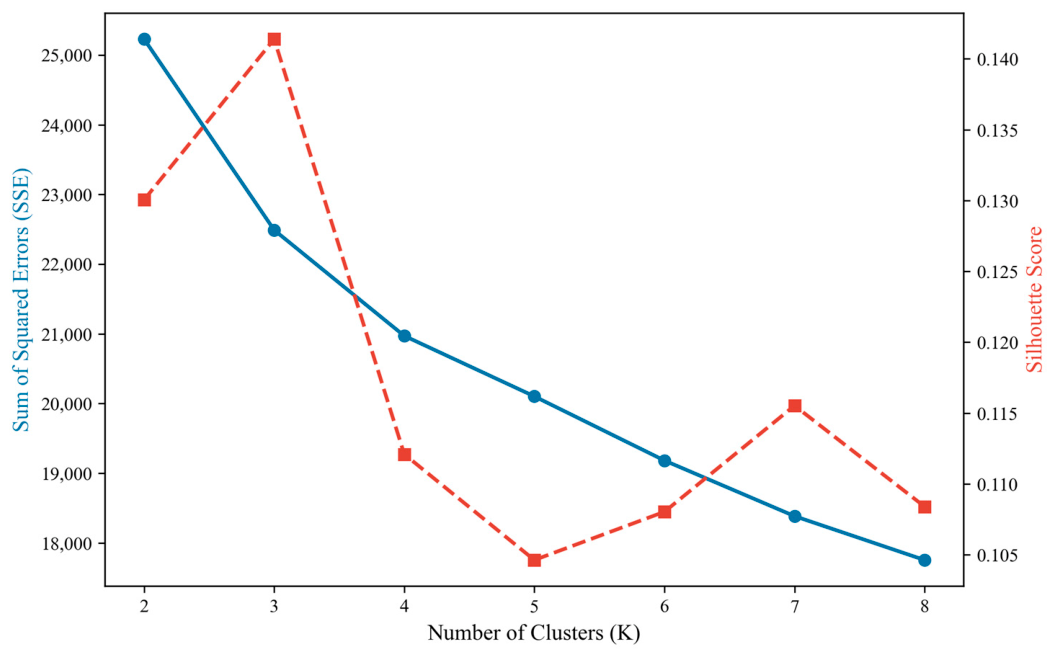
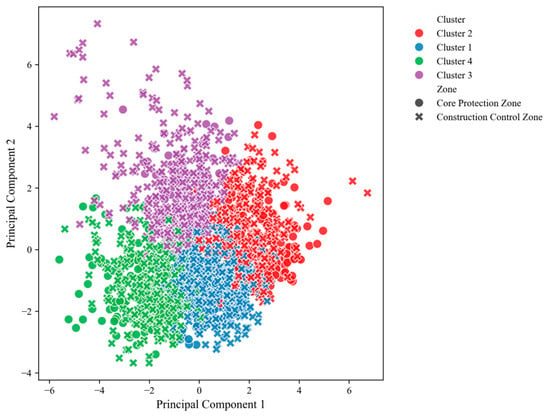
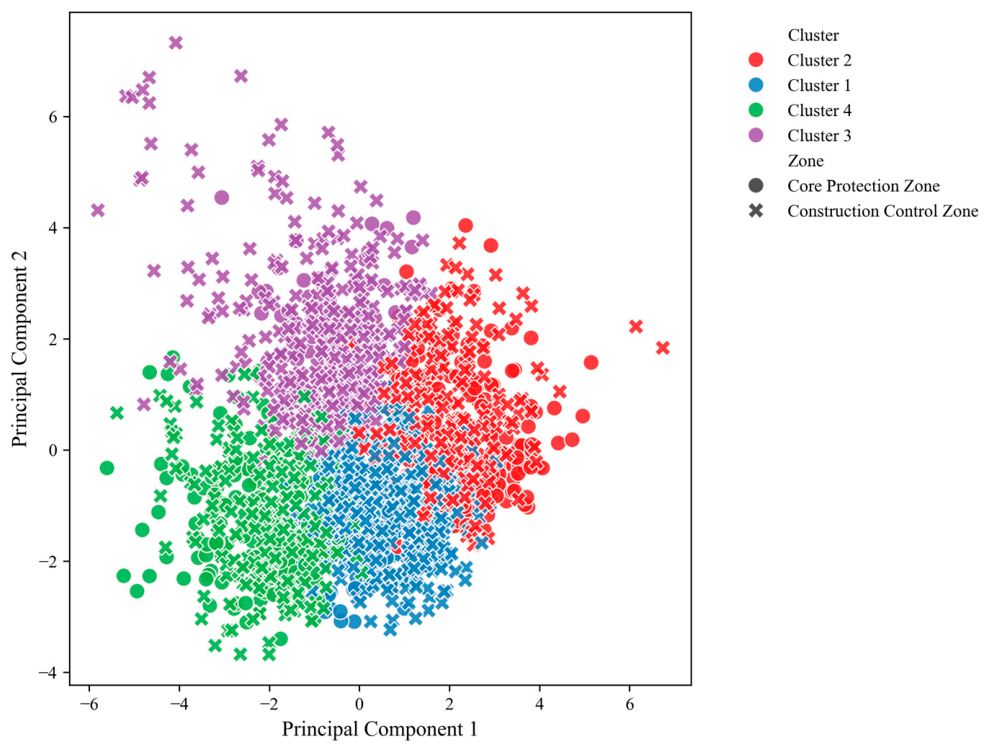
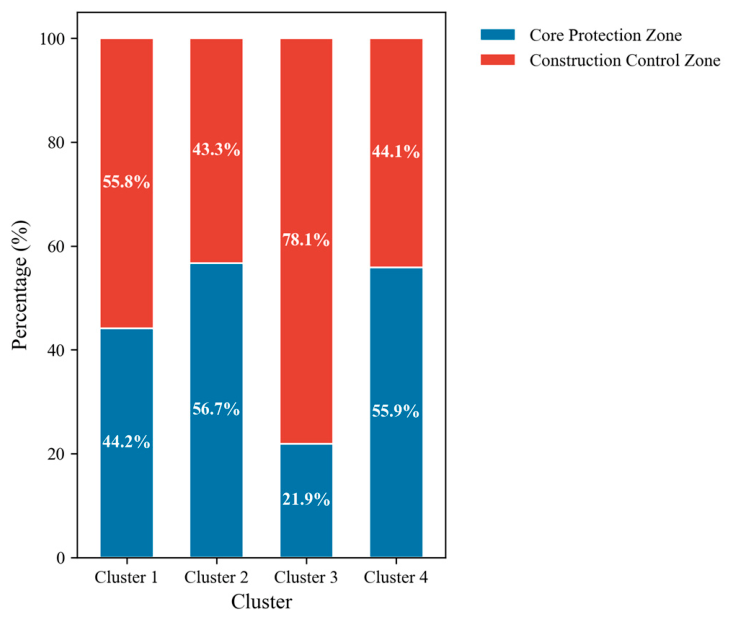
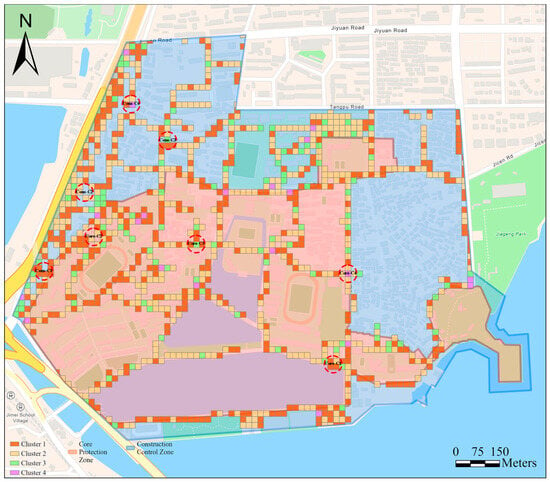
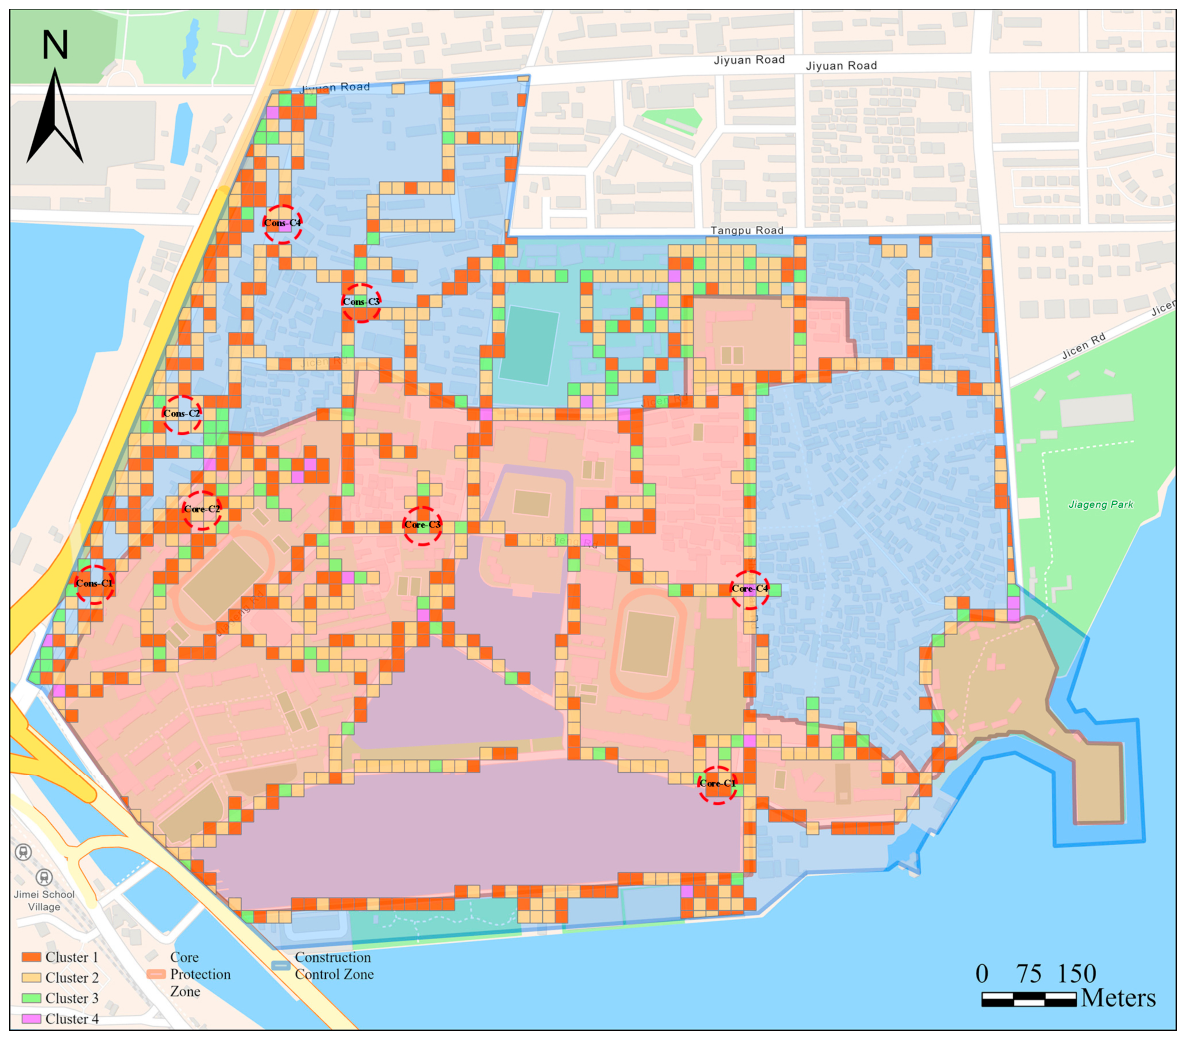
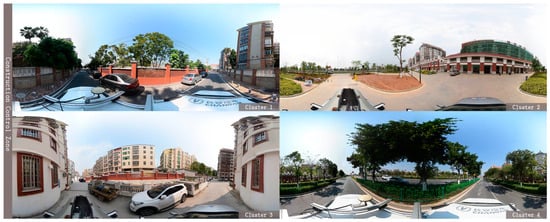
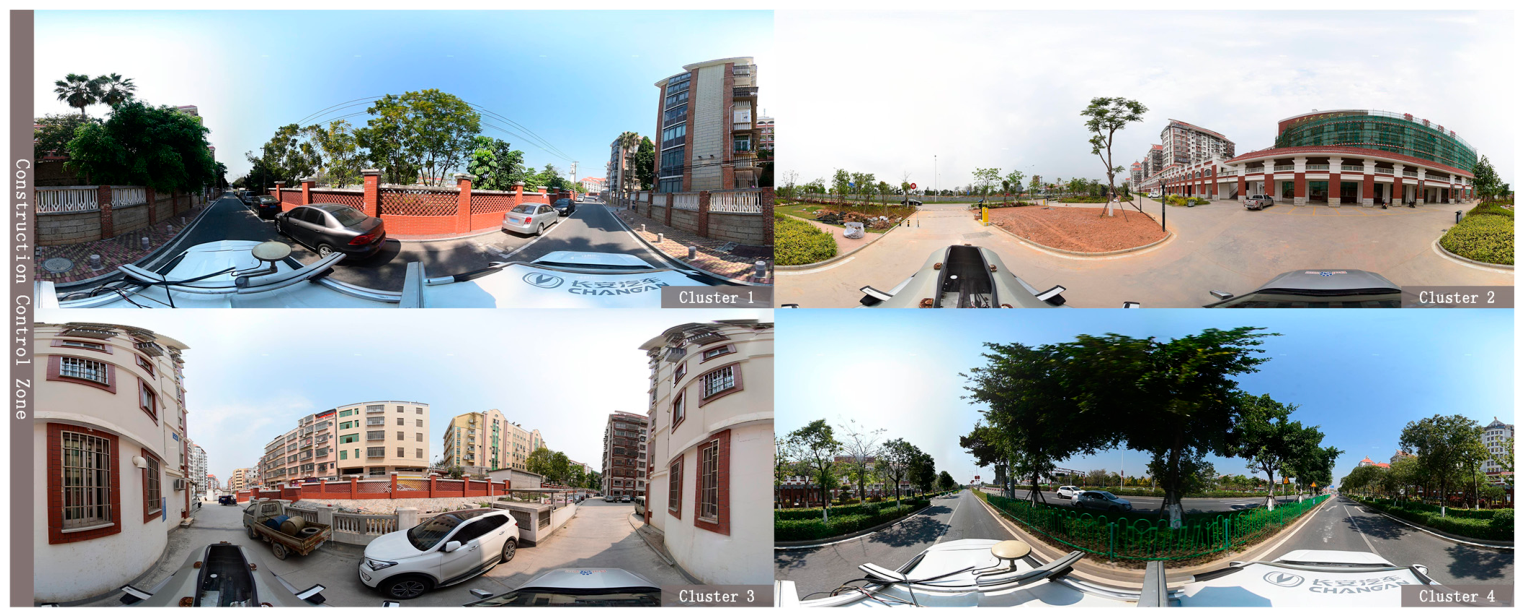
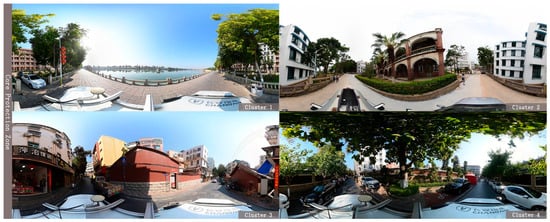
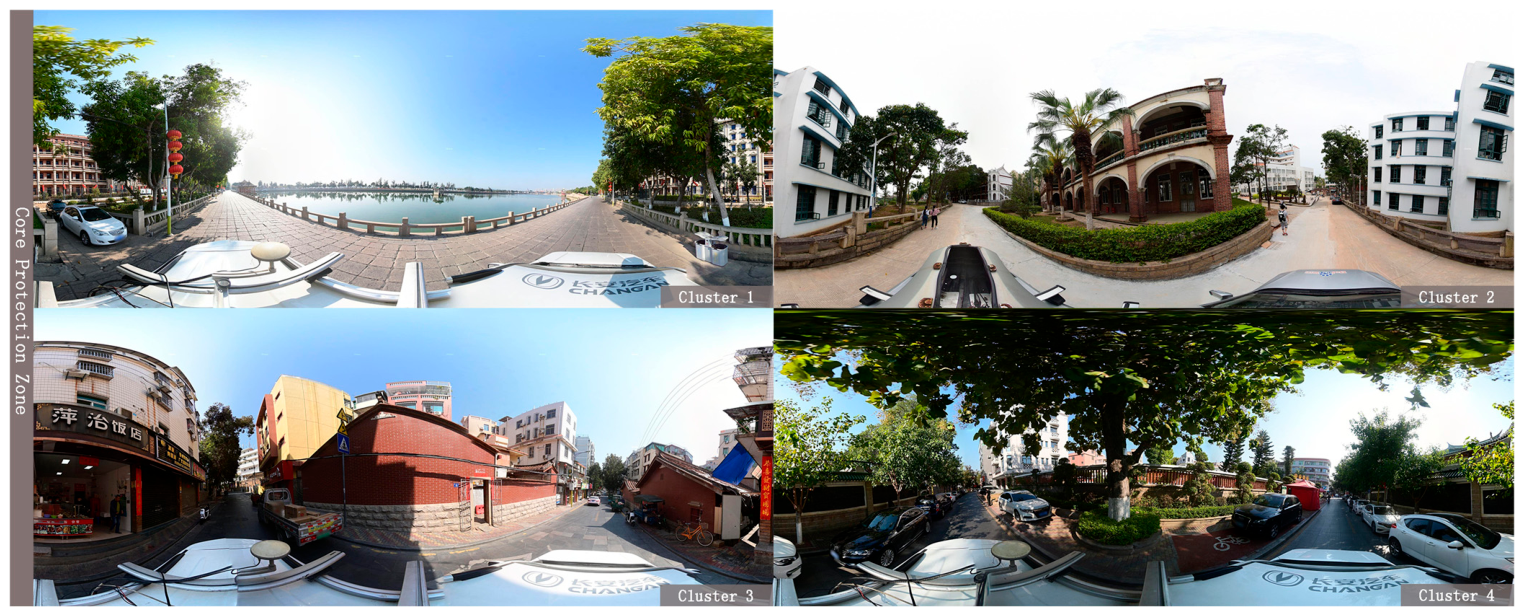
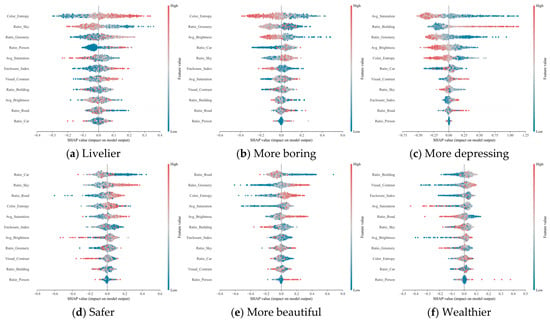
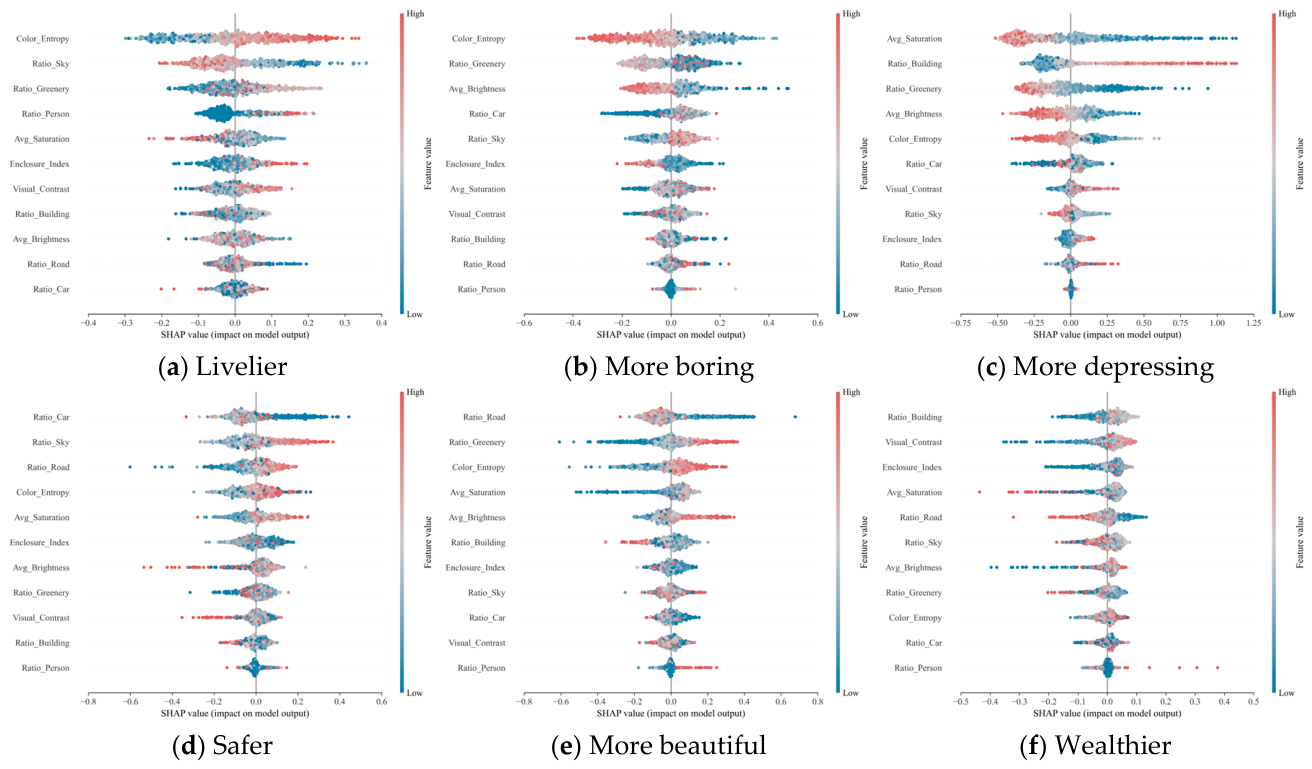
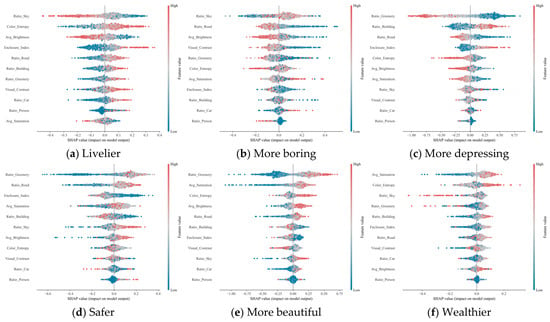
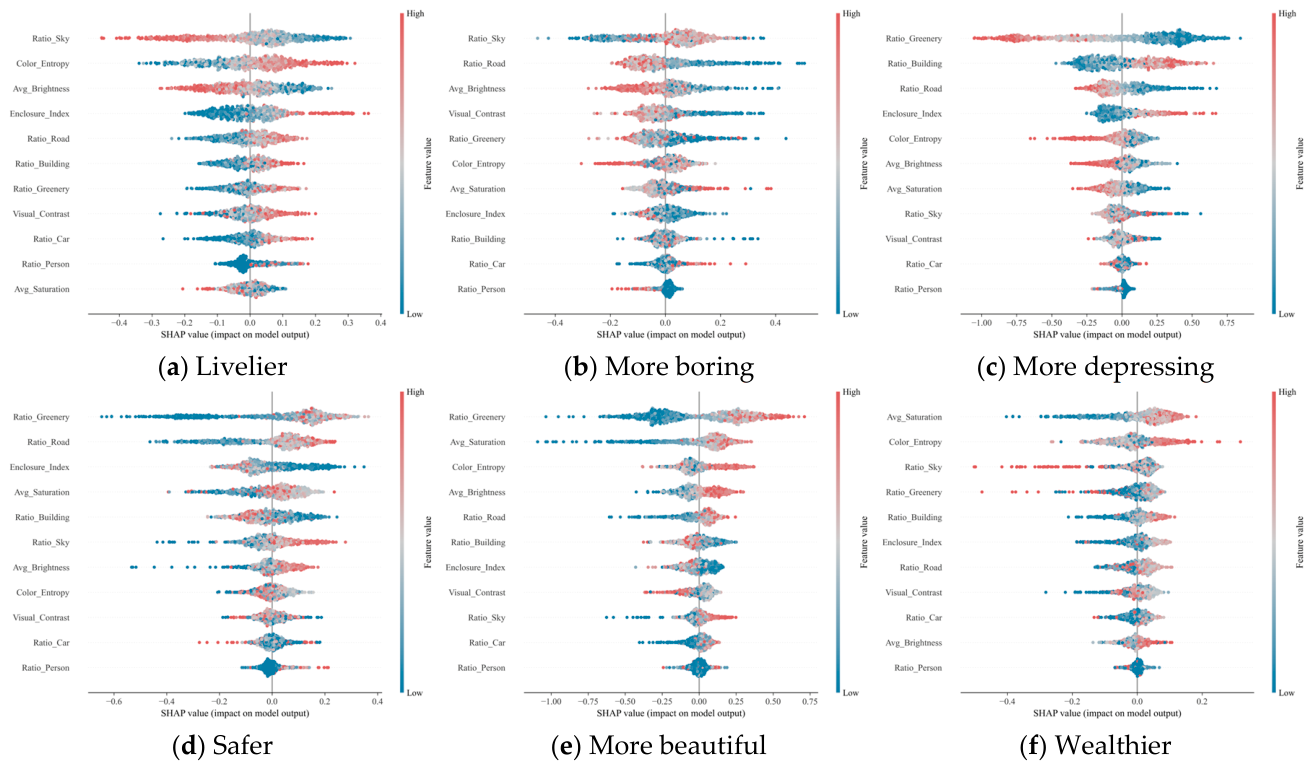

Disclaimer/Publisher’s Note: The statements, opinions and data contained in all publications are solely those of the individual author(s) and contributor(s) and not of MDPI and/or the editor(s). MDPI and/or the editor(s) disclaim responsibility for any injury to people or property resulting from any ideas, methods, instructions or products referred to in the content. |
© 2026 by the authors. Licensee MDPI, Basel, Switzerland. This article is an open access article distributed under the terms and conditions of the Creative Commons Attribution (CC BY) license.