Article

Seasonal Contrasts of Heat and Cold Exposure in Urban Functional Zones: A Machine-Learning and GeoDetector Approach

1
School of Urban Design, Wuhan University, Wuhan 430072, China
2
Research Center for Digital City, Wuhan University, Wuhan 430072, China
*
Author to whom correspondence should be addressed.
Buildings 2026, 16(13), 2681; https://doi.org/10.3390/buildings16132681
Submission received: 27 May 2026 / Revised: 3 July 2026 / Accepted: 4 July 2026 / Published: 6 July 2026
(This article belongs to the Section Architectural Design, Urban Science, and Real Estate)

Abstract

Frequent extreme climate events pose severe threats to human health. Existing studies mainly focused on summer thermal environments, while few compared summer and winter extreme climate risks from the perspective of urban functional zones (UFZs). This study classified more precise UFZs using the machine-learning method and constructed heat and cold exposure indicators. GeoDetector was adopted to analyze driving factors and interactions of both types of exposure across UFZs. The results showed that UFZ classification achieved an overall accuracy of 81.8% and a Kappa coefficient of 0.75. High heat exposure concentrated in core public, residential, and commercial zones, while high cold exposure occurred in peripheral industrial and greenspace zones. Dual high exposure zones lay between the 3rd and 5th Ring Roads. Industrial zones positively contributed to both exposures, while commercial, public, and residential zones showed positive heat but negative cold exposure contributions, and greenspace zones presented opposite effects. Vulnerable population ratios had a strong explanatory power. Heat exposure interactions were dominated by vulnerable populations, building morphology, and landscape patterns, while cold exposure was also affected by the degree of facility agglomeration and human activities with varied mechanisms across UFZs. This study advanced single-season thermal research to multi-season exposure and zoned governance for climate-adaptive renewal.

1. Introduction

Rapid urbanization has exposed numerous cities to increasingly frequent extreme heat events, elevating the risk of population exposure to heatwaves and the associated mortality [1]. The deterioration of the urban thermal environment has emerged as a critical factor compromising the quality of urban life [2]. Meanwhile, in stark contrast to heatwaves whose effects typically persist for several days, cold wave events may exert impacts over a time scale of up to several weeks [3]. Currently, the mortality risk attributable to winter temperature declines continues to rise [4,5]. In China, mortality related to heatwaves and cold waves remains a significant public health concern, particularly among vulnerable populations with limited adaptive resources [6,7,8].
Numerous studies have focused on the spatiotemporal patterns and driving mechanisms of urban heat exposure. These studies found that urban heat exposure levels exhibited significant spatiotemporal heterogeneity due to the dynamic evolution of land surface temperature (LST) and population distribution [9,10], and showed greater variations at relatively finer spatial scales [11]. However, the traditional urban–rural binary classification framework, which treated the entire city as a single homogeneous entity, limited the detailed investigation of the urban heat island effect at fine spatial scales, leading to inevitable uncertainties in the assessment of the urban heat island intensity [12,13]. To address this limitation, the local climate zone (LCZ) system, which is based on three-dimensional morphology and surface cover classification, has been widely adopted. Previous studies revealed the diurnal dynamics of heat exposure in summer across different LCZs [14,15]. The influence of urban functional zones (UFZs) on the urban thermal environment has gradually attracted increasing attention [16]. UFZs serve as the foundation of urban planning and can better capture dynamic socioeconomic processes and human activity patterns. Numerous studies integrated land surface temperature data and population distribution data to reveal the heat exposure of urban residents at the UFZ level [17], and further pointed out that significant differences in heat exposure and their driving factors existed even among different community types [18]. However, current studies on the thermal environment from the UFZ perspective have not yet reached a consensus on standardized classification systems and research methodologies. The classification accuracy of the existing approaches varied significantly, while their applicability across different cities remained inconsistent [19,20]. For example, many studies used point of interest (POI) density for classification [21]. Functional identification was performed by calculating the proportion of POI density [22], or by combining area of interest (AOI) data and indicators such as the integral frequency density (TRi) and category ratio (Ci) derived from the weighted POI density [23]. In recent years, with the development of remote sensing, natural language processing, and machine learning technologies, the comprehensive application of remote sensing imagery data, POI data, mobile phone positioning data, and other geographic data can effectively improve the classification accuracy of urban functional zones [24].
Compared with summer heat exposure that has received extensive attention from the UFZ perspective, systematic investigations into winter cold exposure remain significantly scarce. Previous studies showed that the driving effects of urban two- and three-dimensional built environment factors on LST varied significantly with seasonal changes throughout the year [25,26]. Higher impervious surface rates and population densities may exacerbate anthropogenic heat emissions and increase the summer heat risk, but they may mitigate the cold risk in urban centers during winter [27]. Compared with LST, exposure can better characterize the extent to which individuals are affected by extreme temperatures at the urban scale. Exposure is also conceptually distinct from human thermal comfort and the associated heat stress at the individual or microclimate scale, which are more commonly assessed using composite indices such as physiologically equivalent temperature (PET) or universal thermal climate index (UTCI), that integrate air temperature, humidity, wind speed, radiation, and human physiological parameters [28]. However, the mechanisms underlying such seasonal differences in heat and cold exposure remain unclear to date. Therefore, integrating LST data with static population data to assess the population-based exposure intensity and spatial distribution [29], and further exploring the differential impacts of influencing factors across different seasons, can provide a more comprehensive perspective and scientific basis for refined thermal environment management and also enhance urban climate resilience. Furthermore, previous studies emphasized that cold exposure not only exhibits spatial heterogeneity but is also associated with socially vulnerable populations. For heat or cold exposure, the contribution of population aging was even higher than that of climate change [30]. Differences in physiological and psychological conditions, cognitive abilities, income levels, and residential environments led to varying impacts of cold exposure on different populations, which exacerbated inequalities. Greater attention should be paid to population disparities in heat and cold exposure [31].
In summary, according to existing studies, three critical gaps remain. First, most LCZ and UFZ thermal studies focused on summer heat islands, overlooked winter cold exposure, and lacked a systematic dual season comparison under a unified UFZ framework. Second, the prevailing seasonal LST studies centered on temperature patterns alone, and rarely incorporated population vulnerability to quantify cross-zone exposure heterogeneity. Third, existing driving factor analyses have mainly focused on independent effects, with an insufficient exploration of interactions between vulnerable population distribution and driving factors from multiple dimensions across UFZs. This study does not claim to develop a completely new thermal index or classification method. Its novelty lies in the integrated use of UFZs as exposure assessment units rather than only as descriptive urban form categories. This study compares summer heat and winter cold exposure within the same UFZ framework, population dataset, and analytical procedure. This design allows the identification of whether different UFZs and vulnerable groups face consistent or contrasting seasonal risks. In addition, by incorporating vulnerable populations into the driving factor analysis, the study moves beyond explaining LST patterns alone and examines how urban form, ecological conditions, socioeconomic factors, and population vulnerability jointly shape exposure. Thus, the main contribution is a dual-season, population-based, and mechanism-oriented UFZ framework for urban thermal exposure assessment.
In light of the above considerations, this study takes the area within the 5th Ring Road of Beijing as the research case. Based on multi-source data, it identifies different urban functional zones using machine-learning algorithms, and explores the spatial patterns and driving mechanisms of both summer heat exposure and winter cold exposure. It further incorporates vulnerable population indicators, including the proportions of children, the elderly, and females, into the analytical framework. The specific objectives of this study are threefold: (1) to reveal the differences and associations of heat and cold exposure across various UFZs in a large metropolis; (2) to quantify the effects of building morphology, land cover, landscape pattern, human activity, and vulnerable population structure indicators on seasonal heat and cold exposure; and (3) to examine how vulnerable population structures interact with the built environment. This study presents the following main contributions: It advances urban thermal research from the single-season temperature description to multi-season population-based exposure identification under a unified UFZ framework. It also incorporates vulnerable groups and reveals specific driving mechanisms across UFZs. These findings will provide a solid scientific basis for developing refined seasonal and category-specific governance strategies for heat and cold exposure tailored to different UFZs.

2. Materials and Methods

2.1. Study Area

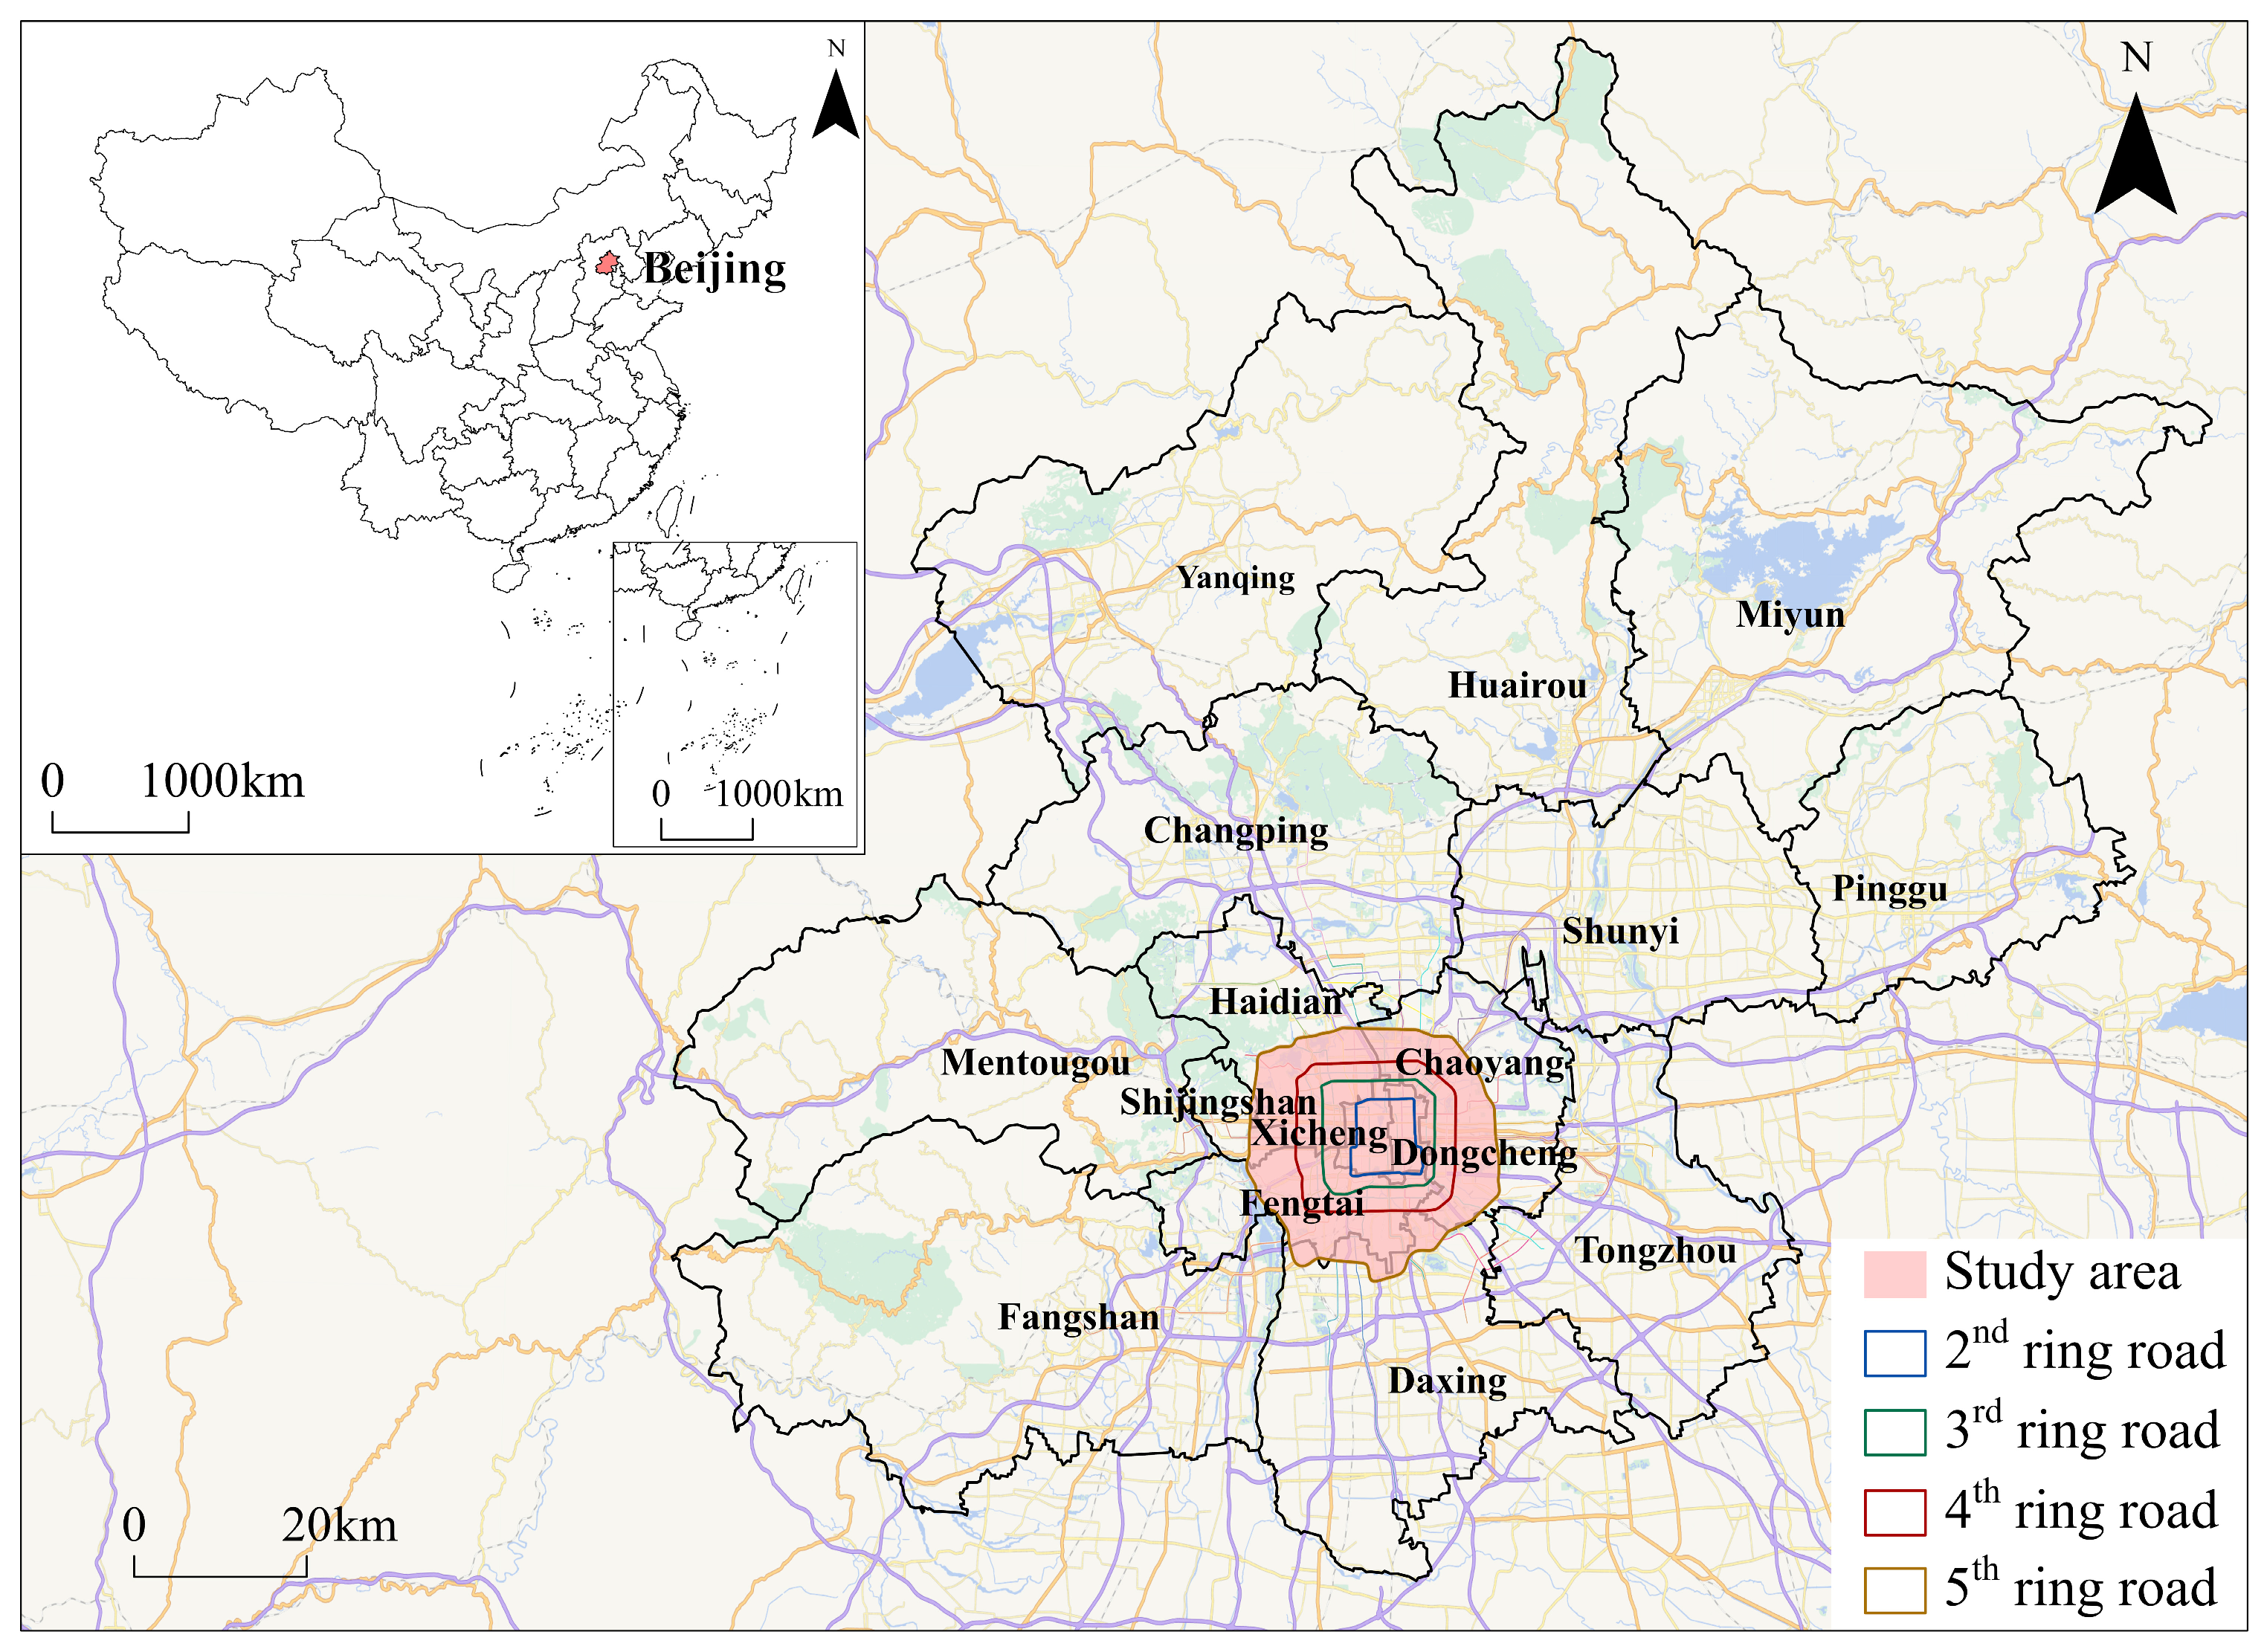
Beijing, the capital of China, is situated at 39°56′ N, 116°20′ E. The city features a continental monsoon climate (Köppen–Geiger class Dwa) within the warm temperate zone, marked by pronounced seasonality [32]. The area within the 5th Ring Road of Beijing constitutes the core urban area of the city, and its population accounted for 41.8% of the city’s total population in 2022 [33]. According to data from the Beijing Meteorological Observatory, Beijing experienced large-scale persistent high temperature and muggy weather in the summer of 2022, with daily maximum temperatures exceeding 35 °C. In the winter of the same year, affected by strong cold air masses, a cold wave event occurred in late November, which posed significant health risks to local residents. The heat and cold exposure in this study area exhibit remarkable complexity and representativeness. In this study, we selected the area within Beijing’s 5th Ring Road as the study area (Figure 1).

2.2. Data Sources

2.2.1. Remote Sensing Data

Summer is the period when vegetation grows most vigorously and the spectral characteristics of ground objects are most distinct. Based on the Google Earth Engine platform, we selected the Landsat 8 OLI/TIRS Collection 2 Level-2 surface reflectance products. We obtained the average values of images from June to August 2022 [34], which were used to calculate various band features, Normalized Difference Vegetation Index (NDVI), Normalized Difference Built-up Index (NDBI), and Normalized Difference Water Index (NDWI).
To characterize the aggregated thermal conditions of the blocks and to identify the overall spatial patterns of heat and cold exposure among UFZs, rather than fine-scale temperature variations within individual blocks, LST data were obtained from the MODIS/061/MOD11A2 dataset (https://lpdaac.usgs.gov/products/mod11a2v061, accessed on 15 March 2025) for the summer (June, July, and August 2022) and the winter (December 2022, and January and February 2023). The MOD11A2 product provided 8-day average LST data at a spatial resolution of 1 km, which provided consistent spatial and temporal coverage with reduced cloud contamination compared with Landsat 8 LST data, enabling consistent seasonal comparisons across the entire study area and avoided excessive fragmentation of thermal signals caused by ultra-fine-resolution data. NPP-VIIRS nighttime light (NTL) data for 2022 were employed to calculate certain indicators (http://www.geodata.cn, accessed on 15 March 2025).

2.2.2. Social Media Data

POI data for 2022 were all obtained via Python 3.10 from the AutoNavi Map API (https://mobile.amap.com/, accessed on 1 August 2025), covering categories such as catering, shopping, accommodation, education, healthcare, and leisure.
Population heat map data were obtained from the urban demographic geo-big data platform (https://huiyan.baidu.com/products/platform, accessed on 23 August 2025). These data covered 24 consecutive hours on the working day of 26 September 2022.

2.2.3. Other Data

Given the widespread extreme heat events in Beijing during the summer of 2022, this study primarily utilizes data from that year. We used the block-level dataset MSDCW (https://figshare.com/articles/dataset/MSDCW_Dataset_and_Code/26021314, accessed on 20 August 2025) [35]. This dataset was generated based on OpenStreetMap road data and GADM administrative boundaries through multi-level buffer analysis and topological segmentation. This road-network-based segmentation approach is more consistent with actual urban management units. It facilitates more accurate urban functional zone identification, reveals the relationship between urban morphology and thermal environment, and can be translated into practical planning and construction practices. The study used the zonal statistics tool in ArcGIS 10.8 to compute the mean LST value of all MODIS pixels falling within each block polygon, thereby assigning a spatially matched LST value to each block. Population data disaggregated by sex and age group were sourced from the WorldPop (https://www.worldpop.org, accessed on 8 November 2025), providing population counts and densities per 100 m × 100 m grid cell. It was used for exposure calculation. Land cover data was from GLC_FCS10, which is a global 10 m land cover product in 2023. Using ArcGIS 10.8, this study reclassified the land cover data. Cropland, forest, shrubland, and grassland were grouped into green space, while wetland and water were merged into water bodies to more accurately describe the land use characteristics. Building vector data was obtained from 3D Global Building Footprints (3D-GloBFP) dataset, which is the first global-scale building height dataset at the individual building footprint level for the year 2020 (https://zenodo.org/records/15487037, accessed on 5 September 2025).
All the above data were topologically corrected, with the projection type and spatial resolution unified.

2.3. Methodology

2.3.1. Research Framework

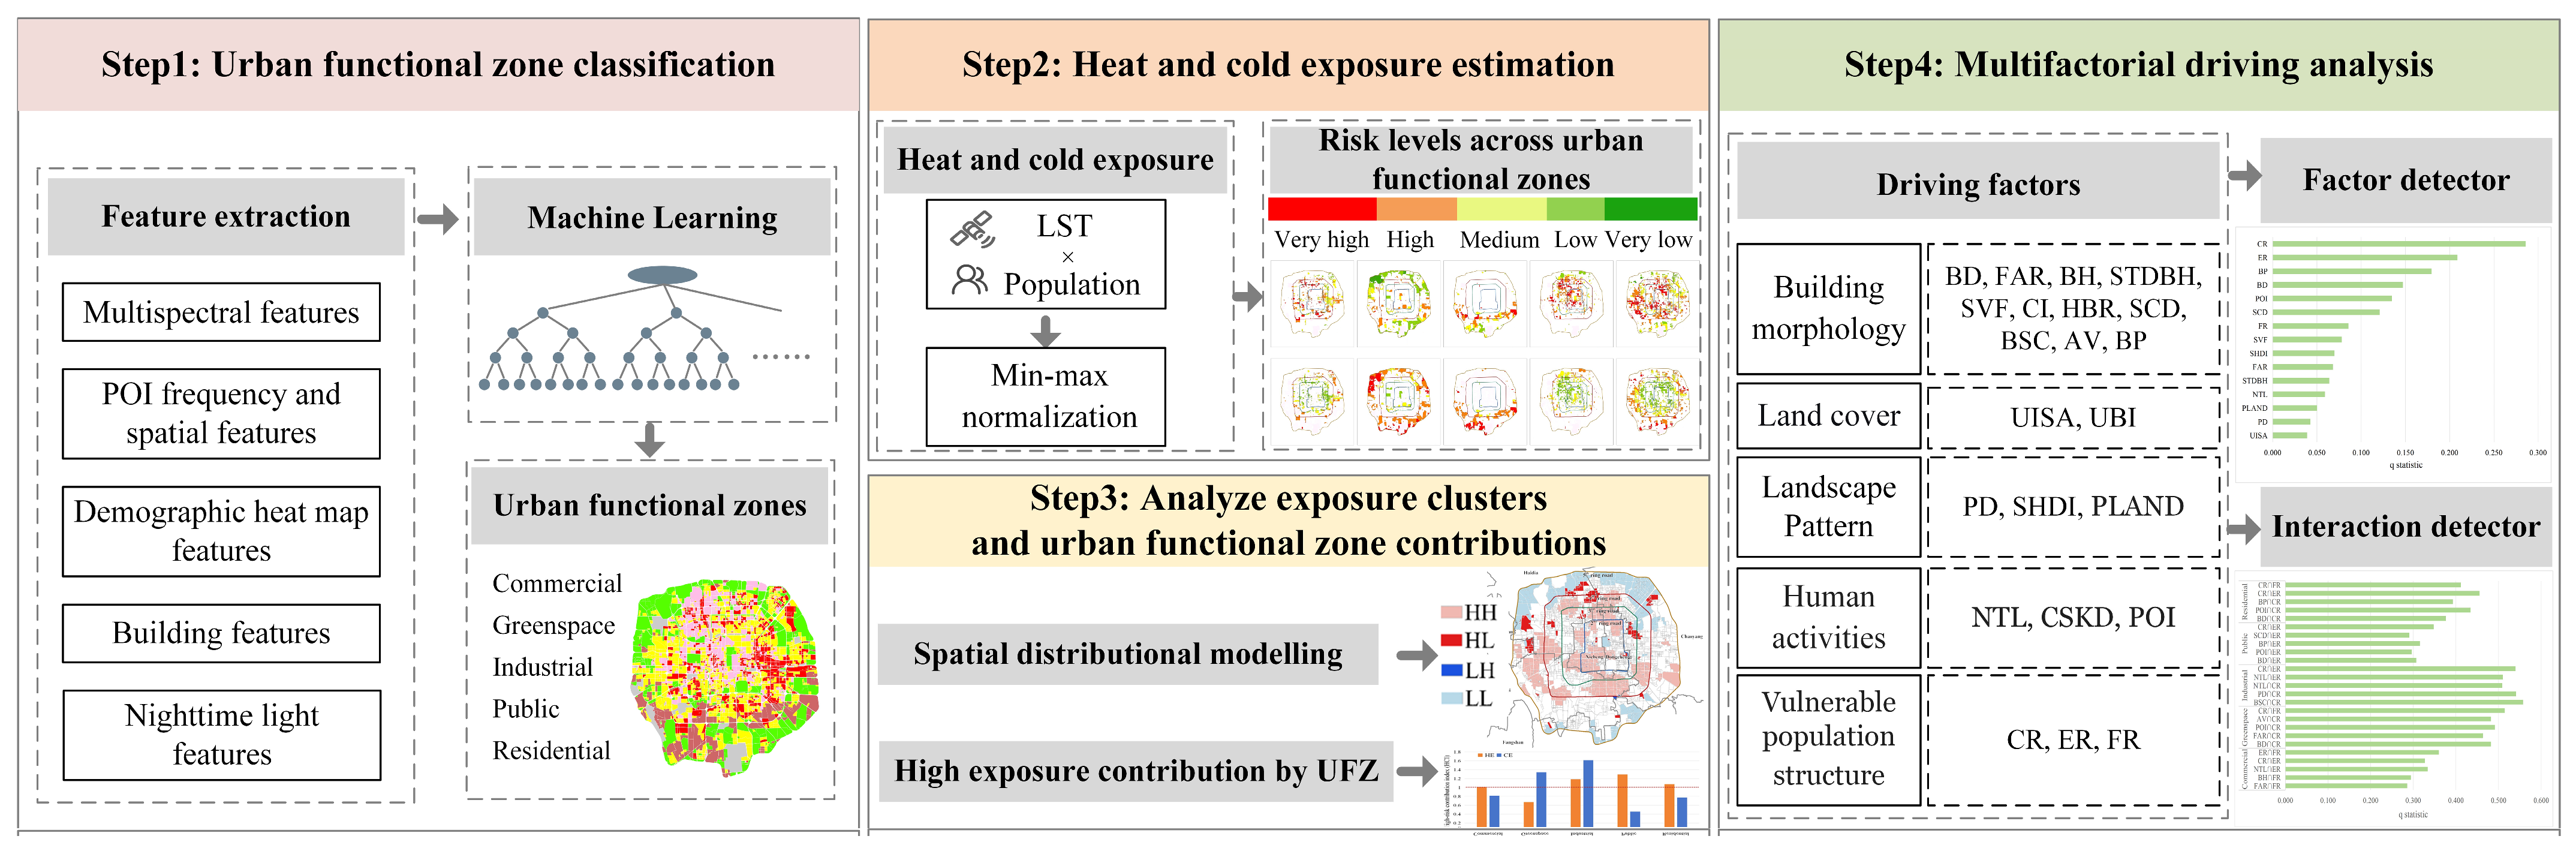
The workflow of this study consists of four parts: (1) we extracted five major categories of features and divided the urban functional zones in the study area using the random forest algorithm; (2) we assessed heat and cold exposure in different UFZs; (3) we analyzed the spatial aggregation patterns of heat and cold exposure and the impacts of different UFZs on exposure; and (4) we applied the Geodetector model to conduct single factor and interactive factor analyses. The study evaluated the respective impacts of building morphology, land cover, landscape pattern, human activity, and vulnerable population structure indicators on heat and cold exposure, identified driving factors, and explored their interactions. Details are shown in Figure 2.

2.3.2. Feature Extraction for UFZs Classification

Following the EULUC classification system [36], this study reclassified UFZs into five major categories: residential zones, commercial zones, industrial zones, public zones, and greenspace zones. Transportation zones were excluded from this study due to their limited occurrence [37].
This study adopted a multi-source big-data approach to defining the functions of blocks. We extracted features of UFZs from five distinct data sources: multispectral remote sensing data, POI data, population heat map data, building morphology data, and nighttime light data. A total of 84 features were ultimately extracted, as detailed in Table 1.
(1)
Multispectral Remote Sensing Data
Using the LANDSAT/LC08/C02/T1_L2 composite images, we calculated the mean value, standard deviation, and variety for the blue, green, red, near-infrared, and short-wave infrared bands for each block. Subsequently, we derived the mean and standard deviation of NDVI, NDBI, and NDWI for each block.
(2)
POI Data
This study reclassified POI data into five UFZ categories. We removed low-importance POIs such as public restrooms [38,39], as some POI categories were common across all urban functional zone types. Subsequently, 17 frequency features and 10 spatial features were extracted from POI data for each block [40]. Frequency features included the total number, proportion, and average kernel density of all POIs and each POI type. The search radius for kernel density analysis was set to 1000 m based on the average block area. Spatial features were extracted using the Word2vec model. First, we constructed a corpus using all POI texts. Second, we obtained vectors for all POI categories through the CBOW algorithm with five training iterations. Finally, ten-dimensional word vectors were generated.
(3)
Population Heat Map Data
Population heat map data for Monday, 26 September 2022 were selected. The mean kernel density for each block was calculated at every integer hour from 0 to 23. A search radius of 1000 m was used for kernel density analysis. This weekday dataset is representative of year-round population activity and can be applied to functional zone classification.
(4)
Building Morphology Data
For each block, the mean, maximum, and standard deviation of floor area ratio and building height were calculated. Additionally, two-dimensional building indicators were computed, including the mean, maximum, and standard deviation of building density and building area.
(5)
Nighttime Light Data
The mean nighttime light value for each block was included in the feature calculation [41].
Subsequently, the random forest model, an ensemble-learning method built on decision trees, was employed for identification of UFZs. This approach was selected owing to its well-documented performance in large-scale data processing and complex classification tasks. Compared with conventional linear models or individual decision trees, the random forest improved prediction accuracy and robustness through the aggregation of multiple decision trees, which enabled effective capture of high dimensional features and nonlinear relationships [42]. Accordingly, the random forest model was extensively adopted for classification, and its advantages were verified using multiple datasets [43,44]. Based on high-resolution historical Google Earth imagery, 266 residential, 110 commercial, 37 industrial, 138 public, and 188 greenspace zone samples were selected in this study. Twenty percent of the blocks were chosen as the test set to verify classifier accuracy, while the remaining blocks were taken as the training set and input into the random forest model for classification of UFZs. The parameters of ‘n_estimators’ and ‘min_samples_leaf’ were set to 200 and 2, respectively. The final classification results were validated through comparison with real-world imagery.

2.3.3. Heat and Cold Exposure Estimation

Humans constitute the core exposure subject in climate-related health risk assessments. Heat exposure and cold exposure reflected the extent to which populations were exposed to urban high and low temperatures, which were generally evaluated by integrating LST and population distribution data [29]. Moreover, urban thermal conditions are generally not confined to individual block boundaries, but are shaped by spatially continuous characteristics such as building density, impervious surface coverage, vegetation, water bodies, and road networks. As a result, neighboring blocks with similar urban form and environmental settings often share a comparable thermal background, allowing broader hot and cold patterns to extend across adjacent blocks. Summer and winter LST were adopted in this study to represent heat hazard and cold hazard, respectively. To eliminate impacts caused by inconsistent dimensions, all indicators were first standardized (Equation (1)) [45]. Specifically, winter LST was separately subjected to reverse normalization (Equation (2)). Given that this study was designed to identify high-exposure population clusters over a broad geographic extent and to provide an objective, reproducible, and standardized spatial reference. The reverse-normalized LST serves as a reasonable dimensionality-reduction proxy for the complex real-world exposure process. While this metric inevitably fails to account for all instantaneous microclimatic influences on individuals, it remains adequate for our primary objective—namely, to map the spatial differentiation of environmental cold exposure among regional populations. Overall, this proxy achieves an optimal balance between data availability, clear physical meaning, and methodological generalizability. Heat exposure values (Equation (3)) and cold exposure values (Equation (4)) [31,46] were subsequently calculated as the product of standardized LST and population data.
X = 0.1 + X M i n M a x M i n × 0.9 0.1
X = 0.1 + M a x X M a x M i n × 0.9 0.1
where X is the standardized values with the range of 0.1–0.9, X is the original value, and M i n and M a x are the minimum and maximum values of the original value.
H E i = L S T s u m m e r , i × log 10 P O P i
C E i = L S T w i n t e r , i × log 10 P O P i
where H E i is the heat exposure index for the i block. P O P i is the standardized population for i block. L S T s u m m e r , i and L S T w i n t e r , i are the normalized LST in summer and winter, respectively.
To facilitate comparisons of spatial heat and cold exposure across different UFZs, the results were standardized using min–max normalization. The Natural Breaks method was applied to classify heat and cold exposure values into five levels.

2.3.4. Spatial Distribution Modelling and Construction of High-Risk Contribution Index

To reveal the non-random spatial distribution patterns and potential aggregation characteristics of summer heat exposure and winter cold exposure, spatial autocorrelation analysis was introduced in this study. Spatial autocorrelation assesses the extent to which the attribute value of a spatial unit is statistically dependent on the values of its neighboring locations [47]. Global Moran’s I was used to assess the spatial distribution characteristics of each UFZ and interpret the average correlation degree between each UFZ and its surrounding areas. To identify specific locations of spatial aggregation for heat and cold exposure, local Moran’s I was adopted. The outputs were classified into four spatial aggregation types: relatively high risk surrounded by high risk (HH), relatively low risk surrounded by low risk (LL), high risk surrounded mainly by low risk (HL), and low risk surrounded mainly by high risk (LH).
Furthermore, to support targeted risk management, the impacts of different UFZs on heat and cold exposure were quantified by calculating the proportion of high-heat-exposure and high-cold-exposure areas within each UFZ relative to total high-risk areas across the study region. The high-risk contribution index (HCI) was adopted to quantify the contributions of various functional zones to severe heat and cold exposure [48] (Equation (5)). Based on aggregation results derived from local Moran’s I, blocks categorized as HH and HL types were extracted as high-exposure zones, whereas the remaining blocks were defined as low-exposure zones.
H C I i = S h i / S i S h / S
where i represents a specific function type, H C I i is the heat or cold exposure contribution index for that type, S i and S h i are the total area of the function type and the area of high heat or cold exposure within that type, respectively, and S h and S are the total area of high heat or cold exposure and the entire study area, respectively.

2.3.5. GeoDetector

GeoDetector represents a set of statistical methods for detecting spatial stratified heterogeneity and revealing its underlying driving forces [49,50]. GeoDetector was employed in this study to assess the impacts of various driving factors on the distribution of heat and cold exposure. With heat exposure and cold exposure set as dependent variables, factor detector and interaction detector were adopted to analyze the driving and interaction effects [51,52]. Independent variables were discretized using the Natural Breaks method to transform them into five classes [53].
The spatial differentiation of the interpreted variable Y is evaluated using q statistical measures within the factor detector. The factor detector evaluated the impact of each individual factor on exposure. The formula for factor detector is as follows:
q = 1 h = 1 L N h σ h 2 N σ 2 = 1 S S W S S T
S S W = h = 1 L N h σ h 2 ,   S S T = N σ 2
where h represents the layer number of the independent variable, and N h is the number of sample units in each zone; N is the total number of samples in the entire study area; L is the total number of zones of the independent variables; and σ h 2 is the variance within each zone, and   σ 2 is the global variance in the entire study area. S S W refers to the variances within the zone; and S S T is the global variance of the dependent variables in the study area. The q values lie within [0, 1], and a larger q corresponds to stronger spatial differentiation of Y. To avoid random fluctuations caused by data partitioning or discretization in a single model run, we independently repeated the entire modelling process three times. The mean q-value obtained from the three runs was used as the final q-value for each factor, and the standard deviation of the three runs was used to construct the standard error term for the t-test.
The interaction detector was designed to identify interactive effects among different factors. It evaluates whether the explanatory power of independent variables X1 and X2 for the dependent variable Y was enhanced, weakened, or remained mutually independent under their combined effect [49]. To evaluate the strength and type of interaction between two factors, the interaction detector calculates the combined q value q (X1 ∩ X2) and contrasts it with the individual q values q (X1) and q (X2). The relationship between the two factors can be classified into the following categories (Table 2).

2.3.6. Driving Factors Selection

Heat and cold exposure were taken as core indicators to characterize urban climatic environments in this study. These indicators were affected by multiple factors, including building morphology, land cover, landscape pattern, human activity, and vulnerable population structure. To comprehensively explore the driving mechanisms of heat and cold exposure, potential drivers were categorized into four groups, with 22 specific indicators calculated [11,20,54,55,56,57,58] (Table 3).

3. Results

3.1. Spatial Distribution of Heat and Cold Exposure Among Different UFZs

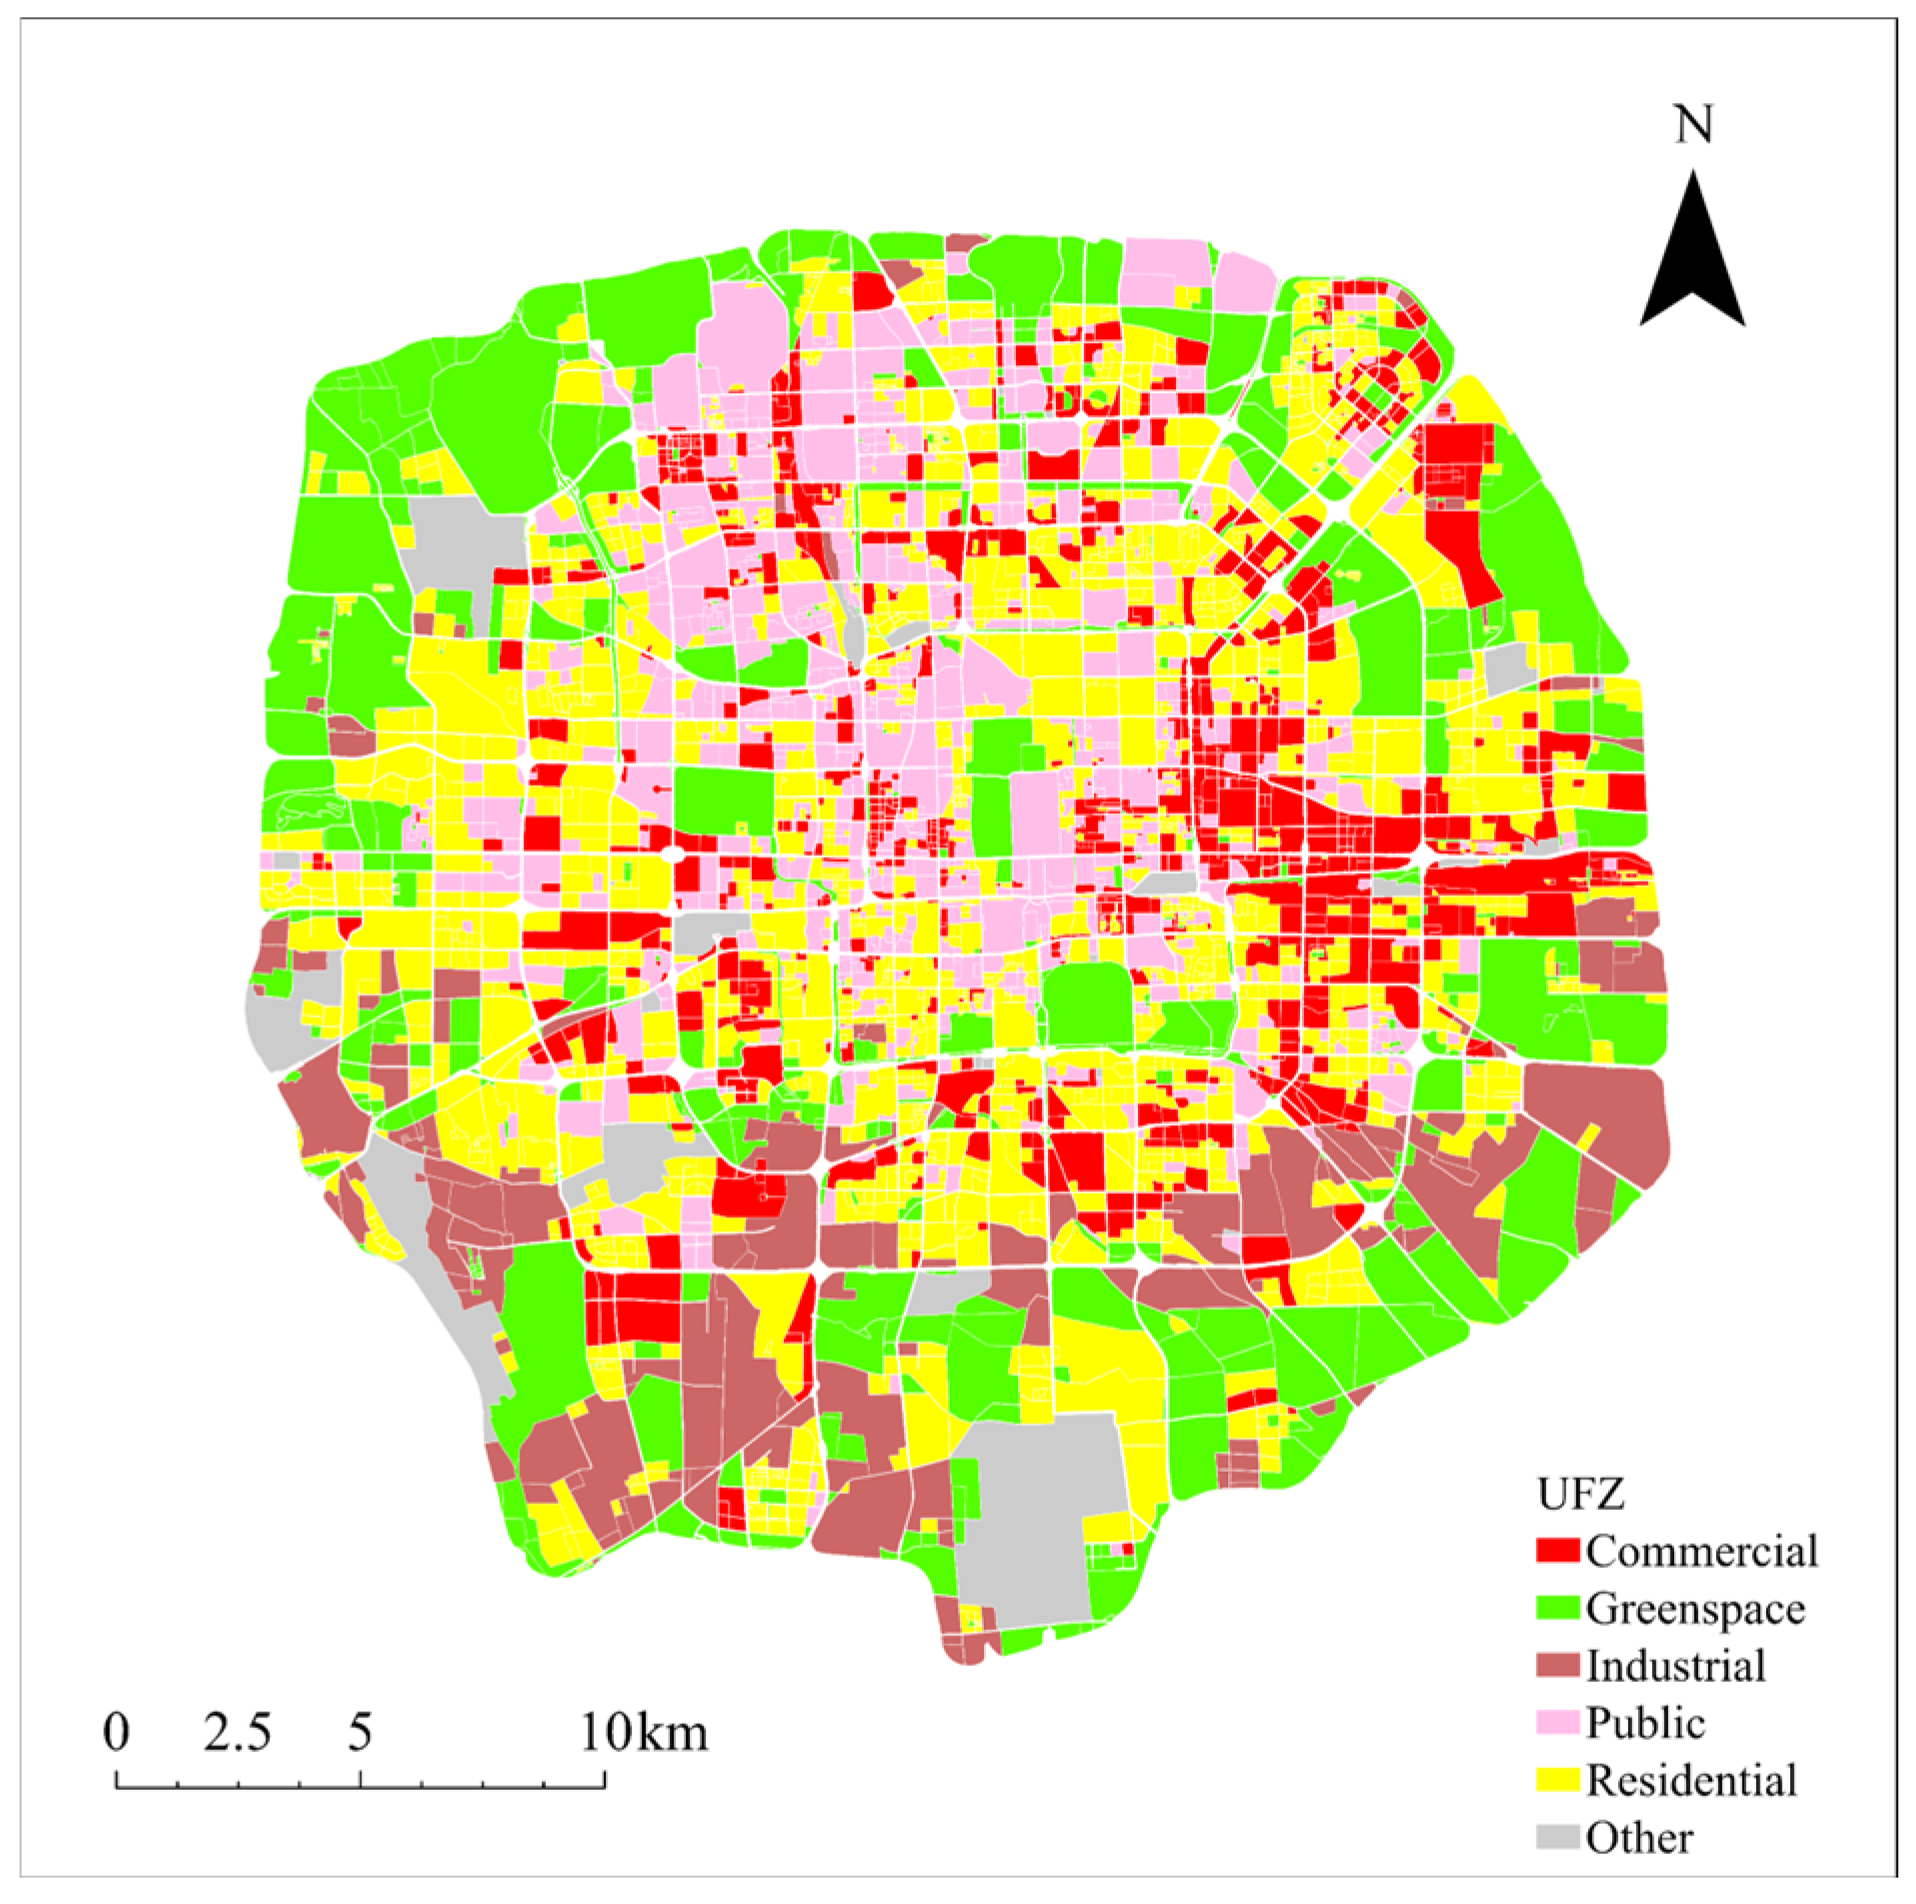
A total of 739 manually classified samples were used for training. The overall accuracy reached 81.8%, and the Kappa coefficient was 0.75, indicating that the classifier effectively identified UFZs. Specifically, the precision, recall, F1-score, and confusion matrix were calculated, as shown in Table 4 and Table 5. The model performed well for residential, greenspace, and public zones, while the classification performance for commercial zones was relatively balanced. Although industrial zones showed a lower recall due to the limited sample size and partial confusion, obvious industrial misclassifications were further checked using correction criteria. The final corrected map contained 149 industrial zones, with an industrial-related correction ratio of 8.72%. The correction followed four main criteria: (1) a clear industrial morphology on high-resolution imagery; (2) large, regularly arranged buildings with internal roads or logistics areas; (3) industrial-related POI records; and (4) classification as industrial or production land in official planning data. Auxiliary texture features (e.g., hardened surfaces, steel roofs, and storage traces) were also considered. To ensure reproducibility, two independent interpreters performed the checks, and modifications were made only when their judgments were consistent. Therefore, the final UFZ classification was sufficiently reliable for subsequent analysis (Figure 3).
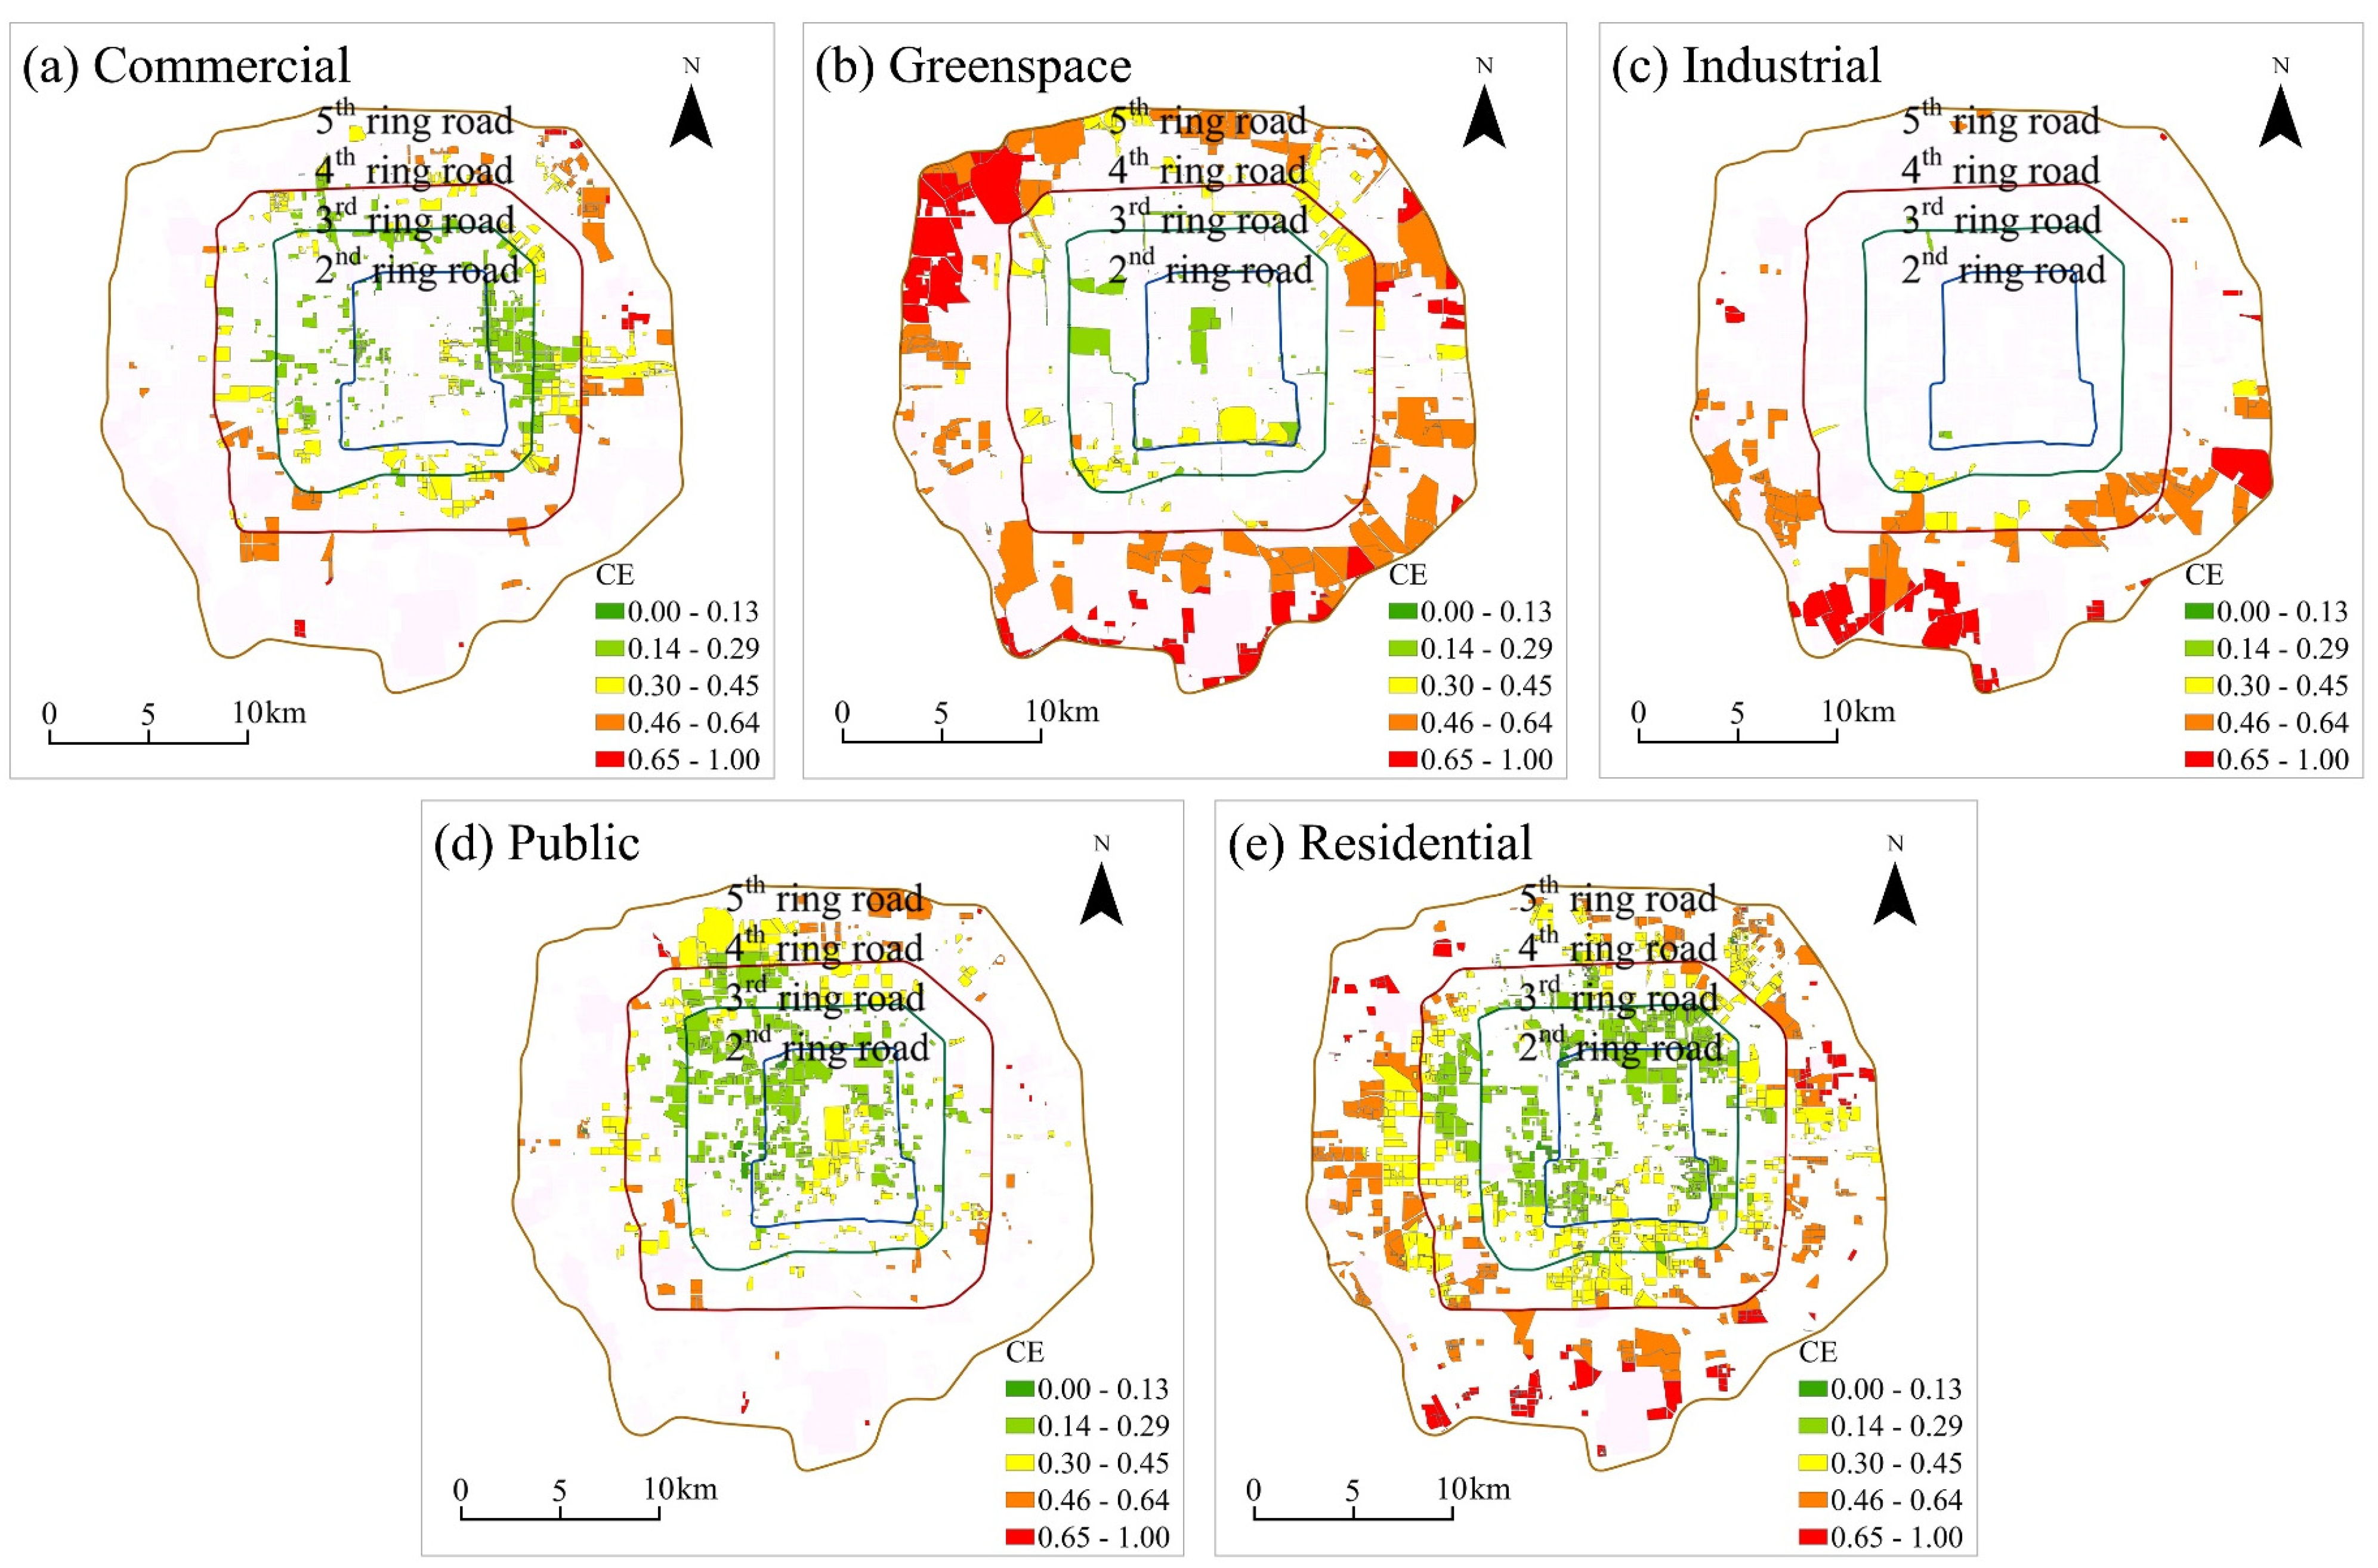
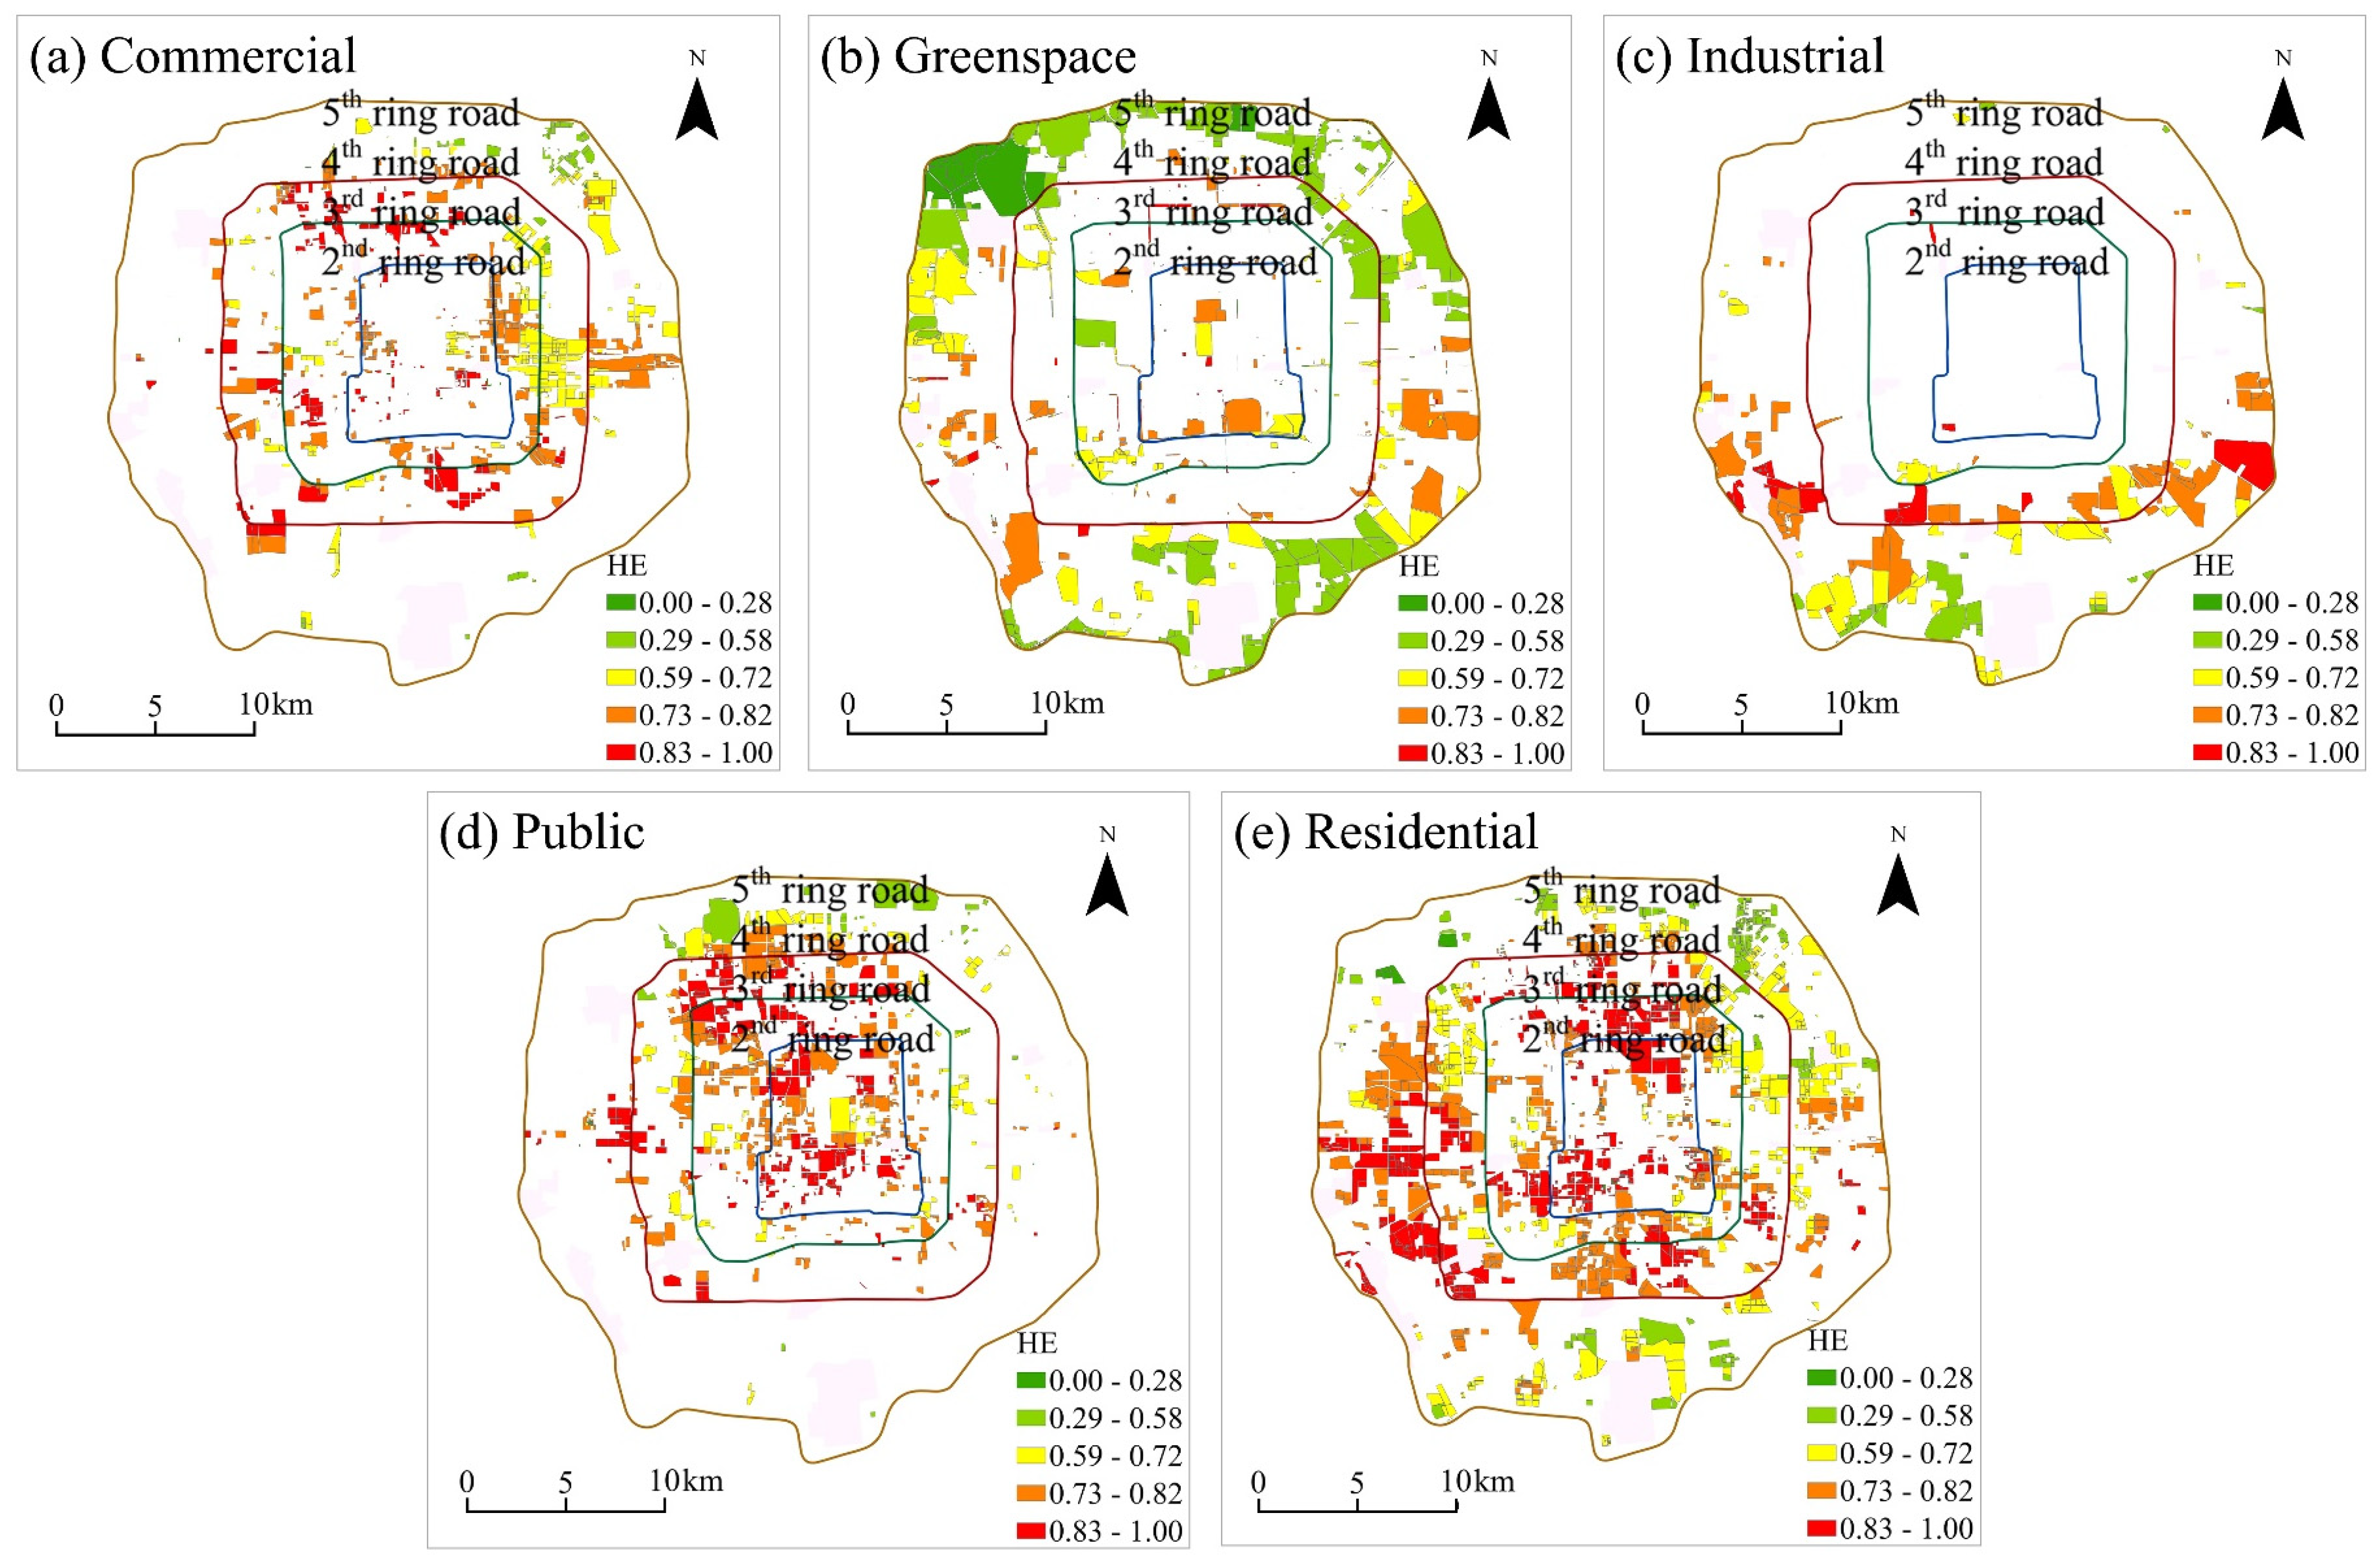
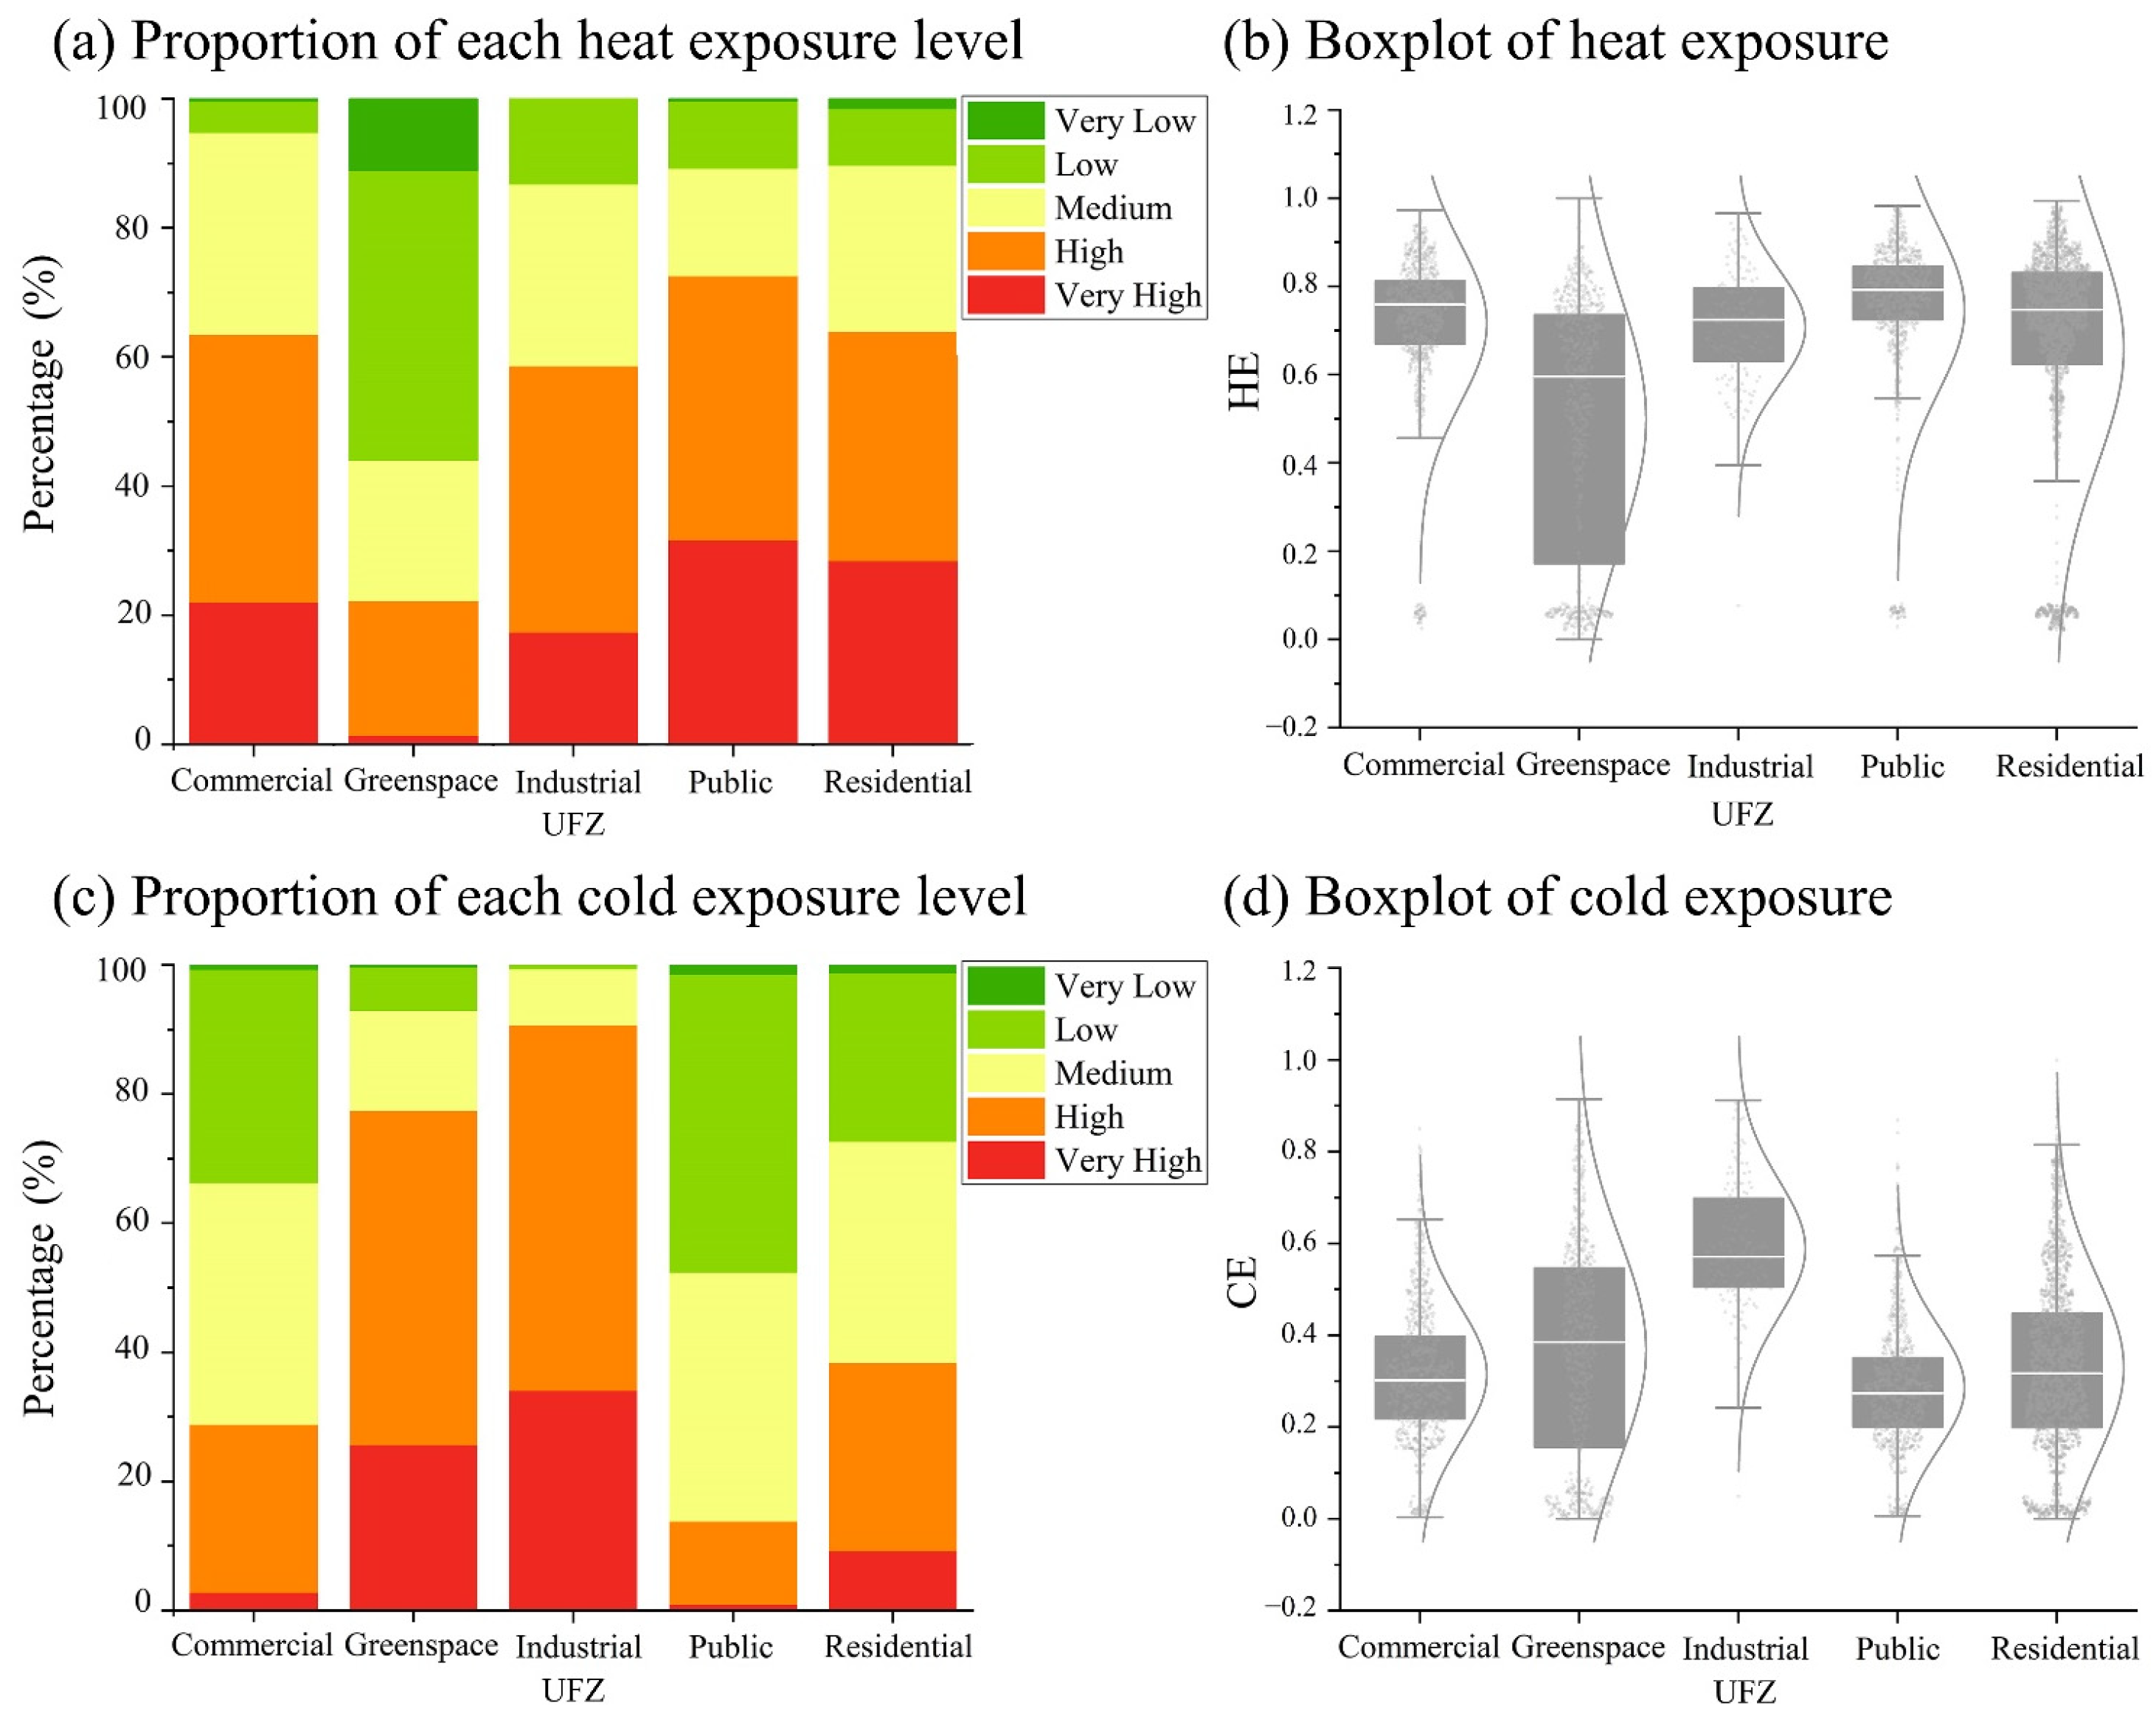
To explore the differences in heat and cold exposure across various UFZs, the Natural Breaks method was first applied to classify heat and cold exposure into five levels: very high, high, medium, low, and very low. As illustrated in Figure 4 and Figure 5a,b, public, residential, and commercial zones exhibited high proportions of very high and high heat exposure levels, which were mainly distributed in the central urban area and northwestern region of Beijing. Industrial zones were mostly located between the 4th and 5th Ring Roads. Owing to the low population density within these zones, the proportion of areas with high and very high heat exposure was not the highest. Greenspace zones showed the largest share of low and very low heat exposure levels. Spatially, they were distributed near the periphery of the 5th Ring Road and adjacent to mountainous areas in the west, where the temperature and population levels were well-regulated.
As illustrated in Figure 5c,d and Figure 6, industrial zones presented the highest overall cold exposure, followed by greenspace zones. Areas beyond the 4th Ring Road for these two zone types were mostly classified into high to very high cold exposure levels. Residential, commercial, and public zones experienced relatively low cold exposure, with areas of very low cold exposure concentrated within the 3rd Ring Road. This region contained numerous universities, shopping malls, and residential communities characterized by dense high-rise and mid-rise buildings. The concentrated heat emissions led to prominent urban heat island effects in winter.
Overall, regions with high exposure in both summer and winter were identified across all five types of zones, which were distributed in the southwestern and southeastern areas between the 3rd and 5th Ring Roads, close to suburban areas. These areas featured a mixed building density and morphology, and a high proportion of impervious surfaces, as well as bare land, large factories, and warehouses. Meanwhile, Beijing contained abundant deciduous tree species. After leaf fall in winter, forest canopies lost thermal insulation and wind-shielding functions, further weakening the overall environmental capacity for heat and cold regulation. This contributed to heat accumulation in summer and poor thermal retention in winter.

3.2. Spatial Aggregation Patterns of Heat and Cold Exposure and Impacts of Different UFZs on Exposure

3.2.1. Spatial Aggregation Patterns

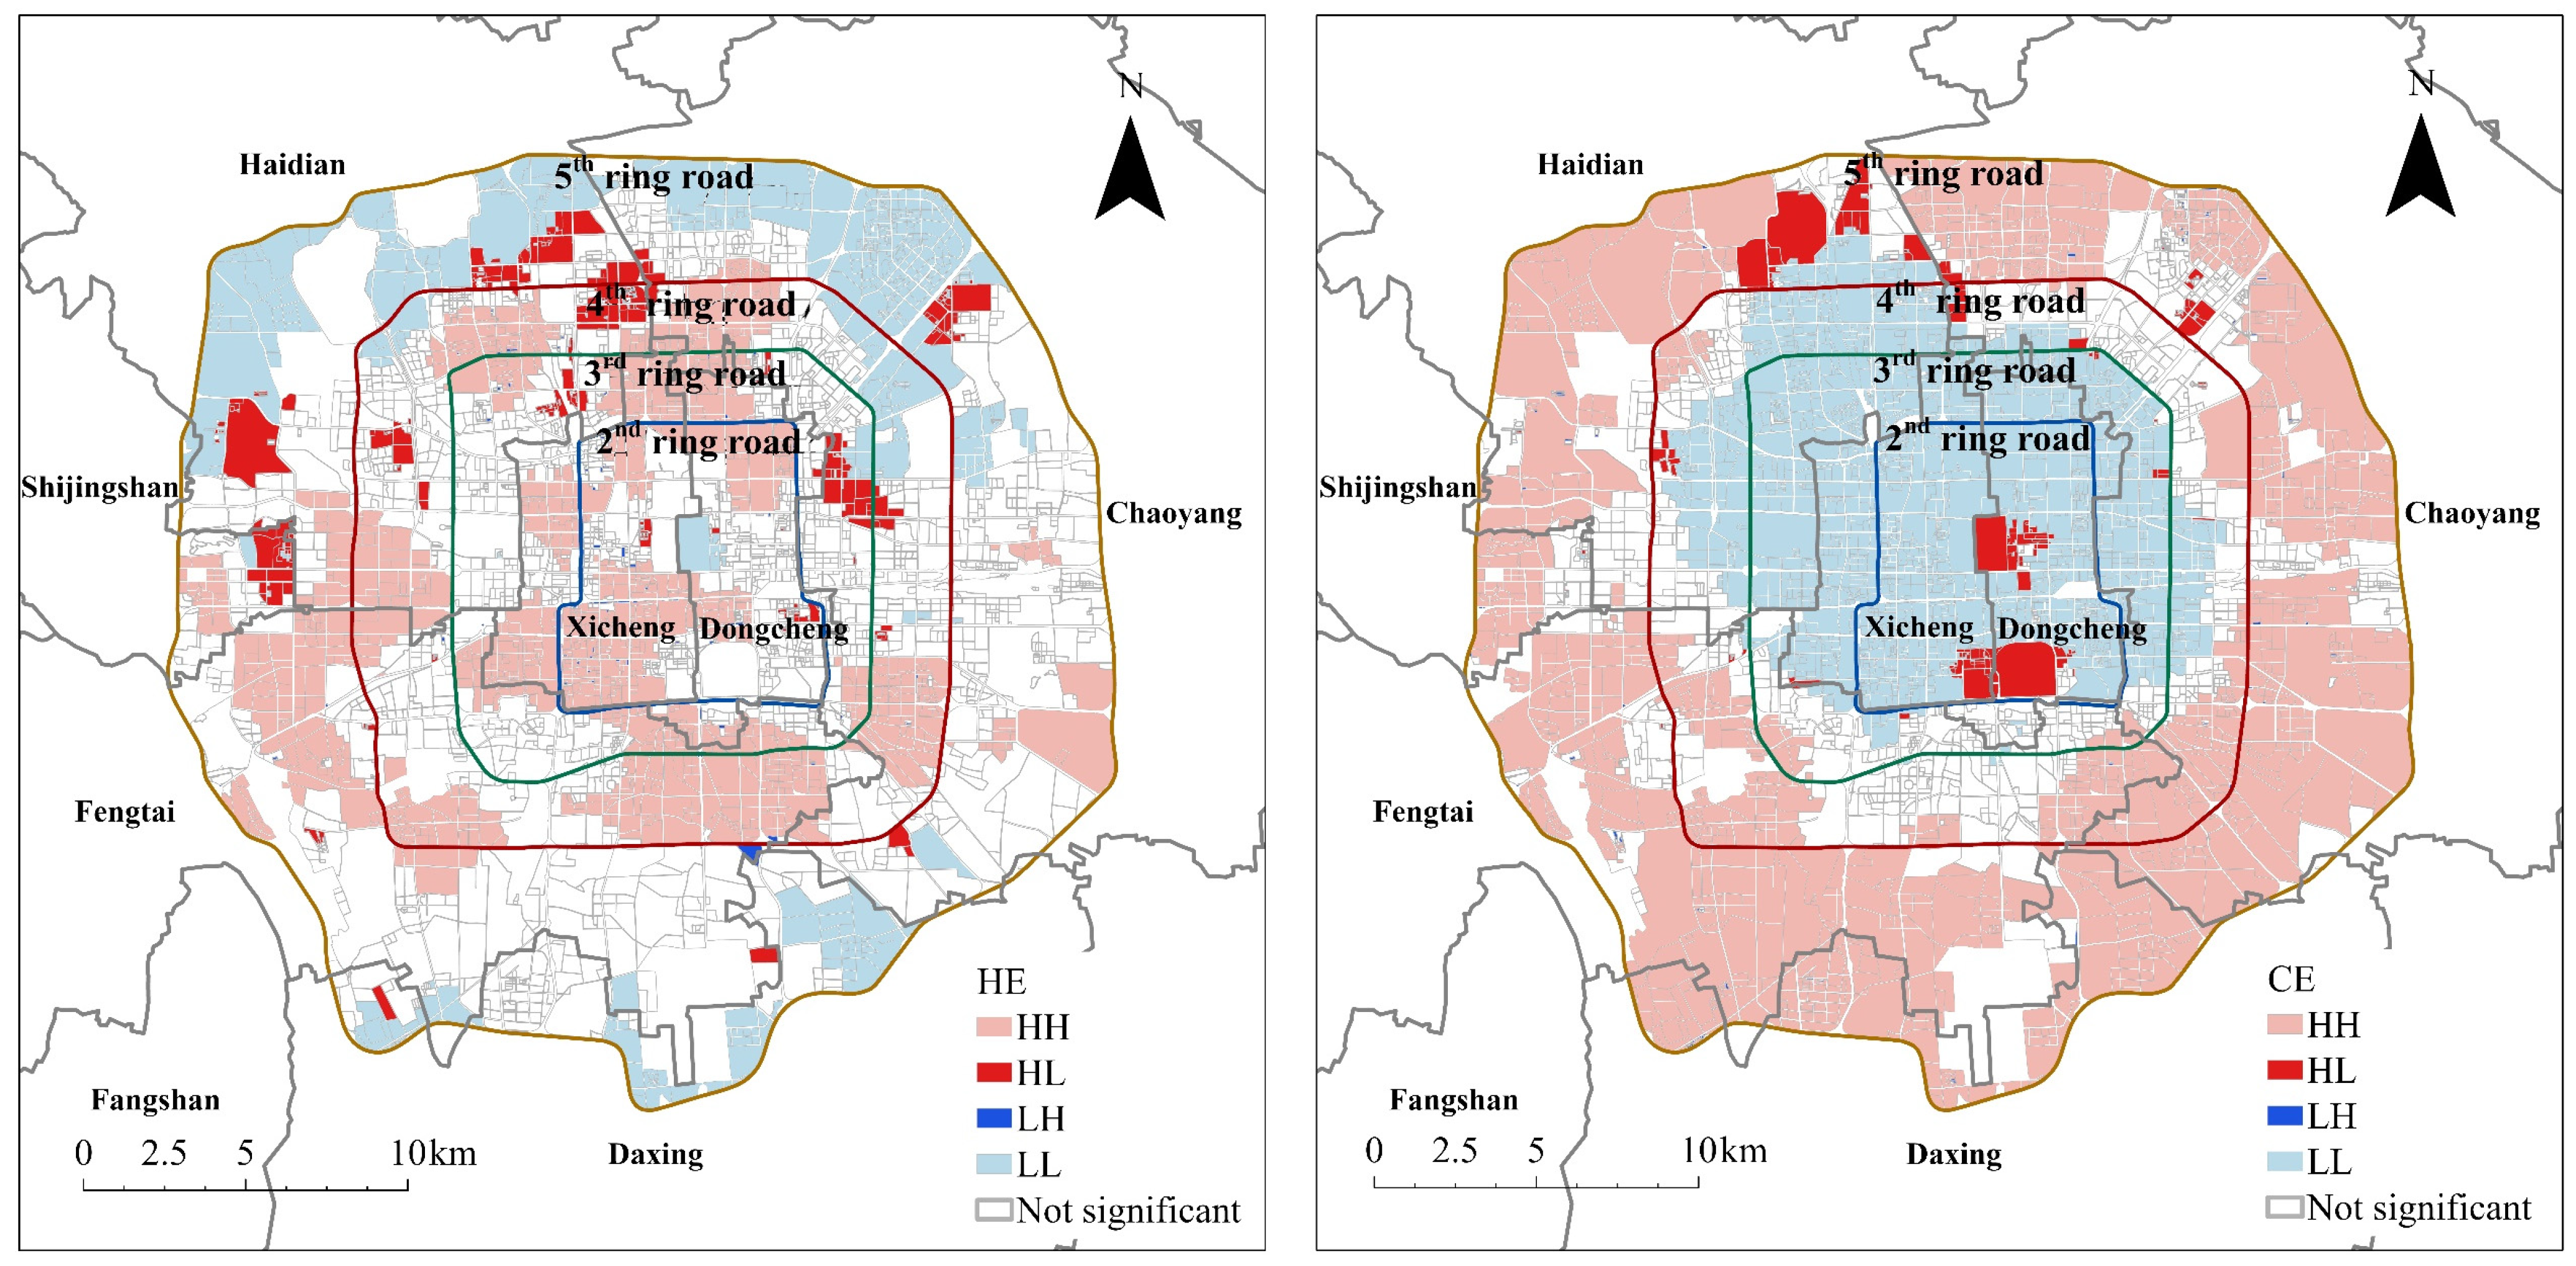
According to Figure 7, the HH aggregation type occupied a relatively large area for summer heat exposure, mainly distributed in Xicheng District, the southeastern part of Haidian District, and northern Fengtai District. The LL aggregation type ranked second, concentrated in the northern and southern parts of the study area. Another low-value aggregation area appeared near the Palace Museum in the west–central Dongcheng District, which was associated with its low building floor area ratio and favorable water-greening environment. For winter cold exposure, the HH aggregation type dominated in area proportion, followed by the LL type. Spatially, HH-type clusters were almost entirely located beyond the 4th Ring Road. In contrast, LL-type clusters were mainly concentrated within the 4th Ring Road, showing a more compact distribution compared with heat exposure patterns.

3.2.2. Impacts of Different UFZs on Exposure

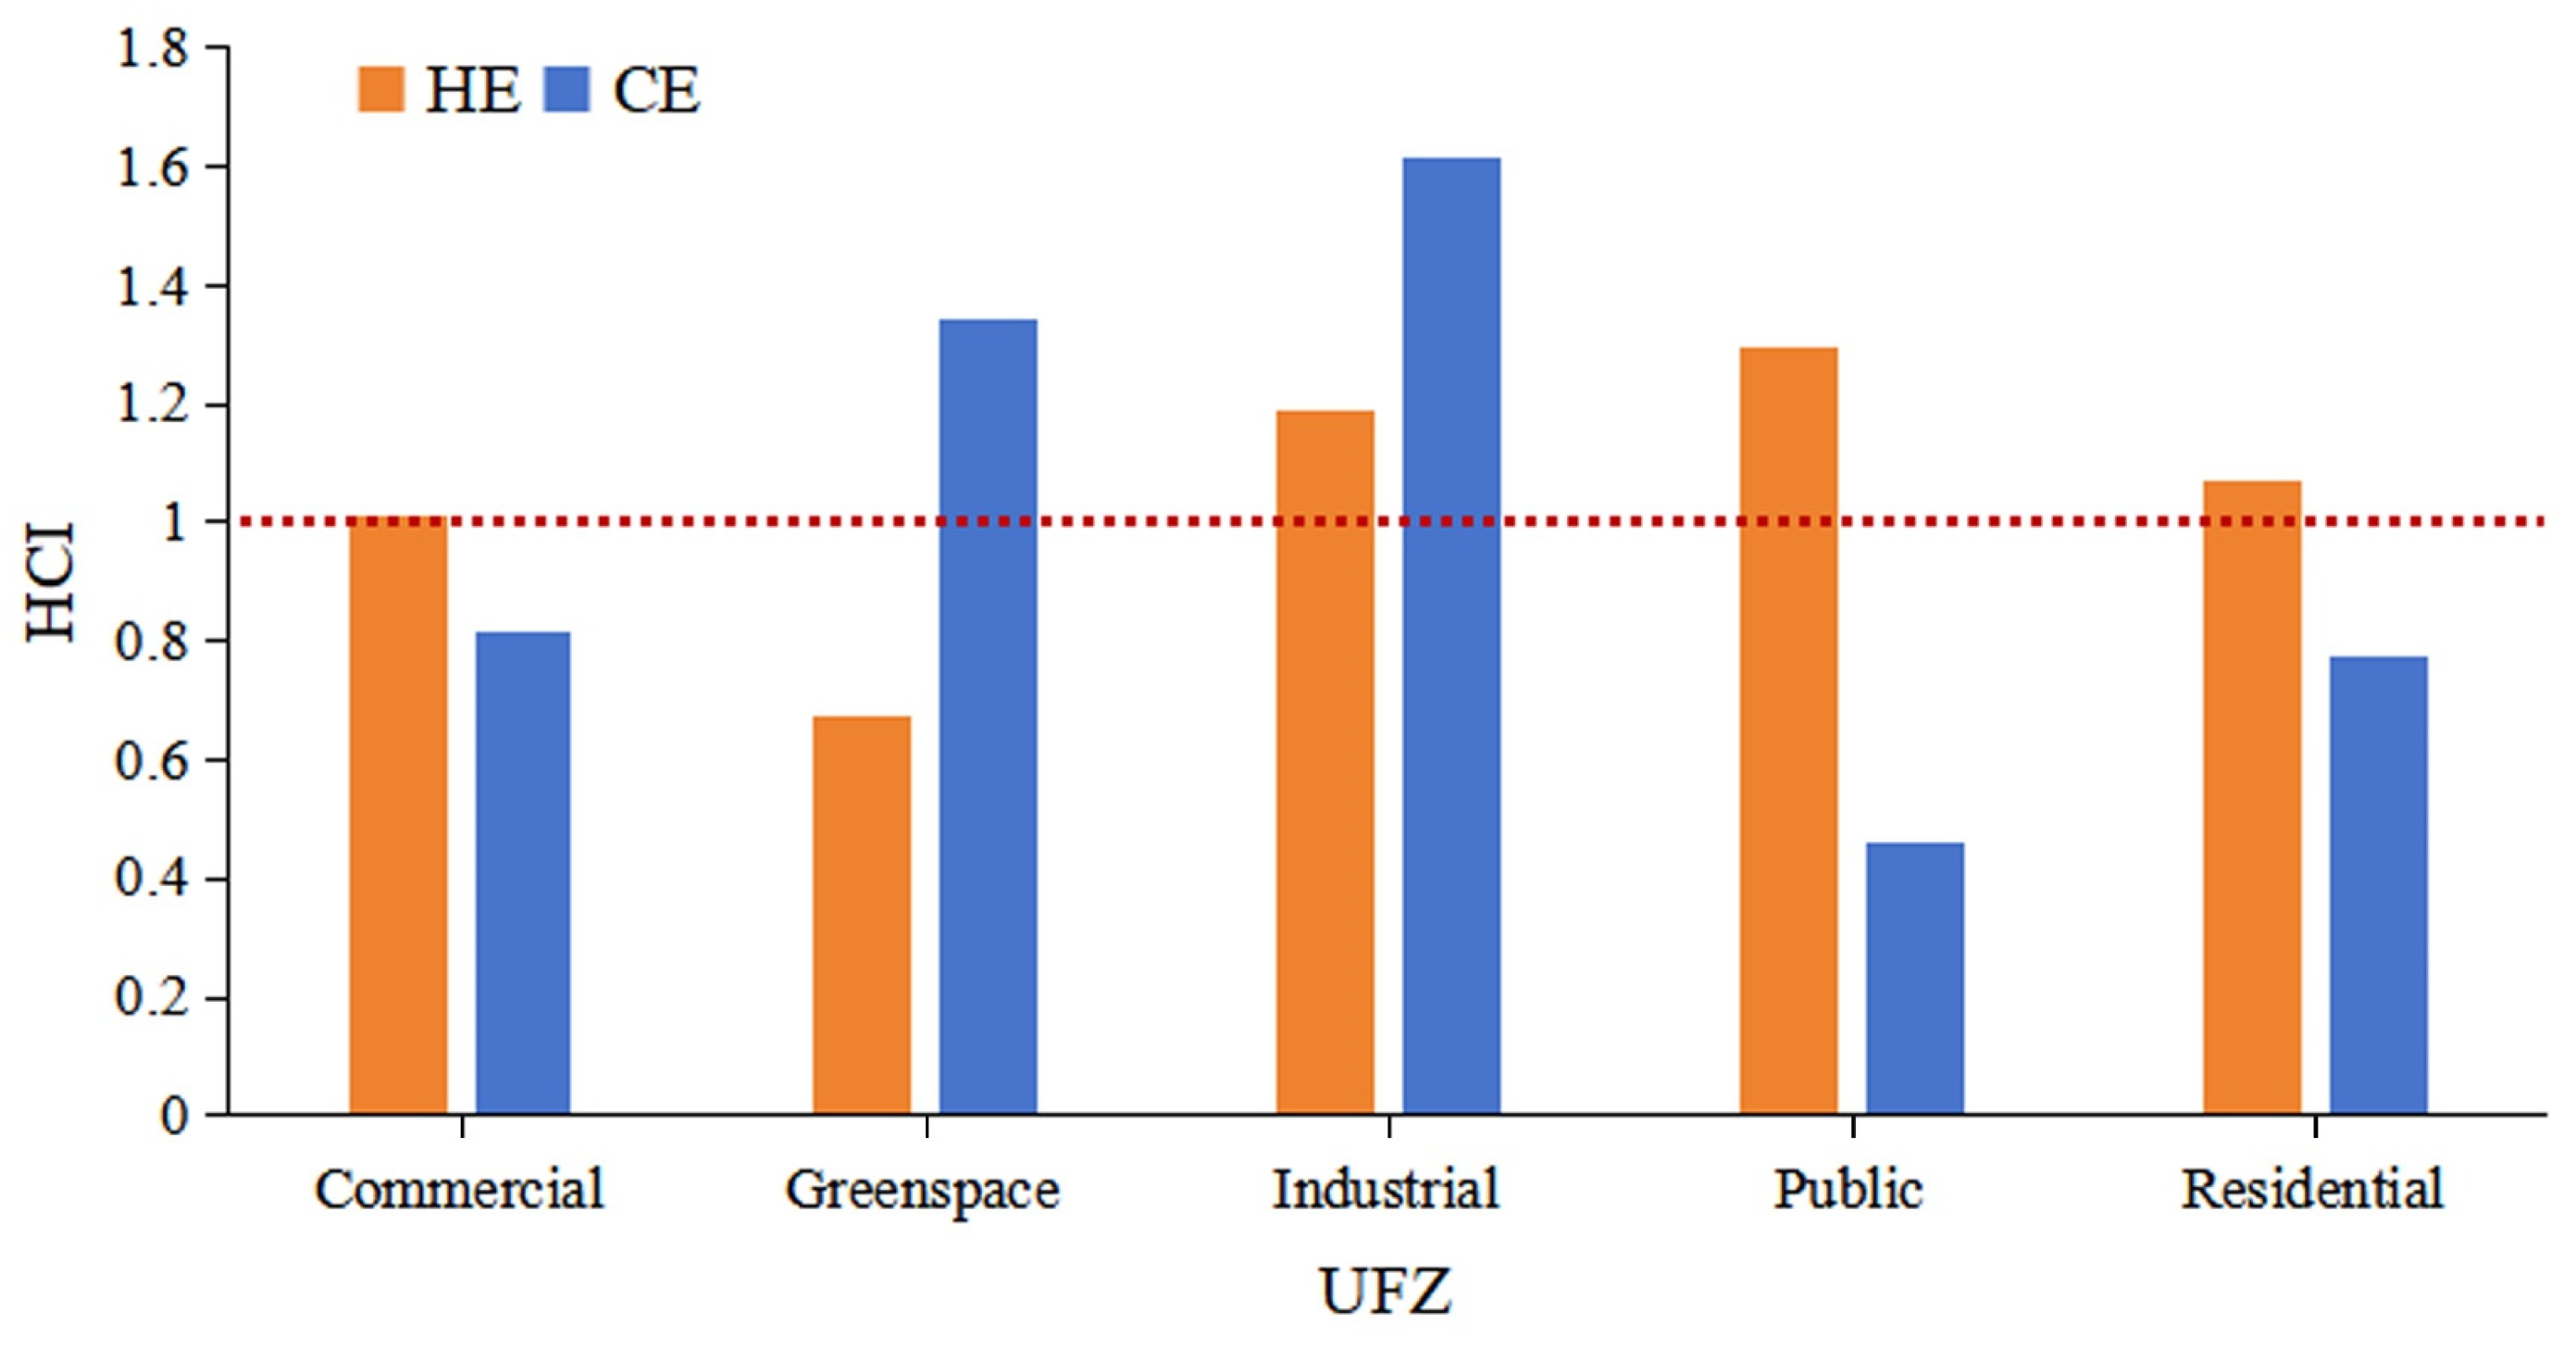
This study calculated the HCI to quantify the contribution of different UFZs to heat and cold exposure. Three patterns were identified (Figure 8). First, the HCI values were greater than 1 for both heat and cold exposure, indicating positive contributions. Only industrial zones belonged to this high-HCI type. Industrial zones contained extensive impervious surfaces, limited shaded vegetation, large open spaces, and a typical low-rise factory or warehouse morphology, which facilitated high temperature aggregation in summer. Specifically, impervious surfaces and industrial roofs can store and release more heat. Substantial anthropogenic heat emissions from industrial activities may further intensify summer heat exposure. In winter, large open spaces, limited building shelter, and the relatively poor thermal insulation of industrial buildings may increase the exposure to low surface temperatures. In addition, some industrial zones are adjacent to mixed residential, dormitory, school, or service functions, which may increase the population-weighted exposure during commuting and working periods. Second, HCI values were greater than 1 for heat exposure but less than 1 for cold exposure. Commercial, public, and residential zones fell into this category. Predominantly located in core urban areas, these zones featured a high building density and intensive human activities, which elevated summer heat exposure. In winter, dense building clusters stored heat and blocked cold winds, thereby exerting negative effects on cold exposure. Third, HCI values were less than 1 for heat exposure but greater than 1 for cold exposure, a pattern exclusive to greenspace zones. Vegetation shading in greenspaces can effectively reduce local heat levels [59,60], thereby contributing negatively to heat exposure. After leaf fall in winter, vegetation may alter the shading and wind-sheltering effects [61,62]. Coupled with the open spatial features and higher sky exposure, which may facilitate longwave radiative heat loss under clear winter conditions, this may partly explain the relatively low winter LST observed in greenspace, yielding positive contributions to cold exposure [63,64,65].

3.3. Spatial Impact Differences and Main Effects of Key Factors on Heat and Cold Exposure

Differences in heat and cold exposure among UFZs were affected by multiple factors. GeoDetector was applied in this study to identify the primary factors influencing heat and cold exposure.
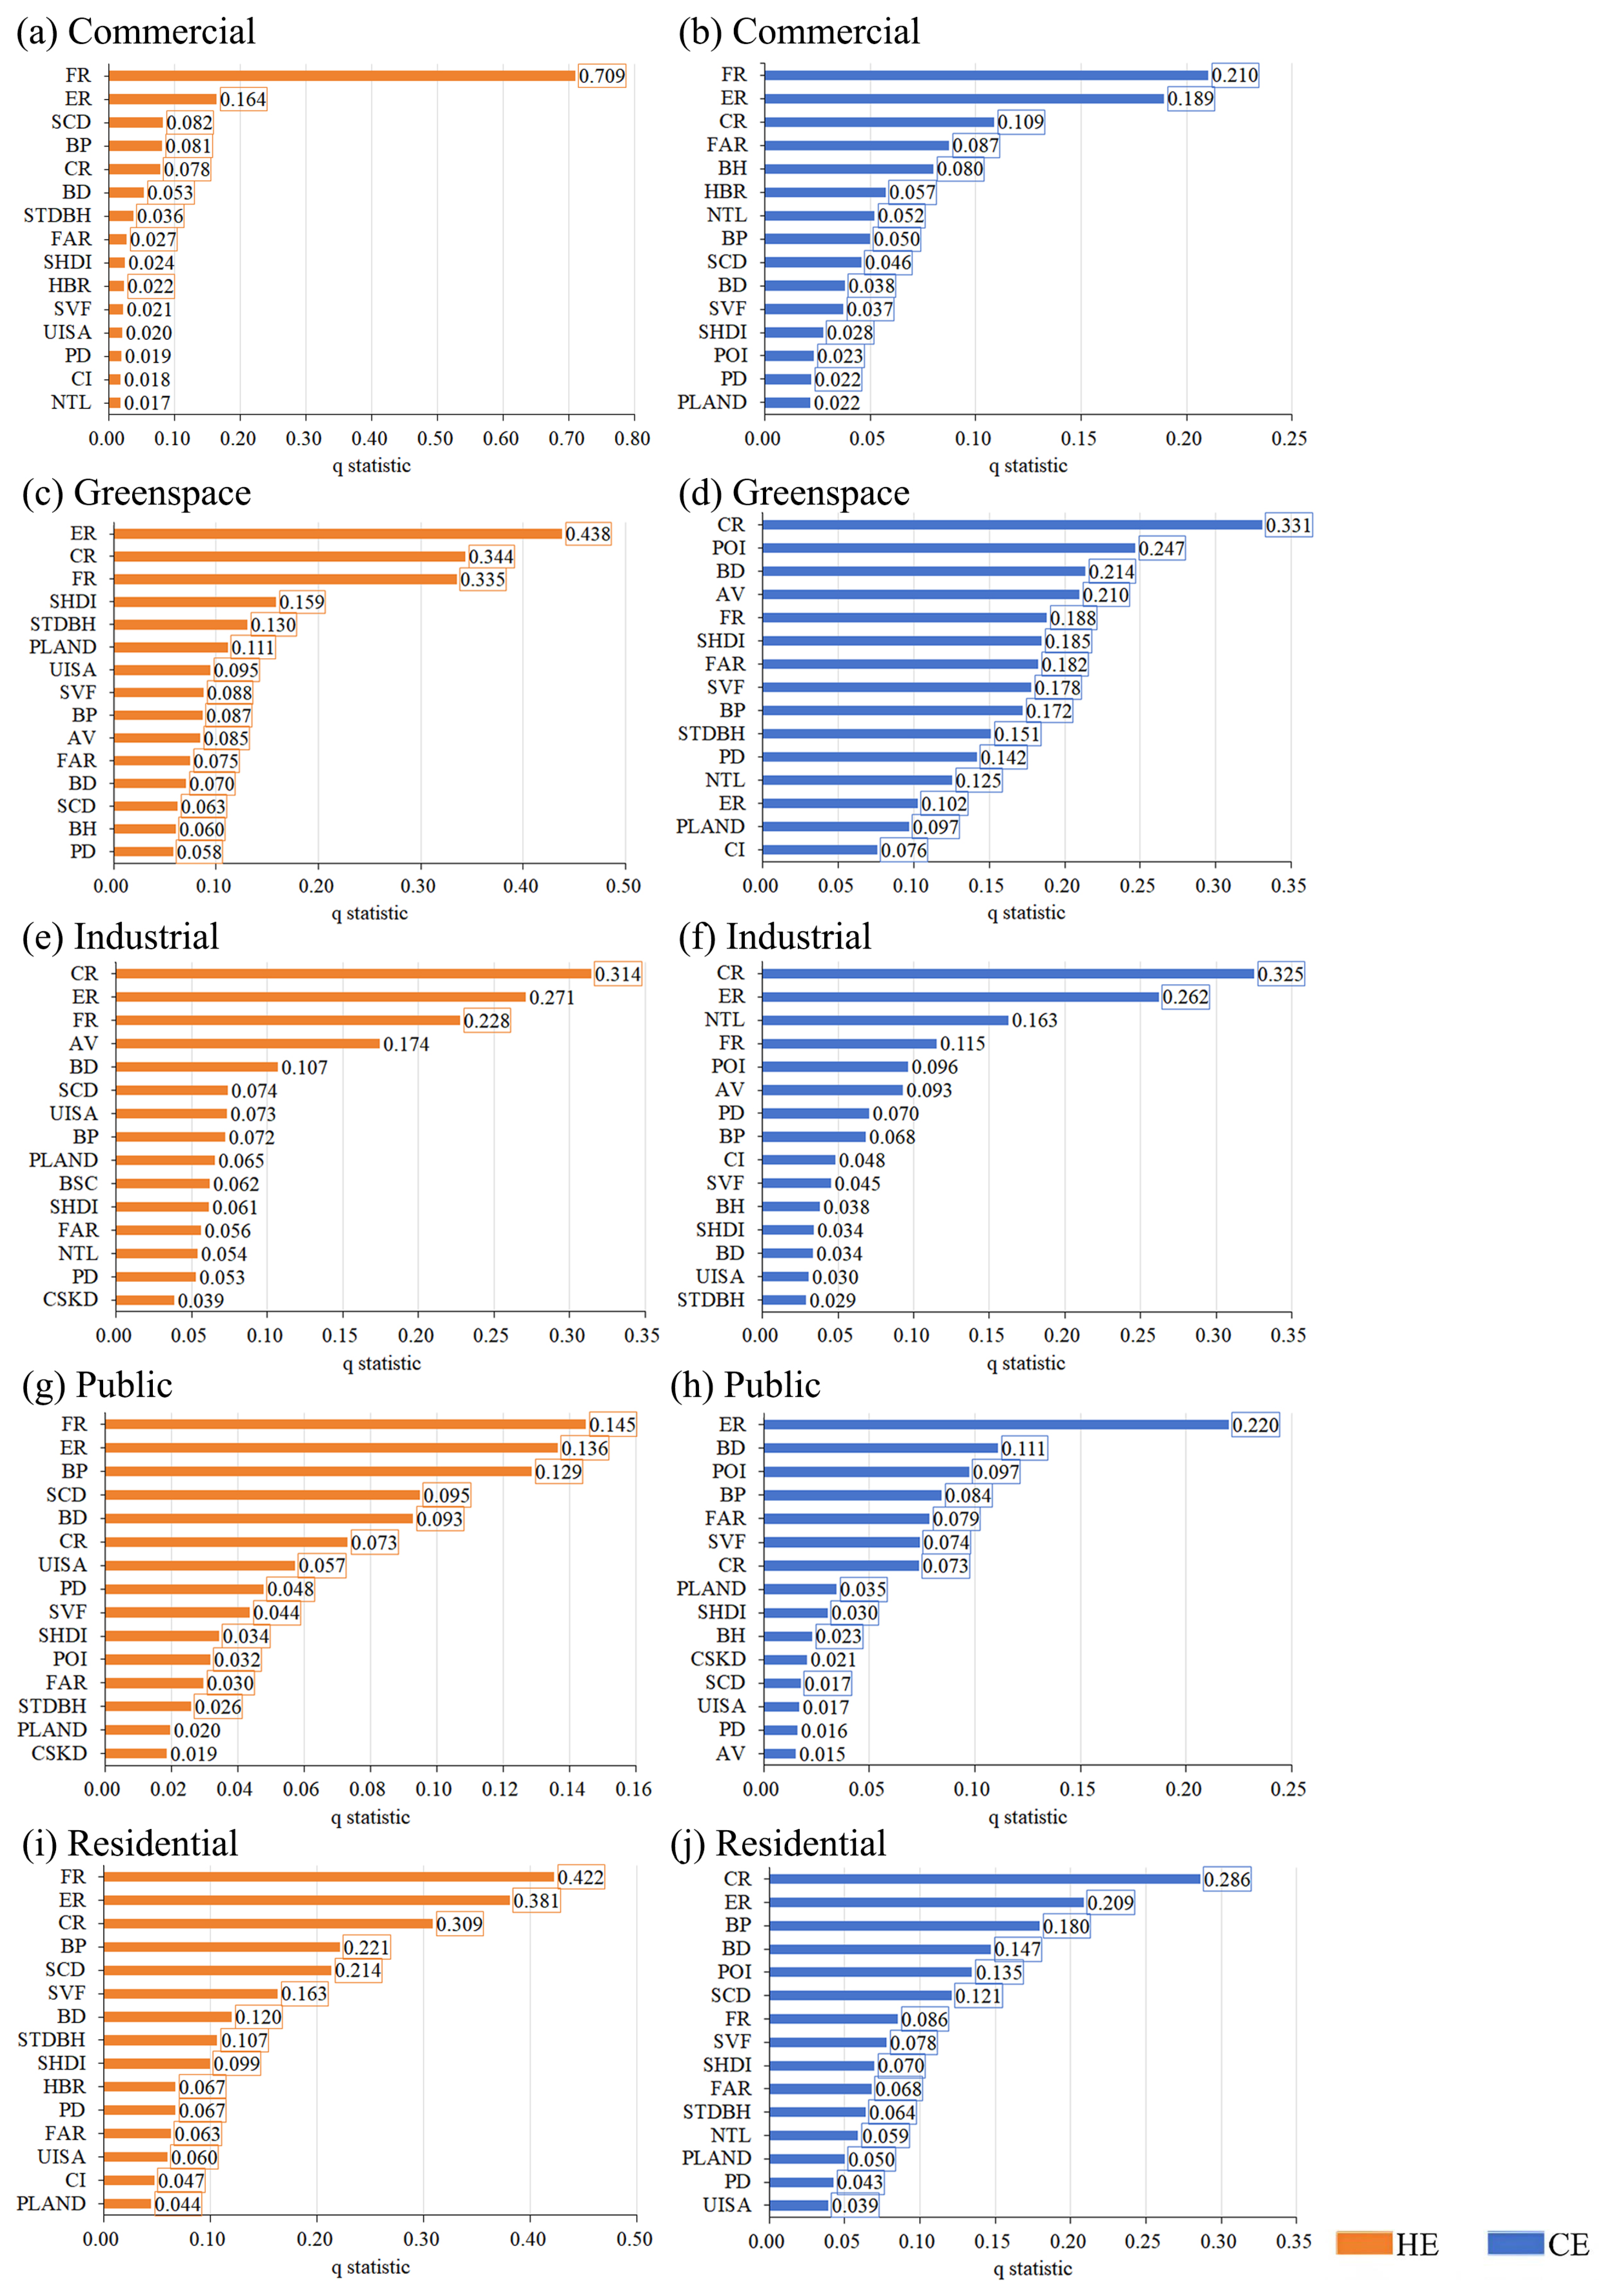
According to t-tests at the significance level of 0.05, significant differences existed in q-values of various factors across UFZs. Figure 9 presented the top 15 factors that significantly affected heat and cold exposure. Within the five functional zones, both heat and cold exposure were predominantly driven by the population structure. This indicated that vulnerable populations were generally closely associated with blocks of high exposure with an evident spatial overlap. Vulnerable groups were generally considered more sensitive to heatwaves and cold surges due to their relatively limited adaptability to extreme climates, thus requiring targeted planning attention.
In addition, for commercial zones, factors related to building morphology and activity intensity including FAR, BH, HBR, and NTL exhibited enhanced explanatory power for cold exposure compared with heat exposure. This indicated that cold exposure in commercial zones was also affected by built-environment factors such as development intensity, building height, and nighttime activity levels.
Within greenspace zones, SHDI and PLAND exhibited a high explanatory power for heat exposure, indicating that the internal diversity of green spaces and the proportion of blue–green spaces exerted certain regulatory effects on heat exposure. Meanwhile, STDBH (q = 0.130 for heat exposure, q = 0.151 for cold exposure) demonstrated that the height differences of buildings inside or adjacent to green spaces influenced heat exchange processes through shading, ventilation, and spatial openness, thereby affecting the distribution of heat and cold exposure. Relatively, cold exposure was comprehensively affected by building morphology indicators including the surrounding building density (BD, q = 0.214), building volume (AV, q = 0.210), floor area ratio (FAR, q = 0.182), sky openness factor (SVF, q = 0.178), and building porosity (BP, q = 0.172). In addition, the q value of POI was 0.247, suggesting that the facility density within greenspace zones also provided a strong explanatory power for cold exposure. More abundant facility provision in public areas may further reduce outdoor low temperature risks.
High q values were observed for the ratio of children and the elderly within industrial zones, which could be attributed to mixed residential land use, large block boundaries, and adjacent mixed living service buildings. This functional zone presented the most complex driving pattern.
Within public and residential zones, BP and SCD showed a high explanatory power for heat exposure, whereas BD, POI, and BP exhibited a high explanatory power for cold exposure. Heat exposure in these two functional zones was more affected by spatial congestion, ventilation, and heat dissipation conditions, while cold exposure was jointly driven by BD, facility aggregation degree (POI), and BP. BP ranked high for both heat and cold exposure, indicating that three-dimensional building spatial permeability served as a stable driving factor for exposure differentiation in the two zone types.
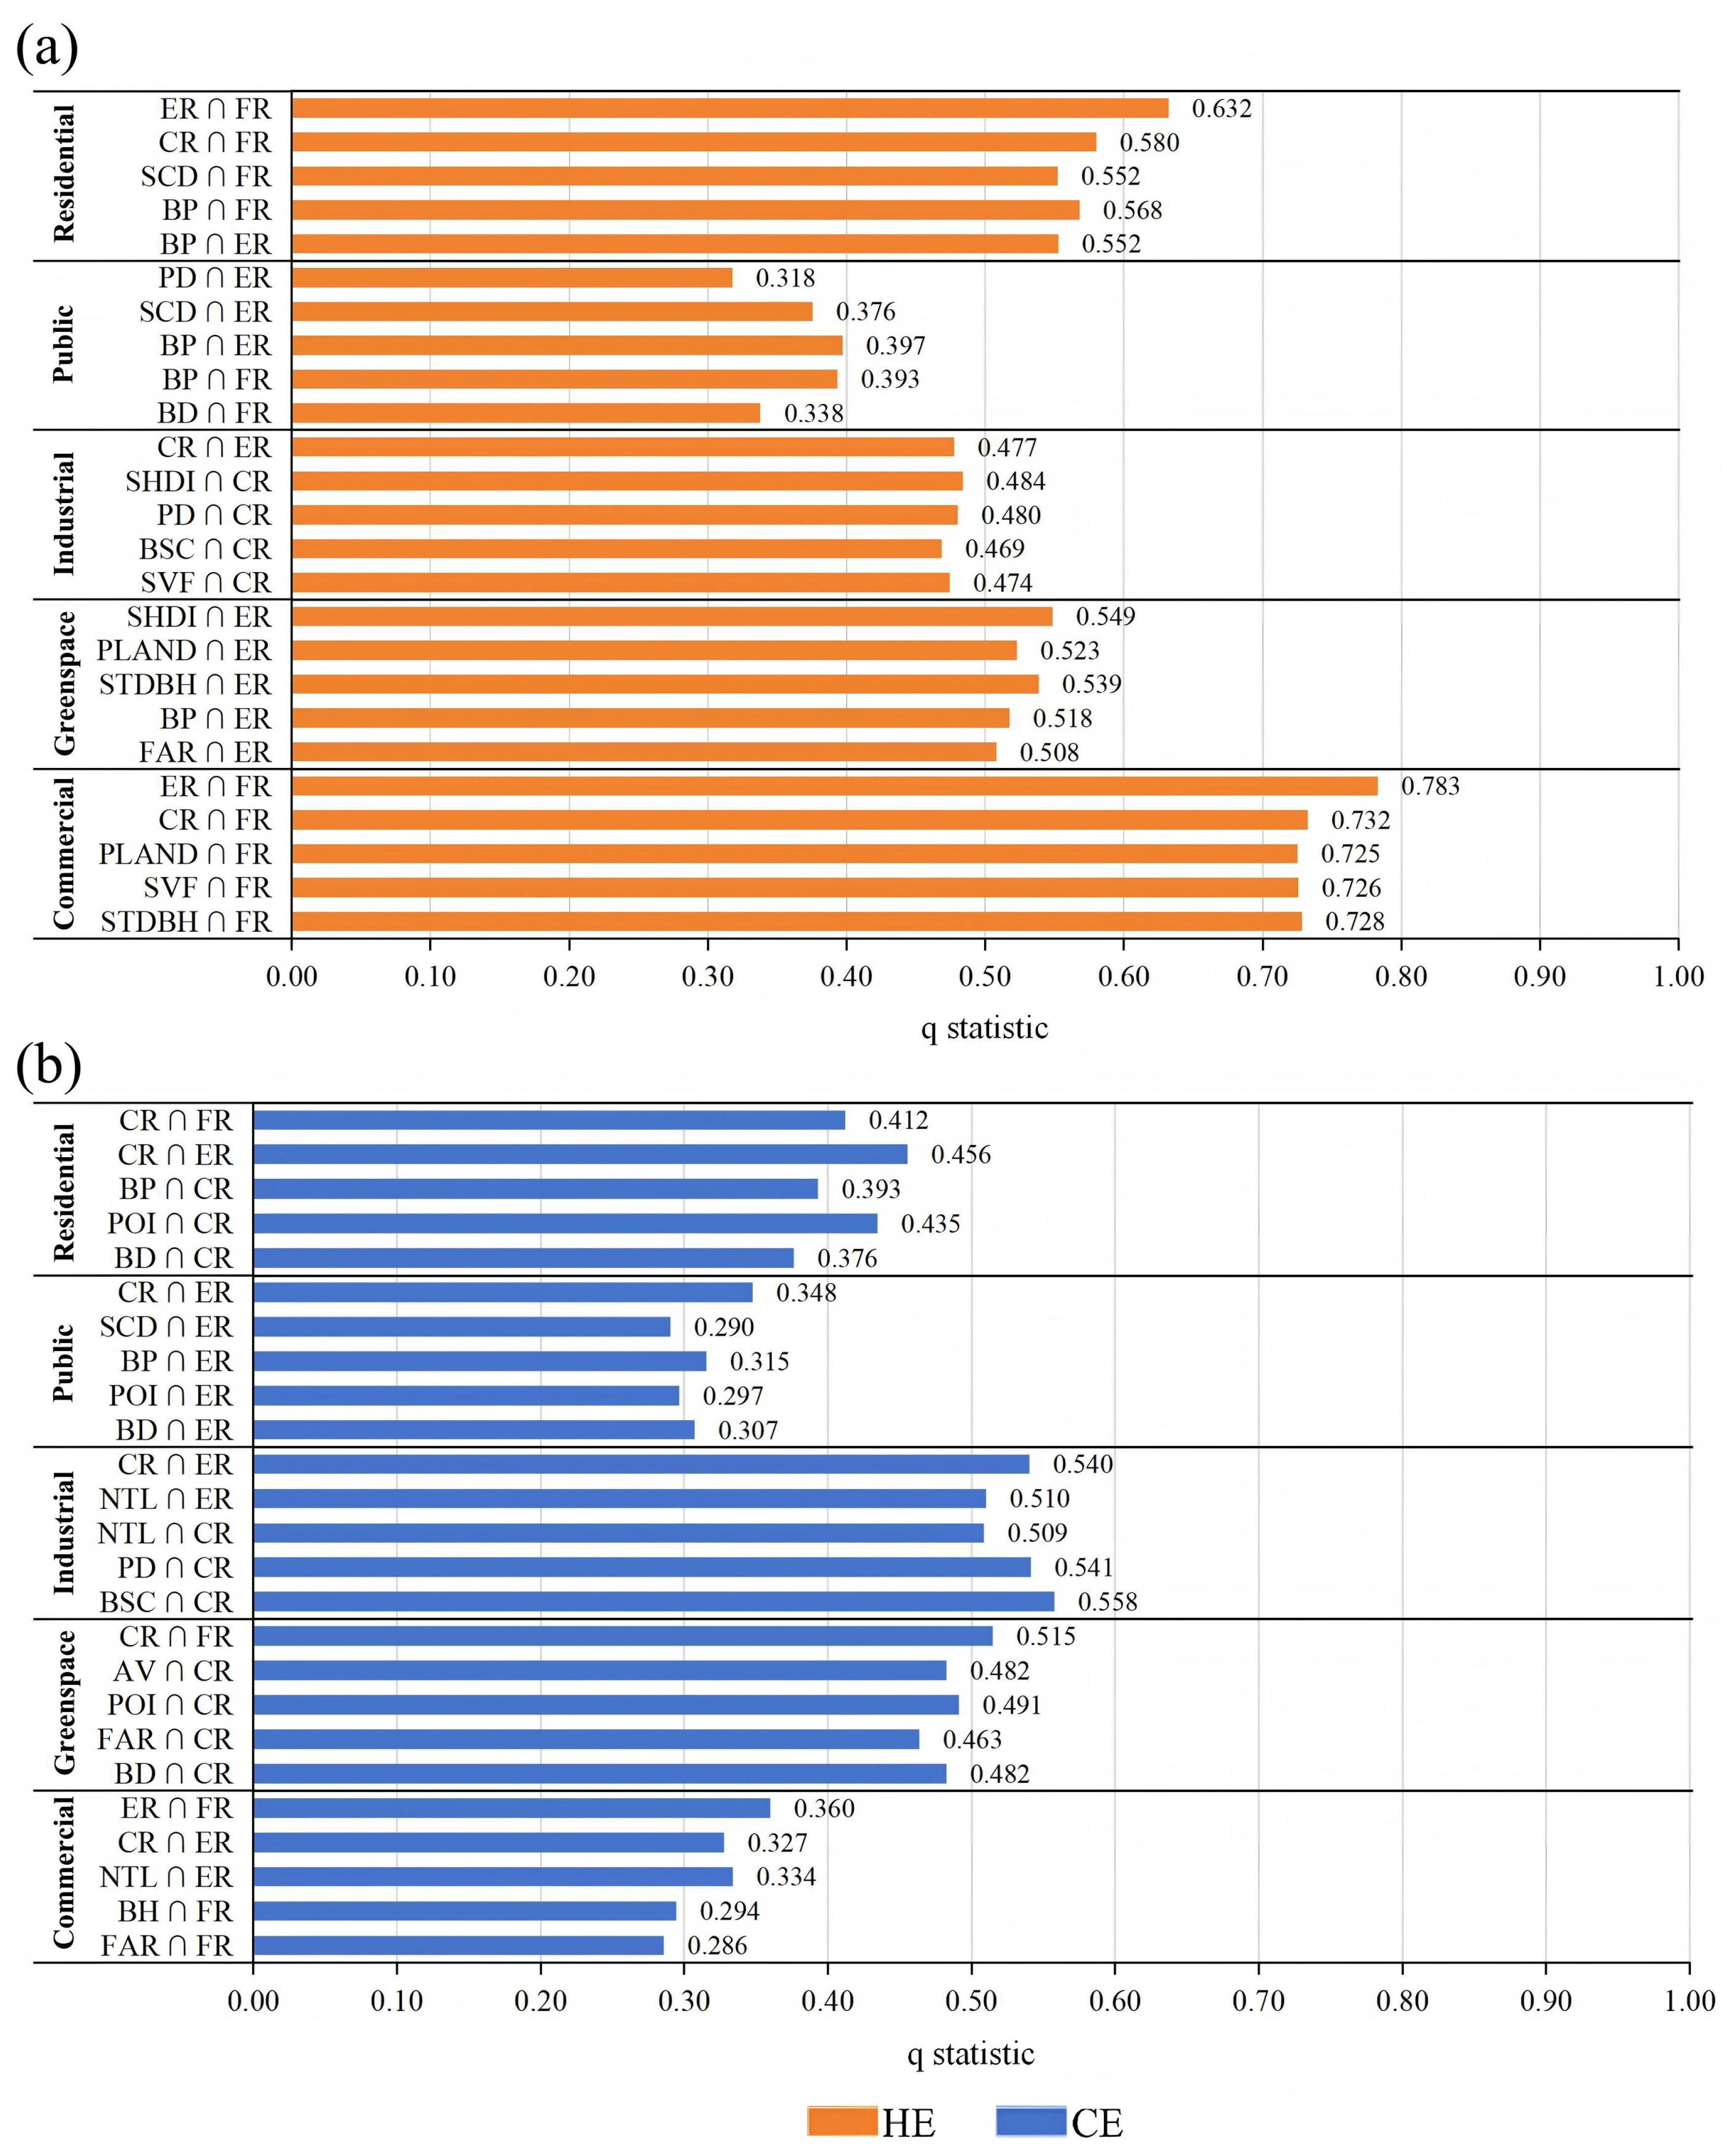
Figure 10 illustrated the top five interactive factors with the highest explanatory power for each functional zone. In terms of interaction modes, both heat and cold exposure exhibited obvious enhancement effects through factor superposition. Interactive q values were generally higher than single-factor q values, which indicated that exposure within different functional zones were not determined by a single variable. Instead, they were formed by the combined effects of the population structure with building morphology, landscape pattern, and human activity intensity.
In terms of factor categories and influence magnitudes, high-value interactive combinations for heat exposure were mainly centered on FR, ER, and CR. This indicated that, under identical heat exposure levels and built environment conditions, differences in the population structure significantly affected exposure sensitivity. Therefore, areas with a high proportion of vulnerable populations required higher governance priority. Specifically, population-structure-related interactive q values were the highest in commercial and residential zones, mainly superimposed with building morphology and landscape factors such as BP, SCD, PLAND, SVF, and STDBH. This revealed that, in UFZs with intensive population aggregation and high spatial use intensity, the distribution of vulnerable populations and spatial environments jointly amplified the spatial disparities in heat exposure. Strong interactions of BP ∩ ER, BP ∩ FR, and SCD ∩ ER were observed in public service zones. Potential heat exposure concerns could be higher when elderly people or females spatially overlapped with public service blocks with crowded buildings and poor ventilation conditions.
By contrast, interactive combinations for cold exposure were mostly represented by superpositions of CR and ER with BD, POI, BP, NTL, PD, BSC, and AV, which were particularly prominent in industrial, greenspace, and residential zones. Areas with a high building density, concentrated facilities, intense human activities, or fragmented landscape patches were more likely to overlap with the distribution of vulnerable populations, leading to elevated potential cold exposure concern. Overall, heat exposure was primarily driven by the combined effects of the spatial distribution of vulnerable populations, unfavorable building morphology, and landscape patterns. Cold exposure was more comprehensively affected by vulnerable populations and building morphology, as well as the degree of facility agglomeration and human activities.

4. Discussion

4.1. Impact of Feature Categories on the Classification Accuracy of UFZs

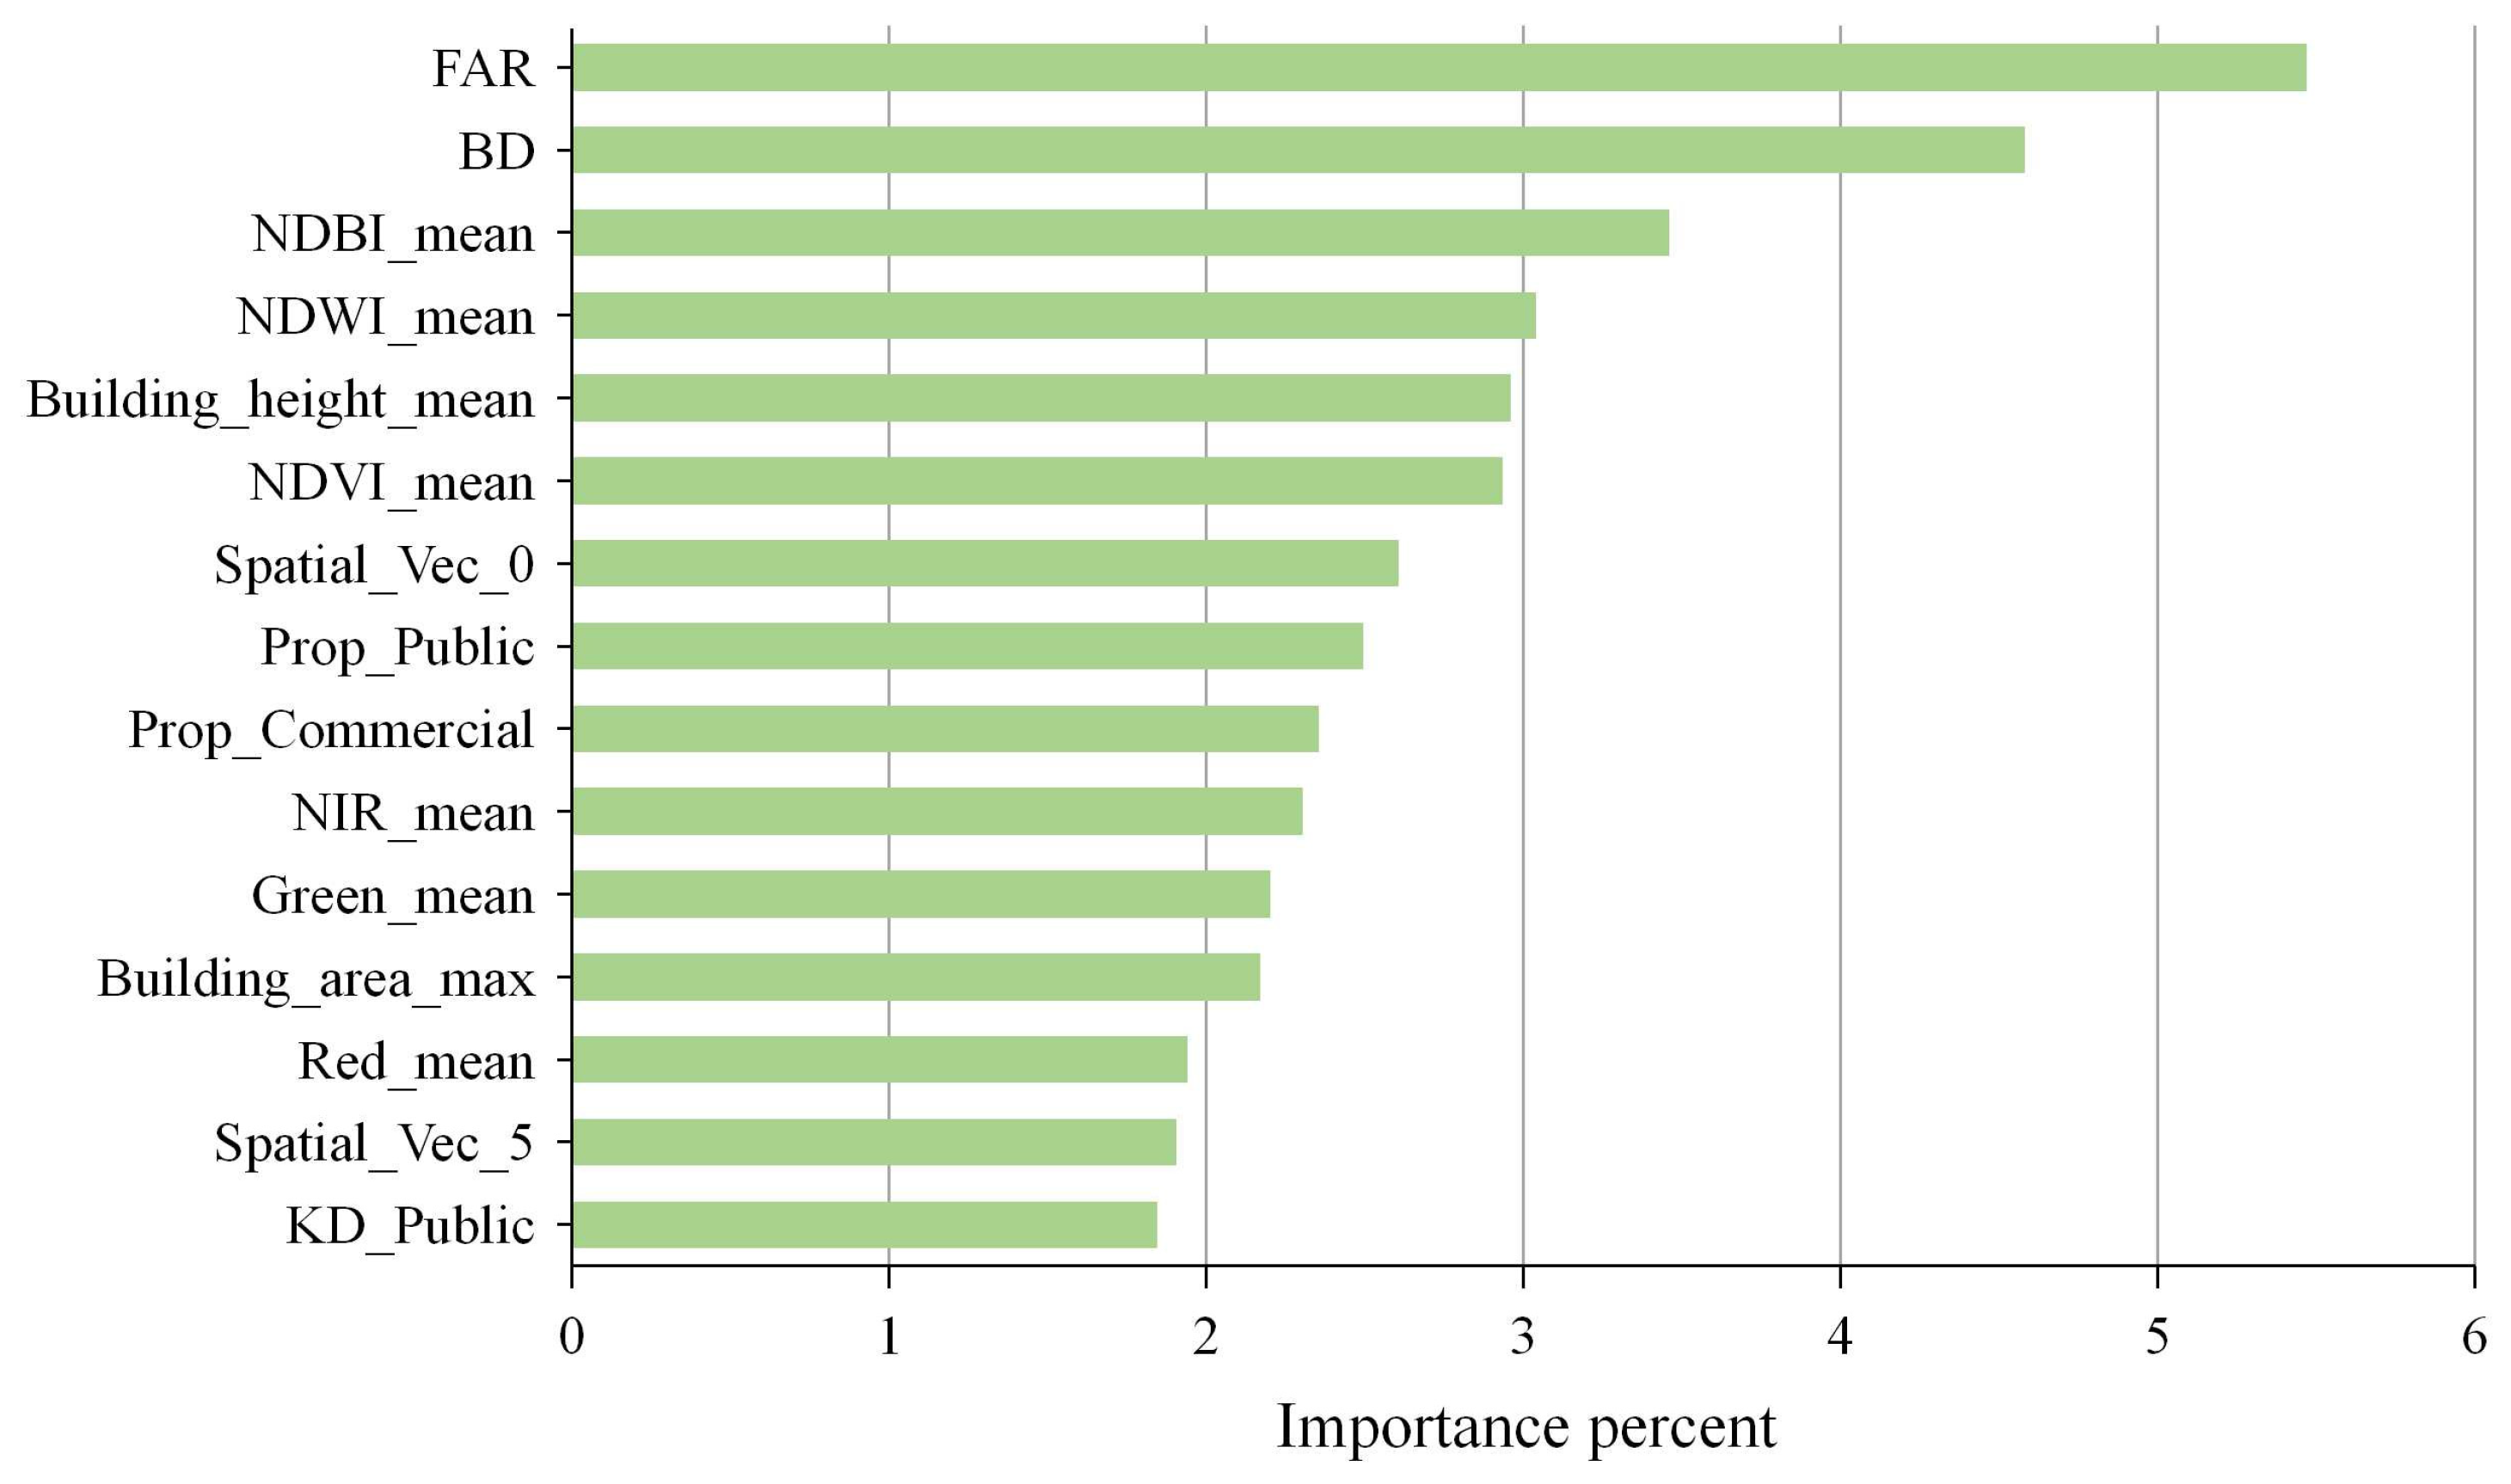
Figure 11 presented the importance distribution of the top 15 indicators. Building morphology features, remote sensing band features, POI frequency, and spatial features were identified as the most critical indicators for UFZ classification. In contrast, features extracted from population heat maps and nighttime light data were the least significant. Two dimensions (Spatial_Vec_0 and Spatial_Vec_5) within the ten-dimensional POI text word vectors exhibited a relatively high importance, which suggested that the classification accuracy could be further improved by acquiring word vectors with higher dimensionality and richer semantic information.

4.2. Discussion of HE and CE Distribution Discrepancies in Different UFZs

This study adopted UFZs to investigate heat and cold exposure conditions. Compared with heat risk studies using the LCZ classification system, LCZs focus on local climatic characteristics shaped by building morphology, surface materials, and land cover. By contrast, UFZs emphasized the distinct socioeconomic functions and human activity patterns of different regions. The advantages of functional zone division in this study lay in the idea that zones of the same function generally shared similar behavioral patterns and management requirements. Targeted renewal strategies could thus be formulated accordingly. Therefore, function-based governance conformed better to urban management and planning practices [66].
Most studies have examined heat exposure across different UFZs. Consistent with our findings, public, residential, and commercial zones have a high average heat exposure, primarily concentrated in the central region [17]. Industrial and greenspace zones presented the highest cold exposure concentrated in areas beyond the 4th Ring Road, which can be explained by the fact that daily commuting behavior towards city centers may modulate the intensity of residents’ exposure to heat and cold [67].
Meanwhile, this study explored the driving factors and interactive effects of heat and cold exposure across UFZs. By incorporating vulnerability-related indicators associated with population factors, the research further highlighted the spatial overlap between population structure differences and exposure patterns. It revealed whether areas with high heat and cold exposure overlapped with populations of low adaptive capacity such as the elderly and females, thus enhancing the social equity interpretation and planning orientation of the findings. Consistent with our findings, a study in Changchun similarly found that women in residential zones face higher cold exposure. In addition, women generally have a longer life expectancy than men, resulting in a higher proportion of older women [68]. Factors such as a reduced thermoregulatory capacity further increase cold exposure among elderly women [31]. Similarly, the high urban heat vulnerability in summer results from the interaction between heat exposure sources and individual-level adaptive capacity, particularly among elderly groups [69]. Older and child populations exposed to extreme hot and cold temperatures were both positively and significantly associated with the death rate and years of life lost [70]. For the driving factors, a study in Beijing also highlighted the important role of architectural morphology in winter [71].
Furthermore, this study only examined the relative surface thermal exposure, not human thermal comfort. The exposure was based on LST and population data. Meteorological factors including air temperature [72], extreme-temperature frequency [48,73], humidity, solar access, building shelter, heating availability, and wind speed [74], as well as comprehensive thermal comfort indices such as UTCI [75] and PET, were not incorporated. These omitted factors may alter the perceived heat and cold stress and cause the exposure to differ from pedestrian-level thermal conditions. However, continuous meteorological data at the block scale were difficult to obtain, and the inputs required for thermal comfort indices were unlikely to be consistently matched with LST for seasonal analysis. Therefore, the exposure levels in certain UFZs may be underestimated or overestimated. The omission of these factors may partly explain the differences from studies using meteorological variables or thermal comfort indices [76].

4.3. Function-Based Urban Planning Recommendations

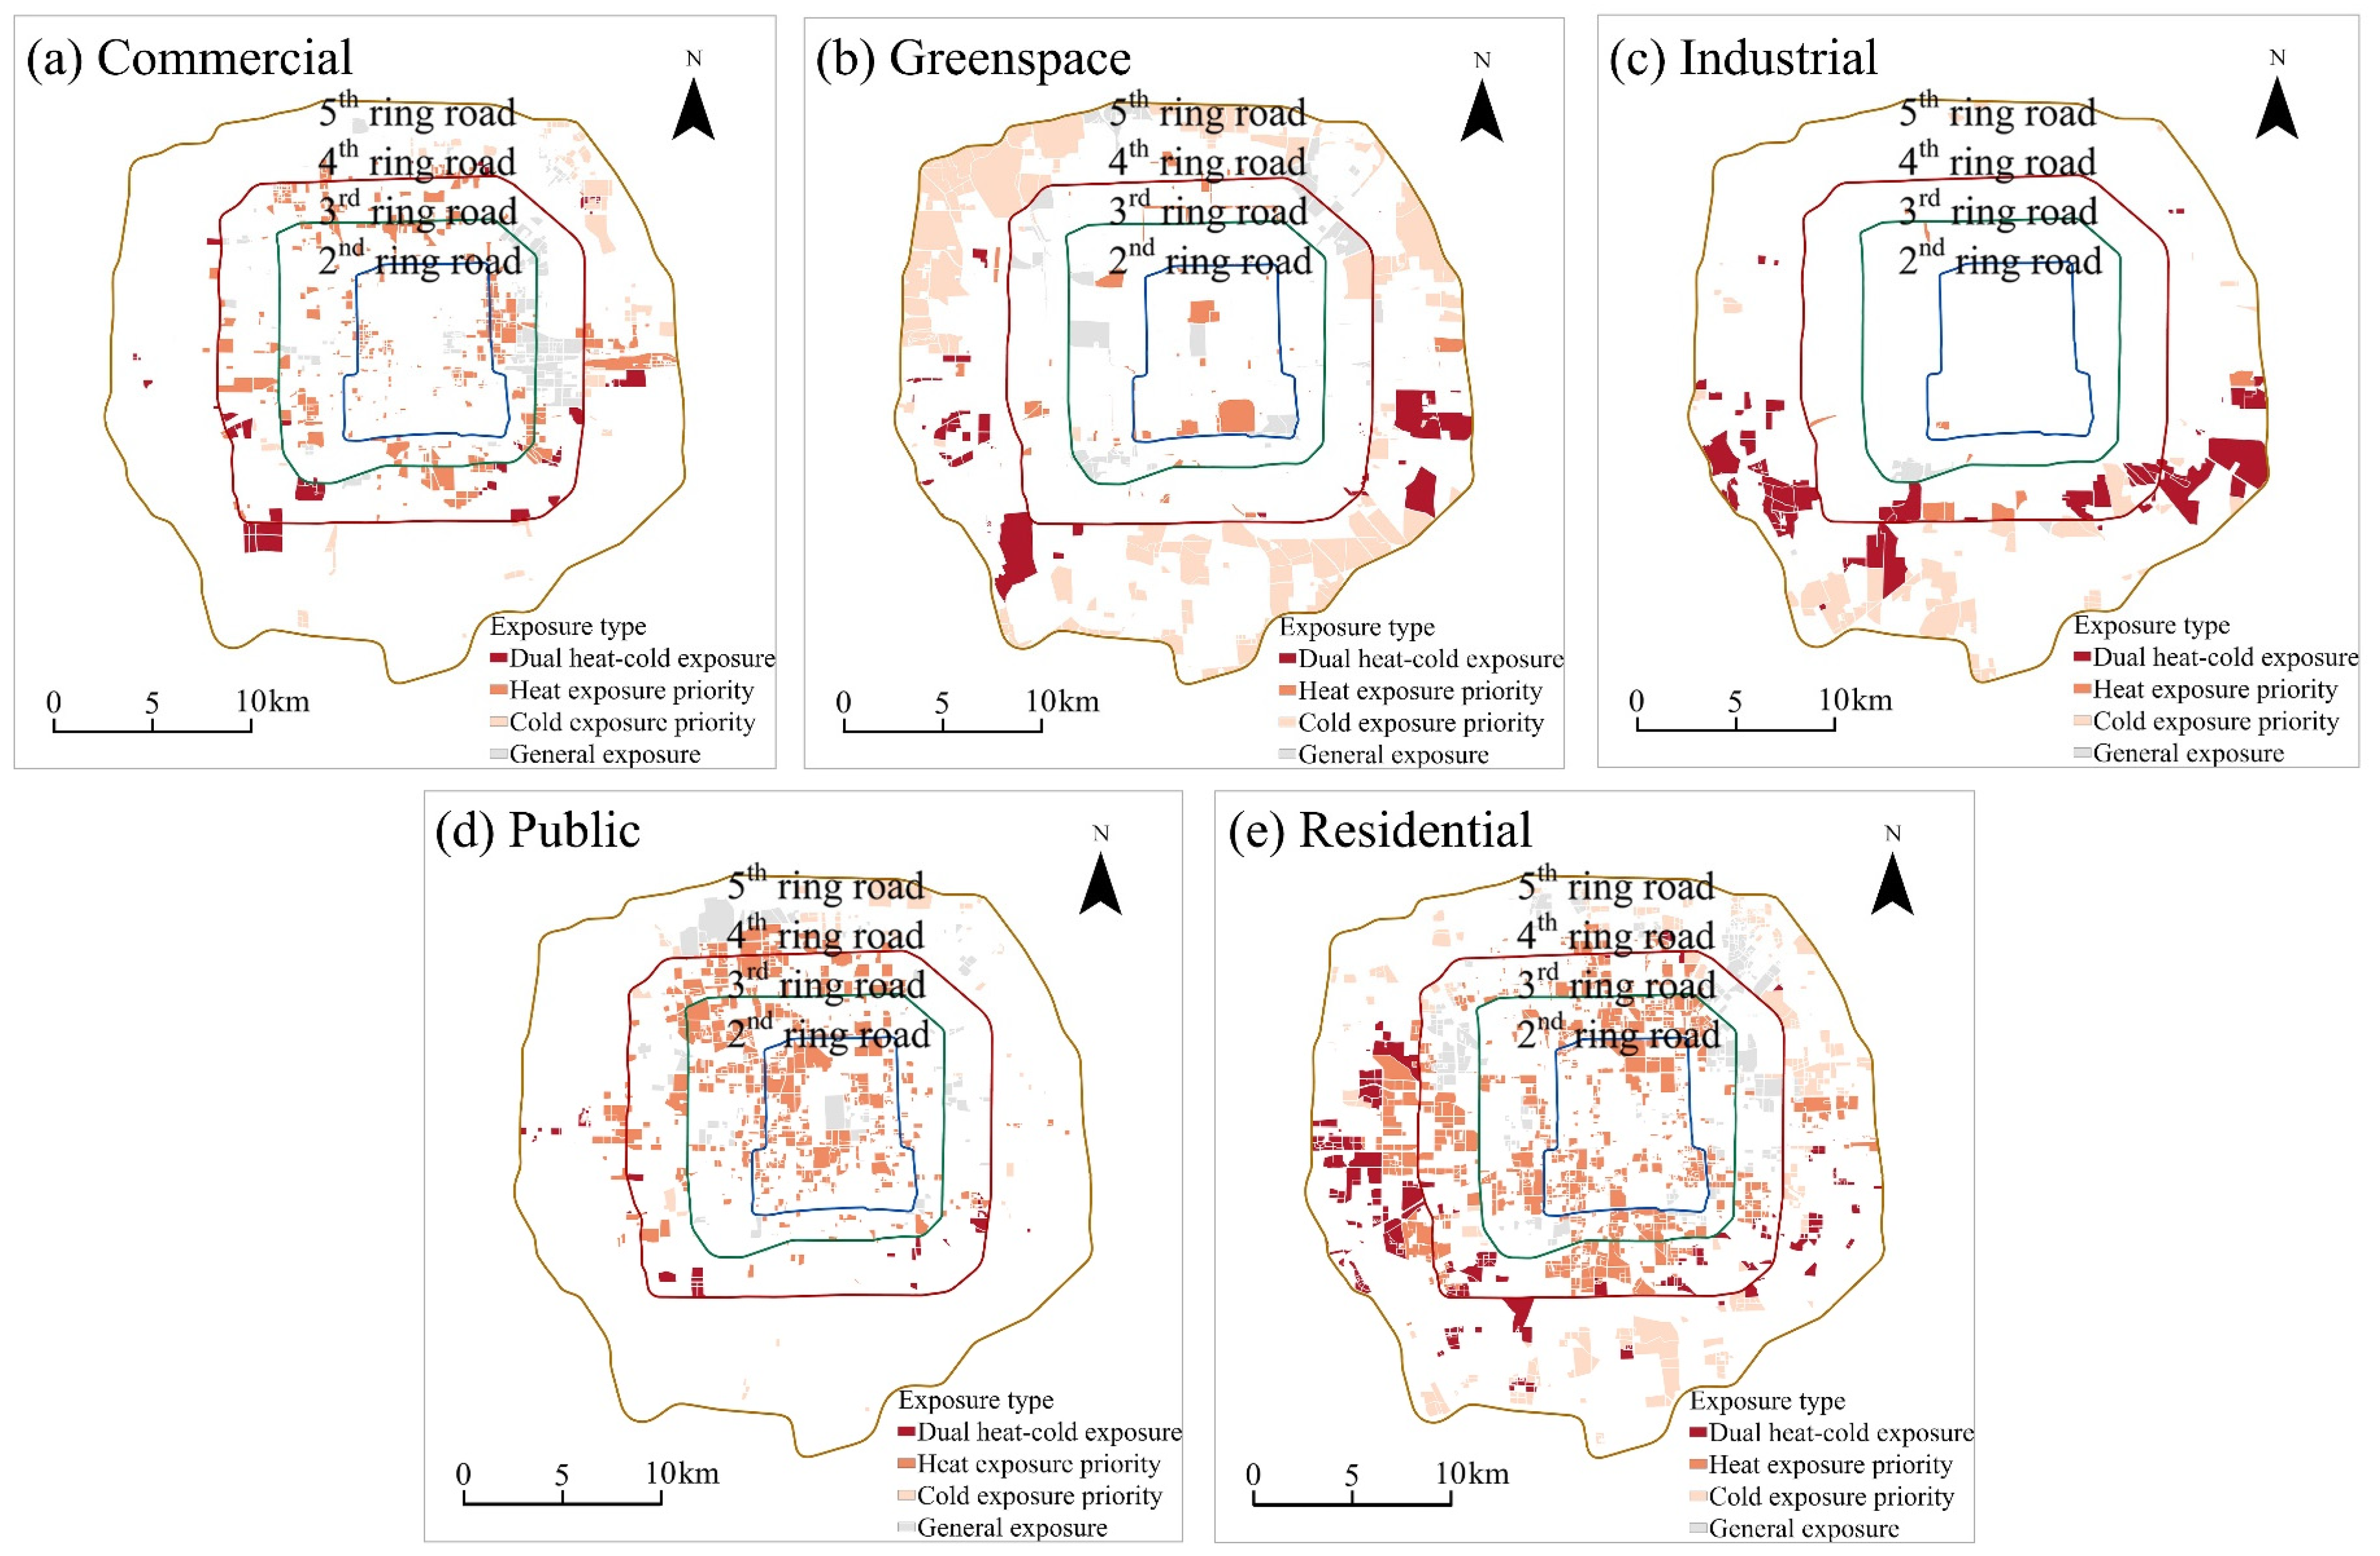
However, given the significant differences among UFZs in the driving mechanisms of heat and cold exposure, this study further classified the major seasonal risk types faced by different UFZs from a spatial perspective. Continuous heat and cold exposure grades were further transformed into priority governance zones with planning orientation. Zones with high or very high levels of heat or cold exposure were defined as priority areas for exposure governance. Blocks with only heat exposure at high or above levels were classified as heat exposure priority areas, blocks with only cold exposure at high or above levels were classified as cold exposure priority areas, and blocks with both heat and cold exposure at high or above levels were classified as dual heat–cold exposure areas. Three governance types including heat exposure priority areas, cold exposure priority areas, and dual heat–cold-sensitive areas were finally identified (Figure 12). According to the classification results, heat exposure priority areas focused on cooling, shading, and ventilation improvement. Cold exposure priority areas emphasized wind sheltering, sunlight exposure, and the protection of activity spaces. Dual heat–cold-sensitive areas required the simultaneous consideration of summer cooling and winter cold prevention, avoiding single-season-oriented renovations that could trigger new adaptability problems.
The corresponding planning implications is proposed below by integrating the spatial governance types of heat and cold exposure, as well as the driving factors and interactive effects within different UFZs.
Heat exposure was more comprehensively affected by physical conditions including building density, spatial aggregation degree, sky view factor, building porosity, and blue–green spatial structure, which required more attention to heat accumulation, shading, and ventilation conditions. For cold exposure, facility density and human activity intensity exhibited a relatively higher importance, which were associated with human travel, stay behaviors, and public space utilization.
In terms of different UFZs, greenspace zones outside the 4th Ring Road were almost entirely composed of cold exposure priority areas and dual heat–cold exposure areas. Greenspace zones generally exerted positive effects on heat exposure through cooling and shading to improve surface thermal environments. However, for cold exposure, oversimplified open and fragmented greenspace might increase coldness in winter and cause discomfort during outdoor exposure. Supported by the interaction results, greenspace-related exposure is closely linked to the spatial overlap between ER or CR and landscape structure (SHDI, PLAND), AV, POI, and FAR. Therefore, the future construction of greenspace should not merely pursue area expansion. Instead, it should shift to a seasonal adaptive design combined with the structure of blue green spaces, spatial form, and surrounding building morphology [77]. Continuous shading, evapotranspiration cooling, and ventilation corridors should be provided in summer, while, in winter, priority is given to wind-sheltered, sun-oriented, semi-enclosed spaces that support outdoor stay. For greenspace near residential, school, or service facilities, child and elderly activity areas should avoid overly open winter wind exposure. Sheltered rest spaces, sunlit walking paths, and continuous vegetation buffers should be arranged near entrances, playgrounds, and frequently used paths.
Residential zones presented the widest distribution and served as long-term activity spaces for three types of vulnerable populations. The findings on the driving factors of heat and cold exposure revealed that the proportion of vulnerable populations interacted with SCD, BP, BD, and POI. Future planning should focus on optimizing residential spatial forms within communities. For instance, a combination of high-rise buildings and low-density building layouts could mitigate temperature rises in summer and winter [71]. In residential blocks with a high SCD, high BD, or low BP, planning should reduce excessive spatial congestion, improve building gaps and ventilation paths, and avoid enclosed layouts that intensify heat accumulation or winter cold exposure. The climate environments along residents’ daily activity paths should be improved by separately planning summer cooling routes and winter sunlit wind-sheltering routes. Along these routes, corresponding protective facilities should be arranged at key nodes including road intersections, inter-building walkways, children activity venues, community squares, and stations. These facilities shall cover the 15 min walking range of residential communities. This design aims to ensure maximum tolerant heat discomfort below 60 min [78], forming an age-friendly microclimate environment suitable for long-term stay.
Heat exposure priority areas accounted for a higher proportion in commercial zones. The interaction results showed that commercial heat exposure was mainly associated with PLAND ∩ FR, SVF ∩ FR, and STDBH ∩ FR, while cold exposure was mainly associated with NTL ∩ ER, BH ∩ FR, and FAR ∩ FR. For mature commercial zones, time-based pedestrian flow guidance and stay time control are required to avoid superposition with high-temperature environments [53]. Future strategies include controlling spatial congestion and the floor area ratio. Street trees, pocket green spaces, and building setbacks at ground floors can be appropriately increased. Cooling or heating facilities shall be installed in outdoor seating areas to improve thermal comfort in blocks with frequent female work and consumption activities.
Dual heat–cold exposure areas occupied the largest proportion in industrial zones. These zones exerted positive contributions to both heat and cold exposure, easily resulting in hotter summers and colder winters. Spatially, industrial zones were mostly adjacent to residential areas and blue–green spaces. Apart from factories and warehouses, many newly constructed or ongoing buildings existed within these zones. Village communities, staff dormitories, and schools were mixed around industrial parks. The interaction results further showed that industrial heat exposure was mainly associated with SHDI ∩ CR, PD ∩ CR, BSC ∩ CR, and SVF ∩ CR, while cold exposure was mainly associated with NTL ∩ ER, NTL ∩ CR, PD ∩ CR, and BSC ∩ CR. According to interactive analysis results, construction planning should not only focus on factory spacing as well as the richness and density of surrounding blue–green spaces [79], but also prioritize improving the heat and cold protection capacity for the workers and surrounding residents during commuting and working periods.
Public zones including schools and training institutions, medical and elderly care facilities, and cultural and sports facilities contained more heat exposure priority areas. Attention should be paid to public blocks with an extreme SCD, BD, BP, PD, or POI concentration. Obvious overlaps existed between females, the elderly, and exposure to heat and cold. Fine-scaled renovations should be prioritized around these nodes in future construction. Such measures include shading along school commuting routes, and cooling and wind shielding for rest spaces near hospitals and walking paths for the elderly.

4.4. Limitations and Future Research

This study classified urban functional zones using multi-source data and verified their reliability. It also explored the distribution and formation mechanisms of heat and cold exposure within different functional zones inside the 5th Ring Road of Beijing, with the spatial distribution of vulnerable populations taken into consideration. Nevertheless, several limitations remain in this research as follows.
Blocks were adopted to identify the distribution characteristics of exposure for the linkage with subsequent planning and governance. Although the MOD11A2 product with a higher resolution can fully capture the continuous variations of heat and cold conditions in each block across summer and winter to support a reliable seasonal comparison, the 1 km LST pixels may overlap multiple blocks in densely segmented blocks, which may smooth localized temperature variations and introduce mixed-pixel uncertainty. The results should be interpreted as the aggregated block-level exposure patterns and relative differences among UFZs rather than precise estimates of fine-scale thermal conditions. Future studies could incorporate LST datasets with a higher temporal and spatial resolution to further examine the within-block exposure variations. At the same time, some blocks contained multiple mixed functions simultaneously, where the internal differences were ignored too. Future studies can conduct an analysis based on finely divided functional land parcels. Meanwhile, future studies could collect more refined functional samples, especially industrial samples in broader urban areas, and test additional methods for handling a class imbalance to improve the classification accuracy of UFZs.
In addition, the heat and cold exposure in this study mainly reflected the static exposure of the total population, while the dynamic population flows were difficult to capture. The population distribution in different functional zones changes significantly across seasons and within different periods of a single day. For example, commercial zones present higher pedestrian concentrations during daytime and evening hours, whereas residential zones have larger population sizes at night. It should be noted that cold exposure in this study was calculated using reversely normalized LST and population data. However, cold exposure is inherently complex, and other factors, such as wind exposure, solar access, building shelter, heating availability, activity behavior, and indoor refuge, may also influence actual cold exposure. Future studies could incorporate high spatiotemporal resolution LST data, dynamic population data, additional climate, building and behavioral variables, or thermal comfort indices to provide a more comprehensive assessment.

5. Conclusions

This study constructed heat exposure and cold exposure indicators using LST and total population data, combined with urban functional zone results derived from a random forest model. It investigated the distribution patterns and spatial aggregation patterns of heat and cold exposure across different functional zones in detail, and examined their respective driving factors and interactive effects. The results revealed the following findings.
(1)
The UFZ classification achieved satisfactory accuracy, with an overall accuracy of 81.8% and a kappa coefficient of 0.75. High heat exposure areas were concentrated in public, residential, and commercial zones within the core urban area. High cold exposure areas were mainly distributed in peripheral industrial and greenspace zones. A small number of dual high exposure zones for both summer and winter existed in all functional zones, primarily concentrated in the southwestern and southeastern areas.
(2)
Summer heat exposure HH aggregation areas were distributed in Xicheng District, southeastern Haidian District, and northern Fengtai District. Winter cold exposure HH aggregation areas were almost entirely located outside the 4th Ring Road. HCI analysis indicated that industrial zones exerted positive contributions to both heat and cold exposure. Commercial, public, and residential zones showed positive contributions to heat exposure and negative contributions to cold exposure. Greenspace zones presented negative contributions to heat exposure and positive contributions to cold exposure.
(3)
The proportion of vulnerable populations exhibited a high explanatory power in all functional zones. Spatial environments where vulnerable groups such as children and the elderly resided further amplified exposure. High-value interactions of heat exposure were mainly formed by the superposition of vulnerable populations, building morphology, and landscape patterns. High-value interactions of cold exposure were more comprehensively driven by vulnerable populations, building density, facility density, and activity intensity. The heat and cold exposure mechanisms varied among different functional zones.
Overall, the core contribution of this study is to advance heat and cold environment research from a simple temperature-level analysis to the multi-seasonal identification of population-based exposure and differentiated governance based on accurate functional zones. It provides planning-oriented references for future urban renewal and climate adaptive construction.

Author Contributions

Conceptualization, J.Y. and Q.Z.; methodology, J.Y. and Q.Z.; software, J.Y.; validation, J.Y.; formal analysis, J.Y.; investigation, J.Y.; data curation, J.Y. and Q.Z.; writing—original draft preparation, J.Y. and Q.Z.; writing—review and editing, J.Y. and Q.Z.; visualization, J.Y.; supervision, Q.Z. All authors have read and agreed to the published version of the manuscript.

Funding

This research is funded by the National Natural Science Foundation of China (No. 52078389).

Data Availability Statement

The data are open-source.

Conflicts of Interest

The authors declare no conflicts of interest.

References

  1. Chen, H.; Zhao, L.; Dong, W.; Cheng, L.; Cai, W.; Yang, J.; Bao, J.; Liang, X.-Z.; Hajat, S.; Gong, P.; et al. Spatiotemporal Variation of Mortality Burden Attributable to Heatwaves in China, 1979–2020. Sci. Bull. 2022, 67, 1340–1344. [Google Scholar] [CrossRef] [PubMed]
  2. Meng, F.; Yan, S.; Tian, G.; Wang, Y. Surface Urban Heat Island Effect and Its Spatiotemporal Dynamics in Metropolitan Area: A Case Study in the Zhengzhou Metropolitan Area, China. Front. Environ. Sci. 2023, 11, 1247046. [Google Scholar] [CrossRef]
  3. Ballester, F.; Michelozzi, P.; Iniguez, C. Weather, Climate, and Public Health. J. Epidemiol. Community Health 2003, 57, 759–760. [Google Scholar] [CrossRef] [PubMed]
  4. Gómez-Acebo, I.; Dierssen-Sotos, T.; Llorca, J. Effect of Cold Temperatures on Mortality in Cantabria (Northern Spain): A Case–Crossover Study. Public Health 2010, 124, 398–403. [Google Scholar] [CrossRef] [PubMed]
  5. Analitis, A.; Katsouyanni, K.; Biggeri, A.; Baccini, M.; Forsberg, B.; Bisanti, L.; Kirchmayer, U.; Ballester, F.; Cadum, E.; Goodman, P.G.; et al. Effects of Cold Weather on Mortality: Results From 15 European Cities Within the PHEWE Project. Am. J. Epidemiol. 2008, 168, 1397–1408. [Google Scholar] [CrossRef] [PubMed]
  6. Xie, H.; Yao, Z.; Zhang, Y.; Xu, Y.; Xu, X.; Liu, T.; Lin, H.; Lao, X.; Rutherford, S.; Chu, C.; et al. Short-Term Effects of the 2008 Cold Spell on Mortality in Three Subtropical Cities in Guangdong Province, China. Environ. Health Perspect. 2013, 121, 210–216. [Google Scholar] [CrossRef] [PubMed]
  7. Wang, Y.-C.; Lin, Y.-K.; Chuang, C.-Y.; Li, M.-H.; Chou, C.-H.; Liao, C.-H.; Sung, F.-C. Associating Emergency Room Visits with First and Prolonged Extreme Temperature Event in Taiwan: A Population-Based Cohort Study. Sci. Total Environ. 2012, 416, 97–104. [Google Scholar] [CrossRef] [PubMed]
  8. Wei, J.; Han, W.; Wang, W.; Zhang, L.; Rajagopalan, B. Intensification of Heatwaves in China in Recent Decades: Roles of Climate Modes. npj Clim. Atmos. Sci. 2023, 6, 98. [Google Scholar] [CrossRef]
  9. Ming, Y.; Liu, Y.; Liu, X.; Tian, Z. Demographic Disparity in Diurnal Surface Urban Heat Island Exposure across Local Climate Zones: A Case Study of Chongqing, China. Sci. Total Environ. 2024, 923, 171203. [Google Scholar] [CrossRef] [PubMed]
  10. Hsu, A.; Sheriff, G.; Chakraborty, T.; Manya, D. Disproportionate Exposure to Urban Heat Island Intensity across Major US Cities. Nat. Commun. 2021, 12, 2721. [Google Scholar] [CrossRef] [PubMed]
  11. Li, J.; Zheng, X.; Zhang, C.; Deng, X.; Chen, Y. How to Evaluate the Dynamic Relevance between Landscape Pattern and Thermal Environment on Urban Agglomeration? Ecol. Indic. 2022, 138, 108795. [Google Scholar] [CrossRef]
  12. Wu, Z.; Yao, L.; Ren, Y. Characterizing the Spatial Heterogeneity and Controlling Factors of Land Surface Temperature Clusters: A Case Study in Beijing. Build. Environ. 2020, 169, 106598. [Google Scholar] [CrossRef]
  13. Wang, J.; Ouyang, W. Attenuating the Surface Urban Heat Island within the Local Thermal Zones through Land Surface Modification. J. Environ. Manag. 2017, 187, 239–252. [Google Scholar] [CrossRef] [PubMed]
  14. Zhang, W.; Sun, Z.; Jia, R.; Han, D.; Xu, X.; Liu, J.; Cong, H.; Qiao, Z. Diurnal Dynamic Assessment of Population Heat Exposure in Local Climate Zones Based on ECOSTRESS: A Case Study of Area within the Sixth Ring Road of Beijing. Remote Sens. Technol. Appl. 2026, 41, 64–75. [Google Scholar] [CrossRef]
  15. Yuan, B.; Zhou, L.; Hu, F.; Zhang, Q. Diurnal Dynamics of Heat Exposure in Xi’an: A Perspective from Local Climate Zone. Build. Environ. 2022, 222, 109400. [Google Scholar] [CrossRef]
  16. Wu, Z.; Wang, Y.; Ren, Y. Optimizing Green Space-Building Landscape Characteristics of Key Urban Functional Zones for Comprehensive Thermal Environment Mitigation. Landsc. Urban Plan. 2025, 257, 105314. [Google Scholar] [CrossRef]
  17. Huang, X.; Li, L.; Yan, X.; Ji, W.; Zhao, K.; Zhao, X. Assessment of Heat Exposure Risk for Urban Populations and Spatio-Temporal Patterns: A Perspective of Urban Functional Zones in Xi’an, China. Urban Clim. 2024, 55, 101992. [Google Scholar] [CrossRef]
  18. Chen, B.; Xie, M.; Feng, Q.; Li, Z.; Chu, L.; Liu, Q. Heat Risk of Residents in Different Types of Communities from Urban Heat-Exposed Areas. Sci. Total Environ. 2021, 768, 145052. [Google Scholar] [CrossRef] [PubMed]
  19. Yang, J.-T.; Zhou, X.-W.; Chen, X.; Yao, X.; Li, M.; Yin, M.-H.; Dong, F.; Yan, S.-H.; Zhao, J.-L. Exploring the Main and Interactive Effects of Urban Morphology on Land Surface Temperature across Different Functional Zones: A Local Geoshapley Analysis Based on XAI. Sustain. Cities Soc. 2025, 134, 106913. [Google Scholar] [CrossRef]
  20. Zuo, M.; Li, M.; Li, H.; Chen, T. Discovering Morphological Impact Discrepancies on Thermal Environment among Urban Functional Zones Using Essential Urban Land Use Categories and Machine Learning. Urban Clim. 2025, 61, 102423. [Google Scholar] [CrossRef]
  21. Liu, B.; Deng, Y.; Li, M.; Yang, J.; Liu, T. Classification Schemes and Identification Methods for Urban Functional Zone: A Review of Recent Papers. Appl. Sci. 2021, 11, 9968. [Google Scholar] [CrossRef]
  22. Chen, Y.; Yang, J.; Yang, R.; Xiao, X.; Xia, J. Contribution of Urban Functional Zones to the Spatial Distribution of Urban Thermal Environment. Build. Environ. 2022, 216, 109000. [Google Scholar] [CrossRef]
  23. Wang, J.; Zhang, M. Diurnal-Nocturnal Heat Health Risk Assessment at the Block Scale: Integrating Urban Functional Zones and Local Climate Zones. Sustain. Cities Soc. 2025, 130, 106609. [Google Scholar] [CrossRef]
  24. Ge, P.; He, J.; Zhang, S.; Zhang, L.; She, J. An Integrated Framework Combining Multiple Human Activity Features for Land Use Classification. ISPRS Int. J. Geo-Inf. 2019, 8, 90. [Google Scholar] [CrossRef]
  25. Hu, Y.; Dai, Z.; Guldmann, J.-M. Modeling the Impact of 2D/3D Urban Indicators on the Urban Heat Island over Different Seasons: A Boosted Regression Tree Approach. J. Environ. Manag. 2020, 266, 110424. [Google Scholar] [CrossRef] [PubMed]
  26. Peng, J.; Jia, J.; Liu, Y.; Li, H.; Wu, J. Seasonal Contrast of the Dominant Factors for Spatial Distribution of Land Surface Temperature in Urban Areas. Remote Sens. Environ. 2018, 215, 255–267. [Google Scholar] [CrossRef]
  27. Yao, L.; Sun, S.; Song, C.; Wang, Y.; Xu, Y. Recognizing Surface Urban Heat ‘Island’ Effect and Its Urbanization Association in Terms of Intensity, Footprint, and Capacity: A Case Study with Multi-Dimensional Analysis in Northern China. J. Clean. Prod. 2022, 372, 133720. [Google Scholar] [CrossRef]
  28. Zhang, S.; Zhang, X.; Niu, D.; Fang, Z.; Chang, H.; Lin, Z. Physiological Equivalent Temperature-Based and Universal Thermal Climate Index-Based Adaptive-Rational Outdoor Thermal Comfort Models. Build. Environ. 2023, 228, 109900. [Google Scholar] [CrossRef]
  29. Li, L.; Zha, Y. Population Exposure to Extreme Heat in China: Frequency, Intensity, Duration and Temporal Trends. Sustain. Cities Soc. 2020, 60, 102282. [Google Scholar] [CrossRef]
  30. Gao, H.; Ding, T.; Xie, T. The Exposure Threat of Wet Heat Extremes Is Substantially Increasing to the 65+ Elderly Population in Asia. Environ. Res. Lett. 2025, 20, 104073. [Google Scholar] [CrossRef]
  31. Xu, H.; Zeng, P.; Sun, F.; Zhao, H.; Che, Y. Population Exposure Disparities between Residential and Working Areas during a Cold Wave Event in Changchun, China. Appl. Geogr. 2024, 172, 103433. [Google Scholar] [CrossRef]
  32. Peel, M.C.; Finlayson, B.L.; McMahon, T.A. Updated World Map of the Köppen-Geiger Climate Classification. Hydrol. Earth Syst. Sci. 2007, 11, 1633–1644. [Google Scholar] [CrossRef]
  33. Wu, Z.; Zhou, Y.; Ren, Y. Green Space-Building Integration for Urban Heat Island Mitigation: Insights from Beijing’s Fifth Ring Road District. Sustain. Cities Soc. 2024, 116, 105917. [Google Scholar] [CrossRef]
  34. Tu, Y.; Chen, B.; Zhang, T.; Xu, B. Regional Mapping of Essential Urban Land Use Categories in China: A Segmentation-Based Approach. Remote Sens. 2020, 12, 1058. [Google Scholar] [CrossRef]
  35. Tang, J.; Xu, L.; Yu, H.; Jiang, H.; He, D.; Li, T.; Xiao, W.; Zheng, X.; Liu, K.; Li, Y.; et al. A Dataset of Multi-Level Street-Block Divisions of 985 Cities Worldwide. Sci. Data 2025, 12, 456. [Google Scholar] [CrossRef] [PubMed]
  36. Li, Z.; Chen, B.; Huang, Y.; Wang, H.; Wang, Y.; Yuan, Y.; Li, X.; Chen, J.M.; Xu, B.; Gong, P. Enhanced Mapping of Essential Urban Land Use Categories in China (EULUC-China 2.0): Integrating Multimodal Deep Learning with Multisource Geospatial Data. Sci. Bull. 2025, 70, 3029–3041. [Google Scholar] [CrossRef] [PubMed]
  37. Luo, H.; Zhou, R.; Li, C.; Ma, Q.; Fang, X.; Hu, Y.; Lv, X.; Dong, Z.; Tian, Y.; Fang, S. Quantifying the Nonlinear Interactions of 2D/3D Building and Green Space Morphology on Land Surface Temperature across Different Urban Functional Zones. Sustain. Cities Soc. 2026, 138, 107175. [Google Scholar] [CrossRef]
  38. Tao, Y.; Liu, W.; Chen, J.; Gao, J.; Li, R.; Wang, X.; Zhang, Y.; Ren, J.; Yin, S.; Zhu, X.; et al. A Graph-Based Multimodal Data Fusion Framework for Identifying Urban Functional Zone. Int. J. Appl. Earth Obs. Geoinf. 2025, 136, 104353. [Google Scholar] [CrossRef]
  39. Du, S.; Zheng, M.; Guo, L.; Wu, Y.; Li, Z.; Liu, P. Urban Building Function Classification Based on Multisource Geospatial Data: A Two-Stage Method Combining Unsupervised and Supervised Algorithms. Earth Sci. Inform. 2024, 17, 1179–1201. [Google Scholar] [CrossRef]
  40. Sun, J.; Wang, H.; Song, Z.; Lu, J.; Meng, P.; Qin, S. Mapping Essential Urban Land Use Categories in Nanjing by Integrating Multi-Source Big Data. Remote Sens. 2020, 12, 2386. [Google Scholar] [CrossRef]
  41. Gong, P.; Chen, B.; Li, X.; Liu, H.; Wang, J.; Bai, Y.; Chen, J.; Chen, X.; Fang, L.; Feng, S.; et al. Mapping Essential Urban Land Use Categories in China (EULUC-China): Preliminary Results for 2018. Sci. Bull. 2020, 65, 182–187. [Google Scholar] [CrossRef] [PubMed]
  42. Rodriguez-Galiano, V.F.; Ghimire, B.; Rogan, J.; Chica-Olmo, M.; Rigol-Sanchez, J.P. An Assessment of the Effectiveness of a Random Forest Classifier for Land-Cover Classification. ISPRS J. Photogramm. Remote Sens. 2012, 67, 93–104. [Google Scholar] [CrossRef]
  43. Wang, Y.; Li, C.; Zhang, H.; Lu, Y.; Guo, B.; Wei, X.; Hai, Z. Research on Multi-Source Data Fusion Urban Functional Area Identification Method Based on Random Forest Model. Sustainability 2025, 17, 515. [Google Scholar] [CrossRef]
  44. Chen, B.; Xu, B.; Gong, P. Mapping Essential Urban Land Use Categories (EULUC) Using Geospatial Big Data: Progress, Challenges, and Opportunities. Big Earth Data 2021, 5, 410–441. [Google Scholar] [CrossRef]
  45. Dong, J.; Peng, J.; He, X.; Corcoran, J.; Qiu, S.; Wang, X. Heatwave-Induced Human Health Risk Assessment in Megacities Based on Heat Stress-Social Vulnerability-Human Exposure Framework. Landsc. Urban Plan. 2020, 203, 103907. [Google Scholar] [CrossRef]
  46. Namaiti, A.; Zeng, S.; He, W.; Liu, X.; Zeng, J. Exploring Diurnal Spatiotemporal Heterogeneity in Urban Heat Exposure: A Novel Perspective from Urban Form-Function Coupling. Sustain. Cities Soc. 2026, 138, 107161. [Google Scholar] [CrossRef]
  47. Anselin, L.; Syabri, I.; Kho, Y. GeoDa: An Introduction to Spatial Data Analysis. Geogr. Anal. 2006, 38, 5–22. [Google Scholar] [CrossRef]
  48. Chen, B.; Xie, M.; Feng, Q.; Wu, R.; Jiang, L. Diurnal Heat Exposure Risk Mapping and Related Governance Zoning: A Case Study of Beijing, China. Sustain. Cities Soc. 2022, 81, 103831. [Google Scholar] [CrossRef]
  49. Wang, J.; Xu, C. Geodetector: Principle and Prospective. Acta Geogr. Sin. 2017, 72, 116–134. [Google Scholar] [CrossRef]
  50. Wang, J.; Li, X.; Christakos, G.; Liao, Y.; Zhang, T.; Gu, X.; Zheng, X. Geographical Detectors-Based Health Risk Assessment and Its Application in the Neural Tube Defects Study of the Heshun Region, China. Int. J. Geogr. Inf. Sci. 2010, 24, 107–127. [Google Scholar] [CrossRef]
  51. Chen, J.; Shi, X.; Shi, Y.; Delina, L.L. Assessing Heat Vulnerability Risk of Jinan and Guangzhou’s Older Populations Based on Multisource Remote Sensing Data. Build. Environ. 2025, 271, 112622. [Google Scholar] [CrossRef]
  52. Wang, H.; Qin, F.; Xu, C.; Li, B.; Guo, L.; Wang, Z. Evaluating the Suitability of Urban Development Land with a Geodetector. Ecol. Indic. 2021, 123, 107339. [Google Scholar] [CrossRef]
  53. Wu, R.; Xie, M.; Liu, Q.; Li, H.; Guo, Q.; Li, X. Spatial Variability of Causative Factors of Heat Islands from the Perspective of Metropolitan Functional Blocks. Resour. Sci. 2020, 42, 2463–2474. [Google Scholar] [CrossRef]
  54. Qi, J.; Xiong, W.; Li, J.; Zheng, J.; Ye, Q.; Hu, M. Investigating Non-Linear and Synergistic Effects of Urban Functional Zone Morphology on Land Surface Temperature. Sustain. Cities Soc. 2025, 130, 106546. [Google Scholar] [CrossRef]
  55. Guo, F.; Fan, G.; Zhao, J.; Zhang, H.; Dong, J.; Ma, H.; Li, N. Urban Heat Health Risk Inequality and Its Drivers Based on Local Climate Zones: A Case Study of Qingdao, China. Build. Environ. 2025, 275, 112827. [Google Scholar] [CrossRef]
  56. Zhou, Y.; Zhang, G.; Jiang, L.; Chen, X.; Xie, T.; Wei, Y.; Xu, L.; Pan, Z.; An, P.; Lun, F. Mapping Local Climate Zones and Their Associated Heat Risk Issues in Beijing: Based on Open Data. Sustain. Cities Soc. 2021, 74, 103174. [Google Scholar] [CrossRef]
  57. Zhou, Y.; Zhao, H.; Mao, S.; Zhang, G.; Jin, Y.; Luo, Y.; Huo, W.; Pan, Z.; An, P.; Lun, F. Exploring Surface Urban Heat Island (SUHI) Intensity and Its Implications Based on Urban 3D Neighborhood Metrics: An Investigation of 57 Chinese Cities. Sci. Total Environ. 2022, 847, 157662. [Google Scholar] [CrossRef] [PubMed]
  58. Tang, G.; Du, X.; Wang, S. Impact Mechanisms of 2D and 3D Spatial Morphologies on Urban Thermal Environment in High-Density Urban Blocks: A Case Study of Beijing’s Core Area. Sustain. Cities Soc. 2025, 123, 106285. [Google Scholar] [CrossRef]
  59. Bowler, D.E.; Buyung-Ali, L.; Knight, T.M.; Pullin, A.S. Urban Greening to Cool Towns and Cities: A Systematic Review of the Empirical Evidence. Landsc. Urban Plan. 2010, 97, 147–155. [Google Scholar] [CrossRef]
  60. Schwaab, J.; Meier, R.; Mussetti, G.; Seneviratne, S.; Bürgi, C.; Davin, E.L. The Role of Urban Trees in Reducing Land Surface Temperatures in European Cities. Nat. Commun. 2021, 12, 6763. [Google Scholar] [CrossRef] [PubMed]
  61. Konarska, J.; Lindberg, F.; Larsson, A.; Thorsson, S.; Holmer, B. Transmissivity of Solar Radiation through Crowns of Single Urban Trees—Application for Outdoor Thermal Comfort Modelling. Theor. Appl. Climatol. 2014, 117, 363–376. [Google Scholar] [CrossRef]
  62. Giometto, M.G.; Christen, A.; Egli, P.E.; Schmid, M.F.; Tooke, R.T.; Coops, N.C.; Parlange, M.B. Effects of Trees on Mean Wind, Turbulence and Momentum Exchange within and above a Real Urban Environment. Adv. Water Resour. 2017, 106, 154–168. [Google Scholar] [CrossRef]
  63. Oke, T.R. Canyon Geometry and the Nocturnal Urban Heat Island: Comparison of Scale Model and Field Observations. J. Climatol. 1981, 1, 237–254. [Google Scholar] [CrossRef]
  64. Jha, P.; Joy, M.S.; Yadav, P.K.; Begam, S.; Bansal, T. Detecting the Role of Urban Green Parks in Thermal Comfort and Public Health for Sustainable Urban Planning in Delhi. Discov. Public Health 2024, 21, 236. [Google Scholar] [CrossRef]
  65. Xu, M.; Hong, B.; Mi, J.; Yan, S. Outdoor Thermal Comfort in an Urban Park during Winter in Cold Regions of China. Sustain. Cities Soc. 2018, 43, 208–220. [Google Scholar] [CrossRef]
  66. Wang, Y.; Yang, S. Identification of Surface Thermal Environment Differentiation and Driving Factors in Urban Functional Zones Based on Multisource Data: A Case Study of Lanzhou, China. Front. Environ. Sci. 2024, 12, 1466542. [Google Scholar] [CrossRef]
  67. Lin, G.-S.; Llaguno-Munitxa, M.; Manoli, G. Daily and Seasonal Human Mobility Modulates Temperature Exposure in European Cities. PLoS ONE 2025, 20, e0330912. [Google Scholar] [CrossRef] [PubMed]
  68. Gao, J.; Yu, F.; Xu, Z.; Duan, J.; Cheng, Q.; Bai, L.; Zhang, Y.; Wei, Q.; Yi, W.; Pan, R.; et al. The Association between Cold Spells and Admissions of Ischemic Stroke in Hefei, China: Modified by Gender and Age. Sci. Total Environ. 2019, 669, 140–147. [Google Scholar] [CrossRef] [PubMed]
  69. Wu, C.; Shui, W.; Huang, Z.; Wang, C.; Wu, Y.; Wu, Y.; Xue, C.; Huang, Y.; Zhang, Y.; Zheng, D. Urban Heat Vulnerability: A Dynamic Assessment Using Multi-Source Data in Coastal Metropolis of Southeast China. Front. Public Health 2022, 10, 989963. [Google Scholar] [CrossRef] [PubMed]
  70. Du, Y.; Jing, M.; Lu, C.; Zong, J.; Wang, L.; Wang, Q. Global Population Exposure to Extreme Temperatures and Disease Burden. Int. J. Environ. Res. Public Health 2022, 19, 13288. [Google Scholar] [CrossRef] [PubMed]
  71. Hu, D.; Meng, Q.; Schlink, U.; Hertel, D.; Liu, W.; Zhao, M.; Guo, F. How Do Urban Morphological Blocks Shape Spatial Patterns of Land Surface Temperature over Different Seasons? A Multifactorial Driving Analysis of Beijing, China. Int. J. Appl. Earth Obs. Geoinf. 2022, 106, 102648. [Google Scholar] [CrossRef]
  72. do Nascimento, A.C.L.; Galvani, E.; Gobo, J.P.A.; Wollmann, C.A. Comparison between Air Temperature and Land Surface Temperature for the City of São Paulo, Brazil. Atmosphere 2022, 13, 491. [Google Scholar] [CrossRef]
  73. Zhang, Q.; Yang, J.; Xin, J.; Ren, J.; Yu, W.; Xiao, X.; Xia, J. Cooler Urban Spaces? Analysis and Optimization of Heat-Exposed Landscape Morphology from the Perspective of Local Climate Zones. Sustain. Cities Soc. 2025, 130, 106630. [Google Scholar] [CrossRef]
  74. An, L.; Hong, B.; Cui, X.; Geng, Y.; Ma, X. Outdoor Thermal Comfort during Winter in China’s Cold Regions: A Comparative Study. Sci. Total Environ. 2021, 768, 144464. [Google Scholar] [CrossRef] [PubMed]
  75. Blazejczyk, K.; Epstein, Y.; Jendritzky, G.; Staiger, H.; Tinz, B. Comparison of UTCI to Selected Thermal Indices. Int. J. Biometeorol. 2012, 56, 515–535. [Google Scholar] [CrossRef] [PubMed]
  76. Di Napoli, C.; Pappenberger, F.; Cloke, H.L. Assessing Heat-Related Health Risk in Europe via the Universal Thermal Climate Index (UTCI). Int. J. Biometeorol. 2018, 62, 1155–1165. [Google Scholar] [CrossRef] [PubMed]
  77. Arzberger, S.; Egerer, M.; Suda, M.; Annighöfer, P. Thermal Regulation Potential of Urban Green Spaces in a Changing Climate: Winter Insights. Urban For. Urban Green. 2024, 100, 128488. [Google Scholar] [CrossRef]
  78. Wang, Y.; He, B.-J.; Kang, C.; Yan, L.; Chen, X.; Yin, M.; Liu, X.; Zhou, T. Assessment of Walkability and Walkable Routes of a 15-Min City for Heat Adaptation: Development of a Dynamic Attenuation Model of Heat Stress. Front. Public Health 2022, 10, 1011391. [Google Scholar] [CrossRef] [PubMed]
  79. Yu, K.; Chen, Y.; Liang, L.; Gong, A.; Li, J. Quantitative Analysis of the Interannual Variation in the Seasonal Water Cooling Island (WCI) Effect for Urban Areas. Sci. Total Environ. 2020, 727, 138750. [Google Scholar] [CrossRef] [PubMed]
Figure 1. Study area.
Buildings 16 02681 g001
Figure 2. Overview of the workflow.
Buildings 16 02681 g002
Figure 3. UFZ classification results.
Buildings 16 02681 g003
Figure 4. The spatial distribution of heat exposure across different UFZs.
Buildings 16 02681 g004
Figure 5. Boxplots of heat and cold exposure, and the proportion of each exposure level across different UFZs.
Buildings 16 02681 g005
Figure 6. The spatial distribution of cold exposure across different UFZs.
Buildings 16 02681 g006
Figure 7. Spatial aggregation patterns of heat and cold exposure.
Buildings 16 02681 g007
Figure 8. Contributions of UFZs to heat and cold exposure.
Buildings 16 02681 g008
Figure 9. The q statistic of the factor detector across different UFZs (the p values lower than 0.05 were marked by solid rectangle).
Buildings 16 02681 g009
Figure 10. Effect of two-factor interaction across different UFZs. (a) Interaction effects for heat exposure; (b) Interaction effects for cold exposure.
Buildings 16 02681 g010
Figure 11. Ranking of importance of different indicators used for classification.
Buildings 16 02681 g011
Figure 12. Priority classification for heat and cold exposure mitigation.
Buildings 16 02681 g012
Table 1. Features extracted from multi-source big data. The figure in brackets is the number of features.
DataFeature TypeFeatures
Multispectral remote sensing (24)BandThe mean value, standard deviation, and variety for the blue, green, red, near-infrared, and short-wave infrared bands for each block (18)
Normalized
difference index
The mean and standard deviation of NDVI, NDBI, and NDWI for each block (6)
POIs (27)FrequencyThe total number, proportion, and average kernel density of all POIs and each POI type for each block (17)
SpatialityTen-dimensional word vectors of POI labelled sequences for each block (10)
Population heat map (24)Population distributionHourly mean kernel density of the active population for each block (24)
Building morphology (8)Two-dimensional buildingThe mean, maximum, and standard deviation of building density and building area for each block (4)
Three-dimensional buildingThe mean, maximum, and standard deviation of floor area ratio and building height for each block (4)
Nighttime light (1)Nighttime activityThe mean nighttime light value for each block (1)
Table 2. Types of interaction between two factors.
CriterionInteraction
q (X1 ∩ X2) < Min (q (X1), q (X2))Weaken, nonlinear
Min (q (X1), q (X2)) < q(X1 ∩ X2) < Max (q (X1), q (X2))Weaken, nonlinear, univariate
q (X1 ∩ X2) > Max (q (X1), q (X2))Enhance, bivariate
q (X1 ∩ X2) = q (X1) +q (X2)Independent
q (X1 ∩ X2) > q (X1) +q (X2)Enhance, nonlinear
Table 3. Description of indicators.
CategoryMetricsFormulaDescription
Building morphologyBD B D = i = 1 n A i A b Indicates the proportion of the building’s base surface to the overall block. A i is the base area of the i th building. A b is the total area of a block.
FAR F A R = i = 1 n A i F i A b Indicates building aggregation in three-dimensional space. F i is number of floors.
BH B H = 1 n i = 1 n h i Indicates the average building height. h i is the height of the i th building.
STDBH S T D B H = 1 n i = 1 n ( h i B H b ) Indicates the vertical heterogeneity of building heights within the block. B H b is the average building height in the block.
SVF S V F = 1 i = 1 k s i n γ i k Indicates sky openness. γ i is influence of the terrain height angle on the azimuth angle i . k is number of calculated azimuth angles.
CI C I = s q r t ( A b ) E Indicates compactness of neighborhood. A b is the total area of a block. E is the perimeter of the block.
HBR H B R = N i N Indicates the proportion of buildings over 24 m in height. N i is the number of buildings over 24 m in height.
SCD S C D = i = 1 n ( A i × h i ) i = 1 n A i × h m a x Indicates space congestion degree. h m a x is the height of the tallest building in block.
BSC B S C = 1 n i = 1 n S i V i Indicates the building-level spatial heat dissipation area and energy consumption metrics within the block. S i is the surface area of the i th building. V i is the volume of the i th building.
AV A V = 1 n i = 1 n V i Indicates the average of building volumes in block.
BP B P = 1 i = 1 n V i A b × h m a x Indicates the building porosity and the size of space within a block available to provide flow for ventilation.
Land coverUISA U I S A = A i s A b Indicates the proportion of impervious surface area. A i s is the impervious surface coverage area.
UBI U B I = A w a t e r A b Indicates the proportion of water area. A w a t e r is the water area.
Landscape patternPDOmittedIndicates the patch density of blue–green space.
SHDIOmittedIndicates the Shannon Diversity Index.
PLANDOmittedIndicates the proportional coverage of blue–green space.
Human activityNTLOmittedIndicates average nightlight value of the block.
CSKDKernel densityIndicates the density of climate-supportive service facilities (parks, plazas, shopping malls, shopping centers, and subway stations), which has potential effects for both heat and cold avoidance.
POIKernel densityIndicates the density of all POIs in the block.
Vulnerable population structureCR C R = N c N t Indicates the ratio of children. N c is the number of children. N t is the total number of people.
ER E R = N e N t Indicates the ratio of elderly population. N c is the number of older adults.
FR F R = N f N t Indicates the ratio of females. N f is the number of females.
Table 4. Precision, recall, and F1-score for UFZs.
UFZsPrecisionRecallF1-Score
Commercial0.73 0.73 0.73
Greenspace0.80 0.87 0.84
Industrial1.00 0.43 0.60
Public0.91 0.75 0.82
Residential0.81 0.91 0.86
Table 5. Confusion matrix for UFZs.
CommercialGreenspaceIndustrialPublicResidential
Commercial72.73%0.00%0.00%9.09%18.18%
Greenspace2.63%86.84%0.00%0.00%10.53%
Industrial14.29%42.86%42.86%0.00%0.00%
Public7.14%7.14%0.00%75.00%10.71%
Residential3.77%5.66%0.00%0.00%90.57%
Disclaimer/Publisher’s Note: The statements, opinions and data contained in all publications are solely those of the individual author(s) and contributor(s) and not of MDPI and/or the editor(s). MDPI and/or the editor(s) disclaim responsibility for any injury to people or property resulting from any ideas, methods, instructions or products referred to in the content.