


Abstract
Currently, the revitalization and protection of historic districts have become the focus of academic research. However, existing studies have few investigations into how the perception mediated at the pedestrian scale affects spatial behavior choices within historical and cultural districts. This study takes a certain historic district in Shenyang as an example, using multiple perception methods, including visual perception and online perception, as mediators to explore the relationship between spatial characteristics, spatial quality, and urban vitality. First, through the Factor analysis method (FA), the study divides the built environment within the research scope into four spatial characteristics: street scale, historical and cultural, environmental comfort, and functional business characteristics. Second, by applying the mediating and moderating effect model, this study takes visual quality (visual perception) and public preferences (online perception) as perception mediators and analyzes the associative pathways and conditional effects of various spatial characteristics on urban vitality through the mediation process. The study results indicate: (1) Each spatial characteristic has a significant mediating effect on vitality. (2) The effect pathways of spatial characteristics differ substantially across dimensions, and a significant moderating effect exists exclusively in historical and cultural characteristics. (3) Public preference exerts a significant negative moderating effect on the association between historical and cultural characteristics and urban vitality. This study reveals the mechanism of “spatial characteristics–dual perception dimensions–urban vitality” in historic districts and elaborates the associative mechanism between spatial characteristics and historic district vitality under different levels of public preferences.
1. Introduction
Historic Districts as the spatial carriers of urban cultural heritage [1] are increasingly facing the challenge of balancing protection and development in the context of urban renewal [2,3,4]. As urban development shifts from an expansion-based incremental renewal model to a retention-based renewal model, historic districts not only need to maintain historical authenticity [5], but also need to continuously maintain urban vitality [6,7]. Historic districts, especially those with certain forms of commercial business, are often regarded as having distinctive vitality characteristics 2. Studies have shown that districts with good functional mix and significant cultural characteristics have greater appeal to tourists and citizens [8,9]. Elements such as cultural landscapes and cultural heritage in European ancient cities are often recorded by tourists and uploaded to social media and social networking sites, becoming digital records of that site.
Generally, when tourists and citizens choose tourism or commercial destinations, their decision-making process is to some extent influenced by online information [10]. Existing studies have confirmed that online data such as network evaluations and destination searches have a certain promoting effect on tourists’ route selection and behavioral activities [11,12].
The current research mainly focuses on the direct discussion of urban vitality characterization and urban functional attributes. This part of the research neglects the complete process of vitality generation. The formation of urban vitality is a multi-stage transmission process: Firstly, urban development shapes the basic functions of specific areas. Secondly, functional blocks give rise to diverse business types, and residents and tourists form perceptions and impressions of the area through on-site experiences or online information, thereby stimulating corresponding behavioral activities. Thirdly, continuous human activities form stable spatial behavioral patterns, which are recorded as digital records such as location data and online comments by mobile terminals and internet platforms [13]. Finally, this captured and quantifiable digital information jointly constitutes the digital representation of urban vitality [10]. Meanwhile, the rise in experiential consumption has further driven the focus of research and practice to shift from the pure protection of physical space to the experience of spatial quality and human-oriented perception [14].
However, a fundamental dilemma persists: stringent conservation strategies often result in insufficient space utilization and loss of vitality, while excessive commercialization may erode historical authenticity and cultural identity [15]. This contradiction highlights a core issue: how to enhance the urban vitality of historic districts without compromising their heritage value [16,17,18].
The current research mainly focuses on identifying the direct impact of spatial characteristics on urban vitality. Regarding the discussion of the vitality of historic districts, it mainly centers on the binary discussion between vitality indicators and urban functions. Scholars often utilize models such as machine learning to explore their relationship and the main factors. Similar studies have ignored the essential reason for the generation of vitality: the urban vitality generated by the choice of behavior. Meanwhile, the research on historic districts is often confined to the protection of the physical form [19] or the assessment of the built environmental value [20] as the core. Although these studies provide valuable theoretical insights, they generally assume that there is a direct linear correlation between spatial attributes and vitality, ignoring the intrinsic cognitive process by which individuals interpret space and make behavioral responses [21,22,23].
From the perspective of environmental psychology, the association between the space of historic districts and visitors’ behavior can be understood as an information processing process (Figure 1). Environmental stimuli are received by individuals and generate immediate sensory perception. Subsequently, these perceptual signals are integrated with individuals’ existing knowledge, experience, memory, and prior cognition acquired through online channels, and processed by the brain, which ultimately shapes visitors’ behavioral decisions and gives rise to urban vitality [24,25]. This indicates that the spatial characteristics of the historic district space do not directly affect urban vitality, but they exert their impacts through the mediation of the “perception-cognition” pathway.
Figure 1.
Process of information processing.
In this process, immediate sensory perception refers to direct visual, auditory, and tactile sensations generated when individuals interact with the space on-site, among which visual perception accounts for over 80% and serves as the dominant perceptual channel. In contrast, prior cognition represents the expectations and impressions of the space formed by individuals through various channels such as online reviews before visiting, which significantly moderates the effect of on-site perception on behavioral decisions [26]. Moreover, the situational cognition theory further points out that cognition is a dynamic process of interaction between the individual and the environment, and individuals’ prior knowledge profoundly influences their interpretation of and response to current environmental stimuli [27]. In recent years, the research framework of environmental psychology has been increasingly applied to fields related to architecture to study how spatial environmental stimuli affect the behavioral decisions of individuals through cognitive processing and emotional feedback [28].
In the current era of widespread availability of online information, the public preferences reflected in online reviews add a new dimension of influence to this process. As a “preliminary perception”, public preferences shape an individual’s expectations and cognition of the space even before there is any interaction between the individual and the space [29,30]. Therefore, the impact effect of spatial characteristics on urban vitality may vary depending on the level of public preferences, presenting a context-dependent mechanism.
Based on this perspective, the information processing model (IPM) from environmental psychology is used to construct a research framework of “spatial characteristics–dual perceptual dimension evaluation–urban vitality”. Unlike existing studies that generally focus on only a single perceptual dimension, this study is the first to integrate on-site visual quality evaluation (individual immediate experiential perception) and online public preference (collective prior perception) into a unified mechanistic model. Specifically, this study extracted spatial characteristics from the built environment as the environmental input variable, visual quality is set as the mediating variable that links the spatial environment and human behavior, urban vitality is regarded as the outcome variable representing the result of people’s behavioral decisions. Meanwhile, public preference is introduced as the moderating variable to elucidate the differentiated mediating pathways and conditional effects through which various spatial characteristics shape vitality in historic districts.
This study took the Zhongshan Road Historic District in Shenyang, Northeast China as the research object. First, the semantic difference method (SD method) was used to quantify the multi-dimensional perceptual attributes of spatial characteristics and construct the comprehensive measurement index of visual quality. Second, multi-source data including street view images, online reviews and Baidu heat maps were integrated to measure visual quality, public preference and urban vitality, respectively. Finally, using models such as the mediation effect model and the moderating effect model, this study explored the perception-mediated pathways between space and vitality. This study aims to answer the following core questions:
(1) In historic districts, is there a perception-mediated pathway in the influence of spatial characteristics on urban vitality? (2) What differences exist in the effect pathways of spatial characteristics across different dimensions on urban vitality? (3) How does online public preference moderate the influencing mechanism of historical and cultural characteristics on urban vitality?
2. Literature Review
2.1. The Importance and Measurement of Urban Vitality
Urban vitality is regarded as a key force driving urban development and is of vital importance for achieving sustainable urban development [31]. This concept was initially proposed by Jacobs in 1961 and refers to an active urban environment that can support various human activities and promote people’s sense of belonging [32]. Such an urban environment can accommodate various social and economic activities and enhance people’s sense of community identity [11]. However, in the rapid urbanization process of China, large cities generally have the problem of high population density, concentrated economic activities but mismatched employment and living locations, and people’s attention to enhancing urban vitality is insufficient [10]. Therefore, more urban planners and scholars have proposed that vibrant urban spaces are of great significance for promoting interpersonal communication, maintaining social stability, and promoting economic growth [33].
Early measurements of urban vitality predominantly relied on qualitative assessments and small-sample field surveys, including expert scoring, questionnaire surveys, and interviews, through which core influencing factors such as functional mix [34], street connectivity, and building density were identified [35,36]. Nevertheless, these traditional approaches are constrained by notable limitations: they are time-consuming and labor-intensive, yield limited sample sizes, and fail to capture the spatiotemporal dynamics of urban vitality [37,38].
In recent years, with the rapid advancement of information and communication technologies (ICT) and location-based services (LBS), multi-source big data has enabled the refined quantitative measurement of urban vitality [39]. Scholars have extensively utilized diverse data sources, including mobile phone signaling data, Baidu heat maps, points of interest (POI), social media check-in records, and shared bicycle usage data [10] to establish a multi-dimensional evaluation system for urban vitality [13]. For instance, Delclòs-Alió et al. (2019) integrated GIS with smartphone positioning data to validate Jane Jacobs’ theory of urban vitality [40]; Mao et al. (2020) employed POI and LBS data to examine the spatial pattern of vitality in the urban agglomeration along the middle reaches of the Yangtze River [41].
Overall, while measurement approaches for urban vitality have evolved from qualitative evaluation to quantitative analysis supported by multi-source big data, two key limitations persist in existing research. First, most studies use a single data source (e.g., mobile phone signaling data, POIs, or social media data) to represent vitality and fail to accurately characterize the spatiotemporal differentiation patterns of vitality under the mixed cultural, commercial and residential functions of historic districts. Second, most studies focus solely on the spatial distribution outcomes of vitality, without in-depth exploration of the internal behavioral decision-making mechanism underlying vitality formation.
2.2. Built Environment and Urban Vitality
Existing studies have systematically identified a set of core built environment factors that shape urban vitality. Katz (1994) argued that mixed-use functions, compact layout, walkable spatial scale and appropriate building density are the key to enhancing neighborhood vitality [42]. Montgomery (1998) further developed [12] evaluation indicators for urban vitality from dimensions including human-scale design, street connectivity and spatial texture [43]. A large body of subsequent empirical studies has confirmed that neighborhoods with a higher degree of functional mix [44], more appropriate street height-to-width ratio and higher green coverage ratio tend to exhibit stronger vitality [9].
However, this line of research is universally underpinned by a core assumption: there exists a direct linear association between the physical attributes of the built environment and urban vitality. This “spatial determinism” perspective neglects a critical intermediate process—individuals do not passively receive spatial stimuli; instead, they ultimately form behavioral decisions through the perception, interpretation and evaluation of space [21]. Particularly in historic districts, the mechanism by which spatial elements endowed with collective memory and cultural significance shape vitality can hardly be explained by mere physical-spatial correlations.
2.3. Perception-Based Research on Urban Vitality
With the application of environmental psychology theories in urban research, the research paradigm has gradually shifted from a “physical space-oriented” approach to a “human-centered perception-oriented” one. Scholars have come to recognize that urban vitality is essentially the aggregated outcome of human spatial behavior, and perception serves as a critical bridge linking the built environment to behavioral decisions [26]. In recent years, breakthroughs in street view imagery and deep learning technologies have enabled large-scale, fine-grained evaluation of urban visual perception [45].
Research on urban vitality incorporating neighborhood perception evaluation via street view imagery has become a dominant research hotspot. Many studies have extracted visual attributes including green view index, sky view factor and building interface characteristics from street view data [46], quantified spatial quality through the SD method or deep learning models, and validated a significant positive correlation between visual perception and urban vitality [8].
However, two notable shortcomings persist in existing research. First, most studies frame perception as a unidimensional holistic evaluation, failing to unpack the multi-dimensional structure of perception and its differentiated effect pathways. Second, most studies focus solely on individuals’ on-site immediate perception, while entirely overlooking the widespread “prior perception” in the internet age. Specifically, prior perception refers to the expectations and cognition of space formed by individuals through online reviews before their visit, which exerts a pre-visit influence on behavioral decision-making.
2.4. Historic Districts and Symbolic Perception
As a special type of urban space that carries collective urban memory and cultural heritage, the spatial and environmental elements of historic districts serve not only utilitarian functions but also bear strong cultural symbolic meanings. Unlike ordinary urban areas, the vitality of historic districts derives not only from vitality-shaping environmental factors such as functional convenience and spatial accessibility, but also from their unique cultural attractiveness and sense of place identity [47]. Existing studies indicate that distinctive symbolic attributes—including the authenticity of historic buildings, the recognizability of cultural heritage, and the integrity of historical landscape—can foster place attachment and cultural identity among tourists and residents. This generates a “symbolic attraction effect” unique to historic districts compared with conventional urban areas and directly elevates the visit rate and vitality level of the neighborhoods [44].
While existing studies have confirmed the significant role of historical and cultural characteristics in shaping urban vitality, notable research gaps still remain. First, most studies stay at the level of correlation analysis and fail to reveal the internal mechanism through which historical and cultural characteristics influence vitality—that is, whether they exert their effects directly or indirectly through perceptual mediation. Second, the essential differences in effect pathways between historical and cultural characteristics and conventional built environment elements have not been clearly delineated. Third, the differential conditional effects of historical and cultural characteristics on vitality under varying levels of perception have not been systematically explored.
2.5. Online Preference and Collective Cognition
With the growing popularity of social media and online travel platforms, user-generated content (UGC)—including online reviews, travel journals and ratings—has emerged as a vital data source for characterizing public collective perception. Such data offers the strengths of large sample sizes, extensive coverage and high spatiotemporal resolution, enabling an authentic reflection of how large populations experience and evaluate urban spaces [48]. Evidence shows that public preferences conveyed in online evaluations shape individuals’ expectations and cognition of a destination prior to their physical interaction with the space, which in turn exerts a significant impact on visit decisions, length of stay and consumption behavior [29,30].
Nevertheless, two key limitations persist in existing studies on online public preferences. First, online preference is mostly used as an indicator of urban vitality rather than an antecedent variable driving vitality. Second, online public preference has not been incorporated into in-depth investigations, for instance, examining its heterogeneous effects across the effect pathways through which different spatial characteristics shape urban vitality. In fact, as a form of prior perception, online public preference is highly likely to reshape individuals’ perception and evaluation of on-site spatial characteristics, thereby moderating the effect of spatial characteristics on urban vitality.
2.6. Research Gaps and Corresponding Strategies
Building on the literature review, three core limitations remain in extant research on urban vitality, and this study makes systematic breakthroughs targeting these gaps:
- (1)
- Existing analytical frameworks are predominated by environmental factors or a single perceptual dimension, lacking a holistic research framework that integrates “physical space–immediate perception–prior cognition–behavioral outcomes”. Grounded in the classical information processing model of environmental psychology, this study develops a dual-perception integration analytical framework for the first time, incorporating on-site visual perception (immediate perception) and online public preference (prior cognition) into a unified mechanistic model, which fills the gap in existing theoretical frameworks.
- (2)
- Existing studies tend to focus on the static correlation between perception and vitality, overlooking the different effect pathways through which various spatial characteristics shape urban vitality, and have not explored the moderating effect of online public preference within these pathways. By employing mediating and moderating effect models, this study systematically reveals the distinct mechanisms through which different spatial characteristics exert impacts on urban vitality.
- (3)
- Most existing perception-vitality studies concentrate on conventional urban areas, with inadequate attention to the specific context of historic districts. Although urban vitality research incorporating street view-based neighborhood perception evaluation has become a prominent research hotspot, the cultural and symbolic elements in historic districts follow a unique attraction mechanism, so the conclusions drawn from ordinary urban areas cannot be simply applied to historic districts. Taking the Zhongshan Road Historic District in Shenyang as the case, this study advances research on the vitality formation mechanism of historic districts and provides a reference for the conservation and revitalization of comparable historic districts.
3. Materials and Methods
3.1. Research Area
This study takes the historic district on Zhongshan Road in Shenyang City, Liaoning Province, China as the research object. As a core component of Shenyang’s urban structure, this area is a key node of Shenyang’s collage urban pattern of “Shengjing City–Mantie Railway–Commercial Port Area” (Figure 2a) and a typical sample of urban form with historical stratigraphic characteristics.
Figure 2.
(a) Urban layout. (b) Distribution of historical resource points.
The study area exhibits a unique urban structure, integrating grid-like road networks, radial street layouts, and central square arrangements in a mixed spatial form (Figure 2b). Within the districts, there are numerous early European-style modern buildings, making it one of the most representative areas of the Chinese Northeast region featuring a blend of Chinese and Western architectural styles.
The total area of the district is approximately 93.7 hectares, covering the sections along Zhongshan Road and the surrounding areas, including Shenyang Railway Station, Zhongshan Square, etc. The core protection area covers an area of 26.4 hectares, including the core street corridor, heritage building plots, and designated protected zones. There are numerous national, provincial, and municipal cultural relics protection units distributed within the district, fully demonstrating its long historical evolution and significant cultural value (Figure 2b).
3.2. Research Boundaries and Sampling Design
Following the analytical logic of street scale proposed by previous studies [49], this research defines the street space not only as the road itself but also includes the surrounding built environment that can affect individual perception and activity intensity, such as building facades and the first-floor functional interfaces.
In this study, the center line of Zhongshan Road was used as the baseline, and the buffer zone of 55 m was extended to both sides of the road [49] as the spatial scope of analysis (Figure 3). The selection of the 55 m buffer zone is based on the pedestrian scale perception principle in urban design research. The street experience is mainly shaped by the immediate visual and functional environment. This scale has been widely applied in existing studies on human–environment interaction and can effectively capture the interface between buildings and public spaces, which is the area with the closest correlation between perception and behavior.
Figure 3.
(a) Study site. (b) Scope of the study.
Within the study area, 70 sampling points were selected using the systematic sampling method and evenly distributed along the road centerline at a fixed interval of 100 m to ensure the spatial coverage and representativeness of the samples. This sampling interval was determined according to the average length of street segments in the study area and the 55 m pedestrian perception buffer zone adopted in this research [49] and can effectively capture the spatial heterogeneity of the neighborhood-built environment.
Meanwhile, this sampling scheme fully covers all continuous, pedestrian-accessible street segments in the Zhongshan Road Historic District, representing the maximum valid sample size available at this research scale and within the study scope [50]. The number of sampling points in existing perception studies of historic districts at the same scale mostly ranges from 60 to 90 [14,18], and the sample size of this study falls within a reasonable range of similar studies in this field.
These sampling points will serve as the basic units for subsequent spatial quality evaluation, perception analysis and urban vitality measurement. Each sampling point corresponds to evaluation data from multiple raters. By aggregating the evaluation results of all raters for the same sampling point, the visually perceived spatial characteristics of this spatial unit are derived, thereby realizing the spatial matching between the objective built environment and subjective perception evaluation.
3.3. Data Sources
3.3.1. Urban Street Space Data
The urban street space data is used to construct the physical spatial base of the study area. The vector data are taken from Open Street Map [51], and are supplemented with high-resolution remote sensing images for geometric correction and accuracy verification. After data cleaning, topology correction and element classification [52], the core spatial elements of Zhongshan Road Historic District were extracted, including street networks, building bases and public space boundaries [46]. This dataset provides basic spatial support for subsequent urban form analysis and spatial visualization.
3.3.2. Street View Images and Perception Data
Street view images have become an increasingly important data source in urban research, as it provides visual information from a fine-grained pedestrian perspective and compensate for the limitations of traditional geospatial datasets. Unlike the top-down perspective of remote sensing imagery, street view data can accurately characterize pedestrian-scale environmental features such as building facades, street greenery, and pedestrian facilities, and has emerged as a core tool for research on the perceptual quality of the built environment and urban livability [53].
Breakthroughs in computer vision and deep learning technologies have further expanded their application boundaries, enabling large-scale semantic understanding of urban scenes and automatic extraction of visual indicators. These advances allow for the quantification of greenness exposure [54], evaluation of walking environments, and construction of subjective perception models. Multiple recent systematic reviews have confirmed that street view imagery has become the mainstream data source for research on pedestrian-scale built environment perception, with applications spanning urban planning, landscape architecture, public health and other fields [55,56].
In Chinese urban research, Google Street View and Baidu Street View exhibit notable cross-platform complementarity: Google Street View boasts extensive global coverage but suffers from slow updates in mainland China and substantial data gaps in historic districts; Baidu Street View offers better domestic coverage and update frequency, yet is predominantly captured from a vehicle-mounted perspective and struggles to cover the narrow alleys and lanes of historic districts. Both platforms share common limitations such as image occlusion, inconsistent shooting angles, and an update lag of 1–3 years [57], which are particularly pronounced in spatially complex historic districts.
This study adopts a standardized on-site shooting method to collect street view imagery to obtain fine-grained perceptual information that is generally unavailable from large-scale remote sensing imagery or platform-based street view datasets [58,59]. This method ensures that visual data aligns with pedestrian-scale perceptual characteristics and is especially well suited to the narrow, complex street environments of historic districts. Compared with platform data such as Baidu Street View and Google Street View, on-site shooting effectively avoids issues including update lags, partial occlusion, and inconsistent shooting angles, and has been proven to deliver higher reliability in fine-grained visual evaluation of historic districts [60].
Based on the 70 sampling points selected via the systematic sampling method described above, street view images in four directions (front, back, left, and right) are captured continuously at each point following the direction of pedestrian movement with standardized fixed viewing angles (Figure 4). The horizontal field of view is 360 degrees, and the vertical field of view is 90 degrees, ensuring that experimental participants can fully and accurately perceive the spatial characteristics surrounding each sampling point, and guaranteeing spatial consistency and data comparability across all sampling points.
Figure 4.
Distribution of sampling point images.
All images were acquired from 9:00 to 17:00 on sunny days between May and June 2025, with dawn and dusk periods excluded. Only footage captured under clear weather conditions was selected, and images taken on rainy, snowy or foggy days were discarded to ensure uniform lighting conditions across all samples. All collected raw images underwent manual quality control. Invalid images—including those obscured by vehicles, pedestrians or construction hoardings, as well as blurry and severely distorted frames—were eliminated one by one. Ultimately, 280 valid images (4 for each sampling point) were retained for subsequent perceptual evaluation and spatial visualization analysis, serving as the foundational dataset for constructing visual quality indicators of the built environment.
3.3.3. Public Preference Data
To capture the collective perception characteristics of urban spaces, this study collected user-generated content 48 from mainstream online platforms such as Ctrip and Dazhong Dianping as public preference data. Such platforms collect a large amount of text feedback from residents and tourists, which can truly reflect the users’ subjective perception evaluations of the built environment.
This study employs a Python 3.10.12-based web crawler to extract review texts and rating data for core points of interest (POIs) within the study area, including heritage buildings, commercial facilities, and public spaces. The review data were collected from January 2021 to June 2025, yielding a total of 3158 raw reviews. To ensure data quality, preprocessing was performed on the raw dataset, which included removing duplicate reviews, empty reviews, reviews containing only images or emojis, advertising content, and invalid reviews with an insufficient word count (fewer than 5 Chinese characters). For identical POIs from Ctrip (https://www.ctrip.com/, accessed on 15 September 2025) and Dianping (https://www.dianping.com/, accessed on 15 September 2025), matching was conducted based on POI names and address information, and ambiguous entries were subject to manual verification to ensure that reviews from different platforms correspond to the same spatial entity.
Given the technical difficulty of fully identifying fake reviews, this study adopts a conservative and rigorous screening strategy to exclude obviously invalid or suspected promotional reviews—including those containing only advertising links, repetitive promotional slogans, or evident commercial promotion tendencies. A total of 126 such reviews were removed to mitigate the impact of low-quality content on the analytical results. Through natural language processing methods such as sentiment analysis and keyword extraction [61,62], the unstructured text data was transformed into quantitative indicators of spatial perception quality. These indicators can represent public preferences and are used to supplement the perceived evaluation data obtained from on-site research.
3.3.4. Urban Vitality Data
This study measures urban vitality using Baidu heat map data [63]. This data reflects the spatial distribution characteristics of population density based on mobile device positioning and can be used as an indicator of the real-time activity patterns of humans within the urban space. Python was used to collect heat map data at multiple time periods on weekdays and weekends. The original heat values were preprocessed and spatially registered with the study area to conduct the analysis of the spatio-temporal characteristics of urban vitality.
This dataset integrates both temporal dynamics and spatial distribution characteristics and can identify the active hotpots and low-vitality areas of the district; it provides behavioral outcome variables for testing the relationship between spatial characteristics, perception, and urban vitality.
3.4. Methodology
3.4.1. Urban Vitality Measurement Methods
Urban vitality is measured by Baidu heat map data, which is generated based on mobile phone signaling and can reflect the real-time spatial pattern of population concentration. It has been widely used as an indicator to represent the intensity of urban activities and space utilization levels. To ensure data reliability and temporal representativeness, heat map data were collected consecutively on 17 September (Wednesday), 18 September (Thursday), 20 September (Saturday) and 21 September (Sunday) 2025, covering two weekdays and two weekend days. The data collection was scheduled to avoid national statutory public holidays, large-scale commercial promotions and cultural festivals within the study area. All sampling days were sunny with temperatures between 18 °C and 26 °C, consistent with typical outdoor activity conditions in autumn in Shenyang and thus can reliably reflect the daily activity patterns of residents and tourists in the district. Data were extracted every 2 h from 8:00 to 22:00 each day, resulting in a total of 32 time snapshots. ArcGIS was adopted to standardize the thermal values and conduct geographic registration and grid correction. The processed dataset was used to quantify the urban vitality level of each sampling point.
3.4.2. Spatial Perception and Evaluation Methods
The scenic beauty estimation (SBE) method is a quantitative evaluation method for landscape visual perception that converts observers’ subjective esthetic perceptions into quantifiable values for statistical analysis. The Semantic Differential (SD) method measures psychological experiences via verbal scales and transforms respondents’ perceptions into quantifiable data. This study integrates the SBE method with a 7-point Likert scale to quantitatively evaluate the spatial perception of experiencers in historic districts. Meanwhile, an SD scale comprising 14 adjective pairs is employed to decompose the multi-dimensional perceptual characteristics of environmental elements underlying holistic esthetic evaluations.
The evaluation was administered via an online questionnaire platform. Each rater was randomly presented with 16 sets of street view images and instructed to rate the SBE of each set on a 7-point Likert scale, as well as complete the SD assessment using 14 adjective pairs. Each set of evaluations took approximately 1 min, with the total evaluation duration per rater controlled within 20 min—well below the widely recognized 30 min fatigue threshold in psychological experiments. This design effectively mitigated the interference of fatigue effects on evaluation outcomes and ensured the accuracy and consistency of the data. A total of 50 undergraduate and graduate students majoring in landscape architecture were recruited for the evaluation. All participants were aged 18–30, with no color vision abnormalities and basic professional knowledge of landscape visual perception.
In total, 11,200 sets of raw SD evaluation scores were collected (50 raters × 16 image sets × 14 evaluation indicators). The conventionally adopted ±3 standard deviation method was applied to identify and exclude abnormal scores. For each SD indicator at each sampling point, the mean and standard deviation of scores across all raters were calculated separately, and scores falling outside the range of “mean ± 3 standard deviations” were classified as outliers and removed. A total of 14 abnormal scores were eliminated, accounting for 0.125% of all raw scores. This proportion is far lower than the theoretical outlier ratio of 0.3% under a normal distribution, indicating negligible random responding among raters and excellent overall data quality.
Inter-rater agreement was measured using the absolute agreement intraclass correlation coefficient (ICC) from a two-way mixed-effects model, calculated via standard maximum likelihood estimation based on fully balanced data with no missing values. The results showed that the average measurement ICC of the SD scale reached 0.76 (95% CI: 0.69–0.82), satisfying the “good agreement” criterion (ICC > 0.7) proposed by Landis [64]. In addition, Cronbach’s α coefficient was employed to test the internal reliability of the SD scale. SPSS reliability statistics indicated a raw Cronbach’s α of 0.857 and a standardized-item Cronbach’s α of 0.859, both well above the general academic threshold of 0.7. This verifies the strong reliability of the 14 selected adjective pairs and the scientific, rational design of the scale.
3.4.3. Visual Quality Measurement Methods
This study conceptually defines visual quality in historic districts as the holistic evaluation of the comprehensive quality of street space formed by pedestrians with vision as their core perceptual channel. Its connotation extends beyond narrow-sense visual esthetics and encompasses all spatial attributes that can be identified, perceived and judged through the street visual interface.
This study adopts the SBE method to measure the overall comprehensive score of visual quality in historic districts and clearly defines the levels of visual perception across different district units. The SD method is further applied to decompose the multi-dimensional environmental element perception characteristics within the overall esthetic evaluation and explores the core spatial characteristics that influence visual perception evaluation and subjective feelings. Finally, through mathematical statistical methods, abnormal deviation data is eliminated, and the original scoring results are standardized. On this basis, the Factor analysis method (FC) is used to construct a spatial visual quality evaluation system. Let the standardized variables be X1, X2, …, Xn. Based on the decomposition of characteristic values, the principal components are extracted, and the number of principal components retained is determined by the principal component eigenvalues and contribution rate (usually more than 60%). The standardized scores of each spatial characteristic are calculated through the following linear weighted formula:
In the formula, Fn represents the visual quality evaluation score of the nth spatial characteristic; αn is the factor score coefficient corresponding to the nth environmental element, derived from the principal component score coefficient matrix output by SPSS 26.0; Xn is the standardized score of the nth environmental element.
Based on the Principal component eigenvalues and contribution rate through the FC method, to ensure that the weights sum up to 1, the final weight is determined by the ratio of the single-dimensional variance contribution rate and cumulative variance contribution rate (CVC). The specific calculation is as follows:
In the formula: M represents the comprehensive visual quality total score of the district sample; F1 − F4 respectively represent the visual quality sub-item scores of the four dimensions of spatial characteristics; γ1–γ4 respectively represent the normalized weights of the spatial characteristics of the corresponding dimensions.
3.4.4. Public Preference Measurement Methods
To capture the online collective perceptual characteristics of the historic district, a Python-based web crawler technology was adopted to collect UGC from mainstream platforms such as Ctrip and Dianping. The dataset included comment texts, ratings, time, and spatial reference information related to the points of interest (POI). After data cleaning and preprocessing (including the removal of duplicate comments, empty comments, advertising comments and abnormally short comments; the standardization of POI information across different platforms; text denoising; synonym merging; Chinese word segmentation; and the retention of sentiment words, negative words and degree adverbs), the ROSTCM6 software was used for text mining and sentiment analysis. The sentiment analysis was carried out based on the HowNet sentiment dictionary to assign a score to each review. Among them, the core emotion words are assigned basic polarity weights (positive words = 1, negative words = −1), among which there are 3730 positive evaluation words and 1254 negative evaluation words. Degree adverbs were classified into five levels based on their semantic intensity and assigned corresponding weights (Table 1) to simulate the subtle differences in sentiment modification in human language.
Table 1.
Classification and assignment of degree adverbs.
Given the contextual complexity inherent to experiences in historic districts, the sentiment dictionary approach cannot fully identify metaphors, irony, and complex semantic expressions. Accordingly, this study primarily employs this method to characterize the overall sentiment tendency of large-scale comments, rather than conducting fine-grained emotion recognition. Regarding the spatial distribution characteristics of public preferences examined in this study, the dictionary approach presents favorable interpretability and computational efficiency. The relevant limitations are further elaborated in Section 5.
Finally, an emotion calculation function was constructed in Python. This function can identify the sentiment words in the comment text and their modification degree and calculate the comprehensive sentiment score of each comment through weighted calculation, thereby converting the unstructured subjective evaluation into continuous emotional values. After applying the function to all comment data, the sentiment public preference scores for each point were obtained, serving as the public preference data of this study (Figure 5).
Figure 5.
Data analysis process of public preferences.
3.4.5. Mediating and Moderating Effects
To explore the interaction relationship among spatial characteristics, perception evaluation and urban vitality, a mediation and moderation analysis framework was constructed. Baron and Kenny [65] proposed a stepwise regression method be used to test the mediating effect, and subsequent method improvements were referred to for model optimization to test whether spatial characteristics (independent variable X) influence urban vitality (dependent variable Y) through visual quality (mediating variable M). The moderating effect was introduced to capture the influence of online public preference (modifying variable W) on the association between “perception evaluation–urban vitality”, enabling the model to reflect the context-dependent mechanism of the individual’s “perception processing—behavioral decision-making” relationship. Meanwhile, this study estimates the direct and indirect effects to identify the intrinsic interaction pathways among “space, perception and vitality”.
The analytical sample size for this statistical model in this study was n = 70, corresponding to 70 basic spatial analysis units. All tests for mediating and moderating effects were performed using the PROCESS macro (Version 4.0) developed by Andrew F. Hayes, The Ohio State University, Columbus, OH, USA. A bias-corrected Bootstrap method was employed to improve statistical power under small-sample conditions, with 5000 resamples specified to calculate 95% confidence intervals (CIs). An effect was deemed statistically significant if its 95% Bootstrap confidence interval did not contain zero.
3.5. Study Framework
This study constructs its variable system and effect pathways based on the IPM theory of environmental psychology. The IPM theory divides the human–environment interaction process into four consecutive stages: environmental input stage → immediate perception stage → prior cognition stage → behavioral decision stage. By integrating this theoretical framework with the specific context of historic districts, this study operationalized each theoretical stage into quantifiable empirical variables and developed an integrated mediating-moderating effect model of “spatial characteristics–dual perception dimensions–urban vitality” (Figure 6).
Figure 6.
Study framework.
Correspondence Between Research Variables and IPM Theory
To ensure consistency between the theoretical framework and empirical research, this study provides explicit operational definitions for each stage of the IPM:
Environmental input stage: Corresponds to the independent variable (X) of this study, namely the multidimensional spatial characteristics of historic districts. Through FA, this study extracted four dimensions of spatial characteristics from the built environment. These represent the objective environmental stimuli that individuals first encounter upon entering the space and serve as the starting point of the entire information processing process.
Immediate perception stage: Corresponds to the mediating variable (M) of this study, namely visual quality. Visual quality refers to individuals’ overall evaluation of spatial quality formed after receiving environmental stimuli through visual senses when observing street space on-site.
Prior cognition stage: Corresponds to the moderating variable (W) of this study, namely public preferences. Public preferences are collective cognitions formed based on online user reviews, representing most people’s expectations and impressions of different spaces in the district prior to their visit. They serve as a valid corresponding variable for the “cognition” stage in IPM theory.
Behavioral decision-making stage: Corresponds to the dependent variable (Y) of this study, namely urban vitality. Urban vitality is the outcome of spatial agglomeration formed after many individuals make behavioral decisions such as visiting, staying, and consuming.
Based on the above correspondence, the hypotheses proposed in this study are as follows:
- (1)
- Various spatial characteristics of historic districts affect urban vitality primarily by influencing individuals’ immediate visual perception;
- (2)
- Public preferences, as prior cognition, moderate the strength of the “visual perception → urban vitality” pathway. Specifically, the effect of visual perception on urban vitality varies across different levels of public preferences.
4. Results
4.1. Vitality Measurement: Urban Vitality Analysis of Zhongshan Road Historic District
This study used Baidu heat map data collected for four consecutive days (including two working days and two rest days) in September 2025 to measure urban vitality. A total of 32 heat slices were extracted and standardized for spatial analysis. This study characterized the population concentration density of the district using the heat values of the Baidu heat map, thereby quantifying the level of urban vitality. Referring to the official legend and color grading standards of the heat map released by Baidu Maps (https://map.baidu.com/), the heat values were divided into 7 heat levels from low to high, and were assigned values 1 to 7 successively, completing the standardized processing of vitality data (Figure 7). The results showed that urban vitality exhibited significant temporal and spatial heterogeneity: the overall pattern presented a bimodal diurnal variation, with peaks occurring during the periods of 12:00–14:00 and 18:00–20:00.
Figure 7.
Distribution of district heat levels. (a) Heat slice. (b) Heat levels distribution.
The results of the spatial distribution indicate that the high-vitality areas continue to cluster around major transportation hubs, commercial centers, educational institutions, and core heritage sites, while the low-vitality areas are mainly distributed in less accessible or functionally single neighborhoods. Compared between weekdays and weekends, the overall spatial distribution pattern remains stable, with only a slight decrease in the proportion of high-vitality areas on weekends, suggesting that the vitality structure of the neighborhoods is relatively consistent under different times.
This study further calculated the arithmetic average of the heat values on weekdays and weekends in the historic district, as well as the four-day comprehensive heat value. Then, the heat values within the block area and its buffer zone (55 m) 49 and the surrounding areas were spatially linked to each block within the study area to obtain the urban vitality distribution. According to the Natural Breaks Classification (NBC), it is divided into 7 levels: the heat value below 2.98 is level 1, the heat value between 2.99 and 3.34 is level 2, the heat value between 3.35 and 3.88 is level 3, the heat value between 3.89 and 4.34 is level 4, and the heat value between 4.35 and 4.79 is level 5. The heat value between 4.80 and 5.24 is level 6, and the heat value between 5.25 and 5.69 is level 7. The heat is mainly concentrated in areas such as point 1 Shenyang Railway Station, point 2 Shenyang Railway Bureau (near the former site of the Fengtian Post and Courier Office, etc., historical buildings), point 3 around Zhongshan Square, point 4.5 Hongta Community, Guiyang Nan District, etc. (Figure 8).
Figure 8.
Distribution of comprehensive heat value of district space.
From the perspective of time distribution characteristics, the vitality values of all levels reached their peak between 12:00 and 16:00. A “noon” and “evening” double peak pattern was observed. Among the 70 sampling points, the average number of sampling points for levels 1–7 during working days (weekdays) from 8:00 to 22:00 was 4.56, 10.25, 9.44, 6.94, 23.44, 13.00, and 2.38, respectively. The number of sampling points with vitality values lower than 3.34 (levels 1–2) was approximately 15. The number of sampling points with vitality values between 3.35 and 4.35 (levels 3–4) was approximately 16. The number of sampling points with vitality values higher than 4.34 (levels 5–7) was approximately 39. For the rest of the days (weekends) from 8:00 to 22:00, the average number of sampling points for levels 1–7 was 5.06, 13.63, 11.38, 5.00, 22.19, 11.19, and 1.56, respectively. The number of sampling points with vitality values lower than 3.34 (levels 1–2) was approximately 19. The number of sampling points with vitality values between 3.35 and 4.35 (levels 3–4) was approximately 16. The number of sampling points with vitality values higher than 4.34 (levels 5–7) was approximately 35. Overall, the number of sampling points with vitality values higher than 4.34 (levels 5–7) on working days (n = 39) was slightly higher than that on rest days (n = 35) (Figure 9).
Figure 9.
(a) The number of points at different levels varies with time on weekdays. (b) The number of points at different levels varies with time on weekends.
From the perspective of spatial distribution characteristics, the district vitality on working days (weekdays) shows significant spatial differentiation: the low-vitality areas (<3.34, 1–2 levels) are concentrated in eighteen business and office-focused blocks such as A2, A4, B5, B7, etc.; the medium-vitality areas (3.35–4.35, 3–4 levels) are distributed in twenty-two blocks such as B1, B2, A3, etc., covering cultural heritages, residential and medical facilities; the high-vitality areas (>4.34, 5–7 levels) are concentrated in twenty-four blocks such as Z1, Z2, Z3, etc., with the core being transportation hubs, historical building clusters and public service facilities (Figure 10a).
Figure 10.
Distribution of urban vitality levels. (a) Vitality distribution on weekdays. (b) Vitality distribution on weekends.
The distribution of low-vitality areas on rest days (weekends) is basically the same as that on working days, still concentrated in blocks D5, D6, D8, D9, E3, F3, and F4; the core of high-vitality areas is concentrated in historical landmark buildings, such as the former site of the Fengtian Police Station and the former branch of the Fengtian Yokohama Shin-Kin Bank, and the vitality of the high-vitality areas on working days is maintained and enhanced on rest days (Figure 10b).
4.2. Dimension Division: Extraction of Spatial Characteristics of Historic District
To systematically quantify the spatial quality of Zhongshan Road Historic District, this study selected 14 environmental factors based on the environmental perception theory (EPT) 66, including Accessibility, Sky Openness, Green View Index, Authenticity, Historic Building Density, Historical Value, Billboard Density, Functional Density, and Functional Mix. All indicators were subjectively scored using the (SD) method; a higher score indicates a stronger positive perception of the corresponding environmental factor among participants. All variables were uniformly measured on a 7-point Likert scale; thus, no dimensional conversion was required in this study.
A total of 50 undergraduate and graduate students majoring in landscape architecture were recruited for the evaluation. They assessed images of 70 sampling points within the study area, with each rater scoring 16 sets of randomly presented street view images. After excluding outlier data, 786 sets of valid evaluation data were obtained. To match individual rating data with spatial analysis units, the arithmetic mean of all valid evaluation scores for each spatial sampling point was calculated to derive composite scores for the 14 SD indicators at each sampling point. All subsequent statistical analyses, including factor analysis and mediation and moderating effect models, were performed based on the aggregated scores of these 70 spatial units (analytical sample size n = 70). The valid rating data with outliers removed were entered into SPSS statistical software for further analysis.
First, prior to conducting FA, all indicators underwent Z-score standardization to eliminate variance differences among variables and ensure comparability across indicators. Second, construct validity tests and factor suitability tests were carried out on the scale data. The results showed that the KMO value was 0.834 (>0.600), and the significance level of Bartlett’s test of sphericity was p < 0.001, indicating that the scale had favorable construct validity and was suitable for factor analysis (Table 2). Third, the common factors were extracted through the principal component analysis method (PCA). Based on the principle that the characteristic values are greater than 1, a total of four main common factors were extracted. The cumulative variance contribution rate (CVC) of these four common factors reached 73.708% (Table 3), which exceeded the conventional threshold of 60%, indicating that they can effectively explain most of the information of the original variables and have high explanatory power and reference value. Finally, the maximum variance method was used for factor rotation, resulting in the rotated component matrix. As shown in the rotated factor loading matrix (Table 4). Each common factor comprises multiple indicators with high factor loadings and shared spatial connotations. Drawing on the indicators with the highest loadings as well as theories related to the spatial quality of historic districts, this study named the four extracted common factors, respectively, as street scale characteristics, historical and cultural characteristics, environmental comfort characteristics, and functional business characteristics. These four spatial characteristics collectively constitute the comprehensive evaluation dimension of the historic district visual quality in this study.
Table 2.
KMO and Bartlett Test.
Table 3.
Principal component eigenvalues and contribution rate.
Table 4.
Rotated factor loading matrix.
Overall, the SD scale constructed in this study exhibits favorable internal consistency reliability (Cronbach’s α = 0.857) and construct validity (KMO = 0.834). The four spatial characteristic dimensions extracted via factor analysis are scientifically valid and reliable and can be applied to subsequent analysis of the association between visual quality and urban vitality.
Based on the principal component score coefficient matrix (Table 5), some indicators exhibit negative coefficients. Such negative coefficients do not indicate a negative effect of the indicators; they merely reflect a negative correlation between the observed variables and their corresponding common factors. That is, a higher score for a given indicator corresponds to a lower composite score of its associated common factor. When interpreting common factors, both the magnitude and the sign (positive or negative direction) of the coefficients should be considered, and a comprehensive analysis should be conducted in conjunction with the spatial attributes and theoretical background corresponding to each indicator. Using the calculation method of Formula 1, the spatial characteristics scores (F1–F4) of the four dimensions are calculated as follows:
F1 = −0.045X1 − 0.102X2 + 0.254X3 + 0.289X4 + 0.328X5 − 0.045X6 + 0.291X7 + 0.214X8 + 0.171X9 − 0.085X10 − 0.044X11 − 0.085X12 − 0.222X13 − 0.112X14
F2 = 0.005X1 − 0.069X2 − 0.262X3 − 0.107X4 − 0.098X5 + 0.354X6 + 0.025X7 + 0.129X8 + 0.018X9 + 0.351X10 − 0.107X11 − 0.055X12 + 0.121X13 + 0.338X14
F3 = 0.038X1 + 0.108X2 + 0.167X3 + 0.013X4 − 0.068X5 − 0.099X6 − 0.154X7 − 0.188X8 − 0.095X9 − 0.026X10 + 0.442X11 + 0.456X12 + 0.370X13 + 0.017X14
F4 = 0.522X1 + 0.575X2 − 0.093X3 + 0.006X4 + 0.000X5 + 0.011X6 − 0.044X7 − 0.017X8 − 0.066X9 + 0.037X10 + 0.027X11 + 0.079X12 + 0.075X13 + 0.012X14
Table 5.
Principal component score coefficient matrix.
To better understand the spatial distribution of the four-dimensional spatial characteristics, this study used the ArcGIS software to visually represent the spatial scores of each dimension of spatial characteristics for the historic district of Shenyang Zhongshan Road (Figure 11).
Figure 11.
Distribution of the scores for the four-dimensional spatial characteristics. (a) Street scale characteristics. (b) Historical and cultural characteristics. (c) Environmental comfort characteristics. (d) Functional business characteristics.
Street scale characteristics: Using Equation (3), the street scale characteristics scores of all sampling points within the study area were calculated. The overall street scale characteristics score of the district was relatively high, mainly in blocks of level 3 and level 5. The overall scale conditions were good. Among them, the high-scoring areas (6–7 levels) were concentrated in blocks C5, C2, C8, C9, C6, C3, D1, F6, F8, and G3, covering areas such as the former site of the Municipal Committee, Lang qin Center, City Square, China Medical University and its affiliated hospital on the south side, and Shenyang Dental Hospital; the low-scoring areas (1–2 levels) were concentrated on the west side of Zhongshan Square (Figure 11a).
Historical and cultural characteristics: Using Equation (4), the historical and cultural characteristics scores for all sampling points within the study area were calculated. The spatial distribution of the historical and cultural characteristics scores for the blocks is uneven, with significant clustering characteristics. The high-scoring areas (6–7 levels) are concentrated in the street clusters on the north side of Zhongshan Road, corresponding to blocks A2, A4, B5, B7, E4, E5, F5, F6, and F8, covering areas such as Shenyang General Machinery and Electronics Building and Vienna International Hotel, Xinrong Building and Suning Plaza, and China Medical University Affiliated Dental Hospital. The low-scoring areas (levels 1–2) are mainly concentrated in the northeastern part of Zhongshan Square (Figure 11b).
Environmental comfort characteristics: Using Equation (5), the environmental comfort characteristic scores for all sampling points within the study area were calculated. The overall environmental comfort characteristic score of the block was relatively low, while the spatial clustering characteristics were obvious. The scores of most blocks were concentrated in the range of 1–5; only a few areas reached levels 6–7, mainly located in blocks C7, C11, D4, E4, E5, F5, F6, F8, and G3, covering areas such as the city square, Liaoning Hotel (the former site of Dahe Hotel), the China Medical University Affiliated Dental Hospital, and Shenyang Dental Hospital (Figure 11c).
Functional business characteristics: Using Equation (6), the functional business characteristics scores for all sampling points within the study area were calculated. The spatial distribution of functional business characteristics in the blocks is uneven, showing significant polarization characteristics. The high-scoring areas (6–7 levels) are concentrated in blocks Z1, B1, B3, B4, B5, B7, C1, C4, B6, B8, C3, D1, F3, F4, F7, G1, G2, and G3, covering historical building clusters such as Shenyang Station, Shenyang Railway Bureau Guesthouse, Xinrong Building and Suning Square, the former site of Fengtai Post Office, urban squares, and Red Tower Community, etc.; the low-scoring areas are mainly at levels 1–3, and there are very few transitional blocks at levels 4–5 (Figure 11d).
4.3. Human Perception: Evaluation of the Visual Quality of Historic District
The four dimensions of spatial characteristics extracted by the FC are: street scale characteristics, historical and cultural characteristics, environmental comfort characteristics, and functional business characteristics. In summary, the evaluation of the spatial quality of a historic district is not determined by a single factor but is the result of the combined effect of multiple factors. To further analyze the spatial quality of a historic district as perceived by the experiencers under the human scale, this study takes visual quality as the result of human perception. According to the FC results in the previous text, formula 2 is used for calculation. The cumulative variance contribution rate of the four-dimensional spatial characteristics after rotation is 73.708%. To ensure that the weights sum up to 1, the weight of each of the four spatial characteristic dimensions was determined by the ratio of its individual variance contribution rate to the cumulative variance contribution rate (Table 3). Specifically, the coefficient of F1 in Equation (7) (0.3193) is derived from the calculation 23.535/73.708. Accordingly, the calculation of visual quality (M) is as follows:
M = 0.3193F1 + 0.2870F2 + 0.2207F3 + 0.1731F4
In order to better understand the spatial distribution of visual quality, a spatial visualization distribution was conducted using ArcGIS 10.8 (Figure 12), which enabled the acquisition of the spatial distribution of the comprehensive score of visual quality. Within the region, the overall distribution of visual quality scores is relatively balanced. The areas with high scores (level 6–7) are mainly concentrated in the east of Zhongshan Square and the street-facing building clusters on the north side of Zhongshan Road. The areas with low scores (level 1–2) are concentrated in the northwest and southeast building complexes of Zhongshan Square.
Figure 12.
Spatial distribution of the comprehensive visual quality score.
The scores of the four-dimensional spatial characteristics are the constituent elements of the overall “visual quality” score. The overall score is the comprehensive representation of the weighted scores of each dimension of spatial characteristics based on their information explanatory power. Both are the corresponding relationship between local characteristics and overall evaluation, and they fully cover all the evaluation information of the visual quality of the block.
4.4. Network Perception: Public Preference of Network Evaluation Measures
The perception of the experiencer is a process formed based on the connection between the experiencer and the spatial environment. Therefore, in addition to the perception generated on-site, the network evaluation, which is a perception formed before the actual activity, will also have an impact on the behavior decisions of the experiencer, and thereby reflect an influence on urban vitality. To quantitatively analyze the public preference of a historic district based on network perception, this study comprehensively adopts the Textual Analysis (TA) and text Sentiment Analysis (SA) methods. First, from platforms such as Ctrip, Dianping, 3158 pieces of multi-dimensional raw data including user ratings and comment texts of all points of interest (POI) within the research scope were crawled. After data cleaning, duplicate comments, advertising comments, invalid comments and abnormally short comments were removed, and a total of 3032 pieces of valid comments were retained for subsequent analysis. Comments from different platforms were uniformly subjected to the same preprocessing workflow, and a unified corpus was constructed after cross-platform matching based on POI names and address information.
Using the ArcGIS platform, the sentiment scores were combined with geographical coordinates for spatial visualization distribution (Figure 13), intuitively revealing the spatial differentiation characteristics of the public preference and sentiment attitudes of the experiencer’s perception in the district on the network.
Figure 13.
Spatial distribution of network evaluation data.
The SA of online review data reveals that public preference shows clear spatial differentiation within the study area: the high-preference areas (4–5 levels) are mainly concentrated in major transportation hubs, the central public spaces where point 5.6 is located, and the sections of historical cultural resources-rich streets where points 2, 3, and 4 are located. Spatial visualization further indicates that public preference exhibits dual characteristics of clustering and linear distribution along the main street corridors, reflecting the dual influences of functional concentration and heritage appeal. The medium-preference areas (3 levels) are mainly concentrated near Shenyang Railway Station at point 1 and near Ou Feng Street at point 10. The low-preference areas (1–2 levels) are mainly concentrated near the historical buildings at point 8 (Figure 14).
Figure 14.
Spatial distribution of public preference levels.
4.5. Space–Perception–Vitality: Mediating and Moderating Effects
This study constructs a “space–perception–vitality” variable system and its interaction pathway: taking the spatial characteristics of the historic district as the stimulus source, the vitality of the district as the outcome, the visual quality evaluation of the experiencer as the mediator, and introducing the public preference evaluation as the moderator to explain the influence pathway of spatial characteristics on vitality (Figure 6).
To investigate the functional relationships among variables, this study employed the PROCESS macro developed by Hayes to test the mediating and moderating effects using the Bootstrap method with 5000 resamples. Compared with the traditional Baron–Kenny stepwise regression approach, the Bootstrap method constructs an empirical sampling distribution through repeated resampling and does not require the assumption of normality, delivering higher statistical power and accuracy under small-sample conditions. The 95% Bootstrap confidence intervals for all core effects did not contain zero, and the overall coefficient of determination (R2) of the model reached 0.42. This indicates that the model constructed in this study explains 42% of the variance in urban vitality. Given that R2 values in comparable studies generally range from 0.3 to 0.5, the proposed model exhibits favorable explanatory power.
Focusing on four spatial characteristics as independent variables (X), namely street scale characteristics (X1), historical and cultural characteristics (X2), environmental comfort characteristics (X3), and functional business characteristics (X4), the visual quality as the mediating variable (M), the vitality of the district space as the dependent variable (Y), and the public preferences as the moderating variable (W), this study analyzes the internal effect pathways of each spatial characteristic on the vitality of district space.
4.5.1. The Mediating Effect of Spatial Characteristics on Visual Quality
The first premise of the mediating effect is that the independent variable has a significant predictive effect on the mediation variable. The test results of the mediating effect of spatial characteristics on visual quality (Table 6) show that the four dimensions of spatial characteristics, namely street scale, historical and cultural, environmental comfort, and functional business, all have a significant positive impact on visual quality (p < 0.01). The specific effects are street scale characteristics (coeff = 0.4168, p < 0.001), historical and cultural characteristics (coeff = 0.4619, p < 0.001), environmental comfort characteristics (coeff = 0.7407, p < 0.01), and functional business characteristics (coeff = 0.6821, p < 0.001). The confidence intervals (LLCI, ULCI) of the coefficients for each dimension do not include 0, further verifying the significance of the effect. In conclusion, the first path of the mediating effect test, spatial characteristics (X) → visual quality (M), is established, and the subsequent pathway test of visual quality (M) → urban vitality (Y) can be conducted.
Table 6.
Summary table of spatial characteristics (X)—mediating or moderating effects of visual quality (M) (Notes: ** p < 0.01, *** p < 0.001).
4.5.2. The Mediating Effect of Spatial Characteristics Mediated by Visual Quality on Urban Vitality
The test results for the mediating effect of spatial characteristics on urban vitality via visual quality (Table 7) indicate that spatial characteristics 1: street scale characteristics: visual quality has a significant effect on urban vitality (coeff = 0.4857, p < 0.001), while street scale characteristics have no significant direct effect on urban vitality (coeff = 0.1729, p = 0.1462). Combined with the significant results of the previous mediating pathway, it indicates that “street scale characteristics (X1) → visual quality (M) → urban vitality (Y)” has a Full Mediating effect.
Table 7.
Summary table of mediating or moderating effects of spatial characteristics–visual quality–urban vitality (Notes: ** p < 0.01, *** p < 0.001).
Spatial characteristics 2: historical and cultural characteristics: visual quality has a significant effect on urban vitality (coeff = 0.3361, p < 0.01), while historical and cultural characteristics have a significant direct effect on urban vitality (p < 0.05); public preference has a significant positive impact on urban vitality (p < 0.01), and its interaction term (Int) with historical and cultural characteristics has a significant negative impact on urban vitality (int = −0.1775, p < 0.05), indicating that public preference has a significant negative Moderated Mediation effect in the pathway “historical and cultural characteristics (X2) → visual quality (M) → urban vitality (Y)”.
Spatial characteristics 3: environmental comfort characteristics: visual quality has a significant effect on urban vitality (coeff = 0.4648, p < 0.001), while environmental comfort characteristics have no significant direct effect on urban vitality (p = 0.8127). Combined with the significant results of the previous mediating pathway, it indicates that “environmental comfort characteristics (X3) → visual quality (M) → urban vitality (Y)” has a Full Mediating effect.
Spatial characteristics 4: functional business characteristics: visual quality has a significant effect on urban vitality (coeff = 0.3857, p < 0.01), while functional business characteristics have no significant direct effect on urban vitality (p = 0.3616). Combined with the significant results of the previous mediating pathway, it indicates that “functional business characteristics (X4) → visual quality (M) → urban vitality (Y)” has a Full Mediating effect.
4.5.3. The Moderating Effect of Public Preference
To further examine the moderating effect of public preferences, the moderating variable public preference (W) and the interaction term (Int) between historical and cultural characteristics and public preferences were incorporated into the model (Table 8). To avoid multicollinearity, the independent variable (historical and cultural characteristics) and the moderating variable (public preferences) were subjected to Z-score standardization prior to constructing the interaction term. The interaction term was defined as the product of the two standardized variables, Int = standardized historical and cultural characteristics × standardized public preferences.
Table 8.
Three groups of levels after mean ± 1 standard deviation calculation (Notes: * p < 0.05).
This study employed Model 14 of Hayes’ PROCESS macro (a moderated mediation model) for the test. This model can simultaneously examine mediating effects and moderating effects, which fully aligns with the theoretical framework of this study. To intuitively demonstrate the gradient variation in the moderating effect, public preferences were divided into three levels—low (W = 2.1418), medium (W = 3.4571), and high (W = 4.7724)—following the widely accepted criterion of “mean ± 1 standard deviation” for moderating variables. The simple slopes and their significance of the effect of historical and cultural characteristics on urban vitality at each level were calculated, respectively.
The pathway of public preferences on the direct driving effect of historical and cultural characteristics on urban vitality has a significant negative moderating effect. Specifically, the higher the level of public preferences, the weaker the direct driving effect of historical and cultural characteristics on urban vitality. To further discuss the Conditional Effect of public preferences, that is, the differences in the level of its moderating effect on urban vitality at different levels of public preference values. Combining the three grouping levels of the moderating variable (public preferences) “mean ± 1 standard deviation” (Table 9) with the moderation effect test results, the conditional effect of public preferences is analyzed in the form of a slope graph (Figure 15).
Table 9.
Slope analysis data table.
Figure 15.
A slope graph of the moderated mediation effect.
When public preference is at a low value (mean W − 1SD = 2.1418), the simple slope of historical and cultural characteristics on urban vitality is significant (Effect = 0.3606, p = 0.0317 < 0.05), and the positive driving effect holds. The slope line steadily rises from 3.3984 to 3.9802, with the maximum increase. The positive driving effect of historical and cultural characteristics on vitality is significant. When public preference is at the median value (mean W = 3.4571), the simple slope is not significant (Effect = 0.1271, p = 0.3279 > 0.05), the Confidence Interval includes 0, and the positive driving effect is not significant. The slope line gradually rises from 3.9439 to 4.1491, with a narrowing increase, and the positive driving effect weakens and is not significant. When public preference is at a high value (mean W + 1SD = 4.7724), the simple slope is negative but not significant (Effect = −0.1063, p = 0.5551 > 0.05), and the Confidence Interval includes 0, and the negative moderating trend does not reach significance. The slope line slightly decreases from 4.4895 to 4.3180, showing a negative trend.
The public preference has a gradient negative moderating effect on the relationship between historical and cultural characteristics and urban vitality: as the level of public preference increases, the positive driving effect of historical and cultural characteristics on urban vitality gradually weakens from “significant” to “non-significant” and eventually shows a negative moderating trend. Therefore, this effect clarifies the Conditional Effect of historical and cultural characteristics on urban vitality: when public preference is low, the direct enhancing effect of historical and cultural characteristics on urban vitality is stronger; while when public preference is high, users pay more attention to the other multi-dimensional experience dimensions of the district, and the direct driving effect of historical and cultural characteristics on urban vitality will be weakened. Currently, the enhancement of vitality is achieved through the mediating transmission pathway of visual quality.
This study found that there exists a composite effect model integrating multiple mediating and moderating effects between the four dimensions of spatial characteristics (X) and visual quality (M), as well as between public preference (W) and urban vitality (Y). To reveal the internal influence mechanism of the multi-dimensional spatial characteristics of Zhongshan Road Historic District on the urban vitality of the district. After analyzing the statistical results, it is shown that “visual quality” is the core mediating variable (M), while the moderating variable (W) “public preference” plays a moderating role on a specific pathway and together with the four dimensions of spatial characteristics (X1-X4) and vitality (Y), constitutes a study framework integrating “mediating and moderating effect model” (Figure 16).
Figure 16.
Mediating and moderating effect model(Notes: * p < 0.05, ** p < 0.01, *** p < 0.001).
5. Discussion
5.1. Perception Serves as the Mediating Relationship Between the Built Environment and Vitality
This study verifies that perception exerts a significant mediating effect on the relationship between the spatial characteristics of historic districts and urban vitality. As the core mediating variable, visual quality indicates that the impact of the built environment on human behavior does not occur directly. Instead, environmental stimuli are first transformed into individuals’ perceptual evaluations, which in turn shape their willingness to use space. This process fully embodies the chain mechanism of environment–perception–behavior and validates the applicability of the classic Information Processing Model (IPM) from environmental psychology in the context of historic districts.
In terms of effect magnitude, environmental comfort characteristics (coeff = 0.4648) and street scale characteristics (coeff = 0.4857) exhibit the strongest mediating effects (Table 7). These two dimensions directly determine pedestrians’ immediate walking experience, including street cleanliness, walking smoothness, and sense of spatial openness. Since vision is the primary channel for acquiring such physical environmental information, their impacts on urban vitality are almost entirely transmitted through visual perception, which aligns with the finding that these two dimensions present full mediating effects.
In contrast, the mediating effects of historical and cultural characteristics (coeff = 0.3361) and functional business characteristics (coeff = 0.3857) are relatively weaker, as their impacts on vitality also involve important non-visual transmission pathways. Historical and cultural characteristics directly attract crowds through the embedded cultural symbolic meanings and collective memories, which corresponds to the significant direct effect identified in this study. Meanwhile, functional business characteristics influence people’s consumption and stay behaviors through actual service provision, including dining, shopping and leisure services, and these effects are not solely transmitted through visual perception.
From a theoretical perspective, street scale, environmental comfort, and functional business characteristics fall into the category of instrumental spatial attributes. Their value can only influence urban vitality after being converted into behavioral intention through human perceptual evaluation, hence presenting full mediating effects. Historical and cultural characteristics, by comparison, are symbolic spatial attributes that inherently carry collective memory and place identity and possess independent destination attractiveness, thus exhibiting both direct and mediating effects. This distinction confirms the essential difference in vitality generation mechanisms between historic districts and ordinary urban areas, and enriches the theoretical connotation of the symbolic attraction effect in historic district research.
Therefore, it is concluded that visual quality is a key mediating variable connecting the spatial characteristics of the built environment and the observed intensity of population aggregation [50,60]. This finding supports and expands the environmental perception theory [66,67]. Through empirical verification, it has been confirmed that the association between the built environment and behavioral outcomes is significantly mediated by perception: the built environment shapes experiencers’ perceptions, which in turn influence the spatial agglomeration of behaviors [68]. Specifically, street scale, environmental comfort, and functional business characteristics show a complete mediating effect (p < 0.05), indicating that these spatial attributes mainly function as “input signals” of perception, rather than direct triggering factors of behavior, which further strengthens the importance of the perception process 68 in explaining the refined differentiation of street scale urban vitality [69,70]. This is consistent with Kevin Lynch’s idea in 1984 that “space can both stimulate certain behaviors and also impose constraints on such behaviors” [71].
In the research on historic districts, an increasing number of studies have focused on tourists’ perception and behavior, using the situational cognitive theory (SC) to explore the generation process of cognition and emotion. Cognition is a key factor in the interaction between individuals and the environment [27,46], while tourists’ perception is a process formed based on the connection between tourists and the destination [29,30]. Wei distinguishes between “cognition” of space and “image” of space, refers to the cognitive result of geographical space, while spatial “cognition” emphasizes the formation process of spatial imagery [68]. Ling et al. explored the changes in tourists’ perception and cognition of various scenic spots in the ancient town through multi-source data analysis and analyzed the characteristics and environmental elements of the space and their impact on tourists’ cognition [72].
From a practical perspective, this study holds significant implications for urban planning. This study demonstrates that the spatial characteristics of a historic district have a significant mediating effect on the impact of visual quality on urban vitality. It provides a new perspective for urban planners and scholars in the study of urban vitality, and in urban construction, attention should be paid to the mediating role of human perception in the vitality mechanism.
5.2. The Different Effects of Historical and Cultural Characteristics
Significant mediating effects were observed for all spatial characteristics in their impacts on urban vitality, whereas only the historical and cultural characteristics exhibited a pattern of coexisting significant moderating and direct effects. There are significant conditional effect differences in the impact of historical and cultural characteristics on urban vitality, and public preference has a significant negative moderating effect on the pathway by which historical and cultural characteristics drive urban vitality.
This finding essentially distinguishes the vitality generation logic of historic districts from that of ordinary urban areas. Unlike other spatial characteristics that function solely through perceptual mediation, historical and cultural characteristics exert both direct and indirect dual impacts on urban vitality. This suggests that their underlying mechanism does not rely entirely on perceptual evaluation; there also exists a meaning-driven behavioral activation pathway. This phenomenon can be explained by the “symbolic attractiveness effect” [73] of the heritage environment: historical and cultural spatial elements carry dual attributes simultaneously. First, the physical spatial attribute, consistent with elements such as street scale and environmental comfort, affects pedestrians’ spatial evaluation and willingness to stay through visual perception, corresponding to the mediating effect pathway. Second, the cultural symbolic attribute: the collective memory, cultural markers and place identity value embedded in historical buildings and heritage sites can act as destination attraction factors independently of on-site perception processes to directly drive visitor arrivals, corresponding to the direct effect pathway verified in this study.
This conclusion echoes and complements similar domestic studies on historic districts. Existing research on Beijing’s Shi Chahai Historic District found that historical attractiveness is the primary driver of daytime vitality in the district [44], but that study only verified the direct correlation without revealing its internal transmission mechanism. This study further clarifies the dual-pathway action mechanism of historical and cultural characteristics, confirming that they can not only indirectly enhance vitality through visual perception but also generate attractiveness directly through cultural symbolic value, thus improving the mechanistic explanation of vitality drivers in historic districts. Meanwhile, research on Shanghai’s historic and cultural districts found that historical functional zoning shapes spatial experience through the evolution of architectural features [74]. From the perception–behavior perspective, this study supplements the micro-process by which historical elements influence vitality, providing a more refined theoretical basis for the practice of balancing conservation and revitalization in historic districts.
Notably, precisely because historical and cultural characteristics possess independent symbolic attraction attributes, their effect intensity is most vulnerable to interference from the public’s prior cognition, which is also the core reason why significant moderating effects appear exclusively in this dimension. With the growing commercialization of districts and the proliferation of online communication, the original historical physical elements may be replaced by more transmissible consumer-oriented cultural symbols, causing the marginal contribution of historical and cultural characteristics to vitality to be diluted by online cognition. This pattern has been further validated in the moderating effect analysis.
5.3. The Moderating Effect of Online Network Public Preferences
This study not only verifies the applicability of environmental perception theory in historic districts but also demonstrates that the theory requires extension through the introduction of prior perception variables when applied to highly complex heritage spaces. One of the most important findings of this study is that public preference has a gradient negative moderating effect on the relationship between historical and cultural characteristics and urban vitality: as the level of public preference increases, the positive driving effect of historical and cultural characteristics on urban vitality gradually weakens from “significant” to “non-significant” (Table 8) and ultimately shows a negative moderating trend. Therefore, this effect clarifies the conditional effect of historical and cultural characteristics on urban vitality: when public preference is low, the direct enhancing effect of historical and cultural characteristics on urban vitality is stronger, while when public preference is high, experiencers pay more attention to the other multi-dimensional experience dimensions of the district, and the direct driving effect of historical and cultural characteristics on urban vitality is weakened. Currently, the enhancement of vitality is achieved through the mediating pathway of visual quality.
From the perspective of cognitive mechanism, this result reflects the competitive relationship between two perception-driven mechanisms in historic spaces: one is the a posteriori perception-driven mechanism, in which people form perceptual judgments and make behavioral decisions through on-site environmental stimuli; the other is the a priori cognition-driven mechanism, in which people form perceptual expectations through online information and make visit decisions based on such expectations [75]. This finding extends the application boundary of the Information Processing Model (IPM) in environmental psychology to the internet era [76]. The cognitive processing in the classic IPM is primarily based on on-site stimuli and individual past experience, whereas this study confirms that public preferences collectively formed online act as a form of socialized prior cognition, which systematically alters individuals’ interpretation of and reaction to on-site spatial stimuli, and in turn moderates the strength of the effect of spatial characteristics on behavioral outcomes.
The practical logic of this moderating effect can be further explained by the Expectation-Disconfirmation Theory [77,78]: individuals form psychological expectations based on external information before being exposed to a space and compare their on-site perception with the expectation baseline during the experience. Ultimately, behavioral decisions are not solely determined by objective spatial attributes but are jointly driven by the discrepancy between expectation and perception. Within the variable system of this study, public preferences, as prior cognition collectively formed online, are essentially the shared expectation baseline for visitors before their arrival [29,30].
When public preferences are at a low level, people hold low psychological expectations of the district, and the on-site historical buildings and cultural atmosphere create a positive experience that exceeds expectations. As a result, the driving effect of historical and cultural characteristics on urban vitality is highly significant. When public preferences are at a high level, people have already established high psychological expectations through online reviews before visiting. The on-site historical and cultural elements have been effectively anticipated and discounted, and their marginal attractiveness declines markedly. At this point, people’s satisfaction and willingness to stay depend more on overall experience quality such as walking comfort and functional diversity, rather than the historical attributes themselves. This conclusion is consistent with findings from similar studies on historical heritage tourism scenarios: in high-profile, highly rated historical destinations, the direct driving effect of objective cultural heritage attributes on behavioral intention is significantly weakened by pre-visit expectations [79,80].
Public preference has a significant negative moderating effect on the relationship between historical and cultural characteristics and urban vitality. This indicates that high levels of public preference lead individuals to form strong psychological expectations prior to spatial experience, thereby weakening the marginal effect of heritage-related spatial characteristics on vitality as an outcome of behavioral decisions [75]. In the current era of highly widespread network information, online reviews reflecting public preference add a new dimension of influence to this process. As a “preliminary perception”, public preference shapes an individual’s expectations and cognition of the space before interaction between the individual and the space occurs [29,30]. This study further documents a similar pattern in the context of historic districts. In the level of high public preference, as a preliminary perception, tourists will thus generate a willingness to visit and make behavioral decisions, generating urban vitality. Therefore, the behavioral decisions resulting from historical and cultural characteristics will decrease, and thus the study results have explanatory power: when online evaluations are more positive and widely spread, people rely more on the “preliminary perception” expectations rather than direct spatial experiences, leading to a decline in the impact of actual historical and cultural characteristics on urban vitality. Conversely, when online preference is low, the influence of physical heritage attributes on actual behavioral decisions is stronger. This indicates that in historic districts, network perception as a “preliminary perception” jointly shapes the spatial decision-making process with on-site experiences [76].
In terms of research contributions, this finding breaks through the unidimensional perceptual framework widely adopted in existing studies on perception and urban vitality. Previous research has mostly treated perception as an immediate on-site overall evaluation, overlooking the preemptive influence of prior cognition on behavioral decision-making in the internet era. For the first time, this study incorporates both on-site visual quality (immediate perception) and online public preferences (prior cognition) into a unified mechanistic model. It confirms that prior cognition attenuates the marginal driving effect of on-site spatial attributes, providing a new analytical perspective for research on urban perception and vitality in the digital age. Meanwhile, this conclusion provides a theoretical foundation for the dimension-specific governance of historic districts. Districts with varying degrees of online popularity differ fundamentally in the core levers for vitality enhancement, and homogeneous renewal strategies should not be applied uniformly.
Current research uses big data analysis to explore the relationship between tourists and space, thereby attracting more attention to academic studies on tourists’ perceptions. Data sources such as Sina Weibo (one of the most important social media platforms in China) [13], drone aerial photography technology, interest point information on Baidu Maps [72], and tourists’ travel notes from various social media [12] effectively fill the gaps in traditional research data, providing new perspectives and methods for urban vitality studies. For instance, Wei et al. analyzed tourists’ spatial cognition of tourist attractions, identifying those tourist spaces frequently mentioned by tourists, thereby reflecting tourists’ spatial cognition of the tourist destination [67].
5.4. Consistency Between Spatial Cluster and Mechanism
To verify the reliability of the econometric model conclusions in Section 4.5 and rule out spurious associations caused by over-modeling, this study conducted spatial autocorrelation analysis using GeoDa software to examine the association patterns among variables from a spatial perspective.
5.4.1. Global Spatial Autocorrelation
This study employs the global Moran’s I index to measure the overall spatial association pattern between four types of spatial characteristics (X1–X4) and urban vitality (Y) within the historic district. The interpretation criteria for global Moran’s I are specified as follows: when Moran’s I > 0, positive spatial autocorrelation exists between variables, indicating that attribute values present a clustered spatial distribution where high values tend to neighbor high values and low values tend to neighbor low values. When p < 0.05, the spatial pattern is statistically significant rather than generated by random processes.
The results demonstrate that all four dimensions of spatial characteristics in the district exhibit significant positive spatial autocorrelation with urban vitality (Moran’s I > 0, p < 0.05) (Figure 17). This suggests that both spatial quality and urban vitality feature pronounced spatial agglomeration effects, forming a pattern of high-value clustering and low-value clustering instead of random distribution. This spatial pattern offers consistent corroboration at the spatial dimension for the mediating model conclusion that spatial characteristics exert significant effects on urban vitality and preliminarily eliminates the possibility of spurious correlation.
Figure 17.
Global Moran Index (a) Street scale characteristics (b) Historical and cultural characteristics; (c) Environmental comfort characteristics (d) Functional business characteristics.
5.4.2. Local Spatial Autocorrelation
To further identify specific spatial agglomeration areas, bivariate Local Moran’s I and LISA (Local Indicators of Spatial Association) cluster maps were applied for analysis, which can intuitively present the spatial association patterns between each sampling point and its surrounding sampling points.
As indicated by the Local Moran’s I test results (Figure 18), the bivariate Moran’s I values for the four spatial characteristics (street scale, historical and cultural, environmental comfort, and functional business) with urban vitality were 0.115, 0.025, 0.068, and 0.270, respectively. All indices were positive and passed the significance test, which aligned with the findings of the global analysis.
Figure 18.
Local Moran index. (a) Street-scale characteristics. (b) Historical and cultural characteristics. (c) Environmental comfort characteristics. (d) Functional business characteristics. Notes: The circles represent sample points, and the regression line indicates the overall trend of spatial autocorrelation.
As shown in the spatial agglomeration distribution map (Figure 19), the study area is dominated by high–high (HH) clustering and low–low (LL) clustering patterns. High–high clusters are concentrated around the transportation hub of Shenyang Station, the core area of Zhongshan Square, and the historic building cluster along the middle section of Zhongshan Road. These areas boast well-designed street scales, rich historical and cultural endowments, and mixed commercial functions, serving as dual cores of both spatial quality and urban vitality. LL agglomeration zones are mainly located in the northwestern part and eastern peripheral road segments of the study area. Characterized by single functions and poor walkability, these areas show low levels of both spatial quality and urban vitality.
Figure 19.
Spatial Agglomeration distribution. (a) Street-scale characteristics. (b) Historical and cultural characteristics. (c) Environmental comfort characteristics. (d) Functional business characteristics.
A small number of spatial outlier units are scattered on the periphery of the core area, and the overall agglomeration pattern is highly consistent with the conclusions derived from the mediating and moderating model.
The above spatial agglomeration features and the effect pathways identified by the econometric model provide robust mutual validation. From the perspective of spatial statistics, this finding verifies the spatial authenticity of the “spatial characteristics–dual perception dimensions–urban vitality” mechanism proposed in this study, rules out the possibility that the model results stem from random spatial distribution, and further strengthens the validity of the research conclusions.
5.5. Research Limitations
This study still has several limitations that need to be addressed in future research.
First, the sampling scope is limited. This research focuses exclusively on the Zhongshan Road Historic District in Shenyang, with a total of 70 sampling points. Although this sample size is reasonable for empirical studies on historic district vitality at the same scale, all statistical results are robust and have been cross-validated through spatial autocorrelation analysis. Further expansion of the sample size is required if the research conclusions are to be generalized to larger urban areas and other types of historic districts.
Second, the time span of urban vitality data is relatively narrow. Only four days of Baidu heatmap data in September 2025 were collected in this study. The dataset covers typical time periods on both weekdays and weekends and can reflect basic daily and weekly variations in district vitality. Nevertheless, it fails to capture seasonal fluctuations, holiday effects, and long-term annual dynamics. Future studies may extend the data collection period to include all four seasons and major festivals, so as to more comprehensively unpack the spatio-temporal evolution mechanism of vitality in historic districts.
Third, regarding the measurement of urban vitality, this study adopts Baidu heat map data. While it can reflect the overall spatial agglomeration of crowds, it cannot capture individual behavioral decision-making processes, such as standing stay time, movement paths and consumption behaviors. Future research can combine GPS tracking, Bluetooth positioning and field investigations to acquire refined individual behavioral data, so as to deepen the understanding of the transformation mechanism between perception and behavior.
6. Conclusions
This study takes the Zhongshan Road Historic District in Shenyang as a case study and, based on the information processing model in environmental psychology, constructs a research framework of “Spatial characteristics–dual-perception dimension evaluation–Urban vitality.” It systematically examines the perceptual mediation pathways and moderating effects through which the built environment of historic districts influences urban vitality. In response to the three core research questions raised in the introduction, the main conclusions are as follows:
First, spatial characteristics in historic districts exert a significant and widely observed perceptual mediation effect on urban vitality. Visual quality serves as a key mediating variable linking the objective built environment with behavioral outcomes of users. The three categories of spatial characteristics—street-scale attributes, environmental comfort, and functional land-use mix—all exhibit full mediation effects on urban vitality. This indicates that these spatial attributes do not directly drive vitality; instead, they influence people’s visitation and stay behaviors by shaping their visual perceptual evaluations. This finding confirms that human-centered perception is an indispensable core mechanism in the formation of vitality in historic districts.
Second, different dimensions of spatial characteristics exhibit fundamentally different pathways in influencing urban vitality. In addition to the mediation effect, only historical and cultural characteristics demonstrate a significant direct effect, suggesting a dual-path mechanism: on the one hand, they exert indirect influence through visual perception; on the other hand, they directly attract users through cultural symbolism, collective memory, and place identity, forming a distinctive “symbolic attraction effect.” This difference highlights the fundamental distinction between historic districts and ordinary urban areas in vitality-generation mechanisms, emphasizing the irreplaceable value of historical and cultural resources in urban regeneration.
Third, public preferences exert a gradient negative moderating effect on the relationship between historical and cultural characteristics and urban vitality, indicating that the effects of spatial characteristics are context-dependent. Results show that when public preference is low, the positive effect of historical and cultural characteristics on urban vitality is significant (Effect = 0.3606, p < 0.05). When public preference reaches a medium level, this effect weakens and becomes statistically insignificant. When public preference is high, the direct effect further shifts toward a negative trend (Effect = −0.1063). This indicates that the influence of spatial characteristics is not fixed but varies significantly depending on prior cognition.
The contribution of this study lies in breaking through the limitation of single-dimension perception in existing research. It is the first to integrate “on-site visual quality (instant perception)” and “online public preferences (prior cognition)” into a unified framework, thereby deepening the understanding of the internal mechanisms underlying the formation of vitality in historic districts.
Based on these findings, this study offers three practical implications for the conservation and revitalization of historic districts:
(1) Establish a “perception-first” regeneration strategy: In spatial renovation, priority should be given to improving environmental comfort and street-scale characteristics that most strongly affect visual quality. Measures such as enhancing walkability, improving cleanliness, and optimizing spatial proportions should be adopted to strengthen overall attractiveness.
(2) Implement a tiered strategy for activating historical and cultural resources: In areas with low online visibility and low public preference, efforts should focus on highlighting and disseminating historical and cultural characteristics to strengthen their direct attractiveness. In areas with higher online visibility and stronger public preference, emphasis should be placed on improving overall visual quality and diversified functional experiences to meet higher user expectations.
(3) Establish an integrated “online–offline” vitality management system: Greater attention should be paid to the moderating role of public preferences. Online review data should be incorporated into routine monitoring and planning decision-making to track changes in public perception in real time and achieve coordinated optimization of physical space and online reputation management.
Nevertheless, this study still has certain limitations that need to be further addressed in future research. First, this study takes only the Zhongshan Road Historic District in Shenyang as a single case, and the sample scope has geographical limitations. Future research can expand the coverage of cases to verify the generalizability of the conclusions of this study across historic districts with different cultural backgrounds and scales. Second, the vitality data in this study only covers a short period in autumn and fails to capture the impacts of seasonal fluctuations and holiday effects. Future studies can extend the time span of data to reveal the long-term evolution pattern of vitality in historic districts. Third, this study adopts Baidu heat map data to represent urban vitality, which cannot distinguish the behavior types and length of stay of the population. Subsequent research can combine field tracking and multi-source behavioral data to conduct a more fine-grained analysis of the micro-mechanism through which perception is transformed into behavior.
Author Contributions
Conceptualization, R.M., Y.D., Z.L. and Q.W.; Methodology, R.M. and Z.L.; Software, R.M.; Validation, R.M.; Formal analysis, R.M. and Z.L.; Investigation, R.M.; Data curation, Z.L.; Writing—original draft, R.M.; Writing—review and editing, R.M. and Q.W.; Visualization, R.M.; Supervision, Y.D., Z.L. and Q.W.; Project administration, Y.D. and Q.W.; Funding acquisition, Y.D. and Q.W. All authors have read and agreed to the published version of the manuscript.
Funding
This research was funded by the Soft Science Research Project of the Department of Housing and Urban-Rural Development of Liaoning Province (No. LNSJSKJ-2025-036), the Decision-making Consultation and New Think Tank Commissioned Research Project of Liaoning Province, and the Platform Construction Project of the Education Department of Liaoning Province (No. LJ232410153071).
Institutional Review Board Statement
Not applicable.
Informed Consent Statement
Not applicable.
Data Availability Statement
The data presented in this study were self-collected and available on request from the corresponding author.
Conflicts of Interest
The authors declare no conflicts of interest.
References
- Wu, C.; Li, G.; Li, Y.; Pu, Y.; Zhang, Y. A Review of Research on Strategies and Methods for the Revitalization of Urban Historic Districts. IOP Conf. Ser. Earth Environ. Sci. 2022, 1101, 052021. [Google Scholar] [CrossRef] [Scilit]
- Chen, D. Examining Urban Design Strategies in Historic Districts: A Systematic Literature Review. Proc. Inst. Civ. Eng. Urban Des. Plan. 2024, 177, 232–239. [Google Scholar] [CrossRef] [Scilit]
- Chen, B. Revitalization Strategy in Conservation and Renewal of Historical and Cultural Districts: A Case Study of Shangxiahang in Fuzhou City. J. Landsc. Res. 2021. [Google Scholar] [CrossRef]
- Mouratidis, K.; Poortinga, W. Built Environment, Urban Vitality and Social Cohesion: Do Vibrant Neighborhoods Foster Strong Communities? Landsc. Urban Plan. 2020, 204, 103951. [Google Scholar] [CrossRef] [Scilit]
- Li, M.; Liu, J.; Lin, Y.; Xiao, L.; Zhou, J. Revitalizing Historic Districts: Identifying Built Environment Predictors for Street Vibrancy Based on Urban Sensor Data. Cities 2021, 117, 103305. [Google Scholar] [CrossRef] [Scilit]
- Xianning, D.U.; Di, W.A.N.G.; Ran, X.I.A.O. Inheritance of Historical Block Context Based on the Theory of Place Spirit: A Case Study of Nanjing Confucius Temple Historic Block. J. Landsc. Res. 2022, 14, 85. [Google Scholar] [CrossRef]
- Zhang, Y.; Han, Y. Vitality Evaluation of Historical and Cultural Districts Based on the Values Dimension: Districts in Beijing City, China. npj Herit. Sci. 2022, 10, 137. [Google Scholar] [CrossRef] [Scilit]
- Ogawa, Y.; Oki, T.; Zhao, C.; Sekimoto, Y.; Shimizu, C. Evaluating the Subjective Perceptions of Streetscapes Using Street-View Images. Landsc. Urban Plan. 2024, 247, 105073. [Google Scholar] [CrossRef] [Scilit]
- Guo, Z.; Luo, K.; Yan, Z.; Hu, A.; Wang, C.; Mao, Y.; Niu, S. Assessment of the Street Space Quality in the Metro Station Areas at Different Spatial Scales and Its Impact on the Urban Vitality. Front. Archit. Res. 2024, 13, 1270–1287. [Google Scholar] [CrossRef] [Scilit]
- Long, Y.; Jiao, S.; Yu, Y.; Xiao, K. An Analysis of Spatial Vitality Distribution and Formation Mechanisms in Historical Urban Areas Based on Multi-source Big Data: A Case Study of Changsha. Front. Archit. Res. 2025, 14, 1727–1749. [Google Scholar] [CrossRef] [Scilit]
- Han, Y.; Qin, C.; Xiao, L.; Ye, Y. The Nonlinear Relationships between Built Environment Features and Urban Street Vitality: A Data-Driven Exploration. Environ. Plan. B Urban Anal. City Sci. 2024, 51, 195–215. [Google Scholar] [CrossRef] [Scilit]
- Sulis, P.; Manley, E.; Zhong, C.; Batty, M. Using Mobility Data as Proxy for Measuring Urban Vitality. J. Spat. Inf. Sci. 2018, 16, 137–162. [Google Scholar] [CrossRef] [Scilit]
- Fu, X.; Yu, G.; Liu, Z. Spatial–Temporal Convolutional Model for Urban Crowd Density Prediction Based on Mobile-Phone Signaling Data. IEEE Trans. Intell. Transp. Syst. 2022, 23, 14661–14673. [Google Scholar] [CrossRef] [Scilit]
- Zheng, G.; Ding, L.; Zheng, J. A Multi-Dimensional Evaluation of Street Vitality in a Historic Neighborhood Using Multi-Source Geo-Data: A Case Study of Shuitingmen, Quzhou. ISPRS Int. J. Geo-Inf. 2025, 14, 240. [Google Scholar] [CrossRef] [Scilit]
- Zhuang, T.; Qian, Q.K.; Visscher, H.J.; Elsinga, M.G.; Wu, W. The Role of Stakeholders and Their Participation Network in Decision-Making of Urban Renewal in China: The Case of Chongqing. Cities 2019, 92, 47–58. [Google Scholar] [CrossRef] [Scilit]
- Hu, C.; Gong, C. Creating an Ecological Historic District: Rethinking a Chinese Challenge Through the Case of Oakland District, Pittsburgh. Procedia Eng. 2016, 145, 1572–1579. [Google Scholar] [CrossRef] [Scilit]
- Yu, B.; Sun, J.; Wang, Z.; Jin, S. Influencing Factors of Street Vitality in Historic Districts Based on Multisource Data: Evidence from China. ISPRS Int. J. Geo-Inf. 2024, 13, 277. [Google Scholar] [CrossRef] [Scilit]
- Han, C.; Zhang, Z. Nonlinear Effects of Built Environment Perception and Objective Features on Street Vitality in Historic Districts. Front. Archit. Res. 2026, 15, 1075–1091. [Google Scholar] [CrossRef] [Scilit]
- Accordino, J.; Adhikari, S. Balancing Act: Preserving Historic Fabric and Enhancing Economic Vitality in Towns in the Metropolitan Periphery. Plan. Pract. Res. 2022, 37, 95–110. [Google Scholar] [CrossRef] [Scilit]
- Zhao, Y.; Liu, J.; Zheng, Y. Preservation and Renewal: A Study on Visual Evaluation of Urban Historical and Cultural Street Landscape in Quanzhou. Sustainability 2022, 14, 8775. [Google Scholar] [CrossRef] [Scilit]
- Lyu, Y.; Abd Malek, M.I.; Jaafar, N.H.; Sima, Y.; Han, Z.; Liu, Z. Unveiling the Potential of Space Syntax Approach for Revitalizing Historic Urban Areas: A Case Study of Yushan Historic District, China. Front. Archit. Res. 2023, 12, 1144–1156. [Google Scholar] [CrossRef] [Scilit]
- Hart, R.A.; Moore, G.T. The Development of Spatial Cognition: A Review. In Image and Environment: Cognitive Mapping and Spatial Behavior; Downs, R.M., Stea, D., Eds.; Aldine Publishing Company: Chicago, IL, USA, 1973; pp. 246–288. [Google Scholar]
- Hillier, B.; Penn, A.; Hanson, J.; Grajewski, T.; Xu, J. Natural Movement: Or, Configuration and Attraction in Urban Pedestrian Movement. Environ. Plan. B Urban Anal. City Sci. 1993, 20, 29–66. [Google Scholar] [CrossRef] [Scilit]
- Simon, H.A. Information Processing Models of Cognition. Annu. Rev. Psychol. 1979, 32, 363–396. [Google Scholar] [CrossRef] [Scilit]
- Simon, H.A. Information-Processing Models of Cognition: Related discussion in information science context. J. Am. Soc. Inf. Sci. 1981, 32, 364–377. [Google Scholar] [CrossRef] [Scilit]
- Bettman, J.R. Information Processing Models of Consumer Behavior. J. Mark. Res. 1970, 7, 370–376. [Google Scholar] [CrossRef] [Scilit]
- Li, M.; Ding, R.; Zhang, Y.; Liu, W.; He, H.; Liu, H. From Cognitive Sciences to Learning Sciences: The Past, the Present and the Future. Tsinghua J. Educ. 2018, 39, 29–39. [Google Scholar] [CrossRef]
- Huang, D.; Gong, W.; Wang, X.; Liu, S.; Zhang, J.; Li, Y. A Cognition–Affect–Behavior Framework for Assessing Street Space Quality in Historic Cultural Districts and Its Impact on Tourist Experience. Buildings 2025, 15, 2739. [Google Scholar] [CrossRef] [Scilit]
- Rasoolimanesh, S.M.; Seyfi, S.; Hall, C.M.; Hatamifar, P. Understanding Memorable Tourism Experiences and Behavioural Intentions of Heritage Tourists. J. Destin. Mark. Manag. 2021, 21, 100621. [Google Scholar] [CrossRef] [Scilit]
- Shi, D.; Zhang, B.; Yi, B. How Is Tourist Destination Performed? Exploratory Research Based on Text Mining. Tour. Trib. 2022, 37, 68–82. [Google Scholar] [CrossRef]
- Zeng, C.; Song, Y.; He, Q.; Shen, F. Spatially Explicit Assessment on Urban Vitality: Case Studies in Chicago and Wuhan. Sustain. Cities Soc. 2018, 40, 296–306. [Google Scholar] [CrossRef] [Scilit]
- Jacobs, J. The Death and Life of Great American Cities; Vintage: New York, NY, USA, 1992. [Google Scholar]
- Chen, X.; Lee, G.; Joo, D. Natural Landscape Performance: Environmental Restorativeness and Its Influence on Tourist Behavior. Int. J. Tour. Res. 2024, 26, e2636. [Google Scholar] [CrossRef] [Scilit]
- Sung, H.G.; Go, D.H.; Choi, C.G. Evidence of Jacobs’s Street Life in the Great Seoul City: Identifying the Association of Physical Environment with Walking Activity on Streets. Cities 2013, 35, 164–173. [Google Scholar] [CrossRef] [Scilit]
- Hui, E.C.M.; Chen, T.; Lang, W.; Ou, Y. Urban Community Regeneration and Community Vitality Revitalization through Participatory Planning in China. Cities 2021, 110, 103072. [Google Scholar] [CrossRef] [Scilit]
- Gülden Demet, O.R.U.Ç.; Giritlioğlu, C. The Evaluation of Urban Quality and Vitality of the Istanbul Historical Peninsula-Eminönü District. Evaluation 2008, 5, 97–117. [Google Scholar]
- Xiao, L.; Lo, S.; Liu, J.; Zhou, J.; Li, Q. Nonlinear and Synergistic Effects of TOD on Urban Vibrancy: Applying Local Explanations for Gradient Boosting Decision Tree. Sustain. Cities Soc. 2021, 72, 103063. [Google Scholar] [CrossRef] [Scilit]
- Szeto, W.Y.; Yang, L.; Wong, R.C.P.; Li, Y.C.; Wong, S.C. Spatio-temporal Travel Characteristics of the Elderly in an Ageing Society. Travel Behav. Soc. 2017, 9, 10–20. [Google Scholar] [CrossRef] [Scilit]
- Yue, Y.; Zhuang, Y.; Yeh, A.G.; Xie, J.Y.; Ma, C.L.; Li, Q.Q. Measurements of POI-based Mixed Use and Their Relationships with Neighbourhood Vibrancy. Int. J. Geogr. Inf. Sci. 2017, 31, 658–675. [Google Scholar] [CrossRef] [Scilit]
- Delclòs-Alió, X.; Gutiérrez, A.; Miralles-Guasch, C. The Urban Vitality Conditions of Jane Jacobs in Barcelona: Residential and Smartphone-Based Tracking Measurements of the Built Environment in a Mediterranean Metropolis. Cities 2019, 86, 220–228. [Google Scholar] [CrossRef] [Scilit]
- Mao, W.; Zhong, Y. Spatial Pattern and Influencing Factors of Urban Vitality in the Middle Reaches of the Yangtze River. World Reg. Stud. 2020, 29, 86. [Google Scholar]
- Katz, P. The New Urbanism: Toward an Architecture of Community; McGraw-Hill: New York, NY, USA, 1994. [Google Scholar]
- Montgomery, J. Making a City: Urbanity, Vitality and Urban Design. J. Urban Des. 1998, 3, 93–116. [Google Scholar] [CrossRef] [Scilit]
- Zhang, A.; Li, W.; Wu, J.; Lin, J.; Chu, J.; Xia, C. How Can the Urban Landscape Affect Urban Vitality at the Street Block Level? A Case Study of 15 Metropolises in China. Environ. Plan. B Urban Anal. City Sci. 2021, 48, 1245–1262. [Google Scholar] [CrossRef] [Scilit]
- Gao, W. Impact of Physical Features on Visual Walkability Perception in Urban Commercial Streets by Using Street-View Images and Deep Learning. Buildings 2025, 15, 113. [Google Scholar] [CrossRef] [Scilit]
- Ma, Z. Deep Exploration of Street View Features for Identifying Urban Vitality: A Case Study of Qingdao City. Int. J. Appl. Earth Obs. Geoinf. 2023, 123, 103476. [Google Scholar] [CrossRef] [Scilit]
- Chan, S.H.G.; Lee, W.H.H.; Tang, B.M.; Chen, Z. Legacy of Culture Heritage Building Revitalization: Place Attachment and Culture Identity. Front. Psychol. 2024, 14, 1314223. [Google Scholar] [CrossRef] [Scilit] [PubMed]
- Kovács, Z.; Vida, G.; Elekes, Á.; Kovalcsik, T. Combining Social Media and Mobile Positioning Data in the Analysis of Tourist Flows: A Case Study from Szeged, Hungary. Sustainability 2021, 13, 2926. [Google Scholar] [CrossRef] [Scilit]
- Long, Y.; Zhou, Y. Quantitative Evaluation on Street Vibrancy and Its Impact Factors: A Case Study of Chengdu. New Archit. 2016, 1, 52–57. [Google Scholar]
- Li, X.; Wang, C. Understanding the Relationship between Tourists’ Perceptions of the Authenticity of Traditional Village Cultural Landscapes and Behavioural Intentions, Mediated by Memorable Tourism Experiences and Place Attachment. Asia Pac. J. Tour. Res. 2023, 28, 254–273. [Google Scholar] [CrossRef] [Scilit]
- Li, Q.; Cui, C.; Liu, F.; Wu, Q.; Run, Y.; Han, Z. Multidimensional Urban Vitality on Streets: Spatial Patterns and Influence Factor Identification Using Multisource Urban Data. ISPRS Int. J. Geo-Inf. 2021, 11, 2. [Google Scholar] [CrossRef] [Scilit]
- Chen, M.; Cai, Y.; Guo, S.; Sun, R.; Song, Y.; Shen, X. Evaluating Implied Urban Nature Vitality in San Francisco: An Interdisciplinary Approach Combining Census Data, Street View Images, and Social Media Analysis. Urban For. Urban Green. 2024, 95, 128289. [Google Scholar] [CrossRef] [Scilit]
- Liang, C.; Sensen, C.; Wenwen, Z. Use of Tencent Street View Imagery for Visual Perception of Streets. ISPRS Int. J. Geo-Inf. 2017, 6, 265. [Google Scholar] [CrossRef] [Scilit]
- Ye, Y.; Richards, D.; Lu, Y. Measuring Daily Accessed Street Greenery: A Human-Scale Approach for Informing Better Urban Planning Practices. Landsc. Urban Plan. 2019, 191, 13. [Google Scholar] [CrossRef] [Scilit]
- Zhu, X.; Bai, M.; Bai, Y. Evaluation of Street Space Renovation in Historic Areas Using Deep Learning Based on Street View Imagery in the Human Visual Field. China City Plan. Rev. 2024, 33, 51. [Google Scholar] [CrossRef]
- Galea, S.; Vlahov, D. Urban Health: Evidence, Challenges, and Directions. Annu. Rev. Public Health 2005, 26, 341–365. [Google Scholar] [CrossRef] [Scilit] [PubMed]
- Kada, L.W.Z.H. Cross-Platform Complementarity: Assessing the Data Quality and Availability of Google Street View and Baidu Street View. Sage Publ. 2024, 4, 22–47. [Google Scholar] [CrossRef] [Scilit]
- Ma, S.; Wang, B.; Liu, W.; Zhou, H.; Wang, Y.; Li, S. Assessment of Street Space Quality and Subjective Well-Being Mismatch and Its Impact Using Multi-Source Big Data. Cities 2024, 147, 104797. [Google Scholar] [CrossRef] [Scilit]
- Wu, Y.; Liu, Q.; Hang, T. Integrating Restorative Perception into Urban Street Planning: A Framework Using Street View Images, Deep Learning, and Space Syntax. Cities 2024, 147, 104791. [Google Scholar] [CrossRef] [Scilit]
- Li, N.; Meng, F.; Martin, D. The Influence of Travel Photo Editing on Tourists’ Experiences. Tour. Manag. 2023, 98, 104762. [Google Scholar] [CrossRef] [Scilit]
- Beibei, Z.; Omar, A. A Study on the Rural Tourscape and Immersion Experience of Customers Based on UGC Metadata. Glob. Bus. Manag. Res. 2024, 16, 1147–1169. [Google Scholar]
- Cuomo, M.T.; Tortora, D.; Foroudi, P.; Giordano, A.; Festa, G.; Metallo, G. Digital Transformation and Tourist Experience Co-Design: Big Social Data for Planning Cultural Tourism. Technol. Forecast. Soc. Change 2021, 162, 120345. [Google Scholar] [CrossRef] [Scilit]
- Dong, Q.; Cai, J.; Chen, S.; He, P.; Chen, X. Spatiotemporal Analysis of Urban Green Spatial Vitality and the Corresponding Influencing Factors: A Case Study of Chengdu, China. Land 2022, 11, 1820. [Google Scholar] [CrossRef] [Scilit]
- Landis, J.R.; Koch, G.G. The Measurement of Observer Agreement for Categorical Data. Biometrics 1977, 33, 159–174. [Google Scholar] [CrossRef] [Scilit]
- Baron, R.M.; Kenny, D.A. The moderator–mediator variable distinction in social psychological research: Conceptual, strategic, and statistical considerations. J. Pers. Soc. Psychol. 1986, 51, 1173–1182. [Google Scholar] [CrossRef] [PubMed]
- Meng, Y.; Deng, S.; Li, Y. Tourism Image Research of Yuelu Mountain Scenic Spot Based on Cognitive Map. Areal Res. Dev. 2018, 37, 118–122. [Google Scholar]
- Park, E.; Lee, H.; Chen, J.L. Tourist Behaviour Centred on Place Attachment: The Effect of Tourist Involvement on Place Attachment and Loyalty. J. Travel Tour. Mark. 2011, 28, 775–791. [Google Scholar]
- Wei, T.; Ren, J. Progress in Domestic Research on Spatial Cognition in Human Geography. J. South China Norm. Univ. Nat. Sci. Ed. 2020, 52, 1–10. [Google Scholar] [CrossRef]
- UNESCO. Recommendation on the Historic Urban Landscape; UNESCO: Paris, France, 2011. [Google Scholar]
- UNESCO. Urban Heritage for Resilience: Consolidated Results of the Implementation of the 2011 Recommendation on the Historic Urban Landscape; UNESCO: Paris, France, 2023. [Google Scholar]
- Lynch, K. Good City Form; MIT Press: Cambridge, UK, 1984. [Google Scholar]
- Wang, L.; Ding, J.; Chen, M.; Sun, Y.; Tang, X.; Ge, M. Exploring Tourists’ Multilevel Spatial Cognition of Historical Town Based on Multi-Source Data—A Case Study of Feng Jing Ancient Town in Shanghai. Buildings 2022, 12, 1833. [Google Scholar] [CrossRef] [Scilit]
- Zhang, Y.; Yang, C.; Jia, Z. The Enlightenment of “Historical Dynamics” to the Space Restoration of Historical Blocks. Archit. J. Suppl. 2018, 1, 161–167. [Google Scholar]
- Sheng, H.; Li, S. Functional Zoning and Architectural Color Differentiation in Shanghai Historic and Cultural Conservation Area from Dual Spatial and Temporal Perspectives. Geomat. Inf. Sci. Wuhan Univ. 2026, 51, 99–113. [Google Scholar] [CrossRef]
- Penning-Rowsell, E.C. A Public Preference Evaluation of Landscape Quality. Reg. Stud. 1982, 16, 97–112. [Google Scholar] [CrossRef] [Scilit]
- Ling, Z.; Zheng, X.; Chen, Y.; Qian, Q.; Zheng, Z.; Meng, X.; Shi, X. The Nonlinear Relationship and Synergistic Effects between Built Environment and Urban Vitality at the Neighborhood Scale. Remote Sens. 2024, 16, 2826. [Google Scholar] [CrossRef] [Scilit]
- Oliver, R.L. A Cognitive Model of the Antecedents and Consequences of Satisfaction Decisions. J. Mark. Res. 1980, 17, 460–469. [Google Scholar] [CrossRef] [Scilit]
- Churchill, G.A.; Surprenant, C. An Investigation into the Determinants of Customer Satisfaction. J. Mark. Res. 1982, 19, 491–504. [Google Scholar] [CrossRef] [Scilit]
- Yuan, L.; Marzuki, A. What Keeps Historical Theme Park Visitors Coming? Research Based on Expectation Confirmation Theory. Front. Psychol. 2024, 15, 1293638. [Google Scholar] [CrossRef] [Scilit] [PubMed]
- Minh, H.N.; Rahman, S.; Thi, T.C. The Effect of Tourist Expectations and Tourist Experiences on Tourist Satisfaction with Heritage Attributes: A Case Study of Hội An, Vietnam. Plan. Malays. J. 2023, 21, 1337. [Google Scholar] [CrossRef] [Scilit]
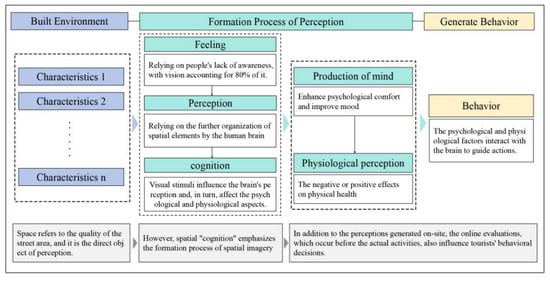
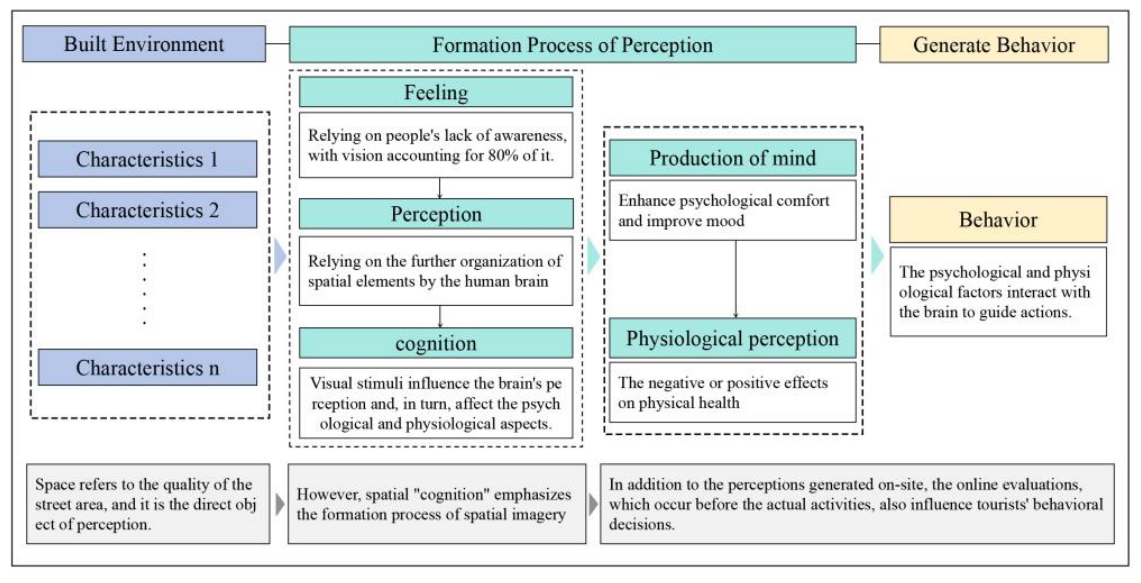
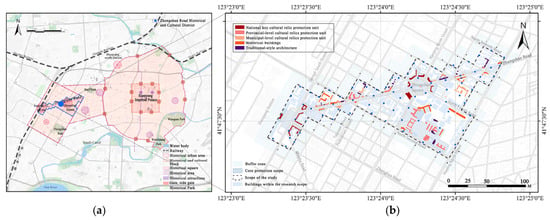
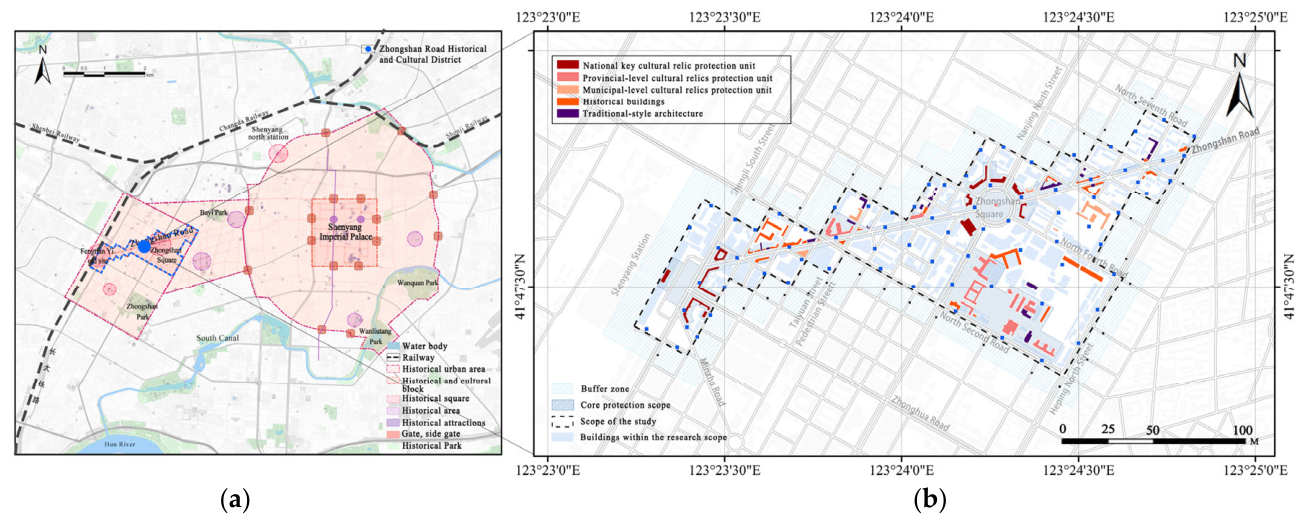
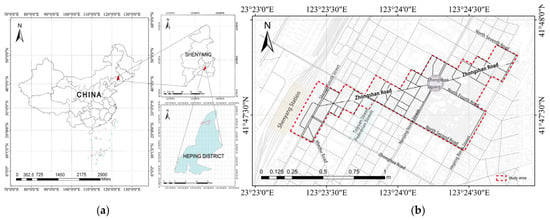
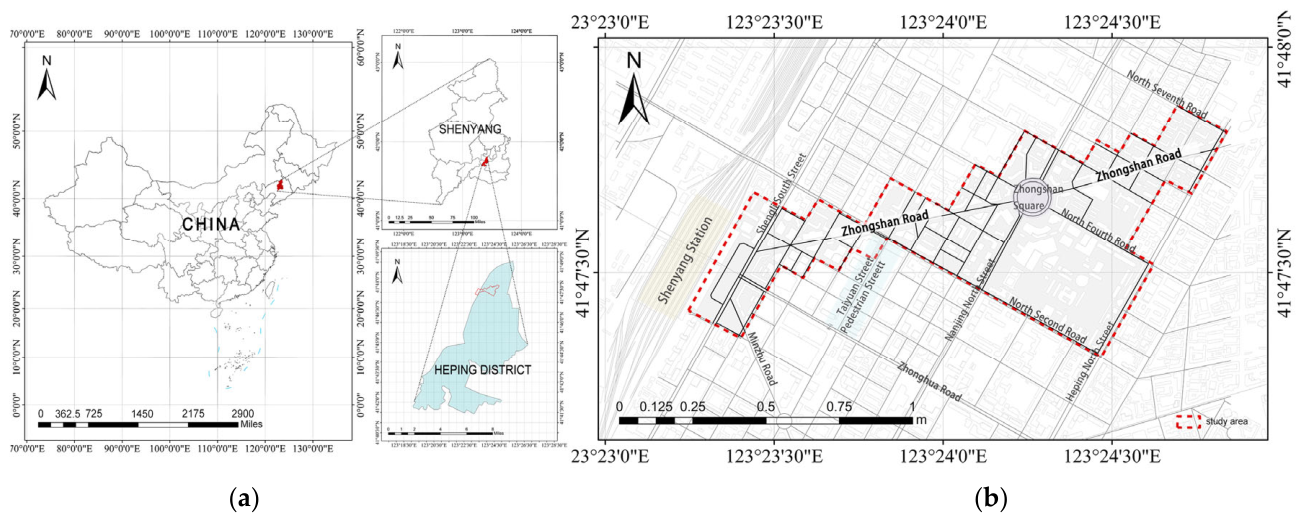
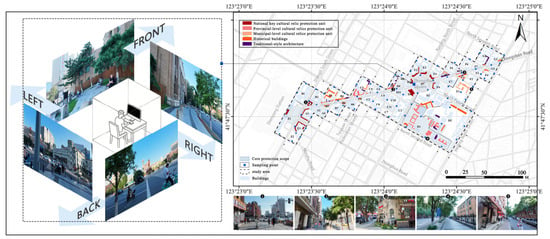
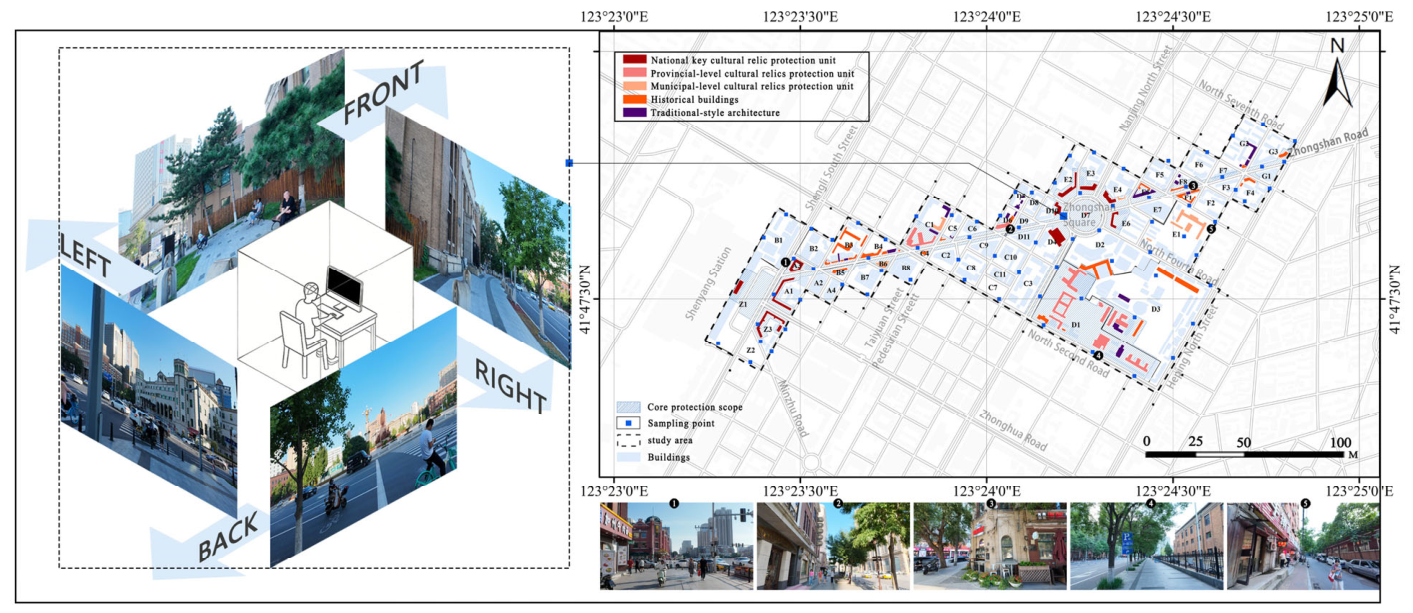
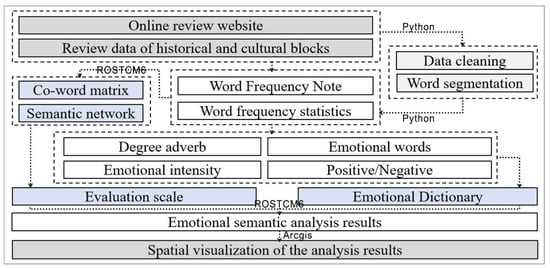
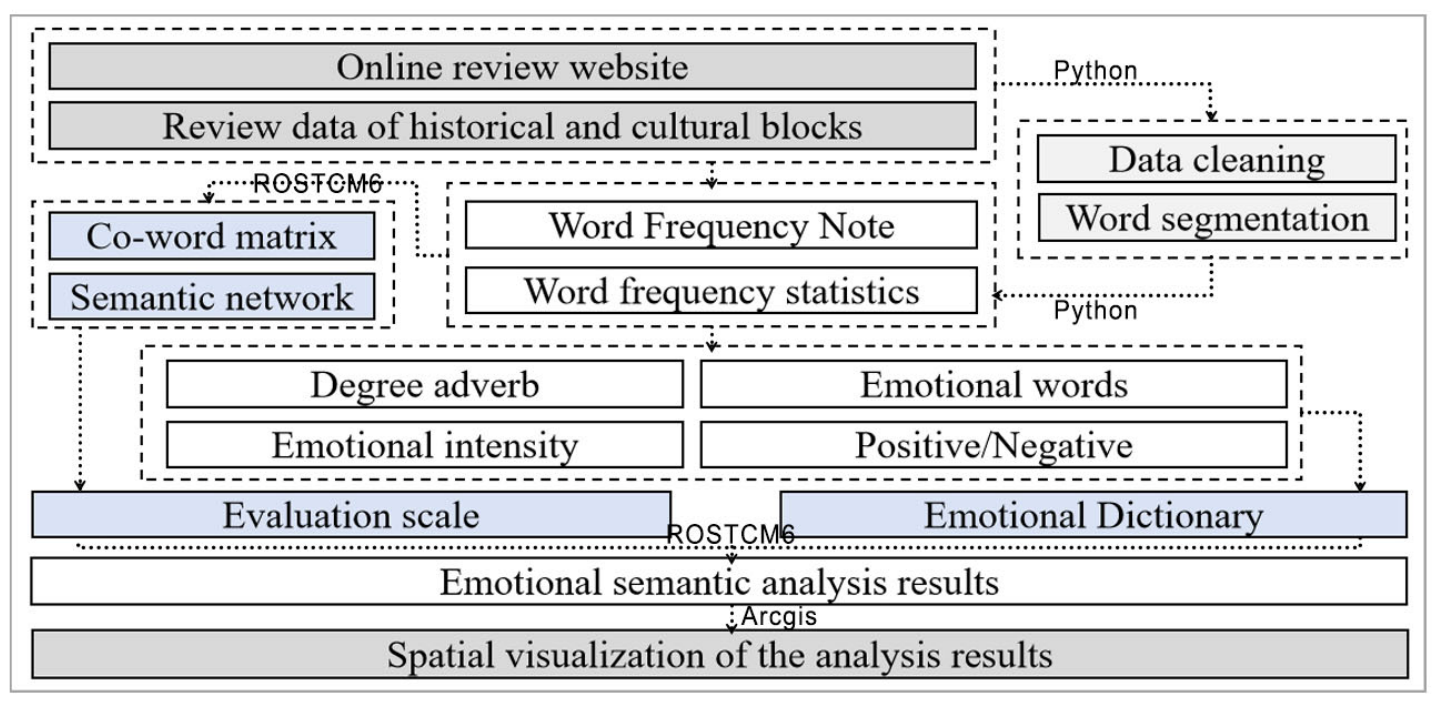
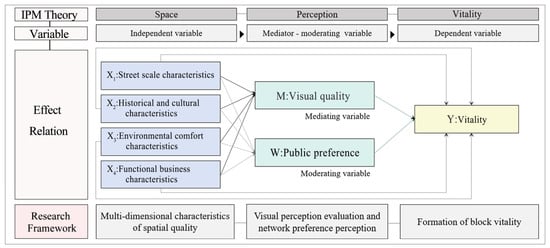
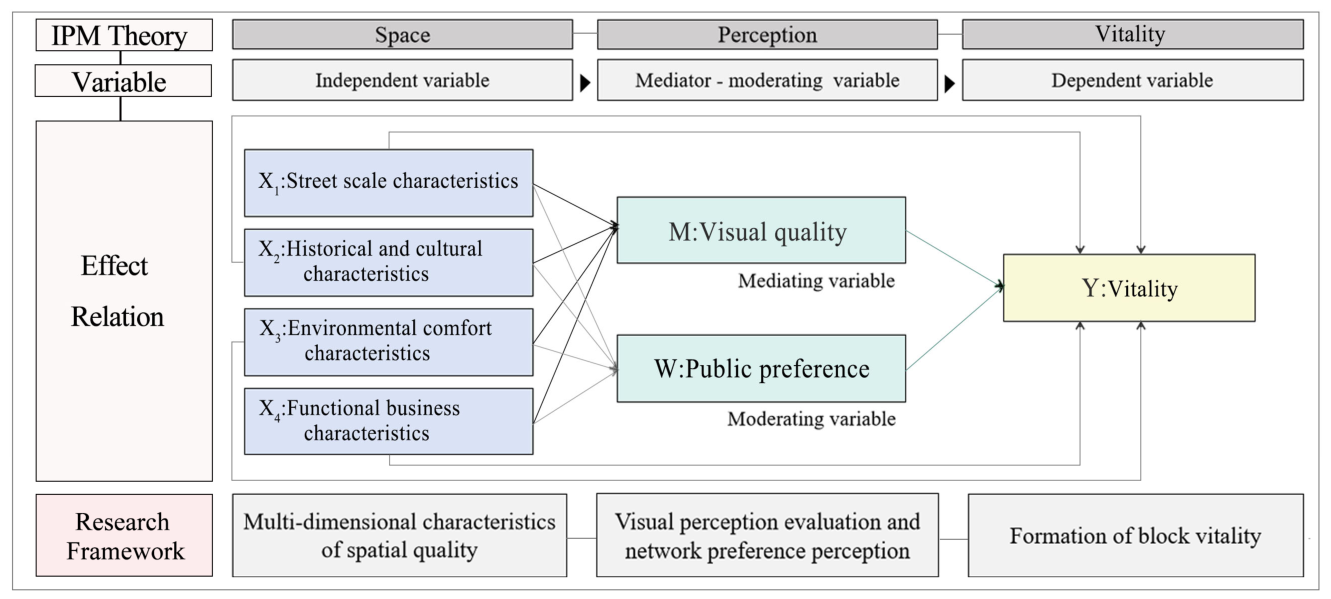
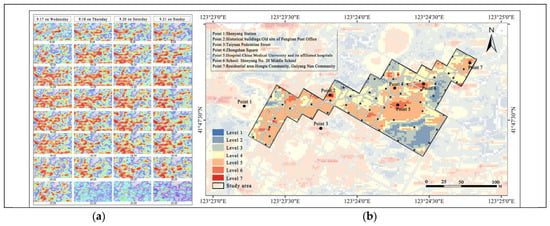
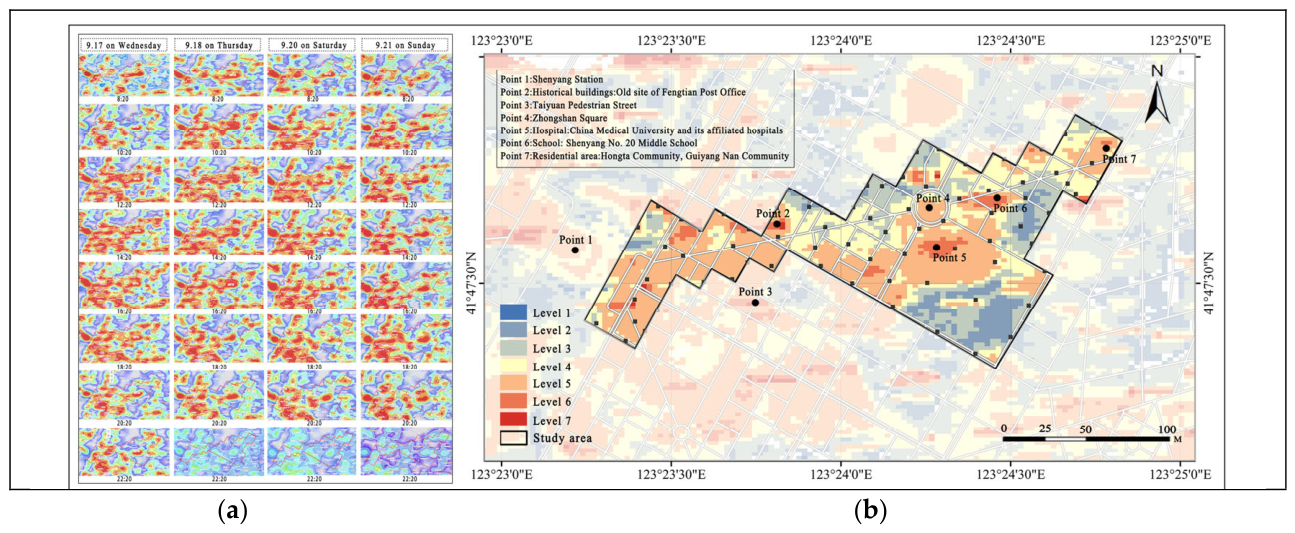
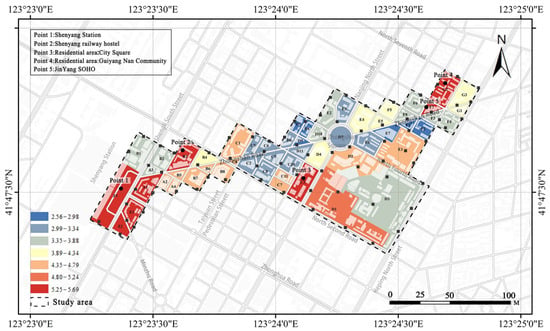
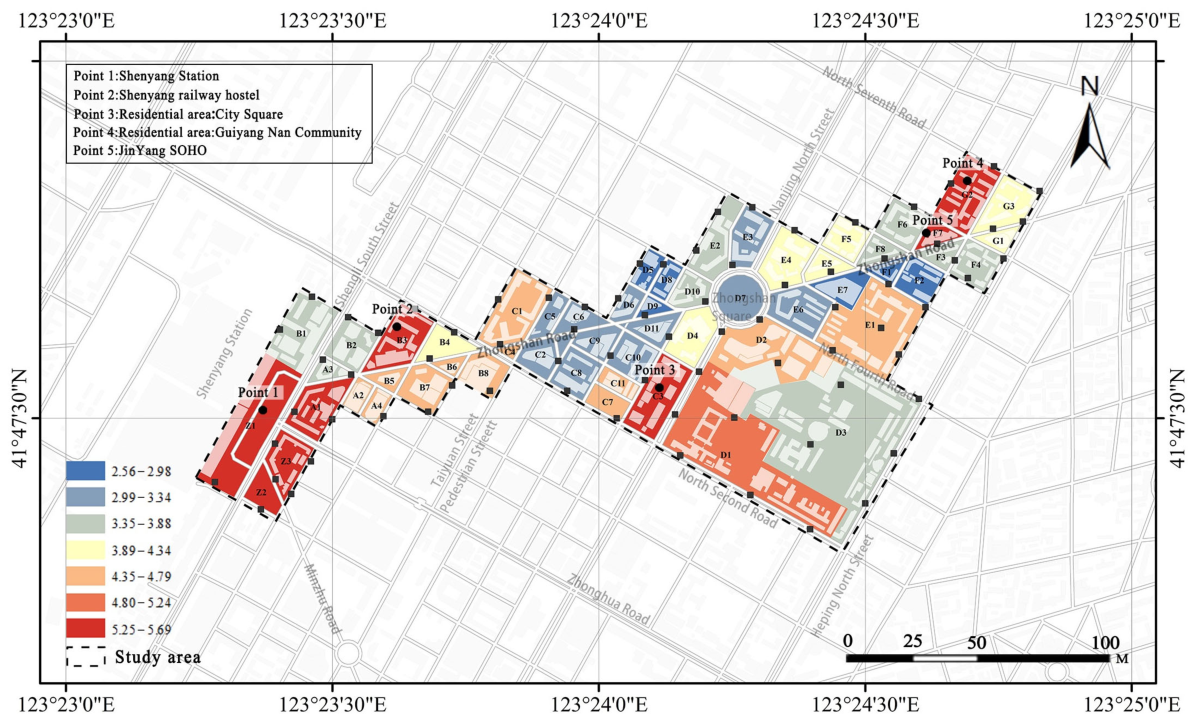
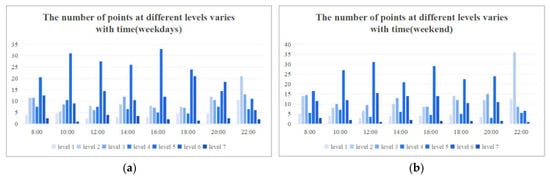
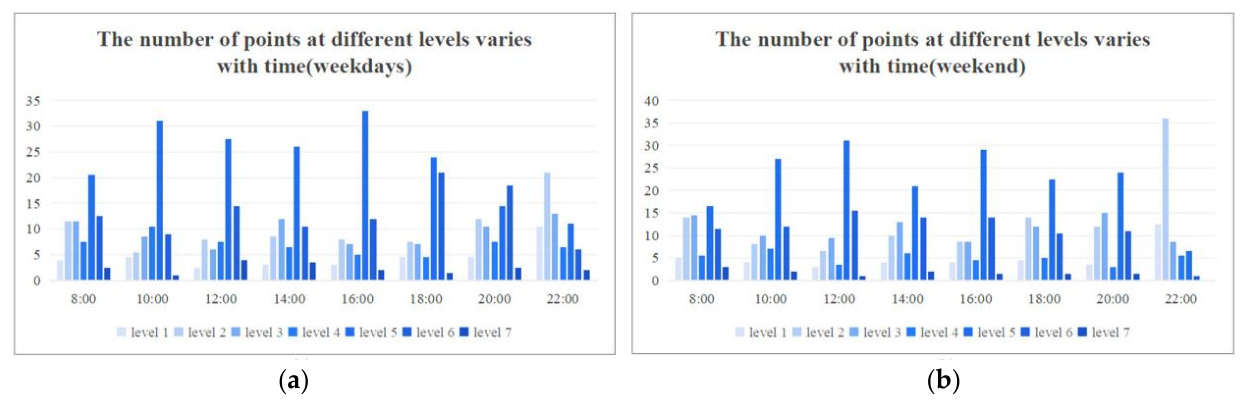
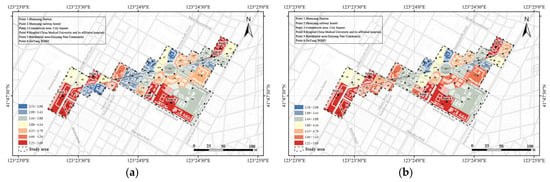
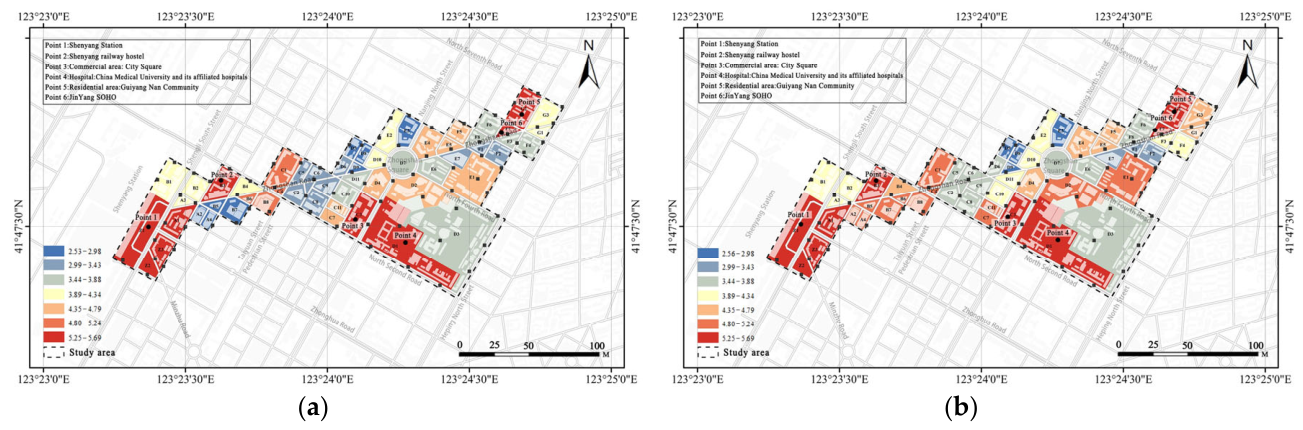
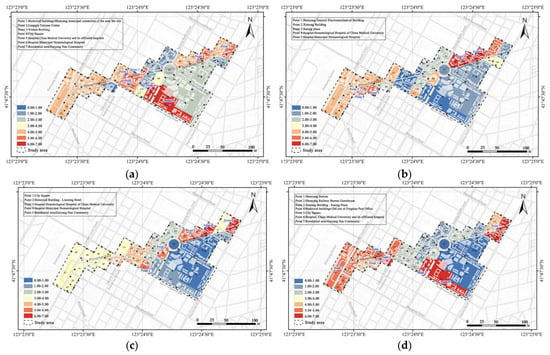
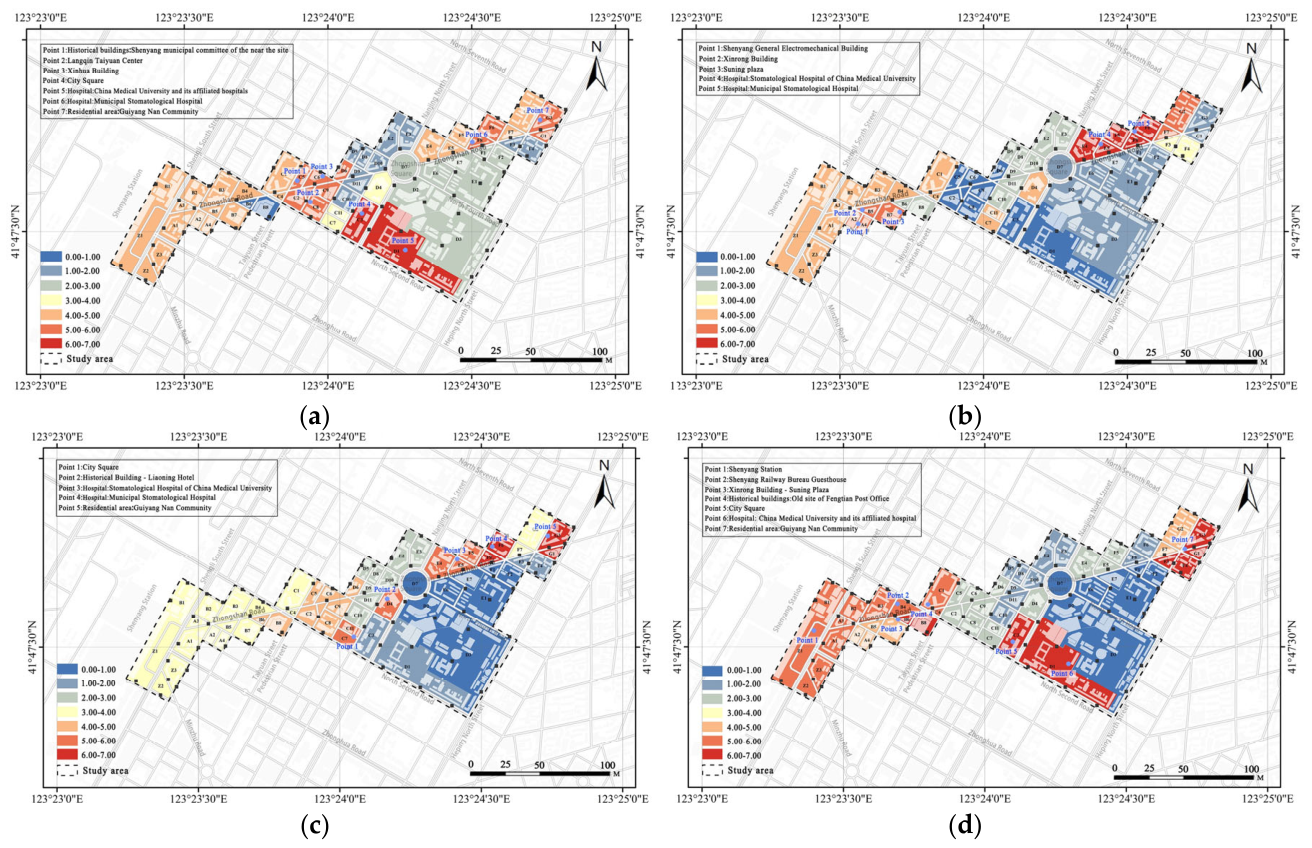
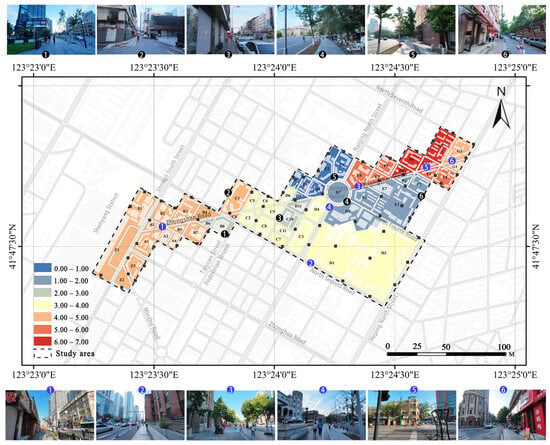
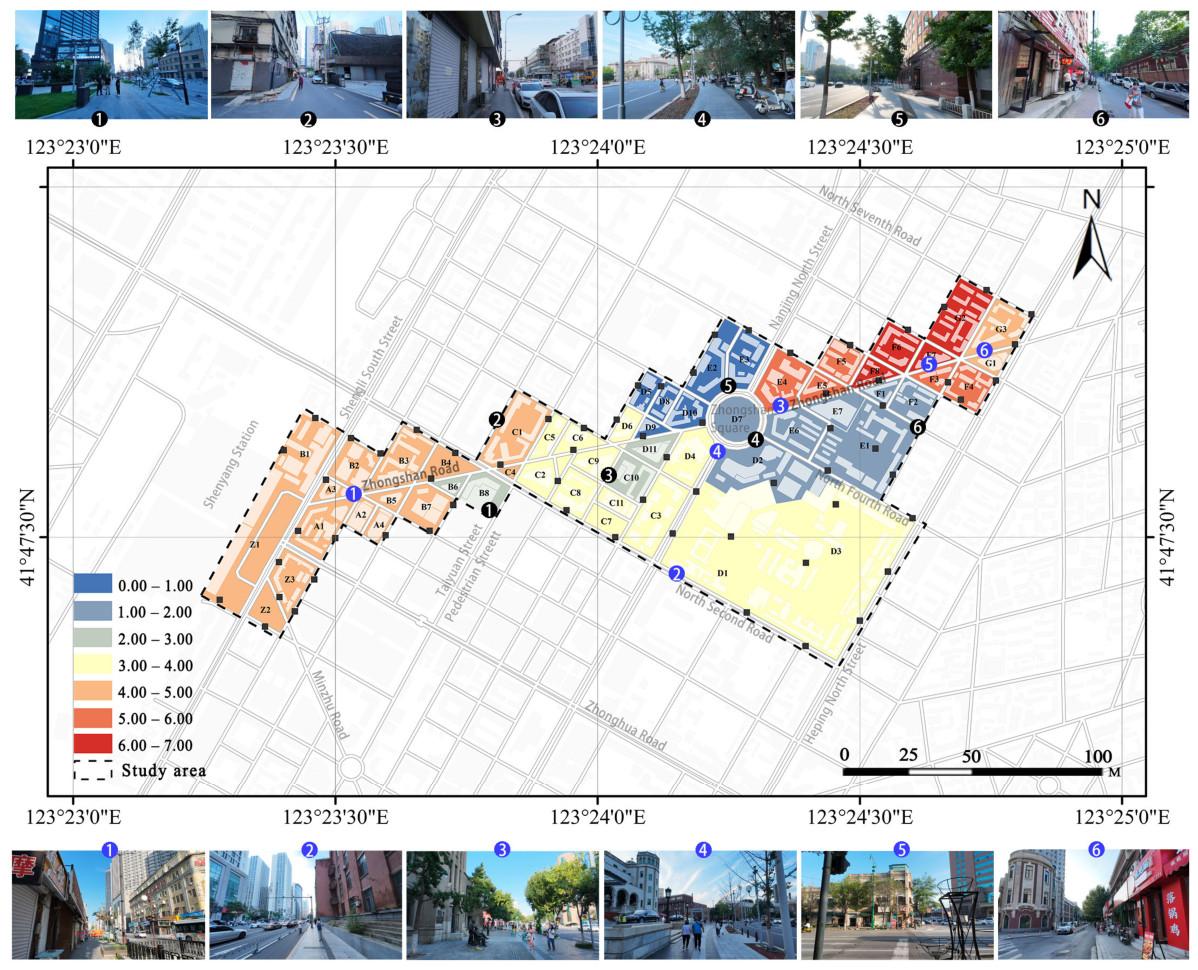
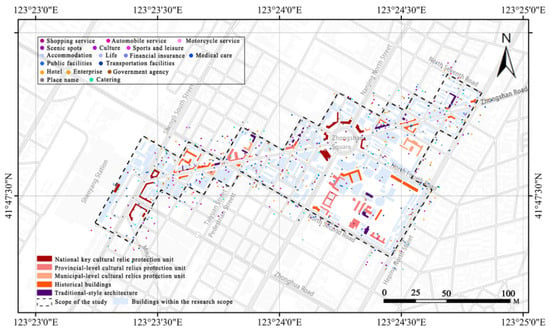
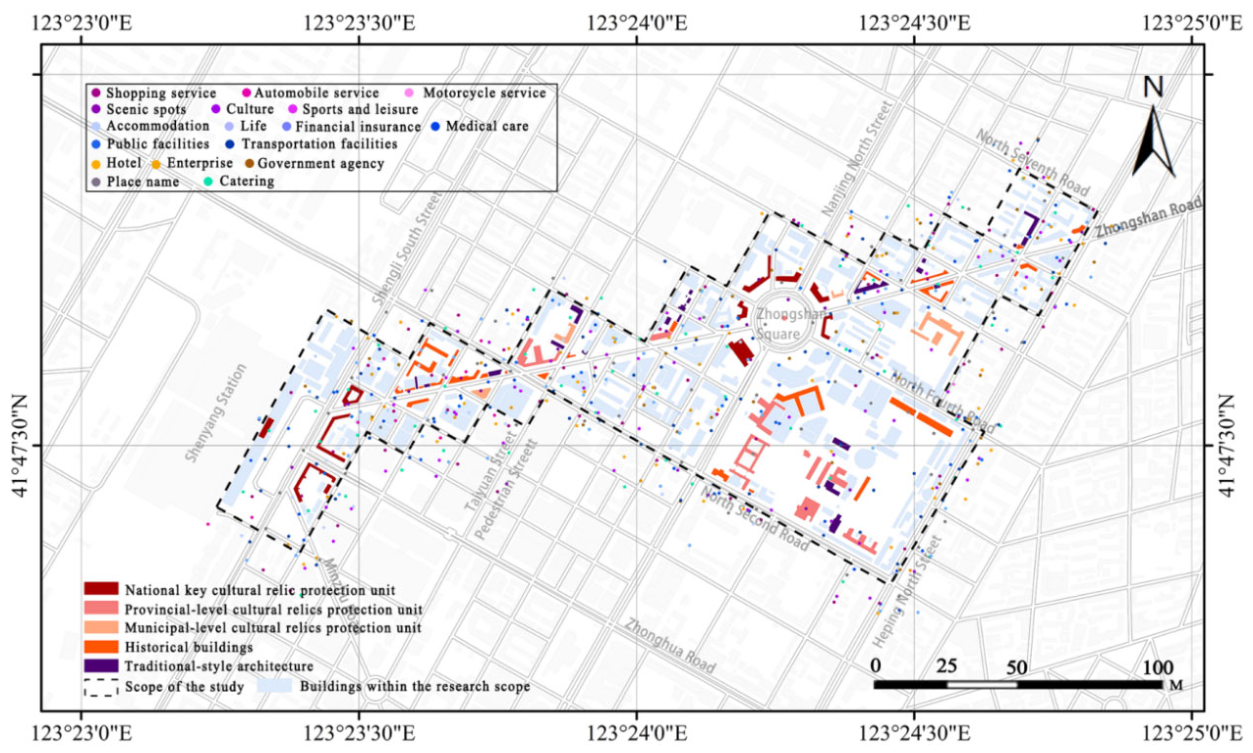
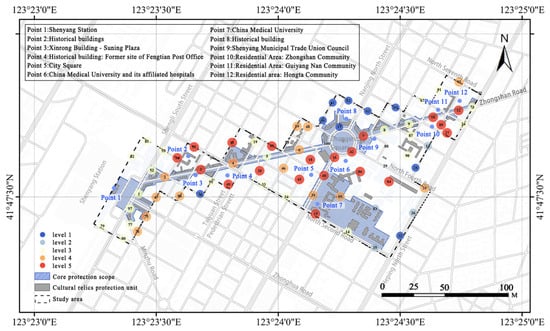
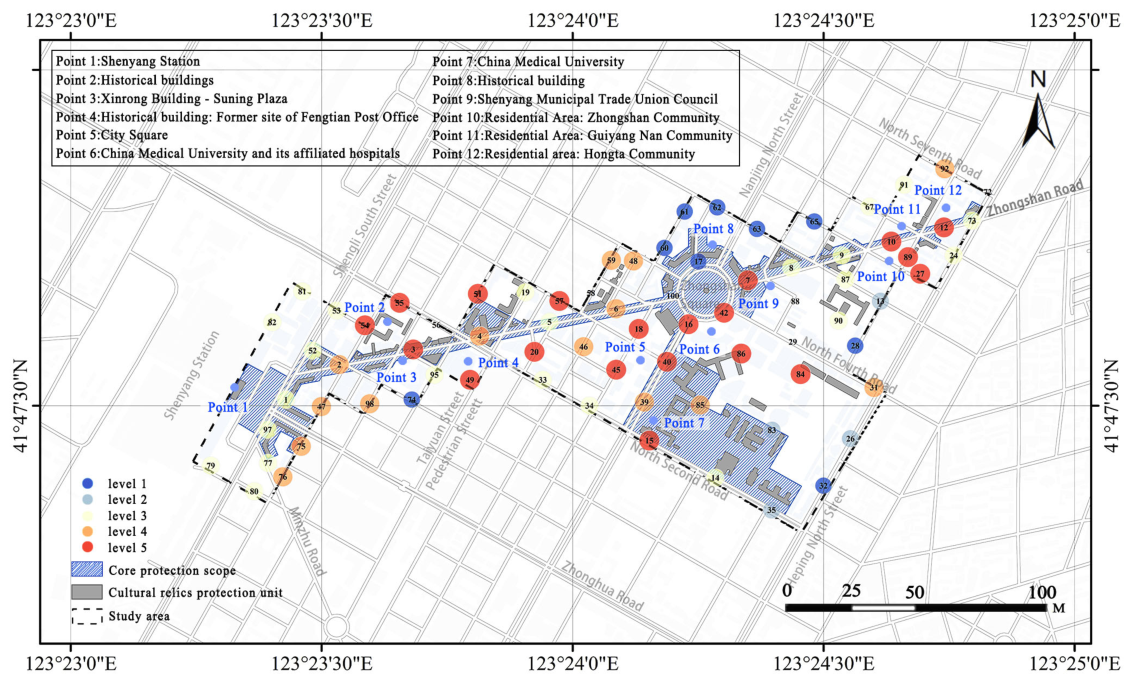
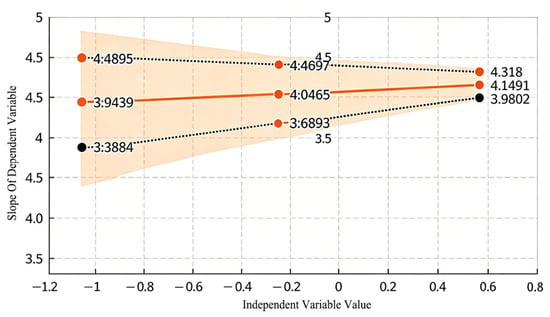
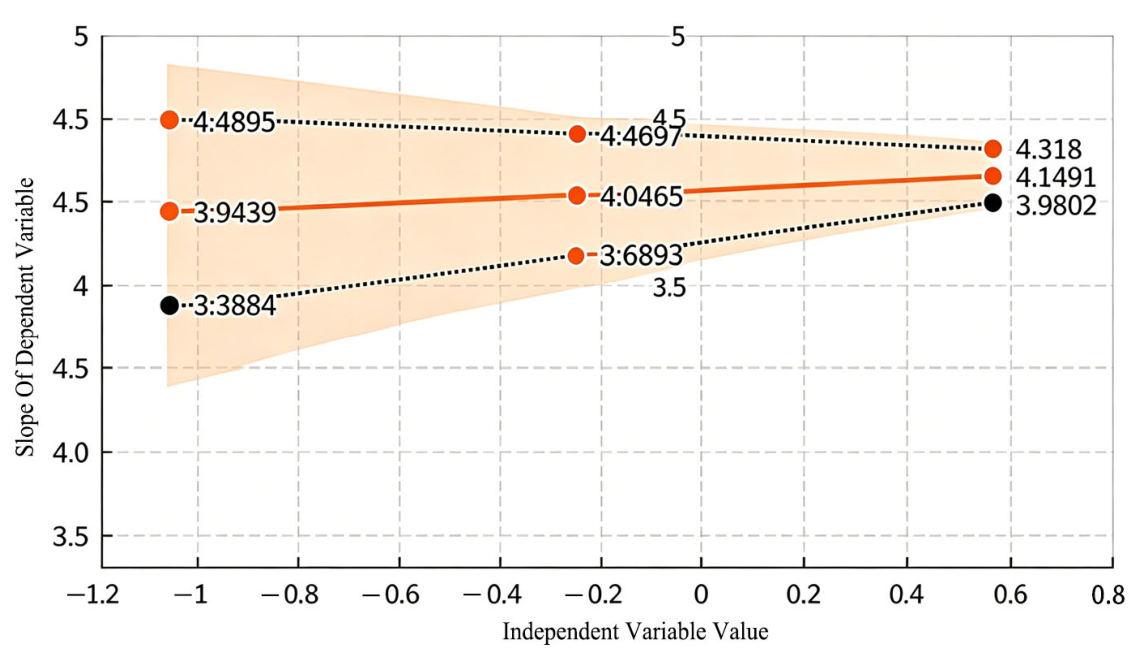
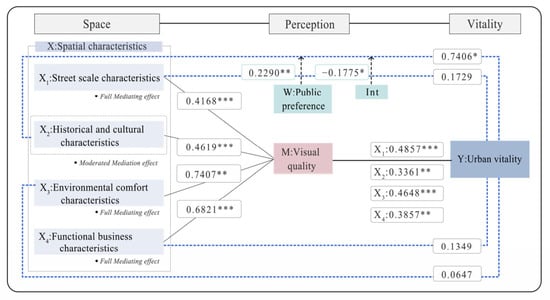
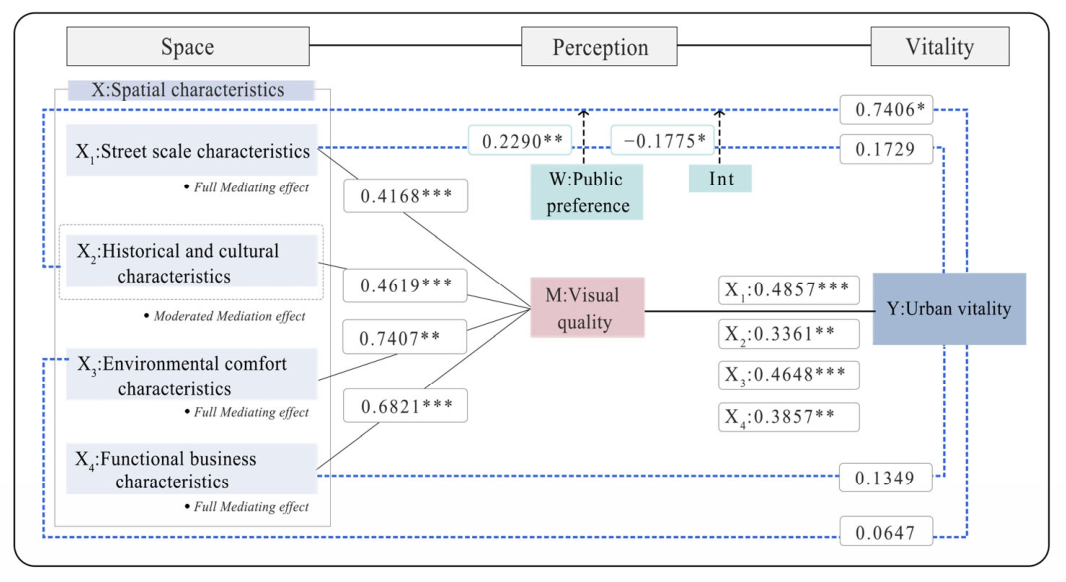
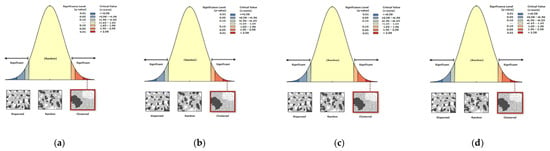
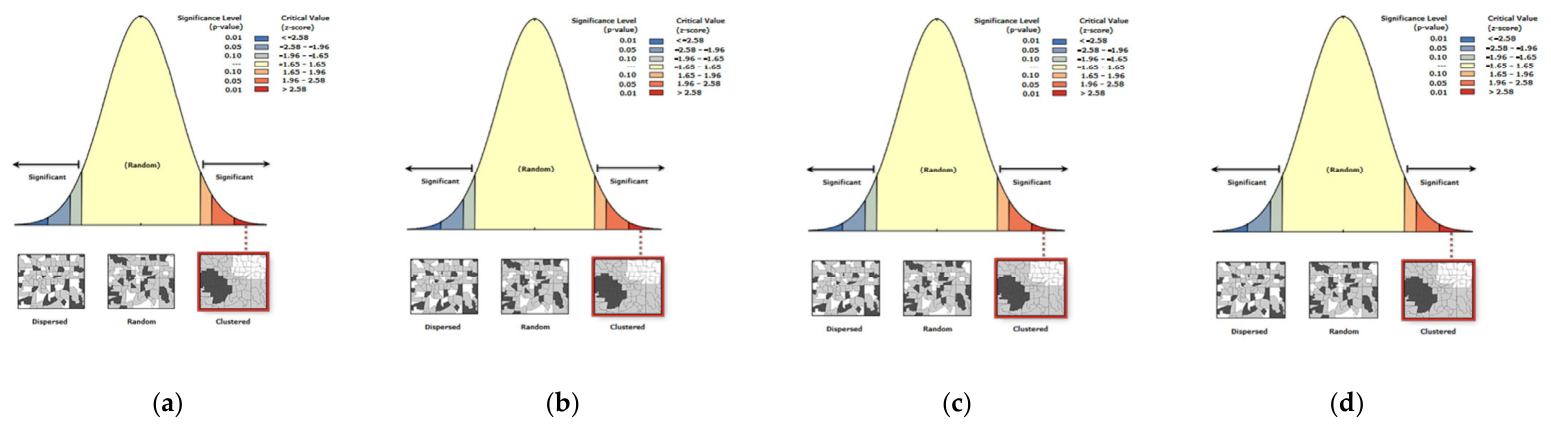
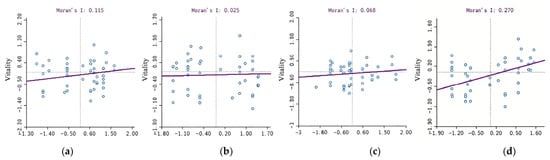
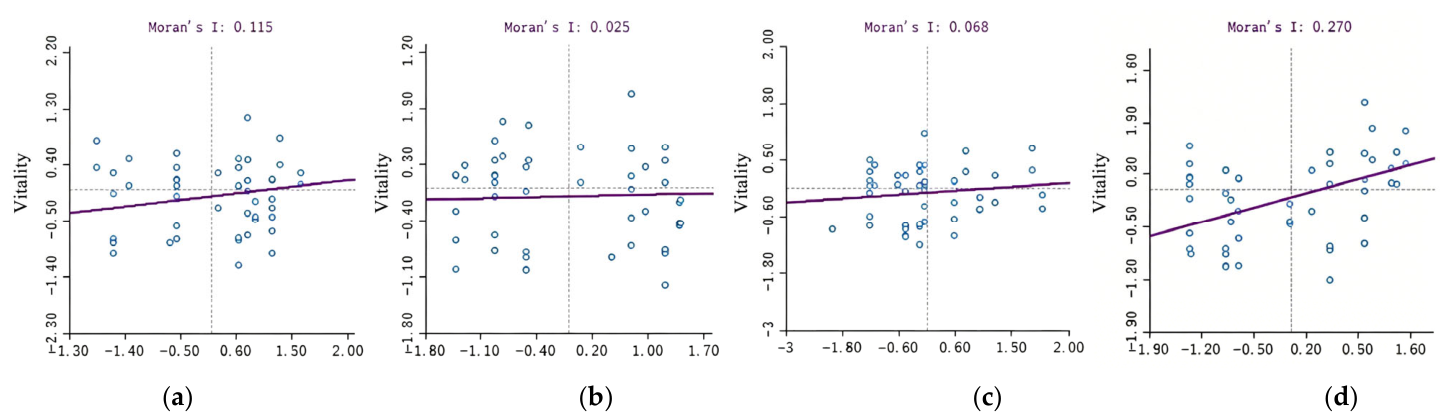
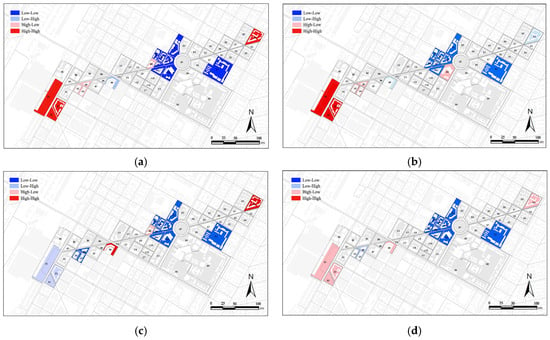
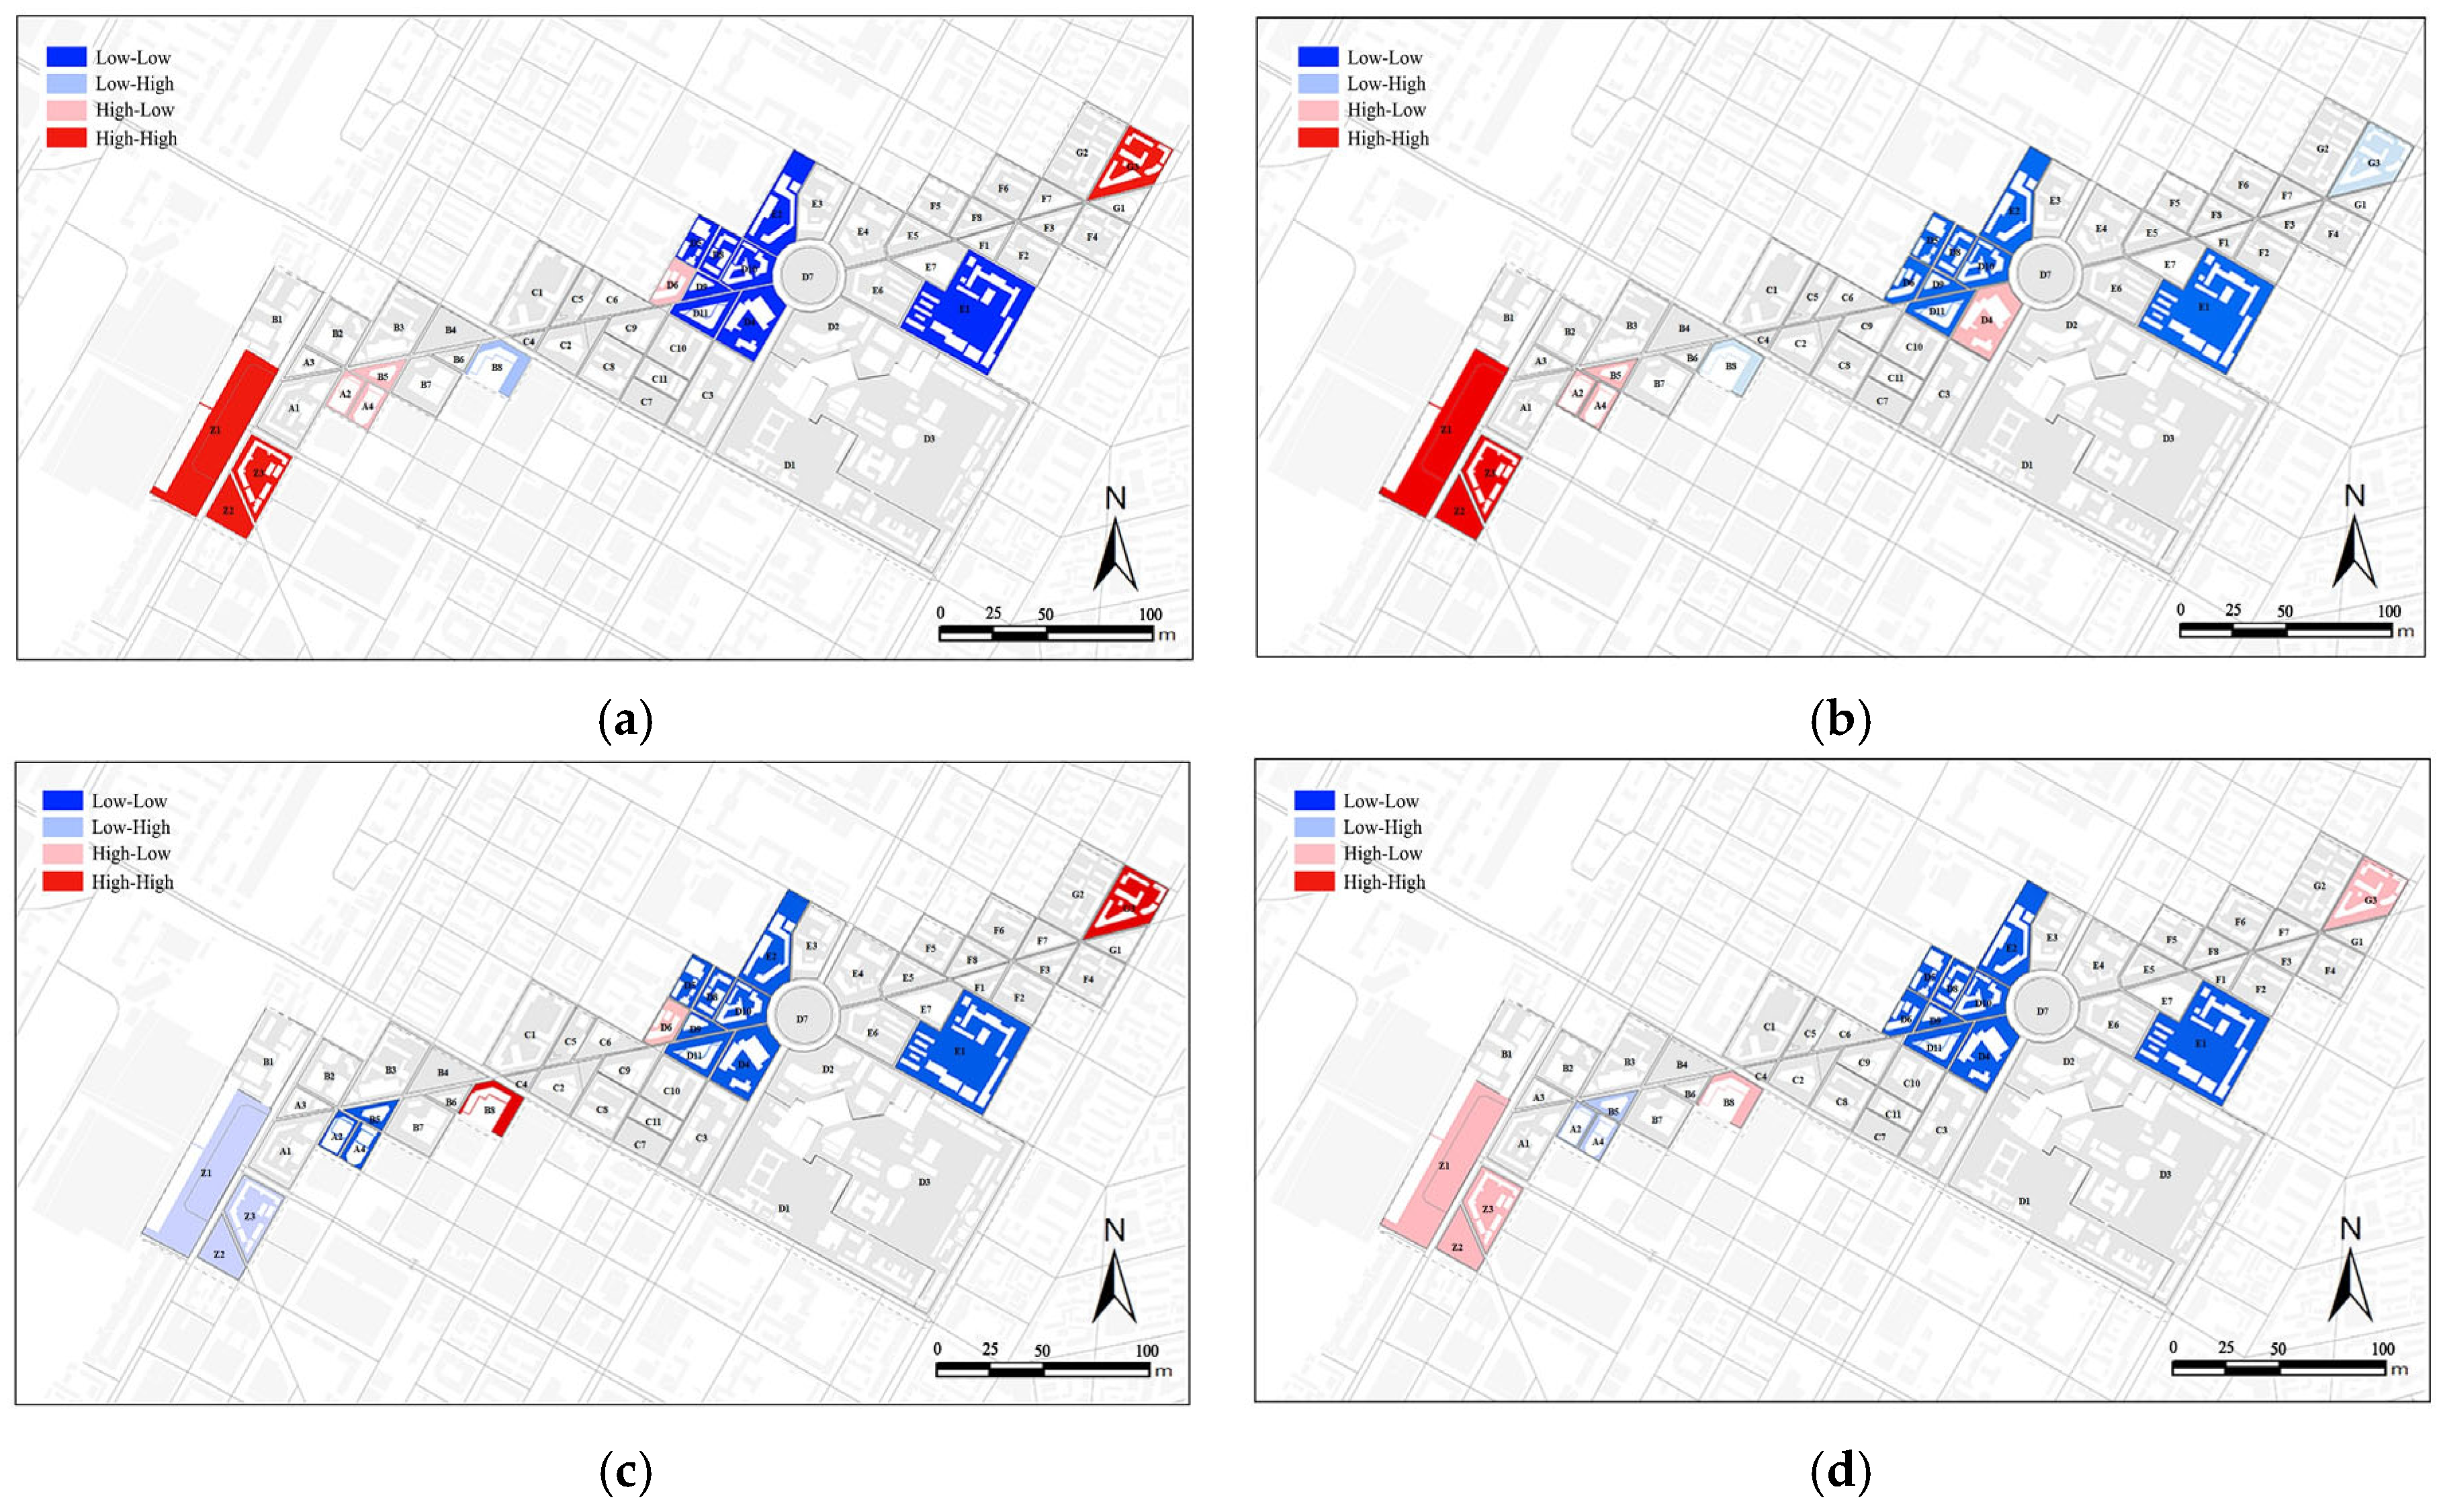

Disclaimer/Publisher’s Note: The statements, opinions and data contained in all publications are solely those of the individual author(s) and contributor(s) and not of MDPI and/or the editor(s). MDPI and/or the editor(s) disclaim responsibility for any injury to people or property resulting from any ideas, methods, instructions or products referred to in the content. |
© 2026 by the authors. Licensee MDPI, Basel, Switzerland. This article is an open access article distributed under the terms and conditions of the Creative Commons Attribution (CC BY) license.