


Abstract
The 6 February 2023 Kahramanmaraş earthquakes caused widespread structural damage and highlighted the need for rapid building-level decision support in post-earthquake assessment. This study presents an explainable ensemble learning framework for seismic damage prediction using 16,611 building-level field observations from Kırıkhan, Hatay, Türkiye. The original damage records were reorganized into three operational classes: No-Damage, Slight–Moderate, and Heavy–Collapse. Eight tree-based ensemble models, LightGBM, CatBoost, XGBoost, Random Forest, Extra Trees, Gradient Boosting Machine, AdaBoost, and HistGradientBoosting, were evaluated under a consistent protocol using class-weighting strategies where supported, with Balanced Accuracy as the primary metric. LightGBM and Random Forest achieved the joint-highest Balanced Accuracy value (0.650). Random Forest produced the strongest agreement-based metrics, while LightGBM remained closely competitive and was selected as the representative model for explainability because of its balanced class-wise behavior. CatBoost achieved the highest Heavy–Collapse recall (0.729), XGBoost achieved the highest Macro-AUC (0.821), and GBM produced the highest Overall Accuracy (0.658), showing that model ranking varied by evaluation criterion. SHapley Additive exPlanations identified building age, lithology, number of floors, structural system, plinth area, and proximity to faults and surface ruptures as key contributors. The remaining classification uncertainty, particularly among adjacent damage states, indicates that the framework is best interpreted as a complementary decision-support tool for preliminary screening and prioritization before final safety decisions or official damage assessment.
1. Introduction
Earthquakes are among the most destructive natural hazards because of their large-scale impacts on human life, economies, infrastructure systems, and the built environment [1,2,3]. After major seismic events, particularly in regions with dense and vulnerable building stocks, the rapid, reliable, and operationally useful identification of building damage states becomes one of the most critical requirements of disaster management and emergency response [2,3,4,5,6]. Early identification of damage levels provides essential decision-support information for directing search-and-rescue activities, allocating limited technical and logistical resources to priority areas, distinguishing safe and unsafe buildings, and establishing emergency response priorities [2,6,7]. Beyond emergency response, reliable post-earthquake damage information is also important for prioritizing subsequent rehabilitation and retrofitting strategies, particularly for vulnerable masonry and reinforced-concrete building systems, for which steel-based strengthening solutions have been widely investigated to improve lateral strength, ductility, and seismic performance [8,9]. Therefore, rapid post-earthquake damage assessment is not only a technical evaluation process, but also an operational decision-support mechanism that can improve crisis management and help reduce secondary losses [4]. However, the timely production of this decision-support information immediately after an earthquake is closely linked to the operational capacity of conventional field-based damage assessment procedures.
Conventional post-earthquake damage assessment generally relies on building-level visual field inspections conducted by expert engineering teams. Although indispensable for official and detailed evaluation, this approach has important operational limitations in regional-scale disasters where damage is distributed across large areas. These limitations include time requirements, high cost, labor intensity, the need for specialized personnel, difficulties in field accessibility, and the need for rapid coordination under challenging post-disaster conditions [2,10,11]. Moreover, the dependence of the process on expert judgment may increase the risk of subjectivity and inconsistency in damage grading, while continuing aftershocks and the potential collapse of severely damaged buildings pose serious safety concerns for inspection teams [4,12]. These limitations have increased the need for faster, scalable, and data-driven approaches in post-earthquake damage assessment. The 2023 Kahramanmaraş earthquakes further demonstrated the operational burden of large-scale official damage assessment, as millions of buildings had to be inspected within a short period under continuing post-disaster constraints [2,3]. In this context, machine learning (ML) methods have emerged as a powerful alternative for building damage prediction because of their ability to learn complex and nonlinear relationships among structural characteristics, local environmental conditions, and seismic parameters directly from data [5,7,13,14]. Their capacity to produce rapid predictions over large datasets makes ML-based approaches particularly valuable for preliminary assessment, response prioritization, and operational decision support after major earthquakes [15,16].
In recent years, ML-based approaches have been increasingly used in the literature on post-earthquake building damage prediction and rapid seismic damage assessment of infrastructure systems. These studies generally aim to estimate damage levels in a data-driven manner by using multidimensional inputs such as building age, number of floors, structural system, soil conditions, and ground-motion parameters [4,6,10]. Various algorithms have been employed to model the complex and nonlinear relationships between seismic and structural parameters, including Random Forest (RF) [7], XGBoost [5], Artificial Neural Networks (ANNs) [17], Support Vector Machines (SVMs) [18], LightGBM (LGBM), CatBoost, and other ensemble-based models [16,19,20].
Among these methods, tree-based ensemble models have gained particular attention because they can capture nonlinear feature interactions, adapt to complex and noisy field data, and generate strong predictive performance in high-dimensional data structures [16,21]. Nevertheless, recent studies also indicate that focusing solely on predictive accuracy is insufficient. Model decisions must also be interpretable, transparent, and auditable from an engineering perspective. For this reason, explainable artificial intelligence (XAI) approaches, particularly SHAP (SHapley Additive exPlanations), which is grounded in Shapley values and quantifies feature contributions to model predictions, have become increasingly important for understanding the decision mechanisms of black-box models and evaluating the physical plausibility of model outputs [13,14,22,23]. Beyond building inventories, ML has also been explored for rapid seismic damage assessment of other structural systems, such as gantry cranes, further demonstrating its potential for time-sensitive post-earthquake decision support [24].
Despite substantial progress in the existing literature, several methodological and contextual gaps remain in post-earthquake building damage prediction. First, many studies rely on numerically simulated data, idealized structural analysis outputs, data augmentation strategies, or hybrid datasets supported by simulation-based records [5,14,15,25,26]. Although such approaches allow specific aspects of structural behavior to be examined under controlled conditions, they may not fully represent the data noise, missing or inconsistent observations, class overlap, heterogeneity of building stocks, and field-assessment uncertainties that arise under real disaster conditions. Therefore, there remains a need for damage prediction models developed and tested directly on large-scale, building-level forensic field data collected after real earthquakes, where damage labels, building-stock heterogeneity, missing or inconsistent records, and class imbalance reflect real post-disaster conditions [2,3]. Second, many existing studies compare only a limited number of algorithms or focus on a narrower set of model families, whereas comprehensive benchmarks using the same preprocessing, optimization, and evaluation protocol remain relatively limited [4,21]. In addition, the performance of histogram-based algorithms that provide computational efficiency for large-scale datasets, particularly HistGradientBoosting (HistGB), has not yet been sufficiently examined in the context of seismic damage prediction. A related challenge concerns model evaluation under imbalanced real-world damage distributions. In such real field datasets, class imbalance and reliance on overall accuracy alone may further obscure model performance for underrepresented but operationally critical damage classes [27].
Finally, high predictive performance alone is not sufficient for disaster management applications. It is also necessary to transparently explain which structural, geological, and seismic variables drive model decisions. Although the use of XAI approaches such as SHAP has increased in the literature, many of these analyses have been conducted on simulated or synthetically augmented datasets [14,16]. This limits the ability to evaluate how models learn heterogeneous and noisy damage patterns under real field conditions. The 6 February 2023 Kahramanmaraş earthquake sequence, involving two consecutive major events within approximately nine hours, widespread destruction across 11 provinces, complex rupture processes, and extensive structural damage, provides an important real-disaster context for such evaluations [2,3,28,29,30,31,32,33]. For this type of event, there is still a need for studies that use building-level real field data, systematically compare modern ensemble learning models, and assess model decisions from an explainability perspective.
In response to these methodological and contextual gaps, this study presents a data-driven, operational, and explainable approach for seismic building damage prediction based on large-scale real field data collected after the 2023 Kahramanmaraş earthquakes. The present study is based on 16,611 building-level forensic field observations from Kırıkhan, Hatay, and integrates structural, seismic, topographic, and geological predictor variables within a common analytical framework. LGBM, CatBoost, XGBoost, RF, Extra Trees (ET), Gradient Boosting Machine (GBM), AdaBoost, and HistGB, which is notable for its computational efficiency in large-scale datasets, were systematically compared under a consistent modeling and evaluation protocol. In this respect, the study represents one of the early comprehensive benchmark analyses evaluating the performance of modern tree-based ensemble models for building-level damage prediction in the context of the 2023 Kahramanmaraş earthquakes.
The modeling framework was designed to preserve the empirical structure of the field dataset and to evaluate model performance with attention to class imbalance. Following the systematic benchmark, the selected model was interpreted using SHAP to examine how variables such as building age, number of floors, lithology, structural system, and proximity to faults and surface ruptures contributed to damage class predictions. Thus, this study not only provides a model comparison aimed at high predictive accuracy but also proposes an explainable and operationally relevant damage prediction approach based on real post-earthquake field data. The remainder of the paper introduces the study area and dataset, describes the modeling and evaluation procedure, presents the performance and explainability results, and discusses the findings in relation to the literature and disaster management practice.
2. Materials and Methods
This study adopted a multi-stage methodological workflow that integrates ML and XAI to improve operational usability, class-wise balance, and model interpretability in rapid post-earthquake building damage prediction. The experimental process began with the compilation of building-level real field data collected from Kırıkhan, Hatay, after the 2023 Kahramanmaraş earthquakes. Structural, seismic, topographic, and geological predictor variables were then integrated within a common analytical framework, followed by data cleaning, consistency checks, and the reclassification of the target variable into three operational damage classes: No-Damage, Slight–Moderate, and Heavy–Collapse.
In the modeling stage, LGBM, CatBoost, XGBoost, RF, ET, GBM, AdaBoost, and HistGB were systematically compared under the same experimental protocol. To address class imbalance, a cost-sensitive learning strategy was adopted instead of synthetic sample generation, and model performance was evaluated using both global and class-wise metrics, with Balanced Accuracy as the primary criterion. Finally, the model that provided the most suitable profile in terms of overall performance and class-wise balance was interpreted using SHAP to explain how structural, geological, and seismic variables contributed to model decisions. The proposed methodological workflow is summarized in Figure 1.
Figure 1.
Methodological workflow of the proposed explainable ensemble learning framework.
2.1. Study Area
Kırıkhan district, which constitutes the study area of this research, is located in southern Türkiye, in the eastern part of the Mediterranean Region. It is bordered by Kumlu, Antakya, İskenderun, Payas, and Hassa districts, as well as Syria, and is approximately 42 km from Antakya [34]. Geographically, Kırıkhan is located approximately between 36° and 37° N latitude and 36° and 37° E longitude, covering an area of about 715 km2 [35]. The location and boundaries of the study area are shown in Figure 2.
Figure 2.
Location of the study area.
Kırıkhan and its surroundings are situated within the Kahramanmaraş-Hatay graben, north of the Amik Plain and on the eastern flank of the folded and faulted Amanos Mountains, at an elevation of approximately 160 m [36]. In terms of geomorphological and geological characteristics, the district exhibits substantial topographic diversity and pronounced heterogeneity in ground conditions [34]. Elevation in the study area ranges from approximately 80 m to 950 m, and spatial variations in slope, lithology, and local ground conditions contribute to differences in observed building damage levels. In addition, the building stock in the district center varies in terms of age, number of floors, structural system, and occupancy type, making the multi-class damage prediction problem both realistic and analytically meaningful.
The region is located within the interaction zone of the Dead Sea Fault Zone (DSFZ) and the East Anatolian Fault Zone (EAFZ), particularly along the Karasu Fault [37]. Recent field-based geological evaluations of the 2023 Kahramanmaraş earthquakes further emphasize that the interaction among the East Anatolian Transform Fault, Dead Sea Transform Fault, Antakya Transform Fault, Sarız-Saimbeyli Mega Shear Zone, foreland fold-thrust belt faults, and Karasu Graben boundary faults contributed to the tectonic complexity of the earthquake sequence [3]. This tectonic setting indicates that the area is exposed to high seismic hazard. These characteristics make Kırıkhan an important natural setting for testing rapid post-earthquake damage classification algorithms under real field conditions.
Accordingly, the selection of the study area was based not only on data availability but also on the suitability of the area for testing the proposed model under complex and challenging field conditions and for evaluating its potential transferability to disaster management decision-support processes. Within this framework, the proposed methodology enables the joint assessment of classification performance and the explainability of model decisions.
2.2. Dataset and Predictor Variable Preprocessing
The primary dataset used in this study consists of field observations and damage assessment records collected by technical teams of the Republic of Türkiye Ministry of Environment, Urbanization and Climate Change within the administrative boundaries of Kırıkhan district, Hatay Province, after the 6 February 2023 Kahramanmaraş earthquakes. The unit of analysis was defined at the individual building scale, and each building was represented by structural, environmental, geological, and seismic variables related to its observed damage state. After data cleaning and consistency checks, the final sample included 16,611 buildings.
The dependent variable in the raw dataset originally consisted of five official damage categories: No Damage, Slightly Damaged, Moderately Damaged, Heavily Damaged, and Collapsed. Previous studies have reported that slight and moderate damage levels may exhibit similar structural responses under field conditions, increasing class overlap and reducing the discriminative capacity of multi-class models [4,10]. Similar uncertainties have also been observed in post-earthquake reassessment processes, where moderate and severe damage categories may be particularly prone to classification changes after objections and expert re-evaluation [2]. In this study, class merging was applied to improve the operational decision-support capacity of the model and to generate outputs that are more interpretable for post-earthquake response prioritization [6,7,13]. Accordingly, the target variable was reorganized into three main classes: (i) Class 0: No-Damage, (ii) Class 1: Slight–Moderate, and (iii) Class 2: Heavy–Collapse. Within this reclassification scheme, the Slightly Damaged and Moderately Damaged categories were merged into the Slight–Moderate class, while the Heavily Damaged and Collapsed categories were merged into the Heavy–Collapse class.
This transformation reduces the structural and observational overlap that may occur between intermediate damage levels, while enabling the model to distinguish more effectively between the operationally critical extremes, namely undamaged and heavily damaged or collapsed buildings. After reclassification, the class distribution of the dataset was 21.95% for Class 0 (N = 3647), 48.72% for Class 1 (N = 8093), and 29.32% for Class 2 (N = 4871) (Figure 3). This distribution indicates a moderate class imbalance, with the Slight–Moderate class being dominant in the dataset. In the existing literature, class imbalance in earthquake damage datasets is often addressed through synthetic sample generation or resampling strategies such as the Synthetic Minority Over-Sampling Technique (SMOTE) [4,19,38]. However, in this study, no synthetic sample generation or resampling strategy was applied during preprocessing in order to preserve the empirical class distribution of the official post-earthquake field inventory. Instead, stratified sampling was used to maintain class proportions during data partitioning, and class imbalance was considered in the subsequent modeling and evaluation stages.
Figure 3.
Damage class distribution of the dataset after reclassification.
To represent building damage from a multidimensional perspective, 11 independent variables commonly used in the literature and reflecting the structural, geological, topographic, and seismic characteristics of the study area were included in the model. These variables were Building Age, Number of Floors, Structural System, Building Position, Plinth Area, Occupancy Type, Lithology, Slope, Peak Ground Acceleration (PGA), Distance to Fault, and Distance to Surface Rupture. This predictor set allows building-level vulnerability components and local ground and seismic hazard conditions that may influence damage levels to be evaluated within the same analytical framework. The inclusion of spatial seismic-hazard-related variables is also consistent with earlier Geographic Information System (GIS) based earthquake hazard mapping studies, in which parameters such as topography, source-to-site distance, soil conditions, liquefaction potential, and fault or focal mechanism were considered key inputs for spatial earthquake hazard assessment [39]. The definitions, data types, sources, and related literature references of the variables are presented in Table 1. The selected variables are also consistent with recent post-earthquake surveys and structural damage studies after the 2023 Kahramanmaraş earthquakes, which emphasized the importance of building age, number of stories, structural system, floor area, use type, location, ground-motion characteristics, and local geological or fault-related conditions in interpreting observed damage patterns [2,20,31,32,33,40].
Table 1.
Dependent and independent variables used in the study.
Based on the dependent and independent variables listed in Table 1, the seismic damage prediction problem was formulated as a multi-class classification task at the individual building scale. In this formulation, the observed damage state of each building represents the dependent variable, whereas the selected structural, spatial, geological, topographic, and seismic variables represent the input predictors. Accordingly, the input–output relationship of the model can be expressed as follows:
where (i) denotes an individual building, (Damage_Statei) represents the observed damage class, and (f) denotes the machine learning function learned from the selected predictor variables. The output variable was defined as one of three classes: No-Damage, Slight–Moderate, or Heavy–Collapse. Representative input–output examples for the three damage classes are provided in Appendix A Table A1 to further clarify how the tabular predictor combinations correspond to observed damage states. It should also be noted that no building photographs, façade images, unmanned aerial vehicle images, street-view images, or other visual data were used as model inputs. The models were trained only using tabular field inventory attributes and spatial, geological, topographic, and seismic predictor variables.
Before modeling, a multi-stage preprocessing protocol was applied to improve the analytical quality of the raw dataset and ensure consistency among model inputs. The initial database contained 18,285 buildings. Completeness checks were first conducted, and duplicate records, spatial and attribute inconsistencies, missing coordinate information, and logical inconsistencies that were incompatible with engineering reality were examined. In the subsequent missing data analysis, 1674 observations with missing values in critical attributes used as core model inputs were excluded from the analysis. As a result of these filtering steps, the final modeling process was conducted using 16,611 buildings. This approach was adopted to reduce the potential bias that incomplete or inconsistent records could introduce into model decisions and to ensure that all algorithms were evaluated on the same cleaned and comparable dataset.
To further characterize the final predictor space before model training, an Exploratory Data Analysis (EDA) was performed on the 11 input variables after data cleaning and consistency checks (Figure 4). The EDA summarizes the frequency distributions of categorical predictors and the empirical distributions of numerical predictors using histograms or discrete bar plots. For numerical variables, basic descriptive statistics, including minimum, median, maximum, and standard deviation, are also provided within the figure to support interpretation. Building age and plinth area contained a small number of extreme values; therefore, these two variables were capped at 80 years and 1000 m2, respectively, only for visualization purposes, while the original values were retained in the modeling dataset. The EDA also shows that some variables, particularly PGA, have a comparatively narrow value range within the district-scale study area. Such variables were retained in the initial predictor set because they represent relevant seismic-hazard context, while their actual contribution to model decisions was evaluated later through model performance and SHAP-based interpretation.
Figure 4.
EDA of the input predictor variables.
In the second stage of preprocessing, the variable space was transformed into a structure suitable for the selected ML algorithms. Numerical variables were retained in their original continuous form, while categorical variables were transformed using One-Hot Encoding to generate binary vector representations [10,16]. This transformation ensured that all models were trained on the same feature space, supporting a fair and reproducible comparison among algorithms. Since all models used in this study are tree-based or ensemble learning algorithms, and because these algorithms are relatively robust to differences in feature scale, no normalization or standardization was applied to the dataset.
In the final stage, the dataset was divided into 70% training and 30% test subsets using stratified random sampling to preserve the original class distribution [7]. Stratification ensured that each damage class was represented in both the training and test sets at proportions close to those in the original dataset. The training set was used for model development, hyperparameter optimization, and the implementation of learning strategies designed to account for class imbalance, whereas the test set was reserved exclusively for the independent evaluation of final model performance. This procedure allowed the eight models to be compared within a consistent and reproducible experimental framework based on the same data split, preprocessing protocol, and performance evaluation criteria.
2.3. Machine Learning Models
In this study, eight well-established ensemble learning models were comparatively evaluated to capture the multidimensional and nonlinear structure of post-earthquake building damage classification. The selected models were RF, ET, GBM, HistGB, LGBM, XGBoost, CatBoost, and AdaBoost. These models are widely used in geospatial disaster and natural hazard modeling because of their pattern recognition capability in high-dimensional datasets, robustness to noise, ability to capture nonlinear predictor interactions, and built-in mechanisms for controlling overfitting [44]. The basic theoretical principles of these algorithms are briefly summarized below to clarify their roles in the comparative benchmark.
Among the bagging-based methods used in the analysis, RF trains multiple decision trees in parallel using bootstrap samples derived from the original dataset and determines the final prediction through majority voting. The decision trees used as base learners recursively partition the feature space into more homogeneous subregions by selecting split rules according to impurity-based criteria. Its random feature selection at the node level reduces inter-tree correlation and thereby decreases model variance [45]. ET, which follows a similar tree-ensemble structure, introduces a higher degree of randomness when determining split thresholds. This strategy can reduce computational cost and support model generalization by providing an effective bias-variance trade-off [14,46,47].
In contrast, six boosting-based algorithms were included to represent sequential error-correction architectures. GBM constructs weak learners sequentially and focuses on minimizing the residual errors of the preceding model by following the negative gradient of the loss function [48]. HistGB, a histogram-based variant of this approach, accelerates the training process, particularly in large datasets, by binning continuous variables. AdaBoost, one of the fundamental boosting algorithms, iteratively assigns higher weights to misclassified observations, allowing the model to focus more strongly on difficult cases through a sequence of weak learners [19,49,50].
Recent optimized variants of the boosting family were also evaluated in terms of computational efficiency and predictive performance. LGBM uses a leaf-wise growth strategy in which the leaf associated with the greatest potential reduction in loss is expanded, providing advantages in memory efficiency and computational speed [51]. XGBoost effectively controls model complexity through second-order optimization and regularization terms [52]. CatBoost, in its native formulation, employs ordered boosting to reduce target leakage and can handle categorical variables through symmetric tree structures [53]. In this benchmark, however, all algorithms, including CatBoost, were trained on the same one-hot encoded feature space to ensure methodological consistency and fair comparison across models. Accordingly, all models were evaluated using the same train-test split and preprocessing protocol.
Since class imbalance may bias model learning toward dominant damage categories, imbalance-aware strategies were considered during model training [27]. Where supported by the algorithm, class weighting was used to account for imbalanced class distributions, while the original training data structure was preserved without synthetic sample generation. In addition, model comparison was not based solely on overall accuracy, because accuracy may be misleading in imbalanced datasets and may mask weak performance for underrepresented but operationally important damage classes [27,54]. Therefore, Balanced Accuracy was used as a central criterion in model optimization and evaluation, as it provides a more informative estimate of class-wise generalization performance under imbalanced class distributions than standard accuracy alone [55].
2.4. Hyperparameter Optimization
In this study, comprehensive hyperparameter optimization was performed for all eight ML models to improve their generalization capacity and reduce the risk of overfitting that may arise from default parameter settings. Although grid search and Bayesian optimization are frequently used in the literature, RandomizedSearchCV was preferred in this study because it provides an effective balance between computational cost and the efficient exploration of large hyperparameter spaces [14,25]. The implementation of the model training, cross-validation, hyperparameter search, and performance metric calculations was conducted within the Python 3.11.0, mainly using scikit-learn 1.7.2-compatible workflows [56], together with LightGBM 4.6.0, XGBoost 3.1.3, CatBoost 1.2.8, and SHAP 0.48.0 for model training and explainability analysis.
A model-specific hyperparameter search space was defined for each algorithm, and preprocessing steps, class-weighting strategies, and model training were evaluated within the same experimental workflow. The optimization process was conducted exclusively on the training set. The independent test set was not used at any stage for hyperparameter selection, model tuning, or validation. Considering the class imbalance in the dataset, Balanced Accuracy was used as the primary optimization metric instead of standard accuracy, as it reflects classification performance more evenly across damage classes. To reduce the effect of class imbalance during training, class weights were calculated only from the class frequencies in the training set and incorporated into model training through the parameters supported by the corresponding algorithms, following the general principle that imbalance-aware learning strategies can reduce bias toward majority classes without altering the original sample distribution [27]. This strategy allowed errors in underrepresented but operationally critical damage classes to be assigned a higher learning cost.
Validation during hyperparameter optimization was conducted using five-fold stratified cross-validation to reduce dependence on a single train-validation split and to preserve class distribution within each validation fold [10,14]. This structure allowed hyperparameter combinations to be evaluated across different subsamples and prevented model selection from depending on a single data partition. The search budget was kept equal across all models, with 100 randomized iterations defined for each algorithm. During this process, key parameters such as learning rate, tree depth, number of leaves, sampling ratios, and regularization coefficients were randomly sampled within predefined ranges. The best hyperparameter sets obtained from the optimization process and used in the final model training are presented in Table 2.
Table 2.
Optimized hyperparameter values used for the final training of the ML models.
2.5. Model Performance Comparison
The generalization performance of the eight optimized ML models was evaluated on the independent test set, which was not used during model training. Because the problem has a multi-class structure and the class distribution is naturally imbalanced, reporting model performance using a single metric may be misleading. Therefore, a multi-criteria and hierarchical evaluation strategy was adopted [10,41]. In this framework, model performance was assessed not only in terms of overall accuracy, but also by considering class-wise balance, the ability to detect critical damage classes, error patterns, and probabilistic discrimination capacity. Balanced Accuracy was used as the primary ranking criterion because it reduces the influence of the majority class and treats all classes with equal importance, thereby providing a more informative estimate of generalization performance under imbalanced class distributions than standard accuracy alone [55]. In addition, recall for the Heavy–Collapse class was separately evaluated to interpret the operational safety profile of each model. The evaluation procedure was conducted in two stages using the metrics summarized in Table 3.
Table 3.
Metrics used for model performance evaluation and their analytical purposes.
At the global level, Accuracy, Balanced Accuracy, Macro-F1, Weighted-F1, Cohen’s Kappa, Quadratic Weighted Kappa (QWK), and Matthews Correlation Coefficient (MCC) were calculated to assess overall classification capacity and class-wise decision balance [25]. Among these metrics, Accuracy and Weighted-F1 summarize overall classification performance, whereas Balanced Accuracy, Macro-F1, and MCC provide a more balanced interpretation under class imbalance. In particular, MCC is informative because it evaluates classification quality by jointly considering all components of the confusion matrix and is less prone to overoptimistic interpretation than accuracy alone under imbalanced conditions [54]. QWK further accounts for the ordinal nature of the damage classes by penalizing errors between distant classes more strongly. At the class-wise level, Precision, Recall, Specificity, and F1-score were computed for each damage class, namely No-Damage, Slight–Moderate, and Heavy–Collapse, using a One-vs-Rest (OvR) approach [4,16]. This structure enabled the systematic evaluation of not only overall predictive performance, but also the discrimination capacity for each individual damage class.
To visually compare model behavior and examine error patterns, a confusion matrix was generated for each model. The diagonal elements of the matrices represent correct classifications, whereas the off-diagonal elements indicate misclassifications among damage classes [16,17]. This analysis allowed the different operational implications of false negatives in the Heavy–Collapse class and false positives in the No-Damage class to be interpreted from a disaster management perspective. In addition, multi-class Receiver Operating Characteristic (ROC) analysis was performed to evaluate threshold-independent discrimination performance, and both class-wise ROC curves and Macro- Area Under the Curve (AUC) values were reported [15,21]. ROC-AUC results were not used as the sole determinant of model ranking, but rather as a complementary indicator of the probabilistic discrimination capacity of the models across damage classes.
2.6. Model Explainability
In post-earthquake building damage classification, high predictive accuracy alone is not sufficient. Model decisions must also be transparent, understandable, and interpretable from an engineering perspective. To explain the decision mechanisms of complex ensemble models, which are often regarded as black boxes, and to evaluate the extent to which model outputs are consistent with physically meaningful damage-related processes, this study applied the game-theory-based SHAP approach as a post hoc explainability tool [4,16,22]. In recent years, SHAP has been widely adopted in different application domains, including civil engineering, geospatial modeling, and natural hazard susceptibility assessment, because it provides both global and local explanations for complex ML models. Recent geospatial natural hazard studies have also shown that XAI methods such as SHAP and Local Interpretable Model-Agnostic Explanations (LIME) can improve the transparency of ensemble ML models by clarifying the relative and local contributions of conditioning factors to susceptibility predictions [57,58,59]. SHAP quantifies the marginal contribution of each feature to the final model prediction through Shapley values, making model behavior interpretable both locally, at the level of individual building predictions, and globally, across the entire dataset [14,22,60].
For a given feature, the SHAP value represents the average marginal contribution of that feature across all possible feature subsets. In this study, the SHAP value of feature j was defined as follows:
where denotes the SHAP contribution of feature j, F is the full set of input features, and S is any subset of features that does not contain feature j. The terms and represent the number of elements in S and F, respectively. The function f denotes the trained model, while represent the model outputs with and without feature j, respectively. In the additive SHAP explanation framework, the model output for an individual building can be expressed as the sum of the expected model output and the feature-specific SHAP contributions:
where represents the model output for the i-th building, E[f(x)] is the expected model output over the background data, p is the number of input features after preprocessing, and denotes the SHAP contribution of feature j for building i. A positive SHAP value indicates that the corresponding feature increases the model output toward the relevant damage class, whereas a negative SHAP value decreases it. The absolute SHAP value represents the strength of the contribution. Since this study involved a multi-class damage classification problem, SHAP values were interpreted separately for the No-Damage, Slight–Moderate, and Heavy–Collapse classes.
SHAP analysis was performed on the model that exhibited the most suitable profile in terms of overall performance, class-wise balance, and decision consistency, based on the model comparison results. This choice ensured that the explainability analysis focused not merely on the model with the highest single performance value, but on the model showing a more balanced and operationally interpretable prediction behavior under the imbalanced multi-class structure. During the analysis, the preprocessing pipeline used in model training was preserved. Categorical variables were included in the SHAP computation in their one-hot encoded form, consistent with the modeling stage. Because the selected model was tree-based, TreeExplainer was used due to its computational efficiency and optimization for tree-based models [23]. Given the multi-class output structure, SHAP values were calculated separately for each damage class, namely No-Damage, Slight–Moderate, and Heavy–Collapse, allowing the relative contributions of predictor variables to be evaluated across different damage levels [21].
Because One-Hot Encoding decomposes categorical variables into multiple binary columns, feature importance can become fragmented, making interpretation at the original variable level more difficult. To reduce this issue and enable a more integrated interpretation of variable contributions, SHAP contributions belonging to the subcolumns of the same original variable were regrouped. This procedure allowed categorical variables such as lithology or structural system to be interpreted at the main variable level rather than through individual subcategories. Two main visualization types were used to present and interpret the results from an engineering perspective. Global importance plots were used to show the mean absolute contribution of each variable to model decisions across the entire dataset, enabling the relative importance ranking of the most influential predictors in damage prediction to be assessed [16]. In addition, dependence plots were prepared for the Heavy–Collapse class, which is the most critical class for disaster management and life safety, to examine the relationships between predictor values and SHAP contributions. These plots allowed the direction of variable contributions, nonlinear response patterns, and possible threshold-like behaviors in damage prediction to be evaluated [14]. In addition to these global and class-specific SHAP summaries, representative local SHAP outputs for selected independent test-set cases are provided in Appendix A Figure A1. These examples illustrate how individual predictor values contributed to the model output for representative No-Damage, Slight–Moderate, and Heavy–Collapse cases.
3. Results
3.1. Global Performance Comparison
The global performance of the eight optimized ensemble learning models was comparatively evaluated on the independent test set, which was not used during model training, using the heatmap presented in Figure 5. The multi-criteria evaluation matrix included metrics sensitive to class imbalance, such as Balanced Accuracy and Macro-F1; indicators representing overall predictive performance, including Overall Accuracy and Weighted-F1; and agreement-based statistical metrics, including MCC, Cohen’s Kappa, and QWK. Across the eight models, performance values ranged from 0.511 to 0.650 for Balanced Accuracy, from 0.526 to 0.640 for Macro-F1, and from 0.306 to 0.449 for MCC.
Figure 5.
Heatmap of global performance metrics for the eight ML models.
Given the imbalanced class structure of the dataset, the highest Balanced Accuracy value, which reflects the average recall across minority and majority classes, was obtained by the LGBM model (0.650). RF achieved a nearly identical Balanced Accuracy value (0.650), while CatBoost (0.648), ET (0.645), and HistGB (0.640) also produced close scores. These results indicate that the leading models had similar class-balance-sensitive performance profiles on the independent test set. In terms of Overall Accuracy and Weighted-F1, GBM achieved the highest values, with scores of 0.658 and 0.654, respectively, followed by XGBoost with scores of 0.654 and 0.649. This pattern shows that GBM and XGBoost performed strongly in frequency-weighted and overall classification metrics, whereas LGBM, RF, and CatBoost provided more competitive results when class balance was considered.
Agreement-based metrics also showed limited differences among the leading models. RF achieved the highest Cohen’s Kappa (0.447), QWK (0.561), and MCC (0.449) values, indicating a slightly stronger agreement between predicted and observed damage classes. LGBM remained close to RF in these metrics, with Cohen’s Kappa, QWK, and MCC values of 0.435, 0.549, and 0.441, respectively. The similar scores obtained by LGBM, RF, CatBoost, ET, and HistGB suggest that these models produced competitive global performance profiles, with differences depending on the selected evaluation criterion. In contrast, AdaBoost produced the lowest scores across the global evaluation metrics, with a Balanced Accuracy of 0.511, indicating a weaker capacity to discriminate damage classes in a balanced manner.
Overall, the global evaluation results show that model performance was metric-dependent rather than dominated by a single algorithm. LGBM achieved the highest Balanced Accuracy and therefore provided the most favorable result according to the primary imbalance-sensitive metric, while RF showed the strongest agreement-based performance. GBM and XGBoost achieved higher Overall Accuracy and Weighted-F1 values, but their lower Balanced Accuracy values indicate a less balanced class-wise prediction profile. Therefore, the global performance comparison highlights LGBM, RF, CatBoost, ET, and HistGB as the most competitive models under the independent test-set evaluation, with each model showing slightly different strengths across the evaluation metrics.
To further evaluate the generalization behavior of the optimized models and to examine possible overfitting tendencies, the training-set and independent test-set performances were compared using four representative metrics: Accuracy, Balanced Accuracy, Macro-F1, and ROC-AUC (Table 4). The corresponding generalization gap values were calculated as the arithmetic difference between training and independent test performance. These metrics were selected to jointly represent overall classification success, class-balance-sensitive performance, macro-averaged class-wise prediction quality, and threshold-independent probabilistic discrimination.
Table 4.
Training and independent test-set performance comparison of the optimized models.
The train–test comparison showed that LGBM exhibited the smallest performance gaps among all models, with gaps of 0.038 for Accuracy, 0.046 for Balanced Accuracy, 0.039 for Macro-F1, and 0.020 for ROC-AUC. CatBoost also showed relatively low gaps, with values of 0.063, 0.072, 0.065, and 0.036 for the same metrics, respectively. RF achieved the joint-highest independent test Balanced Accuracy with LGBM (0.650), while its train–test gaps were 0.085 for Accuracy, 0.085 for Balanced Accuracy, 0.098 for Macro-F1, and 0.067 for ROC-AUC.
Among the remaining models, ET, GBM, XGBoost, HistGB, and AdaBoost showed larger gaps in one or more metrics. ET had gaps of 0.145 for Accuracy, 0.147 for Balanced Accuracy, and 0.159 for Macro-F1. GBM achieved the highest independent test Accuracy (0.658), but showed gaps of 0.134 for Accuracy and 0.156 for Macro-F1. XGBoost achieved the highest independent test ROC-AUC (0.821), with a ROC-AUC gap of 0.095. AdaBoost showed the lowest independent test Balanced Accuracy (0.511) and the largest Balanced Accuracy gap (0.170). Overall, these results indicate that the magnitude of train–test differences varied among the models, with LGBM showing the lowest generalization gaps across the evaluated metrics.
3.2. Class-Wise Discrimination Capacity (ROC–AUC Analysis)
The ability of the models to discriminate among damage levels was evaluated using ROC curves and AUC values, which provide threshold-independent measures of classification performance on the independent test set (Figure 6). Because the problem has a multi-class structure, the analyses were conducted using an OvR approach for each damage class. ROC curves visualize the trade-off between sensitivity and the false positive rate at different decision thresholds, while AUC summarizes the overall discrimination capacity of the model.
Figure 6.
Class-wise One-vs-Rest ROC curves and AUC scores for the eight models.
Macro-AUC values, which represent global discrimination capacity across all classes, ranged from 0.733 for AdaBoost to 0.821 for XGBoost. Weighted-AUC values showed a similar pattern, ranging from 0.710 for AdaBoost to 0.807 for XGBoost. According to Macro-AUC, XGBoost achieved the highest discrimination performance, followed closely by GBM (0.819), LGBM (0.817), and CatBoost (0.817). The fact that LGBM achieved the highest Balanced Accuracy, whereas XGBoost ranked first in Macro-AUC, indicates that model performance can be evaluated from different perspectives depending on the selected metric. Specifically, XGBoost showed a stronger profile in terms of probabilistic discrimination among classes, while LGBM provided more balanced results in threshold-dependent and class-balance-oriented metrics. In contrast, AdaBoost produced the lowest Macro-AUC value (0.733), clearly separating it from the other ensemble models.
At the class level, all models achieved their highest discrimination performance for the Heavy–Collapse category. In this operationally critical class, XGBoost (0.866) and GBM (0.863) produced the highest AUC scores, indicating a strong probabilistic discrimination profile for distinguishing heavily damaged or collapsed buildings from the other classes. Similarly, the No-Damage class was also discriminated relatively well by the models, with LGBM and XGBoost sharing the highest AUC value in this category (0.841). RF, GBM, and CatBoost also produced very close No-Damage AUC values of 0.840, indicating that the leading models had comparable discrimination capacity for this class.
In contrast, AUC values decreased noticeably across all models for the Slight–Moderate class. Even the best-performing model for this class, XGBoost, reached only 0.755, while AdaBoost declined to 0.630. This reduction in performance for the intermediate damage level indicates class overlap and decision-boundary uncertainty, likely because slightly and moderately damaged buildings share structural and observational similarities with both undamaged and heavily damaged buildings. Overall, the ROC-AUC results show that XGBoost and GBM provided the strongest probabilistic discrimination profiles, whereas LGBM, CatBoost, and RF remained highly competitive with only small differences in Macro-AUC and Weighted-AUC values. These findings indicate that ROC-AUC-based model ranking was broadly consistent among the leading models, but not identical to the ranking obtained from threshold-dependent and class-balance-sensitive metrics.
3.3. Class-Wise Performance Profiles
To further examine the overall picture provided by the global metrics, class-wise Balanced Accuracy, Recall, Specificity, Precision, and F1-score were analyzed for each damage level, as shown in Figure 7. This sub-analysis reports threshold-dependent performance indicators that directly reflect the prediction balance at the class level. Accordingly, it allows the evaluation of not only the overall success of each model, but also the specific prediction profiles they exhibit across different damage classes.
Figure 7.
Comparative heatmaps of class-wise performance metrics by damage level.
For the Heavy–Collapse class (Class 2), which is the most critical category from the perspectives of disaster management and life safety, the highest OvR Balanced Accuracy was obtained by CatBoost (0.778). This model was followed by LGBM (0.773) and RF (0.771). For the same damage class, CatBoost (0.729) and LGBM (0.725) produced the highest Recall values, indicating a stronger ability to identify dangerous buildings without overlooking them. HistGB also achieved a high Recall value for this class (0.722), although its Precision remained lower than those of GBM and XGBoost. In contrast, AdaBoost showed a considerably lower Recall value of 0.423 for this class, suggesting that it failed to correctly detect a substantial proportion of heavily damaged or collapsed buildings. On the other hand, GBM and XGBoost achieved Precision values of 0.695 and 0.692, respectively, indicating more reliable positive predictions for the Heavy–Collapse class. However, their lower Recall values for this class, 0.624 and 0.629, respectively, show that these models followed a more conservative Heavy–Collapse prediction profile.
For the dominant class in the dataset, Slight–Moderate (Class 1), most models achieved relatively high Recall values. AdaBoost produced the highest Recall for this class (0.815), but its Specificity remained low (0.404). This indicates that the model tended to assign uncertain cases to the majority Slight–Moderate class. GBM and XGBoost also produced high Recall values for this class, with scores of 0.754 and 0.747, respectively, but this was accompanied by lower Specificity values. In terms of F1-score, which balances Recall and Precision, GBM achieved the highest value for Class 1 (0.698), followed closely by XGBoost (0.695) and Adaboost (0.667).
For the least represented class, No-Damage (Class 0), performance differences among models became more pronounced. LGBM reached a Balanced Accuracy of 0.747 and a Recall of 0.670 for this class, showing a more balanced class-wise profile in distinguishing undamaged buildings from damaged ones. HistGB produced the same Recall value for No-Damage buildings (0.670), while ET achieved a very similar Balanced Accuracy value (0.746). In contrast, AdaBoost produced a Recall of only 0.294 for this class, indicating limited ability to correctly identify undamaged buildings. Although XGBoost achieved a high Specificity value of 0.914 for Class 0, its Recall remained at 0.479, suggesting that the model was more selective when assigning buildings to the No-Damage class. A similar pattern was also observed for GBM, which showed high Specificity for the No-Damage class (0.917) but lower Recall (0.490).
Overall, the class-wise metrics indicate that CatBoost provided the strongest profile in terms of Recall and F1-score for the Heavy–Collapse class, while LGBM produced one of the most balanced profiles for identifying the No-Damage class. RF showed a comparatively stable profile across the three damage classes and achieved the highest F1-score for the Slight–Moderate class after GBM and XGBoost. XGBoost and GBM, in contrast, exhibited a more precision-oriented and conservative prediction profile, particularly for the Heavy–Collapse and No-Damage classes. These findings show that model performance cannot be fully explained by a single global metric and that each model offers different operational advantages across damage classes.
3.4. Confusion Matrix-Based Error Profiles
The classification behavior and error distributions of the eight ML models on the independent test set were quantitatively evaluated using the confusion matrices presented in Figure 8. The diagonal elements of the matrices represent correct classifications, whereas the off-diagonal elements indicate misclassifications among damage classes. The confusion matrices were computed only for the independent test subset; therefore, the row totals correspond to the test-set supports of 1094 No-Damage, 2428 Slight–Moderate, and 1462 Heavy–Collapse test-set samples. This analysis reveals not only how many correct predictions each model produced, but also which damage classes were most frequently confused and how these errors should be interpreted from a disaster management perspective.
Figure 8.
Confusion matrices showing the prediction distributions of the eight ML models on the test set.
For the Heavy–Collapse class (Class 2), which is the most critical category for post-earthquake emergency response and life safety, CatBoost achieved the highest number of correct classifications, with 1066 correctly identified samples out of 1462 Heavy–Collapse test-set samples, corresponding to a recall of 72.91%. LGBM (1060; 72.50%) and HistGB (1056; 72.23%) followed with very close values. In contrast, AdaBoost correctly classified only 619 samples in this class, corresponding to a recall of 42.34%, indicating a more limited capacity to distinguish Heavy–Collapse cases compared with the other models. When the false negative distribution was examined, XGBoost classified 481 heavily damaged or collapsed buildings as Slight–Moderate and 61 as No-Damage. A similar error pattern was observed for GBM, which assigned 496 Heavy–Collapse samples to the Slight–Moderate class. Such errors are particularly important from a disaster management perspective because assigning heavily damaged or collapsed buildings to lower damage classes may adversely affect emergency response prioritization.
For the dominant Slight–Moderate class (Class 1), the highest numbers of correct classifications were observed for AdaBoost (1979; 81.51%), GBM (1830; 75.37%), and XGBoost (1814; 74.71%). This indicates that these models tended to concentrate their predictions on the dominant Slight–Moderate category. In terms of misclassification patterns, HistGB and LGBM assigned 544 and 522 samples from this class, respectively, to the higher Heavy–Collapse category. This finding suggests that LGBM and HistGB tended to assign uncertain cases to a higher damage class, reflecting a more safety-oriented overestimation profile. Although such overestimations are treated as errors in terms of overall accuracy, they may have a different operational meaning in preliminary post-earthquake assessment, where avoiding the omission of risky buildings is often a priority.
For the No-Damage class (Class 0), the highest numbers of correct classifications were obtained by LGBM (733; 67.00%) and HistGB (733; 67.00%), followed by CatBoost (721; 65.90%) and ET (713; 65.17%). The lowest number of correct predictions was recorded for AdaBoost (322; 29.43%). The most prominent error pattern in this class was the assignment of undamaged buildings to the Slight–Moderate class. This error was particularly frequent for AdaBoost (719), XGBoost (499), and GBM (486), indicating that these models had difficulty separating undamaged buildings from those with slight damage. Although these errors are less critical than classifying severely damaged buildings as lower-risk cases, they may still reduce the efficiency of field prioritization by increasing false alarms.
Overall, the confusion matrices show that CatBoost, LGBM, and HistGB exhibited a relatively more sensitive profile in detecting the Heavy–Collapse class, whereas XGBoost, GBM, and AdaBoost concentrated their predictions more strongly on the Slight–Moderate class. Accordingly, the first group can be characterized by a more safety-oriented damage detection profile, while the second group reflects a more majority-class-oriented prediction tendency. These findings indicate that model selection should not be based solely on overall accuracy but should also consider the operational consequences of different error types in disaster management.
3.5. Interpretation of Model Decisions Using SHAP
Explainability analyses were conducted on the LGBM model, which achieved the joint-highest Balanced Accuracy on the independent test set and showed a competitive performance profile across global, class-wise, and probabilistic evaluation metrics. In addition, the train–test comparison showed that LGBM had the smallest generalization gaps across Accuracy, Balanced Accuracy, Macro-F1, and ROC-AUC, supporting its stable performance beyond the training data. The selection of LGBM for SHAP interpretation was not intended to imply that this model dominated all evaluation criteria. As shown in the previous sections, RF produced slightly stronger agreement-based metrics, XGBoost and GBM achieved the highest ROC-AUC values, and CatBoost provided the strongest Heavy–Collapse recall and F1-score. However, the main priority of this study was to interpret a model that provided a favorable compromise between imbalance-sensitive performance, class-wise prediction balance, generalization stability, and operational relevance.
In this context, LGBM was selected because it achieved the highest Balanced Accuracy together with RF, maintained high recall for both the No-Damage and Heavy–Collapse classes, remained highly competitive in Macro-AUC and Weighted-AUC, and showed the most limited train–test performance gaps among the evaluated models. This performance profile makes LGBM suitable for explaining the decision mechanisms of a model that does not only favor the dominant Slight–Moderate class, but also preserves meaningful sensitivity to the two operationally important extreme classes while maintaining stable generalization behavior. Therefore, SHAP analysis was performed on the LGBM model as the selected representative model for explainability. TreeExplainer, which is computationally efficient for tree-based models, was used, and model decisions were evaluated through global importance rankings and Heavy–Collapse-focused dependence patterns. The class-wise SHAP results computed for LGBM are presented as a stacked bar plot in Figure 9. In this plot, the total length of each bar represents the overall mean absolute contribution of the corresponding variable to model decisions. The colored components show how this total contribution is distributed across the three damage classes: No-Damage, Slight–Moderate, and Heavy–Collapse. Therefore, Figure 9 represents the relative magnitude of variable contributions to model decisions rather than the direction of their effects.
Figure 9.
Class-wise grouped SHAP importance plot for the LGBM model, showing the mean absolute SHAP contribution magnitudes of predictor variables.
When the total mean absolute SHAP contributions were examined, Building Age (0.500) emerged as the most influential variable in model decisions. It was followed by Lithology (0.429) and Number of Floors (0.429). A second group of influential variables included Structural System (0.357), Plinth Area (0.322), and Distance to Fault (0.321), whereas PGA (0.169), Building Position (0.112), and Occupancy Type (0.083) showed lower contribution levels. This ranking indicates that building age, geological unit, and number of floors were more influential in the overall decision structure of the model, while variables such as PGA and occupancy type contributed more modestly in this dataset.
The class-wise contribution profiles further revealed distinct patterns across damage levels. For the No-Damage class, the highest contributions were obtained from Lithology (0.213), Building Age (0.207), and Number of Floors (0.190). For the Slight–Moderate class, the contribution pattern differed, with Structural System (0.127), Distance to Fault (0.110), and Plinth Area (0.101) ranking as the three most influential variables. For the Heavy–Collapse class, the most prominent contributions were concentrated in Building Age (0.234), Number of Floors (0.199), and Lithology (0.190), while Structural System (0.141) also provided a secondary but meaningful contribution. These findings indicate that critical damage predictions were strongly influenced by both structural and geological variables, particularly building age, number of floors, lithology, and structural system.
In addition to the raw grouped mean(|SHAP|) values shown in Figure 9, normalized SHAP contribution percentages were calculated to improve interpretability (Table 5). The grouped mean absolute SHAP value of each feature-class combination was divided by the total sum of all feature-class contributions and multiplied by 100. This normalization does not change the relative ranking of the variables, but allows the contribution of each predictor to be interpreted more directly as a percentage share of the total SHAP-based explanation. A similar normalization strategy was used by [61], who applied ML and SHAP values to rapid visual screening features for seismic vulnerability ranking and expressed feature contributions as percentages of the total model explanation.
Table 5.
Normalized class-wise SHAP contribution percentages of the selected LGBM model. The grouped mean absolute SHAP contributions were normalized by the total sum of all feature-class contributions and expressed as percentages.
The normalized SHAP contribution table confirmed the dominance of a small group of structural and site-related variables. Building Age had the highest total contribution (15.499%), followed by Lithology (13.309%), Number of Floors (13.305%), Structural System (11.083%), Plinth Area (9.989%), and Distance to Fault (9.970%). For the Heavy–Collapse class, Building Age (7.254%), Number of Floors (6.167%), and Lithology (5.907%) showed the highest class-specific contributions, indicating that severe damage predictions were mainly influenced by the combined effects of building vulnerability and local geological conditions. The importance of the Number of Floors for the Heavy–Collapse class is also consistent with the reviewer-recommended study, which emphasized the role of structural characteristics such as the number of storeys in severe damage-related limit-state interpretation.
The SHAP dependence plots presented in Figure 10 show the direction of variable contributions and approximate threshold regions for the Heavy–Collapse output. For Building Age, the contribution sign shifted from negative to positive at approximately 18 to 20 years, while buildings older than 40 years showed clearly positive SHAP contributions, reaching higher positive values in older age ranges. For Number of Floors, the contribution was negative for one-story buildings, near neutral for two-story buildings, and positive for buildings with three or more floors. The Heavy–Collapse-oriented contribution became stronger, particularly for buildings with six or more floors. For the Plinth Area, negative contributions were observed approximately within the 100 to 220 m2 range, whereas values above about 250 m2 shifted into the positive contribution band. These patterns suggest that older, multi-story buildings with larger footprint areas contributed more strongly to Heavy–Collapse predictions.
Figure 10.
SHAP dependence plots for the Heavy–Collapse class, showing local contribution patterns of key predictor variables.
The effects of geological and fault-proximity variables were nonlinear. For Lithology, the code-based separation was clear: HOP (Hatay Ophiolite) mostly produced negative contributions, SOF (Sofular Formation) showed clearly positive contributions, ALV (Alluvium) and BLV (Belveren Formation) generally produced moderate positive contributions, and TPH (Tepehan Formation) showed more limited positive effects. This pattern indicates that Lithology captured a site-specific component of the observed damage distribution rather than acting only as a categorical background variable. In particular, the positive contributions of SOF, ALV, and BLV are consistent with the tendency of softer sedimentary or alluvial units to amplify shaking and interact with building vulnerability, whereas the negative contribution of HOP may reflect comparatively more competent ground conditions. Therefore, the lithology effect should be interpreted together with the actual spatial distribution of damage, local ground conditions, and building characteristics. For Distance to Surface Rupture, strong positive contributions were observed at very short distances from the surface rupture, particularly below approximately 200 m. As distance increased, the contribution weakened and became negative at farther distances. For Distance to Fault, the relationship was not monotonic: positive contributions appeared at short distances, shifted toward negative values in the intermediate distance range, and became positive again in some farther distance bands. This fluctuating pattern indicates that fault proximity did not produce a simple linear effect and should be interpreted together with local ground conditions and building characteristics.
Topographic and typological variables also showed discriminative patterns. For Slope, contributions were mostly positive at low slope values, whereas they generally shifted to negative values above approximately 7°, with the lowest contributions observed in the moderate-to-high slope range. For Structural System, RC/RCF (Reinforced Concrete) categories predominantly produced negative contributions, while UMA (Unreinforced Masonry, Adobe) showed clearly positive contributions. UMB (Unreinforced Masonry, Brick) and UMS (Unreinforced Masonry, Stone) also generally contributed positively. For Building Position, detached buildings were concentrated in the negative contribution cluster, whereas attached and block-attached buildings showed more pronounced positive contributions. For Occupancy Type, RES (Residential) mostly produced neutral or low contributions, while COM (Commercial), PUB (Public), and some commercial or warehouse-type uses showed more visible positive contribution clusters. The SHAP contributions of PGA remained more limited compared with the main structural and geological variables, with contribution values forming both positive and negative clusters in specific value ranges.
Overall, the SHAP findings indicate that Heavy–Collapse decisions were not driven by a single input, but by threshold-sensitive and nonlinear combined effects of building stock characteristics, including age, number of floors, and structural system, together with geological unit, proximity to faults and surface ruptures, and topographic context. These patterns support the engineering interpretability of the model decisions. However, SHAP results should not be interpreted as direct evidence of causality, but rather as an explainable representation of the relationships learned by the model.
To complement the global and class-wise SHAP interpretations, representative local SHAP explanations were also examined for selected independent test-set cases (Appendix A Figure A1). These local examples show how the 11 original predictors contributed positively or negatively to the model output for individual No-Damage, Slight–Moderate, and Heavy–Collapse cases. The local SHAP outputs support the case-level transparency of the model by illustrating that individual predictions were shaped by different combinations of structural, geological, topographic, and seismic variables rather than by a single dominant predictor.
4. Discussion
4.1. Integrated Evaluation of Model Performance in Damage Prediction
The findings of this study indicate that model performance in seismic building damage prediction cannot be adequately explained through a single “best model” perspective. Instead, different models offer different advantages corresponding to distinct operational priorities in disaster management. The earthquake damage prediction literature also emphasizes that model performance should not be evaluated solely using Overall Accuracy, but should be interpreted together with multiple metrics such as Recall, Precision, F1-score, ROC-AUC, Cohen’s Kappa, Balanced Accuracy, and MCC, particularly under imbalanced class distributions [14,19,25,54,55]. This is particularly important for imbalanced datasets, where focusing only on overall accuracy may overemphasize performance in the majority class and mask weaknesses in underrepresented but operationally critical damage classes. Therefore, balanced metrics such as Balanced Accuracy and MCC provide a more reliable basis for evaluating model performance under class imbalance [54,55].
In this context, the independent test-set results showed that LGBM and RF achieved the joint-highest Balanced Accuracy value (0.650), indicating that both models provided the most favorable class-balance-sensitive performance profiles. However, RF produced slightly higher agreement-based metrics, with MCC, Cohen’s Kappa, and QWK values of 0.449, 0.447, and 0.561, respectively, while LGBM remained very close with corresponding values of 0.441, 0.435, and 0.549. This result indicates that LGBM and RF should be interpreted as closely competitive models rather than as a case in which one model clearly dominated all evaluation criteria. CatBoost, ET, and HistGB also produced close Balanced Accuracy values of 0.648, 0.645, and 0.640, respectively, suggesting a competitive performance range among the leading ensemble models. This finding supports the view that Balanced Accuracy and MCC are more informative than overall accuracy alone in imbalanced multi-class settings [54,55]. The balanced profile of LGBM can be associated with its histogram-based splitting strategy, leaf-wise growth mechanism, and regularization components. Ref. [51] reported that the LGBM architecture provides computational efficiency for large-scale datasets, while Ref. [16] identified LGBM as a strong alternative in seismic damage prediction because of its high accuracy and low computational cost.
The train–test comparison further supports this interpretation by showing that model reliability should also be evaluated in terms of generalization stability. Previous ML-based seismic damage studies have reported training and test performance together to assess whether high training scores are transferred to unseen data and to identify possible overfitting tendencies [41]. Similarly, recent seismic ML studies have emphasized the importance of robustness, validation, and overfitting control when applying advanced models to earthquake-related prediction problems [14,19]. In the present study, LGBM produced the smallest train–test gaps across all four representative metrics, with differences of 0.038 in Accuracy, 0.046 in Balanced Accuracy, 0.039 in Macro-F1, and 0.020 in ROC-AUC. This indicates that LGBM not only achieved one of the strongest independent test-set performances but also transferred its training performance to unseen data more consistently than the other models. CatBoost also showed moderate train–test gaps, whereas ET, GBM, XGBoost, and AdaBoost exhibited larger decreases in one or more metrics. These larger gaps do not invalidate their independent test-set performance, but they indicate stronger overfitting or reduced generalization tendencies compared with LGBM.
The performance of HistGB is also one of the notable findings of this study. In the seismic damage prediction literature, models such as LGBM, XGBoost, and RF have been more frequently evaluated, whereas the use of HistGB in this context has remained relatively limited. Although HistGB did not produce the highest global performance values, it remained competitive in terms of Balanced Accuracy (0.640) and achieved a high Recall value for the Heavy–Collapse class (0.722). The present findings therefore suggest that HistGB may serve as a computationally practical and competitive model candidate for rapid post-earthquake damage prediction. However, this result should not be interpreted as evidence that HistGB is superior to other models, but rather as an indication that histogram-based gradient boosting approaches offer strong alternatives for this problem.
XGBoost and GBM showed strong performance in terms of overall and probabilistic discrimination metrics. GBM achieved the highest Overall Accuracy (0.658) and Weighted-F1 (0.654), while XGBoost followed closely with an Overall Accuracy of 0.654 and Weighted-F1 of 0.649. In terms of ROC-AUC, XGBoost achieved the highest Macro-AUC value (0.821), followed by GBM (0.819). This indicates that these models were effective in terms of overall classification success and probabilistic discrimination capacity. Studies such as Refs. [4,5] have similarly reported that XGBoost can produce high overall accuracy in earthquake damage prediction problems. Nevertheless, in imbalanced datasets, high Overall Accuracy and ROC-AUC values should be interpreted together with class-wise metrics. In this study, although XGBoost and GBM performed strongly in terms of AUC and overall accuracy, their Balanced Accuracy values were lower than those of LGBM, RF, CatBoost, ET, and HistGB, and their Recall values for the Heavy–Collapse class remained at 0.629 and 0.624, respectively. This indicates that these models followed a more conservative prediction profile for the most critical damage class.
From a practical perspective, the moderate overall accuracy values obtained in this study should be interpreted in the context of real-world post-earthquake field inventories rather than idealized or simulation-based datasets. Real field damage datasets commonly include class imbalance, uncertain boundaries between damage states, human-induced labeling variability, incomplete structural information, and hidden building-level vulnerabilities. Therefore, overall accuracy values around the mid-60% range are not unusual in empirical regional earthquake damage assessment studies based on macroscopic building attributes. Previous studies using real post-earthquake damage inventories have reported comparable performance levels, such as approximately 64% in [10], 66% in [6], and 67% in [62]. Accordingly, the performance values obtained in the present study should not be evaluated only through Overall Accuracy, but should be interpreted together with ROC-AUC, Balanced Accuracy, class-wise Recall, agreement-based metrics, and explainability outputs. In this study, the leading models achieved Macro-AUC values above 0.80, and the Heavy–Collapse class was detected with Recall values up to 0.729, indicating that the framework can provide useful support for preliminary screening and prioritization.
From a disaster management perspective, the most critical issue is the correct identification of heavily damaged or collapsed buildings. CatBoost achieved the highest Recall value for the Heavy–Collapse class (0.729) and also produced the highest F1-score for this class (0.680), providing an important advantage in life-safety-oriented scenarios where reducing false negatives is a priority. Ref. [19] reported that CatBoost and LGBM can produce strong and stable performance in imbalanced earthquake damage datasets. In addition, Refs. [4,6] emphasized that rapid damage assessment is critical for post-earthquake emergency response, recovery, and prioritization. In this context, the high-sensitivity profile of CatBoost makes it an operationally valuable candidate for rapid preliminary screening scenarios in which heavily damaged or collapsed buildings should not be overlooked. LGBM also showed a similar safety-relevant profile, with a Heavy–Collapse Recall of 0.725 and a No-Damage Recall of 0.670, suggesting that it maintained sensitivity to both operationally important extreme classes.
The intermediate Slight–Moderate class produced substantial uncertainty in model performance and showed the highest false-positive tendency among the damage categories. The lower AUC values and confusion matrix errors observed for this class indicate that intermediate damage levels have a transitional character in both structural and observational terms. Ref. [10] noted that assigning a precise damage level to buildings that fall between two damage grades during field observations is often difficult. Similarly, Ref. [18] associated the confusion observed in the moderate damage class with the inherently ambiguous and transitional nature of this class in field assessments. Therefore, the performance reduction observed for the Slight–Moderate class should not be interpreted solely as an algorithmic limitation but also as a classification uncertainty arising from the non-sharp physical and observational boundaries of the target classes. During the model development stage, the original Slight and Moderate damage labels were also examined as separate categories. However, this more detailed class structure increased confusion between adjacent damage levels, because the distinction between Slight and Moderate damage is visually subtle and partly observer-dependent in rapid post-earthquake field assessments. Therefore, these two categories were combined into a single Slight–Moderate class to reduce label ambiguity and obtain a more stable damage taxonomy for rapid preliminary screening. This aggregation is consistent with previous real-world earthquake damage prediction studies, which have emphasized that broader, action-oriented damage classes can reduce confusion among intermediate damage states and improve the practical usability of ML-based regional damage assessment [7,10]. Although separating Slight and Moderate damage may reduce within-class heterogeneity in theory, the present findings indicate that, without richer structural, visual, and engineering-level information, such a split may redistribute the existing confusion between adjacent classes rather than improve practical performance. The high Recall values obtained by AdaBoost (0.815), GBM (0.754), and XGBoost (0.747) for this class further indicate that some models tended to concentrate their predictions on the dominant Slight–Moderate category, which improved majority-class detection but reduced class-wise balance.
AdaBoost produced the lowest performance across most global and class-wise metrics. Ref. [19] reported that AdaBoost may produce acceptable results for majority classes but can show inconsistent performance for underrepresented classes. In the present study, AdaBoost achieved high Recall for the Slight–Moderate class but low Specificity, indicating that its predictions were concentrated toward the majority class and that its ability to distinguish underrepresented classes was limited. This behavior was also reflected in its low Balanced Accuracy (0.511), Macro-F1 (0.526), MCC (0.306), and Heavy–Collapse Recall (0.423). In contrast, RF produced one of the most stable overall profiles, achieving the joint-highest Balanced Accuracy and the highest agreement-based metrics. Although Ref. [7] reported substantial differences between training and test performance for RF in some seismic damage prediction problems, the present independent test-set results show that RF can still provide strong and reliable performance when evaluated within a consistent preprocessing, optimization, and testing framework.
Overall, the results indicate that LGBM and RF provided the strongest general profiles when class balance and decision consistency were considered together. LGBM was particularly suitable as a representative model for explainability because it achieved the joint-highest Balanced Accuracy, maintained high Recall for both No-Damage and Heavy–Collapse classes, and remained competitive in ROC-AUC-based evaluation. RF showed the strongest agreement-based performance, CatBoost was the most advantageous model for life-safety-oriented Heavy–Collapse detection, and XGBoost and GBM provided the strongest probabilistic and overall accuracy-oriented profiles. HistGB emerged as a computationally practical and competitive alternative, whereas AdaBoost showed a clear tendency toward the dominant Slight–Moderate class. Therefore, model selection should be guided by the intended operational use: Recall should be prioritized when avoiding missed heavily damaged buildings is the main objective; Precision and AUC become more relevant when reducing false alarms and refining resource allocation are more important; and Balanced Accuracy, MCC, and Kappa should be considered more decisive when overall class balance and decision consistency are the primary concerns.
4.2. Interpreting Damage Drivers Through SHAP
The findings obtained from SHAP analysis indicate that the LGBM model did not rely on a single variable in seismic damage prediction. Instead, it accounted for the nonlinear combined effects of variables related to structural vulnerability, local geological conditions, seismotectonic proximity, and building typology. This pattern is broadly consistent with the literature emphasizing that earthquake damage is shaped not only by ground-motion intensity but also by the combined influence of factors such as building age, number of floors, structural system, plinth area, ground conditions, and proximity to faults or surface ruptures [4,6,7,10,16]. Nevertheless, SHAP values should not be interpreted as direct evidence of causality. Ref. [41] emphasized that ML models cannot directly establish definite causal relationships between input variables and damage grades. Refs. [14,16] similarly noted that the primary function of SHAP is to explain model decisions and improve algorithmic transparency.
Building age was among the variables with the highest contribution to model decisions. This result is consistent with studies indicating that older buildings may exhibit greater vulnerability because of material deterioration, insufficient maintenance, reduced load-bearing capacity, construction deficiencies, and the possibility of having been constructed under older seismic codes [7,10,16,33,40]. Similarly, the contribution of the number of floors to Heavy–Collapse predictions is meaningful from an engineering perspective. The number of floors is a compound vulnerability indicator related to building height, mass distribution, natural vibration period, lateral stiffness, and irregularity potential. Refs. [5,13,16] also reported that the number of floors and building height play a decisive role in seismic response and damage classification. This finding is consistent with [61], who reported that structural characteristics such as the number of storeys, together with soft-storey/short-column effects, infill-wall regularity, seismic-code deficiency, and structural irregularities, contributed to distinguishing severe damage and collapse-related limit states in reinforced concrete buildings.
The SHAP patterns associated with the structural system variable are also consistent with earthquake engineering literature. The relatively low or negative contribution of reinforced concrete systems toward Heavy–Collapse, in contrast to the positive contributions of unreinforced masonry, adobe, stone, or brick masonry systems, can be explained by differences in ductility and brittle behavior. However, the similar SHAP contribution observed for steel structures and unreinforced brick masonry should be interpreted cautiously. This similarity does not imply that these two structural systems have equivalent inherent seismic vulnerability. From an engineering perspective, unreinforced masonry is generally expected to be more vulnerable, whereas properly designed and detailed steel structures may perform better under seismic loading. In the present dataset, this pattern may instead be related to region-specific inventory and assessment conditions after the 2023 Kahramanmaraş earthquakes, as well as the limited and heterogeneous representation of steel structures in the regional building stock. Ref. [2] noted that post-earthquake damage assessment procedures are mainly structured around reinforced concrete and masonry buildings, whereas less common or non-standard structural systems may be more difficult to evaluate consistently in rapid field assessments. In addition, field observations after the Kahramanmaraş earthquakes indicate that the affected building stock included non-engineered or poorly detailed structures, irregular construction practices, and deficiencies in inspection and code compliance [33]. In this context, the steel category in the inventory may include local lightweight, industrial, agricultural, or non-standard steel-type structures rather than representing only fully code-compliant engineered steel frames. Moreover, the SHAP profile of this category may also be affected by its co-occurrence with other risk-related variables such as building age, occupancy type, lithology, and proximity to rupture or faults. Accordingly, the observed SHAP pattern should be interpreted as a dataset-specific conditional contribution learned from the available field inventory, rather than as evidence that steel structures are generally as vulnerable as unreinforced masonry. Refs. [4,7] identified structural system type as an important variable in earthquake damage prediction, particularly noting that adobe, stone masonry, and buildings constructed with weak bonding materials are associated with higher damage levels. The contribution of the Plinth Area can also be interpreted as an indirect vulnerability indicator related to overall building size, seismic weight, occupancy characteristics, plan complexity, and potential irregularities [6,7,10]. The higher contributions observed for attached or block-attached buildings in the Building Position variable may be associated with interaction between adjacent structures and seismic pounding effects. Field observations from heavily affected provinces after the 2023 Kahramanmaraş earthquakes also indicate that poor reinforcement detailing, material quality problems, frame discontinuities, insufficient stair support conditions, and adjacent building effects contributed to observed structural damage patterns in reinforced concrete buildings [40]. Similarly, site investigations after the Kahramanmaraş earthquakes reported extensive structural damage in reinforced concrete buildings and emphasized the role of ductility, design-level demands, and structural detailing in observed failure patterns [33].
The high SHAP contribution of Lithology highlights the importance of local ground conditions in the spatial distribution of building damage, which is consistent with recent dataset-based and field-oriented studies showing that observed damage after the 2023 Kahramanmaraş earthquakes cannot be interpreted independently of local ground conditions and ground-motion characteristics [20,32]. In the present study, this effect was derived from actual building-level damage observations and therefore reflects how the observed damage labels varied across different lithological settings in the Kırıkhan inventory. The negative SHAP contributions associated with Hatay Ophiolite may indicate comparatively more competent ground conditions, whereas the positive contributions of the Sofular Formation, Alluvium, and Belveren Formation are consistent with the greater sensitivity of softer sedimentary and alluvial units to local site effects. Local geological units may influence structural damage patterns through soil amplification, bearing capacity, liquefaction potential, groundwater conditions, and dynamic ground behavior. Ref. [19] noted that soil-structure interaction plays an important role in seismic damage prediction, while Ref. [32] emphasized that local site effects, strong ground-motion characteristics, and near-field intensity measures contributed to the observed damage patterns after the 2023 Kahramanmaraş earthquakes. Similarly, field-based observations after the earthquake have reported that damage concentration was strongly affected by local soil conditions, sedimentary basin effects, and the interaction between ground conditions and vulnerable building stock [3,33]. Refs. [42,46] also emphasized the importance of seismotectonic factors such as soil class and liquefaction potential in earthquake hazard and damage distribution. Therefore, the high contribution of Lithology suggests that the model was able to incorporate local geological differences into damage prediction. However, individual lithological units should not be interpreted directly as “safe” or “risky”; rather, they should be considered together with structural and seismotectonic variables.
Distance to fault and distance to surface rupture indicate that the model was sensitive to the seismotectonic context, which is particularly relevant for the 2023 Kahramanmaraş earthquake sequence because it involved complex interactions among major strike-slip fault systems and multiple ruptured fault segments. Near-fault effects, surface deformation, permanent displacement, directivity, pulse-like motions, and high ground-motion components can increase structural damage in areas close to faults and surface ruptures [3,32]. Ref. [18] reported that Joyner-Boore distance is an important variable for distinguishing damage classes, and Ref. [19] considered Rjb as one of the key inputs in seismic damage modeling. Refs. [42,46] also emphasized the role of distance to faults in seismic susceptibility and the spatial distribution of damage. In this study, positive Heavy–Collapse-oriented contributions at short distances to surface rupture support the potential role of near-fault and surface deformation effects in damage prediction. However, the nonlinear pattern observed for Distance to Fault indicates that the effect of fault proximity cannot be explained by distance alone and should be interpreted together with local ground conditions and building vulnerability.
The relatively limited SHAP contribution of PGA compared with variables such as building age, lithology, number of floors, and structural system does not imply that PGA is physically unimportant for earthquake damage. A more appropriate interpretation is that PGA alone may have limited discriminatory power within this specific dataset. Earthquake damage is shaped not only by peak ground acceleration but also by the combined effects of frequency content, duration, spectral acceleration, velocity components, local site amplification, near-field pulse-like motions, and the structural period of buildings [4,7,32]. In the 2023 Kahramanmaraş earthquakes, very high PGA and Peak Ground Velocity (PGV) values, great spectral demands, and near-field impulsive motions were reported, indicating that a single PGA layer may not fully represent the complexity of seismic demand controlling building damage [32]. Ref. [5] also showed that spectral accelerations at different periods and other ground-motion parameters can provide a more explanatory representation of seismic damage. In addition, since the present analysis was conducted at the district scale within Kırıkhan, PGA exhibited a comparatively narrow value range across the building inventory, as also shown by the exploratory data analysis in Figure 4. In other words, the PGA values were both high and spatially less variable within the study area, which limited their ability to separate different damage classes. Therefore, its low SHAP contribution should be associated not with the irrelevance of seismic demand, but with the limitations of PGA as a single intensity measure and its restricted spatial variability within the study area. Under such district-scale conditions, building-level and local site-related variables may become more influential in distinguishing damage classes, whereas seismic intensity variables may show greater spatial variability and potentially stronger predictive contribution in broader regional or multi-district applications.
Overall, the SHAP findings indicate that the LGBM model used variables such as building age, number of floors, structural system, plinth area, lithology, distance to faults and surface ruptures, and building position within an engineering-interpretable context for Heavy–Collapse predictions. This suggests that the proposed explainable ensemble learning approach not only provides predictive performance but also contributes to a more transparent interpretation of model decisions for rapid post-earthquake preliminary assessment and decision-support processes. Nevertheless, SHAP results should be interpreted as explainable representations of relationships learned from real field data, rather than as definitive causal mechanisms or deterministic engineering thresholds.
4.3. Implications for Post-Earthquake Damage Assessment and Disaster Management
The explainable ML approach developed in this study can be regarded as an operational framework that may support rapid preliminary assessment and decision-making after earthquakes. After major seismic events, rapid information on the spatial distribution and severity of building damage is critical for directing search-and-rescue operations, prioritizing field inspections, supporting evacuation decisions, and allocating limited resources effectively. Ref. [6] emphasized that the rapid and spatial assessment of building damage is essential for post-earthquake emergency response and recovery. In contrast, conventional building-level field inspections involve important limitations, including time and cost requirements, dependence on expert personnel, accessibility constraints, and safety risks caused by aftershocks [7,11,41]. Therefore, rapid and scalable prediction models based on real field data can provide important support for preliminary screening and prioritization in the early stages of disaster response.
The No-Damage, Slight–Moderate, and Heavy–Collapse classes used in this study allow a rapid triage logic to be established before detailed engineering inspection. Correctly identifying the Heavy–Collapse class is particularly important for life safety, evacuation, search-and-rescue activities, and the deployment of field teams. In disaster management, the costs of classification errors are not equal: assigning a heavily damaged or collapsed building to a lower damage class, that is, a false negative error, may have more serious consequences than assigning an undamaged or slightly damaged building to a higher damage class. Therefore, models such as CatBoost and LGBM, which showed high sensitivity for the Heavy–Collapse class, may be more suitable for life-safety-oriented early response scenarios. In contrast, models with stronger Precision, AUC, or overall balance may serve different operational purposes when more precise allocation of limited resources is required [2,6].
The explainability component of this study also contributes to the more transparent and auditable use of model outputs in disaster management. SHAP analysis provides decision makers not only with an answer to the question of “which building is more at risk?”, but also with insight into “which variables drive this prediction?”. Explaining the roles of variables such as building age, number of floors, structural system, lithology, and proximity to faults or surface ruptures makes the black-box prediction process more interpretable. Ref. [14] stated that XAI and SHAP-based approaches improve transparency by explaining model decisions, while Ref. [16] emphasized the importance of explainability methods in high-risk applications.
Another important application potential lies in integrating model outputs into GIS-based spatial decision-support processes. Previous GIS-based earthquake hazard and risk studies have also emphasized that spatial decision-support systems can support disaster response and recovery by rapidly integrating hazard-related criteria such as source-to-site distance, local site conditions, topography, and fault-related parameters into interpretable map products [63]. Visualizing building-level predictions in a map environment can help identify neighborhoods, streets, or building clusters where damage is spatially concentrated and can support the more effective deployment of field teams. Recent post-earthquake studies also show that inspection-derived building data can support downstream decision-making tasks beyond damage classification, including usability assessment, vulnerability interpretation, reconstruction planning, and resource allocation [64]. Ref. [7] noted that transferring ML outputs into a GIS environment enables the production of spatial damage prediction maps, while Ref. [15] emphasized that such predictions can be integrated into disaster simulation platforms to support evacuation, rescue, and medical assistance routing. GIS-based spatial decision-support approaches are also important for prioritization, hazard mapping, risk mapping, and emergency management, as previous earthquake-related GIS and Multi-Decision Criteria Analysis (MDCA) studies have shown through the integration of spatial hazard criteria and decision analysis techniques [39,42,46,65].
Nevertheless, the proposed approach should not be regarded as a substitute for official damage assessment or detailed engineering inspection, because post-earthquake safety evaluation involves field-based engineering judgment, structural inspection protocols, and reassessment procedures that cannot be fully replaced by predictive models [2]. ML models should be considered complementary tools that can support rapid preliminary screening, prioritization, and decision-making in the early post-earthquake phase. In this regard, the proposed framework should be viewed as a triage tool used before expert-based Rapid Visual Screening (RVS), helping to prioritize buildings or zones that require urgent inspection, rather than as a method that is directly equivalent to or a replacement for RVS. Ref. [21] framed such models within the scope of preliminary damage classification, while Ref. [25] emphasized that the purpose of ML methods is not to replace engineering inspection, but to accelerate first-stage pre- and post-seismic assessment processes. Therefore, the proposed approach should be interpreted as a supportive decision tool for rapid post-earthquake preliminary assessment, spatial prioritization, and field team deployment, rather than as a replacement for final structural safety decisions.
4.4. Limitations and Future Research Directions
The findings of this study indicate the potential of explainable ML models based on real field data for seismic building damage prediction. However, the results should be interpreted in light of several methodological and data-related limitations. Since the study is based only on building damage data collected from Kırıkhan, Hatay, after the 2023 Kahramanmaraş earthquakes, the direct generalizability of the model to regions with different building stocks, ground conditions, earthquake source characteristics, and damage distributions is limited. Ref. [6] emphasized that findings derived from a single earthquake should be interpreted carefully for different construction types, building heights, and damage classes. Therefore, future studies should externally validate the model across different cities, earthquake scenarios, and building inventories.
A stratified random train-test split was used for model comparison. Although this approach preserves class distribution, possible effects of spatial autocorrelation and spatial leakage cannot be fully excluded because building data are spatially clustered. Nearby buildings may share similar structural characteristics, ground conditions, and damage patterns, which can lead to dependence between training and test samples and potentially optimistic performance estimates. Refs. [10,66] highlighted the importance of representative sampling and geographic location effects in damage prediction models. Therefore, spatial block cross-validation, subregion-based partitioning, or independent spatial test areas represent important directions for future work. Although the dataset is based on official field damage assessments, visual damage grading may still involve uncertainty due to observer variability, time pressure, accessibility constraints, continuing aftershocks, and overlap among intermediate damage classes. The confusion observed in the Slight–Moderate class should therefore be interpreted not only as an algorithmic limitation, but also as a data-related limitation arising from the transitional nature of damage classes. This limitation is consistent with post-earthquake assessment experiences after the 2023 Kahramanmaraş earthquakes, where objection and reassessment processes revealed substantial classification changes, particularly in moderate and severe damage categories [2].
This study used variables that are rapidly accessible after an earthquake. However, detailed engineering parameters such as concrete strength, reinforcement details, short-column effects, soft-story conditions, shear wall ratio, foundation type, maintenance condition, workmanship quality, adjacent building effects, and code compliance were not available in the dataset, although these factors have been reported as important contributors to observed structural damage after the 2023 Kahramanmaraş earthquakes [33,40]. Similarly, seismic demand was represented by PGA, although building damage can be more comprehensively explained using multiple parameters such as spectral acceleration, PGV, Arias intensity, significant duration, frequency content, Rjb, Vs30, local site amplification, and near-field pulse-like motion indicators [5,19,25,32]. Incorporating more detailed structural, seismic, and ground-condition variables in future studies may improve the explanatory capacity of the models.
Finally, although SHAP analysis improves the interpretability of model decisions by quantifying feature contributions, it does not establish direct causal mechanisms between predictor variables and damage grades. Therefore, SHAP results should be interpreted as explainable representations of relationships learned by the model, rather than as deterministic engineering thresholds or evidence of physical causality [14,41]. Future research can further improve the operational applicability of this framework through external validation, spatial cross-validation, real-time data streams, hybrid datasets combining real-world damage observations with physics-based numerical simulations, high-resolution façade- or image-based observations from Unmanned Aerial Vehicle (UAV) and field surveys, 3D data acquisition, and GIS-based operational decision-support systems.
5. Conclusions
This study presented an ensemble learning-based approach for rapid and explainable seismic building damage prediction using 16,611 building-level real field observations collected from Kırıkhan, Hatay, after the 2023 Kahramanmaraş earthquakes. The original damage classes were reorganized into three operational levels, namely No-Damage, Slight–Moderate, and Heavy–Collapse, and eight ML models were compared under the same experimental protocol. To account for class imbalance, class-weighting strategies were used where supported by the algorithms instead of synthetic sample generation, and model performance was evaluated not only by overall accuracy but also using Balanced Accuracy, MCC, Cohen’s Kappa, QWK, ROC-AUC, and class-wise metrics. The results showed that LGBM and RF provided the strongest general profiles when class balance and decision consistency were considered together. LGBM achieved the joint-highest Balanced Accuracy and maintained high recall for both No-Damage and Heavy–Collapse classes, whereas RF produced the strongest agreement-based metrics. CatBoost showed the highest sensitivity and F1-score for the Heavy–Collapse class, while XGBoost and GBM showed stronger profiles in probabilistic discrimination and overall accuracy-oriented metrics. These findings indicate that model selection should be guided by operational priorities, particularly in life-safety- and early-response-oriented scenarios. SHAP analysis was therefore conducted on LGBM as a representative and balanced model and showed that building age, lithology, number of floors, structural system, plinth area, and proximity to faults and surface ruptures played key roles in model decisions, supporting the engineering interpretability of the predicted damage patterns in relation to building stock vulnerability, local geological conditions, and seismotectonic context. At the same time, the remaining classification uncertainty, particularly among adjacent damage states, indicates an important limitation of rapid field inventory-based ML classification, where damage boundaries are transitional, and the available predictors are necessarily macroscopic. Nevertheless, the proposed approach should not be regarded as a substitute for official damage assessment or detailed engineering inspection. Rather, it should be considered a complementary tool for early-stage preliminary assessment, damage prioritization, field team deployment, and GIS-based decision support after earthquakes. Future studies should externally validate the model in different cities and earthquake scenarios, apply spatial cross-validation strategies, incorporate more detailed engineering and ground-motion parameters, and integrate model outputs into real-time GIS-based decision-support systems.
Author Contributions
Conceptualization, C.B., K.K., S.S.Y., H.K. and S.S.B.; methodology, C.B., H.K. and S.S.B.; software, C.B. and S.S.B.; validation, C.B., K.K., S.S.Y. and S.S.B.; formal analysis, C.B. and S.S.B.; investigation, C.B. and H.K.; resources, C.B. and S.S.Y.; data curation, C.B. and S.S.Y.; writing—original draft preparation, C.B., K.K. and S.S.Y.; writing—review and editing, K.K., C.B., S.S.Y. and S.S.B.; visualization, C.B. and S.S.B.; supervision, K.K. and S.S.Y. All authors have read and agreed to the published version of the manuscript.
Funding
This research was supported under the “Cooperation Protocol for Social and Cultural Services Between Osmaniye Korkut Ata University and Osmaniye Municipality” signed on 25 April 2025. Financial support for the acquisition of the data used in this study was provided by Osmaniye Municipality. (grant number: 230980).
Data Availability Statement
Restrictions apply to the availability of these data. The building-level damage assessment data were obtained from the Republic of Türkiye Ministry of Environment, Urbanization and Climate Change and are available from the corresponding author(s) with the permission of the relevant institution.
Acknowledgments
This manuscript is derived from the doctoral dissertation research of the first author, C.B., conducted at the Department of Geomatics Engineering, Aksaray University, under the supervision of K.K. and S.S.Y., the authors. The authors gratefully acknowledge Osmaniye Municipality for its support in facilitating the acquisition of the data used in this study. The authors also thank the editor and anonymous reviewers for their constructive comments and suggestions, which helped improve the quality of the manuscript.
Conflicts of Interest
The authors declare no conflicts of interest.
Abbreviations
The following abbreviations are used in this manuscript:
| ANN | Artificial Neural Network |
| AUC | Area Under the Curve |
| DSFZ | Dead Sea Fault Zone |
| EAFZ | East Anatolian Fault Zone |
| EDA | Exploratory Data Analysis |
| ET | Extra Trees |
| GBM | Gradient Boosting Machine |
| GIS | Geographic Information System |
| HistGB | HistGradientBoosting |
| LGBM | Light Gradient Boosting Machine |
| LIME | Local Interpretable Model-Agnostic Explanation |
| MCC | Matthews Correlation Coefficient |
| MDCA | Multi-Decision Criteria Analysis |
| ML | Machine Learning |
| OvR | One-vs-Rest |
| PGA | Peak Ground Acceleration |
| PGV | Peak Ground Velocity |
| QWK | Quadratic Weighted Kappa |
| RF | Random Forest |
| ROC | Receiver Operating Characteristic |
| RVS | Rapid Visual Screening |
| SHAP | SHapley Additive exPlanations |
| SMOTE | Synthetic Minority Oversampling Technique |
| SVM | Support Vector Machine |
| UAV | Unmanned Aerial Vehicle |
| XAI | Explainable Artificial Intelligence |
Appendix A
Table A1.
Representative input–output examples for the three damage classes.
Figure A1.
Representative local SHAP explanations for selected independent test-set cases. Red bars indicate positive contributions toward the predicted damage class, while blue bars indicate negative contributions.
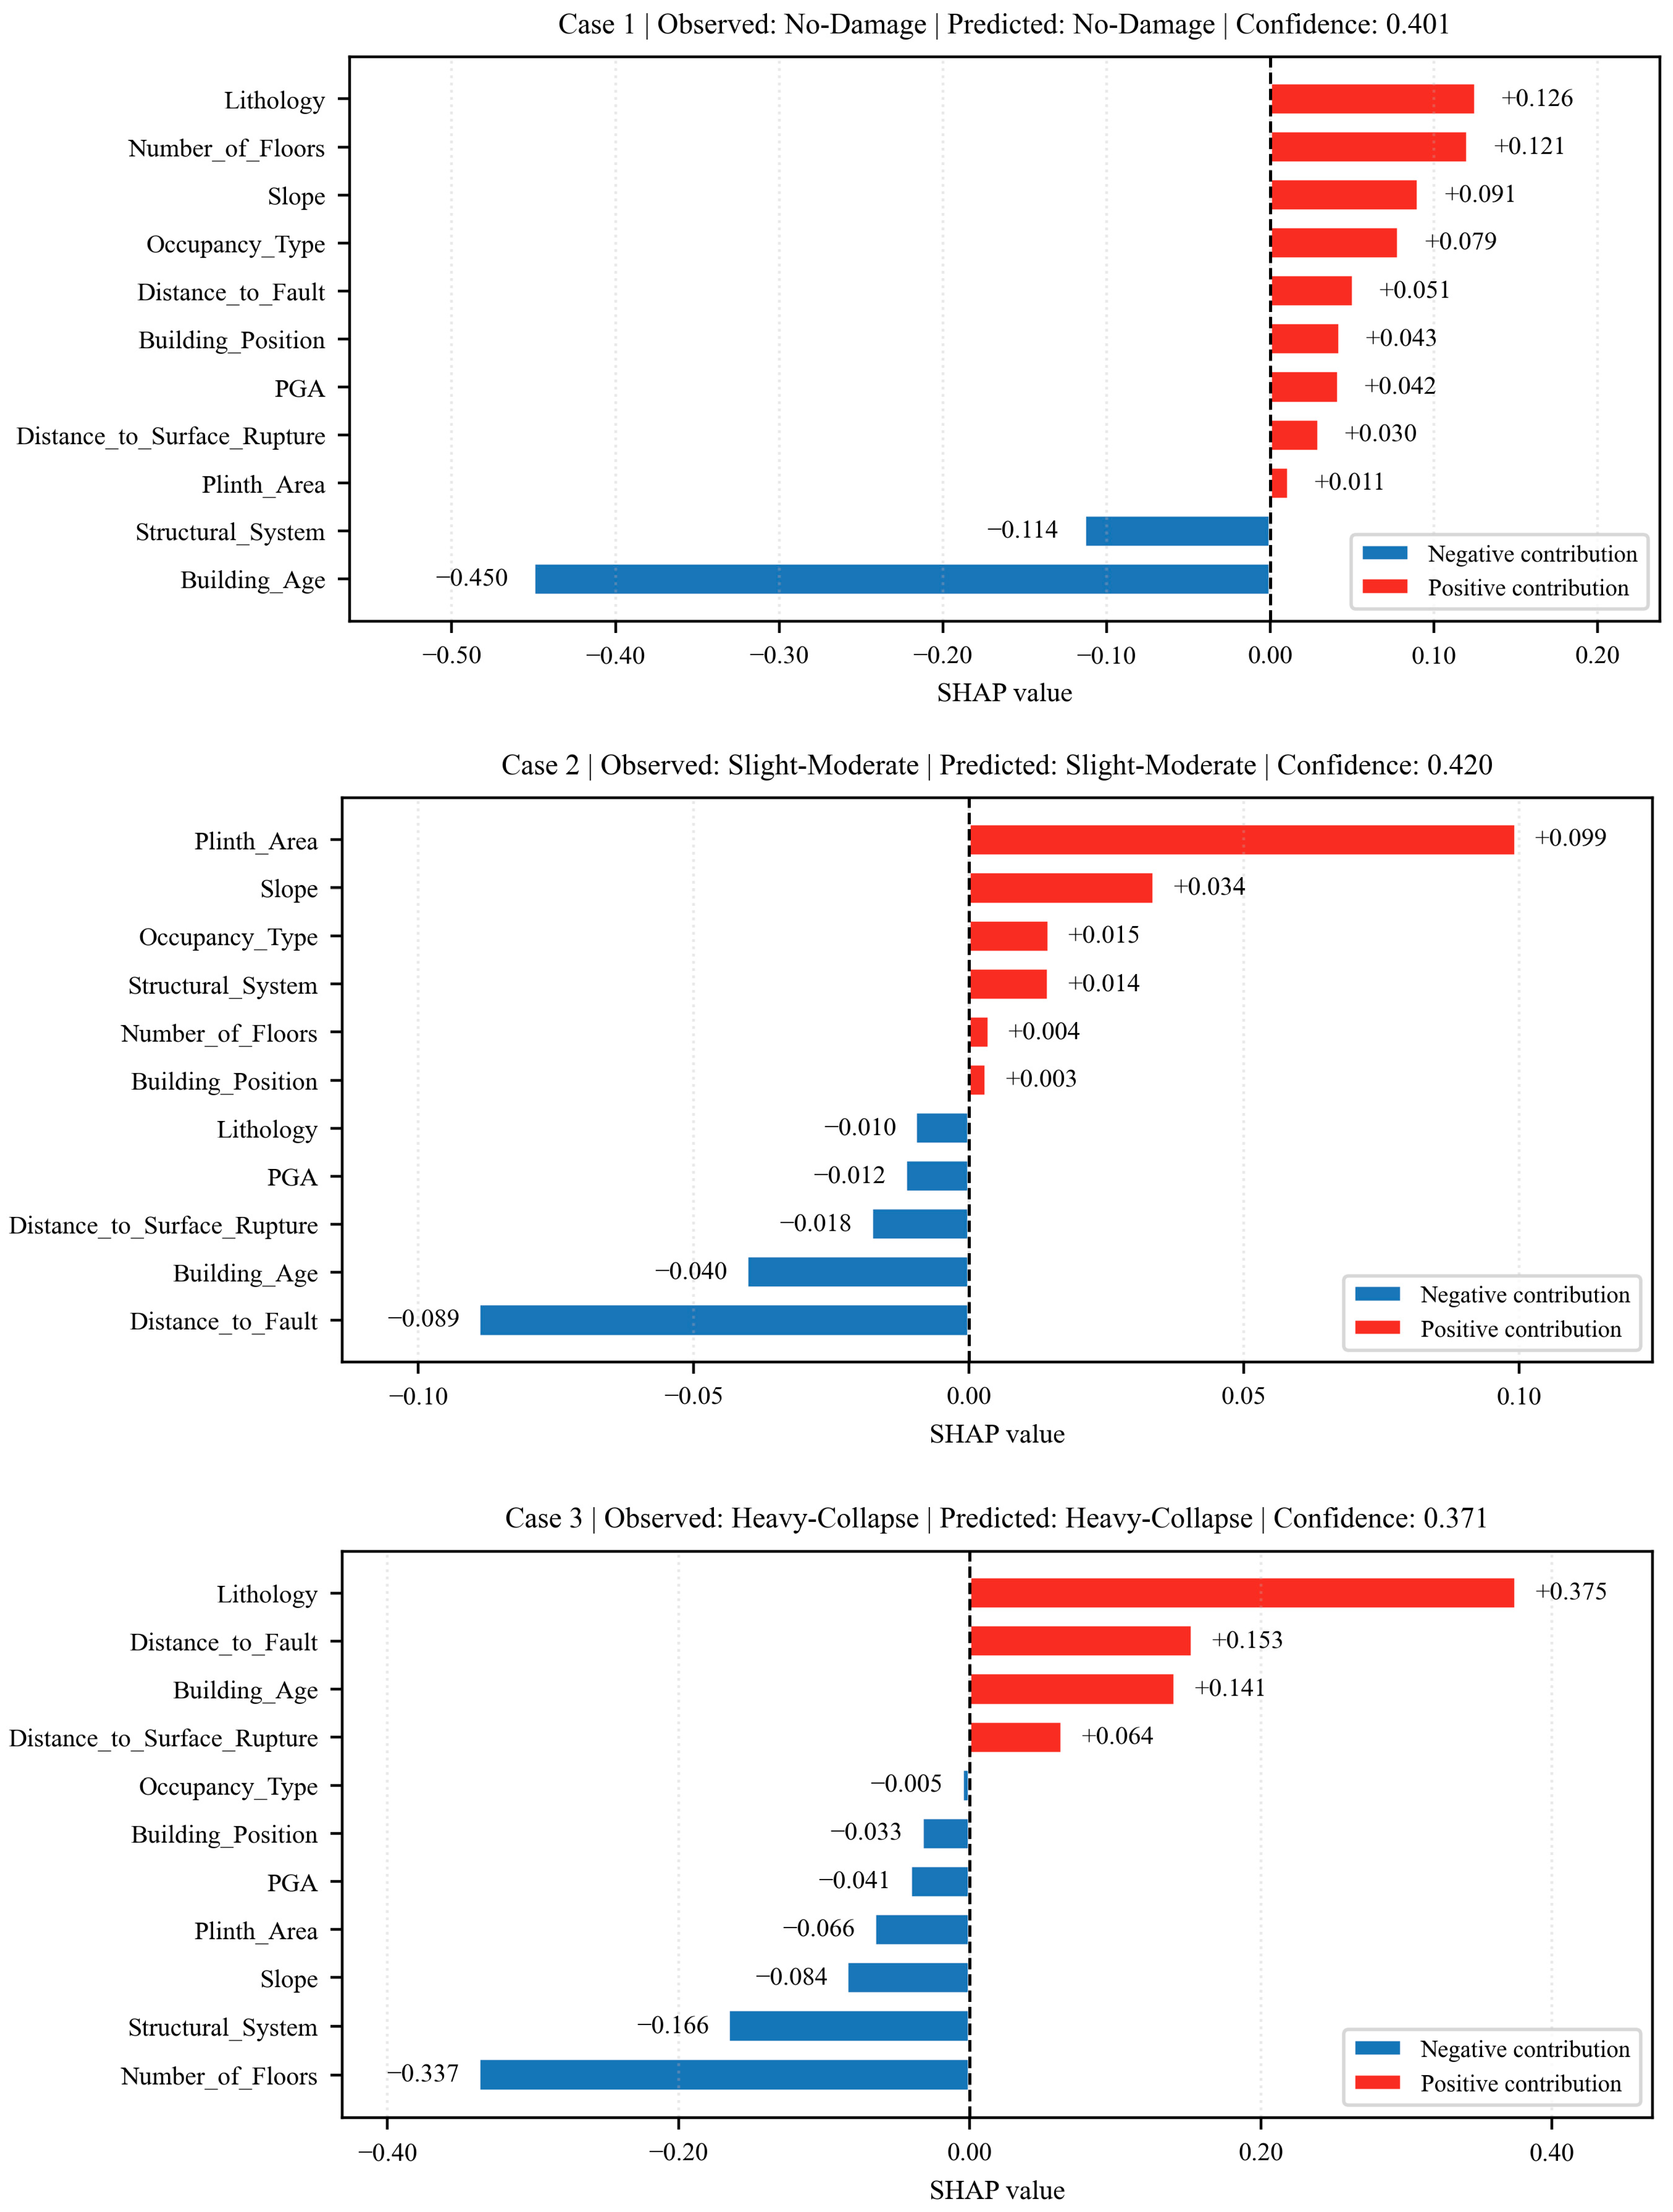
References
- UN. Office for Disaster Risk Reduction (UNDRR). Global Assessment Report on Disaster Risk Reduction; UN Office for Disaster Risk Reduction: Geneva, Switzerland, 2019; Volume 36. [Google Scholar]
- Demir, A. Post-Earthquake Structural Damage Assessment, Lessons Learned, and Addressing Objections Following the 2023 Kahramanmaras, Turkey Earthquakes. Bull. Earthq. Eng. 2025, 23, 1107–1127. [Google Scholar] [CrossRef] [Scilit]
- Yılmaz, Y.; Gürer, Ö.F.; Yiğitbaş, E. 2023 Kahramanmaraş Deprem Fayları Üzerinde Gözlemler ve Değerlendirmeler/Field Data and Some Thoughts on the 2023 Kahramanmaraş Earthquakes Faults. Geol. Bull. Turk. 2025, 68, 1–34. [Google Scholar] [CrossRef] [Scilit]
- Sajan, K.C.; Bhusal, A.; Gautam, D.; Rupakhety, R. Earthquake Damage and Rehabilitation Intervention Prediction Using Machine Learning. Eng. Fail. Anal. 2023, 144, 106949. [Google Scholar] [CrossRef] [Scilit]
- Zhang, H.; Cheng, X.; Li, Y.; He, D.; Du, X. Rapid Seismic Damage State Assessment of RC Frames Using Machine Learning Methods. J. Build. Eng. 2023, 65, 105797. [Google Scholar] [CrossRef] [Scilit]
- Mangalathu, S.; Sun, H.; Nweke, C.C.; Yi, Z.; Burton, H.V. Classifying Earthquake Damage to Buildings Using Machine Learning. Earthq. Spectra 2020, 36, 183–208. [Google Scholar] [CrossRef] [Scilit]
- Bhatta, S.; Dang, J. Seismic Damage Prediction of RC Buildings Using Machine Learning. Earthq. Eng. Struct. Dyn. 2023, 52, 3504–3527. [Google Scholar] [CrossRef] [Scilit]
- Ahmadi, H.M.; Zucconi, M.; Formisano, A.; Ferracuti, B. Seismic Retrofitting of Masonry Walls Using Regular Steel Grids and Steel Web Plates. Procedia Struct. Integr. 2026, 78, 1745–1752. [Google Scholar] [CrossRef] [Scilit]
- Formisano, A.; Ahmadi, H.M.; Mazzolani, F.M. Ductility and Behaviour Factor of RC Frame—Perforated SPSW Dual Systems. Key Eng. Mater. 2018, 763, 835–845. [Google Scholar] [CrossRef] [Scilit]
- Ghimire, S.; Guéguen, P.; Giffard-Roisin, S.; Schorlemmer, D. Testing Machine Learning Models for Seismic Damage Prediction at a Regional Scale Using Building-damage Dataset Compiled after the 2015 Gorkha Nepal Earthquake. Earthq. Spectra 2022, 38, 2970–2993. [Google Scholar] [CrossRef] [Scilit]
- Harirchian, E.; Aghakouchaki Hosseini, S.E.; Jadhav, K.; Kumari, V.; Rasulzade, S.; Işık, E.; Wasif, M.; Lahmer, T. A Review on Application of Soft Computing Techniques for the Rapid Visual Safety Evaluation and Damage Classification of Existing Buildings. J. Build. Eng. 2021, 43, 102536. [Google Scholar] [CrossRef] [Scilit]
- Harirchian, E.; Kumari, V.; Jadhav, K.; Rasulzade, S.; Lahmer, T.; Das, R.R. A Synthesized Study Based on Machine Learning Approaches for Rapid Classifying Earthquake Damage Grades to RC Buildings. Appl. Sci. 2021, 11, 7540. [Google Scholar] [CrossRef] [Scilit]
- Bhatta, S.; Kang, X.; Dang, J. Machine Learning Prediction Models for Ground Motion Parameters and Seismic Damage Assessment of Buildings at a Regional Scale. Resilient Cities Struct. 2024, 3, 84–102. [Google Scholar] [CrossRef] [Scilit]
- Demertzis, K.; Kostinakis, K.; Morfidis, K.; Iliadis, L. An Interpretable Machine Learning Method for the Prediction of R/C Buildings’ Seismic Response. J. Build. Eng. 2023, 63, 105493. [Google Scholar] [CrossRef] [Scilit]
- Bhatta, S.; Dang, J. Machine Learning-Based Classification for Rapid Seismic Damage Assessment of Buildings at a Regional Scale. J. Earthq. Eng. 2024, 28, 1861–1891. [Google Scholar] [CrossRef] [Scilit]
- Li, Y.; Jia, C.; Chen, H.; Su, H.; Chen, J.; Wang, D. Machine Learning Assessment of Damage Grade for Post-Earthquake Buildings: A Three-Stage Approach Directly Handling Categorical Features. Sustainability 2023, 15, 13847. [Google Scholar] [CrossRef] [Scilit]
- Morfidis, K.; Kostinakis, K. Approaches to the Rapid Seismic Damage Prediction of r/c Buildings Using Artificial Neural Networks. Eng. Struct. 2018, 165, 120–141. [Google Scholar] [CrossRef] [Scilit]
- Yalçın, D.; Aktuğ, B. Makine Öğrenmesi Yöntemleri Ile Deprem Sonrası Bina Hasar Sınıfı Kestirimi: İzmir Örneği. Türk Deprem Araşt. Derg. 2026, 8, 92–103. [Google Scholar] [CrossRef] [Scilit]
- Ozturk, B.; Hussein, A.F.; El Naggar, M.H. Machine Learning-Based Seismic Damage Assessment of a Bridge Portfolio in Cohesive Soil. Buildings 2025, 15, 1682. [Google Scholar] [CrossRef] [Scilit]
- Atasever, K.; Aydogdu, H.H.; Narlitepe, F.; Goksu, C.; Demir, U.; Demir, C.; Ilki, A. Damage Assessment of Structures Following the February 6, 2023 Kahramanmaraş Earthquakes: A Dataset-Based Case Study in Gaziantep, Türkiye. Arab. J. Sci. Eng. 2026, 51, 693–715. [Google Scholar] [CrossRef] [Scilit]
- Luk, S.H. Machine Learning-Based Methods for the Seismic Damage Classification of RC Buildings. Buildings 2025, 15, 2395. [Google Scholar] [CrossRef] [Scilit]
- Lundberg, S.M.; Allen, P.G.; Lee, S.-I. A Unified Approach to Interpreting Model Predictions. In Advances in Neural Information Processing Systems 30 (NIPS 2017); NeurIPS: San Diego CA, USA, 2017. [Google Scholar]
- Lundberg, S.M.; Erion, G.; Chen, H.; DeGrave, A.; Prutkin, J.M.; Nair, B.; Katz, R.; Himmelfarb, J.; Bansal, N.; Lee, S.I. From Local Explanations to Global Understanding with Explainable AI for Trees. Nat. Mach. Intell. 2020, 2, 56–67. [Google Scholar] [CrossRef] [Scilit] [PubMed]
- Peng, Q.; Cheng, W.; Jia, H.; Guo, P.; Jia, K. Rapid Seismic Damage Assessment Using Machine Learning Methods: Application to a Gantry Crane. Struct. Infrastruct. Eng. 2023, 19, 779–792. [Google Scholar] [CrossRef] [Scilit]
- Kostinakis, K.; Morfidis, K.; Demertzis, K.; Iliadis, L. Classification of Buildings’ Potential for Seismic Damage Using a Machine Learning Model with Auto Hyperparameter Tuning. Eng. Struct. 2023, 290, 116359. [Google Scholar] [CrossRef] [Scilit]
- Cheng, Q.; Li, A.; Ren, H.; Por, C.C.; Liao, W.; Xie, L. Rapid Seismic-Damage Assessment Method for Buildings on a Regional Scale Based on Spectrum-Compatible Data Augmentation and Deep Learning. Soil Dyn. Earthq. Eng. 2024, 178, 108504. [Google Scholar] [CrossRef] [Scilit]
- He, H.; Garcia, E.A. Learning from Imbalanced Data. IEEE Trans. Knowl. Data Eng. 2009, 21, 1263–1284. [Google Scholar] [CrossRef] [Scilit]
- Chen, W.; Gang, R.; Dengjie, K.; Zhifan, W.; Chen, W.; Rao, G.; Kang, D.; Wan, Z.; Wang, D. Early Report of the Source Characteristics, Ground Motions, and Casualty Estimates of the 2023 Mw 7.8 and 7.5 Turkey Earthquakes. J. Earth Sci. 2023, 34, 297–303. [Google Scholar] [CrossRef] [Scilit]
- Jia, Z.; Jin, Z.; Marchandon, M.; Ulrich, T.; Gabriel, A.A.; Fan, W.; Shearer, P.; Zou, X.; Rekoske, J.; Bulut, F.; et al. The Complex Dynamics of the 2023 Kahramanmaraş, Turkey, Mw 7.8-7.7 Earthquake Doublet. Science 2023, 381, 985–990. [Google Scholar] [CrossRef] [Scilit] [PubMed]
- Gokceoglu, C. 6 February 2023 Kahramanmaraş—Türkiye earthquakes: A general overview. Int. Arch. Photogramm. Remote Sens. Spat. Inf. Sci. 2023, XLVIII-M-1-2023, 417–424. [Google Scholar] [CrossRef] [Scilit]
- Yilmaz, Z.; Altunişik, A.C.; Taciroglu, E.; Günaydin, M.; Okur, F.Y.; Sunca, F.; Şişman, R.; Aslan, B.; Sezdirmez, T. Regional Building Damage Survey Data on the 2023 Kahramanmaraş, Türkiye, Earthquakes. ASCE OPEN Multidiscip. J. Civ. Eng. 2024, 2, 04024009. [Google Scholar] [CrossRef] [Scilit]
- Akinci, A.; Dindar, A.A.; Bal, I.E.; Ertuncay, D.; Smyrou, E.; Cheloni, D. Characteristics of Strong Ground Motions and Structural Damage Patterns from the February 6th, 2023 Kahramanmaraş Earthquakes, Türkiye. Nat. Hazards 2024, 121, 1209–1239. [Google Scholar] [CrossRef] [Scilit]
- Gurbuz, T.; Cengiz, A. Structural Damages during the February 06, 2023 Kahramanmaraş Earthquakes in Turkey. Soil Dyn. Earthq. Eng. 2025, 191, 109214. [Google Scholar] [CrossRef] [Scilit]
- Gürçeşme, M. Determination of Suitable Settlement Areas by Using Analytical Hierarchy Process with CBS: The Case of Kırıkhan (Hatay); Sosyal Bilimler Enstitüsü: Hatay, Turkey, 2025. [Google Scholar]
- Kırıkhan Kaymakamlığı. Available online: https://www.kirikhan.gov.tr/cografi (accessed on 23 March 2026).
- Atasoy, A.; Demir, H. The Effects of Syrian Refugees on Kırıkhan (Hatay). J. Int. Soc. Res. 2015, 8, 457–470. [Google Scholar] [CrossRef] [Scilit]
- Korkmaz, H. Antakya’da Zemin Özellikleri ve Deprem Etkisi Arasındaki İlişki. Coğrafi Bilim. Derg. 2006, 4, 49–66. [Google Scholar]
- Chawla, N.V.; Bowyer, K.W.; Hall, L.O.; Kegelmeyer, W.P. SMOTE: Synthetic Minority Over-Sampling Technique. J. Artif. Intell. Res. 2002, 16, 321–357. [Google Scholar] [CrossRef] [Scilit]
- Erden, T.; Karaman, H. Analysis of Earthquake Parameters to Generate Hazard Maps by Integrating AHP and GIS for Küçükçekmece Region. Nat. Hazards Earth Syst. Sci. 2012, 12, 475–483. [Google Scholar] [CrossRef] [Scilit]
- İnce, O. Structural Damage Assessment of Reinforced Concrete Buildings in Adıyaman after Kahramanmaraş (Türkiye) Earthquakes on 6 February 2023. Eng. Fail. Anal. 2024, 156, 107799. [Google Scholar] [CrossRef] [Scilit]
- Al-Rawashdeh, M.; Al Nawaiseh, M.; Yousef, I.; Bisharah, M.; Alkhadrawi, S.; Al-Bdour, H. Predicting Building Damage Grade by Earthquake: A Bayesian Optimization-Based Comparative Study of Machine Learning Algorithms. Asian J. Civ. Eng. 2024, 25, 253–264. [Google Scholar] [CrossRef] [Scilit]
- Jena, R.; Pradhan, B.; Beydoun, G. Earthquake Vulnerability Assessment in Northern Sumatra Province by Using a Multi-Criteria Decision-Making Model. Int. J. Disaster Risk Reduct. 2020, 46, 101518. [Google Scholar] [CrossRef] [Scilit]
- Gökkaya, M.A. Coğrafi Bilgi Sistemleri (Cbs) Ve Analitik Hiyerarşi Yöntemi (Ahy) İle Üretilen Deprem Tehlike Haritalarının Duyarlılık Analizi. Master’s Thesis, İstanbul Technical University, Istanbul, Turkey, 2014. [Google Scholar]
- Bilgilioğlu, S.S.; Gezgin, C.; Iban, M.C.; Bilgilioğlu, H.; Gündüz, H.I.; Arslan, Ş. Explainable Sinkhole Susceptibility Mapping Using Machine-Learning-Based SHAP: Quantifying and Comparing the Effects of Contributing Factors in Konya, Türkiye. Appl. Sci. 2025, 15, 3139. [Google Scholar] [CrossRef] [Scilit]
- Breiman, L. Random Forests. Mach. Learn. 2001, 45, 5–32. [Google Scholar] [CrossRef] [Scilit]
- Bilgilioğlu, S.S.; Gezgin, C.; Solak, H.İ.; Tiryakioğlu, İ. A Novel Approach for Earthquake Spatial Probability Modeling by Integration of Geodetic Strain into Explainable Artificial Intelligence (XAI). Stoch. Environ. Res. Risk Assess. 2026, 40, 18. [Google Scholar] [CrossRef] [Scilit]
- Geurts, P.; Ernst, D.; Wehenkel, L. Extremely Randomized Trees. Mach. Learn. 2006, 63, 3–42. [Google Scholar] [CrossRef] [Scilit]
- Friedman, J.H. Greedy Function Approximation: A Gradient Boosting Machine. Ann. Stat. 2001, 29, 1189–1232. [Google Scholar] [CrossRef] [Scilit]
- Iban, M.C.; Bilgilioglu, S.S. Snow Avalanche Susceptibility Mapping Using Novel Tree-Based Machine Learning Algorithms (XGBoost, NGBoost, and LightGBM) with EXplainable Artificial Intelligence (XAI) Approach. Stoch. Environ. Res. Risk Assess. 2023, 37, 2243–2270. [Google Scholar] [CrossRef] [Scilit]
- Freund, Y.; Schapire, R.E. A Decision-Theoretic Generalization of On-Line Learning and an Application to Boosting. J. Comput. Syst. Sci. 1997, 55, 119–139. [Google Scholar] [CrossRef] [Scilit]
- Ke, G.; Meng, Q.; Finley, T.; Wang, T.; Chen, W.; Ma, W.; Ye, Q.; Liu, T.-Y. LightGBM: A Highly Efficient Gradient Boosting Decision Tree. In Advances in Neural Information Processing Systems 30 (NIPS 2017); NeurIPS: San Diego CA, USA, 2017. [Google Scholar]
- Chen, T.; Guestrin, C. XGBoost: A Scalable Tree Boosting System. In Proceedings of the ACM SIGKDD International Conference on Knowledge Discovery and Data Mining, San Francisco, CA, USA, 13–17 August 2016; pp. 785–794. [Google Scholar] [CrossRef] [Scilit]
- Prokhorenkova, L.; Gusev, G.; Vorobev, A.; Dorogush, A.V.; Gulin, A. CatBoost: Unbiased Boosting with Categorical Features. In Advances in Neural Information Processing Systems 31 (NeurIPS 2018); NeurIPS: San Diego CA, USA, 2018. [Google Scholar]
- Chicco, D.; Jurman, G. The Advantages of the Matthews Correlation Coefficient (MCC) over F1 Score and Accuracy in Binary Classification Evaluation. BMC Genom. 2020, 21, 6. [Google Scholar] [CrossRef] [Scilit] [PubMed]
- Brodersen, K.H.; Soon Ong, C.; Stephan, K.E.; Buhmann, J.M. The Balanced Accuracy and Its Posterior Distribution. In Proceedings of the 2010 20th International Conference on Pattern Recognition, Istanbul, Turkey, 23–26 August 2010. [Google Scholar] [CrossRef] [Scilit]
- Pedregosa, F.; Michel, V.; Grisel, O.; Blondel, M.; Prettenhofer, P.; Weiss, R.; Vanderplas, J.; Cournapeau, D.; Pedregosa, F.; Varoquaux, G.; et al. Scikit-Learn: Machine Learning in Python. J. Mach. Learn. Res. 2011, 12, 2825–2830. [Google Scholar]
- Çetin, İ.; Bilgilioğlu, S.S. Comparative Analysis of Sinkhole Susceptibility Models Using Ensemble Machine Learning and Local Interpretable Model-Agnostic Explanations (LIME). Trans. GIS 2026, 30, e70210. [Google Scholar] [CrossRef] [Scilit]
- Usta, Z.; Akıncı, H.; Akın, A.T. Comparison of Tree-Based Ensemble Learning Algorithms for Landslide Susceptibility Mapping in Murgul (Artvin), Turkey. Earth Sci. Inform. 2024, 17, 1459–1481. [Google Scholar] [CrossRef] [Scilit]
- Tonbul, H.; Veraverbeke, S. Machine-Learning Wildfire Susceptibility Mapping with SHAP-Based Explainability in Türkiye’s Fire-Prone Regions. Stoch. Environ. Res. Risk Assess. 2026, 40, 2. [Google Scholar] [CrossRef] [Scilit]
- Molnar, C. Interpretable Machine Learning A Guide for Making Black Box Models Explainable; Leanpub: Vancouver, BC, Canada, 2022. [Google Scholar]
- Karampinis, I.; Iliadis, L.; Karabinis, A. Rapid Visual Screening Feature Importance for Seismic Vulnerability Ranking via Machine Learning and SHAP Values. Appl. Sci. 2024, 14, 2609. [Google Scholar] [CrossRef] [Scilit]
- Roeslin, S.; Ma, Q.; Juárez-Garcia, H.; Gómez-Bernal, A.; Wicker, J.; Wotherspoon, L. A Machine Learning Damage Prediction Model for the 2017 Puebla-Morelos, Mexico, Earthquake. Earthq. Spectra 2020, 36, 314–339. [Google Scholar] [CrossRef] [Scilit]
- Karaman, H.; Erden, T. Net Earthquake Hazard and Elements at Risk (NEaR) Map Creation for City of Istanbul via Spatial Multi-Criteria Decision Analysis. Nat. Hazards 2014, 73, 685–709. [Google Scholar] [CrossRef] [Scilit]
- Rosso, M.M.; Aloisio, A.; Di Battista, N.; d’Alfonso, T.; Demartino, C.; Quaranta, G. Machine Learning Model for Predicting Post-Earthquake Reconstruction Grants of Masonry Buildings from Seismic Vulnerability Features. Int. J. Disaster Risk Reduct. 2026, 140, 106123. [Google Scholar] [CrossRef] [Scilit]
- Nyimbili, P.H.; Erden, T.; Karaman, H. Integration of GIS, AHP and TOPSIS for Earthquake Hazard Analysis. Nat. Hazards 2018, 92, 1523–1546. [Google Scholar] [CrossRef] [Scilit]
- Stojadinović, Z.; Kovačević, M.; Marinković, D.; Stojadinović, B. Rapid Earthquake Loss Assessment Based on Machine Learning and Representative Sampling. Earthq. Spectra 2022, 38, 152–177. [Google Scholar] [CrossRef] [Scilit]
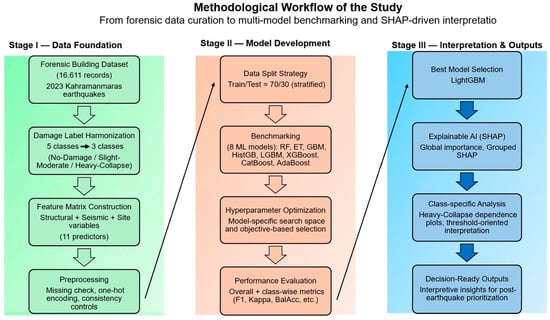
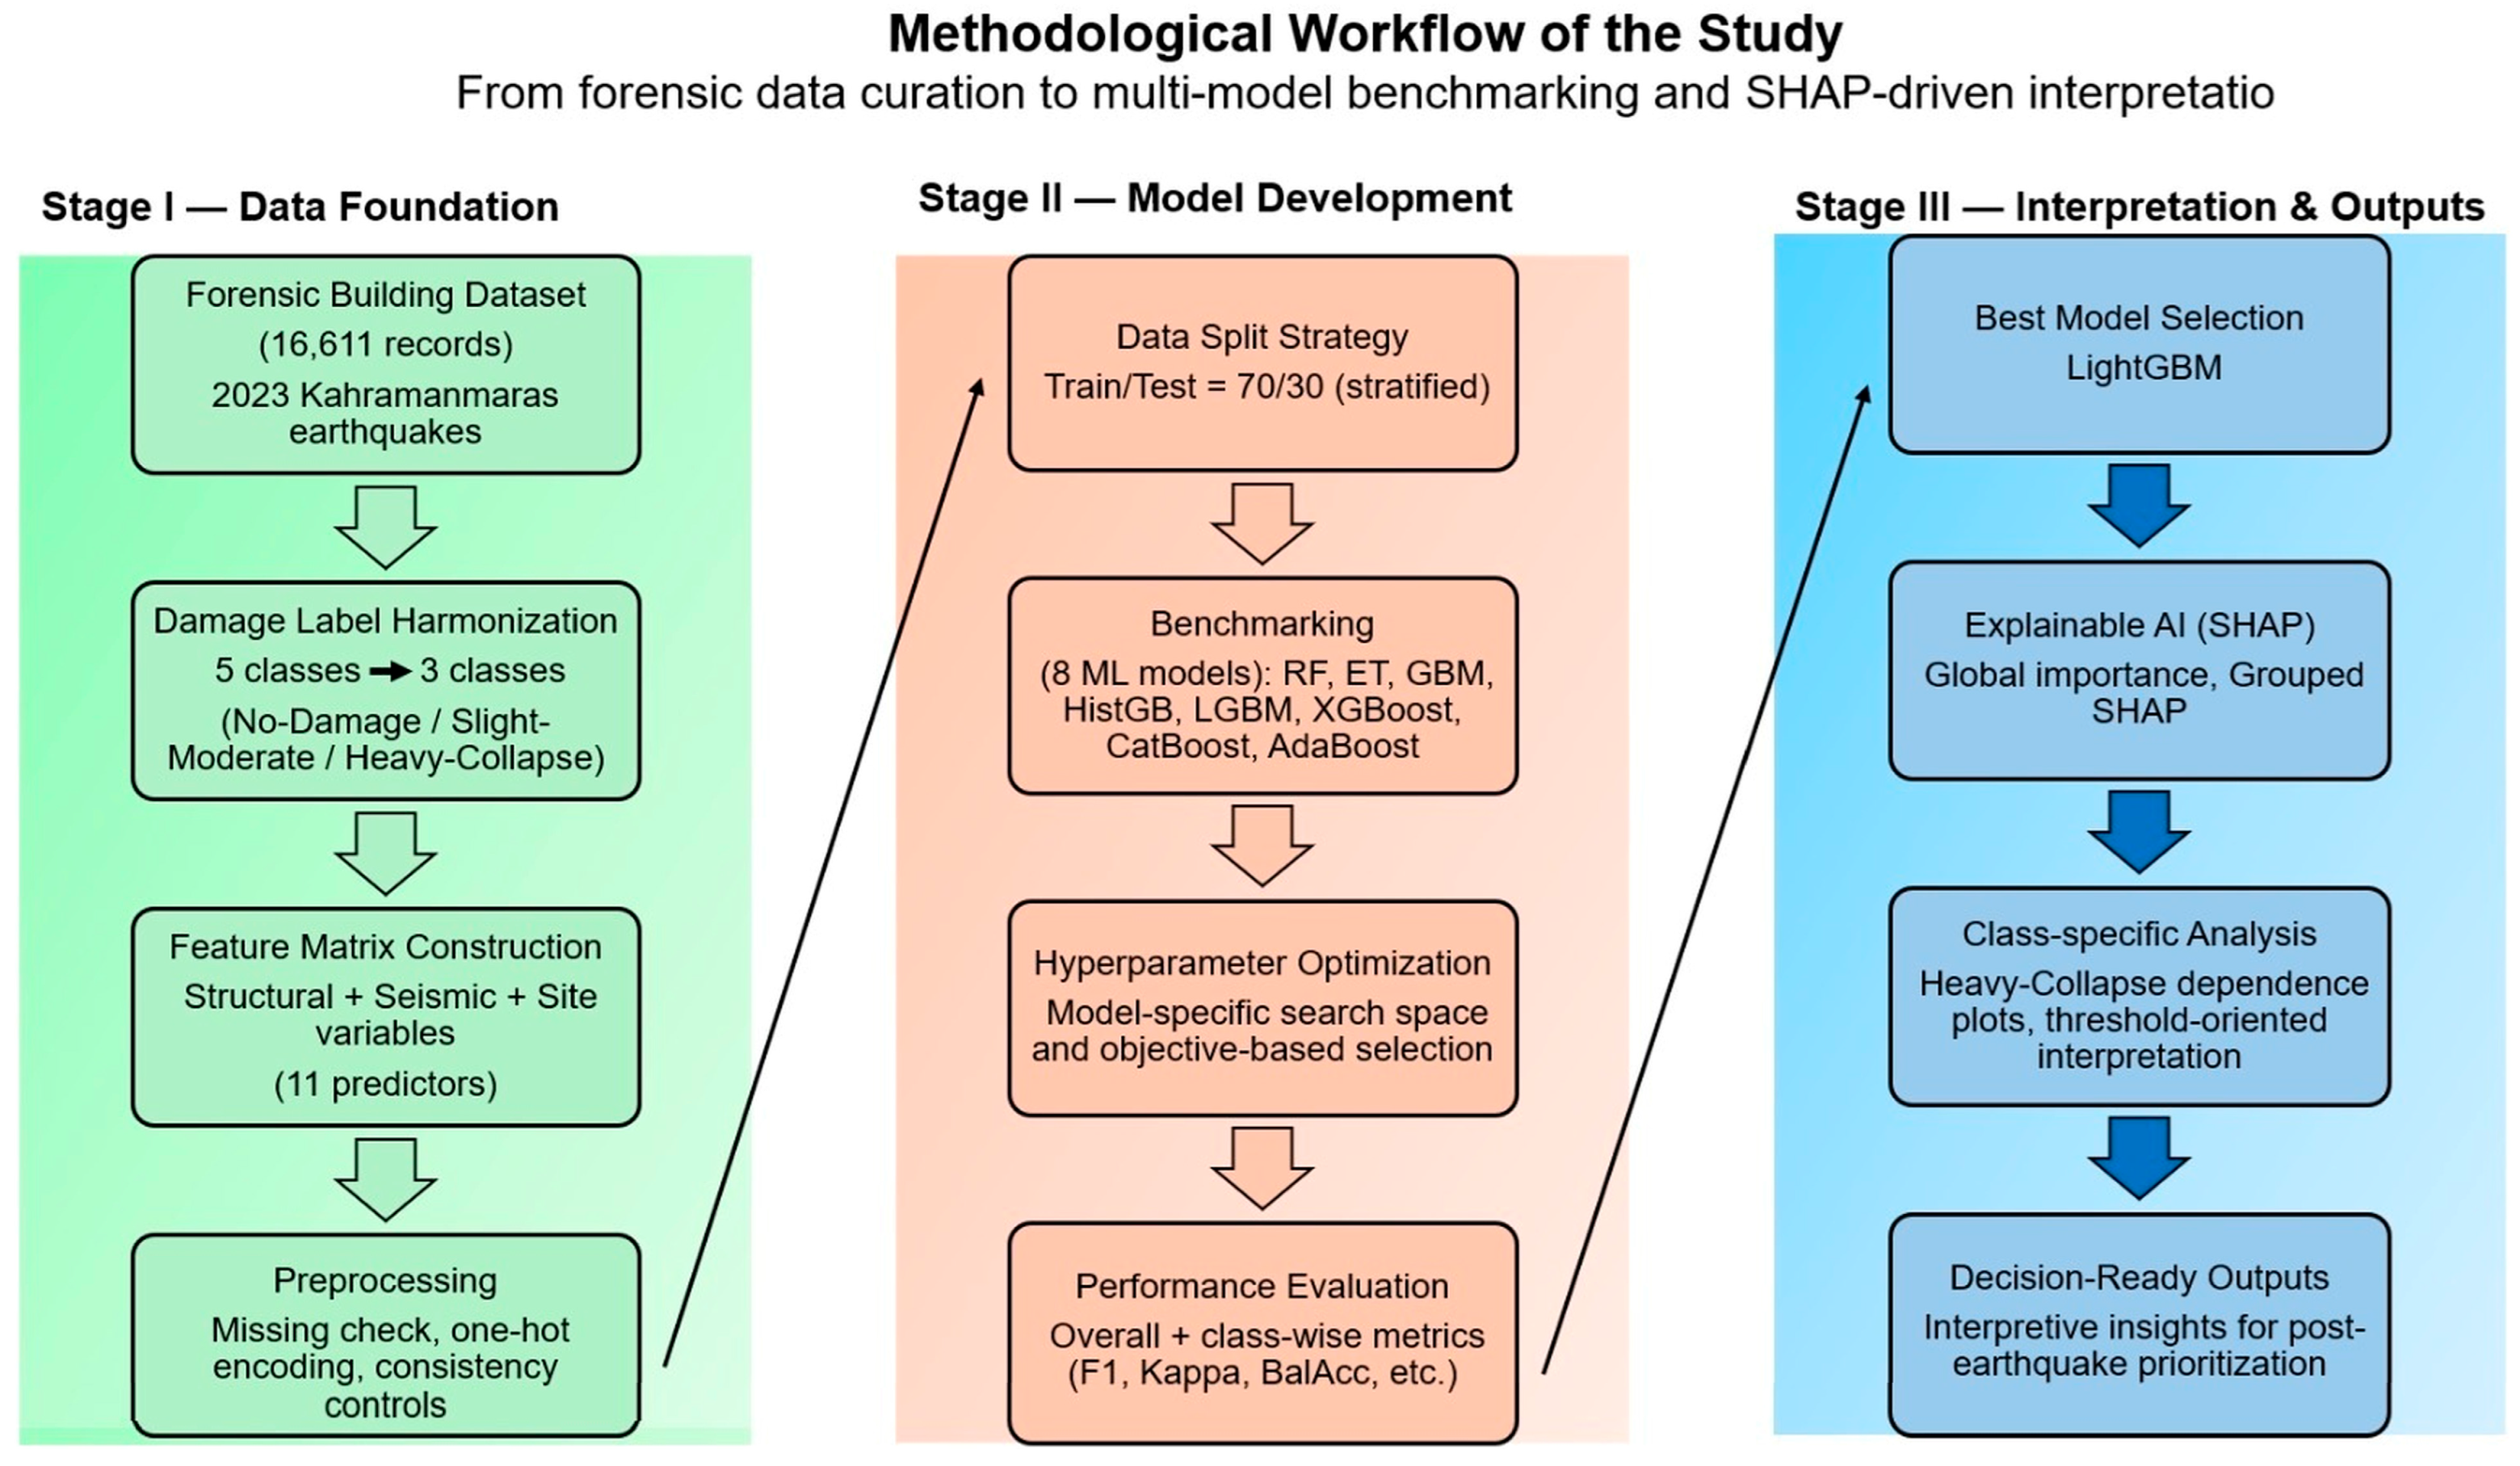
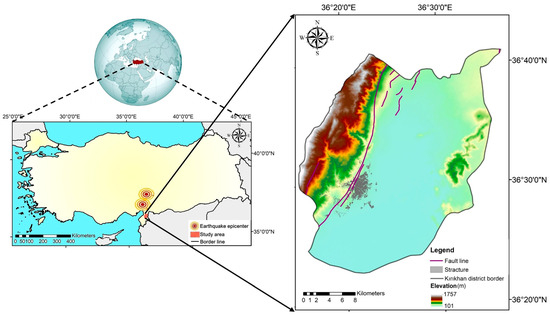
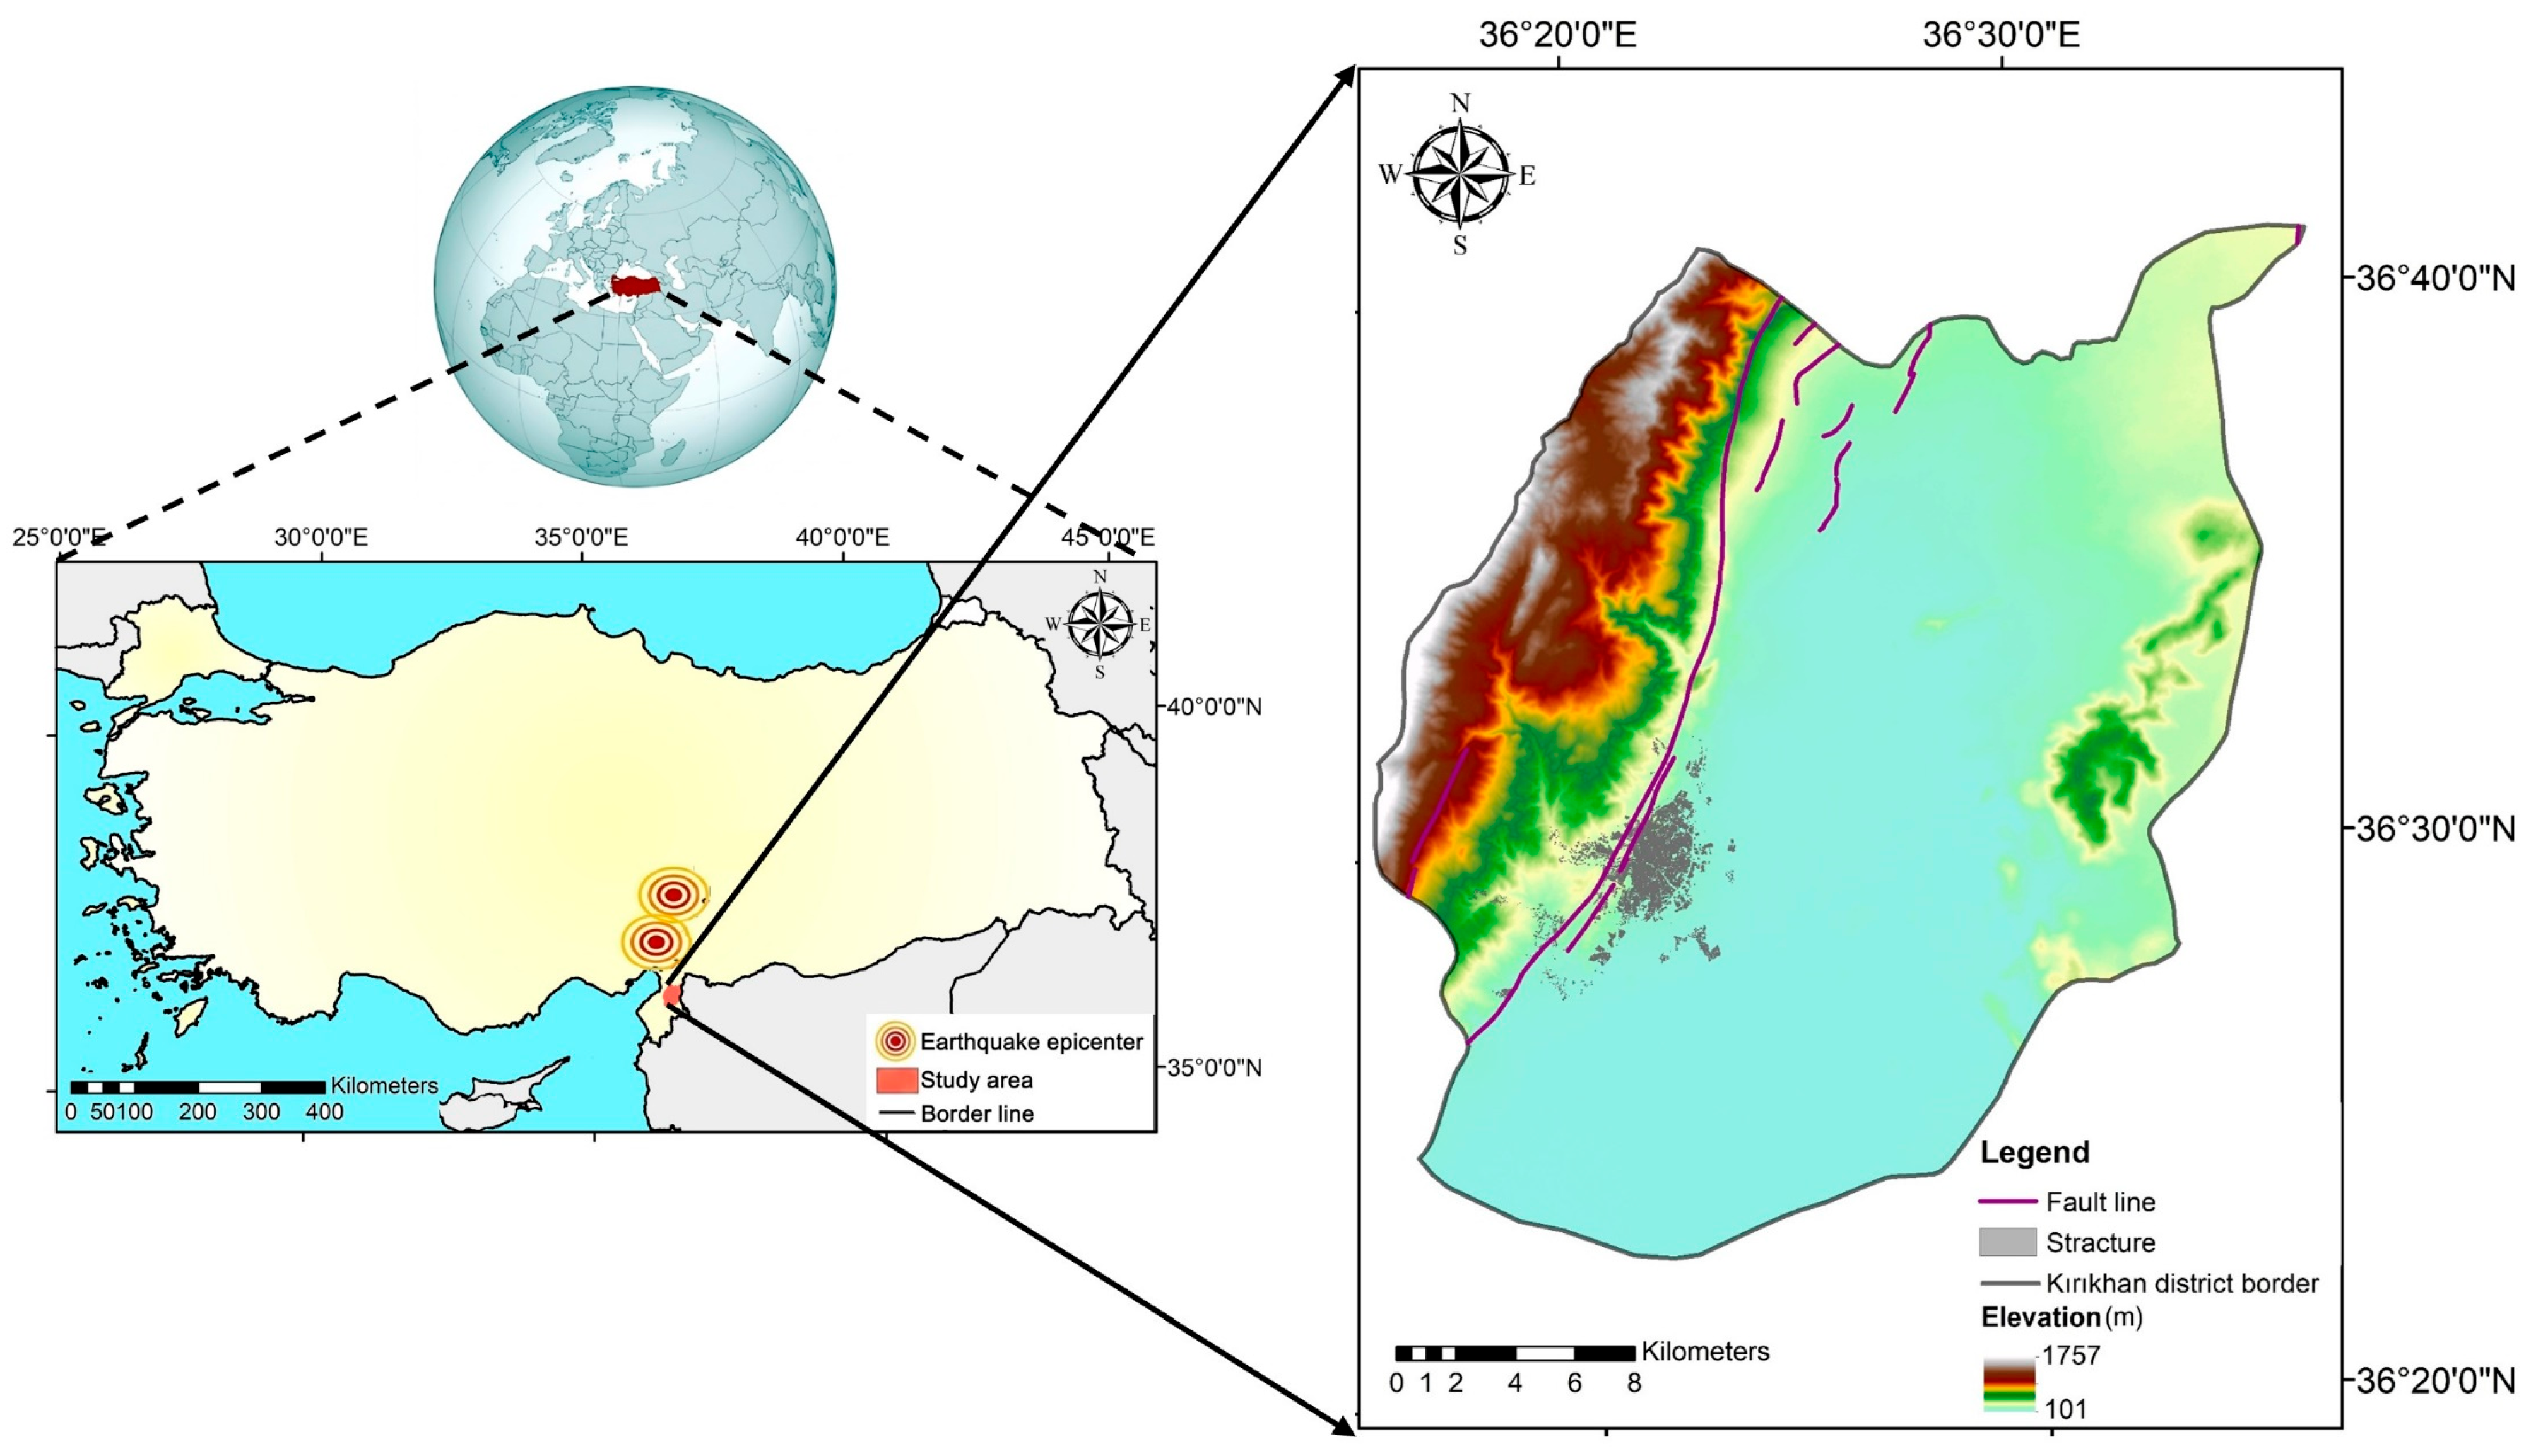
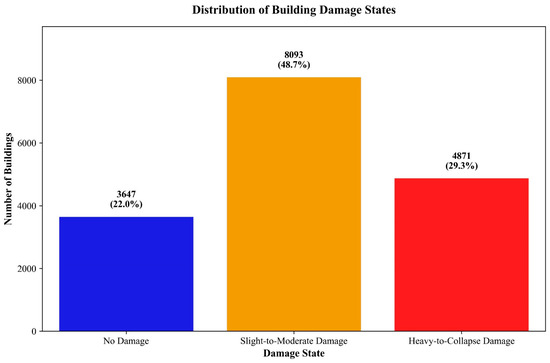
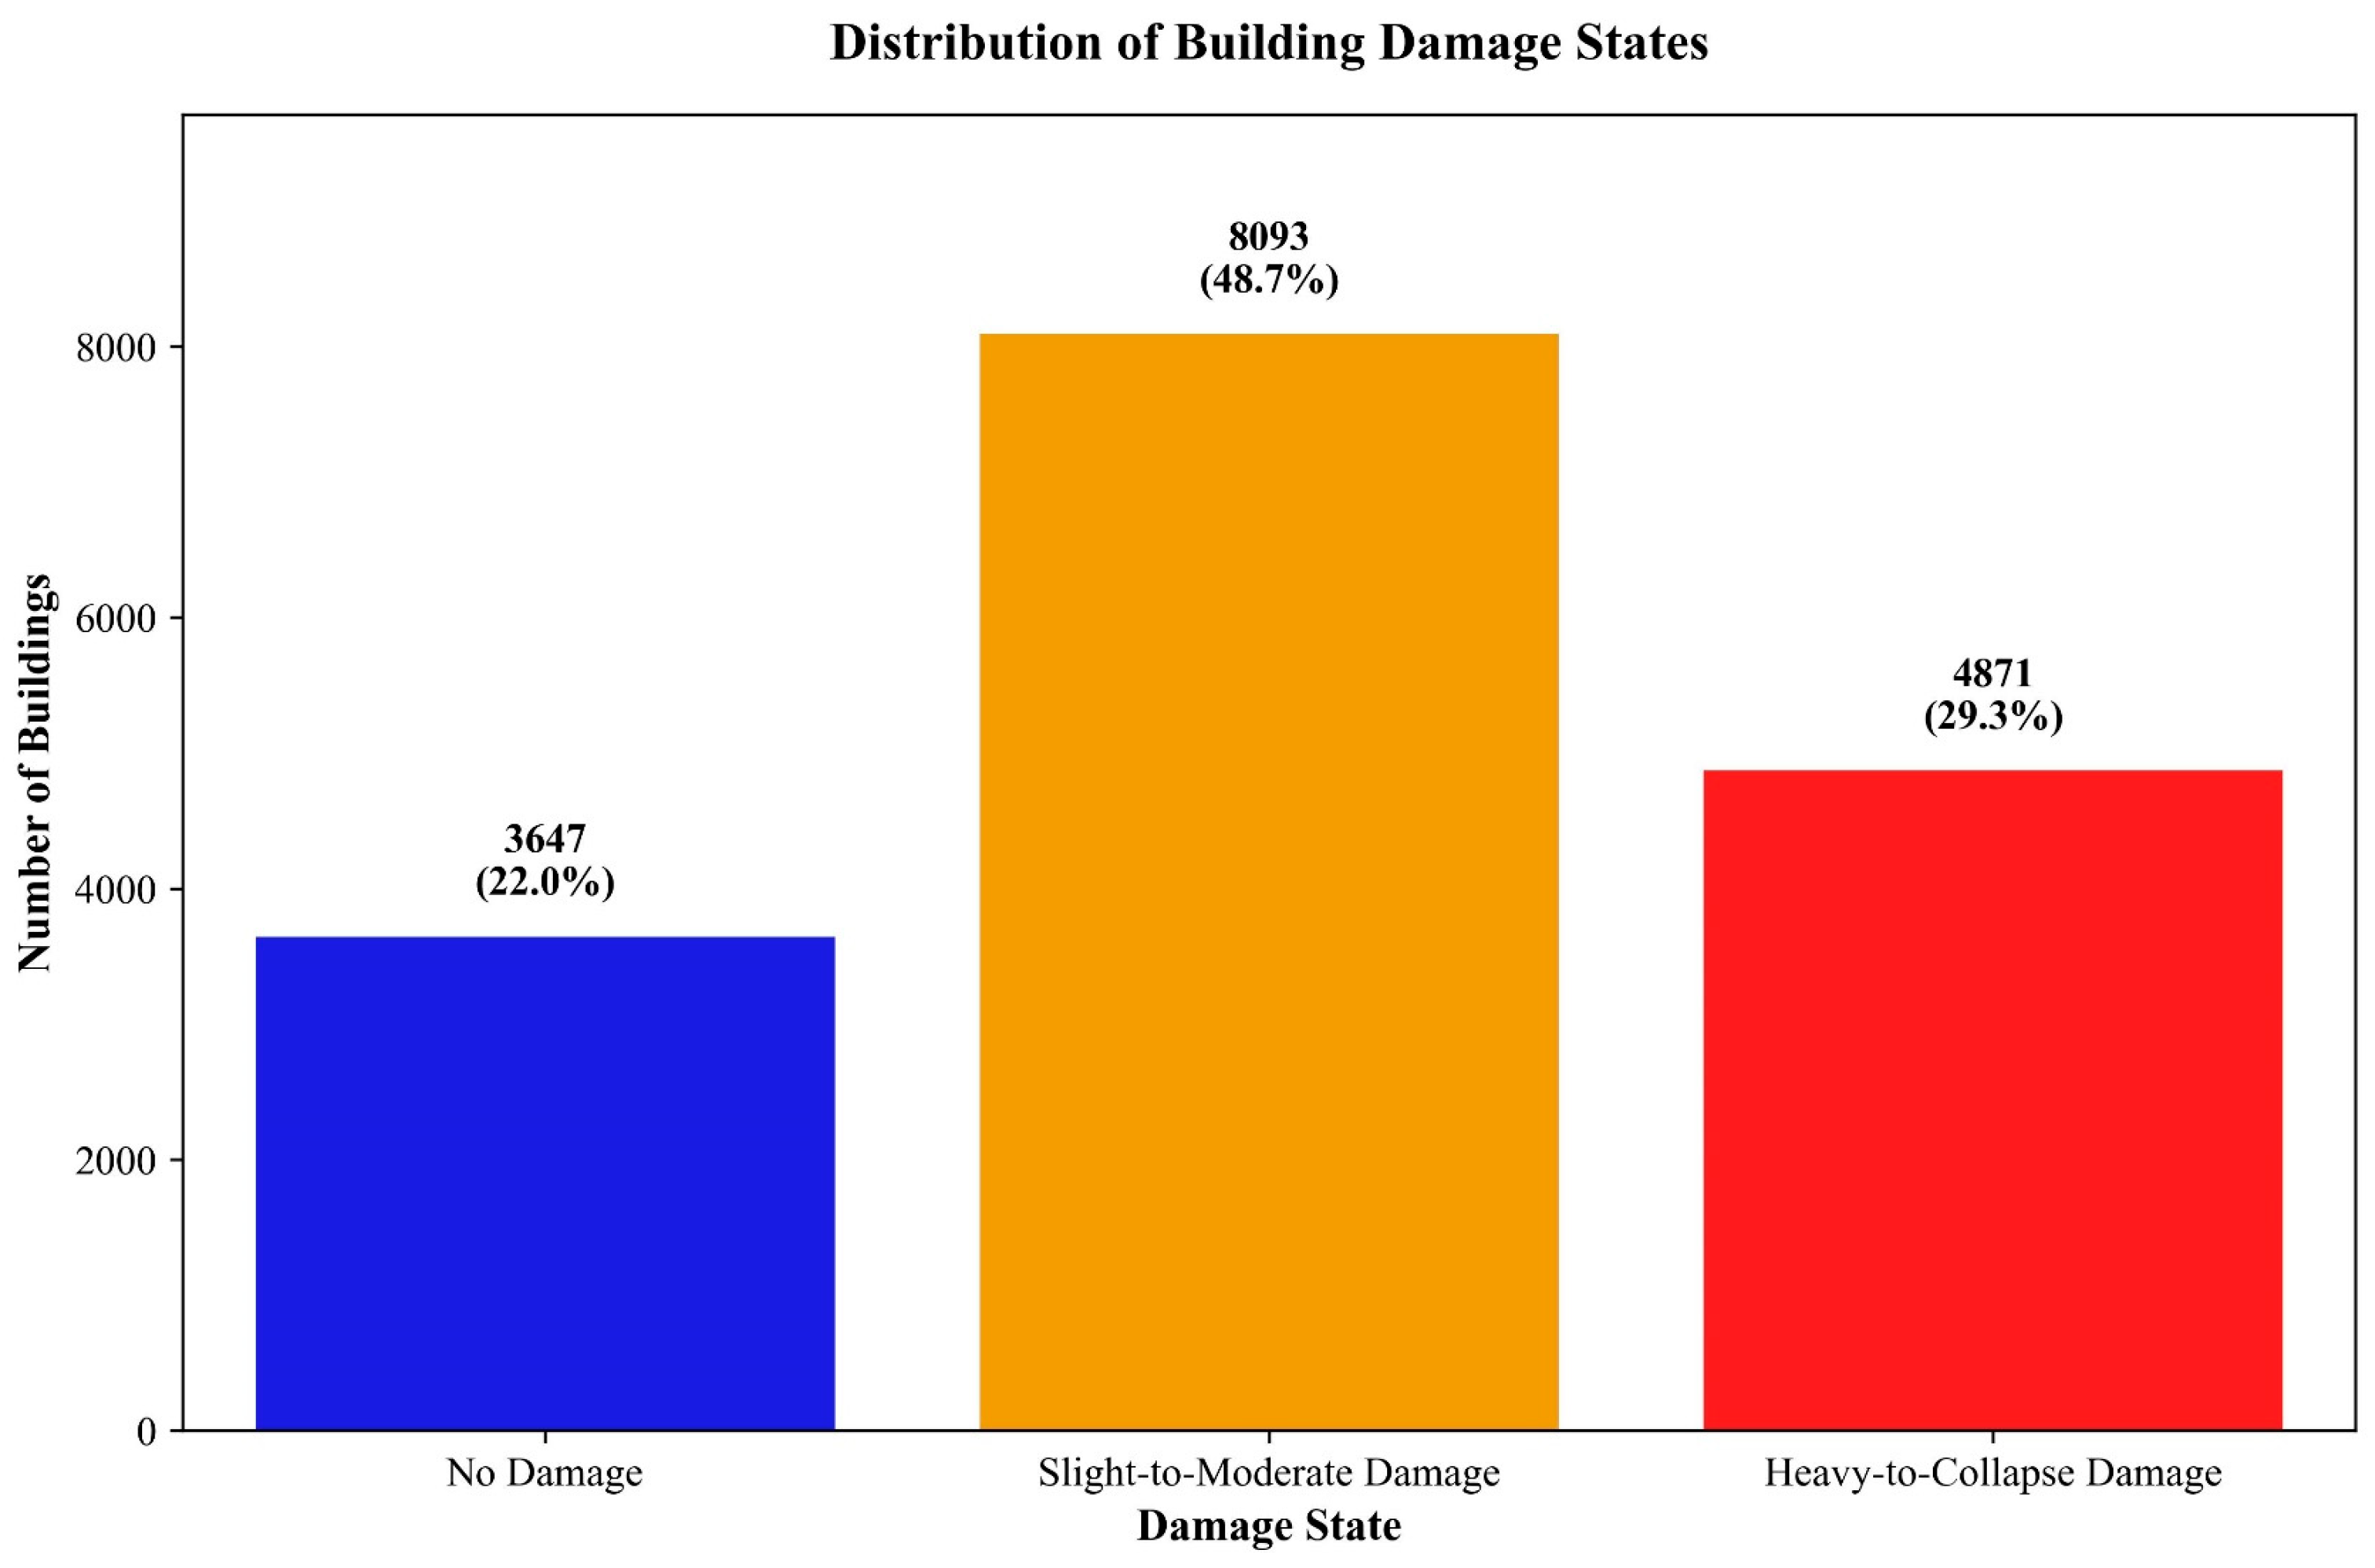
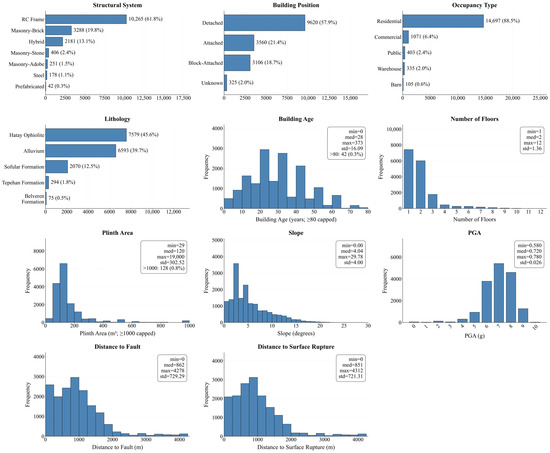
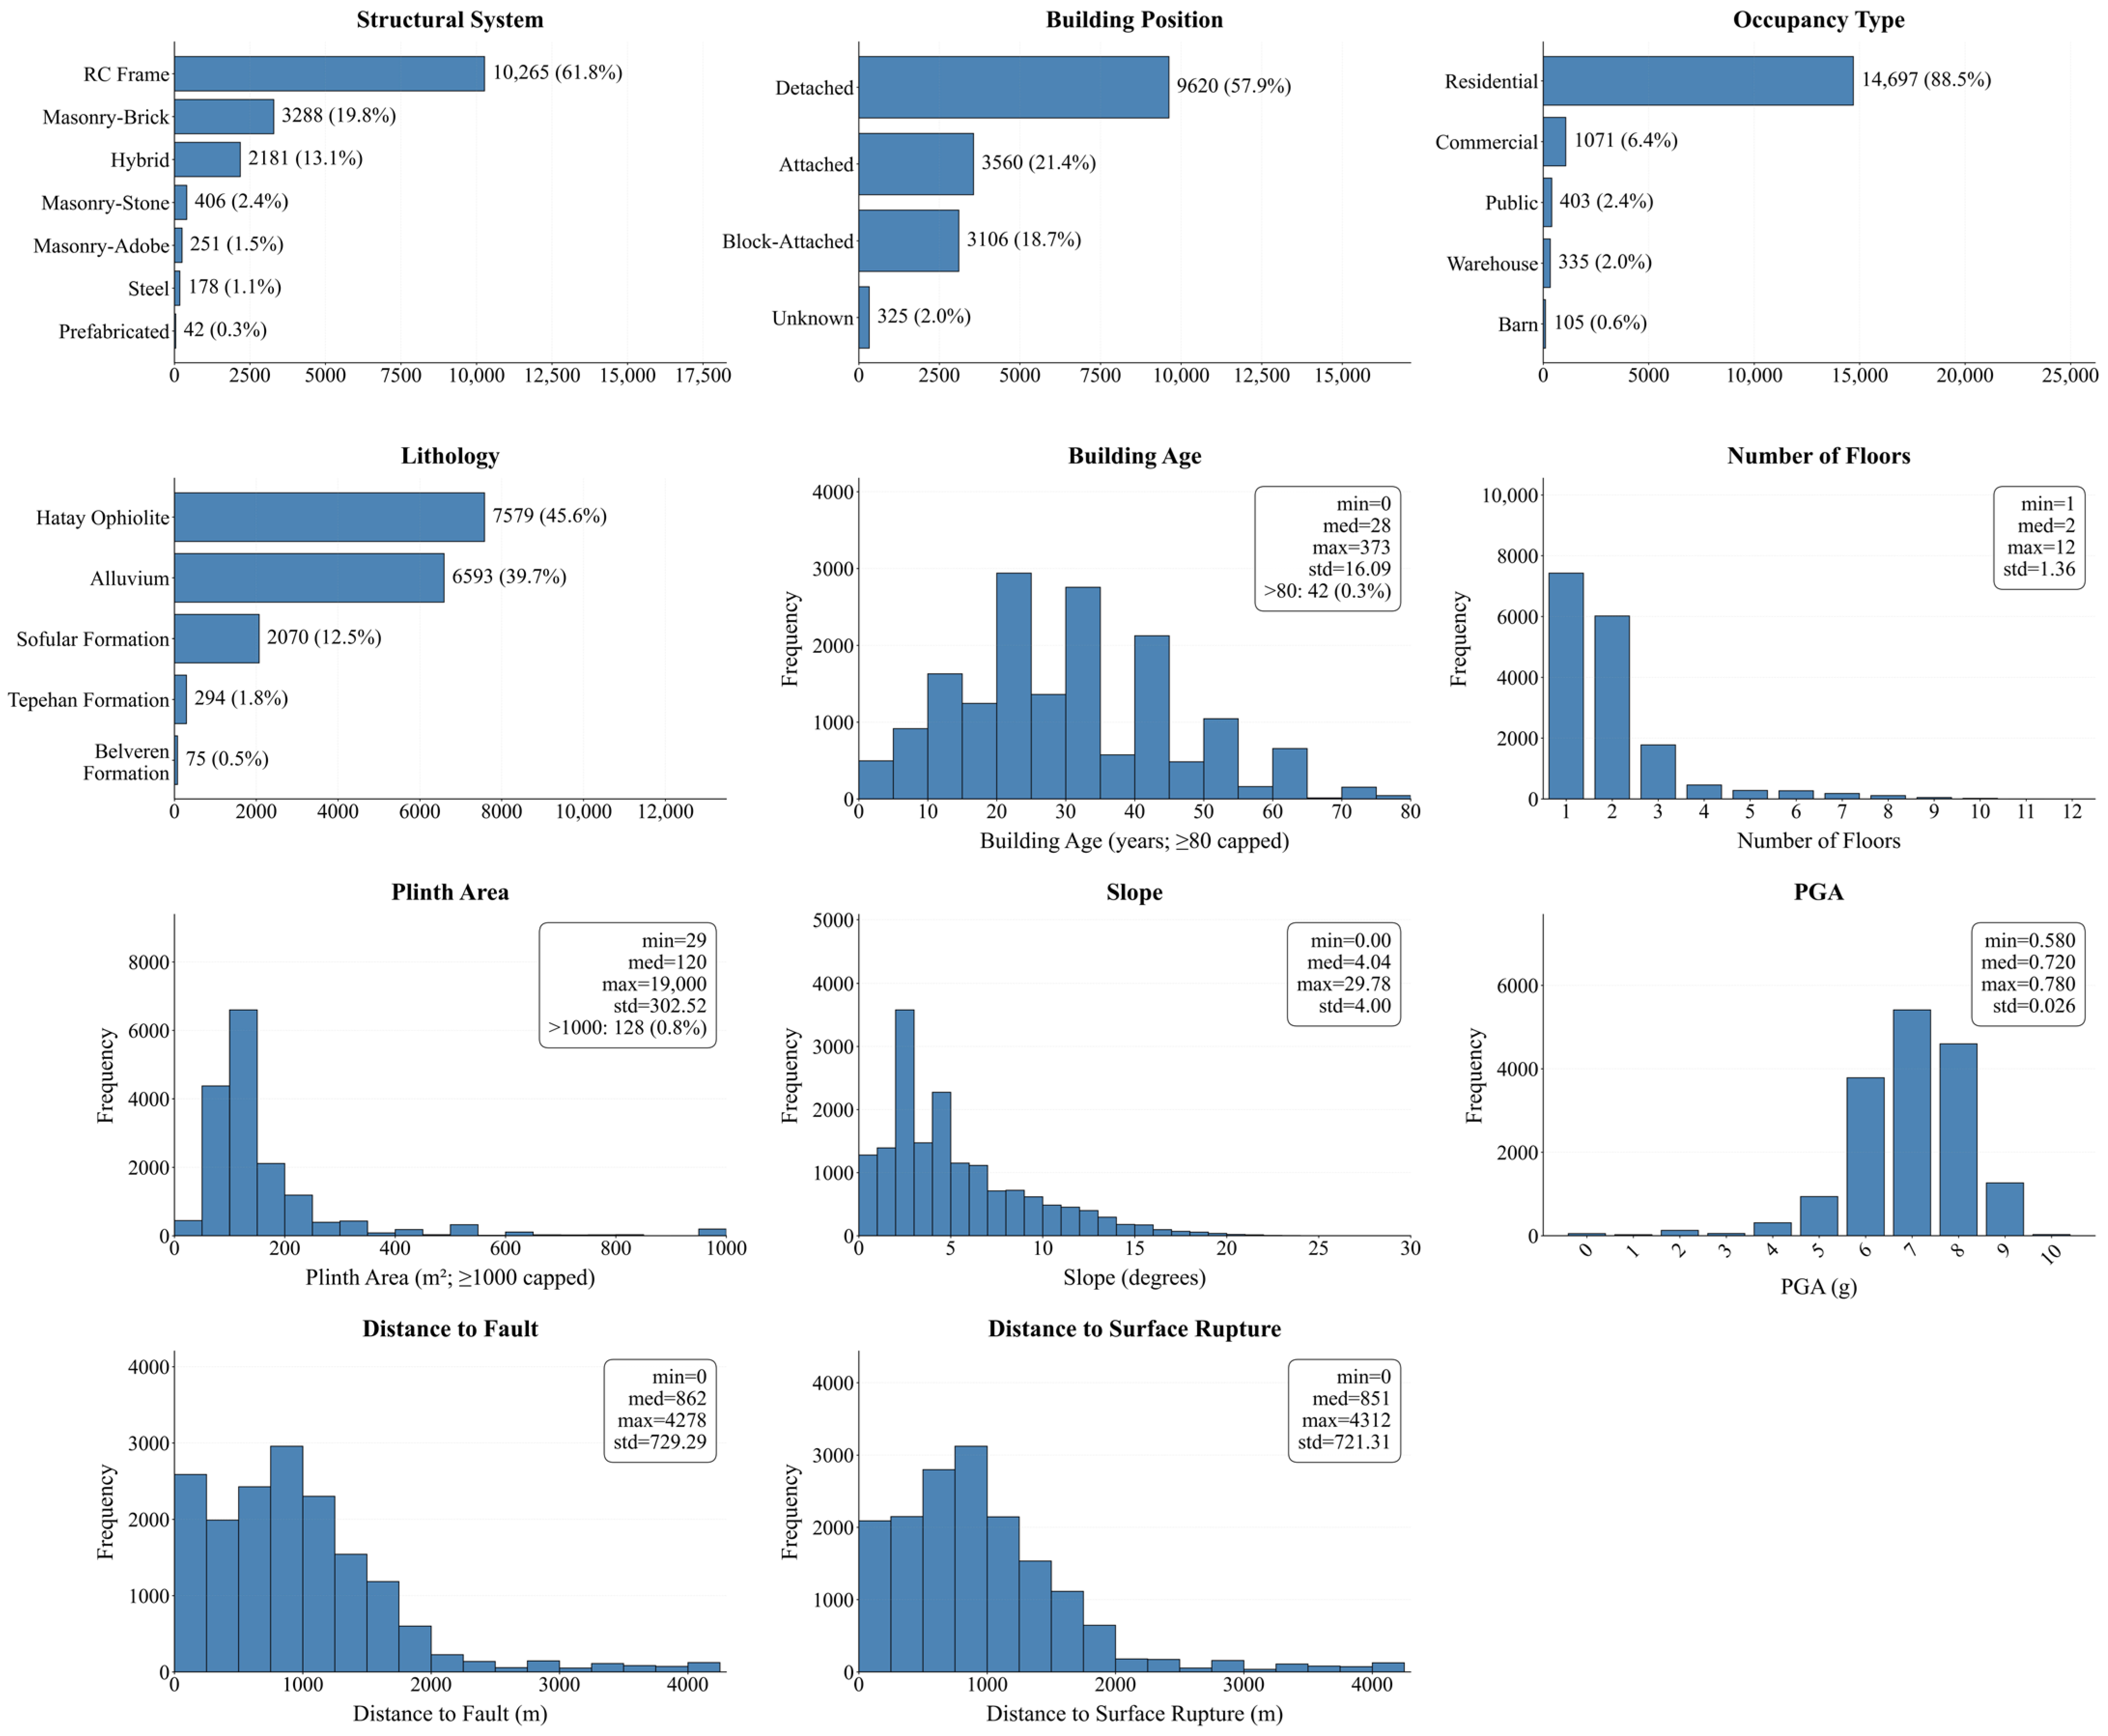
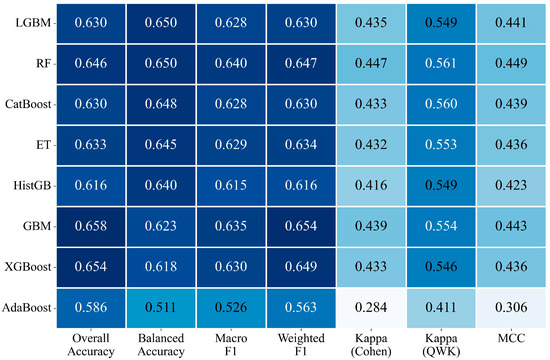
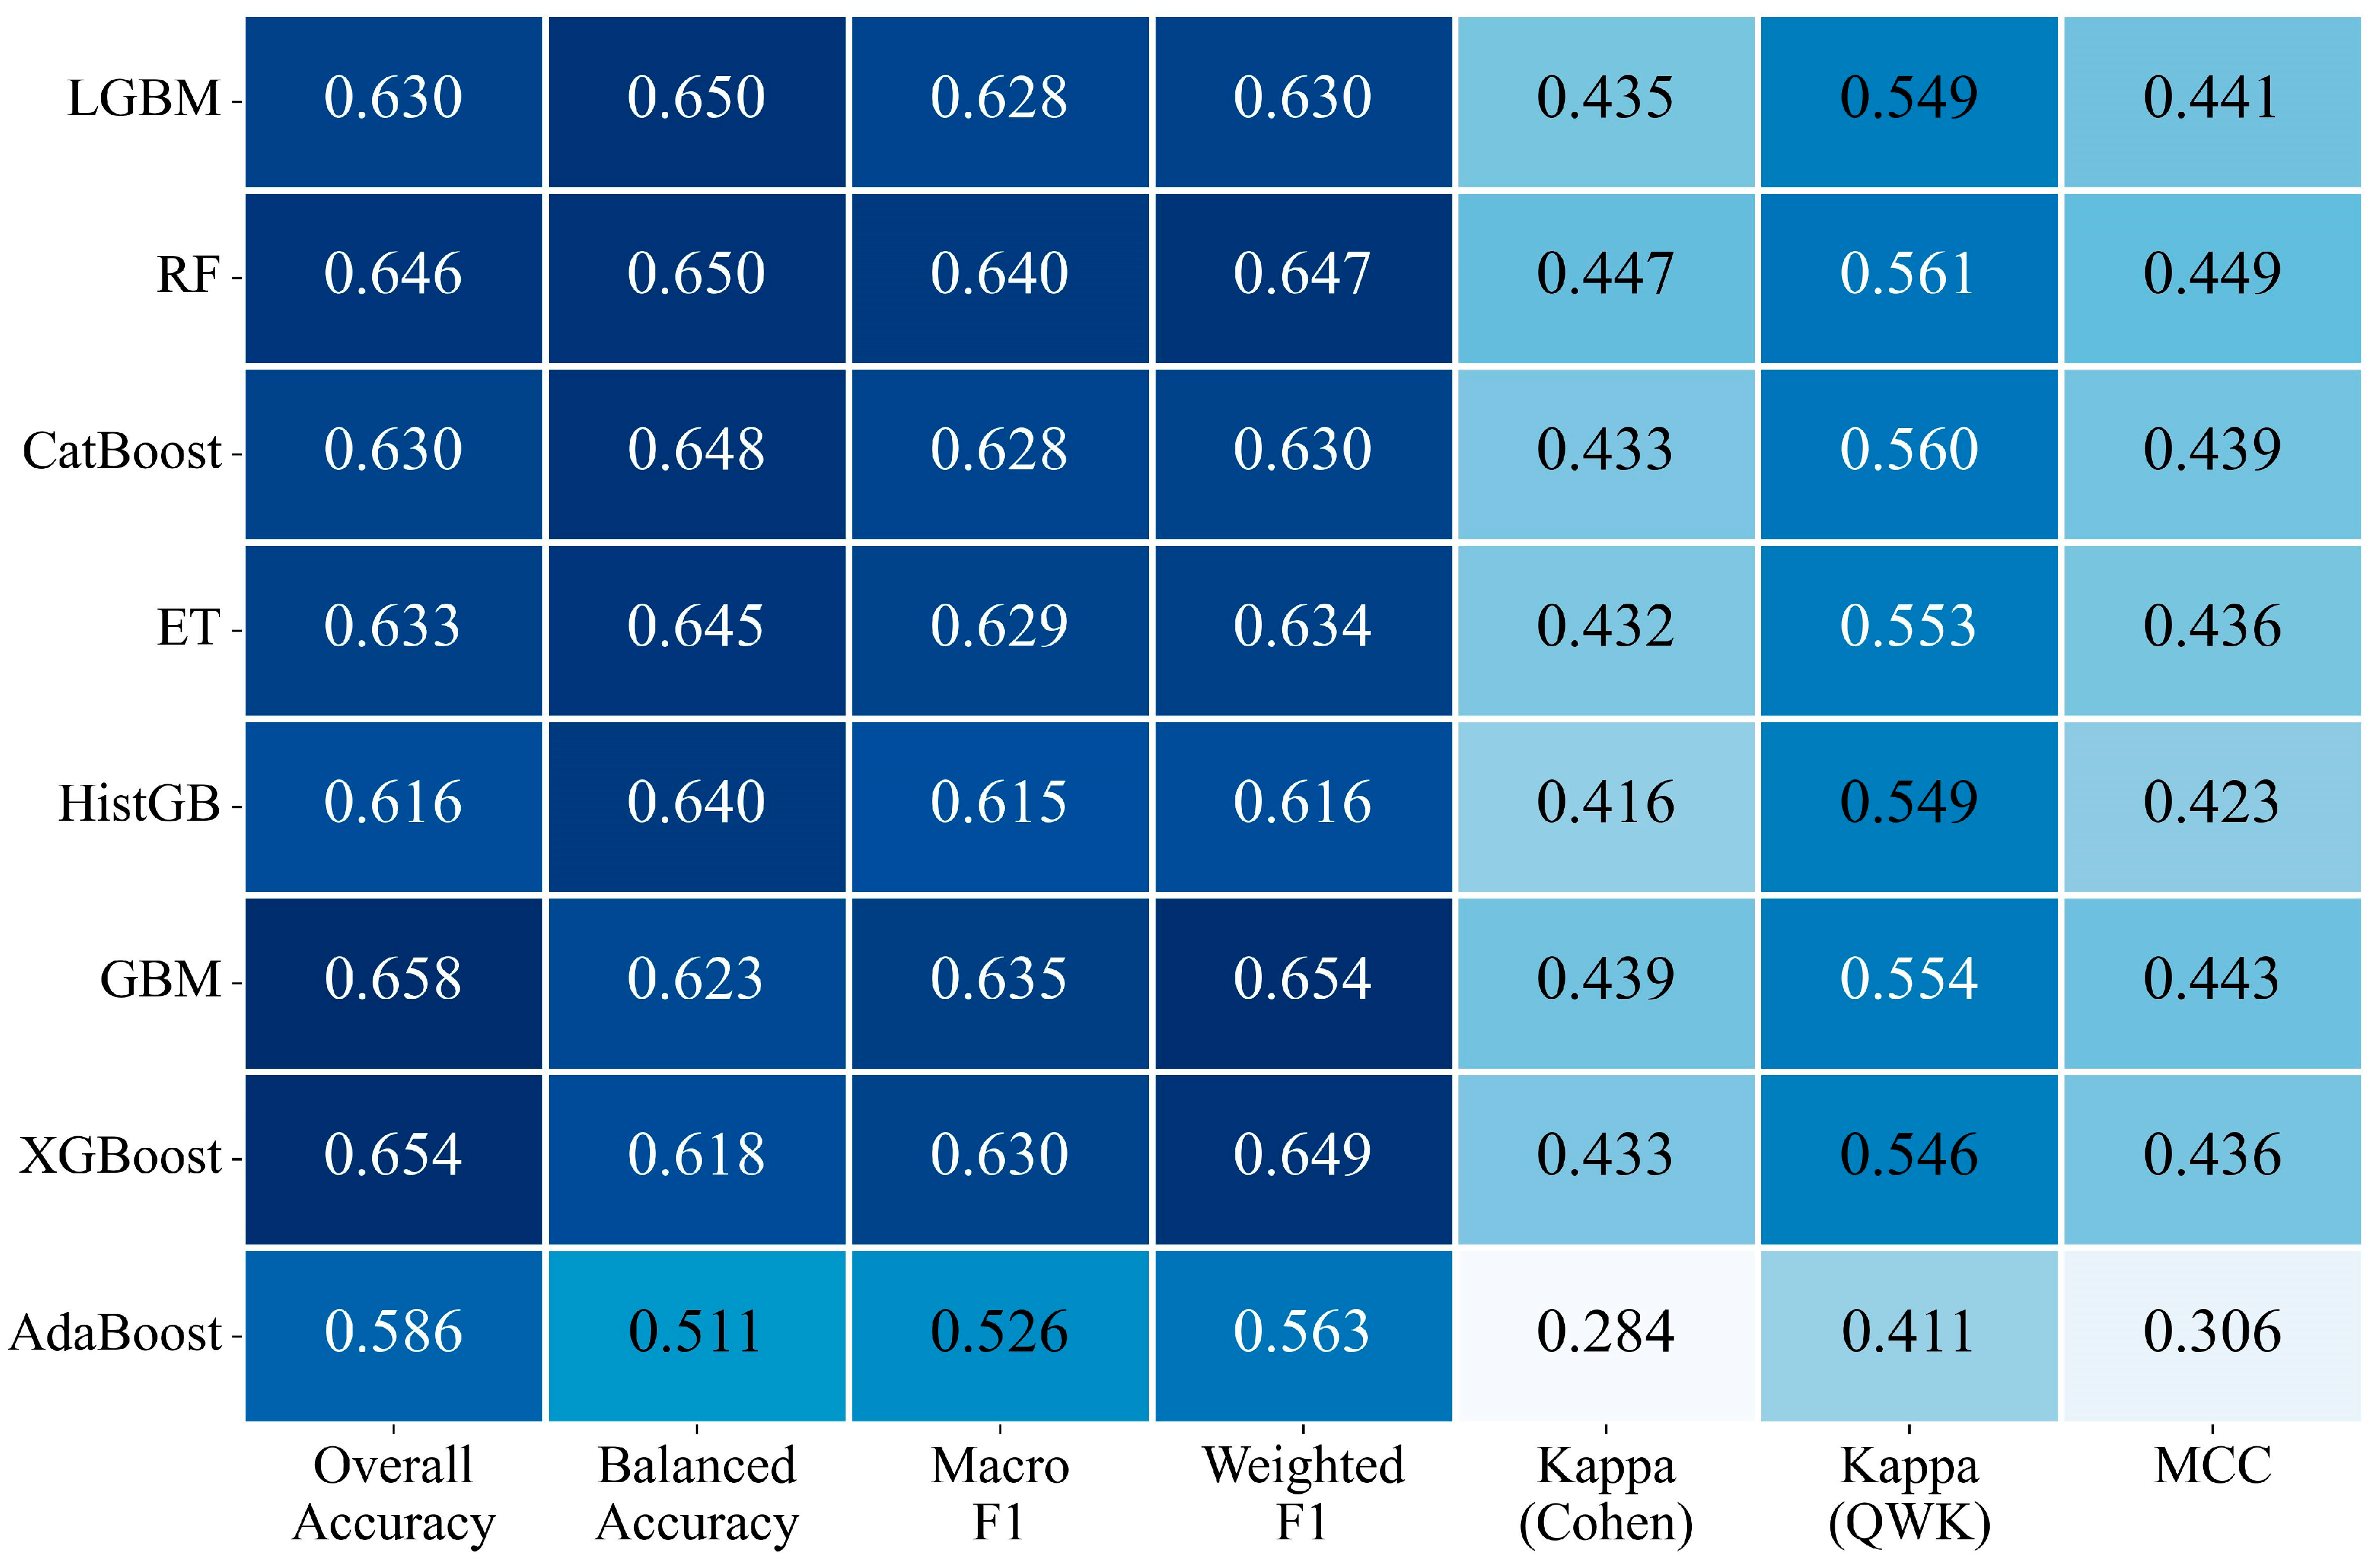
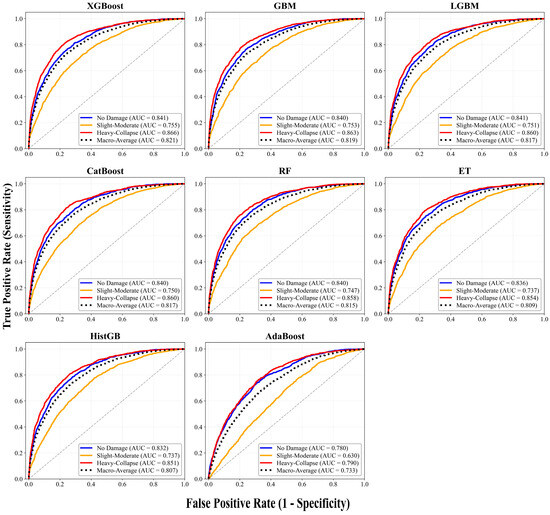
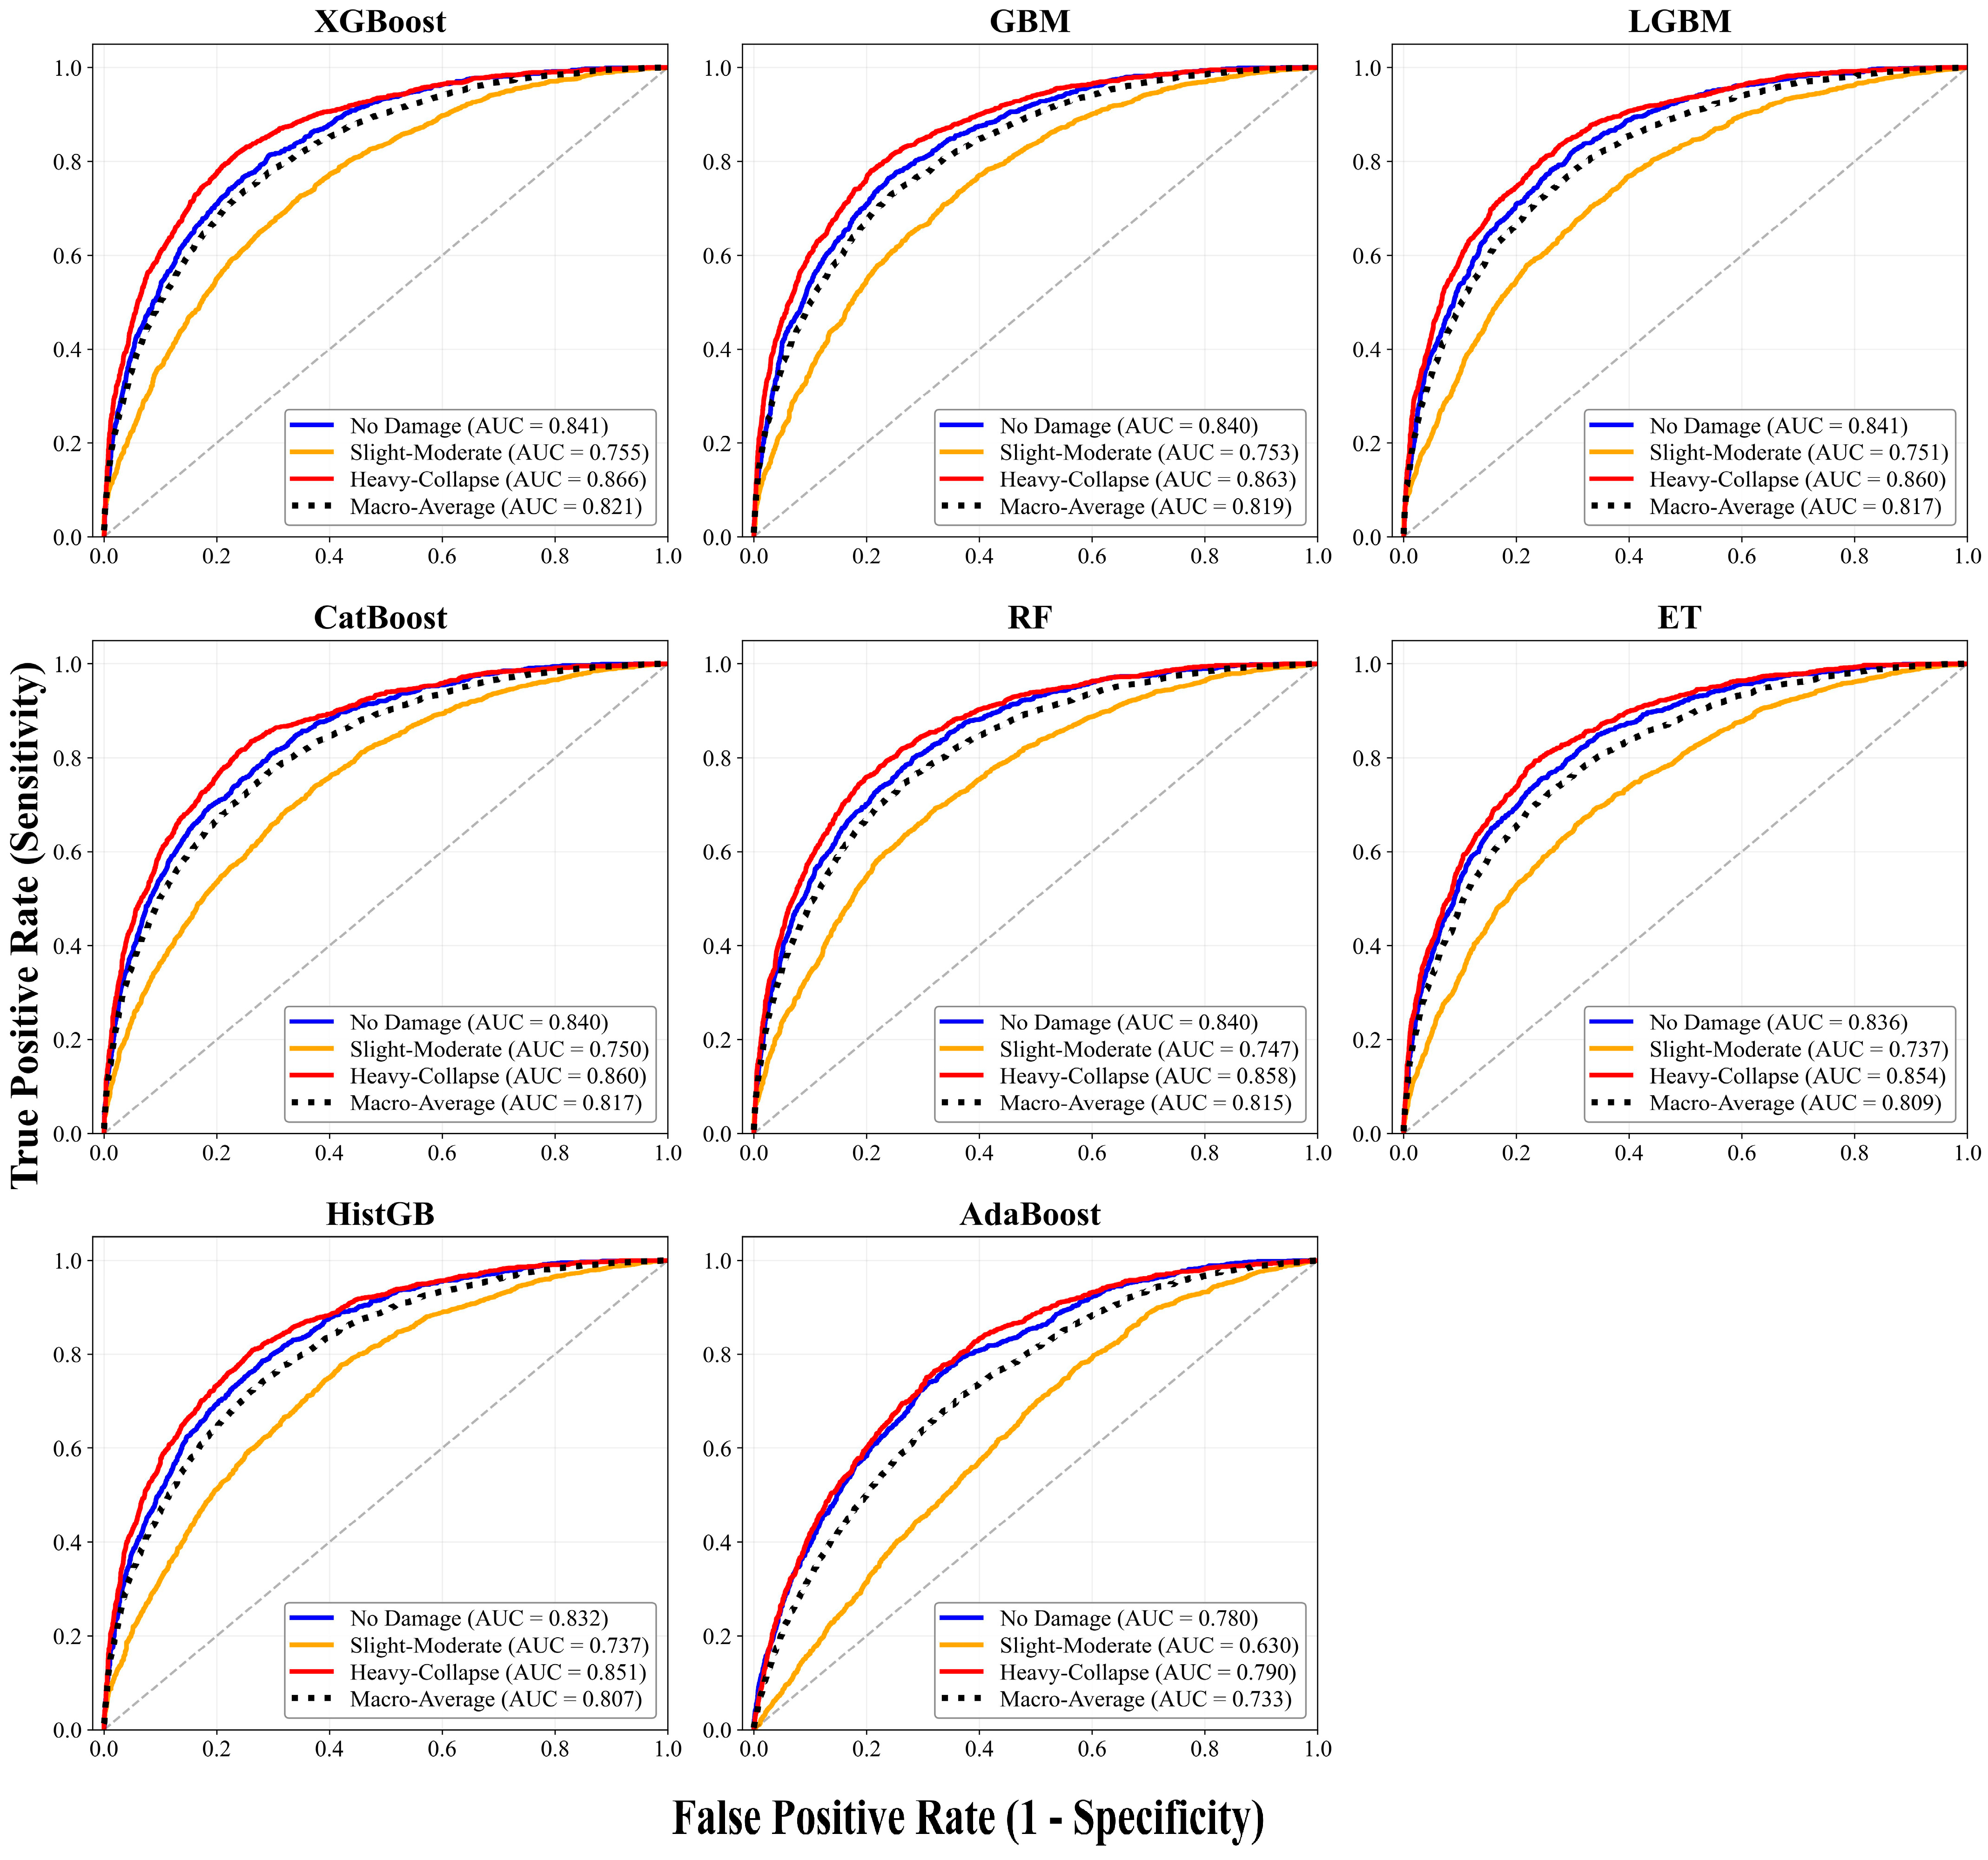
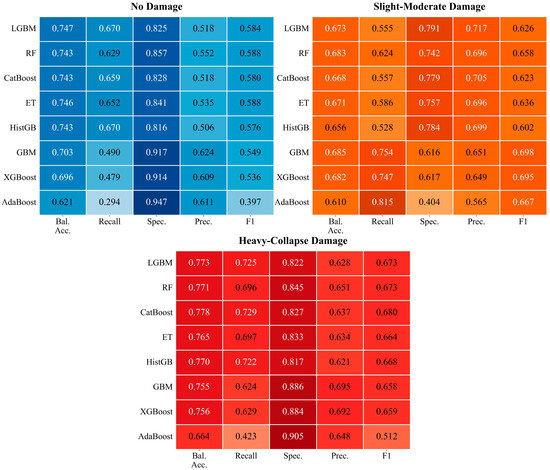
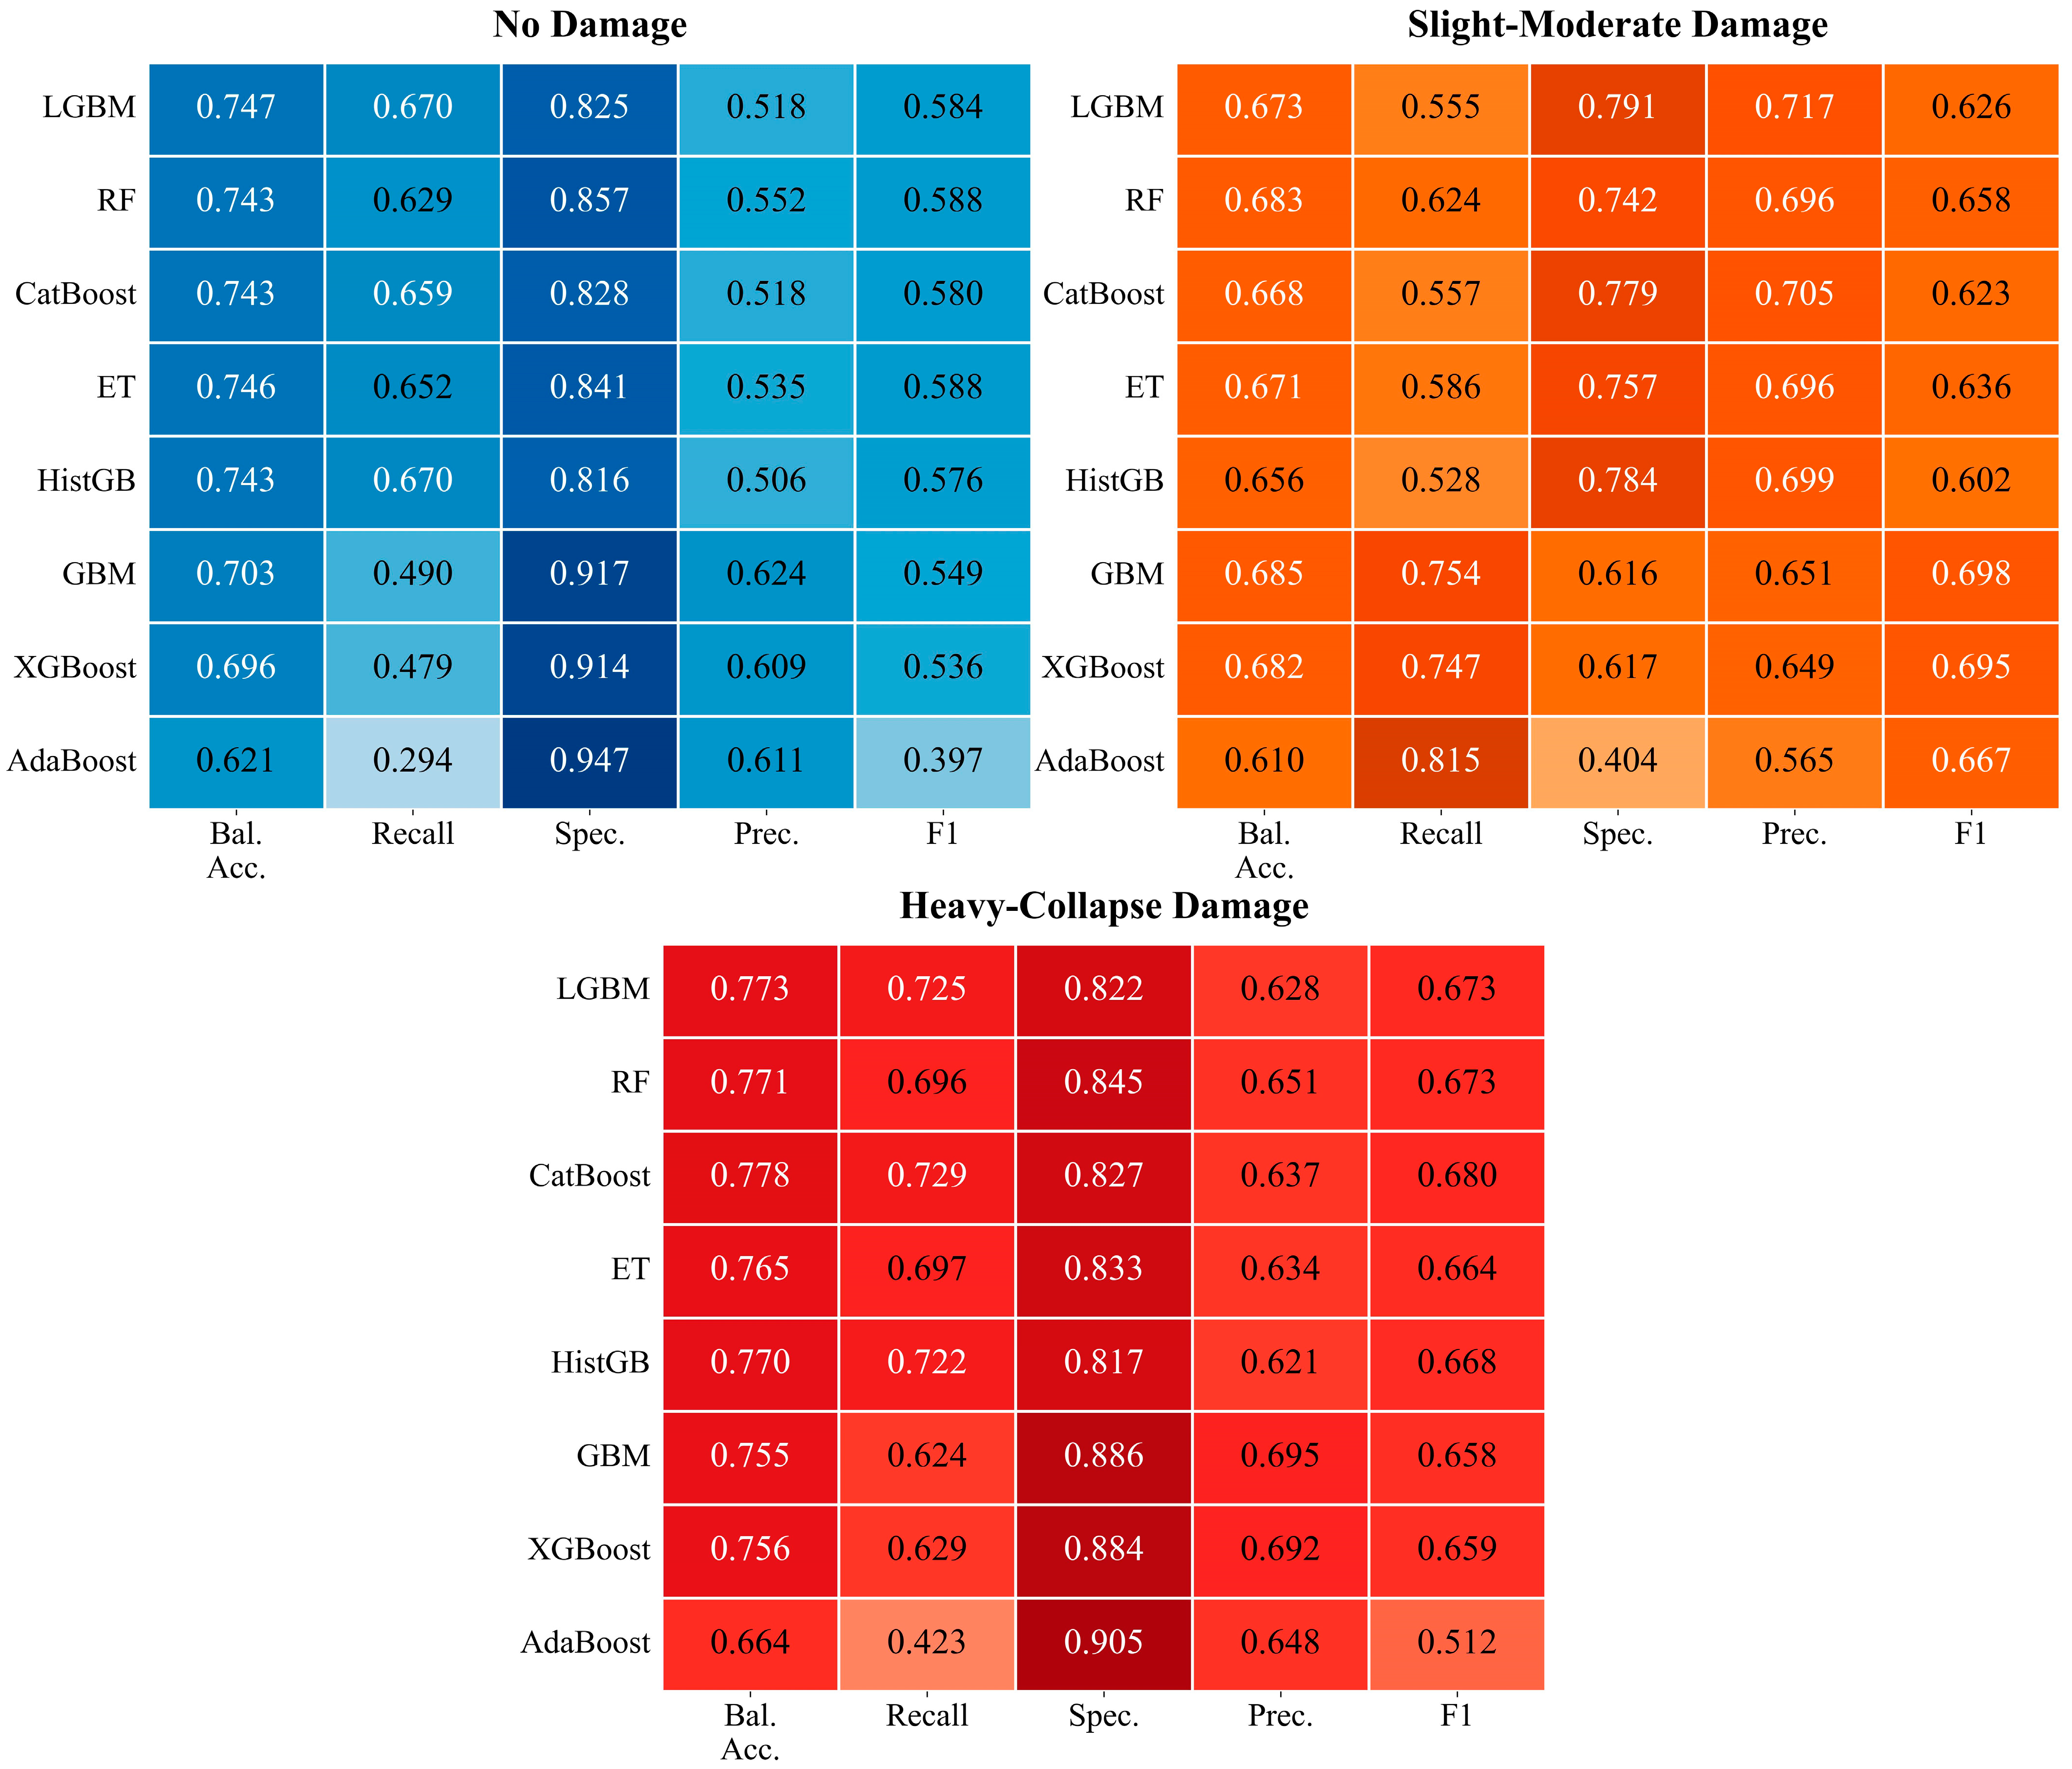
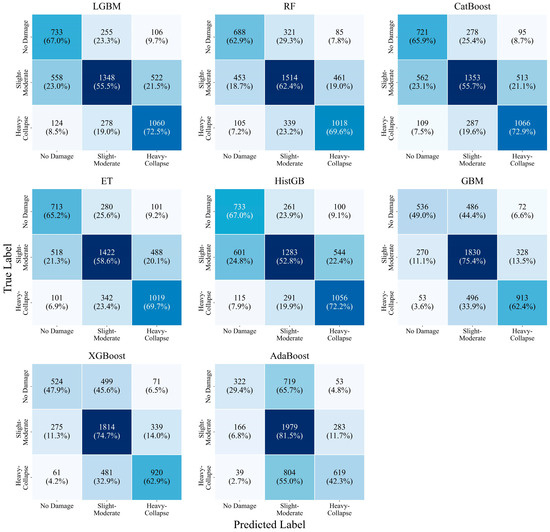
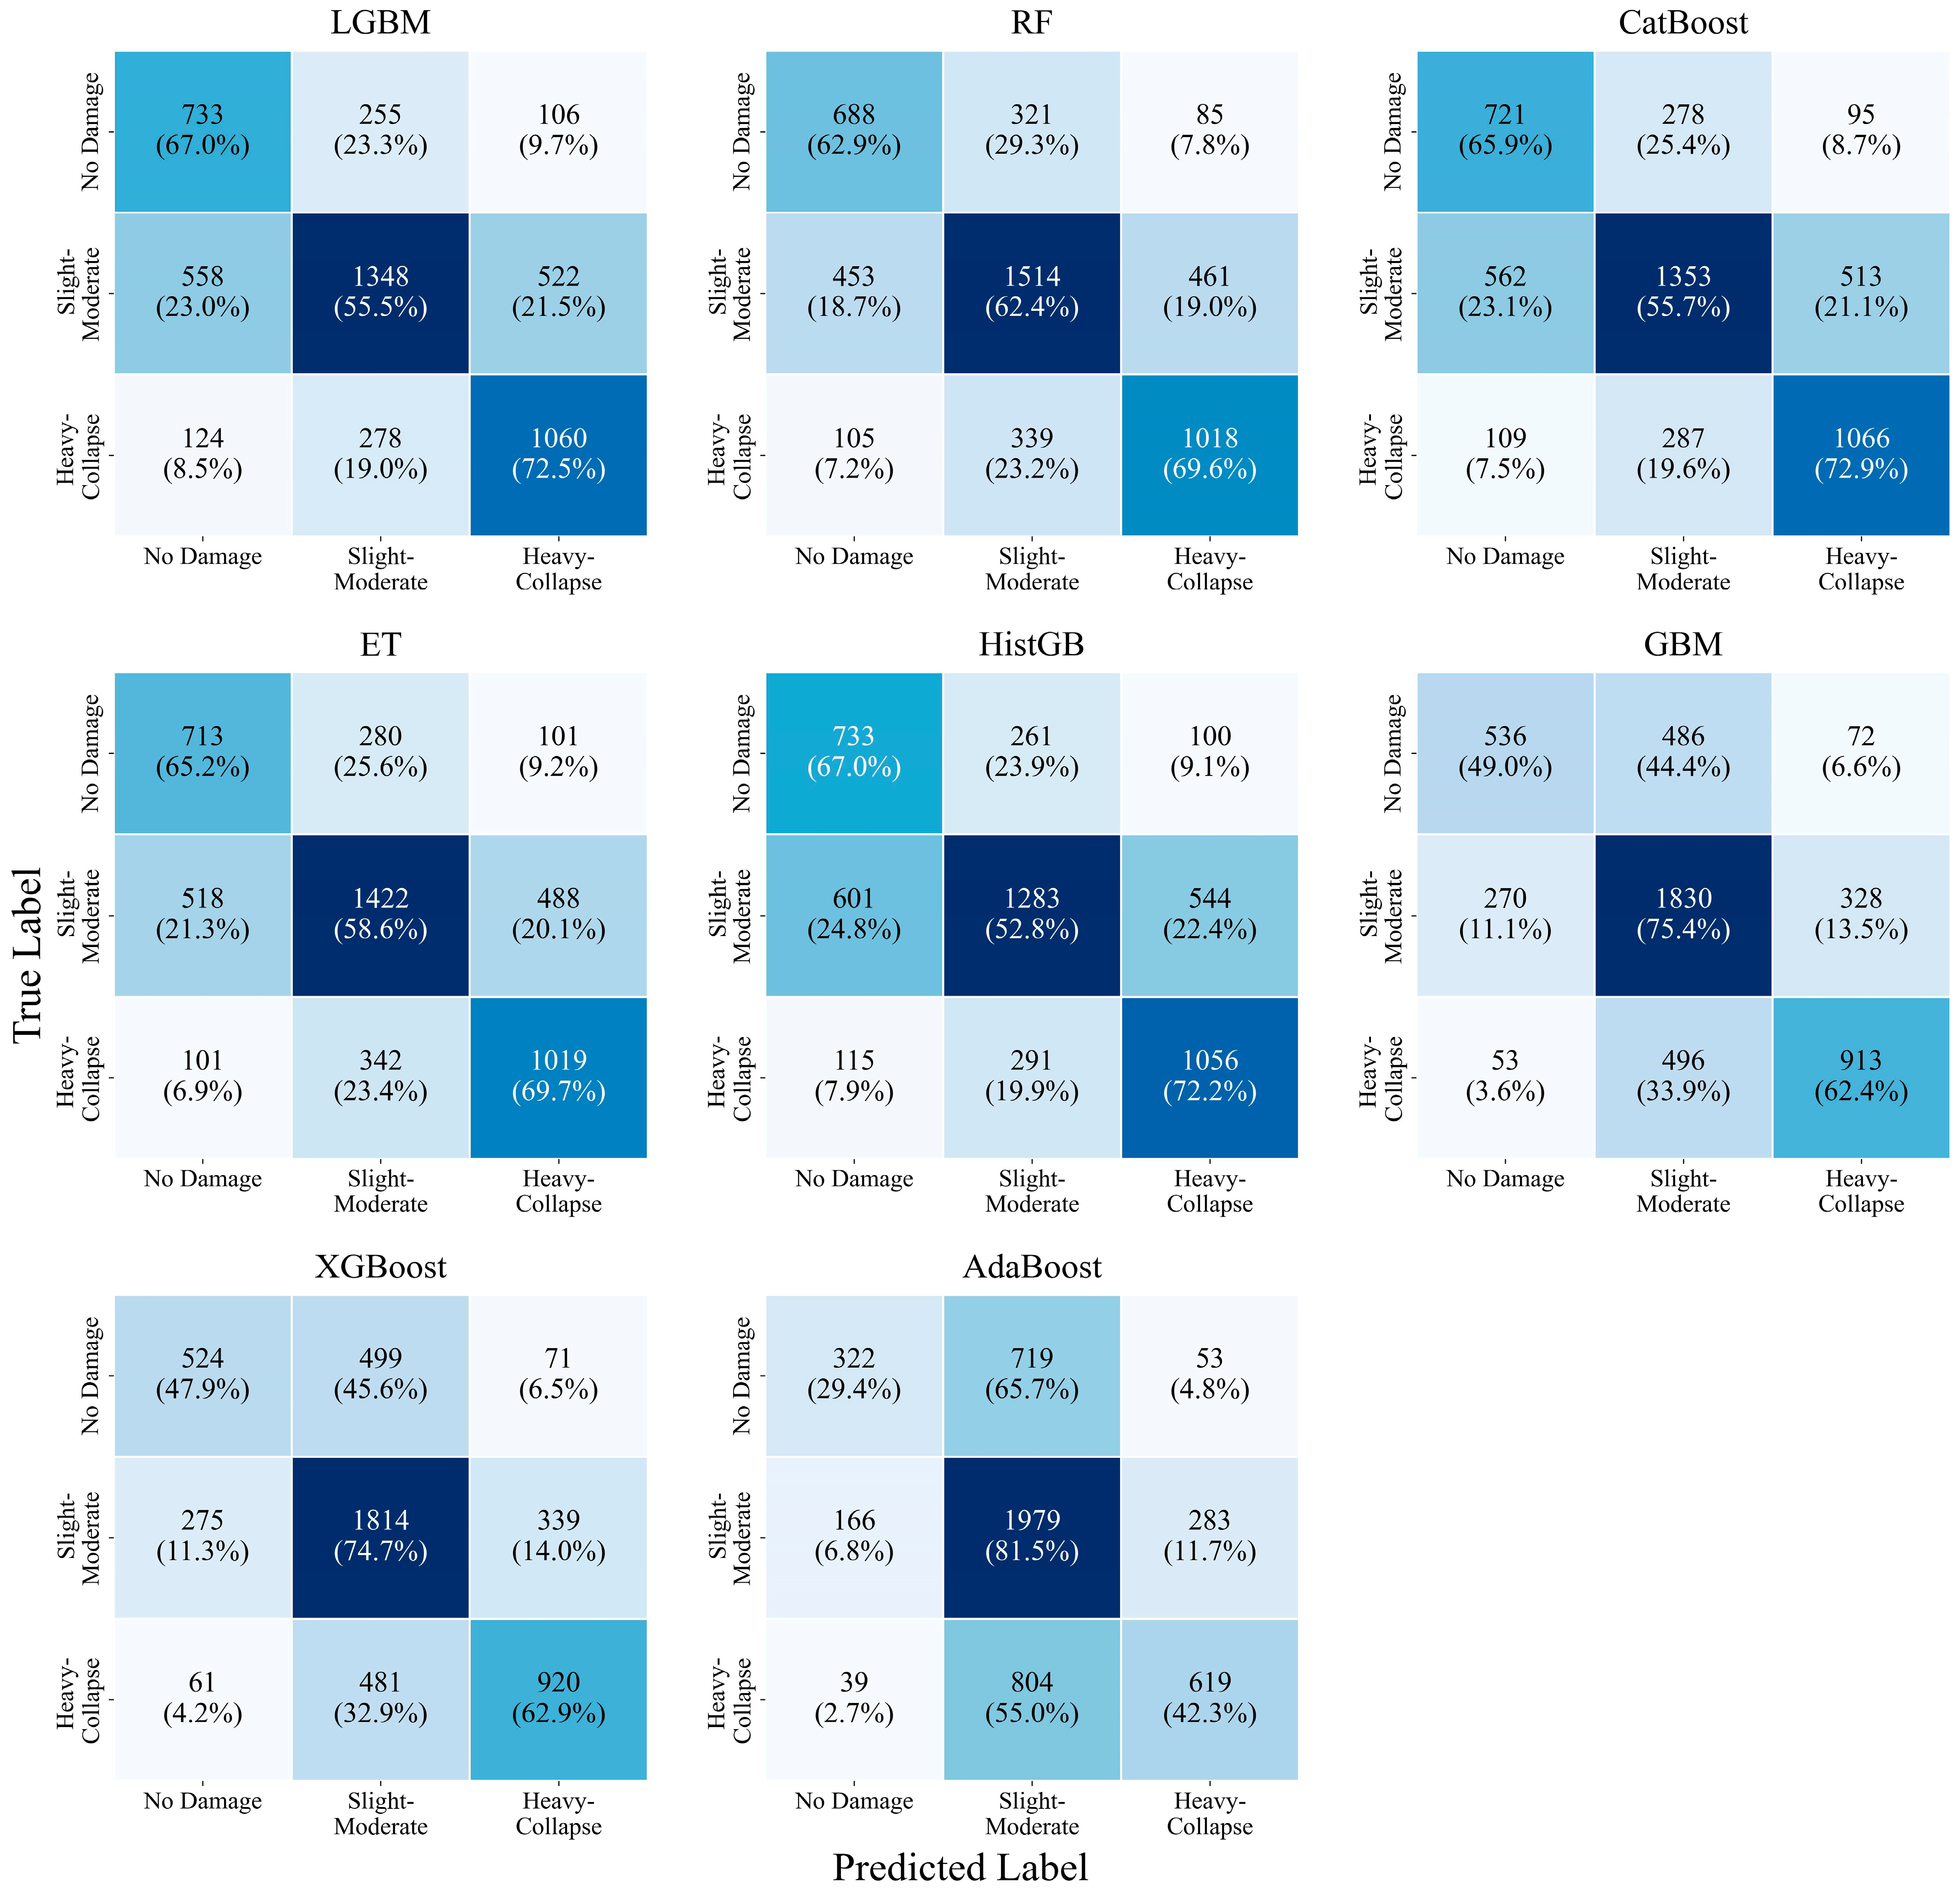
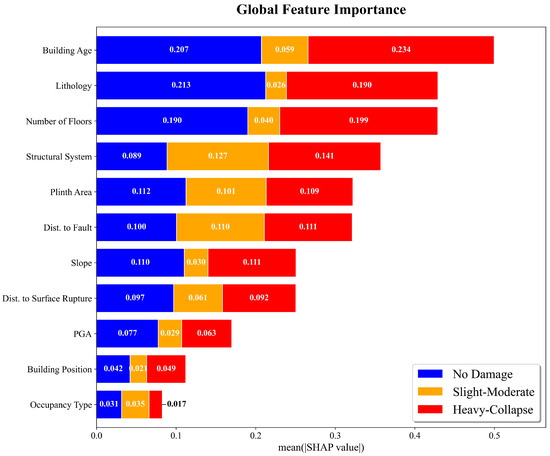
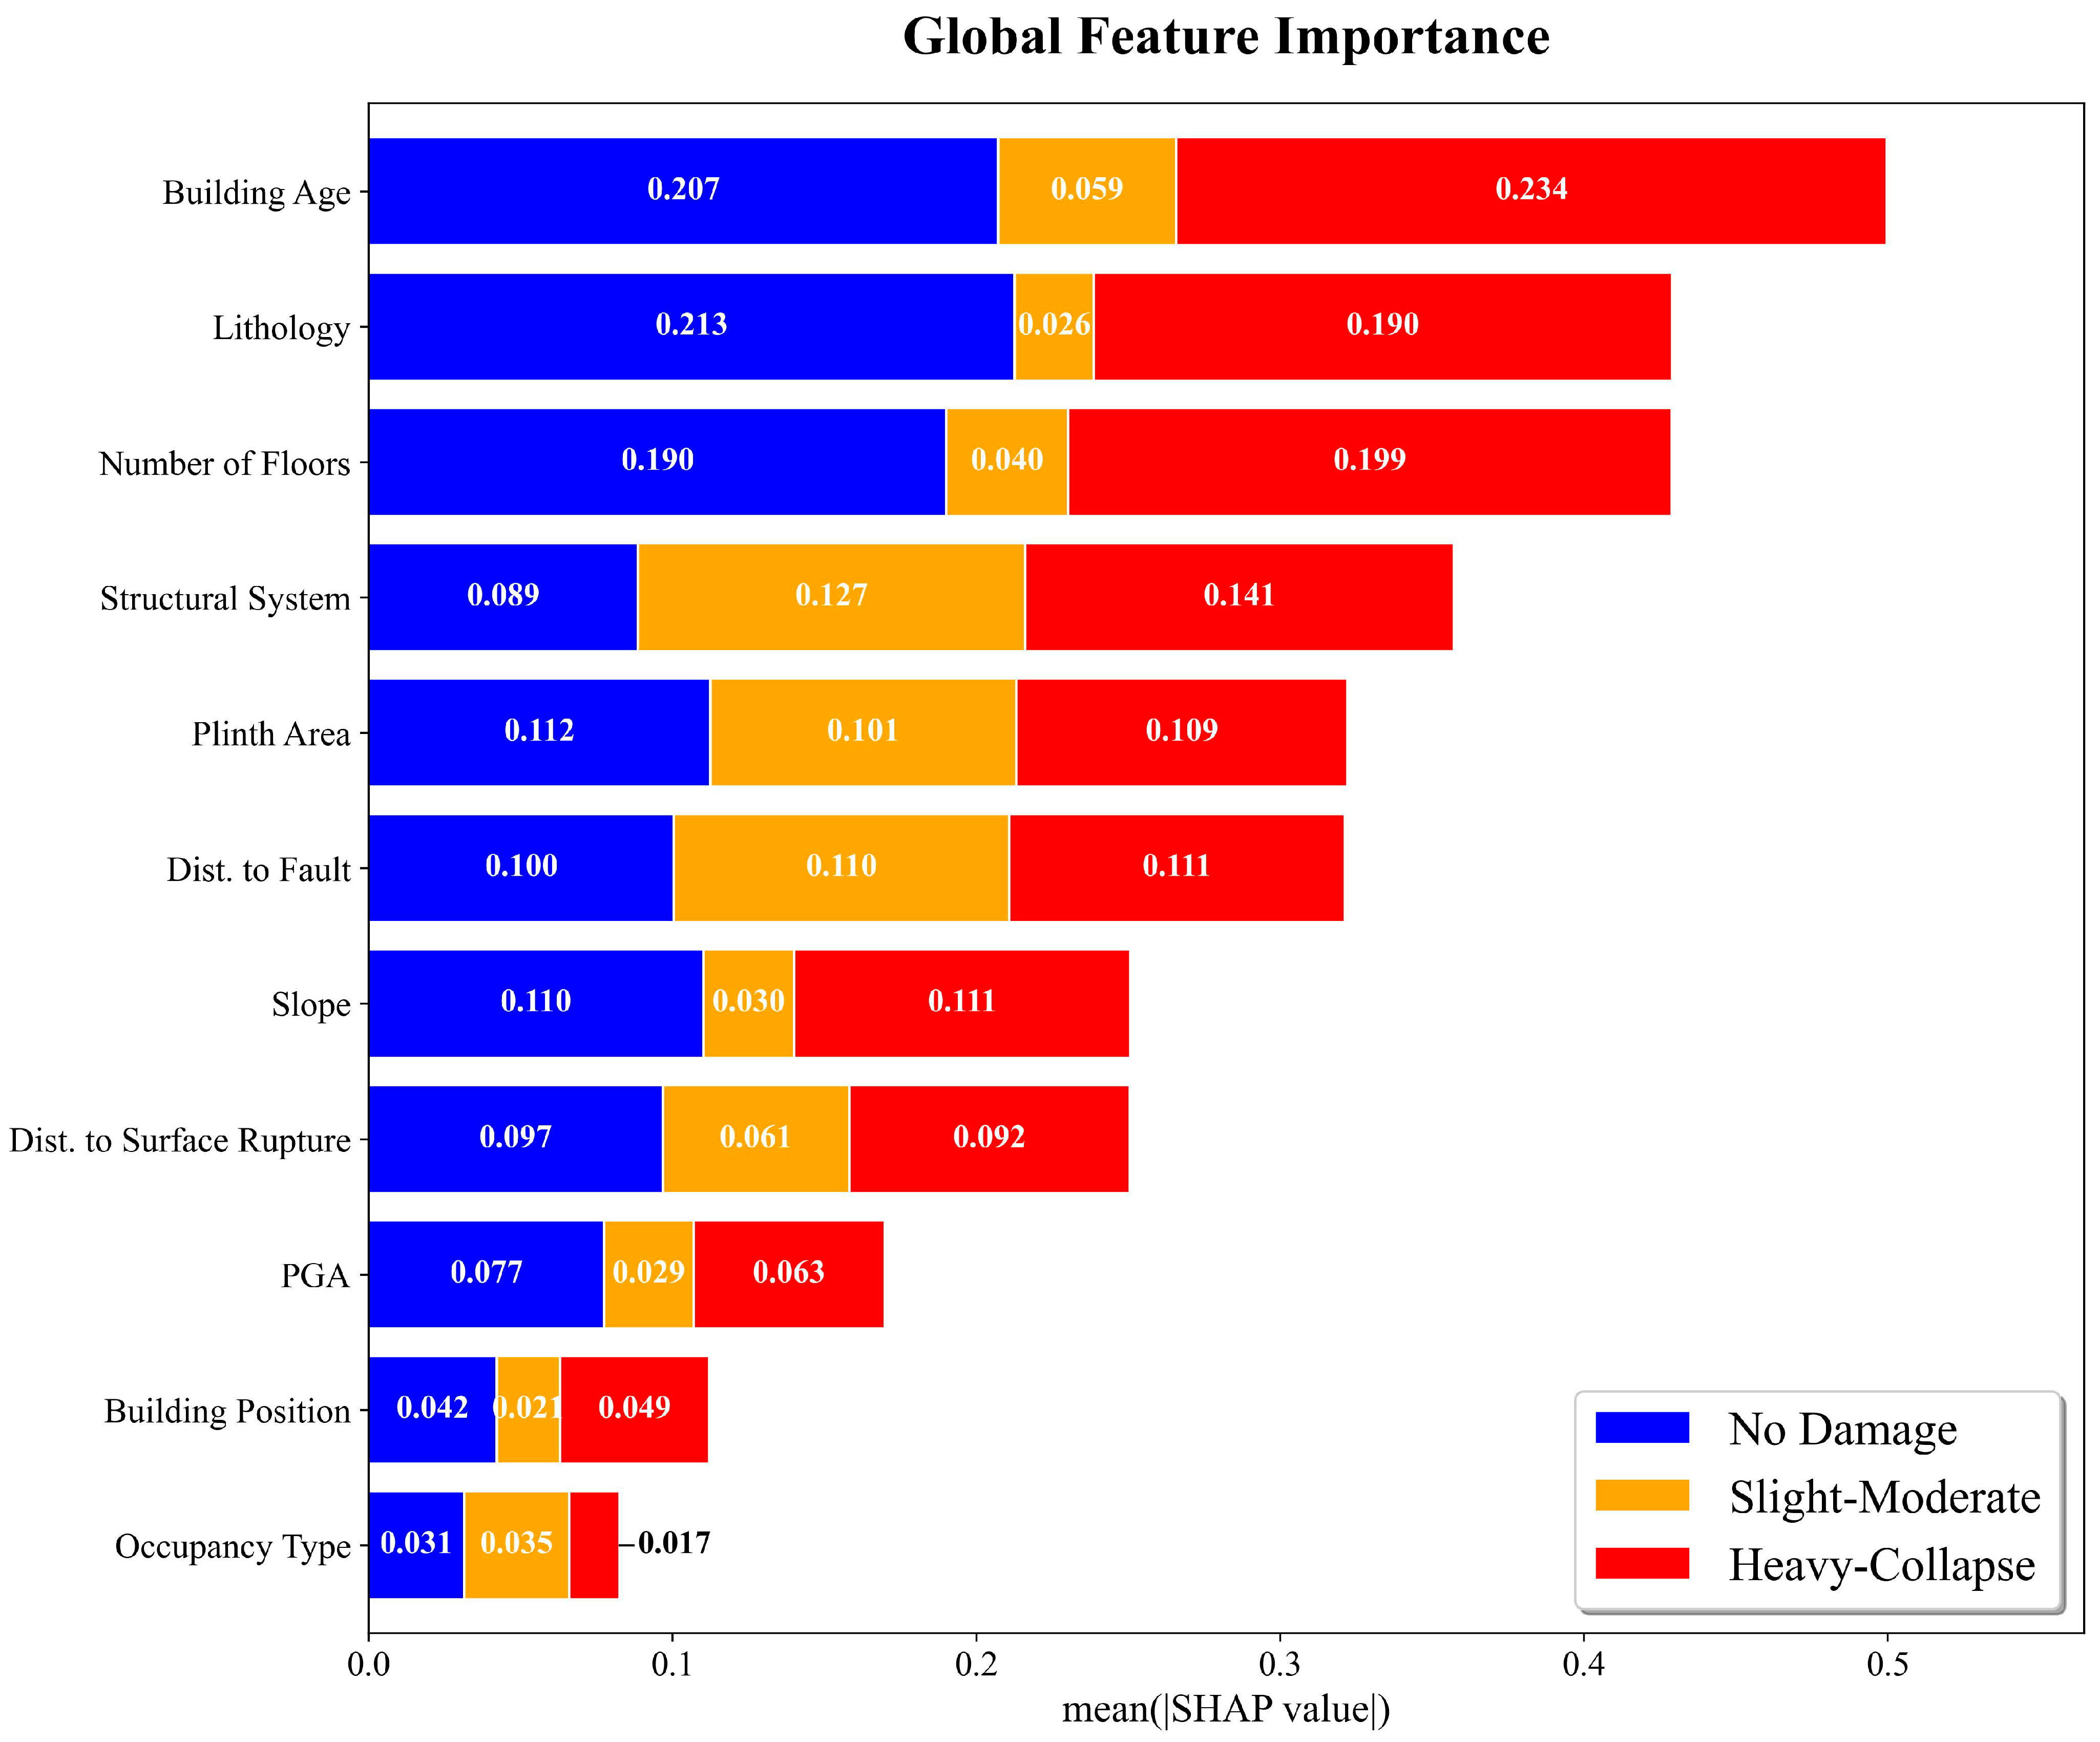
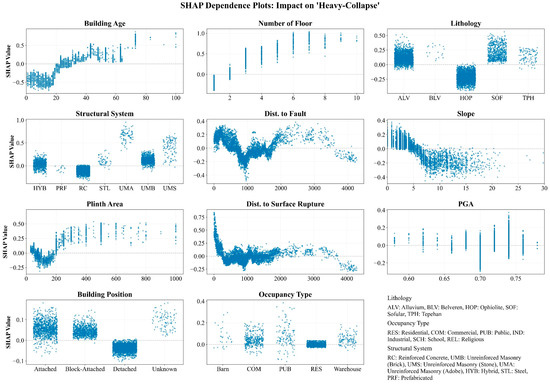
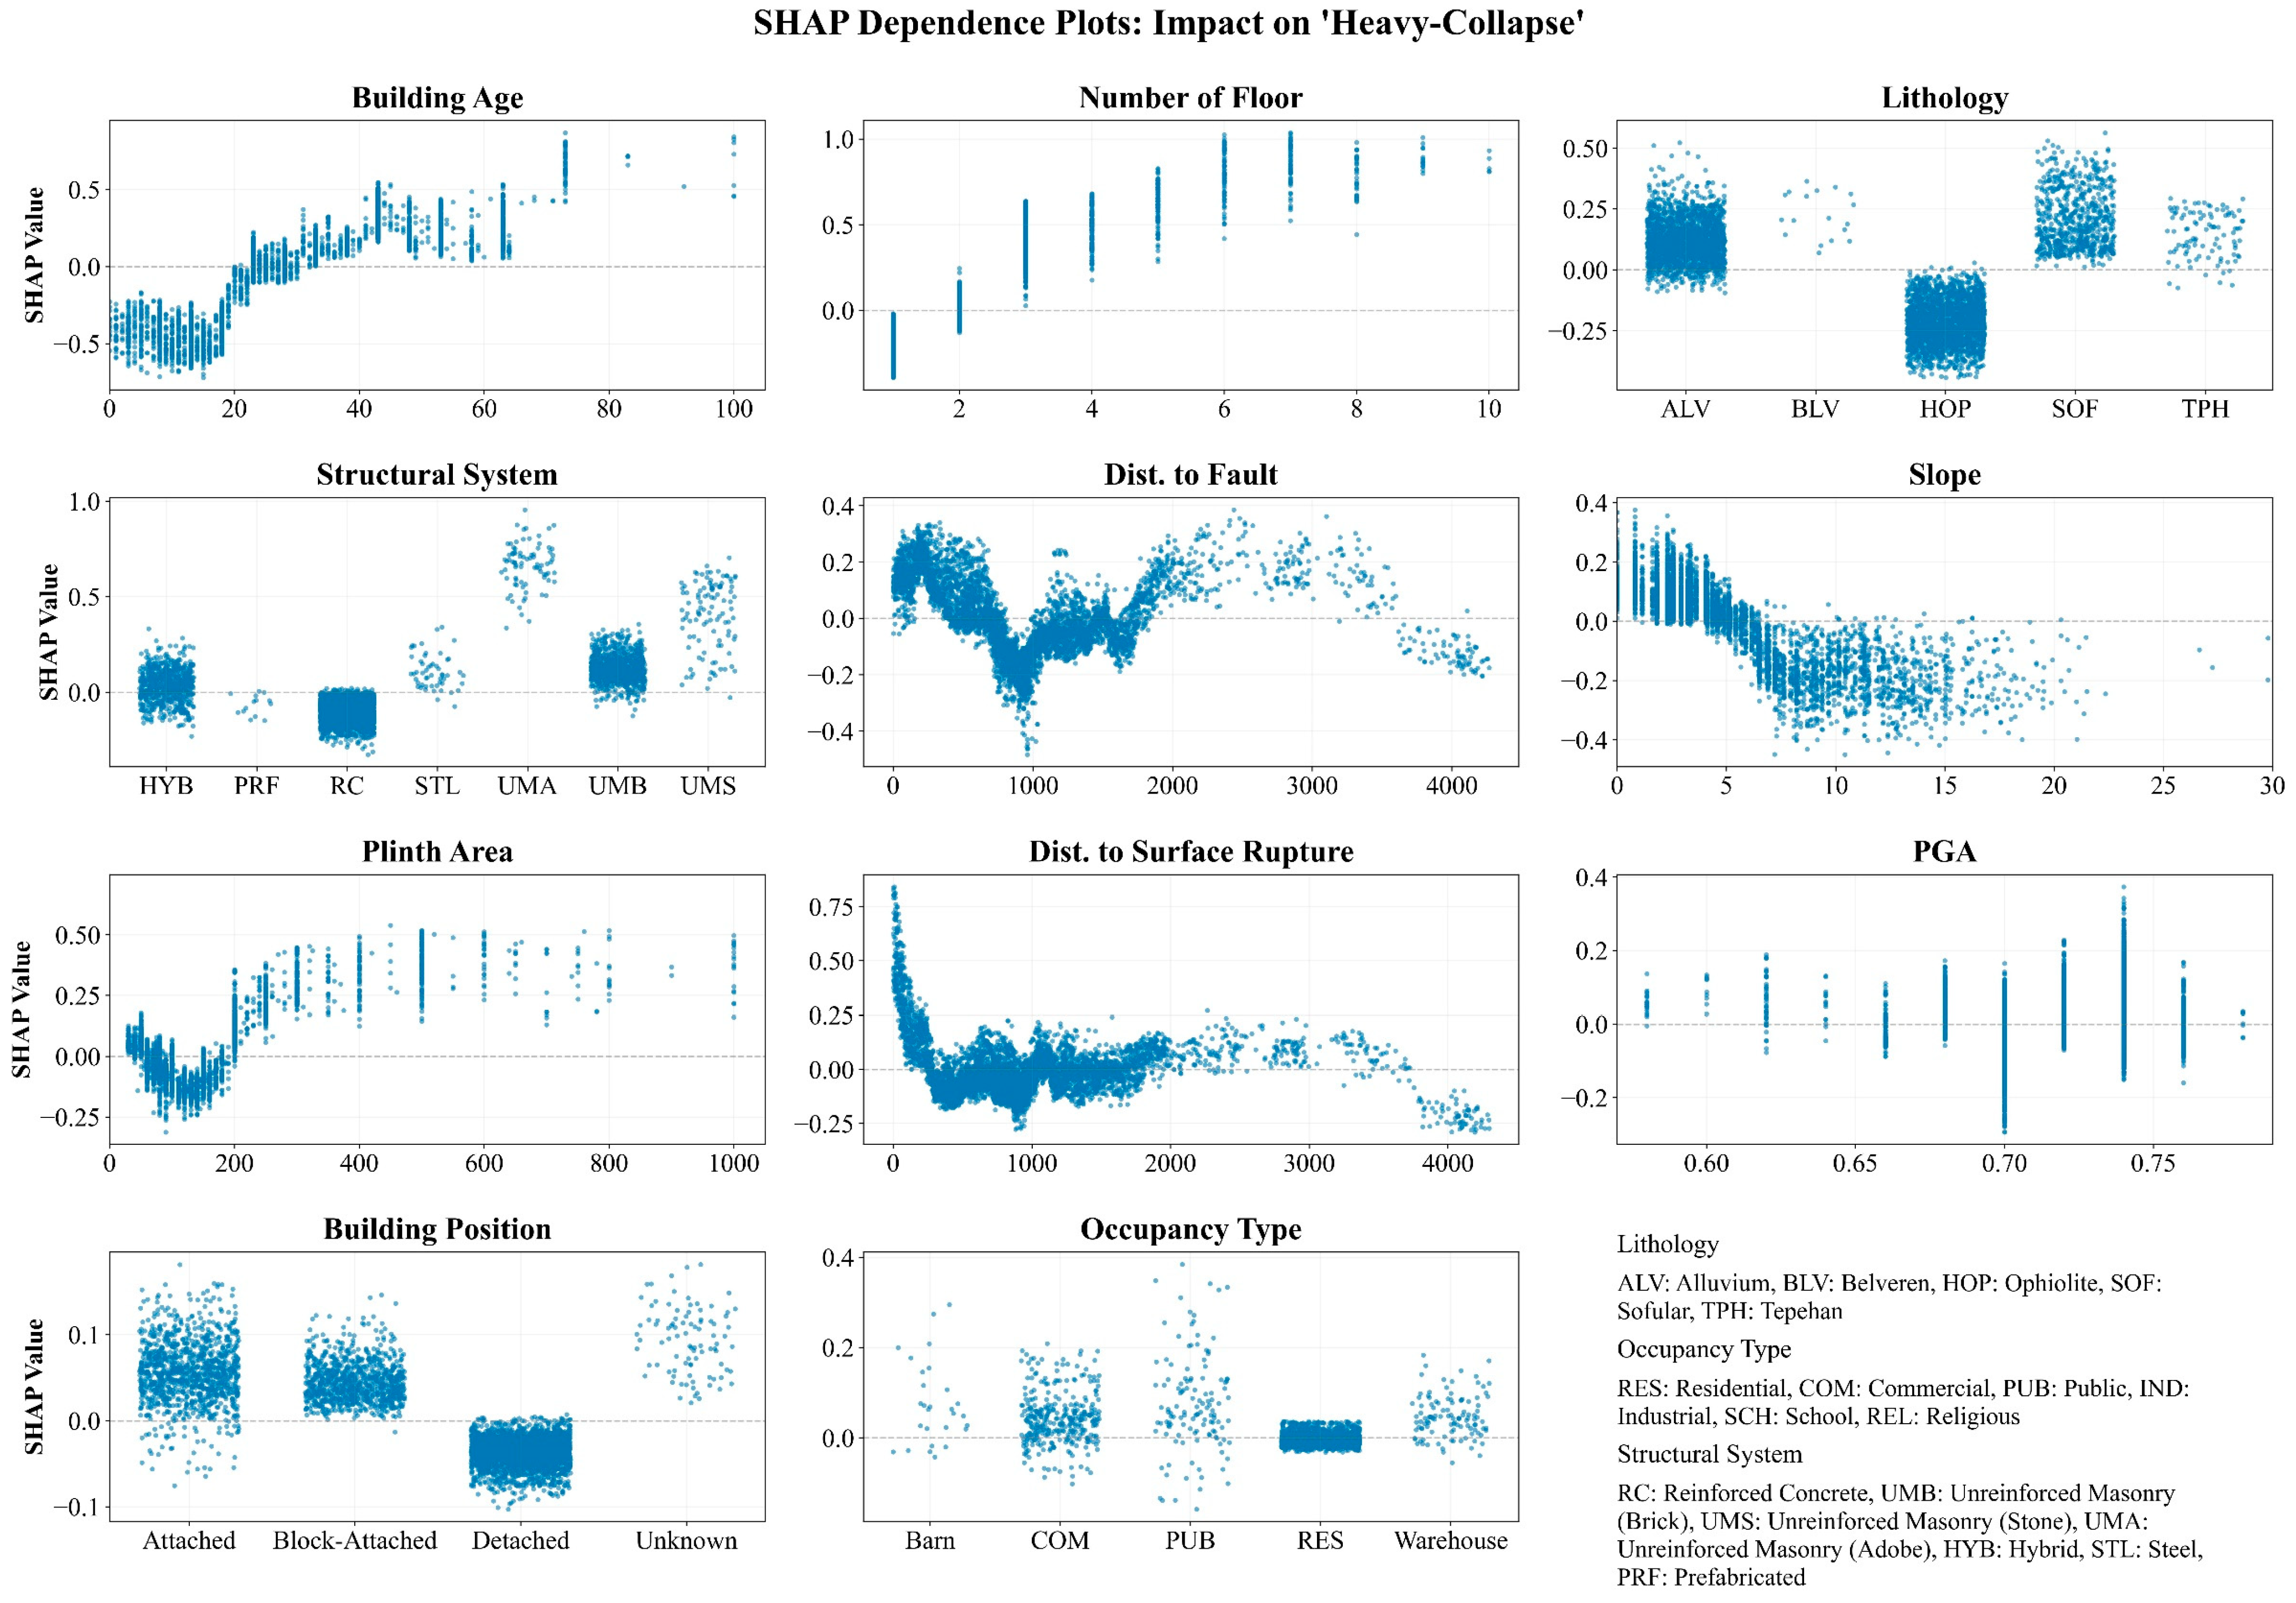

Disclaimer/Publisher’s Note: The statements, opinions and data contained in all publications are solely those of the individual author(s) and contributor(s) and not of MDPI and/or the editor(s). MDPI and/or the editor(s) disclaim responsibility for any injury to people or property resulting from any ideas, methods, instructions or products referred to in the content. |
© 2026 by the authors. Licensee MDPI, Basel, Switzerland. This article is an open access article distributed under the terms and conditions of the Creative Commons Attribution (CC BY) license.