


Abstract
Precise control of the water-to-cement (w/c) ratio is critical in three-dimensional concrete printing (3DCP), for which minor deviations compromise extrudability, buildability, and structural integrity. Existing non-destructive w/c (moisture) sensors have not been validated for real-time, in situ monitoring during the concrete extrusion process. This study develops and validates a four-electrode Wenner-array probe, interfaced with an LCR meter, for in situ electrical resistance measurements of fresh concrete. The system was calibrated against NaCl and KCl electrolytic solutions at resistivities of 1, 5, and 10 Ω·m and then tested on ordinary Portland cement pastes at w/c ratios of 0.40–0.60 and on a proprietary 3D-printable blend at 0.40–0.65. The results show that resistance drift remained below 1.2% under ambient temperature fluctuations, with sub-second response times. Strong nonlinear correlations (R2 > 0.99) were established between electrical resistance and w/c ratio for both formulations, with resistance increasing with higher w/c ratios due to ionic dilution and decreasing over time as early-age hydration progressed. Proprietary mixtures below w/c = 0.51 exhibited insufficient pore connectivity (CV > 30%) for reliable measurement, whereas mixtures at w/c ≥ 0.51 demonstrated excellent repeatability (CV < 2.80%). Electrical resistance measurement provides a viable real-time technique for w/c determination in fresh concrete, enabling automated closed-loop control in 3DCP operations.
1. Introduction
Construction technology is undergoing a fundamental transformation through three-dimensional concrete printing (3DCP), a process in which concrete is deposited layer by layer without the use of traditional formwork. This methodology offers compelling advantages, including up to 60% reduction in material waste [1], enhanced geometric design freedom, and accelerated construction timelines. At its core, however, successful 3DCP depends on maintaining precise control of the water-to-cement (w/c) ratio; this single parameter simultaneously governs fresh-state rheological behavior, such as flowability and viscosity, and hardened-state mechanical performance, such as compressive strength [2]. Unlike conventional cast concrete supported by formwork during curing, 3DCP must strike a delicate balance: The concrete must be fluid enough for extrusion through a nozzle (extrudability), structurally stable enough to hold its shape immediately after deposition (buildability), and pumpable through the delivery system without blockage (pumpability) [3]. This balance is exceptionally sensitive to the w/c ratio, making real-time monitoring of water content not just desirable but also operationally essential for closed-loop control.
When water content falls below a critical threshold, the mixture becomes excessively stiff, risking hose blockages, inconsistent layer deposition, and brittle, discontinuous layers prone to structural failure. Conversely, excess water causes the deposited concrete to lose shape retention, potentially resulting in collapse and structural instability during printing. Both failure modes carry serious consequences: financial losses from wasted materials and labor, amplified environmental impacts from excess concrete production, and hazardous working conditions for construction personnel. These risks underscore the importance of developing robust, real-time monitoring systems capable of detecting and correcting w/c deviations before print failures occur. Indeed, monitoring and feedback systems for key mixture parameters are widely regarded as an inevitable step toward full automation in construction [4].
Recent advances in in situ sensing for 3DCP have demonstrated the potential of embedded piezoelectric sensors for real-time monitoring of setting behavior [5], while vision-based systems have been developed for geometric quality control during extrusion [6]. In the domain of electrical characterization of cementitious materials, electrochemical impedance spectroscopy has been applied to estimate w/c ratios in fresh concrete using artificial neural networks, achieving promising accuracy in laboratory settings [7]. A majority of current 3DCP operations depend predominantly on manual assessment, in which workers evaluate mixture consistency through visual inspection and tactile feedback. This approach is inherently subjective, operator-dependent, and incapable of providing quantitative real-time data. Traditional concrete testing methods, including slump flow tests (ASTM C143), chloride penetration tests (ASTM C1202), and gravimetric water content determination (ASTM C566-19) [8], are fundamentally incompatible with real-time process control and require sample preparation and testing duration ranging from 15 min to 24 h [9,10]. Flow table experiments by Papachristoforou et al. [11] identified a narrow printability window of 18–24 cm flow table expansion, highlighting that the margin for acceptable w/c variation is tight and that manual detection alone is insufficient to consistently identify it.
Despite rapid growth in 3DCP research, investigations remain disproportionately focused on material optimization, such as mix design, admixture selection, and rheology modification, rather than on process control and automated monitoring systems [12]. Commercial time-domain reflectometry (TDR) systems, such as the IMKO SONO-WZ, can measure moisture within 10 s in traditional ready-mix applications. However, they are designed for stationary mixing drums and have not been verified for continuous in-line monitoring during the extrusion stage of 3DCP. Microwave dielectric sensors require specimen preparation steps that are incompatible with ongoing extrusion processes. Additionally, TDR measurement accuracy declines in high-ionic-strength environments, such as fresh cement paste. This fundamental limitation does not affect electrical resistance measurements at the sub-centimeter electrode spacings used in this study. However, none have been specifically validated or adapted for real-time, in situ w/c monitoring during the extrusion process in 3D-printable formulations. This represents a critical gap in the transition from laboratory demonstrations to construction-scale 3DCP.
Electrical resistance measurement has long been recognized as a sensitive indicator of the physicochemical state of fresh cementitious materials. The fundamental principle is that variations in w/c ratio alter the concentration of ionic species such as K+, Na+, Ca2+, and OH− in a pore solution, thereby altering electrical conductivity in a predictable manner [13]. Mancio et al. [14] demonstrated instantaneous in situ w/c determination in fresh conventional concrete using electrical measurements, and Wei and Li [15] confirmed that water content dominates the electrical response in fresh cement systems before significant hydration occurs. Wei and Xiao [13] further established that the w/c ratio directly governs the electrical resistivity of cement paste through a power-law relationship at fixed curing times. However, a point of ongoing debate in the literature concerns the relative contributions of electrode polarization, contact resistance, and sample geometry to measured impedance values, with two-electrode configurations known to introduce significant measurement artifacts that four-electrode Wenner-array configurations can effectively eliminate [16]. However, to the best of the authors’ knowledge, no published study has specifically validated such sensors for real-time, in situ w/c monitoring during the extrusion process in 3D-printable formulations. This gap represents a critical barrier to automated quality control in construction-scale 3DCP.
A critical distinction separates conventional concrete quality control from the monitoring challenge posed by 3DCP. In conventional cast concrete, the w/c ratio is fixed at the batching plant, and the material is supported by formwork throughout placement and curing. Hence, the static conditions under which post-mixing measurements are made are sufficient. In 3DCP, the material must simultaneously satisfy contradictory rheological demands: low enough yield stress for extrusion through a nozzle (extrudability) and high enough structural build-up for self-supporting layer deposition (buildability). This creates a demand for a critical balance that is acutely sensitive to the w/c ratio and evolves dynamically from mixing through pumping to deposition [3,7]. Existing electrical resistance studies, including those by Mancio et al. [14] and Wei and Li [15], were conducted under static formwork conditions with no material flow, extrusion pressure, or shear history.
The gap between static laboratory validation and dynamic extrusion-phase monitoring represents the central unresolved challenge that this study begins to address by establishing the baseline resistance–w/c relationships necessary for any future closed-loop monitoring system. While Mancio et al. [14] demonstrated instantaneous in situ w/c determination in concrete under static lab conditions and Wei and Li [15] confirmed that water content controls the electrical response in fresh Portland cement paste, neither study examined 3DCP conditions. This study advances these findings by carrying out the following: (1) validating resistance-based w/c monitoring for a proprietary 3D-printable cement with masonry sand, silica fume, and admixtures; (2) characterizing and quantifying the percolation threshold in high-powder mixes; and (3) evaluating system stability metrics relevant to automated construction, including thermal drift below 1.2%, sub-second response, and measurement repeatability. The principal findings demonstrate that electrical resistance provides a stable, sub-second, highly repeatable indicator of the w/c ratio in fresh concrete, with strong nonlinear correlations (R2 > 0.99) established for both cement types, laying the foundation for automated, closed-loop water-dosing control in 3DCP operations. Despite the conventional distinction between concrete (with coarse aggregates) and mortar (with fine aggregates), the concrete-printing domain widely applies the term “concrete” to both material types. For consistency with current practice, this paper employs the term in that broader sense.
2. Materials and Methods
2.1. Apparatus Development
2.1.1. Electrical Resistance Measurement System
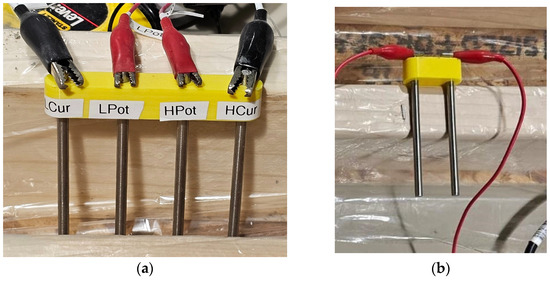
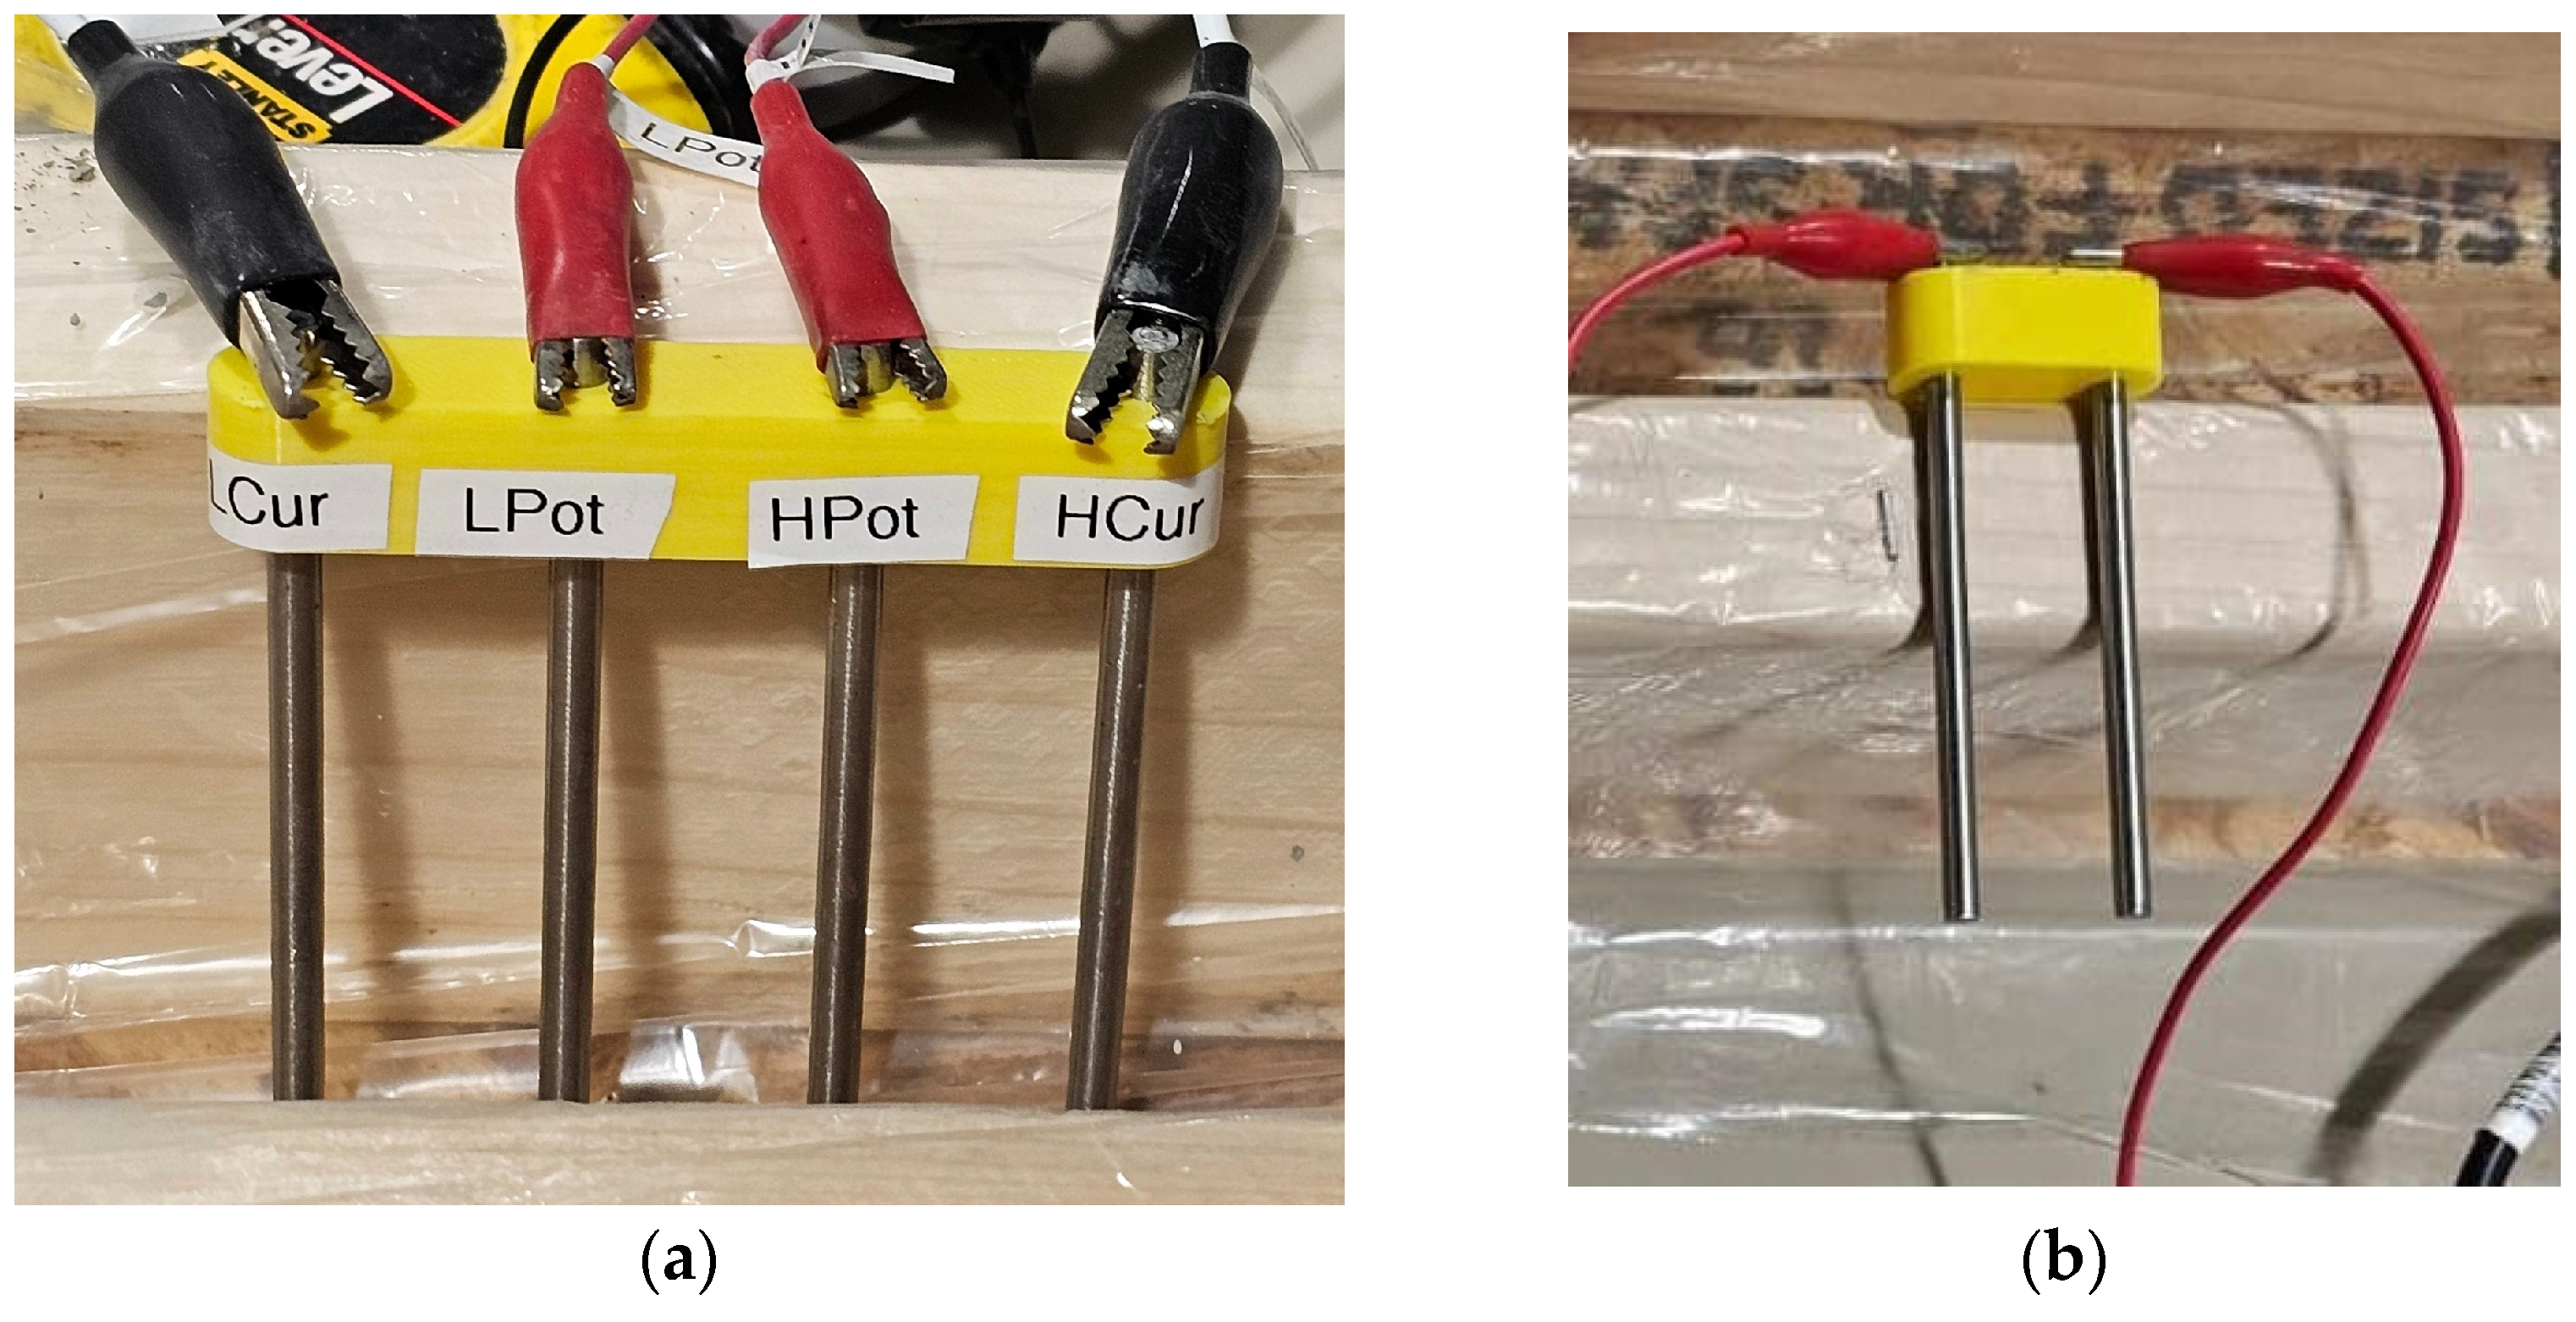
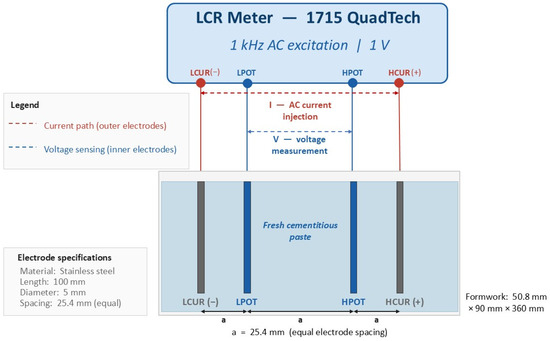
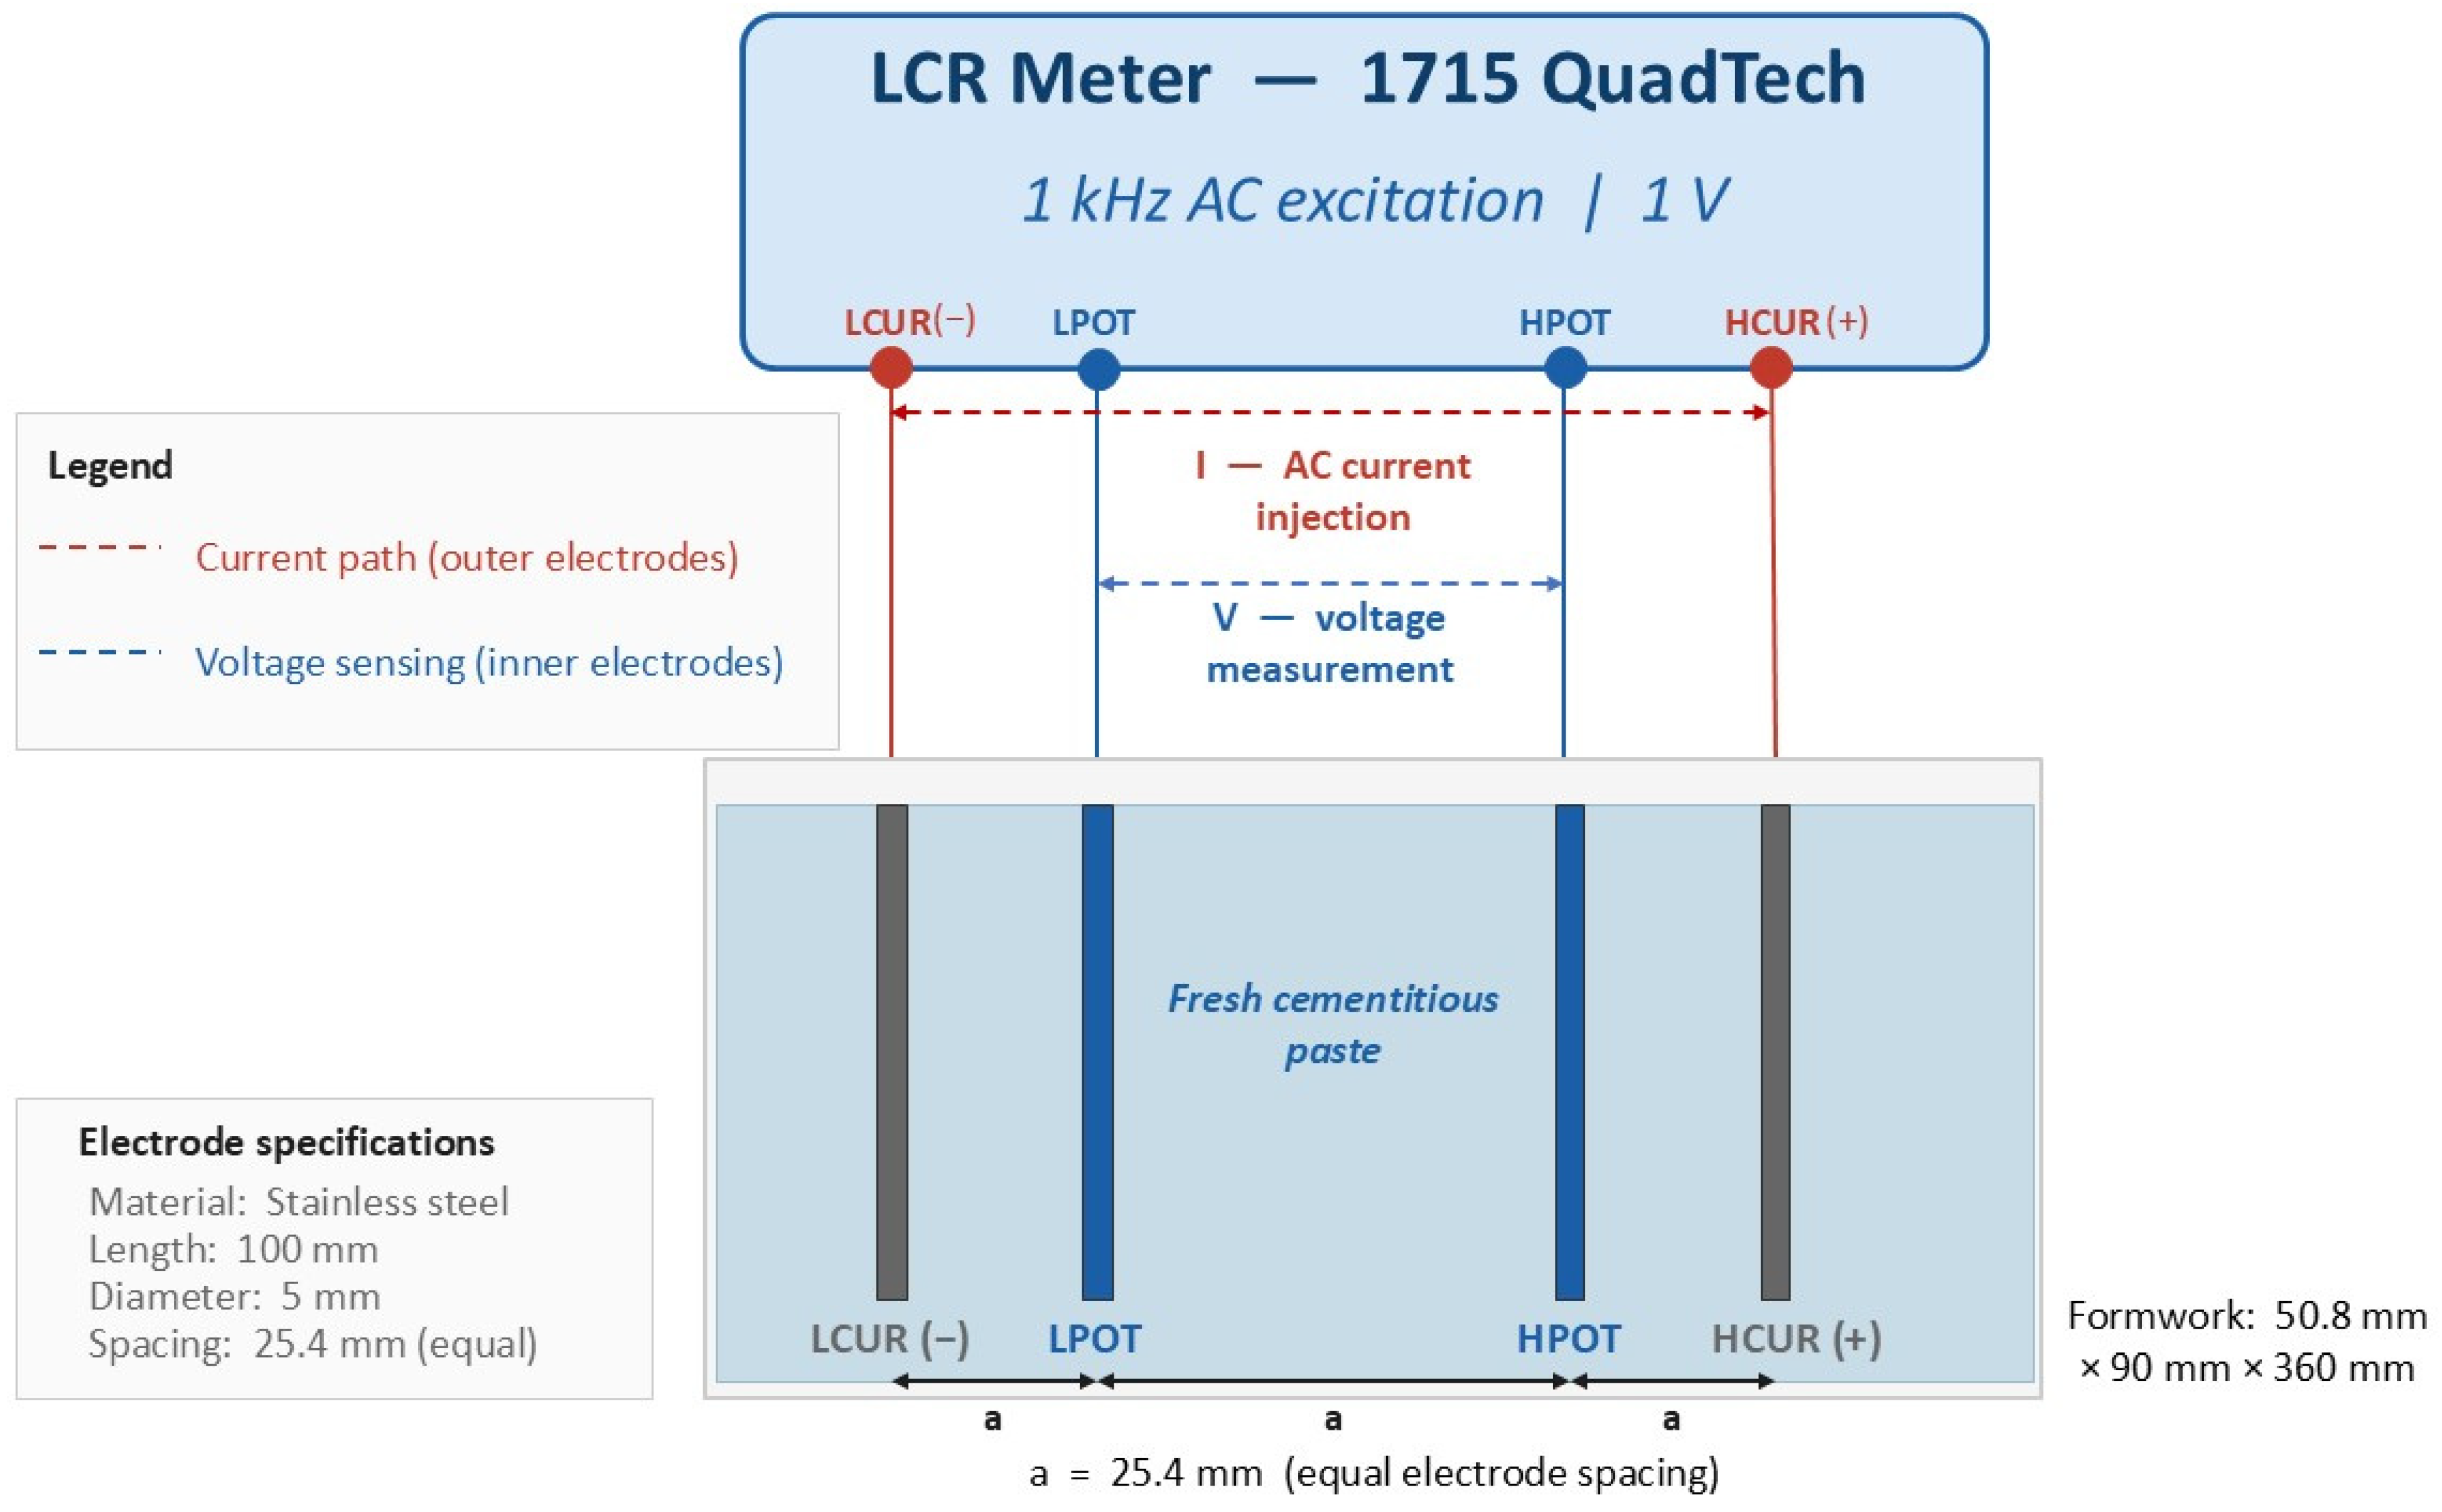
A 1715 QuadTech LCR Digibridge (IET Labs, Inc., Westbury, NY, USA) was used as the primary measurement instrument, configured to measure resistance (R) and series reactance (X) by transmitting an alternating current at 1 kHz with an excitation voltage of 1 V, with automatic resistance range, slow measurement speed, and manual trigger mode. The measurement frequency of 1 kHz was selected based on established practice for uniaxial electrical resistance measurements of cementitious materials, where the accepted operating range of 0.5–10 kHz minimizes electrode polarization artifacts at low frequencies and capacitive coupling effects at high frequencies [17,18,19]. At 1 kHz, the four-electrode configuration maintained a reactance-to-resistance ratio |Xs|/Rs < 0.025 throughout all experiments, confirming that the measured values represent the bulk resistive response of the material with negligible capacitive distortion. Two probe configurations were fabricated for comparative evaluation (a four-electrode probe and a two-electrode probe), as shown in Figure 1. Both probes featured stainless steel electrodes (100 mm length and 5 mm diameter) with 25.4 mm (1 inch) inter-electrode spacing, and they were housed in 3D-printed PLA brackets. Figure 2 shows the electrical circuit schematic of the four-electrode Wenner-array measurement system. In this system, alternating current (1 kHz, 1 V) is injected through the outer electrodes (LCUR and HCUR), while the resulting voltage drop is measured across the inner electrodes (LPOT and HPOT). The electrode spacing was a = 25.4 mm. The K-type thermocouple was inserted at the geometric center of the formwork, midway between the inner potential electrodes (LPOT and HPOT), at the same 50 mm depth as the electrodes, ensuring that the recorded temperature represents the same material volume probed electrically.
Figure 1.
(a) Image of the four-electrode probe; (b) image of the two-electrode probe.
Figure 2.
Electrical circuit schematic of the four-electrode Wenner-array measurement system.
The two-electrode probe was connected to an LCR meter using a proprietary 1700-03 Kelvin Clip Cable lead set, with the red Kelvin clip connecting the high side to the HPOT and HCUR (+) terminals and the black Kelvin clip connecting the low side to the LPOT and LCUR (−) terminals. Custom BNC-to-alligator-clip harnesses with identical wire lengths and gauges were used to connect both probes to the LCR meter, minimizing electrical noise and impedance mismatches.
2.1.2. Temperature Monitoring
Ambient temperature and relative humidity were monitored using a UEI DTH880 digital thermo-hygrometer (Instrumentation2000, Edison, NJ, USA). Sample temperature was measured using an Omega HH508 digital thermometer with a K-type thermocouple (resolution ±0.1 °C; Dwyer Omega, Michigan City, IN, USA), with analog verification provided by a Taylor standard-grade mercury thermometer. Temperature was recorded at 5-min intervals for all experiments, conducted under ambient laboratory conditions with continuous monitoring.
2.2. Experimental Program
The experimental program comprised four sequential phases: (1) probe configuration selection by comparing two-electrode versus four-electrode configurations; (2) system validation using NaCl and KCl electrolytic solutions of known resistivity; (3) correlation establishment using OPC pastes; and (4) validation using a proprietary 3DCP formulation. All experiments used fixed probe positioning to eliminate geometric variables in the resistance readings.
2.2.1. Probe Selection
Type I Portland cement conforming to ASTM C150/C150M-21 [20] was used for all cement-based experiments. Cement pastes were prepared in accordance with ASTM C305-20 [21] at a w/c ratio of 0.50. Mix proportions were calculated for a 1-m3 reference volume, assuming 6% air content and 15% additional material to compensate for mixing losses [22]. Tap water at 15 °C was used for all mixtures. All OPC paste batches followed ASTM C305-20 [21], mixing for 30 s at low speed, 30 s at medium speed, a 90-s rest, and 60 s at medium speed to ensure consistent energy and shear. Proprietary formulations were mixed per the manufacturer’s protocol at the same rotor speeds for 3 min to handle higher powder content. Mixing time, rotor speed, and batch volume were constant across all replicates to ensure reproducible ionic dissolution and reduce variability.
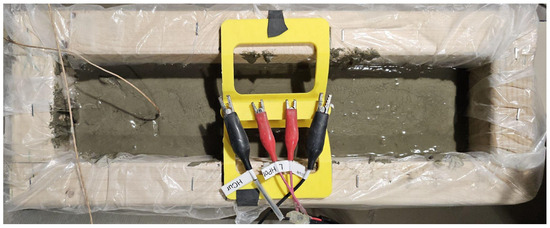
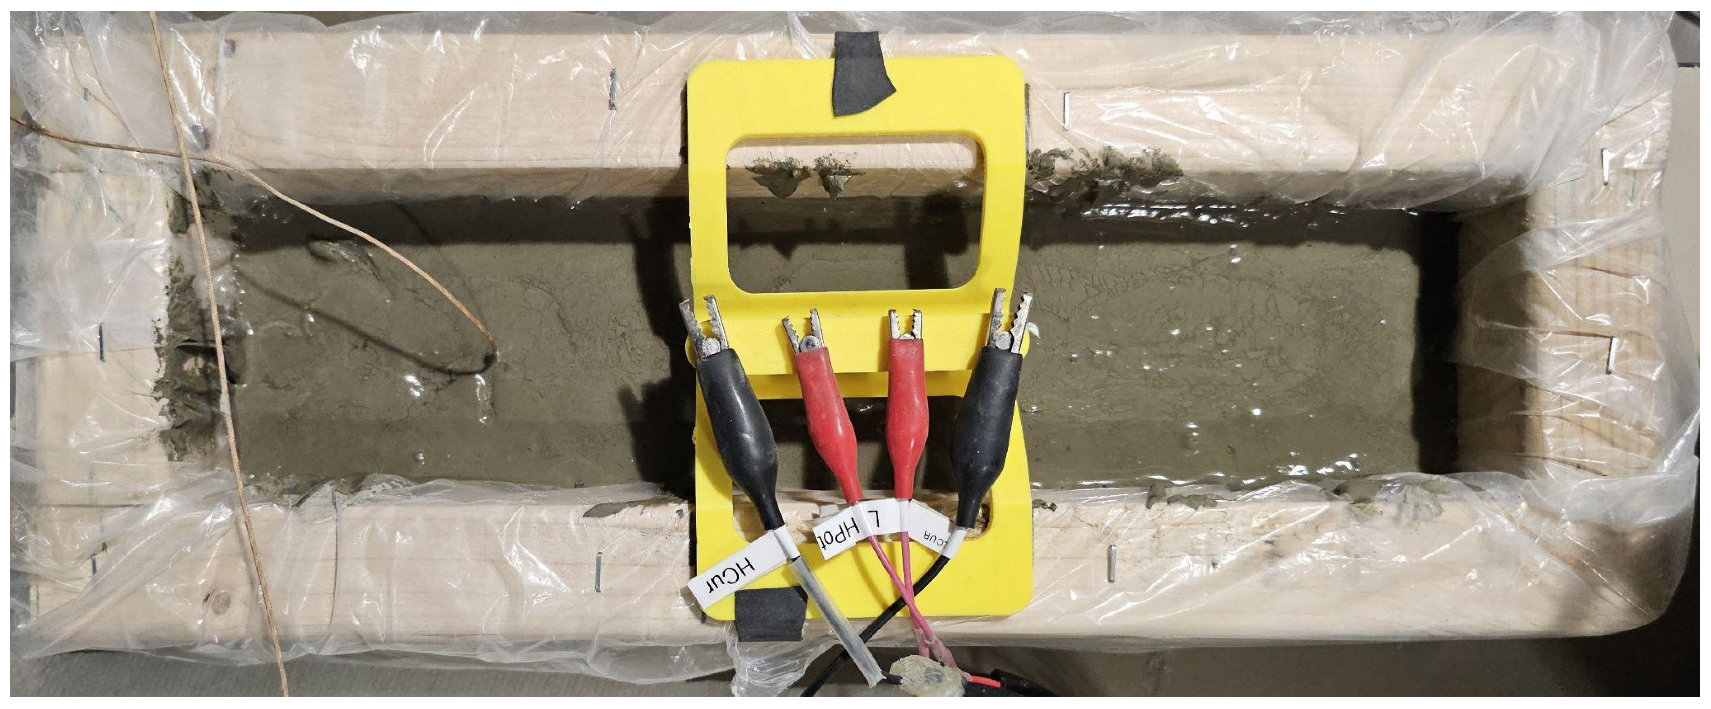
Both probe configurations were tested simultaneously using OPC paste at w/c = 0.50 in a wooden formwork measuring 88.9 mm × 85 mm × 1000 mm (volume ≈ 7.55 L), as shown in Figure 3. Resistance and reactance measurements were recorded at 5-min intervals over 45 min. Individual resistance readings are completed in less than one second. The 45-min monitoring period used here was solely for probe comparison purposes and does not represent an operational requirement for w/c ratio determination. Three replicate trials (n = 3) were conducted for each w/c ratio across all experimental phases, providing sufficient statistical power to detect resistance differences between w/c levels given the low within-group variability observed (CV < 3%) and the large effect sizes anticipated based on the prior literature [11,12]. The geometric cell constant differs between the probe selection formwork (88.9 × 85 × 1000 mm) and the main characterization mold (50.8 × 90 × 360 mm) because the cell constant depends on the electrode spacing relative to the sample’s boundaries. The probe selection experiment was used solely for comparative evaluations of electrode configurations, while all resistance–w/c regression equations were derived from the single 50.8 × 90 × 360 mm mold, ensuring a consistent cell constant across all calibration data.
Figure 3.
Probe selection experimental setup showing the wooden formwork (88.9 mm × 85 mm × 1000 mm) with both probe configurations connected to the LCR meter.
2.2.2. System Validation Using Electrolytic Solutions
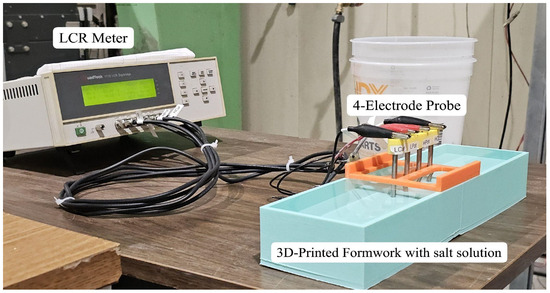
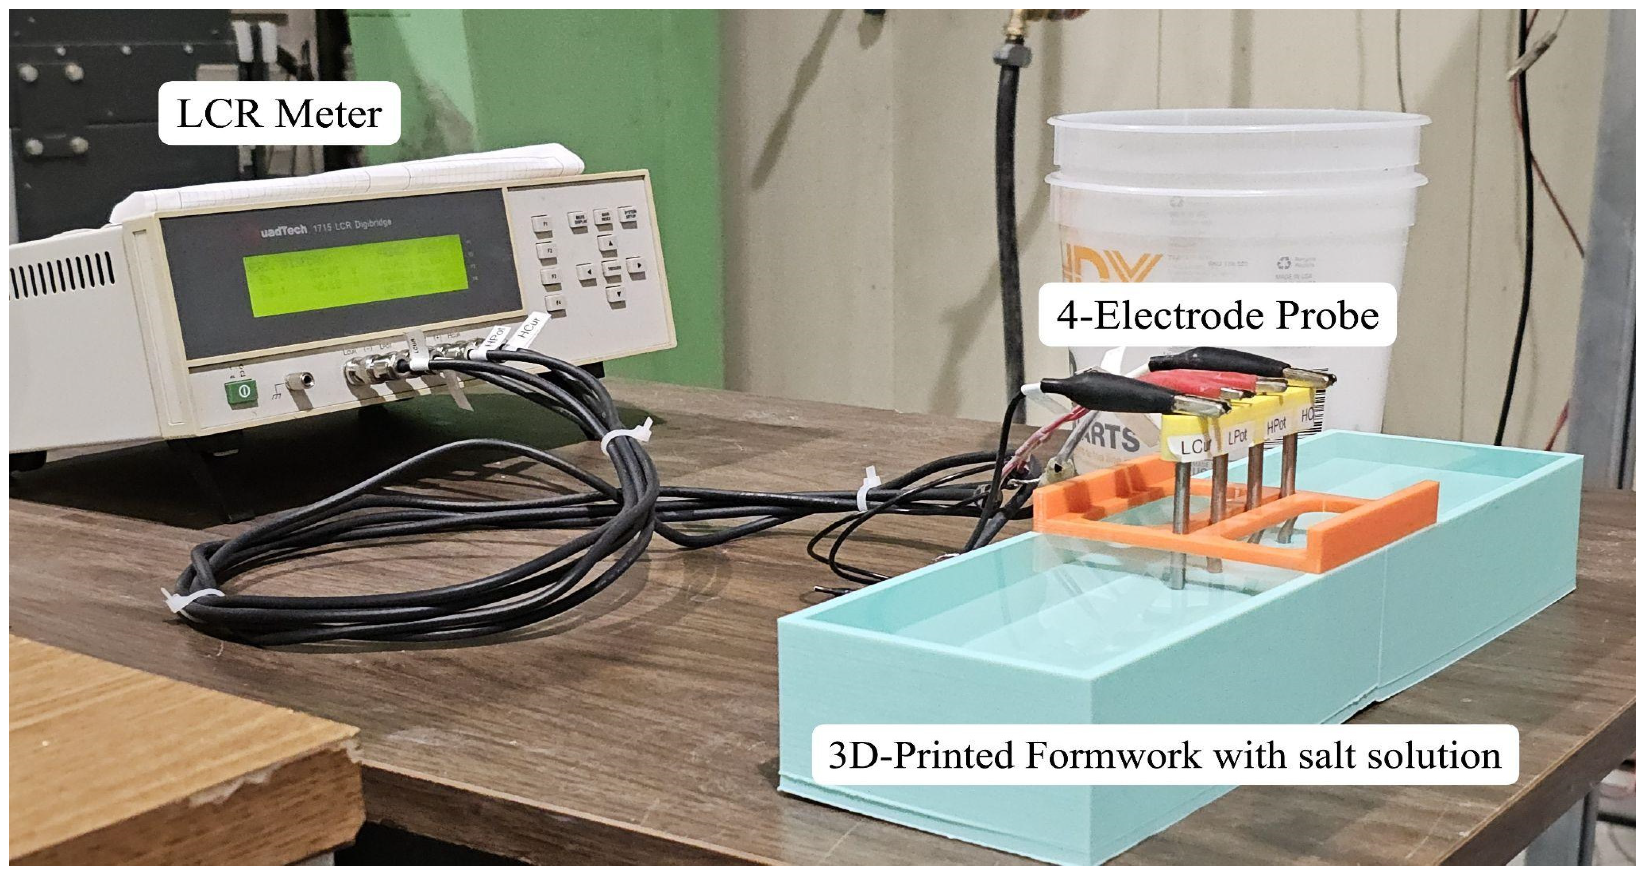
The four-electrode probe was selected for system validation because it inherently minimizes contact-resistance effects. Electrolytic solutions of NaCl (99.9% purity) and KCl (99.8% purity) were prepared by dissolution in deionized water at 20 °C at concentrations calculated to achieve target resistivities of 1, 5, and 10 Ω·m based on established concentration–resistivity relationships [23], as shown in Table 1. Solutions were poured into a 3D-printed formwork with internal dimensions of 50.8 mm × 90 mm × 360 mm (volume: 1.64 L), and the probe was positioned using a 3D-printed recentering bracket that maintained a fixed position throughout all measurements, as shown in Figure 4. Measurements were recorded at 5-min intervals over 30 min while monitoring ambient and solution temperatures. Two replicate trials were conducted per concentration to assess measurement repeatability, thermal stability, and resistance drift.
Table 1.
NaCl and KCl concentrations for target resistivities.
Figure 4.
Saline solution experimental setup showing the 3D-printed formwork (50.8 mm × 90 mm × 360 mm) with the four-electrode probe positioned using the integrated holder and connected to the LCR meter.
2.2.3. Ordinary Portland Cement Paste Characterization
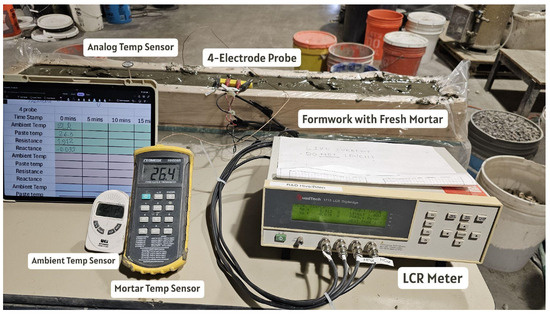
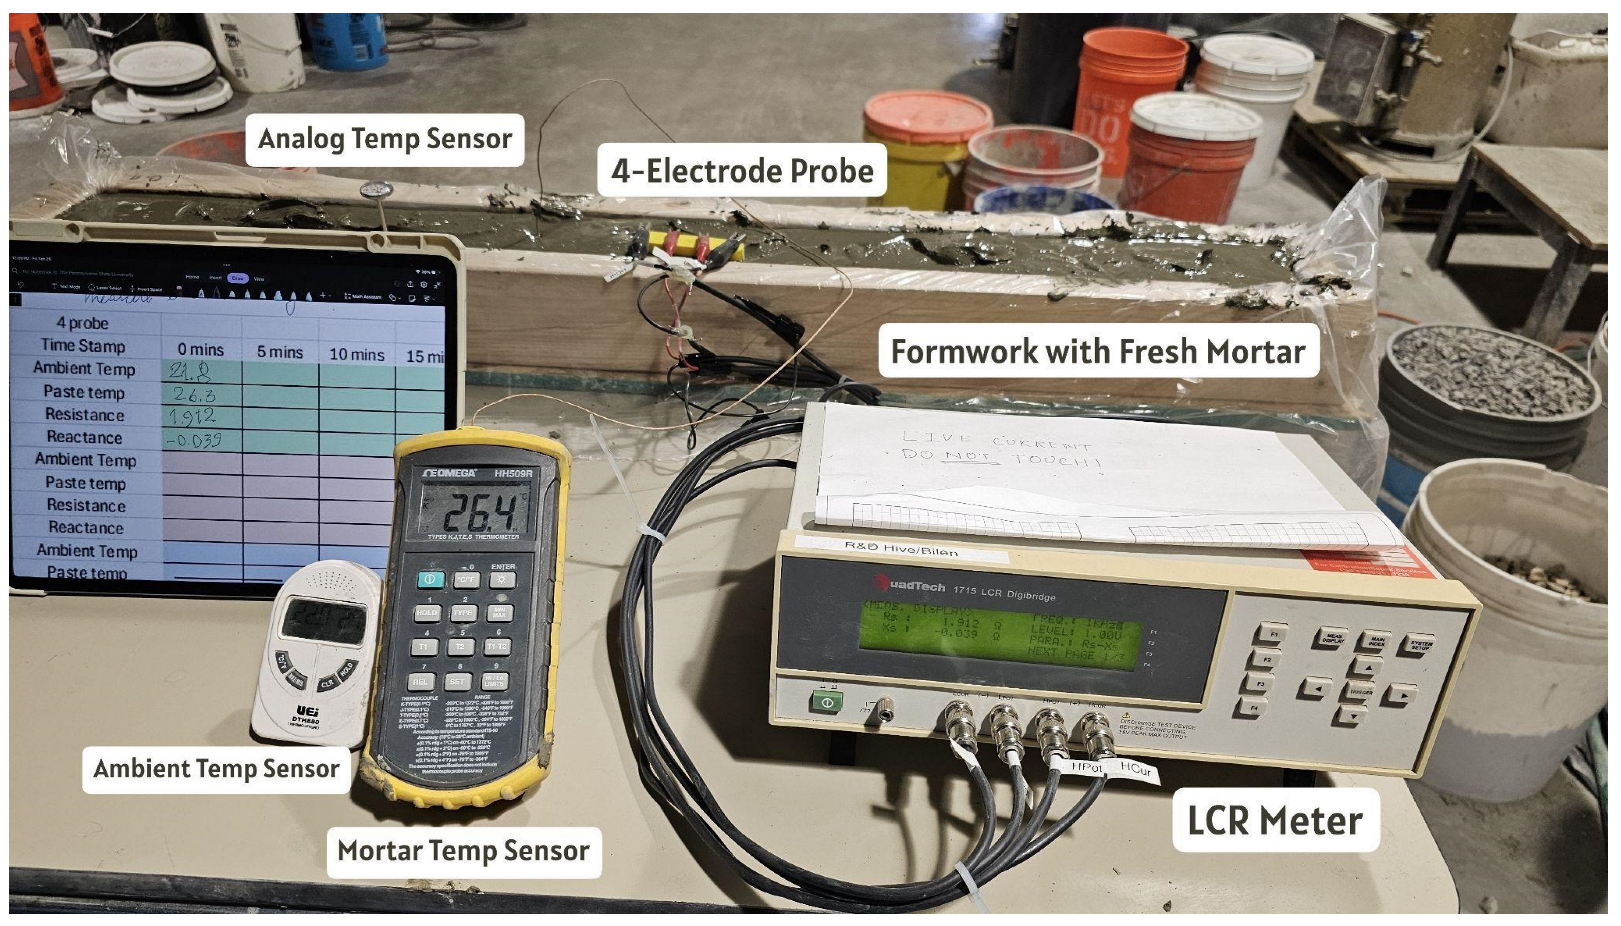
OPC pastes were prepared at five w/c ratios (0.40, 0.45, 0.50, 0.55, and 0.60) in accordance with ASTM C305-20 mixing procedures [21], with mix proportions detailed in Table 2. Each batch was mixed for the prescribed duration and transferred to the compact wooden formwork (50.8 mm × 90 mm × 360 mm) at a marked fill level (1.64 L) within 7–8 min of mixing, as shown in Figure 5. The four-electrode probe was inserted into the fresh paste immediately upon filling. Resistance, reactance, ambient temperature, and paste temperature were recorded at 5-min intervals over 30 min, with all measurements completed before initial setting. After each test, the formwork was cleaned and lined with a fresh plastic liner to prevent contamination. Three replicate trials were conducted for each w/c ratio.
Table 2.
Mixture proportions for the OPC resistance experiment.
Figure 5.
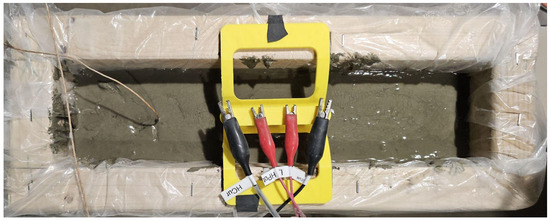
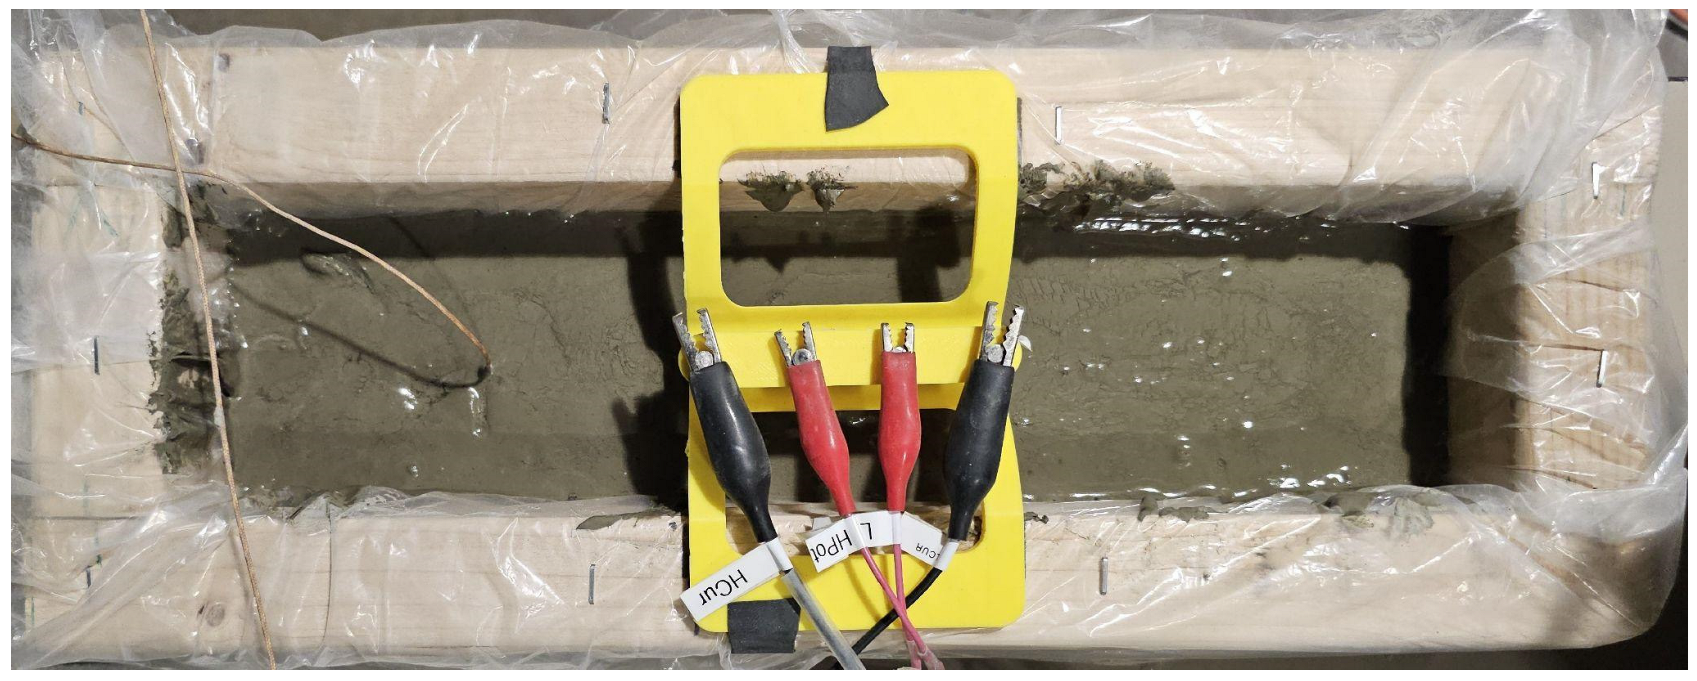
OPC paste experimental setup showing the four-electrode probe inserted into freshly mixed paste within the wooden formwork at the marked fill level (1.64 L).
2.2.4. 3DCP Formulation Validation
A proprietary 3DCP blend designated “X-Hab 3D” was provided by X-Hab 3D. The blend composition comprised OPC, sand, silica fume, and pulverized limestone, as shown in Table 3, with superplasticizers and admixtures optimized for 3DCP, enabling mixing times under 3 min. The X-Hab 3D formulation was tested at w/c ratios of 0.40, 0.45, 0.51, 0.55, 0.60, and 0.65, with 0.51 representing the manufacturer-recommended ratio for optimal printability. The experimental protocol matched that of Section 2.2.3: 1.64-L sample volume, four-electrode probe insertion, and resistance measurements at 5-min intervals over 30 min. Three replicate trials were conducted for each w/c ratio. This phase assessed whether the resistance-based w/c determination established for conventional OPC remained valid for admixture-modified formulations optimized for additive construction.
Table 3.
X-Hab 3D material composition.
3. Results
3.1. Probe Selection: Two-Electrode Versus Four-Electrode Configuration
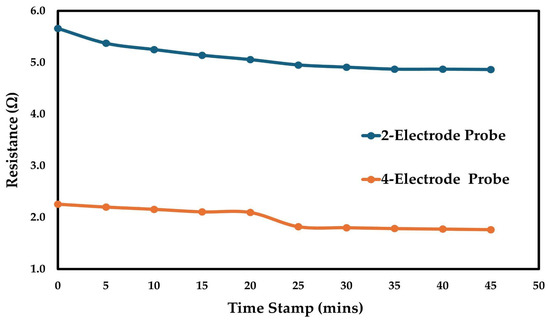
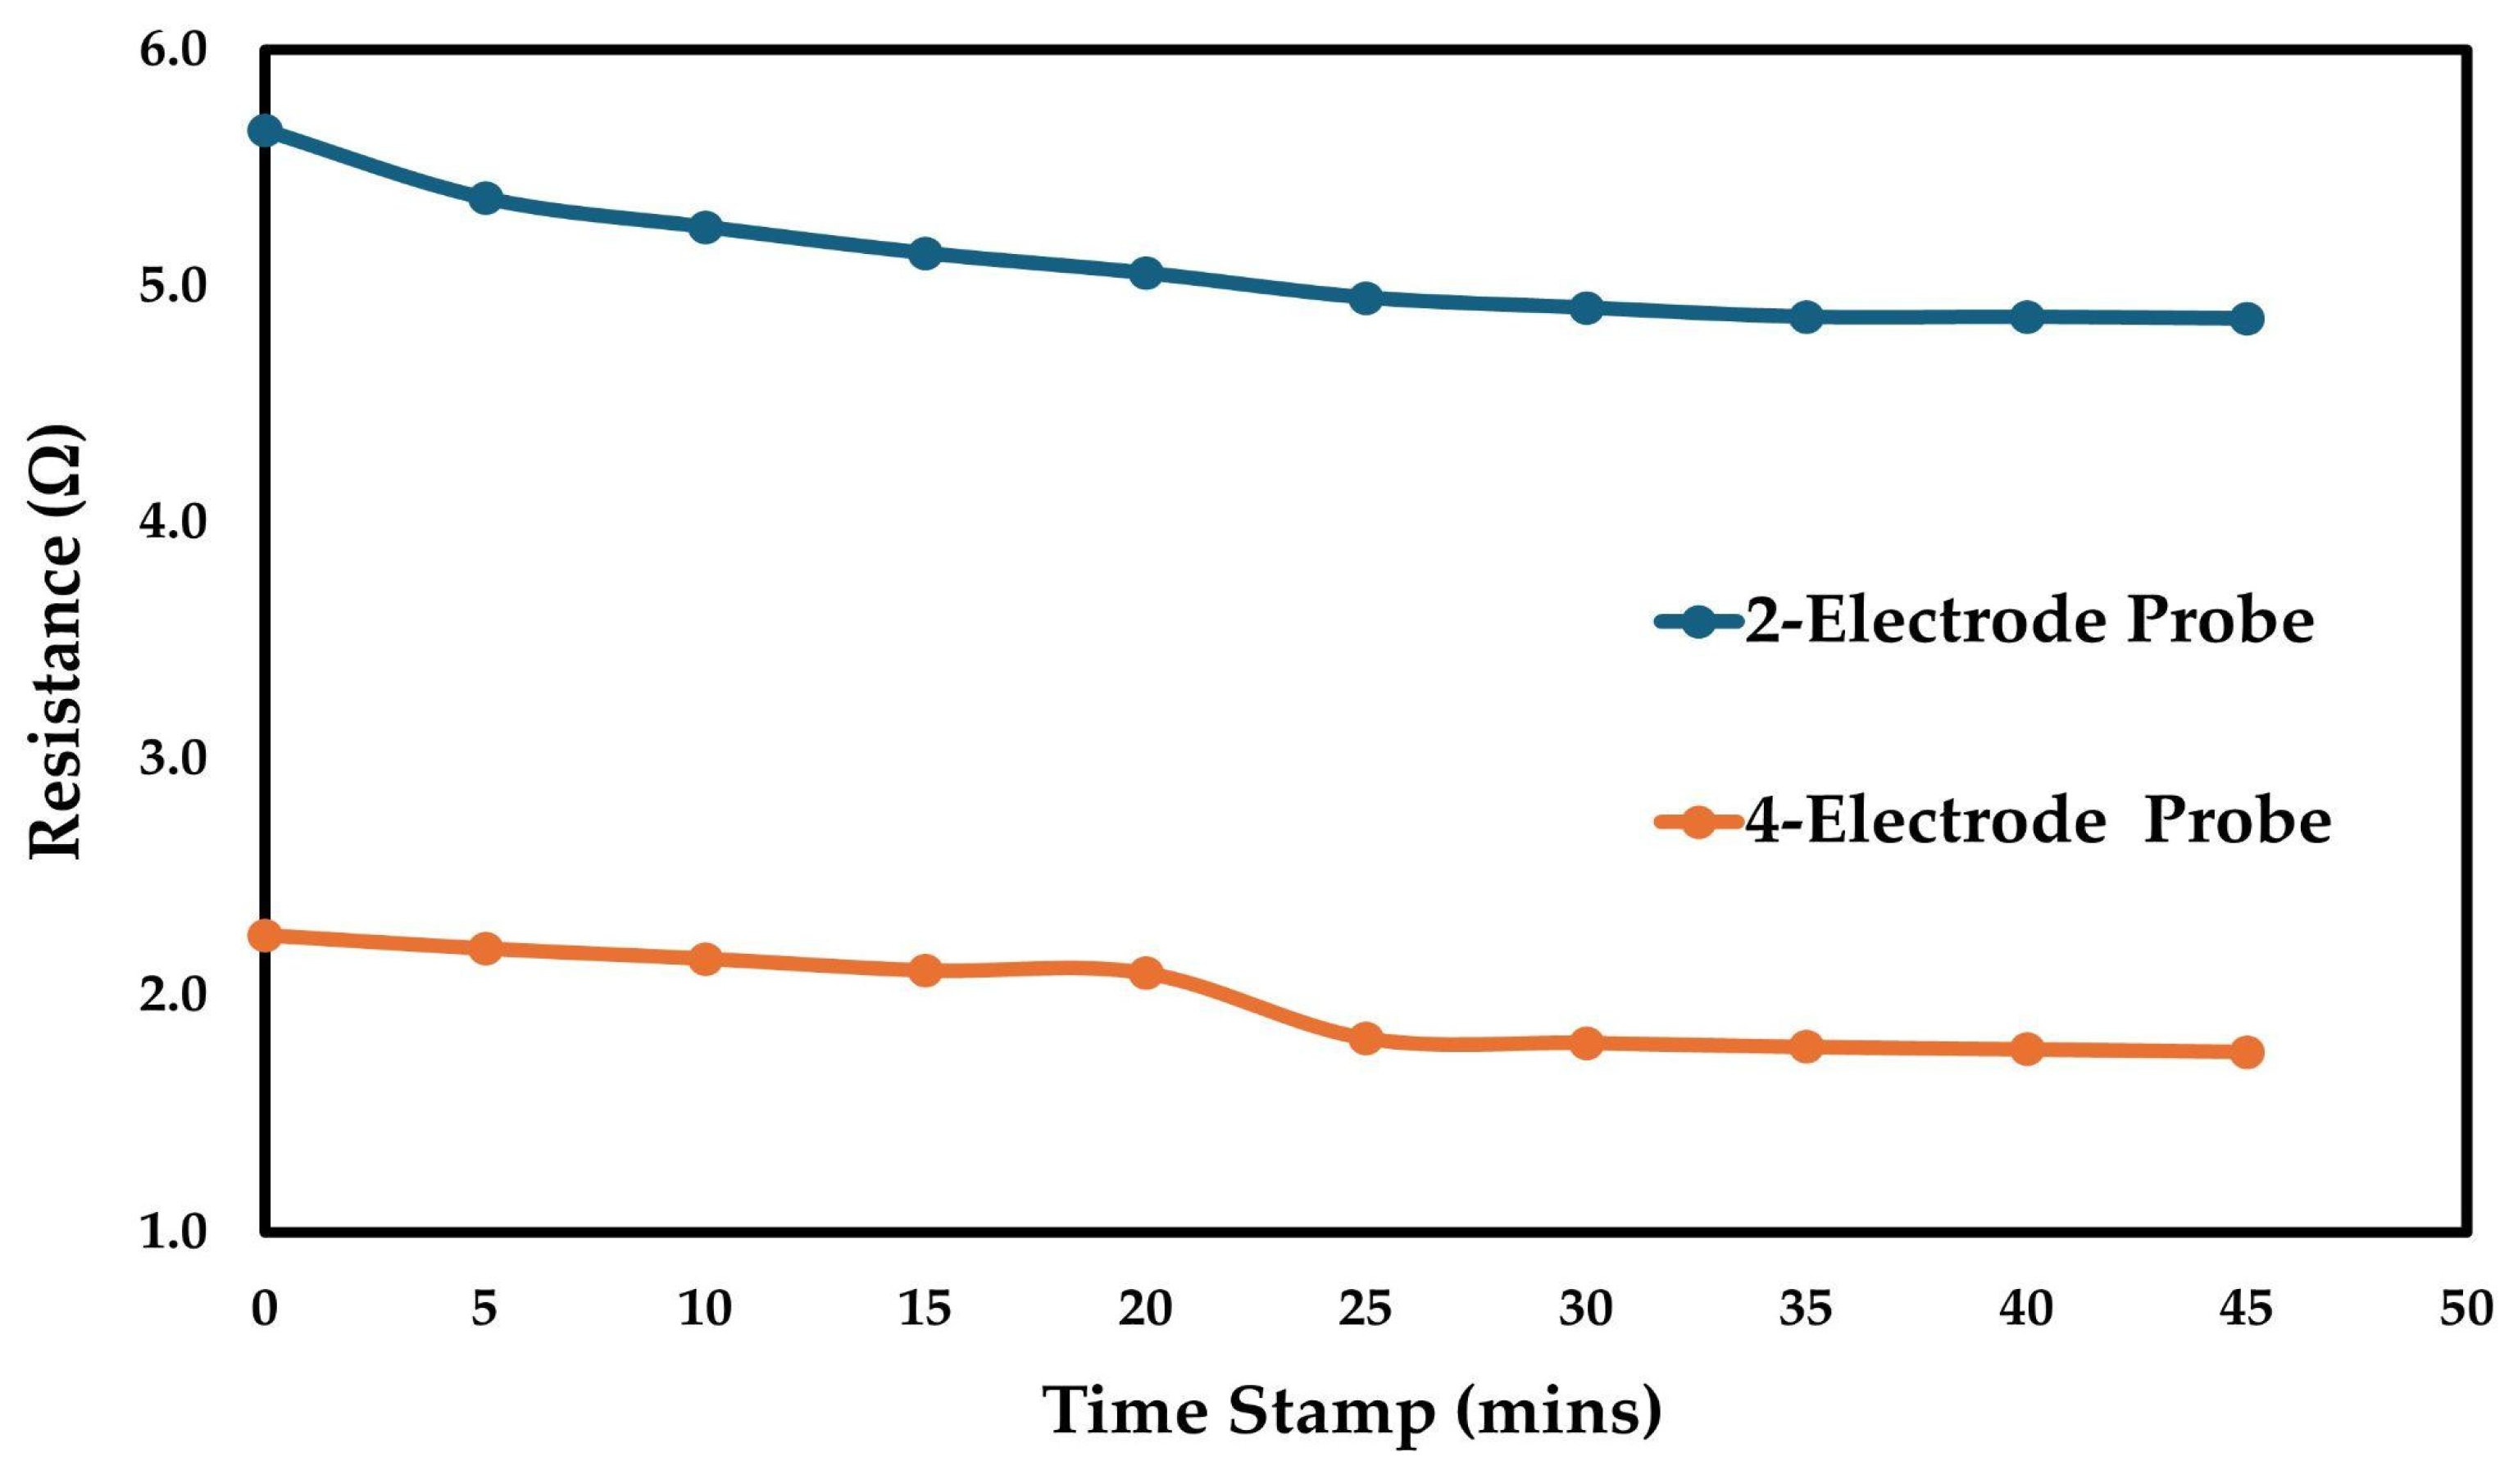
A comparative evaluation of two-electrode and four-electrode probe configurations revealed significant differences in both resistance and reactance measurements over the 45-min measurement period, as shown in Figure 6. The two-electrode probe consistently yielded resistance values approximately twice those of the four-electrode probe throughout the measurement period, recording 5.66 ± 0.80 Ω compared to 2.26 ± 0.50 Ω for the OPC paste at w/c = 0.50, as detailed in Table 4. Both configurations exhibited a declining resistance trend characteristic of early-age cement hydration, but the magnitude of the offset remained constant over time, confirming that the difference is attributable to electrode configuration rather than hydration kinetics.
Figure 6.
Resistance readings measured using the two-electrode and four-electrode probes over 45 min for OPC paste at w/c = 0.50.
Table 4.
Resistance and reactance readings from the two-electrode versus four-electrode probe experiment.
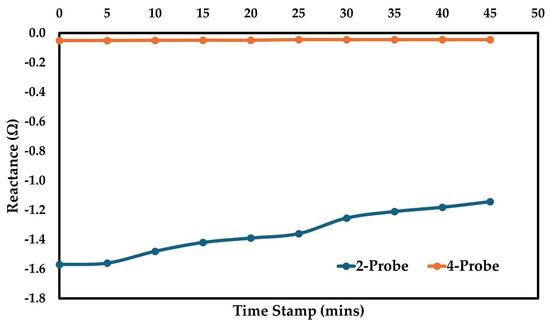
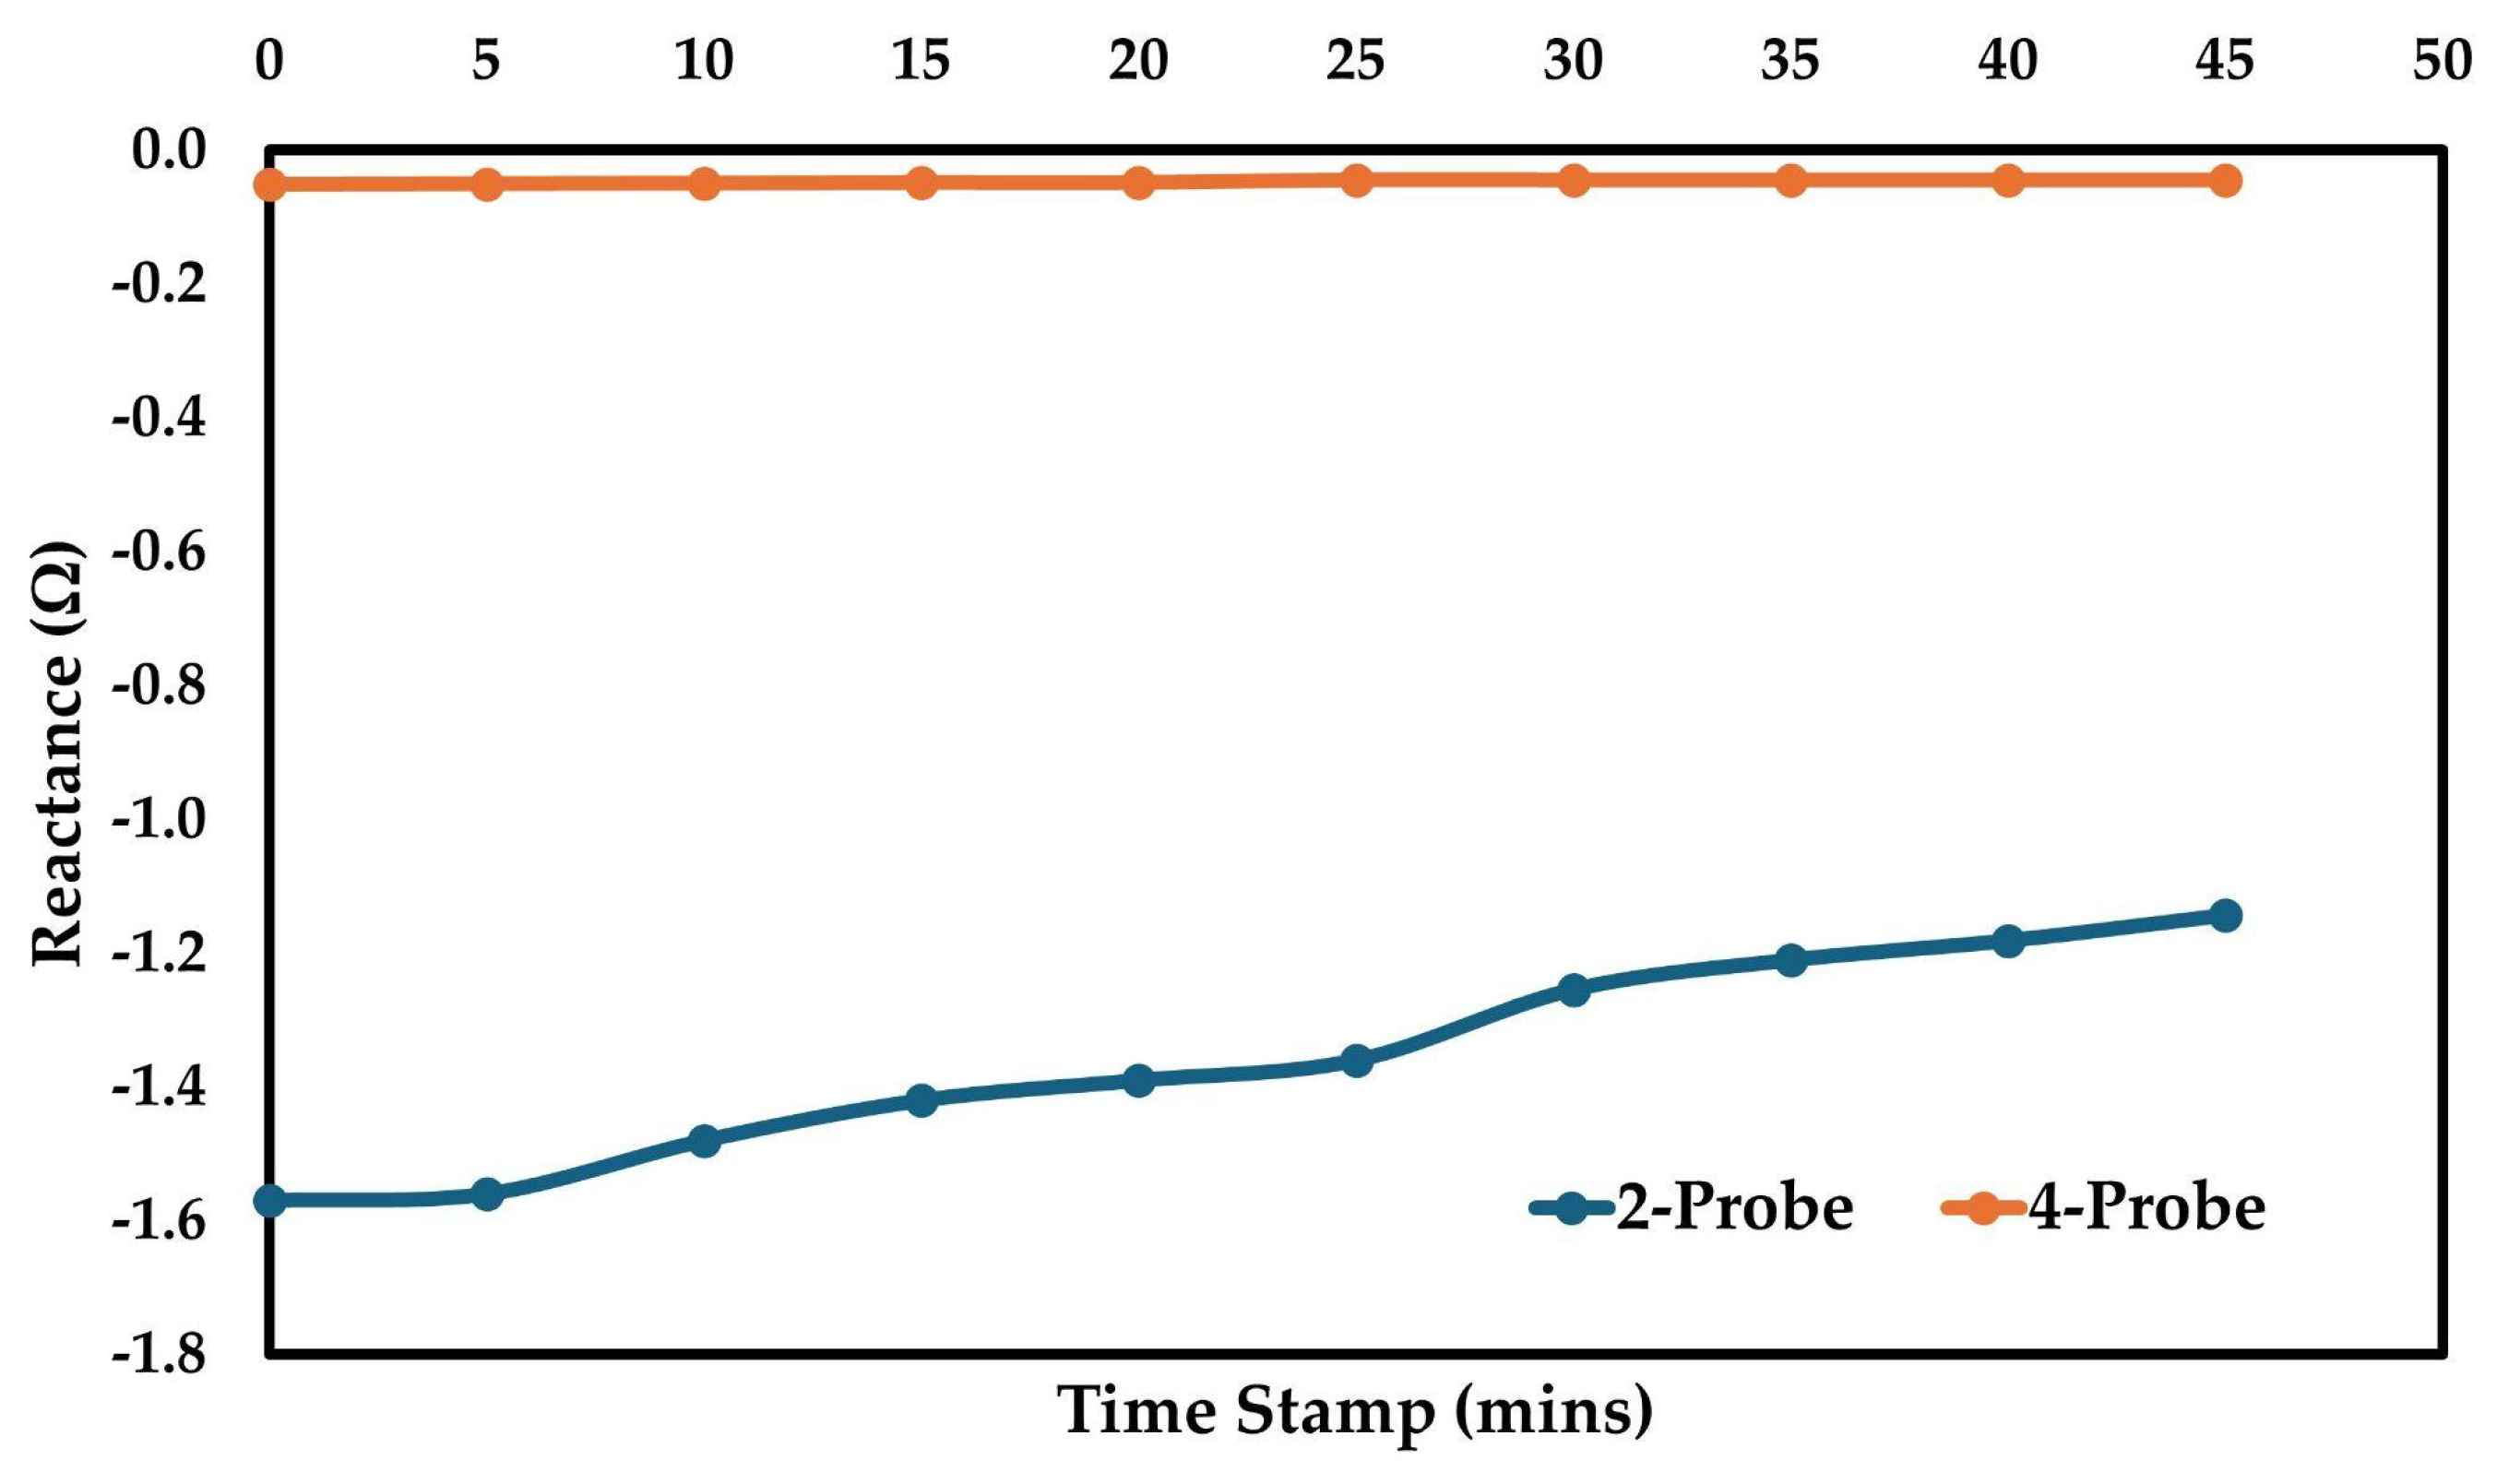
Reactance measurements showed even more pronounced differences between configurations, as shown in Figure 7. The four-electrode probe maintained substantially lower reactance values (−0.050 ± 0.003 Ω) than the two-electrode probe (−1.40 ± 0.20 Ω), as shown in Table 4. Critically, the four-electrode probe kept reactance at least one order of magnitude below the corresponding resistance measurements throughout the entire test duration. The four-electrode configuration reduced reactance from −1.40 ± 0.20 Ω to −0.050 ± 0.003 Ω, representing a 96% decrease and providing direct quantitative evidence that electrode polarization effects were effectively eliminated rather than merely assumed to be negligible. Since reactance in the 1-kHz frequency range is dominated by double-layer capacitance at the electrode–electrolyte interface, the 96% reduction in reactance confirms that the Wenner configuration successfully decouples the voltage-measurement circuit from the polarization impedance of the current-injecting electrodes. The resulting reactance-to-resistance ratio (|Xs|/Rs < 0.025) satisfies the IEEE Standard 142-2007 [24] criterion for negligible reactive interference in resistive measurements.
Figure 7.
Reactance readings measured using the two-electrode and four-electrode probes over 45 min for OPC paste at w/c = 0.50.
3.2. System Validation Using Electrolytic Solutions
3.2.1. KCl Solution Results
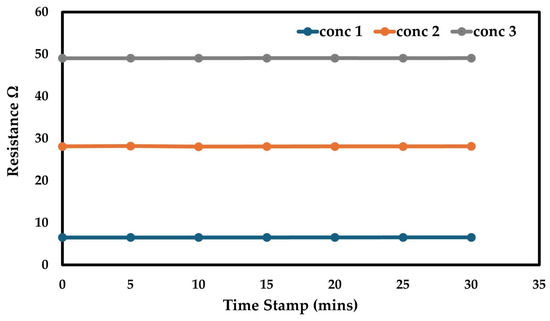
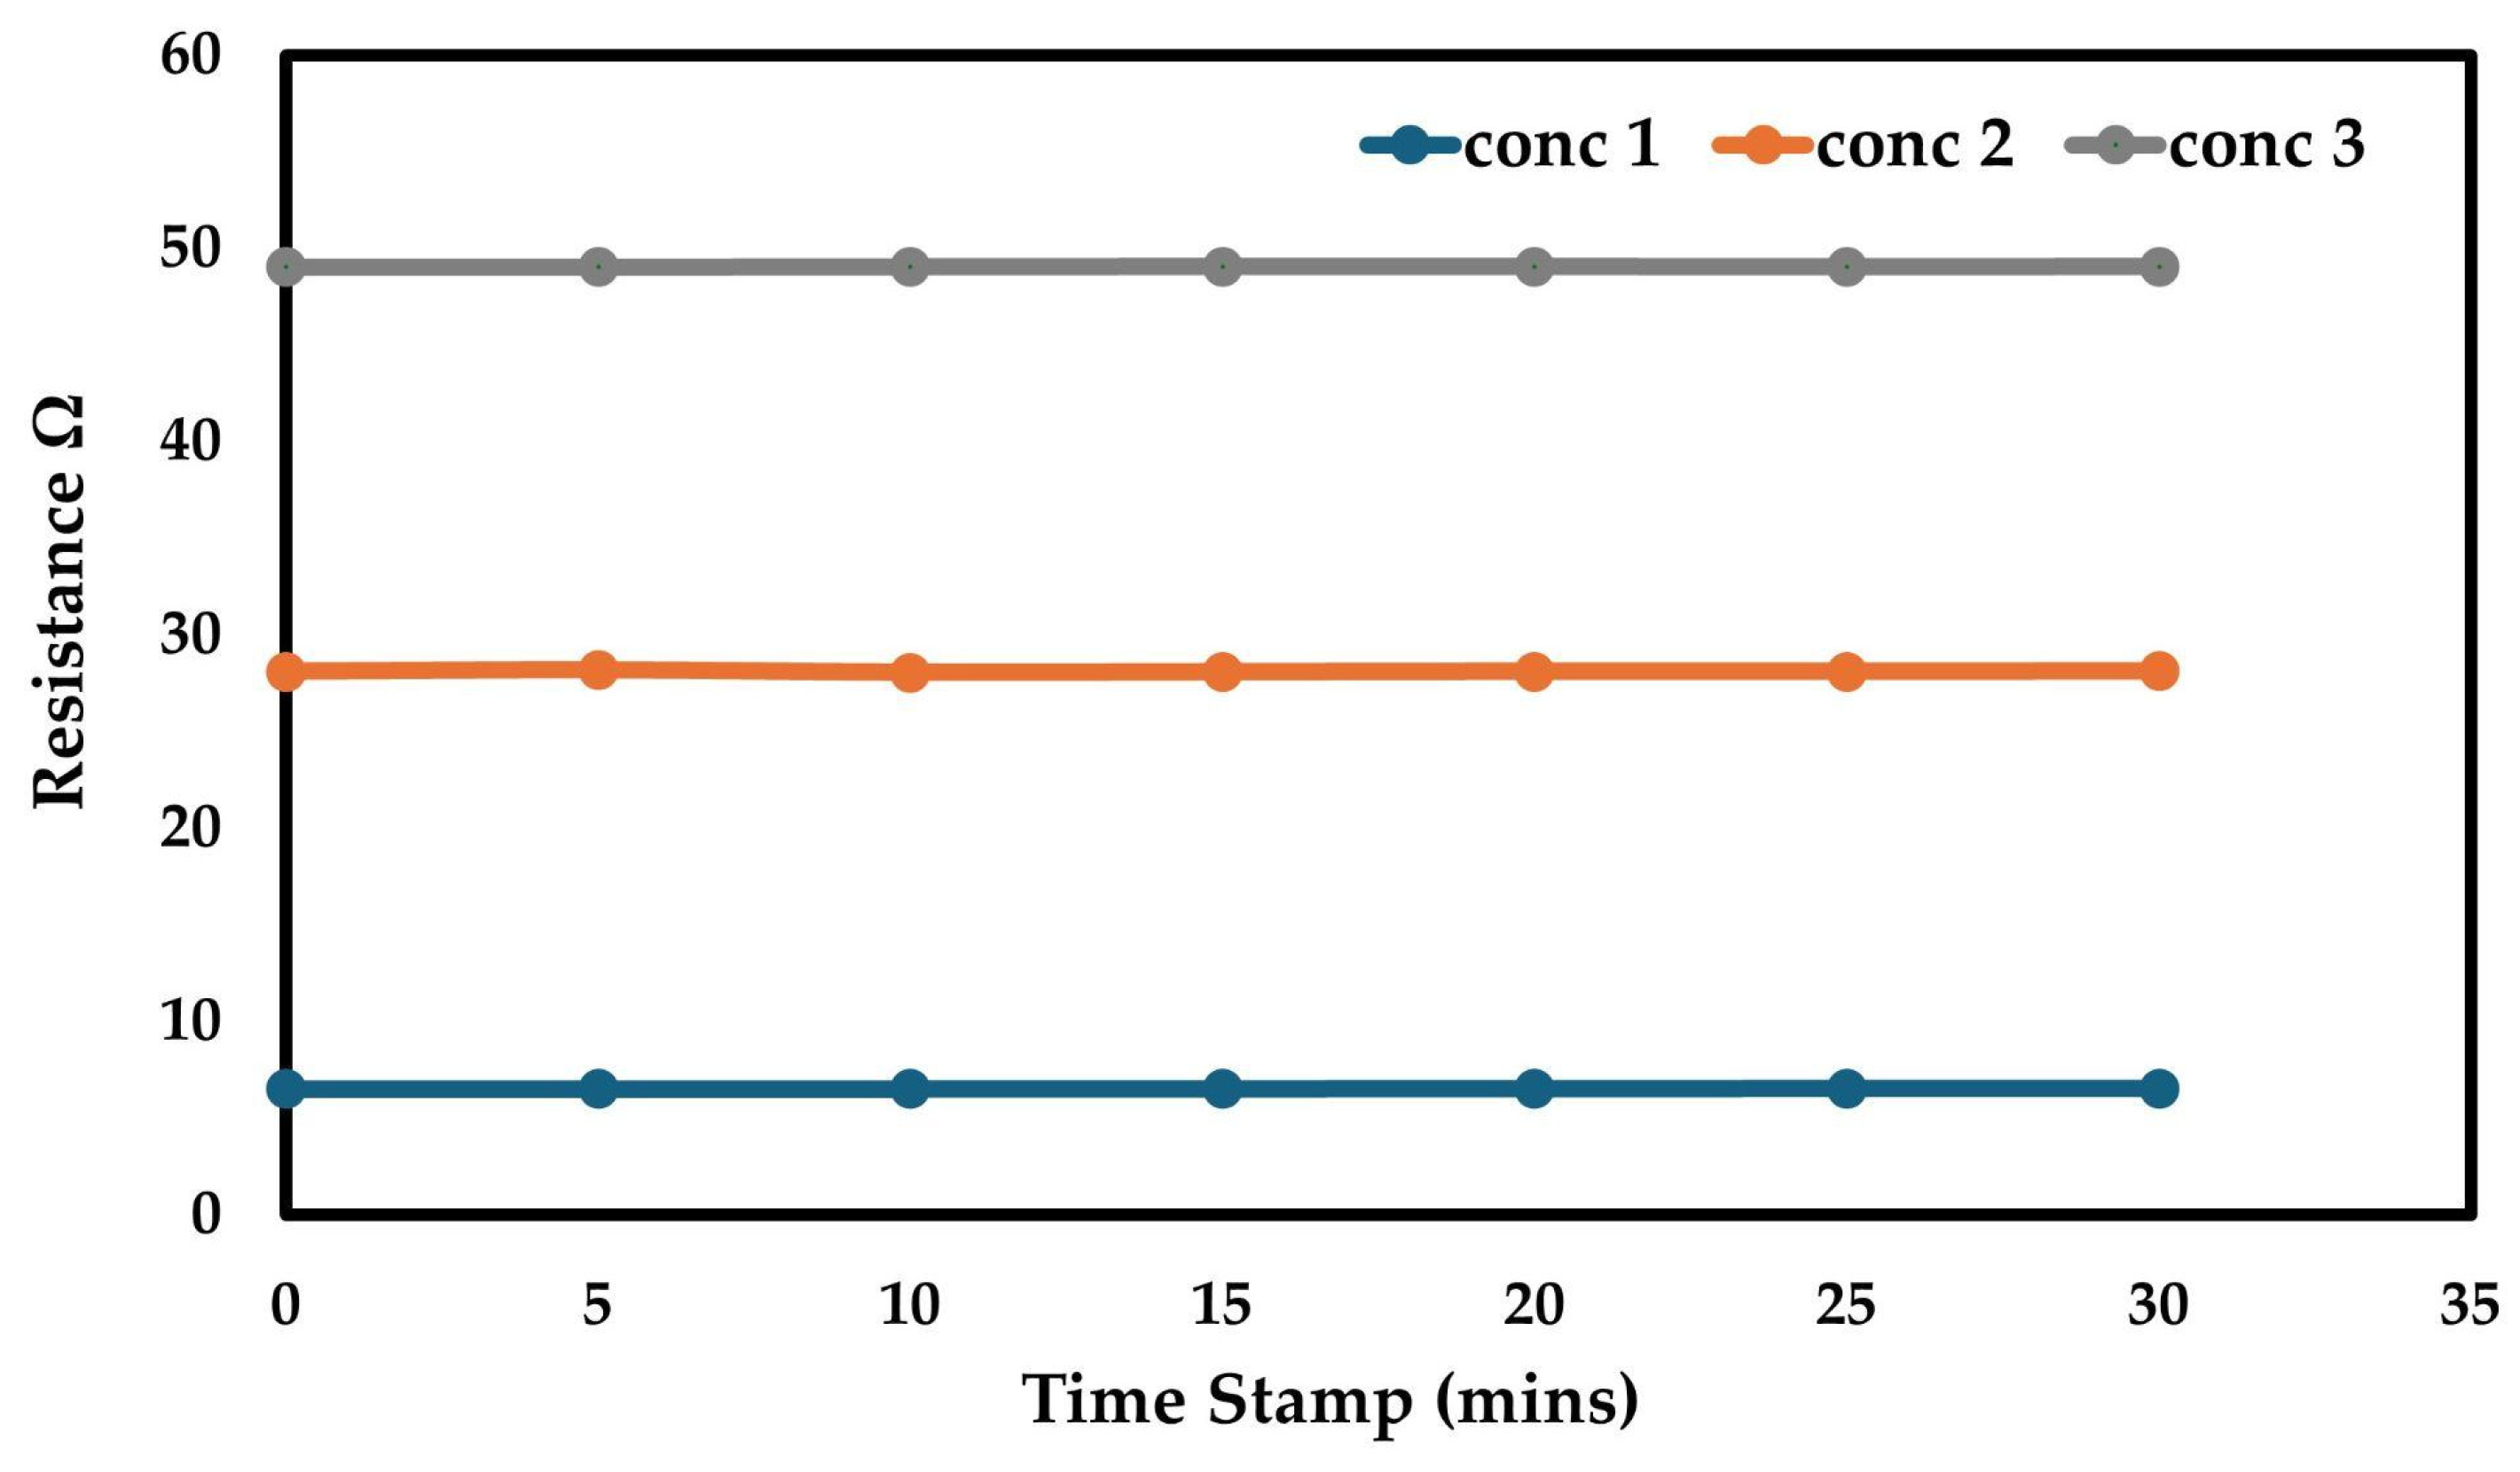
Electrical resistance measurements of standardized KCl solutions demonstrated exceptional stability over the 30-min measurement period, as shown in Figure 8. For the triplicate KCl solutions corresponding to theoretical resistivities of 1, 5, and 10 Ω·m, the measured resistances were 6.53 ± 0.04 Ω, 28.14 ± 0.27 Ω, and 49.05 ± 0.04 Ω, respectively, as detailed in Table 5. Maximum resistance drift across all concentrations did not exceed 1.13%, with minimum drift as low as 0.02%. Sample temperatures were approximately 1.0 °C below ambient, with thermal equilibration occurring within the first 5 min of testing.
Figure 8.
Resistance-versus-time graph for KCl solutions at three target resistivities (1, 5, and 10 Ω·m).
Table 5.
Readings from the three iterations of KCl experiments.
3.2.2. NaCl Solution Results
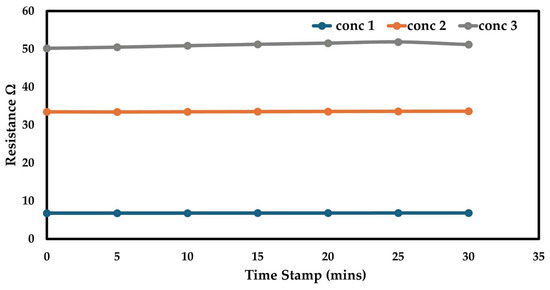
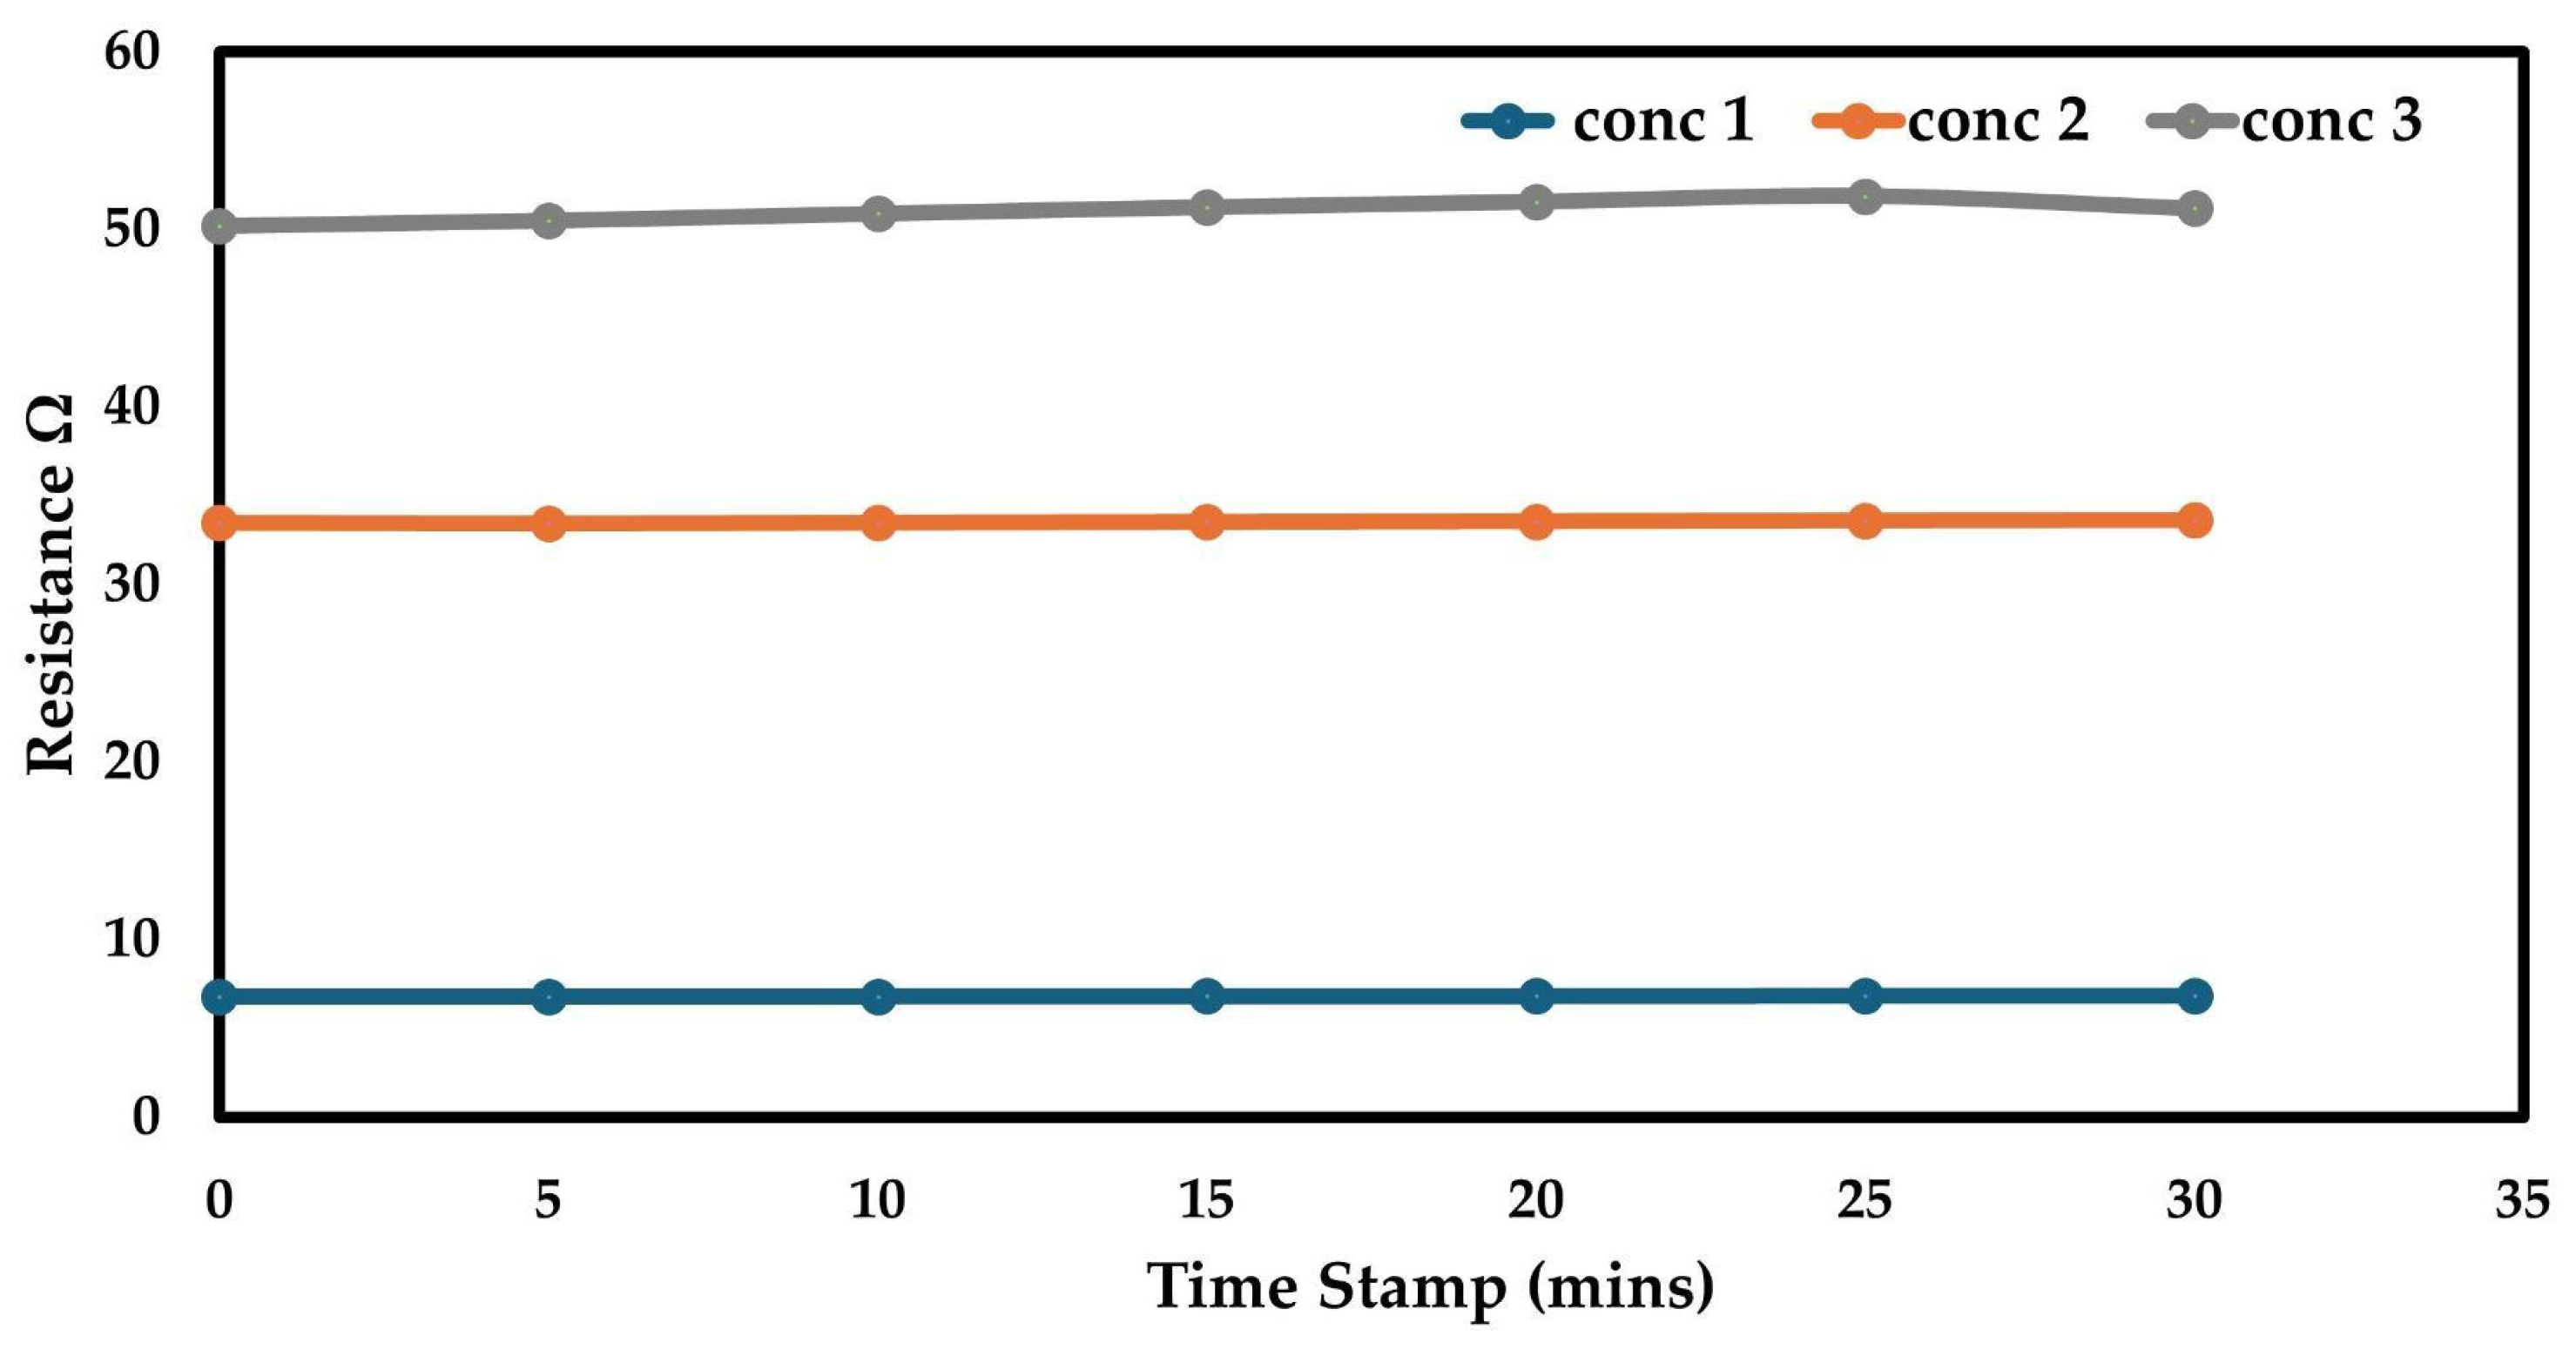
Similar stability was observed in the NaCl solution experiments, as shown in Figure 9. Measured resistances were 6.81 ± 0.05 Ω, 33.52 ± 0.07 Ω, and 50.54 ± 0.34 Ω across the three resistivity levels tested, as detailed in Table 6. Resistance variations remained below 1.2% for all electrolyte concentrations. The inverse relationship between ionic concentration and electrical resistance was empirically confirmed across both electrolyte systems, with higher salt concentrations yielding proportionally lower resistance values, consistent with theoretical predictions.
Figure 9.
Resistance-versus-time graph for NaCl solutions at three target resistivities (1, 5, and 10 Ω·m).
Table 6.
Readings from the three iterations of NaCl experiments.
3.3. Ordinary Portland Cement Paste Characterization
3.3.1. Temporal Resistance Evolution
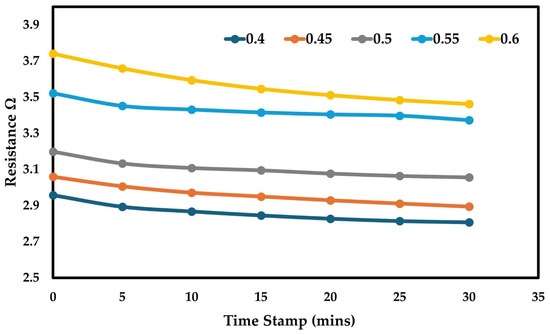
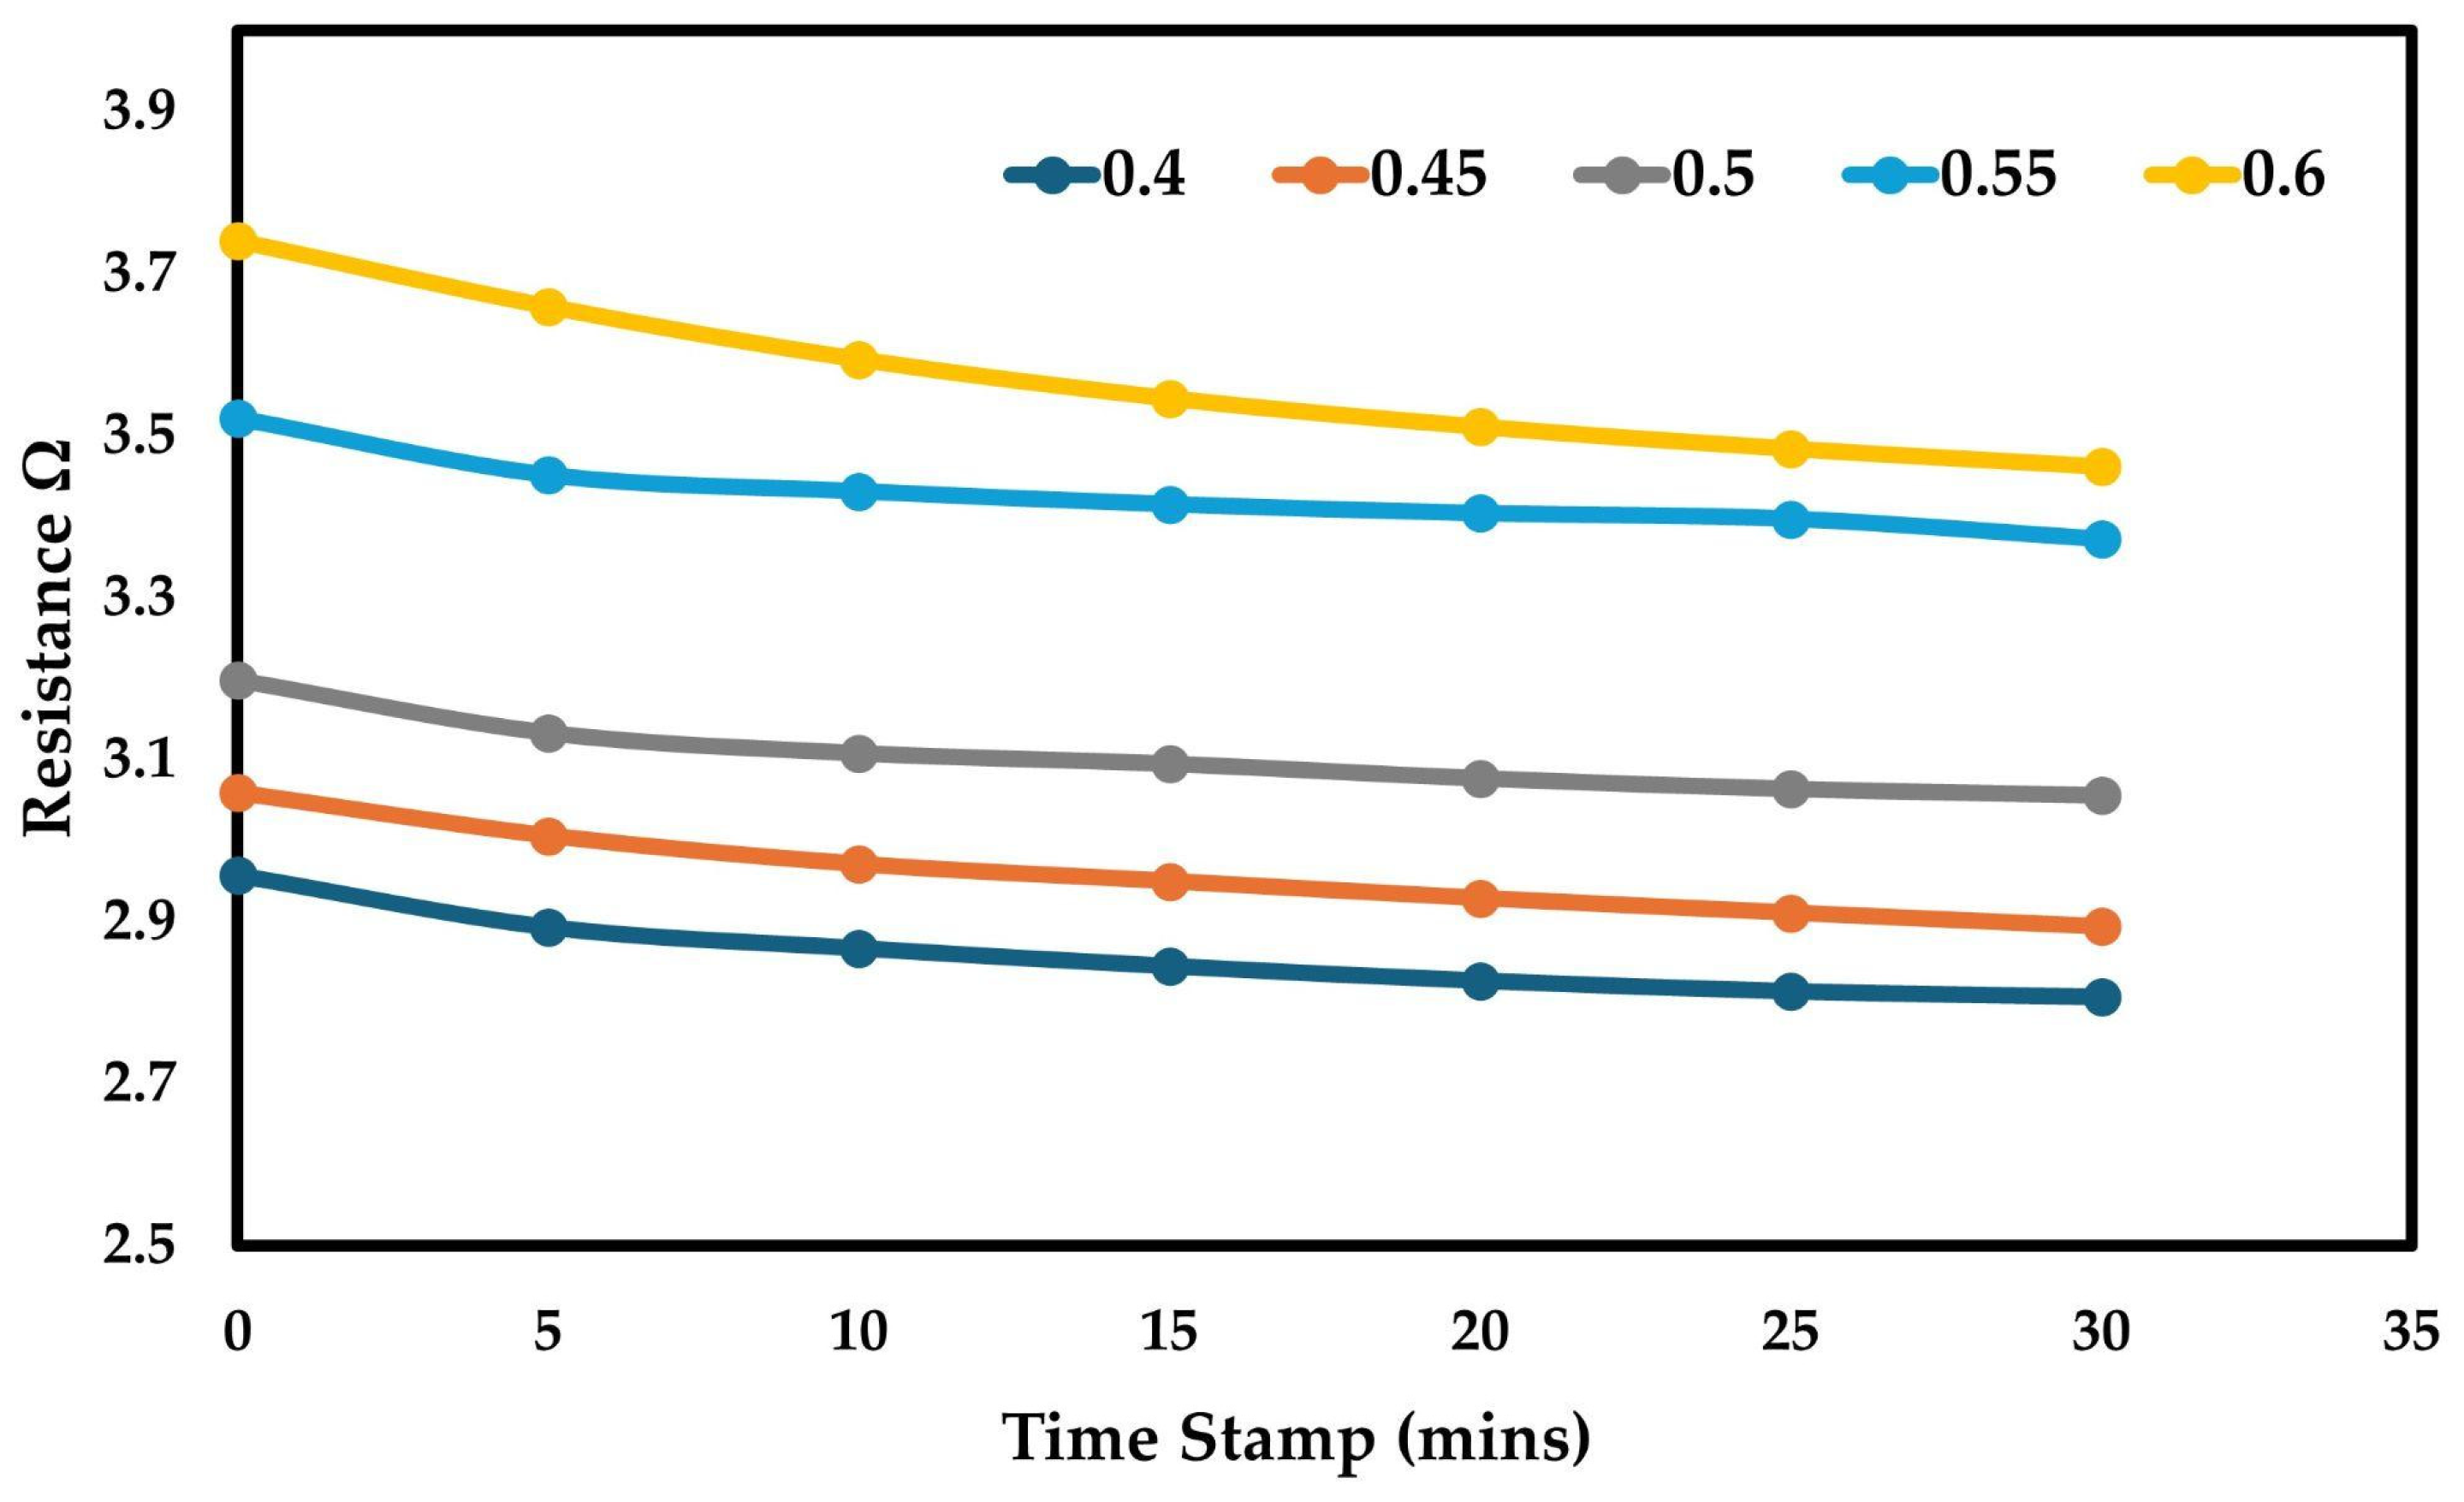
The temporal evolution of electrical resistance in OPC pastes at five w/c ratios (0.40, 0.45, 0.50, 0.55, and 0.60) exhibited consistent declining trends across all tested ratios over the 30-min measurement period, as shown in Figure 10. Resistance decreased by 5.1–10.1% depending on mixture composition, with each w/c ratio producing a distinct resistance profile and clear separation maintained throughout the measurement duration. The monotonic decline in resistance is consistent with progressive alkali dissolution and a rising OH− concentration during early-age hydration, which increases ionic strength and develops additional conductive pathways.
Figure 10.
Electrical resistance of OPC paste as a function of time for w/c ratios of 0.40–0.60.
3.3.2. Resistance–w/c Ratio Correlation
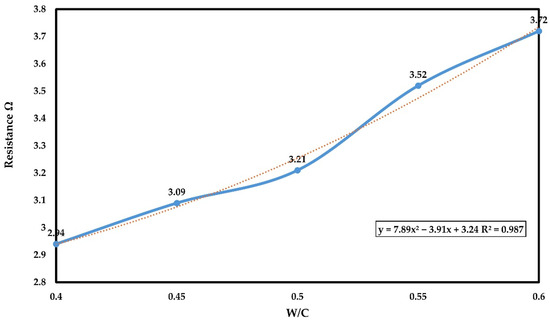
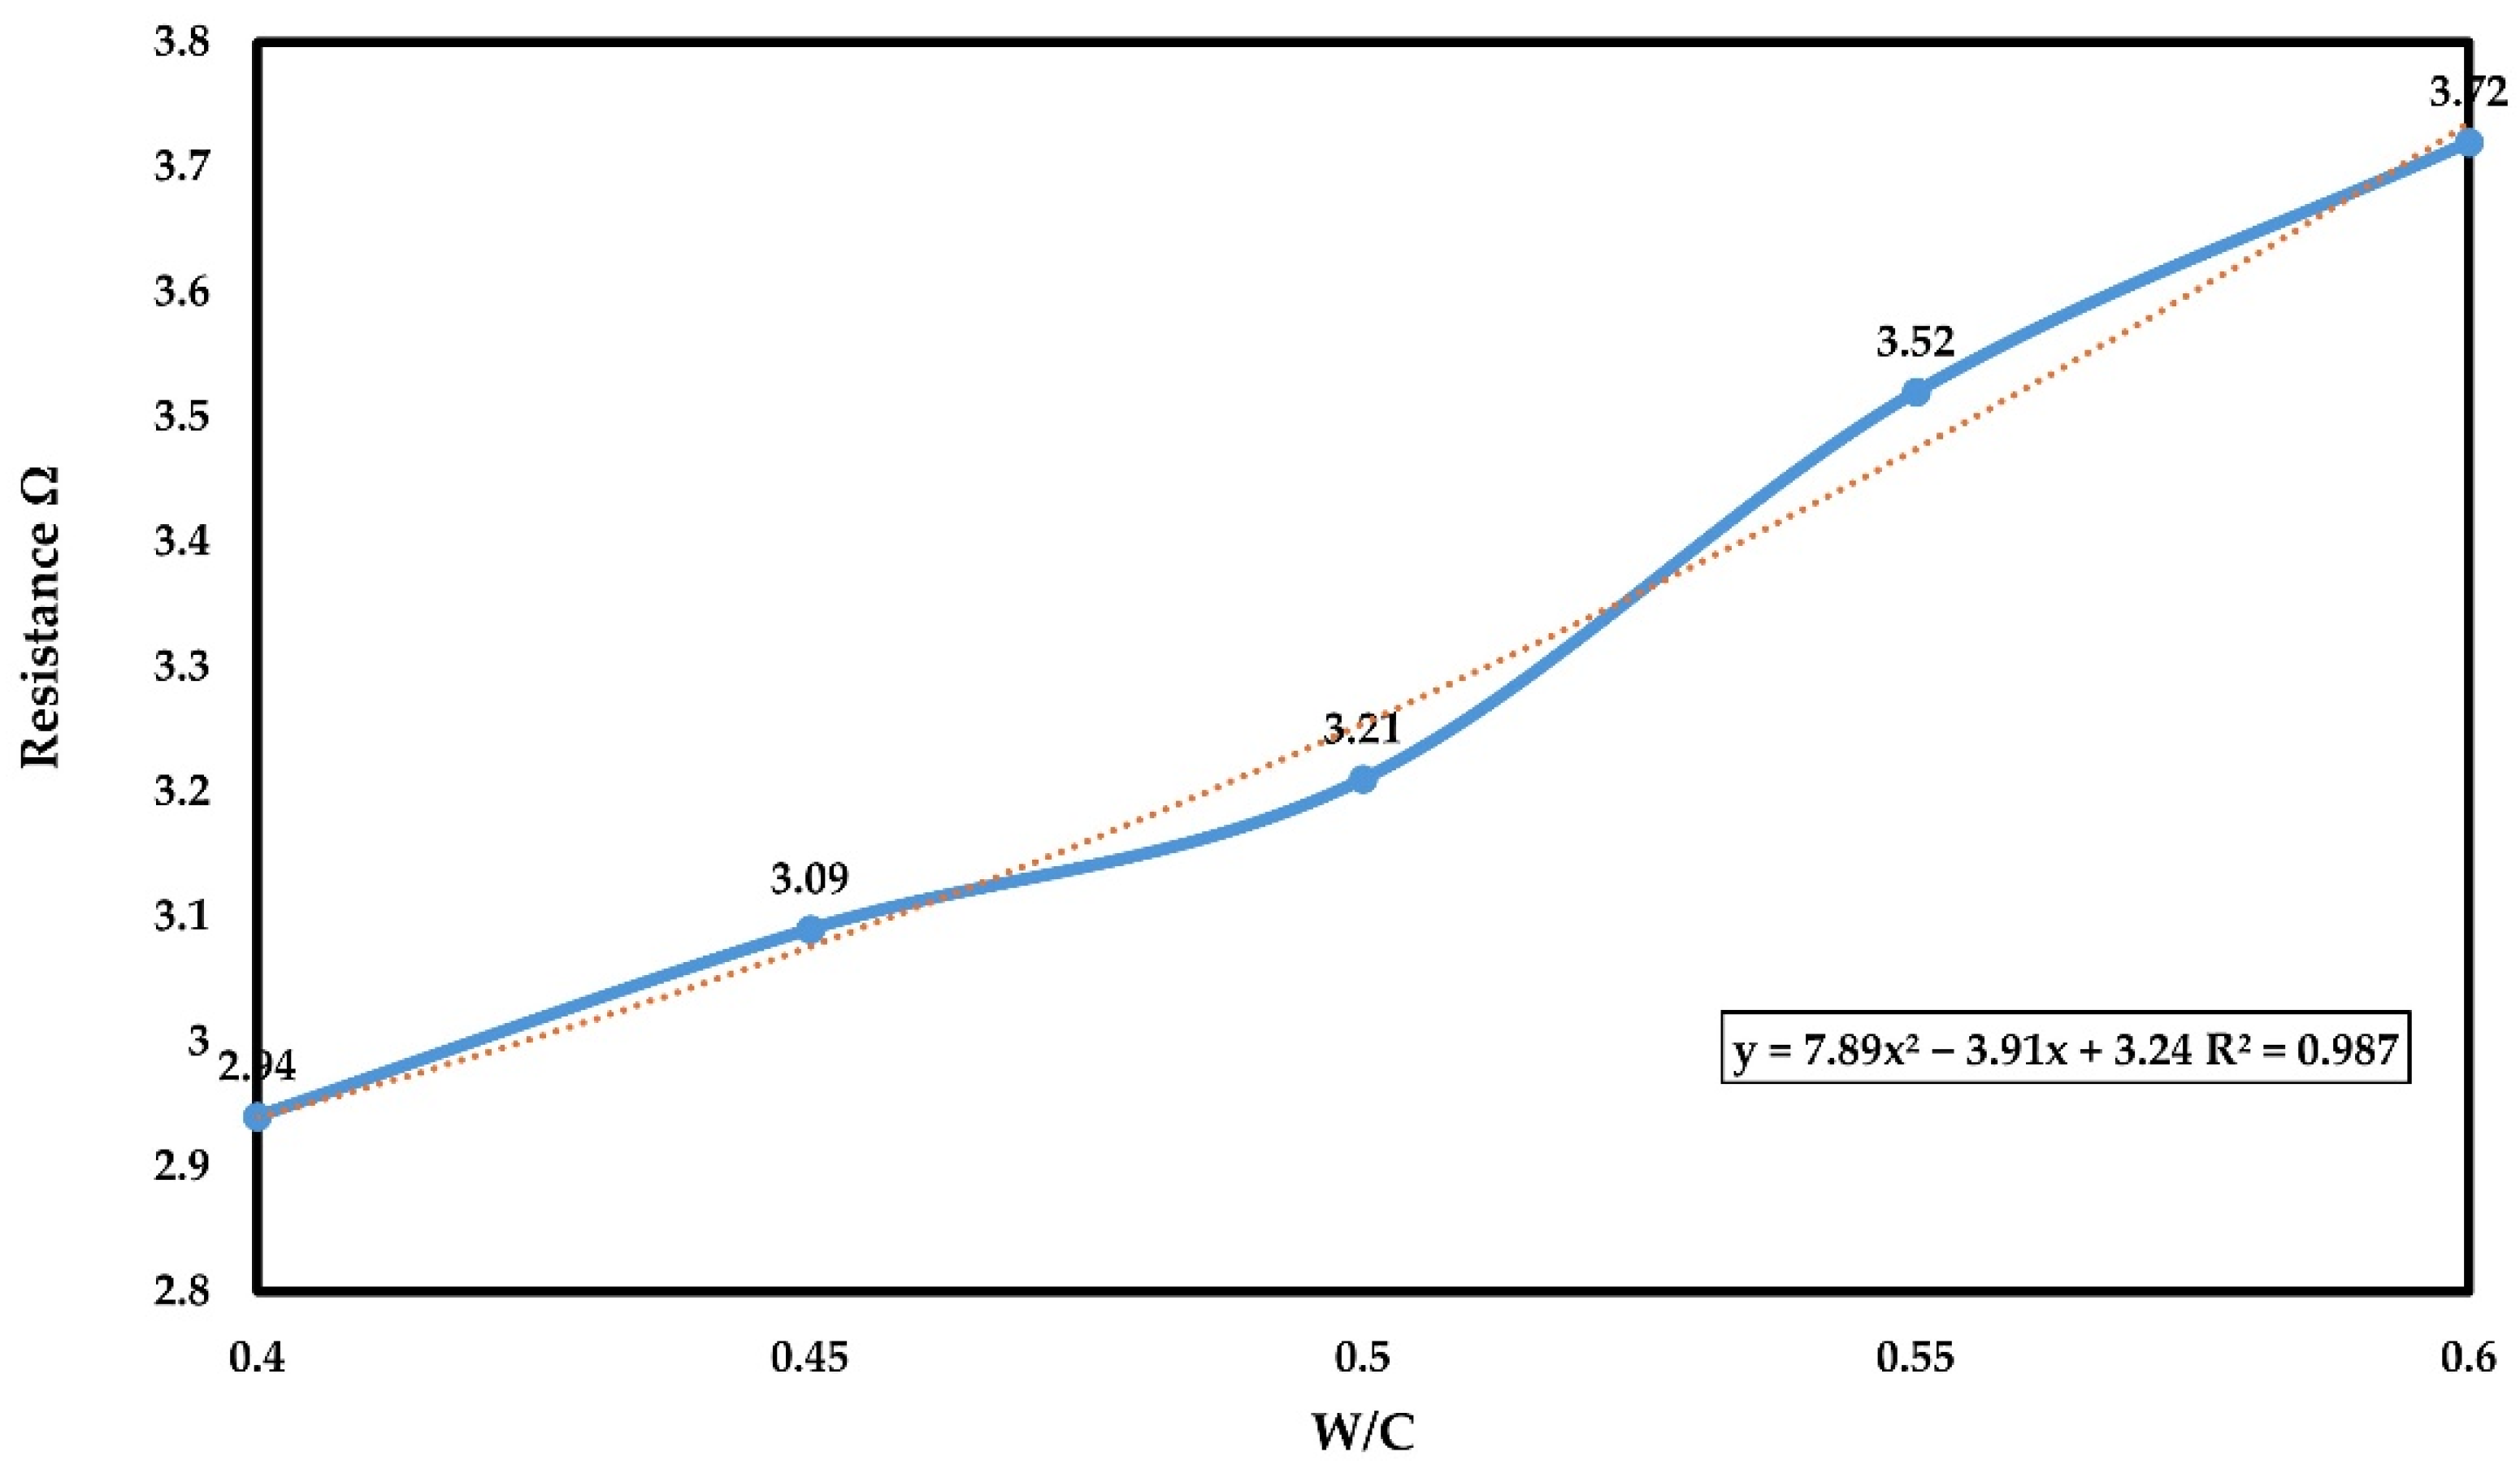
The electrical resistance demonstrated a strong nonlinear correlation with w/c ratio, following a second-order polynomial relationship, as shown in Figure 11:
where R is electrical resistance in Ω. Resistance values increased steadily with increasing w/c ratios, from 2.94 ± 0.03 Ω at w/c = 0.40 to 3.72 ± 0.02 Ω at w/c = 0.60, as detailed in Table 7. R2 = 0.987 indicates a strong model fit; this metric should be interpreted with caution given the limited number of tested w/c levels (n = 5). The supporting error metrics are RMSE = 0.037 Ω and MAE = 0.033 Ω, confirming that the high R2 reflects genuine predictive accuracy rather than overfitting, as both values represent less than 5% of the total measurement range. The physical monotonicity of the resistance–w/c relationship, grounded in ionic dilution theory [12,13], further supports the validity of the model. This positive correlation between resistance and w/c ratio reflects the dilution of ionic species in larger water volumes at higher w/c ratios, in contrast to the inverse relationship typically observed in hardened concrete systems, where increased porosity governs conductivity. Measurement repeatability was highly consistent across all mixture proportions, with coefficients of variation ranging from 0.34% (w/c = 0.50) to 1.01% (w/c = 0.45) and standard deviations below 0.03 Ω for every formulation tested.
R = 7.89(w/c)2 − 3.91(w/c) + 3.24 (R2 = 0.987, RMSE = 0.037 Ω, MAE = 0.033 Ω)
Figure 11.
Relationship between electrical resistance and w/c ratio for fresh OPC paste, showing the second-order polynomial fit.
Table 7.
Mean resistance, standard deviation, and coefficient of variation for OPC pastes at each w/c ratio.
The model demonstrated strong predictive accuracy with a root–mean–square error (RMSE) of 0.037 Ω and a mean absolute error (MAE) of 0.033 Ω, confirming that deviations between measured and predicted resistance values are well within the practical tolerance range for quality control applications across the full measurement range of 2.94–3.72 Ω. The 95% confidence intervals for mean resistance at each w/c level are reported in Table 7, ranging from ±0.063 Ω at w/c = 0.40 to ±0.052 Ω at w/c = 0.60, confirming tight within-group clustering across all tested ratios. The 95% prediction bands for individual measurements span approximately ±0.11 Ω across the full w/c range, indicating that the model can reliably predict resistance values for new measurements within this margin. Residual analysis confirmed no systematic bias across w/c levels overall, with residuals distributed around zero in the range of −0.059 to +0.065 Ω. A minor localized overprediction was observed at w/c = 0.50, where all three replicates yielded negative residuals (−0.059 to −0.037 Ω), consistent with normal fitting behavior in second-order polynomial models rather than systematic model misspecification. The random distribution of residuals across all other w/c levels confirms that the second-order polynomial adequately captures the nonlinear resistance–w/c relationship without underfitting or overfitting. One-way ANOVA confirmed statistically significant differences in mean resistance between all w/c levels (F = 634.07, p < 0.001), demonstrating that the system can reliably discriminate between w/c ratios differing by as little as 0.05 across the full tested range. The large F statistic reflects the combination of tight within-group repeatability (CV ≤ 1.01%) and clearly separated group means spanning 0.778 Ω across the five tested w/c levels. Coefficients of variation ranged from 0.34% at w/c = 0.50 to 1.01% at w/c = 0.45, with no systematic trend across the five tested w/c levels. The absence of a CV trend confirms that measurement reliability is independent of water content for OPC paste across the full tested range, indicating that the ionic conduction mechanism is fully and consistently established at all tested w/c ratios between 0.40 and 0.60.
3.4. 3DCP Formulation Validation
3.4.1. Influence of Water Content on Measurement Reliability
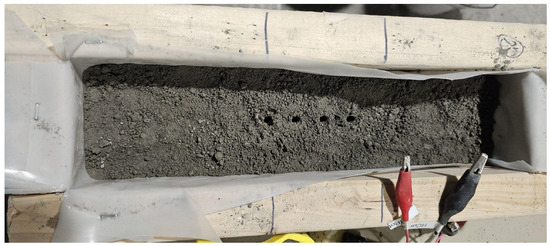
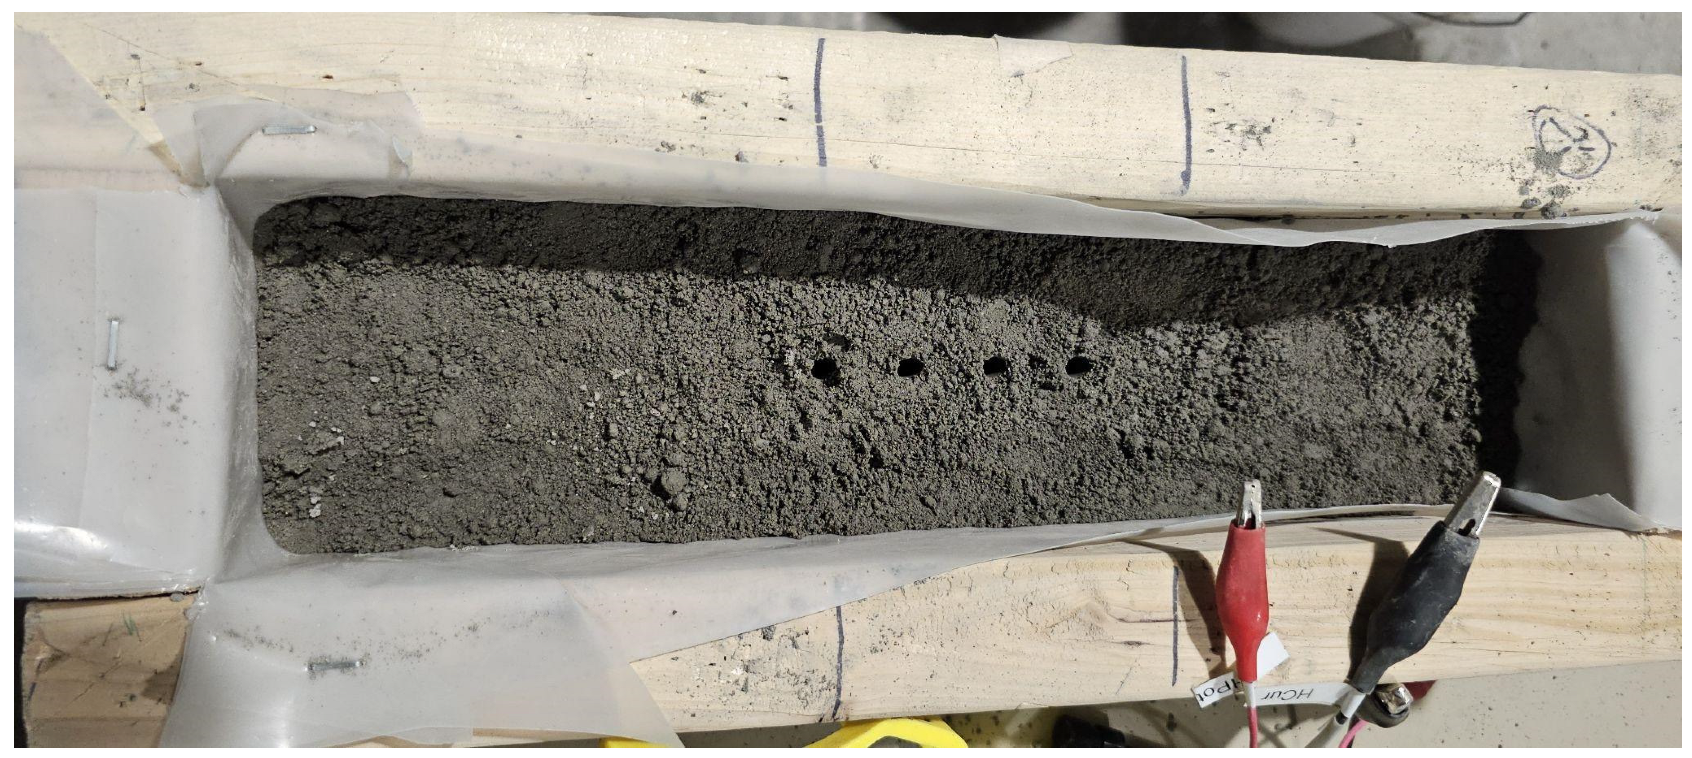
X-Hab 3D mixtures prepared at w/c ratios of 0.40 and 0.45 exhibited insufficient moisture content for reliable electrical resistance measurements. Visual examination revealed granular, discontinuous microstructures lacking cohesive mortar formation, as shown in Figure 12. Electrical measurements from these mixtures demonstrated excessive variability, with coefficients of variation of 41.27% (w/c = 0.40) and 30.65% (w/c = 0.45) and mean resistances of 144.13 ± 59.49 Ω and 33.15 ± 10.16 Ω, respectively, as shown in Table 8, indicating inadequate pore–solution connectivity for stable ionic conduction. The higher percolation threshold of X-Hab 3D mixtures relative to OPC paste (w/c = 0.51 vs. 0.40) reflects fundamental compositional differences between the two formulations. OPC paste consists exclusively of cement and water, producing a homogeneous ionic solution at all tested w/c ratios. In contrast, the X-Hab 3D blend incorporates 50–55% masonry sand, 5–10% silica fume, and chemical admixtures, which collectively increase water demand for pore filling, reduce the volume fraction of conductive pore solution per unit volume, and may redistribute water around particle surfaces through superplasticizer adsorption. These factors raise the minimum water content required to establish continuous conductive pathways.
Figure 12.
X-Hab 3D mixture at w/c = 0.45 showing granular, discontinuous microstructure insufficient for reliable electrical resistance measurement.
Table 8.
Resistance readings from the three iterations of the X-Hab 3D material experiment.
In contrast, mixtures formulated at w/c ≥ 0.51 produced cohesive, workable mortar with continuous microstructures, as shown in Figure 13. These formulations yielded consistent electrical measurements with coefficients of variation below 2.80%, indicating measurement precision comparable to that achieved in the OPC experiments.
Figure 13.
X-Hab 3D mixture at w/c = 0.51 showing cohesive, workable mortar with continuous microstructure suitable for reliable electrical resistance measurement.
3.4.2. Resistance–w/c Correlation for 3DCP Cement
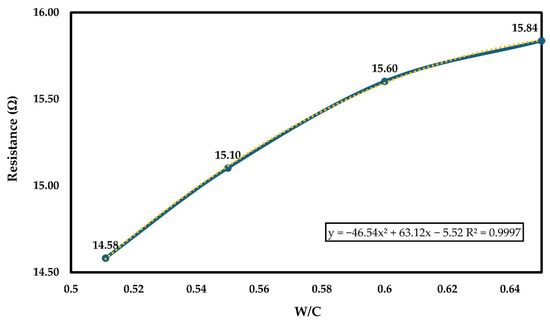
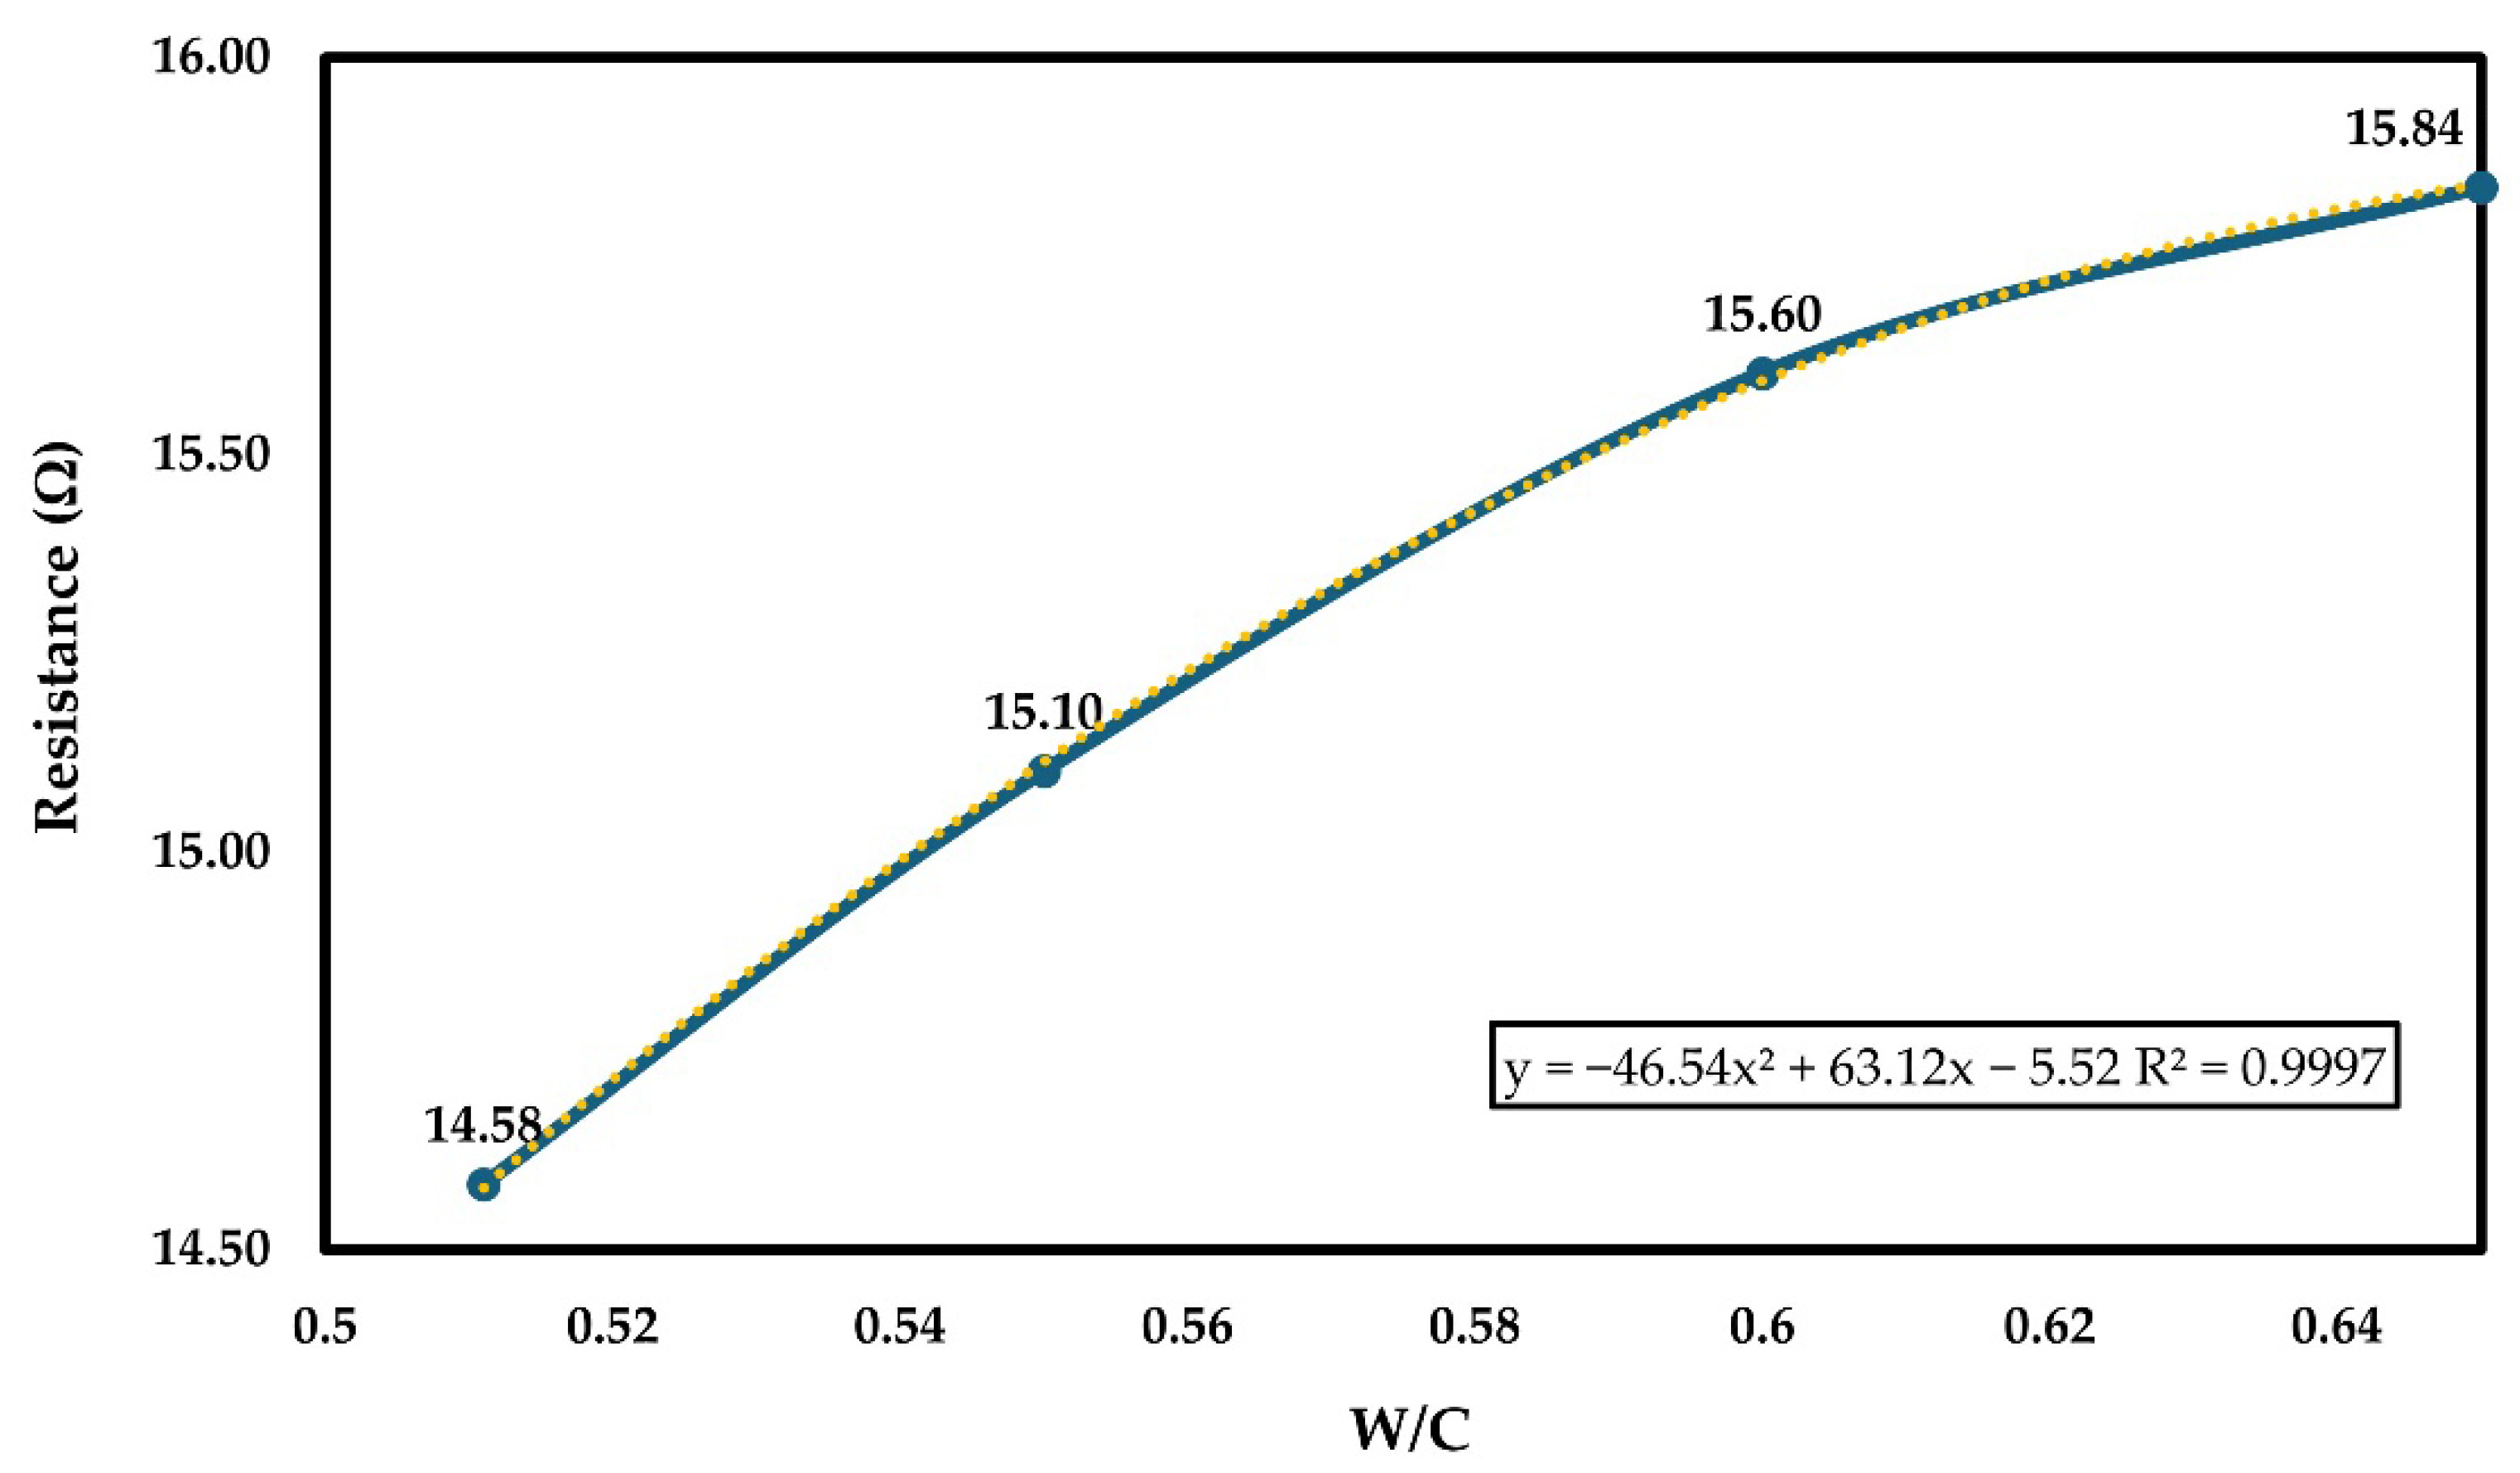
For X-Hab 3D mixtures at w/c ratios of 0.51–0.65, a strong nonlinear correlation between initial electrical resistance and w/c ratio was established, as shown in Figure 14:
Measured resistance values of R ranged from 14.58 ± 0.41 Ω at w/c = 0.51 to 15.84 ± 0.03 Ω at w/c = 0.65, representing absolute values approximately 4.5-fold higher than the corresponding OPC measurements at similar w/c ratios, as detailed in Table 8. The R2 of 0.9997 for X-Hab 3D cement blend should be interpreted with caution, given n = 4 valid w/c levels. RMSE = 0.169 Ω and MAE = 0.097 Ω confirm practical accuracy, with residuals at w/c ≥ 0.55 bounded within ±0.047 Ω. Extrapolation beyond the tested range is not recommended without additional validation. Despite this difference in magnitude, the positive correlation between resistance and w/c ratio remained consistent with OPC behavior. Measurement precision improved substantially at higher w/c ratios, with coefficients of variation decreasing from 2.80% at w/c = 0.51 to 0.16% at w/c = 0.65, reflecting enhanced pore connectivity and more stable ionic conduction pathways at higher water contents. The X-Hab 3D model achieved an RMSE of 0.169 Ω and an MAE of 0.097 Ω. While these absolute error values are larger than those of the OPC model, they remain small relative to the measurement range and are largely attributable to higher within-replicate variability at w/c = 0.511 (CV = 2.80%), where pore connectivity is near the percolation threshold. At w/c ≥ 0.55, RMSE drops substantially, reflecting the improved measurement precision at higher water contents where pore connectivity is fully established. The 95% confidence intervals for X-Hab 3D mixtures narrow substantially with increasing w/c ratios, from ±1.02 Ω at w/c = 0.511 to ±0.063 Ω at w/c = 0.65, reflecting the progressive improvement in pore connectivity and measurement stability above the percolation threshold. These intervals are reported in Table 8. Residual analyses for the X-Hab 3D model revealed that residuals at w/c ≥ 0.55 were tightly bound between −0.044 and +0.047 Ω with no systematic trend, confirming model adequacy at water contents above the percolation threshold. The larger residuals at w/c = 0.511 (−0.450 to +0.342 Ω) reflect the inherently higher measurement variability near the percolation threshold rather than model misspecification, and they are consistent with the elevated CV (2.80%) and wider confidence interval reported for that group. One-way ANOVA confirmed statistically significant differences between w/c levels in the X-Hab 3D formulation (F = 21.73, p < 0.001). The lower F value relative to OPC is attributable to the higher within-group variability at w/c = 0.511 (CV = 2.80%) near the percolation threshold, which increases the within-group variance term in the F ratio. At w/c ≥ 0.55, where pore connectivity is fully established, the between-group differences are large relative to within-group variability, and the overall ANOVA result confirms that the w/c ratio has a statistically significant and practically meaningful effect on resistance across the valid measurement range. Coefficients of variation for X-Hab 3D mixtures at w/c ≥ 0.511 decreased monotonically from 2.80% at w/c = 0.511 to 0.16% at w/c = 0.65, as shown in Table 8. This systematic decreasing trend with increasing w/c ratio is physically meaningful: It directly reflects the progressive development of continuous and stable pore solution connectivity above the percolation threshold, which reduces measurement variability as more water becomes available to fill interparticle spaces and establish consistent ionic conduction pathways. The monotonic CV trend provides independent corroboration of the percolation threshold identified in Section 3.4.1, and it further confirms that resistance measurements become increasingly reliable as w/c increases above 0.511.
R = −46.54(w/c)2 + 63.12(w/c) − 5.52 (R2 = 0.9997, RMSE = 0.169 Ω, MAE = 0.097 Ω)
Figure 14.
Relationship between electrical resistance and w/c ratio for X-Hab 3D mortar at w/c ratios of 0.51–0.65, showing the second-order polynomial fit.
3.4.3. Temporal Resistance Evolution
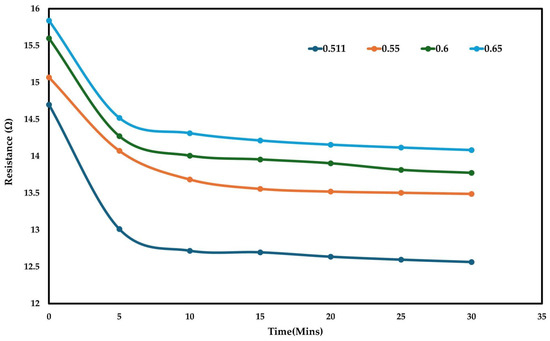
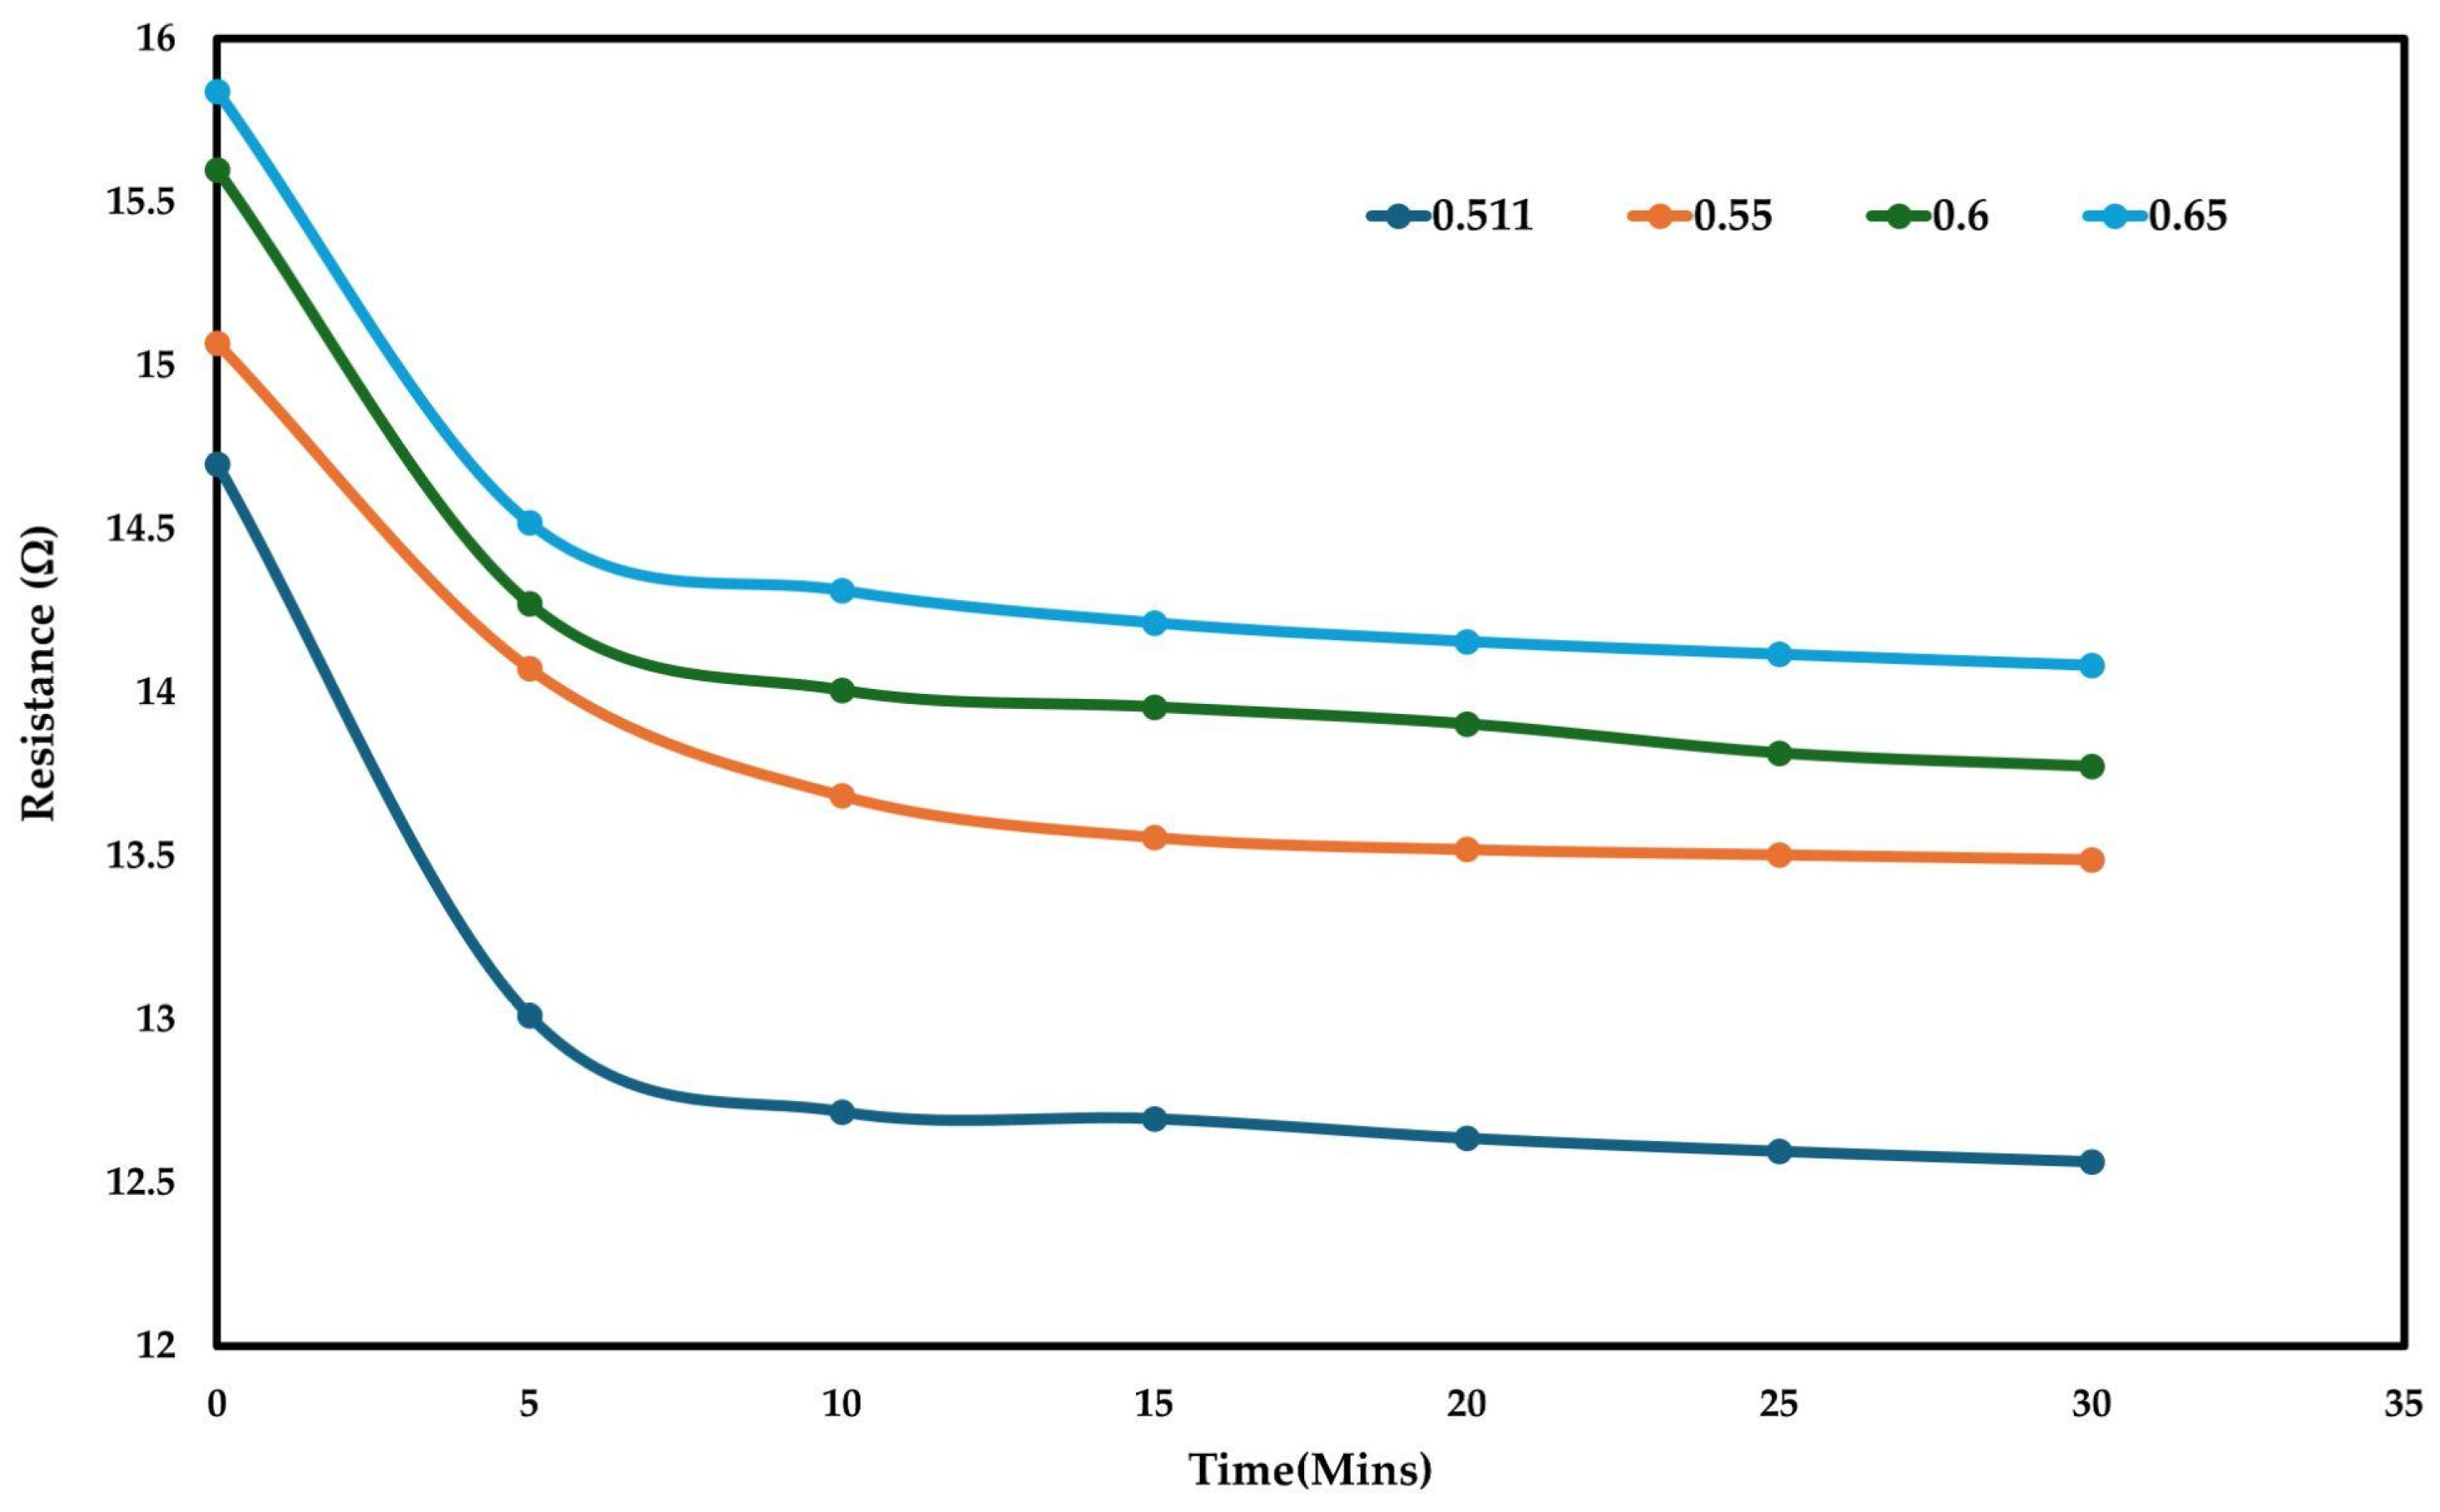
The temporal evolution of electrical resistance in X-Hab 3D mortar over the 30-min measurement period differed distinctly from OPC behavior, exhibiting biphasic kinetics, as shown in Figure 15. A pronounced initial decline occurred between 0 and 5 min post-mixing, with resistance reductions of 11.5% (w/c = 0.51, from 14.70 Ω to 13.01 Ω), 6.6% (w/c = 0.55, from 15.07 Ω to 14.07 Ω), 8.5% (w/c = 0.60, from 15.60 Ω to 14.27 Ω), and 8.3% (w/c = 0.65, from 15.84 Ω to 14.52 Ω). Following this rapid initial phase, resistance continued to decrease at a substantially reduced rate, declining an additional 3.4–3.9% over the subsequent 25 min. Throughout the measurement period, ambient temperature remained stable at 24.9 ± 0.2 °C, while sample temperatures ranged from 23.0 to 24.9 °C across mixtures, confirming that the biphasic temporal behavior reflects accelerated early-age hydration kinetics in the 3DCP formulation rather than thermal effects.
Figure 15.
Electrical resistance of X-Hab 3D mortar as a function of time for w/c ratios of 0.51–0.65.
4. Discussion
4.1. Probe Configuration Selection
The twofold difference in resistance measurements between two-electrode and four-electrode configurations directly reflects the fundamental limitation of two-electrode systems, in which current injection and voltage sensing occur through the same electrodes. In two-electrode systems, the measured resistance includes contributions from both the bulk material resistance and the spreading resistance, which is the constriction resistance encountered by current as it flows from a small contact point into a larger bulk material [25]. The Wenner array eliminates this artifact by separating current injection (outer electrodes) from voltage measurement (inner electrodes), ensuring that voltage drops across contact interfaces become negligible [16].
The substantially lower reactance in the four-electrode system (−0.050 ± 0.003 Ω versus −1.40 ± 0.20 Ω) further indicates reduced electrode polarization. Electrode polarization generates a double-layer capacitance at the electrode–electrolyte interface, producing capacitive reactance that contributes to the total measured impedance [26]. Four-electrode configurations minimize this capacitive contribution by drawing minimal current through voltage-sensing electrodes, whereas two-electrode systems include the polarization capacitance of both electrodes in the measurement circuit. The four-electrode configuration satisfies the IEEE Standard 142-2007 criterion of maintaining reactance values at least one order of magnitude below resistance measurements, whereas the two-electrode system approaches the threshold above which reactive impedance components begin to compromise measurement accuracy. These findings are consistent with Gowers and Millard [16], who demonstrated the superiority of the Wenner configuration for measuring concrete resistivity, and confirm that four-electrode configurations are essential for reliable fresh-concrete monitoring applications.
4.2. Thermal Stability and Environmental Sensitivity
The narrow temperature range encountered during experimentation (±1 °C) had a negligible effect on resistance measurements, as evidenced by minimal resistance variation (<1.2%) across all three experimental systems: saline, OPC, and X-Hab 3D cement blend. This stability is consistent with the findings of Wei and Xiao [27], who showed that significant changes in resistivity require temperature fluctuations exceeding 5 °C. Temperature influences the resistivity of cement paste through two opposing mechanisms operating on different timescales: Immediate increases in temperature reduce resistivity by enhancing ionic mobility and decreasing pore-solution viscosity, while sustained elevated temperatures increase resistivity through accelerated hydration, which densifies the pore structure and alters ionic pathways [27]. Neither effect was observed under the experimental conditions of this study, as the ±1 °C variation was insufficient to elicit measurable changes.
The consistent 1 °C temperature depression observed in samples relative to ambient conditions likely reflects evaporative cooling at exposed surfaces. This finding has important implications for field implementation. Under construction-site conditions with thermal variations of 10–20 °C, active temperature compensation or environmental controls would be necessary to maintain measurement accuracy, as larger fluctuations would produce measurable resistance changes that require correction. This represents a practical limitation that must be addressed in the transition from laboratory validation to real-time field deployment. The observed decline in resistance over the 30-min monitoring period is consistent with established cement hydration chemistry. During the dormant period following mixing, continuous dissolution of unhydrated cement grains releases alkali (K+ and Na+) and hydroxide (OH−) ions into the pore solution, progressively increasing its ionic concentration and conductivity. This relationship between hydration degree and pore solution resistivity has been mathematically modeled and experimentally verified during the dissolution stage and dormant period [28], supporting the interpretation that the 30-min resistance decline observed here reflects ongoing pore solution ionic enrichment rather than the onset of setting.
4.3. Water Content–Resistance Relationship in OPC Paste
The strong nonlinear correlation (R2 = 0.99) between resistance and w/c ratio, combined with low measurement variability (CV < 1.01%), confirms that water content dominates the electrical response in fresh OPC paste. Upon water–cement contact, alkali sulfates (K2SO4 and Na2SO4) and hydroxides dissolve from cement particles, releasing highly mobile ions (K+, Na+, and OH−) that establish conductive pathways detectable by the LCR meter [29]. Lower w/c ratios concentrate dissolved ions in a smaller water volume, yielding lower resistance, whereas higher w/c ratios dilute ions across a larger volume, increasing resistance. This behavior contrasts with hardened concrete, in which higher w/c ratios produce lower resistivity due to increased porosity and pore connectivity [13].
The empirical equation
provides a predictive model enabling estimation of the w/c ratio from resistance measurements with sufficient precision for quality-control applications. The continued decrease in resistance over 30 min indicates ongoing alkali dissolution and rising OH− concentrations, which progressively increase ionic strength and develop additional conductive pathways. Each w/c ratio maintained a distinct resistance profile throughout testing, demonstrating that dilution effects from varying w/c ratios exert a stronger influence than early-age hydration during the measurement window. These findings are consistent with Mancio et al. [14] and Wei and Li [15], confirming that water content dominates the electrical response in fresh systems before significant hydration occurs. Furthermore, Obla et al. [30] similarly noted that, at constant paste volume, lower w/c ratios reduce water content while increasing cement content, thereby concentrating charged ions and reducing measured resistance, in agreement with the present results.
R = 8.29(w/c)2 − 4.31(w/c) + 3.34
The positive correlation between resistance and w/c in fresh paste, where higher w/c ratios increase resistance, contrasts with the well-known negative correlation in hardened concrete [13]. This apparent contradiction reflects a fundamental change in the dominant mechanism of electrical conduction. In fresh paste, the pore solution is not compartmentalized; ions like K+, Na+, Ca2+, and OH− are dispersed in a continuous aqueous phase. Increasing water dilutes ion concentrations, reduces ionic mobility, and raises resistance. In hardened concrete, the limiting factor shifts to pore geometry: Higher w/c ratios lead to increased porosity and connectivity, providing more conductive pathways and lowering resistance. The transition between these regimes occurs gradually during hydration as the pore network is segmented by the precipitation of calcium silicate hydrate. This process is not observed within the 30-min measurement window of this study. The ionic dilution effect can be estimated from mix proportions. At w/c = 0.40, the OPC paste’s water volume fraction is about 0.286, versus 0.375 at w/c = 0.60, a 31% increase. Assuming constant ionic release, this raises the water volume and dilutes conductive ions (K+, Na+, Ca2+, and OH−) by about 25–30%. The observed resistance increase of 26.5% aligns with this dilution, confirming ionic dilution as the main factor. The slight difference with the linear estimate reflects the nonlinear relationship between ionic concentration and resistivity in cement pore solutions [13,21], where small ionic changes cause larger resistivity shifts. This dominance of ionic dilution is theoretically grounded: Pore connectivity effects become significant only after a critical percolation point at approximately 6 h of hydration, when hydration products begin disconnecting the capillary pore network [31]. Before this point, the pore network remains fully connected and saturated, so resistivity depends almost entirely on pore solution ionic concentration. As the 30-min measurement window in this study falls well within this pre-percolation period, ionic dilution is the dominant mechanism by definition.
4.4. Moisture Content Thresholds in 3D-Printable Concrete
The measurement failure observed at w/c ratios below 0.51 in the X-Hab 3D concrete establishes a critical percolation threshold below which insufficient pore connectivity prevents reliable resistance measurement. The granular, discontinuous microstructures observed at w/c = 0.40 and 0.45 reflect a condition in which water content is insufficient to fill interparticle spaces and establish continuous conductive pathways, resulting in coefficients of variation exceeding 30%. This threshold differs from OPC paste, with which reliable measurements were obtained down to w/c = 0.40, likely reflecting differences in particle size distribution, particle shape, and chemical admixture content in the X-Hab 3D concrete. The presence of masonry sand (50–55%) and supplementary cementitious materials may require more water to achieve comparable pore filling, while superplasticizers may redistribute water around particle surfaces rather than in bulk pore spaces, further raising the effective percolation threshold.
This moisture threshold has direct practical implications for 3DCP operations. Low-water mixes are commonly used to achieve rapid strength gain and reduced deformation after deposition; however, the present results indicate that resistance-based monitoring becomes unreliable below w/c = 0.51 for X-Hab 3D concretes. The w/c = 0.51 percolation threshold established for the X-Hab 3D formulation represents a practical limitation for high-performance 3DCP mixes, which typically use w/c ratios between 0.30 and 0.45, enabled by polycarboxylate ether superplasticizers at dosages of 0.8–1.8% by binder weight [32]. In these ultra-low-water-content mixes, the resistance-based approach described here may not reliably quantify the w/c ratio. However, the system can serve as a critical early-warning indicator: Resistance values exceeding the upper threshold of the reliable measurement range could trigger an alert, indicating that the mixture is operating in an unreliable low-moisture regime, risking damage to pumping and extrusion systems. Future research should explore whether modifications to an electrode’s surface area, alternative electrode geometries, or recalibrated thresholds tailored to specific formulations can extend the reliable measurement range to lower w/c ratios relevant to high-performance 3DCP applications.
4.5. Applicability to 3DCP Formulations
The strong correlation (R2 = 0.994) between electrical resistance and w/c ratio in X-Hab 3D concrete demonstrates that resistance-based monitoring can be extended to admixture-modified formulations. This is significant because 3DCP concretes differ substantially from conventional mixtures through higher paste content, chemical admixtures, supplementary cementitious materials, and specialized rheology modifiers. Despite these compositional differences, the fundamental relationship between water content and ionic concentration persists, because the dilution mechanism governing conductivity operates independently of most admixture effects, provided that admixtures do not substantially alter pore-solution ionic concentrations [10,12].
Compositional differences do manifest in absolute resistance values: X-Hab 3D concrete exhibited approximately 4.5-fold higher resistance (14.58–15.84 Ω) compared to OPC paste (2.94–3.72 Ω) at similar w/c ratios. Three factors likely contribute to this difference: The 50–55% sand content increases tortuosity and reduces the conductive cross-section; lower cement content per volume reduces ionic sources; potential ion adsorption onto silica fume surfaces removes charge carriers from solution. The biphasic temporal evolution observed in X-Hab 3D concrete, which is a sharp initial decline of 6.6–11.5% within the first 5 min followed by a gradual decrease, contrasts with the more uniform kinetics of OPC paste and likely reflects accelerated alkali-ion release from chemical admixtures, enhancing early dissolution kinetics. Despite these kinetic differences, the fundamental w/c–resistance relationship persists across both systems, confirming the broad applicability of the technique to formulations relevant to 3DCP. The resistance–w/c relationships here are formulation-specific: Regression equations for OPC paste and X-Hab 3D concrete differ, with a 4.5-fold difference in resistance at the same w/c ratio. Practical w/c monitoring needs calibration for each cement, aggregate, and admixture profile. This limits quick generalization across 3DCP but aligns with the formulation-specific nature of concrete quality control.
4.6. Implications for Real-Time Quality Control in 3DCP
The sub-second response times and sub-2% measurement precision demonstrated in this study enable the detection of w/c ratio variations within the narrow operational tolerance required for 3DCP. Resistance measurements for w/c ratios differing by 0.05 (~10% relative variation in water content) provide sufficient resolution for operational control, as this corresponds to the margin between acceptable and unacceptable printability identified by Papachristoforou et al. [11]. The hydration-driven resistive behavior of both OPC and X-Hab 3D formulations is systematic and predictable, enabling straightforward compensation by reference to the time-dependent curves established here.
In real 3DCP operations, moisture conditions evolve continuously from mixing to deposition, and printing path geometry introduces additional variability. Curved paths, start/stop operations, and overlapping layers create local differences in flow rate and water distribution [33], meaning a single pre-extrusion measurement may not capture the full w/c variability along a complex print path. Future work should explore distributed sensor arrays or in-nozzle probe configurations for continuous monitoring throughout printing.
Practical implementation of a closed-loop monitoring system would require the following: (a) establishing baseline resistance–w/c correlation curves for each specific mixture, admixture, and aggregate combination; (b) characterizing resistance behavior across relevant sample geometries, including print-hose configurations; (c) developing correction factors for semi-infinite sample geometries representative of the extrusion process; (d) validating temporal evolution patterns under expected environmental conditions; and (e) determining threshold resistance limits corresponding to acceptable printing performance. Threshold-based monitoring is feasible: Resistance values falling outside ±5% of the expected range for a given mixture and elapsed time could trigger automated water dosing corrections before or during printing. Laboratory conditions may not accurately represent construction-site electromagnetic interference or mechanical vibration, and field validation under realistic conditions represents the critical next step toward industrial deployment.
4.7. Advantages and Limitations
The instantaneous electrical resistance measurements demonstrated here overcome the key limitations of traditional moisture analysis methods. Oven drying (ASTM C566-19) [8] requires 24 h of heating, microwave drying [10] shortens this to 15–30 min, and the calcium chloride test (ASTM F1869) [8] operates on a 24-h cycle. None of these methods is compatible with real-time process control. The Wenner configuration enhances contact resistance rejection and aligns with AASHTO TP 95-14 standards [34], outperforming two-electrode commercial systems for fresh concrete monitoring applications. Beyond single-material 3DCP, the system holds potential for multi-material additive manufacturing (MMAM), where real-time monitoring of material consistency at the point of extrusion remains an unresolved process control challenge [35]. The sub-second response times and formulation-specific calibration approach demonstrated here suggest that resistance-based monitoring could be extended to detect w/c deviations across discrete or graded material transitions, positioning the system as a foundational sensing technology for next-generation automated concrete printing operations.
Table 9 compares the electrical resistance monitoring system developed in this study against established moisture measurement techniques for 3DCP quality control. The proposed system offers the best combination of response time and compatibility with 3DCP formulations among currently available methods. Its main limitations are the need for formulation-specific calibration and the percolation threshold constraint at low w/c ratios, as discussed in Section 4.4.
Table 9.
Comparison of moisture measurement techniques for 3DCP applications.
All measurements in this study were conducted under static conditions and do not directly represent the dynamic extrusion environment of 3DCP. During active extrusion, shear forces temporarily break down the cement particle network, potentially reducing resistance below the static value and causing a slight overestimation of the w/c ratio [36]. Therefore, taking measurements during the pauses between printed layers is recommended as the most practical deployment strategy. Several inherent limitations must be acknowledged. First, sample geometry and probe placement significantly influence resistance readings; this study controlled for these variables by maintaining constant formwork dimensions and fixed probe positioning across all experiments, but generalization to arbitrary geometries requires additional geometric correction factors. Second, chemical admixtures can alter pore-solution ionic concentrations independently of the w/c ratio, potentially introducing systematic errors that require formulation-specific calibration. Third, ambient temperature fluctuations beyond ±5 °C would require active compensation to maintain measurement accuracy under field conditions. Fourth, the formulation-specific nature of resistance and w/c relationship necessitates individual calibration procedures for each concrete mixture design, which may represent a practical barrier to rapid deployment across diverse 3DCP operations. These constraints define the boundaries within which the conclusions of this study can be reliably applied. After extrusion, thixotropic recovery rebuilds the cement particle network over 60–600 s [36], continuously changing the material state and resistance readings. The temporal resistance decrease observed in both OPC and X-Hab 3D systems likely reflects a combination of thixotropic recovery and early hydration kinetics; exploring these two contributions is identified as a direction for future work. Furthermore, chemical accelerators commonly used in 3DCP may compress the usable measurement window to less than 5 min, requiring future probe configurations to be integrated directly into the mixing drum or delivery hose. All measurements were conducted under static conditions, while real 3DCP involves continuous flow and pumping pressure. During pumping, shear rates of 20–40 s−1 (80–160 s−1 for pastes and mortars) [36] disturb the cement particle network and create uneven particle distributions that could affect ionic conditions near the electrodes [37]. Extrusion pressure may also alter the current’s conductive pathways [29], while moving fluid can disturb the ionic environment around stationary electrodes [25]. A practical solution would be to take advantage of the sub-second response time demonstrated here, allowing measurements during the pauses between printed layers, well before structural recovery begins (60–600 s) [36]. Quantifying these flow effects using a flow-cell probe configuration remains a priority for future work.
5. Conclusions
This study developed and validated a non-destructive, in situ four-electrode Wenner-array electrical resistance measurement system for real-time quantification of water-to-cement (w/c) ratios in fresh cementitious materials, with direct application to three-dimensional concrete printing (3DCP). The following principal conclusions are drawn:
- The four-electrode Wenner-array configuration demonstrated clear superiority over the two-electrode configuration, maintaining reactance values at least one order of magnitude below resistance measurements throughout all tests, satisfying the IEEE Standard 142-2007 criterion and confirming that electrode polarization and contact resistance artifacts are effectively eliminated.
- System validation against NaCl and KCl electrolytic solutions of known resistivity confirmed exceptional stability, with resistance drift below 1.2%, sub-second response times, and thermal equilibration within the first 5 min—establishing the probe as a reliable measurement platform for fresh cementitious materials.
- Strong nonlinear correlations (R2 > 0.99, RMSE = 0.037 Ω for OPC; R2 = 0.994, RMSE = 0.169 Ω for X-Hab 3D) were established between electrical resistance and w/c ratio for both formulations, supported by one-way ANOVA confirming statistically significant differences between all w/c levels (p < 0.001). Resistance increased with higher w/c ratios due to ionic dilution and decreased over time as early-age hydration progressed. This behavior is the opposite of that in hardened concrete and consistent with dilution-controlled ionic conduction in fresh systems.
- X-Hab 3D cement mixtures below w/c = 0.51 exhibited insufficient pore connectivity for reliable measurement (CV > 30%), establishing a formulation-specific percolation threshold, while mixtures at w/c ≥ 0.51 demonstrated excellent repeatability (CV < 2.80%), confirming the broad applicability of the measurement principle to admixture-modified formulations with appropriate formulation-specific calibration.
- Electrical resistance measurement provides a viable, low-cost, real-time technique for w/c determination in fresh concrete, enabling the foundation for automated closed-loop water dosing control in 3DCP operations. Field validation under realistic construction conditions should include electromagnetic interference, mechanical vibration, flow-induced effects, and variable temperature; these variables represent the essential next step toward industrial implementation.
Author Contributions
Conceptualization, A.B., J.P.D. and S.G.B.; methodology, A.B., J.P.D. and S.G.B.; validation, A.B.; formal analysis, A.B.; investigation, A.B.; resources, S.G.B.; data curation, A.B.; writing—original draft preparation, A.B.; writing—review and editing, J.P.D. and S.G.B.; visualization, A.B.; supervision, J.P.D. and S.G.B.; project administration, J.P.D.; funding acquisition, J.P.D. All authors have read and agreed to the published version of the manuscript.
Funding
This research was partially funded by the U.S. Department of Housing and Urban Development, grant number RP-22-AK-004. The APC was funded by the U.S. Department of Housing and Urban Development.
Data Availability Statement
The original contributions presented in this study are included in the article. Further inquiries can be directed to the corresponding author.
Acknowledgments
The authors thank Aleksandra Radlińska, Amir Alarab, Mahdi Mirabrishami, and Hanbin Cheng for their guidance on material behavior and testing. The authors also acknowledge X-Hab 3D for providing the X-Hab 3D cement blend, and Amir Ghasemi, Nusrat Tabassum, and Ali Baghi at Penn State’s Additive Construction Lab for their support during testing sessions. Any findings, interpretations, or conclusions expressed in this paper are those of the authors and do not necessarily reflect the views of the U.S. Department of Housing and Urban Development or any other funding agency. The contents of this paper should not be construed as representing the official policy or endorsement of HUD. During the preparation of this manuscript, the author(s) used the software Claude (Anthropic, San Francisco, CA, USA; model: Claude Sonnet 4.6, released 17 February 2026) and Grammarly for academic writing assistance. The authors have reviewed and edited the output and take full responsibility for the content of this publication.
Conflicts of Interest
Bilén and Duarte and The Pennsylvania State University own equity in X-Hab 3D, which is engaged in activities related to concrete printing. Their ownership in this company has been reviewed by the university’s Individual and Institutional Conflict of Interest Committees and is currently being managed by the university.
Abbreviations
The following abbreviations are used in this manuscript:
| 3DCP | Three-dimensional concrete printing |
| AM | Additive manufacturing |
| AASHTO | American Association of State Highway and Transportation Officials |
| ASTM | American Society for Testing and Materials |
| BNC | Bayonet Neill–Concelman (connector type) |
| CV | Coefficient of variation |
| DIW | Direct ink writing |
| DS | Dynamic stability |
| FFF | Fused filament fabrication |
| HUD | U.S. Department of Housing and Urban Development |
| IEEE | Institute of Electrical and Electronics Engineers |
| KCl | Potassium chloride |
| LCR | Inductance, capacitance, and resistance (meter) |
| LPBF | Laser powder bed fusion |
| MMAM | Multi-material additive manufacturing |
| NaCl | Sodium chloride |
| OPC | Ordinary Portland cement |
| PLA | Polylactic acid |
| R2 | Coefficient of determination |
| Rs | Series resistance |
| TDR | Time-domain reflectometry |
| w/c | Water-to-cement ratio |
| Xs | Series reactance |
References
- Zhang, J.; Wang, J.; Dong, S.; Yu, X.; Han, B. A review of the current progress and application of 3D printed concrete. Compos. Part A Appl. Sci. Manuf. 2019, 125, 105533. [Google Scholar] [CrossRef] [Scilit]
- Roussel, N. Rheological requirements for printable concretes. Cem. Concr. Res. 2018, 112, 76–85. [Google Scholar] [CrossRef] [Scilit]
- Le, T.T.; Austin, S.A.; Lim, S.; Buswell, R.A.; Gibb, A.G.F.; Thorpe, T. Mix design and fresh properties for high-performance printing concrete. Mater. Struct. 2012, 45, 1221–1232. [Google Scholar] [CrossRef] [Scilit]
- Quah, T.K.N.; Tay, Y.W.D.; Lim, J.H.; Tan, M.J.; Wong, T.N.; Li, K.H.H. Concrete 3D printing: Process parameters for process control, monitoring and diagnosis in automation and construction. Mathematics 2023, 11, 1499. [Google Scholar] [CrossRef] [Scilit]
- Soni, A.K.; Sangwai, A.; Panda, B. In-process monitoring and quality assessment of 3D concrete printing process. In Industry 4.0 and Advanced Manufacturing; Springer: Singapore, 2025. [Google Scholar]
- Farrokhsiar, P.; Gursoy, B.; Duarte, J.P. A comprehensive review on integrating vision-based sensing in extrusion-based 3D printing processes. Constr. Robot. 2024, 8, 21. [Google Scholar] [CrossRef] [Scilit]
- Park, J.; Song, H.; Choi, H. Estimation of water-to-cement ratio in cementitious materials using electrochemical impedance spectroscopy and artificial neural networks. Constr. Build. Mater. 2022, 350, 128843. [Google Scholar]
- ASTM C566-19; Standard Test Method for Total Evaporable Moisture Content of Aggregate by Drying. ASTM International: West Conshohocken, PA, USA, 2019.
- Halstead, W.J. Rapid test methods for asphalt concrete and Portland cement concrete. Synth. Highw. Pract. 1993, 187, 16–25. [Google Scholar]
- Nagi, M.; Whiting, D. Determination of water content of fresh concrete using a microwave oven. Cem. Concr. Aggreg. 1994, 16, 125–131. [Google Scholar] [CrossRef] [Scilit]
- Papachristoforou, M.; Mitsopoulos, V.; Stefanidou, M. Evaluation of workability parameters in 3D printing concrete. Procedia Struct. Integr. 2018, 10, 155–162. [Google Scholar] [CrossRef] [Scilit]
- Ma, G.; Buswell, R.; da Silva, W.R.L.; Wang, L.; Xu, J.; Jones, S.Z. Technology readiness: A global snapshot of 3D concrete printing and the frontiers for development. Cem. Concr. Res. 2022, 156, 106774. [Google Scholar] [CrossRef] [Scilit]
- Woelfl, G.A.; Lauer, K. The electrical resistivity of concrete with emphasis on the use of electrical resistance for measuring moisture content. Cem. Concr. Aggreg. 1979, 1, 64–78. [Google Scholar] [CrossRef] [Scilit]
- Mancio, M.; Moore, J.R.; Brooks, Z.; Monteiro, P.J.M.; Glaser, S.D. Instantaneous in-situ determination of water-cement ratio of fresh concrete. ACI Mater. J. 2010, 107, 587–593. [Google Scholar]
- Wei, X.; Li, Z. Early hydration process of Portland cement paste by electrical measurement. J. Mater. Civ. Eng. 2006, 18, 99–105. [Google Scholar] [CrossRef] [Scilit]
- Gowers, K.R.; Millard, S.G. Measurement of concrete resistivity for assessment of corrosion severity of steel using Wenner technique. ACI Mater. J. 1999, 96, 536–541. [Google Scholar] [CrossRef] [Scilit]
- Azarsa, P.; Gupta, R. Electrical resistivity of concrete for durability evaluation: A review. Adv. Mater. Sci. Eng. 2017, 2017, 8453095. [Google Scholar] [CrossRef] [Scilit]
- Polder, R.B. Test methods for on-site measurement of resistivity of concrete—A RILEM TC-154 technical recommendation. Constr. Build. Mater. 2001, 15, 125–131. [Google Scholar] [CrossRef] [Scilit]
- Sengul, O. Use of electrical resistivity as an indicator for durability. Constr. Build. Mater. 2014, 73, 434–441. [Google Scholar] [CrossRef] [Scilit]
- ASTM C150/C150M-21; Standard Specification for Portland Cement. ASTM International: West Conshohocken, PA, USA, 2021.
- ASTM C305-20; Standard Practice for Mechanical Mixing of Hydraulic Cement Pastes and Mortars of Plastic Consistency. ASTM International: West Conshohocken, PA, USA, 2020.
- Lazniewska-Piekarczyk, B.; Gołaszewski, J. Relationship between air-content in fresh cement paste, mortar, mix and hardened concrete. IOP Conf. Ser. Mater. Sci. Eng. 2019, 471, 032044. [Google Scholar] [CrossRef] [Scilit]
- Lide, D.R. Electrical conductivity of aqueous solutions. In CRC Handbook of Chemistry and Physics, 84th ed.; CRC Press: Boca Raton, FL, USA, 2003. [Google Scholar]
- IEEE Std 142-2007; IEEE Recommended Practice for Grounding of Industrial and Commercial Power Systems. IEEE: New York, NY, USA, 2007.
- Rocha, P.; Schlett, P.; Kintzel, U.; Hunskaar, V.; Martiniussen, I.B.; Heikkila, J. Electrochemical noise and impedance of Au electrode/electrolyte interfaces enabling extracellular detection of glioma cell populations. Sci. Rep. 2016, 6, 34843. [Google Scholar] [CrossRef] [Scilit] [PubMed]
- Lazanas, A.C.; Prodromidis, M.I. Electrochemical impedance spectroscopy—A tutorial. ACS Meas. Sci. Au 2023, 3, 162–193. [Google Scholar] [CrossRef] [Scilit] [PubMed]
- Wei, X.; Xiao, L. Effect of temperature on the electrical resistivity of Portland cement pastes. Adv. Cem. Res. 2012, 24, 69–76. [Google Scholar] [CrossRef] [Scilit]
- Tian, Y.; Xu, X.; Ji, H.; Tian, Z.; Jin, X.; Jin, N.; Yan, D.; Tang, S. A mathematical model for the electrical resistivity of cement paste at early ages considering the partially saturated state. Materials 2020, 13, 3306. [Google Scholar] [CrossRef] [Scilit] [PubMed]
- Huang, L.; Tang, L.; Löfgren, I.; Olsson, N.; Yang, Z. Real-time monitoring the electrical properties of pastes to map the hydration induced microstructure change in cement-based materials. Cem. Concr. Compos. 2022, 132, 104639. [Google Scholar]
- Obla, K.; Hong, R.; Sherman, S.; Bentz, D.P.; Jones, S.Z. Relating the electrical resistance of fresh concrete to mixture proportions. Adv. Civ. Eng. Mater. 2018, 7, 71–86. [Google Scholar] [CrossRef] [Scilit] [PubMed]
- Yousuf, F.; Wei, X. Water to cement ratio effect on cement paste microstructural development by electrical resistivity measurements and computer illustration. Am. J. Civ. Eng. Archit. 2021, 9, 73–87. [Google Scholar] [CrossRef] [Scilit]
- Lee, K.-W.; Lee, H.-J.; Choi, M.-S. Correlation between thixotropic behavior and buildability for 3D concrete printing. Constr. Build. Mater. 2022, 347, 128498. [Google Scholar] [CrossRef] [Scilit]
- Rushing, T.S.; Al-Chaar, G.; Eick, B.A.; Burroughs, J.; Shannon, J.; Barna, L.; Brady, M. Investigation of concrete mixtures for additive construction. Autom. Constr. 2022, 134, 104624. [Google Scholar]
- AASHTO TP 95-14; Standard Test Method for Surface Resistivity of Concrete’s Ability to Resist Chloride Ion Penetration. AASHTO: Washington, DC, USA, 2014.
- Fakhr Ghasemi, A.; Pinto Duarte, J. A systematic review of innovative advances in multi-material additive manufacturing: Implications for architecture and construction. Materials 2025, 18, 1820. [Google Scholar] [CrossRef] [Scilit] [PubMed]
- Jayathilakage, R.; Rajeev, P.; Sanjayan, J. Structural build-up model for three-dimensional concrete printing based on kinetics theory. Front. Struct. Civ. Eng. 2024, 18, 998–1014. [Google Scholar]
- Kabashi, V.; Liberto, T.; Robisson, A. Shear-induced particle migration in a cement slurry under oscillatory pipe flow. J. Non-Newton. Fluid Mech. 2023, 319, 105071. [Google Scholar] [CrossRef] [Scilit]

Disclaimer/Publisher’s Note: The statements, opinions and data contained in all publications are solely those of the individual author(s) and contributor(s) and not of MDPI and/or the editor(s). MDPI and/or the editor(s) disclaim responsibility for any injury to people or property resulting from any ideas, methods, instructions or products referred to in the content. |
© 2026 by the authors. Licensee MDPI, Basel, Switzerland. This article is an open access article distributed under the terms and conditions of the Creative Commons Attribution (CC BY) license.