


Abstract
Energy-intelligent building control is widely advocated as a key strategy for reducing building energy use and associated carbon emissions. However, empirical evidence from real buildings remains relatively scarce and is often affected by methodological limitations. This study reports a 92-day field experiment on the 14th floor of an office building in Shenzhen, China, where an Internet of Things (IoT) and edge-computing-based intelligent building environmental control system was deployed to manage lighting and HVAC. An A-B-A experimental design was implemented in summer 2022, comprising two intelligent-control phases (A1 and A2, July and September) and one intermediate manual-control phase (B, August) during which the intelligent algorithms were disabled without notifying occupants. Aggregated monthly runtimes show average energy-saving potential ratios of approximately 25.98% for lighting and 19.50% for HVAC when the intelligent system is active. As this study was conducted on a single office floor in one building, the results should be interpreted as proof-of-concept field evidence for this specific operational and climatic context rather than as directly generalizable performance estimates for all office buildings. The study further highlights methodological considerations for future field evaluations, including the influence of outdoor climate, occupancy patterns and experimental design choices. The findings provide a real-world empirical case of the energy-saving potential performance of intelligent environmental control in office buildings and contribute to narrowing the gap between simulated and measured savings.
1. Introduction
As urbanization is increasing, an ever-greater population lives in urban areas with increasing occupied time [1]. Buildings are responsible for 40% of global energy use and contribute towards 30% of the total CO2 emissions [2]. Among building functions, heating, ventilation, and air-conditioning (HVAC) systems and lighting systems are the main contributors to building energy usage, accounting for 35% and 11% of total energy use, respectively [3]. Hence, there is a great potential for energy conservation during building operation. It is urgent to seek suitable energy-saving paths during building operation, and the deployment of intelligent control systems may be an efficient path worth exploring.
Recent developments in information and communication technology (ICT) infrastructure have led to advanced controllers for building lighting systems, integrated with, e.g., sensors, actuators, and micro-controllers [4,5]. With advances in digital technologies, the concept of energy-intelligent buildings has gained prominence. Such buildings integrate sensing, communication and control technologies, often grounded in the Internet of Things (IoT) to manage indoor environmental systems, such as lighting and heating, ventilation and air-conditioning (HVAC), more efficiently [3]. In this paper, the term energy-intelligent building environmental control system refers to systems that deploy distributed sensors and controllers to automatically adjust lighting and air-conditioning operation based on occupant presence and environmental conditions, with the dual goals of maintaining acceptable indoor comfort and reducing unnecessary energy use. It should be noted that this article does not involve improving comfort, dealing with medical rehabilitation, monitoring mobility and physiological parameters, even delivering therapy [6].
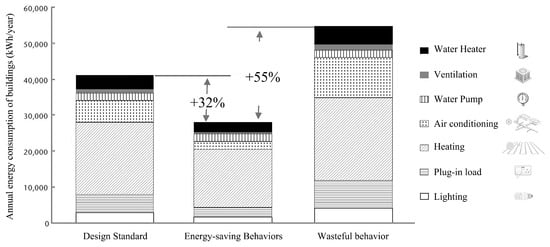
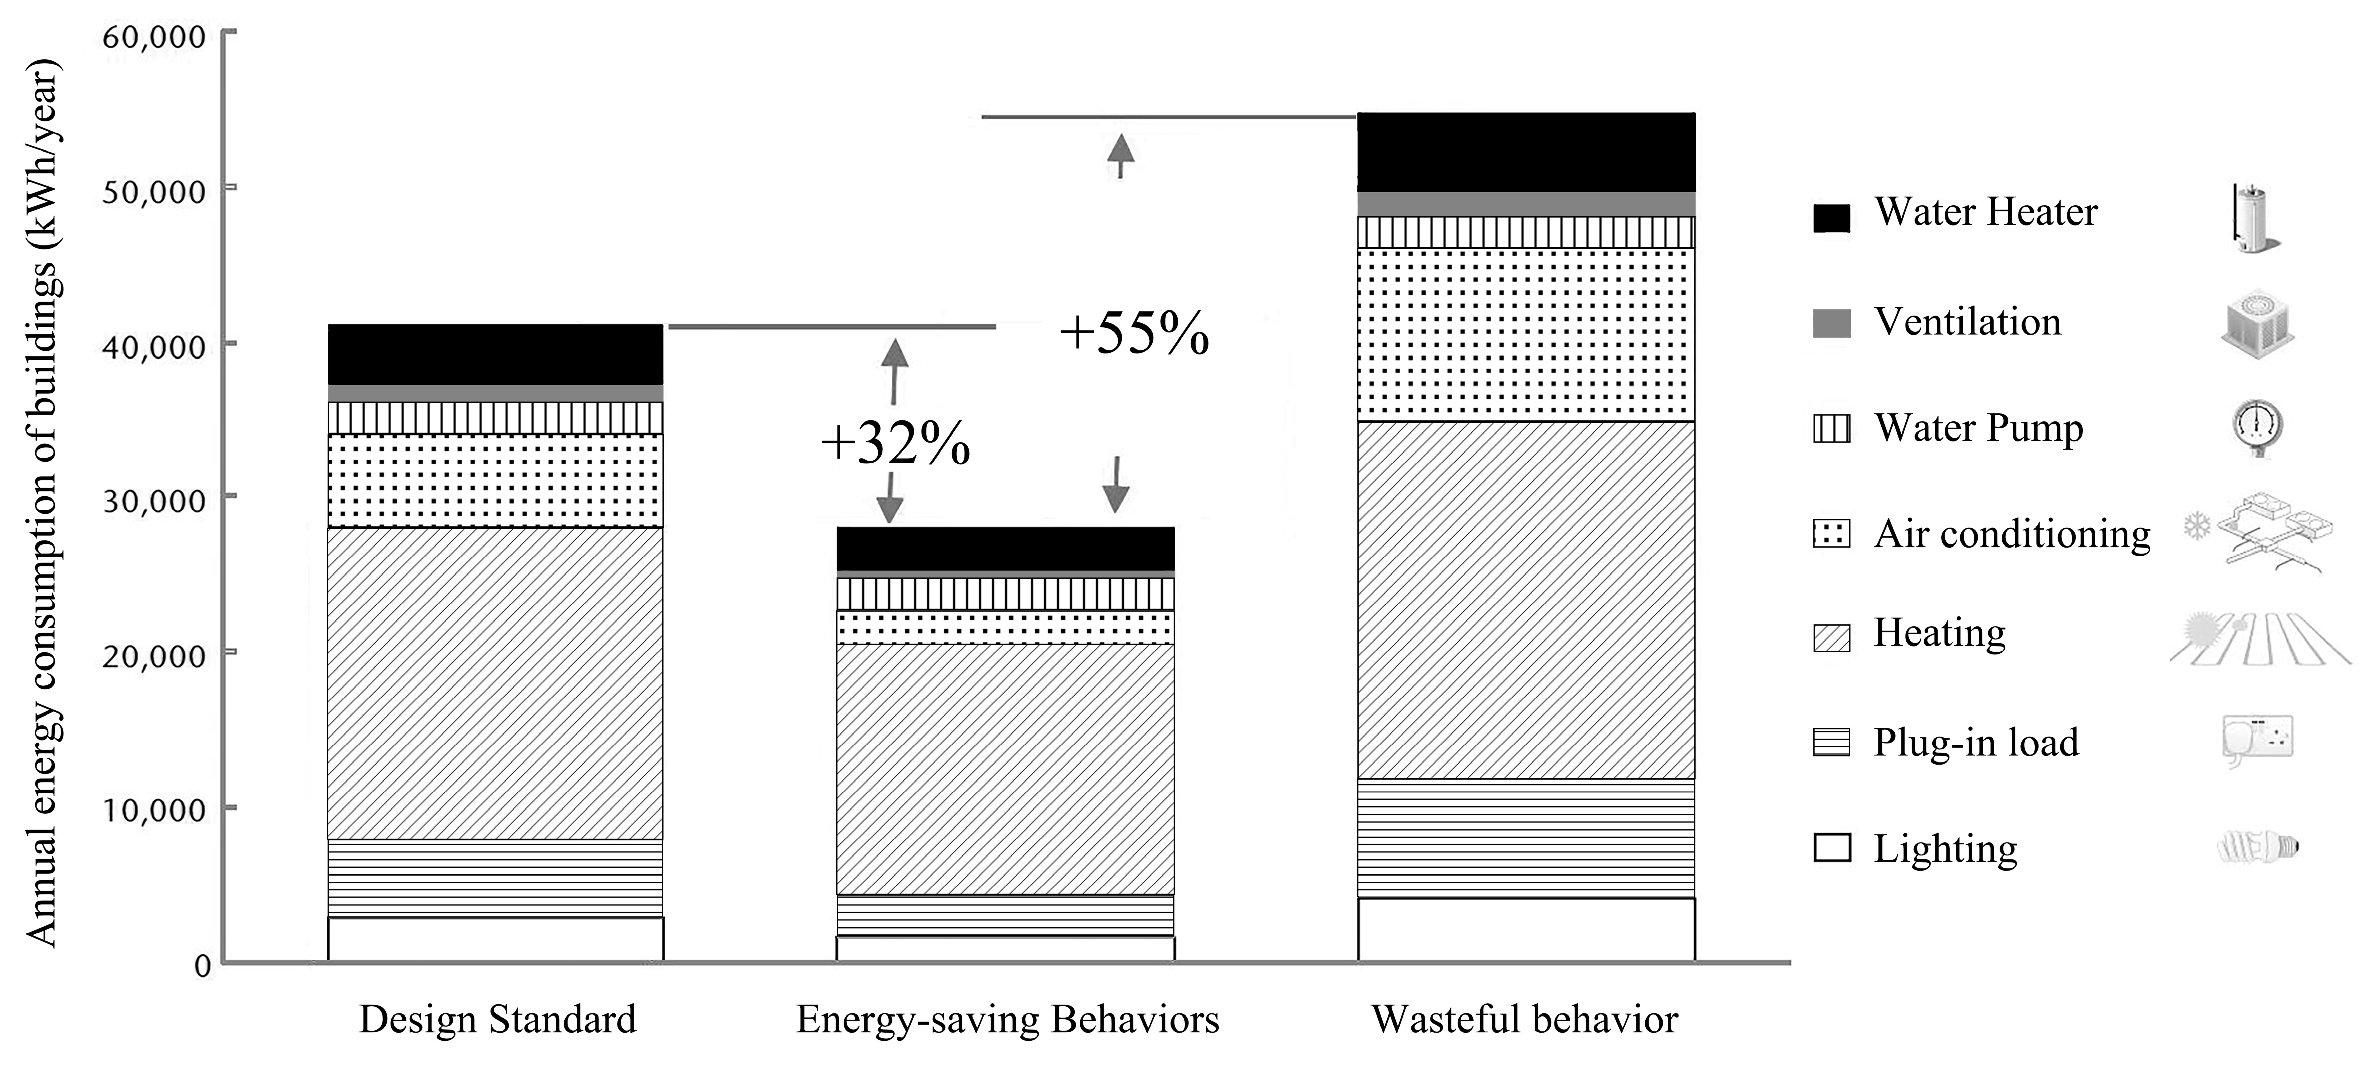
The World Business Council for Sustainable Development reports that wasteful behavior can increase a building’s designed energy use by 33%, while conservation behavior can decrease it by 32% [7] (Figure 1). Consequently, energy-intelligent building control systems have significant energy-saving potential by dynamically adjusting lighting and HVAC settings in real time based on occupancy and environmental conditions [4,6].
Figure 1.
Energy consumption proportion attributed to building occupants’ behavior.
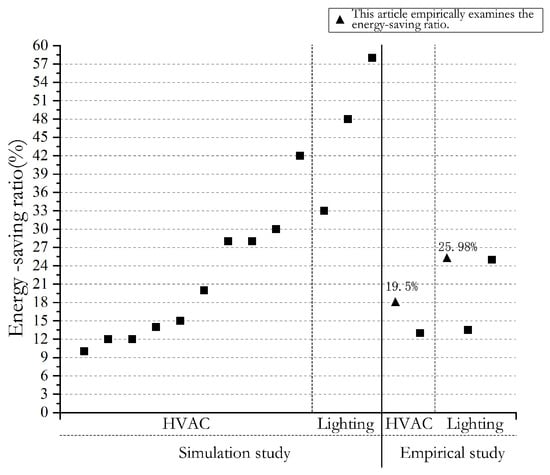
Existing research on energy-intelligent building energy management in office buildings can broadly be classified into simulation-based and empirical studies [8,9,10,11,12,13,14]. Delaney proposed an office lighting control system based on wireless communication, which combines photodetectors and infrared sensors and achieved up to 58% lighting energy savings [8]. Wen et al. employed a wirelessly networked intelligent lighting system in shared office spaces, effectively reducing energy use while accommodating diverse occupant lighting preferences, with reported savings of 48% [15]. Singhvi et al. developed a wireless sensor-based lighting control system in which users wore localization devices to enable relatively accurate position tracking, resulting in an energy saving of 33% [16].
Simulation studies typically employ building performance simulation tools to estimate potential savings under hypothetical control strategies. They often report high theoretical savings, particularly for lighting systems with occupancy and daylight-responsive controls [8,9,10,11,12,13,14,15,16,17]. However, these results rely on assumptions about occupancy, behavioral patterns and control performance that may not fully reflect real operations.
Compared with the extensive simulation literature, empirical investigations that monitor actual energy consumption or equipment operating hours before and after the implementation of intelligent control strategies remain relatively scarce, and the reported savings are generally smaller in magnitude and exhibit considerable variability. For HVAC systems, which constitute a major share of energy demand in office buildings [3,18], Peng et al. [19] proposed a demand-responsive cooling control scheme based on occupancy learning and reported a 20.3% reduction in overall cooling energy use. Building on this concept, they subsequently introduced machine-learning-based control frameworks, achieving energy savings in the range of 7–52% relative to conventional time-schedule operation [20]. In a follow-up study, they applied neural networks to model individual thermal preference profiles and demonstrated additional savings of 4–25% compared with fixed temperature setpoints [21].
For lighting systems, occupant-centric control approaches have similarly been shown to offer substantial energy-saving potential while still satisfying visual comfort requirements. Nagy et al. [22] proposed an occupant-centric lighting control concept in which preferred setpoints are inferred automatically from user interactions; a 12-week deployment in six offices yielded a 13.4% reduction in normalized lighting energy consumption without causing notable deterioration in reported comfort. Park et al. [23,24,25] developed LightLearn, an adaptive reinforcement-learning-based controller capable of capturing individual occupant behavior and varying environmental conditions, and demonstrated that it can achieve a more favorable trade-off between comfort and energy use than both schedule-based and purely occupancy-based control strategies.
A common limitation in empirical studies is the use of simple A-B designs, where a “before” period with manual control is compared to an “after” period with intelligent control. In such designs, changes in occupants’ awareness (Hawthorne-type effect [26]), seasonal weather variation, or evolving operational practices can confound the observed savings. Furthermore, many empirical studies focus on either lighting or HVAC alone, with relatively few addressing combined lighting and air-conditioning performance in the same building.
To address these gaps, this study conducts a real-world, long-term A-B-A field experiment on the 14th floor of an office building in Shenzhen, China. An intelligent building environmental control system was deployed to manage lighting and HVAC based on occupant presence and environmental sensing. The experiment comprises two intelligent-control phases (A1 and A2) separated by a manual-control phase (B), which helps to reduce the impact of transient awareness or learning effects. The main objectives are to:
- Quantify real-world energy-saving performance for both lighting and air-conditioning using equipment runtime as a proxy for energy consumption.
- Demonstrate the methodological advantages of an A-B-A experimental design in controlling for reactivity effects and temporal confounds.
- Analyze weekday versus weekend performance to identify differences in energy savings, particularly the reduction of “forgotten-on” equipment.
By providing detailed empirical evidence from an active office environment, this study aims to complement simulation-based work and contribute to more realistic expectations and design guidelines for intelligent building environmental control systems. The study is positioned as an initial single-building field evaluation, and its external validity should be tested through future deployments in buildings with different layouts, operational practices, occupant behaviors and micro-climatic conditions.
2. Materials and Methods
2.1. Experimental Site and Energy-Intelligent Control System
The field experiment was conducted on the 14th floor of a multi-storey office building in Shenzhen, China. The experimental floor has a total area of approximately 3500 m2 and comprises open-plan workspaces, individual offices, meeting rooms and public areas such as corridors. The office operates on a typical weekday schedule, with occasional overtime and weekend work. The lighting system in the experimental area consists of ceiling-mounted luminaires installed in the different functional zones, while space conditioning is provided by split or unitary air-conditioning units. Prior to the deployment of the intelligent building environmental control system, both lighting and HVAC were mainly operated through manual switching by occupants and facility staff.
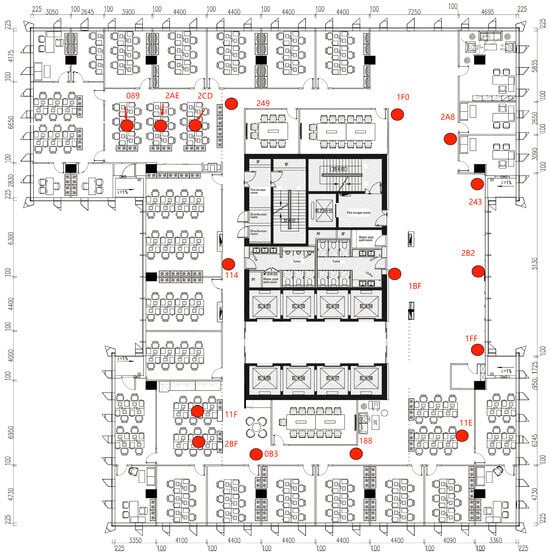
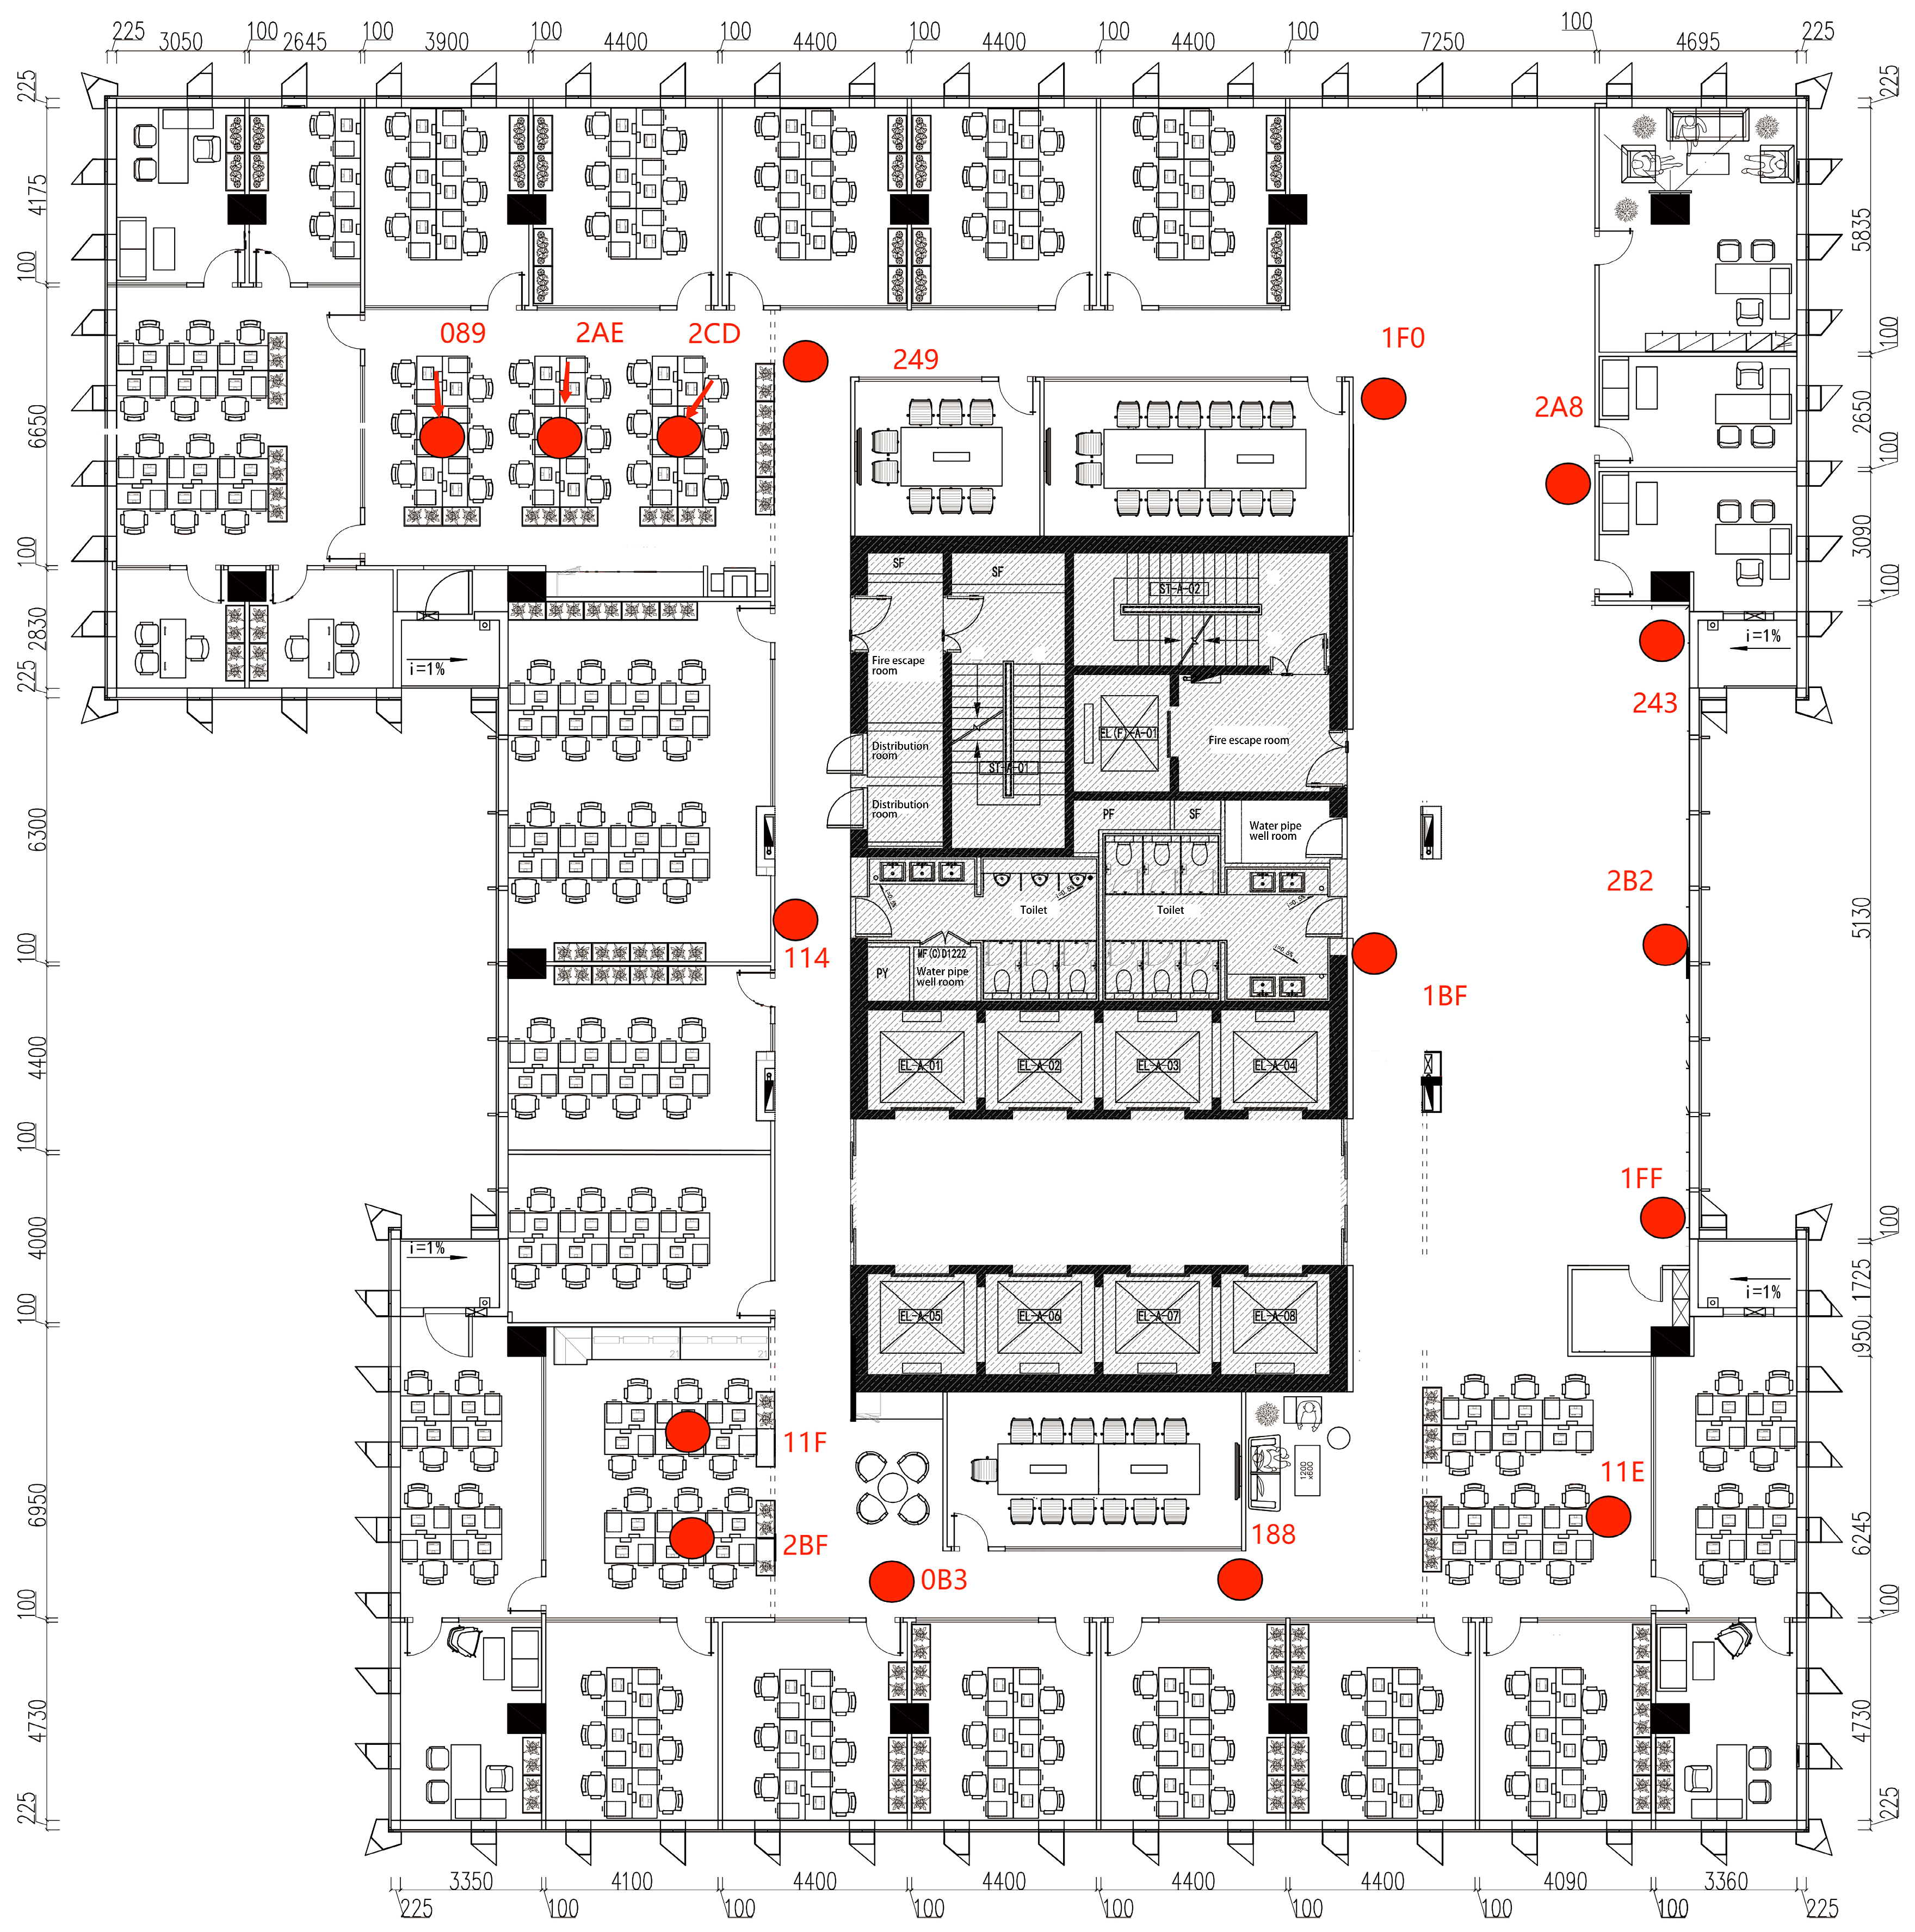
On the experimental floor, energy use is dominated by the lighting and air-conditioning systems. The studied area is served by 29 split air-conditioning units and 97 luminaires in total. This study concentrates on the open-plan zones of the floor, including corridors, the pantry, open office areas and an exhibition space. Staff working in these open areas follow relatively flexible schedules; therefore, an intelligent building environmental control system that detects occupant presence is particularly suitable for reducing unnecessary operation and achieving energy savings. During the entire experimental period, the composition of the office staff and their general working patterns remained essentially unchanged. The layout of the empirical study area (the 14th floor) and the locations of the sensors and controllers of the intelligent control system are illustrated in Figure 2.
Figure 2.
The layout of the empirical study area and the locations of the sensors of the intelligent control system (the red dots represent the radar).
Since November 2021, the 14th floor has been equipped with an intelligent building environmental control system. The system integrates a set of distributed sensors [27] and actuators linked through wireless communication and edge-computing gateways [28]. Table 1 summarizes the main components and their quantities.
Table 1.
The number of equipment arrangements in the experimental area site in this study.
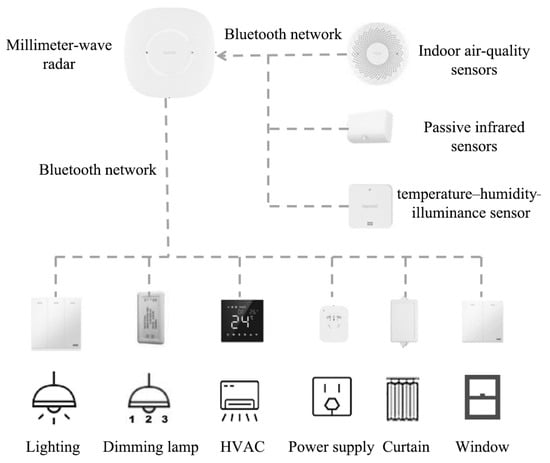
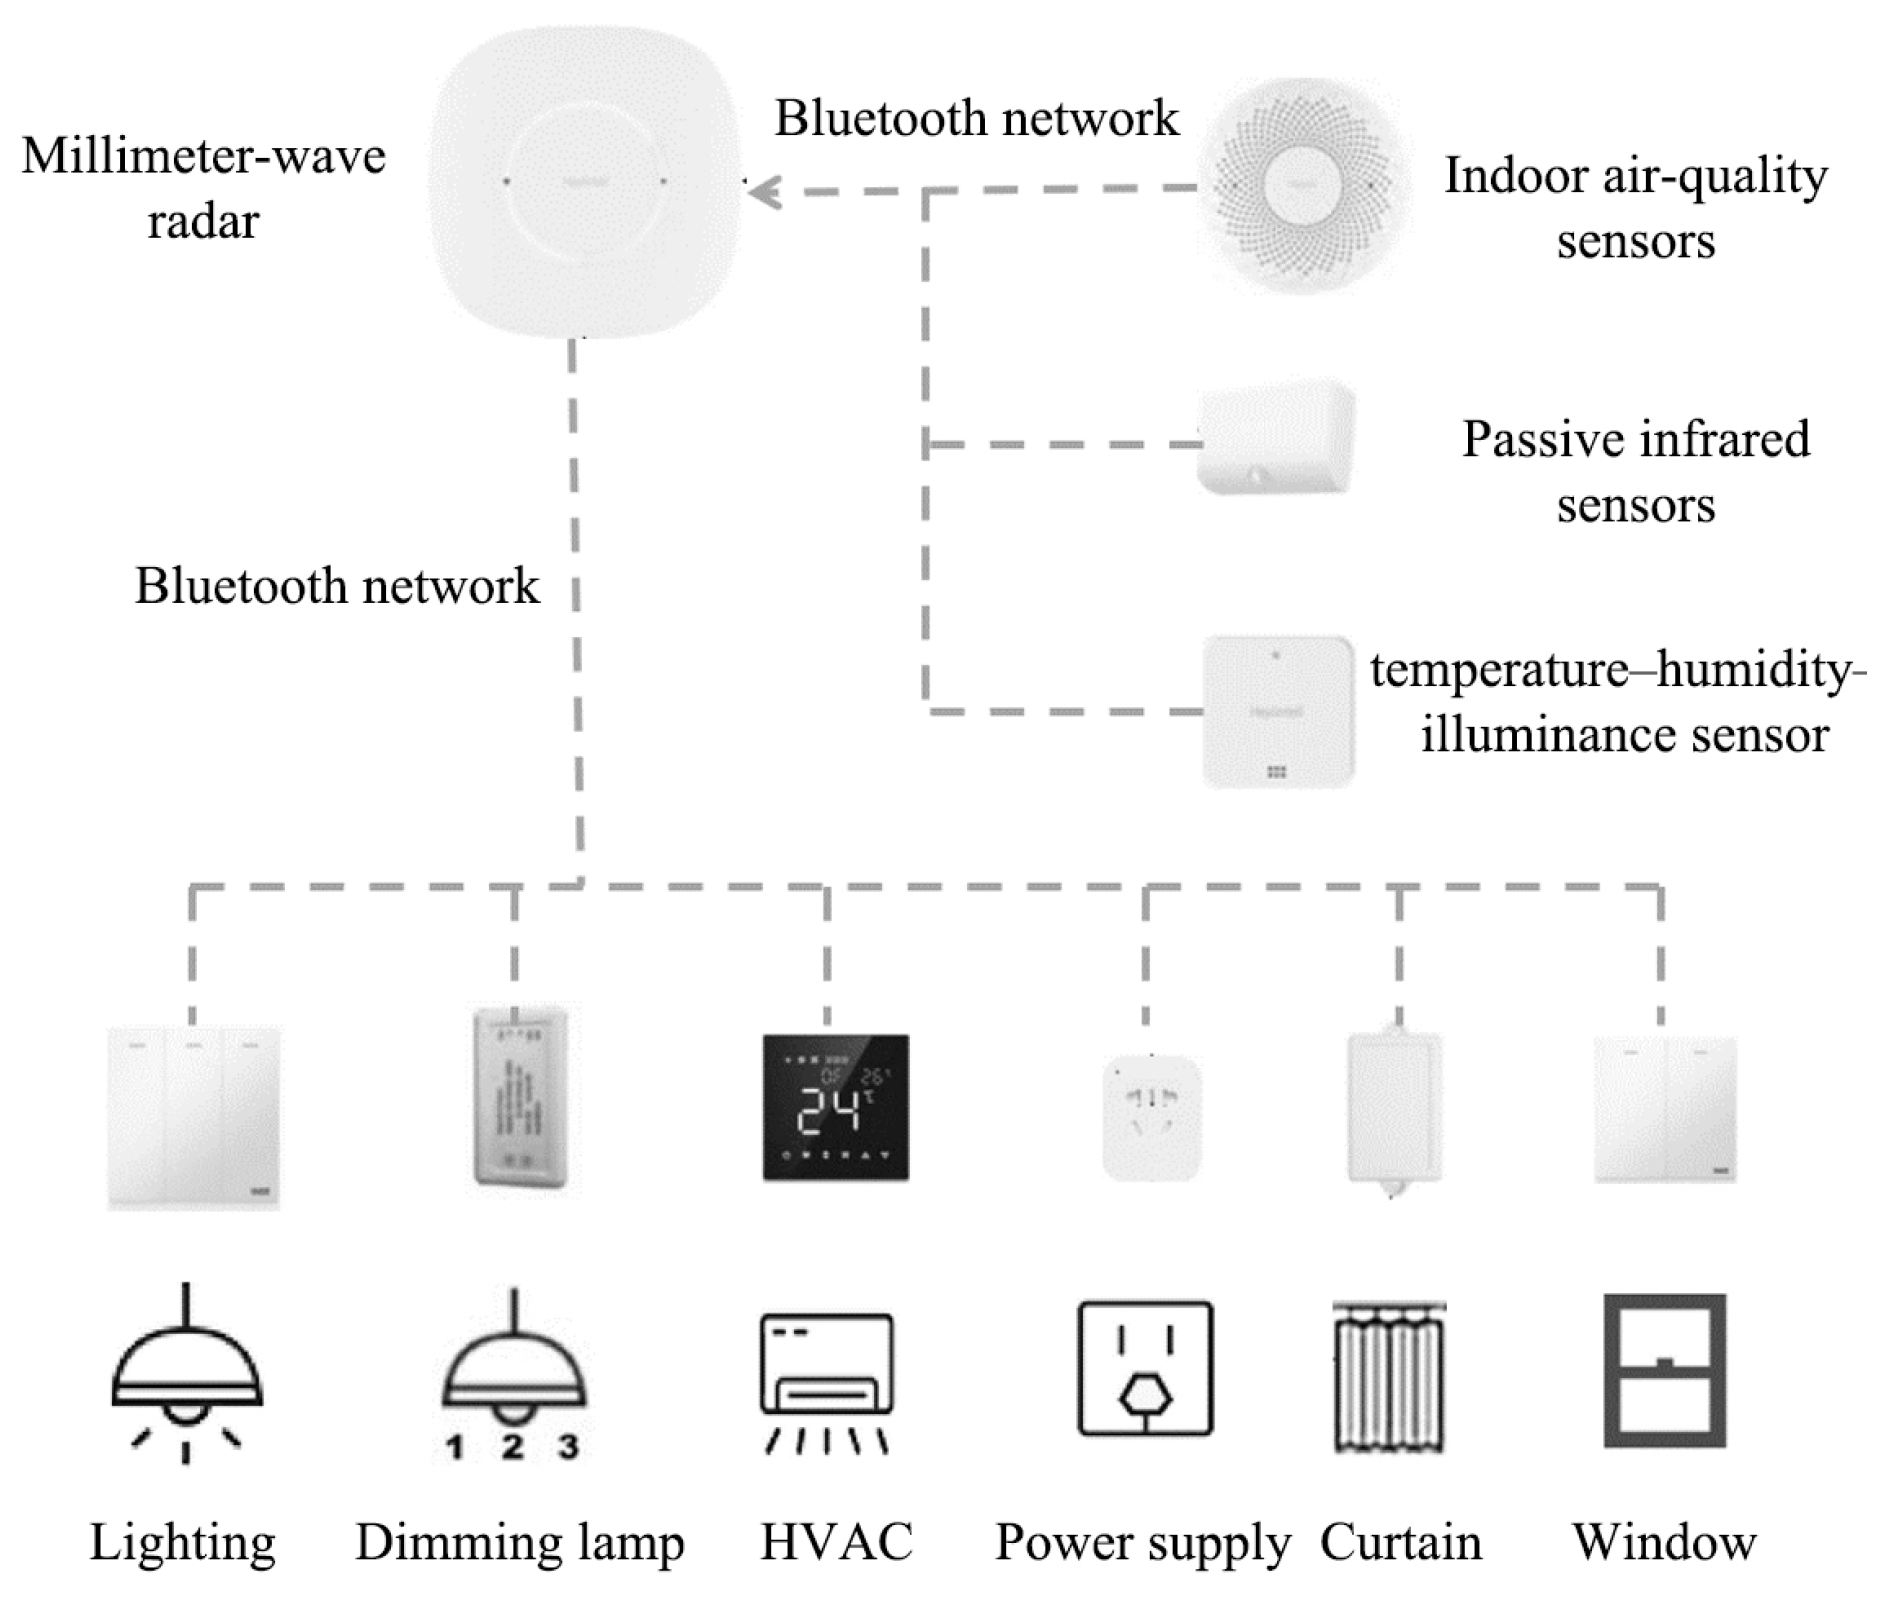
Figure 3 illustrates the overall architecture of the intelligent environmental control system, including sensor layer, control algorithms and actuation via smart switches.
Figure 3.
Architecture of energy-intelligent building environmental control system.
- Millimeter-wave radar gateways are deployed in offices, meeting rooms and public areas to detect occupant presence and movement, and to transmit the data to the control platform.
- Passive infrared (PIR) sensors are installed as auxiliary presence detectors, enhancing the robustness of occupant detection in conjunction with millimeter-wave radar.
- Indoor air-quality sensors monitor parameters such as CO2 concentration in selected zones.
- A temperature–humidity–illuminance sensor records environmental conditions, providing additional contextual information for system optimization.
- Smart switches and relays connect the luminaires and air-conditioning units to the intelligent control system, enabling automatic on/off control.
- A smart electricity meter records daily electricity consumption at the floor level.
The core control strategy is occupancy-based on/off control with a short delay. When occupancy is detected in a given zone, the corresponding lighting and associated air-conditioning equipment remain on or are switched on as needed [29]. When no occupancy is detected for a defined period (five minutes in this experiment), the system automatically switches off the lighting and air-conditioning in that zone. This logic targets unnecessary operation in unoccupied spaces while maintaining comfort during occupied periods.
In many energy-intelligent building systems, passive infrared (PIR) sensors are widely used for occupancy detection; however, their performance can be limited in terms of detection range and accuracy [30], which may lead to false detections and, consequently, occupant dissatisfaction [31]. In the present system, a hybrid sensing approach combining mmWave radar and PIR sensors is adopted as an optimization strategy. This combination enables more reliable tracking of occupant movement and, in turn, supports more precise control of the wireless smart switches in response to observed movement patterns [32].
2.2. Experimental Design
To rigorously evaluate the energy-saving potential performance of the intelligent control system and refine its strategies, an A-B-A experimental design was implemented over three consecutive months in summer 2022 (July–September). To interpret monthly differences cautiously, we assume that, apart from the intervention, other conditions affecting runtime evolve smoothly over time. Under this condition, any statistically significant divergence between the two groups observed after the intervention can be attributed to the true effect of the energy-intelligent control system, thereby reducing the likelihood that the results are driven by other confounding factors [33]. The timeline is as follows and indicated in Figure 4:
Figure 4.
The “A-B-A” experimental design process applied in this empirical study.
- A1 phase (July 2022): Energy-intelligent building environmental control system operating normally. Runtime data for lighting and air-conditioning equipment on the 14th floor are collected as the first experimental group.
- B phase (August 2022): On the morning of 2 August, the intelligent control algorithms are disabled without notifying occupants, and the system reverts to manual control for one month. Device runtime data are collected as the control group.
- A2 phase (September 2022): The intelligent control algorithms are reactivated and run for one month; runtime data are collected as the second experimental group.
The total duration of the experiment is 92 days, covering July, August and September 2022. To ensure comparability across months, data analysis focuses on periods from Monday to Friday that represent normal working weeks. In each month, four groups of weekdays and three groups of weekend days are included, resulting in a balanced dataset across the three phases. During the entire experiment, the composition of staff and their nominal working hours remained essentially unchanged.
This A-B-A configuration allows July (A1) and September (A2) to serve as two independent baseline months under intelligent control, bracketing the manual-control month of August (B). Comparing A1 vs. B and A2 vs. B helps to separate the impact of intelligent control from temporal and behavioral confounds [33].
2.3. Data Collection and Statistical Analysis
Due to data access restrictions and user privacy requirements of the building operator, detailed smart-meter electricity data were not available to the authors. Therefore, this study used the on/off states and cumulative operating time of the controlled equipment as the primary measurable outcomes. The reported reduction ratios should be interpreted as reductions in equipment runtime and as runtime-based energy-saving potential, rather than as directly measured electricity savings. The intelligent system records the on/off state and cumulative running time of each controlled lighting and air-conditioning unit via the smart switches. For this study, equipment running time is adopted as the primary indicator, under the assumption that each device has a relatively constant power rating during operation. This allows runtime to serve as a proxy for energy consumption, which is appropriate when detailed circuit-level metering is not available.
Two types of indicators are derived:
- Daily average runtime per device (hours per day per unit), computed separately for lighting and air-conditioning in each phase.
- Monthly cumulative runtime (hours), summing up the total operating time of all controlled lighting or air-conditioning units in each month.
In addition, the total runtimes for weekdays and weekends are calculated separately for each phase, enabling a more detailed analysis of behavioral patterns and energy-saving potential mechanisms.
To characterize climatic context and potential weather-related confounding factors, monthly values of mean, maximum and minimum outdoor temperature, sunshine hours, relative humidity and number of rain days for Shenzhen in July–September 2022 were obtained from the local meteorological bureau. These data are used qualitatively in the discussion to interpret the robustness of the findings.
3. Results
3.1. Daily Runtime Trends
The intelligent building environmental control system substantially reduced the daily average runtime per device for both lighting and air-conditioning.
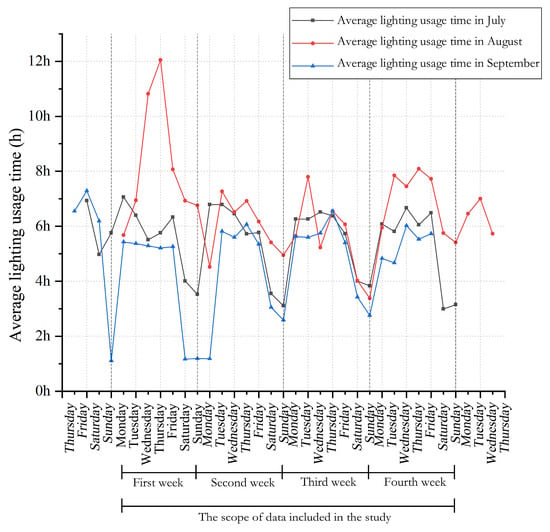
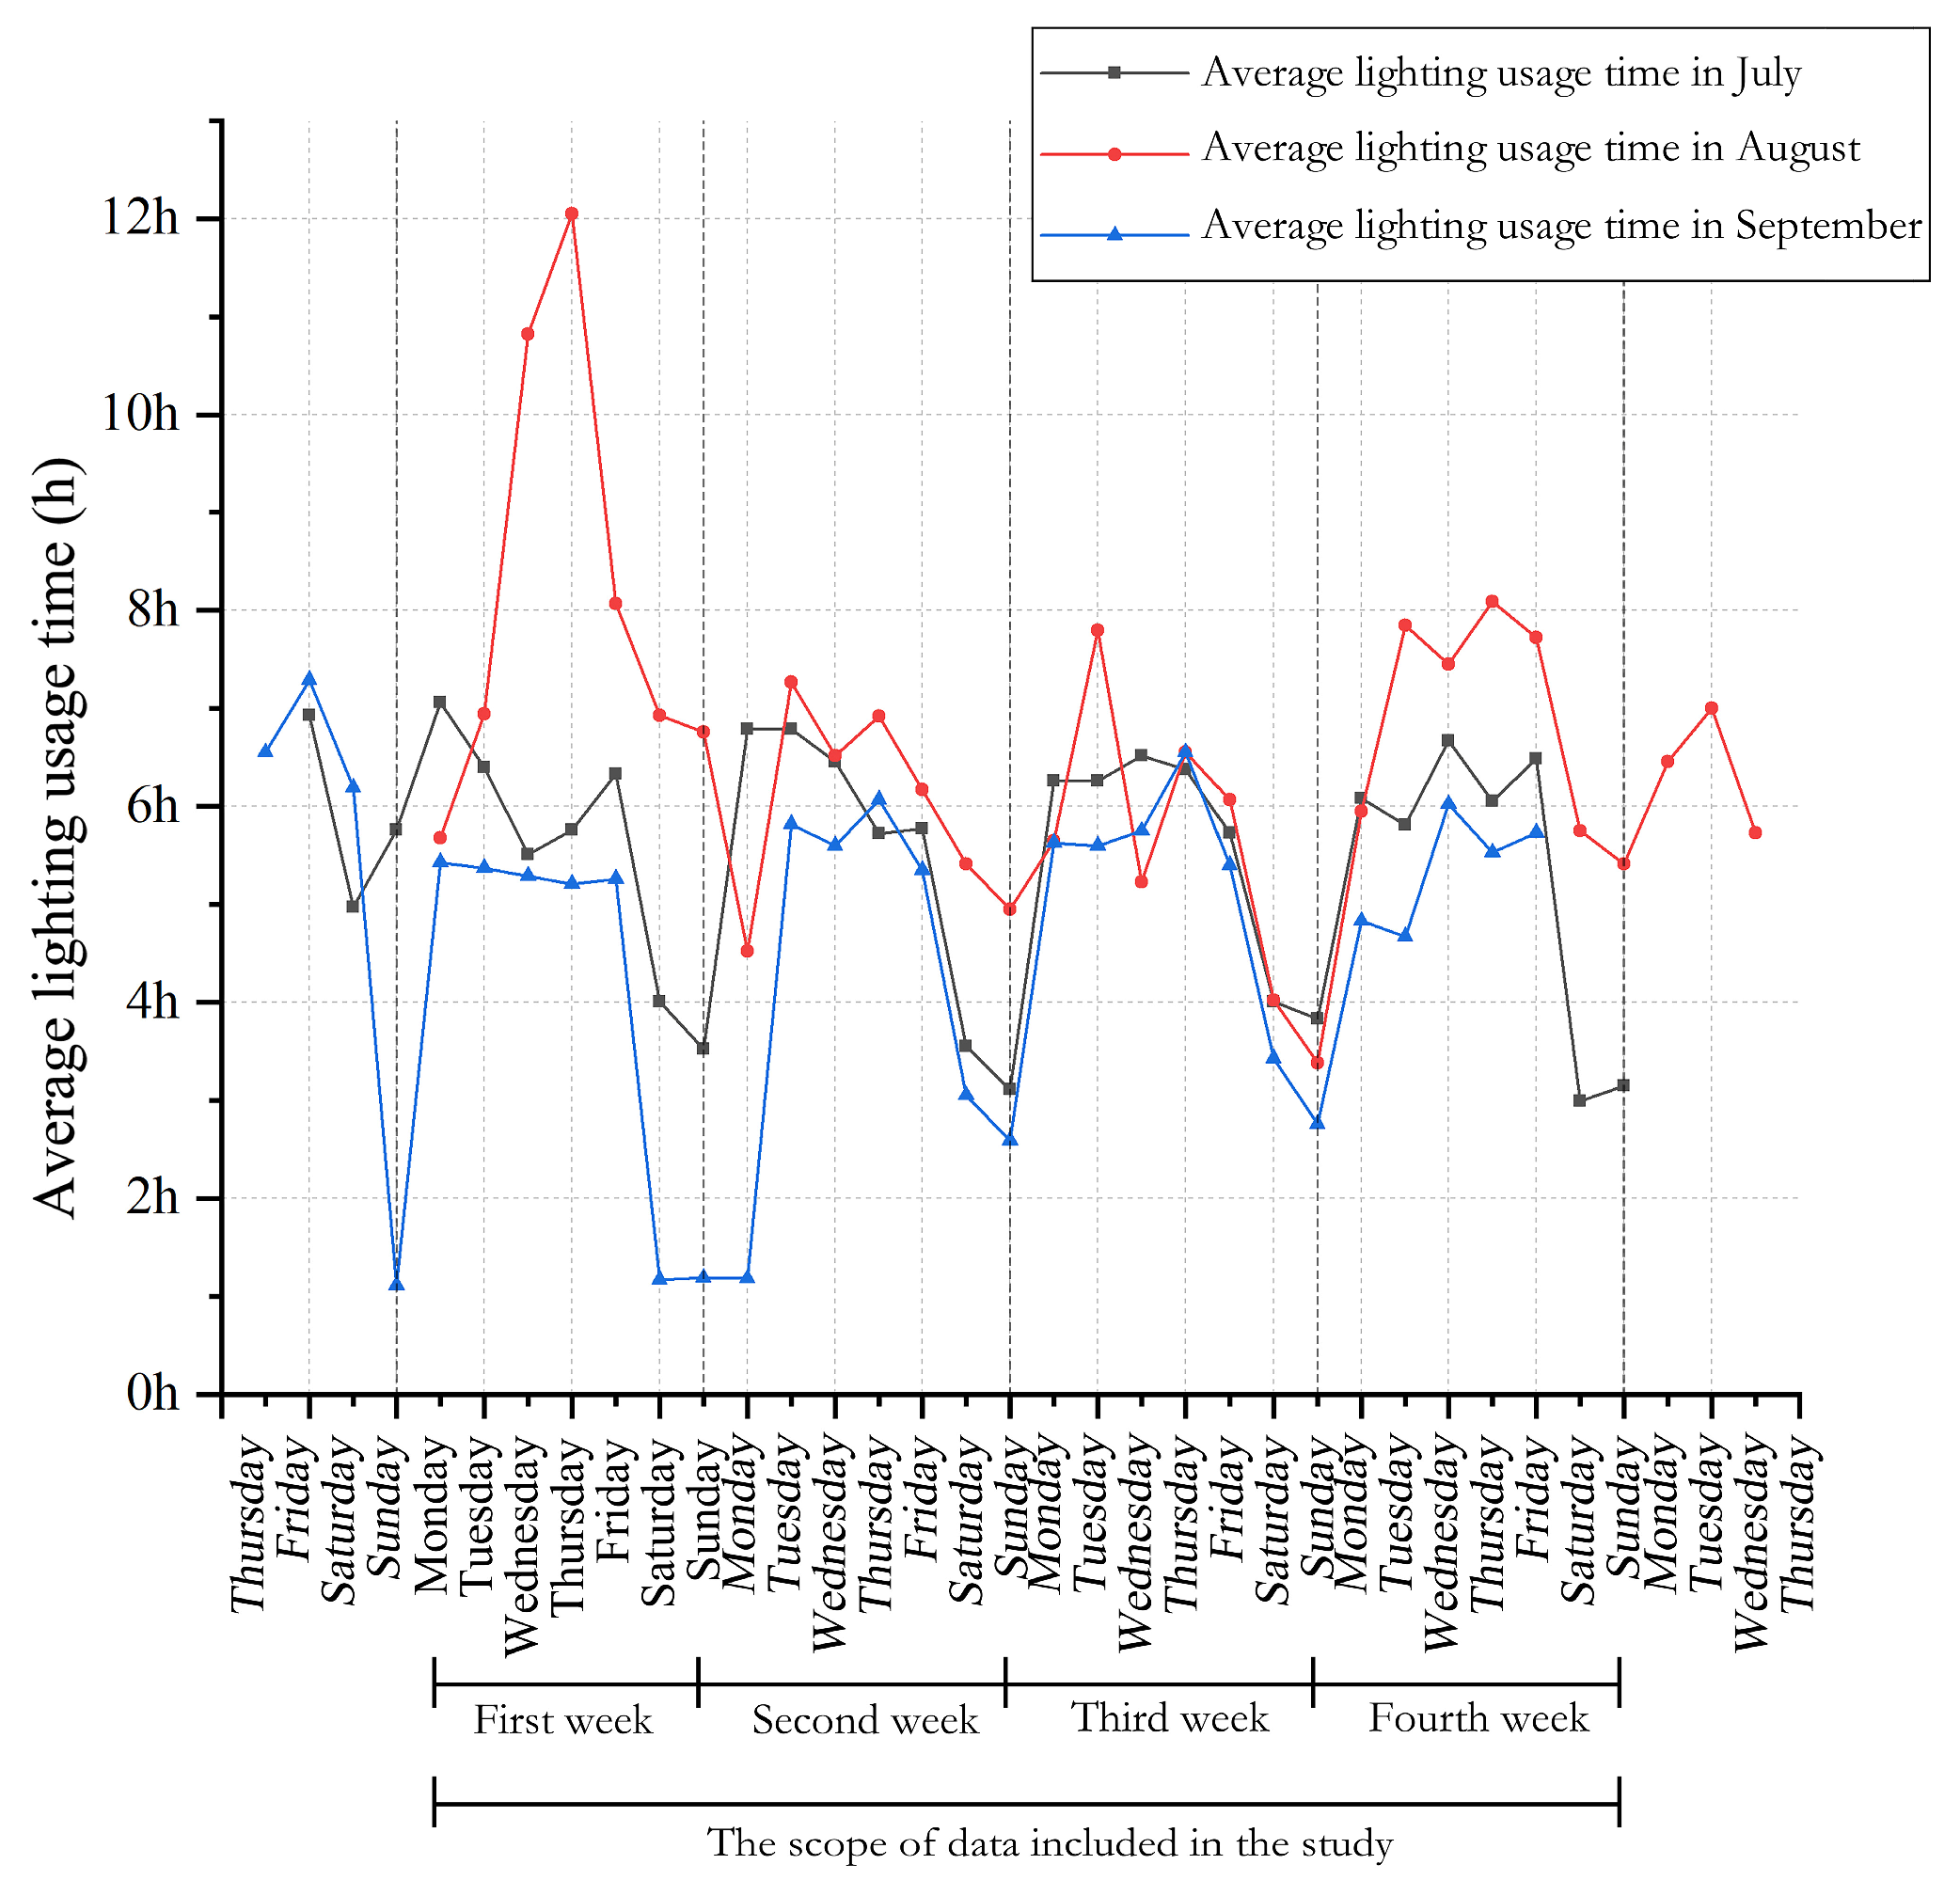
For lighting, the daily runtime per luminaire in July (A1) typically ranged from 3 to 7 h, whereas in August (B) under manual control it ranged from 4 to 8 h. The mean daily runtime per luminaire was 5.59 h in July and 6.76 h in August, representing a reduction of 1.17 h/day under intelligent control. In September (A2), the daily lighting runtime per device ranged from 1 to 7 h, again lower than the 4–8 h range observed in August. The mean daily runtime per luminaire was 4.60 h in September, which is 2.16 h/day shorter than in August. The trend can be observed in Figure 5.
Figure 5.
The trend chart of the average operating time of the lighting equipment obtained from this empirical study.
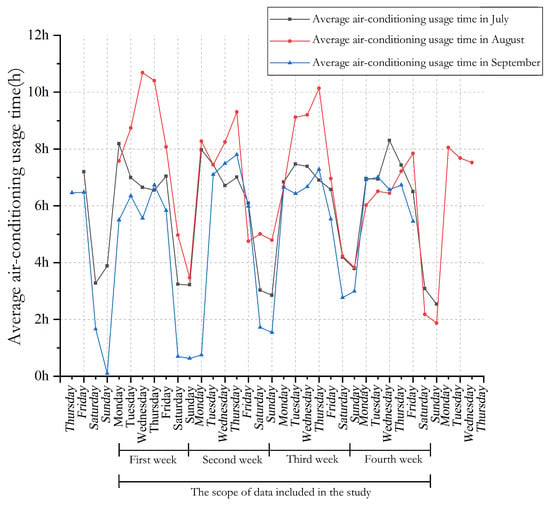
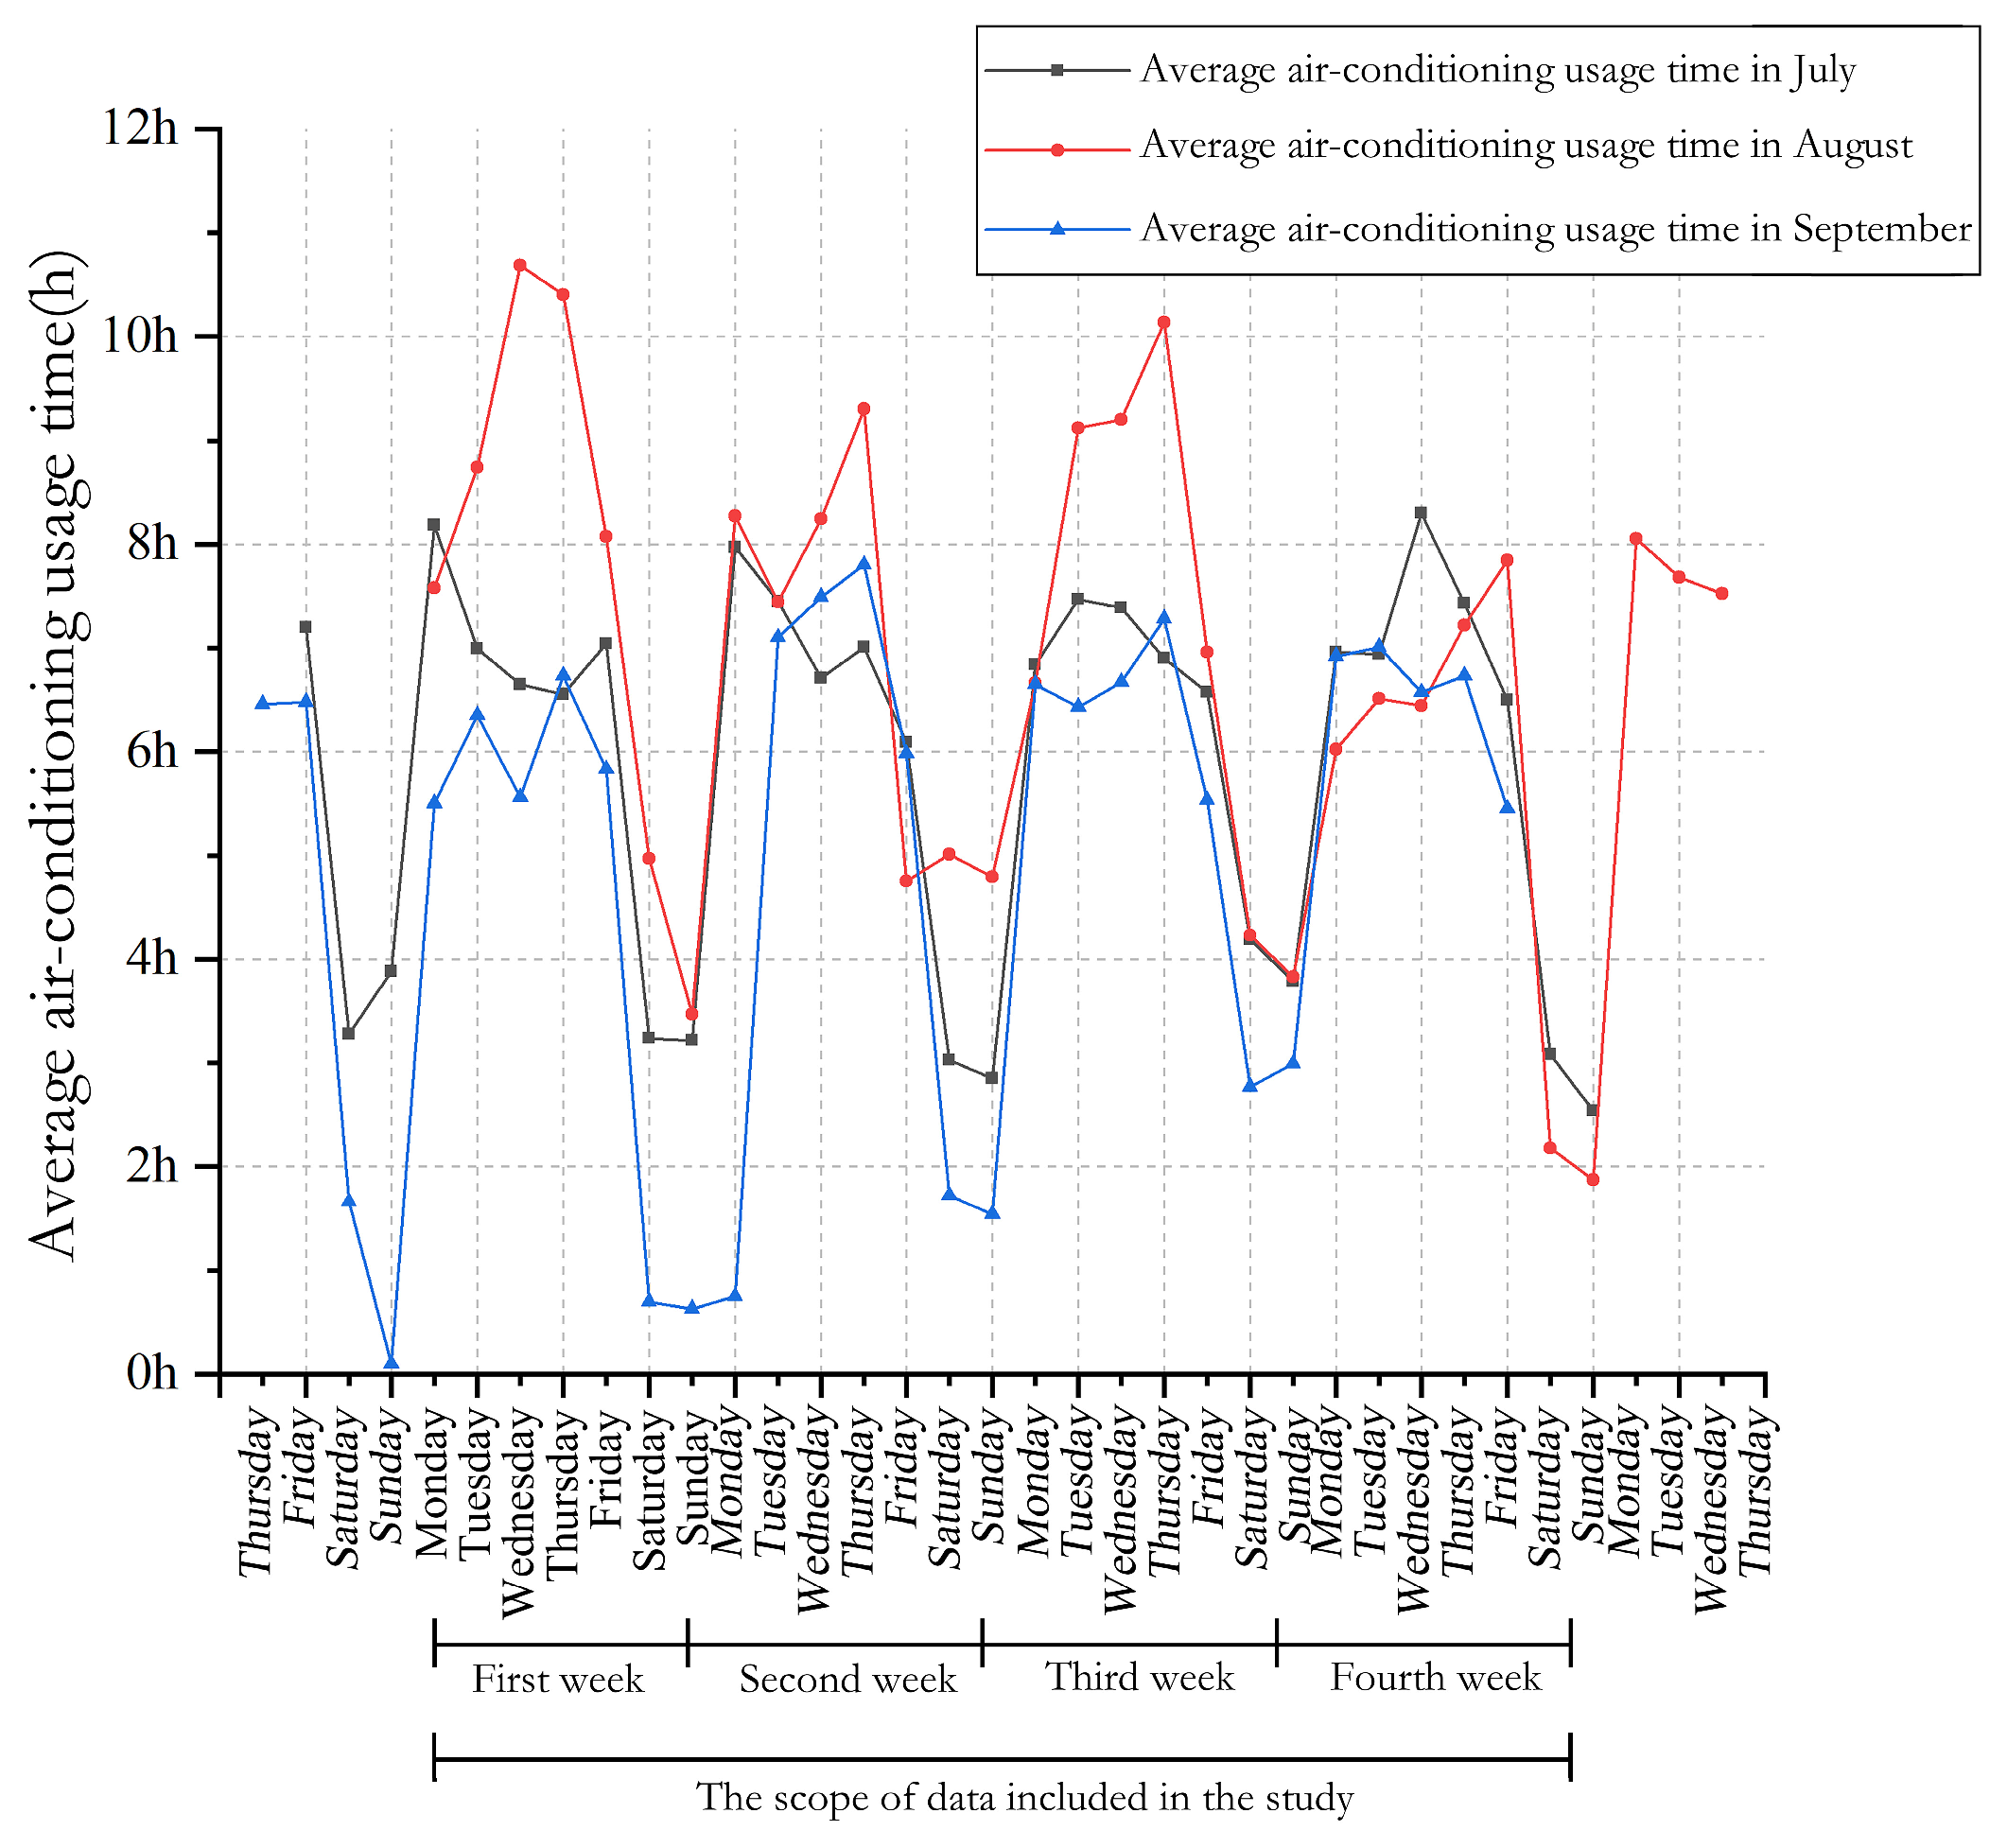
For air-conditioning, the daily runtime per unit in July (A1) ranged from 3 to 10 h, compared with 4–10 h in August. The mean daily runtime per air-conditioning unit was 6.16 h in July and 7.13 h in August, a reduction of 0.97 h/day under intelligent control. In September (A2), the mean daily runtime per air-conditioning unit further decreased to 5.17 h, which is 1.97 h/day shorter than in August. The trend can be observed in Figure 6.
Figure 6.
The trend chart of the average operating time of air-conditioning equipment obtained from this empirical study.
3.2. Statistical Significance of Differences (Paired t-Tests)
To compare equipment runtime between the control-active and manual-control phases, a matched-day paired comparison was conducted. The paired structure was defined using the common analytical window shared by the three phases. Specifically, 25 daily observations were aligned by day position and weekday/weekend sequence, and paired comparisons were then performed for July versus August and September versus August. July and September represented the two control-active phases, whereas August represented the manual-control phase. This pairing strategy was used to reduce the influence of weekday/weekend scheduling differences, but it should be interpreted as a matched-day comparison rather than a true repeated-measures design under identical external conditions.
Paired-sample t-tests were first used to examine whether daily equipment runtime differed between each control-active phase and the manual-control phase (Table 2). For lighting, the mean daily runtime was 5.59 h per unit in July and 6.76 h per unit in August, corresponding to a mean paired difference of −1.17 h per unit. This difference was statistically significant, t(24) = −3.11, p = 0.0047. The September lighting runtime was further reduced to 4.60 h per unit, with a mean paired difference of −2.16 h per unit relative to August, t(24) = −5.52, p < 0.001. However, because significant Ljung–Box autocorrelation was detected for this comparison, the paired t-test result for the September–August lighting comparison should be interpreted with caution.
Table 2.
The results of paired-sample t-tests on daily average runtime.
A similar pattern was observed for air-conditioning runtime. The mean daily air-conditioning runtime was 6.16 h per unit in July and 7.13 h per unit in August, giving a mean paired difference of −0.97 h per unit, t(24) = −3.20, p = 0.0038. In September, the mean air-conditioning runtime was 5.17 h per unit, corresponding to a mean paired difference of −1.97 h per unit relative to August, t(24) = −4.90, p < 0.001.
To further examine whether the reduction was consistent across the two control-active phases, the average runtime of July and September was compared with August. The mean lighting runtime across the two control-active months was 5.10 h per unit, compared with 6.76 h per unit in August, indicating an average paired reduction of −1.67 h per unit. The mean air-conditioning runtime across the two control-active months was 5.67 h per unit, compared with 7.13 h per unit in August, indicating an average paired reduction of −1.47 h per unit. These results suggest that both lighting and air-conditioning operated for shorter periods during the control-active phases than during the manual-control phase.
Assumption diagnostics were also conducted for the paired differences. Shapiro–Wilk tests indicated that most paired differences did not significantly deviate from normality, although the September–August lighting difference and the averaged control-active lighting difference showed evidence of non-normality. Autocorrelation diagnostics further suggested that the September–August lighting comparison may contain serial dependence.
Most paired comparisons support statistically significant runtime reductions. However, the September–August lighting comparison should be interpreted with caution because significant serial autocorrelation was detected in the paired differences.
3.3. Monthly Cumulative Runtime and Overall Energy-Saving Potential Ratios
Using monthly cumulative runtime as a proxy for energy use, the intelligent control system achieved substantial overall energy-saving potential for both lighting and air-conditioning.
For lighting (Figure 7):
Figure 7.
The cumulative operating time trend chart of the lighting equipment obtained from this empirical study.
- In July (A1), the total monthly runtime of all controlled luminaires was 12,349.88 h, compared with 15,881.38 h during August (B). This corresponds to a 22.24% reduction in lighting runtime.
- In September (A2), total lighting runtime was 11,160.78 h, compared with 15,881.38 h in August, yielding a 29.72% reduction.
Combining the two intelligent-control months (A1 and A2) relative to the manual-control month (B), the average lighting runtime reduction is approximately 25.98% (lighting: 22.24% + 29.72%/2 ≈ 25.98%).
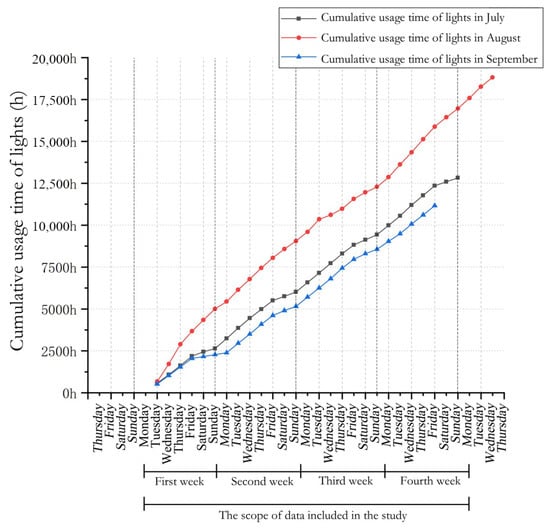
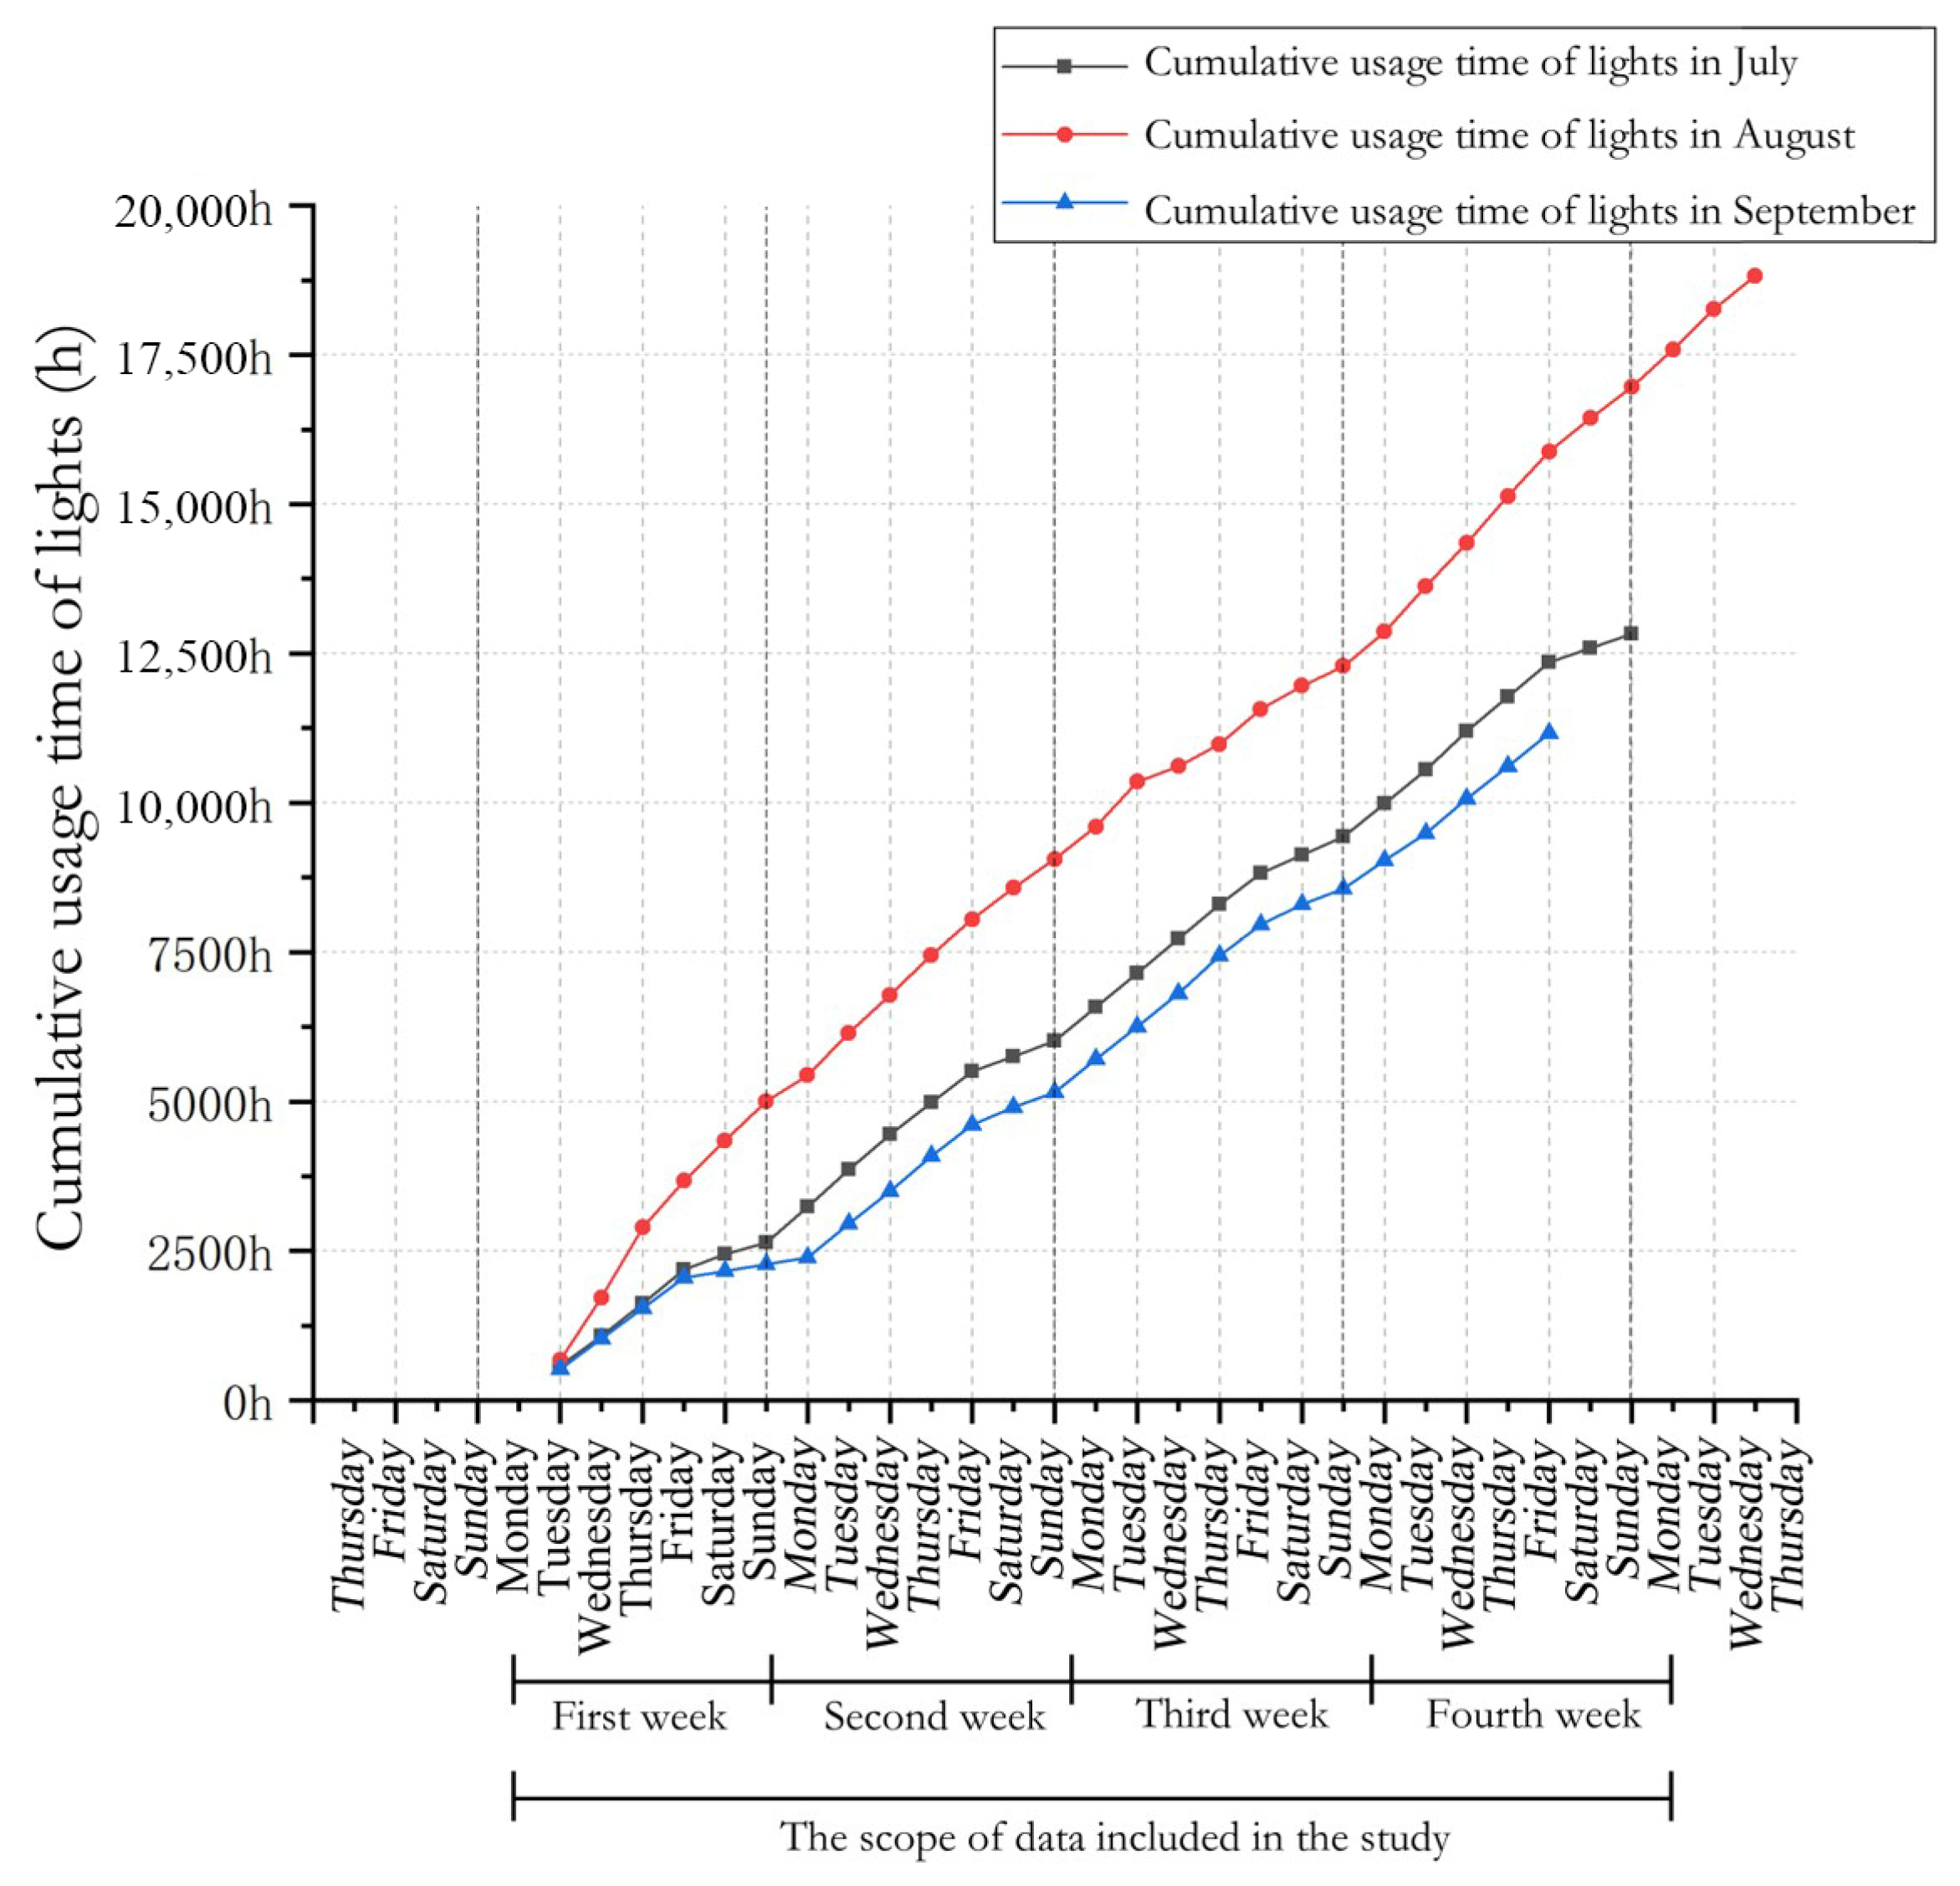
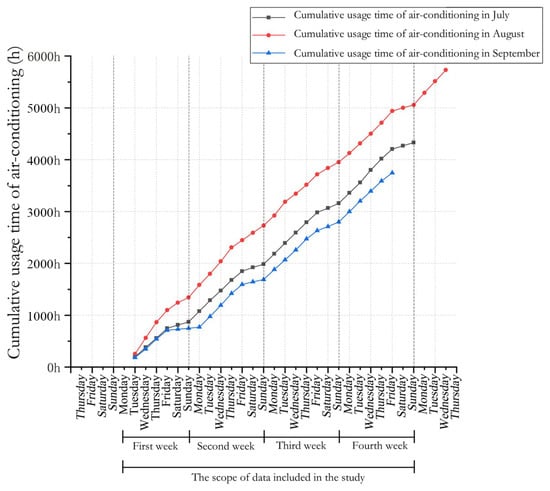
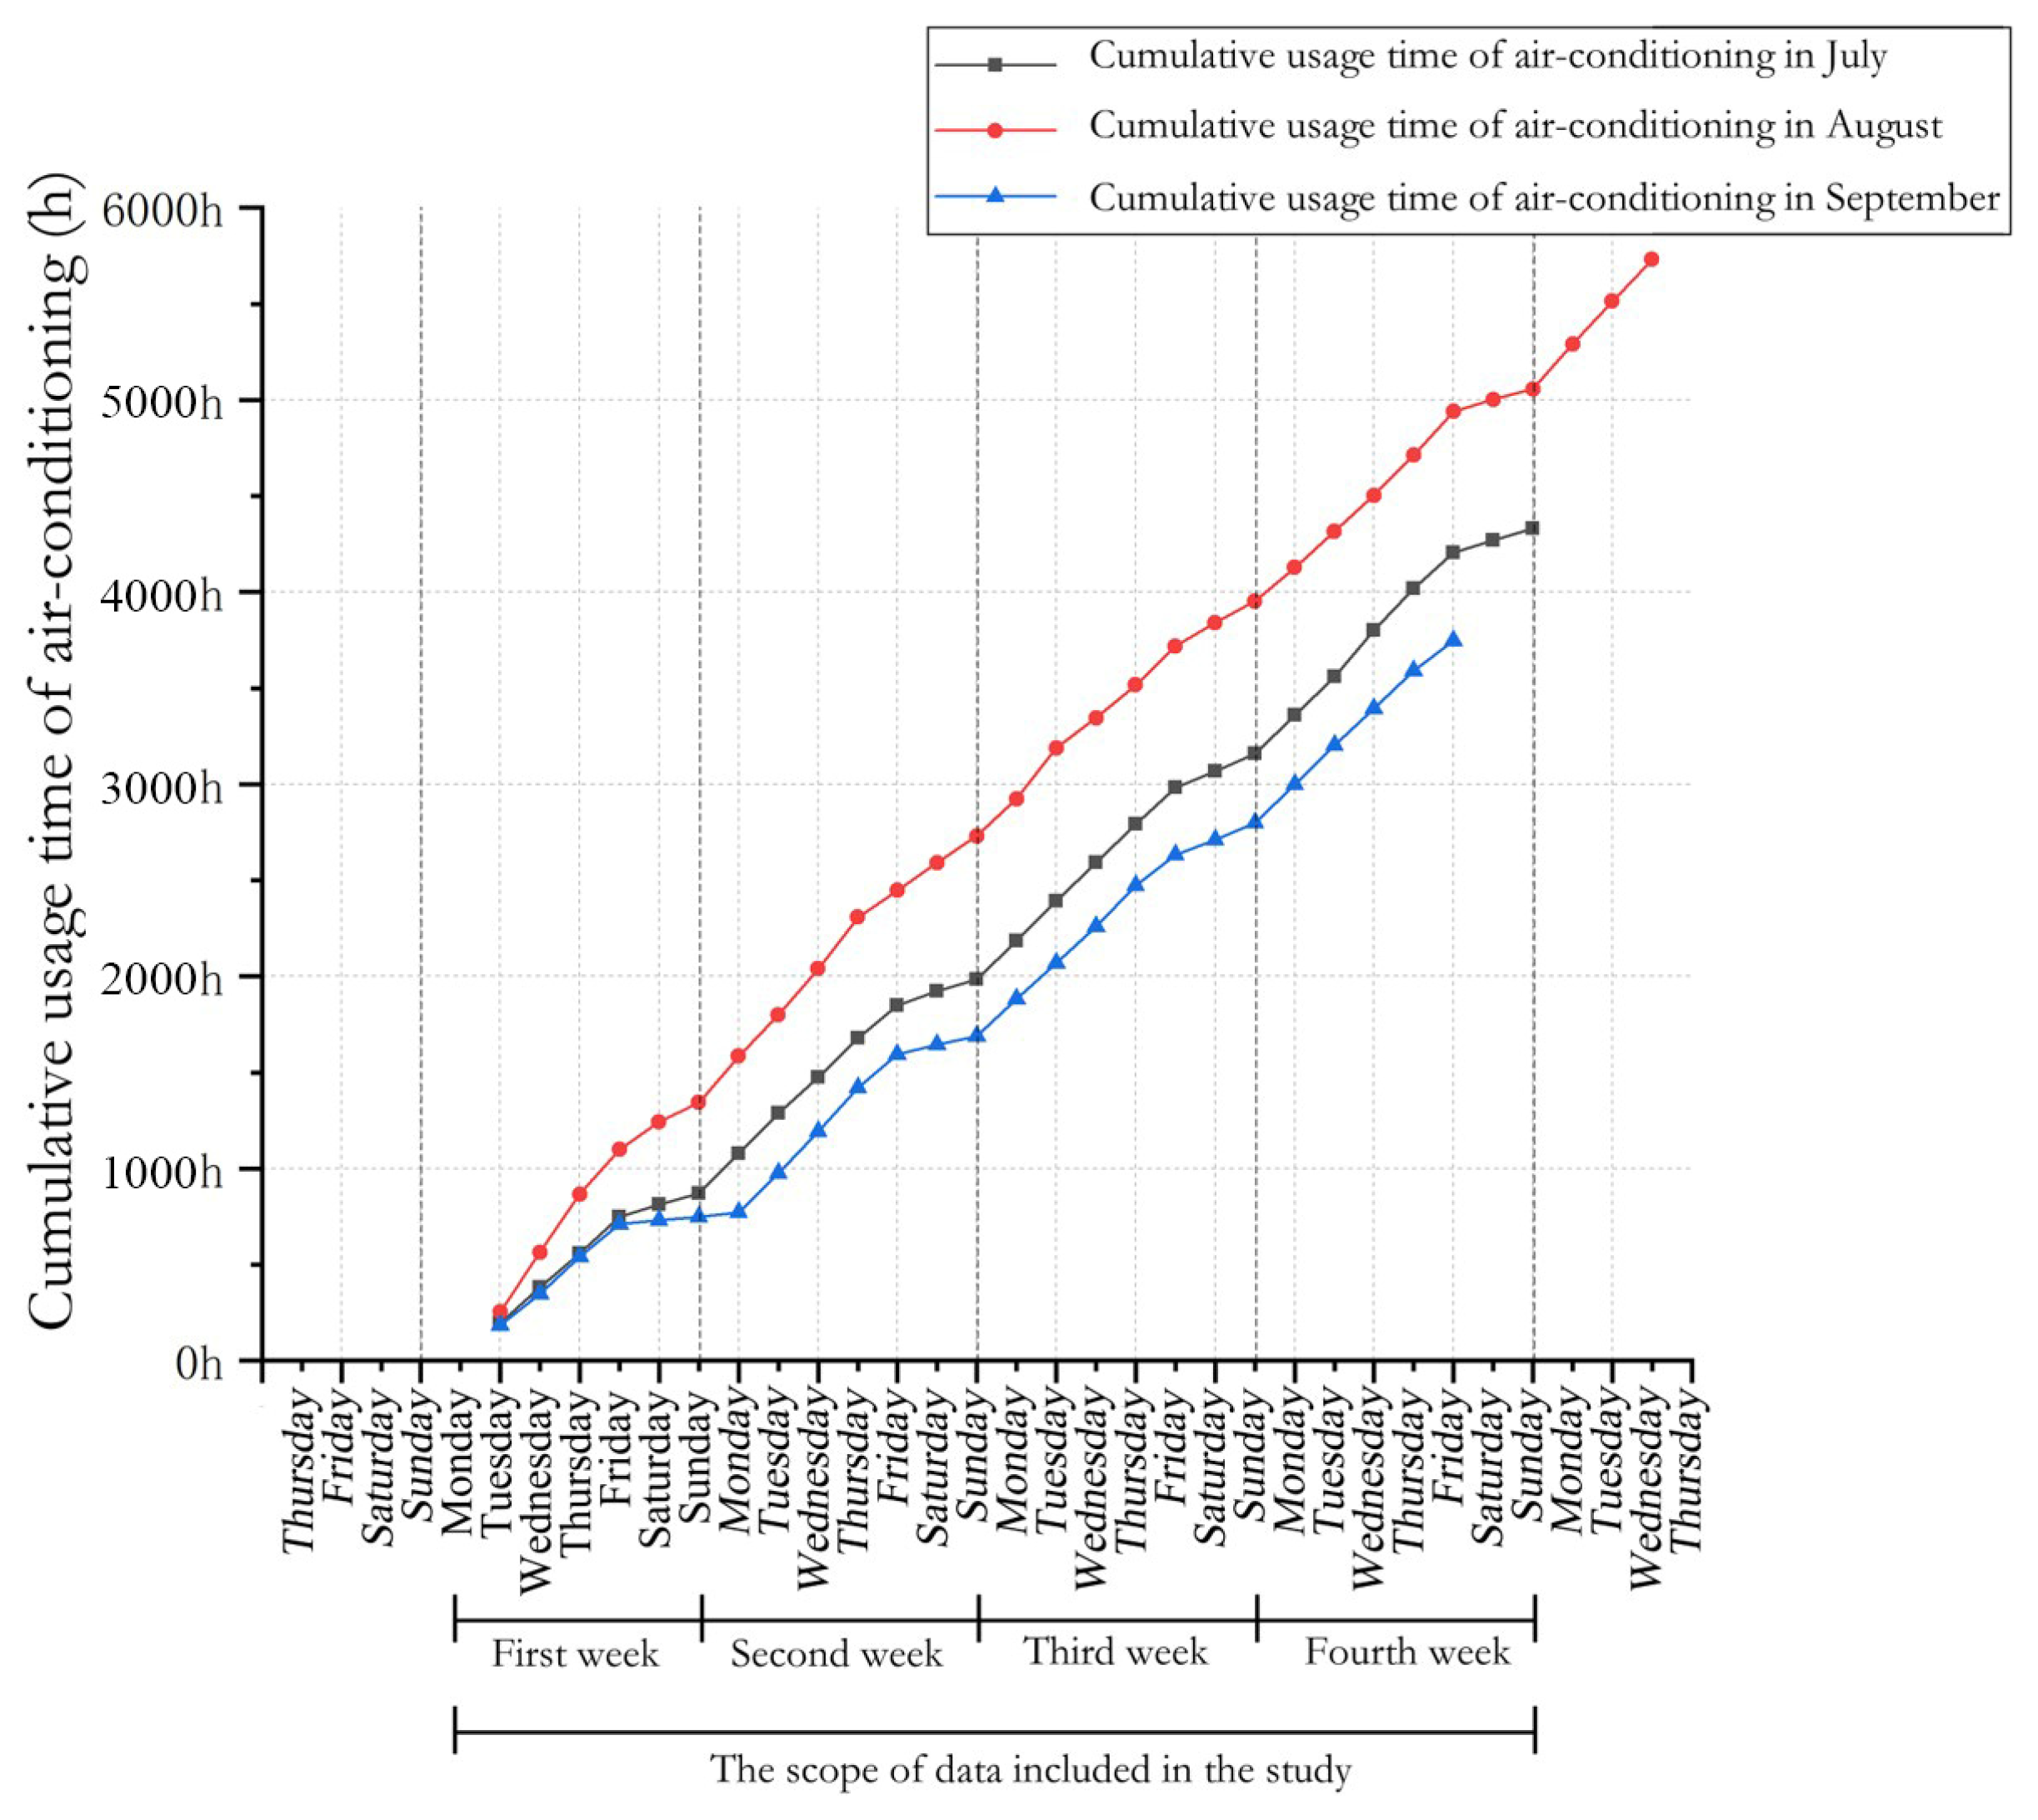
For air-conditioning (Figure 8):
Figure 8.
The trend chart of the cumulative operating time of the air-conditioning equipment obtained from this empirical study.
- In July (A1), total monthly runtime of all air-conditioning units was 4204.94 h, compared with 4938.83 h in August (B), representing a 14.86% reduction.
- In September (A2), total air-conditioning runtime was 3746.76 h, versus 4938.83 h in August, a 24.14% reduction.
Combining the two intelligent-control months (A1 and A2) relative to the manual-control month (B), the average air-conditioning runtime reduction is approximately 19.50% (air-conditioning: 14.86% + 24.14%/2 ≈ 19.50%).
Taken together, these results indicate that the intelligent building environmental control system can reliably deliver 20–26% reductions in operating time for lighting and air-conditioning in this office floor under real working conditions.
3.4. Weekday Versus Weekend Performance
Because work schedules and occupant presence patterns differ between weekdays and weekends, the energy-saving potential was further analyzed separately for weekday and weekend periods.
For weekdays, in July (A1), the cumulative weekday lighting runtime was 10,784.27 h, compared with 12,830.47 h in August (B), a 15.95% reduction. Weekday air-conditioning runtime was 3772.16 h in July vs. 4176.39 h in August, a 9.68% reduction. In September (A2), weekday lighting runtime was 9783.30 h vs. 12,830.47 h in August, a 23.75% reduction. Weekday air-conditioning runtime was 3446.62 h vs. 4176.39 h in August, a 17.47% reduction. Aggregating across the two intelligent-control months, the weekday lighting energy-saving potential is 19.85%, and weekday air-conditioning energy-saving potential is 13.58%.
For weekends, in July (A1), weekend lighting runtime was 1565.61 h, compared to 3050.91 h in August (B), a 48.68% reduction. Weekend air-conditioning runtime was 432.78 h in July vs. 762.44 h in August, a 43.24% reduction. In September (A2), weekend lighting runtime was 1377.48 h vs. 3050.91 h in August, a 54.85% reduction. Weekend air-conditioning runtime was 300.14 h vs. 762.44 h in August, a 60.63% reduction. Overall, weekend lighting energy-saving potential reached 51.77%, and weekend air-conditioning energy-saving potential reached 51.94%.
The much larger savings on weekends indicate that, under manual control, a substantial amount of equipment remains on in unoccupied spaces due to “forgotten-on” behavior. The intelligent system effectively eliminated this waste by automatically switching off lights and air-conditioning after detecting prolonged absence.
The larger weekend reductions are consistent with reduced unoccupied operation, including equipment that may have been left on under manual control. However, because individual switching behavior was not directly observed, “forgotten-on” equipment should be interpreted as a plausible inference rather than a directly measured mechanism.
3.5. Climatic Conditions During the Experiment
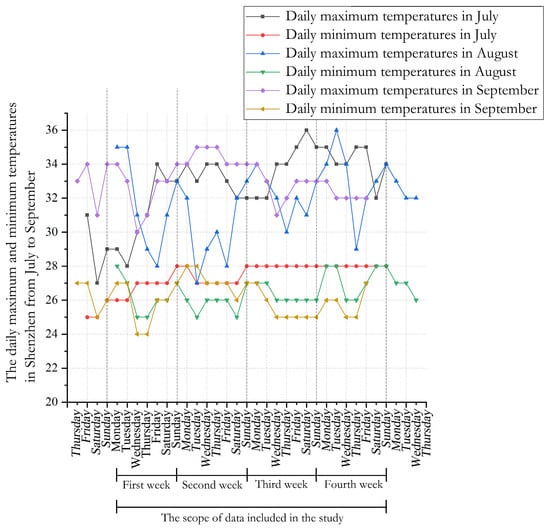
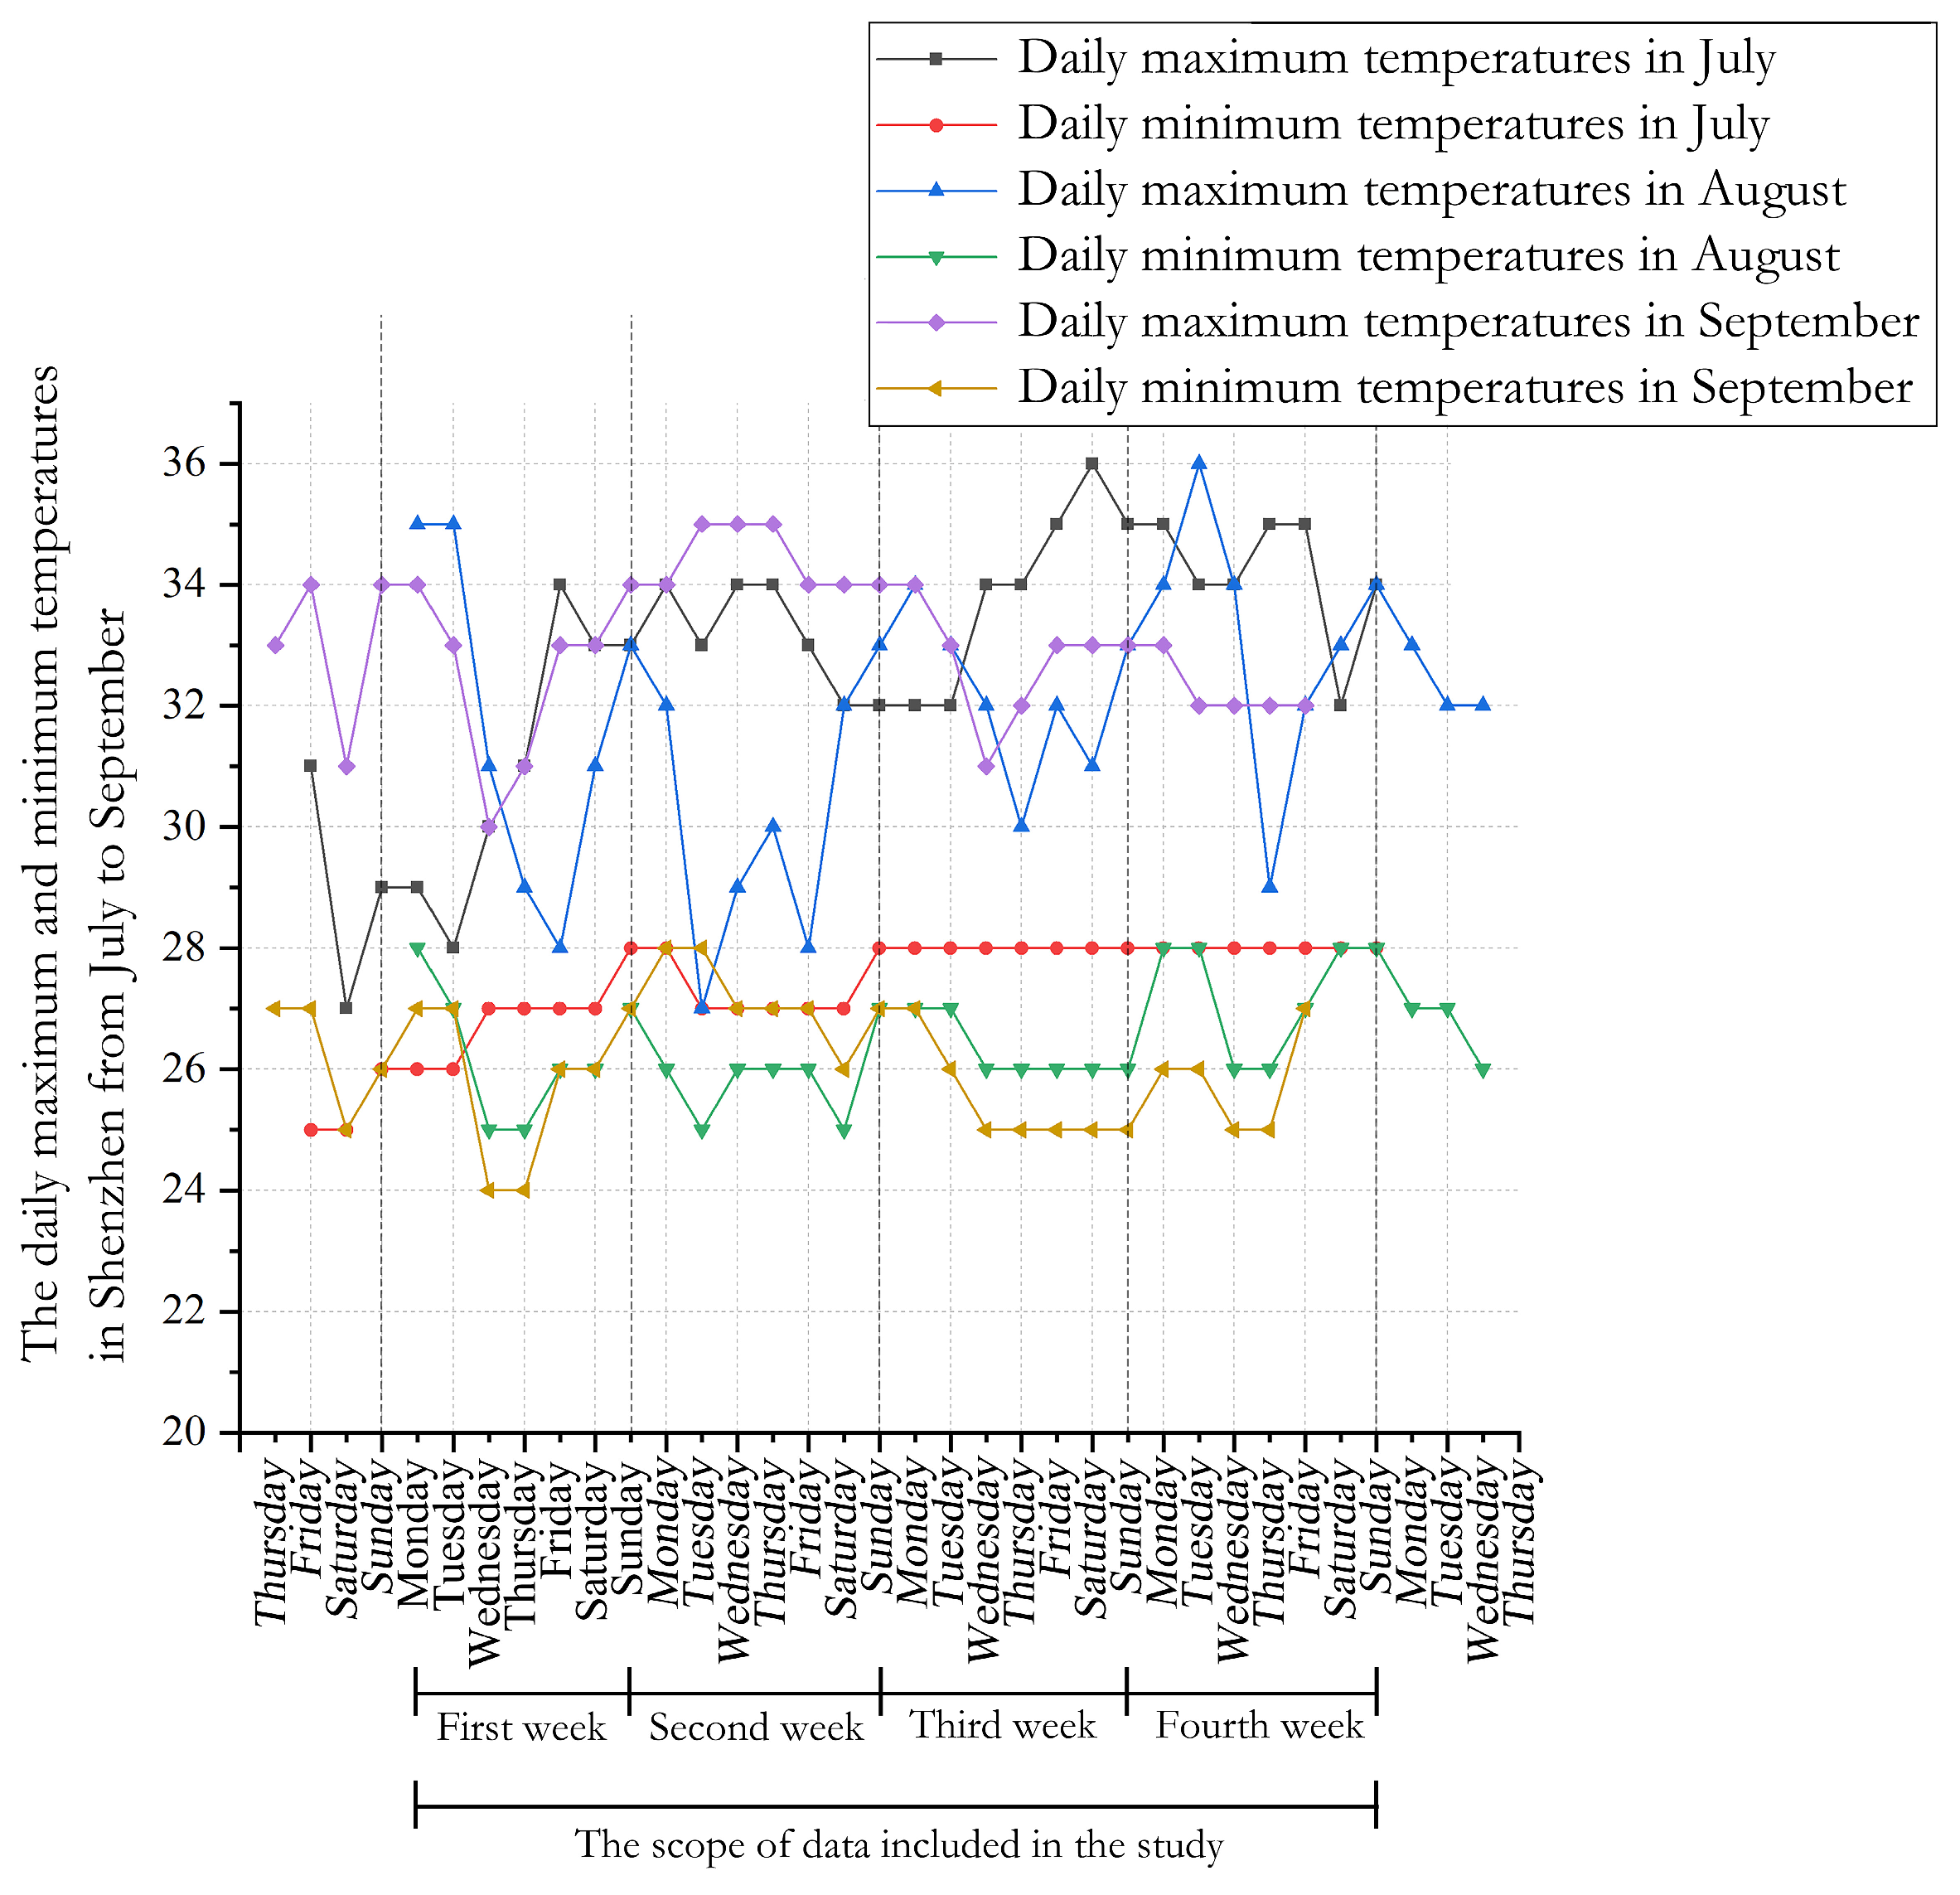
Table 3 and Figure 9 summarizes the outdoor climatic conditions in Shenzhen during July–September 2022. July and September were characterized by high mean temperatures (29.8 °C and 29.0 °C) and relatively long sunshine durations (216.1 h and 205.2 h), whereas August had a slightly lower mean temperature (28.4 °C), fewer sunshine hours (155.5 h) and a larger number of rain days (20 vs. 10 and 6 in July and September).
Table 3.
Climate conditions in Shenzhen for July, August and September 2022 (data source: Shenzhen Meteorological Bureau).
Figure 9.
Temperature trend chart for the highest and lowest temperatures in Shenzhen from July to September 2022 (data source: Shenzhen Meteorological Bureau).
These differences suggest that cooler and wetter conditions in August may have reduced cooling load demands relative to July and September. Consequently, the air-conditioning energy-saving potential estimated from runtime comparisons may be conservative: intelligent control in July and September was achieved under relatively more challenging climatic conditions.
To account for climatic variation across the A-B-A phases, a weather-adjusted analysis was conducted for air-conditioning runtime. Daily cooling-degree days were calculated from the available maximum and minimum outdoor temperatures using a 26 °C base temperature. Within the matched analytical window, the mean CDD26 values were 4.42 °C·day in July, 2.88 °C·day in August, and 3.52 °C·day in September, indicating that the manual-control phase in August had the lowest temperature-related cooling demand (Table 4). A regression model was then fitted with daily air-conditioning runtime as the dependent variable and control phase, CDD26, and weekend status as predictors. After adjustment, the estimated air-conditioning runtimes were 6.27 h/day/unit in July, 7.04 h/day/unit in August, and 5.16 h/day/unit in September. Compared with August, the adjusted runtime reductions were 10.9% in July and 26.7% in September, with an average reduction of 18.8% across the two control-active phases. These results indicate that the lower air-conditioning runtime during the occupancy-responsive control phases was not solely attributable to milder outdoor conditions. However, the findings should be interpreted as weather-adjusted runtime reductions rather than directly measured electricity savings.
Table 4.
Weather-adjusted analysis of air-conditioning runtime.
4. Discussion
4.1. Comparison with Previous Studies
Simulation studies of intelligent lighting and HVAC control frequently report high theoretical energy-saving potentials, often exceeding 40–50% for occupancy-based lighting control alone [8,9,15,16,34]. However, empirical studies conducted in real buildings typically find more modest savings, partly due to deviations from idealized behavioral and operational assumptions [9,11,12].
The present study’s empirical energy-saving potential—approximately 26% for lighting and 20% for air-conditioning—are broadly consistent with the higher end of reported real-world results for intelligent control systems in office settings (Figure 10). The magnitude of savings is meaningful given that the building was already operating in a relatively modern office context, and the field experiment was conducted without imposing changes in work schedules or policies, other than the control mode itself.
Figure 10.
The location where the data and conclusions of this empirical study are situated (data source [3]).
4.2. A-B-A Experiment Design
Many existing empirical evaluations of energy-intelligent building systems employ a simple A-B design, comparing a “before” period (manual control) with an “after” period (intelligent control). While straightforward, this approach is vulnerable to several confounding factors:
- Increased occupant awareness or behavioral change triggered by the introduction of the system and the associated study (a Hawthorne-type effect).
- Temporal variability in weather, occupancy and operational practices that may coincide with the intervention.
- Long-term drift in system performance or occupant adaptation.
The A-B-A design used in this study provides two separate reference periods (A1 and A2) with intelligent control, bracketing the manual-control period (B). This configuration offers several advantages:
- It allows the observed savings to be replicated across two independent intelligent-control months with different climatic conditions.
- It helps discern whether any observed changes during B are due to the absence of intelligent control or to temporally correlated external factors.
- It reduces the likelihood that the results are driven solely by short-term behavioral changes following system deployment.
Although the design does not eliminate all potential confounds, it represents a methodological improvement over simple A-B designs and can serve as a useful template for future empirical studies of building control technologies.
4.3. Role of Occupant Behavior and “Forgotten-On” Equipment
The analysis of weekday versus weekend performance sheds light on the primary mechanisms behind the observed savings. Weekday savings of roughly 20% for lighting and 14% for air-conditioning suggest that intelligent control reduces runtime during normal working days by tailoring operation more closely to actual occupancy patterns. For example, lights and air-conditioners are switched off shortly after occupants leave a meeting room or office, rather than being left on for extended periods.
The extremely high weekend savings, exceeding 50% for both lighting and air-conditioning, indicate that under manual control, a significant portion of equipment is inadvertently left on in unoccupied spaces, especially outside regular working hours. The intelligent system essentially eliminates this behavioral waste by automatically switching off equipment in unoccupied zones.
These findings underscore the importance of incorporating occupant behavior explicitly into building energy analysis and control strategies. Even in buildings with efficient equipment, uncontrolled or poorly managed occupant behavior can offset technical efficiency gains. Intelligent control systems that directly monitor and respond to occupancy are a powerful tool to align operation with actual needs.
A further limitation is the lack of occupancy-normalized analysis. Although the control strategy was occupancy-responsive, detailed occupancy records, including zone-level presence rates, occupant-hours, and meeting room utilization, could not be accessed due to user privacy and data governance restrictions in the occupied office building. As a result, the present study cannot fully separate the effect of the control system from possible changes in office use intensity across the three experimental phases. The reported runtime reductions should therefore be interpreted as control-period differences in equipment operation rather than occupancy-normalized savings. Future studies should incorporate privacy-preserving aggregated occupancy indicators, such as occupied-zone-hours or anonymized zone presence rates, which would provide a valuable supplement for normalizing equipment runtime and for more accurately identifying the contribution of occupancy-responsive control.
The further decrease in runtime from A1 to A2 should also be interpreted cautiously. It may reflect seasonal conditions, occupancy variation, operational adaptation, or other unmeasured temporal factors, rather than a progressive improvement in control intelligence. Therefore, A1 and A2 are treated as two control-active phases bracketing the manual-control phase, rather than as evidence of continuous system learning.
4.4. Limitations and Future Research
Despite its contributions, this study has several limitations that point to avenues for future work:
- Single-building, single-floor case: The findings are based on one office floor in a specific climate and operational context. Multi-building and multi-climate studies are needed to generalize the results.
- Runtime as a proxy for energy: While runtime is a reasonable indicator when device power ratings are relatively constant, direct meter-based measurements at the circuit or equipment level would enable more precise quantification of energy savings.
- Limited experimental duration: The 92-day experiment covers one summer season. Longer-term studies spanning different seasons and year-to-year variations would strengthen the evidence base.
- Comfort and satisfaction metrics: This study focuses on energy-related performance. Incorporating thermal comfort, visual comfort and occupant satisfaction data would help evaluate the trade-offs and co-benefits of intelligent control.
- Advanced control strategies: The current system implements primarily occupancy-based on/off control. Future research could explore more advanced strategies such as demand-response, predictive control, and integrated daylight-responsive dimming, and their combined impact on energy, comfort and user behavior.
5. Conclusions
This paper reported a 92-day A-B-A field experiment evaluating an intelligent building environmental control system for lighting and air-conditioning on an office floor in Shenzhen, China. The key conclusions are:
- The deployment of an IoT-based intelligent control system that integrates mmWave radar, infrared sensors and smart switches significantly reduced the runtime of both lighting and air-conditioning systems compared with manual control.
- Based on monthly cumulative runtime, the intelligent system achieved average savings of 25.98% for lighting and 19.50% for air-conditioning. These results indicate substantial runtime reductions during the intelligent-control phases. Most paired comparisons supported statistically significant reductions, although the September–August lighting comparison should be interpreted with caution because significant autocorrelation was detected.
- When weekdays and weekends were analyzed separately, weekday savings remained substantial (19.85% for lighting and 13.58% for air-conditioning), while weekend savings exceeded 50% for both subsystems. This indicates that the intelligent system is particularly effective at eliminating “forgotten-on” lights and air-conditioners in unoccupied spaces.
- The A-B-A experimental design helped mitigate Hawthorne-type effects and temporal confounds, representing a methodological advance over simple before–after comparisons commonly found in the literature.
- The study provides a high-quality empirical sample for intelligent building energy research and demonstrates that occupancy-based environmental control systems can contribute meaningfully to building energy efficiency under the “dual carbon” policy context.
Future work should extend such experiments to multiple buildings, longer periods and diverse climates, incorporate detailed energy metering and comfort metrics, and investigate more advanced control strategies. Nevertheless, the present findings already support wider adoption of intelligent building environmental control systems as a practical and effective measure for reducing operational energy use in office buildings.
Author Contributions
Methodology, data curation and writing—original draft preparation, M.W.; writing—review and editing, supervision, B.Y. All authors have read and agreed to the published version of the manuscript.
Funding
This work was supported by the Open Project Fund of the State Key Laboratory of Building Safety and Environment/National Engineering Research Center for Building Technology (BSBE2023-04).
Data Availability Statement
The original contributions presented in this study are included in the article. Further inquiries can be directed to the corresponding author.
Acknowledgments
During the preparation of this study, the authors used IBM SPSS 26.0 for the statistical analyses and visualization. The authors have reviewed and edited the output and take full responsibility for the content of this publication.
Conflicts of Interest
The authors declare no conflicts of interest.
Abbreviations
The following abbreviations are used in this manuscript:
| IoT | Internet of Things |
| HVAC | Heating, Ventilation and Air Conditioning |
| PIR | Passive Infrared |
| CDD | Cooling Degree Days |
| A-B-A | Experimental design with two control-active phases and one manual-control phase |
References
- Rupp, R.F.; Vásquez, N.G.; Lamberts, R. A review of human thermal comfort in the built environment. Energy Build. 2015, 105, 178–205. [Google Scholar] [CrossRef] [Scilit]
- Ahmad, M.W.; Mourshed, M.; Mundow, D.; Sisinni, M.; Rezgui, Y. Building energy metering and environmental monitoring—A state-of-the-art review and directions for future research. Energy Build. 2016, 120, 85–102. [Google Scholar] [CrossRef] [Scilit]
- Nguyen, T.A.; Aiello, M. Energy intelligent buildings based on user activity: A survey. Energy Build. 2013, 56, 244–257. [Google Scholar] [CrossRef] [Scilit]
- Chew, I.; Karunatilaka, D.; Tan, C.P.; Kalavally, V. Smart lighting: The way forward? Reviewing the past to shape the future. Energy Build. 2017, 149, 180–191. [Google Scholar] [CrossRef] [Scilit]
- Zhang, X.; Wang, M.; Wei, M.; Wang, Y.; Liu, S. The optimal number of sensors for a digital imaging system from the perspective of metamer mismatching. Color Res. Appl. 2020, 45, 275–289. [Google Scholar] [CrossRef] [Scilit]
- Chan, M.; Estève, D.; Escriba, C.; Campo, E. A review of smart homes—Present state and future challenges. Comput. Methods Programs Biomed. 2008, 91, 55–81. [Google Scholar] [CrossRef] [Scilit] [PubMed]
- Transforming the Market. Energy Efficiency in Buildings. World Business Council for Sustainable Development (WBCSD). Available online: https://docs.wbcsd.org/2009/08/EEB-TransformingTheMarket.pdf (accessed on 7 June 2024).
- Delaney, D.T.; O’Hare, G.M.P.; Ruzzelli, A.G. Evaluation of energy-efficiency in lighting systems using sensor networks. In Proceedings of the First ACM Workshop on Embedded Sensing Systems for Energy-Efficiency in Buildings (BuildSys ’09); Association for Computing Machinery: New York, NY, USA, 2009; pp. 61–66. [Google Scholar] [CrossRef] [Scilit]
- Gangolells, M.; Casals, M.; Forcada, N.; Macarulla, M.; Giretti, A. Energy performance assessment of an intelligent energy management system. Renew. Sustain. Energy Rev. 2016, 55, 662–667. [Google Scholar] [CrossRef] [Scilit]
- Godithi, S.B.; Sachdeva, E.; Garg, V.; Brown, R.; Kohler, C.; Rawal, R. A review of advances for thermal and visual comfort controls in personal environmental control (PEC) systems. Intell. Build. Int. 2019, 11, 75–104. [Google Scholar] [CrossRef] [Scilit]
- Kim, Y.; Charbiwala, Z.; Singhania, A.; Schmid, T.; Srivastava, M.B. SPOTLIGHT: Personal Natural Resource Consumption Profiler; Association for Computing Machinery (ACM): New York, NY, USA, 2008. [Google Scholar]
- Nguyen, T.A.; Aiello, M. Beyond Indoor Presence Monitoring with Simple Sensors. In Proceedings of the International Conference on Pervasive and Embedded Computing and Communication Systems; SciTePress: Setúbal, Portugal, 2023; pp. 5–14. Available online: https://www.scitepress.org/Link.aspx?doi=10.5220/0003801300050014 (accessed on 7 June 2024).
- Zhou, P.; Huang, G.; Li, Z. Demand-based temperature control of large-scale rooms aided by wireless sensor network: Energy saving potential analysis. Energy Build. 2014, 68, 532–540. [Google Scholar] [CrossRef] [Scilit]
- Zhou, P.; Huang, G.; Zhang, L.; Tsang, K.-F. Wireless sensor network based monitoring system for a large-scale indoor space: Data process and supply air allocation optimization. Energy Build. 2015, 103, 365–374. [Google Scholar] [CrossRef] [Scilit]
- Wen, Y.-J.; Agogino, A.M. Wireless networked lighting systems for optimizing energy savings and user satisfaction. In Proceedings of the 2008 IEEE Wireless Hive Networks Conference, Austin, TX, USA, 7–8 August 2008; pp. 1–7. [Google Scholar] [CrossRef] [Scilit]
- Singhvi, V.; Krause, A.; Guestrin, C.; Garrett, J.H.; Matthews, H.S. Intelligent light control using sensor networks. In Proceedings of the 3rd International Conference on Embedded Networked Sensor Systems; Association for Computing Machinery: New York, NY, USA, 2005; pp. 218–229. [Google Scholar] [CrossRef] [Scilit]
- Al-Turjman, F.M.; Hassanein, H.S.; Ibnkahla, M. Quantifying connectivity in wireless sensor networks with grid-based deployments. J. Netw. Comput. Appl. 2013, 36, 368–377. [Google Scholar] [CrossRef] [Scilit]
- Chen, S.; Zhang, G.; Xia, X.; Chen, Y.; Setunge, S.; Shi, L. The impacts of occupant behavior on building energy consumption: A review. Sustain. Energy Technol. Assess. 2021, 45, 101212. [Google Scholar] [CrossRef] [Scilit]
- Peng, Y.; Rysanek, A.; Nagy, Z.; Schlüter, A. Occupancy learning-based demand-driven cooling control for office spaces. Build. Environ. 2017, 122, 145–160. [Google Scholar] [CrossRef] [Scilit]
- Peng, Y.; Rysanek, A.; Nagy, Z.; Schlüter, A. Using machine learning techniques for occupancy-prediction-based cooling control in office buildings. Appl. Energy 2018, 211, 1343–1358. [Google Scholar] [CrossRef] [Scilit]
- Peng, Y.; Nagy, Z.; Schlüter, A. Temperature-preference learning with neural networks for occupant-centric building indoor climate controls. Build. Environ. 2019, 154, 296–308. [Google Scholar] [CrossRef] [Scilit]
- Nagy, Z.; Yong, F.Y.; Schlueter, A. Occupant centered lighting control: A user study on balancing comfort, acceptance, and energy consumption. Energy Build. 2016, 126, 310–322. [Google Scholar] [CrossRef] [Scilit]
- Park, J.; Dougherty, T.; Fritz, H.; Nagy, Z. LightLearn: Occupant centered lighting controller using reinforcement learning to adapt systems to humans. In Proceedings of the International Building Physics Conference 2018, Syracuse, NY, USA, 24 September 2018; Available online: https://surface.syr.edu/ibpc/2018/IM1/2 (accessed on 7 June 2024).
- Park, J.Y.; Dougherty, T.; Fritz, H.; Nagy, Z. LightLearn: An adaptive and occupant centered controller for lighting based on reinforcement learning. Build. Environ. 2019, 147, 397–414. [Google Scholar] [CrossRef] [Scilit]
- Park, J.Y.; Nagy, Z. The Influence of Building Design, Sensor Placement, and Occupant Preferences on Occupant Centered Lighting Control. In Proceedings of the ASCE International Conference on Computing in Civil Engineering 2019, Atlanta, GA, USA, 17–19 June 2019; pp. 98–104. [Google Scholar] [CrossRef] [Scilit]
- Inge Fostervold, K.; Buckmann, E.; Lie, I. VDU-screen filters: Remedy or the ubiquitous Hawthorne effect? Int. J. Ind. Ergon. 2001, 27, 107–118. [Google Scholar] [CrossRef] [Scilit]
- Benezeth, Y.; Laurent, H.; Emile, B.; Rosenberger, C. Towards a sensor for detecting human presence and characterizing activity. Energy Build. 2011, 43, 305–314. [Google Scholar] [CrossRef] [Scilit]
- Duarte, C.; Van Den Wymelenberg, K.; Rieger, C. Revealing occupancy patterns in an office building through the use of occupancy sensor data. Energy Build. 2013, 67, 587–595. [Google Scholar] [CrossRef] [Scilit]
- Littlefair, P.J. Photoelectric control: The effectiveness of techniques to reduce switching frequency. Light. Res. Technol. 2001, 33, 43–55. [Google Scholar] [CrossRef] [Scilit]
- Labeodan, T.M.; de Bakker, C.; Rosemann, A.L.P.; Zeiler, W. On the application of wireless sensors and actuators network in existing buildings for occupancy detection and occupancy-driven lighting control. Energy Build. 2016, 127, 75–83. [Google Scholar] [CrossRef] [Scilit]
- García-Monge, M.; Zalba, B.; Casas, R.; Cano, E.; Guillén-Lambea, S.; López-Mesa, B.; Martínez, I. Is IoT monitoring key to improve building energy efficiency? Case study of a smart campus in Spain. Energy Build. 2023, 285, 112882. [Google Scholar] [CrossRef] [Scilit]
- Zhao, P.; Lu, C.X.; Wang, J.; Chen, C.; Wang, W.; Trigoni, N.; Markham, A. mID: Tracking and Identifying People with Millimeter Wave Radar. In Proceedings of the 2019 15th International Conference on Distributed Computing in Sensor Systems (DCOSS), Santorini Island, Greece, 29–31 May 2019; pp. 33–40. [Google Scholar] [CrossRef] [Scilit]
- Zhang, S.; Su, H.; Wu, M.; Yang, B. An empirical study on energy usage and occupant comfort of occupant-centric control systems in offices. Build. Environ. 2025, 278, 112954. [Google Scholar] [CrossRef] [Scilit]
- Padmanabh, K.; Malikarjuna, A.; Sen, S.; Katru, S.P.; Kumar, A.; C, S.P.; Vuppala, S.K.; Paul, S. iSense: A wireless sensor network based conference room management system. In Proceedings of the First ACM Workshop on Embedded Sensing Systems for Energy-Efficiency in Buildings (in BuildSys ’09); Association for Computing Machinery: New York, NY, USA, 2009; pp. 37–42. [Google Scholar] [CrossRef] [Scilit]



Disclaimer/Publisher’s Note: The statements, opinions and data contained in all publications are solely those of the individual author(s) and contributor(s) and not of MDPI and/or the editor(s). MDPI and/or the editor(s) disclaim responsibility for any injury to people or property resulting from any ideas, methods, instructions or products referred to in the content. |
© 2026 by the authors. Licensee MDPI, Basel, Switzerland. This article is an open access article distributed under the terms and conditions of the Creative Commons Attribution (CC BY) license.