


Abstract
Buildings in Lagos require mechanical cooling year-round, with air conditioning accounting for up to 80% of residential electricity consumption. Despite this, the Nigerian Building Code (NB 485:2017) still references 1990s thermal design data, creating a growing mismatch between design assumptions and actual thermal conditions. Compounding background warming and an intensifying urban heat island have widened this gap considerably, yet no study has linked long-term cooling demand trends to quantified engineering design shortfalls for any Nigerian city. This study presents a 35-year cooling degree day (CDD) trend analysis for Lagos (1990–2024), derived from 12,784 daily temperature records at four engineering base temperatures (22 °C, 23.3 °C, 26 °C, and 28 °C) respectively. Trends are detected using the Mann–Kendall test with Trend-Free Pre-Whitening and Sen’s slope as the magnitude estimator. Significantly increasing CDD trends are confirmed at three base temperatures, with a Sen’s slope of +4.55 °C·days yr−1 at the primary design reference of 23.3 °C (p < 0.01). Structural break analysis identifies 2015 as the transition into a persistently above-baseline thermal regime, with mean CDD in the most recent sub-period exceeding the 1990–2001 design baseline by up to 50% at higher base temperatures. The detected trends are translated into three engineering gap analyses: required envelope U-value trajectories, an HVAC capacity undersizing index, and annual thermal cycling frequency as a structural fatigue proxy. Results show that the dominant uninsulated sandcrete typology fails ASHRAE 90.1-2019 Zone 1A prescriptive limits throughout the study horizon, installed HVAC systems are already operating in the engineering caution zone, and façade fatigue loading has intensified markedly since 2015. To the author’s knowledge, this study is the first to couple a statistically robust long-period CDD record for Lagos with code-referenced design gap figures, providing a replicable framework for climate-adaptive building code revision across similar hot–humid climates in sub-Saharan Africa.
1. Introduction
Buildings consume over 32% of global final energy (e.g., electricity, natural gas, heating oil) and contribute about 34% of CO2 emissions [1], with the fastest-growing component of that demand concentrated in the mechanical cooling of tropical-region buildings [2]. In engineering practice, the annual cooling degree day (CDD) index, which is the cumulative sum of daily mean temperature exceedances above a comfort baseline, is the primary scalar through which the outdoor thermal environment enters building design: it governs envelope thermal transmittance (U-value) requirements under ASHRAE 90.1 [3] and ISO 15927-6 [4], HVAC system sizing, and climate zone classifications. Its proportionality with annual conductive heat flux (Q = CDD × U × A) means that every percentage-point rise in CDD translates directly into an equivalent rise in the thermal load the building envelope, mechanical plant, and thermal-cycling-sensitive materials must carry. Karami et al. [5] showed that the relationship between climate zone CDD and optimum insulation thickness is non-linear and coupled to HVAC system size, while Shahid et al. [6] demonstrated that optimum insulation thickness is highly sensitive to both the number of cooling degree days and the choice of base temperature. Together, these findings make the precise, trend-aware quantification of CDD not just the assignment of a static climate zone, but also a prerequisite for sound building thermal design.
Lagos, Nigeria, crystallises the global problem at its most acute; one of Africa’s most populous metropolitan areas (accounting for about 20–25 million inhabitants, growing by ~500,000 yr−1 [7]) sits in a tropical savanna climate (Köppen Aw) in which air conditioning accounts for 50–80% of residential electricity consumption [8] and virtually every building requires mechanical cooling year-round. While Section 9 of the National Building Code (NB 485:2017) [9] attempts to regulate energy efficiency and thermal comfort, a direct analysis of the document reveals a significant temporal mismatch in its underlying meteorological datasets. Specifically, the framework relies on baseline cooling degree day (CDD) data and ambient design temperatures dating back to the 1990s. This reliance on historical, pre-climate-change data introduces critical inaccuracies when predicting modern structural thermal loading, multi-mode structural degradation, or energy performance under current and projected climate realities, leading to a regulatory stasis that leaves buildings specified against an outdoor thermal environment that no longer exists [10]. Two compounding warming signals have widened the gap since those reference data were collected. First, a background mean temperature increase of +0.25 °C per decade since 1970, with nighttime minima rising faster than daytime maxima [11], an asymmetric pattern that is particularly damaging for CDD accumulation because increasingly warm nights eliminate the nocturnal thermal relief on which tropical buildings depend. Second, an intensifying urban heat island: Lagos’s built-up area expanded by 71.2% between 2000 and 2022 [12], driving an ensemble-mean increase of 0.44 °C in nighttime UHI intensity between 1984 and 2016 and producing Land Surface Temperature trends of up to 0.174 °C yr−1 at multiple sites across Lagos State [12,13]. Santamouris [8] demonstrated that urban buildings carry, on average, 13% higher cooling loads than rural equivalents due to UHI effects alone. The compound result is a thermal environment measurably and progressively more severe than the conditions embedded in current Nigerian building design practice, with direct, unquantified consequences for envelope U-value adequacy, HVAC capacity, and the fatigue life of thermally cycled structural materials and sealants.
Previous studies do not supply the quantitative evidence needed to act on this problem. Gbode et al. [14] confirmed statistically the significant warming across all three Nigerian climatic zones using the Mann–Kendall test but performed no CDD computation. Awolola and Olorunmaiye [2] computed cooling degree days for 18 Nigerian cities from the Nigerian Meteorological Agency (NiMet) data across approximately 15-year windows ending between 2008 and 2009, reporting annual CDD for Ikeja at 1785.6 °C·days at base 22 °C and 1118.5 °C·days at base 24 °C, among the lower values nationally, with northern cities such as Sokoto and Maiduguri recording substantially higher figures due to their proximity to the sub-Saharan area; however, the study contains no trend analysis and no design code comparison. The only West African multi-year CDD trend study [15] applies non-parametric testing to Kano and Bamako, explicitly excluding Lagos, a climatically distinct humid coastal environment. The most recent Lagos-specific thermal load analysis [16] examines cooling degree hours over 2001–2023 and reports an accelerating CDH trend post-2012; but degree hours are not interchangeable with degree days for ASHRAE 90.1 [3] or ISO 15927-6 [4] compliance calculations, the study excludes the 1990s reference baseline decade, and its energy-policy framing, also leaving the structural engineering dimension—envelope U-value adequacy, HVAC oversizing, and material fatigue—entirely unaddressed. Bentoumi et al. [17] showed that bringing an under-insulated building into thermal compliance reduced air conditioning demand by 18% and annual energy consumption by 500 kWh, a finding that illustrates the cost of designing to an inadequate thermal baseline, one derived from a temperate North African context with no application to humid tropical conditions. No published study has combined a statistically robust, long-period CDD trend analysis for Lagos with a quantitative translation of the detected trends into engineering design gap figures expressed as percentage exceedances of current code references.
This paper fills those gaps of the various limitations and setbacks, as addressed above and further elaborated as shown in Table 1. It presents a 35-year CDD trend analysis for Lagos (1990–2024) derived from 12,784 daily temperature records from the NASA POWER MERRA-2 reanalysis dataset at four engineering base temperatures: 22 °C (ASHRAE 55 lower comfort bound), 23.3 °C (the primary reference matching the 2025 Lagos CDH study [16]), 26 °C (ASHRAE 55 upper adaptive comfort limit for naturally ventilated buildings), and 28 °C (the ISO 11600:2003 [18] elastomeric sealant degradation threshold). Trends are detected using the Mann–Kendall test with Trend-Free Pre-Whitening following Collaud Coen et al. [19], the pre-whitening protocol identified as optimal for autocorrelated climate series, verified by the Hamed–Rao (H&R) variance correction [20], with Sen’s slope [21] as the trend magnitude estimator. The detected CDD trends are then translated into three engineering output analyses: the envelope U-value reduction required to maintain historical design heat flux; HVAC capacity undersizing relative to two established design baselines; and the change in annual thermal cycling frequency relevant to structural fatigue and sealant service life under ISO 15686-1:2011 [22]. This is the first study to deliver these design gap figures as percentage exceedances of established code references for Lagos, and the longest CDD trend record yet published for any Nigerian city.
Table 1.
Prior studies relevant to the present work, showing key findings and limitations addressed.
2. Data and Methods
2.1. Study Area
Lagos, Nigeria (6.52° N, 3.37° E), is the study site as shown in Figure 1. Situated on the southwestern Atlantic coast of Nigeria at an average elevation of approximately 25 m above sea level, its climate is classified as tropical savanna (Köppen Aw): year-round high temperatures, and a pronounced bimodal seasonal structure governed by competing atmospheric circulation systems. The wet season (April–October) is driven by the West African Monsoon, which adverts moist maritime air from the Atlantic and is associated with high humidity, sustained cloud cover, convective rainfall, and persistently elevated nighttime temperatures. The dry season (November–March) is dominated by the northeasterly Harmattan, which brings drier, cooler continental air from the Sahara and suppresses, but does not eliminate, the cooling demand of buildings. Lagos was selected as the study site because it uniquely combines the four conditions that maximise the structural and thermal engineering significance of a CDD trend analysis: the highest sustained cooling demand of any southern Nigerian city [2]; a well-documented and intensifying urban heat island [12,13]; a building stock designed against 1990s-era climate data under a code that has not been updated for climate change [10]; and a position in the Guinea Coast climatic zone that is absent from all existing West African multi-base CDD trend analyses [15].
Figure 1.
Study area map showing the location of Lagos, Nigeria, within West Africa.
2.2. Temperature Dataset: Source, Provenance, and Quality Assessment
2.2.1. NASA POWER MERRA-2 Reanalysis Dataset
Daily maximum (T2M_MAX) and minimum (T2M_MIN) surface air temperature records were obtained from the NASA Prediction of Worldwide Energy Resources (POWER) project, which provides gap-free gridded meteorological data derived from the Modern-Era Retrospective analysis for Research and Applications, Version 2 (MERRA-2) reanalysis product developed by the NASA Global Modelling and Assimilation Office (GMAO) [23]. POWER provides MERRA-2 parameters spatially interpolated to a user-specified surface coordinate, with temporal coverage from January 1981 to near-real-time. Data for this study were extracted via the Data Access Viewer for the coordinate 6.5244° N, 3.37° E, the grid point representative of the Lagos metropolitan area, at a POWER-reported elevation of 25.49 m, in the Buildings (SB) community format, which provides parameters calibrated for building energy and thermal performance applications, for the period 1 January 1990 to 31 December 2024, yielding 12,784 daily records (35 full calendar years including nine leap years: 1992, 1996, 2000, 2004, 2008, 2012, 2016, 2020, and 2024). Table 2 summarises the five meteorological parameters downloaded.
Table 2.
Meteorological parameters downloaded from the NASA POWER MERRA-2 reanalysis for Lagos, Nigeria (1990–2024).
The MERRA-2 dataset was selected over the alternatives (ERA5, NCEP/NCAR Reanalysis-2, and the sparse NiMET station network) on four grounds. First, the MERRA-2 dataset has zero missing values at any point during the study period; NiMET station records for Lagos have documented gaps exceeding six months in the 2000–2010 period and are not publicly available in digitised daily format. Second, the POWER product has been extensively validated against ground-station observations for building energy applications in tropical and subtropical climates, with mean absolute errors for daily mean temperature below 0.8 °C in comparisons with available West African stations. Third, MERRA-2 assimilates satellite brightness temperature data, radiosonde profiles, and surface synoptic observations through a four-dimensional variational (4D-Var) data assimilation scheme, making it more representative of the atmospheric state than any single surface station. Fourth, the POWER/MERRA-2 combination has been the primary data source in the most methodologically comparable published CDD trend studies for West Africa [15] and for other data-sparse tropical regions [16,23], ensuring that the results of this study are directly comparable to the existing literature. The single 50 km MERRA-2 grid point cannot resolve Lagos’s intra-urban UHI heterogeneity, and this is expected to cause a systematic underestimation of urban thermal exposure. Two independent sources help characterise this bias: satellite-derived LST studies report nighttime UHI intensities for Lagos increasing by +0.44 °C (1984–2016), with stronger effects in dense commercial cores [12,13], while Santamouris [8] reports urban buildings generally carry 5–15% higher cooling loads than rural equivalents across comparable cities. Together, these suggest the underestimation is on the order of 5–15% of reported CDD values for buildings in the urban core, though the precise figure depends on local land cover within the grid cell. Since the same grid point is used consistently across the 35-year record, this bias is approximately stationary and affects absolute CDD levels rather than the trends, significance, or relative comparisons reported in this study, which remain valid. In the absence of digitised NiMET daily records for the overlap period, validation was instead carried out against the Lagos annual CDD reported by Awolola and Olorunmaiye [2] for the approximate 1995–2009 window. The MERRA-2-derived mean annual CDD at base 22 °C for 1995–2009 is 1672.2 °C·days yr−1, compared to the Lagos in situ value of 1785.6 °C·days yr−1, a negative bias of approximately 6.4%. This is consistent with documented validation studies of NASA POWER temperature data against ground observations in comparable contexts. A direct comparison of NASA POWER predictions against NiMET ground-truth records across Nigerian stations reported RMSE values of 1.2 °C for minimum temperature and 2.6 °C for maximum temperature, with correlation coefficients of 0.6 and 0.7 respectively [24]. A separate evaluation of NASA POWER air temperatures across multiple Nigerian meteorological stations reported mean absolute errors ranging from approximately 1.9 °C to 3.1 °C [25]. More broadly, NASA POWER has been shown to systematically underestimate maximum temperatures relative to gauge stations by 6.5–11.2% in other tropical and subtropical basins [26]. The 6.4% negative bias in annual CDD reported here falls within this documented range of NASA POWER temperature bias magnitudes for comparable settings.
2.2.2. Data Quality Control
The raw dataset was subjected to four quality control checks before any derived quantities were computed, and the results are summarised in Table 3. The NASA POWER encoding uses a fill value of −999 for missing or unreliable records; no such values were detected across any parameter or any of the 12,784 daily records, confirming that the dataset is complete for the full study period. A reference calendar from 1 January 1990 to 31 December 2024 was constructed and compared against the dates in the dataset; no missing or duplicate dates were identified, and the nine leap years in the study period (1992, 1996, 2000, 2004, 2008, 2012, 2016, 2020, 2024) each correctly contain 366 records, giving a total of 12,784. Physical plausibility was verified by testing the constraint Tmax ≥ Ŧmean ≥ Tmin across all records; zero violations were detected, and the daily temperature range averaged 4.07 °C (minimum 1.11 °C, maximum 12.32 °C), consistent with the persistently humid and cloudy climate of coastal Lagos. Finally, statistical outlier screening identified values exceeding three standard deviations from the column mean; inspection of all flagged records confirmed that they correspond to physically interpretable climatological events, Harmattan intrusion episodes (low T2M_MIN, low RH2M), and pre-monsoon heat events (high T2M_MAX), and no records were removed or altered.
Table 3.
Quality control protocol applied to the NASA POWER MERRA-2 dataset for Lagos, Nigeria (1990–2024).
2.3. Multi-Base Cooling Degree Day Computation Framework
2.3.1. Daily Mean Temperature
Daily mean temperature () was derived from the daily maximum (Tmax) and minimum (Tmin) temperatures using the arithmetic mean method specified in ISO 15927-6:2007 as shown in Equation (1). This method is preferred over the reanalysis model-derived T2M because it is directly reproducible from any standard meteorological record, ensuring that the methodology can be replicated by other researchers using station data.
where is daily mean temperature, is daily maximum temperature, is daily minimum temperature, d is Day Index, y is Year Index.
2.3.2. Daily and Annual CDD
The fundamental CDD computation follows the threshold exceedance approach standardised in ISO 15927-6:2007 [4] and ASHRAE 90.1-2019 [3]. For a given base temperature , the daily CDD is the positive excess of the daily mean temperature above :
Annual CDD is obtained by summing Equation (2) over all days in the calendar year:
The four base temperatures yield a 35 × 4 panel matrix C used in all downstream statistical and engineering analyses, and were selected to span the full range of engineering relevance for Lagos buildings, following the multi-base approach of De Rosa et al. [27] and the 2024 West Africa CDD study [15].
2.3.3. Temporal Structure: Sub-Periods and Seasonal Decomposition
To detect whether the rate of CDD increase has accelerated over time, the 35-year study period was divided into three consecutive sub-periods of approximately equal length. Period 1 (P1, 1990–2001, 12 years) constitutes the historical design baseline, representing the thermal climate against which the majority of Lagos’s existing building stock was designed. Period 2 (P2, 2002–2013, 12 years) is a transition period used to assess whether change was progressive or abrupt. Period 3 (P3, 2014–2024, 11 years) represents the current thermal load environment against which the adequacy of existing design standards is evaluated. The P1 mean CDD at each base temperature serves as the internal historical design baseline in the design gap analysis. For seasonal decomposition, the study year was partitioned into the wet season (April–October, 7 months) and the dry season (November–March, 5 months), following standard climatological convention [14,15].
2.4. Statistical Trend Detection
2.4.1. Autocorrelation Assessment and Trend-Free Pre-Whitening (TFPW)
The Mann-Kendall test assumes serial independence; positive lag-1 autocorrelation, common in climate time series, can artificially inflate its significance [19]. Each annual CDD series was therefore examined for autocorrelation before trend testing, using two diagnostics: the lag-1 autocorrelation function (ACF) of the raw series, assessed against the 95% confidence bound ±1.96/√n = ±0.331 (n = 35); and the Pearson lag-1 autocorrelation of trend-removed residuals (after Sen’s slope removal), which is the definitive pre-whitening decision criterion recommended by Collaud Coen et al. [19]. The pre-whitening threshold was set at |ρ^1_detrended| ≥ 0.10, following Collaud Coen et al. [19]. The results of this pre-test for all four base temperatures are presented in Table 4.
Table 4.
Lag-1 autocorrelation diagnostics for the annual CDD series.
The three-step TFPW procedure is:
Step 1—Remove the trend using Sen’s slope to obtain the detrended residuals :
where is Original Time Series Value, is Pairwise CDD Values, i,j is Time Indices, t is Time Indices.
Step 2—Estimate the lag-1 Pearson autocorrelation of the detrended residuals and pre-whiten:
where p is Lag-1 Autocorrelation Coefficient, Lagged Detrended Residuals, is pre-whitened residuals, n is Sample Size.
Step 3—Restore the trend to the pre-whitened residuals to obtain the corrected series X*(t):
where is TFPW-corrected series.
Where the detrended lag-1 autocorrelation met or exceeded 0.10, the 26 °C (ρ^1 = +0.163) and 28 °C (ρ^1 = −0.128) series, Trend-Free Pre-Whitening (TFPW) was required. As a conservative and methodologically consistent approach, TFPW was applied to all four series, including the 22 °C and 23.3 °C series whose detrended autocorrelations fall marginally below the threshold [19]. To confirm that this conservative choice does not alter statistical conclusions, the MK test was re-run on the raw (non-TFPW) series for 22 °C and 23.3 °C.
2.4.2. Mann–Kendall Test
The Mann-Kendall (MK) test [28,29] is the primary statistical test for monotonic trend detection and was applied to each TFPW-corrected annual series X*(t). The test statistic S counts the excess of concordant over discordant pairs:
where sgn(u) = +1 if u > 0; 0 if u = 0; −1 if u < 0. For n = 34 (post-TFPW), the total number of pairwise comparisons is Npairs = 34 × 33/2 = 561.
The variance of S incorporates a correction for g tied groups of size tp (ties are uncommon in continuous daily temperature data but can occur due to rounding in MERRA-2 output):
where p is Tied Group Index, , is Scaling Constant.
The standardised test statistic with continuity correction is
where is Standardised MK Test Statistic, is standard deviation of S, ±1 is continuity correction.
The null hypothesis of no monotonic trend is rejected when |ZMK| > 1.96 at α = 0.05 (two-tailed). As a complementary cross-check using an alternative autocorrelation correction approach, the Hamed and Rao [20] modified Mann–Kendall test, which corrects for autocorrelation by inflating the variance of S using an autocorrelation correction factor without explicit pre-whitening (as opposed to TFPW which removes serial dependence before computing S), was applied to the raw series at each base temperature. Their agreement demonstrates robustness to the choice of autocorrelation correction method, not statistical independence of evidence, since both methods derive significance from the same pairwise S statistic computed from the same data.
2.4.3. Sen’s Slope Estimator and OLS Regression
The magnitude of each detected trend was quantified using Sen’s slope [21], the median of all n(n − 1)/2 pairwise slopes in the TFPW-corrected series:
where n = 34 after TFPW, giving 561 pairwise slopes. Sen’s slope is reported in °C·days yr−1 and converted to decadal rates by multiplying by 10. Its robustness to outliers and distributional assumptions makes it the primary trend magnitude estimator for climate time series that may be influenced by ENSO-driven extreme years [19,21]. OLS linear regression was applied as a secondary parametric confirmatory method; the coefficient of determination R2 quantifies the fraction of inter-annual CDD variance attributable to the linear time trend and serves as a diagnostic complement to the non-parametric results.
2.4.4. CUSUM Change-Point and Sequential Mann–Kendall (SQMK) Trend Onset Detection
The Cumulative Sum (CUSUM) of standardised annual CDD anomalies is used to identify the year at which the CDD series undergoes a structural shift from a persistently below-mean to a persistently above-mean regime. To formally confirm the structural break year identified by visual inspection of the CUSUM diagram, the Pettitt non-parametric change-point test was applied to each annual CDD series [30]. The test identifies the most probable single change-point year and derives an associated p-value under the null hypothesis of no change-point, requiring no distributional assumptions. The significance threshold was set at α = 0.05.
The Sequential (or Progressive) Mann–Kendall test computes the MK statistic ZMN progressively as each year is added to the series (the progressive statistic u(t)) and retrogressively from the reversed series (the retrograde statistic u′(t)) [28]. The intersection of u(t) and u′(t) within the ±1.96 significance band identifies the approximate year at which the trend became established within the series, the trend onset year. This is distinct from the CUSUM change-point (which identifies the regime transition year) and provides a third, independent corroboration of the temporal structure of the trend. The year at which u(t) first crosses the −1.96 threshold is reported as the year from which the trend became statistically significant, equivalent to the earliest year from which a statistically valid trend could have been detected given the data length.
2.4.5. Seasonal Mann–Kendall Test
The Seasonal Mann–Kendall (SMK) test of Hirsch et al. [31], implemented via pymannkendall seasonal_test() with period = 12, was applied to the full 420-observation monthly CDD panel at each base temperature. The SMK test evaluates trends within each calendar month independently across the 35 years, then combines the resulting S statistics; the between-month comparisons are made only within the same calendar month, eliminating the dominant seasonal autocorrelation without requiring pre-whitening.
The overall test statistic is:
where is Overall SMK Test Statistic, is Within-Season S Statistic, m is Overall SMK Test Statistic, k is Season Index.
The variance of accounts for ties within each season:
where is Variance of the Overall SMK Statistic, is Observations in Season, is Number of Tied Groups in Season k, is Size of Tied Group p in Season k, P is Tied Group Index within Season k.
The standard MK test was additionally applied to annual wet-season (April–October) and dry-season (November–March) CDD totals separately, with TFPW applied where |ρ^1_detrended| ≥ 0.10. Month-by-month MK tests (12 independent tests, n = 35 values each) were used to identify the specific calendar months driving the seasonal trend signal; no correction for multiple testing was applied to these exploratory monthly tests. Per-month Sen’s slope quantifies the trend magnitude in each calendar month:
2.5. Engineering Implication Framework: From CDD Trend to Design Gap
The engineering implication framework translates the detected CDD trends directly into quantities that are actionable for practising structural and mechanical engineers. All engineering quantities are derived analytically from the CDD panel using the physical relationships and published standards documented below. The framework is built on the ISO 15927-6 degree-day thermal load equation as its central relation, from which the required envelope U-value trajectory, the HVAC capacity undersizing index, and the structural thermal cycling frequency are all derived. Each sub-section below documents the governing equation, the parameter definitions, the numerical inputs, and the sensitivity range evaluated.
2.5.1. Annual Conductive Heat Flux Through Building Envelope (ISO 15927-6)
The ISO 15927-6 degree-day thermal load equation [4] is the fundamental physical link between the CDD climate index and the annual conductive heat flux through a building envelope assembly. For a unit area of envelope with thermal transmittance U (W m−2 K−1), the annual conductive heat flux Q transferred from the outdoor environment to the conditioned interior is:
where Q is in Wh m−2 yr−1, is the annual CDD for year y at base temperature b, and A = 1 m2 for cross-typology comparison.
Expressing Q in the more practically useful unit of kWh m−2 yr−1:
where the factor 24/1000 converts from W·h to kWh.
Equation (16) is evaluated across six design U-value levels: 0.5, 0.857, 1.0, 1.5, 2.0, and 2.5 W m−2 K−1. These span the full realistic range of Lagos building envelope assemblies, from well-insulated modern curtain wall construction (0.5 W m−2 K−1) to typical uninsulated hollow sandcrete blockwork (1.5 to 2.5 W m−2 K−1) that constitutes the majority of the Lagos commercial building stock. Independent EnergyPlus/DesignBuilder simulations of Lagos sandcrete residential buildings corroborate this range and the conductive load sensitivity assumed here: Onyenokporo and Ochedi [32] modelled a Lagos sandcrete building with wall U-value = 0.987 W m−2 K−1 and found roof insulation alone (reducing roof U-value from 2.113 to 0.198 W m−2 K−1) cut annual cooling load by 12.2%; Okonta [33] modelled a Lagos residence with wall U-value = 1.86 W m−2 K−1, within the range assumed here, and found combined insulation and shading reduced annual cooling load by 27.6%. These results support both the assumed U-value range and the order-of-magnitude sensitivity of cooling load to envelope conductive performance. The U = 0.857 W m−2 K−1 level corresponds to the ASHRAE 90.1-2019 prescriptive transmittance limit for above-grade walls in Climate Zone 1A [3] and serves as the primary engineering compliance reference throughout the analysis. An important physical caveat applies to Equation (16): it captures the steady-state conductive heat flux through the opaque envelope only, and does not account for solar radiation transmitted through glazing, latent heat exchange through infiltration and ventilation, or internal gains from occupants and equipment. The degree-day approach is therefore most appropriate for opaque envelope design assessment, which is the dominant assembly in Lagos commercial buildings where window-to-wall ratios are typically 20–40%, and the derived U-value requirements should be interpreted as the transmittance requirement for the opaque envelope fraction rather than a whole-building thermal performance standard.
2.5.2. Historical Design Baseline and the Design Gap Concept
The design heat flux baseline is the annual conductive heat flux that a building’s envelope and HVAC system were implicitly specified to manage when originally designed. This baseline is anchored to the Period 1 (P1, 1990–2001) mean CDD, which corresponds to the climate conditions that informed the Nigerian Building Code’s thermal design data [10]:
where the Period 1 mean CDD is:
The design gap in any year t is defined as the fractional excess of the actual CDD above the P1 baseline:
A positive gap implies that every square metre of building envelope designed to the historical P1 thermal environment is imposing a proportionally larger cooling load on the HVAC system than that system was specified to handle.
2.5.3. Required Envelope U-Value Under Elevated CDD
For a building designed with transmittance Udesign under the P1 baseline, the U-value required to maintain Q ≤ Qdesign as CDD rises is obtained by inverting Equation (15):
where CDD(t) is defined piecewise over the full observed and projected horizon:
where is the P3 period mean (the most recent 11-year mean, used as the 2024 projection anchor); is Sen’s slope in °C·days yr−1 (Equation (10)); and t is the calendar year.
The projected CDD trajectory (Equation (21b)) assumes trend stationarity: that the Sen’s slope estimated over the full 1990–2024 period continues unchanged through 2054. This assumption is explicitly conservative relative to CMIP6 projections, which show accelerating warming for the Guinea Coast zone under all Shared Socioeconomic Pathways [34,35]. The projection therefore represents a lower bound on the future design gap. To quantify the sensitivity of the projection to uncertainty in the Sen’s slope estimate, a symmetric uncertainty band of ±1 °C·days yr−1 around the central Sen’s slope is applied to all projected trajectories. This band is defined as:
The ±1 °C·days yr−1 band is a conservative representation of the slope estimation uncertainty: it does not incorporate scenario uncertainty from emission pathway differences, and therefore understates the full projection uncertainty range at longer horizons. To incorporate scenario uncertainty into the 2025–2054 CDD projections, bias-corrected annual CDD projections were derived from a four-model CMIP6 ensemble under SSP2-4.5 and SSP5-8.5, using daily maximum and minimum temperature data (tasmax, tasmin) from the NASA NEX-GDDP-CMIP6 bias-corrected downscaled dataset for the Lagos grid cell (6.52° N, 3.37° E). The models selected were ACCESS-CM2, CMCC-ESM2, MRI-ESM2-0, and NorESM2-MM for SSP2-4.5, and ACCESS-CM2, CMCC-ESM2, GFDL-ESM4, and MRI-ESM2-0 for SSP5-8.5, chosen on the basis of data availability and demonstrated performance over West Africa. Annual CDD was computed from daily mean temperature using Equation (1) applied to the MERRA-2 historical series. A per-model delta bias correction was applied using each model’s own 1995–2014 historical CDD mean as the reference period, subtracting the model’s historical CDD mean and adding the MERRA-2 observational baseline, thereby removing the well-documented CMIP6 warm bias over West Africa and expressing projected changes in MERRA-2-equivalent units. Ensemble statistics, including median, interquartile range (25–75th percentile), and 5–95th percentile, were computed across models for each year of the projection window.
Equation (20) is evaluated for all six Udesign levels and for each year t from 1990 to 2054. The resulting family of trajectories maps the progressive narrowing of the permissible envelope transmittance window across building typologies and provides the basis for the compliance zone analysis relative to the ASHRAE 90.1 Zone 1A limit.
2.5.4. HVAC Capacity Undersizing Index
The HVAC capacity undersizing index quantifies the ratio of the current or projected annual CDD demand to the design CDD against which the installed system was sized:
where CDD(t, b) follows the piecewise definition of Equations (21a) and (21b), and the two design baselines used are:
The engineering significance thresholds for are calibrated as indicated below:
Thresholds of I = 1.10 and I = 1.20 were adopted as operational caution boundaries, consistent with the commonly applied 10% and 20% safety margins in HVAC load estimation practice (ASHRAE, 2023, Chapter 3) [36]. These are interpreted here in terms of cumulative annual thermal load deviation, not peak-day capacity exceedance, and represent engineering judgement benchmarks rather than codified HVAC sizing limits. These thresholds are applied as engineering decision criteria rather than absolute performance standards; in practice, HVAC system response to excess load depends on outdoor design conditions, diversity factors, and control strategy. The undersizing index provides a consistent, year-by-year signal of the direction and magnitude of the capacity gap, not a binary pass/fail determination. Moreover, an important qualification applies to the undersizing index: HVAC systems are sized to peak design-day conditions (e.g., ASHRAE 0.4% design dry-bulb and wet-bulb), not annual CDD totals. The index developed here is therefore more precisely a ‘cumulative annual thermal load deviation index’: it indicates the degree to which the annual thermal demand environment has shifted relative to the historical baseline, with direct operational consequences (longer run-hours, higher part-load ratios, accelerated equipment deterioration) rather than a direct statement that installed plant capacity is exceeded on design days.
2.5.5. Annual Thermal Cycling Frequency and Structural Fatigue Proxy
The annual thermal cycling frequency is the count of days per year on which the daily mean temperature exceeds structural threshold b. It is formulated as an indicator function sum:
where the indicator function is defined as:
The trend in is characterised by Sen’s slope applied to the annual series:
The physical basis for treating as a structural fatigue proxy derives from ISO 15686-1:2011 [22] (service life planning) and ISO 11600:2003 [18] (sealant performance). ISO 15686-1 frames the design loading on building components in terms of the frequency and amplitude of thermal cycling events: for façade sealants, expansion joints, and cladding panel fixings, the relevant loading cycle is the daily temperature swing above and below the reference temperature for material calibration. At base 28 °C, represents the count of days per year on which the daily mean temperature exceeded the ISO 11600:2003 Type F2 elastomeric sealant’s upper service temperature reference, above which accelerated creep, UV-induced surface cracking, and adhesive failure occur.
3. Results and Discussion
3.1. Overview of the 35-Year Thermal Record
The 35-year (1990–2024) daily temperature record for Lagos reveals a thermally intense and warming climate baseline. Computed from the arithmetic mean of daily maximum (Tmax = 28.66 °C) and minimum (Tmin = 24.60 °C) temperatures, the mean daily temperature averaged across the full period is 26.37 °C (study-period mean of the derived daily mean), with the mean annual temperature series averaging 26.63 °C (±0.23 °C SD) across the 35 years. The coldest calendar year on record within the study period is 2012 (annual mean 26.31 °C), while 2024 is the warmest (27.26 °C)—a range of 0.96 °C that, though modest in absolute terms, translates into profoundly non-linear increases in cooling demand at higher base temperatures, as demonstrated in the sections that follow.
The full-period mean annual cooling degree days (CDDs) at the four base temperatures are: 1691 °C·days yr−1 (base 22 °C), 1217 °C·days yr−1 (base 23.3 °C), 316 °C·days yr−1 (base 26 °C), and 15 °C·days yr−1 (base 28 °C) as shown in Table 5. These values reflect the strongly differentiated sensitivity of the CDD metric to base temperature selection: increasing the base temperature from 22 °C to 28 °C reduces mean annual accumulation by a factor of approximately 113, underscoring the critical importance of matching base temperature to the intended design application.
Table 5.
Summary statistics for annual CDD at four base temperatures, Lagos, Nigeria (1990–2024).
3.2. Annual CDD Trends and Statistical Significance
3.2.1. Mann–Kendall and Sen’s Slope Results
Applying the TFPW MK test to the 35-year annual CDD series at each of the four base temperatures reveals statistically significant positive monotonic trends at three of the four bases (Figure 2). The detailed results are summarised in Table 6. Statistical significance is denoted throughout as *** (p < 0.001), ** (p < 0.01), * (p < 0.05), and n.s. (not significant).
Figure 2.
Annual CDD for Lagos, Nigeria (1990–2024), at four base temperatures with Sen’s slope trend and LOESS smoother. Statistical significance of the Mann-Kendall trend test: ** p < 0.01, * p < 0.05; n.s. = not significant (p ≥ 0.05).
Table 6.
Mann–Kendall trend and Sen’s Slope results for annual CDD series at four base temperatures.
At base 22 °C, the MK test yields τ = +0.375 (p = 0.0014), indicating a statistically significant positive trend at the 1% level. Sen’s slope of +4.42 °C·days yr−1 implies an increase of approximately 44 °C·days per decade, or a total accumulation of approximately +155 °C·days over the 35-year study period. The OLS coefficient of determination (R2 = 0.296) confirms that approximately 30% of the inter-annual CDD variance at this base temperature can be attributed to the linear time trend component, with the remaining variance attributable to year-to-year atmospheric variability [37]. At base 23.3 °C, the trend is marginally stronger (τ = +0.378, p = 0.0011; Sen’s slope = +4.55 °C·days yr−1, R2 = 0.301), which is physically consistent with the arithmetic of degree-day accumulation: since the 23.3 °C base eliminates the coldest portion of the daily temperature distribution, the surviving CDD values are drawn from a higher, more rapidly shifting part of the distribution, making the trend signal fractionally more pronounced [15,38]. At base 22 °C, the raw-series MK yields τ = +0.375, p = 0.0016, virtually identical to the TFPW result (τ = +0.375, p = 0.0014). At base 23.3 °C, raw-series MK yields τ = +0.378, p = 0.0015, again identical to the TFPW result (τ = +0.378, p = 0.0011). The trend direction, significance level, and Sen’s slope are unchanged in both cases, confirming that MK conclusions are invariant to the choice of TFPW application at these base temperatures.
At base 26 °C, the trend remains statistically significant but at the 5% level (τ = +0.308, p = 0.0117), there is a slight relaxation relative to the lower base temperatures, reflecting the higher inter-annual volatility of accumulation near this threshold. Sen’s slope diminishes to +2.83 °C·days yr−1 and R2 falls to 0.201. The reduced slope reflects the threshold non-linearity: at 26 °C, CDD accumulates only on days when the daily mean temperature exceeds this level, which particularly in the early decades occurred on a minority of days, and the annual total was therefore more volatile. This threshold non-linearity, whereby trend strength weakens and inter-annual volatility increases as fewer days contribute to CDD accumulation at higher base temperatures, was similarly observed by Dicko et al. [15] across West African stations at base temperatures of 26 °C and above. At base 28 °C, the MK test yields τ = +0.099 (p = 0.5532), which is not statistically significant at any conventional level. Sen’s slope is +0.15 °C·days yr−1 and R2 = 0.033. The absence of a statistically detectable trend at this base temperature over the full 1990–2024 record does not mean that no thermal change has occurred: rather, it reflects the extreme sparsity of days on which daily mean temperature exceeds 28 °C in Lagos’s climate. Through most of the study period, the 28 °C threshold was exceeded on fewer than 30 days per year, and in several years (2009, 2011, 2014) on fewer than 3 days. This makes the annual CDD series at this base temperature highly volatile (SD = 17 °C·days against a mean of just 15 °C·days), and statistical power is insufficient to discriminate a weak linear trend from noise over 35 years, a limitation well established in climate extreme indices with sparse threshold exceedance [39]. This result is consistent with findings in comparable tropical West African studies where no significant CDD trend was detected at higher base temperatures despite confirmed background warming [15].
The Hamed–Rao modified MK test applied to the raw (non-TFPW) series yielded identical conclusions at all four base temperatures, confirming that the TFPW procedure does not alter the inferential outcome and that the detected trends are robust to the autocorrelation correction method employed [40,41].
Under SSP2-4.5, the bias-corrected CMIP6 ensemble median projected annual CDD at base 23.3 °C for 2025–2054 exceeds the MERRA-2 historical baseline of 1179 °C·days yr−1 by +320 °C·days yr−1 (interquartile range (IQR): +273 to +385 °C·days yr−1), representing a 27.1% increase above the design-era baseline. Under SSP5-8.5, the corresponding increase is +403 °C·days yr−1 (IQR: +345 to +467 °C·days yr−1), equivalent to a 34.2% rise. The scenario envelopes are substantially wider than the ±1 °C·days yr−1 parametric band of the observational trend extrapolation, confirming that emission pathway uncertainty dominates projection uncertainty at the 30-year horizon. The observational trend extrapolation lies within but toward the lower bound of the SSP2-4.5 interquartile range, indicating that the trend-based projection is conservative relative to the full scenario envelope. Results are consistent across all four base temperatures: SSP5-8.5 exceeds SSP2-4.5 by approximately 80–83 °C·days yr−1 at bases 22 °C and 23.3 °C, narrowing to approximately 59 °C·days yr−1 at base 28 °C, reflecting the greater sensitivity of lower base temperatures to background warming. Projected increases at base 28 °C are +188 °C·days yr−1 under SSP2-4.5 (IQR: +134 to +262) and +247 °C·days yr−1 under SSP5-8.5 (IQR: +175 to +329), though these should be interpreted as indicative given the non-significant MK trend at this base temperature in the observational record.
3.2.2. OLS Regression and CDD–Temperature Correlation
The scatter plots of annual CDD against mean annual temperature (Figure 3) reveal an exceptionally tight linear relationship at the lower two base temperatures. At base 22 °C, the OLS regression explains 96.7% of inter-annual CDD variance (R2 = 0.967, p < 0.0001, slope = 340.2 °C·days yr−1), indicating that virtually all year-to-year fluctuation in annual CDD at this base temperature is mechanistically attributable to corresponding fluctuations in mean annual temperature, consistent with the well-established strong predictive relationship between annual mean temperature and annual CDD across global locations [38]. The relationship is nearly as strong at base 23.3 °C (R2 = 0.969, slope = 338.9 °C·days yr−1). Both slope values are physically interpretable: a 1 °C increase in mean annual temperature adds approximately 339–340 °C·days to the annual cooling load at these lower bases, which is equivalent to slightly less than one full year’s worth of additional daily mean temperature exceedance above the base threshold.
Figure 3.
Correlation between annual CDD and mean annual temperature showing how incremental warming translates into disproportionately large increases in cooling load. Statistical significance of their correlation: *** p < 0.001.
At base 26 °C, the relationship remains highly significant (R2 = 0.869, slope = 229.0 °C·days yr−1, p < 0.0001) but the scatter is noticeably larger, with 1998 and 2016 appearing as moderate leverage points on the right-hand tail. The reduced R2 at this base reflects the threshold amplification effect: small changes in the upper tail of the daily temperature distribution translate into disproportionately large CDD changes at a higher base temperature, introducing non-linearity not fully captured by the OLS linear fit [15]. At base 28 °C, the OLS R2 drops to 0.408 (slope = 46.1 °C·days yr−1, p < 0.0001); the relationship is statistically significant but the residual scatter is substantial, with 1998 and 2024 as dominant outliers. The 1998 outlier is attributable to the 1997–1998 El Niño event, the strongest recorded in the 20th century. During El Niño events, anomalous warming of the equatorial Pacific perturbs the Walker Circulation, increasing atmospheric subsidence over West Africa and suppressing the West African Monsoon; the resultant rainfall deficits over the Guinea coast reduce evaporative cooling and drive anomalously high surface temperatures across southern Nigeria during the wet season [42,43]. The 2016 outlier (second-highest at the 26 °C base) similarly coincides with the 2015–2016 El Niño, the strongest of the satellite era at that point. The robustness of Sen’s slope to these outliers (as a median-based estimator) is a principal motivation for its selection as the primary trend magnitude estimator. The low slope at 28 °C confirms that unit changes in mean annual temperature produce only a small average increment in 28 °C CDD, but that specific years with anomalously warm upper tails generate extreme CDD values that dominate the time series statistics [15]. This divergence between the mean-temperature slope and the tail-driven outlier magnitude is a characteristic feature of high-threshold exceedance series [44].
A consistent feature across all base temperatures is that 2024 is the highest CDD year on record, and that the three highest CDD years at the 22 °C and 23.3 °C bases are all from the most recent sub-period (2021, 2023, 2024) as depicted in Figure 3. The dominance of the most recent years in the CDD ranking aligns with the global temperature record, in which 2024 was confirmed as the warmest year in Africa’s instrumental record, with the past decade constituting the warmest ten-year period ever documented on the continent [45,46]. A recent study specifically identified Nigeria as among the countries where a majority of the population experienced a locally record warm annual average in 2024 [47]. At the 26 °C base, however, 1998 (426 °C·days) and 2016 (402 °C·days) rank second and third, respectively reflecting the outsized influence of those particular warm events at higher threshold temperatures. At the 28 °C base, the extreme value structure is still more non-linear: 2024 (81 °C·days) is nearly 4.5 times larger than the second-highest year on record (1998, 69 °C·days), indicating that the uppermost tail of the temperature distribution has moved dramatically above the 28 °C threshold only in the most recent decade consistent with the accelerating warming trend documented across Lagos and the confirmation that Africa’s most recent decade is the warmest in the continent’s climate record [12,45].
3.3. Sub-Period Analysis and Temporal Acceleration
3.3.1. Mean CDD by Sub-Period
Division of the 35-year record into three 11–12-year sub-periods (P1: 1990–2001, P2: 2002–2013, P3: 2014–2024) reveals a pattern of pronounced temporal acceleration that is not apparent from the full-period linear trend alone as illustrated in Figure 4. The mean annual temperature during P1 was 26.53 °C, essentially unchanged in P2 (26.55 °C), and then rose markedly to 26.83 °C in P3, a P1-to-P3 warming of 0.30 °C concentrated almost entirely in the most recent 11 years.
Figure 4.
Sub-period mean annual CDD compared against published and historical design baselines.
The plateau-then-acceleration structure is a defining characteristic of this dataset. At base 22 °C, the P1-to-P2 increment (+8 °C·days yr−1, +0.5%) is negligible, while the P2-to-P3 jump (+104 °C·days yr−1, +6.3%) is dramatic. The same pattern repeats at 23.3 °C (+9 and +103 °C·days yr−1 respectively) and at 26 °C (−2 and +69 °C·days yr−1), where P2 actually recorded a marginal decrease relative to P1 before the strong P3 acceleration. This plateau-then-surge structure supports the global pattern of accelerating surface warming post-2014 documented across multiple CMIP6 model runs [34,35]. At base 23.3 °C, the most widely cited ASHRAE 90.1 reference for tropical mixed-mode design applications [3], the P3 mean of 1291 3 °C·days yr−1 exceeds the P1 baseline of 1179 °C·days yr−1 by +112 °C·days yr−1 (+9.5%), as depicted in Figure 4b, meaning that every building in Lagos currently experiences a thermal load environment approximately 9–10% more demanding than the climate data against which its HVAC system and envelope were specified. This 9.5% increase represents a 9.5% increase in the outdoor thermal driving force—the cumulative temperature excess above the comfort base, which is the standard climate severity index used in ISO 15927-6 and ASHRAE practice. It directly scales the conductive component (Q = CDD × U × A) and contributes to ventilation/infiltration-related cooling load, though solar, latent, and internal gains do not scale at the same rate. The increment therefore describes the increase in outdoor thermal severity and its direct conductive-load consequence, and should not be evaluated as implying a 9–10% increase in total building cooling energy consumption.
The threshold non-linearity amplifies the P1-to-P3 percentage change in proportion to the base temperature. The 6.8% increase at 22 °C expands to 9.5% at 23.3 °C, 22.7% at 26 °C, and 50.0% at 28 °C (Figure 4). This escalating percentage change with base temperature reflects the physical principle that degree-day accumulation near a threshold is geometrically sensitive to shifts in the underlying temperature distribution. For engineering practice, this means that buildings designed to the most demanding thermal standard, i.e., those with indoor set-points approaching 28 °C, face a proportionally larger capacity gap than those designed to a 22 °C or 23.3 °C internal comfort temperature.
3.3.2. Trend Onset Detection Analysis
The structural break analysis (Figure 5) reinforces the sub-period results. The CUSUM statistic of standardised CDD anomalies reaches its minimum in 2015 at all four base temperatures, identifying 2015 as the transition year between the persistently below-mean regime of P1/P2 and the persistently above-mean regime of P3. The consistency of this structural break year across all four base temperatures is noteworthy: it suggests that the change in mean climate state that drove the CDD increase is a broad-spectrum shift in the daily temperature distribution rather than a change confined to a particular quantile. This broad-spectrum character is also found in a study by Gbode et al. [14], where significant increases in warm spell frequency, warm days, and warm nights alongside reductions in cold days and cold nights across all three climatic zones of Nigeria, including the Guinea Coast, indicate that the warming manifests across the full daily temperature distribution rather than at isolated extremes.
Figure 5.
CUSUM of standardised CDD anomalies illustrating the structural break detection at four base temperatures. (a) Base temperature: 22 °C. (b) Base temperature: 23.3 °C. (c) Base temperature: 26 °C. (d) Base temperature: 28 °C.
To formally confirm the structural break identified by visual inspection of the CUSUM diagram, the Pettitt non-parametric change-point test was applied to each annual CDD series [30]. The test confirms 2015 as the statistically significant structural break year at base temperatures 22 °C (K_T = 198, p = 0.003), 23.3 °C (K_T = 198, p = 0.003), and 26 °C (K_T = 184, p = 0.006), fully consistent with the CUSUM minimum identified at 2015 and the sub-period boundary of P3 adopted in the study. At 28 °C, the CUSUM minimum at 2015 is present but shallow, and the Pettitt test does not confirm a statistically significant level shift at this base temperature (K_T = 118, p = 0.199), consistent with the non-significant Mann–Kendall trend and the high inter-annual volatility of the 28 °C series driven by ENSO-related extreme years. The 28 °C structural break result is therefore treated as descriptive rather than inferentially confirmed, consistent with the treatment of the 28 °C trend results throughout the analysis.
The Sequential Mann–Kendall (SQMK) progressive and retrograde statistics (Figure 6) provide a complementary perspective on the temporal structure of the trend. At all four base temperatures, the progressive statistic u(t) first exceeds the −1.96 significance threshold (indicating a statistically confirmed downward trend in the pre-2015 below-mean regime) in 1992, meaning that a statistically significant monotonic trend had already emerged within the first three years of the record. This early detection is consistent with the plateau structure: the CDD series at lower base temperatures shows very limited variability through P1 and P2, so even a modest systematic direction in the data produces an early MK significance crossing. This interpretation aligns with Bisai et al. [48], who demonstrated using the SQMK test on a long surface air temperature series that when forward sequential values u(t) and retrograde values u′(t) intersect, the intersection identifies the approximate turning point of the trend within the time series, and that statistically significant crossings within a short early window of the record are attributable to low variability in the pre-shift regime.
Figure 6.
SQMK progressive and retrograde statistics confirming the monotonic trend significant. (a) Base temperature: 22 °C. (b) Base temperature: 23.3 °C. (c) Base temperature: 26 °C. (d) Base temperature: 28 °C.
The intersection of u(t) and u′(t) within the significance band, the SQMK-identified trend onset, occurs in the early 2010s across all base temperatures, approximately coinciding with the CUSUM structural break at 2015. Dicko et al. [15] identified 2015 as the year of most significant CDD impact in their analysis of West African cities, with the structural break appearing in the early-to-mid 2010s at multiple base temperatures. Beyond approximately 2015–2016, the progressive statistic u(t) turns sharply negative (increasing CDD), and the retrograde statistic u′(t) rises toward zero from the right, creating a pronounced V-shape that is characteristic of a strong, abrupt trend shift rather than a gradual monotonic change. This pattern confirms that the dominant trend signal in the Lagos CDD series is not a smooth linear increase over the full 35 years but rather a step-change amplification concentrated in the post-2015 period.
3.4. Seasonal and Monthly CDD Structure
3.4.1. Monthly CDD Climatology
The 35-year monthly CDD climatology (Figure 7) reveals a thermal annual cycle that is markedly different from temperate climate patterns. At base 22 °C, monthly CDD values remain elevated throughout the year, with the minimum in August (96 °C·days, coinciding with the August Meteorological Break in rainfall) and the maximum in March (184 °C·days), the hottest dry-season month before the onset of the West African Monsoon. In southern Nigeria, the wet season exhibits a bimodal rainfall pattern peaking in June–July and September–October, interrupted by a short dry spell in August commonly referred to as the “August break” [49]. March consistently records the highest temperatures of the year in Lagos, with average maximum temperatures reaching approximately 32.7 °C, while July represents the coolest month with average highs near 28.1 °C [50]. The dry season months (November–March) individually contribute 142, 159, 184, 151, and 150 °C·days respectively at base 22 °C. The wet season months (April–October) contribute 171, 164, 130, 105, 96, 108, and 132 °C·days respectively, with a pronounced reduction in June–September associated with monsoonal cooling. During the boreal spring transition (March–June), dry, warm Harmattan winds from the Sahara are replaced by moisture-laden southwesterly flows from the tropical Atlantic, fundamentally altering the surface energy balance [51].
Figure 7.
Monthly CDD climatology showing the annual thermal cycle of Lagos, Nigeria.
The seasonal contrast becomes dramatically more pronounced at higher base temperatures. Studies across West African cities have demonstrated that a lower base temperature leads to higher computed energy consumption while a higher base temperature leads to lower energy consumption, reflecting the non-linear sensitivity of CDD accumulation to the chosen thermal threshold [15]. At base 26 °C, wet-season CDD values collapse to near zero in July (1 °C·day) and August (0 °C·days), with October (12), September (2), and June (13) also contributing negligibly. The entire annual 26 °C CDD accumulation (mean = 316 °C·days yr−1) is dominated by the dry-season months of February (46), March (60), and April (51), and by the dry-to-wet transition period. In Lagos, the highest temperatures occur within the dry season when average maximum temperatures range from approximately 31 °C to 33 °C, confirming the dry season as the dominant driver of thermal stress at higher base thresholds [52]. At base 28 °C, meaningful CDD accumulation is essentially confined to February (4), March (6), and April (4), and the annual total of 15 °C·days yr−1 is so small that individual day events of extreme heat drive the entire annual tally.
3.4.2. Seasonal Trend Attribution
The Sen’s slope sensitivity heat matrix (Figure 8a) provides a comprehensive decomposition of trend strength by temporal context and base temperature. For the full period at the 22 °C and 23.3 °C bases, the wet-season (April–October) Sen’s slope (+4.21 °C·days yr−1, p < 0.001) is markedly larger than the dry-season slope (+0.48–0.40 °C·days yr−1, not significant), indicating that the overall annual CDD trend is disproportionately driven by increasing wet-season temperatures. This is a climatologically significant finding: the West African Monsoon is not simply suppressing dry-season warming; it is the season in which the most statistically robust thermal intensification is occurring.
Figure 8.
Sen’s slope sensitivity heat matrix showing that CDD growth is concentrated in the wet season and in P3 (2014–2024). Statistical significance: *** p < 0.001, ** p < 0.01, * p < 0.05; n.s. = not significant (p ≥ 0.05).
The month-by-month Sen’s slope pattern (Figure 8b) confirms that statistically significant positive trends at base 22 °C and 23.3 °C are concentrated in the months April through November (+0.36 to +0.77 °C·days yr−1, ** to *** significance), with the peak signal in July (+0.77, p < 0.001) and August (+0.70, p < 0.01). Independent station-level analysis of Lagos climate data found significant maximum temperature increases in July, August, October, and November during the period 2000–2009, confirming a warming pattern concentrated in the mid-to-late wet season months [53]. January and December show near-zero and marginally negative slopes that are not significant at any level. The concentration of trend significance in mid-to-late wet season months is consistent with an intensification of the latent heat flux under the monsoon circulation, likely associated with increasing sea surface temperatures in the Gulf of Guinea [37].
The monthly CDD heatmap (Figure 9) provides the same information in a spatiotemporal format. The progressive darkening (increasing CDD) from the 1990s to the 2020s is visible across all months but is most pronounced in the wet season columns (May–October), where the colour gradient from cool blue in the 1990s to deep blue in the 2020s is most visually striking. The anomaly heatmap (Figure 9b) shows a clear transition from predominantly below-climatology (blue) conditions in the early 2000s to predominantly above-climatology (red/orange) conditions from approximately 2016 onwards, consistent with the 2015 structural break identified by the CUSUM analysis. Distribution-free CUSUM analysis of temperature series in Nigerian cities has demonstrated its effectiveness in pinpointing abrupt climatic shift years, with significant change-points identified through exceedance of critical CUSUM values that represent statistically robust structural transitions in the temperature regime [40]. The annual CDD partitioned by season (Figure 9c) confirms that both wet-season and dry-season contributions to annual CDD have increased in P3, but the wet-season contribution (vermilion area) has grown proportionally more steeply, a finding consistent with the seasonal Sen’s slope analysis.
Figure 9.
Monthly CDD heatmap (year × month) at base temperature 23.3 °C illustrating the progressive increase across nearly all months in recent years. Dotted lines indicate the boundaries separating each period (P1: 1990–2001, P2: 2002–2013, P3: 2014–2024).
3.5. Engineering Implications I: Required Envelope U-Value Under the Elevated CDD Regime
Figure 10 illustrates the evolution of required envelope U-values from 1990 to 2054 across six design levels (0.5–2.5 W m−2 K−1), benchmarked against the ASHRAE 90.1-2019 Zone 1A prescriptive wall limit of 0.857 W m−2 K−1. The shaded sensitivity band represents the full range of projected U-value trajectories required to maintain the P1 design heat flux under rising CDD conditions. Results show a persistent downward shift in required U-values over time, indicating that progressively lower envelope transmittance is needed to offset increasing cooling demand. This finding supports the degree-day framework established by Shahid et al. [6], who demonstrated using the CDD method across Indian climate zones that optimum insulation thickness, and by extension the required envelope transmittance, is directly governed by the magnitude of cooling degree days, such that higher CDD regimes demand thicker insulation and lower U-values to maintain thermal performance targets.
Figure 10.
Required envelope U-value to maintain design heat flux as CDD rises benchmarked against the ASHRAE 90.1 Zone 1A limit of 0.857 W m−2 K−1.
The highest trajectories (2.5 and 2.0 W m−2 K−1), representing typical uninsulated sandcrete construction, remain entirely within the non-compliant zone throughout the study and projection periods. Although the required U-values decline over time, they remain far above the ASHRAE limit, demonstrating that most existing Lagos commercial buildings are already operating with substantially poorer thermal performance than required under current climatic conditions. This is corroborated by Opoku et al. [54], who confirmed that uninsulated sandcrete block walls are the dominant envelope assembly in sub-Saharan Africa, exhibiting high thermal conductivity that leads directly to elevated heat transmission loads through the building envelope and correspondingly high cooling electricity consumption. Similarly, the 1.5 W m−2 K−1 trajectory also remains persistently non-compliant, with projected required values still significantly above the prescriptive threshold by 2054.
The 1.0 W m−2 K−1 trajectory occupies a transitional zone. Initially close to compliance during P1, rising CDD conditions progressively reduce the allowable U-value, causing the installed specification to become increasingly inadequate from approximately 2014 onward. By contrast, the lower trajectories corresponding to the ASHRAE limit (0.857 W m−2 K−1) and well-insulated modern construction (0.5 W m−2 K−1) remain within the compliant zone throughout the projection horizon, although their required values continue to decline, indicating a tightening thermal performance requirement over time. The utility of degree-day-based performance curves to characterise this tightening window across climate scenarios is supported by Batiha et al. [55], who introduced thermal insulation performance curves (TIPCs) derived from heating and cooling degree-day inputs and demonstrated that a single climate-dependent factor encompassing CDD, energy cost, and insulation cost can capture the full permissible insulation performance envelope for any building type, providing a methodological parallel to the trajectory family presented here.
Overall, Figure 10 demonstrates a widening thermal performance gap between installed envelope systems and the increasingly stringent U-values required to maintain historical design heat flux levels under future warming conditions. The results indicate that uninsulated sandcrete typologies, which dominate Lagos commercial construction, are becoming progressively less climate-resilient, while even buildings designed to current ASHRAE standards may require further reductions in envelope transmittance in the coming decades.
3.6. Engineering Implications II: HVAC Capacity Undersizing Index
Figure 11 presents the distribution of the HVAC undersizing index (ratio of annual CDD to historical design CDD) from 1990 to 2054 using violin plots for four periods: P1 (1990–2001), P2 (2002–2013), P3 (2014–2024), and the projected 2025–2054 period. The P1 distribution is narrow and centred around the design capacity line (I = 1.00), with a median of 0.997, indicating that HVAC systems during the baseline period generally operated within their intended design limits. P2 shows only a slight increase in median value (1.010) and continued clustering around the design threshold, reflecting relative stability despite short-term climatic oscillations. This early period behaviour is corroborated by Bell et al. [56], who showed that HVAC sizing methods based on historical design day data perform adequately under stable climate conditions but become progressively inadequate as climate shifts accumulate, because design day datasets are rarely updated to reflect recent warming trends.
Figure 11.
Annual cumulative thermal load deviation index quantifying the increasing risk of thermal comfort failure in buildings sized to historical cooling load baselines.
A clear shift emerges during P3, where the median index increases to 1.102, placing the average year at the engineering caution threshold of +10% overload. Several recent years, particularly 2021, 2023, and 2024, exceed I = 1.20, indicating significant HVAC undersizing relative to the historical baseline. These results suggest that many systems designed using earlier climatic conditions are already operating beyond their intended cooling capacity. This is directly supported by Ishola et al. [57], who established that HVAC systems in Lagos and across Nigeria are routinely undersized due to the use of outdated or non-localised design conditions, resulting in systems that struggle to maintain indoor comfort, a condition that worsens as the gap between design-era CDDs and current CDDs grows.
The projected 2025–2054 distribution indicates further escalation, with a median index of approximately 1.155 and most projected years remaining above the caution threshold. The broader violin shape reflects increasing variability and uncertainty in future cooling demand, while the upper range approaches or exceeds the significant undersizing threshold (I = 1.20). This pattern is consistent with the finding of Ishola et al. [16], who showed a pronounced and sustained increase in cooling degree hours across two distinct periods in Lagos (Layer 1: 2001–2012 and Layer 2: 2012–2023), with the more recent layer exhibiting markedly higher CDH values that signal an already-loaded cooling infrastructure facing accelerating demand. This implies that future HVAC systems in Lagos are likely to experience persistent overload conditions, leading to reduced thermal comfort, declining operational efficiency, accelerated equipment wear, and potentially shorter replacement cycles than assumed in conventional building life-cycle planning [56]. The 33% average projected increase in building cooling demand across tropical climates by the middle of the 21st century reported by Khourchid et al. [58] provides a global benchmark that frames the Lagos undersizing trajectory as representative of a systemic tropical-city challenge rather than a local anomaly.
3.7. Engineering Implications III: Annual Thermal Cycling Frequency and Structural Fatigue Implications
Figure 12 shows the annual thermal cycling frequency, defined as the number of days per year in which the daily mean temperature exceeds selected structural thresholds, serving as a proxy for thermal fatigue loading on façade sealants, expansion joints, and cladding fixings under ISO 15686-1:2011. At the lower thresholds of 22 °C and 23.3 °C, cycling frequency remains effectively constant throughout the study period, with temperatures exceeding these thresholds almost every day of the year. This indicates no meaningful increase in thermal fatigue loading at these bases.
Figure 12.
Annual thermal cycling frequency at each base temperature.
At the 26 °C threshold, however, a statistically significant increasing trend is observed. The annual frequency rises from an average of 236 days yr−1 in P1 to 269 days yr−1 in P3, with a Sen’s slope of +1.22 days yr−1, representing an overall increase of 44 days (+17.7%). This indicates a substantial increase in the duration of annual thermal expansion stress experienced by façade assemblies. This finding aligns with the evidence compiled by Athauda et al. [59], who documented that increasing temperature and moisture variations attributable to climate change cause façade building materials to undergo more frequent and severe cycles of expansion and contraction, resulting in cracking, deformation, and material degradation, and that these effects directly translate into increased maintenance requirements and shortened effective service lives of façade components.
The most pronounced change occurs at the 28 °C threshold. Annual cycling frequency increases from 33 days yr−1 in P1 to 54 days yr−1 in P3, representing a +63.6% increase in thermal stress cycles, with a Sen’s slope of +0.68 days yr−1. For ISO 11600:2003 Type F2 elastomeric sealants commonly used in curtain wall façade joints, this increase represents a significant acceleration in fatigue loading conditions. The physical mechanism is well established: Riahinezhad et al. [60] demonstrated that diurnal cycles of contraction and dilation arising from daily temperature fluctuations impose significant and cumulative stress on sealants and expansion joints, and that the crack growth rate and time-to-failure of elastomeric sealants are directly governed by the frequency and magnitude of thermally induced cyclic movement with projected future climates producing measurably shorter service lives compared to historical baselines. Nečasová et al. [61] further confirm that sealed joints in façade applications are expected to have service lives of 10–20 years under standard exposure conditions, but that intensified thermal and mechanical loading conditions of the type this study precisely quantifies can substantially shorten that service life. Consequently, maintenance and replacement schedules calibrated to the earlier P1 climate may no longer be adequate under present and projected thermal conditions. The results therefore suggest that façade sealant systems designed for conventional 15–20-year service lives under earlier climatic regimes may experience substantially shortened effective service lives under future warming conditions. This conclusion is reinforced by Lacasse et al. [62], who established that increases in CO2 concentration, temperature, and relative humidity arising from a changing climate will accelerate building material degradation processes, causing a decrease in serviceability and durability of building components and that service life prediction estimates based on historical climate data must be revised upward in their uncertainty bounds to account for climate-driven acceleration of deterioration. The absence of a statistically significant MK trend at 28 °C means that the +63.6% increase in thermal cycling frequency from P1 to P3 and associated engineering observations should be interpreted as descriptive sub-period comparisons rather than trend-confirmed findings. The high inter-annual volatility of the 28 °C series (SD = 17 °C·days, mean = 15 °C·days) dominated by a few extreme years (2024: 81 °C·days; 1998: 69 °C·days) means statistical power is insufficient to confirm a monotonic trend. The 28 °C fatigue-loading results are therefore presented as a plausible leading indicator warranting monitoring and material testing, not as a confirmed engineering design parameter.
4. Conclusions
This study presents the first statistically rigorous, 35-year CDD trend analysis for Lagos, Nigeria (1990–2024), anchored to four engineering-relevant base temperatures (22 °C, 23.3 °C, 26 °C, and 28 °C) and coupled directly to quantified building design gap analyses. The following are the principal conclusions of the study:
- Statistically significant positive monotonic CDD trends are confirmed at three base temperatures: τ = +0.375 (p = 0.0014), Sen’s slope = +4.42 °C·days yr−1 at 22 °C; τ = +0.378 (p = 0.0011), Sen’s slope = +4.55 °C·days yr−1 at 23.3 °C; and τ = +0.308 (p = 0.0117), Sen’s slope = +2.83 °C·days yr−1 at 26 °C. No significant trend is detected at 28 °C (p = 0.5532), reflecting sparse threshold exceedance and insufficient statistical power over 35 years.
- The trend follows a plateau-then-acceleration structure, with negligible change from P1 (1990–2001) to P2 (2002–2013), followed by a sharp P3 (2014–2024) acceleration. The P1-to-P3 increase amplifies with base temperature: +6.8% at 22 °C, +9.5% at 23.3 °C, +22.7% at 26 °C, and +50.0% at 28 °C. This confirms that buildings designed to higher indoor set-points face disproportionately larger thermal load gaps.
- CUSUM, Sequential Mann–Kendall, and Pettitt change-point analyses consistently identify 2015 as the structural break year at 22 °C, 23.3 °C, and 26 °C (p ≤ 0.006), marking the transition to a persistently above-baseline CDD regime consistent with the mid-2010s acceleration documented in the broader sub-Saharan African temperature record.
- The CDD increase is disproportionately driven by the wet season (April–October), with wet-season Sen’s slopes of +4.21 °C·days yr−1 at base 22 °C (p < 0.001) far exceeding non-significant dry-season slopes. July and August carry the strongest monthly signals, indicating that the West African Monsoon season is intensifying thermally rather than providing nocturnal cooling relief.
- Uninsulated sandcrete construction (U = 1.5–2.5 W m−2 K−1), which constitutes the majority of Lagos’s commercial building stock, remains continuously non-compliant with the ASHRAE 90.1-2019 Zone 1A prescriptive wall limit of 0.857 W m−2 K−1 throughout the full 1990–2054 horizon. Even envelopes specified at the ASHRAE limit face a tightening performance requirement as CDD continues to rise.
- The cumulative annual thermal load deviation index shows HVAC systems sized to the P1 baseline operating near design limits through P2 (median index 1.010) before entering the engineering caution zone during P3 (median index 1.102), with 2021, 2023, and 2024 exceeding the significant overload threshold of 1.20, with direct operational consequences for run-hours, part-load ratios, and equipment deterioration.
- Annual thermal cycling frequency at the 26 °C threshold has increased by +44 days yr−1 (+17.7%) from P1 to P3 (Sen’s slope = +1.22 days yr−1, trend-confirmed), representing a statistically confirmed acceleration in fatigue loading on façade sealants and expansion joints under ISO 15686-1:2011 and ISO 11600:2003, warranting downward revision of conventional 15–20 year service life assumptions. The corresponding +63.6% increase at 28 °C is descriptive only and should be treated as a plausible leading indicator rather than a confirmed design parameter.
- Taken together, the three engineering gap analyses confirm that the thermal environment embedded in NB 485:2017, anchored to 1990s-era climate data, is systematically inconsistent with the thermal loads Lagos buildings have experienced since 2015 and will continue to face through at least 2054.
Beyond its application to Lagos, the methodology developed in this study is readily transferable to other rapidly urbanising tropical cities facing comparable conditions: a humid climate, an intensifying urban heat island, an ageing building stock dominated by uninsulated masonry construction, and building codes anchored to outdated climate normals. Because the framework relies exclusively on globally available MERRA-2/NASA POWER reanalysis data and CMIP6 ensemble projections, it requires no dedicated local instrumentation and can be applied directly to cities such as Accra, Abidjan, Dar es Salaam, Mumbai, Jakarta, and Manila, each of which shares Lagos’s combination of rapid urban growth and humid–tropical CDD sensitivity. The four-base-temperature, sub-period, and structural-break analytical structure presented here thus offers a replicable template for establishing climate-adaptation evidence bases in other Global South megacities where local meteorological records are similarly sparse or inaccessible.
5. Role and Significance of the Study
This study directly addresses a regulatory and design evidence gap that affects one of the world’s largest and fastest-growing tropical megacities. By combining the longest CDD trend record published for any Nigerian city with a quantitative translation of those trends into engineering design gap figures expressed as percentage exceedances of established code references, it provides the first evidence base from which policymakers, standards bodies, and practising engineers in Nigeria can assess the magnitude of the climate adaptation deficit embedded in existing building design practice.
For building regulators and standards bodies, the findings provide a directly actionable case for the revision of thermal design references in the Nigerian Building Code (NB 485:2017). The quantified P1-to-P3 CDD exceedances at four base temperatures supply the input data required to update climate zone assignments and prescriptive U-value limits for Climate Zone 1A-equivalent conditions in Lagos without additional data collection.
For structural and mechanical engineers, the HVAC undersizing index and the envelope U-value trajectory analyses provide a practical, year-by-year diagnostic of the gap between installed building capacity and current thermal demand. The results enable practising engineers to quantify retrofit insulation requirements and HVAC uprating needs for existing buildings using the same ISO 15927-6 degree-day framework that governs initial design, supporting evidence-based retrofit specification rather than rule-of-thumb upgrades.
For structural durability and façade engineering practice, the thermal cycling frequency results supply the first published quantification of the acceleration in fatigue loading on sealants, expansion joints, and cladding fixings attributable to a documented multi-decade climate trend for Lagos. These figures can be incorporated directly into ISO 15686-1 service life planning procedures and into ISO 11600:2003 sealant performance assessments, enabling engineers to adjust maintenance schedules and replacement cycles to reflect current rather than historical thermal loading conditions.
6. Limitations of the Study and Future Work
Limitations of the present study should be noted when applying or extending its findings. First, the analysis relies on a single NASA POWER MERRA-2 grid point (50 km resolution) and cannot resolve intra-urban temperature variability across Lagos’s heterogeneous urban fabric. The likely underestimation of urban thermal exposure is characterised at approximately 5–15% of reported CDD values for buildings in the urban core; however, because the same grid point is used consistently across the 35-year record, this bias is approximately stationary and affects absolute CDD levels rather than the trends, significance levels, or relative sub-period comparisons central to this study’s conclusions. Future work integrating NiMET station records and satellite-derived Land Surface Temperature data would enable spatially resolved, neighbourhood-scale CDD mapping. Second, the engineering framework is based on steady-state ISO 15927-6 conductive heat flux relationships and does not account for latent heat, solar gains, ventilation loads, or internal gains. The derived U-value requirements and load deviation indices should therefore be interpreted as opaque envelope assessments rather than whole-building energy performance indicators. Whole-building dynamic energy simulation with Lagos-specific archetypes and occupancy schedules is identified as a priority for future work. Third, although bias-corrected CMIP6 projections under SSP2-4.5 and SSP5-8.5 have been incorporated, the ensemble comprises only four models per scenario. Model structural uncertainty arising from differences in convective parameterisation and West African Monsoon representation is not fully captured at this ensemble size, and expanding the model pool with probabilistic skill-based weighting is recommended for future scenario assessments. Fourth, the thermal cycling analysis uses daily mean temperature exceedance as a fatigue loading proxy without modelling strain amplitudes or non-linear damage accumulation in specific sealant and cladding systems. Translating the cycling frequency increases quantified here into quantitative service life estimates requires materials science collaboration, including accelerated weathering tests calibrated to the thermal loading conditions documented in this study.
Author Contributions
Conceptualization, O.B.; Methodology, O.B., B.L. and N.B.; Software, O.B. and J.A.; Validation, B.L. and N.B.; Investigation, J.A.; Writing—original draft, O.B. and J.A.; Writing—review & editing, B.L. and N.B.; Visualization, O.B. and J.A.; Supervision, B.L. and N.B. All authors have read and agreed to the published version of the manuscript.
Funding
This research received no external funding.
Data Availability Statement
The daily temperature data used in this study were obtained from the NASA POWER project and are freely and publicly available through the NASA POWER Data Access Viewer at https://power.larc.nasa.gov/data-access-viewer/ (accessed on 1 April 2026). The derived data generated in this study are available from the corresponding author upon reasonable request.
Conflicts of Interest
Author Benjamin Labar was employed by the company Nidaco Nigeria Limited. The remaining authors declare that the research was conducted in the absence of any commercial or financial relationships that could be construed as a potential conflict of interest.
Abbreviations
| 4D-Var | Four-Dimensional Variational data assimilation |
| ACF | Autocorrelation Function |
| ASHRAE | American Society of Heating, Refrigerating and Air-Conditioning Engineers |
| CDD | Cooling Degree Day(s) |
| CDH | Cooling Degree Hour(s) |
| CMIP6 | Coupled Model Intercomparison Project Phase 6 |
| CUSUM | Cumulative Sum |
| HVAC | Heating, Ventilation, and Air Conditioning |
| LOESS | Locally Estimated Scatterplot Smoothing |
| MERRA-2 | Modern-Era Retrospective analysis for Research and Applications, Version 2 |
| MK | Mann–Kendall |
| NB | Nigerian Building Code Standard |
| NiMET | Nigerian Meteorological Agency |
| OLS | Ordinary Least Squares |
| POWER | Prediction Of Worldwide Energy Resources (NASA) |
| RH | Relative Humidity |
| SMK | Seasonal Mann–Kendall |
| SQMK | Sequential (Progressive) Mann–Kendall |
| SSP | Shared Socioeconomic Pathway |
| TFPW | Trend-Free Pre-Whitening |
| TIPC | Thermal Insulation Performance Curve |
| UHI | Urban Heat Island |
| CDDdaily | Daily Cooling Degree Day value (°C·day) |
| CDDannual | Annual Cooling Degree Day total (°C·days yr−1) |
| Ncycle | Annual thermal cycling frequency (days yr−1) |
| Ny | Number of days in calendar year (365 or 366) |
| P1 | Sub-period 1: 1990–2001 (historical baseline) |
| P2 | Sub-period 2: 2002–2013 (transition period) |
| P3 | Sub-period 3: 2014–2024 (current period) |
| Q | Annual conductive heat flux through envelope (Wh m−2 yr−1 or kWh m−2 yr−1) |
| R2 | Coefficient of determination (OLS) |
| S | Mann–Kendall test statistic (sum of concordant minus discordant pairs) |
| Sk | Within-season Mann–Kendall S statistic |
| SSMK | Overall Seasonal Mann–Kendall test statistic |
| Tb | Base temperature for CDD computation (°C) |
| Ŧmean | Daily mean temperature derived from arithmetic mean of Tmax and Tmin (°C) |
| Tmax | Daily maximum surface air temperature (°C) |
| Tmin | Daily minimum surface air temperature (°C) |
| U | Thermal transmittance of building envelope (W m−2 K−1) |
| Ureq(t) | Required envelope U-value in year t to maintain design heat flux (W m−2 K−1) |
| X(t) | Original annual CDD time series value |
| X*(t) | TFPW-corrected annual CDD series |
| Detrended CDD residuals after Sen’s slope removal | |
| βs | Sen’s slope—median pairwise slope of annual CDD series (°C·days yr−1) |
| βs(N) | Sen’s slope of annual thermal cycling frequency series (days yr−1) |
| βs,k | Per-month Sen’s slope (°C·days yr−1) |
| ε′(t) | Pre-whitened residuals after lag-1 autocorrelation removal |
| τ | Kendall’s tau—normalised Mann–Kendall trend statistic |
| K_T | Pettitt test statistic |
| IQR | Interquartile range |
References
- UNEP. Global Status Report for Buildings and Construction 2024/2025; United Nations Environment Programme: Nairobi, Kenya, 2024. [Google Scholar]
- Awolola, O.O.; Olorunmaiye, J.A. Cooling Degree Days for Estimating Energy Consumption in Air Conditioning Systems in Nigeria. J. Clean Energy Technol. 2020, 8, 5–10. [Google Scholar] [CrossRef] [Scilit]
- ASHRAE Standard 90.1-2019; Energy Standard for Buildings Except Low-Rise Residential Buildings. ASHRAE: Atlanta, GA, USA, 2019.
- ISO 15927-6:2007; Hygrothermal Performance of Buildings—Calculation and Presentation of Climatic Data—Part 6: Accumulated Temperature Differences. ISO: Geneva, Switzerland, 2007.
- Karami, M.; Anbarzadeh, E.; Delfani, S. Effect of HVAC system size on the optimum insulation thickness of the buildings in different climate zones. J. Therm. Eng. 2022, 8, 249–267. [Google Scholar] [CrossRef] [Scilit]
- Shahid, M. Optimum insulation thickness for external building walls for different climate zone in India. J. Therm. Eng. 2024, 10, 1198–1211. [Google Scholar] [CrossRef] [Scilit]
- African Cities Research Consortium (ACRC). Urban heat stress in Lagos: Thermal inequity and building design implications. In ACRC Policy Brief; University of Manchester: Manchester, UK, 2025. [Google Scholar]
- Santamouris, M. On the energy impact of urban heat island and global warming on buildings. Energy Build. 2014, 82, 100–113. [Google Scholar] [CrossRef] [Scilit]
- NB 485:2017; Nigerian National Building Code. Standards Organisation of Nigeria: Abuja, Nigeria, 2017.
- Sichali, M.; Mulenga, C. Building Regulations Adaptation to Climate Change—A Comparative Literature Review of Selected African Countries’ Building Regulations. J. Health Environ. Res. 2025, 11, 23–37. [Google Scholar] [CrossRef] [Scilit]
- StatsClimat. Climate Report for Lagos, Nigeria. Available online: https://statsclimat.com/Nigeria/report_Lagos (accessed on 12 April 2026).
- Ikuemonisan, F.E.; Ogunjo, S.T.; Popogbe, O.O.; Tariq, A. Urban Heatwave Dynamics in Lagos State: Evidence from the Analysis of Land Surface Temperature Trends and Land Cover Changes (2000–2022). Earth Syst. Environ. 2026, 10, 959–975. [Google Scholar] [CrossRef] [Scilit]
- Bassett, R.; Young, P.J.; Blair, G.S.; Samreen, F.; Simm, W. The Megacity Lagos and Three Decades of Urban Heat Island Growth. J. Appl. Meteorol. Climatol. 2020, 59, 2041–2055. [Google Scholar] [CrossRef] [Scilit]
- Gbode, I.E.; Adeyeri, O.E.; Menang, K.P.; Intsiful, J.D.K.; Ajayi, V.O.; Omotosho, J.A.; Akinsanola, A.A. Observed changes in climate extremes in Nigeria. Meteorol. Appl. 2019, 26, 642–654. [Google Scholar] [CrossRef] [Scilit]
- Dicko, K.; Umaru, E.T.; Sanogo, S.; Okhimamhe, A.A.; Loewner, R. A Trend Analysis of Changes in Cooling Degree Days in West Africa Under Global Warming. Atmosphere 2024, 15, 1376. [Google Scholar] [CrossRef] [Scilit]
- Ishola, I.S.; Adeyemi, K.O.; Ozigis, I.I.; Zarmai, M.T. Rising heat, rising challenges: Cooling and heating dynamics in Lagos amid global warming. Next Res. 2025, 2, 100671. [Google Scholar] [CrossRef] [Scilit]
- Bentoumi, L. Impact of thermal insulation on energy consumption in buildings. J. Therm. Eng. 2024, 10, 924–935. [Google Scholar] [CrossRef] [Scilit]
- ISO 11600:2003; Building Construction—Jointing Products—Classification and Requirements for Sealants. ISO: Geneva, Switzerland, 2003.
- Collaud Coen, M.; Andrews, E.; Bigi, A.; Martucci, G.; Romanens, G.; Vogt, F.P.A.; Vuilleumier, L. Effects of the prewhitening method, the time granularity, and the time segmentation on the Mann–Kendall trend detection and the associated Sen’s slope. Atmos. Meas. Tech. 2020, 13, 6945–6964. [Google Scholar] [CrossRef] [Scilit]
- Hamed, K.H.; Ramachandra Rao, A. A modified Mann-Kendall trend test for autocorrelated data. J. Hydrol. 1998, 204, 182–196. [Google Scholar] [CrossRef] [Scilit]
- Sen, P.K. Estimates of the Regression Coefficient Based on Kendall’s Tau. J. Am. Stat. Assoc. 1968, 63, 1379–1389. [Google Scholar] [CrossRef]
- ISO 15686-1:2011; Buildings and Constructed Assets—Service Life Planning—Part 1: General Principles and Framework. ISO: Geneva, Switzerland, 2011.
- NASA GMAO. MERRA-2 POWER Reanalysis; Goddard Earth Sciences Data and Information Services Center (GES DISC): Greenbelt, MD, USA, 2015. [Google Scholar]
- Oloyede, O.A.; Ozuomba, S.; Asuquo, P. Descriptive and Diagnostic Analysis of NASA and NiMet Big Weather Data. In Proceedings of the IEEE Nigeria 4th International Conference on Disruptive Technologies for Sustainable Development (NIGERCON), Abuja, Nigeria, 5–7 April 2022. [Google Scholar] [CrossRef] [Scilit]
- Faloye, O.T.; Kamchoom, V.; Ogunrinde, A.T.; Ajayi, A.E.; Oguntunde, P.G.; Sinsamutpadung, N. Evaluation of various machine learning-based bias correction approaches for NASA POWER air temperatures: A case study of Nigeria. Big Earth Data 2025, 9, 1111–1135. [Google Scholar] [CrossRef] [Scilit]
- Tayyeh, H.K.; Mohammed, R. Analysis of NASA POWER reanalysis products to predict temperature and precipitation in Euphrates River basin. J. Hydrol. 2023, 619, 129327. [Google Scholar] [CrossRef] [Scilit]
- De Rosa, M.; Bianco, V.; Scarpa, F.; Tagliafico, L.A. Historical trends and current state of heating and cooling degree days in Italy. Energy Convers. Manag. 2015, 90, 323–335. [Google Scholar] [CrossRef] [Scilit]
- Mann, H.B. Nonparametric Tests Against Trend. Econometrica 1945, 13, 245–259. [Google Scholar] [CrossRef] [Scilit]
- Kendall, M.G. Rank Correlation Methods, 4th ed.; Charles Griffin: London, UK, 1975. [Google Scholar]
- Pettitt, A.N. A Non-Parametric Approach to the Change-Point Problem. J. R. Stat. Soc. Ser. C (Appl. Stat.) 1979, 28, 126–135. [Google Scholar] [CrossRef] [Scilit] [PubMed]
- Hirsch, R.M.; Slack, J.R.; Smith, R.A. Techniques of trend analysis for monthly water quality data. Water Resour. Res. 1982, 18, 107–121. [Google Scholar] [CrossRef] [Scilit]
- Onyenokporo, N.C.; Ochedi, E.T. Low-cost retrofit packages for residential buildings in hot-humid Lagos, Nigeria. Int. J. Build. Pathol. Adapt. 2019, 37, 250–272. [Google Scholar] [CrossRef] [Scilit]
- Okonta, D.E. Investigating the impact of building materials on energy efficiency and indoor cooling in Nigerian homes. Heliyon 2023, 9, e20316. [Google Scholar] [CrossRef] [Scilit] [PubMed]
- Almazroui, M.; Saeed, F.; Saeed, S.; Nazrul Islam, M.; Ismail, M.; Klutse, N.A.B.; Siddiqui, M.H. Projected Change in Temperature and Precipitation Over Africa from CMIP6. Earth Syst. Environ. 2020, 4, 455–475. [Google Scholar] [CrossRef] [Scilit]
- Falchetta, G.; Mistry, M.N. The role of residential air circulation and cooling demand for electrification planning: Implications of climate change in sub-Saharan Africa. Energy Econ. 2021, 99, 105307. [Google Scholar] [CrossRef] [Scilit]
- ASHRAE. ASHRAE Handbook—HVAC Applications; ASHRAE: Atlanta, GA, USA, 2023. [Google Scholar]
- Gadedjisso-Tossou, A.; Adjegan, K.I.; Kablan, A.K.M. Rainfall and Temperature Trend Analysis by Mann–Kendall Test and Significance for Rainfed Cereal Yields in Northern Togo. Sci 2021, 3, 17. [Google Scholar] [CrossRef] [Scilit]
- Cai, W.; Reason, C.; Mohino, E.; Rodríguez-Fonseca, B.; Malherbe, J.; Santoso, A.; Li, X.; Chikoore, H.; Nnamchi, H.; McPhaden, M.J.; et al. Climate impacts of the El Niño–Southern Oscillation in Africa. Nat. Rev. Earth Environ. 2025, 6, 503–520. [Google Scholar] [CrossRef] [Scilit]
- Kossin, J.P.; Knapp, K.R.; Olander, T.L.; Velden, C.S. Global increase in major tropical cyclone exceedance probability over the past four decades. Proc. Natl. Acad. Sci. USA 2020, 117, 11975–11980. [Google Scholar] [CrossRef] [Scilit] [PubMed]
- Olali, K.; Nwaogazie, I.; Ikebude, C. Establishing Climate Change on Temperature Trend, Variation and Change Point Pattern in Warri, Nigeria. Hydrology 2025, 13, 90–101. [Google Scholar] [CrossRef] [Scilit]
- Yue, S.; Wang, C. The Mann-Kendall Test Modified by Effective Sample Size to Detect Trend in Serially Correlated Hydrological Series. Water Resour. Manag. 2004, 18, 201–218. [Google Scholar] [CrossRef] [Scilit]
- Vizy, E.K.; Cook, K.H. Mechanisms by which Gulf of Guinea and eastern North Atlantic sea surface temperature anomalies can influence African rainfall. J. Clim. 2001, 14, 795–821. [Google Scholar] [CrossRef] [Scilit]
- Mourshed, M. Relationship between annual mean temperature and degree-days. Energy Build. 2012, 54, 418–425. [Google Scholar] [CrossRef] [Scilit]
- Alexander, L.V.; Zhang, X.; Peterson, T.C.; Caesar, J.; Gleason, B.; Klein Tank, A.M.G.; Haylock, M.; Collins, D.; Trewin, B.; Rahimzadeh, F.; et al. Global observed changes in daily climate extremes of temperature and precipitation. J. Geophys. Res. Atmos. 2006, 111, 2005JD006290. [Google Scholar] [CrossRef] [Scilit]
- World Meteorological Organization. State of the Climate in Africa 2024; WMO: Geneva, Switzerland, 2025; Available online: https://wmo.int/publication-series/state-of-climate-africa-2024 (accessed on 12 April 2026).
- NOAA National Centers for Environmental Information. 2024 Was the World’s Warmest Year on Record; NOAA: Washington, DC, USA, 2025. Available online: https://www.noaa.gov/news/2024-was-worlds-warmest-year-on-record (accessed on 14 April 2026).
- Berkeley Earth. Global Temperature Report for 2024. 2025. Available online: https://berkeleyearth.org/global-temperature-report-for-2024/ (accessed on 16 April 2026).
- Bisai, D.; Chatterjee, S.; Khan, A.; Barman, N.K. Application of Sequential Mann-Kendall test for detection of approximate significant change point in surface air temperature for Kolkata weather observatory, West Bengal, India. Int. J. Curr. Res. 2014, 6, 5319–5324. [Google Scholar]
- Awode, A.E.; Adewumi, J.R.; Obiora-Okeke, O.; Komolafe, A.A. Analysis of rainfall variability and extreme events in South-Western Nigeria: Implications for water resource management and climate resilience. Bull. Natl. Res. Cent. 2025, 49, 31. [Google Scholar] [CrossRef] [Scilit]
- Weather Atlas. Yearly and Monthly Weather—Lagos, Nigeria. Weather Atlas. 2024. Available online: https://www.weather-atlas.com/en/nigeria/lagos-climate (accessed on 20 April 2026).
- Raj, J.; Bangalath, H.K.; Stenchikov, G. West African Monsoon: Current state and future projections in a high-resolution AGCM. Clim. Dyn. 2019, 52, 6441–6461. [Google Scholar] [CrossRef] [Scilit]
- Guo, L.; Di, L.; Zhang, C.; Lin, L.; Chen, F.; Molla, A. Evaluating contributions of urbanization and global climate change to urban land surface temperature change: A case study in Lagos, Nigeria. Sci. Rep. 2022, 12, 14168. [Google Scholar] [CrossRef] [Scilit] [PubMed]
- Sojobi, A.O.; Balogun, I.I.; Salami, A.W. Climate change in Lagos state, Nigeria: What really changed? Environ. Monit. Assess. 2016, 188, 556. [Google Scholar] [CrossRef] [Scilit] [PubMed]
- Opoku, R.; Obeng, G.Y.; Darkwa, J.; Kwofie, S. Minimizing heat transmission loads and improving energy efficiency of building envelopes in sub-Saharan Africa using bio-based composite materials. Sci. Afr. 2020, 8, e00358. [Google Scholar] [CrossRef] [Scilit]
- Batiha, M.A.; Rawadieh, S.; Batiha, M.; Al-Makhadmeh, L.; Kayfeci, M.; Marachli, F. Thermal insulation performance curves for exterior walls in heating and cooling seasons. J. Therm. Eng. 2023, 9, 1053–1069. [Google Scholar] [CrossRef] [Scilit]
- Bell, N.O.; Bilbao, J.I.; Kay, M.; Sproul, A.B. Future climate scenarios and their impact on heating, ventilation and air-conditioning system design and performance for commercial buildings for 2050. Renew. Sustain. Energy Rev. 2022, 162, 112363. [Google Scholar] [CrossRef] [Scilit]
- Ishola, I.S.; Adeyemi, K.O.; Ozigis, I.I.; Zarmai, M.T. Outdoor cooling and heating design values for energy management in Nigeria’s air-conditioning industry. Cogent Eng. 2025, 12, 2526123. [Google Scholar] [CrossRef] [Scilit]
- Khourchid, A.M.; Ajjur, S.B.; Al-Ghamdi, S.G. Building Cooling Requirements under Climate Change Scenarios: Impact, Mitigation Strategies, and Future Directions. Buildings 2022, 12, 1519. [Google Scholar] [CrossRef] [Scilit]
- Athauda, R.S.; Asmone, A.S.; Conejos, S. Climate Change Impacts on Facade Building Materials: A Qualitative Study. Sustainability 2023, 15, 7893. [Google Scholar] [CrossRef] [Scilit]
- Riahinezhad, M.; Esmizadeh, E.; Lopez-Carreon, I.; Gaur, A.; Lu, H.; Lacasse, M.A. Crack Length of Elastomeric Sealants and Their Service Life in Contrasting Canadian Climates: Effects of Climate Change. Polymers 2024, 16, 2039. [Google Scholar] [CrossRef] [Scilit] [PubMed] [PubMed Central]
- Nečasová, B.; Liška, P. Research Summary on Characterizing Impact of Environment on Adhesion of Sealed Joints in Façade Applications. Materials 2020, 13, 4847. [Google Scholar] [CrossRef] [Scilit] [PubMed] [PubMed Central]
- Lacasse, M.A.; Gaur, A.; Moore, T.V. Durability and Climate Change—Implications for Service Life Prediction and the Maintainability of Buildings. Buildings 2020, 10, 53. [Google Scholar] [CrossRef] [Scilit]
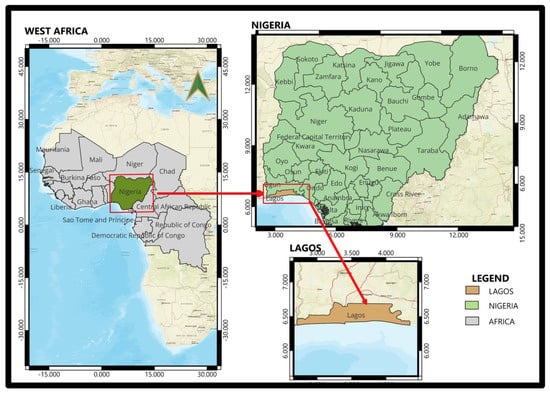
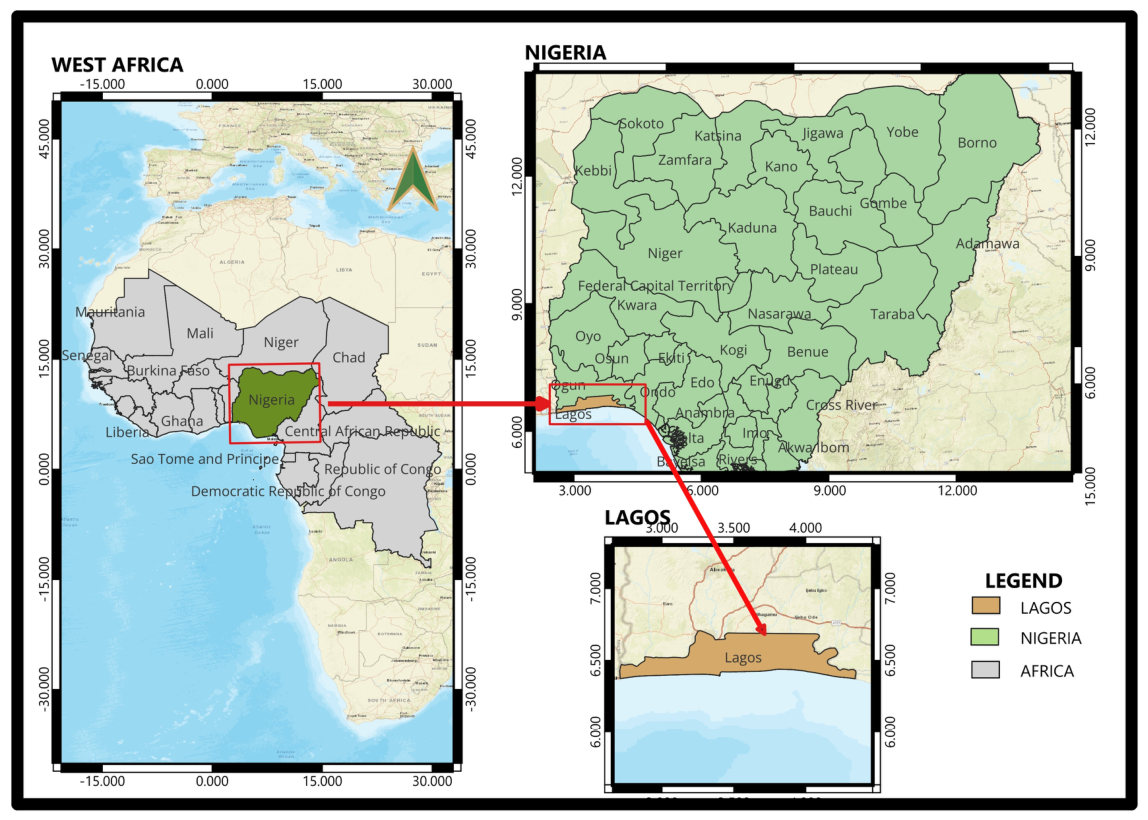
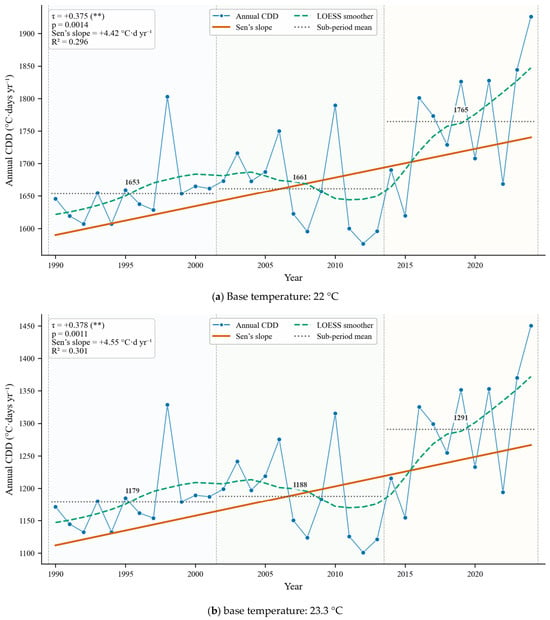
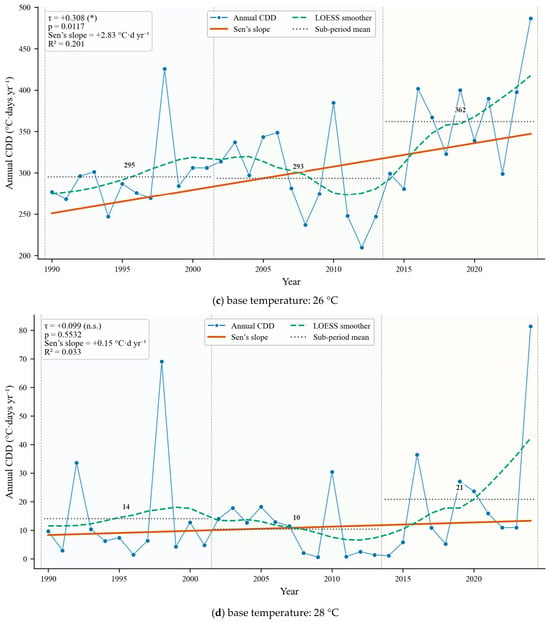
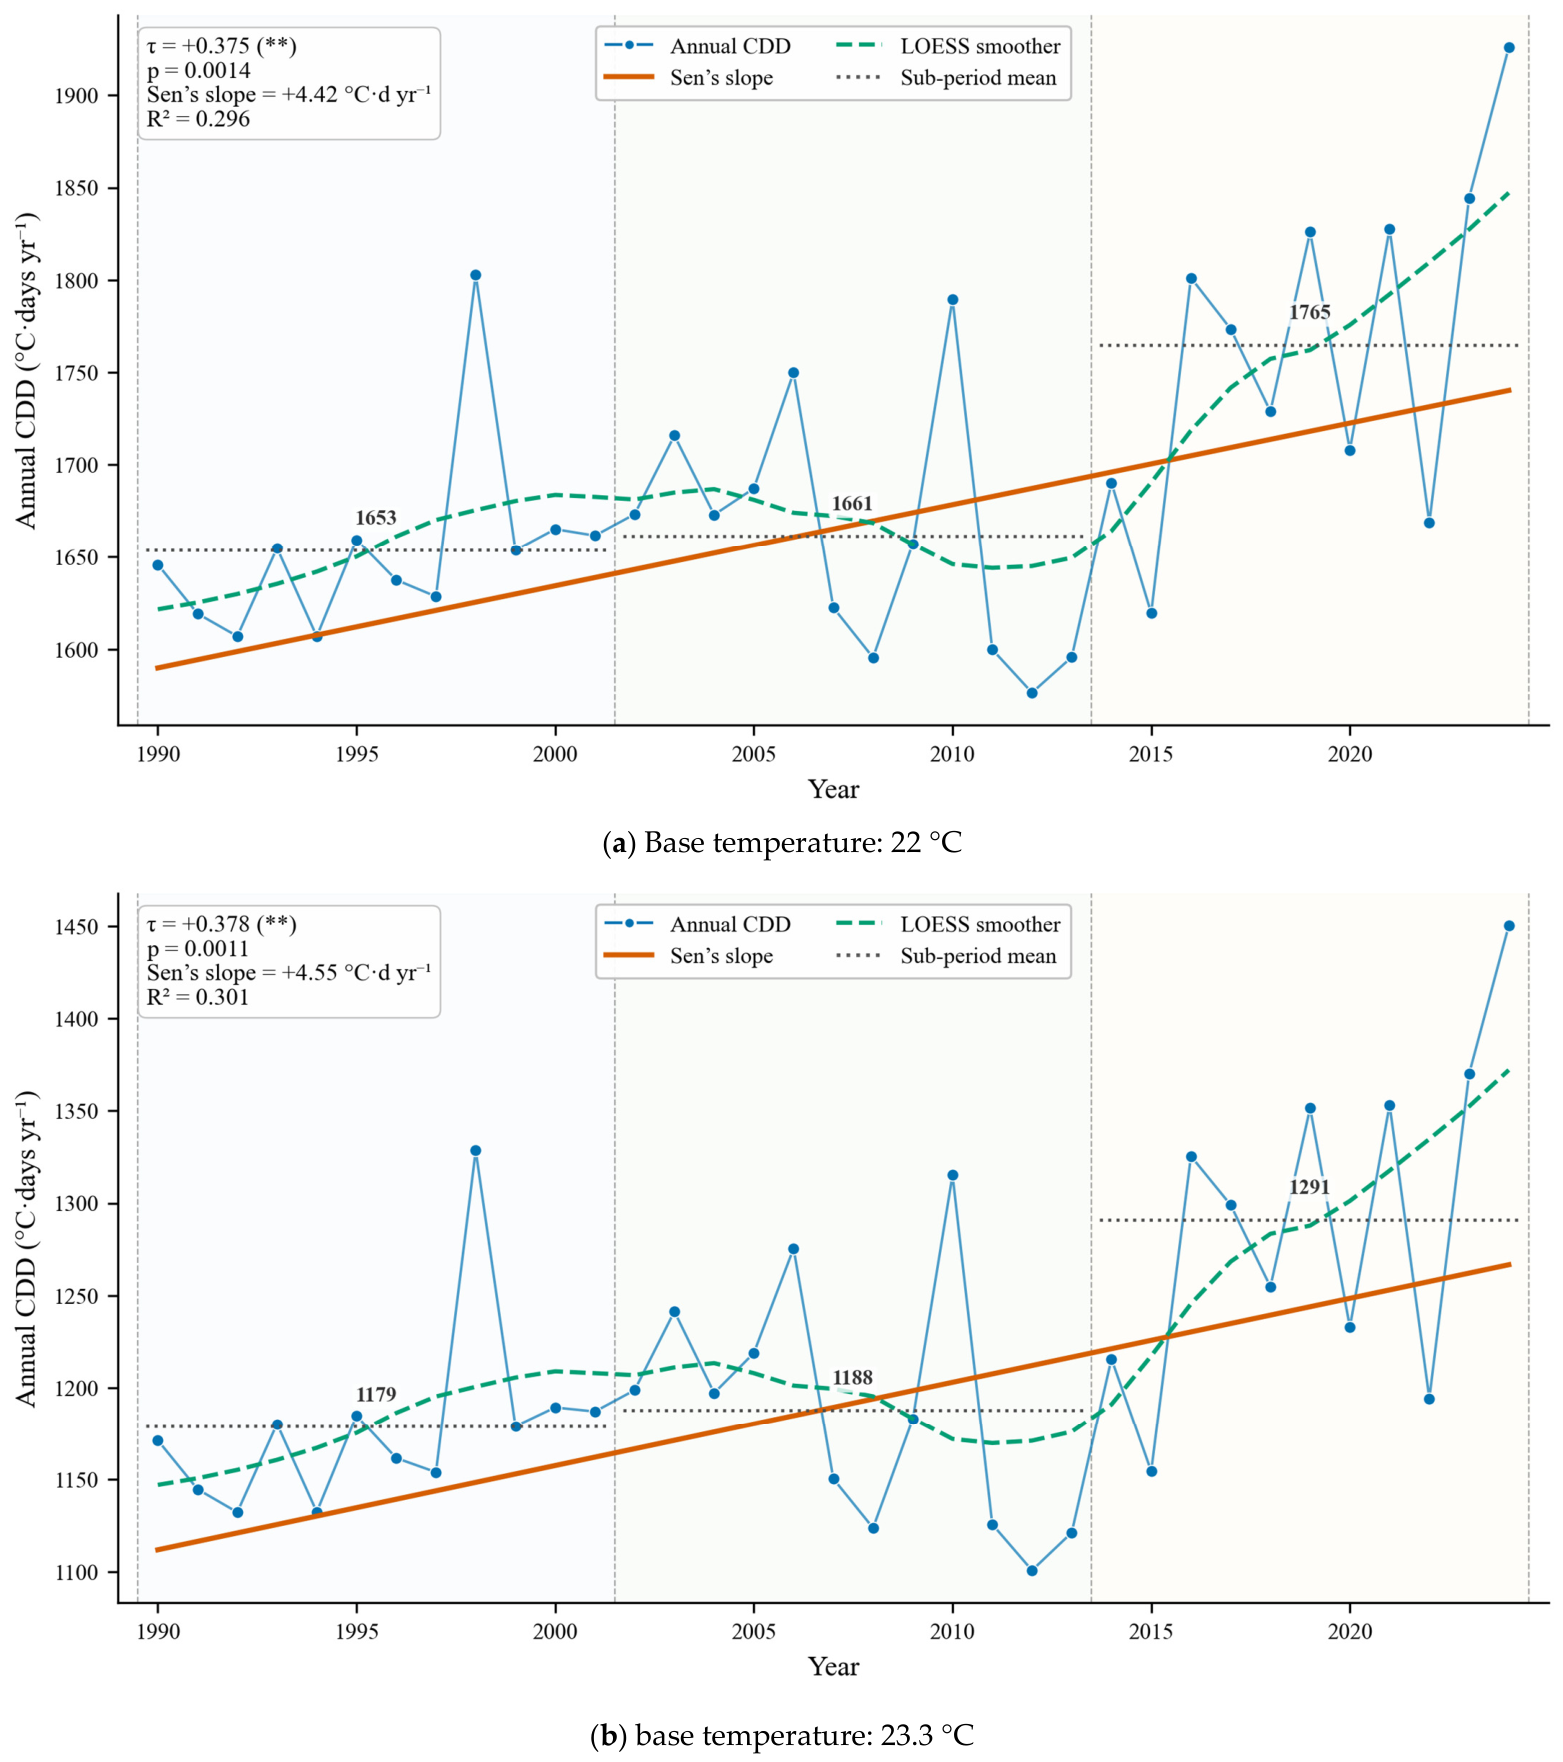
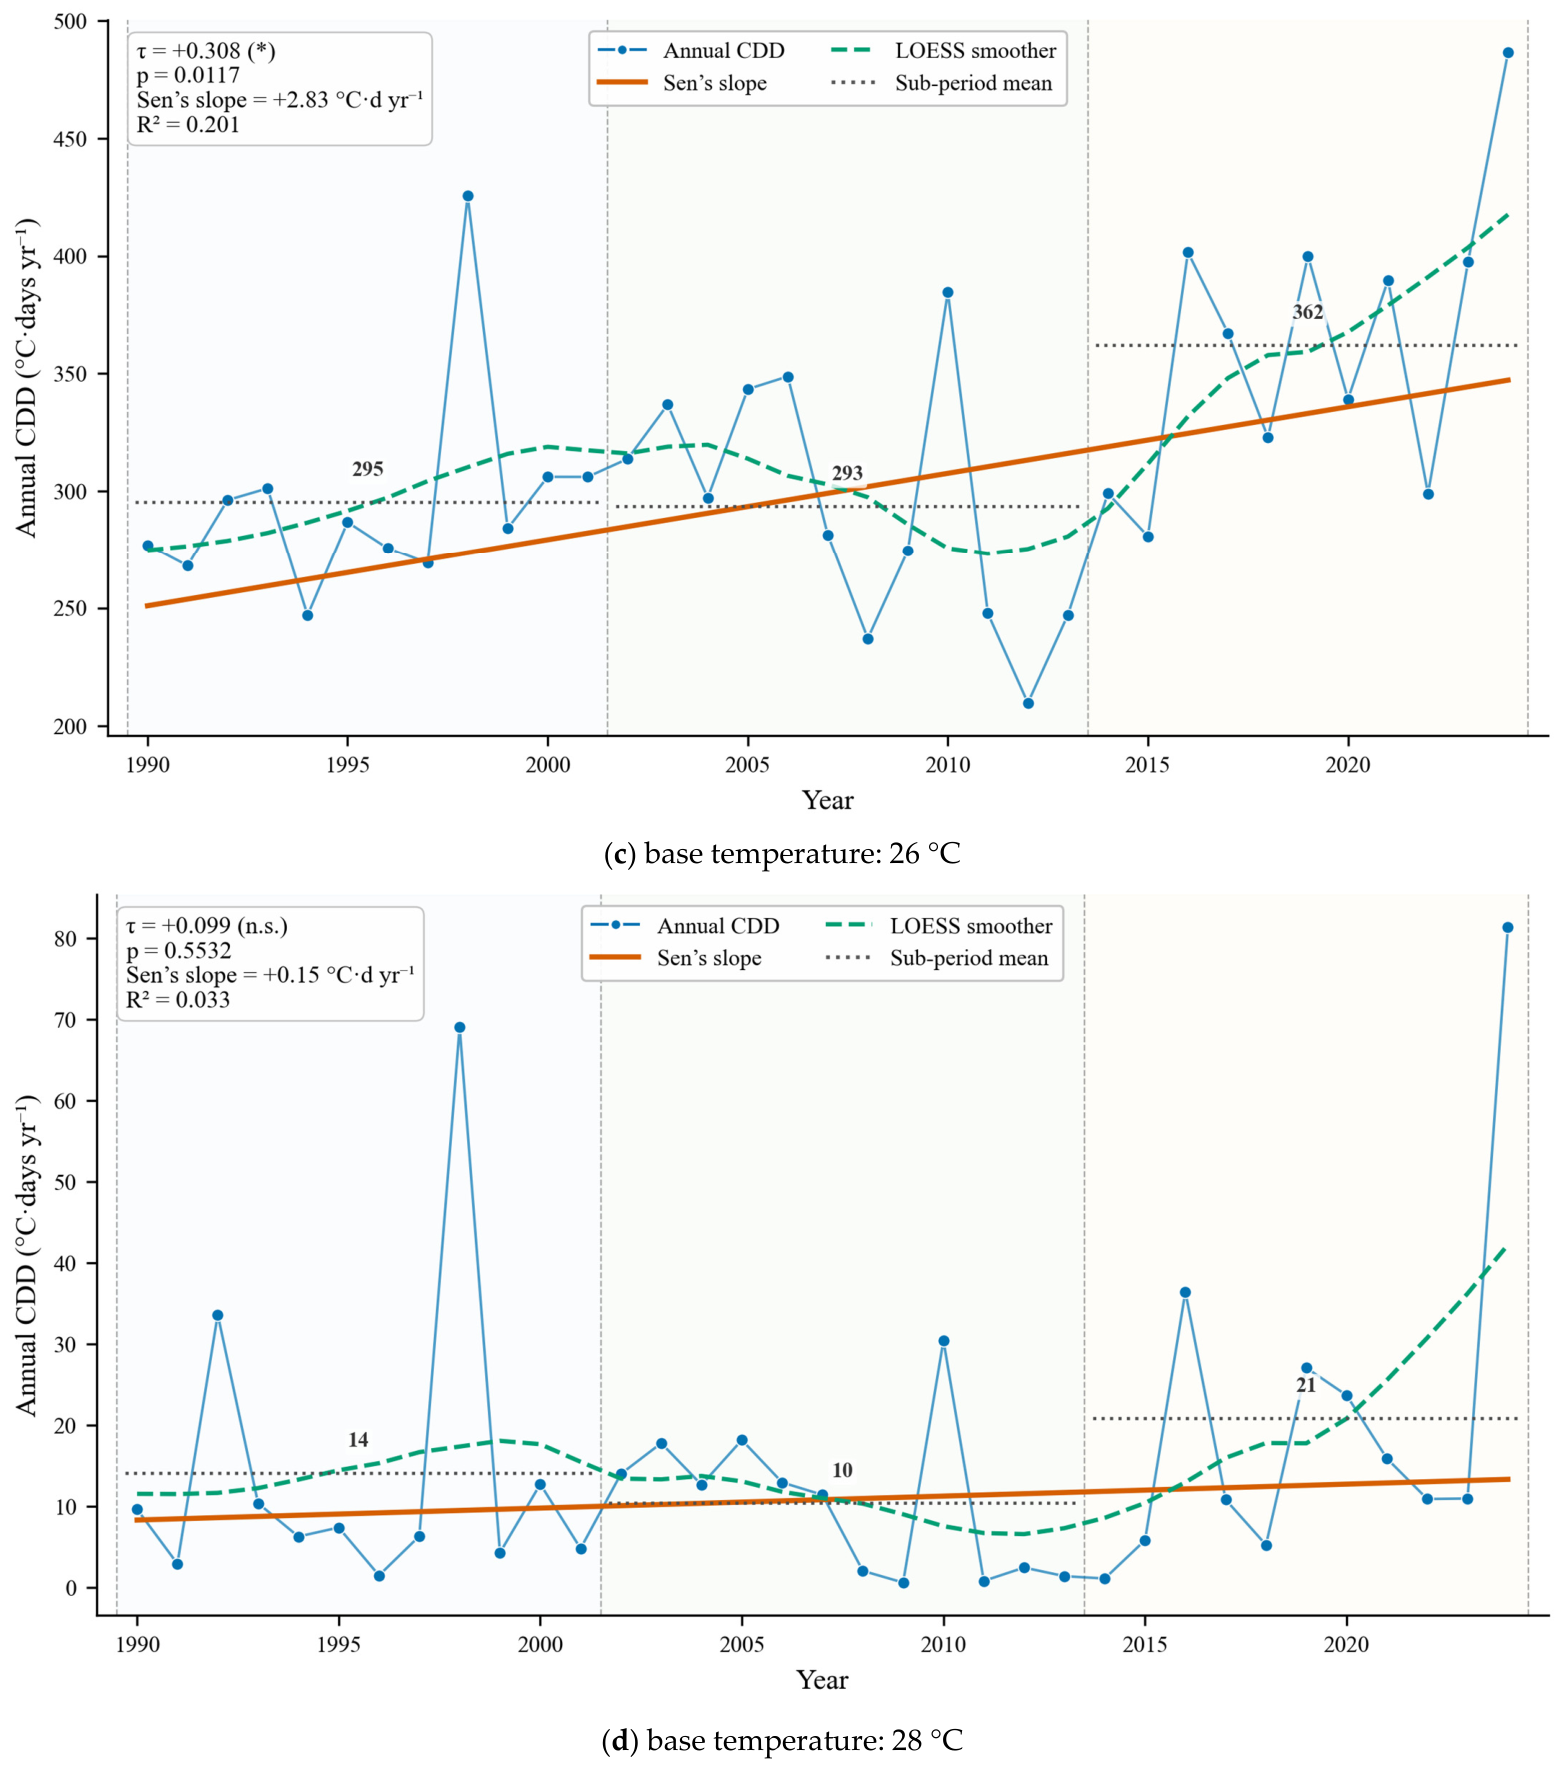
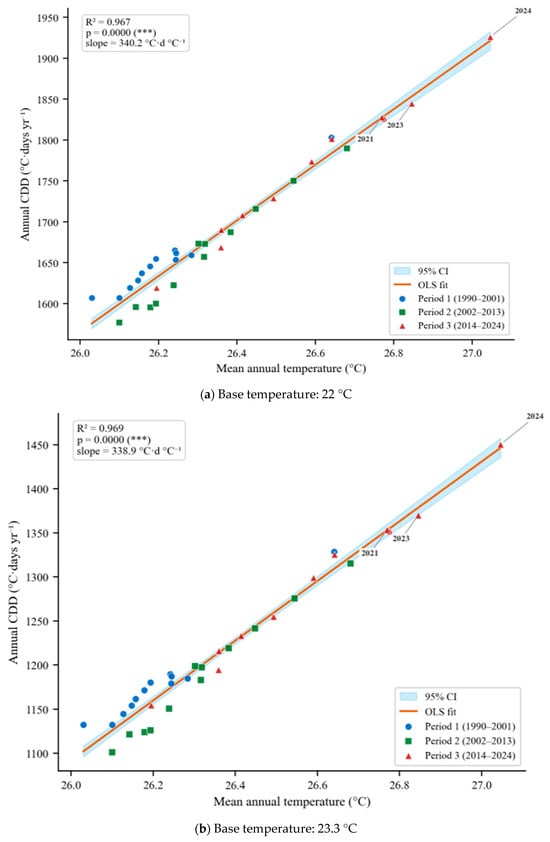
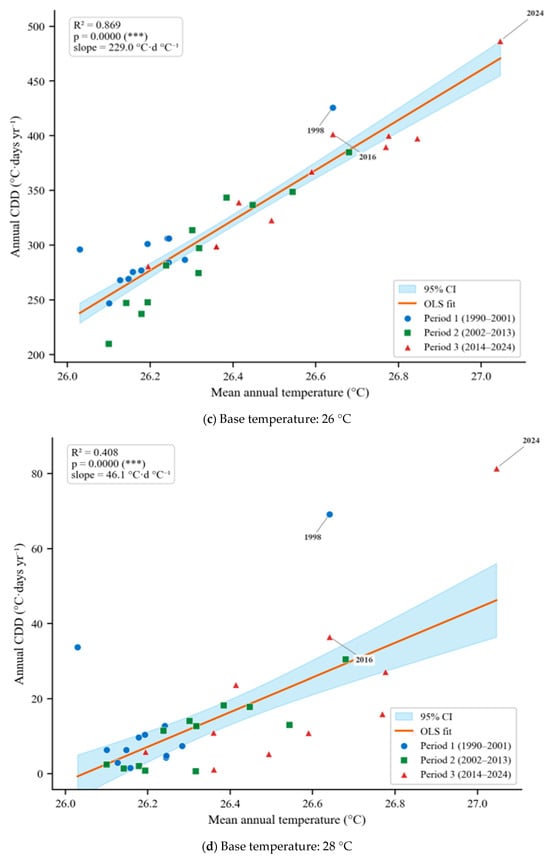
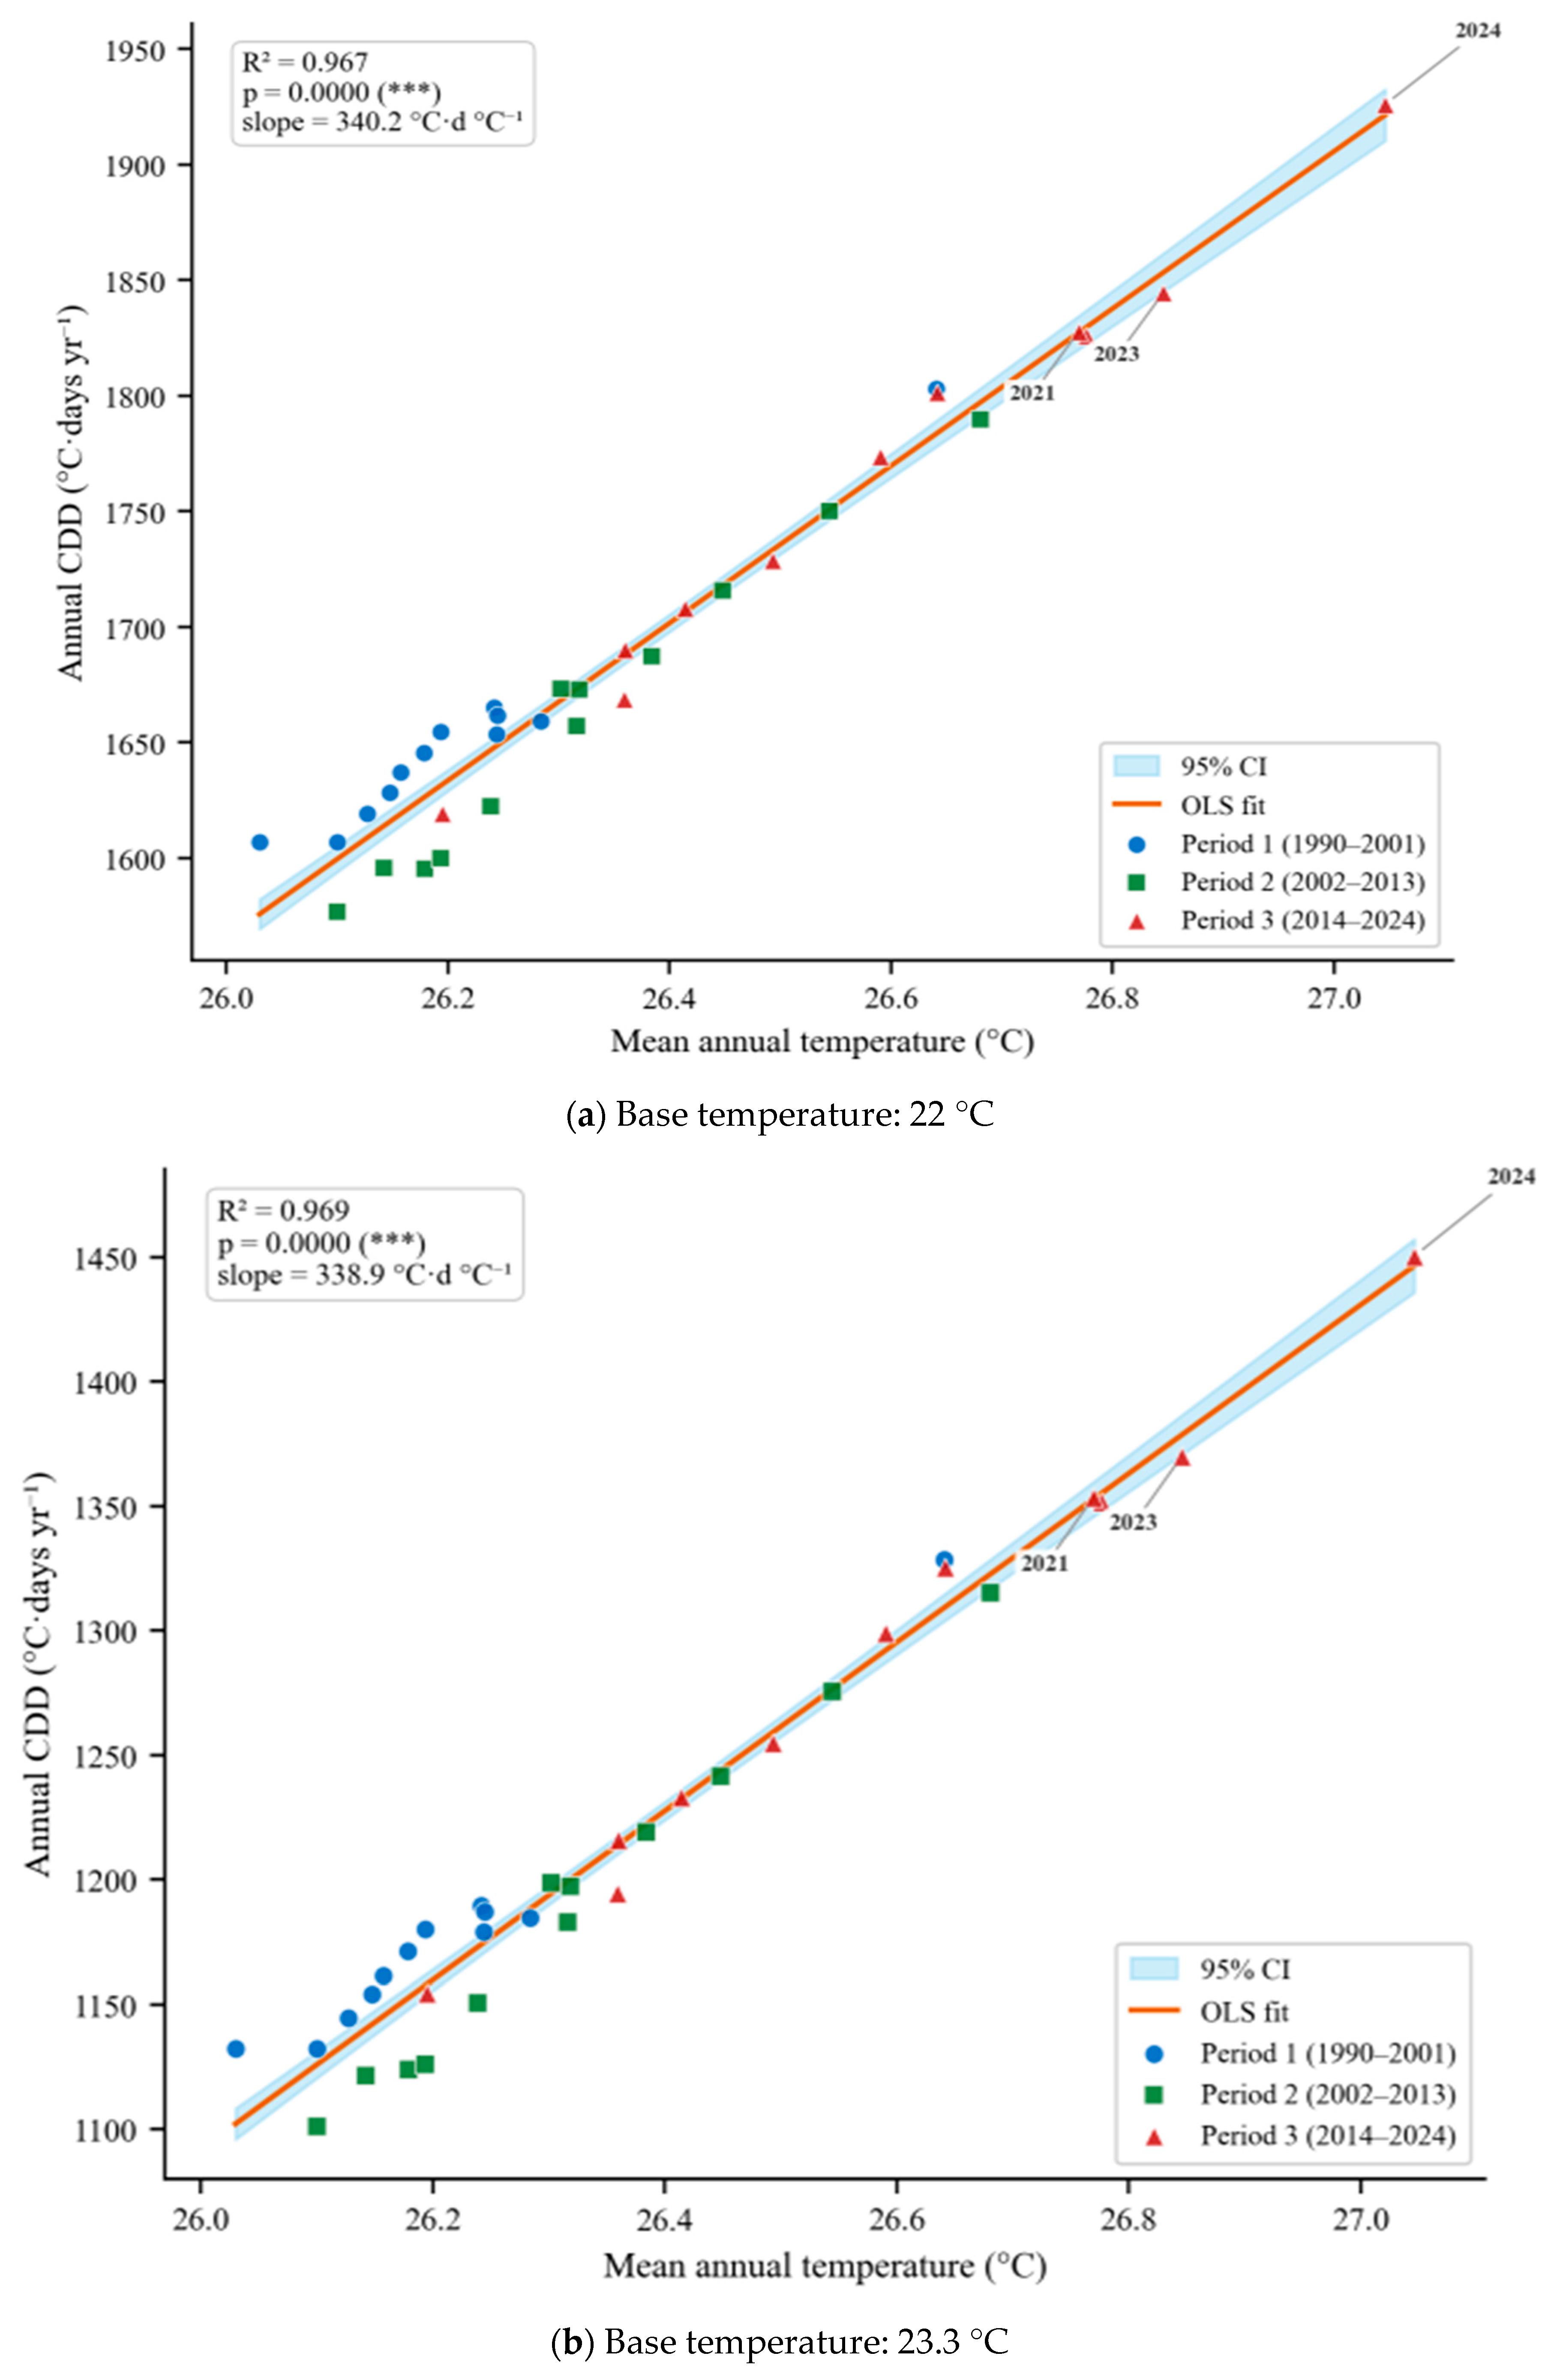
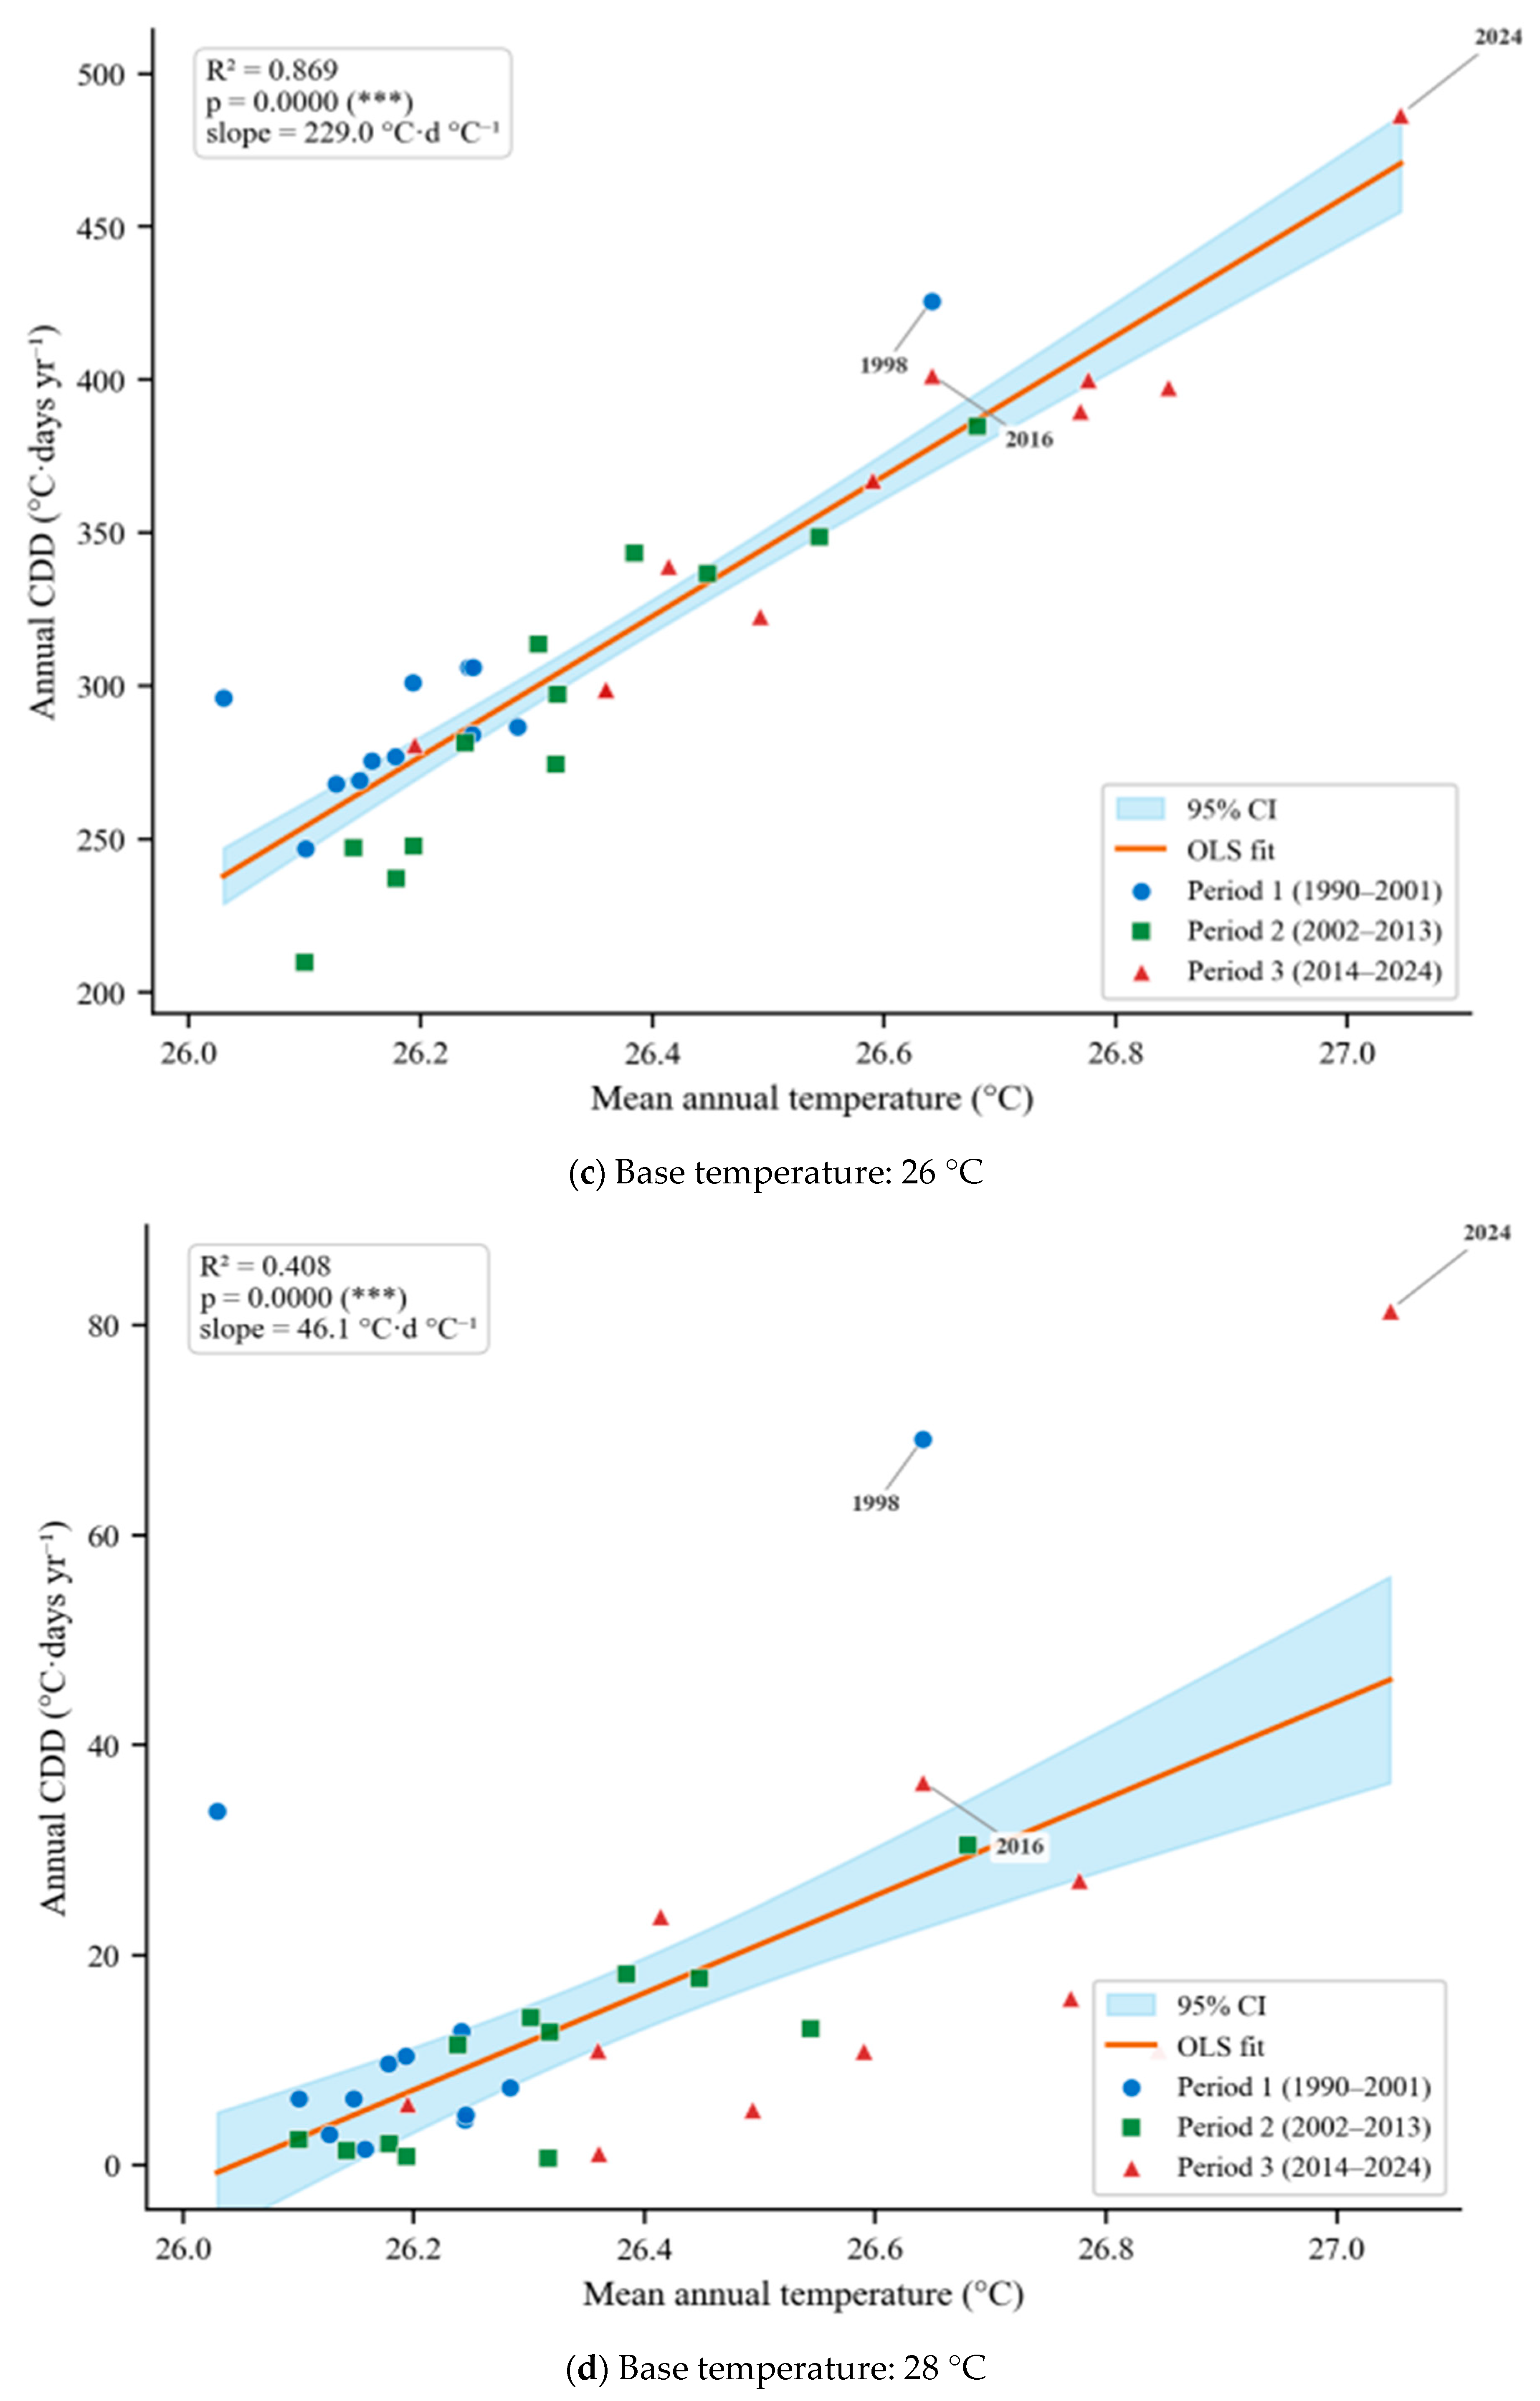
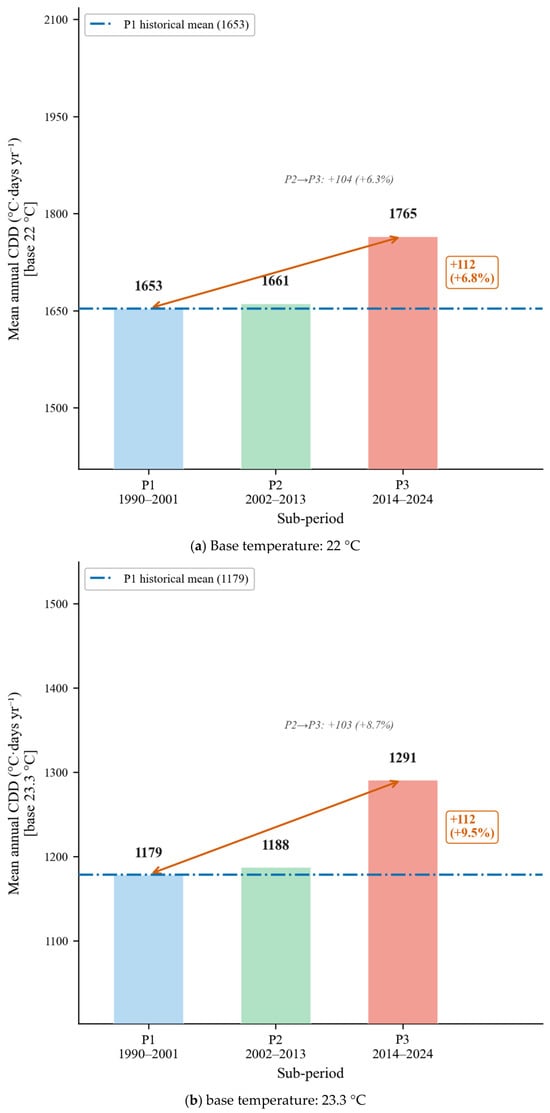
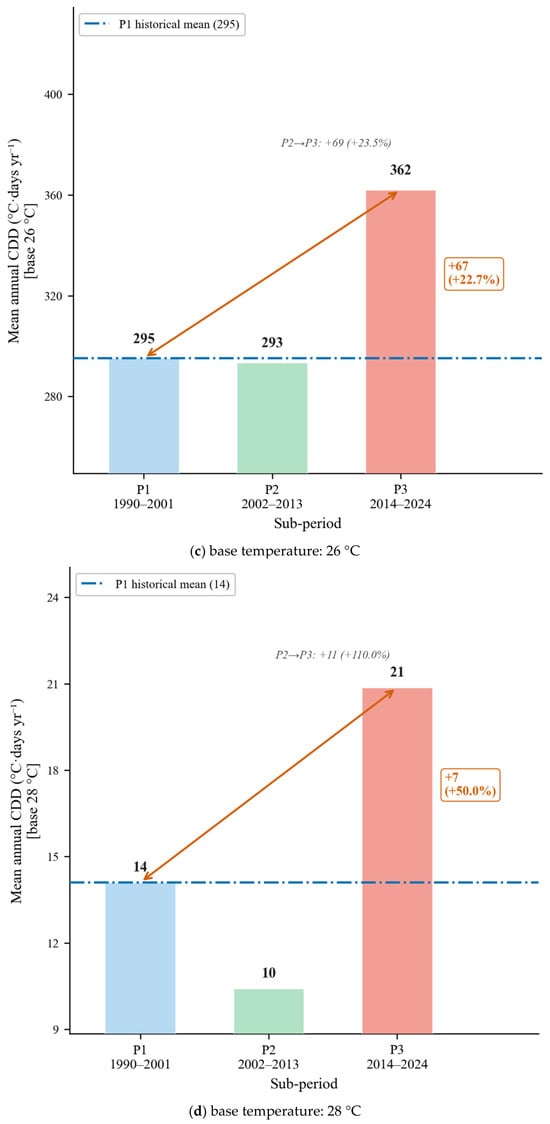
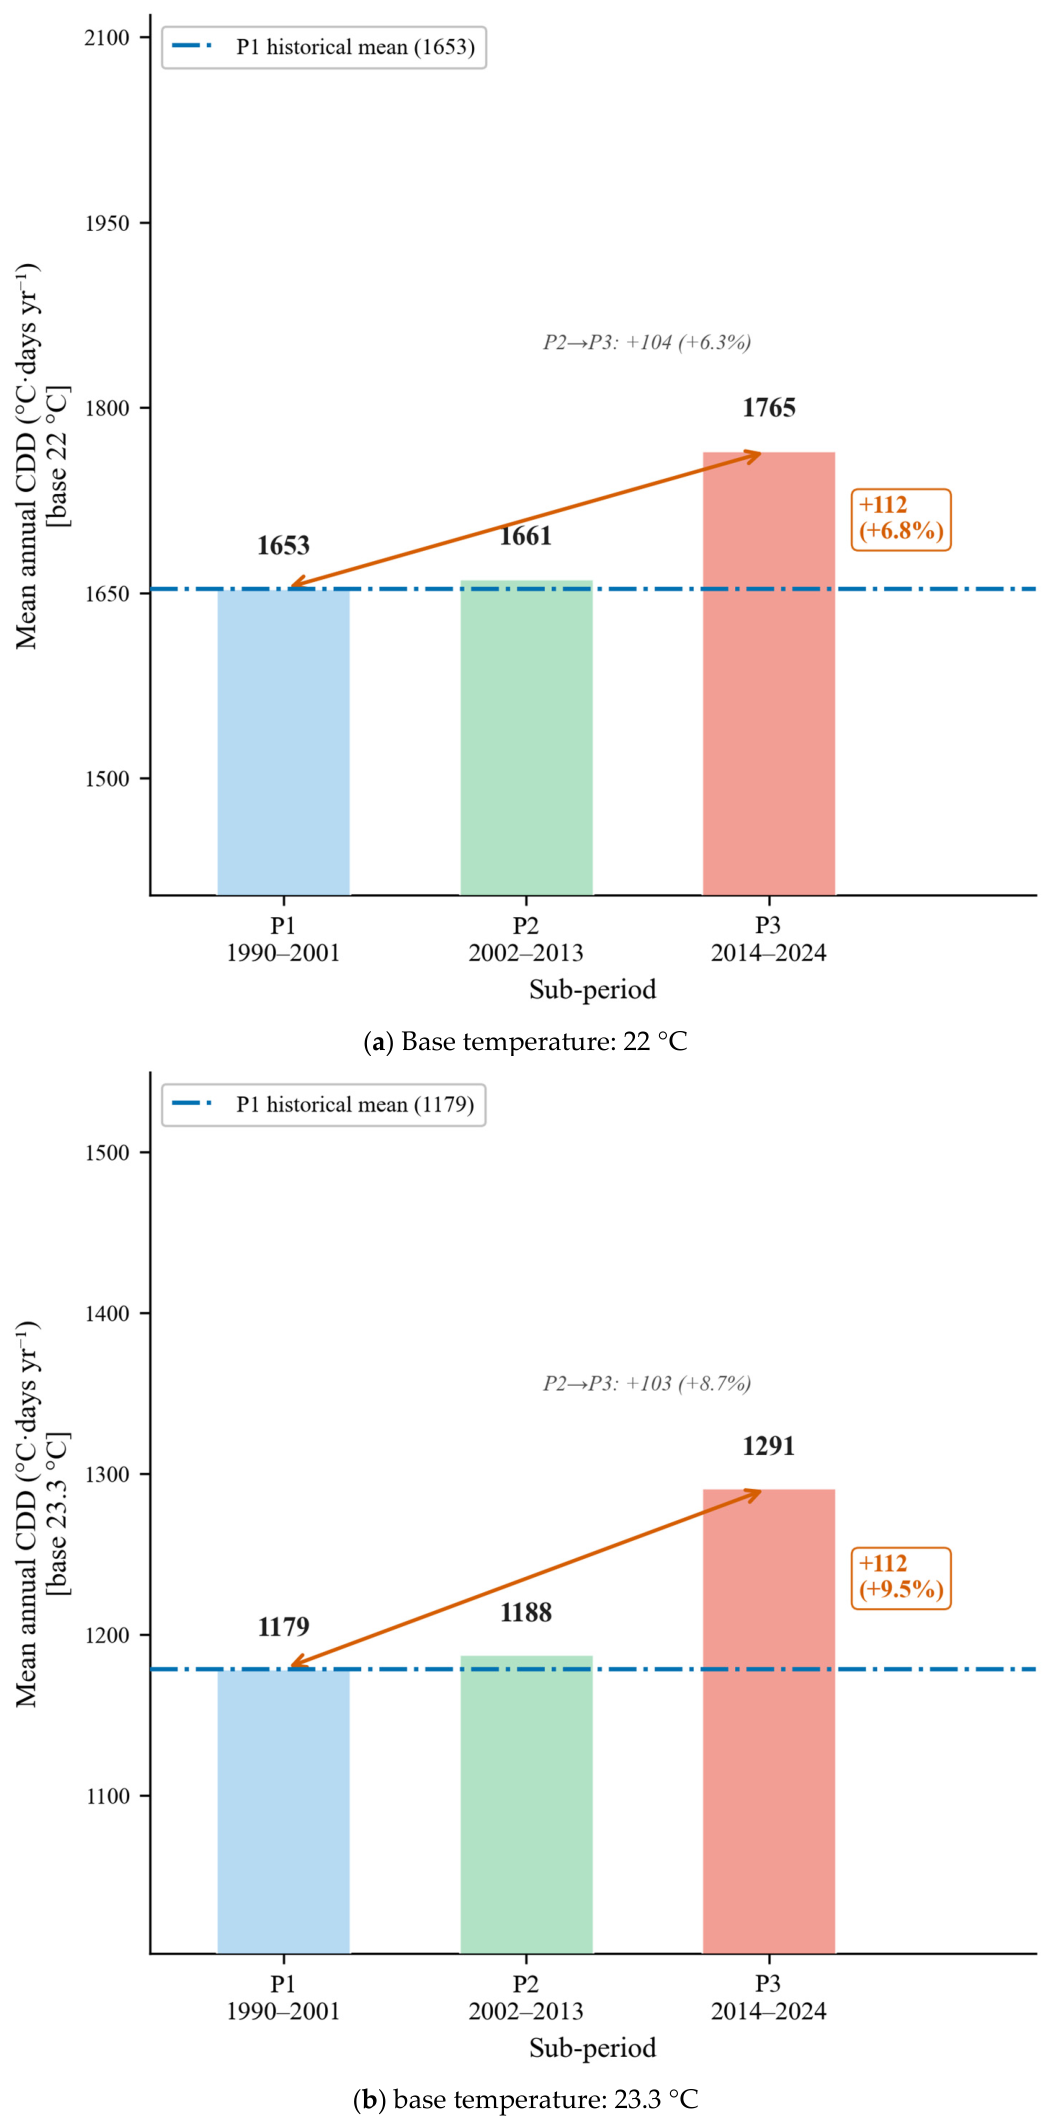
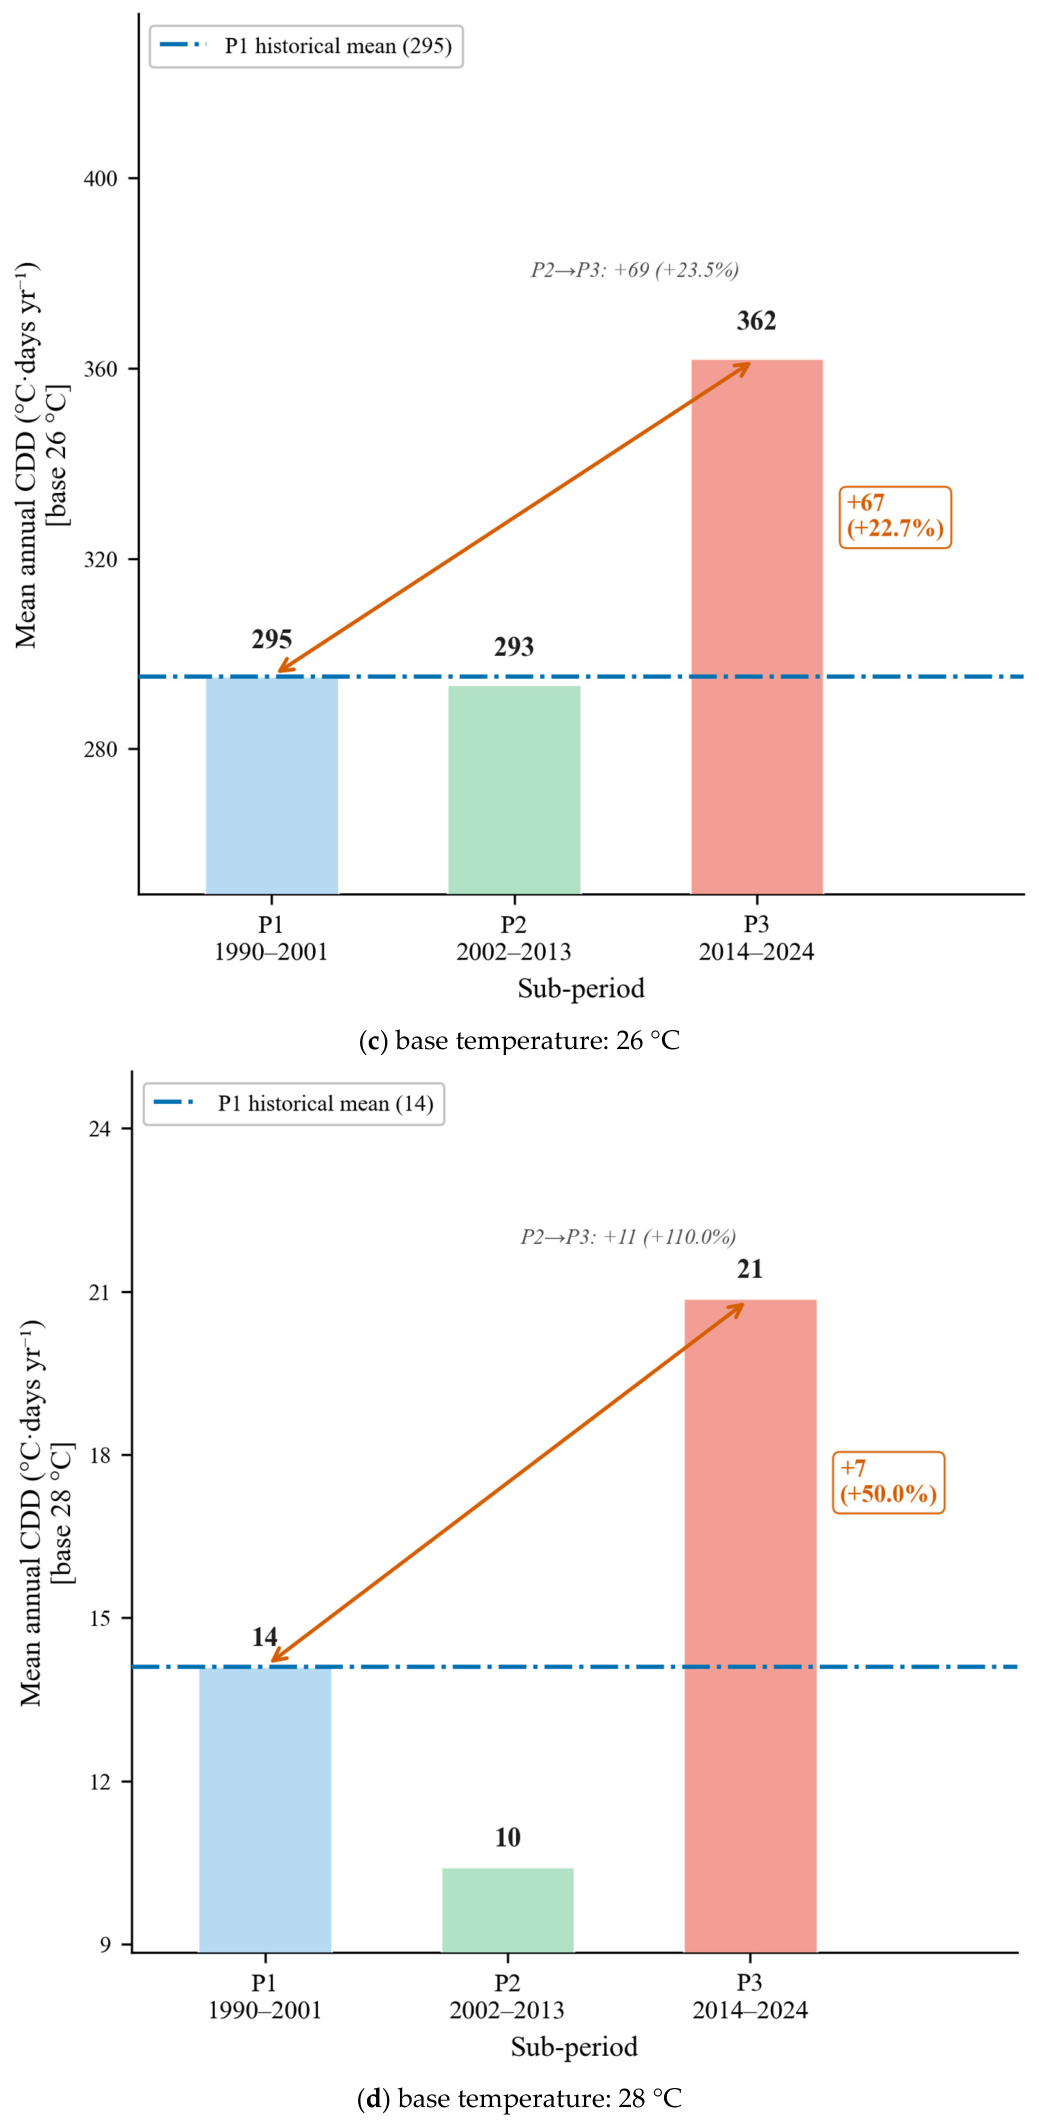
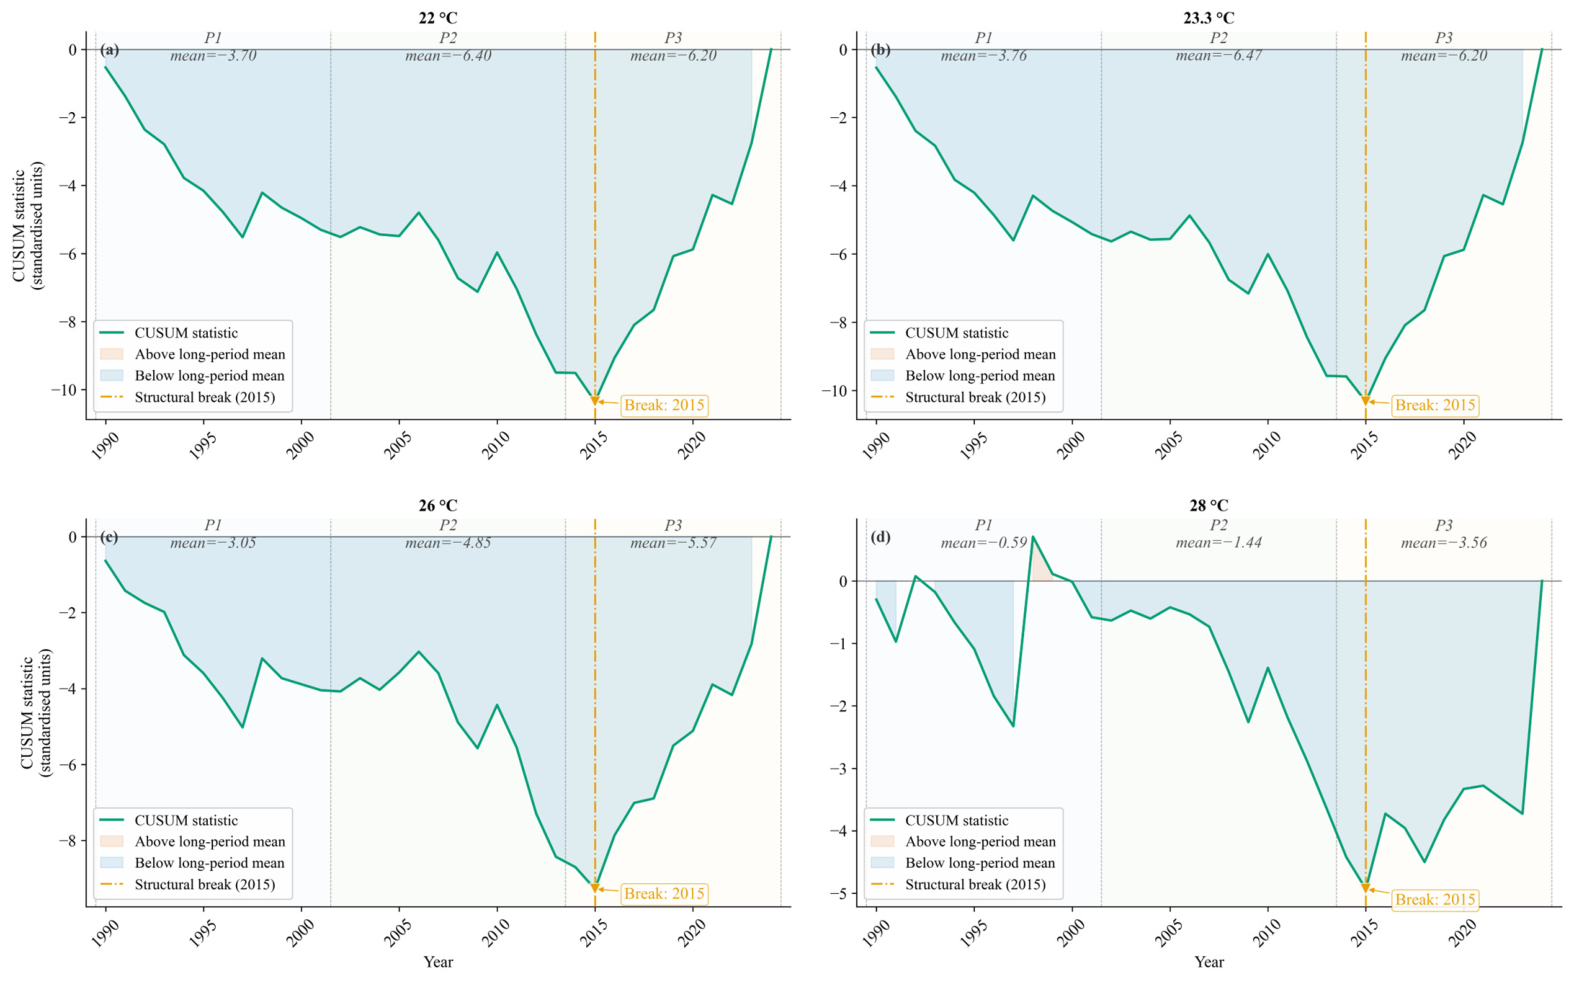
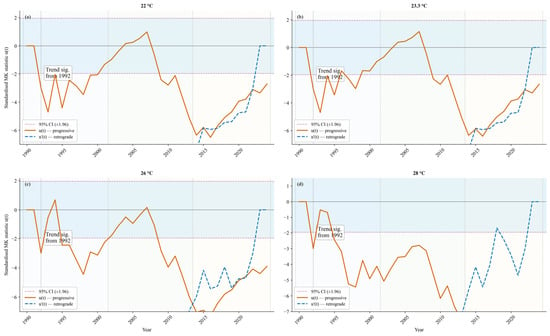
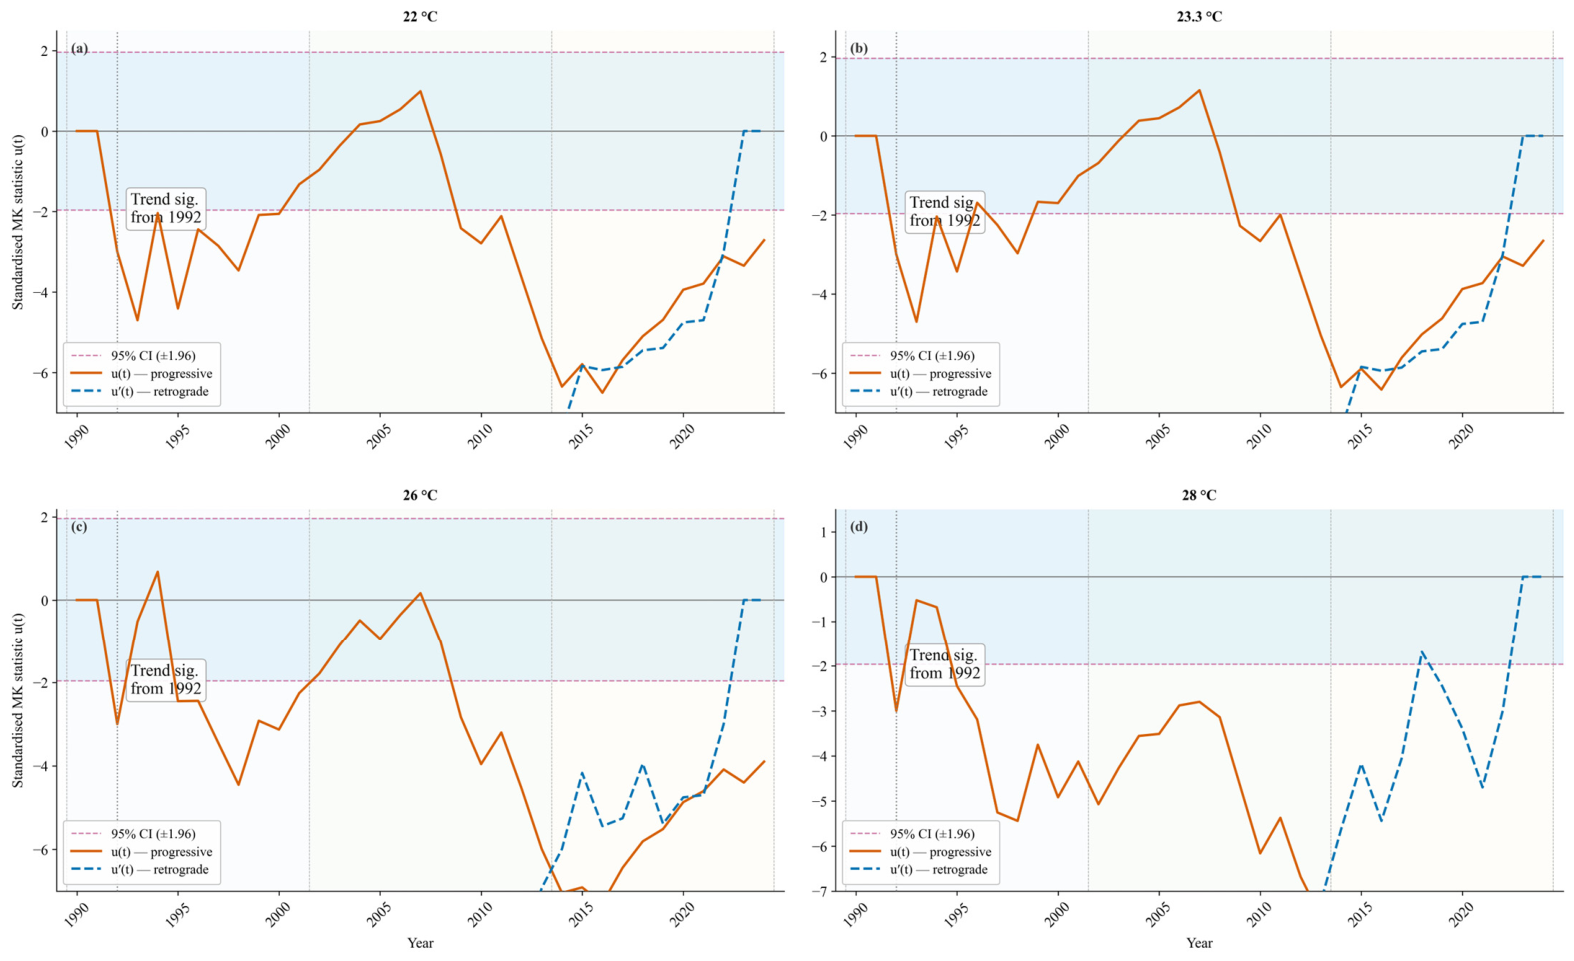
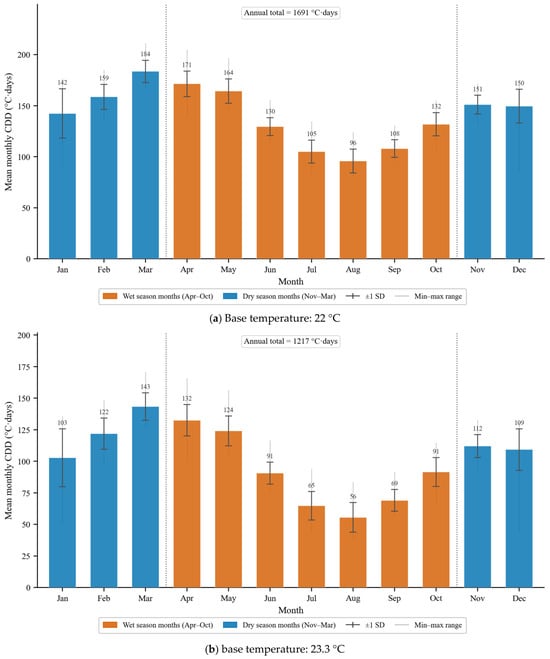
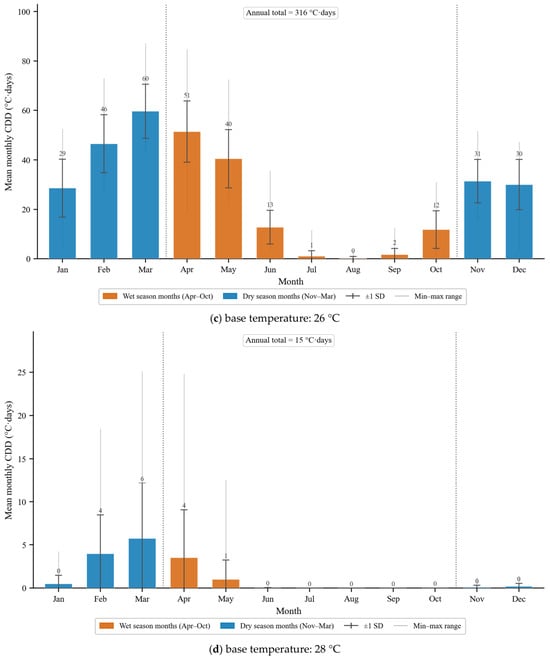
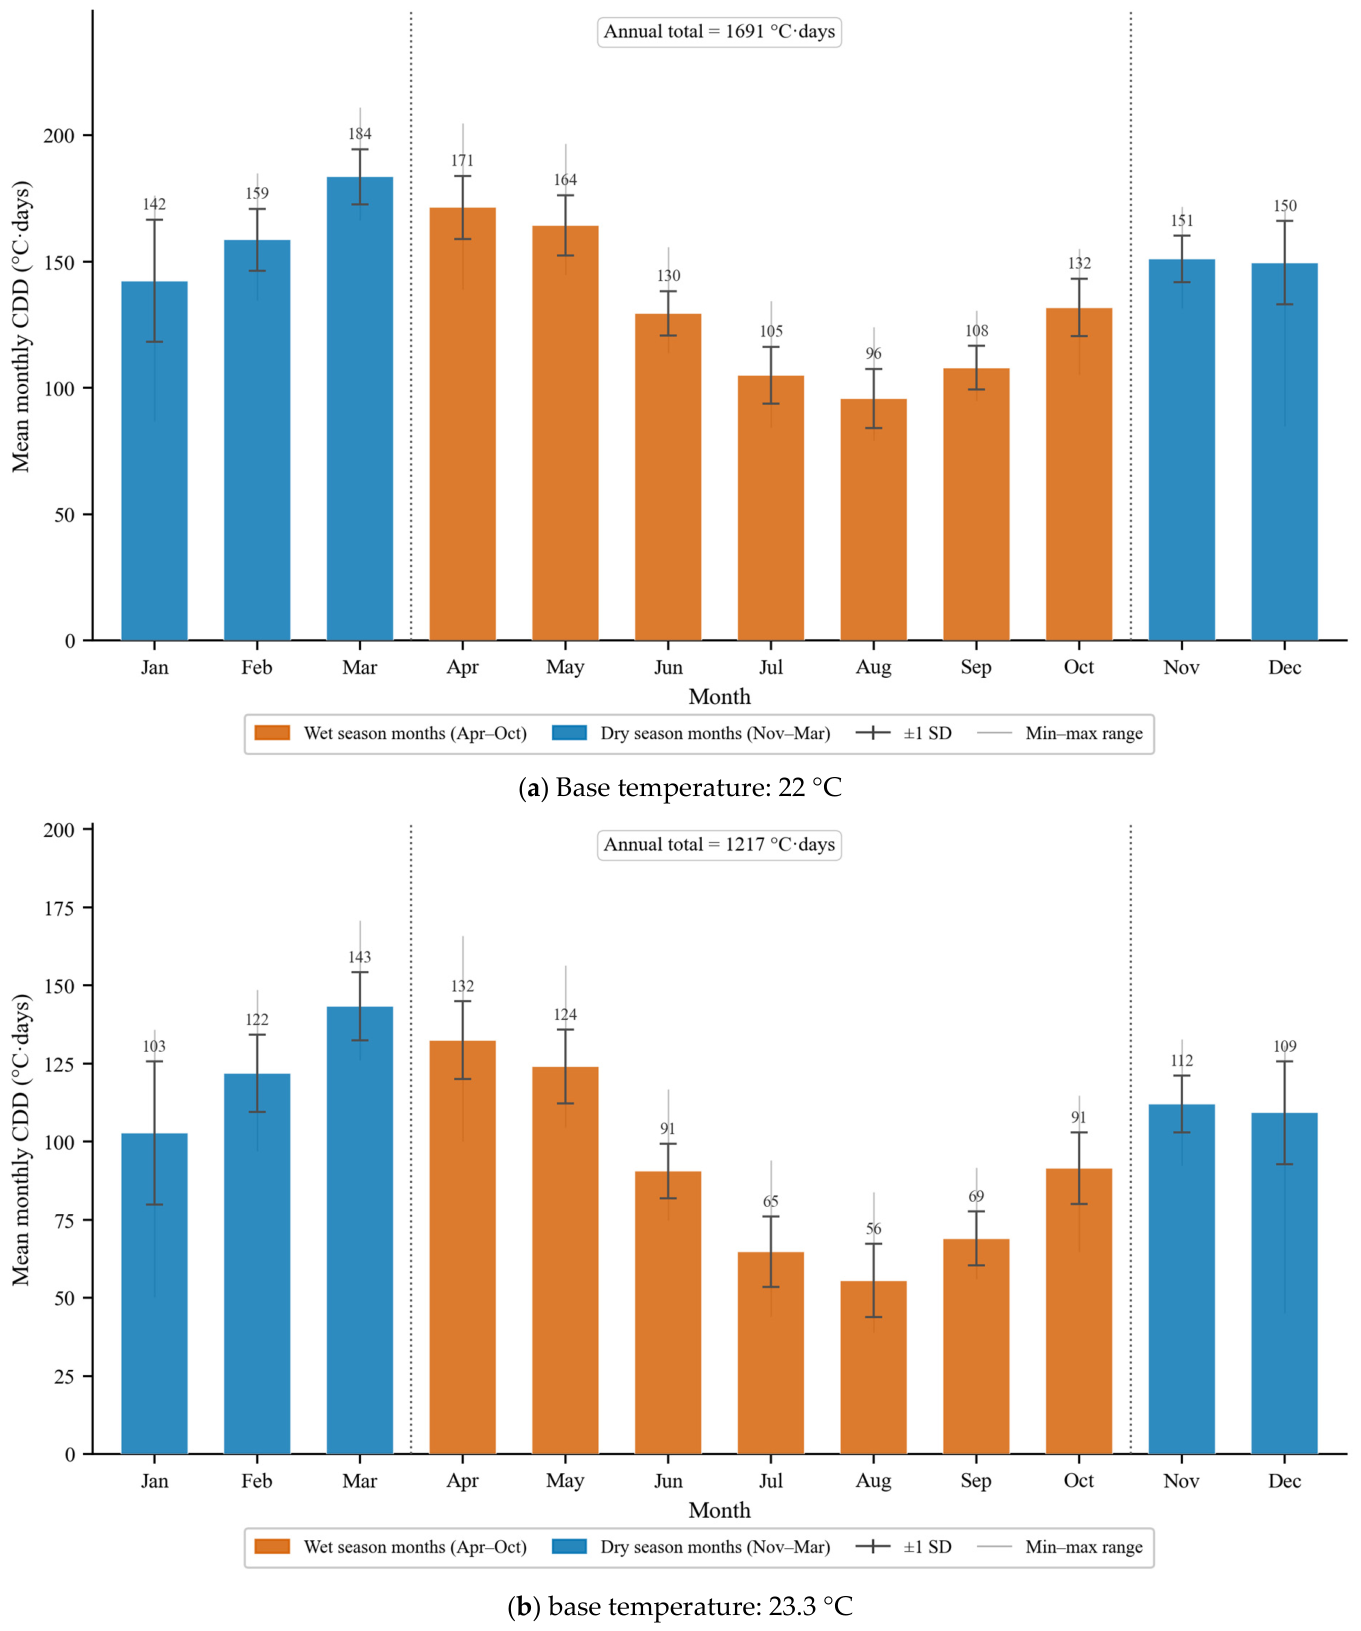
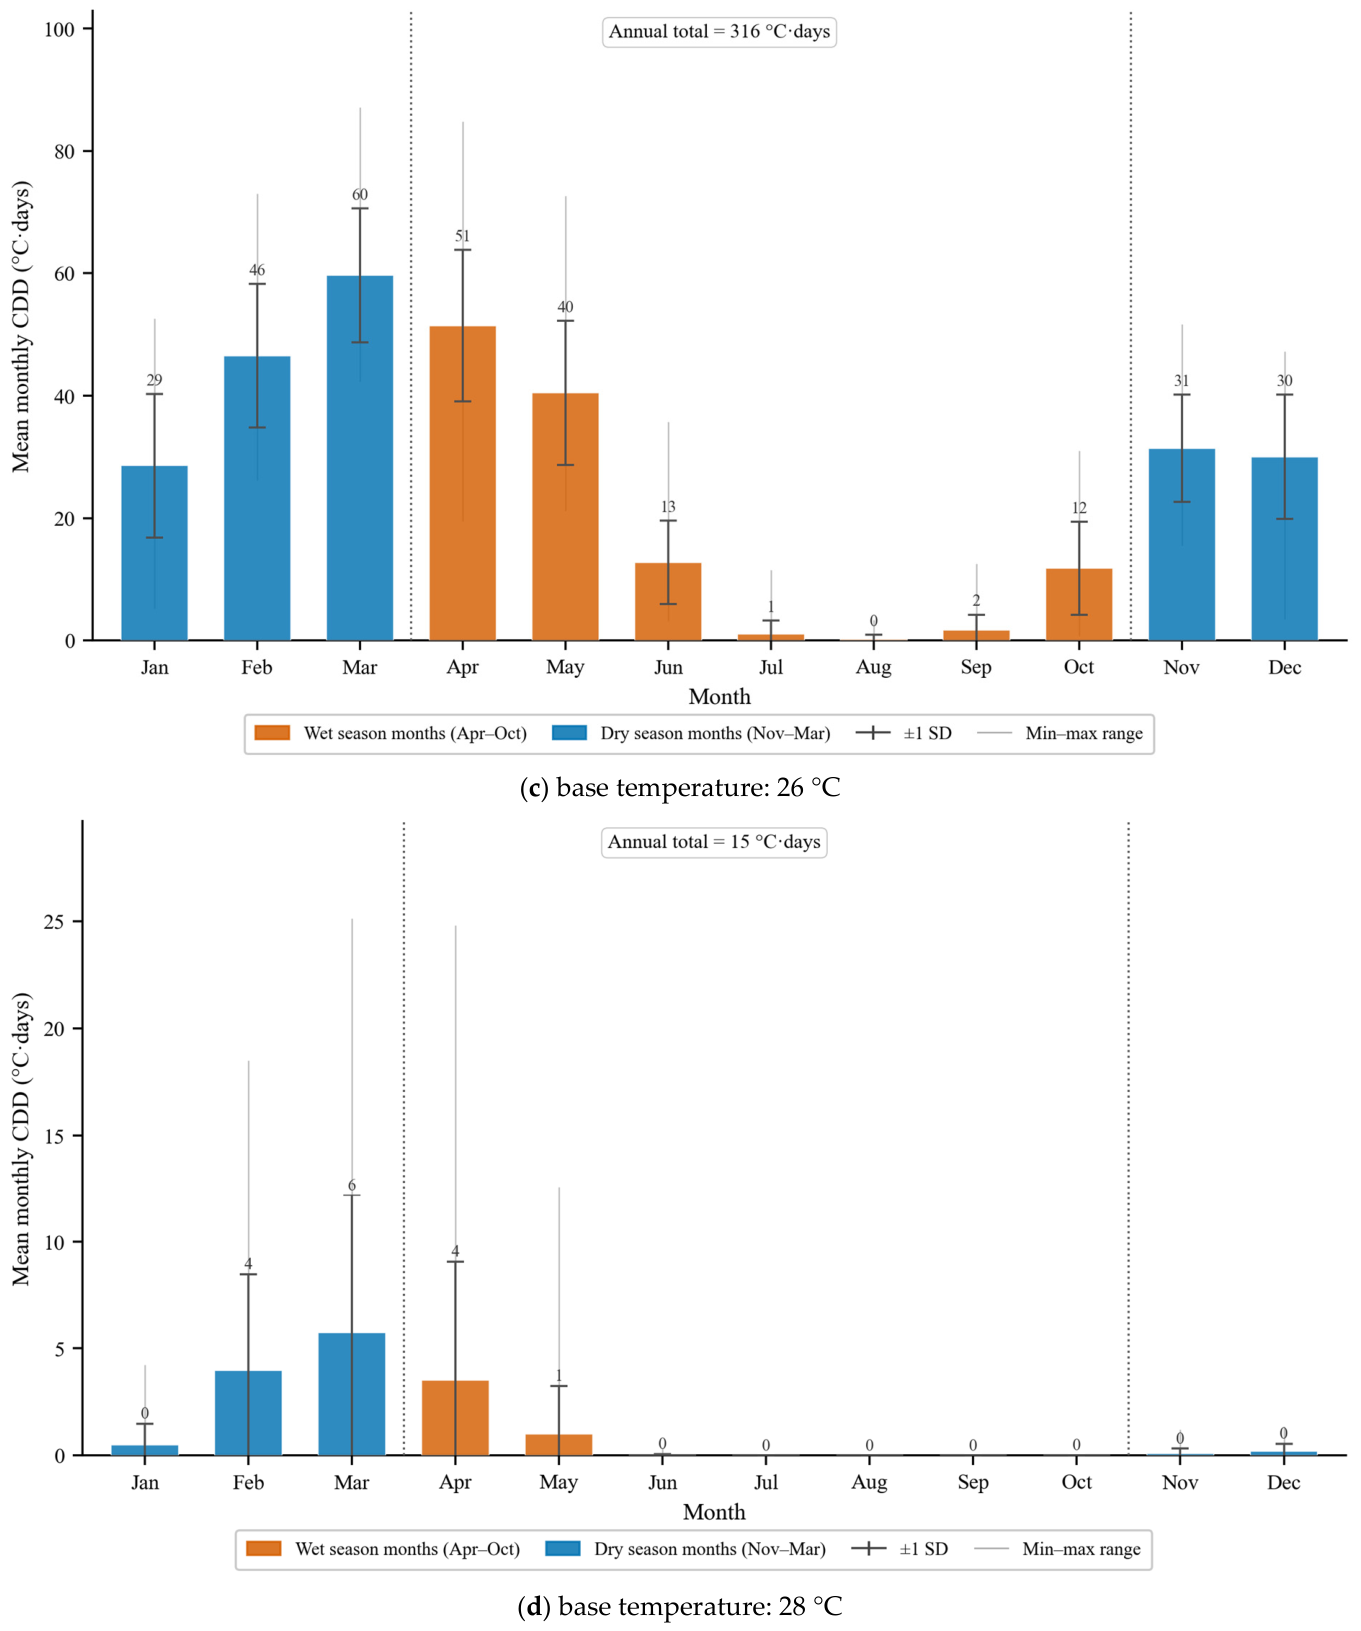
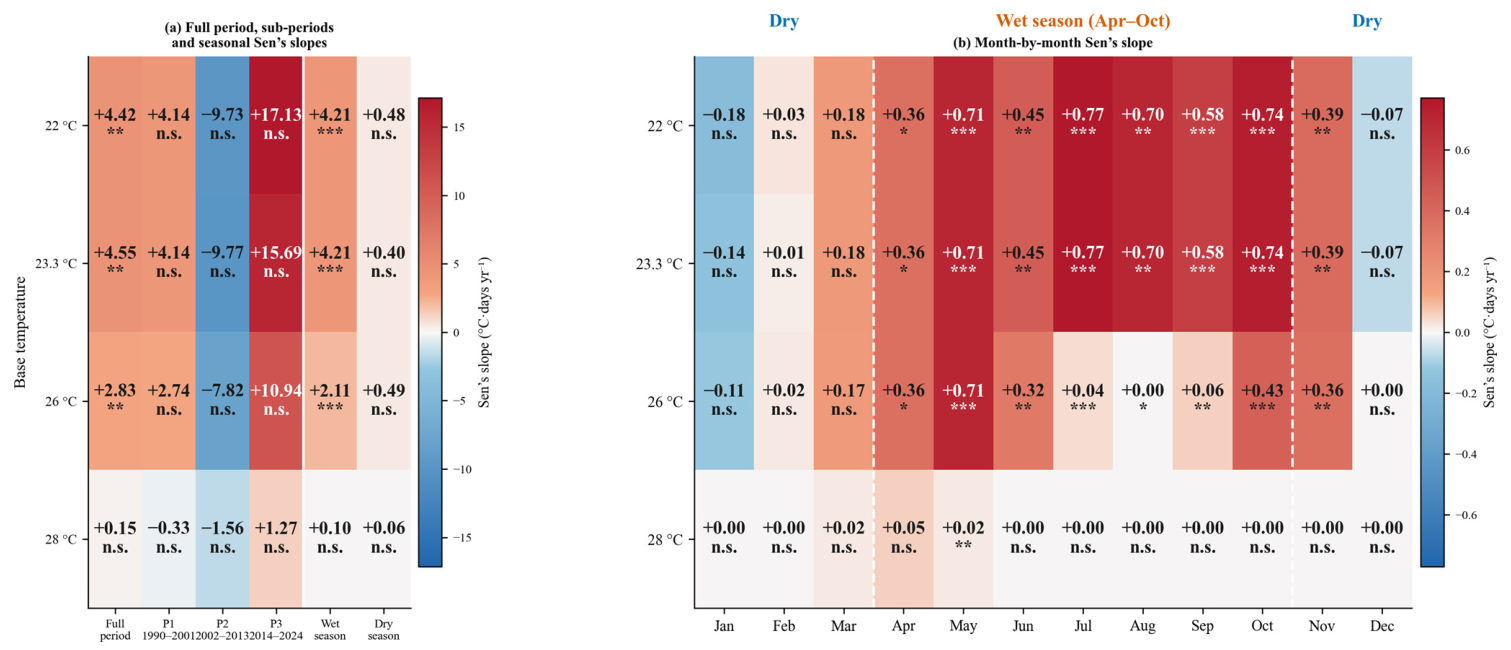
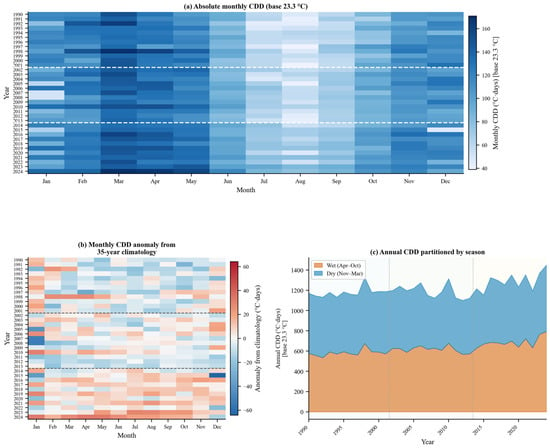
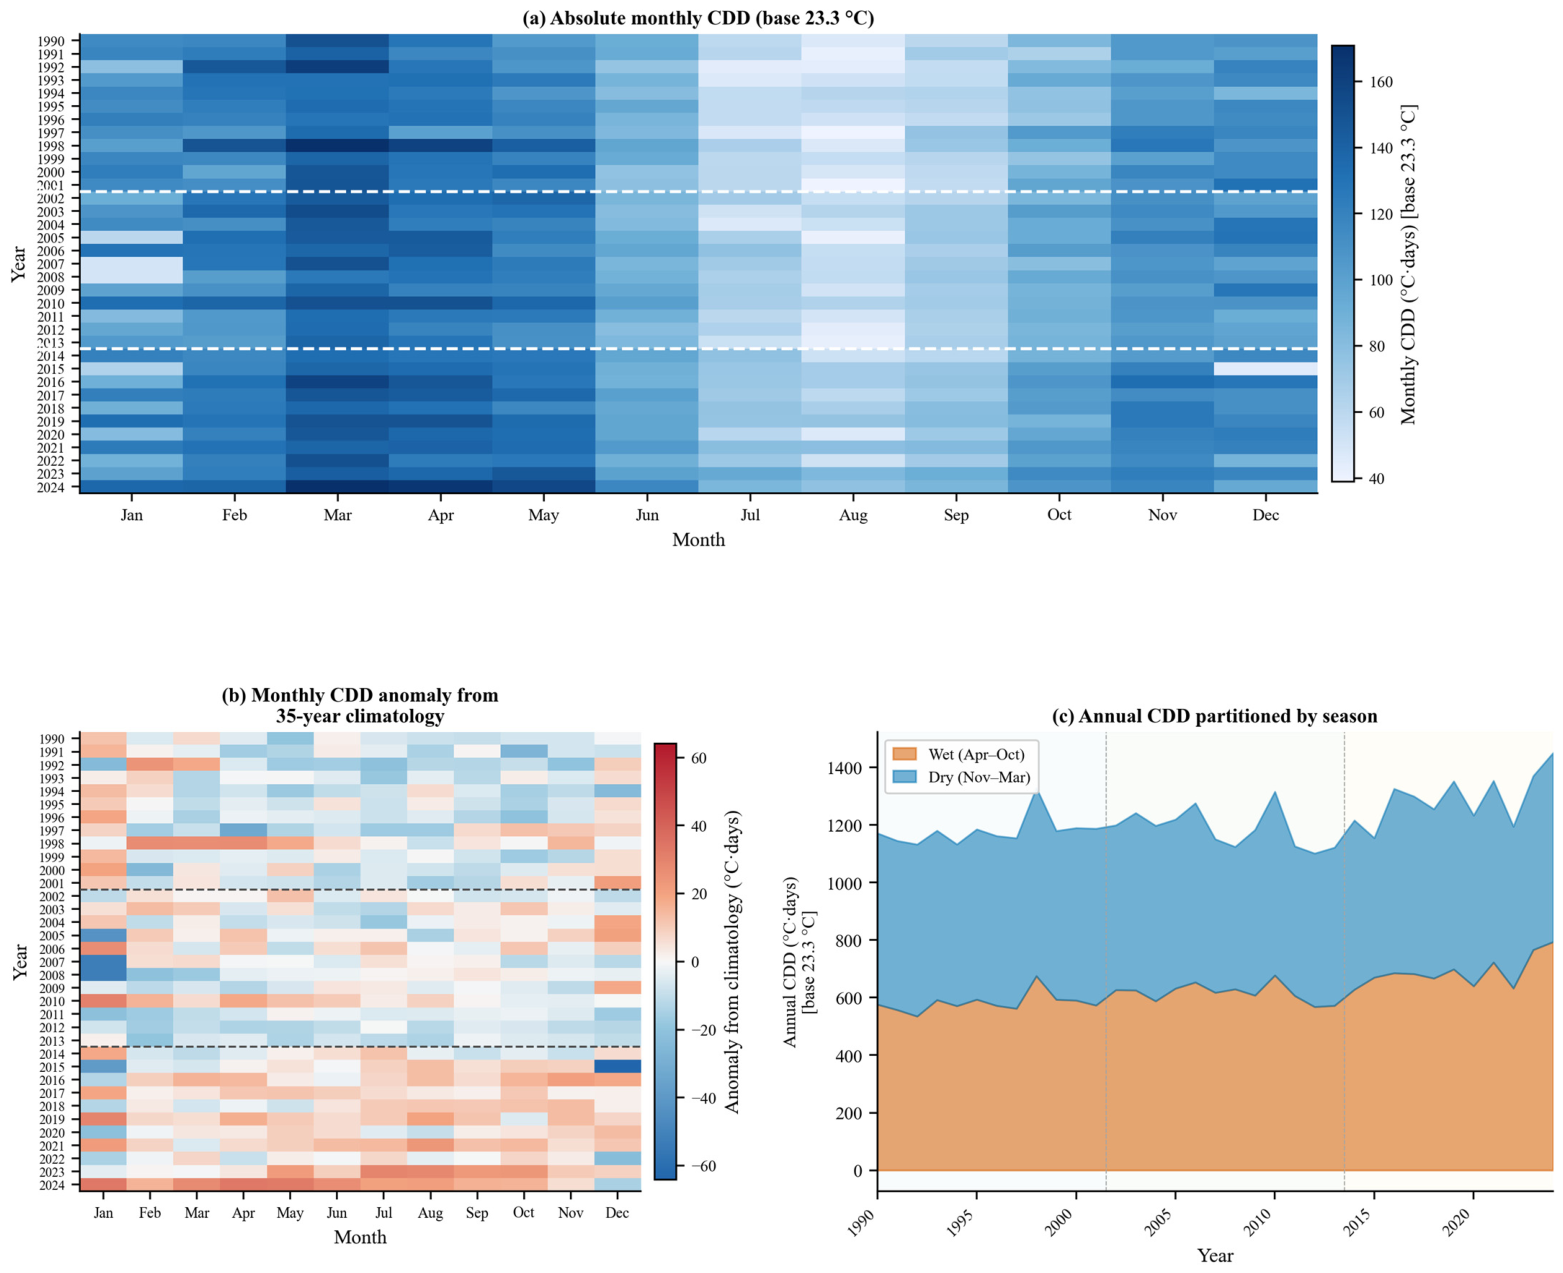
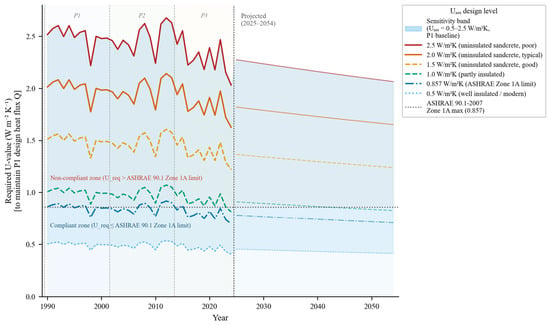
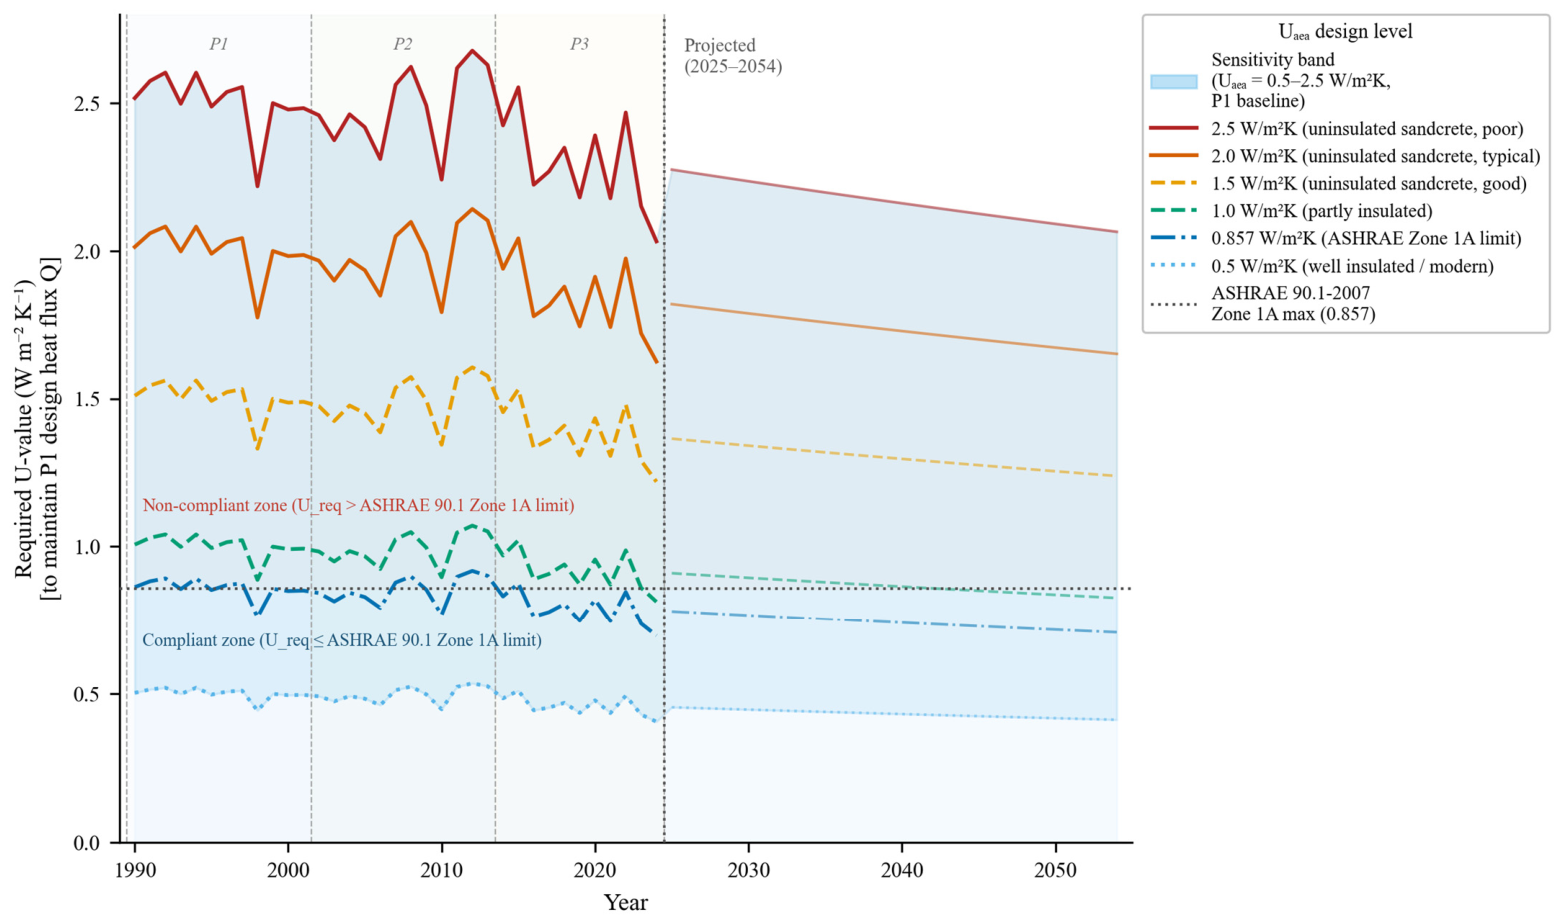
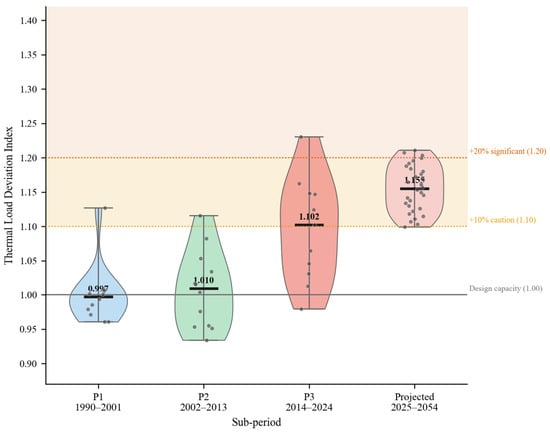
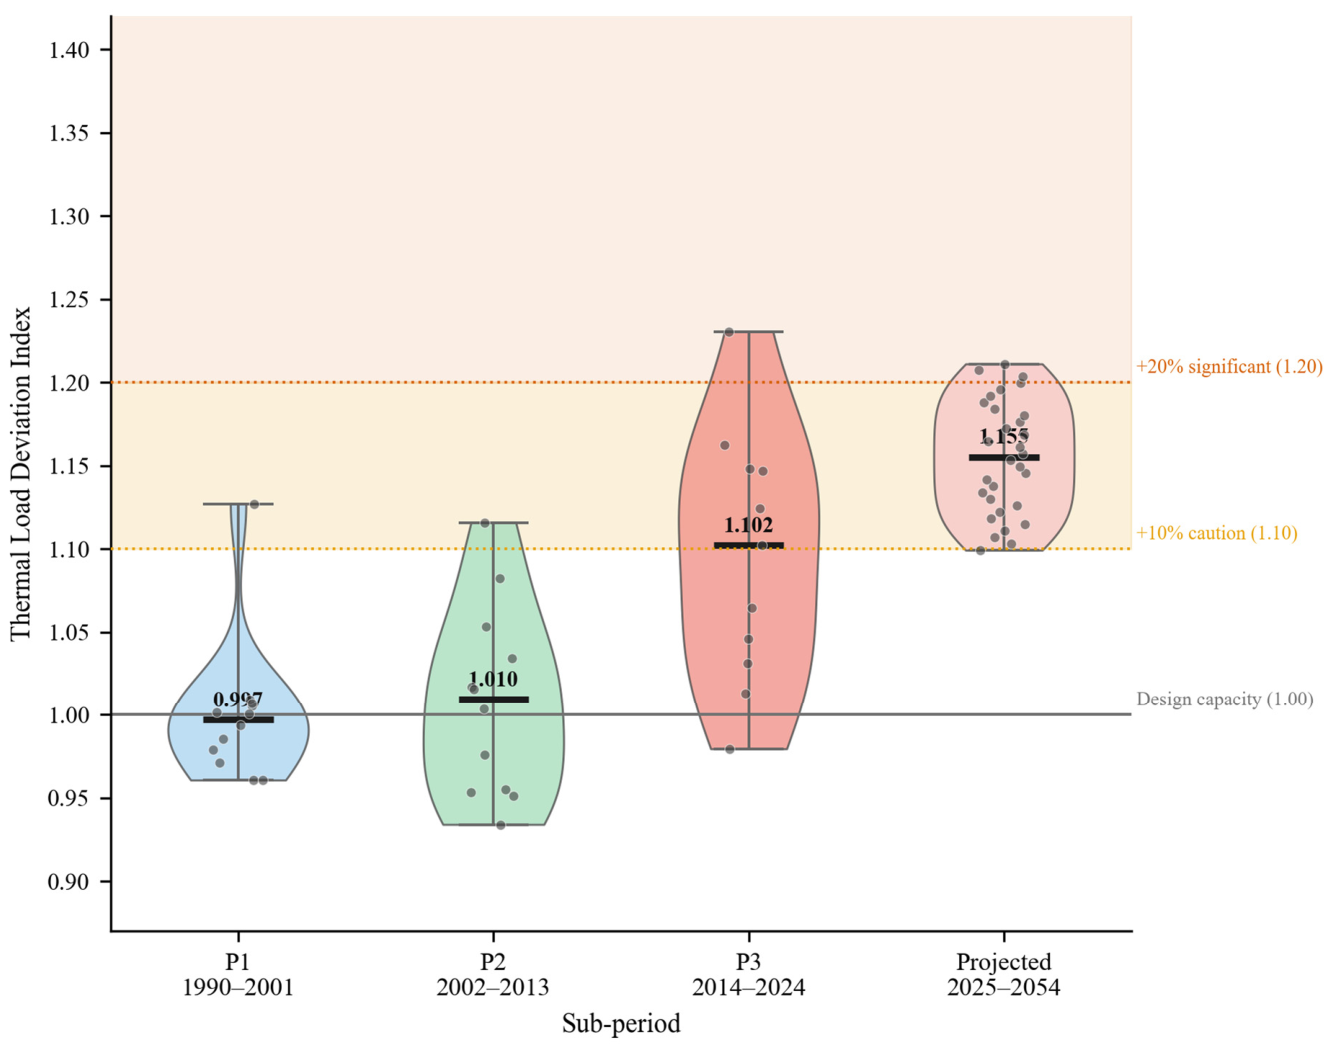
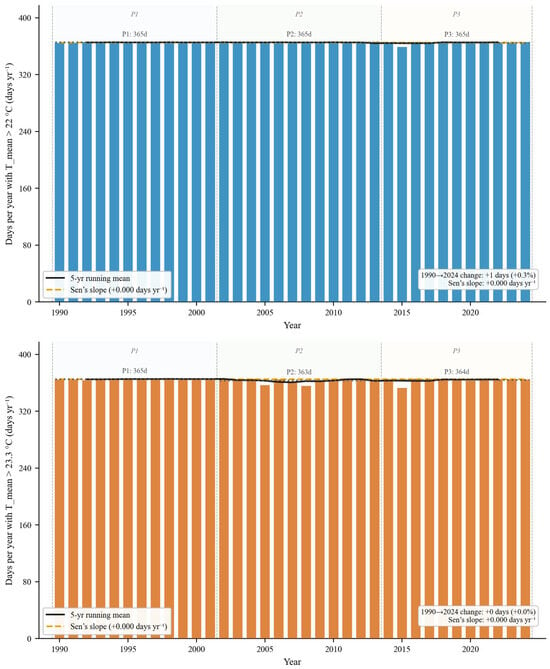
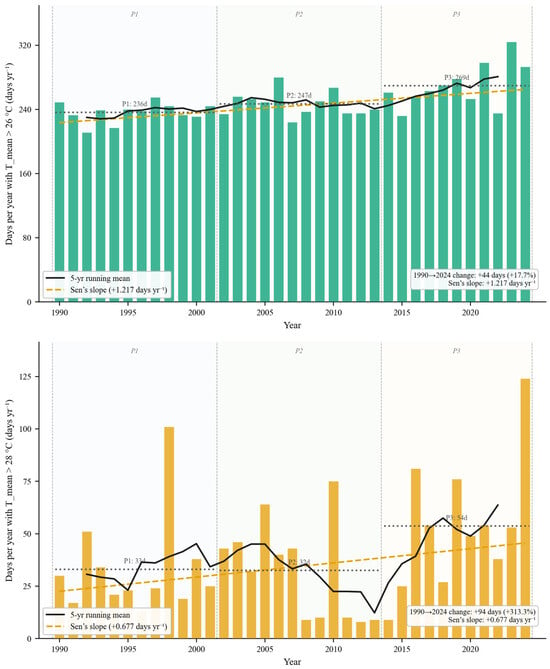
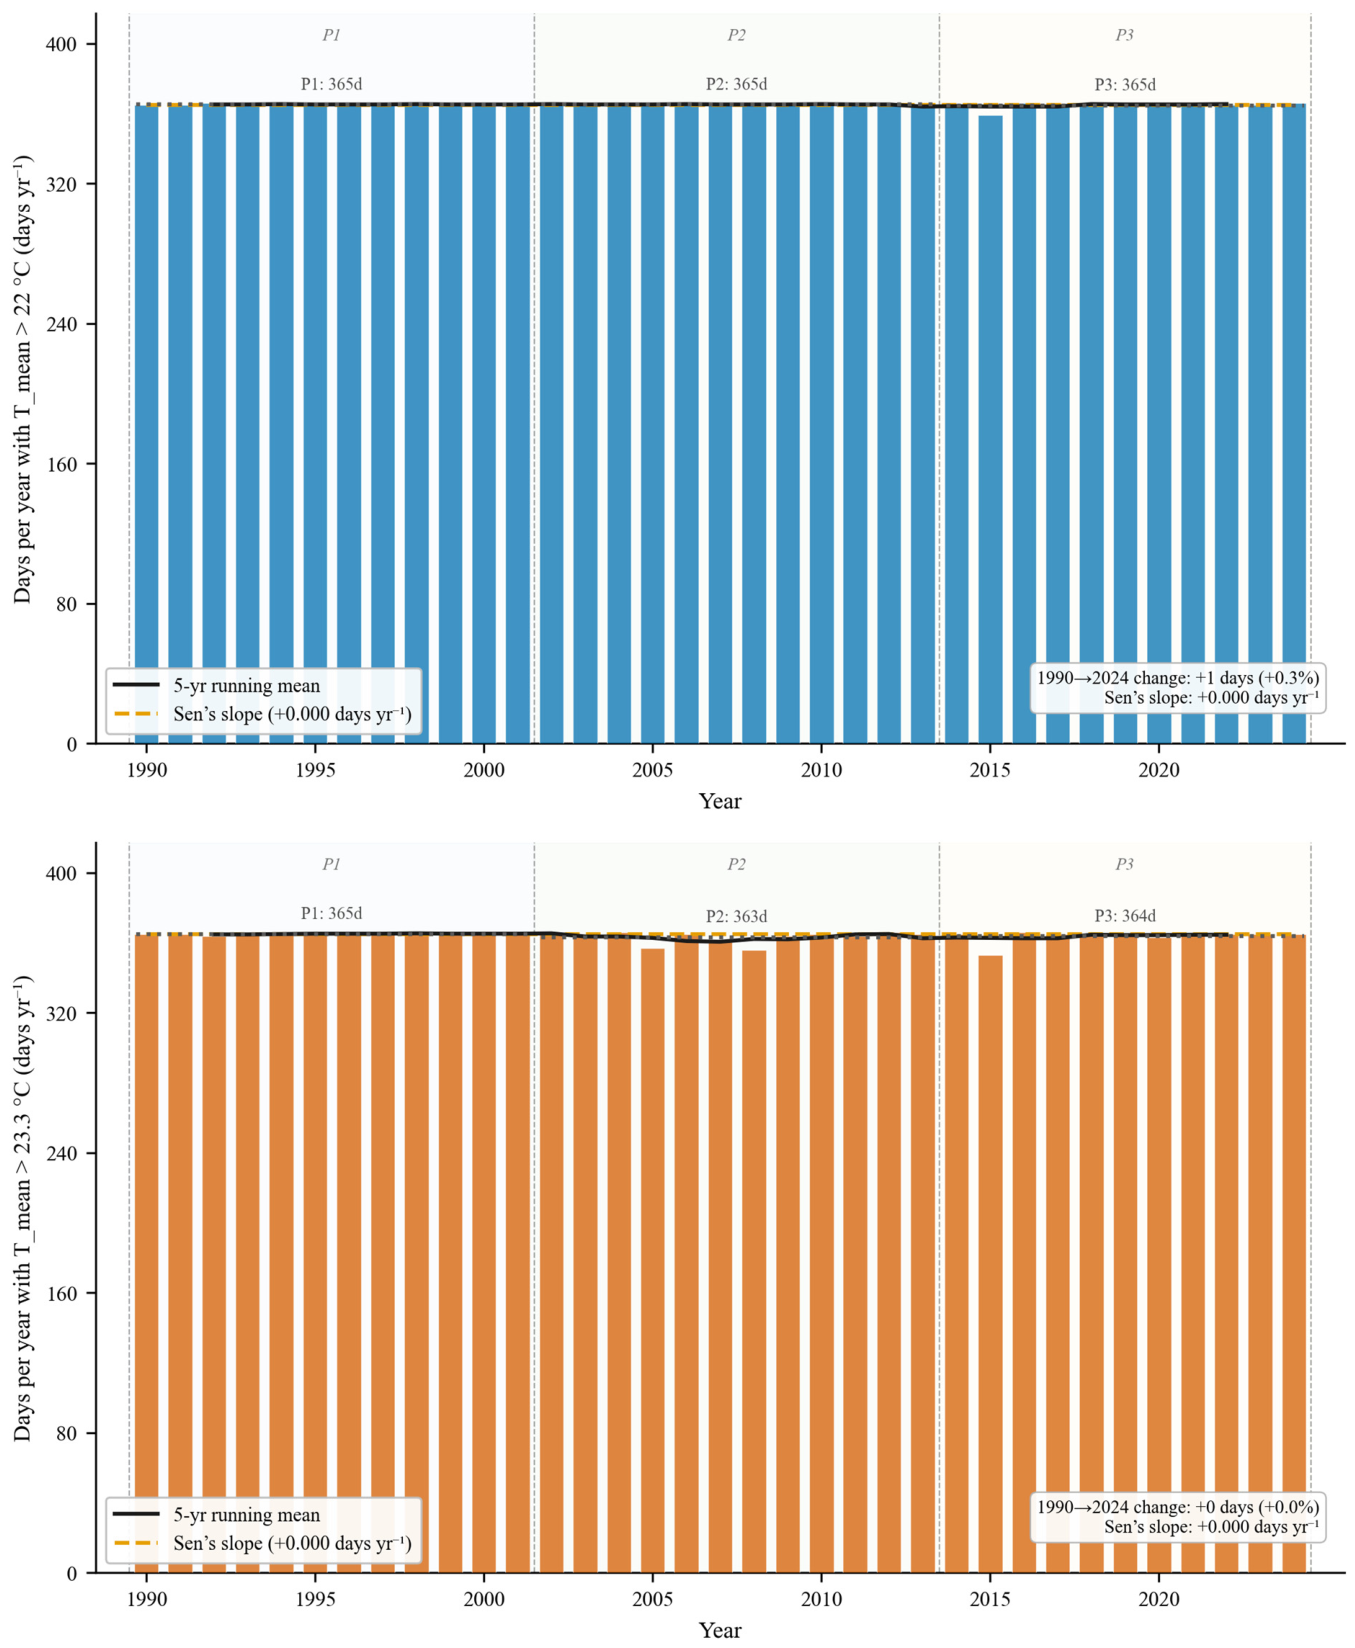
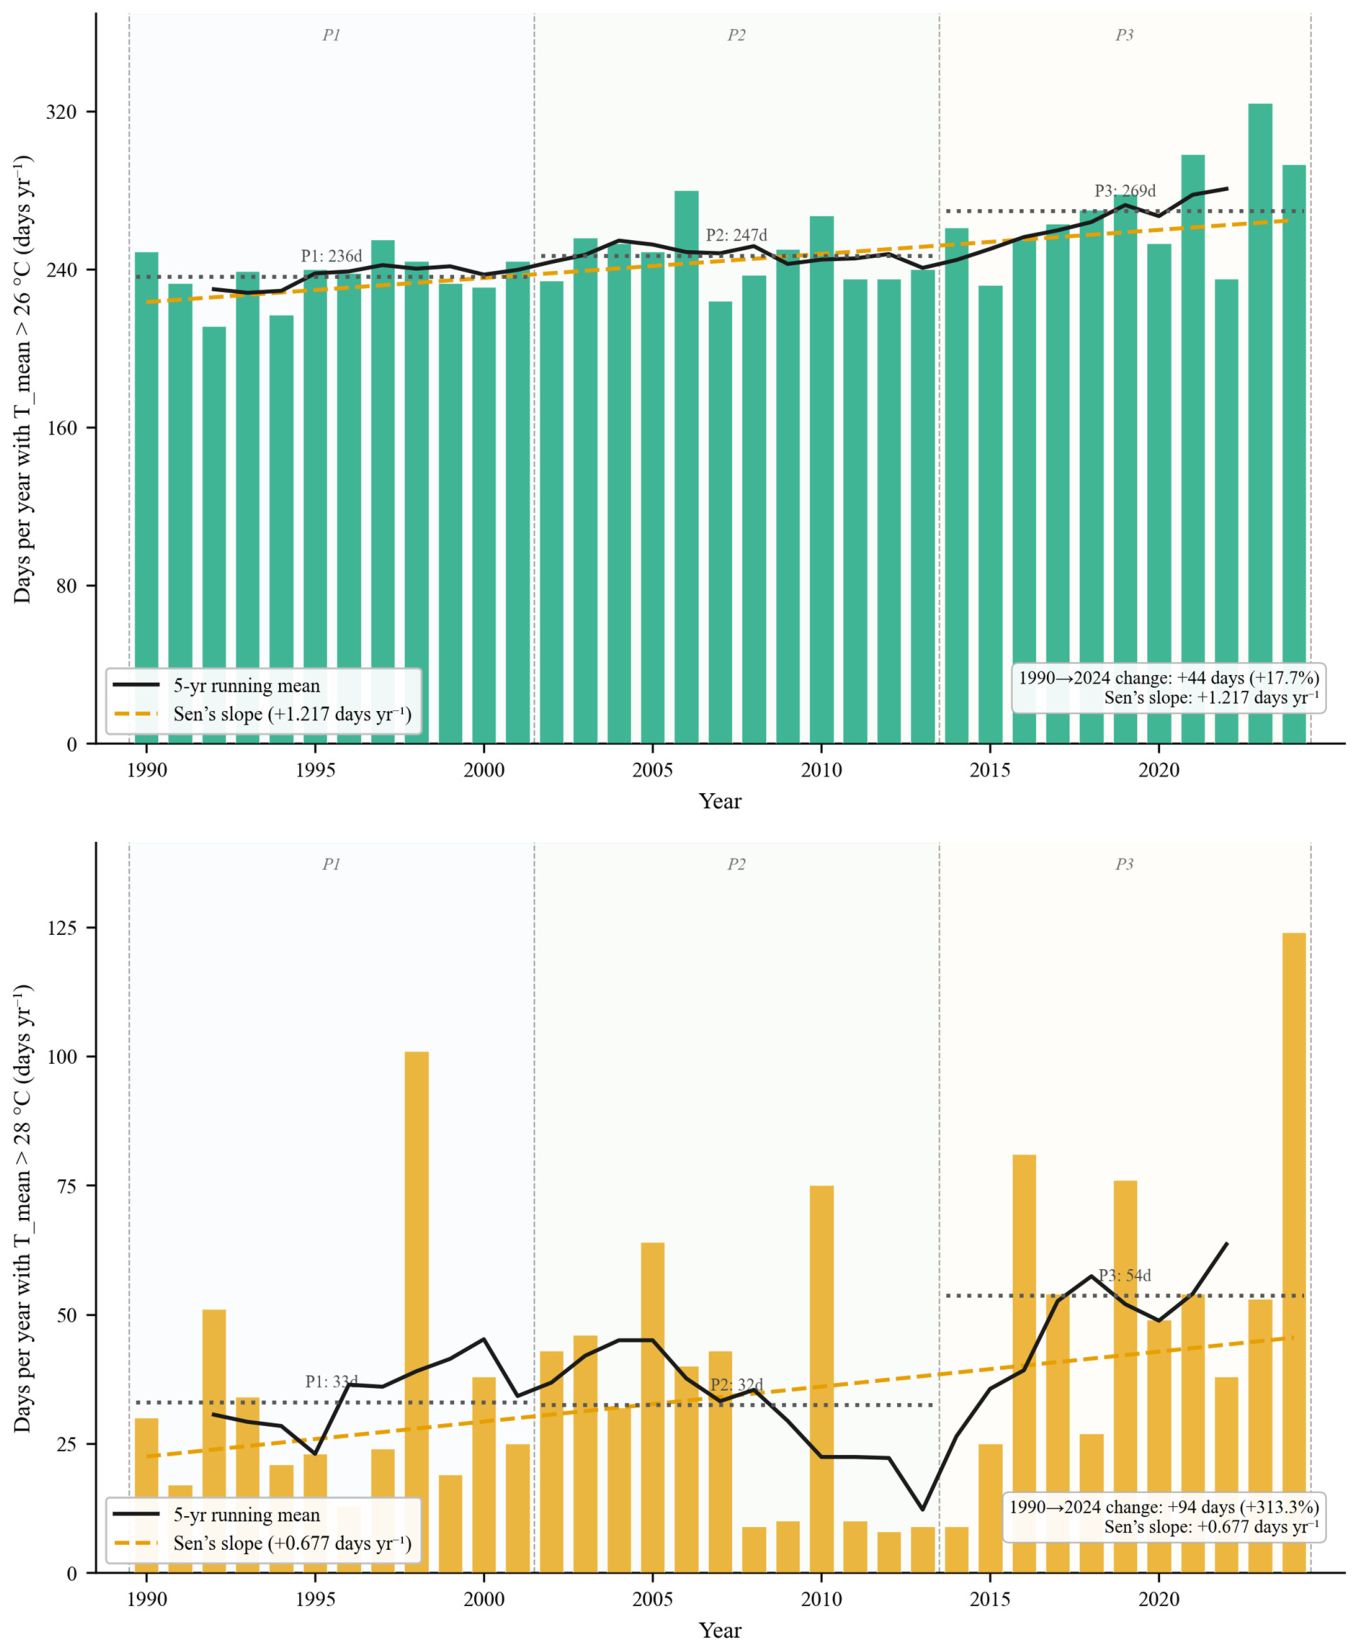

Disclaimer/Publisher’s Note: The statements, opinions and data contained in all publications are solely those of the individual author(s) and contributor(s) and not of MDPI and/or the editor(s). MDPI and/or the editor(s) disclaim responsibility for any injury to people or property resulting from any ideas, methods, instructions or products referred to in the content. |
© 2026 by the authors. Licensee MDPI, Basel, Switzerland. This article is an open access article distributed under the terms and conditions of the Creative Commons Attribution (CC BY) license.