


Abstract
Background: Virtual reality (VR) has attracted increasing attention in architectural design education because of its potential to support spatial cognition and embodied understanding of architectural space. Compared with conventional two-dimensional (2D) drawings and screen-based three-dimensional (3D CAD) tools, VR enables learners to experience space at a realistic scale through binocular disparity and motion parallax, which may reduce cognitive load and facilitate experiential learning. However, previous studies have mainly relied on subjective evaluations, such as questionnaires and observations, and have not sufficiently examined differences in educational effectiveness among design tools or among students with different learning levels. Objective and Methods: This study aimed to identify effective teaching tools for facilitating students’ understanding at different learning levels and to propose appropriate methods for applying VR to improve educational effectiveness. To achieve this, we proposed an objective experimental method for evaluating the effectiveness of VR in architectural design education based on students’ ability to identify incorrect content in architectural design plans. The experiment compared the performance of students using 2D drawings, 3D CAD, and VR environments and examined differences according to student grade levels (higher- and lower-year students) objectively. Results: The results revealed that both higher- and lower-year students identified more incorrect content items related to “Fitting” (such as door layouts) when using 2D drawings (finding rates were 43.8%~53.3% higher than those with 3D CAD or VR), whereas more incorrect content items related to “Furniture” size were identified when using VR (finding rates were 18.8%~56.3% higher than those with 2D drawings or 3D CAD). In addition, items related to sectional and elevation design, such as “Opening,” as well as issues concerning the size of “Space,” were identified by higher-year students regardless of the tool used. In contrast, lower-year students identified approximately twice as many of these items when using VR as when using 2D drawings. Conclusions: Based on the above results, the effectiveness of VR varied depending on both the type of design knowledge and the students’ learning levels. VR improved lower-year students’ understanding of spatial dimensions, furniture and fitting compared with conventional tools. Furthermore, VR encouraged more detailed consideration of spatial and design-related issues during architectural design tasks. These findings suggest that VR can reduce the cognitive load associated with learning architectural spatial concepts and promote experiential learning close to real spatial perception. Implications: This study supports the appropriate use of VR in architectural design education. The experimental method proposed in this study can also be used to objectively evaluate the effectiveness of educational tools other than VR before their implementation in architectural design education. Applying this method in architectural education is expected to enhance students’ awareness of architectural spatial issues and promote more comprehensive spatial understanding during the design process.
1. Introduction
1.1. Development of Architectural Education
Researchers in the field of architectural education have been exploring how to teach more effectively [1,2,3,4,5,6]. Early instruction primarily relied on paper-based materials [1,2,3,5], slides, site visits [4], and 2D drawings (hereafter, 2D) [6]. When students use traditional paper or 2D, they should be able to conceptualize 3D architectural space from flat information. However, developing the ability to construct a space from flat information requires considerable time and effort [7]. The spatial imagination of architecture students in the early stages of study is weak, which may lead to difficulties in understanding architecture-related knowledge when using traditional paper-based materials or 2D.
Students have difficulty grasping complex knowledge in the early stages of learning when their memory capacity for new knowledge is not fully developed [8,9]. Researchers have pointed out that students should be given learning content of an appropriate difficulty level to match their knowledge and experience [9,10]. Furthermore, teaching methods should be developed based on the difficulty of the learning content [11,12] to achieve higher teaching effectiveness.
Along with technological advancements, since about 2000, the traditional method of transforming 2D into 3D models through a computer screen has been expected to help design beginners understand architectural information more intuitively and reduce the difficulty of design learning. For example, Shimokawa et al. [13] and Takagi et al. [14] introduced computer graphics (CG) and 3D computer-aided design (3D CAD) technology in a university architectural design course and verified its effectiveness as a teaching tool.
The effectiveness of virtual reality (VR) technology—a rapidly evolving technology that enables virtual architectural spaces to be experienced in realistic size—as a substitute tool of real space has been validated through comparisons between traditional space presentation (photographs and 360° panoramas) and the real space [15,16,17,18,19,20,21,22,23,24,25]. VR technology has been widely adopted as an alternative to the actual building environment [7,26,27,28,29]. VR applications as teaching materials and design aids in practical design education [30,31,32,33,34,35,36,37,38,39,40,41] have been increasingly used in recent years.
1.2. VR in Architecture Education
Because VR enables users to experience spaces at full scale even before construction or design completion, many universities have begun incorporating VR into architectural education. For example, studies have verified the effectiveness of VR for the learning of “scale feeling,” a basic skill in architectural design. Mabuchi et al. [31] used VR to conduct a training experiment on the scale feeling of outdoor spaces. Hansol [32] explored the possibility of learning scale feeling in VR. The authors [30,33,34] conducted scale feeling training experiments in indoor and outdoor spaces with university students and confirmed that VR can develop the same scale feeling as real space for the learning effect of “scale feeling.” However, although “scale feeling” has been verified as a basic ability, its application in actual architectural design has not been explored.
Therefore, research on VR applications as teaching materials and design aids in practical design education has been progressively conducted. Shimokawa and Kobayashi et al. [35,36,37] reported that VR-based design presentations elicited fewer questions from audience students than conventional presentations, suggesting the potential of VR for “studio pedagogy [42]”. Other studies have demonstrated additional educational benefits, including improved knowledge acquisition [38], enhanced understanding of building structures [39], better comprehension of spatial relationships between buildings and their surroundings [40,41], and higher levels of student interest and perceived learning effectiveness than conventional 2D media [43]. Furthermore, Crolla-Díaz et al. [44] and González et al. [45] evaluated the influence of VR and XR technologies on the design process using five-point Likert scale assessments.
Based on the above findings, the effects (advantages) of VR can be summarized as follows.
- One advantage of VR is its ability to facilitate spatial understanding through binocular disparity and motion parallax [46,47], compared with conventional 2D drawings and screen-based 3D representations. This tendency has been suggested in previous studies [48]. In other words, VR has the potential to support spatial cognition. From the perspective of cognitive load theory [49], the use of VR in education for novice learners may reduce the cognitive load associated with learning, thereby lowering task difficulty and improving educational effectiveness.
- In addition, previous studies have reported that VR enables users to experience spaces at a scale similar to that of real environments [30], and that VR can provide embodied experiences involving bodily sensation [7]. These characteristics may enable students, as users, to understand space while drawing on bodily experiences from everyday life, thereby facilitating spatial evaluation and design consideration based on actual usage situations. Furthermore, such experiences may support user-centered design-thinking processes.
However, a comprehensive review of the aforementioned studies suggests that the educational effectiveness of VR, particularly in comparison with conventional tools, has not yet been sufficiently evaluated in a quantitative, objective, and comprehensive manner.
- Previous studies [8,9,10,11,12] in education revealed that students’ learning results or proficiency levels were assessed through time spent on problem-solving, test scores, and teachers’ scores and evaluations. However, in architectural design education, students’ design works contain multifaceted design elements as well as designers’ subjective ideas. Therefore, traditional evaluation approaches, such as “analysis of dialogues or student behavior when using VR as a presentation tool in design lectures” [35,36,37] or questionnaire-based evaluations such as “five-point Likert scale” of students’ learning outcomes [38,39,40,41,43,44,45,50], may be less effective for objectively and quantitatively assessing students’ understanding of design-related knowledge from multiple perspectives.
In particular, studies [35,36,37], which examined the use of VR in practical educational settings, did not specifically investigate the extent to which VR improves learning effectiveness for different types of architectural design knowledge in comparison with conventional design tools.
On the other hand, evaluation methods employing questionnaires [38,39,40,41,50] are easily influenced by the so-called novelty effect [51,52,53], as students tend to overestimate the effectiveness of VR when encountering it for the first time as an instructional tool. Omlor [54] confirmed this phenomenon, showing that although students tend to rate their learning outcomes higher after using a new learning method compared to traditional ones, there is no significant difference in the actual learning effectiveness. As Checa [55] pointed out in a review of VR-related studies, VR support does not always demonstrate a clear advantage over traditional methods. Therefore, evaluating the educational effectiveness of VR solely on the basis of students’ subjective responses may not accurately reflect its actual educational effectiveness.
- Although most studies have positively evaluated the application of VR in design education by comparing VR with a single conventional teaching tool, the architectural design process—from its early stages to the completed design—includes diverse types of design content, such as structural design, flow planning, and furniture arrangement. Consequently, VR does not always provide higher educational effectiveness than traditional 2D or 3D CAD tools, and more comprehensive and objective comparisons among different tools are required.
Furthermore, previous studies have primarily focused on differences among tools as experimental conditions. However, from the perspective of cognitive load theory, VR is expected to reduce learning difficulty by facilitating spatial understanding. Despite this potential, previous studies have not compared students with different levels of knowledge backgrounds, such as differences in grade level or learning experience. Even if students are given the same instruction, differences in learning experience and fundamental knowledge levels may affect educational outcomes, as confirmed by Hou et al. [30,34] and Nagamatsu et al. [9].
In summary, although VR application as a teaching material and design aid has potential, specific application strategies remain underexamined, and methods for evaluating the effectiveness of VR applications using objective metrics have yet to be created. We suggest that this gap in the literature explains the difficulties in applying VR in real educational scenarios [56,57].
1.3. Evaluation Method of VR’s Teaching Effectiveness
This study quantitatively compared the teaching effectiveness of different tools, referencing the experimental method of students finding errors in programming, a task execution method used by Nagamatsu et al. [9] to measure students’ skill proficiency. In this study, a new evaluation method was designed wherein university students majoring in architecture were asked to complete the task of finding incorrect content in design plans. The “incorrect content” in this study refers to design issues that teachers commonly identify as mistakes in students’ design proposals during practical architectural design education, such as desk critiques and design reviews.
Although the use of incorrect-content detection as an evaluation method has received limited attention in architectural design education, similar problem-detection tasks have been widely employed in medical education and educational psychology to assess learners’ understanding, expertise, and task performance. Previous studies have reported that individuals with higher levels of understanding and expertise allocate their attention more effectively to task-relevant information and demonstrate superior visual search performance (Gegenfurtner et al. [58]). This tendency has also been highlighted in the review conducted by van der Gijp et al. [59]. In particular, studies on visual search for abnormalities in radiology have examined differences between experts and novices in terms of visual information interpretation and search efficiency using eye-tracking techniques. These studies have evaluated performance from perspectives such as visual search patterns [60] and time on task [61,62]. For example, novices have been reported to exhibit more localized visual search behavior than experts [60].
Based on these findings, it can be assumed that, in the incorrect-content detection task adopted in this study, students who achieve a higher level of spatial understanding and comprehension are more likely to identify inappropriate design elements accurately and efficiently. Furthermore, identifying inappropriate design elements requires a certain level of understanding of both the design content and spatial configuration. Therefore, the results of the incorrect-content detection task may reflect not only problem-detection performance but also the degree of understanding of the design itself.
Accordingly, the proposed evaluation method may serve as an indirect indicator of the educational effectiveness of VR by reflecting students’ understanding of design content and spatial configurations. Therefore, the results obtained through this method are considered to possess a reasonable degree of validity for evaluating the educational effectiveness of different presentation tools.
The conceptual diagram is shown in Figure 1. If students can detect most incorrect content using one tool, then, in practical teaching scenarios, that tool will be more effective in helping students understand the content compared with other tools, thus improving teaching effectiveness. Additionally, the number of students who point out the same incorrect content can be an indicator when quantitatively comparing the effectiveness of different tools. Therefore, we believe that our proposed evaluation method has a reliable degree of objectivity.
Figure 1.
The relationship between whether or not incorrect contents can be found and the educational effect.
1.4. Research Purpose and Significance
This study aimed to identify effective educational tools for facilitating students’ understanding at different learning levels and to propose appropriate applications of VR in architectural design education. The primary objectives of this study are as follows:
- This study used both VR technology and conventional presentation tools (2D drawings and 3D CAD models) to present the same architectural design and compared students’ performance in identifying incorrect design content. The aim was to clarify the educational situations in which VR is more effective than conventional tools in promoting problem awareness and problem detection related to architectural design.
- To examine whether the results obtained through the proposed incorrect-content detection task correspond with VR-related educational effects suggested in previous studies, such as reduced cognitive load and improved design-thinking processes. Based on this examination, this study further investigates whether the proposed evaluation method can serve as an indirect indicator of VR’s educational effectiveness beyond problem-detection performance alone.
The significance of this study can be summarized in the following aspects:
While previous studies have primarily relied on questionnaire-based assessments, behavioral observations, or analyses of design discussions, this study proposes an objective and quantitative evaluation method based on students’ detection of incorrect design content, enabling direct comparisons of educational effectiveness across different presentation tools and learner groups. Furthermore, the study examines differences among students with different levels of architectural learning experience, a perspective that has received limited attention in previous VR-based architectural education research. As a result, the proposed method facilitates a more direct and reliable comparison of how new technologies affect students at different learning levels and may contribute to accelerating the adoption of emerging technologies in education.
Furthermore, presenting learners with floor plans and sections containing “incorrect designs” as examples for teaching architectural design knowledge has traditionally been adopted in educational textbooks and instructional materials. The effectiveness and importance of such “Problem-based Learning” (PBL) approaches [63] have already been discussed in many previous studies. In addition, the application of generative AI technologies has rapidly expanded in recent years [64]. In the field of design, it is becoming increasingly important not only to apply acquired knowledge but also to cultivate the ability to recognize and critically examine problems contained in generated proposals and design outputs, namely, to foster a critical perspective.
Based on the above discussion, the comparative results among tools regarding “finding incorrect content in design plans” in this study may contribute not only to supporting the acquisition of architectural design knowledge but also to improving educational methods for fostering learners’ critical perspectives. In addition, VR is expected to provide experiential-learning-like effects [65] by enabling learners to experience “incorrect spaces” at a level comparable to observation in real environments.
2. Methodology
The research flowchart is shown in Figure 2. This section describes the participants, the setting of incorrect content, and the experimental process.
Figure 2.
Research flowchart.
2.1. Participants
This study included higher-grade (H) and lower-grade participants (L) to investigate the effect of grade-level differences on the application effect of each tool (Table 1). Most of the study participants were students from different academic years within the same architectural education program at the same university. This sampling approach helped minimize individual differences and uncertainties that might arise from variations in educational background or curriculum content. We recruited participants from all academic years in the field of architecture at Hiroshima University (HU). Referring to HU’s curriculum, participants were classified into three groups:
- fourth-year and above students (fourth-year students and graduate students; total enrollment: 109; hereafter, H), who were assumed to possess knowledge of design drafting, architectural planning, and the built environment;
- third-year students in the field of architecture at HU (total enrollment: 51) who had completed a project related to residential design two months before the experiment and thus had some architectural knowledge (hereafter, L-2); and
- second-year students in the field of architecture at HU (total enrollment: 50) who had little or no architecture-related knowledge (hereafter, L-0).
Table 1.
Subjects and experiment date.
Finally, to include students currently studying residential design, we also recruited students from the field of architecture at the Hiroshima Institute of Technology (HIT, total enrollment: 120) who had some architectural knowledge and were working on architecture-related topics (hereafter, L-1).
Considering that the curricula differ among universities, students of the same academic year from different universities were excluded from participation.
Regarding the recruitment procedure, for L students, we distributed and collected experiment consent forms during architecture-related lectures. For H students, the consent forms were distributed and collected in their respective laboratories.
The final number of participants was as follows: H, 46 students (recruitment rate: 42.2%); L-2, 16 students (recruitment rate: 31.4%); L-1, 15 students (recruitment rate: 12.5%); and L-0, 16 students (recruitment rate: 32.0%).
2.2. The Setting of Incorrect Content
For the preparation of the experiment, design teachers and teaching assistants (TAs) were interviewed in two stages. The first stage aimed to identify students’ common incorrect content items in design plans and to select the incorrect content to be used in the experiment. The second stage aimed to examine the reasonableness of the selected incorrect content for the experiment.
2.2.1. Comprehensive Investigation of Common Incorrect Content in Students’ Design Plans
This study defined the setting of incorrect content as common mistakes of students when learning design drafting using 2D or 3D CAD. For this purpose, interviews and surveys were conducted with three teachers with experience in teaching design drafting at HU (mean of 11.6 years of teaching experience). As reference information, six TAs in the design drawing course were surveyed. The survey period was 12–27 April 2022, and all teachers and TAs were interviewed individually.
After explaining the interview’s purpose, the following questions were asked:
- In instructing the students on design drafting, how many stages of instruction are involved from the early stages to completion?
- What are the common mistakes made by the students during these stages?
The results showed that three stages of design are involved in students’ design drafting. Stage 1, the overall building planning stage, focuses on the overall scale of the building in the flow, structure, and spatial layout. Stage 2, the space design stage, focuses on the scale of the individual rooms, size of the space, and design of the openings. Stage 3, the detailed design stage, includes furniture arrangement, size selection, and material selection.
Additionally, 66 common student design incorrect content items were highlighted in the survey, of which 42 were related to residential interiors (Table 2). The reason for restricting the incorrect content to residential design in this study is that residential design is usually the first design issue in a university architecture course [5,66], and the students have more experience with residential spaces than public facilities, such as art museums or office buildings [34]. Therefore, it is less difficult for students to find incorrect content during the experiments. The effects of using VR in areas other than residential buildings will be verified in future studies.
Table 2.
Incorrect content frequently encountered in students’ designs.
2.2.2. Selection of the Incorrect Content Items
We believe that the content items related to the Building Standards Law in Japan can be recognized as incorrect; therefore, it is reasonable to select them as incorrect content. However, regarding design planning, as the actual use may differ for different users and the design sense may differ for different designers, some of the content may be interpreted as both incorrect and correct. Therefore, when selecting incorrect content items for design planning, we prioritized the content that teachers commonly identify as a mistake in their students’ designs.
First, we conducted a rough classification of the mistake items based on the type of object (e.g., “space,” “opening,” “furniture and equipment”). However, we found that the number of mistake items varied significantly among these object categories—for example, there were 12 mistake items related to “space,” accounting for more than one-fourth of the total. Therefore, to balance the number of mistake items across categories, we next subdivided the object categories that contained a larger number of mistake items based on the type of mistake—for instance, “space (height),” “space (relation),” “furniture and equipment (size),” and “furniture and equipment (height).” Finally, the mistake was subdivided into 15 categories (Categories 1–15 in Table 2). Additionally, the number of teachers who pointed out the same mistake was counted. Next, mistakes related to the Building Standards Law or several teachers and TAs who pointed out the mistakes were selected from each category; we also set a limitation that no more than two mistake items were selected in each category. We then set the incorrect content based on these mistakes (shown after the “→” symbol in the “Common mistakes in student design” column in Table 2).
Additionally, the classification of the selected incorrect content revealed fewer items of incorrect content related to building fittings, such as “doors and windows.” Therefore, by referring to the Building Standards Law on handrails, the content of “S3-5. Balcony railing height is too low” was added. Meanwhile, based on previous research [7], which concluded that “when using VR for spatial confirmation of a design plan, people without design knowledge can also participate in discussions about the design plan based on their physical, embodied experience,” we added “S2-6” and “S3-6,” which are related to the dimensions and ease of use of building fittings and furniture, to examine the conclusion.
Except for “windows and doors,” there was only one incorrect content item related to “material aspects” in all categories, that is, “S3-3”; therefore, we included “S3-4” as an incorrect content item, even though it was pointed out by only one TA. Moreover, we added “S3-7. Chair width (300 mm) is too narrow” to verify whether small mistakes in the design process can be detected or not through VR experience.
A total of 20 incorrect content items were selected (marked in gray in Table 2). Meanwhile, as the added incorrect content items were not pointed out by the teachers in the first phase of interviews, we verified them as incorrect content, as presented in Section 2.2.4.
2.2.3. Presentation of the Design Plan: Creation of Design Plans with Incorrect Content
To avoid unexpected incorrect content, instead of a full redesign, we created design plans with incorrect content based on the house manufacturer’s design drawings of the residences. Additionally, as importing all 20 incorrect content items into the same design plan would be impractical, we assigned them to five design plans (Figure S1 in the Supplementary Material). The following sections describe the methodology and setup for presenting the design plans using 2D, 3D CAD, and VR in the experiments.
2D
In the design courses at HU, students generally use Graphisoft (ArchiCAD 24) to create both 2D plans and 3D models. Considering that students often learn by hand-drawing 2D during the early stages of their architectural education, the 2D presented to participants in this study were created with reference to the level of completion typically seen in the second-year Residential Design course assignments, which include information such as walls, columns, flooring materials, furniture, and equipment (Figures S2–S7 in the Supplementary Material).
Therefore, the design plans in this study were also created using ArchiCAD and printed on A3 paper at a scale of 1:100. The content included floor plans of each floor, one to three cross-sectional drawings, and additional information such as building orientation and flooring materials (Figure S1 in the Supplementary Material). Additionally, all incorrect content related to height was included in the 2D cross section. The 2D presentation of the design plans is shown in Figure 3a.
Figure 3.
Presentation of design plans: (a) 2D; (b) 3DCAD; (c) VR.
3D CAD
We used ArchiCAD to represent the 2D design plans in 3D and created the experimental application using Unity Technologies’ game development tool, Unity3D (version 2021.3.17f1). We displayed the game scene in Unity3D in full screen (Figure 4a) and had participants experience the 3D design plans using a 27-inch PC screen Dell S2721H (Dell Technologies, purchased from Applied Co., Ltd., Hiroshima, Japan) with a 1920 × 1080 pixel display at a distance of 60 cm from the eyes. Participants experienced the design plans in the 3D space from a human viewpoint and could move freely at 1 m/s by using the up, down, left, and right arrow keys on the keyboard. They could also adjust the direction of forward movement and the view with the mouse (Figure 3b).
Figure 4.
An example of screen: (a) 3DCAD; (b) VR.
VR
We used the same model and game development tools as in 3D CAD to demonstrate the VR design plans. The VR device was HTC’s head-mounted display (HMD) VIVE Pro Eye (HTC Corporation; purchased from Applied Co., Ltd., Hiroshima, Japan) with a display resolution of 2880 × 1600 pixels (1440 × 1600 pixels per eye). The left and right displays could show images with binocular parallax (Figure 4b). In VR, participants could walk freely within a maximum range of 4 × 4 m. They were able to move long distances between rooms and up and down staircases by using parabolas fired by the controller (green dashed line in Figure 5), which could teleport to the position on the floor specified by the participant (green circles). Figure 3c shows the design plan presentation in VR.
Figure 5.
Teleport in VR.
Furthermore, we programmed the doors of the rooms in 3D CAD and VR so that when the participant was standing near a closed door, it would open automatically.
2.2.4. Final Adjustment of Incorrect Content
To test the suitability of the 20 incorrect content items used in this experiment, we interviewed 10 faculty members at universities and the National Institute of Technology (KOSEN) in Hiroshima Prefecture, who had experience in instructing design drafting. These interviews were individually conducted between 22 July to 31 August 2022.
After informing the teachers of the interview’s purpose, we presented the list of incorrect content items (marked in gray in Table 2) and asked them to answer whether or not they would point out these incorrect content items in their students’ design plans (Response options: 1. “wouldn’t point out,” 2. “probably wouldn’t point out,” 3. “probably would point out,” and 4. “would point out”). The results for each incorrect content item are shown in Figure 6.
Figure 6.
Results of “whether or not they would point out these incorrect contents if the students they instructed had these incorrect contents in design plans”.
Based on the interview results, we adjusted the incorrect content items that were rarely pointed out by the teachers in regular instruction and, following the suggestions obtained during the interviews, added several other incorrect content items. The revisions were as follows: Owing to the large number of “wouldn’t point out” responses for “S3-3. Mistake in material selection (stone desk in the interior),” it was excluded from the experiment. However, to avoid the number of incorrect content items from falling below five, the item was changed to “S3-3. Mistake in material selection (wooden floor in bathroom).” Additionally, although there was a large number of “would point out” for “S2-7. Slope is too steep for wheelchair users,” responses, it was excluded because wheelchair ramps are not a standard feature in ordinary residential spaces.
During the interviews, we presented the design plans to the teachers and asked them for their suggestions about the experimental content. Based on their responses, such as “when using VR, the vertical dimension may be easier for students to understand” and “the direction feeling is weaker in VR,” we added the incorrect content items “S1-7” and “S1-8.” Based on these adjustments, we used 21 incorrect content items in the formal experiment (Table 2).
Additionally, after the interview survey, we revised as many mistake items as possible, other than the incorrect content items, based on the teachers’ comments on the design plans.
2.2.5. Non-Incorrect Content
Even after undergoing the above process, certain design proposals may still be regarded as incorrect depending on the usage scenarios assumed by each participant. In addition, due to differences in individual values and preconceptions regarding the design, aspects that are generally considered correct may be interpreted as incorrect. Therefore, in this study, the contents other than incorrect content pointed out are defined as “non-incorrect content,” and these results are also included in the analysis.
2.3. Experimental Process
The experiment was conducted in a conference room at HU. The layout of the experimental environment is shown in Figure 7.
Figure 7.
Layout of the experiment room.
Before the experiment, we explained the content of the experiment to the participants. During the experiment, we showed them the five design plans in sequence and asked them to identify the incorrect content. At the end of the experiment, they were asked to answer a questionnaire about their architectural design knowledge, experience, and values. To avoid order effects and participants’ personal experience influencing the results, we let each participant use all three tools (2D, 3D CAD, and VR); hence, they used each tool to experience one or two design plans. Furthermore, the order in which the design plans were experienced and the tools were used was randomized. Consequently, each participant experienced all five design plans and all 21 incorrect content items included in them.
When participants thought they had found an incorrect content item, they verbally reported what the object was, what state it was in, and why they thought it was an incorrect content item. To enable us to record and organize the reported content more accurately, we also asked participants to encircle the mistake (when using 2D) or take a screenshot (when using 3D CAD or VR) after their verbal report.
The duration of the experiment was 1–1.5 h per participant. The following sections present the experimental steps for each tool.
2.3.1. Two-Dimensional
We explained the basic information of the design plan, such as the composition of the family members, structure of the house, and direction of north, east, south, and west in the drafting. Subsequently, the participants checked the design plan as we started the timing. For participants to be able to read the dimensions on the drawings, we allowed them to use a 30 cm triangular ruler; however, they were prohibited from measuring the dimensions of the actual things in the experiment room. For the L-0 students, who lacked experience in reading information from 2D, we explained the meanings of the symbols (e.g., walls, windows, and doors) before the experiment and allowed them to ask questions about the meanings of the symbols during the experiment.
2.3.2. Three-Dimensional CAD
Before the experiment, we adjusted the viewpoint height to match the participant’s eye level for the design plan. Participants used the keyboard and mouse to virtually walk around the design plan. To prevent them from not being able to fully observe the space due to unfamiliarity with the operation method, we explained the operation method in a practice space outside the design plan and allowed participants to practice sufficiently how to move within the design plan before starting the experiment. After the practice, all participants—including the L-0 and L-1 students who had no prior experience with 3D CAD—were able to independently perform operations such as turning and moving. Subsequently, we moved their viewpoints to the entry door and explained the basic information about the design plan. Participants followed a pre-determined route and walked under our instructions to obtain an approximate overview of all the rooms in the design plan. Following this overview, they returned to the entry door and began a free-form search for incorrect content. When incorrect content was found, they took a screenshot of the keyboard manipulation.
2.3.3. VR
The procedure for the VR design plan was similar to that in the 3D CAD. When incorrect content was found in the VR plan, participants took a screenshot by pressing a controller button.
The duration for each design plan, including the time to obtain an approximate overview of the design plan, was standardized at 8 min. Participants could end the experiment early if they were unable to find any incorrect content.
3. Results and Discussion
For each design plan, the number of users for each tool was restricted to 15–16. The sum of the number of times the incorrect content items were pointed out (ICp), the number of times content other than incorrect content was pointed out as non-incorrect content items (n-ICp), and the number of times each tool was used are shown in Table 3.
Table 3.
Total number of point times.
As each design plan in 2D included 1–3 cross sections, some of the section and elevation information in 3D CAD and VR (e.g., the “height” of “openings,” the “height” or “color” of “furniture,” etc.) cannot be adequately displayed in 2D; therefore, we excluded such content from the n-ICp count.
The results revealed a higher n-ICp count compared with the ICp count. This may be because this experiment did not limit the number of times participants could point out incorrect content items during the 8 min exploration time. Therefore, they pointed out extremely small mistakes, regardless of the level of incorrect content.
3.1. Point-Out Rate of Incorrect Content
First, to examine the influence of order effects, the number of pointed-out items for each tool was aggregated according to usage order (Orders 1–5), as shown in Table 4 below. The results did not indicate a tendency for Orders 4 and 5 to yield higher numbers of pointed-out items than Orders 1 and 2, suggesting that the influence of learning or order effects on the experimental results was limited.
Table 4.
Number of pointed-out in each order.
Then, we calculated the point-out rate by dividing ICp by the number of participants who used each tool to experience the design plan with the incorrect content. Figure 8a–c shows the ICp values (0–100%) for the incorrect content included in each of the three steps described above for setting the incorrect content, according to the tool used. In all graphs (a)–(c), the results for H are shown on the left, whereas those for L are shown on the right.
Figure 8.
Results of point out rates of each incorrect content: (a) Stage 1; (b) Stage 2; (c) Stage 3. Note: * Indicates a significant at p < 0.05 (Chi-square test).
Additionally, following the method described in [67], we conducted a chi-square (χ2) test to examine the differences in detection rates among the tools, and applied the Bonferroni correction to adjust for multiple comparisons. The significance level for the χ2 test was set at α = 0.05 (two-tailed). For post hoc comparisons between tools, the Bonferroni correction was applied to control for the increase in Type I error associated with multiple comparisons. In the 2 × 3 contingency table used in this study, three pairwise comparisons were conducted among the tools (2D: 3D CAD, 2D: VR, and 3D CAD: VR). Therefore, the adjusted significance level was set as follows: αadj = 0.05/3 = 0.0167. The test results and the effect size (Cramer’s V) are shown on the right side of each graph.
Overall, similar trends were observed regardless of grade level or tool, particularly for incorrect content items with low ICp values (e.g., S2-2, S2-3, S3-4, and S3-5) and those with high ICp values (e.g., S2-4). These findings suggest that in some incorrect content items, the difficulty of detecting incorrect content items varies depending on the characteristics of the items themselves. In comparisons among tools, significant differences were identified in three 3 items in H and 4 items in L, indicating that differences in the tools used may also influence the ease of detecting certain inappropriate items.
In the following analysis, we focused mainly on the ICp with a medium or higher effect size (Cramer’s V > 0.30) [67] and the statistical significance (p < 0.05) in the χ2 test.
3.1.1. Higher Grades (H)
The incorrect content items that H could easily find when using 2D compared with the other tools included “S1-4. Corridor space is too long and complicated” (Cramer’s V = 0.342), “S1-5. 6 m spacing between pillars in large spaces of a wooden house” (Cramer’s V = 0.423), and “S3-6. Door opening/closing direction is wrong” (Cramer’s V = 0.646, p < 0.05 for both the comparisons between 2D and 3D CAD and between 2D and VR). They likely found “S1-4” and “S1-5” more easily because of the overall information of the design plan, such as column networks, beams, and room layouts, which can be easily identified in a 2D design plan. Although the door can be opened and closed in 3D CAD and VR, the number of participants who pointed out the door (“S3-6”) was 0 and 1, respectively. This is because, in 2D, the direction of the door opening is indicated by a fan symbol, which makes it easier to check whether the opening of the door will affect the surroundings.
The incorrect content item that H was more likely to find when using 3D CAD was “S1-6. Staircase beams hit the head” (Cramer’s V = 0.394). When participants used VR, they often focused on their feet and operated the teleport function when going up and down the stairs, causing them to ignore the beams overhead. However, in 3D CAD, the spatial information while walking up and down the stairs could not be ignored because they could walk continuously in the space. Regarding “S1-3. Children’s room must be accessed through the master bedroom” (Cramer’s V = 0.291), participants used the teleport function to move between rooms when using VR, which explains the large difference between 3D CAD and VR.
The incorrect content items that H was more likely to find when using VR included “S1-1” (Cramer’s V = 0.362), “S2-1” (Cramer’s V = 0.556, p < 0.05 for the comparisons between 2D and VR), “S2-6” (Cramer’s V = 0.434, p < 0.05 for the comparisons between 2D and VR), “S3-1” (Cramer’s V = 0.502, p < 0.05 for both the comparisons between VR and 2D and between VR and 3D CAD), “S3-2” (Cramer’s V = 0.503, p < 0.05 for both the comparisons between 2D and 3D CAD and between 2D and VR), and “S3-3” (Cramer’s V = 0.366). Most of them were related to the reasonable dimensions of space fitting, furniture and equipment. As participants were immersed in their experience of the space and used their bodies as a reference, it was easier to find incorrect content related to the actual size of the room, furniture, etc., compared with 2D and 3D CAD, which do not provide information about the actual size. This is consistent with the findings of previous research [7], which highlighted the effect of physical, embodied experience in VR.
3.1.2. Lower Grades (L)
Here, the 48 participants classified as L belonged to different grade levels and universities. However, because of the limited sample size, it was difficult to separately compare each grade level; therefore, the participants were integrated into a single L group for comparison. Nevertheless, differences in familiarity with each tool may have existed. To examine in advance the influence of differences in learning experience among L-0, L-1, and L-2, “the numbers of ICp per time the tool was used” are shown in Table 5.
Table 5.
Number of ICp per time the tool was used.
The results indicate that, focusing on 3D CAD, which showed the largest differences in the numbers of ICp among the grade levels, even L-1 with almost no 3D CAD experience tended to identify more incorrect content when using 3D CAD than L-2 who had some prior experience with 3D CAD. From these results, it is inferred that, at least within the scope of a single design task in university education targeted in this study, differences in design-learning experience and experience using tools such as 3D CAD, corresponding to approximately 0.5 years of study, were unlikely to have a decisive influence on the experimental results (ICp).
In Figure 8, although the percentage point rates of ICp for L were generally lower than those for H, the incorrect content items that were easily identified by L using 2D drawings, such as S1-5 (related to columns and beams) and S3-6 (related to the layout of “fitting”, Cramer’s V = 0.514, p < 0.05 for both the comparisons between 2D and 3D CAD and between 2D and VR), and those easily identified using VR, such as S1-1, S2-1, S2-6, S3-1, and S3-2 (related to the size of “space” and “furniture and equipment”), demonstrated trends partially similar to those of H.
However, for some items, the results for L when using 3D CAD (such as S1-6) and 2D drawings (such as S1-7, S1-8, and S2-5) did not show the same tendencies as those of H. These results suggest that the approximately three-year difference in learning experience between H and L influenced the pointed-out results among the tools.
3.2. Results of Pointing out Non-Incorrect Content
We counted the n-ICp of each non-incorrect content item (Table 6). Most of the non-incorrect content items were pointed out by three or fewer participants (the n-ICp was “3 or less”), suggesting a large variation in the content pointed out by participants. Thus, we can infer that personal preferences influenced the results as participants explored the incorrect content included in the design plans.
Table 6.
The number of times each non-incorrect content was pointed out.
Some errors were observed among the pointed-out content items. For example, in Design Plan V, “the distance to the bedroom is too far” and “the table is too low” were pointed out; however, these were not mistakes and participants misunderstood them. Relying solely on subjective judgment to determine whether a pointed-out content items is truly incorrect lacks objectivity.
Here, in addition to the 21 predefined inappropriate items, this section also considers comments unrelated to the predefined items, under the assumption that such observations reflect which elements of the experimental space attracted participants’ attention and were carefully examined. Based on these findings, we further discuss the differences according to grade level and the tools used from a broader perspective.
3.2.1. Classification of Non-Incorrect Content Items
The specific classification procedure was as follows. First, one of the researchers conducted a preliminary classification of the n-ICp into 13 categories: “space size,” “space layout,” “lighting,” “privacy,” “safety,” “environment,” “flow line,” “material,” “furniture,” “fitting,” “storage,” “design,” and “structure.” Next, to minimize overlap among the definitions of each category (e.g., the n-ICp “the distance between the washroom and the balcony is too far” could be categorized as either “space layout” or “flow line”), we refined the classification so that each n-ICp belonged to only one category. Based on this preliminary classification and with reference to the classification principles of previous research [68,69], which adopted a multistage classification method dividing pointed-out content items into “large” (object), “medium” (object characteristic), and “small” (object impression) categories, we reorganized the pointed-out content items by merging overlapping categories as much as possible and providing more detailed definitions for the merged ones.
Subsequently, we defined the pointed-out objects (e.g., “space,” “opening,” “fitting,” etc.) as “large” classification, specific aspects with mistakes (e.g., space: size, space: layout, space: quantity) as “medium” classification, and specific causes of mistakes (e.g., something is too big/small, something is too much/not enough, and flow lines are too long/complex) as “small” classification (Table 7).
Table 7.
Classification of non-incorrect content.
3.2.2. Pointing-Out Results for Each Classification
As the number of participants in each grade varied, we divided “the number of pointed-out times use of each tool” by “the number of times the tool was used” to calculate the mean number of points per time the tool was used. We show the result of “large” classification” in Figure 8. Regardless of grades or tools, the four classifications—“space,” “openings,” “fitting,” and “furniture and equipment”—accounted for over 80% of all pointed-out content.
Additionally, following the method described in [67], we conducted Tukey’s honest significant difference (HSD) test to examine the differences in detection rates among the tools. The test results and the effect size (η2) are shown on the right side of Figure 9.
Figure 9.
Mean number of point outs in “Large Classification”. Note: *** Significant at p < 0.001 according to Tukey’s HSD post hoc test.
As mentioned in Section 2.2.4, we revised as many mistakes as possible, other than the ICp in the design plans, through the interview survey. Therefore, in the experiment, the number of trials in which n-ICp was pointed out when using a certain tool accounted for only about one-third of the total trials, and the proportion of pointed-out instances for each classification was even smaller. Regarding the results of Tukey’s HSD test, we found no significant differences among the tools, except for “space” in H (F(2, 225) = 12.015, p < 0.001, η2 = 0.096), nor any medium or higher effect sizes (η2 > 0.06).
Therefore, the following discussion of n-ICp is based solely on some observed tendencies in the experimental results, which suggest potential directions for future research. Accordingly, the following discussion of n-ICp is intended not as a statistically conclusive comparison among tools, but rather as an exploratory analysis focusing on tendencies observed in the experimental results that may suggest directions for future research.
Space
Regarding “space,” in the results for the H group, the number of times n-ICp was identified using 2D was significantly higher than that using 3D CAD and VR (F(2, 225) = 12.015, p < 0.001, η2 = 0.096). However, no such tendency was observed in L-0 to L-2 (p > 0.1, η2 < 0.06). This indicates that, within the limited experimental time, it was easier for the H group to identify errors using 2D than for the L group. This finding is consistent with previous studies [9], which reported that students with prior knowledge can more quickly become familiar with tasks and complete them efficiently.
The mean number of points for 2D and 3D CAD increased as the grade level increased. By contrast, in VR, the mean number of points for L was comparable to that of H. This tendency may also be explained from the perspective of cognitive load theory [49], compared with 2D and 3D CAD, which require learners to cognitively transform and interpret spatial information presented on two-dimensional media or displays, VR is more helpful for students to understand “space” because it is easy to operate and helps experience the actual size of the space in the design plan with the human viewpoint. Additionally, because the design plan used in the experiment was a residential one, it can be considered that using VR made it easier for students to “visualize real-life scenes [14], “ which also contributed to promoting lower-grade students’ understanding of “space.” Takagi et al. [14] reported that the use of 3D-CAD/CG in architectural design education can promote students’ spatial imagery and understanding during the design process. The present results suggest that VR, which provides a more immersive spatial experience than screen-based 3D representations, may further support such spatial understanding.
As a reference, Figures S8 and S9 in the Supplementary Materials present the results of the “medium” classification and “small” classification,” respectively, with the “medium” classification showing the highest mean number of points. L-1 and L-0 have higher numbers of points for “space: layout” although they have less 2D experience and architectural knowledge, whereas the number of points for VR is comparatively lower. Regarding the “small” classification, all grade levels, except L-2, had a significantly higher number of points in 2D than the other tools. In 2D, H was more likely to point out content related to “flow line” between several spaces, such as “long distances from space to space,” while L-2 focused on “relationships” between spaces, such as “neighboring spaces interact with each other.” L-1 and L-0 point out the “orientation” of a single space, such as “the master bedroom is located in the northwest.” This is consistent with Matsumoto et al.’s [6] suggestion that “students in the lower grades are not capable of grasping space as a whole.” From the perspective of cognitive load theory [49], this tendency suggests that lower-grade students may experience difficulty in processing and integrating multiple spatial relationships simultaneously.
In conclusion, the use of the human viewpoint in VR to learn about spatial “flow line” and “relationships” may increase the learning difficulty of students in lower grade levels.
Opening
Most openings are located on the walls. H and L-2 did not differ much in the mean number of points when using different tools. Conversely, L-1 and L-0, who had little design experience, exhibited a higher number of points when using 3D CAD and VR, which could visualize spatial facade information, compared with 2D, which required the ability to read planar information. These findings suggest that the use of 3D CAD and VR may help reduce the cognitive load associated with understanding openings when teaching architectural design knowledge to students.
However, 3D CAD had a higher number of points than VR, regardless of grade level. This is related to the VR’s movement (e.g., teleport or actual walking), which resulted in participants focusing more on the floor and less on observing content on elevations, such as walls or openings.
Fitting
Regarding fitting, 2D had the highest number of points for all grade levels, except L-1. To further explain this phenomenon, as a reference, Figure S10 in the Supplementary Materials shows the results of the “medium” classification.” For the two main items—“fitting: layout” and “fitting: specification” —there were more points related to door position relationship, opening and closing direction, and rotation axis position. By totaling the number of points for “fitting: layout” and “fitting: specification,” we observed that 2D had the highest number of points among all the grade levels. We assume that this is consistent with the reason why the detection rate of “S3-6” in 2D was the highest, as discussed in Section 3.1.1.
Furniture and Equipment
As we used ArchiCAD’s default model for the design plans, we assumed that there would be less actual incorrect content in this section. Consequently, the number of points for all grade levels was low, and there were no significant differences between grade levels or tools.
In conclusion, the characteristics of the tools influence the students’ attention when experiencing the design solution.
3.3. Summary of Tool Effectiveness
The results are summarized in Table 8 based on the results of ICp and n-ICp.
Table 8.
Summary of tools effectiveness.
For H, who had already completed the full university architectural design curriculum, the differences among tools were mainly observed in the detection rate of ICp related to the size of “space” and “furniture and equipment.” The rate was significantly higher when using VR than when using 2D or 3D CAD. By contrast, for ICp and n-ICp related to “fitting” and “flow design,” 2D drawings were more effective than VR. For ICp and n-ICp related to “opening,” there were no notable differences in the number of responses among the tools.
For L, both ICp and n-ICp response counts were lower overall compared with those of H. However, similar to H, the comparison results among tools for ICp related to the size of “space” and “furniture and equipment” indicated relatively better performance when using VR than when using 3D CAD or 2D drawings, with significant differences also observed in some comparisons (p < 0.05). These results suggest that VR may provide greater educational effectiveness than conventional presentation tools when teaching design knowledge related to spatial dimensions.
Although the present experiment did not directly examine the causes of these differences, the findings of Ishida et al. [7] and Mabuchi et al. [48] suggest a possible explanation. Their studies reported that VR facilitates the understanding and perception of spatial information. From this perspective, VR may reduce the cognitive effort required to transform and integrate spatial size information compared with 2D drawings and screen-based 3D representations, thereby facilitating spatial understanding. In addition, VR may support practical design-thinking processes by enabling learners to more easily simulate actual usage situations in everyday life [7,14], rather than relying solely on knowledge-based design considerations.
By contrast, the comparison results among tools for “fitting” and “flow design” were almost the same as those for H, although significant differences were observed (p < 0.05), suggesting that VR was not necessarily advantageous for learning these aspects. This interpretation is consistent with previous studies suggesting that VR is not always effective for all aspects of architectural learning and evaluation [55]. Therefore, when learning “flow design” and “fitting,” the accumulation of fundamental architectural knowledge may be more important than the choice of tools, particularly for lower-grade students.
Possible explanations may differ between “flow design” and “fitting.” Regarding “flow design,” the present experiment evaluated spaces from a human-scale viewpoint in VR. As a result, learners may have found it difficult to grasp the overall spatial configuration and circulation patterns compared with representations that allow simultaneous observation of the entire layout. In addition, the relatively lower effectiveness of 2D drawings for L may be interpreted in light of previous studies reporting that novices tend to focus more on local features than on global spatial relationships [60]. Regarding “fitting,” although VR visually reproduces door movements and spatial forms, it does not provide physical bodily interaction. Consequently, inconveniences related to bodily movement and actual usage situations may be less easily recognized in VR environments.
In addition, regarding n-ICp related to “opening,” the results suggest that using 3D CAD or VR is more advantageous for students in the initial stage of design learning, as they often experience difficulty understanding spatial elevations from 2D drawings alone. This tendency may also be interpreted from the perspective of cognitive load theory.
4. Research Limitations
This study had some limitations. In the experiment, the design plans of 3D CAD and VR were presented from the actual human viewpoint, and there are additional limiting factors in reading the information on structural surfaces, such as columns and beams, compared with 2D design plans. However, it is difficult to illustrate all the structural information in the 2D design plan using A3 paper. To discover the incorrect content of design plans regarding structural aspects, future studies should experience the design plan from more viewpoints, such as a bird’s-eye view or architectural decomposition, in 3D CAD and VR.
The VR equipment used in this study requires a high initial cost to establish an environment where a large number of students can use VR simultaneously. Additionally, since it is physically difficult to secure sufficient space for realizing a walking-based experience of architectural spaces, large-scale implementation may be challenging. Future studies should consider more feasible equipment that requires less cost and space, such as smartphone-based VR systems.
Additionally, because the number of participants in the lower grade levels was approximately 16 (about 5–6 participants for each tool), it was difficult to conduct a detailed comparison of incorrect content across grade levels. Although this study attempted to address the issue of limited sample size by recruiting participants from different universities, the results indicated that variations in course structures among universities may have influenced the experimental outcomes. Future studies should increase the sample size to enable a more in-depth examination of the teaching effects of VR on architectural design learning at different educational stages.
Furthermore, this study represents an initial step toward quantitatively examining the educational effectiveness of new presentation media such as VR. In particular, the primary purpose of this study was to investigate whether differences in the effectiveness of tools according to grade level could be appropriately reflected through the proposed experimental method. However, further investigation is required regarding how differences in educational curricula, cultural backgrounds, and educational systems may influence the effectiveness of VR-based learning. Therefore, the applicability of the findings in this study may be mainly limited to universities in Japan or institutions with similar educational systems.
The method proposed in this study was designed as a simple and objective approach for comparing the educational effectiveness of different tools within a short experimental period. However, the ability to identify problems represents only one aspect of the architectural design process. Other important aspects, such as design concept generation and decision-making processes, also require further investigation. Therefore, the effectiveness of VR as an educational tool should be verified from multiple perspectives. In addition, the present study did not directly measure cognitive load or design-thinking processes. Future studies should employ more direct indicators, such as task-completion time [9,61,62] and retention tests, to provide a more rigorous evaluation of these educational effects.
5. Conclusions
In this study, we proposed the experimental method of finding incorrect content in design plans to evaluate the effectiveness of VR as an assistant tool for design education objectively. We compared the finding rates of incorrect content across student levels when using 2D, 3D CAD, and VR, and examined the effectiveness of using VR as an educational tool for higher- and lower-grade students in future design education. The main findings of this study are summarized as follows:
- (1)
- Appropriate application of VR according to design content and learner level
Based on the findings, this study identified appropriate educational tools for different types of design knowledge through an objective comparison of their effectiveness in supporting problem awareness and problem detection. For both H and L students, VR showed higher effectiveness than 2D drawings and 3D CAD in detecting incorrect content related to the size of “furniture and equipment.” In contrast, VR was not necessarily advantageous for learning design knowledge related to “fittings” and “flow design.” Furthermore, when teaching knowledge related to the size of “space” and “openings” to L students, VR-enabled learners can identify incorrect content more effectively than 2D drawings and may therefore provide greater educational benefits. These findings suggest that the effectiveness of VR depends on both the type of design content and the learner’s level of architectural knowledge and experience, and that VR should be selectively applied according to educational objectives rather than uniformly adopted across all learning situations.
- (2)
- Potential educational effects of VR
The superior performance of VR in detecting issues related to spatial and furniture dimensions may be attributed to its ability to facilitate spatial understanding. Compared with 2D drawings and screen-based 3D representations, VR may reduce the cognitive load required to transform and integrate spatial information and support design-thinking processes by allowing learners to simulate actual usage situations more easily. These findings are consistent with previous studies suggesting that VR enhances the understanding and perception of spatial information.
The correspondence between the experimental findings and previous studies supports the validity of the proposed “finding incorrect content in design plans” task. The results suggest that this method can serve as an objective and quantitative approach for evaluating not only learners’ problem-detection performance but also the educational effectiveness of design-support tools through relatively simple and short-term experiments. In this respect, the proposed method may complement existing evaluation approaches that primarily rely on questionnaire-based assessments, behavioral observations, or analyses of design discussions, which often depend on subjective judgments. Furthermore, the proposed method may have the potential to be applied not only to VR but also to the evaluation of other emerging educational technologies in architectural design education.
Supplementary Materials
The following supporting information can be downloaded at: https://www.mdpi.com/article/10.3390/buildings16132556/s1, Figure S1: Detailed information of each design plan; Figure S2: Detailed information of each design plan Z; Figure S3: Detailed information of each design plan X (part 1); Figure S4: Detailed information of each design plan X (part 2); Figure S5: Detailed information of each design plan C; Figure S6: Detailed information of each design plan V; Figure S7: Detailed information of each design plan B; Figure S8: Mean number of point out of “Space” in “ Medium Classification”; Figure S9: Mean number of point out of “Space: Layout” in “ Small Classification”; Figure S10: Mean number of point out of “Fitting” in “ Medium Classification”.
Author Contributions
Conceptualization, N.H., D.N., S.K., S.S. and S.N.; Methodology, N.H., D.N., S.K., S.S. and S.N.; Software, N.H., D.N. and S.K.; Validation, N.H., D.N., S.K., S.S. and S.N.; Formal analysis, N.H., D.N., S.K., S.S. and S.N.; Investigation, N.H., D.N., S.S. and S.N.; Resources, N.H., D.N., S.K., S.S. and S.N.; Data curation, N.H., D.N., S.S. and S.N.; Writing—original draft, N.H., D.N. and S.N.; Writing—review & editing, N.H., D.N., S.K., S.S. and S.N.; Visualization, N.H., D.N. and S.N.; Supervision, N.H., D.N., S.K. and S.S.; Project administration, N.H., D.N., S.K. and S.N.; Funding acquisition, N.H. and D.N. All authors have read and agreed to the published version of the manuscript.
Funding
This work was supported by JST SPRING, Grant Number JPMJSP2132.
Institutional Review Board Statement
The research employed only commonly used educational tools within the scope of standard architectural education, without introducing any invasive procedures or sensitive interventions. Participation was entirely voluntary, and all participants were informed in advance that they could withdraw from the experiment at any time without penalty. Furthermore, strict measures were implemented to ensure secure data management, prevent disclosure to third parties, and appropriately handle the data after the completion of the study.
Informed Consent Statement
An invitation letter explaining the purpose and procedures of the study was distributed to potential participants, and returning a response indicating willingness to participate was regarded as providing informed consent.
Data Availability Statement
The data presented in this study are available on request from the corresponding author. The data are not publicly available due to ongoing research and future planned analyses.
Acknowledgments
The authors are grateful for the Architectural Environmental Lab. of Hiroshima University, the S. SUGATA Lab. of Hiroshima Institute of Technology, teachers who collaborated in the hearing survey, and the students who participated in the experiment.
Conflicts of Interest
Author Shunki Nishii was employed by the company Obayashi Corporation. The remaining authors declare that the research was conducted in the absence of any commercial or financial relationships that could be construed as a potential conflict of interest.
Abbreviations
| 2D | a two-dimensional form |
| 3D | a three-dimensional form |
| 3D CAD | 3D computer-aided design |
| CG | computer graphics |
| H | higher-grade participants |
| HIT | Hiroshima Institute of Technology |
| HMD | head-mounted display |
| HSD | honestly significant difference |
| HU | Hiroshima University |
| ICp | the sum of the number of times the incorrect content items were pointed out |
| L | lower-grade participants |
| n-ICp | the number of times content, other than incorrect content, was pointed out as incorrect content items |
| TA | teaching assistant |
| VR | virtual reality |
References
- Akita, M.; Tsunekawa, K. A Study on Architectural Design Exercise and Learning Outcomes in Design Education. J. Archit. Plan. 2017, 82, 2461–2468. [Google Scholar] [CrossRef] [Scilit]
- Akita, M.; Taniguchi, G. A Study on the Correlations of the Amount of Study, The Ability of Space Recognition and the Score During the Primary Architectural Exercise. J. Archit. Plan. 2011, 76, 1045–1051. [Google Scholar] [CrossRef] [Scilit]
- Akita, M.; Tobe, E. A Study of what is the Concept of “Sense of Scale” and how to Train its Ability Through the Design Exercises in the Universities. J. Archit. Plan. 2005, 70, 235–238. [Google Scholar] [CrossRef] [Scilit] [PubMed]
- Wada, K.; Saitoh, T.; Tanemura, T.; Boda, S.; Nishimura, S. A Study on Design Methods for Space Creation in Architectural Design Prosesses. J. Archit. Plan. 2015, 80, 1535–1545. [Google Scholar] [CrossRef] [Scilit]
- Yamano, D.; Kobayashi, T.; Iba, T. Effects of Using Pattern Language in Assessment Preparation and Teaching for a Housing Design Exercise. Jpn. J. Educ. Technol. 2022, 46, 493–507. [Google Scholar] [CrossRef]
- Matsumoto, M.; Yamagata, T.; Abe, E. Thinking Process in Design and Drafting Education: From Efforts to Evidence-Based Tasks. In Summaries of Technical Papers of Annual Meeting Architectural Institute of Japan, Education; Architectural Institute of Japan (AIJ): Tokyo, Japan, 2023; pp. 13–14. Available online: https://www.aij.or.jp/paper/detail.html?productId=688421 (accessed on 15 June 2026).
- Ishida, K.; Sakatani, S.; Tanaka, Y.; Chiba, M. Influence of Experience of Space using VR on Design Process. J. Archit. Plan. 2019, 84, 1579–1587. [Google Scholar] [CrossRef] [Scilit]
- Gathercole, S.E.; Alloway, T.P. Working Memory and Learning: A Practical Guide for Teachers; SAGE Publications: Thousand Oaks, CA, USA, 2008. (In Japanese) [Google Scholar]
- Nagamatsu, M.; Kawada, K.; Yamamoto, T.; Yamane, T. Construction of a Skill Evaluation Model and Consideration on Learning Processes. IEEJ Trans. Electron. Inf. Syst. 2015, 135, 66–72. [Google Scholar] [CrossRef] [Scilit]
- Takizawa, E. The Effects of Task Labels and Difficulty of Practice Tasks on Intrinsic Motivation. Ph.D. Thesis, Gakushuin University, Toshima, Japan, 2010. [Google Scholar]
- Yamamoto, R.; Ohashi, Y. Na ni do no ta kai un dou ka dai no gakusyuu tokusei ni kan suru kenkyuu [A study on learning characteristics in difficult motor tasks]. Congr. Jpn. Phys. Ther. Assoc. 2011, 2011, 431. [Google Scholar] [CrossRef]
- Tomikawa, Y.; Suzuki, A.; Uto, M. Difficulty-Controllable Neural Question Generation for Reading Comprehension based on Item Response Theory. IEICE Trans. 2024, j107-D, 53–66. [Google Scholar] [CrossRef]
- Shimokawa, Y.; Kawasaki, Y.; Miyashita, T. The Class of Design Practice for Space Design using CAD/CG. J. Graph. Sci. Jpn. 2005, 39, 13–20. [Google Scholar] [CrossRef] [Scilit] [PubMed]
- Takagi, M.; Wada, K.; Itami, H.; Hyashi, R. The effect of using 3D-CAD/CG in Architectural design education on Students’ images of space Analysis of thinking content in the process of architectural design plans by 3D-CAD/CG-. In Summaries of Technical Papers of Annual Meeting Architectural Institute of Japan, Architectural Planning and Design; Architectural Institute of Japan: Tokyo, Japan, 2022; pp. 51–52. Available online: https://www.aij.or.jp/paper/detail.html?productId=669034 (accessed on 15 June 2026).
- Wakita, A.; Nishina, D.; Kindaichi, S.; Sugita, S.; Oishi, H.; Shimizu, A.; Akiyama, M. A study on the psychological evaluation of indoor space with whole sky image. Part 6 Experimental results by a HMD, head mount display. In Proceedings of Annual Research Meeting, Chugoku Chapter; Architectural Institute of Japan (AIJ): Tokyo, Japan, 2019; Volume 42, pp. 491–494. Available online: https://www.aij.or.jp/paper/detail.html?productId=663040 (accessed on 15 June 2026).
- Sugita, S.; Nishina, D.; Kobayashi, R.; Tanaka, T.; Oishi, H. A study on alternative possibility of psychological evaluation of exterior space by whole sky image evaluation. J. Environ. Eng. 2018, 83, 235–245. [Google Scholar] [CrossRef] [Scilit]
- Akiyama, M.; Nishina, D.; Sugita, S.; Asami, Y.; Tanaka, T.; Oishi, H.; Kobayashi, R. A study on alternative possibility of whole sky image in psychological evaluation of indoor space. J. Environ. Eng. 2018, 83, 503–513. [Google Scholar] [CrossRef] [Scilit]
- Higuera-Trujillo, J.L.; Lopez-Tarruella, J.; Llinares, C. Psychological and physiological human responses to simulated and real environments: A comparison between Photographs, 360 Panoramas, and Virtual Reality. Appl. Ergon. 2017, 65, 398–409. [Google Scholar] [CrossRef] [Scilit] [PubMed]
- De Kort, Y.A.; Ijsselsteijn, W.A.; Kooijman, J.; Schuurmans, Y. Virtual laboratories: Comparability of real and virtual environments for environmental psychology. Presence Teleoperators Virtual Environ. 2003, 12, 360–373. [Google Scholar] [CrossRef] [Scilit]
- Kuliga, S.F.; Thrash, T.; Dalton, R.C.; Ho, C. Virtual reality as an empirical research tool—exploring user experience in a real building and a corresponding virtual model. Comput. Environ. Urban Syst. 2015, 54, 363–375. [Google Scholar] [CrossRef] [Scilit]
- Chamilothori, K.; Wienold, J.; Andersen, M. Adequacy of Immersive Virtual Reality for the Perception of Daylit Spaces: Comparison of Real and Virtual Environments. LEUKOS J. Illum. Eng. Soc. N. Am. 2018, 15, 1–24. [Google Scholar] [CrossRef] [Scilit]
- Yamada, S.; Kitamoto, E.; Jincho, N.; Oikawa, K. A study on spatial perception in immersive virtual space. AIJ J. Technol. Des. Ume 2018, 24, 1303–1307. [Google Scholar] [CrossRef] [Scilit]
- Wadama, J.; Kawasumi, N.; Uemichi, S.; Sekiya, T. Research on the effect of virtual space representation on spatial experience. In Summaries of Technical Papers of Annual Meeting Architectural Institute of Japan, Information Systems Technology; Architectural Institute of Japan (AIJ): Tokyo, Japan, 2022; pp. 171–172. Available online: https://www.aij.or.jp/paper/detail.html?productId=670862 (accessed on 15 June 2026).
- Peter, W.; Amy, A.G.; William, B.T.; Sarah, H.C. Effects of stereo viewing conditions on distance perception in virtual environments. Presence Teleoperators Virtual Environ. 2008, 17, 91–101. [Google Scholar] [CrossRef] [Scilit]
- Wu, B.; Ooi, T.; He, Z. Perceiving distance accurately by a directional process of integrating ground information. Nature 2004, 428, 73–77. [Google Scholar] [CrossRef] [Scilit] [PubMed]
- Hong, T.; Lee, M.; Yeom, S.; Jeong, K. Occupant responses on satisfaction with window size in physical and virtual built environments. Build. Environ. 2019, 166, 106409. [Google Scholar] [CrossRef] [Scilit]
- Fedaa, A.A.; Michael, K.; John, C.; Wu, Y. Evaluating the impact of viewing location on view perception using a virtual environment. Build. Environ. 2020, 180, 106932. [Google Scholar] [CrossRef] [Scilit]
- Li, J.; Wu, W.; Jin, Y.; Zhao, R.; Bian, W. Research on environmental comfort and cognitive performance based on EEG+VR+LEC evaluation method in underground space. Build. Environ. 2021, 198, 107886. [Google Scholar] [CrossRef] [Scilit]
- Jin, Z.; Juan, Y.K. Is Fengshui a science or superstition? A new approach combining the physiological and psychological measurement of indoor environments. Build. Environ. 2021, 201, 107992. [Google Scholar] [CrossRef] [Scilit]
- Hou, N.; Nishina, D.; Sugita, S.; Jiang, R.; Kindaichi, S.; Oishi, H.; Shimizu, A. Virtual reality space in architectural design education: Learning effect of scale feeling. Build. Environ. 2024, 248, 111060. [Google Scholar] [CrossRef] [Scilit]
- Mabuchi, D.; Yoshioka, Y.; Enta, A.; Fujii, K.; Sano, T. Development and effectiveness of “Scale Training”, a scale sense learning tool utilizing VR. In Summaries of Technical Papers of Annual Meeting Architectural Institute of Japan, Architectural Planning and Design; Architectural Institute of Japan (AIJ): Tokyo, Japan, 2018; pp. 1009–1010. Available online: https://www.aij.or.jp/paper/detail.html?productId=621508 (accessed on 15 June 2026).
- Hansol, C.; Seung-Nam, K. Training street-level “sense of scale” as a spatial perception ability in recorded virtual reality: A Solomon four-group design approach. Virtual Real. 2023, 27, 3149–3164. [Google Scholar]
- Hou, N.; Nishina, D.; Sugita, S.; Jiang, R.; Oishi, H.; Kindaichi, S.; Shimizu, A. A study on possibility of using VR space in design education, Part 1: Verification of VR space effectiveness by learning experiment of scale feeling. J. Environ. Eng. (Trans. AIJ) 2021, 86, 670–679. [Google Scholar] [CrossRef] [Scilit]
- Hou, N.; Nishina, D.; Sugita, S.; Jiang, R.; Kindaichi, S.; Oishi, H. A study on possibility of VR space in design education. AIJ J. Technol. Des. 2022, 28, 1254–1259. [Google Scholar] [CrossRef] [Scilit]
- Shimokawa, Y.; Kobayashi, R. Practice of architectural education DX using virtual space Real-scale observation and discussion of architectural. KIT Prog. 2023, 31, 64–73. [Google Scholar]
- Shimokawa, Y.; Kobayashi, R. Study on the effect of learning architectural space characteristics through simultaneous VR space experience by multiple people -Part 1-. In Summaries of Technical Papers of Annual Meeting Architectural Institute of Japan, Education; Architectural Institute of Japan (AIJ): Tokyo, Japan, 2023; pp. 9–10. Available online: https://www.aij.or.jp/paper/detail.html?productId=688419 (accessed on 15 June 2026).
- Kobayashi, R.; Shimokawa, Y. Study on the effect of learning architectural space characteristics through simultaneous VR space experience by multiple people -Part 2-. In Summaries of Technical Papers of Annual Meeting Architectural Institute of Japan, Education; Architectural Institute of Japan (AIJ): Tokyo, Japan, 2023; pp. 10–11. Available online: https://www.aij.or.jp/paper/detail.html?productId=688420 (accessed on 15 June 2026).
- Yano, T.; Nomura, H.; Suda, T.; Shimokawa, Y. Development of construction education tool for young engineers using 3D virtual tour technology. In Summaries of Technical Papers of Annual Meeting Architectural Institute of Japan, Education; Architectural Institute of Japan (AIJ): Tokyo, Japan, 2023; pp. 7–8. Available online: https://www.aij.or.jp/paper/detail.html?productId=688418 (accessed on 15 June 2026).
- Ahmad, K.B.; Hussain, H.A.; Mostafa, Z.A. The application of virtual reality technology in architectural pedagogy for building constructions. Alex. Eng. J. 2019, 58, 713–723. [Google Scholar] [CrossRef] [Scilit]
- Angulo, A. Rediscovering virtual reality in the education of architectural design: The immersive simulation of spatial experiences. Ambiances 2015. [Google Scholar] [CrossRef] [Scilit]
- Angulo, A.; Guillermo, V.d.V. Immersive simulation of architectural spatial experiences. In Knowledge-based Design—Proceedings of the 17th Conference of the Iberoamerican Society of Digital Graphics; Marcelo, B., Paula, G., Eds.; SiGraDi XVII: Valparaiso, Chile, 2013; pp. 495–499. [Google Scholar]
- Schön, D.A. The Design Studio: An Exploration of Its Traditions and Potentials; RIBA Publications: London, UK, 1985. [Google Scholar]
- Li, T.; Hu, H.; Ma, H.; Ma, J.; Li, Q. Using Virtual Reality to Enhance Learning Performance and Address Educational Resource Disparities in Architectural History Courses. Sustainability 2025, 17, 866. [Google Scholar] [CrossRef] [Scilit]
- Crolla, K.; Song, J.; Bunica, A.; Sheikh, A.T. Integrating Extended Reality in Architectural Design Studio Teaching and Reviews: Implementing a Participatory Action Research Framework. Buildings 2024, 14, 1865. [Google Scholar] [CrossRef] [Scilit]
- González, E.M.D.; Belaroussi, R.; Soto-Martín, O.; Acosta, M.; Martín-Gutierrez, J. Effect of Interactive Virtual Reality on the Teaching of Conceptual Design in Engineering and Architecture Fields. Appl. Sci. 2025, 15, 4205. [Google Scholar] [CrossRef] [Scilit]
- Parker, A. Binocular depth perception and the cerebral cortex. Nat. Rev. Neurosci. 2007, 8, 379–391. [Google Scholar] [CrossRef] [Scilit] [PubMed]
- Kim, H.R.; Angelaki, D.E.; DeAngelis, G.C. The neural basis of depth perception from motion parallax. Philos. Trans. R. Soc. B 2016, 371, 20150256. [Google Scholar] [CrossRef] [Scilit] [PubMed]
- Mabuchi, D.; Masuda, Y.; Ueno, Y. A study on complementary location survey method using digital space for application in architectural design education. AIJ J. Technol. Des. 2026, 32, 516–521. [Google Scholar] [CrossRef] [Scilit]
- Sweller, J. Cognitive Load During Problem Solving: Effects on Learning. Cogn. Sci. 1988, 12, 257–285. [Google Scholar] [CrossRef] [PubMed]
- Aydin, S.; Aktas, B. Developing an integrated VR infrastructure in architectural design education. Front. Robot. AI 2020, 7, 495468. [Google Scholar] [CrossRef] [Scilit] [PubMed]
- Björkman, A.S.; Spångeus, A.; Woisetschläger, M. Mobile learning device increased study efficiency for radiology residents but with risk of temporary novelty effect. Acta Radiol. Open 2019, 8, 2058460119889871. [Google Scholar] [CrossRef] [Scilit] [PubMed]
- Elston, D.M. The novelty effect. J. Am. Acad. Dermatol. 2021, 85, 565–566. [Google Scholar] [CrossRef] [Scilit] [PubMed]
- Miguel-Alonso, I.; Checa, D.; Guillen-Sanz, H.; Bustillo, A. Evaluation of the novelty effect in immersive Virtual Reality learning experiences. Virtual Real. 2024, 28, 27. [Google Scholar] [CrossRef] [Scilit]
- Omlor, A.J.; Schwärzel, L.S.; Bewarder, M.; Casper, M.; Damm, E.; Danziger, G.; Lepper, P.M. Comparison of immersive and non-immersive virtual reality videos as substitute for in-hospital teaching during coronavirus lockdown: A survey with graduate medical students in Germany. Med. Educ. Online 2022, 27, 2101417. [Google Scholar] [CrossRef] [Scilit] [PubMed]
- Kavanagh, S.; Luxton-Reilly, A.; Wuensche, B.; Plimmer, B. A systematic review of Virtual Reality in education. Themes Sci. Technol. Educ. 2017, 10, 85–119. [Google Scholar]
- Checa, D.; Bustillo, A. A review of immersive virtual reality serious games to enhance learning and training. Multimed. Tools Appl. 2020, 79, 5501–5527. [Google Scholar] [CrossRef] [Scilit]
- Pirker, J.; Dengel, A. The potential of 360° virtual reality videos and real VR for education—A literature review. IEEE Comput. Graph. Appl. 2021, 41, 76–89. [Google Scholar] [CrossRef] [Scilit] [PubMed]
- Gegenfurtner, A.; Lehtinen, E.; Säljö, R. Expertise Differences in the Comprehension of Visualizations: A Meta-Analysis of Eye-Tracking Research in Professional Domains. Educ. Psychol. Rev. 2011, 23, 523–552. [Google Scholar] [CrossRef] [Scilit]
- van der Gijp, A.; Ravesloot, C.J.; Jarodzka, H. How visual search relates to visual diagnostic performance: A narrative systematic review of eye-tracking research in radiology. Adv. Health Sci. Educ. 2017, 22, 765–787. [Google Scholar] [CrossRef] [Scilit] [PubMed]
- Alzubaidi, M.; Black, J.A.; Patel, A.; Panchanathan, S. Conscious vs. subconscious perception, as a function of radiological expertise. In Proceedings of the 2009 22nd IEEE International Symposium on Computer-Based Medical Systems, Albuquerque, NM, USA, 2–5 August 2009; pp. 1–8. [Google Scholar] [CrossRef] [Scilit]
- Giovinco, N.A.; Sutton, S.M.; Miller, J.D.; Rankin, T.M.; Gonzalez, G.W.; Najafi, B.; Armstrong, D.G. A Passing Glance? Differences in Eye Tracking and Gaze Patterns Between Trainees and Experts Reading Plain Film Bunion Radiographs. J. Foot Ankle Surg. 2015, 54, 382–391. [Google Scholar] [CrossRef] [Scilit] [PubMed]
- Rubin, G.D.; Roos, J.E.; Tall, M.; Harrawood, B.; Bag, S.; Ly, D.L.; Seaman, D.M.; Hurwitz, L.M.; Napel, S.; Choudhury, K.R. Characterizing search, recognition, and decision in the detection of lung nodules on CT scans: Elucidation with eye tracking. Radiology 2015, 274, 276–286. [Google Scholar] [CrossRef] [Scilit] [PubMed]
- Lu, L.; Mustakim, S.S.; Muhamad, M.M. A meta-analysis of the effectiveness of problem-based learning on critical thinking. Eur. J. Educ. Res. 2025, 14, 789–804. [Google Scholar] [CrossRef] [Scilit]
- UNESCO. Guidance for Generative AI in Education and Research; UNESCO Publishing: Paris, France, 2023. [Google Scholar]
- Niwa, Y. Analysis of the Assignments in the Architecture Design Studio, History of architecture design education at department of architecture, the university of Tokyo(Education). AIJ J. Technol. Des. 2006, 12, 502–513. [Google Scholar] [CrossRef] [Scilit]
- Fukamachi, K.; Toyosaki, S.; Ueno, H.; Komatsugawa, H. Development and Evaluation of a Mixed Reality-Based Computer Network Learning Package According to Kolb’s Experiential Learning Model. J. Jpn. Assoc. Dev. Educ. 2026. [Google Scholar] [CrossRef]
- Mizumoto, A.; Takeuchi, O. Basics and considerations for reporting effect sizes in research papers. Engl. Lang. Educ. 2008, 31, 57–66. [Google Scholar]
- Ishikawa, M.; Nishina, D.; Jin, H.; Lu, W.; Tanaka, T.; Yoshihara, T.N. Liu: A Study on the Psychological Evaluation of Tourist Spots in Hiroshima. J. Environ. Eng. 2019, 84, 469–478. [Google Scholar] [CrossRef] [Scilit]
- Matsuura, Y.; Nishina, D.; Sugita, S.; Jiang, R.; Kindaichi, S.; Hou, N.; Gao, W. Research on rhe Focus of Sightseeing Experience and Evaluation in VR Space Compared to Real-World Space. J. Environ. Eng. 2024, 89, 502–513. [Google Scholar] [CrossRef] [Scilit]
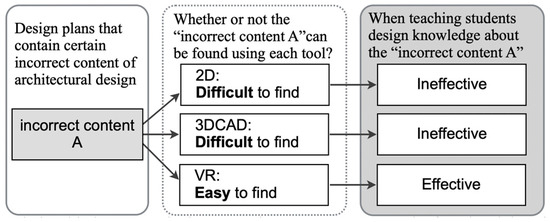
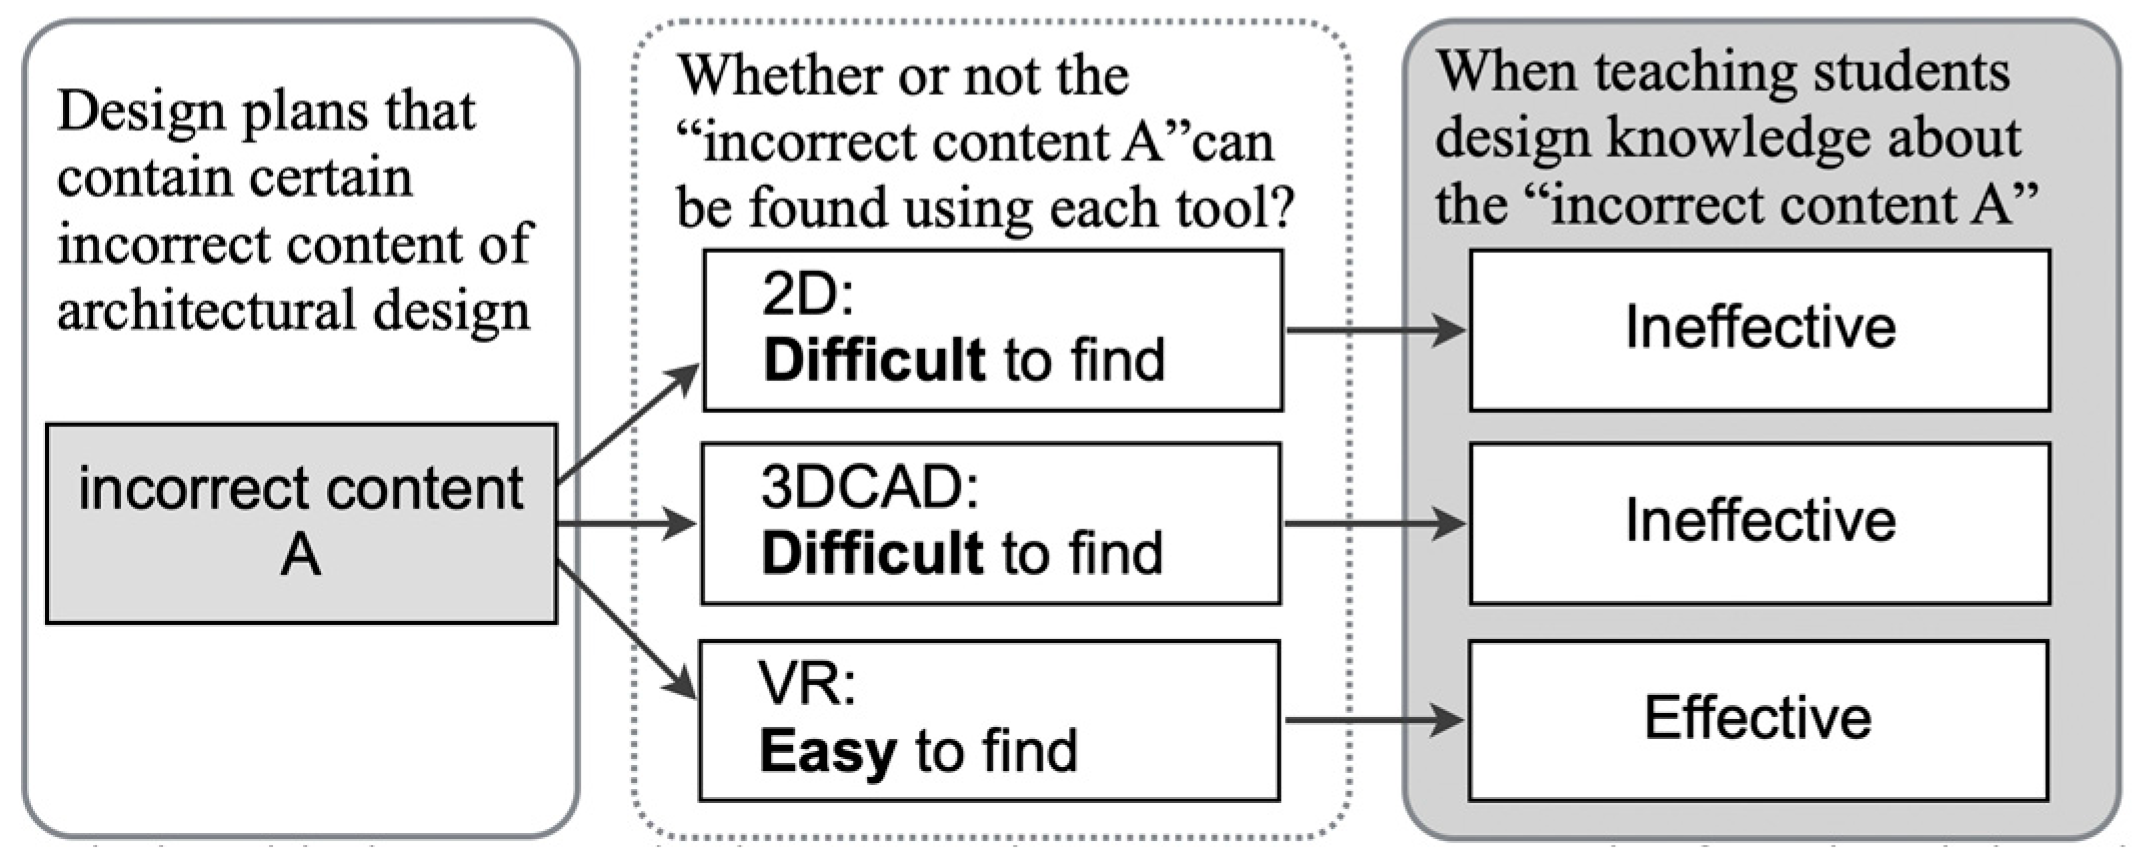
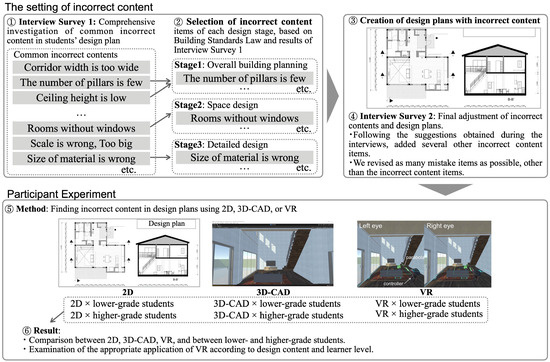
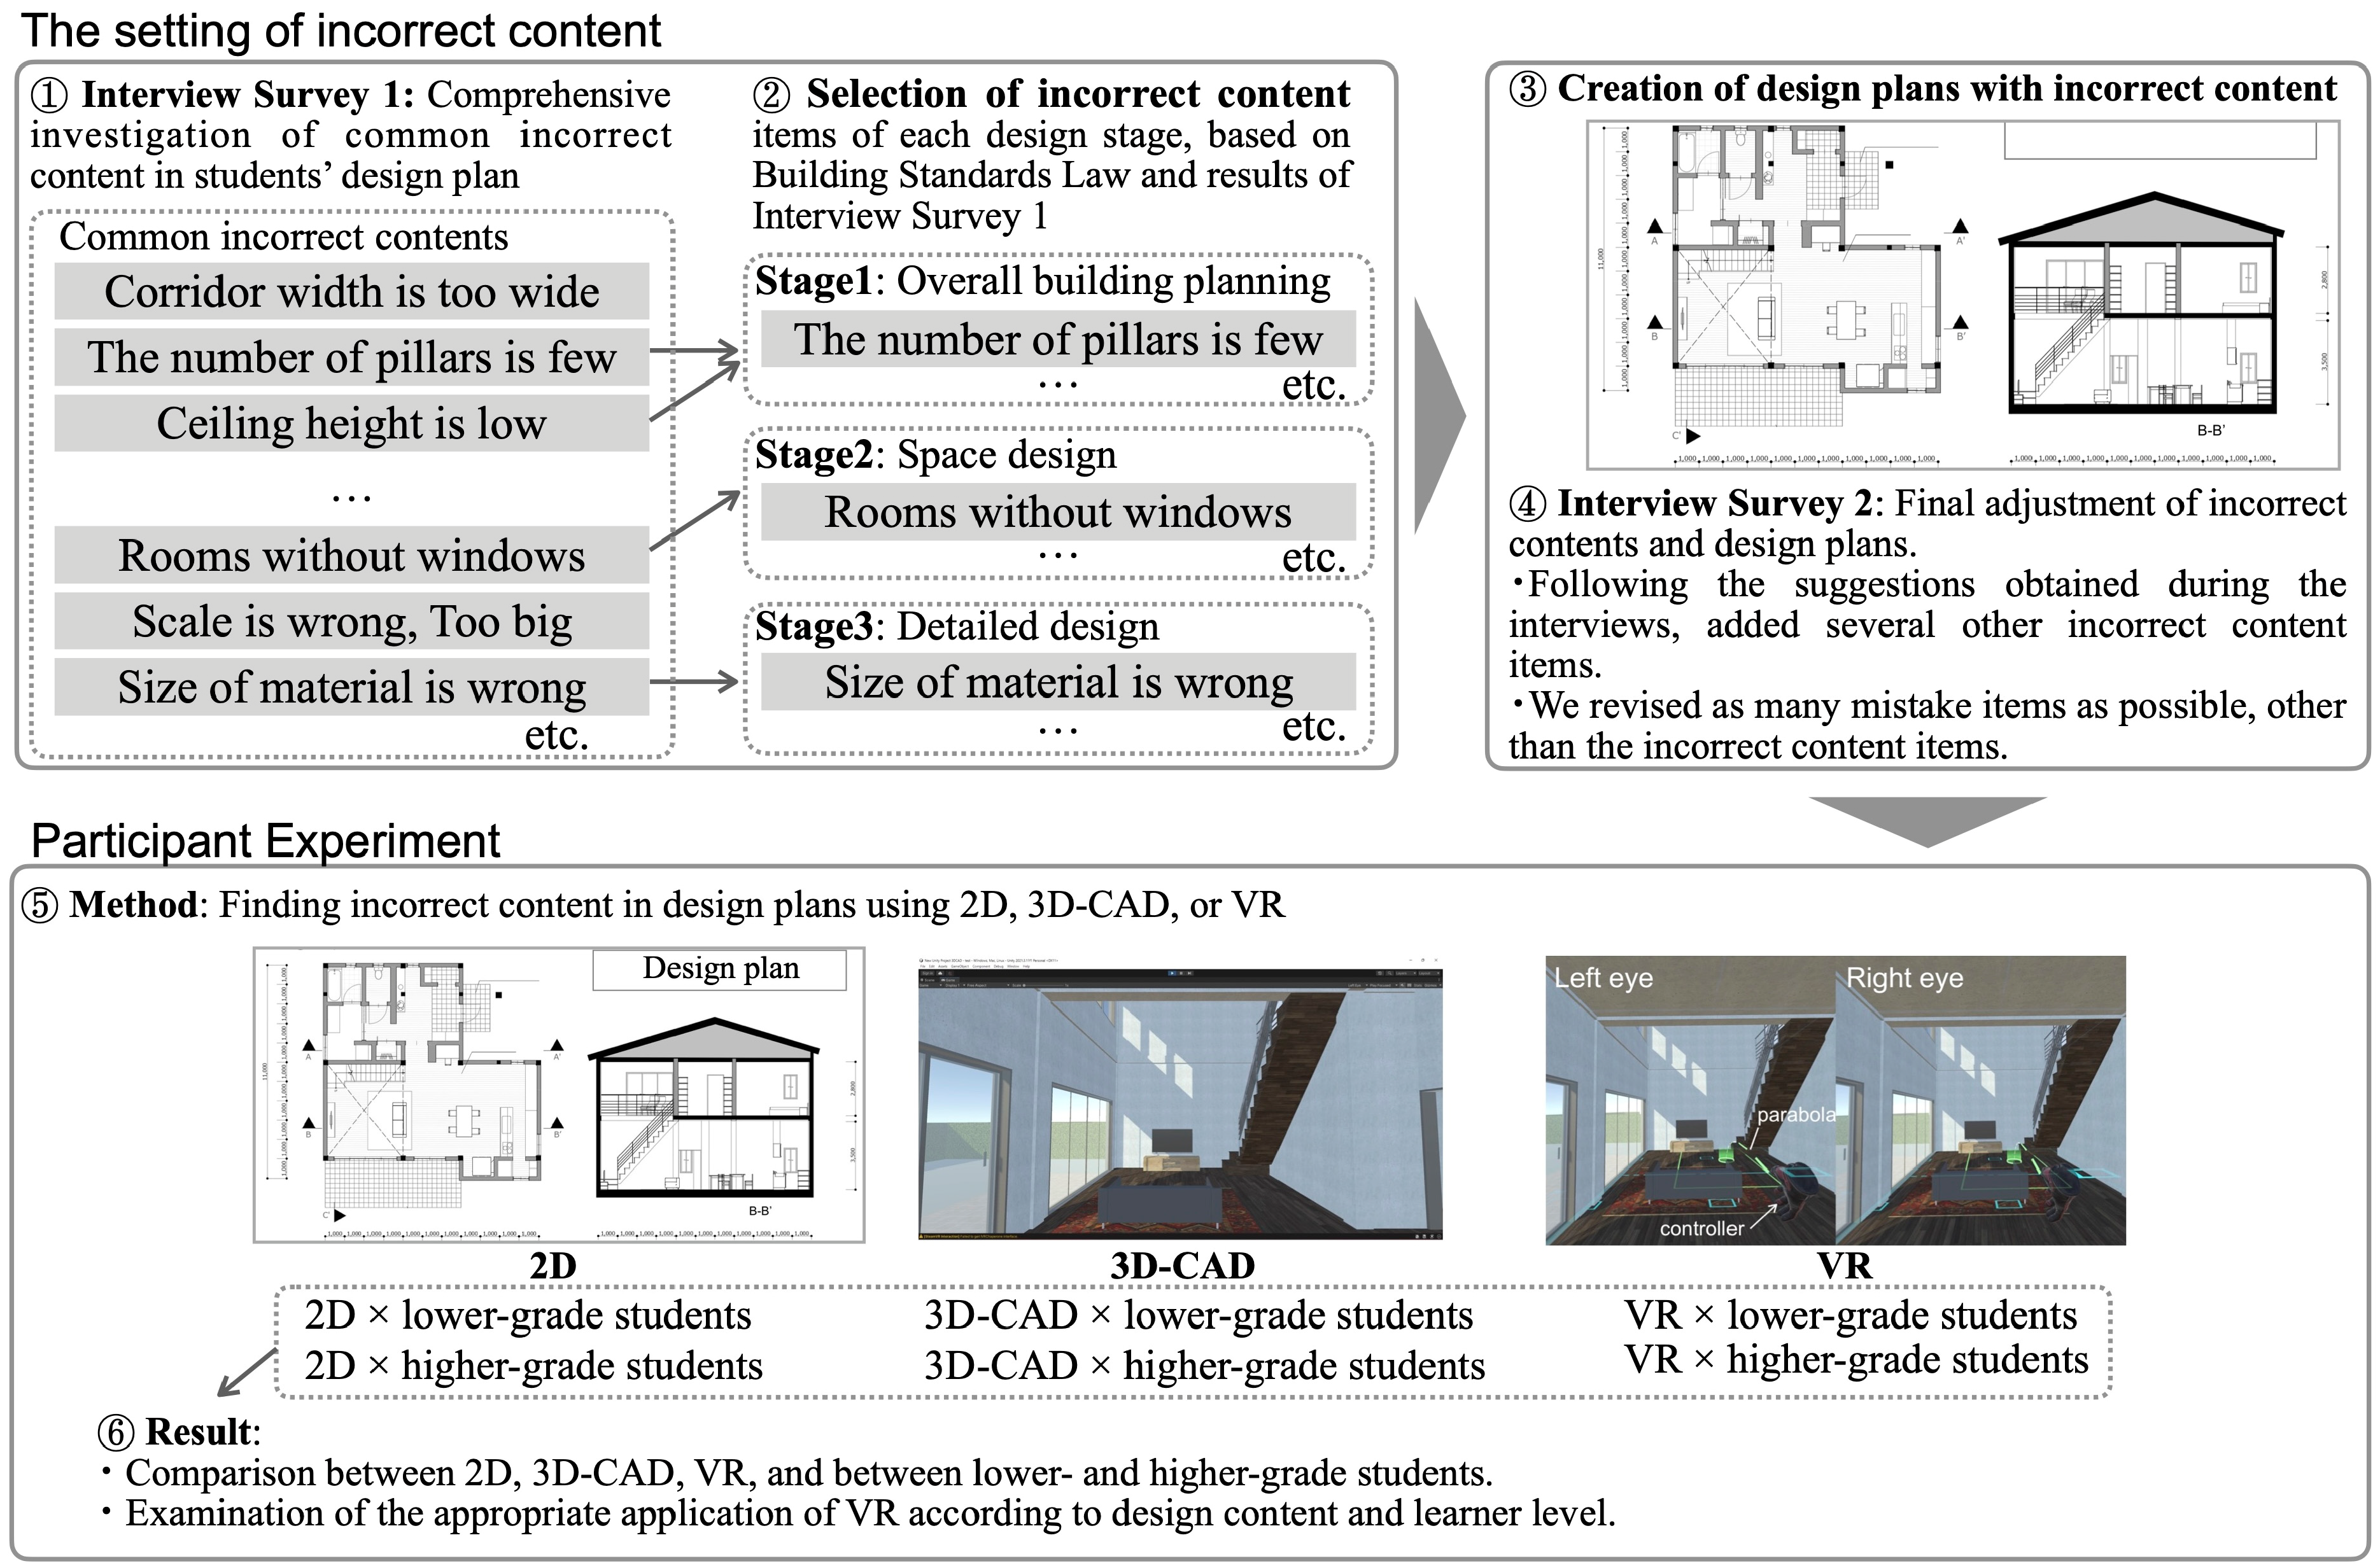
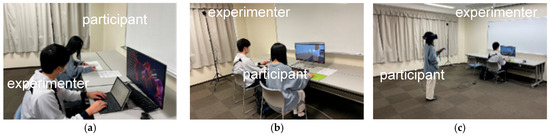
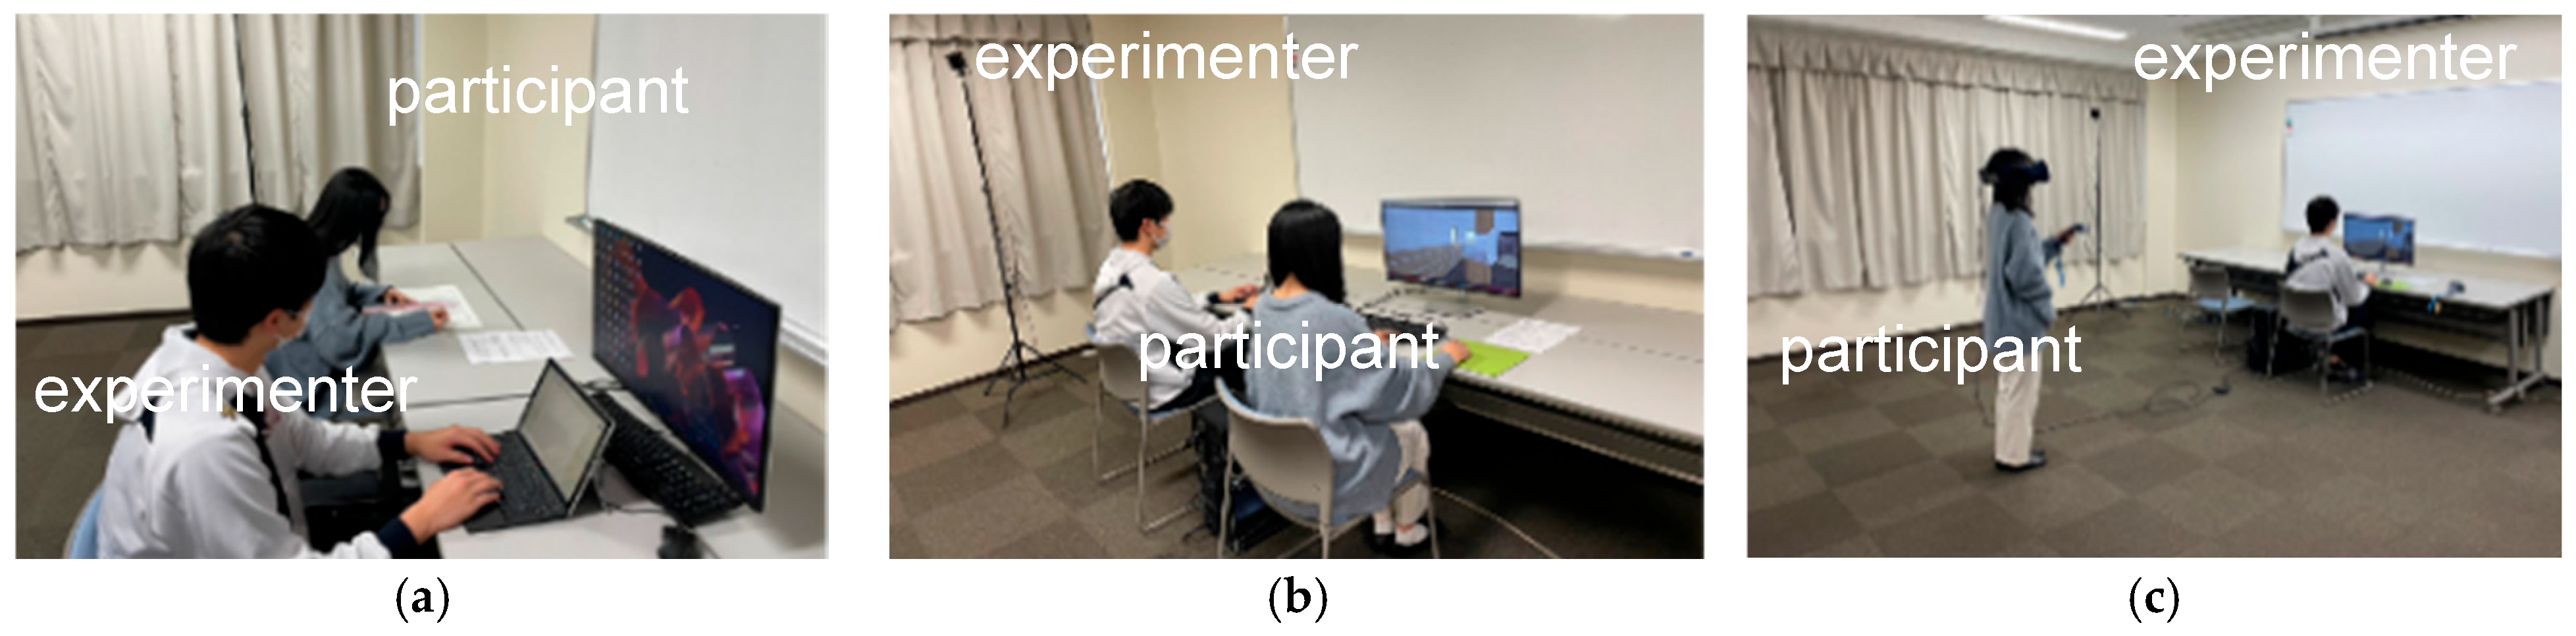
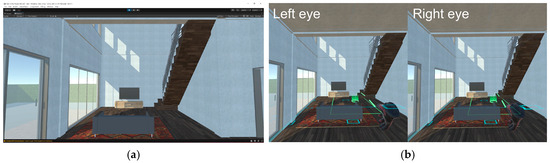
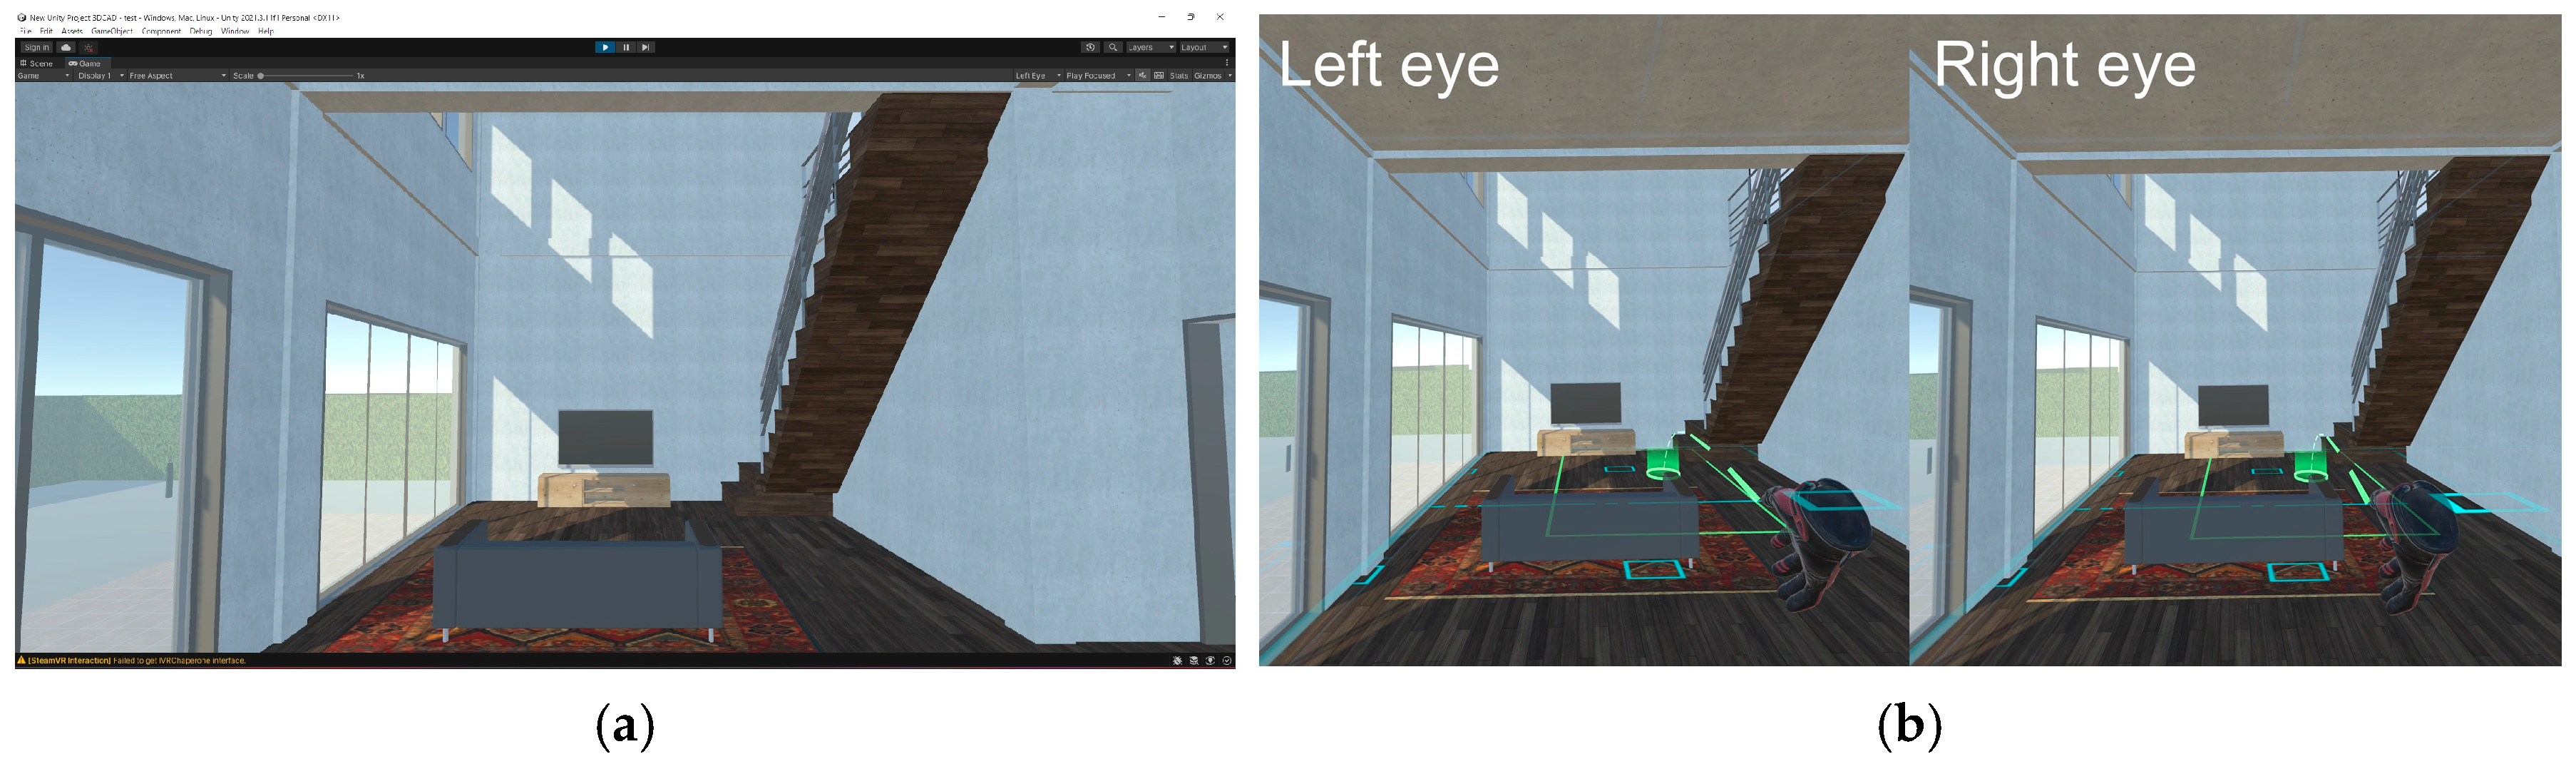
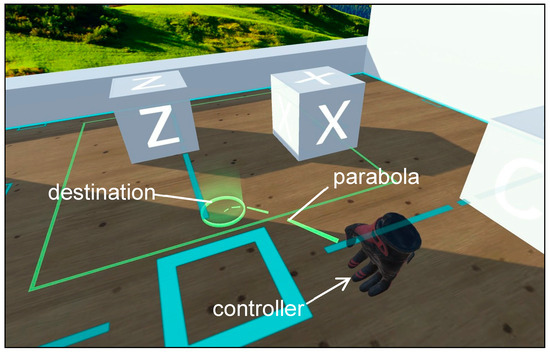
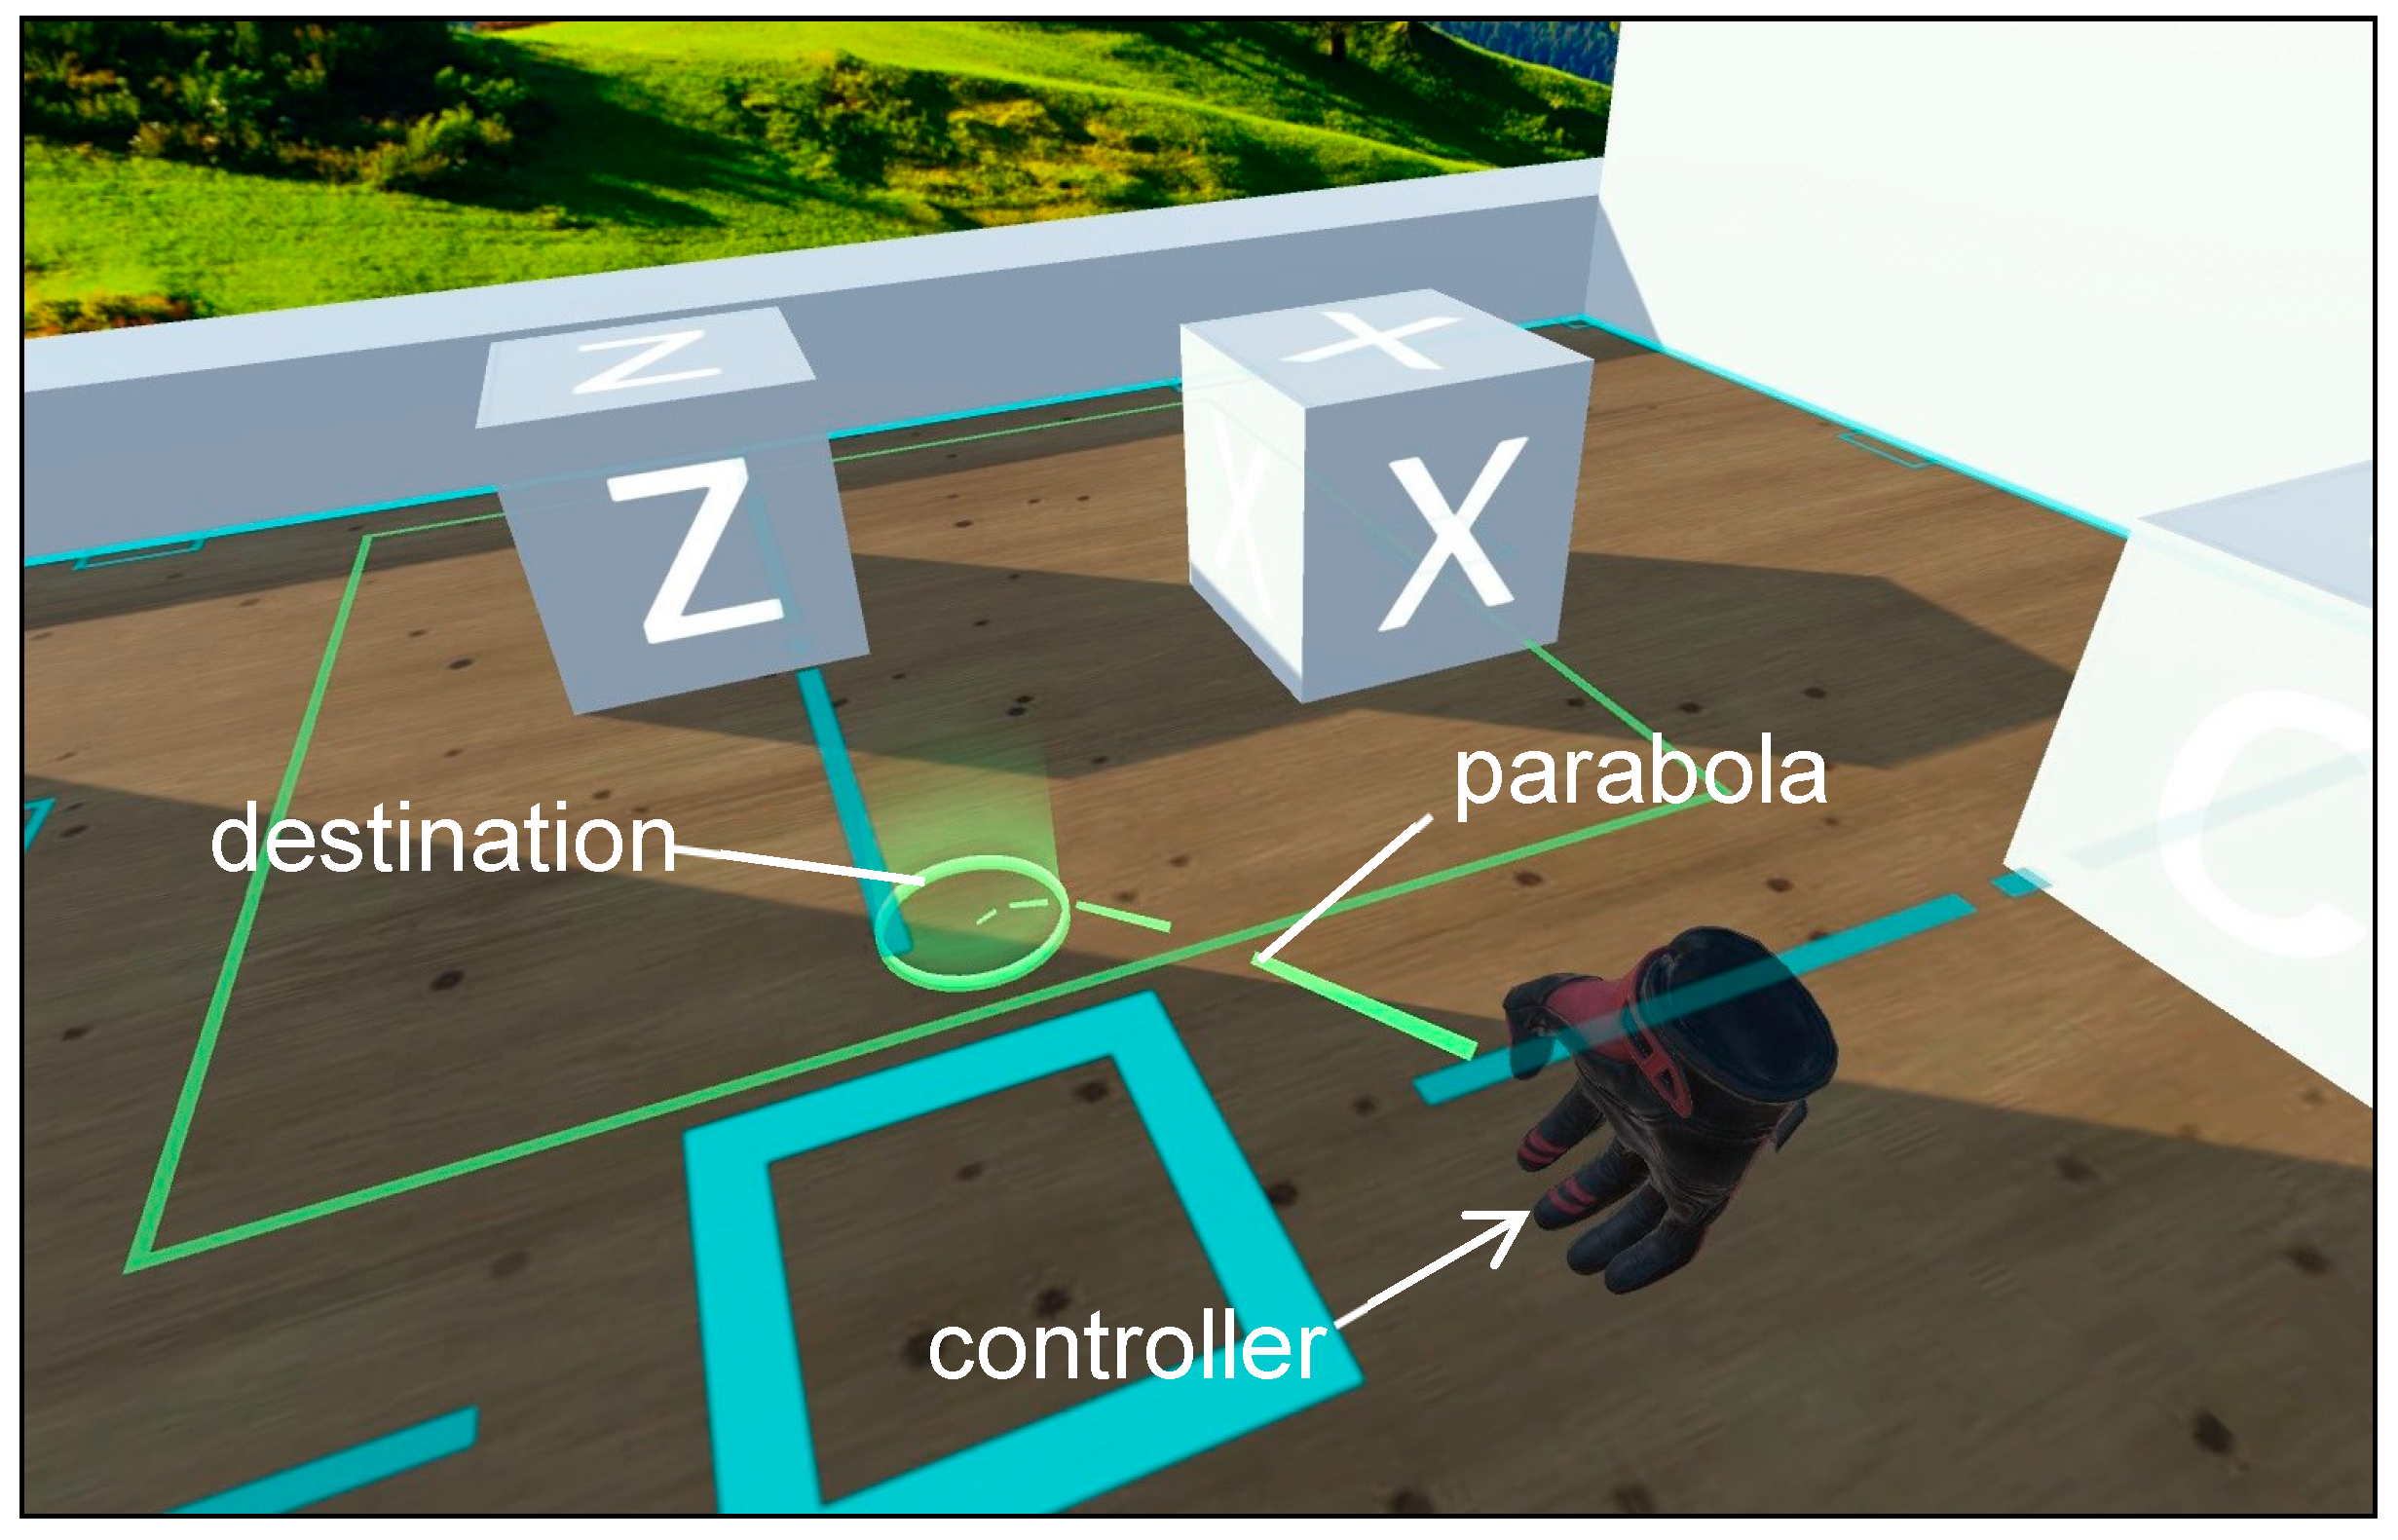
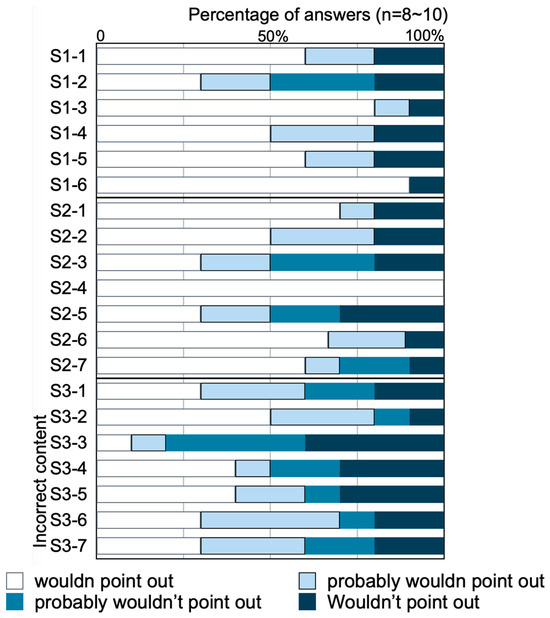
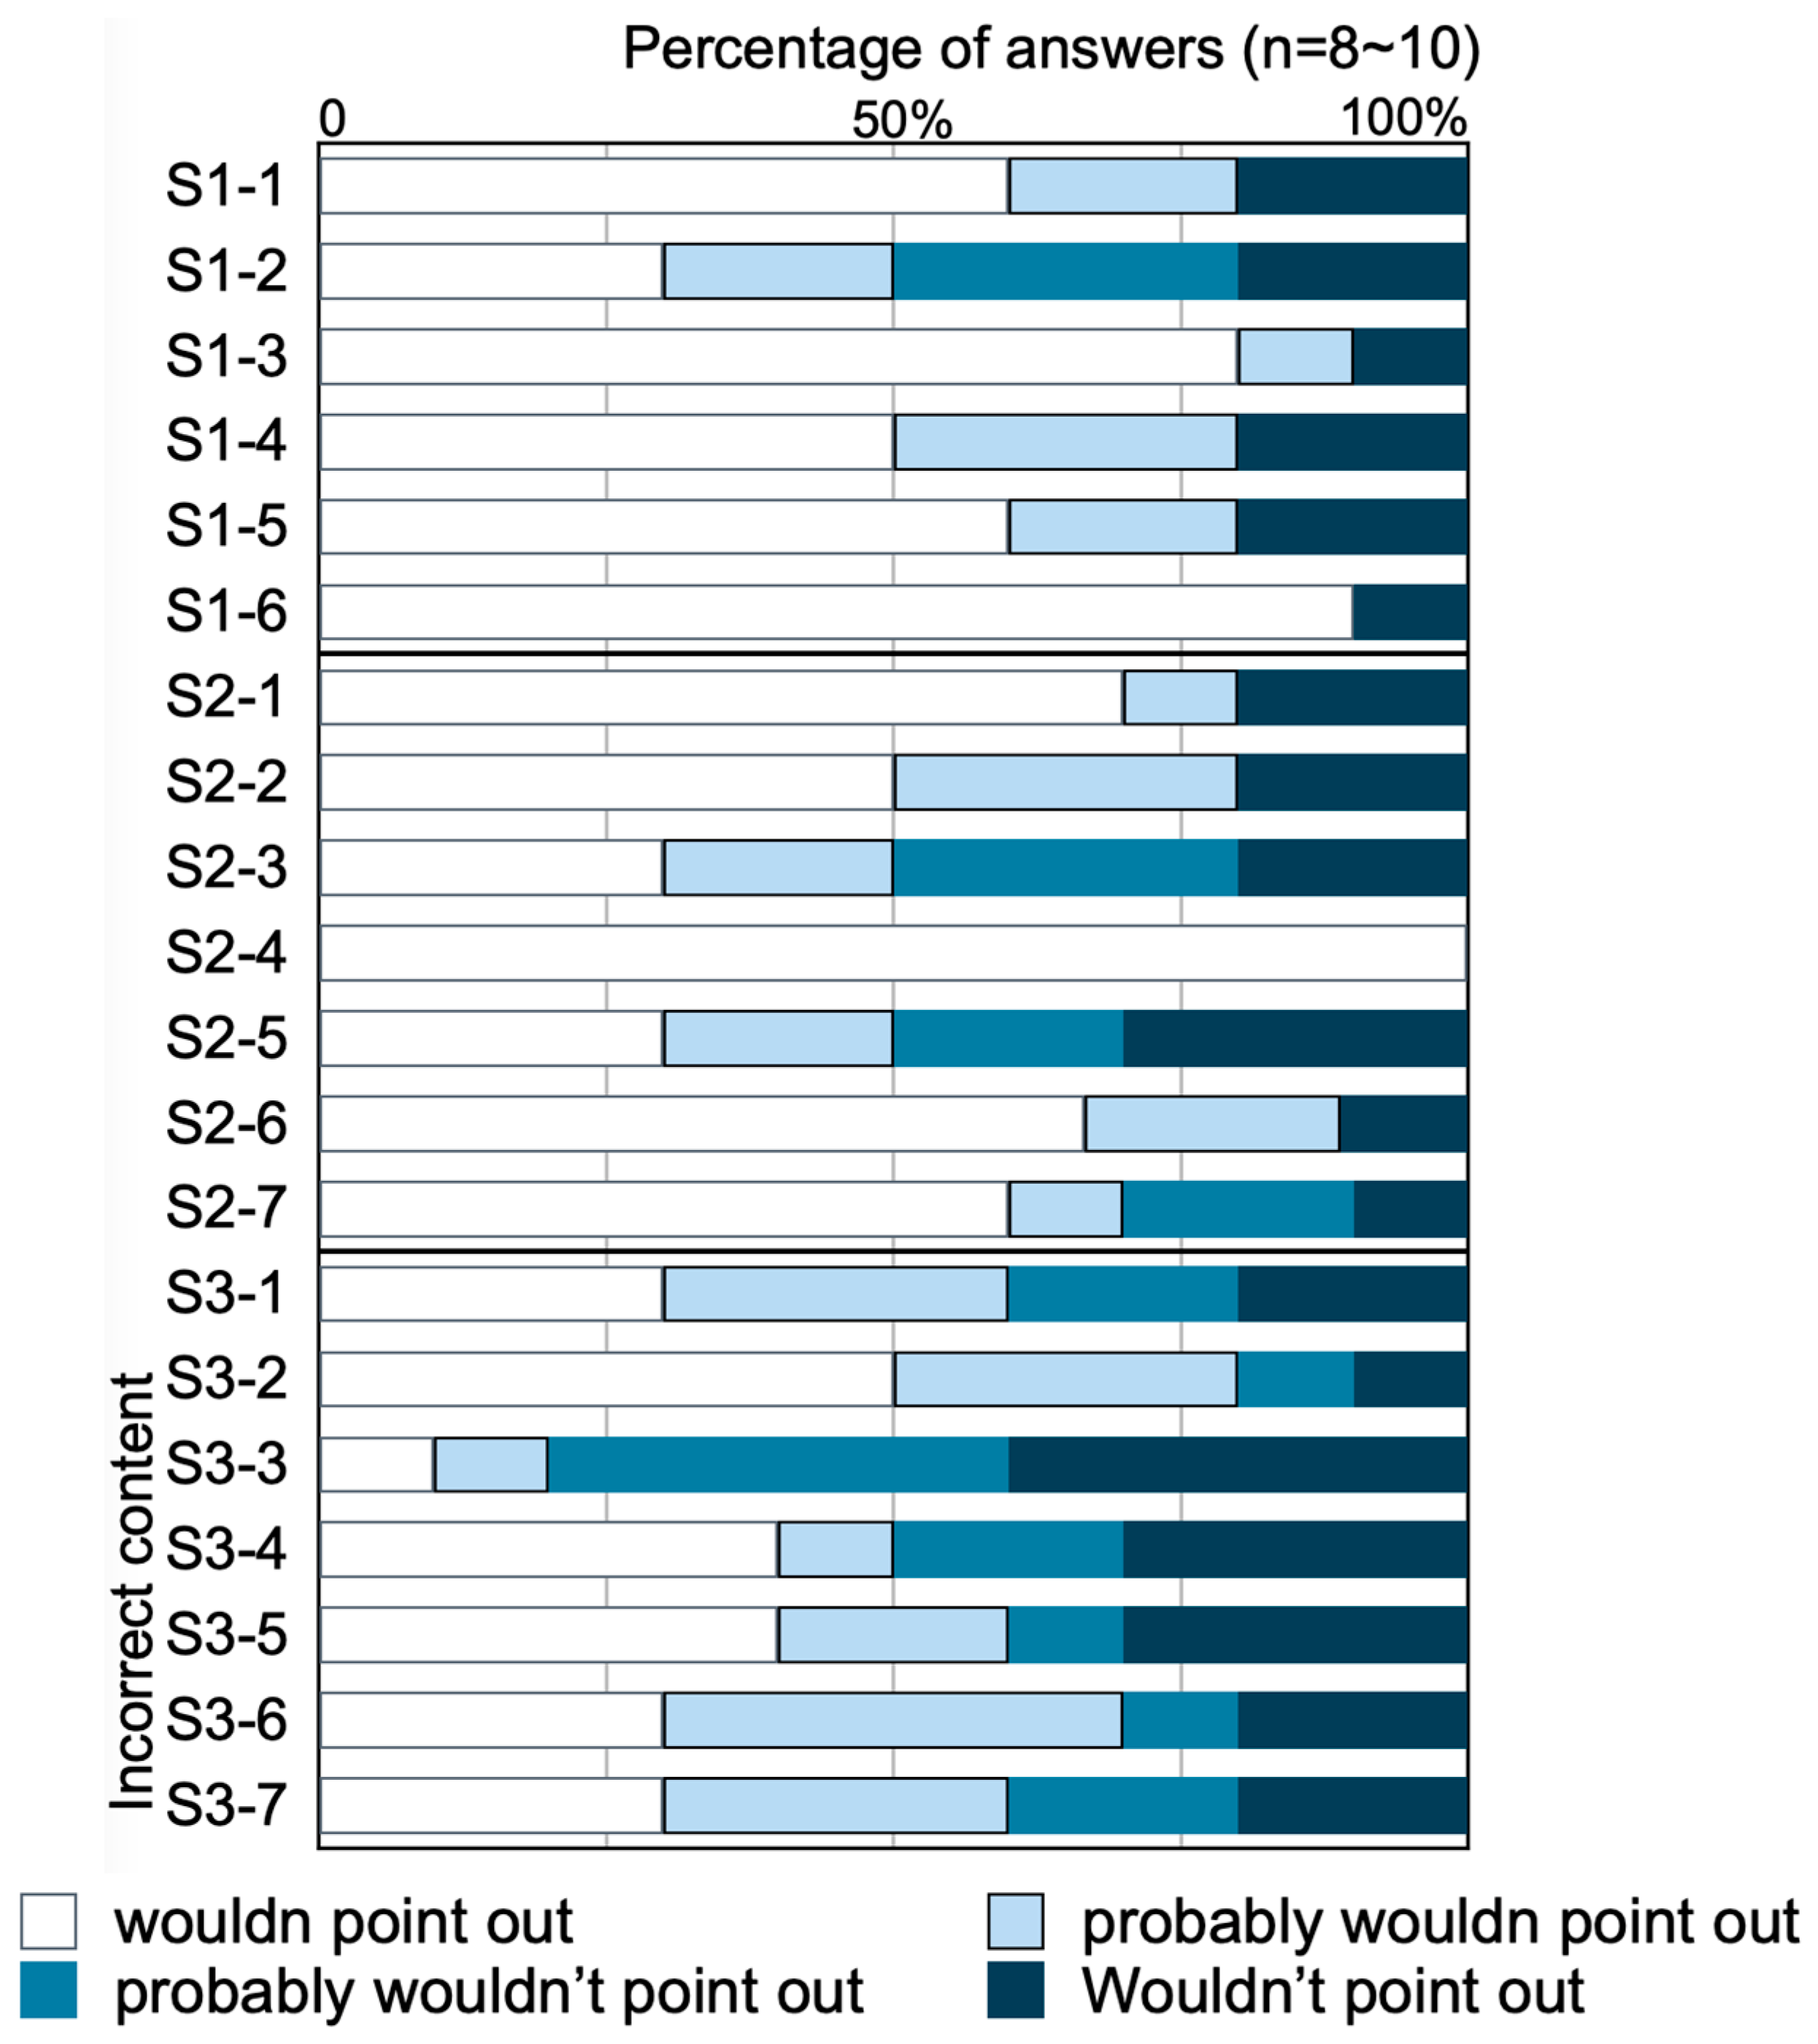
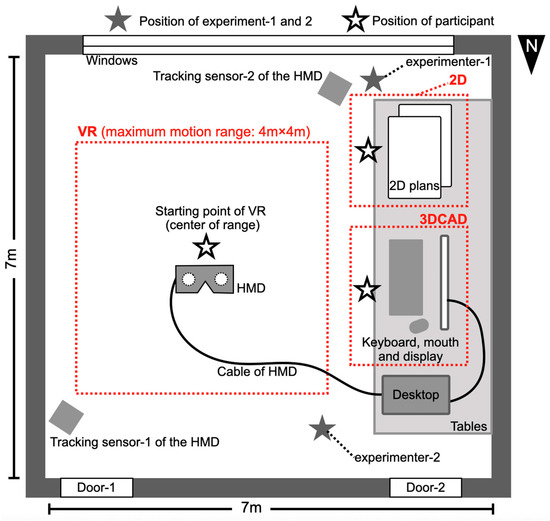
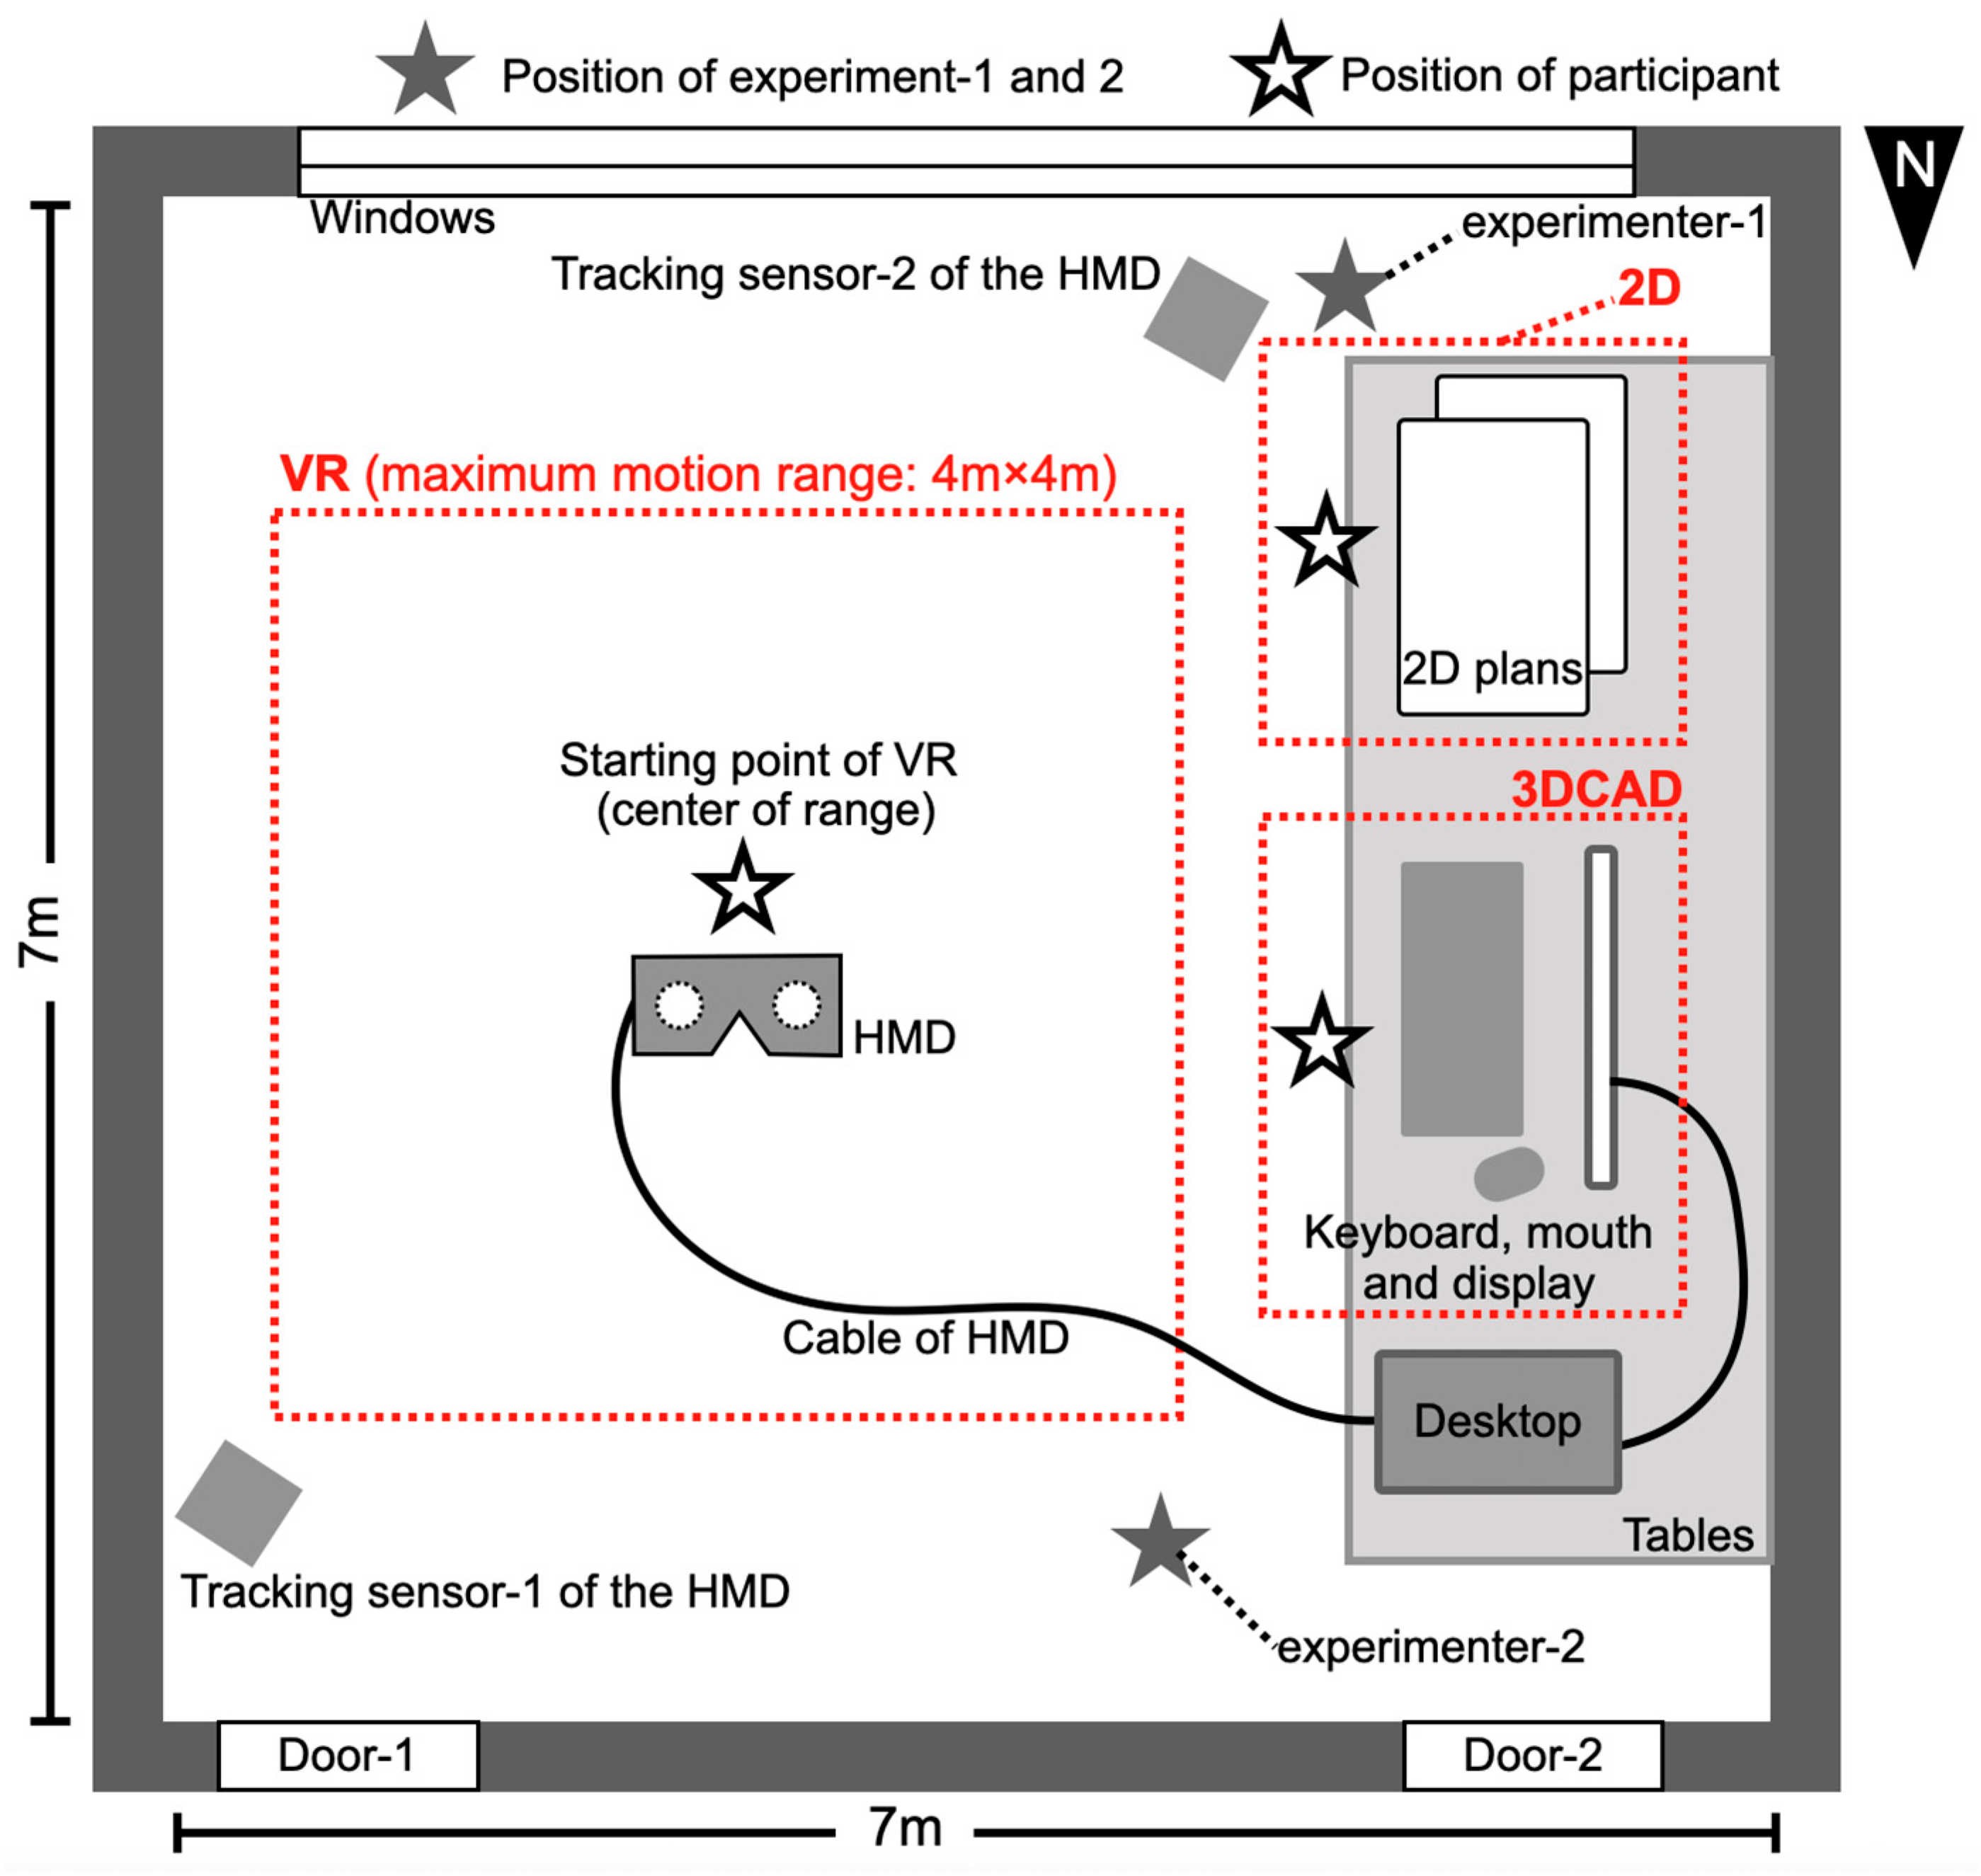
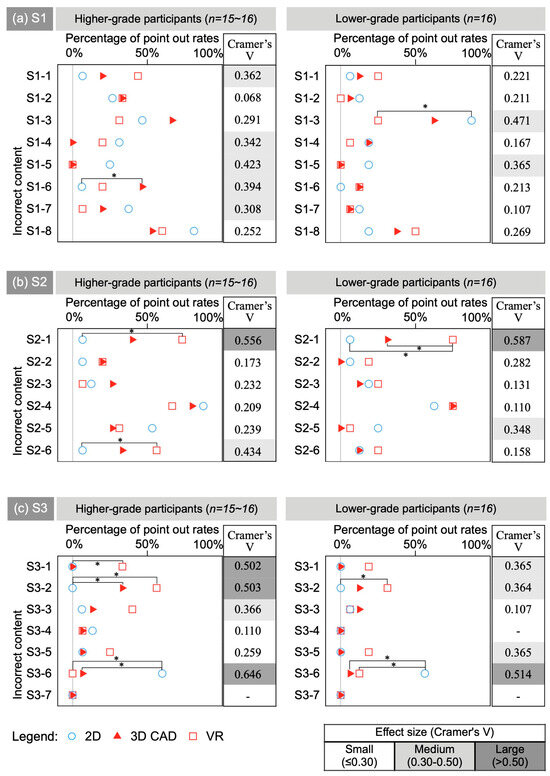
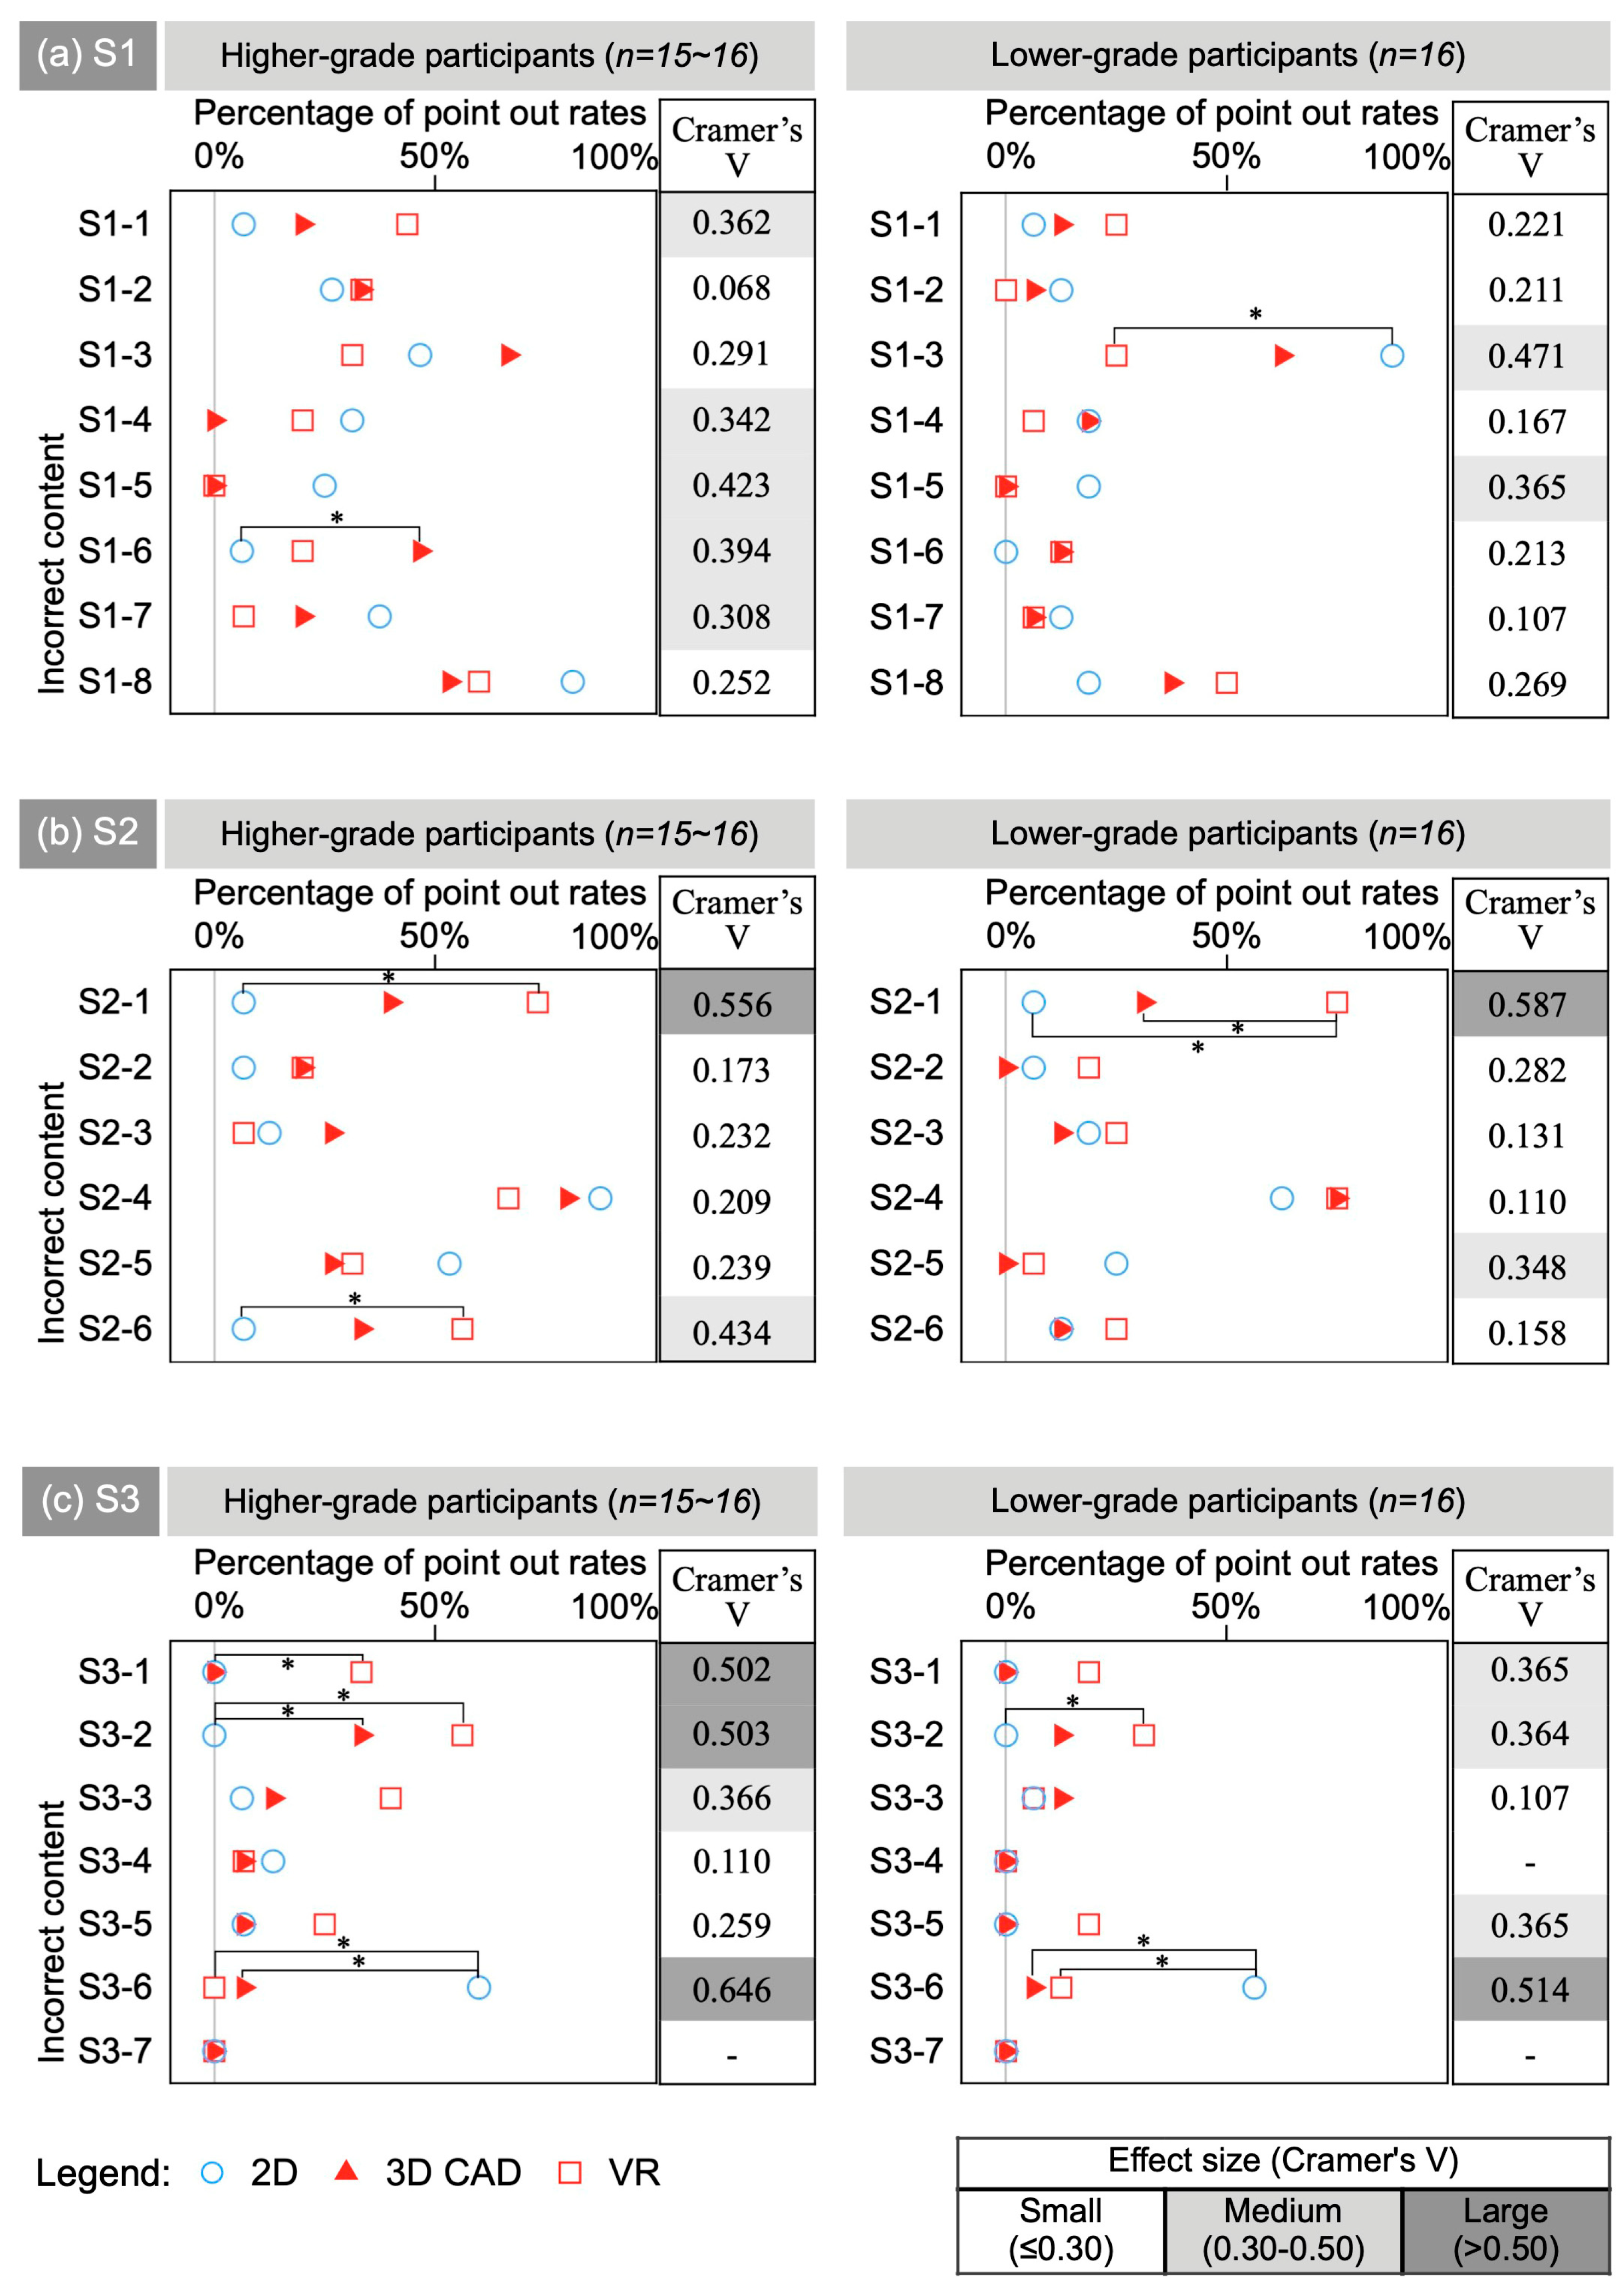
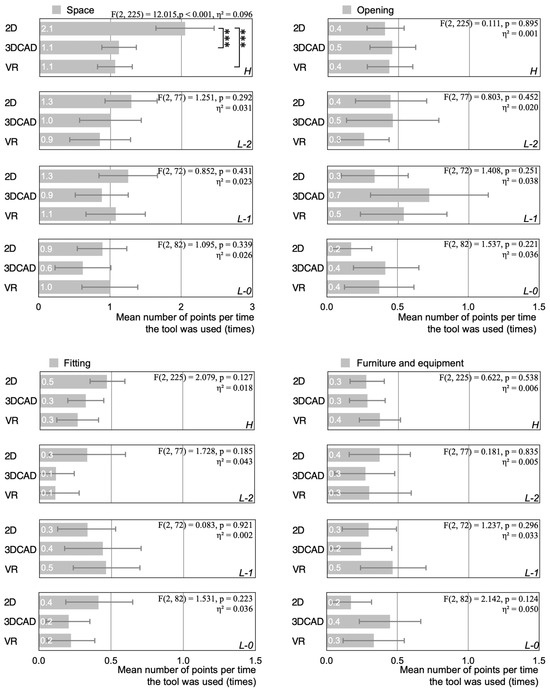
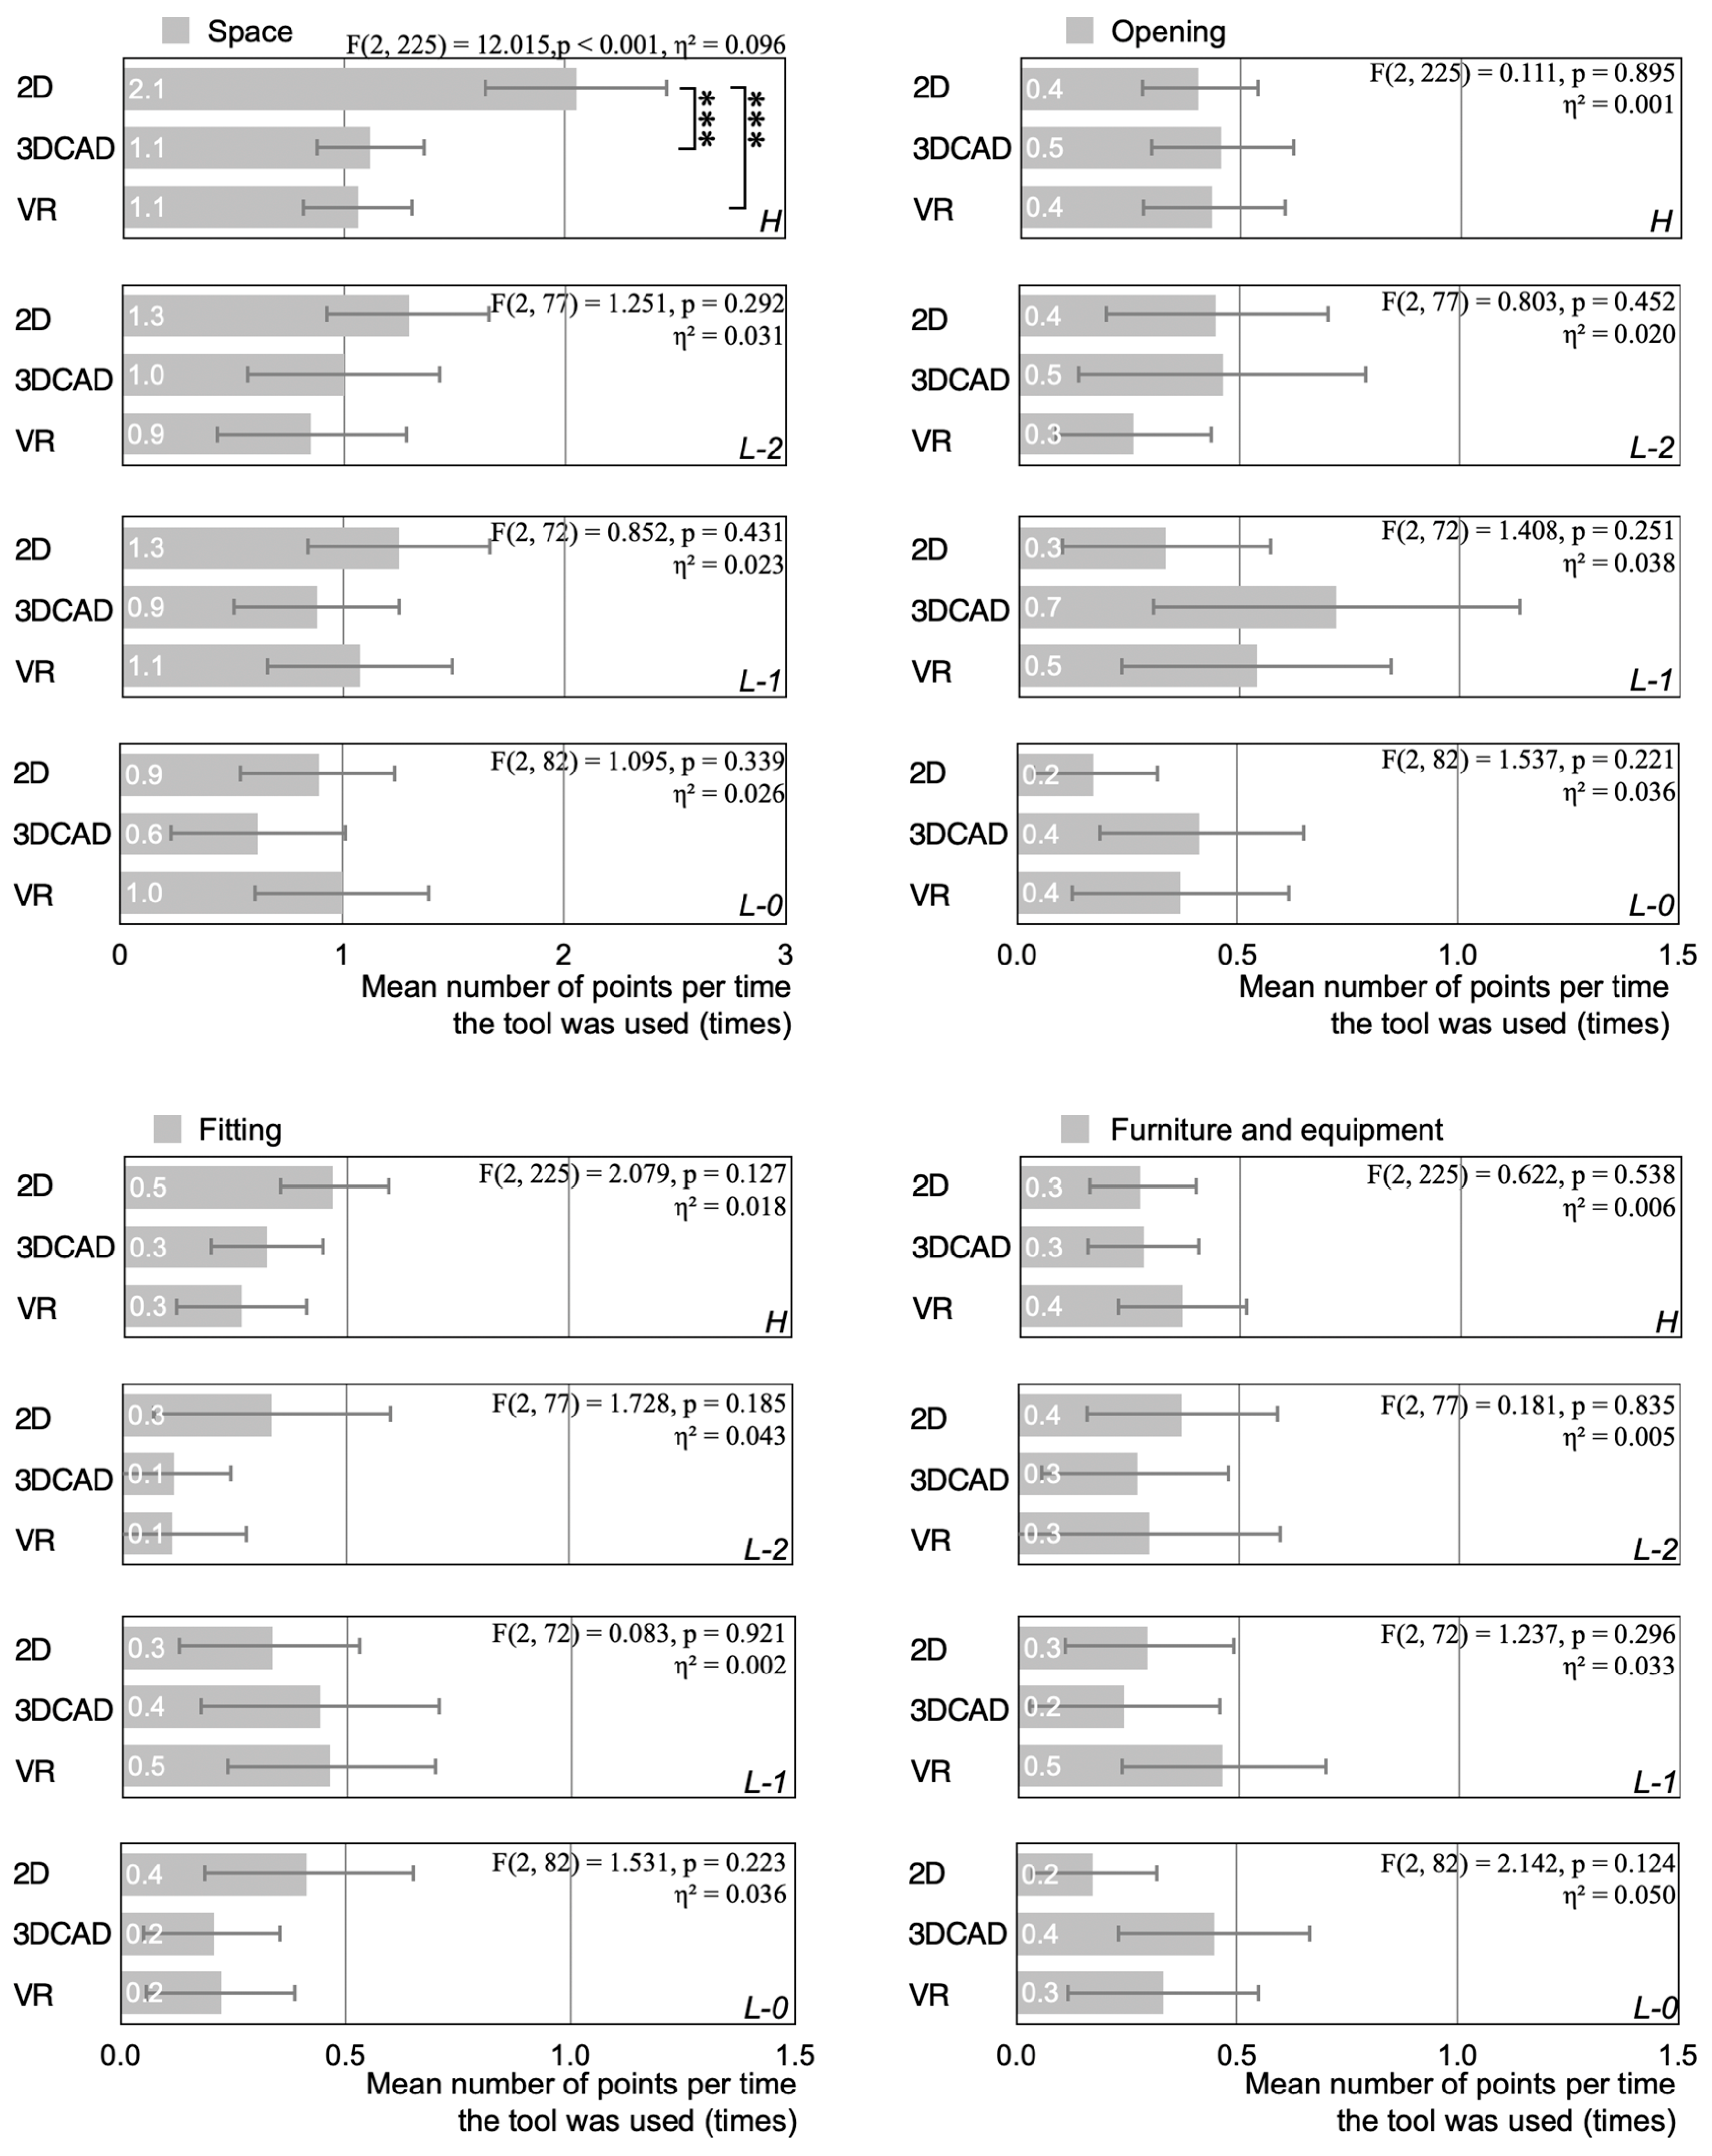

Disclaimer/Publisher’s Note: The statements, opinions and data contained in all publications are solely those of the individual author(s) and contributor(s) and not of MDPI and/or the editor(s). MDPI and/or the editor(s) disclaim responsibility for any injury to people or property resulting from any ideas, methods, instructions or products referred to in the content. |
© 2026 by the authors. Licensee MDPI, Basel, Switzerland. This article is an open access article distributed under the terms and conditions of the Creative Commons Attribution (CC BY) license.