


Abstract
Intelligent cost control in engineering, procurement, and construction (EPC) projects depends on the continuous transmission, updating, warning, correction, and reuse of cost data across multiple project stages. To analyse the resilience of this process, this study constructs an EPC project cost-data transmission network using complex network theory and Monte Carlo simulation. Eighteen core nodes and 27 directed weighted edges are identified according to EPC cost-management logic and expert evaluation. Node importance is analysed using weighted degree centrality, betweenness centrality, and PageRank, while network efficiency is used to evaluate cost-data reachability and transmission-path efficiency. Node failure, edge-weight perturbation, random edge failure, random failure and targeted attack, feedback enhancement, critical-node failure–recovery, and robustness checks are then conducted. The results show that Dynamic cost, Cost deviation warning, and Historical cost database are the three most critical nodes. Their failures reduce network efficiency by 44.54%, 37.43%, and 45.27%, respectively. Random edge failure has a stronger effect on network efficiency than edge-weight perturbation; when the edge failure probability increases from 5% to 20%, the average efficiency loss rate rises from 10.54% to 37.30%. Feedback-link enhancement increases network efficiency from 0.1858 to 0.2009 and produces a larger improvement than forward-link enhancement and random seven-edge enhancement. Robustness checks under alternative network assumptions indicate the relative stability of the critical-node identification results within the proposed network structure. The findings provide a scenario-based network perspective for identifying structurally critical nodes, vulnerable transmission links, and feedback-improvement priorities in EPC cost-data transmission. They also offer a methodological basis for future project-level calibration using BIM/5D BIM records, procurement data, cost-management platform logs, and settlement audit data.
1. Introduction
The engineering, procurement, and construction (EPC) delivery mode integrates design, procurement, and construction within a unified project organization, which facilitates the coordination and use of project resources throughout the project life cycle. Compared with traditional phase-based project management, cost formation in EPC projects depends more heavily on the continuous exchange of data among multiple stages, participants, and information systems. Data related to target cost, design estimates, construction drawing budgets, BIM-based quantities, procurement bills of quantities, supplier quotations, contract prices, progress measurement, variation orders, claims, progress payments, and settlement audits are often generated at different stages and recorded or used by different management entities. If these data are not transmitted in a timely and accurate manner, dynamic cost analysis, deviation warning, and corrective feedback cannot function effectively, and cost control may remain limited to post-event accounting and result-based statistics.
The application of BIM, 5D BIM cost management, project management platforms, and digital collaboration systems has promoted the transformation of project cost management from static accounting to process tracking, dynamic adjustment, and data-driven control [1]. Existing studies have discussed BIM-based cost estimation [2], digital tools for construction cost management [3], BIM-based solutions for construction management challenges [4], pre-tender cost estimation [5], and 5D BIM for cost estimation, cost control, and payments [6], thereby providing an important research basis for intelligent cost control in EPC projects. A recent review of 5D BIM further indicates that cost management research has increasingly focused on cost-tool integration, implementation challenges, standardization, and interoperability [7]. Digital twin research has also shown that construction project management can benefit from the integration of physical project processes and digital information models [8]. A BIM–data mining integrated digital twin framework further demonstrates the value of real-time data capture, process monitoring, and closed-loop decision support in project management [9]. Accountable information sharing has also been examined through an integrated digital twin and blockchain framework, which highlights the importance of traceable data exchange among project participants [10]. Technologies for construction digital twins further support the integration of sensing, modelling, data processing, and decision-making in digital project environments [11]. From the perspective of construction data governance, recent research shows that data governance capabilities can support project organization resilience by improving data standards, data-quality control, and responsibility allocation [12]. These studies suggest that digital technologies can improve the efficiency of quantity extraction, cost estimation, contract management, payment management, and process control, while also enhancing information sharing among multiple stakeholders.
Cost data transmission in EPC projects exhibits clear network characteristics. Target cost affects design limits, quantity formation, and procurement planning, while supplier quotations and contract prices feed back into dynamic cost. Progress measurement, resource consumption, variation orders, and claims are continuously incorporated into cost accounting, whereas settlement audit results and deviation causes are accumulated as historical cost experience and then used to support target cost preparation and procurement price judgment in subsequent projects. Cost deviation is also not a static numerical result. It must pass through dynamic cost monitoring, deviation warning, responsibility tracing, corrective actions, and effectiveness feedback before it can be translated into actual management actions. This indicates that cost data transmission in EPC projects is closer to a directed network composed of multiple data nodes and transmission relationships than to a one-way chain process.
Existing research has not yet provided a sufficient explanation of cost data transmission in EPC projects. Some studies emphasize the value of 5D BIM platforms in cost estimation, cost control, and payment management [6], but the transmission structure among target cost, quantities, procurement prices, variation orders, payment settlement, and historical experience remains underexplored. Many studies on cost management focus more on early-stage cost prediction [13], cost-overrun risk prediction [14], cost-overrun factor evaluation [15], conceptual cost-estimation risk [16], and construction cost index forecasting [17], while relatively few examine the network structure of critical cost data nodes and key transmission links. In actual project operation, data delay, interface interruption, process breakpoints, data quality fluctuation, and insufficient management feedback may all interfere with cost data transmission. Research on network resilience under such disturbances remains limited. These gaps make it difficult for project managers to determine which data nodes are most critical, which transmission relationships are most vulnerable, and how feedback-link optimization can improve intelligent cost control.
Complex network theory provides an alternative analytical perspective for EPC project cost data transmission [18]. It can abstract data objects, business activities, and transmission relationships in project management into nodes and edges, and then identify critical nodes [19,20], vulnerable structures [21], and recovery characteristics using centrality metrics [22,23], network efficiency, robustness analysis, and failure–recovery analysis. Compared with linear process analysis, complex network analysis can describe not only the forward transmission of cost data but also feedback relationships such as deviation warning, corrective actions, and historical experience reuse. When combined with Monte Carlo simulation, it can further simulate edge-weight perturbation, random edge failure, and feedback enhancement scenarios, thereby examining the stability and resilience of the cost data transmission network under uncertain disturbances [24,25,26]. In this way, EPC cost data transmission can be transformed from a qualitative process description into a computable, comparable, and simulatable network analysis problem.
To address these research gaps, this study develops a directed weighted network framework for analysing the resilience of EPC project cost-data transmission. In this framework, key cost-related data objects and management activities are represented as network nodes, and the direct transmission relationships among them are represented as directed weighted edges. The framework integrates the main stages of EPC cost management, including target cost formation, design budgeting, quantity extraction, procurement pricing, contract pricing, construction process cost accumulation, variation and claim management, dynamic cost monitoring, payment settlement, and historical cost experience reuse.
The study focuses on four closely related issues. First, it examines how EPC project cost-data transmission can be represented as a directed weighted network based on cost-management processes and expert judgement. Second, it identifies the nodes that play critical structural roles in the cost-data transmission network. Third, it analyses changes in network-efficiency resilience under node failure, edge-weight perturbation, random edge failure, and targeted attack scenarios. Fourth, it evaluates how feedback-link enhancement can improve the functional retention and recovery capacity of the cost-data transmission network.
To conduct the analysis, this study first identifies 18 core nodes and 27 directed edges according to EPC cost-management logic and expert evaluation. Edge weights are determined through expert scoring and normalization. Weighted degree centrality, betweenness centrality, and PageRank are then used to evaluate node importance. Network efficiency is adopted to describe the structural reachability and transmission-path efficiency of cost data among nodes. Monte Carlo simulation, node failure simulation, random failure and targeted attack analysis, feedback enhancement analysis, and critical-node failure–recovery simulation are further conducted to examine the disturbance response and recovery behaviour of the network.
This study makes three main contributions. First, it provides a network-based representation of EPC cost-data transmission that links forward data transmission, dynamic cost control, settlement feedback, and historical experience reuse. Second, it identifies structurally critical nodes and feedback relationships that affect the continuity of cost-data transmission. Third, it proposes a simulation-based approach for evaluating the network-efficiency resilience of EPC cost-data transmission under different disturbance and recovery scenarios. The results provide a basis for understanding the structural vulnerability of EPC cost-data transmission and for improving feedback-oriented cost-control mechanisms.
2. Construction of the EPC Cost-Data Transmission Network
Intelligent cost control in EPC projects should not be understood as a data-processing task within a single management activity. It depends more on the continuous transmission and feedback of data related to target cost, design outputs, quantities, procurement prices, construction processes, variation orders, payment settlement, and historical experience. Compared with the relatively linear document flow in traditional cost management, cost data in EPC projects are generated from more dispersed sources, involve more nodes, and are transmitted through more intersecting paths, often accompanied by clear feedback relationships. Quantities formed during the design stage affect procurement bills of quantities and contract prices; procurement prices feed back into dynamic cost; and resource consumption, variation orders, and claims during construction further change the project cost status. When dynamic cost deviates from the target cost, cost deviation warning and corrective actions in turn influence subsequent cost control. After project settlement, data related to prices, variations, claims, and settlement differences are accumulated as historical cost experience and used to support target cost preparation and procurement price judgment in subsequent projects.
Based on these characteristics, this study abstracts the cost data transmission process in EPC projects as a directed weighted network. Network nodes represent cost data objects or cost management activities, edges represent data transmission relationships between nodes, and edge weights are used to describe the strength or reliability of data transmission. In this way, EPC project cost data transmission is transformed from a process description into a computable network structure, which can then be used for node importance identification, network efficiency analysis, and disturbance simulation.
2.1. Cost Data Transmission Logic
Cost data transmission in EPC projects mainly includes two types of paths: forward transmission and feedback transmission. Forward transmission describes the gradual flow of cost data from target cost formation to the design, procurement, construction, and settlement stages. Target cost is decomposed into different work units and cost items through the WBS–CBS coding system, thereby constraining design estimates, construction drawing budgets, and quantity data. Design outputs are converted into BIM-based quantities and procurement bills of quantities. The procurement bill of quantities drives supplier quotation, and the quotation results form the contract price, which is then fed back into the dynamic cost management process. Progress measurement, resource consumption, variation orders, and claims during construction are also continuously incorporated into dynamic cost accounting and cost deviation identification.
Feedback transmission focuses on the reverse effect of cost data in deviation warning, corrective actions, and experience reuse. When a deviation occurs between dynamic cost and target cost, the cost deviation warning node identifies the abnormal state and triggers corrective actions. The implementation results of corrective actions return to the dynamic cost node, forming a closed loop of cost control. Meanwhile, data generated from settlement audits, deviation causes, and corrective processes are accumulated in the historical cost database and then used to support target cost preparation and procurement quotation judgment in subsequent projects. Therefore, cost data transmission in EPC projects exhibits the characteristics of a complex network that integrates forward transmission, process convergence, and feedback reuse.
2.2. Network Node Definition
According to the process of intelligent cost control in EPC projects, this study selects 18 core nodes to construct the cost data transmission network. The selection of nodes follows the logic of cost-data generation, transmission, application, warning, correction, settlement, and experience reuse in EPC projects. Three criteria were used to identify the core nodes. First, a node should represent a cost-related data object or management activity that directly participates in cost formation, cost updating, cost monitoring, or cost feedback. Second, a node should have clear upstream or downstream data relationships with other nodes in the EPC cost-control process. Third, the node should be sufficiently general to appear in typical EPC project cost-management practice, rather than being limited to a specific project, organization, or software platform.
Accordingly, this study selected 18 core nodes covering seven functional categories: cost baseline, design and quantity, procurement and contract, construction and change, dynamic control, payment and settlement, and knowledge feedback. These nodes represent the main cost-data objects and management activities through which EPC project costs are generated, transmitted, updated, checked, settled, and reused. Elements such as approval procedures, owner instructions, contract management systems, and data quality review are important for cost-data governance, but they are treated in this study as management conditions or mechanisms that affect transmission relationships and edge weights. They are therefore reflected through the strength, reliability, and business impact of the corresponding edges, rather than being defined as independent cost-data nodes in the baseline network. The definitions of the core nodes are shown in Table 1.
Table 1.
Core node definitions of the EPC project cost data transmission network.
The nodes in Table 1 are not arranged simply according to project stages. Instead, they are abstracted according to the actual flow of cost data in EPC projects. Dynamic cost is the core status node formed after multiple types of process data converge. Cost deviation warning and corrective action represent the feedback mechanism of cost control, while the historical cost database reflects the supporting role of project experience in subsequent cost management.
2.3. Network Edge Relationships and Edge Weight Determination
After defining the nodes, this study further constructs the cost data transmission edges. When the data of one node can be directly transmitted to, influence, or feed back to another node, a directed edge is established between the two nodes. The direction of an edge represents the direction of cost data transmission, while the edge weight represents the relative strength of different transmission relationships. The edge weights used in this study do not directly represent the interface connectivity rate or platform log transmission frequency of a specific project. Rather, they describe the business dependency, data transmission directness, and process correlation between nodes under the baseline scenario.
To determine the edge weights, the transmission edges were first identified according to EPC cost-management processes and the business dependencies among the nodes. A directed edge was included when the relationship between two nodes satisfied three conditions: the upstream node provides cost-related data or management information to the downstream node; the transmission direction can be clearly identified from the cost-control process; and the relationship is sufficiently general to appear in typical EPC cost-management practice. Indirect, occasional, or highly project-specific relationships were not included as independent edges in the baseline network.
An expert-based scoring procedure was then used to evaluate the relative strength of the 27 directed transmission edges. Eight experts were invited to participate in the evaluation. The experts were selected according to three criteria: first, they had more than ten years of experience in EPC project management, engineering cost management, design cost estimation, procurement pricing, contract management, digital construction, or construction management research; second, they had direct experience with cost-data generation, transmission, review, or decision-making; and third, they were familiar with the cost-control process of EPC projects. The expert panel covered the major professional perspectives involved in EPC cost-data transmission, including owner-side investment control, cost consulting, design cost estimation, construction contract management, academic research, bidding and procurement, digital engineering, and whole-process cost management. The composition of the expert panel is shown in Table 2.
Table 2.
Expert panel composition for edge-weight evaluation.
The scoring was conducted using a structured questionnaire. Each expert independently evaluated the 27 directed transmission edges from four dimensions: data dependency strength, transmission frequency, business impact, and data reliability. Each dimension was scored on a five-point scale, where 1 indicated a very weak relationship and 5 indicated a very strong relationship. For each edge, the four-dimensional scores given by an expert were averaged to obtain the expert’s comprehensive score for that edge. The mean comprehensive score across the eight experts was then calculated and normalized to obtain the initial edge weight.
The coefficient of variation was used to examine the dispersion of expert scores. In this study, a coefficient of variation below 0.20 was considered acceptable for the exploratory construction of the cost-data transmission network. The coefficients of variation for all 27 edges ranged from 0.07 to 0.15, indicating that the expert evaluations were relatively consistent. The normalization method divided the mean comprehensive score by 5, corresponding to the upper bound of the five-point scale. This linear normalization maps expert scores into the interval [0, 1], where larger values indicate stronger, more direct, and more reliable cost-data transmission relationships. The robustness of the results under alternative weight assumptions is further examined in the robustness analysis.
For formal expression, let , , , and denote the scores assigned by the -th expert for data dependency strength, transmission frequency, business impact, and data reliability, respectively. The comprehensive score of edge assigned by the -th expert is calculated as:
where is the comprehensive score assigned to edge by the -th expert; , , , and denote the expert’s scores for data dependency strength, transmission frequency, business impact, and data reliability, respectively.
The mean comprehensive score of each edge is calculated as:
where is the number of experts participating in the scoring process. To keep edge weights within the range of 0–1, the mean score is normalized as follows:
To examine the stability of expert scoring, the coefficient of variation is used to measure score dispersion:
where is the standard deviation of expert comprehensive scores for edge . The comprehensive score mean reported in Table 3 refers to .
Table 3.
Edge-weight determination results for cost data transmission.
Table 3 shows that the initial edge weights are mainly distributed between 0.68 and 0.88. Direct business links, such as target cost decomposition, contract price formation, and the triggering of cost deviation warning by dynamic cost, have relatively high weights. By contrast, feedback-oriented links, such as corrective action feedback, deviation cause accumulation, and historical experience reuse, have slightly lower weights. This suggests that forward business links usually have stronger data dependency and transmission stability, whereas feedback links are more likely to be affected by management closure, experience accumulation, and cross-departmental coordination conditions.
2.4. Cost Data Transmission Network Structure
Based on Table 1 and Table 3, a directed weighted network of EPC project cost data transmission is constructed, as shown in Figure 1. In the figure, nodes represent cost data objects or business activities, and node size is used to assist visualization according to the node importance results calculated later. Solid lines represent the main cost data transmission paths, while dashed lines represent feedback links. Different background regions correspond to different stages of cost data transmission, including cost baseline, design and quantities, procurement and contract, construction and change, dynamic control, payment and settlement, and knowledge feedback.
Figure 1.
EPC project cost data transmission network structure.
Figure 1 shows that the EPC project cost data transmission network contains both forward transmission and feedback coupling. The forward transmission path mainly includes target cost, design budget, BIM quantities, procurement BOQ, supplier quotation, contract price, progress measurement, resource consumption, variation order, and claim event. This path continuously transmits cost data generated at different stages to the dynamic cost node. The feedback path mainly includes dynamic cost, cost deviation warning, corrective action, settlement audit, and historical cost database. This path transmits cost deviations, settlement differences, and historical experience back to target cost preparation, procurement quotation judgment, and subsequent cost control processes.
From the network structure, Dynamic cost lies at the intersection of multiple transmission paths and serves as the core node where procurement, construction, variation, and claim data converge. Cost deviation warning connects Dynamic cost with Corrective action and plays a role in transforming cost monitoring into management response. Historical cost database is located at the end of the feedback chain and also connects back to Target cost and Supplier quotation, reflecting the support provided by historical experience for front-end cost decision-making. This structure indicates that the cost data transmission capability of EPC projects is affected not only by the completeness of front-end data but also by whether dynamic cost monitoring, deviation warning, corrective feedback, and experience reuse can form a closed loop.
The directed weighted network constructed in this section provides the basis for subsequent complex network analysis and simulation. Based on this network structure, the following sections calculate node centrality, comprehensive node importance, and network efficiency, and set up simulation scenarios including node failure, edge-weight perturbation, random edge failure, random failure and targeted attack, feedback enhancement, and critical-node failure–recovery. These analyses are used to examine the critical nodes, disturbance resistance, and resilience characteristics of the EPC project cost data transmission network.
3. Network Analysis and Simulation Methods
After constructing the EPC project cost data transmission network, it is necessary to further quantify its structural characteristics, disturbance resistance, and failure–recovery behavior. This study analyzes the network from the perspectives of node importance, network efficiency, node failure, edge-weight perturbation, random edge failure, random failure versus targeted attack, feedback enhancement, and critical-node failure–recovery. Node importance analysis is used to identify critical nodes in the cost data transmission network, while network efficiency is used to characterize the overall transmission capability of cost data. Node failure simulation examines changes in network efficiency after the interruption of critical nodes. Edge-weight perturbation simulation tests whether the network remains stable when transmission strength fluctuates, whereas random edge failure simulation represents the impact of interface interruption or process breakpoints on network function. The comparison between random failure and targeted attack reflects differences in functional retention under random failures of ordinary nodes and successive failures of high-importance nodes. The feedback enhancement scenario focuses on changes in network efficiency after strengthening the links related to cost warning, corrective feedback, and experience reuse. Finally, the critical-node failure–recovery simulation examines the recovery process of network efficiency after critical nodes are restored, thereby characterizing the resilience of the cost data transmission network.
3.1. Directed Weighted Network Model
Let the EPC project cost data transmission network be represented as:
where denotes the node set, representing cost data objects or business activities in EPC projects; denotes the directed edge set, representing direct cost data transmission relationships between nodes; and denotes the edge-weight matrix, representing the transmission strength or reliability of cost data from node to node .
The adjacency matrix is defined as:
where
If , the edge weight is set as . A larger edge weight indicates that the transmission relationship is more stable and direct, and that cost data are more reliably transmitted along the corresponding path. If , then .
Because this study focuses on data transmission efficiency, a larger edge weight indicates lower transmission resistance. To calculate the shortest transmission paths, the edge weight is converted into path distance as follows:
where denotes the transmission distance from node to node . A larger edge weight corresponds to a shorter transmission distance, indicating smoother data transmission.
3.2. Node Centrality Metrics
Node centrality is used to identify critical nodes in the cost data transmission network. Since a single centrality metric cannot fully capture the role of a node, this study selects weighted degree centrality, betweenness centrality, and PageRank to evaluate node importance from three perspectives: local connectivity, intermediary control, and global influence.
3.2.1. Weighted Degree Centrality
Weighted out-degree reflects a node’s ability to transmit cost data to other nodes, and is defined as:
Weighted in-degree reflects a node’s ability to receive cost data from other nodes, and is defined as:
The weighted total degree is then defined as:
A larger weighted total degree indicates that the node has closer data transmission connections with other nodes and stronger local connectivity in the network.
3.2.2. Betweenness Centrality
Betweenness centrality measures the extent to which a node lies on the shortest transmission paths between other nodes. It is defined as:
where denotes the number of shortest paths from node to node , and denotes the number of those shortest paths that pass through node . A higher betweenness centrality indicates that the node is more likely to occupy an intermediary position in cost data transmission. Once such a node fails, it may have a greater impact on network transmission paths.
3.2.3. PageRank
PageRank is used to measure the global influence of nodes in a directed network. In the EPC project cost data transmission network, the importance of a node depends not only on the number of its direct connections but also on whether its upstream nodes are important. Since the network in this study is directed and weighted, edge weights are incorporated into the PageRank calculation:
where denotes the PageRank value of node ; is the damping factor, commonly set to 0.85; denotes the set of upstream nodes pointing to node ; denotes the set of downstream nodes of node ; and denotes the edge weight from node to node . A higher PageRank value indicates stronger global influence in the cost data transmission network.
3.3. Comprehensive Node Importance
Different centrality metrics have different dimensions and value ranges, so they must first be normalized. Let the original value of a given centrality metric be . Its normalized value is calculated as:
Based on this normalization, the comprehensive node importance is defined as:
where denotes the comprehensive importance of node ; , , and denote the normalized weighted total degree, betweenness centrality, and PageRank value, respectively; and , , and are weight coefficients. To avoid overemphasizing any single centrality metric, equal weights are adopted:
A larger comprehensive node importance value indicates that the node plays a stronger role in network connectivity, intermediary transmission, and global influence. The critical nodes in the EPC project cost data transmission network are identified based on this index.
3.4. Network Efficiency
Network efficiency measures how smoothly cost data are transmitted throughout the network. For a directed weighted network, the shortest transmission distance from node to node is denoted by . Network efficiency is defined as:
where is the number of network nodes. If node cannot reach node , the efficiency contribution of this node pair is recorded as 0. A higher network efficiency indicates that cost data can be transmitted through shorter paths, and that the overall transmission capability of the network is stronger.
In this study, network efficiency is used not only to measure the transmission capability of the baseline network, but also to evaluate network performance under node failure, edge-weight perturbation, random edge failure, feedback enhancement, random failure versus targeted attack, and critical-node failure–recovery scenarios.
3.5. Node Failure Simulation
Node failure simulation is used to analyze the impact of critical cost data node interruption on network transmission efficiency. For each node , the node and its associated edges are removed from the baseline network , resulting in the failed network . Network efficiency is then recalculated.
The network efficiency loss rate caused by the failure of node is defined as:
where denotes the network efficiency loss rate caused by the failure of node ; denotes the baseline network efficiency; and denotes the network efficiency after removing node . A larger indicates that the node failure has a more significant impact on the cost data transmission network.
To avoid overestimating average efficiency due to the reduction in network size after node removal, this study calculates network efficiency using the fixed original node size in the node failure simulation. Specifically, after node is removed, all paths related to this node are regarded as unreachable, and their efficiency contribution is recorded as 0. Network efficiency is still calculated using the original number of nodes as the denominator. This treatment better reflects the simulation meaning that the failure of a business node reduces the transmission capability of the original system.
3.6. Method for Monte Carlo Edge-Weight Perturbation Simulation
In actual EPC projects, cost data transmission is not completely stable. Data entry delays, unstable system interfaces, changes in interdepartmental coordination efficiency, and data quality fluctuations may all change the reliability of transmission relationships. To simulate general fluctuations in transmission reliability, this study uses Monte Carlo simulation to randomly perturb network edge weights.
Let the perturbed edge weight of edge in the -th simulation be:
where
In the above equations, is the random perturbation term, and is the perturbation amplitude. To ensure that the perturbed edge weight remains within the range of 0–1, interval clipping is applied. If the perturbed weight is greater than 1, it is set to 1; if it is less than 0, it is set to 0. This study sets to 10%, 20%, and 30%, representing low, medium, and high levels of transmission reliability fluctuation, respectively. Under each perturbation scenario, 1000 simulations are repeated, and the mean, standard deviation, minimum value, maximum value, and average efficiency loss rate of network efficiency are calculated.
The average efficiency loss rate under edge-weight perturbation is defined as:
where denotes the average network efficiency from 1000 simulations when the perturbation amplitude is . This indicator measures the impact of random transmission reliability fluctuations on overall network efficiency.
3.7. Method for Random Edge Failure Simulation
Edge-weight perturbation simulation mainly reflects continuous changes in data transmission reliability. In actual engineering management, however, more severe transmission interruptions may occur. For example, system interfaces may not be connected, approval processes may be interrupted, data may not be transmitted in time, or key business activities may be missing. These situations may cause certain data transmission edges to fail. To simulate this type of scenario, this study further conducts random edge failure simulation.
Assume that each edge fails with probability . The edge weight in the -th simulation is defined as:
This study sets the edge failure probability to 5%, 10%, and 20%, representing mild, moderate, and relatively high levels of data transmission breakpoints, respectively. Under each scenario, 1000 simulations are repeated, and the distribution of network efficiency is calculated.
The average efficiency loss rate under random edge failure is defined as:
where denotes the average network efficiency from 1000 simulations when the edge failure probability is . This indicator is used to evaluate the impact of data transmission link interruption on the network’s functional retention capability.
3.8. Scenario Parameter Settings
The disturbance parameters used in the simulations were defined as scenario levels to compare the network response under different degrees of transmission uncertainty. For edge-weight perturbation, the amplitudes of ±10%, ±20%, and ±30% were used to represent low, medium, and high fluctuations in the strength of cost-data transmission relationships. These fluctuations correspond to common management situations such as temporary delays in data entry, unstable coordination between departments, differences in data completeness, and changes in the reliability of system interfaces.
For random edge failure, the probabilities of 5%, 10%, and 20% were used to represent mild, moderate, and relatively severe transmission breakpoints. In EPC cost management, such breakpoints may be caused by missing data interfaces, interrupted approval or reporting procedures, delayed transmission of procurement or settlement information, or incomplete feedback of variation and claim data. The purpose of using these three probability levels is to compare the functional retention capability of the network under progressively stronger link-interruption scenarios.
The feedback enhancement scenario was designed according to the closed-loop logic of dynamic cost control. The selected enhancement links are related to cost deviation warning, corrective action feedback, settlement experience accumulation, and historical cost reuse. These links were selected because they connect cost monitoring, management response, cost updating, and subsequent decision support. Therefore, the scenario focuses on feedback-oriented improvement rather than uniform strengthening of all transmission relationships. The results of this scenario are interpreted as changes in network-efficiency resilience under specified enhancement assumptions.
3.9. Robustness Simulation Under Random Failure and Targeted Attack
To further analyze the functional retention capability of the cost data transmission network under continuous node failures, this study sets up two node removal scenarios: random failure and targeted attack. The random failure scenario is used to simulate accidental interruption of ordinary business nodes or local data node anomalies, while the targeted attack scenario is used to simulate the impact of successive failures of high-importance nodes on network function.
In the random failure scenario, a node removal sequence is randomly generated in each simulation, and nodes are removed one by one according to this sequence. The simulation is repeated 1000 times, and the average network efficiency under each node removal ratio is calculated. In the targeted attack scenario, nodes are removed in descending order of comprehensive node importance, and the network efficiency after each removal step is calculated.
To compare the functional retention capability of the network under different node removal ratios, relative network efficiency is defined as:
where is the node removal ratio; denotes the remaining network after removing a proportion of nodes; denotes the baseline network efficiency; and denotes the network efficiency after node removal. A higher indicates stronger functional retention capability under continuous node failures. By comparing the variation trends of under random failure and targeted attack scenarios, the sensitivity of the network to ordinary node failures and critical node failures can be assessed.
3.10. Feedback Enhancement Scenario Design
According to the business logic of EPC project cost data transmission, dynamic cost monitoring, cost deviation warning, corrective action implementation, and historical experience reuse are key activities for forming closed-loop cost control. When feedback links are insufficient, cost data may remain at the stage of collection and statistical reporting and may not enter corrective or subsequent optimization processes in time. Therefore, this study designs a feedback enhancement scenario to analyze changes in network efficiency and disturbance resistance after strengthening feedback links.
The feedback enhancement scenario mainly adjusts the edges related to dynamic cost warning, corrective feedback, settlement experience accumulation, and historical experience reuse. The specific edge-weight adjustment rules are shown in Table 4. The enhanced network is denoted as . This scenario does not uniformly increase the weights of all edges. Instead, it focuses on simulating the improvement of key feedback-link transmission capability after the mechanisms of cost warning, corrective closed loop, and historical experience reuse are strengthened. All enhanced edge weights are controlled within the range of 0–1.
Table 4.
Edge-weight adjustment rules under the feedback enhancement scenario.
The enhanced weights in Table 4 were specified as a predefined strengthened-state scenario for controlled comparison. The setting follows three principles. First, the enhanced weights are higher than the corresponding baseline weights but remain below 1.0, indicating that feedback links are strengthened but not assumed to be perfectly reliable. Second, different enhanced values are assigned according to the functional role and standardization potential of each feedback link. The link V13 → V16, which represents the triggering of cost deviation warning by dynamic cost information, is assigned the highest value of 0.95 because this process can be more directly supported by system-based monitoring and warning mechanisms. Links related to warning response, corrective feedback, settlement experience accumulation, and historical experience reuse are set between 0.88 and 0.92 according to their baseline weights and their roles in closing the cost-control feedback loop. Third, the average weight increment of the seven feedback links is used as the reference increment for the forward-link enhancement scenario and the random seven-edge enhancement scenario. This design keeps the total enhancement intensity comparable across scenarios and allows the comparison to focus on the structural location of enhanced links.
Table 4 shows that the feedback enhancement scenario mainly increases the transmission weights of the links related to dynamic cost warning, corrective feedback, and historical experience reuse. Specifically, V13 → V16 represents the transmission capability from dynamic cost to cost deviation warning; V16 → V17 and V17 → V13 represent the closed-loop relationship among warning, correction, and dynamic cost updating; and V15 → V18, V16 → V18, V18 → V1, and V18 → V6 represent the feedback effects of settlement experience, deviation causes, and historical price data on subsequent cost decision-making.
The network efficiency improvement rate after feedback enhancement is defined as:
where denotes the feedback-enhanced network, denotes the network efficiency after feedback enhancement, and denotes the baseline network efficiency. In addition, this study compares the average efficiency of the baseline network and the feedback-enhanced network under random edge failure conditions to determine whether feedback enhancement can improve the network’s functional retention capability under disturbances.
To compare the effect of feedback-oriented enhancement with other enhancement strategies, two reference scenarios were further designed. The first was a forward-link enhancement scenario. In this scenario, seven main forward transmission links from target cost formation to dynamic cost aggregation were strengthened, including V1 → V3, V3 → V4, V4 → V5, V5 → V6, V6 → V7, V7 → V13, and V9 → V13. The second was a random seven-edge enhancement scenario, in which seven directed edges were randomly selected and strengthened. To make the comparison consistent, both reference scenarios used the same average weight increment as the feedback enhancement scenario. The random seven-edge enhancement scenario was repeated 1000 times, and the average network efficiency was used for comparison.
3.11. Critical-Node Failure–Recovery Resilience Simulation
The random failure and targeted attack simulations mainly analyze the network’s functional retention capability under continuous node failures. Network resilience is reflected not only in the degree of functional decline after disturbance but also in the recovery of network function after critical nodes are restored. To characterize the recovery behavior of the EPC cost data transmission network after critical-node shocks, this study designs a critical-node failure–recovery simulation.
Based on the node importance analysis results, Dynamic cost (V13), Cost deviation warning (V16), and Historical cost database (V18) are selected as the critical failure nodes. In the failure stage, these critical nodes and their associated edges are removed successively according to comprehensive node importance, and network efficiency is calculated at each stage. In the recovery stage, the removed nodes and their associated edges are restored successively, and network efficiency is recalculated. By comparing the relative network efficiency during the failure and recovery stages, the impact of critical-node failure on network function and the contribution of node restoration to functional recovery are analyzed.
The relative network efficiency in the critical-node failure–recovery process is defined as:
where denotes the relative network efficiency at the -th failure or recovery stage; denotes the network state at stage ; denotes the network efficiency at that stage; and denotes the baseline network efficiency. The closer is to 1, the closer the network function is to the baseline state. A lower indicates a more significant weakening of network function caused by critical-node failure.
Furthermore, the efficiency loss rate at stage is defined as:
where denotes the efficiency loss rate at stage relative to the baseline network. Changes in and can jointly describe the functional decline caused by successive critical-node failures and the functional recovery brought about by the gradual restoration of critical nodes.
The critical-node failure–recovery simulation differs from the node failure simulation described earlier. The node failure simulation mainly compares the impact of individual node failure, whereas the critical-node failure–recovery simulation emphasizes changes in network efficiency during successive critical-node failures and gradual recovery. It is therefore used to characterize the resilience of the cost data transmission network.
3.12. Computational Implementation and Reproducibility
All network calculations and simulation experiments were implemented in Jupyter Notebook 7.4.5 using Python 3.13.9 packaged by Anaconda. The main Python libraries used for network construction, numerical calculation, Monte Carlo simulation, and visualization included NetworkX 3.5, NumPy 2.3.5, pandas 2.3.3, and Matplotlib 3.10.6. The directed weighted network was constructed using the 18 nodes and 27 directed edges defined in Table 1 and Table 3. Edge weights were used to represent transmission strength, and the corresponding transmission distance was calculated as the reciprocal of edge weight. Weighted shortest paths were then calculated on the directed network.
For node importance analysis, weighted degree centrality was calculated from the sum of incoming and outgoing edge weights. Betweenness centrality was calculated based on directed shortest paths after converting edge weights into transmission distances. PageRank was calculated on the directed weighted network with a damping factor of 0.85, and edge weights were used to distribute the influence of upstream nodes. Dangling nodes were handled according to the standard PageRank iteration procedure, in which their probability mass is redistributed across the network during iteration.
For network efficiency calculation, unreachable node pairs were assigned an efficiency contribution of 0. In node failure and critical-node failure–recovery simulations, the removed node and its associated edges were treated as unavailable. To reflect the functional loss of the original cost-data transmission system, network efficiency after node removal was calculated using the original number of nodes as the denominator. This treatment avoids artificially increasing average efficiency due to the reduction in network size after node removal.
For Monte Carlo simulations, each scenario was repeated 1000 times. To ensure computational reproducibility, the pseudo-random number generator in Python was initialized with a fixed seed of 2026 before the stochastic simulations were conducted. The same seed setting was applied to the edge-weight perturbation simulation, random edge failure simulation, random failure and targeted attack simulation, and random seven-edge enhancement simulation. This setting only controls the reproducibility of pseudo-random sampling and does not affect the baseline network structure, original edge weights, deterministic centrality metrics, or baseline network-efficiency calculation. In the edge-weight perturbation simulation, each edge weight was randomly perturbed within the specified amplitude and then clipped to the interval [0, 1]. In the random edge failure simulation, each edge was independently removed according to the specified failure probability. The mean, standard deviation, minimum value, maximum value, and average efficiency loss rate were calculated across the 1000 simulation runs.
In addition, robustness checks were conducted to examine whether the identification of critical nodes was sensitive to edge-weight assumptions and distance transformation methods. Three alternative network assumptions were tested. First, an unweighted network was constructed by setting all edge weights to 1. Second, the distance transformation was changed from to . Third, the distance transformation was changed to . Under each alternative assumption, the comprehensive node importance ranking and the node failure impact ranking were recalculated and compared with those of the baseline weighted network.
4. Results
Based on the EPC project cost data transmission network constructed in Section 2, this section further conducts network structure analysis and disturbance simulation. First, the baseline network efficiency is calculated to characterize the overall transmission capability of cost data under normal conditions. Second, critical cost data nodes are identified through node centrality analysis. Third, node failure simulation is performed to examine the impact of critical node interruption on network efficiency. Finally, Monte Carlo edge-weight perturbation, random edge failure, feedback enhancement, feedback enhancement comparison, random failure versus targeted attack, critical-node failure–recovery simulation, and robustness checks under alternative network assumptions are conducted to analyse the network’s stability, robustness, and resilience under different disturbance and modelling scenarios.
4.1. Baseline Network Efficiency
According to the network efficiency calculation method described in Section 3, the baseline network efficiency of EPC project cost data transmission is obtained as:
This value is used as the baseline for subsequent analyses of node failure, edge-weight perturbation, random edge failure, feedback enhancement, random failure versus targeted attack, and critical-node failure–recovery scenarios. Since the network constructed in this study is a directed weighted network, network efficiency does not represent the transmission capability of a single node or a single path. Instead, it reflects the average level of cost data reachability and transmission path length among all node pairs in the network. In the following simulations, a greater decrease in network efficiency after the failure of a node or edge indicates a stronger impact on the continuity of cost data transmission.
4.2. Node Importance Analysis
Based on weighted degree centrality, betweenness centrality, and PageRank, the comprehensive node importance values are calculated. The results are shown in Table 5. For clarity, Table 5 reports the top 10 nodes ranked by comprehensive importance.
Table 5.
Top 10 node centrality and importance results.
As shown in Table 5 and Figure 2, Dynamic cost (V13) has the highest comprehensive importance, clearly exceeding the other nodes. This indicates that Dynamic cost is the core convergence node in the EPC project cost data transmission network. Data such as contract price, design change, progress measurement, resource consumption, variation orders, and claim events all flow into the Dynamic cost node and further trigger cost deviation warning. Therefore, Dynamic cost not only undertakes the function of process cost aggregation, but also serves as a hub through which data aggregation is transformed into cost control.
Figure 2.
Node importance ranking in the EPC cost data transmission network.
Cost deviation warning (V16) and Historical cost database (V18) rank second and third, respectively, indicating that cost deviation identification and historical experience feedback play important roles in the network structure. The Cost deviation warning node connects Dynamic cost with Corrective action and is a key node through which cost monitoring is transformed into management response. The Historical cost database connects settlement audit, deviation causes, target cost, and supplier quotation, reflecting the supporting role of cost experience reuse in front-end decision-making.
Supplier quotation (V6), Contract price (V7), Target cost (V1), and Procurement BOQ (V5) also show relatively high comprehensive importance. This suggests that the procurement price formation chain and the target cost baseline chain are important components of EPC cost data transmission. If the transmission relationships among supplier quotation, contract price, procurement BOQ, and dynamic cost are unstable, the timeliness and accuracy of intelligent cost control will be weakened.
To examine whether the equal weighting of , , and affects the node ranking results, a weight sensitivity analysis is further conducted. Taking the equal-weight scenario S0 = (1/3, 1/3, 1/3) as the baseline, three additional scenarios are set: weighted degree-oriented scenario S1 = (0.50, 0.25, 0.25), betweenness-oriented scenario S2 = (0.25, 0.50, 0.25), and PageRank-oriented scenario S3 = (0.25, 0.25, 0.50). The node rankings under different weight combinations are compared, and the Spearman rank correlation coefficient is used to measure the consistency between each scenario and the baseline scenario. The results are shown in Table 6.
Table 6.
Sensitivity analysis of node importance weighting.
Table 6 shows that Dynamic cost (V13) remains the highest-ranked node under all four weight combinations. Cost deviation warning (V16) and Historical cost database (V18) consistently remain among the top three nodes, although their order changes in some scenarios. Moreover, the Spearman rank correlation coefficients between the alternative scenarios and the equal-weight baseline are all greater than 0.98. This indicates that the node importance ranking is not sensitive to changes in , , and . Therefore, the critical node identification results obtained under the equal-weight combination are relatively stable.
4.3. Critical Node Failure Simulation
To further examine the node importance results, each of the 18 nodes is removed individually in the failure simulation. In each simulation, one node and its associated edges are removed, and network efficiency is recalculated. A higher network efficiency loss rate after node failure indicates a greater impact of that node on the cost data transmission network. The simulation results are shown in Table 7.
Table 7.
Critical node failure simulation results.
Table 7 shows that the failure of Historical cost database (V18) leads to the largest network efficiency loss, reaching 45.27%. The failure of Dynamic cost (V13) results in a loss rate of 44.54%, while the failure of Cost deviation warning (V16) leads to a loss rate of 37.43%. Compared with the comprehensive node importance ranking in Table 5, the three nodes are all within the critical node set, but their exact rankings differ. Dynamic cost (V13) ranks first in comprehensive node importance, whereas Historical cost database (V18) causes a slightly higher efficiency loss in the node failure simulation (Figure 3).
Figure 3.
Ranking of critical node failure impacts.
This difference does not imply a contradiction between node importance analysis and failure simulation. Rather, it reflects the different emphases of the two types of metrics. Comprehensive node importance is constructed from weighted degree centrality, betweenness centrality, and PageRank, and mainly reflects a node’s structural centrality in terms of network connection, intermediary transmission, and global influence. Dynamic cost (V13) has the highest comprehensive importance because it aggregates multiple types of data, including contract price, design change, progress measurement, resource consumption, variation orders, and claim events, while also connecting to the cost deviation warning node. It is therefore the core hub through which process data aggregation is transformed into management response.
Node failure simulation measures the marginal impact of removing a node on the overall reachability and transmission efficiency of the directed network. For a directed network, network efficiency is affected not only by path length but also by whether node pairs remain reachable. Although Historical cost database (V18) has a lower comprehensive importance than Dynamic cost (V13), it has a high betweenness centrality and occupies a critical position in the feedback links. This node receives settlement audit and cost deviation warning data, and transmits historical experience back to target cost preparation and supplier quotation judgment through V18 → V1 and V18 → V6. When V18 is removed, settlement differences, deviation causes, and historical price information cannot effectively flow back to front-end cost decision nodes. The feedback loop is interrupted, and some directed transmission paths from back-end nodes to front-end decision nodes become unreachable, resulting in an efficiency loss slightly higher than that caused by the failure of V13.
Therefore, V13 functions more as a process-data convergence hub, whereas V18 functions more as a feedback-loop closure hub. The former is more prominent in the comprehensive centrality ranking, while the latter is more sensitive in terms of efficiency loss after node removal. These results indicate that the critical nodes in the EPC cost data transmission network include not only the dynamic cost node that aggregates multi-source data but also the historical cost database that maintains feedback closure and experience reuse. Node centrality analysis and node failure simulation are therefore not simple repeated validations; instead, they identify critical nodes from two complementary perspectives: structural centrality and failure impact.
4.4. Monte Carlo Edge-Weight Perturbation Simulation
In actual EPC project operation, cost data transmission relationships may be affected by system interface stability, data entry timeliness, interdepartmental coordination efficiency, and data quality fluctuations. To analyze the impact of general transmission reliability fluctuations on network efficiency, this study uses Monte Carlo simulation to randomly perturb network edge weights. Since the edge weights in this study are restricted to the interval [0, 1], interval clipping is applied after perturbation. If the perturbed edge weight is greater than 1, it is set to 1; if it is less than 0, it is set to 0, ensuring that the parameter settings remain consistent with the network definition.
The perturbation amplitudes are set to ±10%, ±20%, and ±30%, representing low, medium, and high levels of cost data transmission strength fluctuation, respectively. Under each perturbation scenario, 1000 independent simulations are conducted, and network efficiency is calculated using the fixed original node size. It should be noted that edge-weight perturbation simulation mainly represents random fluctuations in data transmission strength under the baseline network scenario, rather than complete interruption of key data links.
To verify the rationality of the simulation times, the ±30% perturbation scenario is used as an example to test the convergence of the cumulative mean network efficiency as the number of simulations increases. The result is shown in Figure 4. At the beginning of the simulation, the cumulative mean fluctuates due to the small sample size. As the number of simulations increases, the cumulative mean gradually stabilizes and converges to approximately 0.1831 near 1000 simulations. The cumulative mean of the last 10 simulations fluctuates only within the range of 0.183115–0.183144, indicating that 1000 simulations are sufficient for stable results. Therefore, 1000 repeated samples are used in the subsequent Monte Carlo simulations.
Figure 4.
Convergence test of the Monte Carlo simulation.
After confirming the rationality of the simulation times, the distribution characteristics of network efficiency under different perturbation amplitudes are further analyzed. The results are shown in Table 8 and Figure 5.
Table 8.
Monte Carlo edge-weight perturbation simulation results.
Figure 5.
Network efficiency distribution under edge-weight perturbation.
As shown in Table 8 and Figure 5, the orange horizontal lines, green triangles, and circles in the boxplots denote the median values, mean values, and outliers, respectively. As the edge-weight perturbation amplitude increases from ±10% to ±30%, the fluctuation range of network efficiency gradually expands, and the standard deviation increases from 0.0023 to 0.0068. This indicates that stronger transmission reliability fluctuations increase uncertainty in network operation. In terms of mean network efficiency, the efficiency loss under all three perturbation scenarios remains small, with average efficiency loss rates of 0.0735%, 0.4557%, and 1.4311%, respectively.
These results show that, under the baseline network scenario constructed in this study, the overall network remains relatively stable when cost data transmission relationships experience only limited random fluctuations. This is related to the presence of multiple parallel transmission paths in the network. For example, contract price, progress measurement, resource consumption, variation orders, and claim events can all enter the Dynamic cost node from different directions. Therefore, the fluctuation of a single edge weight does not immediately lead to a significant reduction in overall transmission efficiency. However, as the perturbation amplitude increases, the distribution range in the boxplot widens markedly, indicating that continuous fluctuations in transmission reliability still increase uncertainty in network operation.
4.5. Random Edge Failure Simulation
Edge-weight perturbation mainly reflects continuous fluctuations in data transmission strength, whereas more severe data link interruptions may occur in actual EPC projects. For example, system interfaces may not be connected, approval processes may be interrupted, on-site data may not be uploaded in time, variation orders may not enter the dynamic cost module, or settlement differences may not be accumulated in the historical cost database. All these situations may cause some data transmission edges to fail directly. To simulate such scenarios, this study further conducts random edge failure simulation.
The edge failure probabilities are set to 5%, 10%, and 20%, representing mild, moderate, and relatively high levels of data link interruption, respectively. Specifically, 5% indicates occasional failures of a small number of interface or process links, 10% indicates unstable transmission of some data links during multi-system collaboration, and 20% indicates more serious data breakpoints or cross-departmental coordination failures. It should be noted that these probabilities are mainly used to compare changes in network efficiency under different failure intensities and do not directly correspond to the actual link failure rate of a specific EPC project.
Under each edge failure probability, 1000 Monte Carlo simulations are conducted. In each simulation, each edge fails randomly according to the given probability. If an edge fails, its weight is reset to 0 and the corresponding data transmission link is regarded as interrupted. If the edge does not fail, its original weight is retained. The random edge failure simulation results are shown in Table 9 and Figure 6.
Table 9.
Random edge failure simulation results.
Figure 6.
Network efficiency distribution under random edge failure.
Table 9 and Figure 6 show that random edge failure has a much stronger impact on network efficiency than general edge-weight perturbation. When the edge failure probability is 5%, the average network efficiency loss rate already reaches 10.5418%. When the edge failure probability increases to 20%, the average network efficiency loss rate rises to 37.3045%. This suggests that data link interruption can significantly weaken the overall transmission efficiency of the EPC cost data transmission network constructed in this study.
Figure 6 further shows that as the edge failure probability increases, the distribution range of network efficiency gradually expands and low-efficiency scenarios become more frequent. In the boxplots, the orange horizontal lines, green triangles, and circles denote the median values, mean values, and outliers, respectively. This indicates that when system interfaces, business processes, or cross-departmental coordination relationships are interrupted, cost data may not be effectively transmitted to critical nodes such as Dynamic cost, Cost deviation warning, Settlement audit, or Historical cost database, thereby affecting the overall function of the cost data transmission network.
4.6. Feedback Enhancement Scenario Analysis
The node importance analysis and failure simulation results indicate that Dynamic cost, Cost deviation warning, and Historical cost database are the critical nodes in the network. Based on this result, this study sets up a feedback enhancement scenario according to the rules shown in Table 4. The scenario focuses on increasing the transmission weights of links related to dynamic cost warning, corrective feedback, settlement experience accumulation, and historical experience reuse, and then compares network efficiency before and after feedback enhancement. The results are shown in Table 10 and Figure 7.
Table 10.
Network efficiency comparison under the feedback enhancement scenario.
Figure 7.
Comparison of network efficiency before and after feedback enhancement.
Table 10 and Figure 7 show that, after feedback enhancement, the baseline network efficiency increases from 0.1858 to 0.2009, corresponding to an improvement rate of 8.13%. Under random edge failure conditions, the mean efficiency of the feedback-enhanced network is consistently higher than that of the baseline network. When the edge failure probabilities are 5%, 10%, and 20%, the efficiency improvement rates are 8.0252%, 7.8734%, and 7.6207%, respectively.
These results indicate that, in the network scenario constructed in this study, strengthening the feedback loop of “Dynamic cost–Cost deviation warning–Corrective action–Dynamic cost” and the experience reuse link of “Settlement audit/Cost deviation warning–Historical cost database–Target cost/Supplier quotation” can improve the overall efficiency and disturbance resistance of the cost data transmission network. In other words, improving cost data transmission capability in EPC projects depends not only on front-end data collection and process data aggregation, but also on whether cost deviations can trigger timely management responses and whether historical experience can provide reverse support for subsequent cost decisions.
4.7. Comparative Analysis of Feedback Enhancement
To further examine the effect of feedback-link enhancement, this study compared the feedback enhancement scenario with two reference enhancement scenarios: forward-link enhancement and random seven-edge enhancement. In the forward-link enhancement scenario, seven main forward transmission links were strengthened using the same average weight increment as the feedback enhancement scenario. In the random seven-edge enhancement scenario, seven directed edges were randomly selected and strengthened, and the simulation was repeated 1000 times. The comparison results are shown in Table 11.
Table 11.
Comparison of feedback enhancement and reference enhancement scenarios.
As shown in Table 11, feedback-link enhancement increased network efficiency from 0.1858 to 0.2009, corresponding to an improvement rate of 8.13%. By comparison, forward-link enhancement increased network efficiency to 0.1959, with an improvement rate of 5.47%, while random seven-edge enhancement produced an average network efficiency of 0.1950, with an improvement rate of 4.96%. Under the 10% random edge failure scenario, the feedback-enhanced network also retained the highest average efficiency among the three enhancement scenarios.
These results indicate that the improvement produced by feedback enhancement is not only a result of increasing several edge weights. Strengthening the links related to cost deviation warning, corrective action feedback, settlement experience accumulation, and historical cost reuse produces a stronger improvement in network-efficiency resilience because these links connect cost monitoring, management response, cost updating, and subsequent decision support.
4.8. Robustness Analysis Under Random Failure and Targeted Attack
To further analyze the overall robustness of the EPC project cost data transmission network against node failures, this study sets up two node removal scenarios: random failure and targeted attack. In the random failure scenario, nodes are removed successively in random order in each simulation. The simulation is repeated 1000 times, and the mean network efficiency is taken as the result. In the targeted attack scenario, nodes are removed successively in descending order of comprehensive node importance, and the relative network efficiency after each removal step is calculated. Relative network efficiency is defined as the ratio of the network efficiency after node removal to the baseline network efficiency, and is used to reflect the functional retention capability of the network during continuous node failure.
Figure 8 shows that, as the node removal ratio increases, relative network efficiency decreases under both scenarios, but the rate of decline differs significantly. Under random failure, network efficiency declines more gradually, and the network can still maintain a certain transmission capability when the node removal ratio is low. By contrast, network efficiency decreases faster under targeted attack, especially after high-importance nodes such as Dynamic cost (V13), Cost deviation warning (V16), and Historical cost database (V18) are removed first.
Figure 8.
Network robustness under random failure and targeted attack.
This result suggests that the EPC project cost data transmission network constructed in this study has a certain degree of robustness against random node failures, but is more sensitive to critical node failures. This broadly aligns with the node importance ranking and the critical node failure simulation. Nodes such as Dynamic cost, Cost deviation warning, and Historical cost database not only occupy important positions in the network structure, but also strongly affect the overall transmission capability of the network. Once these nodes fail successively, the transmission paths among procurement, construction, variation, settlement, and feedback reuse are rapidly weakened.
From a management perspective, improving the resilience of the EPC project cost data transmission network should give priority to ensuring the stable operation of critical nodes, rather than relying only on general data redundancy. For nodes such as Dynamic cost, Cost deviation warning, Corrective action, and Historical cost database, higher safeguards should be established in terms of system interfaces, data updates, responsibility allocation, and feedback mechanisms to reduce the impact of critical node failure on the overall cost data transmission network.
4.9. Critical-Node Failure–Recovery Resilience Analysis
The preceding node failure and targeted attack simulations mainly reflect the functional decline of the network under disturbance conditions. To further capture the recovery capability of the cost data transmission network after critical node failure, this study sets up a critical-node failure–recovery scenario. Based on the node importance analysis results, Dynamic cost (V13), Cost deviation warning (V16), and Historical cost database (V18) are selected as the critical failure nodes. In the failure stage, these nodes are removed successively. In the recovery stage, the removed nodes and their associated edges are restored successively, and changes in network efficiency are calculated at each stage.
For comparison, relative network efficiency is used to represent the degree of network functional retention and recovery, namely the ratio of network efficiency at each stage to the baseline network efficiency. The critical-node failure–recovery simulation results are shown in Table 12 and Figure 9.
Table 12.
Critical-node failure–recovery simulation results.
Figure 9.
Critical-node failure–recovery resilience curve.
As shown in Table 12 and Figure 9, as V13, V16, and V18 fail successively, the relative network efficiency decreases from 1.0000 to 0.2764, and the efficiency loss rate reaches 72.36%. This indicates that the successive failure of Dynamic cost, Cost deviation warning, and Historical cost database can significantly weaken the overall function of the cost data transmission network. In particular, the removal of V13 causes a sharp decline in network efficiency, confirming the core role of Dynamic cost in cost data convergence and state transformation.
During the recovery stage, network efficiency increases continuously as the critical nodes are gradually restored. After V13 is restored, the relative network efficiency rises from 0.2764 to 0.3946. After V16 is further restored, the relative network efficiency increases to 0.5473. When V18 is finally restored, network efficiency returns to the baseline level. These results indicate that the restoration of critical nodes can effectively promote the recovery of cost data transmission network function, and that the restoration of Historical cost database is particularly important for the integrity of the network feedback loop.
From a resilience perspective, the EPC project cost data transmission network shows a clear functional decline under critical-node shocks, but its function can gradually recover after the critical nodes and their associated data links are restored. In Figure 9, the dashed horizontal line represents the baseline relative network efficiency level, where the relative network efficiency equals 1.0. Therefore, improving the resilience of the cost data transmission network requires attention not only to robustness before critical node failure, but also to the construction of post-failure recovery mechanisms, including the recovery of the Dynamic cost module, Cost deviation warning, Historical cost database, and the rapid reconstruction of related data interfaces and feedback links.
4.10. Stability Verification of Critical-Node Identification
To examine the stability of the critical-node identification results, robustness checks were conducted under alternative network assumptions. The baseline weighted network was compared with an unweighted network and two alternative distance transformation methods. The results are shown in Table 13.
Table 13.
Robustness checks under alternative network assumptions.
As shown in Table 13, Dynamic cost (V13), Cost deviation warning (V16), and Historical cost database (V18) remained the top three nodes in the comprehensive importance ranking under all alternative assumptions. The node failure impact ranking was also generally stable. Historical cost database (V18), Dynamic cost (V13), and Cost deviation warning (V16) remained the three most influential nodes under the baseline weighted network, the unweighted network, and the distance transformation. Under the transformation, the order of V13 and V18 changed, but the same three nodes remained dominant.
These results indicate that the identification of the key nodes is not highly sensitive to the specific edge-weight or distance-transformation assumptions. Therefore, the conclusion that Dynamic cost, Cost deviation warning, and Historical cost database are the critical nodes of the EPC cost-data transmission network is relatively stable within the proposed network structure.
4.11. Comprehensive Analysis of Results
The simulation and analysis results show that the EPC project cost data transmission network exhibits strong critical-node dependence, sensitivity to link interruption, and feedback recovery characteristics.
The node importance analysis and critical node failure simulation support each other in identifying the critical node set, although their specific rankings are not fully consistent. Dynamic cost (V13), Cost deviation warning (V16), and Historical cost database (V18) rank high in the comprehensive node importance results and also cause considerable network efficiency losses in the node failure simulation. This indicates that dynamic cost convergence, cost deviation warning, and historical experience reuse are core elements for maintaining the continuity of EPC cost data transmission. Dynamic cost (V13) has the highest comprehensive importance, mainly reflecting its structural centrality in multi-source cost data convergence and process state transformation. Historical cost database (V18) causes the largest efficiency loss in the node failure simulation, which is related to the feedback loop connecting back-end settlement differences and deviation causes with front-end target cost and procurement quotation. This also shows that comprehensive node importance and node failure simulation emphasize different aspects: the former focuses on structural centrality, whereas the latter reflects the destructive impact of node failure. Together, they provide complementary evidence for identifying critical nodes.
The edge-weight perturbation simulation and random edge failure simulation reveal different network responses under two types of disturbance. Edge-weight perturbation mainly represents continuous fluctuations in data transmission strength. Under ±10%, ±20%, and ±30% perturbations, the average efficiency loss remains small, indicating that the baseline network maintains a certain degree of stability under general transmission strength fluctuations. Random edge failure corresponds to direct interruption of data links. As the edge failure probability increases, network efficiency decreases markedly, suggesting that system interface interruption, business process breakpoints, or cross-departmental data link failures exert a more direct impact on cost data transmission.
The comparison between random failure and targeted attack indicates that the network has a certain level of robustness against random node failures but is more sensitive to successive failures of high-importance nodes. Under the random failure scenario, network efficiency declines gradually as the node removal ratio increases. Under the targeted attack scenario, network efficiency declines more rapidly because nodes with high comprehensive importance are removed first. This indicates that nodes in the EPC project cost data transmission network do not play equivalent roles, and the stable operation of critical nodes is essential for maintaining network function.
The feedback enhancement scenario and critical-node failure–recovery simulation further reveal that network performance depends not only on functional retention after disturbance, but also on the recovery capability of feedback links and critical nodes. After feedback enhancement, network efficiency improves both in the baseline state and under random edge failure conditions, indicating that strengthening dynamic cost warning, corrective feedback, and historical experience reuse links can improve the network’s disturbance resistance. The critical-node failure–recovery simulation shows that when Dynamic cost (V13), Cost deviation warning (V16), and Historical cost database (V18) fail successively, relative network efficiency decreases sharply. As the critical nodes are gradually restored, network efficiency continuously recovers and eventually returns to the baseline level. Therefore, improving the resilience of the EPC cost data transmission network requires attention not only to robustness before critical node failure, but also to node restoration, data interface reconstruction, and feedback link repair after failure.
5. Discussion
The simulation results in Section 4 show that the EPC project cost data transmission network is highly sensitive to critical nodes and feedback links. In the node importance analysis, Dynamic cost (V13), Cost deviation warning (V16), and Historical cost database (V18) are the three nodes with the highest comprehensive importance. In the node failure simulation, the failure of these nodes also leads to a marked decrease in network efficiency. The Monte Carlo simulation results indicate that general edge-weight perturbations have a relatively limited impact on network efficiency, whereas random edge failures substantially weaken network transmission efficiency. The comparison between random failure and targeted attack further shows that the network has a certain tolerance to random node failures but is more sensitive to successive failures of high-importance nodes. The feedback enhancement scenario confirms a basic finding: under the network setting constructed in this study, strengthening dynamic cost warning, corrective feedback, and historical experience reuse links can improve both network efficiency and disturbance resistance.
5.1. Management Implications of Critical Nodes
The results show that Dynamic cost (V13), Cost deviation warning (V16), and Historical cost database (V18) are the most critical nodes in the EPC cost-data transmission network. These nodes correspond to three key management functions: process cost aggregation, deviation response, and knowledge feedback. Strengthening these nodes can improve the continuity and resilience of EPC cost-data transmission.
First, Dynamic cost (V13) should be protected as the core aggregation node of process cost information. In EPC project management, contract price, design changes, progress measurement, resource consumption, variation orders, and claim events should be transmitted to the dynamic cost module in a timely and standardized manner. Managers can improve this node by establishing a unified dynamic cost ledger, defining standard data interfaces among procurement, contract, construction, and payment systems, and setting clear responsibilities for cost-data submission and review. When BIM/5D BIM or cost-management platforms are used, dynamic cost updating should be linked with progress measurement, procurement price changes, variation confirmation, and payment review so that the cost status can reflect the actual project process.
Second, Cost deviation warning (V16) should be strengthened as the key node that transforms cost monitoring into management response. A cost deviation warning mechanism should include warning thresholds, deviation classification, responsibility tracing, response deadlines, and closed-loop tracking. For example, deviations caused by design changes, procurement price increases, resource overconsumption, variation orders, or claims should be classified separately, and each type of deviation should trigger corresponding corrective procedures. The warning results should not remain only as statistical reports; they should be connected with corrective actions, dynamic cost updating, and historical experience accumulation.
Third, Historical cost database (V18) should be developed as the knowledge feedback node for subsequent cost decision-making. Settlement differences, procurement prices, variation causes, claim events, warning records, and corrective-action results should be systematically stored and coded. These data can support target cost preparation, procurement price judgement, design cost control, and risk identification in later projects. To improve the usefulness of this node, managers should establish standard data categories, update rules, and retrieval mechanisms for historical cost information. The historical database should also be connected with target cost preparation and procurement quotation analysis, so that experience from completed projects can be reused in front-end cost decisions.
Overall, the management implication of the critical-node analysis is that EPC cost control should not focus only on front-end budgeting or final settlement. Greater attention should be paid to the continuity among process cost aggregation, deviation warning, corrective feedback, and historical experience reuse. By protecting Dynamic cost, improving Cost deviation warning, and strengthening the Historical cost database, EPC project organizations can improve the structural resilience of cost-data transmission and support more effective intelligent cost control.
5.2. Differences Between Edge-Weight Perturbation and Edge Failure
The Monte Carlo edge-weight perturbation simulation shows that when edge weights fluctuate randomly within ±10%, ±20%, and ±30%, the average network efficiency loss rates are only 0.0735%, 0.4557%, and 1.4311%, respectively. This indicates that the EPC cost data transmission network remains relatively stable under general fluctuations in transmission reliability. One reason is that the network contains multiple parallel data transmission paths. Construction, procurement, variation, and settlement data can enter Dynamic cost or Settlement audit through different edges. Therefore, fluctuations in edge weights alone do not immediately cause structural breaks in the network.
The random edge failure results are clearly different. When the edge failure probabilities are 5%, 10%, and 20%, the average network efficiency loss rates reach 10.5418%, 21.0783%, and 37.3045%, respectively. Compared with slight fluctuations in data transmission strength, data link interruption has a more direct destructive effect on the cost data transmission network. In EPC projects, unconnected system interfaces, broken approval processes, failure to upload on-site data, variation orders not entering the dynamic cost module, or settlement data not being accumulated in the historical cost database may all cause certain network edges to fail, thereby significantly reducing overall transmission efficiency.
This difference suggests that intelligent EPC cost control should not remain limited to improving data quality at individual nodes or local transmission efficiency. More importantly, it should ensure the continuous operation of key data links. As long as the main links remain connected, the network can tolerate general data fluctuations to some extent. Once key links are interrupted, however, network efficiency declines quickly. The completeness of data interfaces, business processes, and feedback mechanisms therefore directly affects the resilience of EPC project cost data transmission.
5.3. Role of Feedback Enhancement in Network Resilience
The feedback enhancement scenario shows that after increasing the weights of links related to dynamic cost warning, corrective feedback, settlement experience accumulation, and historical experience reuse, the baseline network efficiency increases from 0.1858 to 0.2009, with an improvement rate of 8.13%. Under random edge failure conditions, the mean efficiency of the feedback-enhanced network is also consistently higher than that of the baseline network. When the edge failure probabilities are 5%, 10%, and 20%, the efficiency of the enhanced network increases by 8.0252%, 7.8734%, and 7.6207%, respectively. This indicates that feedback link enhancement can improve network efficiency under normal conditions and also strengthen network resilience under disturbance conditions.
From the perspective of business logic, feedback enhancement mainly affects two types of links. The first type is the dynamic control feedback link, namely V13 → V16 → V17 → V13. This link corresponds to the closed loop among Dynamic cost, Cost deviation warning, Corrective action, and cost status updating. If this link is weak, cost deviations may be detected but cannot be quickly transformed into corrective actions and fed back into the dynamic cost control process. The second type is the experience reuse feedback link, including V15 → V18, V16 → V18, V18 → V1, and V18 → V6. This link represents the reverse support of settlement differences, deviation causes, and historical price experience for target cost preparation and procurement quotation judgment.
The feedback enhancement scenario indicates that the optimization focus of the EPC project cost data transmission network should shift from simple data reporting to feedback-loop reinforcement. If cost data only flow from front-end activities to back-end records without returning to target cost preparation, procurement quotation, and corrective management, their management value will be limited. By strengthening dynamic cost warning, corrective action implementation, and historical experience reuse, cost data can form a continuous correction mechanism during project implementation, thereby improving overall network resilience.
5.4. Implications for Intelligent EPC Cost Control
The results provide three implications for intelligent cost control in EPC projects.
(1) Cost data governance should shift from platform module construction to network link governance. Information system development in EPC projects often emphasizes the functions of individual systems, such as BIM platforms, procurement systems, cost management systems, or payment settlement systems. However, the results in Section 4 show that the key factor affecting cost data transmission efficiency is not simply whether a particular system exists. Instead, it lies in whether continuous links are formed among target cost, quantities, procurement bills of quantities, contract prices, dynamic cost, deviation warning, settlement audit, and historical cost database. Intelligent cost control should therefore focus on data connections across systems, departments, and project stages.
(2) The aggregation and warning functions of the Dynamic cost node should be strengthened. Dynamic cost is the convergence node for multiple types of cost data, including procurement, construction, variations, and claims, and it also provides the basis for cost deviation warning. If dynamic cost data are incomplete, delayed, or cannot be compared with target cost, subsequent warning and correction will lose their foundation. EPC projects should therefore integrate procurement prices, contract prices, progress measurement, resource consumption, variation orders, and claim events into the dynamic cost management process, so that cost data are not scattered across different departments or systems.
(3) The feedback value of the Historical cost database should be emphasized. Historical cost data are not merely archival materials after project completion; they are important references for subsequent target cost preparation, procurement price judgment, risk identification, and scheme optimization. The node failure simulation shows that the failure of the Historical cost database significantly reduces network efficiency, indicating that the experience reuse link plays a critical role in cost data transmission. From the perspective of the simulated network, EPC project teams may benefit from the structured accumulation of procurement prices, variation causes, disputes over site instructions, claim events, settlement differences, and corrective effects, so that these data can provide reverse support for future cost decisions.
5.5. Method Applicability and Limitations
The proposed network model provides a structured way to analyse the resilience of EPC project cost-data transmission from the perspective of network efficiency. It is applicable to EPC projects in which cost data are generated and updated across multiple stages, including target cost preparation, design budgeting, procurement pricing, contract formation, construction progress measurement, variation and claim management, dynamic cost monitoring, payment settlement, and historical cost reuse. In such projects, the model can help managers identify critical cost-data nodes, vulnerable transmission relationships, and feedback links that should receive priority attention.
The applicability of the model is affected by several project and organizational conditions. EPC projects differ in project scale, contract arrangement, owner involvement, digital maturity, BIM or 5D BIM adoption, platform integration, and the standardization of cost-management procedures. These factors may change both the network structure and edge weights. For example, projects with highly integrated cost-management platforms may have stronger links between progress measurement, dynamic cost, and payment settlement, while projects with weak historical data management may have lower feedback strength from settlement audit and deviation warning to the historical cost database. Therefore, the network structure and edge weights should be adjusted when the model is applied to specific EPC projects.
Several limitations should also be noted. First, the network structure and edge weights in this study are derived from EPC cost-management logic and expert scoring. Although the expert panel covered owner-side cost control, cost consulting, design cost estimation, construction contract management, procurement, digital engineering, and academic research, the model has not yet been calibrated using large-scale project-log data. Future studies can integrate BIM/5D BIM records, procurement system data, cost-management platform logs, progress payment records, variation and claim documents, and settlement audit data to validate and refine the network.
Second, the disturbance parameters used in the simulations are scenario settings for comparative analysis. Edge-weight perturbation amplitudes and random edge failure probabilities are used to represent different levels of transmission uncertainty and link interruption, rather than measured failure rates from a specific EPC project. Future empirical studies can estimate these parameters from actual data transmission delays, missing records, interface failures, approval delays, and data-quality problems in project management systems.
Third, the failure–recovery simulation represents an idealized structural recovery process. In the simulation, failed nodes and their associated edges are restored to the baseline state. In practice, recovery may involve time delays, incomplete data restoration, partial recovery of system interfaces, additional coordination costs, and temporary loss of cost-control capability. Future research can extend the model by introducing recovery time, recovery cost, partial restoration, and dynamic data loss into the resilience assessment.
Overall, the proposed framework is most suitable for identifying structural vulnerabilities and feedback-improvement directions in EPC cost-data transmission within the constructed network and predefined simulation scenarios. The results should be interpreted as network-level evidence for cost-data transmission resilience. Future project-level validation using BIM/5D BIM records, procurement system data, cost-management platform logs, variation and claim records, progress payment records, and settlement audit data can further improve the empirical applicability of the framework.
6. Conclusions
This study developed a directed weighted network framework to analyse the resilience of EPC project cost-data transmission. Based on EPC cost-management logic and expert evaluation, 18 core nodes and 27 directed edges were identified to represent the main cost-data objects, management activities, and transmission relationships among target cost, design budgeting, quantity extraction, procurement pricing, contract pricing, construction process cost accumulation, dynamic cost monitoring, payment settlement, and historical cost experience reuse. Complex network analysis and Monte Carlo simulation were then used to examine critical nodes, disturbance response, feedback enhancement, and failure–recovery behaviour. The main conclusions are as follows.
First, EPC project cost-data transmission shows clear network characteristics. Cost data are transmitted through multiple forward, convergent, and feedback paths rather than through a single linear process. The proposed network structure describes how front-end cost baselines, design and quantity data, procurement and contract prices, construction process data, payment settlement, deviation warning, corrective feedback, and historical experience reuse are connected. This network representation provides a basis for analysing the structural reachability and transmission efficiency of cost data across project stages and management activities.
Second, Dynamic cost (V13), Cost deviation warning (V16), and Historical cost database (V18) are the most critical nodes in the proposed EPC cost-data transmission network. Dynamic cost serves as the core aggregation node for contract price, design change, progress measurement, resource consumption, variation order, and claim data. Cost deviation warning connects cost monitoring with corrective response. Historical cost database links settlement audit, deviation causes, historical prices, target cost preparation, and procurement quotation judgement. The node failure simulation further shows that the failures of V18, V13, and V16 lead to network efficiency losses of 45.27%, 44.54%, and 37.43%, respectively. These results indicate that process cost aggregation, deviation warning, and experience feedback are key functions for maintaining the continuity of cost-data transmission.
Third, the simulation results show that link interruption has a stronger effect on network efficiency than general edge-weight fluctuation. Under edge-weight perturbation, the mean network efficiency remains close to the baseline level, even when the perturbation amplitude increases to ±30%. By contrast, random edge failure causes a more pronounced efficiency decline. When the edge failure probability increases from 5% to 20%, the average efficiency loss rate rises from 10.54% to 37.30%. This finding suggests that maintaining the continuity of key data transmission links is essential for preserving the functional performance of the cost-data transmission network.
Fourth, feedback-link enhancement improves the network-efficiency resilience of EPC cost-data transmission. Strengthening the links related to cost deviation warning, corrective action feedback, settlement experience accumulation, and historical cost reuse increases network efficiency from 0.1858 to 0.2009. The comparative enhancement analysis further shows that feedback-link enhancement produces a larger efficiency improvement than forward-link enhancement and random seven-edge enhancement. This result highlights the importance of closed-loop cost control, in which cost monitoring, deviation response, dynamic cost updating, and historical experience reuse are continuously connected.
Fifth, the critical-node failure–recovery simulation shows that successive failures of V13, V16, and V18 substantially weaken network function, while structural restoration of these nodes enables network efficiency to recover to the baseline level in the simulation. The robustness checks under alternative network assumptions further show that V13, V16, and V18 remain the dominant critical nodes under an unweighted network and alternative distance transformation methods. These results support the stability of the critical-node identification results within the proposed network structure.
The findings provide managerial implications for intelligent EPC cost control. EPC project organizations should protect the Dynamic cost node by improving process cost aggregation, strengthen the Cost deviation warning node by establishing threshold-based and responsibility-based response mechanisms, and develop the Historical cost database as a feedback node for target cost preparation and procurement price judgement. Future research can further validate and refine the proposed network by using BIM/5D BIM records, procurement system data, cost-management platform logs, payment records, variation and claim documents, and settlement audit data from actual EPC projects.
These conclusions are bounded by the constructed network structure and predefined simulation scenarios. The results indicate which nodes and links are more important from a network-efficiency perspective, and they suggest that strengthening feedback-oriented transmission relationships may improve the functional retention and recovery capacity of EPC cost-data transmission systems. In future applications, the proposed framework can be further calibrated and tested using project-level digital cost-management data to support more context-specific decision-making in EPC project cost control.
Author Contributions
Conceptualization and formal analysis, R.R. and J.F.; methodology and investigation, R.R. and J.F.; software, validation and visualization, R.R. and Y.Q.; resources and data curation, J.F. and R.R.; writing—original draft preparation, R.R.; writing—review and editing, J.F., R.R., Y.Q. and Y.S.; literature review, manuscript organization and reference checking, Y.S.; supervision and project administration, J.F. All authors have read and agreed to the published version of the manuscript.
Funding
This research received no external funding.
Data Availability Statement
The original contributions presented in the study are included in the article, further inquiries can be directed to the author.
Acknowledgments
The authors would like to thank the experts who provided professional judgments on EPC project cost management and data transmission relationships.
Conflicts of Interest
Author Ruijiang Ran was employed by the company Wuhan Chegu Construction Investment Co., Ltd., Author Yuge Qin was employed by the company Xiamen Ampace Technology Limited. The remaining authors declare that the research was conducted in the absence of any commercial or financial relationships that could be construed as a potential conflict of interest.
References
- Vigneault, M.A.; Boton, C.; Chong, H.Y.; Cooper-Cooke, B. An innovative framework of 5D BIM solutions for construction cost management: A systematic review. Arch. Comput. Methods Eng. 2020, 27, 1013–1030. [Google Scholar] [CrossRef] [Scilit]
- Fazeli, A.; Dashti, M.S.; Jalaei, F.; Khanzadi, M. An integrated BIM-based approach for cost estimation in construction projects. Eng. Constr. Archit. Manag. 2021, 28, 2828–2854. [Google Scholar] [CrossRef] [Scilit]
- Sepasgozar, S.M.E.; Costin, A.M.; Karimi, R.; Shirowzhan, S.; Abbasian, E.; Li, J. BIM and digital tools for state-of-the-art construction cost management. Buildings 2022, 12, 396. [Google Scholar] [CrossRef] [Scilit]
- Parsamehr, M.; Perera, U.S.; Dodanwala, T.C.; Perera, P.; Ruparathna, R. A review of construction management challenges and BIM-based solutions: Perspectives from the schedule, cost, quality, and safety management. Asian J. Civ. Eng. 2023, 24, 353–389. [Google Scholar] [CrossRef] [Scilit]
- Rashidi, A.; Chan, D.W.M.; Ravanshadnia, M.; Sarvari, H.; Tajaddini, A. Applying Building Information Modelling (BIM) technology in pre-tender cost estimation of construction projects: A case study in Iran. Buildings 2024, 14, 1260. [Google Scholar] [CrossRef] [Scilit]
- Pishdad, P.; Onungwa, I.O. Analysis of 5D BIM for cost estimation, cost control and payments. J. Inf. Technol. Constr. 2024, 29, 525–548. [Google Scholar] [CrossRef] [Scilit]
- Cassandro, J.; Mirarchi, C.; Pavan, A. A comprehensive literature review of 5D building information modelling using latent Dirichlet allocation analysis. Constr. Innov. 2025, 25, 331–357. [Google Scholar] [CrossRef] [Scilit]
- Opoku, D.G.J.; Perera, S.; Osei-Kyei, R.; Rashidi, M. Digital twin application in the construction industry: A literature review. J. Build. Eng. 2021, 40, 102726. [Google Scholar] [CrossRef] [Scilit]
- Pan, Y.; Zhang, L. A BIM-data mining integrated digital twin framework for advanced project management. Autom. Constr. 2021, 124, 103564. [Google Scholar] [CrossRef] [Scilit]
- Lee, D.; Lee, S.H.; Masoud, N.; Krishnan, M.S.; Li, V.C. Integrated digital twin and blockchain framework to support accountable information sharing in construction projects. Autom. Constr. 2021, 127, 103688. [Google Scholar] [CrossRef] [Scilit]
- Tuhaise, V.V.; Tah, J.H.M.; Abanda, F.H. Technologies for digital twin applications in construction. Autom. Constr. 2023, 152, 104931. [Google Scholar] [CrossRef] [Scilit]
- Hua, Y.; Kang, M.; Yao, H.; Fu, Y. How to Foster Project Organization Resilience in the Construction Industry: The Role of Data Governance Capabilities. Buildings 2025, 15, 1219. [Google Scholar] [CrossRef] [Scilit]
- Miranda, S.L.C.; Castillo, E.D.R.; Gonzalez, V.; Adafin, J. Predictive analytics for early-stage construction costs estimation. Buildings 2022, 12, 1043. [Google Scholar] [CrossRef] [Scilit]
- Ashtari, M.A.; Ansari, R.; Hassannayebi, E.; Jeong, J. Cost overrun risk assessment and prediction in construction projects: A Bayesian network classifier approach. Buildings 2022, 12, 1660. [Google Scholar] [CrossRef] [Scilit]
- Xie, W.; Deng, B.; Yin, Y.; Lv, X.; Deng, Z. Critical factors influencing cost overrun in construction projects: A fuzzy synthetic evaluation. Buildings 2022, 12, 2028. [Google Scholar] [CrossRef] [Scilit]
- Abdel-Monem, M.; Alshaer, K.T.; El-Dash, K. Assessing risk factors affecting the accuracy of conceptual cost estimation in the Middle East. Buildings 2022, 12, 950. [Google Scholar] [CrossRef] [Scilit]
- AlTalhoni, A.; Liu, H.; Abudayyeh, O. Forecasting construction cost indices: Methods, trends, and influential factors. Buildings 2024, 14, 3272. [Google Scholar] [CrossRef] [Scilit]
- da Mata, A.S. Complex networks: A mini-review. Braz. J. Phys. 2020, 50, 658–672. [Google Scholar] [CrossRef] [Scilit]
- Rai, K.A.; Machkour, M.; Antari, J. Influential nodes identification in complex networks: A comprehensive literature review. Beni-Suef Univ. J. Basic Appl. Sci. 2023, 12, 18. [Google Scholar] [CrossRef] [Scilit] [PubMed]
- Xi, Y.; Cui, X. Identifying influential nodes in complex networks based on information entropy and relationship strength. Entropy 2023, 25, 754. [Google Scholar] [CrossRef] [Scilit] [PubMed]
- Al Musawi, A.F.; Roy, S.; Ghosh, P. Examining indicators of complex network vulnerability across diverse attack scenarios. Sci. Rep. 2023, 13, 18208. [Google Scholar] [CrossRef] [Scilit] [PubMed]
- Liu, X.; Li, D.; Ma, M.; Szymanski, B.K.; Stanley, H.E.; Gao, J. Network resilience. Phys. Rep. 2022, 971, 1–108. [Google Scholar] [CrossRef] [Scilit]
- Qi, X.; Mei, G. Network resilience: Definitions, approaches, and applications. J. King Saud Univ. Comput. Inf. Sci. 2024, 36, 101882. [Google Scholar] [CrossRef] [Scilit]
- Artime, O.; Grassia, M.; De Domenico, M.; Gleeson, J.P.; Makse, H.A.; Mangioni, G.; Perc, M.; Radicchi, F. Robustness and resilience of complex networks. Nat. Rev. Phys. 2024, 6, 114–131. [Google Scholar] [CrossRef] [Scilit]
- Hu, M.; Nippala, E.; Kallioharju, K.; Pelsmakers, S. Monte Carlo simulation approach to understand the cost variance for energy retrofit projects: Comparative study of Finland and the United States. Constr. Manag. Econ. 2022, 40, 207–222. [Google Scholar] [CrossRef] [Scilit]
- Canesi, R.; Gabrielli, L.; Marella, G.; Ruggeri, A.G. Probabilistic risk assessment framework for cost overruns predictions in infrastructure projects using randomized simulations. Comput. Aided Civ. Infrastruct. Eng. 2025, 40, 4774–4796. [Google Scholar] [CrossRef] [Scilit]
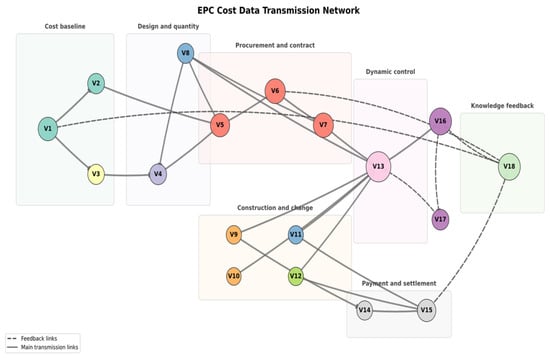
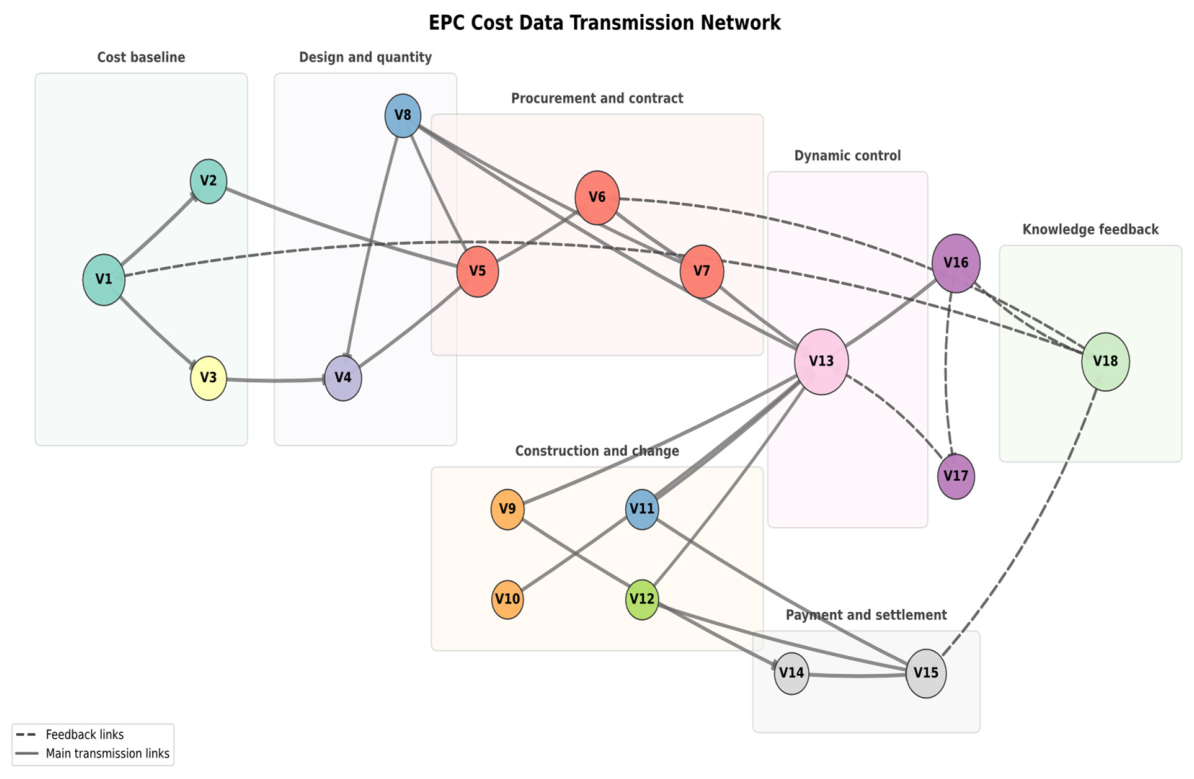
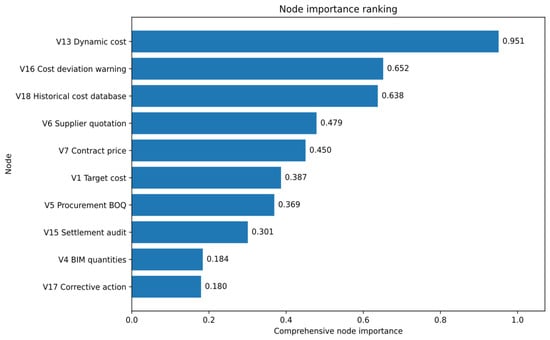
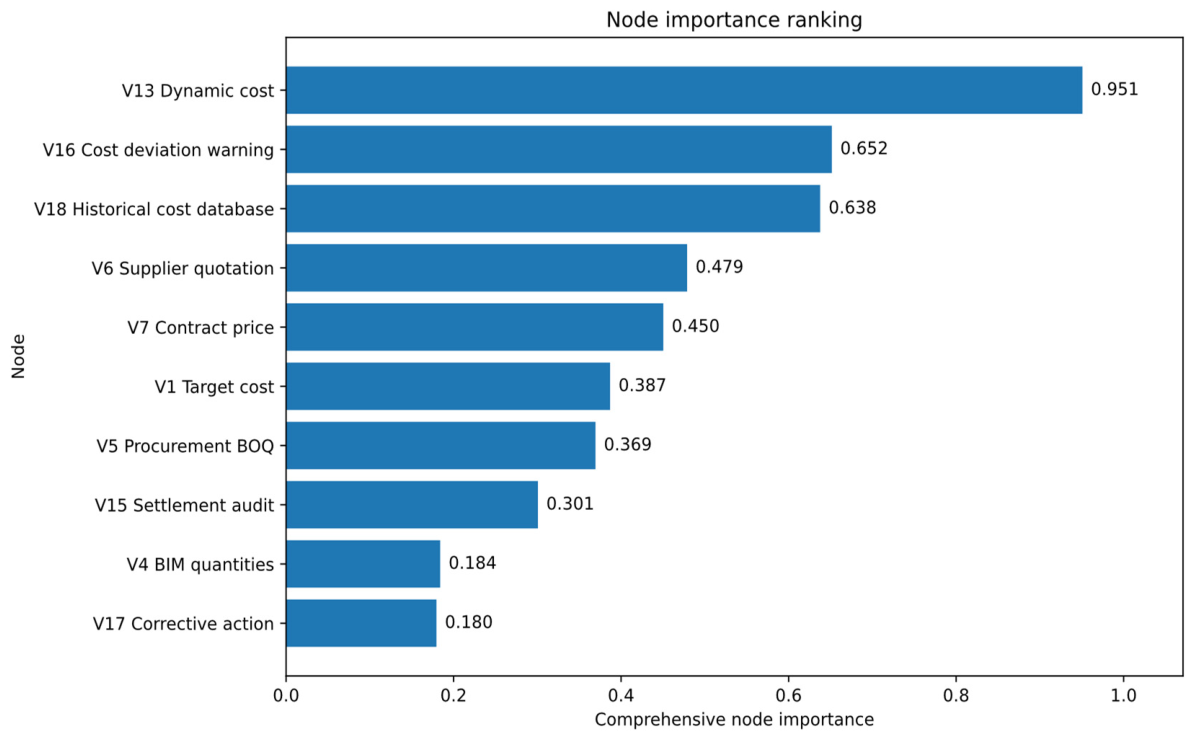
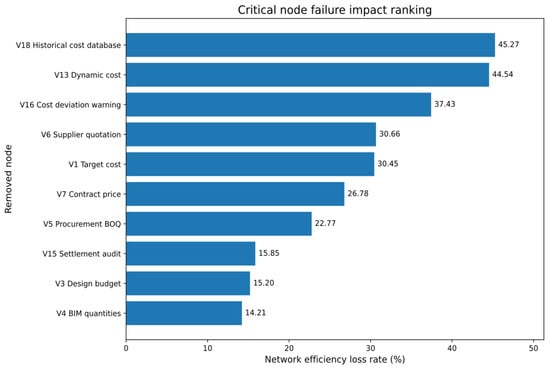
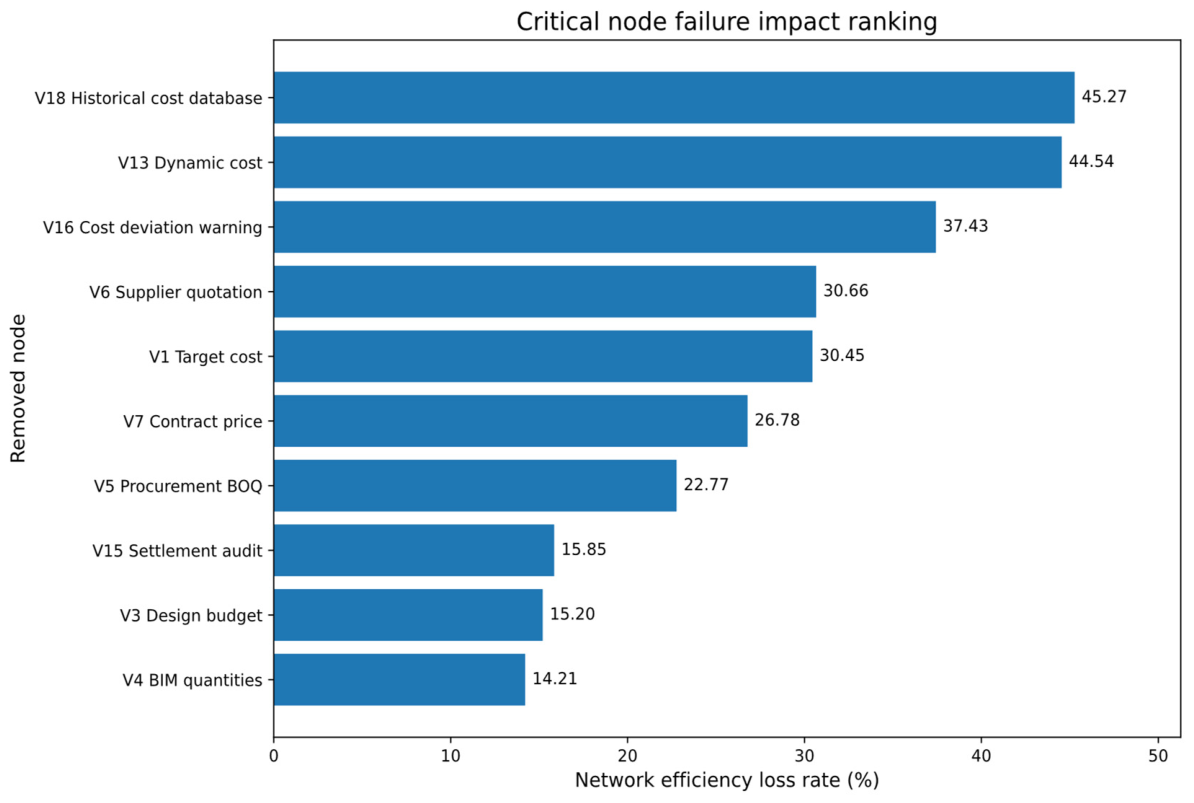
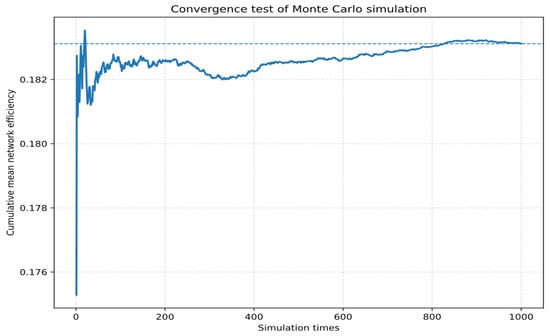
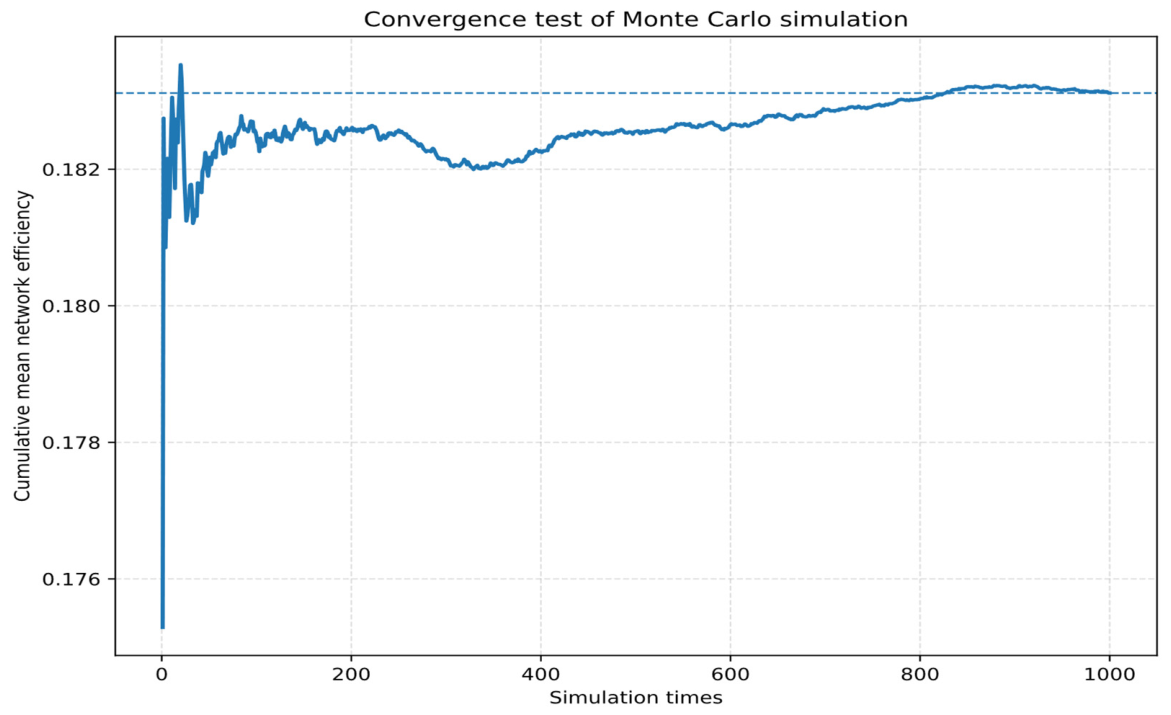
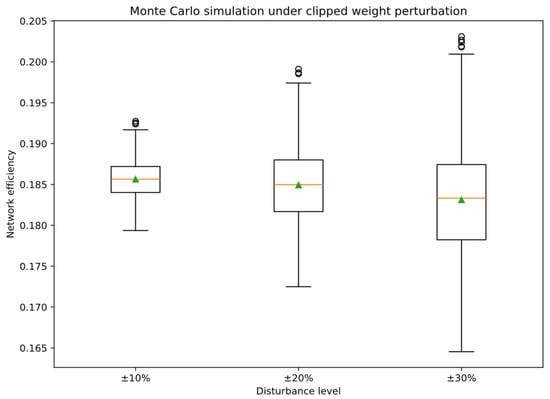
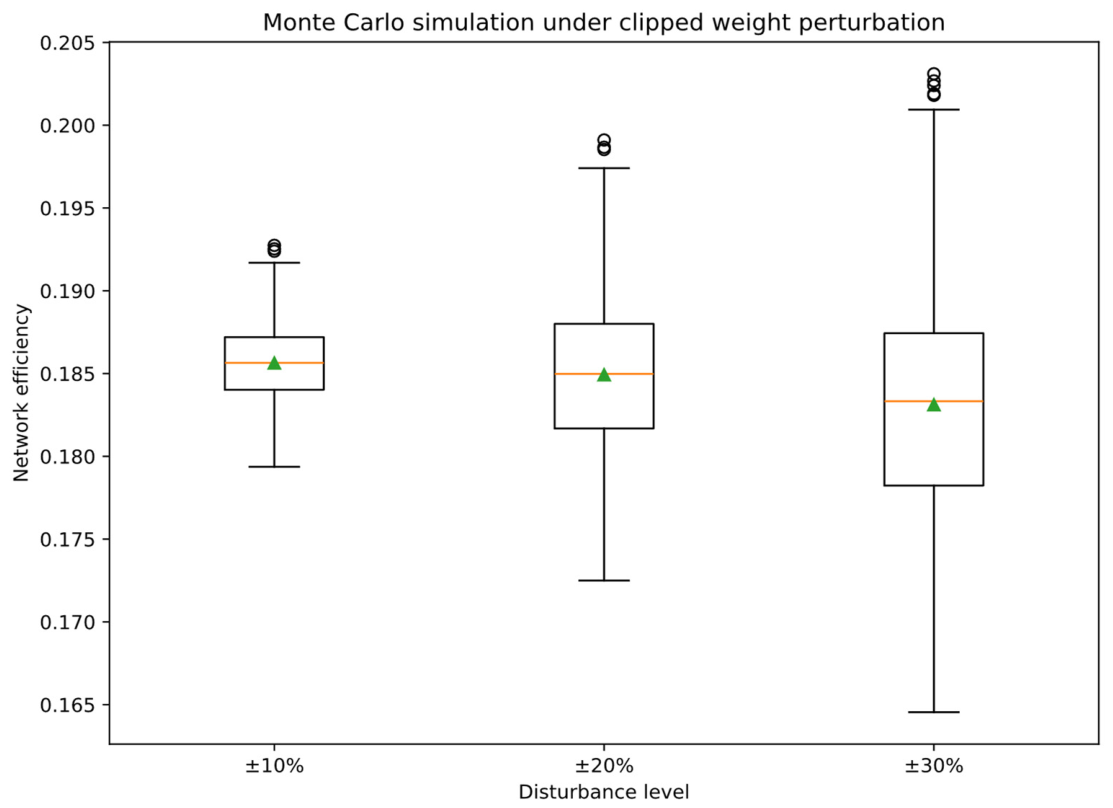
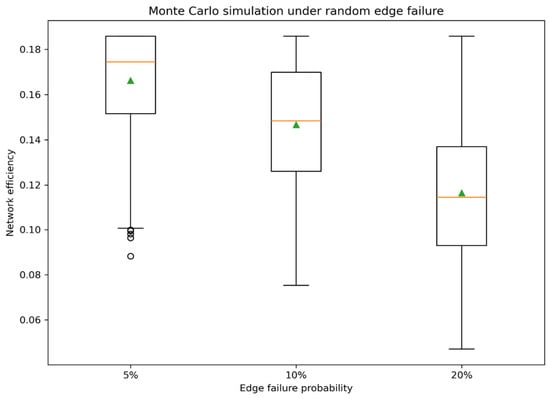
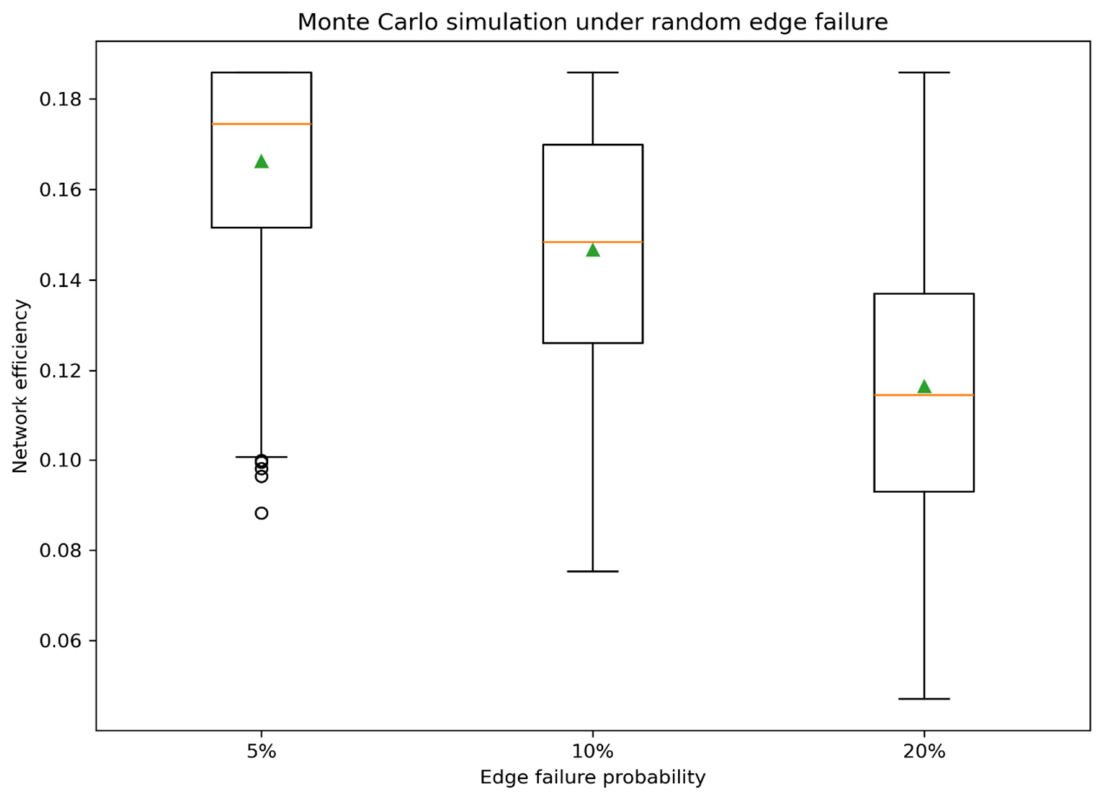
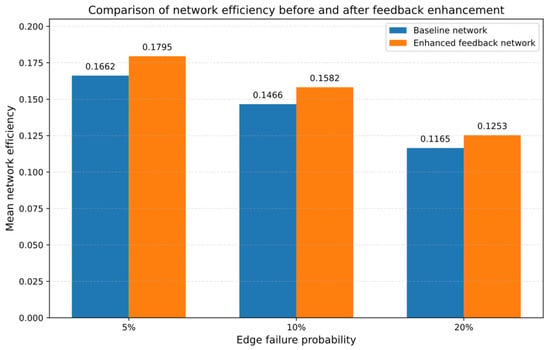
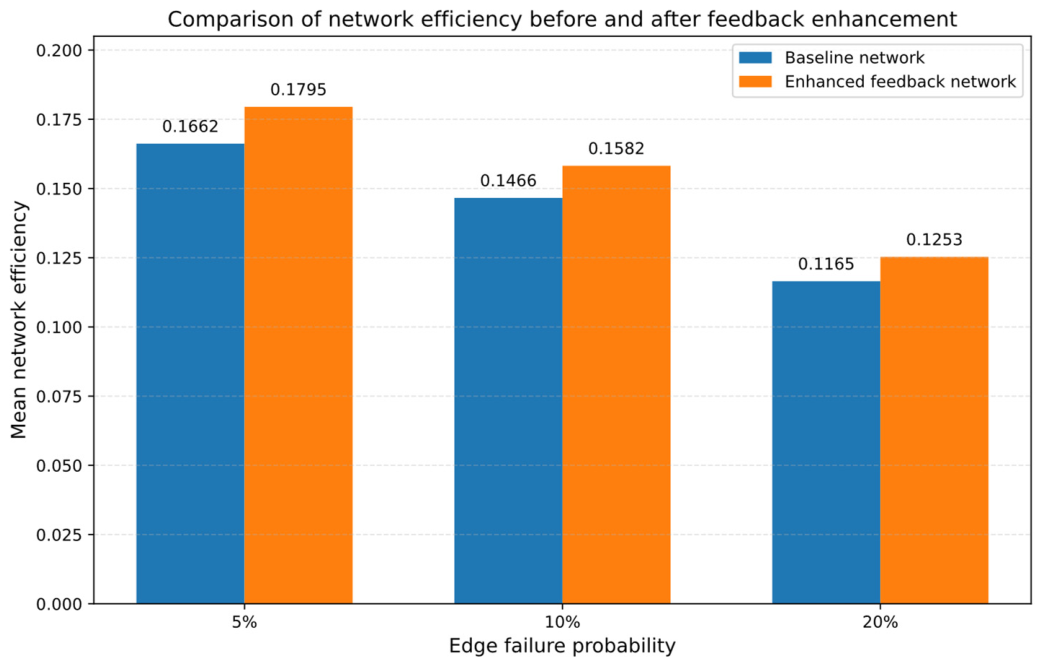
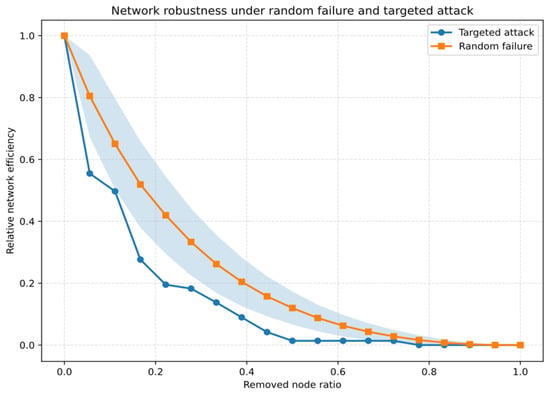
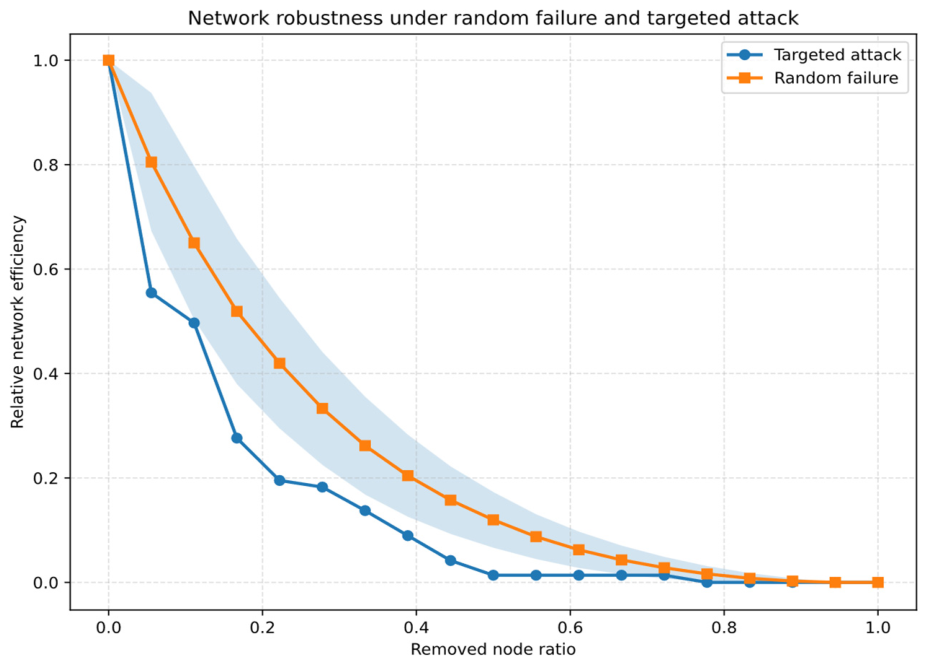
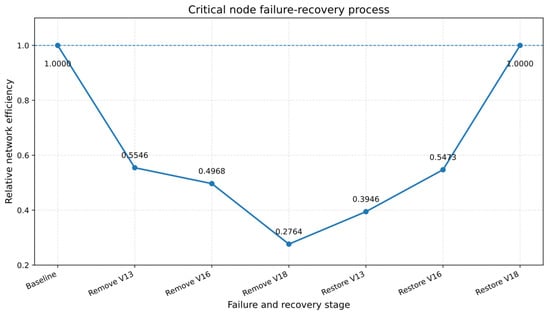
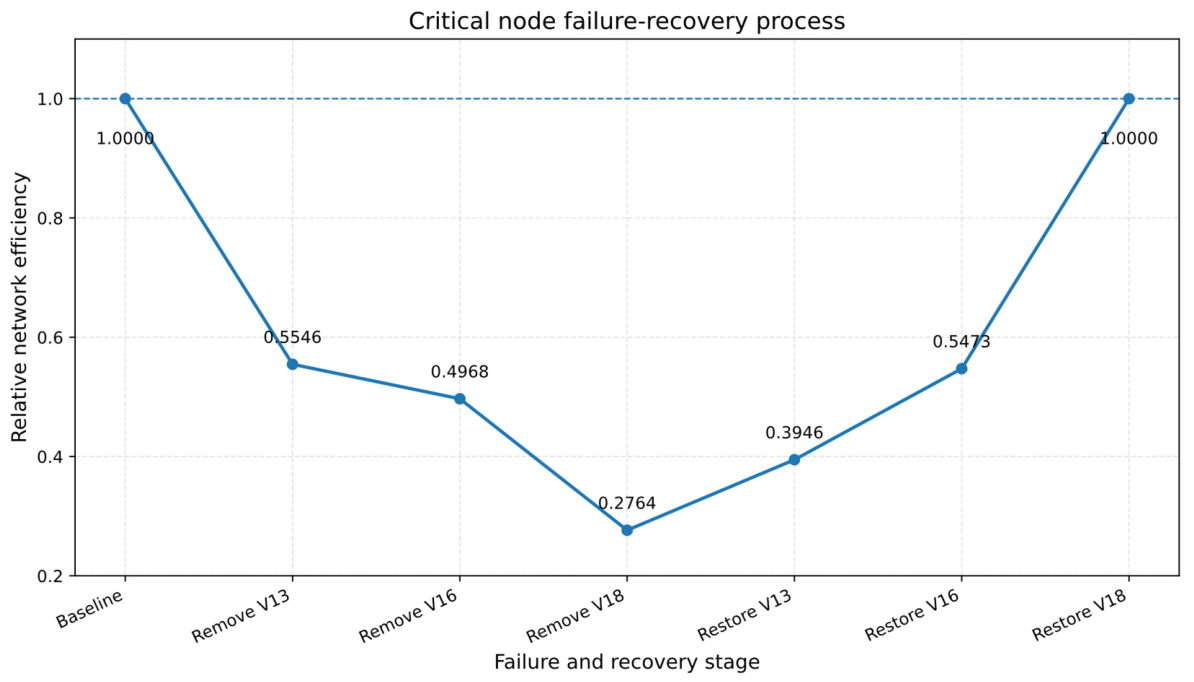

Disclaimer/Publisher’s Note: The statements, opinions and data contained in all publications are solely those of the individual author(s) and contributor(s) and not of MDPI and/or the editor(s). MDPI and/or the editor(s) disclaim responsibility for any injury to people or property resulting from any ideas, methods, instructions or products referred to in the content. |
© 2026 by the authors. Licensee MDPI, Basel, Switzerland. This article is an open access article distributed under the terms and conditions of the Creative Commons Attribution (CC BY) license.