


Abstract
Redevelopment precincts are often assessed through price uplift, although price appreciation alone does not show whether a local housing market becomes more active or liquid. This study examines whether residential turnover and property valuation diverged around the Etihad Campus redevelopment precinct in East Manchester after the 2014Q4 consolidation of the wider campus setting. Using Office for National Statistics House Price Statistics for Small Areas, the analysis applies a neighborhood-scale synthetic control design to a compact Core-4 treatment precinct, using a filtered within-Manchester donor pool to construct the synthetic benchmark. Residential turnover is measured as the mean residential sales count per Lower Layer Super Output Area (LSOA), and valuation is measured as the average of LSOA-level median house-price trajectories. Robustness is assessed using alternative treatment definitions and pre-intervention calibration windows. The results show a persistent post-2014 turnover shortfall relative to the synthetic benchmark, supported by rank-based placebo diagnostics and retained across all valid turnover specifications. By contrast, valuation evidence is weaker, mixed, and more sensitive to design choice. These findings indicate selective housing-market reconfiguration rather than generalized uplift. Redevelopment evaluation should therefore distinguish transaction circulation from price-based valuation, particularly in cumulative precinct-scale redevelopment settings.
1. Introduction
Redevelopment precincts are often evaluated through narratives of visible physical transformation, investment attraction, and price-based uplift. In real estate and housing-market research, however, redevelopment outcomes cannot be reduced to whether prices rise after a major project. Price capitalization remains a necessary benchmark because venue-related redevelopment can be reflected in nearby residential values. Evidence from new sports stadia in London show that such effects can be capitalized into nearby property prices [1]. Recent work treating sports facilities as housing amenities likewise uses housing prices to examine local market response [2]. A broader survey of professional sports venues and local economies also emphasizes that venue-related effects are contested and context-dependent [3]. Price evidence is therefore useful but incomplete: it does not show whether the local housing market has become more active or liquid through transaction circulation.
Residential turnover provides a different lens because it captures market circulation rather than valuation alone. Prices and transactions are related, but the two indicators are not interchangeable. A price-volume model of the housing market shows that financial constraints can link housing prices and trading volume without making the two outcomes equivalent [4]. Search-and-matching research further emphasizes that housing-market liquidity depends on how buyers and sellers find one another and complete transactions [5]. Recent work on monetary-policy transmission also treats residential transactions alongside house prices, confirming that transaction activity is a distinct housing-market outcome [6]. A redevelopment precinct may therefore show a relative valuation signal while recording weaker transaction circulation, or it may become more active without a clear valuation premium. The unresolved issue for redevelopment evaluation is whether turnover and valuation move together after precinct-scale redevelopment or whether they diverge in ways that change the interpretation of local market effects.
East Manchester provides an appropriate empirical setting for examining this issue because the Etihad Campus is embedded in a cumulative redevelopment landscape rather than an isolated single-intervention setting. The area has been shaped by the legacy of the 2002 Commonwealth Games and the shift from event-led to event-themed regeneration [7], by partnership-based regeneration governance in New East Manchester [8], and by debates over whether redevelopment represents urban renaissance or urban opportunism [9]. Qualitative work has also shown that regeneration in East Manchester has been lived through changing meanings of home, place, and neighborhood attachment rather than through official narratives alone [10]. The 2014 opening of the City Football Academy and the wider Eastlands regeneration framework provide the basis for treating the later period as a consolidated campus setting rather than as the beginning of all redevelopment activity in East Manchester [11,12]. This context matters because the Etihad Campus should not be evaluated simply as the isolated effect of one stadium or venue. It is better understood as a redevelopment precinct in which major physical investment, land restructuring, and housing-market adjustment intersect over time.
This cumulative setting also creates an identification problem. In redevelopment precincts shaped by prior investment, policy attention, and neighborhood restructuring, a simple before–after comparison is a weak basis for inference. Observed post-intervention change may reflect broader urban trends, pre-existing trajectories, or other overlapping interventions rather than the redevelopment precinct alone. Synthetic control methods have been developed for settings in which a treated unit is compared with a weighted combination of untreated units that approximates its pre-intervention trajectory [13,14]. More recent methodological guidance emphasizes the importance of feasibility, pre-treatment fit, donor-pool construction, and transparent interpretation in synthetic-control applications [15]. Because specification choices can affect synthetic-control estimates, empirical applications should examine whether findings are sensitive to plausible alternative designs [16]. For the present study, this logic supports a within-Manchester synthetic counterfactual rather than a purely descriptive before–after comparison or a simple citywide benchmark.
This study examines housing-market trajectories around the Etihad Campus redevelopment precinct in East Manchester and asks whether the treated precinct diverged from a within-Manchester synthetic counterfactual after the 2014Q4 consolidation of the wider campus setting. Two complementary outcomes are evaluated: residential turnover, measured as the mean residential sales count per Lower Layer Super Output Area (LSOA), and valuation, measured as the average of LSOA-level median house-price trajectories. The study makes three contributions. First, it reframes redevelopment evaluation as a question of housing-market reconfiguration rather than generalized uplift. Second, it separates transaction circulation from valuation by examining turnover and prices as complementary but non-equivalent outcomes. Third, it applies a neighborhood-scale synthetic control design with alternative treatment definitions and calibration windows to assess the sensitivity of post-intervention divergence to spatial and temporal specification. The results indicate a persistent turnover shortfall and weaker, mixed valuation evidence, supporting an interpretation of selective housing-market reconfiguration rather than uniform neighborhood-market activation.
2. Literature Review
Real estate and housing-market research provides the first premise for this study: redevelopment-related market adjustment cannot be reduced to valuation alone. Transaction timing, land-market conditions, and valuation processes represent different dimensions of how housing markets are organized. Sales-cycle research treats transaction circulation as an object of housing-market prediction and management [17], land–housing market research shows that housing outcomes are shaped by wider land-market and regulatory structures [18], and valuation-oriented work confirms the continuing importance of property-value estimation [19]. Urban-regeneration evaluation research similarly emphasizes that regeneration should be assessed through multiple criteria rather than through a single physical or economic indicator [20]. Taken together, these studies suggest that redevelopment precincts should be evaluated as market systems in which valuation, transaction circulation, liquidity, and selectivity may change in different ways.
Nevertheless, valuation remains a necessary part of redevelopment evaluation because redevelopment-related amenities, expectations, and land-use changes may be capitalized into housing and land prices. The venue and event-legacy literature is useful here because it shows that venue-anchored redevelopment effects are contested, indicator-sensitive, and context-dependent [3,21]. Evidence from new sports stadia in London show that facility-related change can be reflected in nearby residential prices [1], while recent work on sports facilities as housing amenities similarly examines whether prices follow facility provision [2]. Other stadium and arena studies show that facility-related valuation effects can appear in housing values or land values, although their direction and spatial reach vary by context [22,23]. Related work also connects sports facilities to agglomeration and subsidy mechanisms [24], commercial property-market effects [25], and contested socio-spatial implications of stadium-led regeneration [26], showing that venue-anchored redevelopment can reshape nearby real estate markets in more than one way. This literature justifies treating valuation as an empirical outcome, but it also exposes the weakness of a valuation-only framework. Capitalization into price can indicate changing perceived value, expected upgrading, or locational appeal; it does not show whether households are actually moving through the local market, whether transactions are becoming more frequent, or whether market participation is becoming more selective. Price is therefore a valid valuation outcome, but it is not a sufficient measure of market circulation.
The theoretical basis for separating turnover from valuation is provided by housing-market research on prices, trading volume, liquidity, and search frictions. Prices and transactions are related, but their relationship is mediated by credit constraints, information frictions, search processes, and the timing of buyer–seller matching. Price–volume models show that financial and informational conditions can link prices and transaction activity without implying that both indicators move in the same direction or at the same speed [4,27]. Search-and-matching approaches further imply that turnover reflects the capacity of buyers and sellers to find one another, negotiate, and complete transactions; in this sense, turnover is a liquidity and market-circulation indicator rather than a weaker proxy for price [5]. Empirical work on price–volume dynamics also shows that sales and prices may respond differently to shocks and may vary across time scales [28,29]. Recent housing-market research has continued to treat residential transactions alongside house prices, confirming that transaction activity remains analytically relevant rather than merely descriptive [6]. For redevelopment evaluation, this distinction is central. A precinct may display a relative valuation signal while recording weaker transaction circulation, or it may become more active without a clear valuation premium. Turnover and valuation must therefore be evaluated together precisely because they may diverge.
This outcome distinction also affects how the treatment, itself, should be conceptualized. In a redevelopment setting, the relevant object is rarely a single building operating in isolation. The preceding literature shifts attention away from a binary assessment of generalized venue benefits and toward the more precise question of how a surrounding precinct changes. In East Manchester, this distinction is especially important. The Etihad Campus emerged within a longer redevelopment landscape shaped by Olympic bidding and the local politics of globalization [30], the 2002 Commonwealth Games [7], partnership-based regeneration governance [8], and debates over the meaning of New East Manchester’s transformation [9]. Work on sports-city zones further supports treating surrounding land transformation and precinct formation as part of the analytical object [31], while qualitative research on East Manchester shows that regeneration was experienced through changing meanings of community, home, and place attachment, not only through official renewal narratives [10,32]. The treatment object in this study is therefore not a single stadium intervention. It is a cumulative redevelopment precinct in which venue anchors, land restructuring, and neighborhood-market adjustment intersect.
Conceptualizing the treatment as a cumulative redevelopment precinct also clarifies the identification problem. A simple before–after comparison cannot establish whether post-intervention housing-market trajectories are unusual because treated neighborhoods may already differ from other parts of the city before the focal intervention. Their subsequent paths may also reflect broader urban trends, earlier regeneration policy, market sorting, or overlapping public and private investments. Synthetic control methods are suited to this problem because they construct an explicit counterfactual trajectory from a weighted combination of untreated units rather than relying on the treated unit’s own pre–post trend or a simple citywide average [13,14]. Later methodological guidance emphasizes that credible synthetic-control applications require attention to feasibility, donor-pool construction, pre-treatment fit, and transparent interpretation [15]. At the same time, design choices can influence estimates, so robustness checks are not merely technical additions. Sensitivity to alternative specifications must be assessed to reduce dependence on a single preferred design [16]. For this study, these methodological arguments support a within-Manchester synthetic counterfactual, nested treatment definitions, alternative calibration windows, and bounded interpretation of the resulting gaps.
The remaining gap is not located within any single strand of this literature. Rather, it lies in their integration: facility-led redevelopment research has shown that venue-related effects are contested and spatially selective, real estate and housing research has shown that valuation and transactions are both relevant to market evaluation, housing-market theory has shown that turnover and valuation are related but not interchangeable, and synthetic-control research has shown how treated units can be compared with constructed counterfactual trajectories. What remains insufficiently examined is whether turnover and valuation diverge within the same redevelopment precinct when assessed against a within-city synthetic counterfactual. This study addresses that gap by evaluating residential turnover and valuation around the Etihad Campus redevelopment precinct and by asking whether post-2014 housing-market trajectories indicate generalized uplift or selective housing-market reconfiguration.
3. Materials and Methods
3.1. Study Area, Data Sources, and Analytical Scope
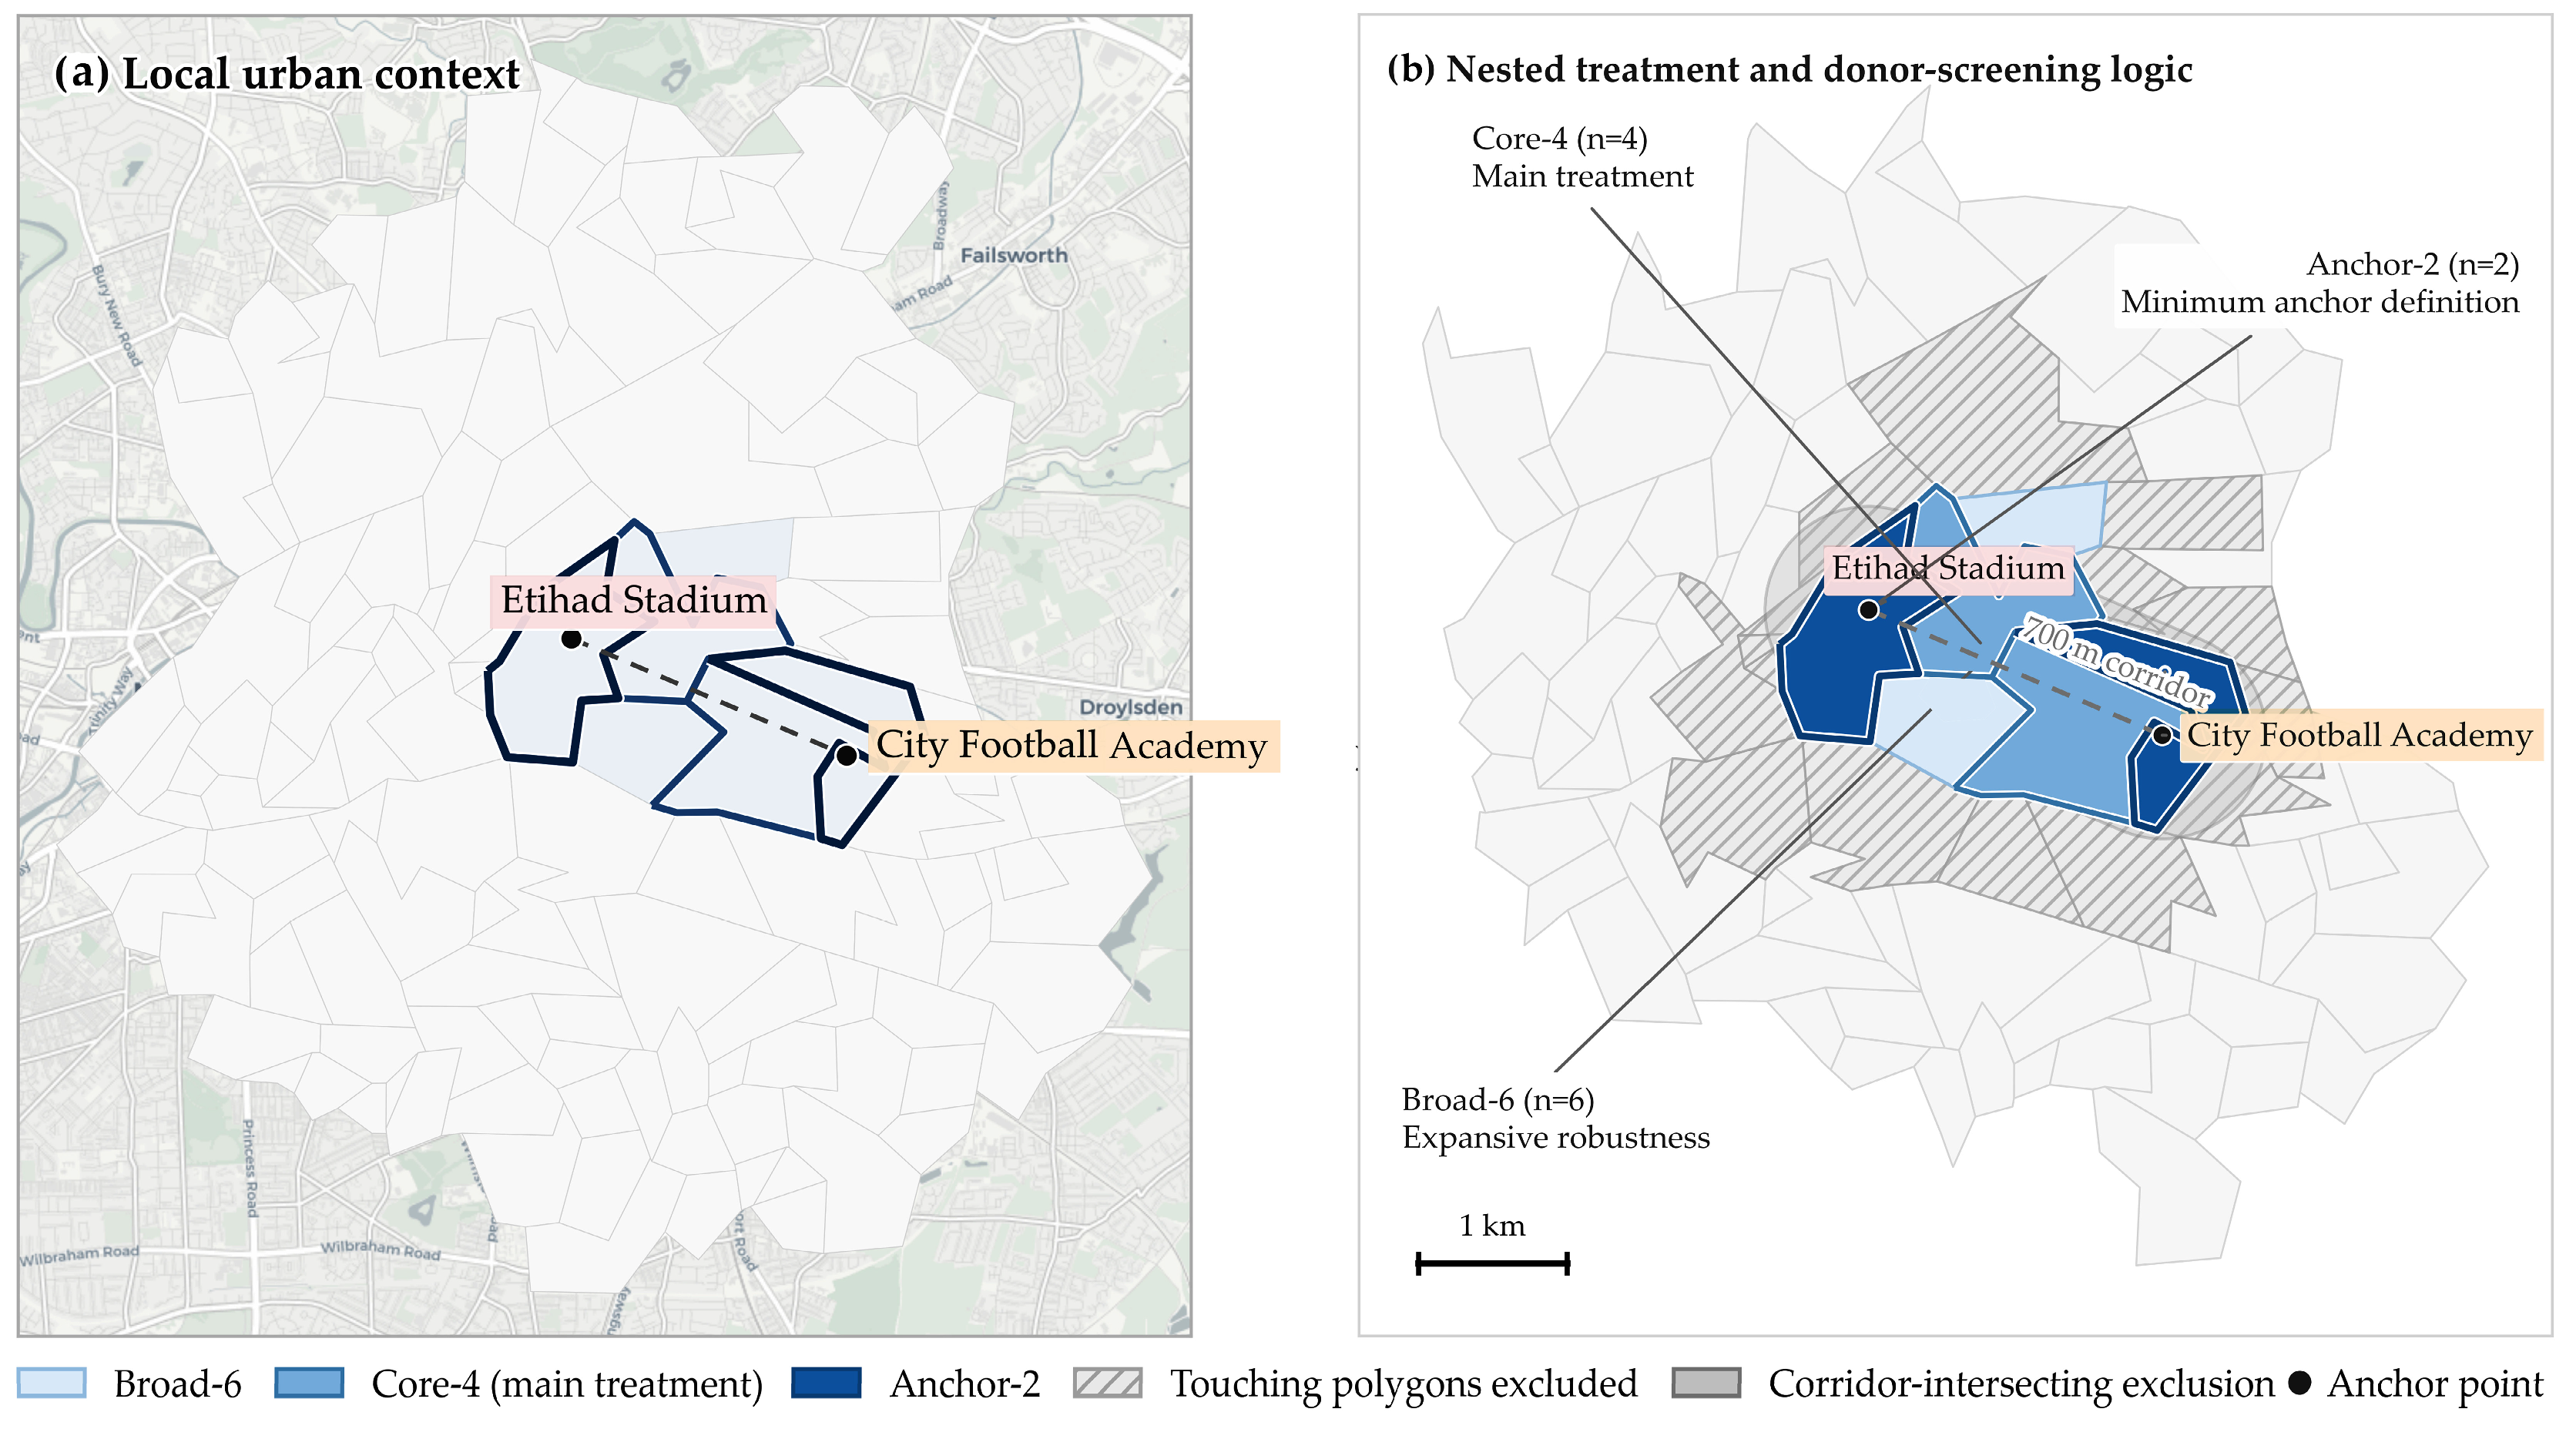
This study examines housing-market trajectories around the Etihad Campus redevelopment precinct in East Manchester and asks whether the neighborhoods immediately surrounding the precinct followed trajectories that differed from those of a within-Manchester counterfactual. The analytical focus is not the isolated effect of a single stadium building. Rather, the Etihad Stadium and the City Football Academy (CFA) are treated as the principal anchors of a broader redevelopment precinct in which major physical investment, land restructuring, and neighborhood-market adjustment intersect. In this context, the fourth quarter of 2014 is used as the principal intervention anchor because it marks the opening of the CFA and the clearer consolidation of the wider precinct logic [11,12]. Thus, 2014Q4 is not treated as the beginning of East Manchester regeneration as a whole; earlier regeneration phases are treated as background conditions, while 2014Q4 marks the consolidation of the Etihad Stadium–CFA campus logic used for the post-intervention comparison. Figure 1 summarizes the study area, nested treatment definitions, and donor-screening logic around the Etihad Campus.
Figure 1.
Study area, nested treatment definitions, and donor-screening logic around the Etihad Campus in East Manchester.
The empirical analysis uses two Office for National Statistics (ONS) House Price Statistics for Small Areas (HPSSA) annual-source datasets: Dataset 41 for residential sales counts by Lower Layer Super Output Area (LSOA) and Dataset 46 for median residential property prices by LSOA. Because these annual-source files are released through a quarterly update structure, they are reorganized here in a common quarter-ending observation index from 1995Q4 to 2023Q1 for synthetic-control calibration and visualization [33,34,35]. This index is an analytical alignment device only: repeated within-year observations reflect the HPSSA reporting structure and should not be interpreted as newly observed quarterly transaction flows or quarterly price formation. To support spatial delineation, the study additionally uses the 2021 ONS LSOA boundary file, which provides polygon geometry and centroid information for treatment identification, donor-pool screening, and mapping [36].
After extracting the Manchester subset, the analytical panel contains 282 LSOAs and 31,020 LSOA-by-quarter-ending-observation records for each outcome. The geographic boundary data are used to define treatment and donor areas spatially, not as outcome variables. Units without consistent geometry support were excluded from treatment delineation and donor screening in order to preserve spatial coherence in the counterfactual design.
The two outcomes serve different but complementary analytical purposes. Residential sales are used to measure neighborhood market turnover and transaction circulation. In the synthetic-control analysis, this source variable is operationalized as the mean residential sales count per LSOA within each treatment definition rather than as the total number of sales across the treated precinct. This construction keeps the treated turnover series comparable to the LSOA-level donor trajectories used to form the synthetic control. The average of LSOA median house prices is retained as a secondary valuation outcome because price remains the dominant benchmark in facility-impact and capitalization research, even though it reflects valuation rather than circulation. Considering both outcomes makes it possible to assess whether capitalization and market activity moved together or diverged after campus consolidation. This distinction is methodologically important because precinct-scale redevelopment may alter transaction activity and market valuation through different mechanisms, and the two outcomes should not be assumed to provide interchangeable evidence of neighborhood change [27,28,29]. Table 1 summarizes the data sources, spatial units, temporal coverage, and analytical roles used in the study.
Table 1.
Data sources, units, coverage, and analytical roles.
3.2. Precinct Delineation and Donor-Pool Design
The spatial design is nested and precinct-based. Instead of relying on a single fixed treatment footprint, the study constructs three ordered precinct scenarios around the Etihad Campus. The first, Anchor-2, contains only the two LSOAs that directly include the two principal campus anchors: the Etihad Stadium and the City Football Academy. The second, Core-4, extends this minimum footprint by adding the two directly connected corridor polygons that spatially bind the anchor areas into a compact campus-adjacent precinct. The third, Broad-6, further extends the footprint to include the next layer of adjacent polygons that remain plausibly within the wider campus precinct.
Among these definitions, Core-4 is used as the main precinct specification. Anchor-2 is intentionally conservative and is useful as a narrow robustness definition, but it is too restrictive for a precinct-scale redevelopment analysis because it captures only the two anchor polygons themselves. Broad-6, by contrast, is intentionally expansive and is useful for sensitivity testing, but it risks over-extending the effective treatment footprint. Core-4 provides the balance point between these two extremes by capturing both the anchors and their most immediate connected neighborhood corridor.
The donor pool is also defined conservatively. The starting comparison set consists of Manchester LSOAs with valid geography support. From this set, the analysis excludes all LSOAs in Broad-6, all polygons directly touching the Broad-6 union, and all polygons intersecting a 700 m corridor drawn between the Etihad Stadium and the CFA. The resulting filtered within-Manchester donor pool, referred to as donor-moderate, serves as the main donor pool throughout the synthetic-control analysis. This spatial screening logic is intended to reduce fringe contamination while preserving a large within-city counterfactual set.
Taken together, the nested precinct logic and the filtered donor-pool design ensure that the counterfactual comparison is neither mechanically citywide nor overly dependent on a single arbitrary boundary choice. The empirical design is therefore centered on a compact redevelopment precinct, but it remains transparent about how precinct breadth can be widened or narrowed in robustness tests. Table 2 summarizes the nested treatment definitions and the donor-pool screening logic.
Table 2.
Nested treatment definitions and donor-pool screening logic.
3.3. Synthetic Control Strategy and Outcome Construction
The core empirical strategy is a neighborhood-scale synthetic control design [13,14,15]. For each outcome, the observed trajectory of the treated precinct is compared with a weighted combination of untreated Manchester LSOAs drawn from the donor-moderate pool. The treated precinct is spatially defined as a group of LSOAs, whereas the donor pool consists of individual untreated LSOAs. For this reason, outcome construction is designed to preserve scale comparability between the treated series and the donor trajectories.
For residential turnover, the source variable is the LSOA-level residential sales count from HPSSA Dataset 41. For each treatment definition, the treated sales series is constructed as the arithmetic mean of LSOA-level residential sales counts across the LSOAs included in that treatment definition. Therefore, the resulting outcome is the mean residential sales count per LSOA within the treated precinct. It should be interpreted as the average neighborhood-level transaction turnover within the precinct, not as the total number of transactions occurring across the precinct. This construction keeps the treated sales trajectory on a scale comparable to the LSOA-level donor trajectories used in the synthetic-control procedure. Throughout the analysis, this turnover measure is interpreted as the transaction intensity at the average LSOA level, not as the total precinct-wide transaction activity. Therefore, a negative treated–synthetic gap indicates lower average transaction circulation per LSOA relative to the synthetic benchmark rather than a direct estimate of the total number of transactions lost across the precinct.
For house prices, the treated series is constructed as the arithmetic mean of the LSOA-level median-price series across the treated LSOAs under the same treatment definition. This follows the areal structure of the HPSSA source and produces a treatment-level valuation trajectory aligned with the precinct definition. Accordingly, the price outcome should be interpreted as an average of area-level median prices rather than as a pooled precinct-wide transaction median.
The synthetic counterpart is obtained as the weighted average of donor trajectories that best reproduces the treated path during the pre-intervention calibration period. Formally, the donor weights are estimated by minimizing the pre-intervention prediction error:
subject to
where denotes the transformed outcome of the treated precinct at quarter-ending observation point , denotes the transformed outcome of donor LSOA at the same observation point, denotes the donor weight assigned to unit , and denotes the last pre-intervention observation point. The weights are constrained to be non-negative and to sum to one so that the synthetic control is formed as a convex combination of untreated Manchester LSOAs.
The baseline synthetic-control specification relies on pre-intervention outcome-trajectory matching only. No additional covariate predictors are included in the donor-weighting procedure. This choice keeps the sales and price models directly comparable and makes the estimated counterfactual depend on how well untreated Manchester LSOAs reproduce the treated precinct’s pre-intervention outcome path. Robustness is therefore assessed through alternative treatment definitions and calibration windows rather than through alternative predictor sets.
The two outcomes are transformed to improve comparability and fit stability. The sales model is estimated as log(1 + mean residential sales count per LSOA), while the price model is estimated as log(price). These transformations reduce skewness and ensure that model fitting, RMSE calculation, and placebo-based diagnostics are conducted on the same transformed scale used in the synthetic-control estimation. Raw-scale trajectories and gaps are retained for substantive interpretation, but the primary fit diagnostics and placebo ratios are based on the transformed outcomes. Consistent with the data structure clarified in Section 3.1, the transformed outcome series are indexed by quarter-ending observation points; the synthetic-control fitting uses this common temporal index, while substantive interpretation does not treat the observations as independent quarterly market flows. Data processing, synthetic-control estimation, placebo reassignment, and visualization were conducted using Python 3.13.
Although the Manchester panel begins in 1995Q4, the baseline specification starts in 2006Q4. This choice retains a sufficiently long pre-intervention period while reducing the extent to which earlier post-Commonwealth Games regeneration dynamics dominate the pre-treatment trajectory. At the same time, it preserves a mature calibration window for evaluating the post-2014 path of the treated precinct against a credible within-city benchmark.
Under the baseline specification, the primary inferential design is defined as the mean residential sales count per LSOA for the Core-4 treatment, donor-moderate is defined as the donor pool, 2006Q4 is defined as the calibration start, and 2014Q4 is defined as the intervention quarter. The average of LSOA median house prices is estimated under the same treatment and donor logic but is interpreted as a secondary valuation outcome. Treatment robustness is assessed by re-estimating the model under Anchor-2, Core-4, and Broad-6. Temporal robustness is assessed by varying the start window across 2004Q4, 2006Q4, and 2008Q4. The resulting treatment-window matrix makes it possible to evaluate whether the sign and relative strength of the post-intervention divergence depend on treatment breadth or on the length of the pre-treatment calibration period. The baseline specifications used in the main synthetic-control analysis are summarized in Table 3.
Table 3.
Baseline specifications used in the main synthetic control analysis.
3.4. Placebo Tests, Robustness Checks, and Interpretation Scope
Inference is based on placebo reassignment and robustness comparison rather than on conventional large-sample statistical theory [14,15]. After estimating the treated-precinct synthetic control, the study iteratively assigns each donor LSOA the role of a pseudo-treated unit and re-estimates the same synthetic-control procedure using the remaining donor LSOAs as the comparison set. For each placebo case, the analysis computes pre-intervention and post-intervention root-mean-squared prediction errors (RMSPEs) on the transformed outcome scale and summarizes their divergence using the ratio of post-to-pre-intervention RMSPE. The actual treated precinct is then evaluated against the distribution of donor–placebo ratios.
The resulting pseudo p-values are interpreted as rank-based placebo diagnostics rather than as conventional hypothesis-test p-values. This distinction is important because the empirical treatment is a spatially defined redevelopment precinct rather than a randomly assigned unit. The placebo distribution therefore provides a structured reference for assessing whether the treated precinct’s post-intervention deterioration in fit is unusually large relative to untreated Manchester neighborhoods estimated under the same synthetic-control logic. For this reason, the placebo evidence is interpreted together with the treatment-definition and start-window robustness matrix rather than as a standalone inferential test. The robustness dimensions used in the synthetic-control analysis are summarized in Table 4.
Table 4.
Robustness dimensions used in the synthetic-control analysis.
The robustness design operates along two dimensions. The first is spatial, through the nested precinct definitions. The second is temporal, through the three start windows of 2004Q4, 2006Q4, and 2008Q4. For each valid combination, the analysis records the pre-intervention fit, post-intervention fit, post/pre RMSPE ratio, and mean post-intervention gap on both the raw and transformed scales. This structure allows the study to distinguish between results that are consistent across the tested specifications and results that depend on one particular spatial or temporal definition [16].
The interpretation scope of the design is intentionally bounded. The study does not claim to isolate the Etihad Campus as the sole causal driver of every observed neighborhood-market change in East Manchester. The campus is embedded in a broader redevelopment setting shaped by multiple layers of investment, planning intervention, and urban restructuring. The synthetic-control design addresses this complexity by comparing the treated precinct with a structured within-Manchester counterfactual, but it does not transform the case into a pure single-shock experiment. Therefore, the results provide neighborhood-scale counterfactual evidence on housing-market trajectories associated with precinct-scale redevelopment rather than definitive proof that the campus alone caused each observed shift in turnover or valuation. This bounded design is particularly appropriate in a cumulative redevelopment setting where the relevant question is not whether a single intervention mechanically produced all subsequent outcomes but whether the treated precinct followed trajectories that diverged from a credible within-city benchmark after the consolidation of the wider redevelopment precinct.
4. Results
4.1. Main Synthetic-Control Evidence on Residential Sales Turnover
This section presents the baseline synthetic-control result for residential sales turnover under the main specification. The treated precinct is defined as the Core-4 precinct, the donor pool is donor-moderate, the calibration window begins in 2006Q4, and the intervention quarter is fixed at 2014Q4. Consistent with the outcome construction described above, residential turnover is measured as the mean residential sales count per LSOA within the treated precinct. The principal empirical question is whether the treated precinct followed a post-intervention turnover trajectory that diverged from a within-Manchester synthetic counterfactual.
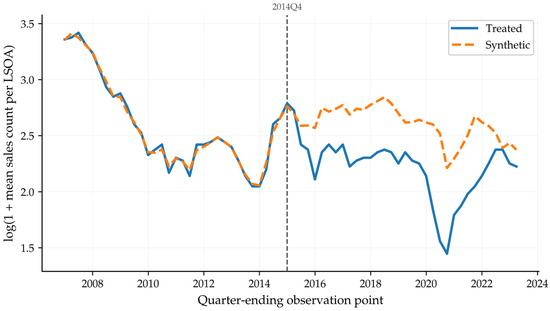
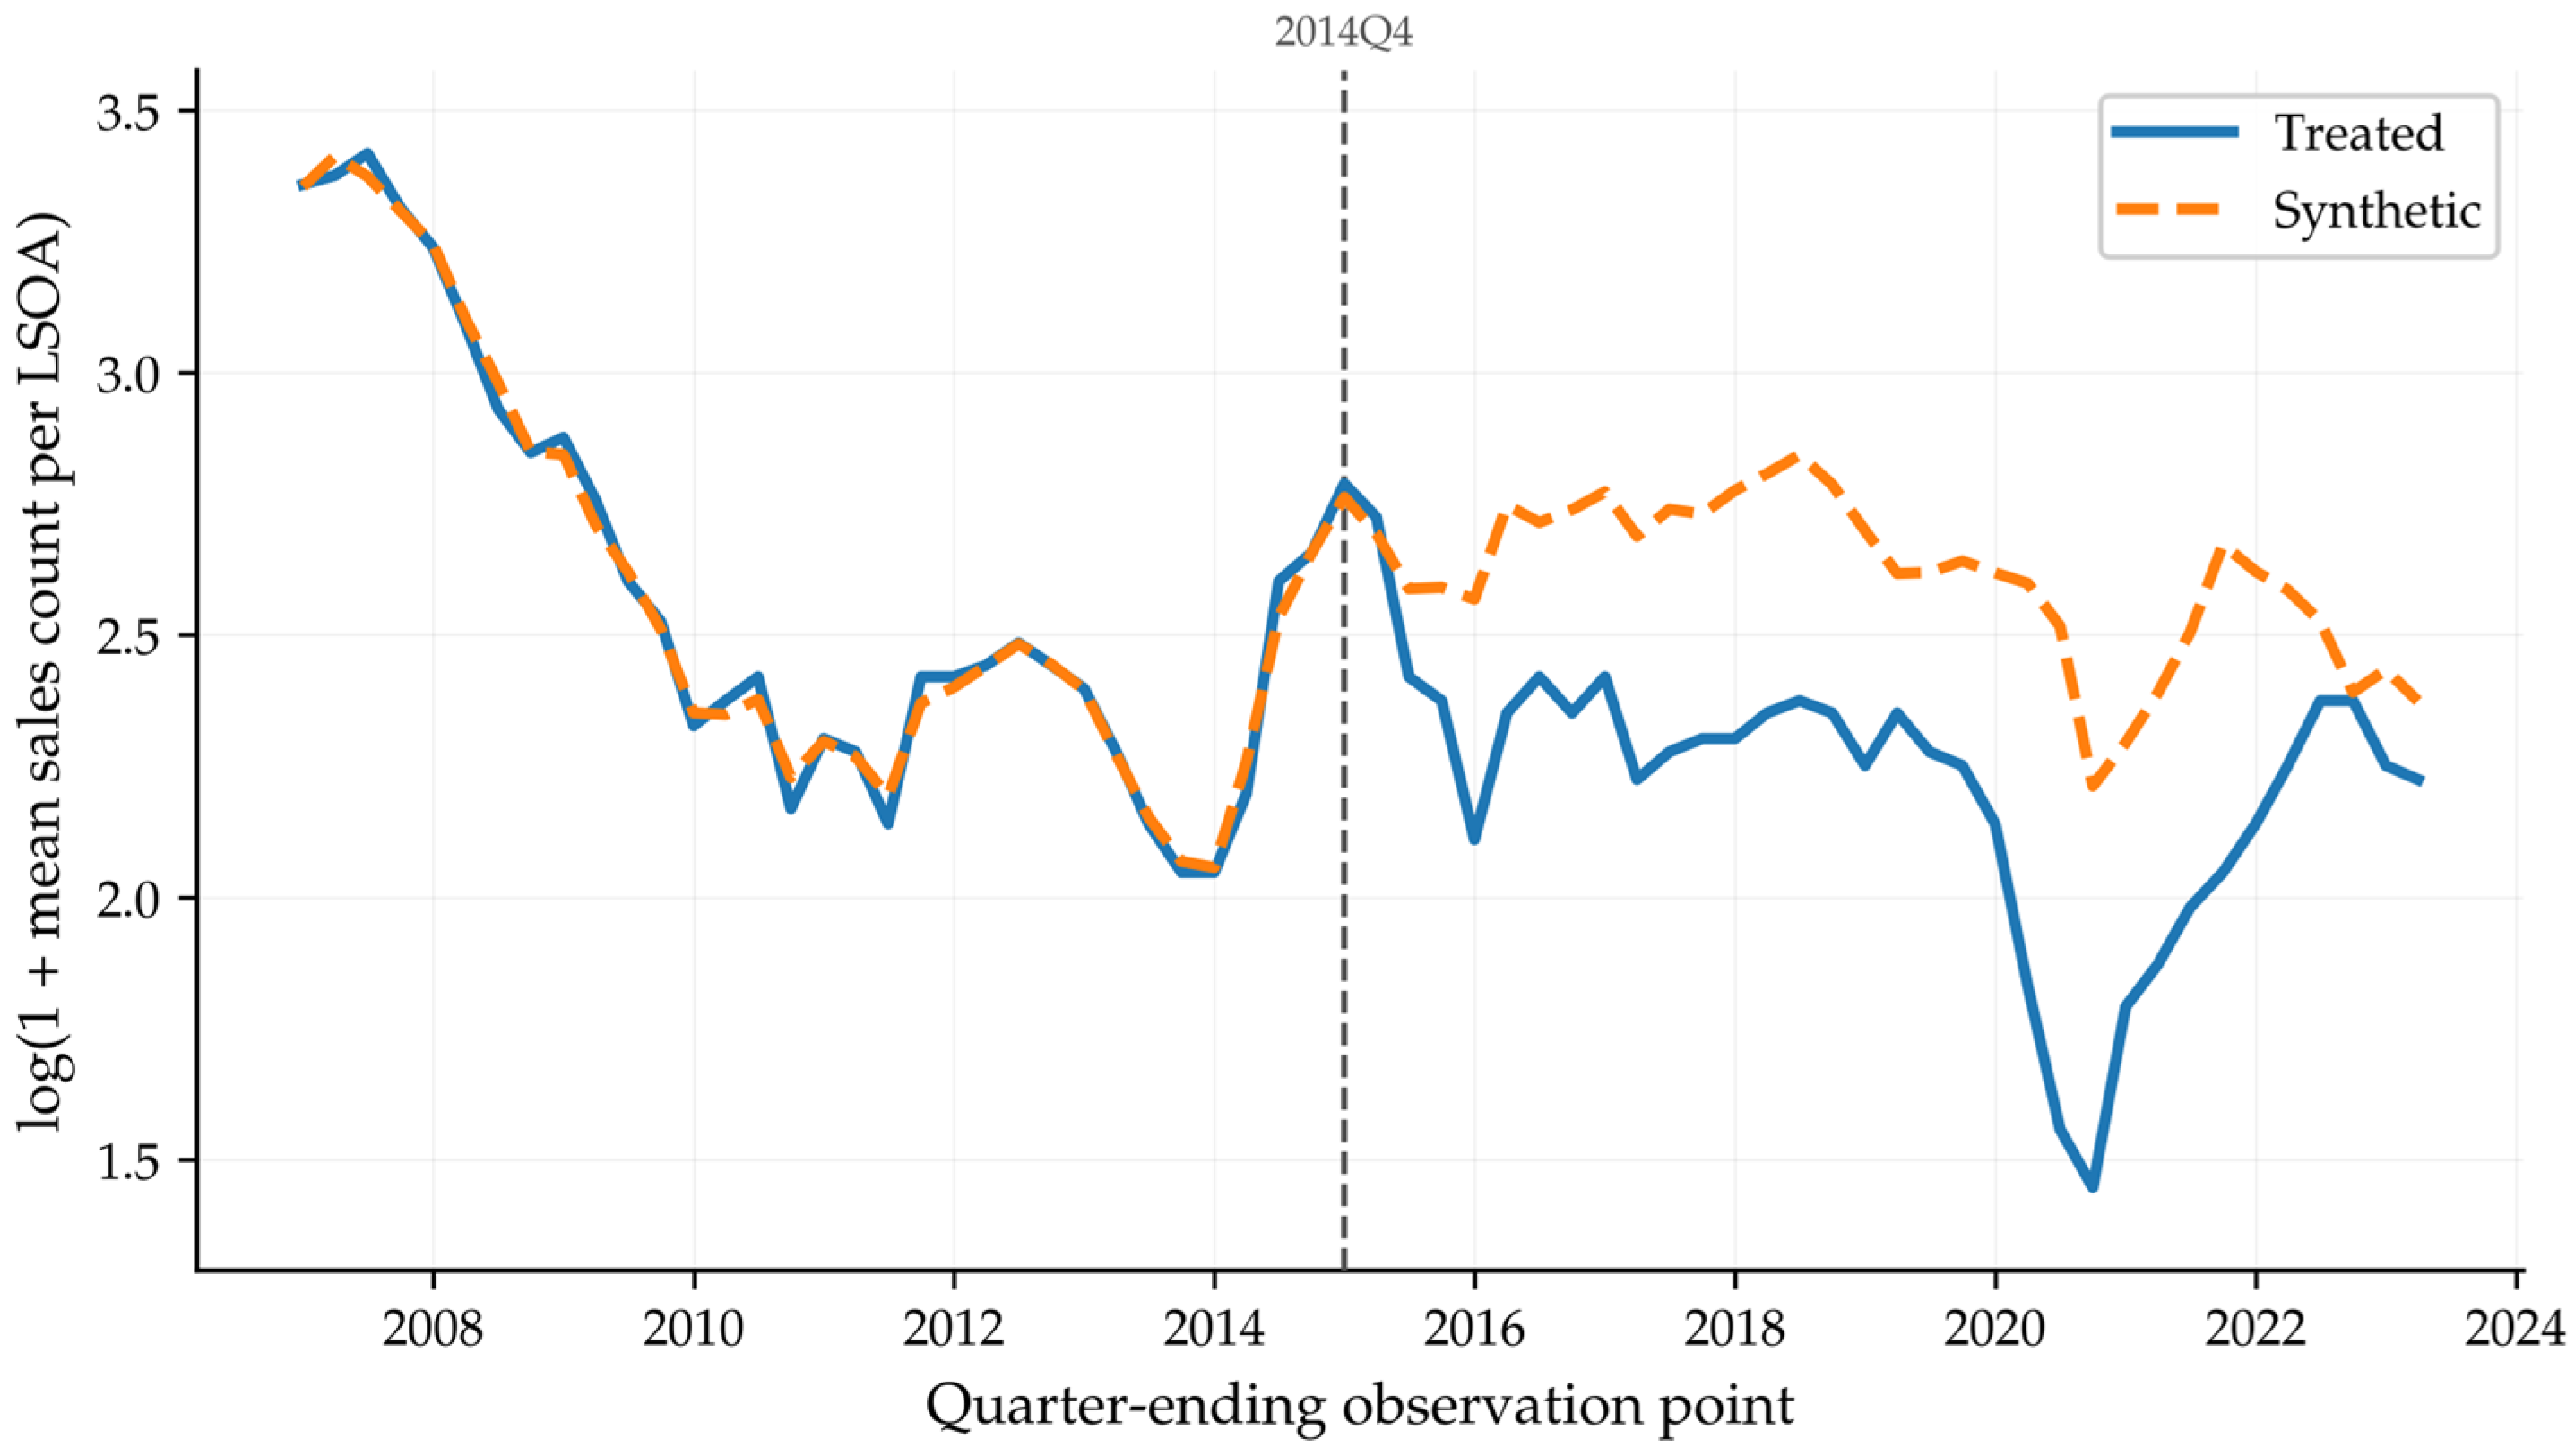
Figure 2 reports the treated and synthetic trajectories on the transformed scale used for synthetic-control fitting. The outcome is log(1 + mean residential sales count per LSOA), so the figure corresponds directly to the scale used for model fitting, RMSE calculation, and placebo-based diagnostics. Over the pre-intervention calibration period, the treated and synthetic trajectories are closely aligned, indicating that the weighted donor combination reproduces the broad pre-2014 movement of the treated precinct. After the 2014Q4 intervention anchor, however, the two paths separate more clearly. The treated series remains persistently below the synthetic trajectory through much of the post-intervention period, indicating a relative shortfall in residential turnover compared with the within-Manchester synthetic benchmark.
Figure 2.
Core-4 residential sales turnover and its synthetic control on log(1 + mean sales count per LSOA); the dashed vertical line marks the 2014Q4 intervention anchor.
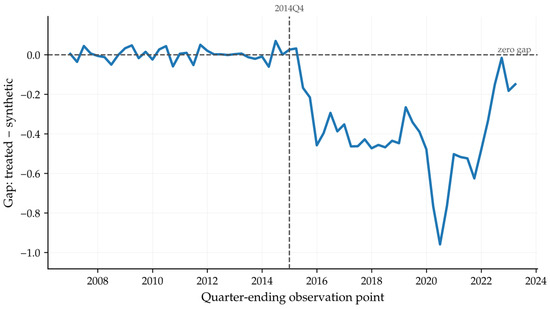
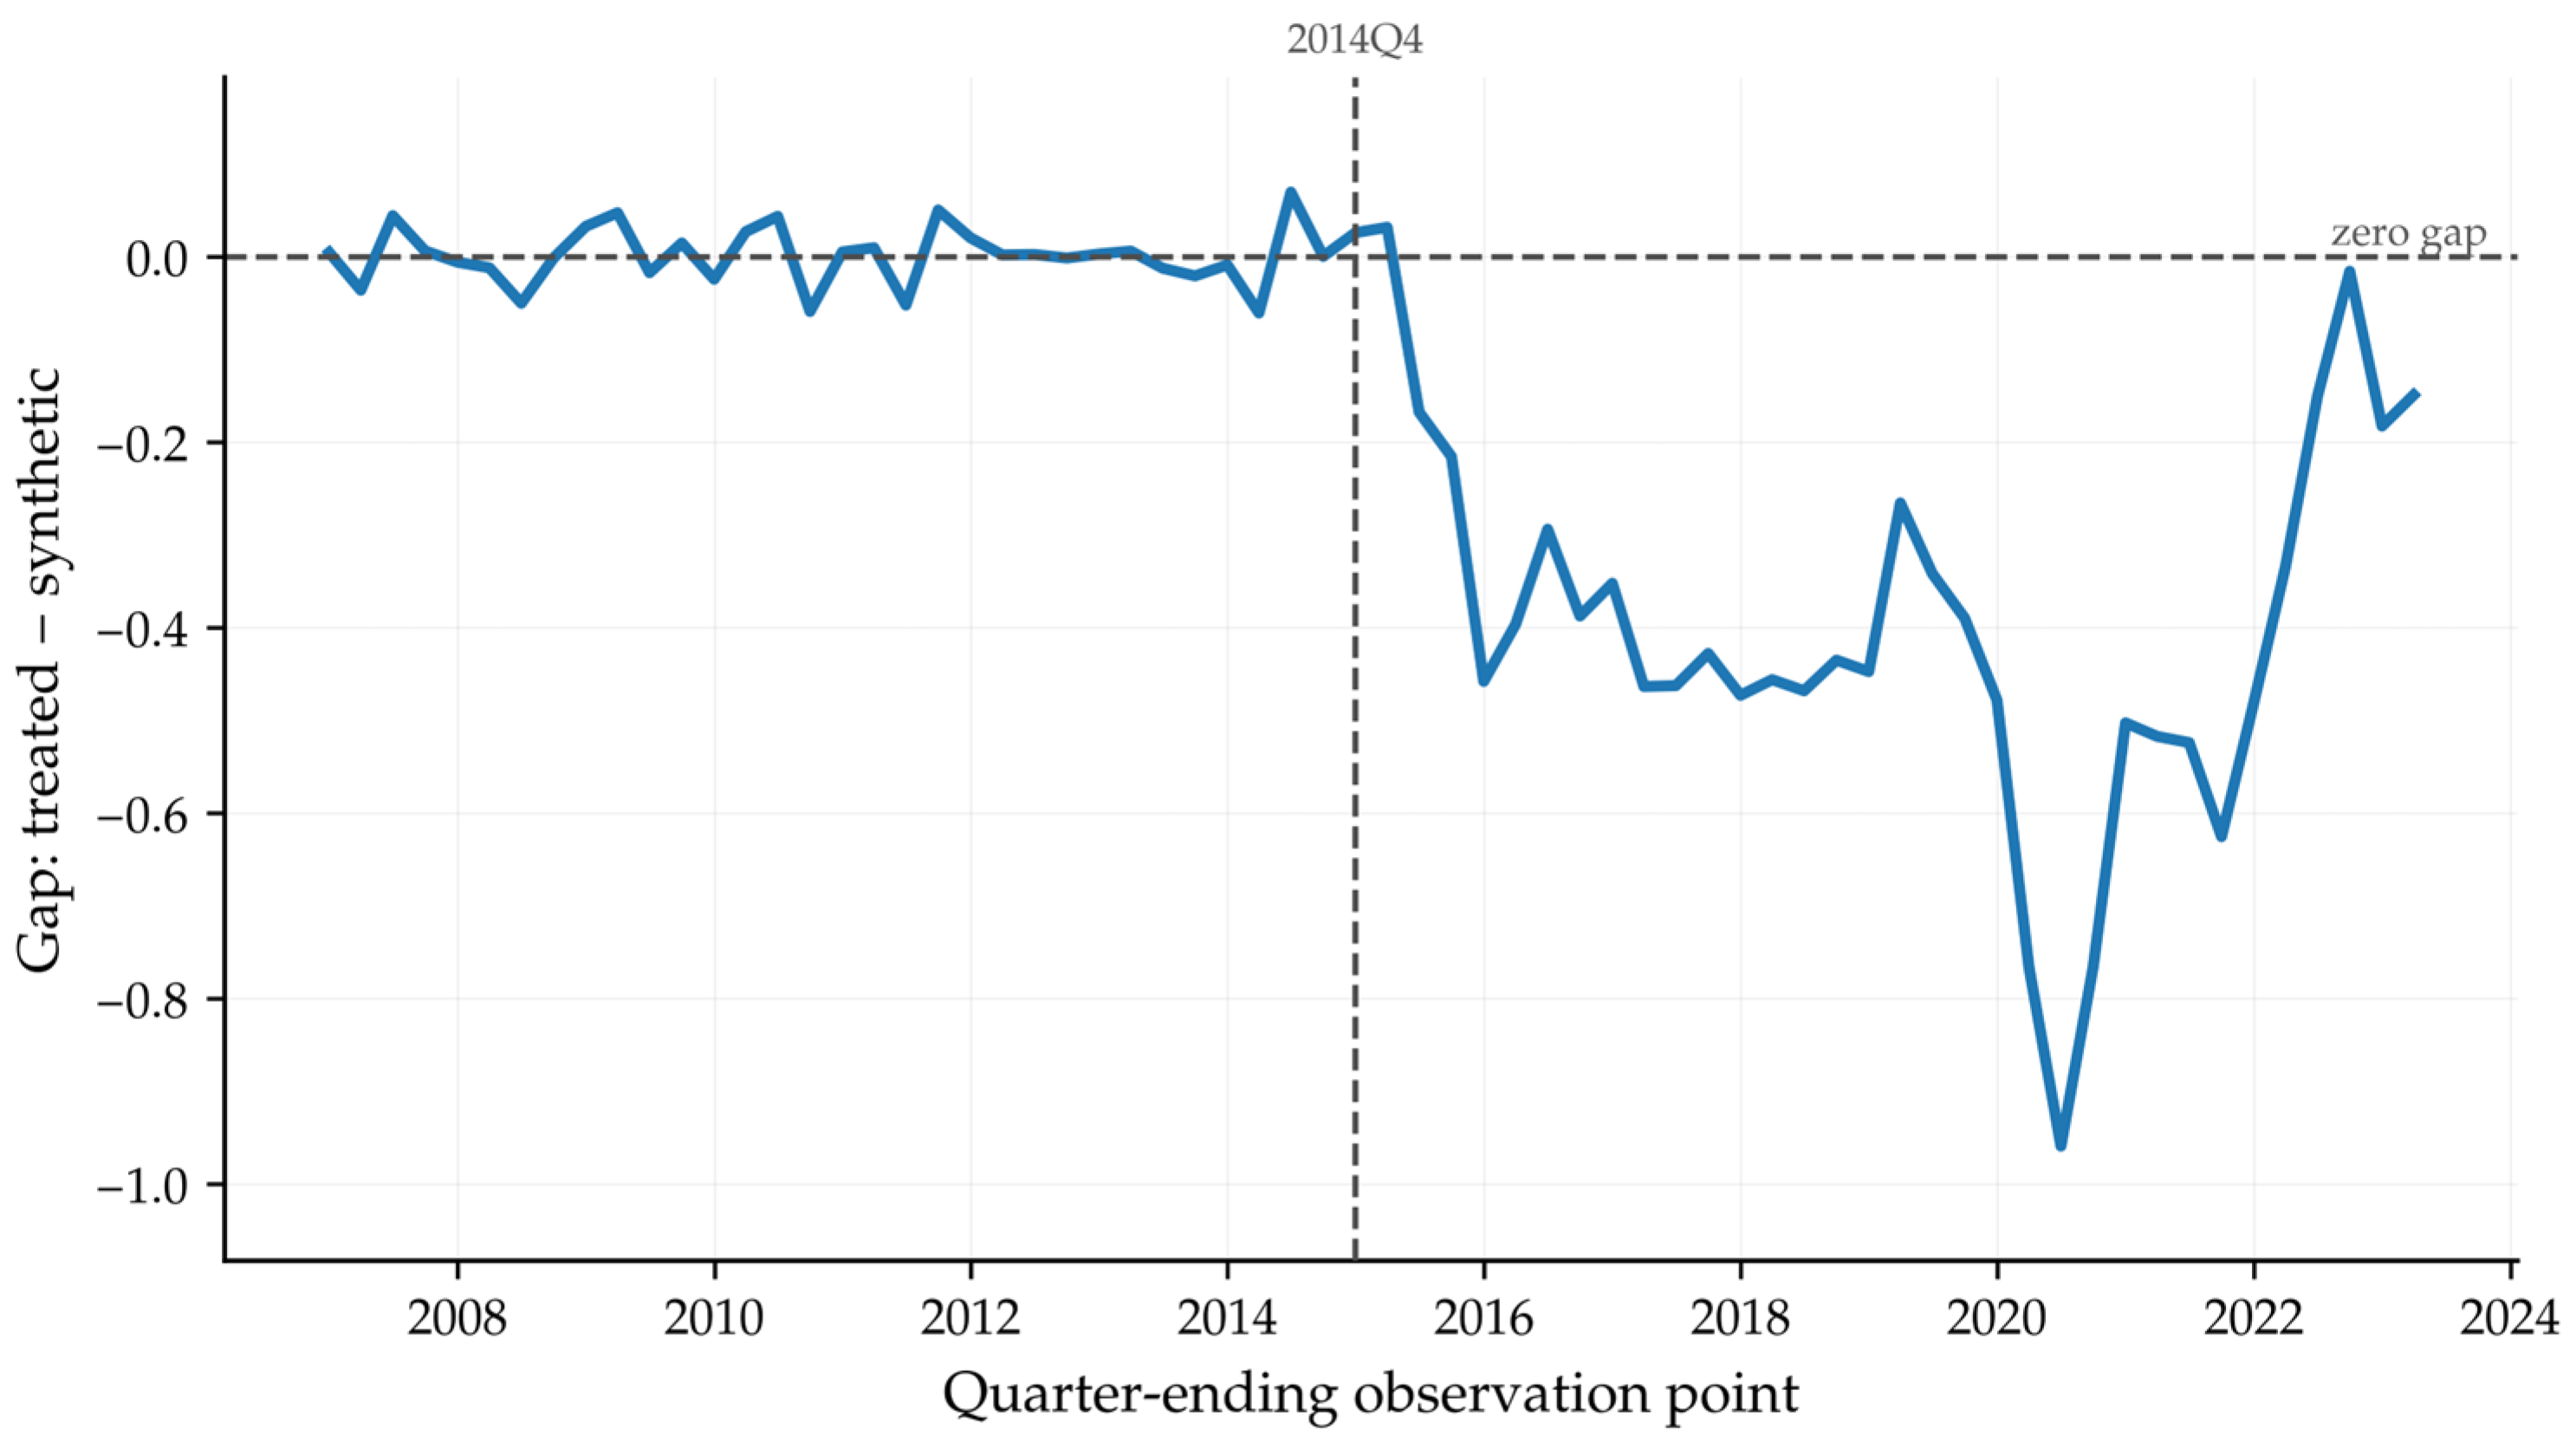
This pattern should not be interpreted as a monotonic absolute decline in transactions at every observation point. Rather, it indicates that the treated precinct followed a weaker turnover trajectory than would have been expected under its synthetic counterfactual. The transformed gap series in Figure 3 reinforces this interpretation. During the pre-intervention period, the treated–synthetic gap fluctuates close to zero, whereas after 2014Q4, it becomes predominantly negative and remains below zero for extended stretches of the post-intervention period.
Figure 3.
Gap in log(1 + mean sales count per LSOA) between the Core-4 treatment precinct and its synthetic control.
Under the baseline Core-4 specification, the mean post-intervention transformed gap is −0.391178. For substantive scale interpretation, the corresponding raw-scale comparison indicates an average post-intervention shortfall of −7.577603 in the mean residential sales count per LSOA. The primary inferential interpretation, however, rests on the transformed-scale fit and gap because this is the scale on which the synthetic-control model is estimated. Taken together, Figure 2 and Figure 3 show that the baseline Core-4 precinct recorded a persistent post-intervention shortfall in the mean residential sales count per LSOA relative to its synthetic counterfactual, rather than evidence of generalized local activation of housing-market turnover.
4.2. Placebo-Based Diagnostics for Residential Sales Turnover
To assess whether the observed turnover divergence is unusually large relative to untreated Manchester neighborhoods, placebo reassignment was conducted by iteratively treating each donor LSOA as a pseudo-treated unit and re-estimating the same synthetic-control procedure using the remaining donor LSOAs as the comparison set. For each placebo case, pre-intervention and post-intervention RMSPEs were calculated on the transformed outcome scale, and their ratio was compared with the corresponding ratio for the actual Core-4 treatment precinct.
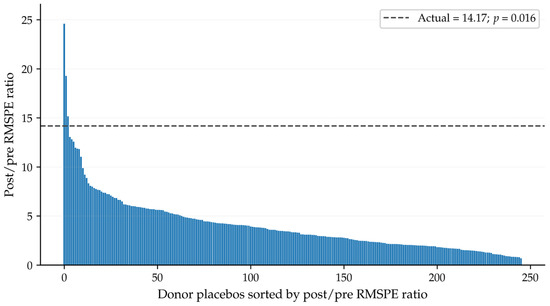
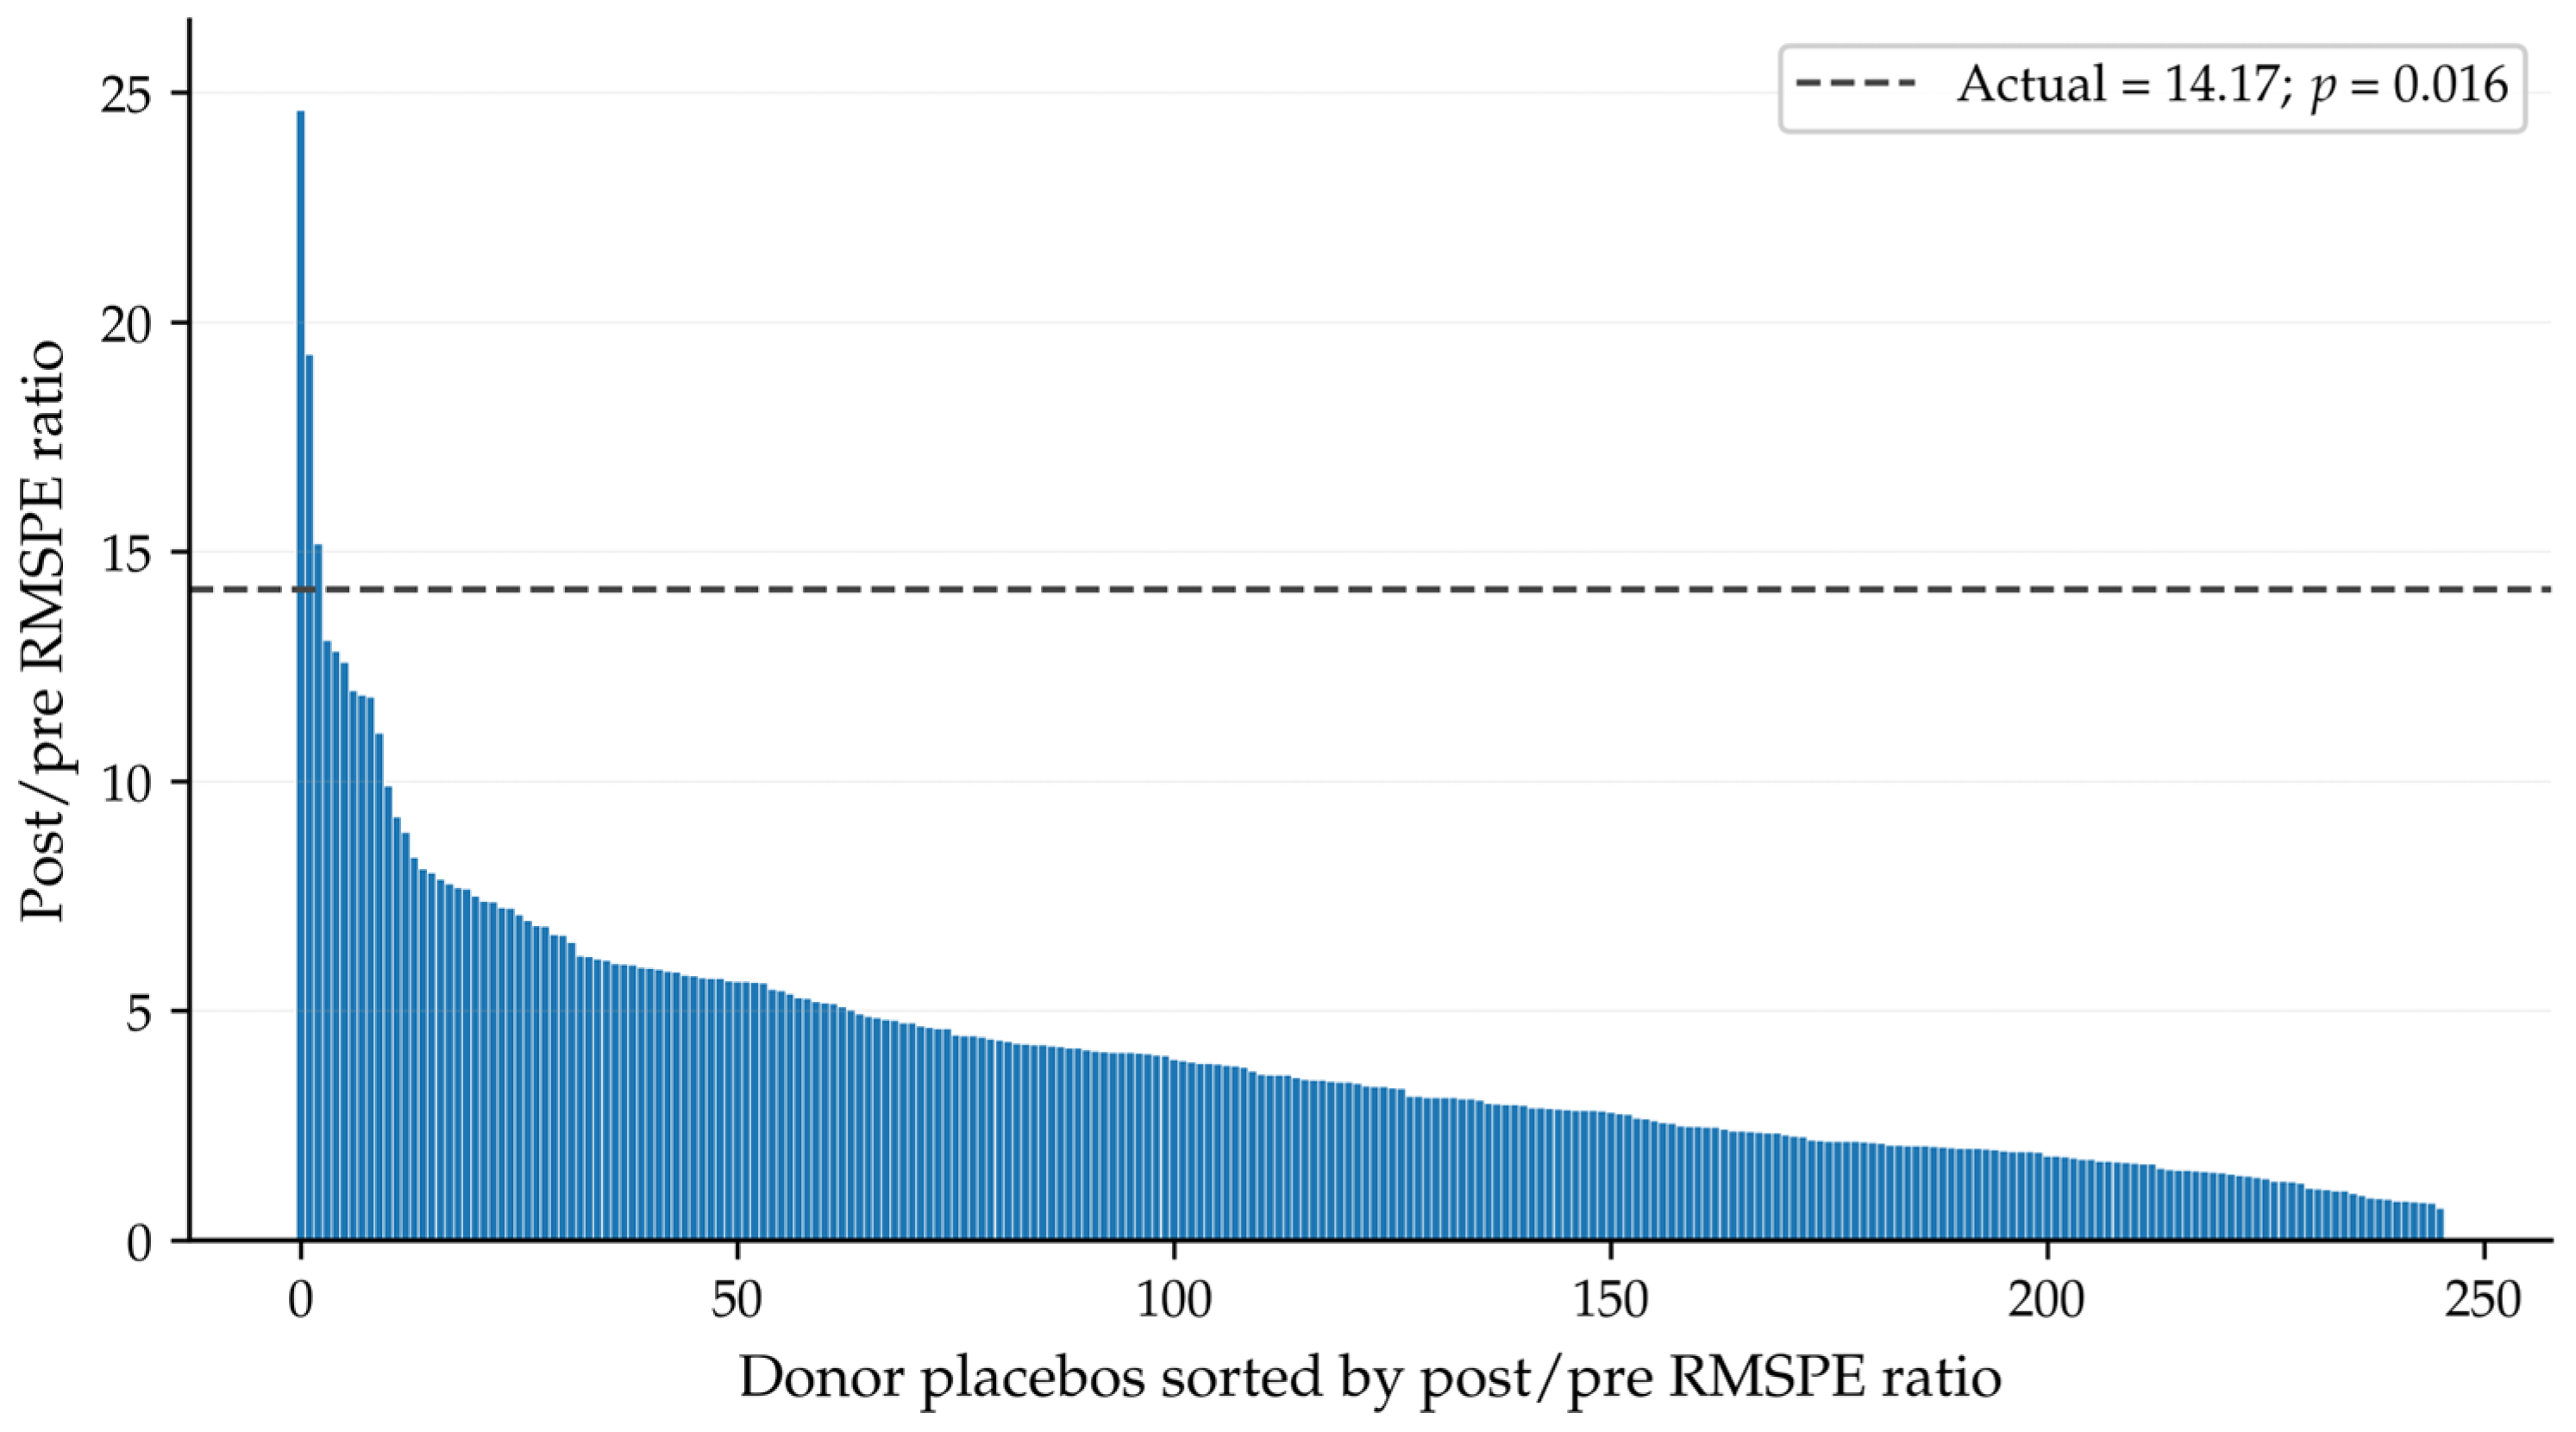
The placebo evidence indicates that the baseline sales result is not simply one among many similarly large donor-placebo deviations. The actual treated precinct records a pre-intervention RMSE of 0.031391 and a post-intervention RMSE of 0.444746 on the transformed scale, yielding a post/pre RMSPE ratio of 14.167958. In the placebo distribution, this ratio corresponds to a rank-based pseudo p-value of 0.016194. Figure 4 shows that the actual treated ratio lies near the upper tail of the donor-placebo distribution rather than near its center.
Figure 4.
Placebo distribution of post/pre RMSPE ratios for mean residential sales count per LSOA.
This result should not be interpreted as a conventional randomized-experiment p-value. Rather, it indicates that the deterioration in post-intervention fit for the treated precinct is unusually large relative to untreated Manchester LSOAs estimated under the same synthetic-control logic. In substantive terms, the placebo evidence supports the interpretation that the post-2014 turnover shortfall is not merely a routine fluctuation observed across many untreated neighborhoods. This diagnostic is most appropriately interpreted together with the robustness matrix reported in Section 4.3, which evaluates whether the negative turnover gap is retained across alternative treatment definitions and calibration windows. Table 5 summarizes the baseline fit and rank-based placebo diagnostics for the main sales outcome and the secondary house-price outcome.
Table 5.
Baseline SCM fit and rank-based placebo diagnostics for the main and secondary outcomes.
4.3. Robustness Across Treatment Definitions and Calibration Windows
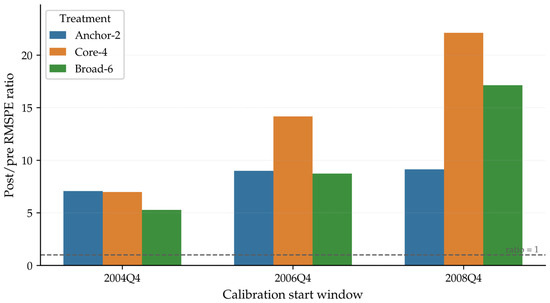
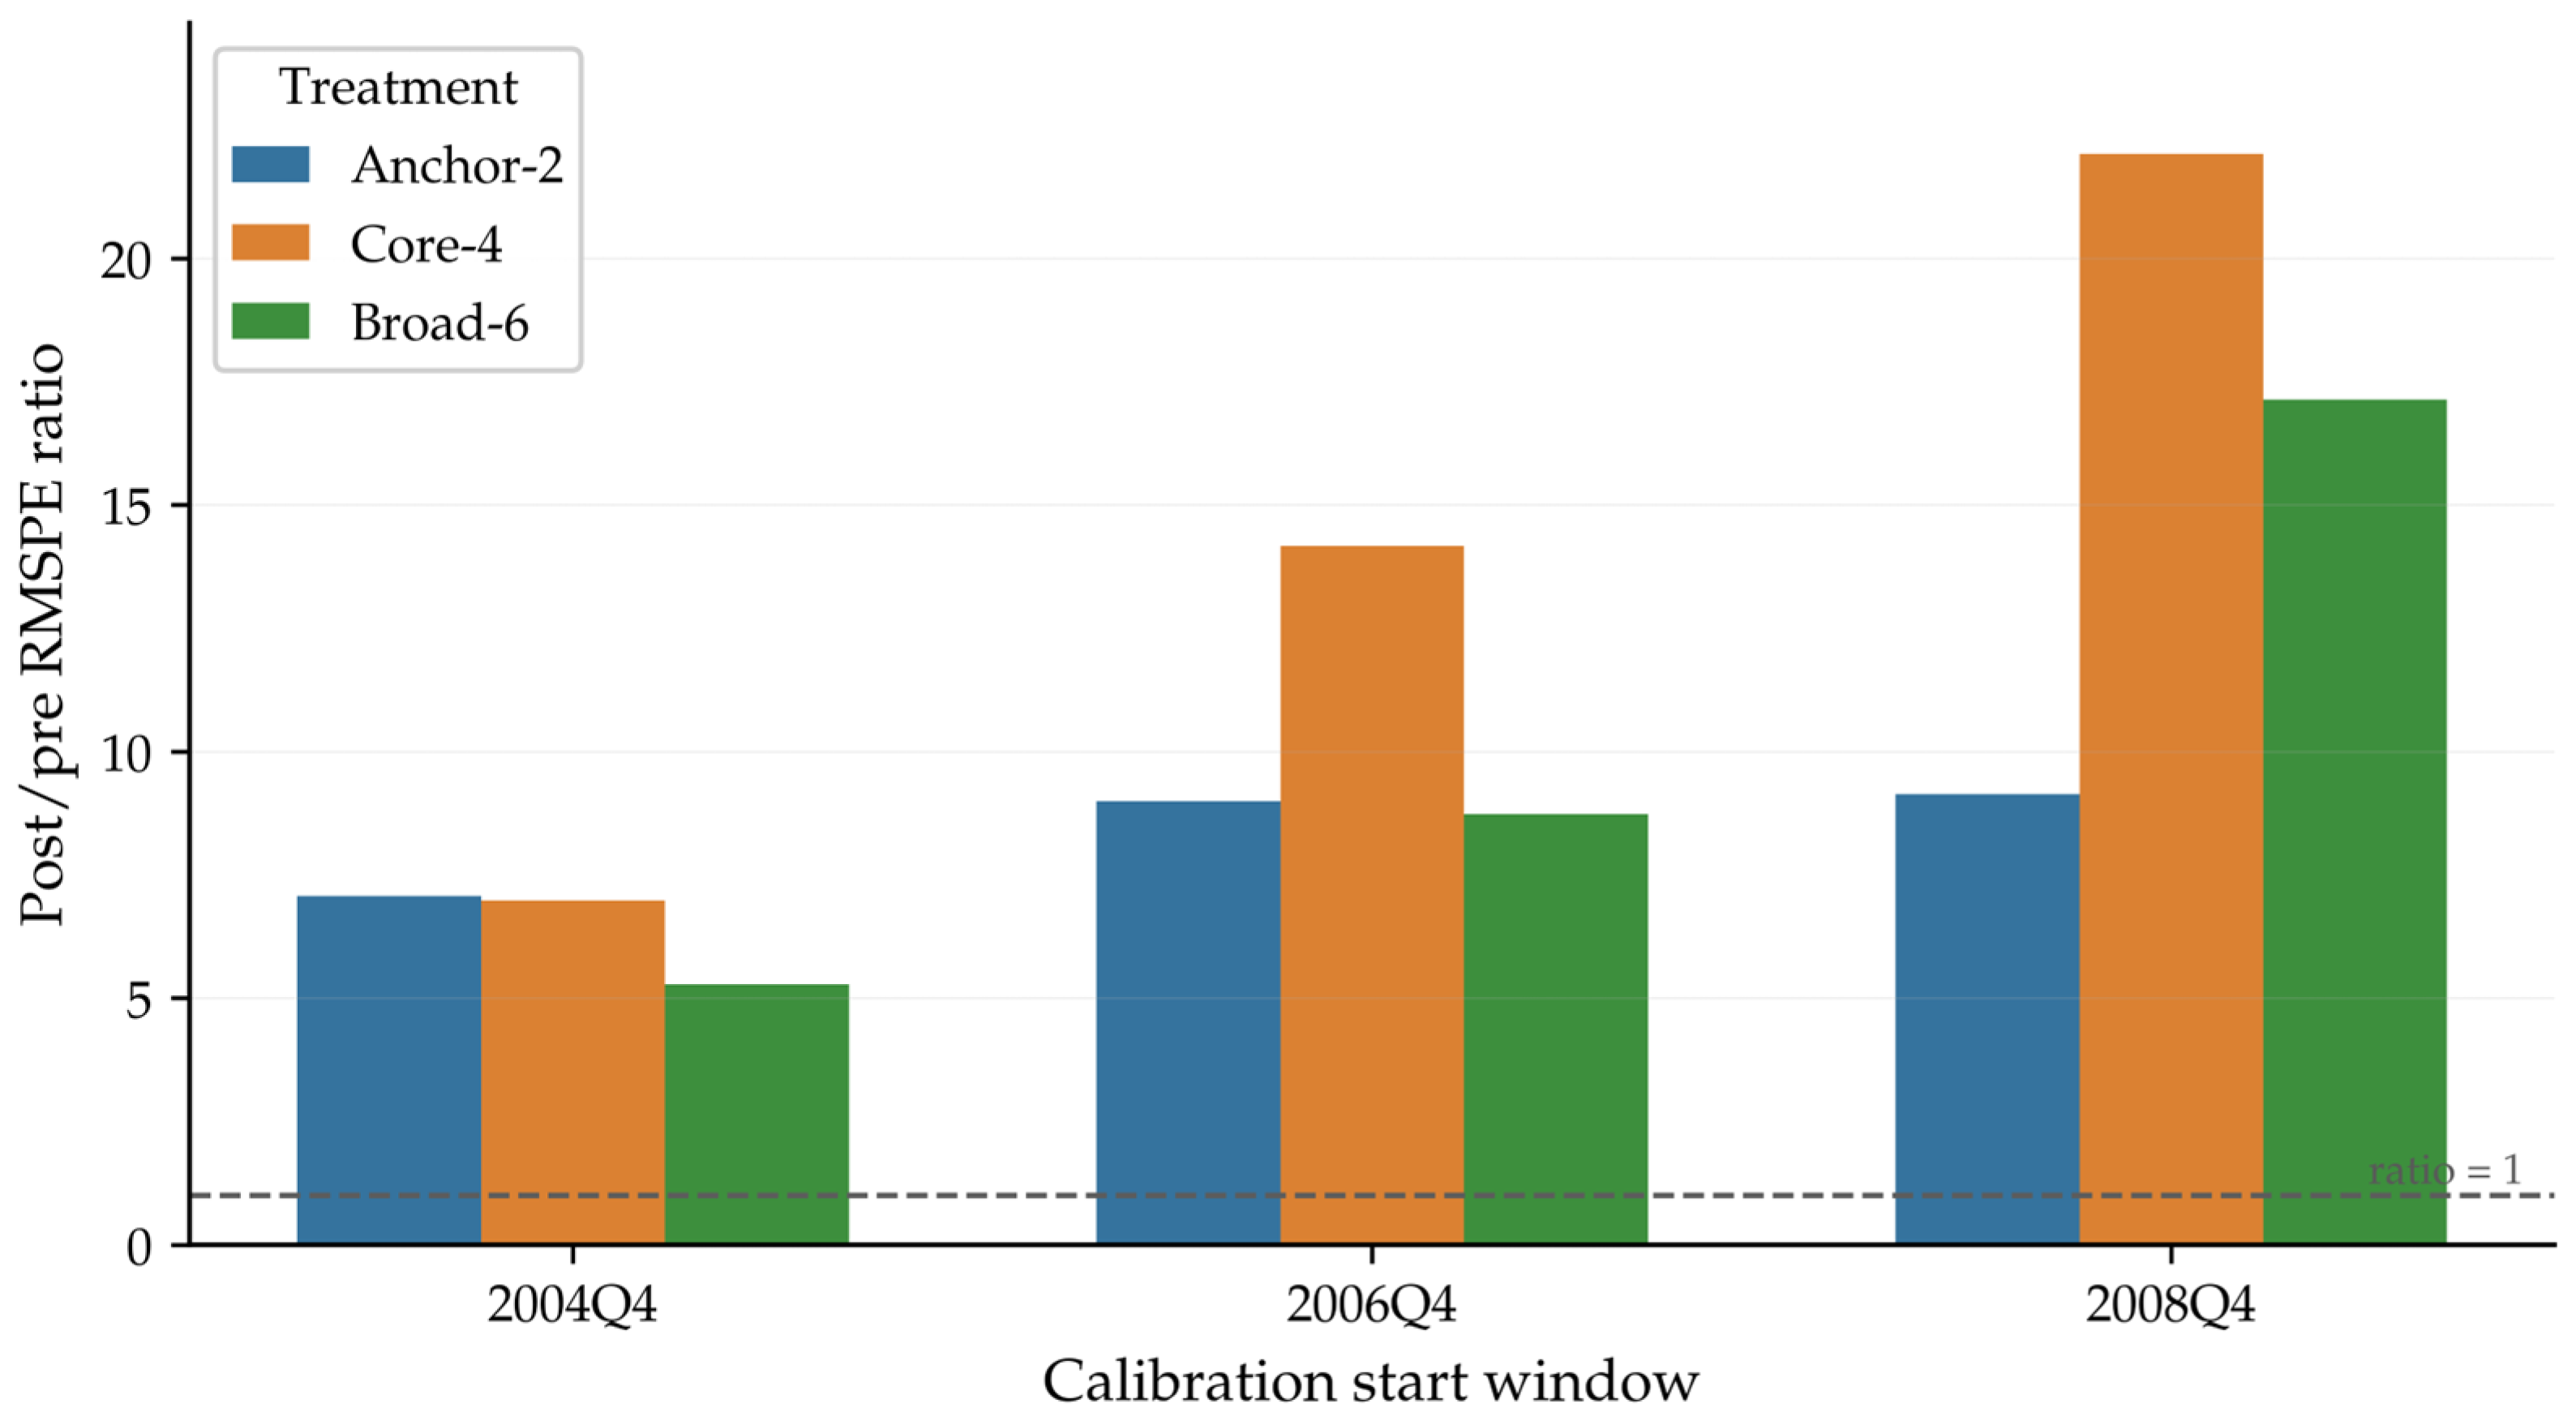
The robustness analysis evaluates whether the negative turnover result is retained under alternative spatial definitions of the treated precinct and alternative pre-intervention calibration windows. Consistent with the outcome construction described in Section 3, the sales outcome is measured as mean residential sales count per LSOA. The model is re-estimated under three treatment definitions—Anchor-2, Core-4, and Broad-6—and three calibration start windows—2004Q4, 2006Q4, and 2008Q4. This yields a nine-cell treatment-window matrix for the main turnover outcome.
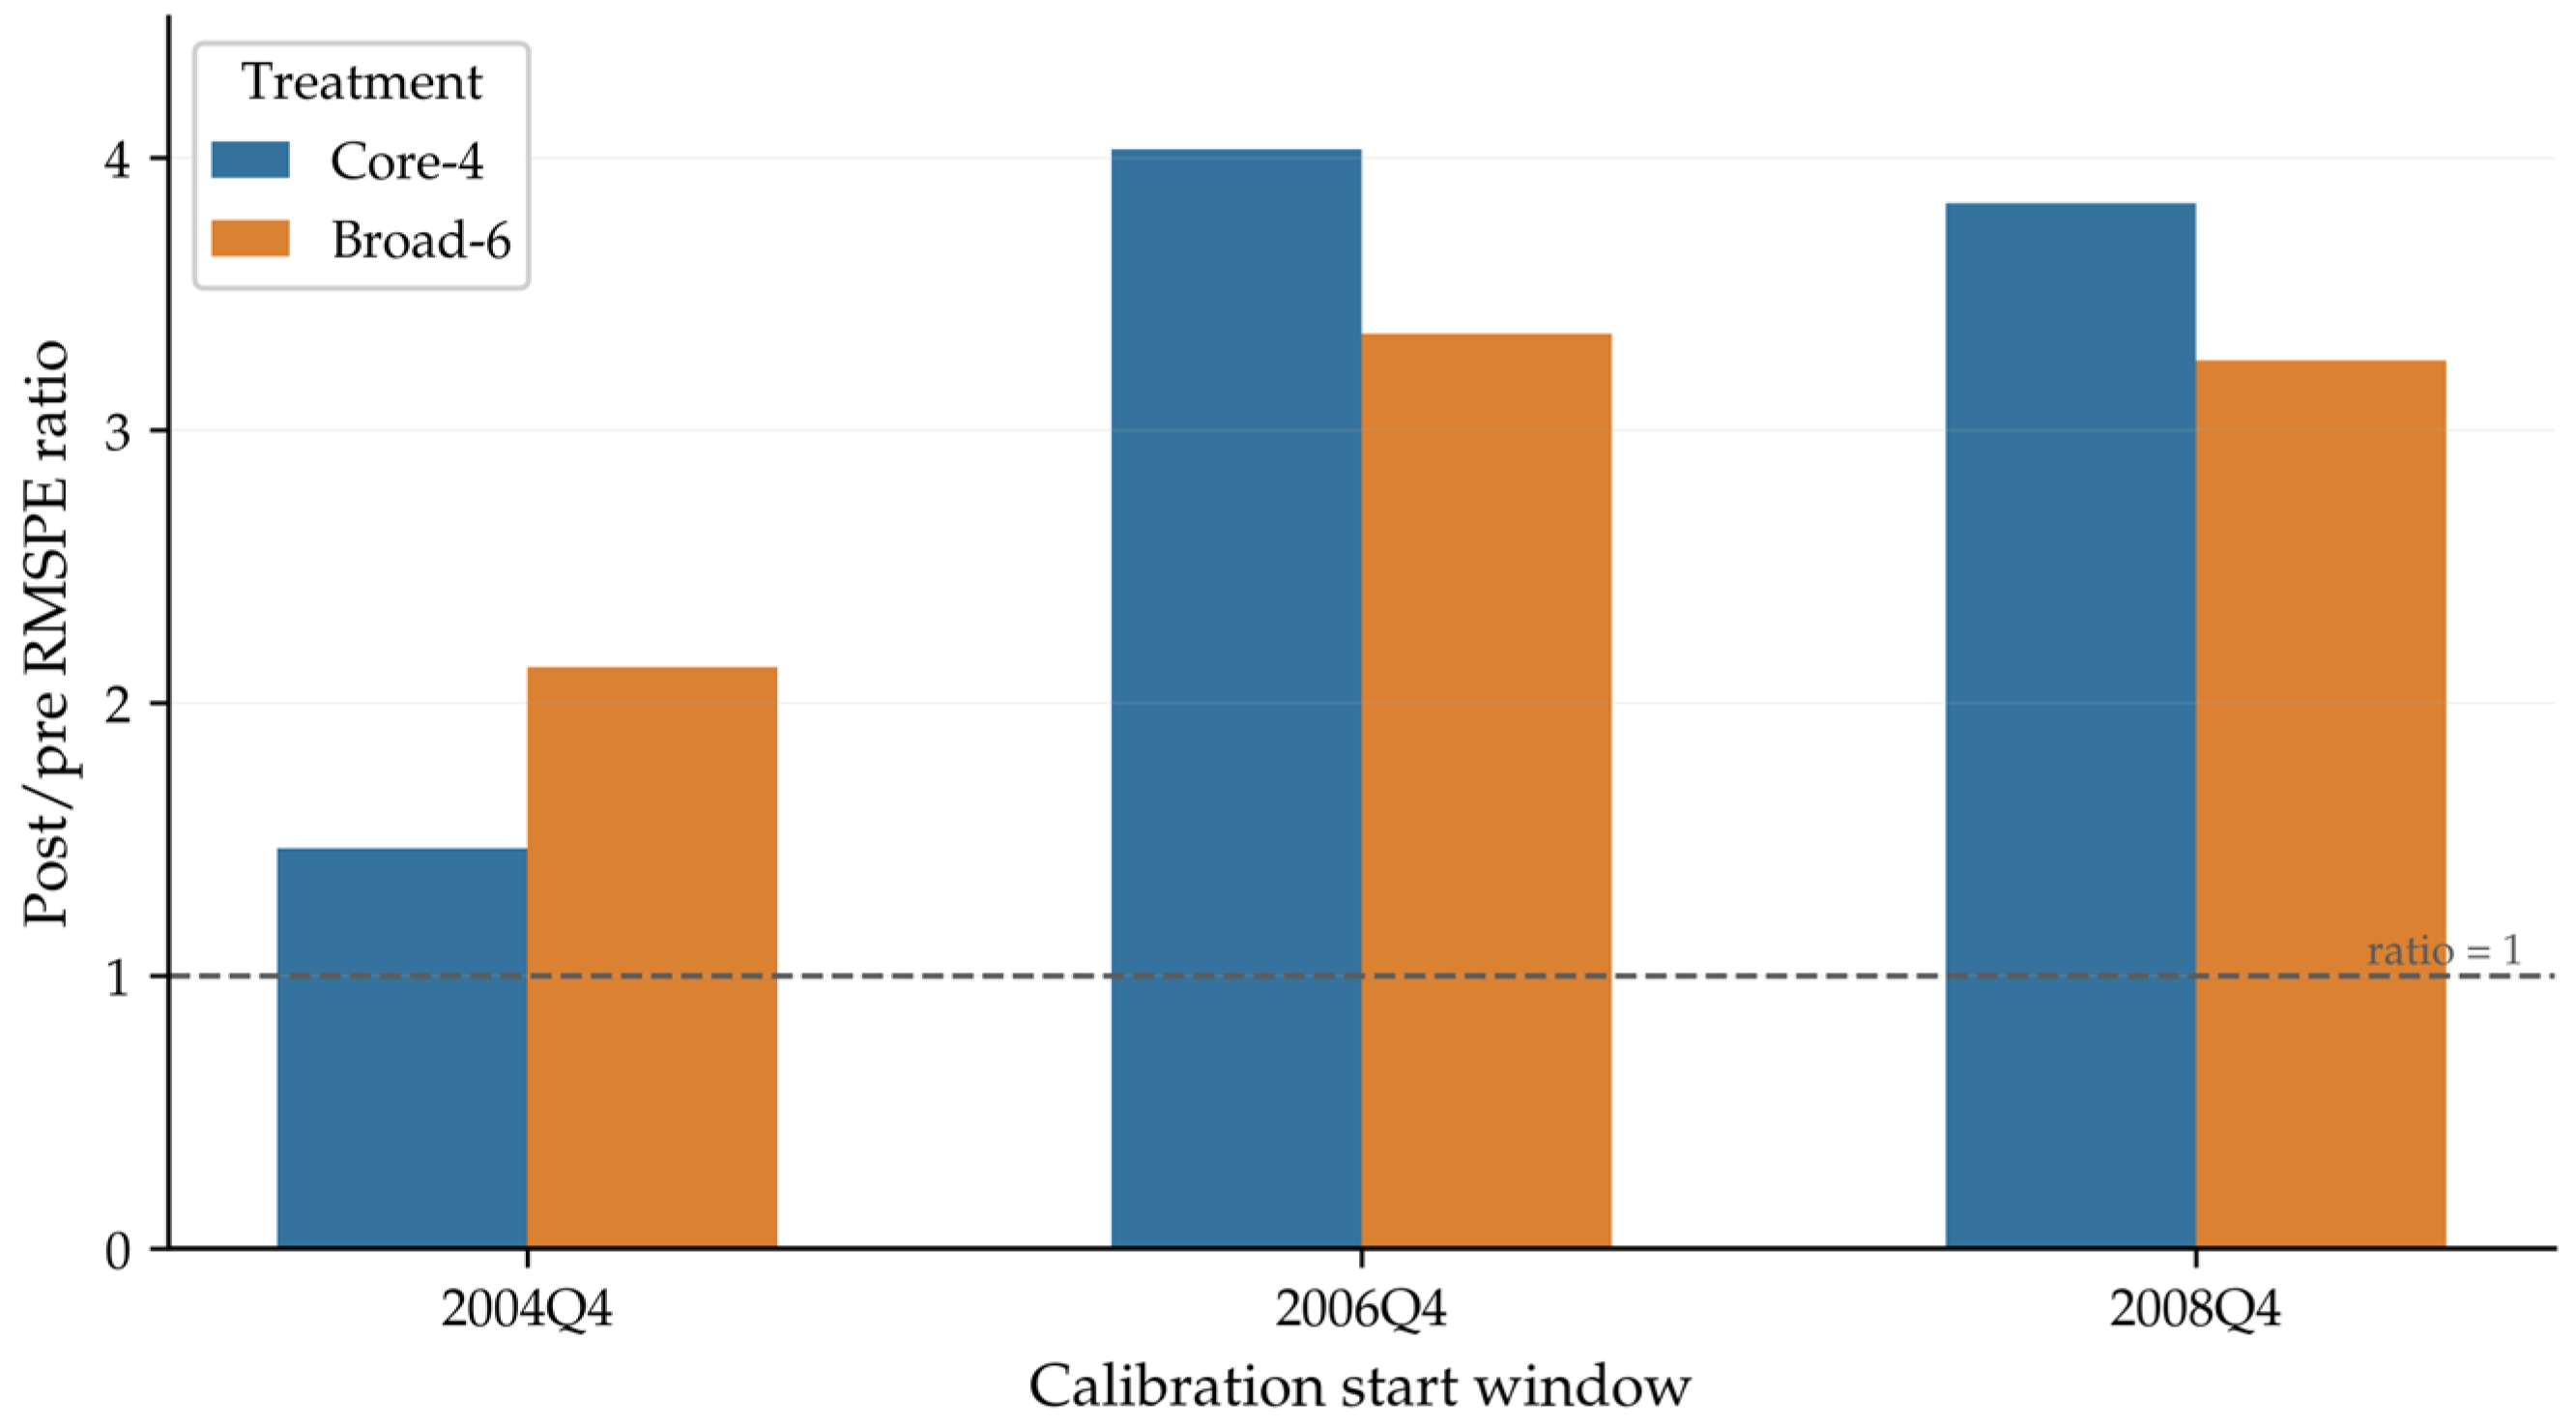
The robustness pattern is consistent across the tested specifications. Across all nine valid sales scenarios, the mean post-intervention gap remains negative on both the raw and transformed scales. The post/pre RMSPE ratio ranges from 5.27 to 22.11, and no valid sales scenario reverses the direction of the post-intervention turnover gap. Figure 5 shows that the post/pre RMSPE ratios remain above one across all treatment definitions and calibration windows, indicating that the post-intervention deterioration in fit is not confined to the baseline Core-4 specification.
Figure 5.
Post/pre RMSPE ratios for mean residential sales count per LSOA across treatment definitions and calibration start windows.
This pattern is important because it reduces the likelihood that the baseline turnover result is an artifact of one particular treatment boundary or one particular calibration window. The negative turnover gap is retained under the narrow Anchor-2 definition, the main Core-4 definition, and the wider Broad-6 definition, although the magnitude of the ratio varies across specifications. The result should therefore be interpreted as a consistent robustness pattern across the tested treatment-window matrix rather than as evidence that the exact magnitude of the turnover shortfall is invariant to design choice.
Table 6 summarizes the post/pre RMSPE ratios and the direction of the mean post-intervention gap across the sales robustness matrix. The Core-4 specification with the 2006Q4 calibration start remains the baseline specification, while the other cells show that the negative post-intervention gap in mean residential sales count per LSOA is retained under narrower and wider treatment definitions and under alternative start windows. The full sales robustness matrix is reported in Table A1.
Table 6.
Post/pre RMSPE ratios and gap direction for mean residential sales count per LSOA across treatment definitions and calibration start windows.
4.4. Secondary Valuation Evidence from the Price Outcome
The house-price analysis is reported as secondary valuation evidence rather than as the headline empirical result. Price remains important because valuation is a central benchmark in redevelopment, facility-impact, and capitalization research. However, price cannot, by itself, establish whether neighborhood market circulation strengthened or weakened. Consistent with the outcome construction described in Section 3, the price outcome is measured as the average of LSOA-level median house-price series within the treated precinct rather than as a pooled precinct-wide transaction median.
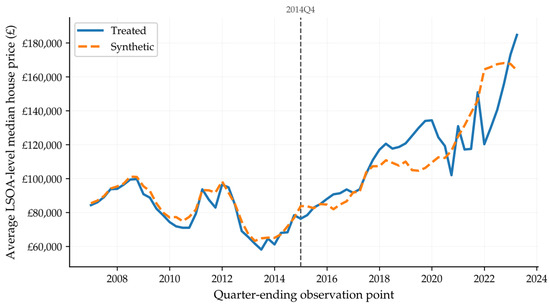
Under the same baseline logic used for the turnover model—Core-4 treatment, donor-moderate donor pool, 2006Q4 calibration start, and 2014Q4 intervention anchor—Figure 6 reports the treated and synthetic price trajectories on the raw scale for substantive interpretation. The treated and synthetic price paths are reasonably close during the pre-intervention period and diverge somewhat after the intervention anchor. In parts of the later post-intervention period, the treated price path lies above the synthetic counterpart, suggesting a limited positive relative valuation signal under the compact Core-4 definition. This pattern, however, should be interpreted cautiously because the price outcome is secondary and more sensitive to treatment definition than the turnover outcome. The corresponding transformed price-gap trajectory is reported in Figure A1.
Figure 6.
Raw-scale average of LSOA-level median house-price trajectories for the Core-4 treatment precinct and its synthetic control; the dashed vertical line marks the 2014Q4 intervention anchor.
The rank-based placebo diagnostics reinforce this cautious interpretation. Under the baseline price specification, the pre-intervention RMSE is 0.032428, and the post-intervention RMSE is 0.130657 on the transformed scale, yielding a post/pre RMSPE ratio of 4.029154. The corresponding rank-based pseudo p-value is 0.302013. This value indicates that the baseline price ratio is not unusually large relative to the donor-placebo distribution. Therefore, the price evidence does not provide the same degree of placebo-diagnostic support as the sales-turnover result.
The robustness pattern is also more mixed for price than for turnover. Across the valid price specifications summarized in Figure A2 and Table A2, post/pre RMSPE ratios vary across treatment definitions and calibration start windows, and the signs of the raw-scale and transformed post-intervention gaps are not uniformly positive. The Anchor-2 price specifications were invalid and are therefore not interpreted. Consequently, the price evidence should be treated as secondary and specification-sensitive. Its role is not to establish a decisive positive valuation effect but to show that valuation signals and turnover signals do not move together in a simple or interchangeable way within the same redevelopment precinct.
4.5. Empirical Synthesis
Taken together, the empirical evidence points to selective housing-market reconfiguration rather than to a uniformly positive pattern of neighborhood-market activation. The most strongly supported result concerns residential turnover, measured as the mean residential sales count per LSOA. Under the baseline Core-4 specification, the treated precinct followed a post-intervention turnover trajectory below its synthetic counterfactual. This pattern is visible in the transformed treated–synthetic trajectory, reinforced by the negative transformed gap, supported by the rank-based placebo diagnostics, and retained across all valid treatment-definition and calibration-window specifications for the turnover outcome.
By contrast, the house-price evidence is more tentative. The compact Core-4 specification shows a limited positive relative valuation signal in parts of the post-intervention period, but the placebo and robustness diagnostics do not support a strong or design-invariant valuation effect. For this reason, the price outcome is treated as secondary evidence on area-level valuation rather than as a decisive estimate of redevelopment-led price uplift.
The combined implication is a turnover–valuation divergence: transaction circulation weakened relative to the synthetic benchmark, whereas valuation evidence remained less stable. This divergence provides the empirical basis for interpreting the case as selective housing-market reconfiguration rather than uniform neighborhood-market activation.
5. Discussion
5.1. Reduced Turnover and Housing-Market Reconfiguration
The central implication of the results is that the Etihad Campus redevelopment precinct is better understood as a case of housing-market reconfiguration than as a case of generalized neighborhood-market activation. Under the baseline Core-4 specification, the treated precinct recorded a persistent post-intervention shortfall in mean residential sales count per LSOA relative to its within-Manchester synthetic counterfactual. This pattern is visible in the transformed treated–synthetic trajectory, reinforced by the negative transformed gap, supported by the rank-based placebo diagnostics, and retained across the tested treatment-definition and calibration-window specifications for the turnover outcome.
This result should not be interpreted as evidence of simple neighborhood decline. Lower turnover relative to the synthetic benchmark may reflect a change in how the local housing market functions rather than a collapse in demand. Several market processes are consistent with this interpretation. In a redevelopment precinct, owners may delay selling if they expect future appreciation, while potential buyers may become more selective as the area’s perceived market position changes. Transaction circulation may also weaken if the local market becomes more oriented toward longer holding periods, fewer completed matches, or a narrower set of active market participants. These pathways point to market selectivity and liquidity rather than to price change alone. These mechanisms cannot be directly identified from the available aggregate small-area data, but they provide plausible interpretations of why a visibly transformed precinct may record weaker transaction circulation than comparable untreated neighborhoods.
The important point is therefore not whether the Etihad Campus should be classified as a regeneration success or failure. The results do not support a simple narrative in which the redevelopment precinct broadly activated the surrounding housing market. At the same time, they do not support a simple account of generalized market deterioration. The more defensible interpretation is narrower: after the 2014Q4 intervention anchor, the treated precinct followed a housing-market trajectory characterized by a lower mean residential sales count per LSOA than its synthetic counterfactual.
5.2. Diverging Turnover and Valuation Signals
A second implication is that turnover and valuation should not be treated as interchangeable indicators of neighborhood-market change. The turnover result is the more strongly supported empirical signal, while the price result remains secondary and more sensitive to design choice. This does not make the price outcome irrelevant; it defines its role as complementary valuation evidence that should be read alongside—not instead of—the turnover result.
This divergence is analytically important because prices and turnover capture different dimensions of the housing market. The price outcome reflects area-level valuation and capitalization, whereas turnover reflects transaction circulation and market liquidity. Therefore, a redevelopment precinct may show a relative valuation signal without producing a corresponding increase in transaction activity. Conversely, a local housing market may become more active without a clear valuation premium. These outcomes should not be collapsed into a single measure of redevelopment performance.
The Etihad case illustrates why this distinction matters. If the case were assessed only through the compact Core-4 price trajectory, the interpretation might lean toward a qualified positive valuation reading. If it were assessed only through turnover, the interpretation would be more cautious. The present analysis shows that the two readings can coexist because they refer to different dimensions of housing-market behavior. The more precise interpretation is therefore not a contradiction between the two outcomes but a divergence between market circulation and valuation within the same redevelopment precinct.
This interpretation is also constrained by the construction of the price outcome. The house-price series is an average of LSOA-level median-price trajectories within the treated precinct, not a pooled precinct-wide transaction median. The price result should therefore be read as secondary evidence on relative area-level valuation patterns rather than as a definitive estimate of a single integrated neighborhood market price. This strengthens—rather than weakening—the need to interpret price and turnover as complementary but non-equivalent indicators.
5.3. Implications for Real Estate and Housing-Market Evaluation in Redevelopment Precincts
The findings have broader implications for real estate and housing-market evaluation in redevelopment precincts. First, the analysis shows that single-indicator evaluation is inadequate. A valuation-oriented assessment alone could suggest a qualified positive reading under the compact Core-4 specification. A turnover-oriented assessment alone would produce a more cautious interpretation. The value of the combined approach is that it shows how these two readings can coexist within the same redevelopment setting.
Second, the results suggest that redevelopment precincts may reshape local housing markets without expanding them in a broad-based way. A major physical transformation may alter the positioning, perception, or selectivity of a local market without necessarily increasing transaction circulation. In this sense, redevelopment may reorganize market behavior, even when it does not produce generalized neighborhood activation. For housing-market evaluation, this distinction matters because redevelopment can change how a market functions, not only how it is priced. This point is particularly important in cumulative redevelopment settings, where multiple layers of investment, planning intervention, and local market adjustment overlap over time.
Third, the study supports a multidimensional approach to housing-market evaluation. At a minimum, redevelopment assessment should distinguish between valuation and turnover. More broadly, it should recognize that housing-market outcomes are not exhausted by price signals. A precinct may become more highly valued, more selective, less liquid, or less frequently traded, and these patterns have different implications for housing-market management. Evaluation frameworks should therefore treat price capitalization and transaction circulation as related but separate dimensions of redevelopment-related market change.
In the Etihad case, the evidence points more clearly toward disconnection than uniform activation. The treated precinct recorded a persistent turnover shortfall relative to its synthetic benchmark, while the valuation evidence remained secondary and mixed. This does not mean that the redevelopment precinct failed in a simple sense. It means that its surrounding housing-market response was selective and multidimensional. Evaluation frameworks that rely only on visible redevelopment, headline prices, or a single market indicator risk missing this structure.
5.4. Scope and Limitations
The interpretation offered here should remain bounded by the scope of the empirical design. The first limitation concerns causal scope. The study does not identify the Etihad Campus as the sole causal driver of every observed neighborhood-market change in East Manchester. The precinct is embedded in a broader redevelopment setting shaped by earlier regeneration policy, public and private investment, land restructuring, and wider urban change. The synthetic-control design addresses this complexity by comparing the treated precinct with a structured within-Manchester counterfactual, but it does not transform the case into a pure single-shock experiment.
The second limitation concerns the mechanism. The study identifies a persistent post-intervention shortfall in the mean residential sales count per LSOA relative to the synthetic benchmark, but it does not directly observe the channels through which this turnover pattern emerged. The available data allow the analysis to track small-area sales counts and median prices, but they do not reveal buyer and seller composition, tenure structure, holding periods, household mobility, or the detailed search-and-matching processes underlying transactions. For this reason, the Discussion frames mechanisms such as market selectivity, longer holding periods, and altered mobility as plausible interpretations rather than as directly demonstrated causal channels.
Future empirical work could test these mechanisms more directly. Ownership and repeat-sales records could examine whether longer holding periods or delayed selling contributed to the turnover shortfall. Transaction-level data with buyer and seller characteristics could test whether market participation became more selective. Tenure and household-mobility data could assess whether lower turnover reflected tenure stabilization, reduced mobility, or changes in the composition of moving households. These mechanisms are therefore presented as empirically testable pathways rather than as causal channels demonstrated by the present aggregate data.
The third limitation concerns the construction and interpretation of the price outcome. The house-price series is based on the arithmetic mean of LSOA-level median-price trajectories across the treated precinct rather than on transaction-level microdata from which a pooled precinct-wide market median could be reconstructed. The price results should therefore be interpreted as secondary evidence on relative area-level valuation patterns within the treated precinct, not as a definitive estimate of a single pooled neighborhood-market median. This limitation reinforces the need to treat the price evidence as secondary and mixed while relying more heavily on the turnover evidence as the main empirical signal.
The fourth limitation is that the study evaluates housing-market trajectories associated with a redevelopment precinct rather than directly measuring parcel-level land-use conversion, built-form change, or household-level displacement. Therefore, the empirical design does not capture every spatial and social transformation occurring within East Manchester. Its value lies in providing a disciplined counterfactual assessment of whether the treated precinct’s housing-market trajectory diverged from comparable untreated Manchester neighborhoods after the 2014Q4 intervention anchor.
Taken together, these limitations imply that the strongest defensible conclusion is a bounded one. The study provides evidence that post 2014, the Etihad Campus redevelopment precinct was associated with a persistent shortfall in the mean residential sales count per LSOA relative to a within-Manchester synthetic counterfactual, while the house-price evidence remained secondary and mixed. This pattern is sufficient to challenge simplified interpretations of redevelopment as uniformly activating or uniformly positive, but it is not sufficient to reduce the case to a single mechanism or a single-cause story. The value of the study lies precisely in this narrower and more disciplined claim: redevelopment precincts may reshape housing-market behavior in selective ways that are visible only when turnover and valuation are evaluated separately.
6. Conclusions
This study examined whether housing-market trajectories around the Etihad Campus redevelopment precinct in East Manchester diverged from a within-Manchester synthetic counterfactual after the 2014Q4 consolidation of the wider campus setting. Using a neighborhood-scale synthetic control design, the analysis evaluated two complementary dimensions of housing-market change: residential turnover, measured as the mean residential sales count per LSOA, and valuation, measured as the average of LSOA-level median house-price trajectories. The results show that these two dimensions did not move in a uniform way after the intervention anchor.
The main empirical result is a persistent post-2014 shortfall in the mean residential sales count per LSOA in the Core-4 precinct relative to its synthetic benchmark. This turnover pattern is supported by the transformed treated–synthetic trajectory, the negative gap series, rank-based placebo diagnostics, and the robustness matrix across alternative treatment definitions and calibration start windows. By contrast, the valuation evidence remains secondary and mixed. The compact Core-4 specification provides a limited positive relative price signal in parts of the post-intervention period, but the baseline price ratio is not unusually large relative to the donor-placebo distribution, and the price robustness pattern is more sensitive to the treatment definition and calibration window.
The central conclusion is therefore not that the Etihad Campus produced a uniform housing-market uplift. Rather, the evidence indicates selective housing-market reconfiguration: transaction circulation weakened relative to the counterfactual, while price-based valuation evidence remained weaker, mixed, and more specification-sensitive. This distinction matters for redevelopment evaluation. A price-only reading could overstate the degree of neighborhood-market activation, while a turnover-only reading would miss the more tentative valuation signal. Redevelopment precincts should therefore be evaluated through both market circulation and price-based valuation, especially where visible physical transformation may not translate into broad-based housing-market activation.
This conclusion remains bounded by the empirical design. The study does not identify the Etihad Campus as the sole causal driver of every observed change in East Manchester, nor does it directly observe the mechanisms through which the turnover shortfall emerged. The analysis relies on small-area aggregate sales and price data rather than transaction-level, household-level, ownership, tenure, or parcel-level evidence. Future research using transaction microdata, ownership and tenure information, household-mobility evidence, or parcel-level land-use and built-form data is needed to identify these mechanisms more directly. Even with these limits, the study provides counterfactual evidence that redevelopment precincts may reshape housing-market behavior in selective ways that become visible only when turnover and valuation are evaluated separately.
Funding
This research received no external funding.
Data Availability Statement
The original contributions presented in this study are included in the article. Further inquiries can be directed to the corresponding author.
Conflicts of Interest
The author declares no conflicts of interest.
Appendix A
Figure A1.
Gap in log(average LSOA-level median house price) between the Core-4 treatment precinct and its synthetic control.
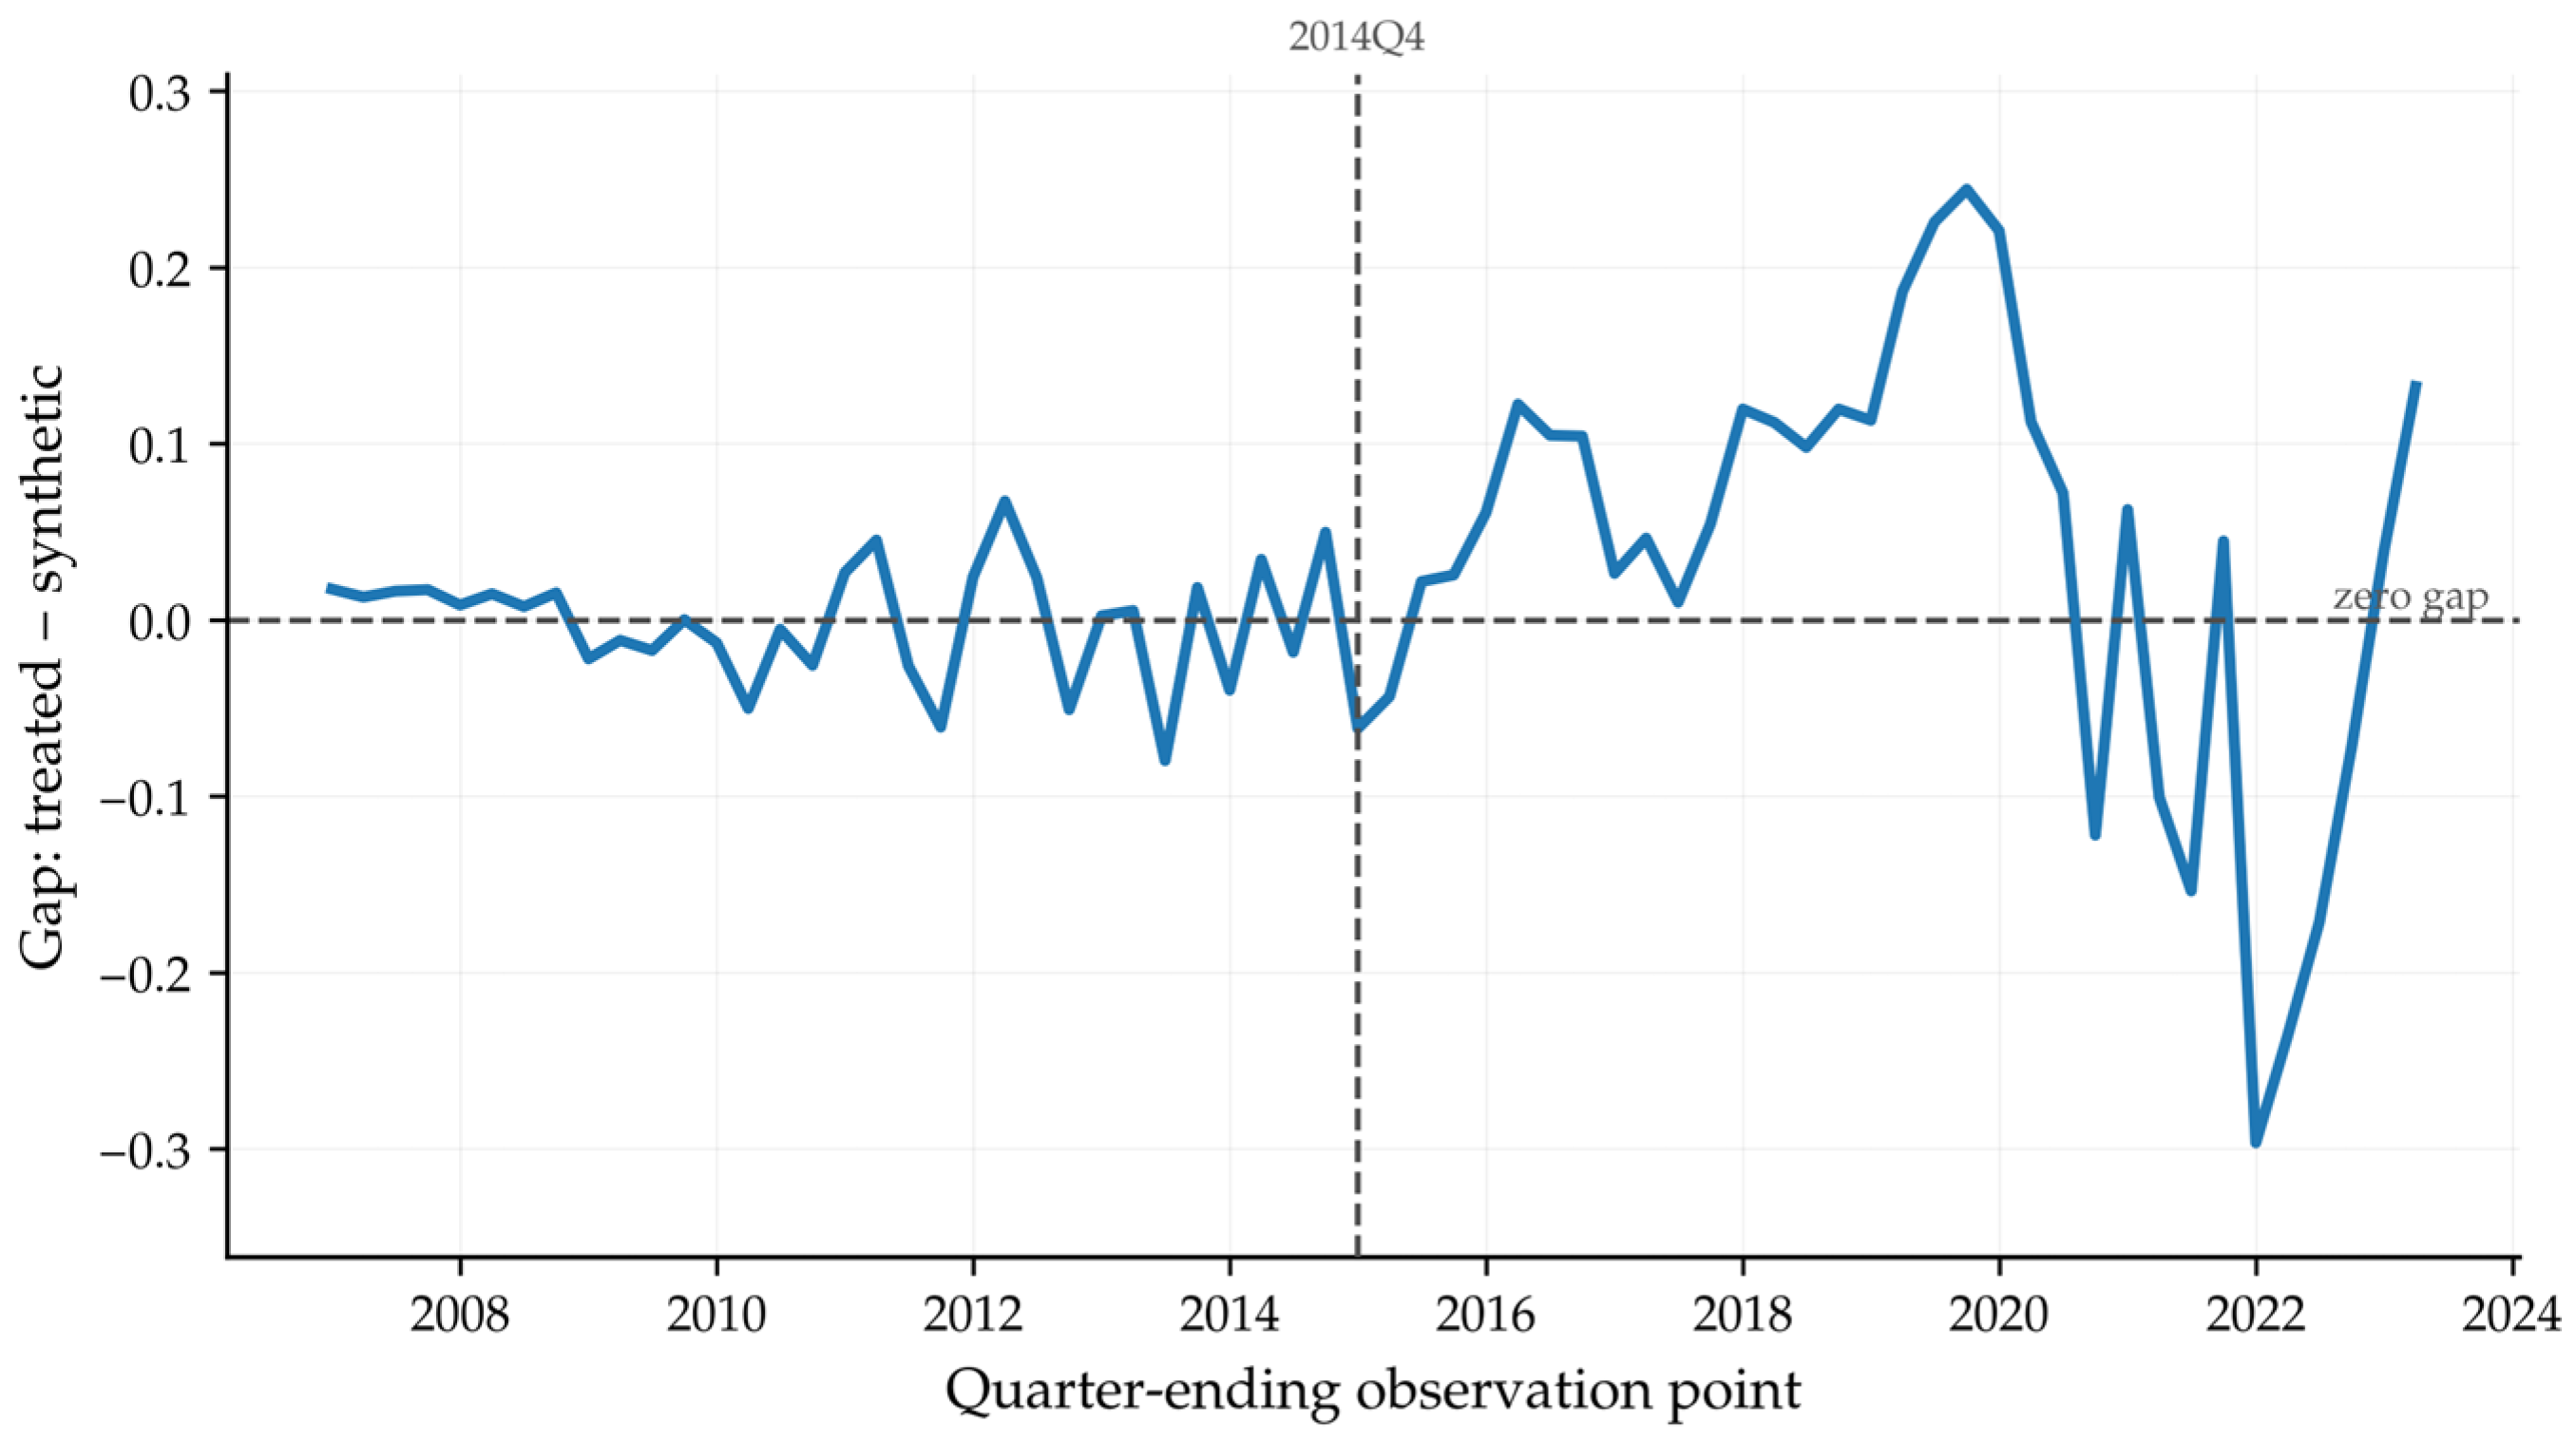
Figure A2.
Post/pre RMSPE ratios for the house-price robustness matrix; Anchor-2 specifications were invalid and are omitted.
Appendix B
Table A1.
Robustness-matrix summary for mean residential sales count per LSOA.
Table A2.
Robustness-matrix summary for house prices.
References
- Ahlfeldt, G.M.; Kavetsos, G. Form or function? The effect of new sports stadia on property prices in London. J. R. Stat. Soc. Ser. A Stat. Soc. 2014, 177, 169–190. [Google Scholar] [CrossRef] [Scilit]
- Propheter, G. Sports facilities as a housing amenity: Do prices follow facilities? J. Sports Econ. 2023, 24, 443–474. [Google Scholar] [CrossRef] [Scilit]
- Bradbury, J.C.; Coates, D.; Humphreys, B.R. The impact of professional sports franchises and venues on local economies: A comprehensive survey. J. Econ. Surv. 2023, 37, 1389–1431. [Google Scholar] [CrossRef] [Scilit]
- Stein, J.C. Prices and trading volume in the housing market: A model with down-payment effects. Q. J. Econ. 1995, 110, 379–406. [Google Scholar] [CrossRef] [Scilit]
- Genesove, D.; Han, L. Search and matching in the housing market. J. Urban Econ. 2012, 72, 31–45. [Google Scholar] [CrossRef] [Scilit]
- Fiorelli, C.; Marzano, E.; Piselli, P.; Rubinacci, R. The role of house prices and transactions in monetary policy transmission: The case of Italy. Ital. Econ. J. 2025, 11, 1239–1266. [Google Scholar] [CrossRef] [Scilit]
- Smith, A.; Fox, T. From ‘event-led’ to ‘event-themed’ regeneration: The 2002 Commonwealth Games Legacy Programme. Urban Stud. 2007, 44, 1125–1143. [Google Scholar] [CrossRef] [Scilit]
- Evans, B. The politics of partnership: Urban regeneration in New East Manchester. Public Policy Adm. 2007, 22, 201–215. [Google Scholar] [CrossRef] [Scilit]
- Mace, A.; Hall, P.; Gallent, N. New East Manchester: Urban renaissance or urban opportunism? Eur. Plan. Stud. 2007, 15, 51–65. [Google Scholar] [CrossRef] [Scilit]
- Lewis, C. Turning houses into homes: Living through urban regeneration in East Manchester. Environ. Plan. A 2017, 49, 1324–1340. [Google Scholar] [CrossRef] [Scilit]
- HM Treasury; Department for Culture, Media and Sport. Chancellor Opens £200 Million Manchester City Football Academy. Available online: https://www.gov.uk/government/news/chancellor-opens-200-million-manchester-city-football-academy (accessed on 30 April 2026).
- Manchester Community Central. Eastlands Regeneration Framework. Available online: https://manchestercommunitycentral.org/news/eastlands-regeneration-framework (accessed on 16 June 2026).
- Abadie, A.; Gardeazabal, J. The economic costs of conflict: A case study of the Basque Country. Am. Econ. Rev. 2003, 93, 113–132. [Google Scholar] [CrossRef] [Scilit]
- Abadie, A.; Diamond, A.; Hainmueller, J. Synthetic control methods for comparative case studies: Estimating the effect of California’s tobacco control program. J. Am. Stat. Assoc. 2010, 105, 493–505. [Google Scholar] [CrossRef] [Scilit]
- Abadie, A. Using synthetic controls: Feasibility, data requirements, and methodological aspects. J. Econ. Lit. 2021, 59, 391–425. [Google Scholar] [CrossRef] [Scilit]
- Ferman, B.; Pinto, C.; Possebom, V. Cherry picking with synthetic controls. J. Policy Anal. Manag. 2020, 39, 510–532. [Google Scholar] [CrossRef] [Scilit]
- Yu, B.; Yan, D.; Wu, H.; Wang, J.; Chen, S. A novel prediction model for the sales cycle of second-hand houses based on the hybrid kernel extreme learning machine optimized using the improved crested porcupine optimizer. Buildings 2025, 15, 1200. [Google Scholar] [CrossRef] [Scilit]
- Al-Nassar, N.S. Exploring the nexus between the land and housing markets in Saudi Arabia amid transformative regulatory reforms. Buildings 2025, 15, 3354. [Google Scholar] [CrossRef] [Scilit]
- Şişman, S.; Kara, A.; Aydınoğlu, A.C. Exploring the impact of different clustering algorithms on the performance of ensemble learning-based mass appraisal models. Buildings 2026, 16, 615. [Google Scholar] [CrossRef] [Scilit]
- Salvo, F.; Zupi, M.; De Ruggiero, M. Land consumption and urban regeneration. Evaluation principles and choice criteria. In New Metropolitan Perspectives. ISHT 2018; Calabrò, F., Della Spina, L., Bevilacqua, C., Eds.; Smart Innovation, Systems and Technologies; Springer: Cham, Switzerland, 2019; Volume 100, pp. 582–589. [Google Scholar] [CrossRef] [Scilit]
- Thomson, A.; Cuskelly, G.; Toohey, K.; Kennelly, M.; Burton, P.; Fredline, L. Sport event legacy: A systematic quantitative review of literature. Sport Manag. Rev. 2019, 22, 295–321. [Google Scholar] [CrossRef] [Scilit]
- Tu, C.C. How does a new sports stadium affect housing values? The case of FedEx Field. Land Econ. 2005, 81, 379–395. [Google Scholar] [CrossRef] [Scilit]
- Ahlfeldt, G.M.; Maennig, W. Impact of sports arenas on land values: Evidence from Berlin. Ann. Reg. Sci. 2010, 44, 205–227. [Google Scholar] [CrossRef] [Scilit]
- Humphreys, B.R.; Zhou, L. Sports facilities, agglomeration, and public subsidies. Reg. Sci. Urban Econ. 2015, 54, 60–73. [Google Scholar] [CrossRef] [Scilit]
- Davies, L.E. Sport and the local economy: The effects of stadia development on the commercial property market. Local Econ. 2008, 23, 31–46. [Google Scholar] [CrossRef] [Scilit]
- Panton, M.; Walters, G. It’s just a Trojan horse for gentrification: Austerity and stadium-led regeneration. Int. J. Sport Policy Politics 2018, 10, 163–183. [Google Scholar] [CrossRef] [Scilit]
- Hort, K. Prices and turnover in the market for owner-occupied homes. Reg. Sci. Urban Econ. 2000, 30, 99–119. [Google Scholar] [CrossRef] [Scilit]
- de Wit, E.R.; Englund, P.; Francke, M.K. Price and transaction volume in the Dutch housing market. Reg. Sci. Urban Econ. 2013, 43, 220–241. [Google Scholar] [CrossRef] [Scilit]
- Akkoyun, H.C.; Arslan, Y.; Kanık, B. Housing prices and transaction volume. J. Hous. Econ. 2013, 22, 119–134. [Google Scholar] [CrossRef] [Scilit]
- Cochrane, A.; Peck, J.; Tickell, A. Manchester plays games: Exploring the local politics of globalisation. Urban Stud. 1996, 33, 1319–1336. [Google Scholar] [CrossRef] [Scilit]
- Smith, A. The development of “sports-city” zones and their potential value as tourism resources for urban areas. Eur. Plan. Stud. 2010, 18, 385–410. [Google Scholar] [CrossRef] [Scilit]
- Lewis, C. ‘Regenerating community’? Urban change and narratives of the past. Sociol. Rev. 2016, 64, 912–928. [Google Scholar] [CrossRef] [Scilit]
- Office for National Statistics. House Price Statistics for Small Areas in England and Wales. Available online: https://www.ons.gov.uk/peoplepopulationandcommunity/housing/bulletins/housepricestatisticsforsmallareas/yearendingmarch2023 (accessed on 30 April 2026).
- Office for National Statistics. Residential Property Sales by Lower Layer Super Output Area: HPSSA Dataset 41. Available online: https://www.ons.gov.uk/peoplepopulationandcommunity/housing/datasets/numberofresidentialpropertysalesbylowerlayersuperoutputareahpssadataset41 (accessed on 30 April 2026).
- Office for National Statistics. Median House Prices by Lower Layer Super Output Area: HPSSA Dataset 46. Available online: https://www.ons.gov.uk/peoplepopulationandcommunity/housing/datasets/medianpricepaidbylowerlayersuperoutputareahpssadataset46 (accessed on 30 April 2026).
- Office for National Statistics. Data and Analysis from Census 2021 Geographies. Available online: https://www.ons.gov.uk/methodology/geography/ukgeographies/censusgeographies/census2021geographies (accessed on 30 April 2026).

Disclaimer/Publisher’s Note: The statements, opinions and data contained in all publications are solely those of the individual author(s) and contributor(s) and not of MDPI and/or the editor(s). MDPI and/or the editor(s) disclaim responsibility for any injury to people or property resulting from any ideas, methods, instructions or products referred to in the content. |
© 2026 by the author. Licensee MDPI, Basel, Switzerland. This article is an open access article distributed under the terms and conditions of the Creative Commons Attribution (CC BY) license.