


Abstract
Contemporary buildings and urban spaces are increasingly expected to support psychological well-being—a quality often termed “restorativeness.” Conventional approaches to quantifying restorativeness rely on subjective surveys or coarse green metrics, failing to capture how specific building morphologies and street-level visual configurations shape restorative experiences, particularly for stress-prone groups such as young adults. This study develops a deep-learning-driven framework linking building visual elements to youth-specific perceived restorativeness, using Changsha, China, as a testbed. The framework comprises three AI-powered modules: the TrueSkill algorithm trains a deep learning model to predict six dimensions of youth perception (e.g., beautiful, clean, safe) from pairwise comparisons of street view images; the Mask2Former architecture segments street-level imagery into 18 building and street attributes; and the XGBoost-SHAP pipeline uncovers nonlinear associations and threshold-like patterns between these attributes and the composite Built Environment Restorativeness Index (BERI). Results reveal three key insights: tree coverage shows a sustained positive association without saturation; building density exhibits a weakening association at high levels, suggesting possible saturation; and road proportion follows a bidirectional pattern, shifting from negative to positive beyond a certain range. Spatially, high BERI zones concentrate where ecological assets and diverse building functions co-occur, while youth perception exhibits systematic mismatches (e.g., “beautiful but not clean,” “safe but not lively”), traceable to imbalances in building form, street furniture, and commercial mix. These findings advance AI-assisted evaluation of built environments by shifting from one-dimensional metrics to interpretable, design-relevant diagnostics, offering a replicable evidence base for crafting youth-responsive buildings and streets.
1. Introduction
Historically, the recognition of urban green spaces as ‘the lungs of the city’ and their role in public health can be traced back to 19th-century sanitary reform movements, such as the National Health Society’s campaign for public gardens in London [1]. Rapid urbanization and the digitalization of daily life have profoundly reshaped the daily rhythms and spatial usage patterns of the youth demographic. As a population group characterized by high mobility within cities and acute spatial sensitivity, young people—under the multiple pressures of study, employment, social interaction, leisure, and commuting—are particularly vulnerable to the cumulative effects of psychological stress, emotional fluctuation, and an increasing need for daily recovery [2,3]. The psychological pressures faced by the youth are not solely related to individual states but are also closely linked to the built environments they inhabit. In this context, the built environment is no longer merely a setting for daily activities but has become a critical external condition influencing emotion regulation, stress relief, and psychological restoration. Therefore, identifying which features of the built environment exert restorative support and proposing targeted optimization strategies have become significant topics in the fields of architecture and urban planning.
Appropriate built environments possess the capacity to directly heal negative emotions and repair psychological depletion. Ulrich (1984) experimentally confirmed the restorative benefits of environments [4]. Attention Restoration Theory (ART), proposed by the Kaplans (1989), posits that environments possessing the qualities of “being away”, “extent”, “fascination”, and “compatibility” can effectively restore directed attention fatigue [5]. For instance, a deep learning-based approach has been successfully used to measure human perceptions (e.g., safe, lively, beautiful) across entire urban regions such as Beijing and Shanghai [6]. The linkage between human perception and urban vitality has been empirically examined in Shenzhen, where perceived beauty, safety, and liveliness were found to correlate with street-level population density [7]. Recent empirical studies using street-view imagery have confirmed that visual space indicators such as greenness and enclosure significantly influence residents’ psychological perceptions [8]. Building on this foundation, this study operationally defines built environment restorativeness as the visually perceived restorative potential of the built environment, encompassing both buildings and street spaces, to support psychological recovery (such as stress reduction and attention restoration) among young people. Throughout this paper, the term “restorativeness” is used to denote this visually perceived potential, which is inferred from subjective perception ratings and objective visual attributes derived from street view imagery, rather than from direct clinical or psychophysiological measurement of restoration outcomes. It should be acknowledged that this operationalization captures the visual dimension of environmental restorativeness, and does not encompass other sensory modalities such as auditory, olfactory, or tactile experiences that may also contribute to psychological restoration in real world settings. This usage is grounded in Attention Restoration Theory and is conceptually distinct from “regeneration,” which in urban studies typically denotes the physical, economic, or ecological renewal of urban fabrics rather than the psychological benefit experienced by individuals. This potential is not an inherent property of the environment itself but is the outcome of interactions between people and their surroundings, co-shaped by subjective perceptions and objective physical attributes.
Thus, built environment restorativeness is no longer viewed as a static attribute that depends solely on natural elements but is increasingly understood as the integrated capacity of the built environment—including its building morphologies, street configurations, and functional mixes—to support the psychological recovery needs of its users. A substantial body of research has demonstrated a strong association between the built environment and perceived psychological stress [9]; factors such as natural landscapes, visual order, spatial openness, walkability, perceived safety, and functional vitality can all positively influence mental health [9,10]. The research also demonstrates that green view index and enclosure significantly affect residents’ perceptions of beauty, safety, and liveliness [11]. In parallel, the biophilic design framework, primarily developed in European and North American contexts, proposes that integrating natural elements and processes into the built environment can reduce stress and enhance cognitive function through multi-sensory engagement [12]. Empirical work in this tradition shows that built spaces designed to stimulate multiple senses tend to yield stronger restorative outcomes than those relying on visual greenery alone [13]. For instance, the Bertschi School Science Wing in Seattle combines an indoor runnel that channels rainwater, a living wall that filters greywater, and an ethnobotanical garden that invites direct tactile interaction. [13] Together these elements create an immersive setting where children can hear, touch, and observe natural processes, illustrating how sensory exploration and discovery can amplify psychological restoration [14,15]. These insights inform the present study’s approach, which extends the biophilic emphasis on multi-sensory experience to everyday urban streetscapes as perceived by young people.
Among these, visual perception dimensions (e.g., green view index, sky openness, color richness) have been shown to significantly affect residents’ emotional experiences and mental health [16,17], and PM10, noise pollution, and PM2.5 have been identified as dominant drivers of negative emotions in London, reinforcing the importance of environmental stressors [18]. Meanwhile, more specific spatial typologies, such as the imagistic perception of everyday living streets, further substantiate the concrete effects of these factors across differentiated spaces [19]. For young people, this issue carries particular practical relevance. Young adults experience frequent transitions between education and employment, a fast-paced lifestyle, and active social needs, giving them a distinctive pattern of spatial perception, preference structure, and recovery requirements. Unlike the general adult population, young people are navigating a “exploration–stabilization” psychological transition, making them more sensitive to environmental novelty and exploratory affordances. At the same time, their social needs and career-development pressures intensify their demand for environmental liveliness and functional diversity. Traditional studies of restorativeness based on whole-population samples or objective green metrics fail to capture these youth-specific perceptual preferences and recovery needs. Consequently, there is a pressing need to construct a youth-specific research framework for built environment restorativeness. While the existing evidence base for biophilic design draws largely from European and North American school or healthcare settings [20], its applicability to the everyday urban streets and building morphologies encountered by young adults in rapidly urbanizing Asian cities remains underexplored. This study aims to bridge that gap by grounding its framework in the Changsha context.
To address the restorative needs of young people through built environment optimization, effective measurement of restorativeness is a prerequisite. Most existing studies have focused on objective physical indicators such as green view ratio, sky visibility, street interface ratios, or facility distribution [21,22]. While these metrics can describe environmental features, they struggle to directly reflect people’s actual subjective experiences of the built environment. Consequently, integrated assessment methods that combine subjective and objective indicators have gradually gained consensus [23]. However, traditional questionnaire-based or experimental assessment methods have limitations in sample size, spatial coverage, and the fusion of subjective and objective dimensions [24,25]. Moreover, to provide targeted strategies for built environment optimization, it is further necessary to identify which environmental attributes influence young people’s restorative perceptions—yet conventional regression models are insufficient to capture the potentially complex nonlinear relationships between environmental attributes and restorativeness [26]. These shortcomings indicate that research on built environment restorativeness needs to shift from single-dimension objective descriptions toward subjective–objective integration, and further adopt technical pathways suitable for identifying complex relationships.
In recent years, the development of street-view imagery, deep learning, and explainable machine learning has provided a data foundation for the large-scale quantification of built environment features [27,28]. Street-view imagery captures fine-grained details of the built environment from a pedestrian’s perspective, enabling the precise extraction of visual elements such as green view ratio, sky view ratio, building view ratio, road proportion, and wall enclosure level [29]. Deep learning facilitates the prediction of subjective perceptions from small samples and the recognition of objective visual elements. Explainable machine learning methods such as XGBoost-SHAP can reveal the action patterns and nonlinear mechanisms through which environmental factors influence restorativeness, thereby enhancing the precision and explanatory power of built environment restorativeness research [30].
Based on the above, this study takes the built-up area of Changsha as the research region and integrates subjective youth perceptions with objective street-view environmental data to construct a comprehensive measurement framework for built environment restorativeness. Changsha is selected as a representative case of China’s new tier-1 cities, characterized by rapid urbanization, substantial youth inflow, and a distinctive mountain–river–city morphology. While this spatial scope enables in-depth, high-resolution analysis, it also means that the findings are embedded within a specific Chinese urban context, and their applicability to cities with different urban morphologies or cultural settings should be evaluated through future cross-cultural validation.
The study is guided by two research questions:
RQ1: What is the spatial distribution pattern of the visually perceived restorative potential of the built environment in Changsha’s built-up area, as measured by the composite Built Environment Restorativeness Index (BERI)?
RQ2: Which fundamental visual attributes of the built environment exhibit the strongest and most consistent associations with BERI, and what nonlinear patterns characterize these associations?
The analytical procedure follows a systematic sequence of six steps. First, subjective perception indicators (beautiful, clean, lively, boring, depressing, safe) are predicted from street-view images using a TrueSkill-based deep learning model trained on youth pairwise comparisons (Section 2.3.1). Second, objective visual indicators are extracted via Mask2Former semantic segmentation and grouped into four latent dimensions—Greenery level, Charm level, Visual complexity, and Walkability—using Latent Dirichlet Allocation topic modeling (Section 2.3.2). Third, the CRITIC weighting method integrates these subjective and objective indicators into the composite BERI, which serves as a spatially explicit measure of visually perceived restorative potential (Section 2.3.3). Fourth, the spatial distribution of BERI is mapped across Changsha’s built-up area and interpreted at macro, meso, and local scales (Section 3.3). Fifth, XGBoost-SHAP analysis is applied to identify which of the 18 raw visual elements drive BERI variation and to characterize their nonlinear association patterns (Section 3.4). Sixth, evidence-informed design strategies are proposed based on the identified association patterns, with explicit acknowledgment of the gap between model-derived insights and operational planning tools (Section 4.2). RQ1 is addressed through the spatial analysis in Section 3.1, Section 3.2 and Section 3.3 and discussed in Section 4.2. RQ2 is addressed through the XGBoost-SHAP analysis in Section 3.4 and discussed in Section 4.1 and Section 4.2. This research contributes to a deeper understanding of the spatial differentiation and visual–environmental correlates of built environment restorativeness from a youth perspective, and provides a scientific basis for the fine-grained governance of youth-friendly built environments.
2. Materials and Methods
2.1. Study Area
Changsha, as a new-tier-1 core city, has experienced significant city-level enhancement that attracts a substantial inflow of young people. This inflow injects developmental vitality but, at the same time, exacerbates the atomization of young individuals due to resource scarcity and intensified competition. The city’s distinctive mountain–river landscape and green development orientation align well with the demands of a highly restorative, youth-friendly built environment, making it an important urban case for exploring restorative capacity. Taking Changsha as a case study provides an adaptable measurement pathway and practical reference for assessing built environment restorativeness in similar cities.
Based on the 2022 Changsha Yearbook and the Changsha Municipal People’s Government “Overview of Changsha”, the study area is defined as the built-up area of Changsha urban district, Hunan Province, China [31] (Figure 1), ensuring data availability and analytical precision. The area encompasses the built-up zones of “six districts and one county” (Furong District, Yuhua District, Kaifu District, Tianxin District, Yuelu District, Wangcheng District, and Changsha County), with a total area of approximately 439.87 km2, which closely aligns with the continuous coverage area of Baidu Street View imagery and effectively captures built environment attributes such as road networks and building forms.
Figure 1.
Built-up area map of Changsha city.
2.2. Data Sources
This study is based on the Baidu Map platform (sampling time: June 2025). Sampling points were established at 50 m intervals along the road network within the study area. At each sampling point, four street-view images were collected with heading angles of 0°, 90°, 180°, and 270° to capture a 360° panoramic view, with a fixed pitch angle of 0° and a field of view of 90°. Image resolution was standardized to 480 × 320 pixels. Sampling points that could not be captured by the street-view vehicle (e.g., pedestrian-only alleys, indoor roads, private compounds), were meaningless (e.g., tunnel interiors, construction sites with complete visual obstruction), or involved privacy concerns (e.g., identifiable individuals in close-up) were excluded. Spatial representativeness was assessed by comparing the density of retained sampling points against the road network density across six administrative districts and one county; no district exhibited a sampling density deviation exceeding 10%, indicating balanced coverage. This resulted in a total of 55,600 sampling points and a dataset comprising approximately 226,402 valid street-view images. All subsequent calculations are based on this dataset. For a comprehensive review of street-view image processing techniques in urban neighborhood assessment, see ref. [32].
2.3. Research Framework
This study uses a combination of subjective perception indicators and objective environmental indicators, both derived from street view imagery, to comprehensively measure the visually perceived built environment restorativeness of Changsha (Figure 2). First, a deep learning-based youth urban perception prediction model is constructed and trained, incorporating the TrueSkill rating mechanism to precisely measure multi-dimensional perception indicators of young people in Changsha. Mask2Former is used for image recognition and semantic segmentation of street-view images to extract objective visual elements in street spaces and compute related physical environmental indicators. Based on these subjective and objective indicators, the CRITIC method is used to construct a comprehensive Built Environment Restorativeness Index (BERI) as a baseline assessment benchmark. This index is not the final research objective but serves as the target variable for subsequent machine learning modeling. It should be noted that BERI is a composite index constructed by the authors through the CRITIC weighting method and validated against direct restorative ratings only for its subjective component (see Section 2.3.1). It is therefore best understood as a proxy benchmark rather than an externally validated ground truth. Further, using the XGBoost-SHAP model with BERI as the dependent variable and the raw street-view visual elements extracted by Mask2Former as independent variables, the study circumvents the circular logic of “explaining a composite indicator with its own components” and directly reveals the nonlinear influence mechanisms of fundamental built environment attributes on the composite construct of built environment restorativeness.
Figure 2.
The technical framework.
It should be noted that the acronym BERI is used in this study exclusively to denote the Built Environment Restorativeness Index, which is a custom composite metric developed through the CRITIC weighting method. This index is conceptually and methodologically distinct from the Bioclimatic Ecosystem Resilience Index, which shares the same abbreviation but addresses a different research domain.
The technologies are employed as follows: TrueSkill to address the challenge of directly quantifying subjective perceptions; deep learning to enable large-scale prediction expansion; Mask2Former to extract objective street-view elements; LDA to cluster and summarize objective elements; CRITIC to assign weights for the comprehensive restorativeness index; and XGBoost-SHAP to account for the mechanism and threshold interpretation.
At a broader methodological level, this study integrates several fundamental scientific research methods that underpin the analytical framework. Analysis is employed to decompose the complex construct of built environment restorativeness into constituent dimensions: six subjective perception indicators and 18 objective visual elements, each examined at the pixel level through semantic segmentation. Synthesis is applied through the CRITIC-based weighted summation that recombines these indicators into the composite BERI, producing a holistic measure from disparate data sources. Deduction guides the derivation of the analytical framework from established theories—specifically, Attention Restoration Theory and the biophilic design framework—which provide the theoretical basis for hypothesizing that specific visual elements and perceptual qualities are associated with restorative potential. Comparison is central to the spatial analysis, where BERI values are compared across urban zones, district types, and local spatial typologies to identify systematic patterns of variation. Induction informs the interpretation of the XGBoost-SHAP results, where the consistent nonlinear patterns observed across tree coverage, building density, and road proportion are generalized into broader insights about the visual-environmental correlates of restorative potential. The systematic integration of these methods ensures analytical rigor and logical coherence throughout the research process [33].
2.3.1. Subjective Perception Prediction Method
Urban perception is a key factor in quantifying built environment restorative capacity and is a direct reflection of the mental health status of young people. Based on a deep learning model, this study innovatively introduces the logic of the TrueSkill algorithm—a comparable machine-learning framework using pairwise comparisons of street-view images has been applied to predict mood states (e.g., motivated, happy, depressed) in Guangzhou [34]—to predict and evaluate the multi-dimensional urban perceptions of Changsha’s youth population. Six perception dimensions—beautiful, clean, lively, boring, depressing, and safe—were selected for training the deep learning model. These dimensions, chosen based on the core dimension division of environmental psychological qualities in existing urban perception and restorativeness research, comprehensively cover the key perception aspects of youth groups regarding environmental aesthetics, order, vitality, safety, and emotional impact.
To ensure the robustness and generalization ability of the prediction model, 32 young adults (16 males and 16 females; mean age 24.3 years, SD = 3.1, age range 18–30) who had resided in Changsha for at least two consecutive years were recruited as annotators through university bulletin boards and social media platforms. The sample comprised 18 undergraduate students, 10 graduate students, and 4 employed young professionals. All participants provided written informed consent, and the research protocol was approved by the Institutional Review Board of the University of South China (Approval Code: prot. n. 31/2025). The training process of the Changsha youth urban perception prediction model was as follows. First, 500 image samples were extracted from Changsha street view image data using stratified random sampling to construct the annotation dataset. The samples spatially cover different locations within Changsha’s built-up area (including central downtown core business districts, new urban districts, old communities, and urban rural fringe zones) and typologically encompass various street view categories such as commercial blocks, residential streets, arterial roads, waterfront leisure zones, and industrial/logistics areas, ensuring comprehensiveness and representativeness of the assessment space. Each annotator completed pairwise comparisons for a randomly assigned subset of the 500 images following a balanced incomplete block design. In each trial, two images were presented side by side, and the participant selected the one that better matched the description of a given perception dimension (e.g., “Which place looks more beautiful?”) (Figure 3). The six dimensions were presented in separate blocks, with the order of dimensions and image pairs randomized. In total, 54,000 pairwise comparisons were collected, and each image received a minimum of 15 comparisons per dimension. The TrueSkill ranking system assigned a rating (μ) and a certainty estimate (σ) to each image based on the comparison outcomes; after 300 iterations, σ values for all images converged below 1.0, indicating stable rank estimates. Inter-annotator agreement, measured by the mean win–loss agreement rate with the majority vote. The 500 annotated images were randomly split into a training set (80%, n = 400) and a test set (20%, n = 100), stratified by the same spatial and typological categories. The training set was used for deep learning model optimization, and the test set was reserved for model evaluation and the independent validation with direct restorative ratings described later in this section.
Figure 3.
Training process of the youth urban perception prediction model.
If x is judged to be better than y in a given comparison, the corresponding formulas are applied as follows:
According to these formulas, and represent the current TrueSkill ratings of the images x and y being compared. After completing the comparisons, a deep learning large model was trained using the RegNet architecture, with batch_size = 64, epochs = 300, and device = cuda.
The six perception dimensions selected in this study—beautiful, clean, lively, boring, depressing, and safe—have been repeatedly used in prior street-view perception research as proxy indicators of perceived environmental quality, and their associations with restorative experiences have been empirically documented [6,34,35]. It should be noted, however, that these dimensions capture perceived environmental attributes rather than providing direct measurement of psychological restoration. Consequently, the composite BERI derived from these dimensions is best interpreted as an index of restorative–supportive environmental quality from the youth perspective, not a validated measure of actual restoration outcomes. It should also be noted that the demographic homogeneity of the annotator group—all being young Changsha residents—is an intentional feature of the research design rather than a limitation. The objective of this study is to model youth-specific perceptions of the built environment, which may differ systematically from those of other age groups. Recruiting annotators from the target population ensures that the trained models capture the perceptual criteria and preferences specific to young people in Changsha. The construct validity of this proxy-based approach and the implications of this design choice for generalizability are discussed in Section 4.3.
2.3.2. Mask2Former Recognizable Perception Dimensions
Visual elements in urban spaces also can reflect and quantify built environment restorative capacity [36]. Although traditional Transformers have shown great potential in image segmentation, there remains room for optimization. Therefore, this study innovatively uses Mask2Former (Figure 4)—an end-to-end detection and segmentation framework based on the Transformer architecture proposed by the Facebook team in late 2021—for this purpose [37]. Compared to traditional models, Mask2Former reduces background interference, improves small-object recognition performance and inference speed, and adapts well to the complex scenes found in street-view imagery, making it a preferred model for street-view recognition. This study uses the Mask2Former model to perform image recognition and semantic segmentation on the Changsha street-view image dataset, classifying and obtaining street-view visual elements relevant to youth perception of the built environment.
Figure 4.
Mask2Former flowchart. Adapted from [37].
The proportions of street view visual elements obtained from semantic segmentation cannot directly assess multi-dimensional urban perception levels. To reduce the dimensionality of the 18 visual elements and group them into interpretable categories grounded in urban design and restoration theory, this study employed Latent Dirichlet Allocation (LDA, Figure 5). Although LDA was originally developed for text analysis, its underlying probabilistic framework is well-suited for discovering latent structures in compositional data such as visual element proportions, where each sampling point can be treated as a mixture of latent “topics” and each topic is defined by a distribution over visual elements.
Figure 5.
pyLDAvis perception dimension visualization.
To apply LDA, each sampling point was represented as a document. The 18 visual elements served as the vocabulary, and the pixel proportion of each element at a given sampling point was treated as its term frequency, after discretization into integer counts by multiplying by 100 and rounding. This document term matrix, with 55,600 documents and 18 terms, was input into the LDA model implemented via the gensim library in Python 3.10. The number of topics was determined by evaluating the perplexity curve across a range of 2 to 12 topics. The curve showed an inflection point at k = 8, which was used as the starting point for exploratory analysis. Through interactive examination using pyLDAvis3.4.1, four topics showed substantial semantic overlap with remaining topics and were therefore excluded. Ultimately, four topics with high distinctness and clearly interpretable keyword semantics were retained.
The four topics and their top associated visual elements were as follows. Topic 1 was dominated by tree, vegetation, and grass, and was labeled “Greenery level,” representing the extent of natural vegetation coverage in the street space. Topic 2 was characterized by wall, fence, street lamp, and traffic light, with road as a contextual element, and was labeled “Charm level.” Topic 3 was defined by building, sky, and signboard, and was labeled “Visual complexity,” reflecting the richness and diversity of built elements in the visual field. Topic 4 was associated with pedestrian, street lamp, tree, building, and road, and was labeled “Walkability,” capturing the elements that support pedestrian activity and street level engagement.
Regarding the label “Charm level,” it should be clarified that this term is not used in the strict Kaplanian sense of “fascination” as a restorative quality. Rather, it draws on the broader urban design literature, where “charm” denotes the visually attractive and engaging qualities of a streetscape that invite exploration and lingering. The elements grouped under this topic—walls, fences, street lamps, traffic lights, and roads—collectively define the spatial enclosure, human-scale detailing, and infrastructural order of the street. Prior studies have shown that these vertical and linear elements significantly shape perceived street character and visual interest, which aligns with the everyday understanding of a street’s charm as its capacity to capture and hold attention.
Through quantitative calculation based on the LDA-derived topic compositions, the four category scores were computed for each sampling point, combined with ArcMap 10.8.1 for geospatial visualization, and incorporated as the objective visual indicators in the built environment restorativeness evaluation system.
Through quantitative calculation, the indicator data were combined with GIS technology for geospatial visualization, serving as some of the key indicators for assessing built environment restorativeness [38].
2.3.3. Built Environment Restorativeness Evaluation Indicator System
To determine the weights of each indicator, this study employs the CRITIC method. As an objective weighting method, the CRITIC method is considered superior to traditional objective weighting methods such as the entropy weight method or standard deviation method [35]. Traditional methods often focus only on the volatility of indicators, whereas the CRITIC method determines weights by comprehensively considering the contrast intensity and conflict among evaluation indicators. This characteristic allows it to not only reflect the degree of fluctuation of each indicator itself but also consider the correlations among indicators, thereby more comprehensively measuring the importance of each indicator and ensuring the accuracy of the weighting results [39]. The weight calculation formula is presented as Formula (2).
Among them, represents the information amount of the j-th item, which determines the influencing factors and their weights. The weights determined by the CRITIC method reflect the contrast intensity and conflict of each indicator at the data level, rather than directly being equivalent to the strength of that element’s effect on restorativeness. For example, in the weighting results, “Charm level” received a relatively high weight, mainly because this indicator exhibited high variability across sample points and strong conflict with other indicators, reflecting the significant difference in data structure between the commercial vitality of the central urban area and peripheral areas. In contrast, objective indicators such as “Greening level” and “Visual complexity” had relatively even distributions, resulting in lower information-carrying capacity and thus lower weights.
An important distinction must be drawn between “index construction weights” and “psychological effect weights.” The CRITIC-derived weights serve the former purpose: they determine how much each indicator contributes to the composite BERI based on the mathematical structure of the data, specifically the amount of independent information each indicator carries. They do not purport to measure the causal strength with which each indicator influences psychological restoration. This distinction is critical. The psychological effect of a given environmental feature on restoration is an empirical question addressed later in this study through the XGBoost SHAP analysis, which directly quantifies the marginal contribution of each visual element to BERI. The CRITIC weights, by contrast, solve a measurement problem: given a set of indicators with different scales, distributions, and degrees of redundancy, how should they be combined into a single index that maximizes information capture?
The rationale for choosing CRITIC over alternative weighting methods is as follows. Equal weighting assumes that all indicators are equally informative, which is clearly untenable when some indicators exhibit high spatial variability while others are relatively uniform across sampling points. Entropy weighting, while also objective, determines weights solely from the degree of disorder within each indicator, ignoring the correlations among indicators. In the present dataset, several indicators exhibit moderate to high correlations, meaning that entropy weighting would assign redundant weights to correlated indicators and inflate their collective influence on the composite index. The CRITIC method addresses this by incorporating conflict among indicators: if two indicators are highly correlated, their weights are mutually adjusted downward, ensuring that the composite index captures diverse rather than overlapping information. The Analytic Hierarchy Process (AHP) and expert weighting methods, while valuable for incorporating domain knowledge, introduce subjectivity that undermines the replicability of the index across different urban contexts. Given the exploratory nature of this study, which aims to establish a data-driven and transferable framework for measuring built environment restorativeness, objective weighting via CRITIC is the most methodologically appropriate choice.
It should be noted that the CRITIC-derived weights reflect the contrast intensity and conflict of each indicator at the data level. For example, in the weighting results, charm level received a relatively high weight, mainly because this indicator exhibited high variability across sample points and strong conflict with other indicators, reflecting the significant difference in streetscape character between the central urban area and peripheral areas [40]. In contrast, greenery level and visual complexity had relatively even spatial distributions, resulting in lower information carrying capacity and thus lower weights. This does not imply that greenery is psychologically less important for restoration than charm; indeed, the XGBoost SHAP analysis in Section 3.4 identifies tree coverage as the dominant factor driving BERI. Rather, it reflects the fact that, from a measurement standpoint, charm provides more discriminating power for differentiating restorative potential across sampling points in Changsha’s built-up area.
Combining all relevant perception dimensions and corresponding weighting indicators, an evaluation indicator system for built environment restorativeness in Changsha was constructed (Table 1) [41]. Before comprehensive evaluation, the two negative indicators, “more boring” and “more depressing,” were reverse-coded so that higher values consistently indicate higher restorative potential. Specifically, for each negative indicator, the value at each sampling point was transformed by subtracting the original score from the maximum observed score across all sampling points, thereby preserving the relative ordering and distributional properties of the original data while aligning the direction with all other indicators for weighted summation. Finally, the perception dimensions in the built environment restorativeness evaluation indicator system were weighted and summed, and visualized using ArcMap 10.8.1 to obtain a spatial distribution map of built environment restorativeness in Changsha.
Table 1.
Evaluation indicator system for built environment restorativeness [41].
The six subjective perception indicators listed in Table 1 serve as proxy measures of perceived environmental qualities that have been consistently associated with restorative experiences in prior research. They are not direct measures of psychological restoration, and the resulting BERI is best interpreted as an index of restorative supportive environmental quality from the youth perspective.
It should be noted that the youth urban perception dimensions listed in this table (e.g., beautiful, clean) are not direct measures of restorativeness but serve as representative perceptual proxy indicators that have been strongly associated with psychological restoration in numerous studies. The comprehensive restorativeness index (BERI) is an indirect estimation derived from the weighted fusion of these proxy indicators and objective built environment attributes.
3. Results
3.1. Youth Urban Perception Results
The six perception prediction models were evaluated on the held out test set (n = 100 images), which was entirely excluded from the pairwise comparison training. Table 2 summarizes the performance of each model. All six dimensions achieved strong predictive performance, with R2 values ranging from 0.819 (clean) to 0.911 (beautiful) and a mean R2 of 0.868.
Table 2.
Validation performance of the perception prediction models across six dimensions.
Overfitting is not a concern in this training paradigm, for a reason rooted in the TrueSkill algorithm. Although only 500 unique images were used, the pairwise comparison design generated 54,000 training samples, with each sample being a comparative decision between two images rather than an image with a fixed label. The model learns to predict the relative ranking of image pairs, not to memorize absolute scores of individual images. Because the train–validation split was conducted strictly at the image level, the 100 test images and all pairwise comparisons involving them were completely withheld from model training. The R2 values reported above therefore reflect the model’s ability to generalize to previously unseen street view scenes. This design, in which the number of training comparisons substantially exceeds the number of unique stimuli and evaluation is performed on held out images, provides a robust safeguard against overfitting. Figure 6 presents the training dynamics and residual plot for the “beautiful” dimension as a representative example, with R2 converging to 0.911 and residuals approaching zero. It should also be noted that the asymmetry between the training scale (500 images) and the application scale (226,402 images) does not inherently indicate overfitting. The 500 images were selected through stratified random sampling to ensure comprehensive coverage of Changsha’s spatial and typological diversity, as described in Section 2.3.1. The strong and consistent performance on the held-out test set (R2 = 0.819–0.911 across all six dimensions) provides empirical evidence that the model generalizes beyond the training distribution. The large-scale prediction across 226,402 images is thus an extrapolation within a systematically sampled and validated domain, rather than an unwarranted generalization to unknown urban contexts.
Figure 6.
Prediction performance of the youth city perception prediction model. (a) more beautiful; (b) cleaner; (c) livelier; (d) more boring; (e) more depressing; (f) safer.
Using this model, large-scale urban perception prediction was carried out on the Changsha street-view image dataset [42], and the TrueSkill ratings and prediction results for each dimension were visualized using GIS technology (Figure 7).
Figure 7.
Urban perceived geographic spatial distribution of youth groups. (a) more beautiful; (b) cleaner; (c) livelier; (d) more boring; (e) more depressing; (f) safer.
As shown in the figure above, the geospatial distribution of youth urban perception in Changsha’s built-up area exhibits a phenomenon of multi-dimensional contradiction. The essence of this phenomenon is a mismatch between spatial function supply and the compound needs of young people. In areas described as “beautiful but not clean” (Figure 6a,b)—such as Taiping Street, Chao Zong Street, Huangxing Square, and other popular check-in spots—the humanistic aesthetic or natural ecological values align with the visual aesthetic needs of young people. The “more beautiful” mean is significantly higher than the mean of the main urban area. However, due to high commercial density, a mismatch between garbage generation and dynamic cleaning capacity, and the narrow alleys restricting sanitation operations, the “cleaner” mean in these areas is lower than the main urban area average, reflecting a misalignment between heritage preservation and refined sanitation management in built environment governance. In areas described as “beautiful but boring” (Figure 6a,d)—such as Riverside Park, the area around Yuelu Mountain, and other ecological zones—the landscapes are pleasant and the “more beautiful” mean is relatively high. Yet due to their single functions, lacking trendy cafes, streetwear stores, and other youth-oriented social and entertainment amenities, the “livelier” mean in these areas is significantly lower than in the trend spot-concentrated Furong District, presenting a dilemma of “pleasing scenery without experiential value”, reflecting the absence of youth-oriented social and consumer amenities in ecological zones. In areas described as “safe but depressing” (Figure 6e,f)—such as Mawangdui, Shumuling, and other old communities—the strict public security and orderly facilities create areas with relatively high “safer” values. However, due to low-end commerce, monotonous employment opportunities, and bland public spaces, the “depressing” mean is relatively high, reflecting that although the peripheral old communities have stable public security, they lack vibrant scenes and employment opportunities needed for youth development. Taken together, these phenomena collectively reveal shortcomings in Changsha’s built environment development: insufficient functional diversity of spaces, poor adaptability to youth scenarios, and a lack of fine-grained governance. It should be noted, however, that these perceptual patterns are unlikely to be solely attributable to physical design deficiencies. Socioeconomic factors—such as the concentration of low-income households in peripheral old communities, the uneven distribution of public investment in sanitation infrastructure, and the market-driven clustering of youth-oriented commercial amenities in high-traffic areas—may co-produce the observed mismatches alongside spatial configuration. The absence of explicit socioeconomic controls in this analysis means that the relative contributions of physical design and socioeconomic context to these perceptual phenomena cannot be disentangled at present. This interpretive caution applies throughout the spatial descriptions that follow.
3.2. Mask2Former Recognizable Dimensions
After recognition and segmentation, a total of 150 categories of street-view visual elements were obtained, among which 18 types of youth street-view visual elements were selected (Table 3), and their proportions and geospatial distributions were quantified and visualized (Figure 8).
Table 3.
Street-view visual elements for young people.
Figure 8.
Visual element recognition and geographic spatial distribution of street scenes among young people.
Areas with high greenery are concentrated around the Yuelu Mountain–Xiang River ecological belt (Figure 9a). Areas with high fascination and high walkability heavily overlap in the Wuyi Square core business district (Figure 9b,d). High Visual complexity is distributed in the old city area and urban–rural fringe zones (Figure 9c). Meanwhile, pairwise comparisons among spatial perception dimensions reveal deeper contradictions in Changsha’s built environment: The high overlap between Charm level and walkability (Figure 9b,d) stems from the positive feedback loop between the slow-traffic system and commercial vitality in the core business district, but it also exacerbates the Matthew effect of social resources. The low overlap between Greening level and Charm level/walkability (Figure 9a,b) reflects the separation between core commercial development and ecological spaces, as well as the disconnection between peripheral ecological belts and everyday walking scenarios. The moderate overlap between Visual complexity and walkability (Figure 9c,d) reflects the walking vitality brought by functional mixing in the old city area, but also exposes the walking difficulties in urban–rural fringe zones resulting from mixed functions and insufficient facilities. These spatial features collectively shape the differentiated living experiences of young people in Changsha’s built environment: the core area offers dense social activities but insufficient ecological buffering, while peripheral areas provide abundant ecological resources yet lack accessibility and spatial fascination. They also reveal the uneven distribution of built environment resources in Changsha.
Figure 9.
Geographic spatial distribution of Mask2Former recognizable features. (a) Greening level; (b) Charm level; (c) Visual complexity; (d) Walkability.
These conditions reflect both Changsha’s distinctive mountain–river–city morphology and its vibrant internet-famous commercial vitality, while also providing a precise spatial basis for alleviating youth atomization and optimizing youth-friendly built environment layouts. The four categories of “Mask2Former recognizable elements” serve as important indicators for subsequent built environment restorativeness measurement.
3.3. Built Environment Restorativeness Analysis
The spatial distribution of BERI across Changsha’s built-up area (Figure 10) reveals a pronounced multi layered structure that can be characterized as “core enrichment, gradient attenuation, and corridor-mediated extension.” At the broadest scale, BERI values exhibit a clear distance decay pattern from the urban core toward the periphery. High BERI zones (upper tertile) are concentrated along the Yuelu Mountain–Xiang River ecological corridor and extend eastward into the Wuyi Square commercial core, forming a continuous high value arc that spans approximately 12 km in a north–south orientation. This arc aligns closely with the city’s primary ecological infrastructure and its most densely serviced commercial and cultural axis. The spatial configuration of this high BERI arc suggests that restorative potential in Changsha is not a simple function of proximity to the geographic center, but rather emerges at the intersection of ecological assets, pedestrian oriented street networks, and diverse building functions [43].
Figure 10.
Geographical spatial distribution of built environment restorativeness (BERI) in Changsha city.
At the intermediate scale, a pronounced gradient is observed between the central urban districts (Furong, Yuelu, Kaifu, Tianxin, and Yuhua) and the peripheral areas (Wangcheng District and Changsha County). Within the central districts, BERI values exhibit substantial internal heterogeneity: pockets of high restorative potential are interspersed with low BERI zones in a patchwork pattern, corresponding to the fine-grained mixing of commercial streets, residential neighborhoods, and small open spaces that characterizes Changsha’s old city fabric. In contrast, the peripheral areas present a more homogeneous landscape of medium to low BERI values, punctuated by isolated high BERI nodes associated with district level commercial centers and major parks. This center–periphery gradient reflects the uneven distribution of pedestrian infrastructure, street-level greening, and functional diversity that is typical of rapidly expanding Chinese cities, where peripheral development has prioritized vehicular accessibility and large-scale residential compounds over the fine-grained, human-scale streetscapes that support restorative experiences [44].
At the local scale, three distinct spatial typologies of high BERI zones can be discerned. The first type consists of ecologically anchored corridors, represented by the Yuelu Mountain foothills and the Xiang River waterfront, where continuous tree canopy, open sky views, and separation from vehicular traffic create conditions consistently associated with high restorative potential. The second type comprises commercially vibrant historic streets, such as Taiping Street and the Wuyi Square pedestrian network, where the enclosure provided by low rise buildings, the visual interest generated by diverse storefronts, and the traffic calmed walking environment coincide with elevated BERI. The third type is found in comprehensively planned new areas, such as portions of the Xiangjiang New District, where deliberate greening investments and modern pedestrian facilities have produced localized BERI highs. The differing compositions of these three typologies—ecological dominance, commercial vitality, and planned green infrastructure, respectively—suggest that multiple pathways exist for achieving high restorative potential, each with distinct implications for urban design policy.
Low BERI zones are predominantly concentrated in three types of settings: suburban industrial and logistics areas in the northeastern and southern fringes, where wide roads, sparse tree coverage, and large building masses with limited visual permeability combine to produce low BERI values; aging residential districts in the urban fringe, where greenery is present but street level vitality and pedestrian amenities are insufficient; and transport infrastructure corridors, where elevated roads and rail lines create visual and physical barriers that fragment the pedestrian experience. The spatial juxtaposition of these low BERI zones with the high BERI arc indicates that Changsha’s restorative landscape is not merely a matter of green coverage but involves a complex interplay of building morphology, street design, and land use mix that varies systematically across the urban fabric.
Taken together, this spatial analysis reveals that BERI in Changsha is shaped by the superimposition of multiple geographic layers: the inherited ecological framework of mountains and rivers, the historical accumulation of fine-grained urban fabric in the old city, the radial expansion of commercial and transport corridors, and the planned development of new urban districts. This multi layered structure is consistent with the spatial logic of China’s new tier 1 cities, where the tension between rapid outward expansion and concentrated inner city renewal produces a distinctive center–periphery gradient in environmental quality that is more variegated than a simple concentric model would predict. It should be noted that the above interpretations are derived from visual inspection of the BERI map and descriptive comparison across zones, and are based exclusively on visual and morphological variables. Socioeconomic factors that are spatially correlated with both urban form and restorative potential—such as income stratification, housing market dynamics, and the spatial distribution of public investment—may contribute to the observed patterns but are not separately identified in this analysis. Formal spatial statistical tests, combined with spatially disaggregated socioeconomic data, would be required to confirm the statistical significance of the observed spatial clustering and to disentangle the physical and socioeconomic pathways underlying the BERI distribution. Both are recommended as directions for future research.
3.4. Influencing Factors and Nonlinear Patterns of Built Environment Restorativeness
Previous studies have shown that the various street view elements identified through street view image segmentation techniques constitute the physical base of restorative built environments and represent the basic factors affecting the capacity for built environment restorativeness. To identify the fundamental physical characteristics driving the spatial differentiation of built environment restorativeness, this study used the pixel ratios of 18 raw street view visual elements as explanatory variables and the BERI as the response variable in an XGBoost SHAP model.
A methodological clarification is warranted regarding the relationship between the explanatory variables and the response variable. It is acknowledged that BERI incorporates objective visual indicators derived from Mask2Former outputs, which are themselves aggregations of the same 18 raw visual elements. However, this does not constitute circular reasoning, for three reasons. First, the explanatory variables enter the XGBoost model at the most granular level—the raw pixel proportion of each of the 18 elements—whereas BERI aggregates these elements through a two-stage transformation: LDA topic clustering into four latent dimensions and CRITIC weighting into a single index. The XGBoost SHAP analysis therefore investigates whether fine-grained, individual visual elements have nonlinear associations with the composite index that are not fully captured by the linear aggregation embedded in BERI’s construction. If all elements contributed to BERI in a strictly linear and additive manner, the SHAP analysis would be redundant; the fact that SHAP reveals pronounced nonlinearities and threshold effects demonstrates that the analysis yields insights beyond what the index construction itself presupposes.
Second, BERI is not solely derived from objective visual elements. The subjective perception dimensions, which account for the dominant share of the CRITIC weights (approximately 77% in total), are predicted by an independently trained deep learning model and are not deterministic functions of any visual element proportions. The subjective component thus introduces variation into BERI that is not mechanically determined by the 18 explanatory variables, ensuring that the relationship between X and Y is empirical rather than definitional.
Third, the SHAP analysis serves a purpose distinct from index construction. The CRITIC method answers the question “how much independent information does each indicator contribute to the composite index?” whereas XGBoost SHAP answers the question “how does each fundamental visual element, taken in isolation and in interaction with others, shape the composite index?” The latter question cannot be answered by examining the index formula alone, precisely because the formula does not specify how the raw elements map to the subjective dimensions, nor does it capture the nonlinear interactions among elements that XGBoost is designed to uncover.
The explainable machine learning XGBoost-SHAP model was used to comprehensively analyze the nonlinear relationships between relevant influencing factors and built environment restorativeness (Figure 11). XGBoost, as a highly efficient and accurate gradient boosting decision tree model, is often treated as a “black box” due to the opacity of its decision-making process. The SHAP (SHapley Additive exPlanations) analysis method, based on game theory, interprets model outputs by quantifying the marginal contribution of a feature under different combinations, thereby determining the importance ranking of features [45].
Figure 11.
SHAP analysis chart.
The figure above reveals, through the relationship between the horizontal and vertical axes, the nonlinear associations between the 18 street view visual elements and built environment restorativeness. The findings indicate that trees show the strongest association with BERI among all elements examined. Within the observed range, trees exhibit a consistently positive relationship with increasing marginal returns, suggesting that higher tree coverage is associated with higher restorative potential without reaching a saturation point in the Changsha context. There is an apparent contrast between the dominant association of trees with BERI and the low weight of greenery (only 1.93%) in the CRITIC weighting results. This contrast illustrates the distinction between index construction weights and model-derived association strength: although greenery exhibits less spatial variability than charm in the study area, its pixel proportion is the most robustly associated with the composite restorative index.
Roads exhibit a nonlinear pattern, with SHAP values shifting from negative to positive as the pixel proportion increases, suggesting a possible inflection zone beyond which higher road proportion is associated with higher BERI. Although buildings generally show a positive association, the SHAP values show a declining trend in samples with the highest proportions, indicating that the association between building density and BERI may weaken beyond a certain range. Small elements or human-scale details—such as trash cans and fences—have dispersed SHAP values and very low influence intensity, having a minimal enhancing or inhibiting effect on built environment restorativeness.
In summary, these model-derived associations suggest that built environments with higher restorative potential tend to feature a combination of substantial tree coverage and moderate building density, rather than the maximization of any single element. It should be emphasized that these findings reflect associative patterns identified through cross-sectional street view data and machine learning models, and do not establish causal relationships. Experimental or longitudinal studies would be required to confirm causal effects of specific built environment features on psychological restoration.
4. Discussion
4.1. Comparison with Existing Studies
Compared with existing research, this study presents innovations in the following aspects [46,47,48,49,50,51,52]: (1) In terms of research perspective, unlike previous studies that focused on the general population or solely on objective green metrics, this study takes young people as a specific evaluation subject, revealing the particularity of their environmental perceptions. (2) In terms of measurement methods, rather than relying solely on questionnaire surveys or single deep learning perception predictions, this study constructs a comprehensive measurement system that combines subjective perception prediction with objective element recognition and introduces the TrueSkill algorithm to solve the challenge of small-sample pairwise comparisons. (3) In terms of mechanism analysis, compared to traditional linear regression analysis, this study uses the XGBoost-SHAP model to confirm the nonlinear effects of elements such as roads and buildings on built environment restorativeness, providing a more refined basis for differentiated spatial regulation [53,54,55].
4.2. Strategies for Improving Built Environment Restorativeness
It should be acknowledged that the strategic directions discussed below are derived from model-based associative patterns and are presented as evidence-informed hypotheses for design exploration rather than as fully operationalized planning standards or regulatory instruments. Translating these directions into actionable guidelines—such as zoning codes, land transfer conditions, or design manuals—requires additional steps of professional validation, stakeholder consultation, and legal–institutional adaptation that lie beyond the scope of the current study. The gap between AI-derived insights and planning practice is a recognized challenge in the field of urban analytics, and the strategies outlined here should be understood as a starting point for bridging that gap, not as its resolution. But the integration of model-derived findings with these frameworks remains a task for future applied research.
Based on the above patterns, this study outlines several strategic directions that may inform the design of youth-friendly built environments. An important distinction should be emphasized at the outset: the SHAP analysis in Section 3.4 identifies predictive, associative relationships between visual elements and BERI, not causal effects. The nonlinear patterns and inflection zones reported—such as the consistently positive association of tree coverage, the weakening association of building density at high levels, and the bidirectional pattern of road proportion—are model-derived statistical relationships that warrant further validation through quasi-experimental or longitudinal designs before being translated into prescriptive design standards. The strategic directions proposed below should therefore be understood as evidence-informed hypotheses for design exploration, grounded in the associative patterns observed in Changsha, rather than as universally applicable causal guidelines. With this caveat in mind, the following directions are offered to address the predicament of youth disembedding and to explore how built environment design may support restorative functions, moving from a logic of spatial supply toward one of demand response.
Prioritize tree coverage in both new development and urban renewal [56]: The SHAP analysis indicates that, within the range observed in this study, higher tree coverage is consistently associated with higher BERI without reaching a saturation point. While this does not imply that any amount of greening is always beneficial, it suggests that incremental increases in tree coverage within the typical urban range are unlikely to yield diminishing restorative returns. In existing stock areas such as Yuelu Avenue, green space can be expanded by converting available small plots (street corners, setbacks) into tree-dominated small green spaces wherever site conditions permit. In new development areas such as the Xiangjiang New District, tree coverage targets can be aligned with existing regulatory benchmarks. For instance, the national Evaluation Standard for Urban Landscaping and Greening (GB/T 50563-2010) stipulates that the green space ratio of newly built residential areas should be no less than 30%, and the Standard for Planning of Urban Green Space (GB/T 51346-2019) sets specific greening requirements for different land use types. Drawing on these standards, incorporating a tree coverage requirement of no less than 25% into land transfer conditions, adjusted according to specific site constraints and building types, can help secure the greening baseline at the planning stage. These numeric references are derived from existing national standards rather than from the SHAP analysis alone. Beyond visual greening, incorporating multi-sensory and interactive design elements such as water features, textured natural materials, and planting designs that visibly change with the seasons can further amplify restorative benefits, as evidenced by biophilic design precedents in educational and community settings [57].
Moderate building density according to local context: The SHAP analysis indicates that the association between building pixel proportion and BERI weakens at the highest density levels, suggesting that excessive building coverage may be associated with lower restorative potential. For stock renewal areas such as the area around Wuyi Square, building density can be guided toward more moderate levels through selective demolition of illegal structures to create visual transparency and increasing setback spaces. For incremental development areas, open space ratio requirements can be specified in land transfer conditions alongside density limits, drawing on national standards such as the Code of Urban Residential Areas Planning and Design (GB 50180-2018), to avoid the visual oppression associated with excessive building enclosure.
Optimize road design to balance accessibility and pedestrian comfort: The SHAP analysis reveals a nonlinear association between road proportion and BERI, with lower BERI at very low road densities and higher BERI beyond a certain range. This pattern suggests that in suburban fringe areas where road networks are sparse, improving basic street connectivity may be associated with higher restorative potential. In core areas where road proportion is already high, pedestrian experience can be enhanced by reducing vehicle lane widths and adding green buffers and crossing facilities, following the Complete Streets approach advocated in international healthy streets guidelines.
Precisely bridge the perception gap, target complex scenarios: For perception contrast points such as “beautiful but not clean” areas like Taiping Street, a smart environmental sanitation dynamic scheduling system based on video recognition should be introduced rather than relying on fixed-period cleaning. For perception contrast points such as “safe but depressing” areas like Mawangdui, strategies should go beyond physical microenvironment improvements to include implanting low-cost, low-threshold “vitality anchors” such as shared office micro-nodes or 24 h self-service libraries to enhance young people’s psychological sense of efficacy.
Bridging micro-level design and macro-level resilience: Although the present study operates at the scale of street-level visual environments, its findings carry implications that extend to broader societal concerns. As Ivančík and Dušek (2026) argue, long-term sustainable development and spatial transformations are inherently conditioned by institutional stability, public legitimacy, and social cohesion [58]. Within this framework, investing in the psychological well-being and restorative needs of youth through evidence-informed urban design can be understood as a proactive strategy that contributes to social cohesion at the micro level. By creating everyday environments that support stress reduction and attention restoration, cities may help to alleviate the cumulative psychological pressures faced by young people—pressures that, if left unaddressed, can fuel social disengagement, political polarization, and diminished trust in public institutions. In this sense, the design of restorative urban spaces is not merely an aesthetic or public health objective, but a foundational investment in the social infrastructure that underpins long-term institutional resilience. This perspective bridges the gap between urban psychology at the micro scale and theories of sustainable development and democratic resilience at the macro scale. Future research could explicitly examine the pathways through which micro-scale environmental quality translates into macro-level outcomes such as civic participation, social capital, and democratic stability.
The analytical framework developed in this study—integrating deep learning, semantic segmentation, and explainable machine learning—represents a technical contribution to the growing field of AI-assisted urban diagnostics. However, as Peráček and Kaššaj (2026) have recently argued, the implementation of artificial intelligence in urban services cannot be separated from the strategic, managerial, and legal frameworks that govern smart city development [59]. Their comprehensive analysis of the European Union’s regulatory environment—including the AI Act, GDPR, and NIS2 Directive—demonstrates that the successful deployment of AI in urban contexts requires not only technical robustness but also institutional preparedness, cross-sectoral coordination, and compliance with evolving legal standards on data protection, algorithmic transparency, and cybersecurity. The BERI framework presented in this study, while methodologically situated in the specific context of Changsha, resonates with these broader governance considerations. Scaling this framework to other cities would require not only local calibration of perception models but also alignment with the regulatory and managerial architectures that Peráček and Kaššaj identify as essential for sustainable smart city development. Future research seeking to translate the BERI framework into operational planning tools—such as GIS-based dashboards or evidence-based design guidelines—should therefore engage with the legal and institutional dimensions of AI deployment, ensuring that technical innovation proceeds in tandem with responsible governance.
4.3. Limitations and Future Research Directions
This study has several limitations that point to directions for future research [60].
First, the study adopts a city-wide scale with young people as a broad category, which may obscure variations among youth sub-groups and localized settings. Future research could narrow the analytical scale to university towns, student neighborhoods, or youth employment hubs to yield more targeted design insights.
Second, the BERI framework is inherently vision-centric, relying exclusively on street-view imagery and thus capturing only the visual dimension of restorative potential. Real-world psychological restoration involves multiple sensory modalities; future studies should integrate acoustic, microclimatic, or physiological data where feasible.
Third, the framework is static, based on images from a single season (June 2025). Restorative potential varies across diurnal cycles, seasons, and activity rhythms, and future work should incorporate multi-temporal imagery and mobility data to capture these dynamics.
Fourth, BERI is constructed from general perception proxies rather than direct psychological recovery measures. Although these proxies are empirically associated with restorative experiences, the index should be regarded as measuring restorative-supportive environmental quality. Future studies should employ standardized instruments such as the Perceived Restorativeness Scale (PRS) or physiological indicators for rigorous construct validation.
Fifth, the perception models are trained on data from young Changsha residents, making them population-specific and embedded in Chinese urban morphology and visual culture. Transferability to other cultural contexts requires cross-cultural validation and local calibration of both perception models and indicator weights.
Sixth, the operationalization of the built environment reduces urban complexity to pixel-level quantities, overlooking spatial configuration, architectural form, and symbolic meaning. Future research should integrate traditional morphological analysis (e.g., space syntax, building typology classification) and qualitative assessments to enrich the framework.
Seventh, the spatial interpretations are based primarily on visual and morphological variables without explicit socioeconomic controls. Socioeconomic factors likely covary with both urban form and restorative potential, and disentangling these pathways requires spatially disaggregated socioeconomic data in future studies.
Eighth, the strategic directions proposed in Section 4.2 are evidence-informed hypotheses rather than operational planning tools. Translating these insights into actionable guidelines requires professional validation, stakeholder consultation, and co-development of decision-support instruments, bridging the gap between AI analytics and planning practice.
4.4. SWOT Analysis of AI Assisted Built Environment Restorativeness Assessment
To position the current framework within the broader development of AI driven urban analytics, a concise SWOT (Strengths, Weaknesses, Opportunities, Threats) analysis is presented in Table 4. This analysis focuses on the use of deep learning and explainable machine learning for evaluating the restorative qualities of built environments, drawing on the methods and findings of this study [61].
Table 4.
SWOT analysis of AI methods for built environment restorativeness assessment.
In summary, while AI methods offer unprecedented efficiency and analytical depth for evaluating built environment restorativeness, their successful application requires careful attention to data quality, model transparency, and the inherent complexity of human–environment interactions. Future work should aim to blend AI driven assessment with qualitative fieldwork, creating a more holistic and trustworthy evaluation paradigm for youth friendly urban design.
5. Conclusions
From the perspective of young people, integrating street-view imagery, deep learning, and explainable machine learning, this study builds a comprehensive analytical framework that combines multiple technologies and fuses multi-source data to achieve a comprehensive measurement and mechanism analysis of the restorative capacity of Changsha’s built-up area.
The key findings are as follows: (1) The visually perceived restorative potential of Changsha’s built environment exhibits a concentric structure characterized by “central agglomeration, peripheral decline”, with high-BERI zones concentrated in areas with a combination of ecological assets and diverse building functions. (2) Young people’s spatial perception exhibits multidimensional mismatches such as “beautiful but not clean” and “safe but not lively”, reflecting a misalignment between built environment supply and youth demand. (3) Key environmental features exhibit nonlinear associations with the perceived restorative potential of the built environment. Tree coverage shows a consistently positive association without reaching saturation within the observed range. The association between building density and BERI appears to weaken at the highest density levels. The association between road proportion and BERI follows a bidirectional pattern, shifting from negative to positive beyond a certain range.
Methodologically, this study breaks through the limitations of traditional single indicators, achieving a deep integration of subjective perception and the objective built environment. Theoretically, it reveals the measurable mechanism through which built environments influence young people’s mental states, providing a spatial explanatory pathway for understanding young people’s psychological recovery needs. Practically, it offers quantitative tools for the precise identification and targeted optimization of youth-friendly built environment development, with the understanding that these tools assess the visual dimension of restorative potential, are embedded within the Chinese urban context from which they were derived, and should be complemented by other sensory and experiential assessments as well as local calibration when applied to different cultural settings.
Author Contributions
Conceptualization, J.L., Z.Z. and Y.W.; Methodology, Z.H., J.L. and Z.Z.; Software, J.L. and Z.Z.; Validation, Z.H., J.L. and Y.W.; Formal analysis, J.L., Z.Z. and Y.W.; Investigation, J.L. and Z.Z.; Resources, Z.H.; Data curation, Z.H.; Writing—original draft, J.L., Z.Z. and Y.W.; Writing—review and editing, Z.H. and Y.W.; Visualization, J.L. and Z.Z.; Supervision, Z.H. and Y.W.; Project administration, Z.H. and Y.W.; Funding acquisition, Z.H. and Y.W. All authors have read and agreed to the published version of the manuscript.
Funding
This research was funded by the National Natural Science Foundation of China (32471596, 31700196) and the Natural Science Foundation of Hunan Province (2020JJ5477).
Institutional Review Board Statement
The study was conducted in accordance with the Declaration of Helsinki and approved by the Institutional Review Board of the College of Architecture and Design, University of South China (Approval Code: prot. n. 31/2025).
Informed Consent Statement
Informed consent was obtained from all subjects involved in the study.
Data Availability Statement
The data is self-measured to ensure authenticity, but due to confidentiality and academic ethics, it will not be made public.
Conflicts of Interest
The authors declare no conflicts of interest.
References
- Hickman, C. ‘To brighten the aspect of our streets and increase the health and enjoyment of our city’: The National Health Society and urban green space in late-nineteenth century London. Landsc. Urban Plan. 2013, 118, 112–119. [Google Scholar] [CrossRef] [Scilit]
- Cao, Q. Manifestations, triggers, and alleviation of anxiety among some youth. People’s Trib. 2024, 17, 88–90. [Google Scholar] [CrossRef]
- Zhang, X.; Wang, X.; Song, B. Influencing Factors for Depressive and Anxiety Symptoms in Chinese Student Girls Aged 10–19 Years Old: A Community-Based Cross-Sectional Study. Preprint 2023. [Google Scholar] [CrossRef] [Scilit] [PubMed]
- Ulrich, R.S. View through a window may influence recovery from surgery. Science 1984, 224, 420–421. [Google Scholar] [CrossRef] [Scilit] [PubMed]
- Kaplan, R.; Kaplan, S. The Experience of Nature: A Psychological Perspective; Cambridge University Press: Cambridge, UK, 1989. [Google Scholar]
- Zhang, F.; Zhou, B.; Liu, L.; Liu, Y.; Fung, H.H.; Lin, H.; Ratti, C. Measuring human perceptions of a large-scale urban region using machine learning. Landsc. Urban Plan. 2018, 180, 148–160. [Google Scholar] [CrossRef] [Scilit]
- Wu, C.; Ye, Y.; Gao, F.; Ye, X. Using street view images to examine the association between human perceptions of locale and urban vitality in Shenzhen, China. Sustain. Cities Soc. 2023, 88, 104291. [Google Scholar] [CrossRef] [Scilit]
- Dai, L.; Zheng, C.; Dong, Z.; Yao, Y.; Wang, R.; Zhang, X.; Ren, S.; Zhang, J.; Song, X.; Guan, Q. Analyzing the correlation between visual space and residents’ psychology in Wuhan, China using street-view images and deep-learning technique. City Environ. Interact. 2021, 11, 100069. [Google Scholar] [CrossRef] [Scilit]
- Peng, H.; Li, Y.; Wu, H.; Zhao, Y. Measurement of urban street psychological stress perception based on Baidu Street View: A case study of Gulou District, Fuzhou. Mod. Urban Res. 2026, 41, 76–82+112. [Google Scholar] [CrossRef]
- Dupont, L.; Antrop, M.; Van Eetvelde, V. Eye-tracking analysis in landscape perception research: Influence of photograph properties and landscape characteristics. Landsc. Res. 2014, 39, 417–432. [Google Scholar] [CrossRef] [Scilit]
- Lu, X.; Li, Q.; Ji, X.; Sun, D.; Meng, Y.; Yu, Y.; Lyu, M. Impact of streetscape built environment characteristics on human perceptions using street view imagery and deep learning: A case study of Changbai Island, Shenyang. Buildings 2025, 15, 1524. [Google Scholar] [CrossRef] [Scilit]
- Olszewska-Guizzo, A.; Sia, A.; Fogel, A.; Ho, R. Features of urban green spaces associated with positive emotions, mindfulness and relaxation. Sci. Rep. 2022, 12, 20695. [Google Scholar] [CrossRef] [Scilit] [PubMed]
- The Bertschi School Science Wing. Living-Future.org. Available online: https://living-future.org/case-studies/the-bertschi-school-science-wing/ (accessed on 5 June 2026).
- Bardhan, M.; Li, F.; Browning, M.H.; Dong, J.; Zhang, K.; Yuan, S.; İnan, H.E.; McAnirlin, O.; Dagan, D.T.; Maynard, A.; et al. From space to street: A systematic review of the associations between visible greenery and bluespace in street view imagery and mental health. Environ. Res. 2024, 263, 120213. [Google Scholar] [CrossRef] [Scilit] [PubMed]
- Collins, P.Y.; Sinha, M.; Concepcion, T.; Patton, G.; Way, T.; McCay, L.; Mensa-Kwao, A.; Herrman, H.; de Leeuw, E.; Anand, N.; et al. Making cities mental health friendly for adolescents and young adults. Nature 2024, 627, 137–148. [Google Scholar] [CrossRef] [Scilit] [PubMed]
- Yang, H.; Zou, S.; Hu, Y. Visual perception characteristics of generalized structure of urban street greening: A case study of six districts in Tianjin city. Landsc. Archit. 2025, 32, 37–44. [Google Scholar] [CrossRef] [Scilit]
- Li, X.; Wu, D.; Li, L.; Wang, X. Research on visual perception evaluation of urban riverside greenway landscape based on deep learning. J. Beijing For. Univ. 2021, 43, 93–104. [Google Scholar] [CrossRef]
- Sakti, A.D.; Niu, H.; Silva, E.A. Environmental determinants of urban mental health in London derived from social media analytics and geospatial machine learning. Cities 2026, 174, 107033. [Google Scholar] [CrossRef] [Scilit]
- Qian, C.; Xiao, Y.; Zhou, Y. Research on perception measurement and spatial distribution characteristics of living streets around historic blocks based on machine learning. Chin. Landsc. Archit. 2025, 41, 61–68. [Google Scholar] [CrossRef]
- Lederbogen, F.; Kirsch, P.; Haddad, L.; Streit, F.; Tost, H.; Schuch, P.; Wüst, S.; Pruessner, J.C.; Rietschel, M.; Deuschle, M.; et al. City living and urban upbringing affect neural social stress processing in humans. Nature 2011, 474, 498–501. [Google Scholar] [CrossRef] [Scilit] [PubMed]
- Duan, Y.; Li, S. Effects of plant communities on human physiological recovery and emotional reactions: A comparative onsite survey and photo elicitation study. Int. J. Environ. Res. Public Health 2022, 19, 721. [Google Scholar] [CrossRef] [Scilit] [PubMed]
- Han, J.; Dong, L. Research on visual evaluation of street landscape based on psychophysical method. Chin. Landsc. Archit. 2015, 31, 116–119. [Google Scholar] [CrossRef]
- Sadeghpoor, F.; Ranjbar, E.; Esmaeilinasab, M.; Valiloo, M.H.S.; Nieuwenhuijsen, M.J. Streets and stress: A pilot study on how quality and design of streets impacts on urban stress. HERD Health Environ. Res. Des. J. 2024, 17, 224–248. [Google Scholar] [CrossRef] [Scilit] [PubMed]
- Wang, L.; Guo, J.L.; Bai, Z.C.; He, J. Construction and empirical research of an urban spatial perception evaluation framework based on multimodal large models. Landsc. Archit. 2026, 1–18. Available online: https://link.cnki.net/urlid/11.5366.S.20260319.1732.003 (accessed on 14 April 2026).
- Wu, S.; Hu, Y. Research on visualization of crowd behavior in public spaces based on deep learning: A case study of Weijin road campus of Tianjin university. Landsc. Archit. 2022, 29, 106–111. [Google Scholar] [CrossRef]
- Huang, Y.; Zhong, C.; He, T.; Jiang, Y. Dynamics of street environmental features and emotional responses in urban areas: Implications for public health and sustainable development. Front. Public Health 2025, 13, 1589183. [Google Scholar] [CrossRef] [Scilit] [PubMed]
- Liu, Z.; Wang, X.; Yang, F.; Li, F. Research progress on digital identification technology of informal green spaces integrated with deep learning under the background of urban renewal. Chin. Landsc. Archit. 2023, 39, 33–38. [Google Scholar] [CrossRef]
- Lü, X.Y.; Guo, C.X.; Tang, H.; Luo, Z.B.; Li, H.F. Post-occupancy evaluation of small and micro urban public spaces renovated with the support of multi-source data and deep learning. Archit. J. 2025, S2, 87–92. Available online: https://link.cnki.net/urlid/11.1930.tu.20251024.1421.006 (accessed on 8 June 2026).
- Ye, Z.Y.; Zhu, J.W.; Wang, J.C.; Ren, Y.M. Research on quality improvement of non-motorized traffic environment based on self-collected street view and deep learning: A case study of Changsha. South Archit. 2026, S2, 30–40. [Google Scholar] [CrossRef]
- Wang, X.; Zhang, J. Research on street perception measurement and vitality impact based on XGBoost-SHAP model: A case study of small-scale blocks in Chengdu. Chin. Overseas Archit. 2025, 12, 53–59. [Google Scholar] [CrossRef]
- Sun, J.; Sun, Z.; Guo, H.; Wang, J.; Jiang, H.; Gao, J. Dataset of Urban Built-Up Areas in China in 2020; Science Data Bank: Beijing, China, 2021; Available online: https://cstr.cn/31253.11.sciencedb.j00001.00332 (accessed on 3 August 2024).
- He, N.; Li, G. Urban neighbourhood environment assessment based on street view image processing: A review of research trends. Environ. Chall. 2021, 4, 100090. [Google Scholar] [CrossRef] [Scilit]
- Huang, L.; Oki, T. Enhancing people’s walking preferences in street design through generative artificial intelligence and crowdsourcing surveys: The case of Tokyo. Environ. Plan. B Urban Anal. City Sci. 2025, 53, 23998083251327405. [Google Scholar] [CrossRef] [Scilit]
- Chen, C.; Li, H.; Luo, W.; Xie, J.; Yao, J.; Wu, L.; Xia, Y. Predicting the effect of street environment on residents’ mood states in large urban areas using machine learning and street view images. Sci. Total Environ. 2022, 816, 151605. [Google Scholar] [CrossRef] [Scilit] [PubMed]
- Qiu, W.; Li, W.; Liu, X.; Zhang, Z.; Li, X.; Huang, X. Subjective and objective measures of streetscape perceptions: Relationships with property value in Shanghai. Cities 2023, 132, 104037. [Google Scholar] [CrossRef] [Scilit]
- Li, X.; Zhang, C.; Li, W.; Ricard, R.; Meng, Q.; Zhang, W. Assessing street-level urban greenery using Google Street View and a modified green view index. Urban For. Urban Green. 2015, 14, 675–685. [Google Scholar] [CrossRef] [Scilit]
- Zhang, H.; Li, F.; Xu, H.; Huang, S.; Liu, S.; Ni, L.M.; Zhang, L. Mp-former: Mask-piloted transformer for image segmentation. In Proceedings of the IEEE/CVF Conference on Computer Vision and Pattern Recognition, Vancouver, BC, Canada, 17–24 June 2023; pp. 18074–18083. [Google Scholar]
- Ye, Y.; Richards, D.; Lu, Y.; Song, X.; Zhuang, Y.; Zeng, W.; Zhong, T. Measuring daily accessed street greenery: A human-scale approach for informing better urban planning practices. Landsc. Urban Plan. 2019, 191, 103434. [Google Scholar] [CrossRef] [Scilit]
- Yu, H.; Gao, Y.; Yang, L.; Liu, F.; Gao, X.; Tan, Q. Knowledge reasoning of transmission line component detection using CRITIC and TOPSIS approaches. Soft Comput. 2023, 27, 991–1004. [Google Scholar] [CrossRef] [Scilit]
- Wang, S.; Cai, W.; Sun, Q.C.; Wu, C.Y.; Huang, X.; Giannopoulos, I.; Alinaghi, N.; Liu, Z. Human-perceived vs actual built environment: Using human-centred GeoAI and street view images to support urban planning in Australia. J. Environ. Manag. 2025, 389, 126070. [Google Scholar] [CrossRef] [Scilit] [PubMed]
- Zhang, Z.; Huang, C. Research on vitality measurement and enhancement of historic streets. Mod. Urban Res. 2025, 2, 74–81. [Google Scholar] [CrossRef]
- Qin, Y.; Wu, X.; Yu, T.; Jiang, S. Enhancing student-centered walking environments on university campuses through street view imagery and machine learning. PLoS ONE 2025, 20, e0321028. [Google Scholar] [CrossRef] [Scilit] [PubMed]
- Wang, L.; Han, X.; He, J.; Jung, T. Measuring residents’ perceptions of city streets to inform better street planning through deep learning and space syntax. ISPRS J. Photogramm. Remote Sens. 2022, 190, 215–230. [Google Scholar] [CrossRef] [Scilit]
- Yao, Y.; Wang, J.; Hong, Y.; Qian, C.; Guan, Q.; Liang, X.; Dai, L.; Zhang, J. Discovering the homogeneous geographic domain of human perceptions from street view images. Landsc. Urban Plan. 2021, 212, 104125. [Google Scholar] [CrossRef] [Scilit]
- Qi, Z.; Li, J.; Yang, X.; He, Z. How streetscape shapes affect visitor emotions: An experimental analysis based on large-scale street view images in Xi’an, China. Cities 2026, 168, 106424. [Google Scholar] [CrossRef] [Scilit]
- Zhang, Z.; Lin, J.Y.; Huang, Z.H.; Huang, C.H. Semantic Segmentation of Street Views in Historic Blocks and Research on Pedestrian Environment. Mod. Urban Res. 2025, 9, 45–51. [Google Scholar] [CrossRef]
- Gu, Y.; Quintana, M.; Liang, X.; Ito, K.; Yap, W.; Biljecki, F. Designing effective image-based surveys for urban visual perception. Landsc. Urban Plan. 2025, 260, 105368. [Google Scholar] [CrossRef] [Scilit]
- Chen, C.; Feng, X.; Yao, J.; Xiong, X. Perceived leisure service benefits of peri-urban community green Spaces: Impact of visual environment during day and night. Landsc. Urban Plan. 2025, 259, 105338. [Google Scholar] [CrossRef] [Scilit]
- Qin, X.; Yang, D.; Wangari, V.W. Quantitative characterization and evaluation of highway greening landscape spatial quality based on deep learning. Environ. Impact Assess. Rev. 2024, 107, 107559. [Google Scholar] [CrossRef] [Scilit]
- Zhao, X.; Lu, Y.; Lin, G. An integrated deep learning approach for assessing the visual qualities of built environments utilizing street view images. Eng. Appl. Artif. Intell. 2024, 130, 107805. [Google Scholar] [CrossRef] [Scilit]
- Bahr, S. The relationship between urban greenery, mixed land use and life satisfaction: An examination using remote sensing data and deep learning. Landsc. Urban Plan. 2024, 251, 105174. [Google Scholar] [CrossRef] [Scilit]
- Li, W.; Yu, J.; Chen, D.; Lin, Y.; Dong, R.; Zhang, X.; He, C.; Fu, H. Fine-grained building function recognition with street-view images and GIS map data via geometry-aware semi-supervised learning. Int. J. Appl. Earth Obs. Geoinf. 2025, 137, 104386. [Google Scholar] [CrossRef] [Scilit]
- Liang, H.; Zhang, J.; Li, Y.; Wang, B.; Huang, J. Automatic estimation for visual quality changes of street space via street-view images and multimodal large language models. IEEE Access 2024, 12, 87713–87727. [Google Scholar] [CrossRef] [Scilit]
- Chen, S.; Liu, L.; Chen, C.; Haase, D. The interaction between human demand and urban greenspace supply for promoting positive emotions with sentiment analysis from Twitter. Urban For. Urban Green. 2022, 78, 127763. [Google Scholar] [CrossRef] [Scilit]
- Wedyan, M.; Saeidi-Rizi, F. Assessing the impact of urban environments on mental health and perception using deep learning: A review and text mining analysis. J. Urban Health 2024, 101, 327. [Google Scholar] [CrossRef] [Scilit] [PubMed]
- Richards, D.R.; Edwards, P.J. Quantifying street tree regulating ecosystem services using Google Street View. Ecol. Indic. 2017, 77, 31–40. [Google Scholar] [CrossRef] [Scilit]
- Liu, J.; Zhang, T.; Ma, Y.; Hu, T.; Lin, F.; Liang, H.; Yang, D.; Pan, Y.; Gao, D.; Qiu, L.; et al. Generative artificial intelligence perspectives on typical landscape types: Can ChatGPT compete with human insight? Landsc. Urban Plan. 2025, 264, 105479. [Google Scholar] [CrossRef] [Scilit]
- Ivančík, R.; Dušek, J. Sustainable Development and Democratic Resilience in the European Union. Sustainability 2026, 18, 3631. [Google Scholar] [CrossRef] [Scilit]
- Peráček, T.; Kaššaj, M. Strategic Management of Urban Services Using Artificial Intelligence in the Development of Sustainable Smart Cities—Managerial and Legal Challenges. Sustainability 2026, 18, 582. [Google Scholar] [CrossRef] [Scilit]
- Huang, Y.; Sanatani, R.P.; Liu, C.; Kang, Y.; Zhang, F.; Liu, Y.; Duarte, F.; Ratti, C. No “true” greenery: Deciphering the bias of satellite and street view imagery in urban greenery measurement. Build. Environ. 2025, 269, 112395. [Google Scholar] [CrossRef] [Scilit]
- Dunkel, A. Visualizing the perceived environment using crowdsourced photo geodata. Landsc. Urban Plan. 2015, 142, 173–186. [Google Scholar] [CrossRef] [Scilit]
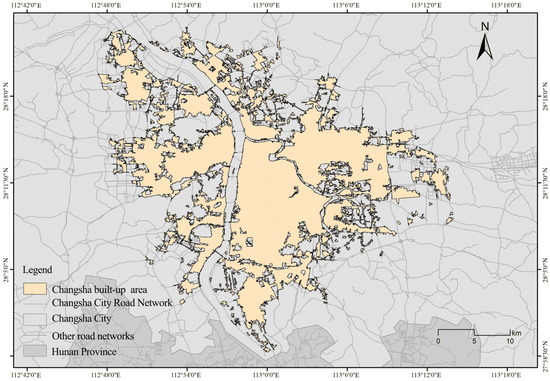
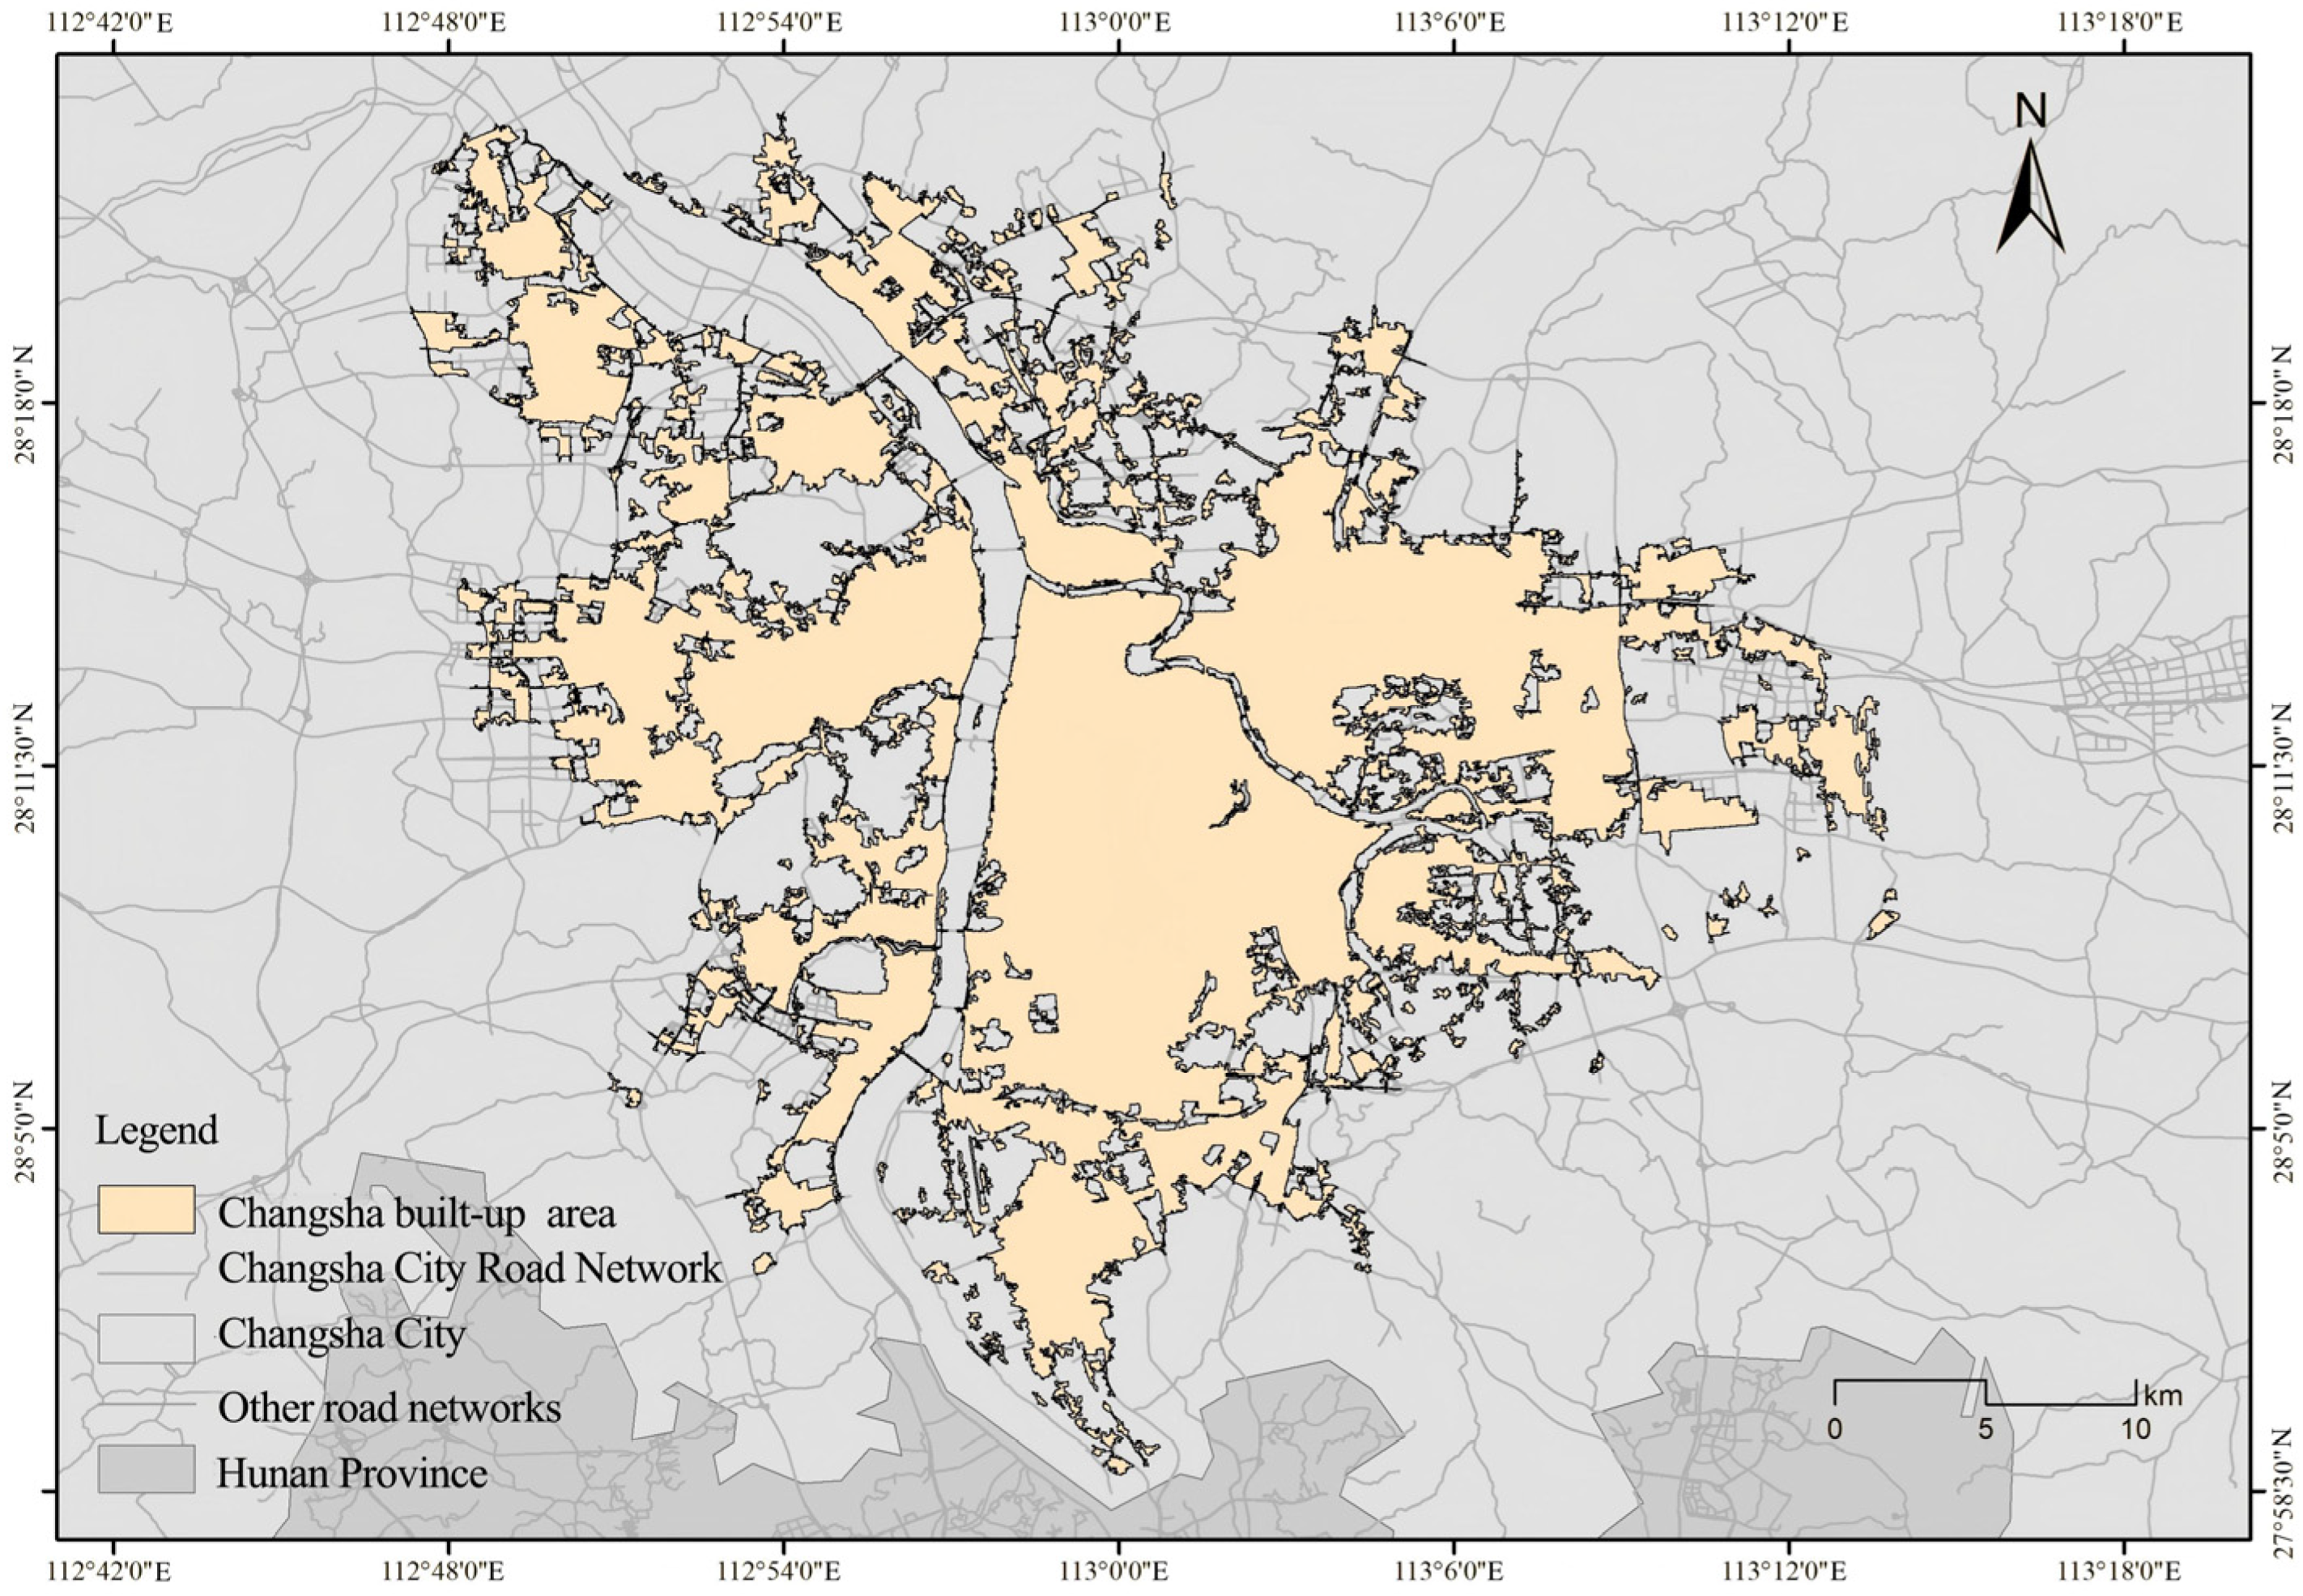
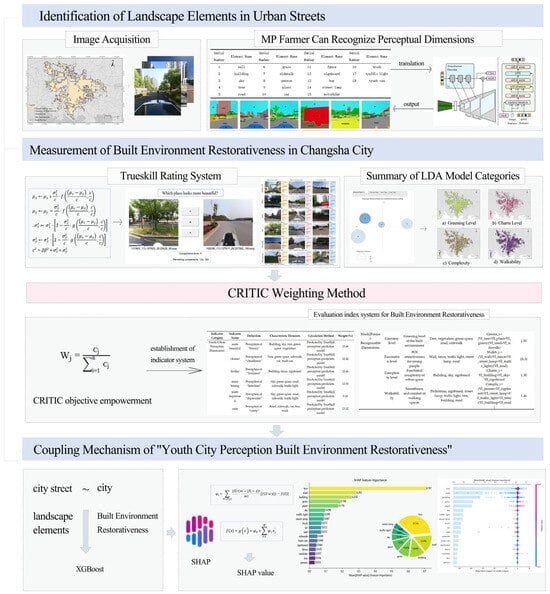
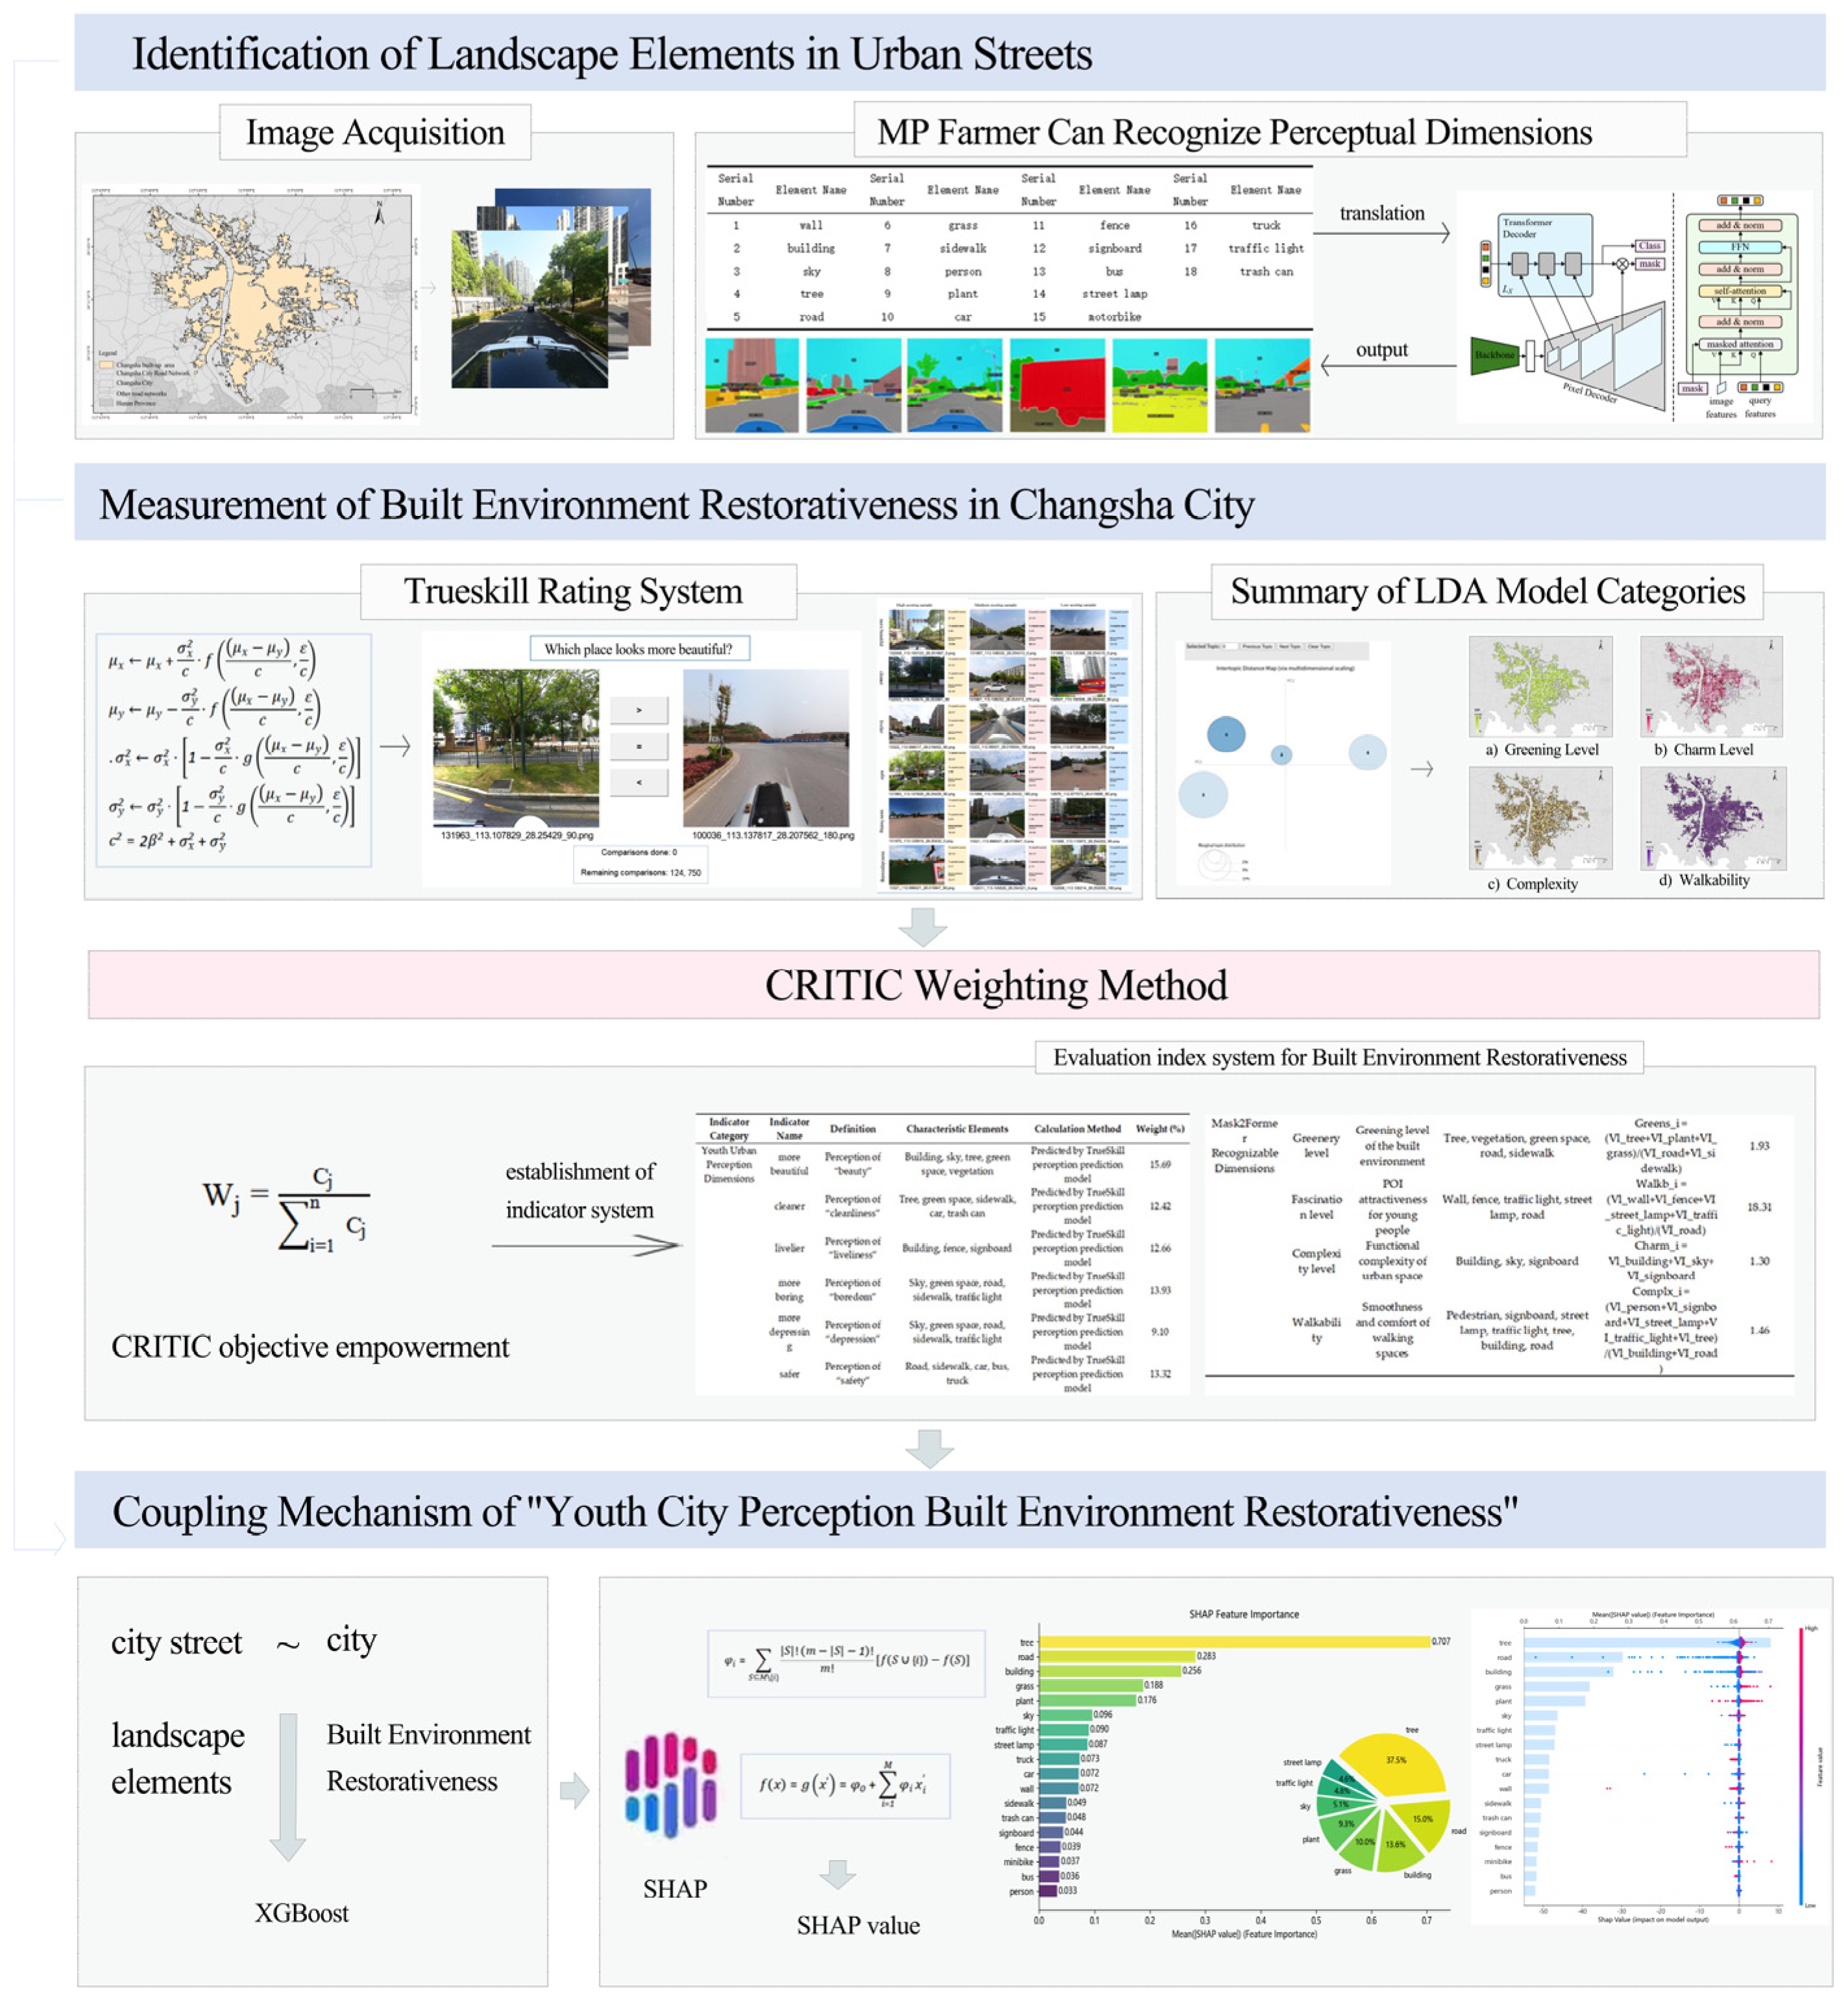
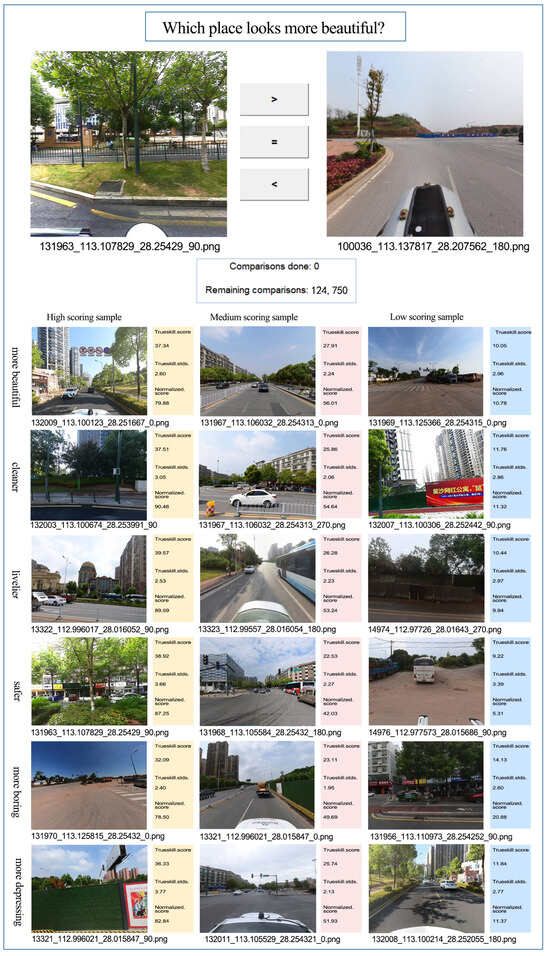
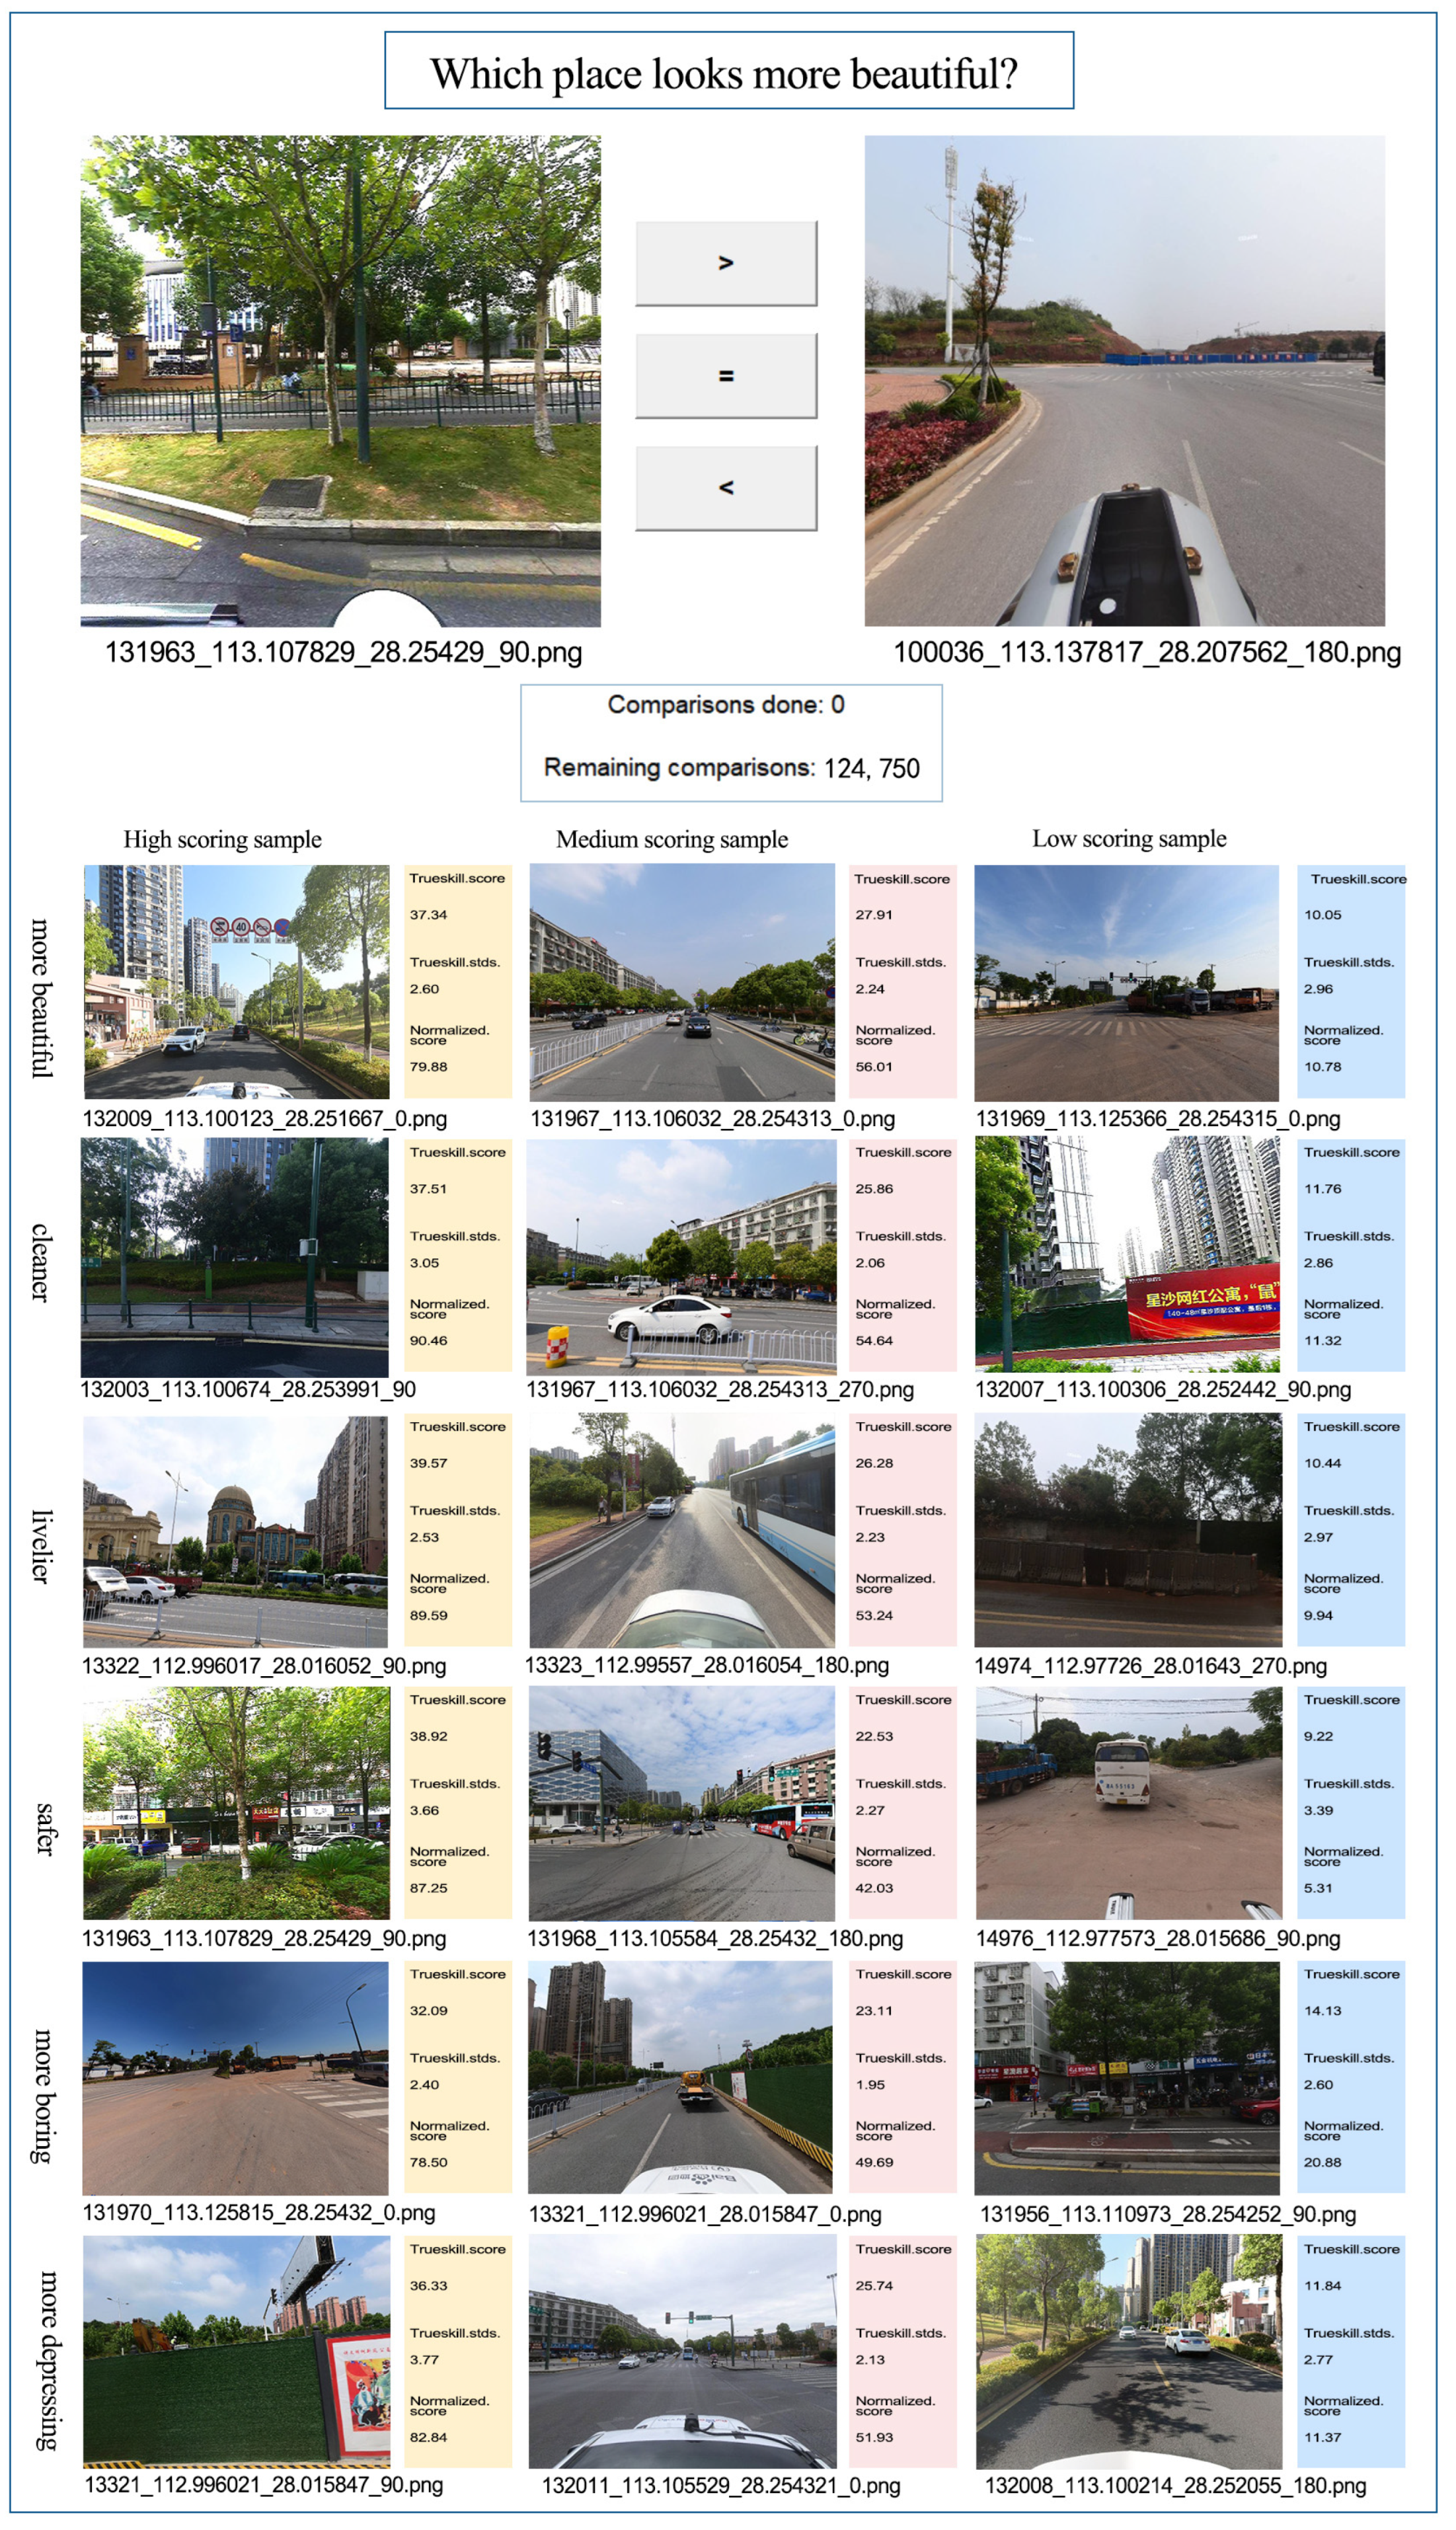
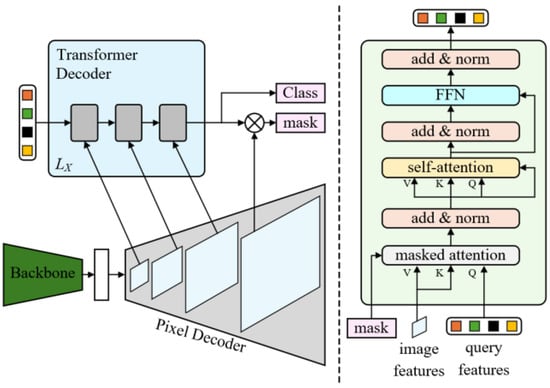
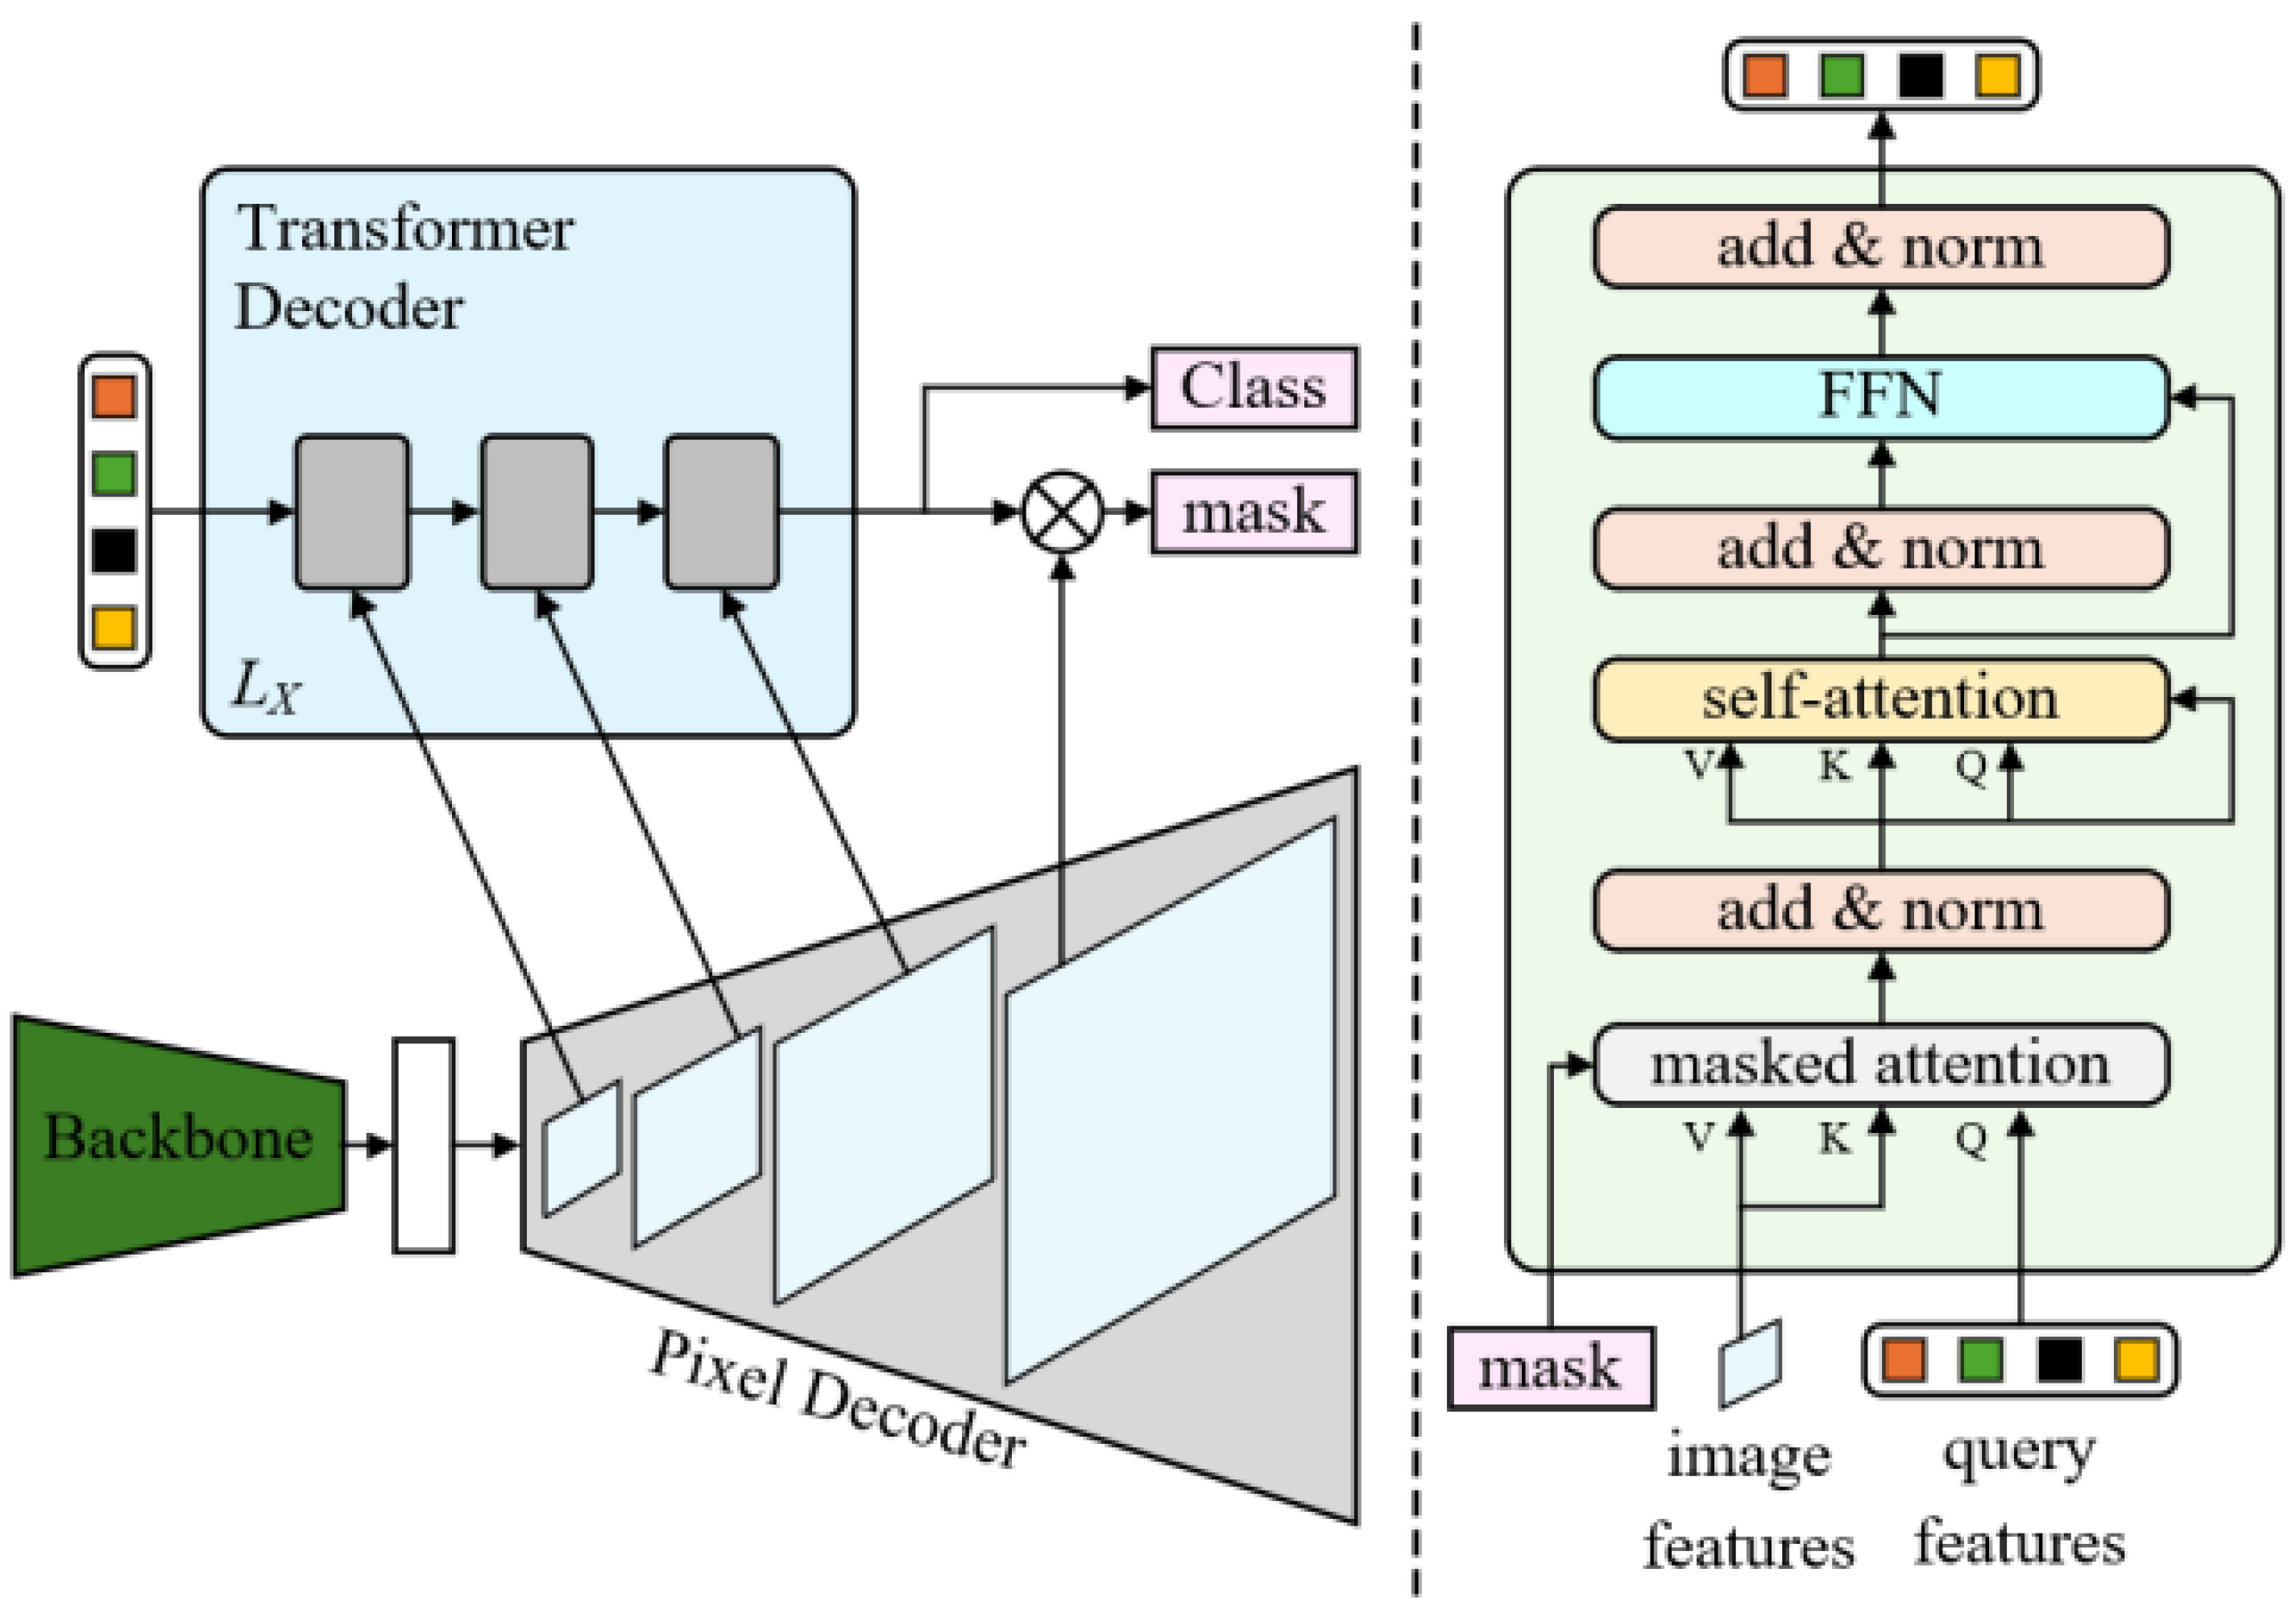
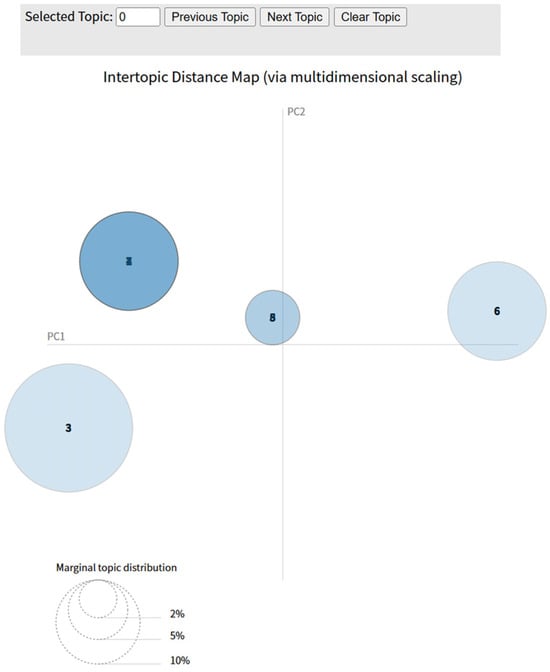
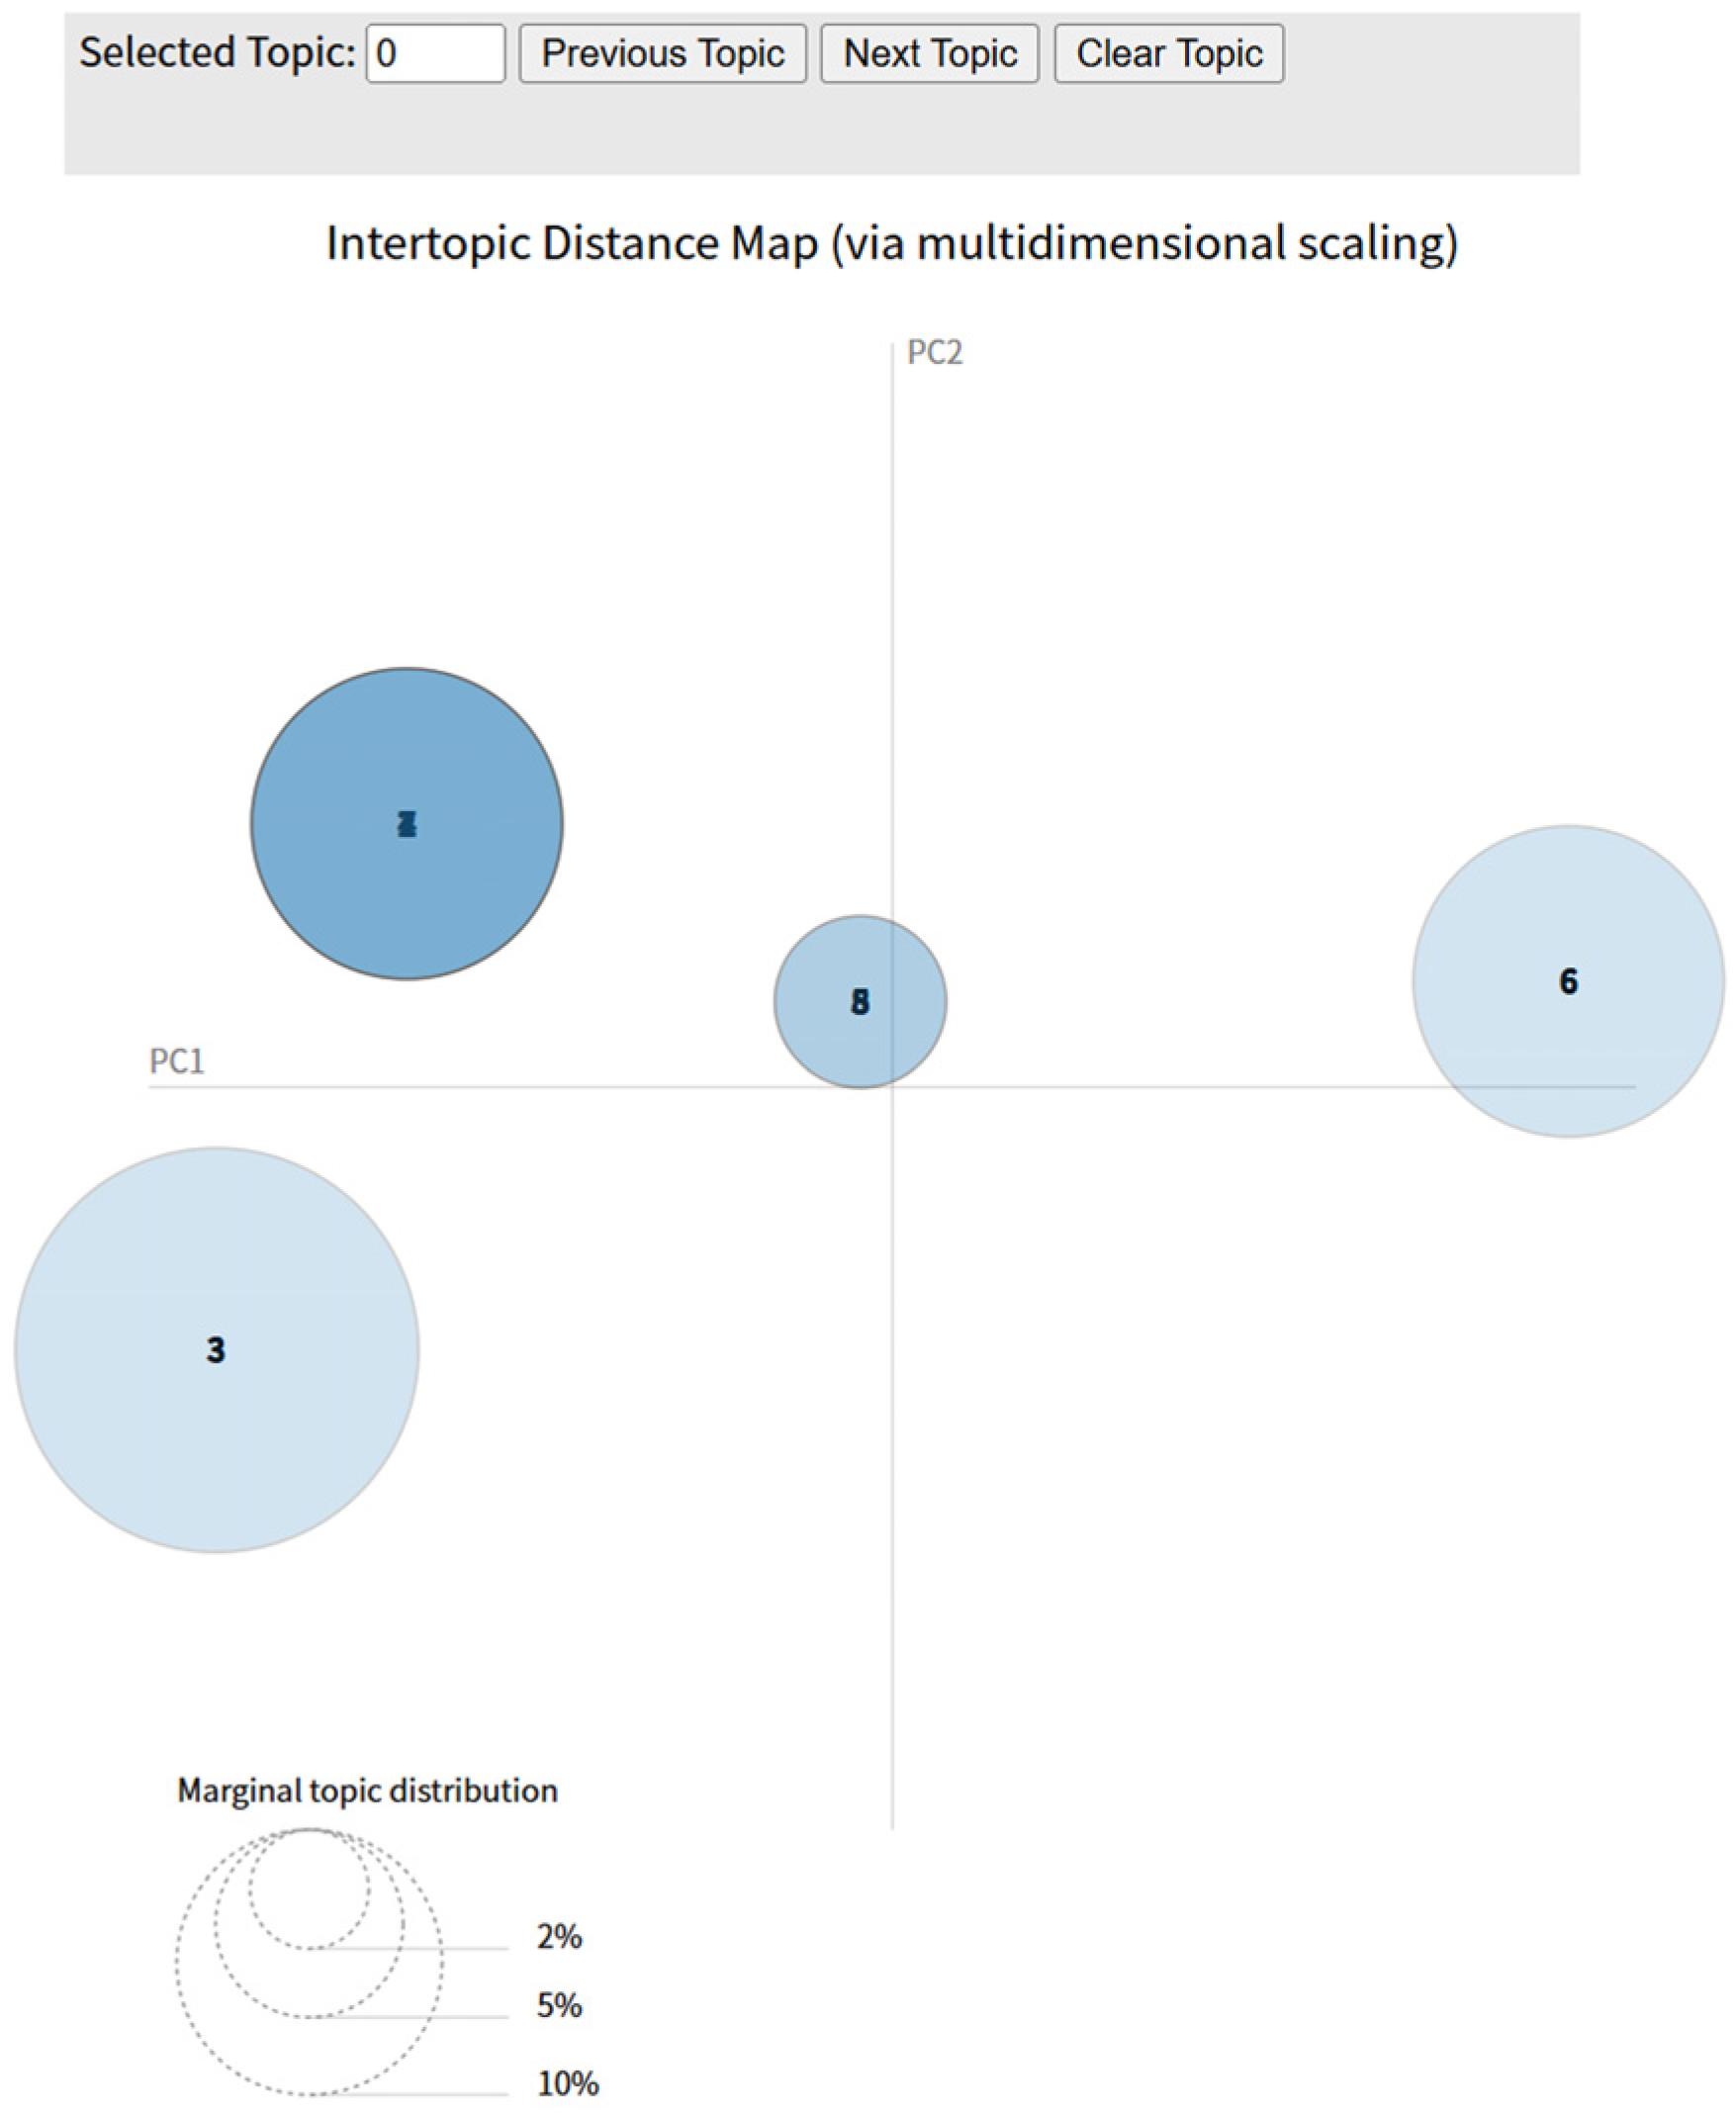
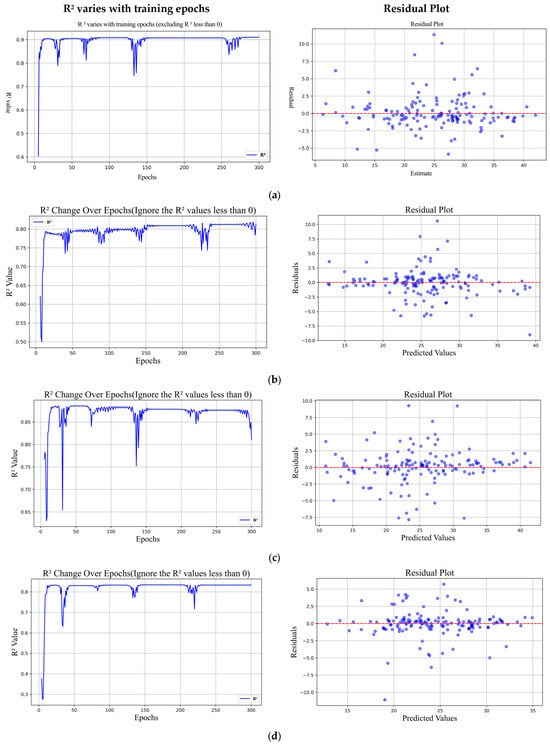
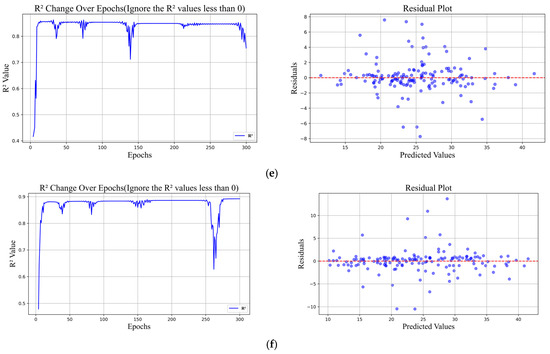
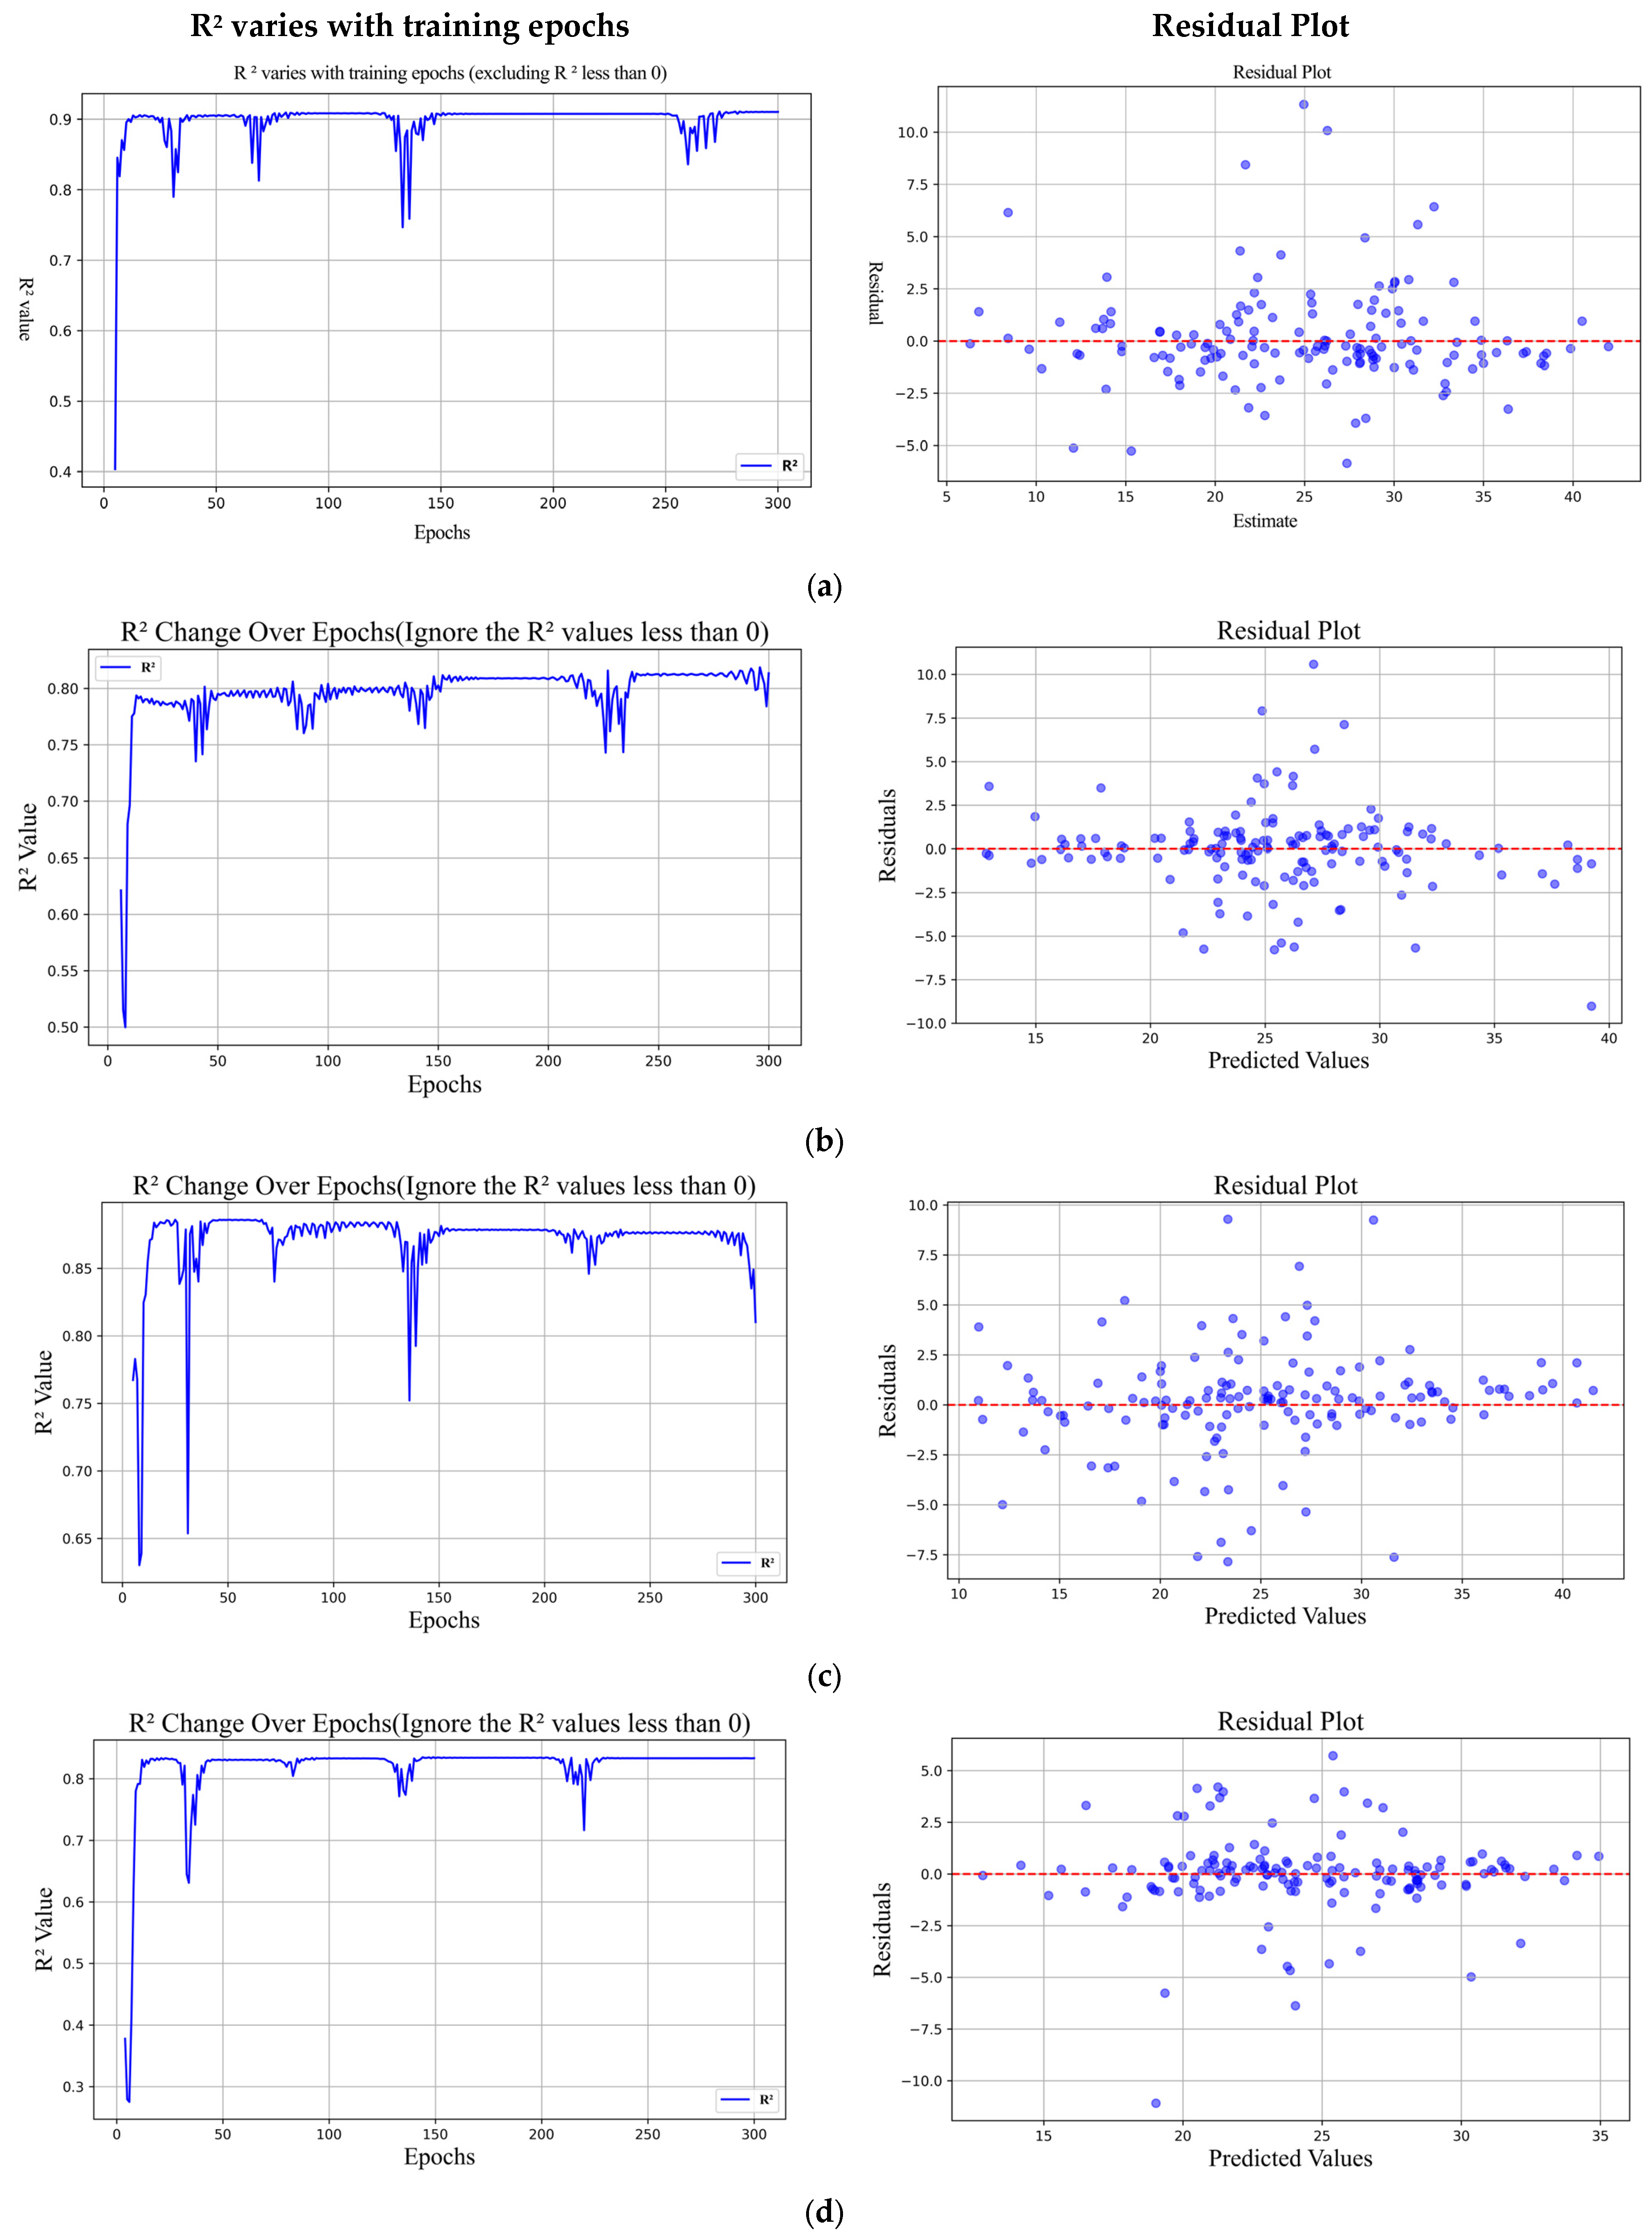
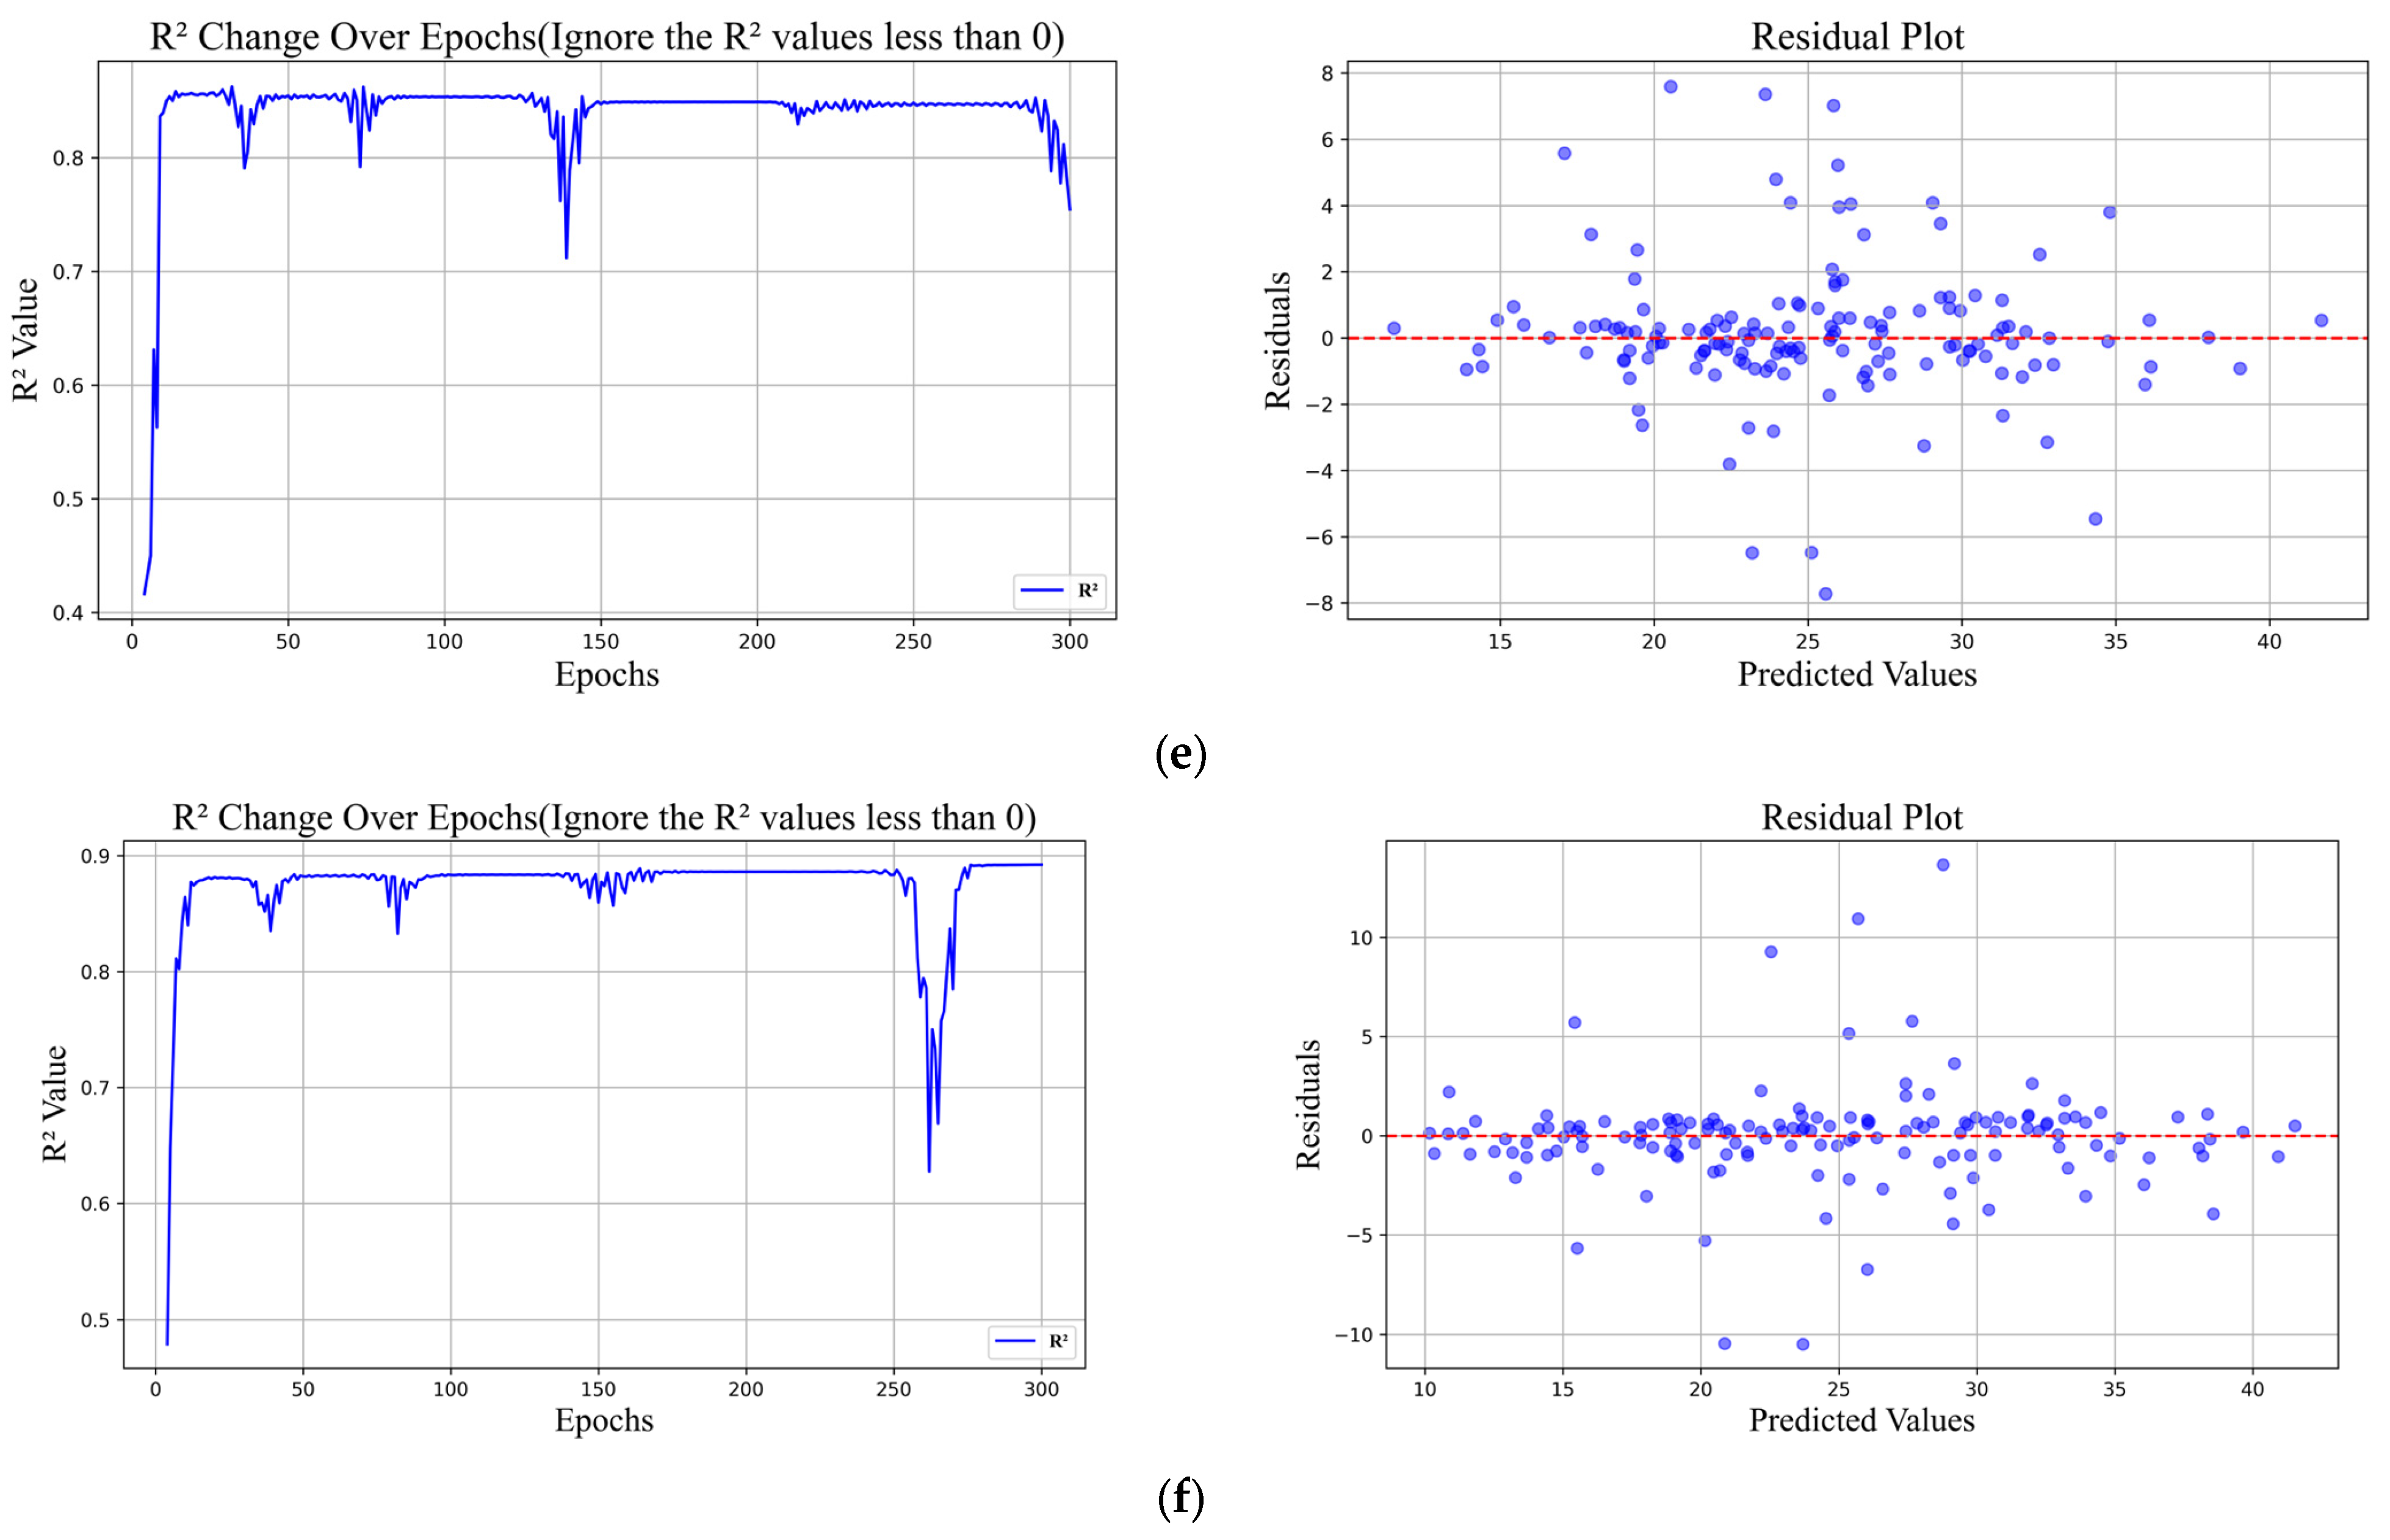
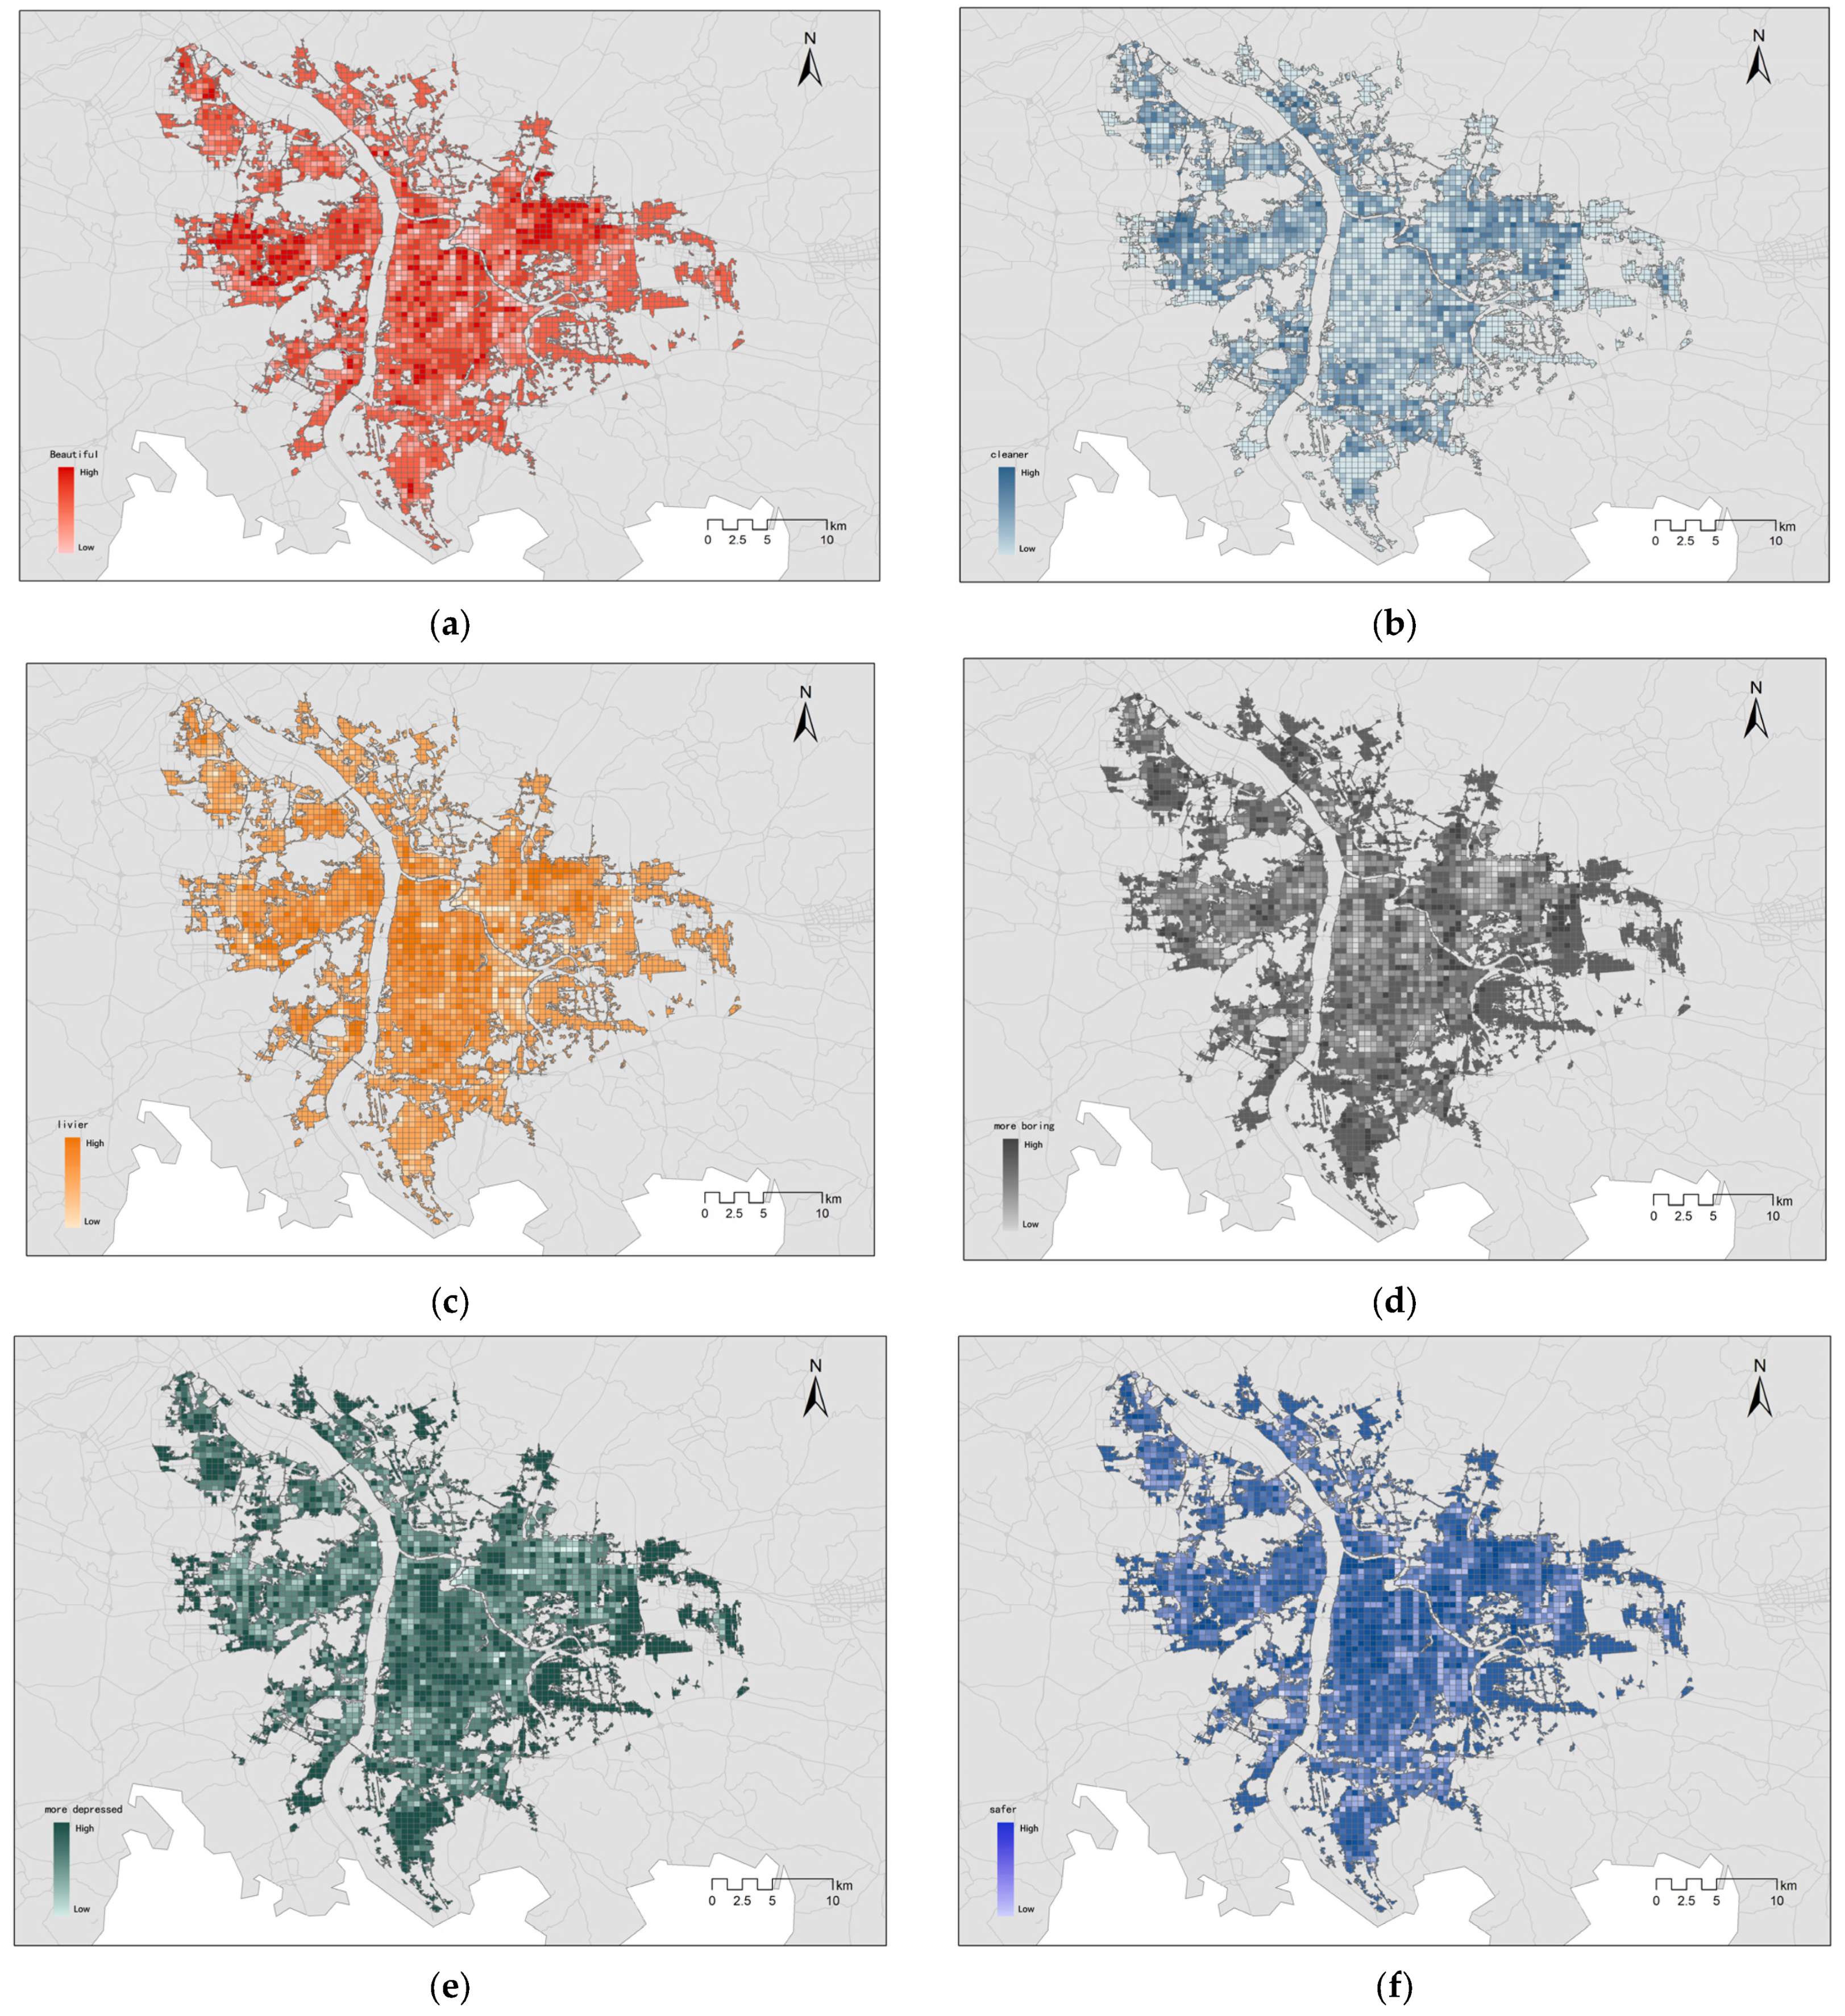
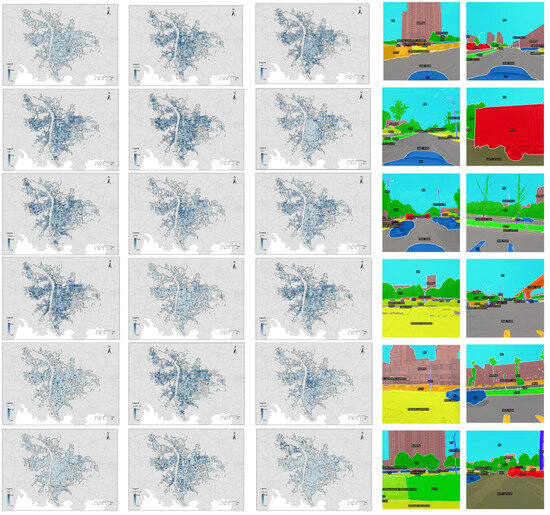
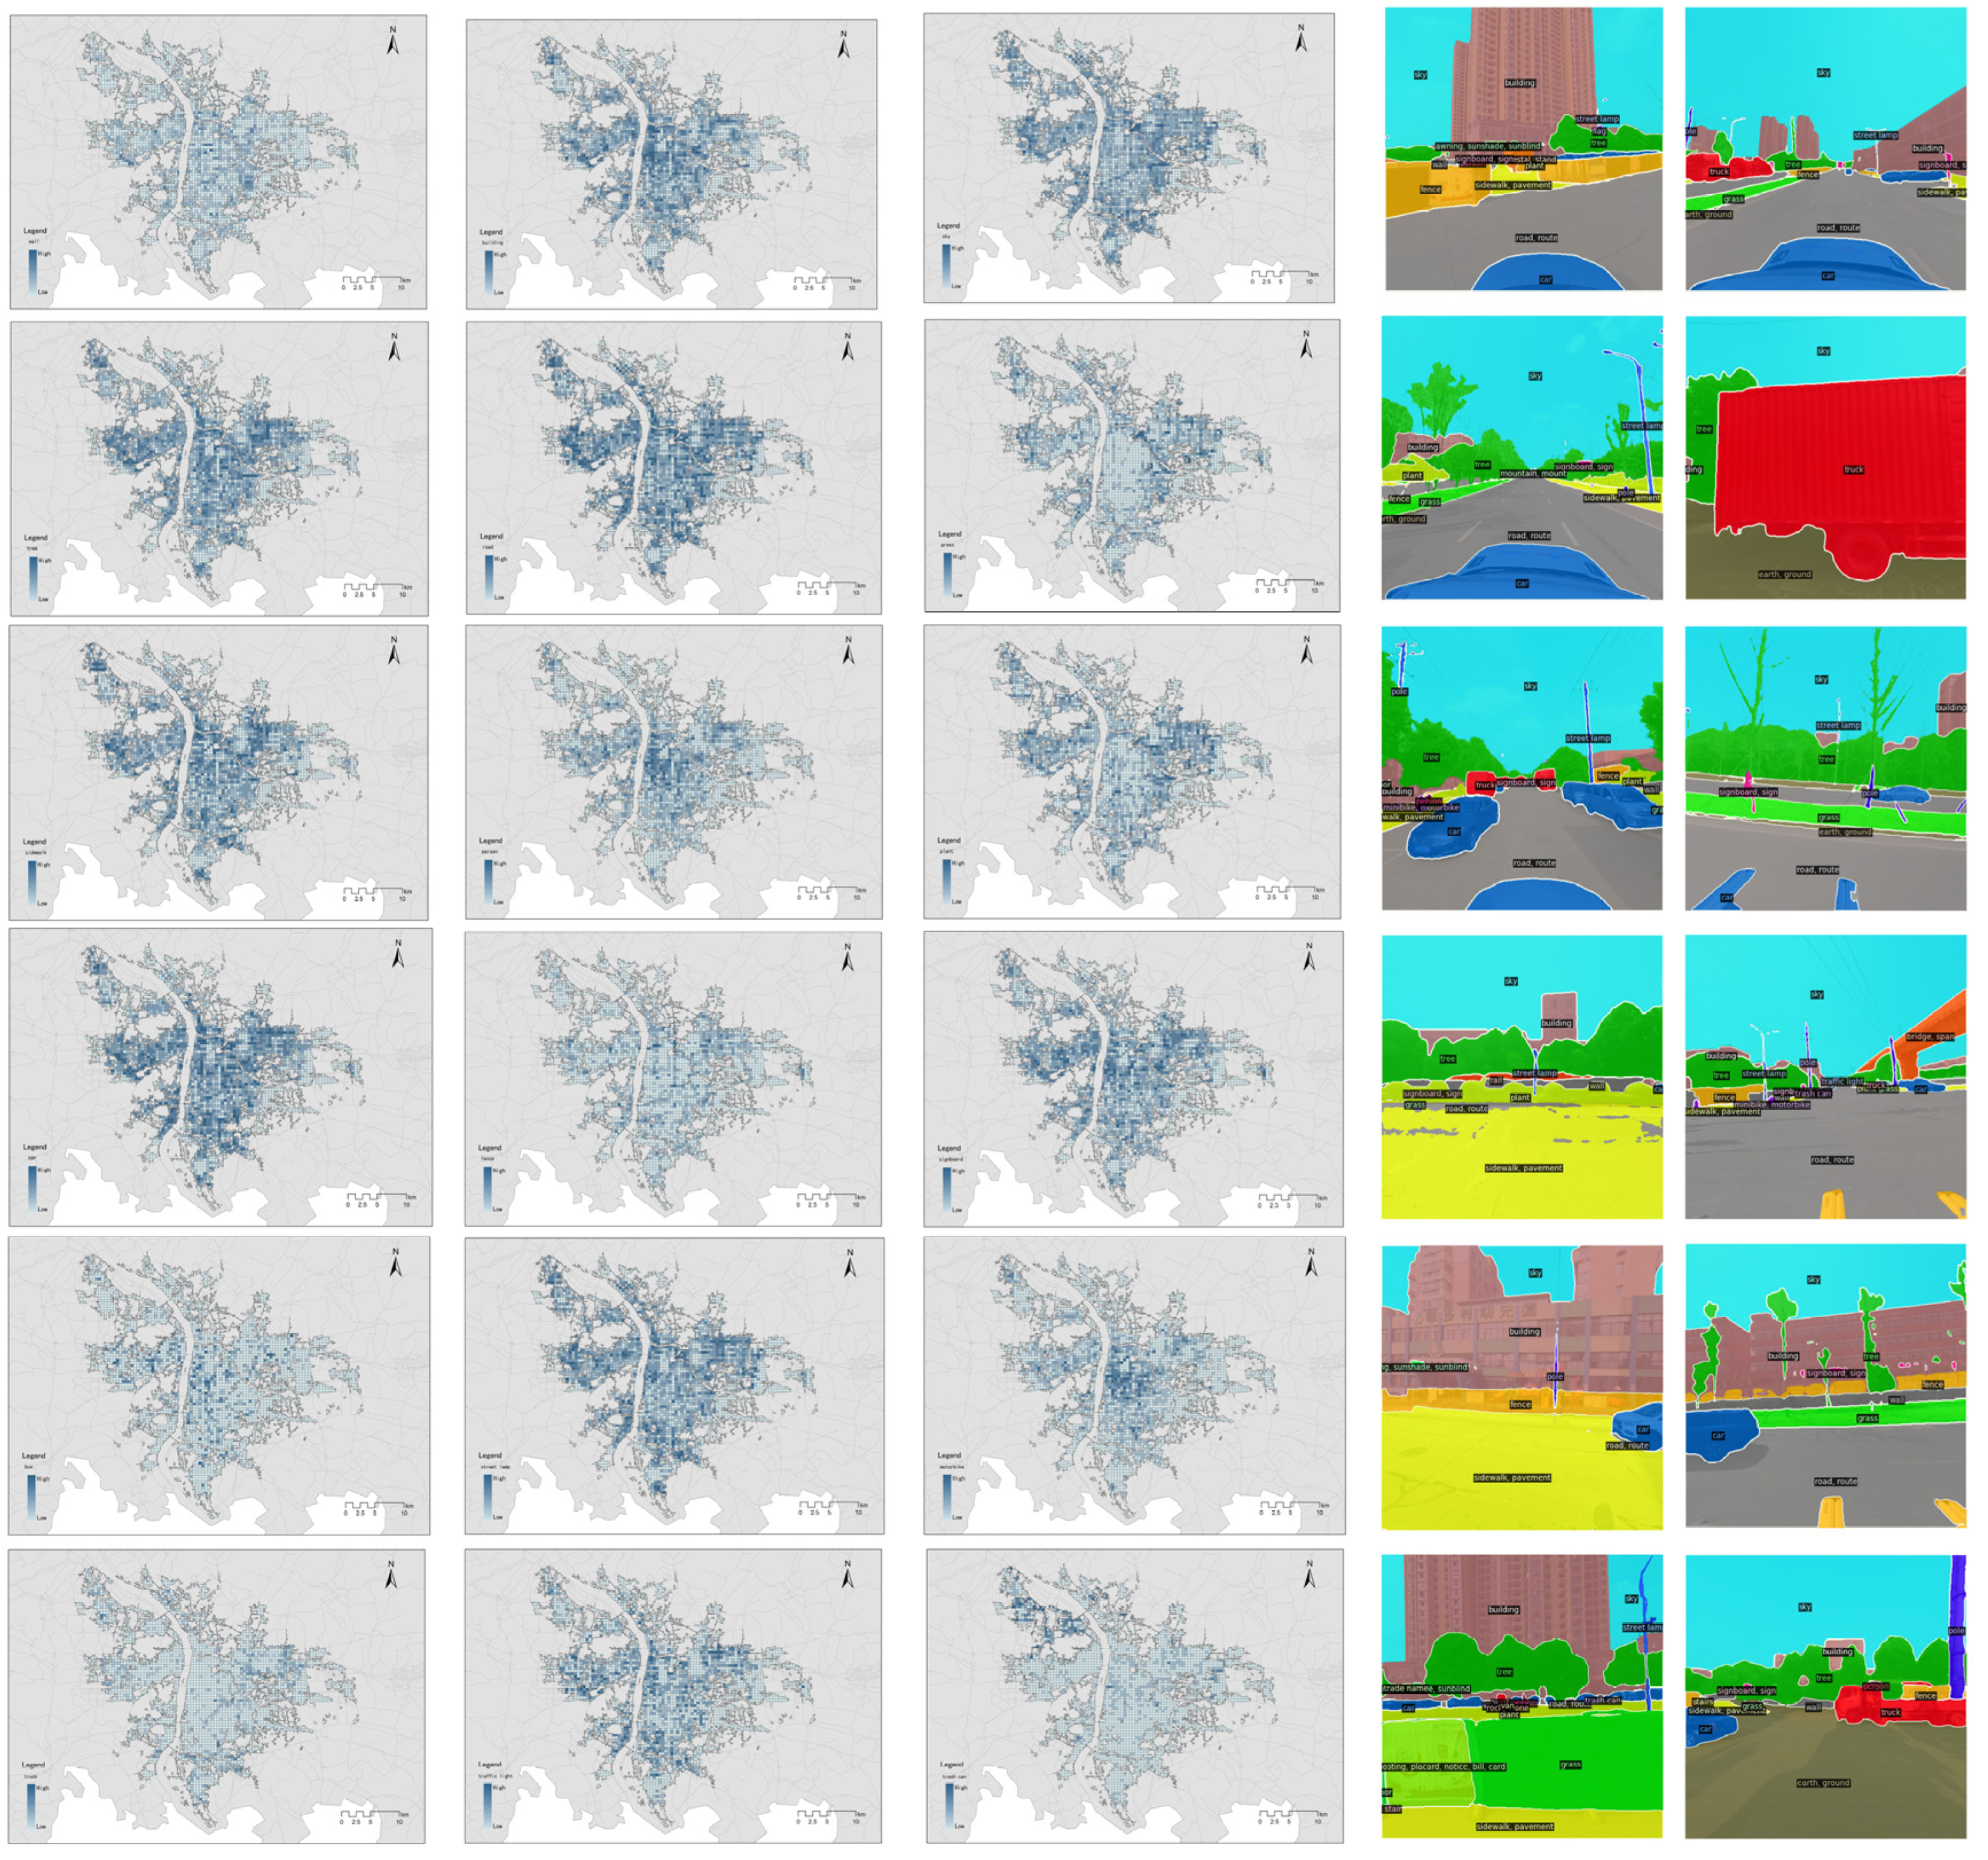
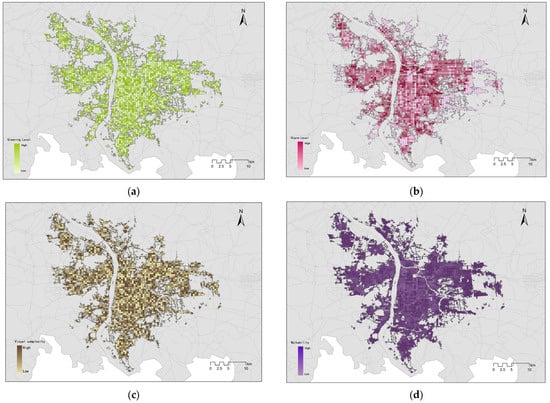
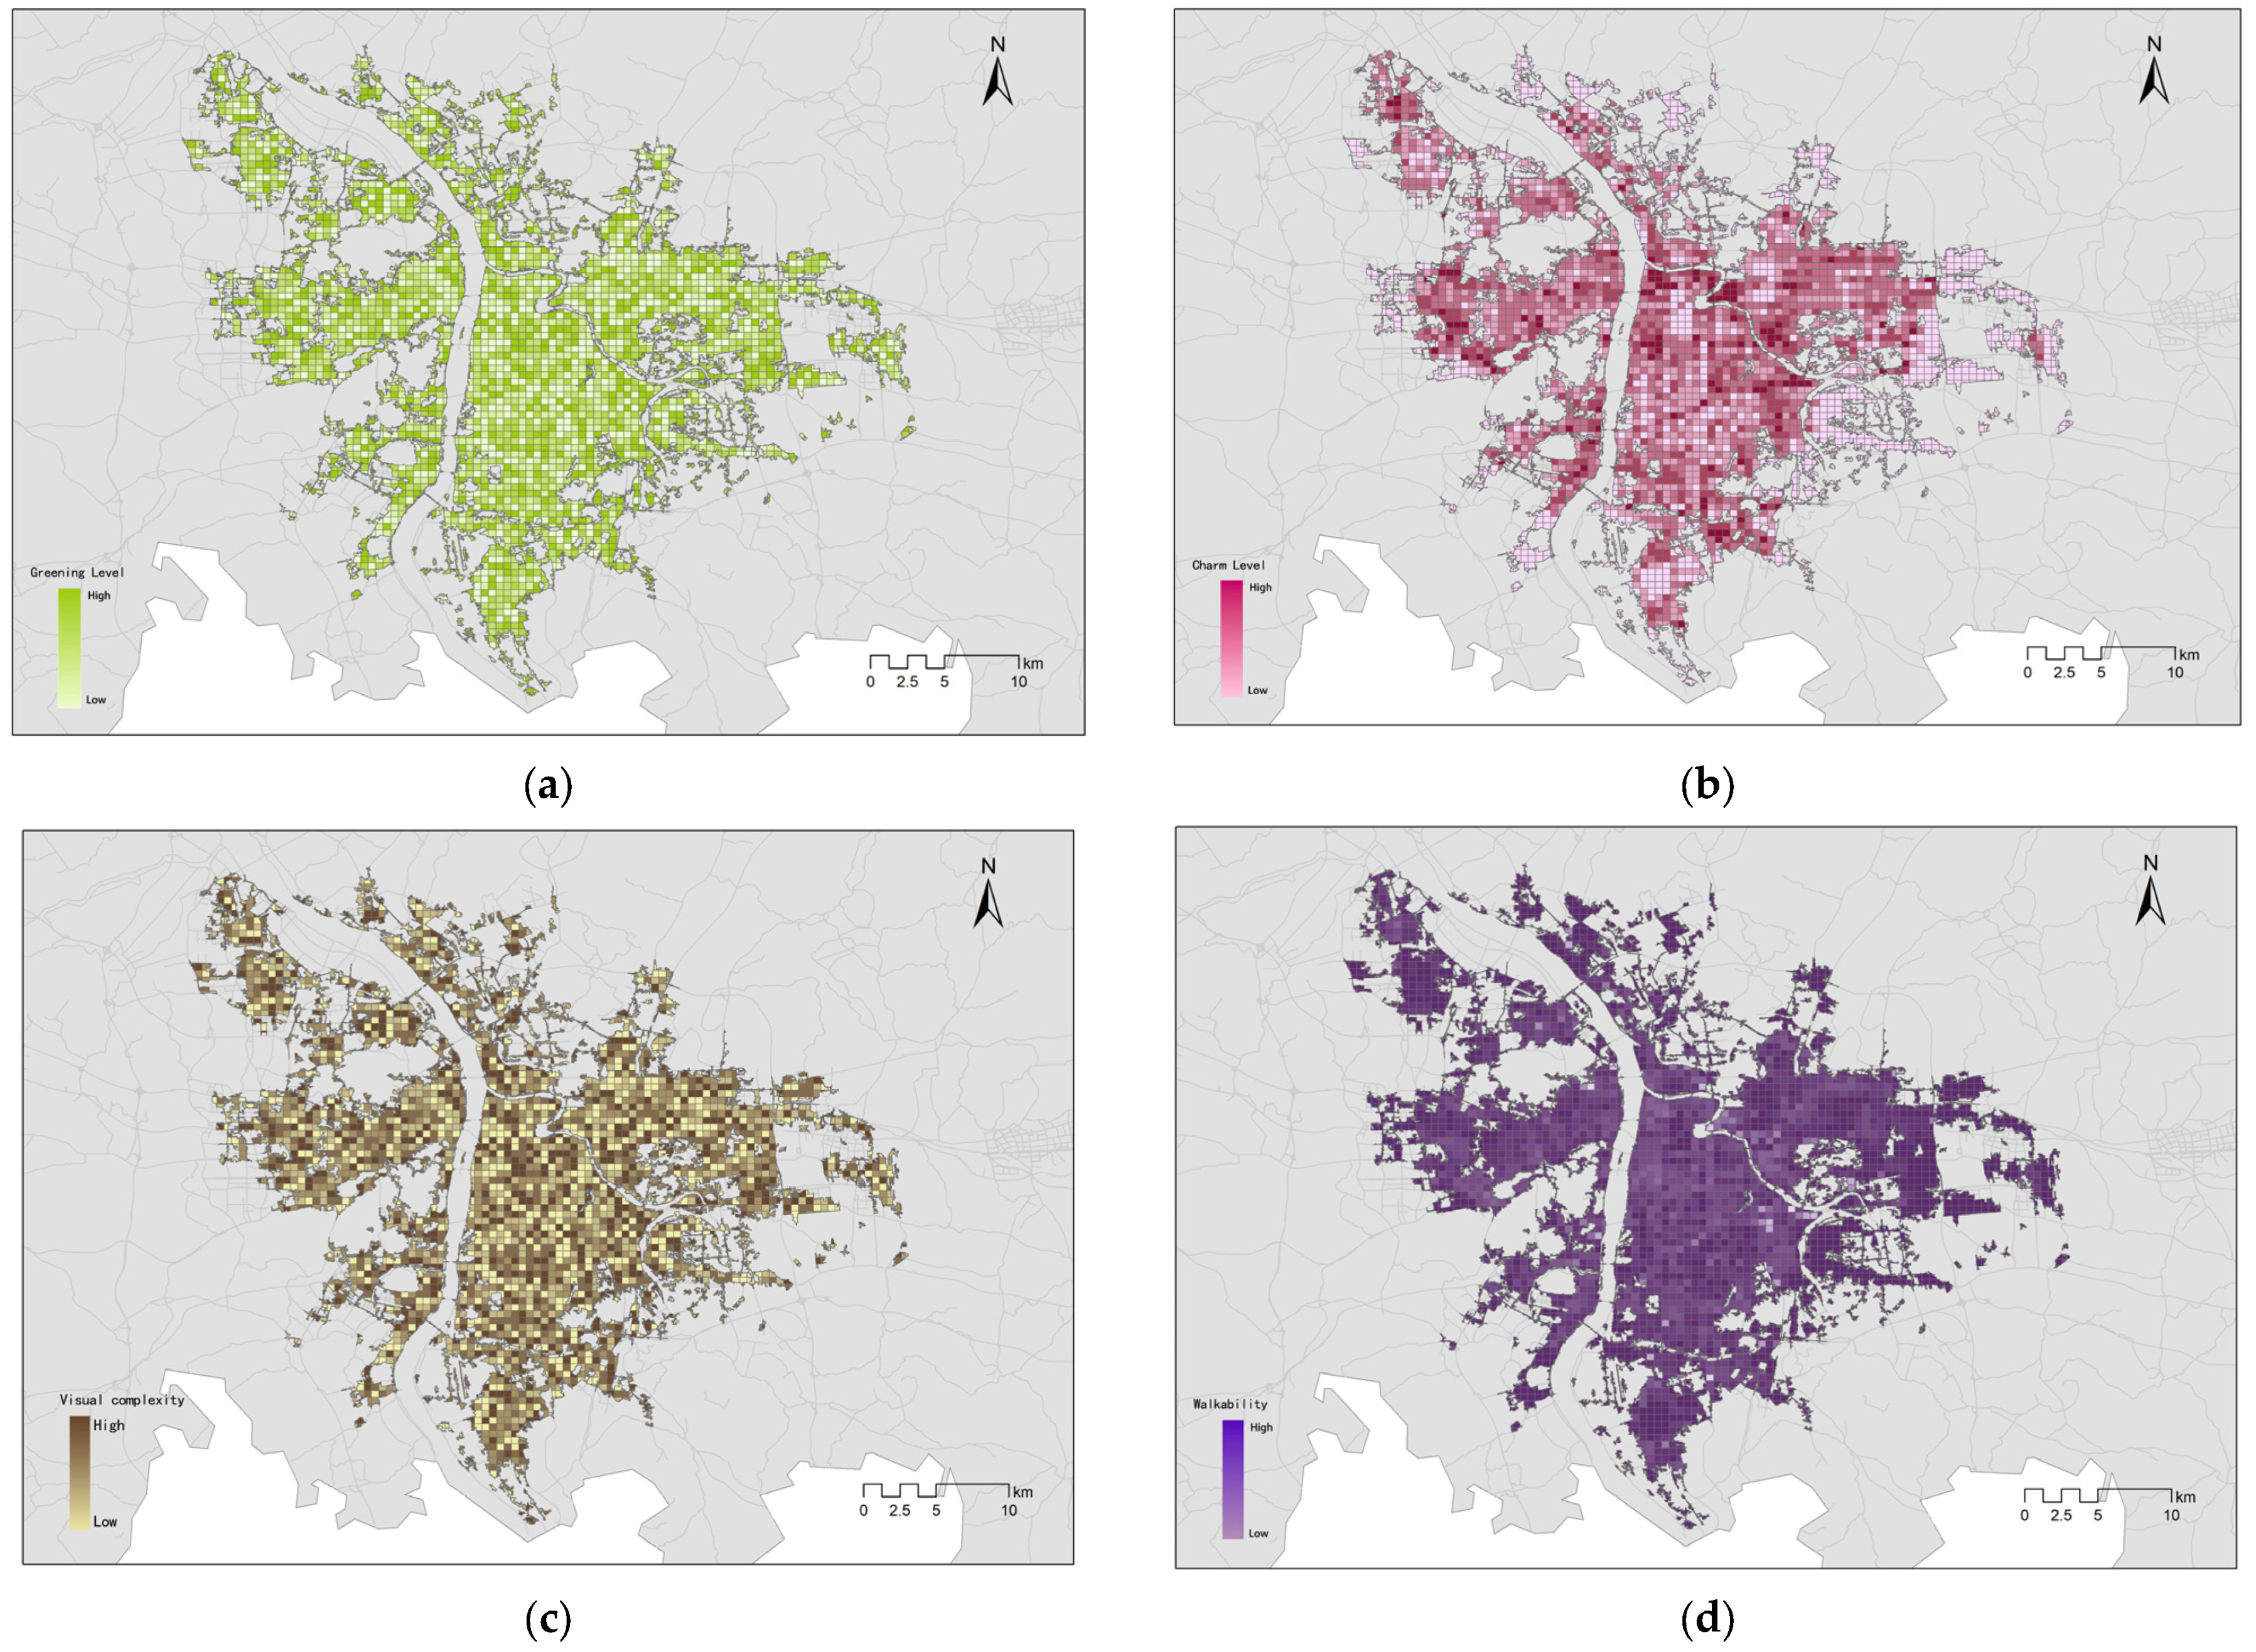
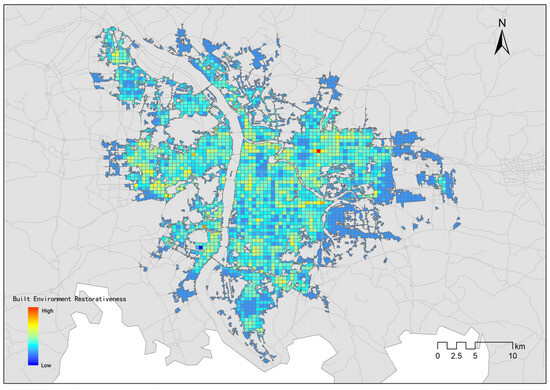
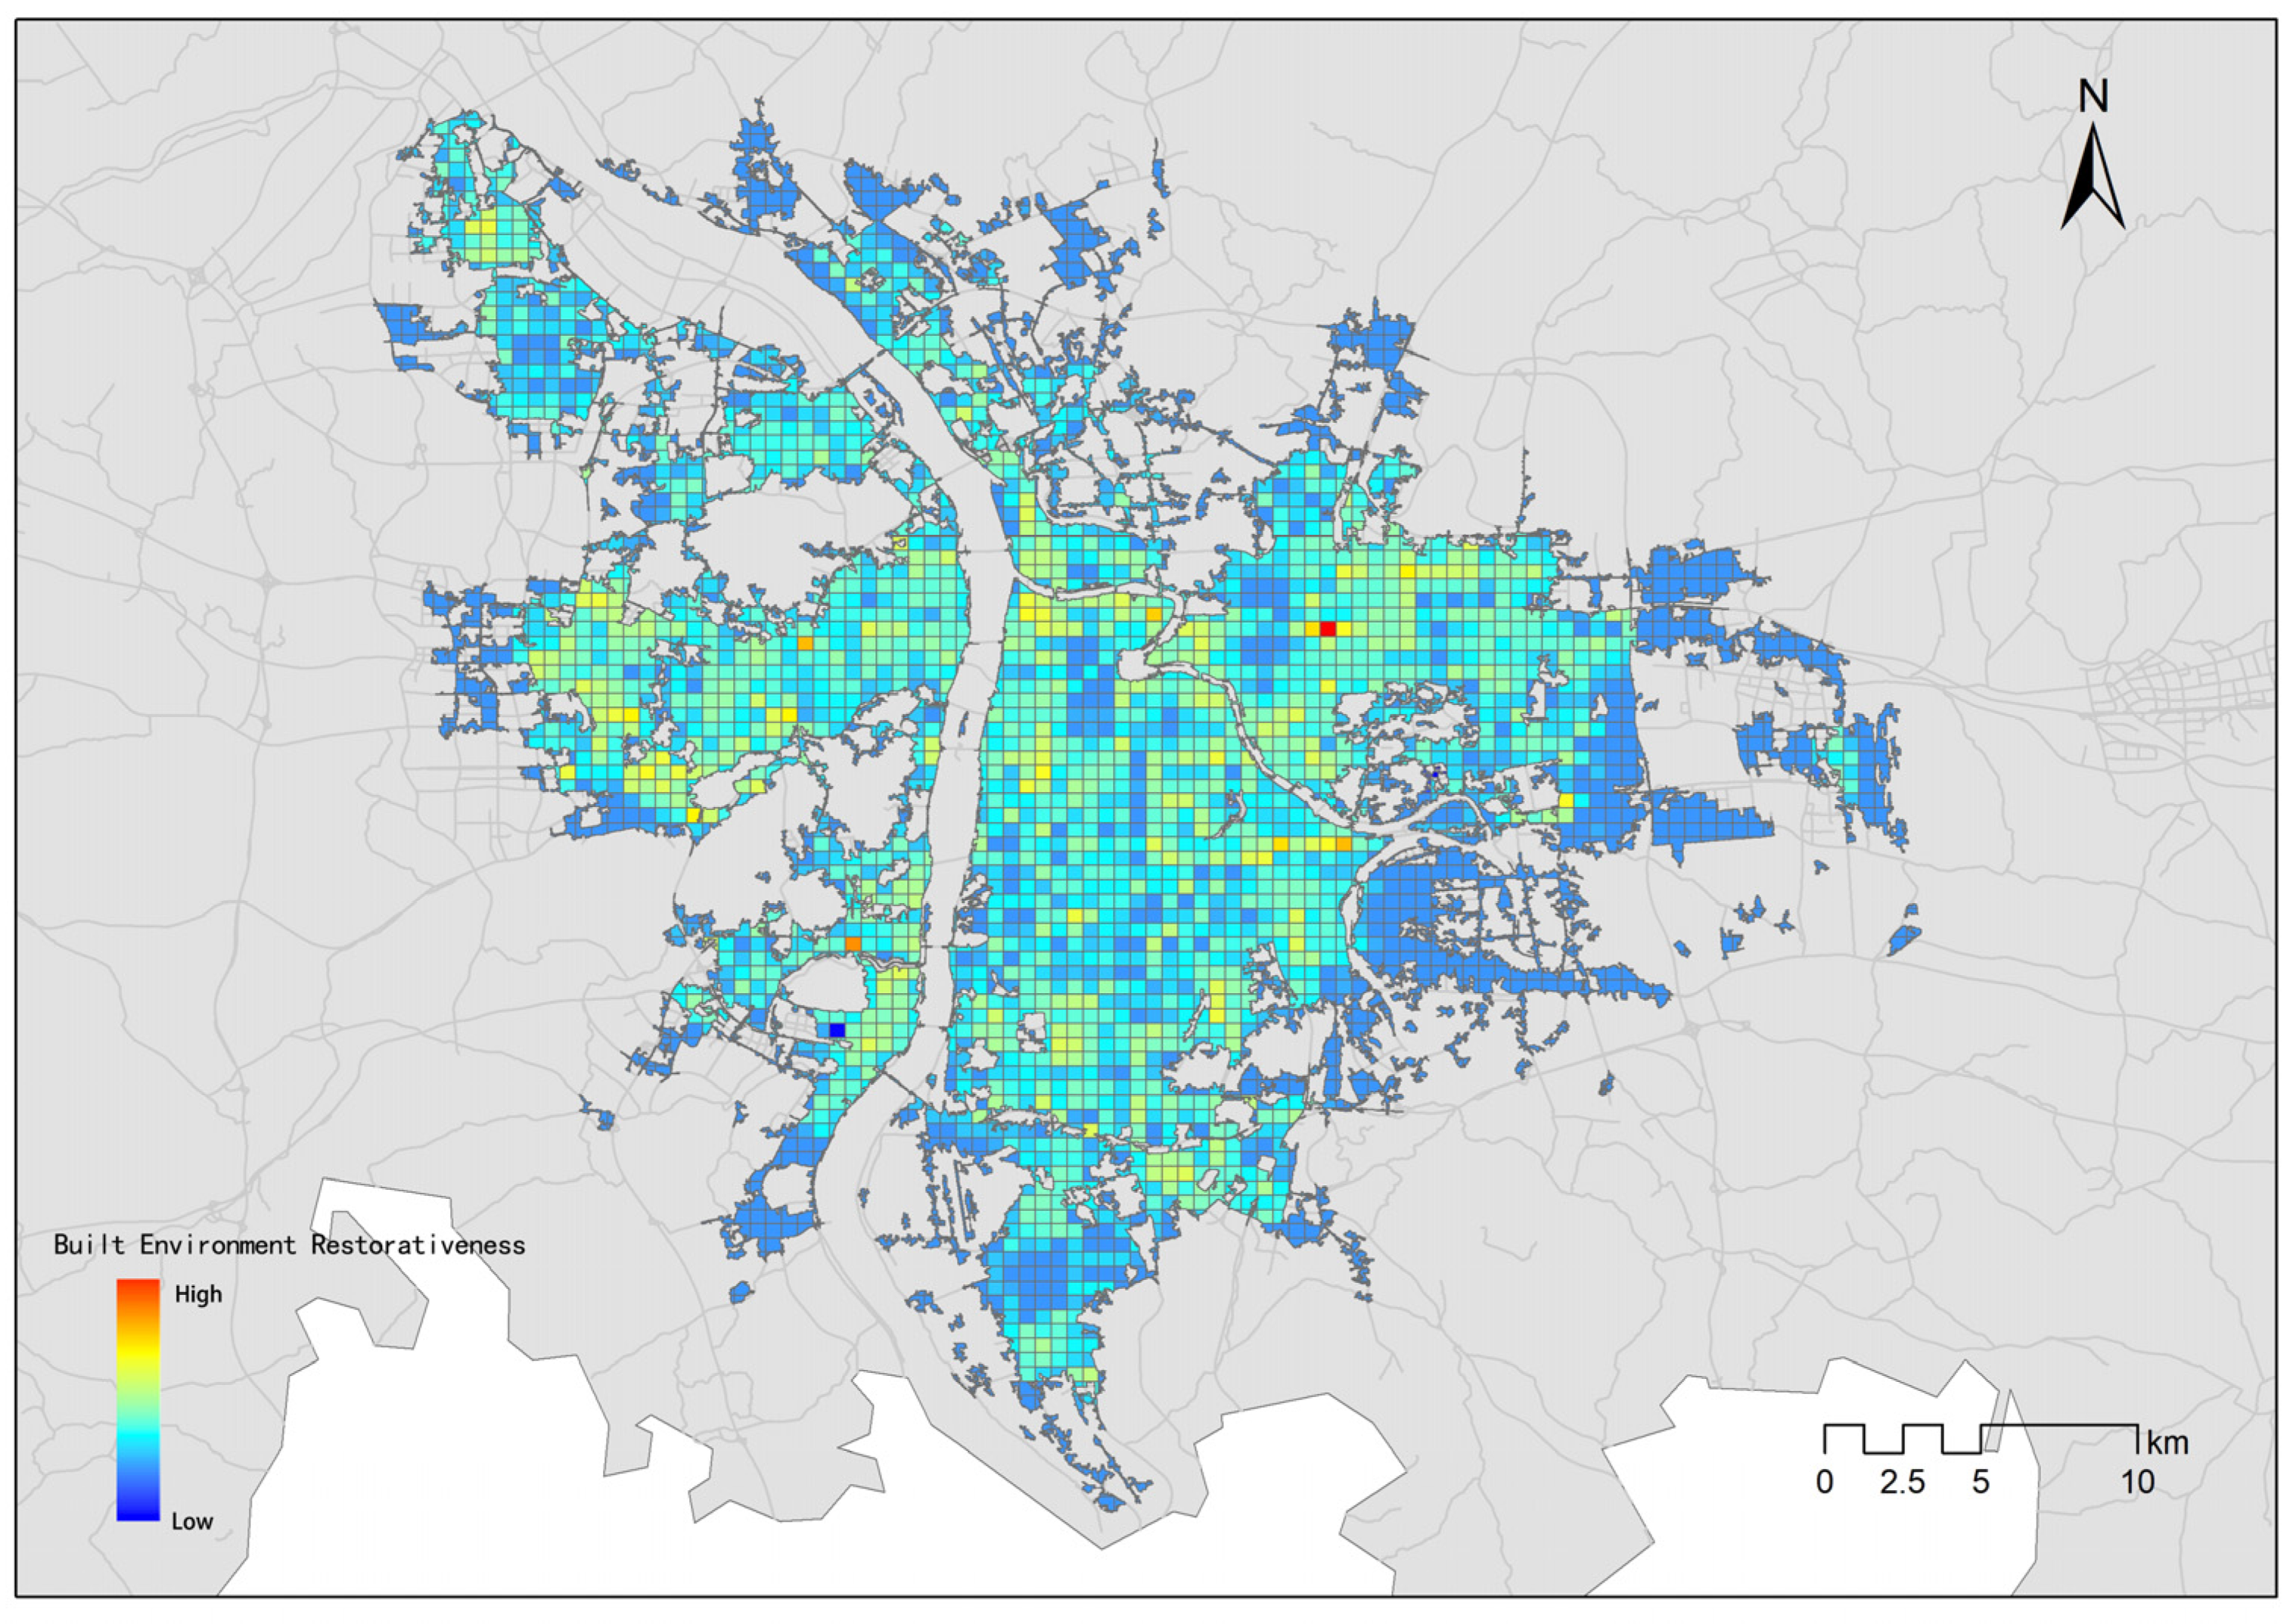
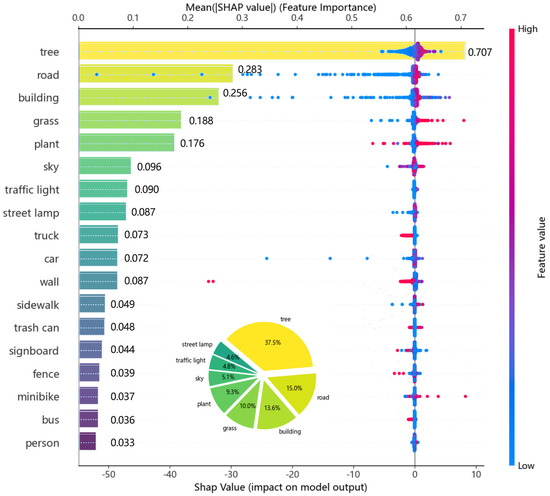
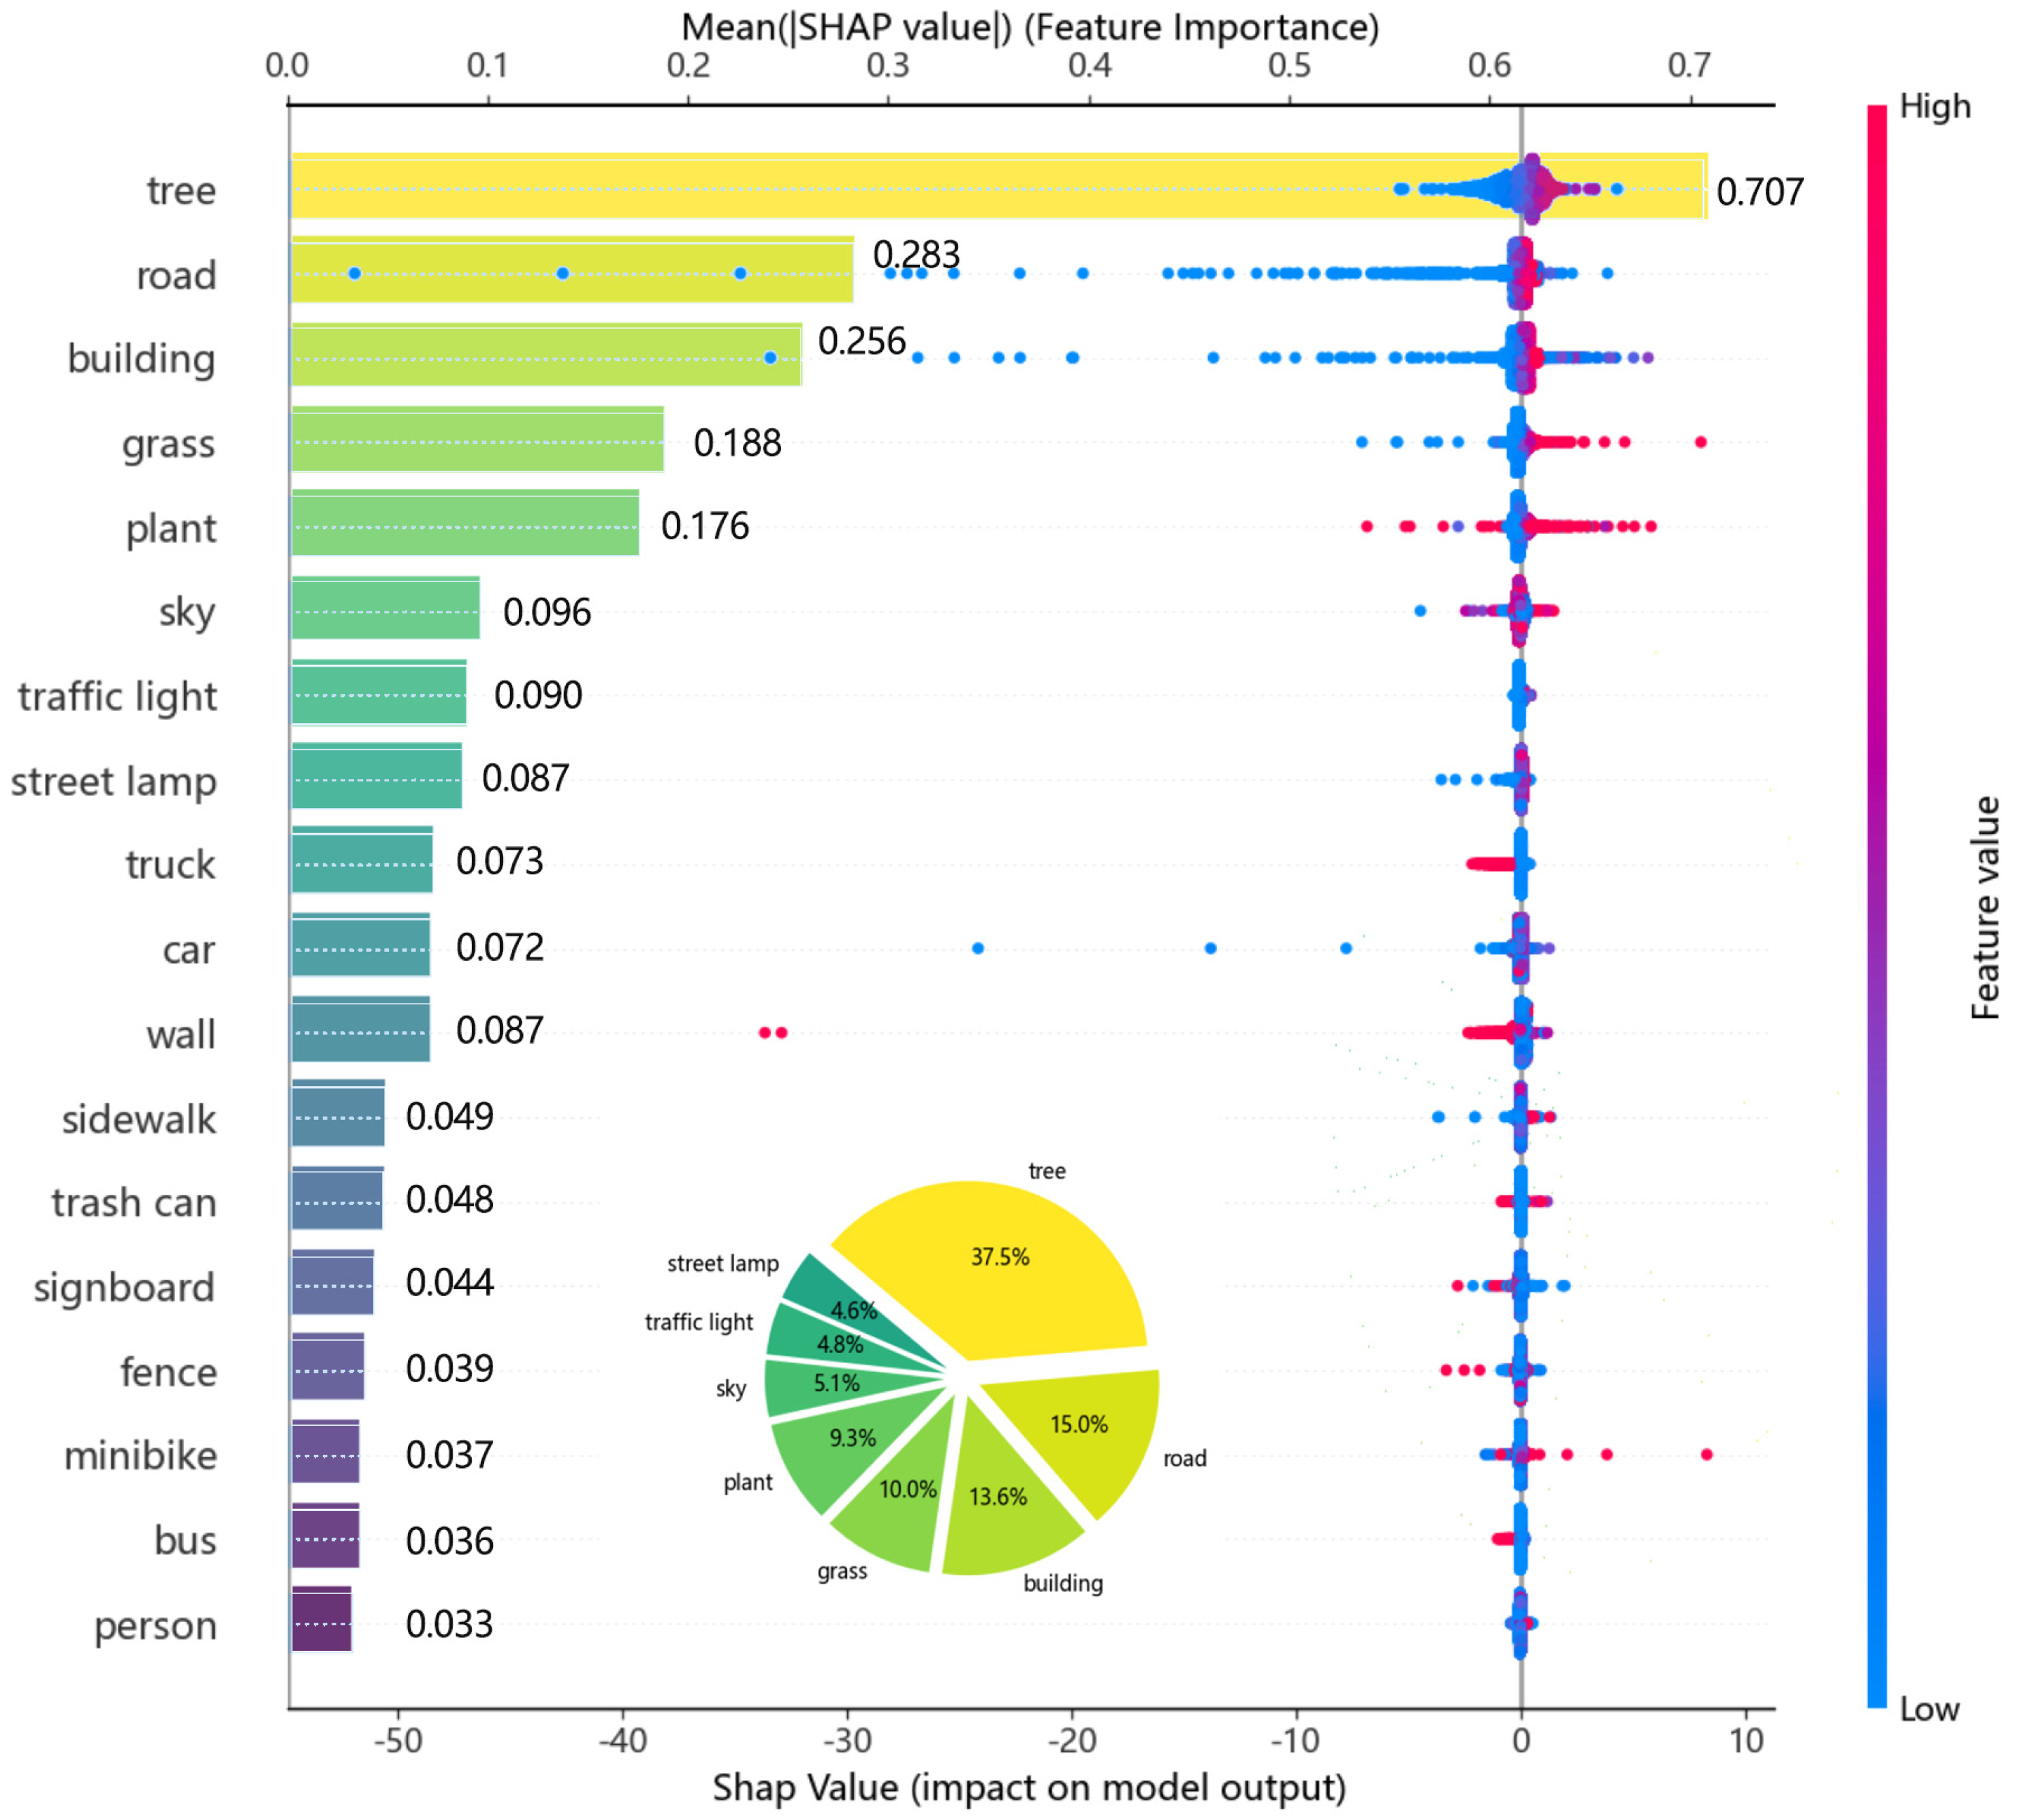

Disclaimer/Publisher’s Note: The statements, opinions and data contained in all publications are solely those of the individual author(s) and contributor(s) and not of MDPI and/or the editor(s). MDPI and/or the editor(s) disclaim responsibility for any injury to people or property resulting from any ideas, methods, instructions or products referred to in the content. |
© 2026 by the authors. Licensee MDPI, Basel, Switzerland. This article is an open access article distributed under the terms and conditions of the Creative Commons Attribution (CC BY) license.