


Abstract
Public concrete datasets often contain duplicate records, coupled variables, and cross-source distribution shifts, which may lead to overly optimistic model evaluation. Based on a deduplicated UCI high-performance concrete dataset (1005 samples), this study develops a leakage-controlled data-driven workflow with applicability-domain assessment. TabPFN, SHAP, and NSGA-II are used for compressive strength prediction, model-response attribution, and scenario-based candidate mix screening, respectively. Model evaluation follows a unified data split, inner training-set cross-validation, and an independent test-set protocol. In addition, 502 non-overlapping records from the Mendeley PCC dataset are used as an external benchmark to examine cross-source transferability and sensitivity to distribution shift. The results show that TabPFN achieves the highest R2 and the lowest RMSE, MAE, and MAPE on the internal UCI test set, with values of 0.953, 3.744 MPa, 2.265 MPa, and 7.580%, respectively; however, its advantage over strong baselines such as CatBoost is limited. On the external Mendeley PCC dataset, TabPFN remains competitive, with R2, RMSE, and MAE values of 0.490, 15.175 MPa, and 11.457 MPa, respectively, but its performance is close to that of random forest, XGBoost, and CatBoost. The 5NN applicability-domain stratification shows that external samples located within the 95% 5NN applicability domain achieve improved performance (R2 = 0.634 and RMSE = 12.367 MPa), suggesting that external prediction errors are associated with the distance from the source-domain distribution. SHAP results indicate that cement, ground granulated blast-furnace slag, curing age, and water are the main attribution variables in the model output; their response directions should be interpreted as statistical attributions rather than material causal mechanisms. The Pareto candidate mixes generated by NSGA-II satisfy basic engineering constraints. Nevertheless, because the external benchmark reveals sensitivity to cross-source distribution shift, the resulting mix proportions should be treated as pre-experimental screening candidates rather than engineering-validated low-GWP concrete mix proportions.
1. Introduction
Concrete is one of the most widely used engineering materials in civil infrastructure and the built environment, and its production and use are associated with substantial resource consumption and carbon-emission pressure [1,2,3]. In the context of low-carbon construction, reducing the environmental burden of concrete while maintaining adequate mechanical performance has become an important issue in mixture design [4]. Conventional concrete mix design generally relies on empirical equations, code-based constraints, and repeated trial batching [5]. When strength, cost, carbon emissions, and multi-component binder systems must be considered simultaneously, conventional approaches are often inefficient in exploring complex design spaces.
In recent years, machine learning methods have been widely used to predict concrete compressive strength, workability, durability, and related properties [6,7], and have also been applied to sustainable high-performance concretes and industrial-waste-based concretes [8]. Random forest, support vector regression, XGBoost, LightGBM, CatBoost, and artificial neural networks have shown strong nonlinear fitting capability on multiple concrete datasets. However, datasets for concrete materials often have limited sample sizes, strongly coupled variables, heterogeneous data sources, and inconsistent experimental conditions, which may weaken model generalizability under cross-source application [9]. For public datasets, insufficient treatment of duplicate samples, data partitioning, and preprocessing pipelines may also introduce data leakage and overestimate model generalizability [10]. Therefore, concrete machine learning studies should not only pursue prediction accuracy, but also address evaluation-protocol rigor, the boundary of model interpretation, and engineering applicability limitations.
TabPFN is a recently proposed pretrained foundation model for tabular data tasks [11]. Unlike conventional machine learning models, which require explicit iterative training and hyperparameter search on the target dataset, TabPFN uses priors acquired during pretraining to perform prediction directly at inference time. This property makes it practically convenient for small- to medium-sized tabular datasets. Recent work has also started to explore TabPFN for concrete-material property prediction [12]. Because concrete experiments are costly, variable interactions are complex, and available datasets are often limited, it is necessary to evaluate the applicability of TabPFN to concrete compressive strength prediction.
In addition to prediction accuracy, model interpretation is important in concrete machine learning research. SHAP, which is based on the Shapley-value concept, decomposes model outputs into marginal contributions of input features and helps identify the variables and response directions on which a model relies [13]. However, SHAP reflects statistical relationships learned by the model under the current data distribution rather than material causal mechanisms [14]. In concrete performance prediction, SHAP has been used to analyze feature attribution and improve the transparency of black-box models [15]. For concrete, which is a strongly coupled material system, directly interpreting SHAP trends as hydration mechanisms, pore-structure evolution, or material thresholds can lead to overinterpretation. Accordingly, this study positions SHAP as a model-response consistency check for assessing whether attribution directions are broadly consistent with established empirical knowledge of concrete materials, rather than as a tool for discovering new material mechanisms.
On the basis of strength prediction, candidate mix search is an important direction in data-driven concrete design. NSGA-II is a classical multiobjective evolutionary algorithm that uses non-dominated sorting and crowding distance to search for Pareto solutions among conflicting objectives [16]. Previous studies have coupled machine learning prediction models with multiobjective optimization algorithms for concrete mix design and have generated candidate solutions considering strength, cost, and environmental burden [17,18]. However, when a machine learning model is used as the fitness function of an optimizer, a genetic algorithm may actively search sparse or extrapolative regions of the training distribution, producing predictions with insufficient reliability or mixtures that are not practically feasible.
The methodological contribution of this study is not the mere serial use of TabPFN, SHAP, and NSGA-II. Rather, it lies in placing pretrained tabular-model evaluation, leakage control, external benchmarking, applicability-domain auditing, and scenario-based candidate mix screening within a single reproducible workflow [19]. This workflow is used to evaluate the predictive performance of TabPFN on public concrete data, examine its cross-source generalization boundary, and identify applicability-domain risks when the model is used as a fitness function for optimization. Accordingly, the resulting mix proportions are positioned as pre-experimental candidates for screening, rather than as engineering-validated final low-GWP concrete mix designs.
Specifically, the contributions of this study are as follows: (1) duplicate records are removed from the UCI high-performance concrete dataset before train–test splitting and inner training-set cross-validation, reducing evaluation bias caused by sample overlap; (2) TabPFN is compared with SVR, random forest, XGBoost, LightGBM, and CatBoost under a unified evaluation protocol, while the comparison boundary between pretrained tabular models and locally trained models is explicitly stated; (3) non-overlapping records from the Mendeley PCC dataset are introduced as an external benchmark to assess cross-source transferability and domain-shift sensitivity of the UCI source-domain models; (4) SHAP is used as a model-response consistency check rather than a material-mechanism discovery tool; and (5) NSGA-II candidate mix search is performed within basic engineering constraints and observed variable ranges, and 5NN distance is used to flag applicability-domain risks for both external samples and optimization candidates.
2. Materials and Methods
2.1. Data Source, Deduplication, and Data Split
This study uses the publicly available Concrete Compressive Strength dataset from the University of California, Irvine (UCI) Machine Learning Repository [20,21]. The dataset contains 1030 samples. The input variables are cement, ground granulated blast-furnace slag, fly ash, water, superplasticizer, coarse aggregate, fine aggregate (kg/m3), and curing age (d), and the output variable is concrete compressive strength (MPa). This dataset has been widely used for benchmark comparisons of concrete strength prediction models and is suitable for evaluating the fitting capability of different machine learning models on tabular concrete data. It should be noted that the dataset was not developed for low-GWP mix screening or life-cycle assessment; therefore, the subsequent carbon-emission and cost calculations in this study are used only as scenario-based inputs for candidate screening.
Public datasets may contain duplicate records. If these are not handled before data partitioning, sample overlap between training and test sets may overestimate model generalization performance [10]. Therefore, hash-based deduplication was performed before splitting the dataset [22]. A total of 25 duplicate records were removed, and 1005 samples were retained for subsequent analysis.
Table 1 shows that the input variables have markedly different distribution ranges. For example, the mean coarse aggregate content is approximately 974 kg/m3, whereas the mean superplasticizer dosage is approximately 6 kg/m3. Distance-based algorithms such as SVR are sensitive to scale differences; therefore, Z-score standardization was applied to the input variables [23]. Although tree-based models and TabPFN are less dependent on standardization, the same preprocessing pipeline was used for all models to maintain evaluation consistency.
Table 1.
Descriptive statistics of the deduplicated dataset.
The dataset was randomly divided into training and test sets at an 8:2 ratio, with the random seed fixed at 42. Z-score standardization was applied to the input features as follows:
The feature mean (μ) and standard deviation (σ) in the equation were estimated strictly from the training set. The same training-set parameters were then used to transform the test set, thereby avoiding information leakage during preprocessing.
No additional fixed validation set was created. Instead, 10-fold cross-validation within the training set was used for hyperparameter search and model selection for the conventional benchmark models. The test set was kept independent throughout model tuning and was used only once for the final internal UCI source-domain evaluation. This setting reduces the sample loss and randomness associated with a fixed validation split, but it cannot replace cross-source validation. Therefore, the non-overlapping PCC subset derived from the Mendeley Data repository [24] was further introduced as an external benchmark to examine cross-source transferability and distribution-shift sensitivity under a non-training data source.
2.2. External Benchmark Dataset and Leakage-Controlled Preprocessing
To further evaluate transferability under cross-source conditions, this study used the pcc_data worksheet from the Mendeley Data dataset entitled “Data for Life cycle assessment and production cost of geopolymer concrete: A meta-analysis” as an external benchmark. This worksheet contains fields for cement, ground granulated blast-furnace slag (GGBFS), fly ash (FA), water, superplasticizer (SP), coarse aggregate, fine aggregate, curing age, and compressive strength (fc), which can be mapped to the eight input variables and one output variable of the UCI concrete strength dataset.
To ensure consistency between the external data and the input space of the source-domain model, the fields in pcc_data were first mapped to Cement, Slag, Fly_Ash, Water, Superplasticizer, Coarse_Aggregate, Fine_Aggregate, Age, and Strength_MPa. Because the UCI source-domain model does not include additional supplementary cementitious material variables such as metakaolin (MK) and rice husk ash (RHA), records with nonzero MK or RHA were excluded to avoid external samples containing critical components that cannot be represented by the source model. The external data were then numerically processed, records with missing values were removed, and internal duplicates were eliminated. To further reduce potential external-data leakage caused by cross-indexing of public datasets, records that fully or approximately overlapped with the deduplicated UCI dataset were removed. Finally, 502 non-overlapping external PCC samples were retained for benchmark testing.
The external benchmark data were not used for model training, hyperparameter optimization, standardization-parameter fitting, model selection, SHAP attribution analysis, or NSGA-II optimization. All feature-standardization parameters were estimated only from the UCI training set and were subsequently used to transform both the internal UCI test set and the Mendeley PCC external samples. External validation used R2, RMSE, MAE, MAPE, bias, median absolute error (MedianAE), and maximum absolute error (MaxAE). To analyze cross-source distribution shift, univariate range-overlap checks and 5-nearest-neighbor (5NN) distance analysis in the standardized feature space were performed. For the 5NN applicability-domain analysis, the 95th percentile of the leave-one-out mean 5NN distance distribution of the UCI training set was used as an empirical threshold, and external samples were classified as either inside or outside the 5NN applicability domain.
2.3. Exploratory Analysis of the Feature Space
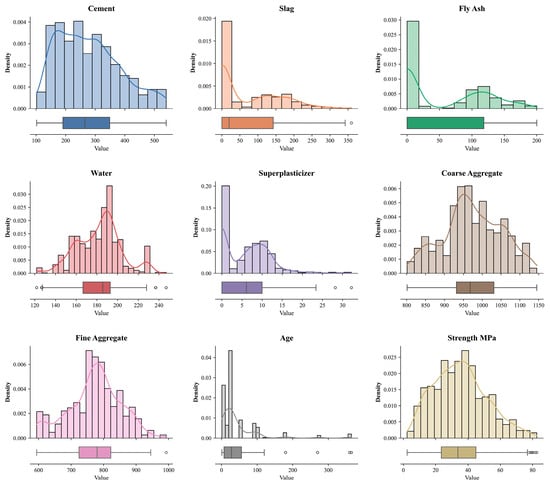
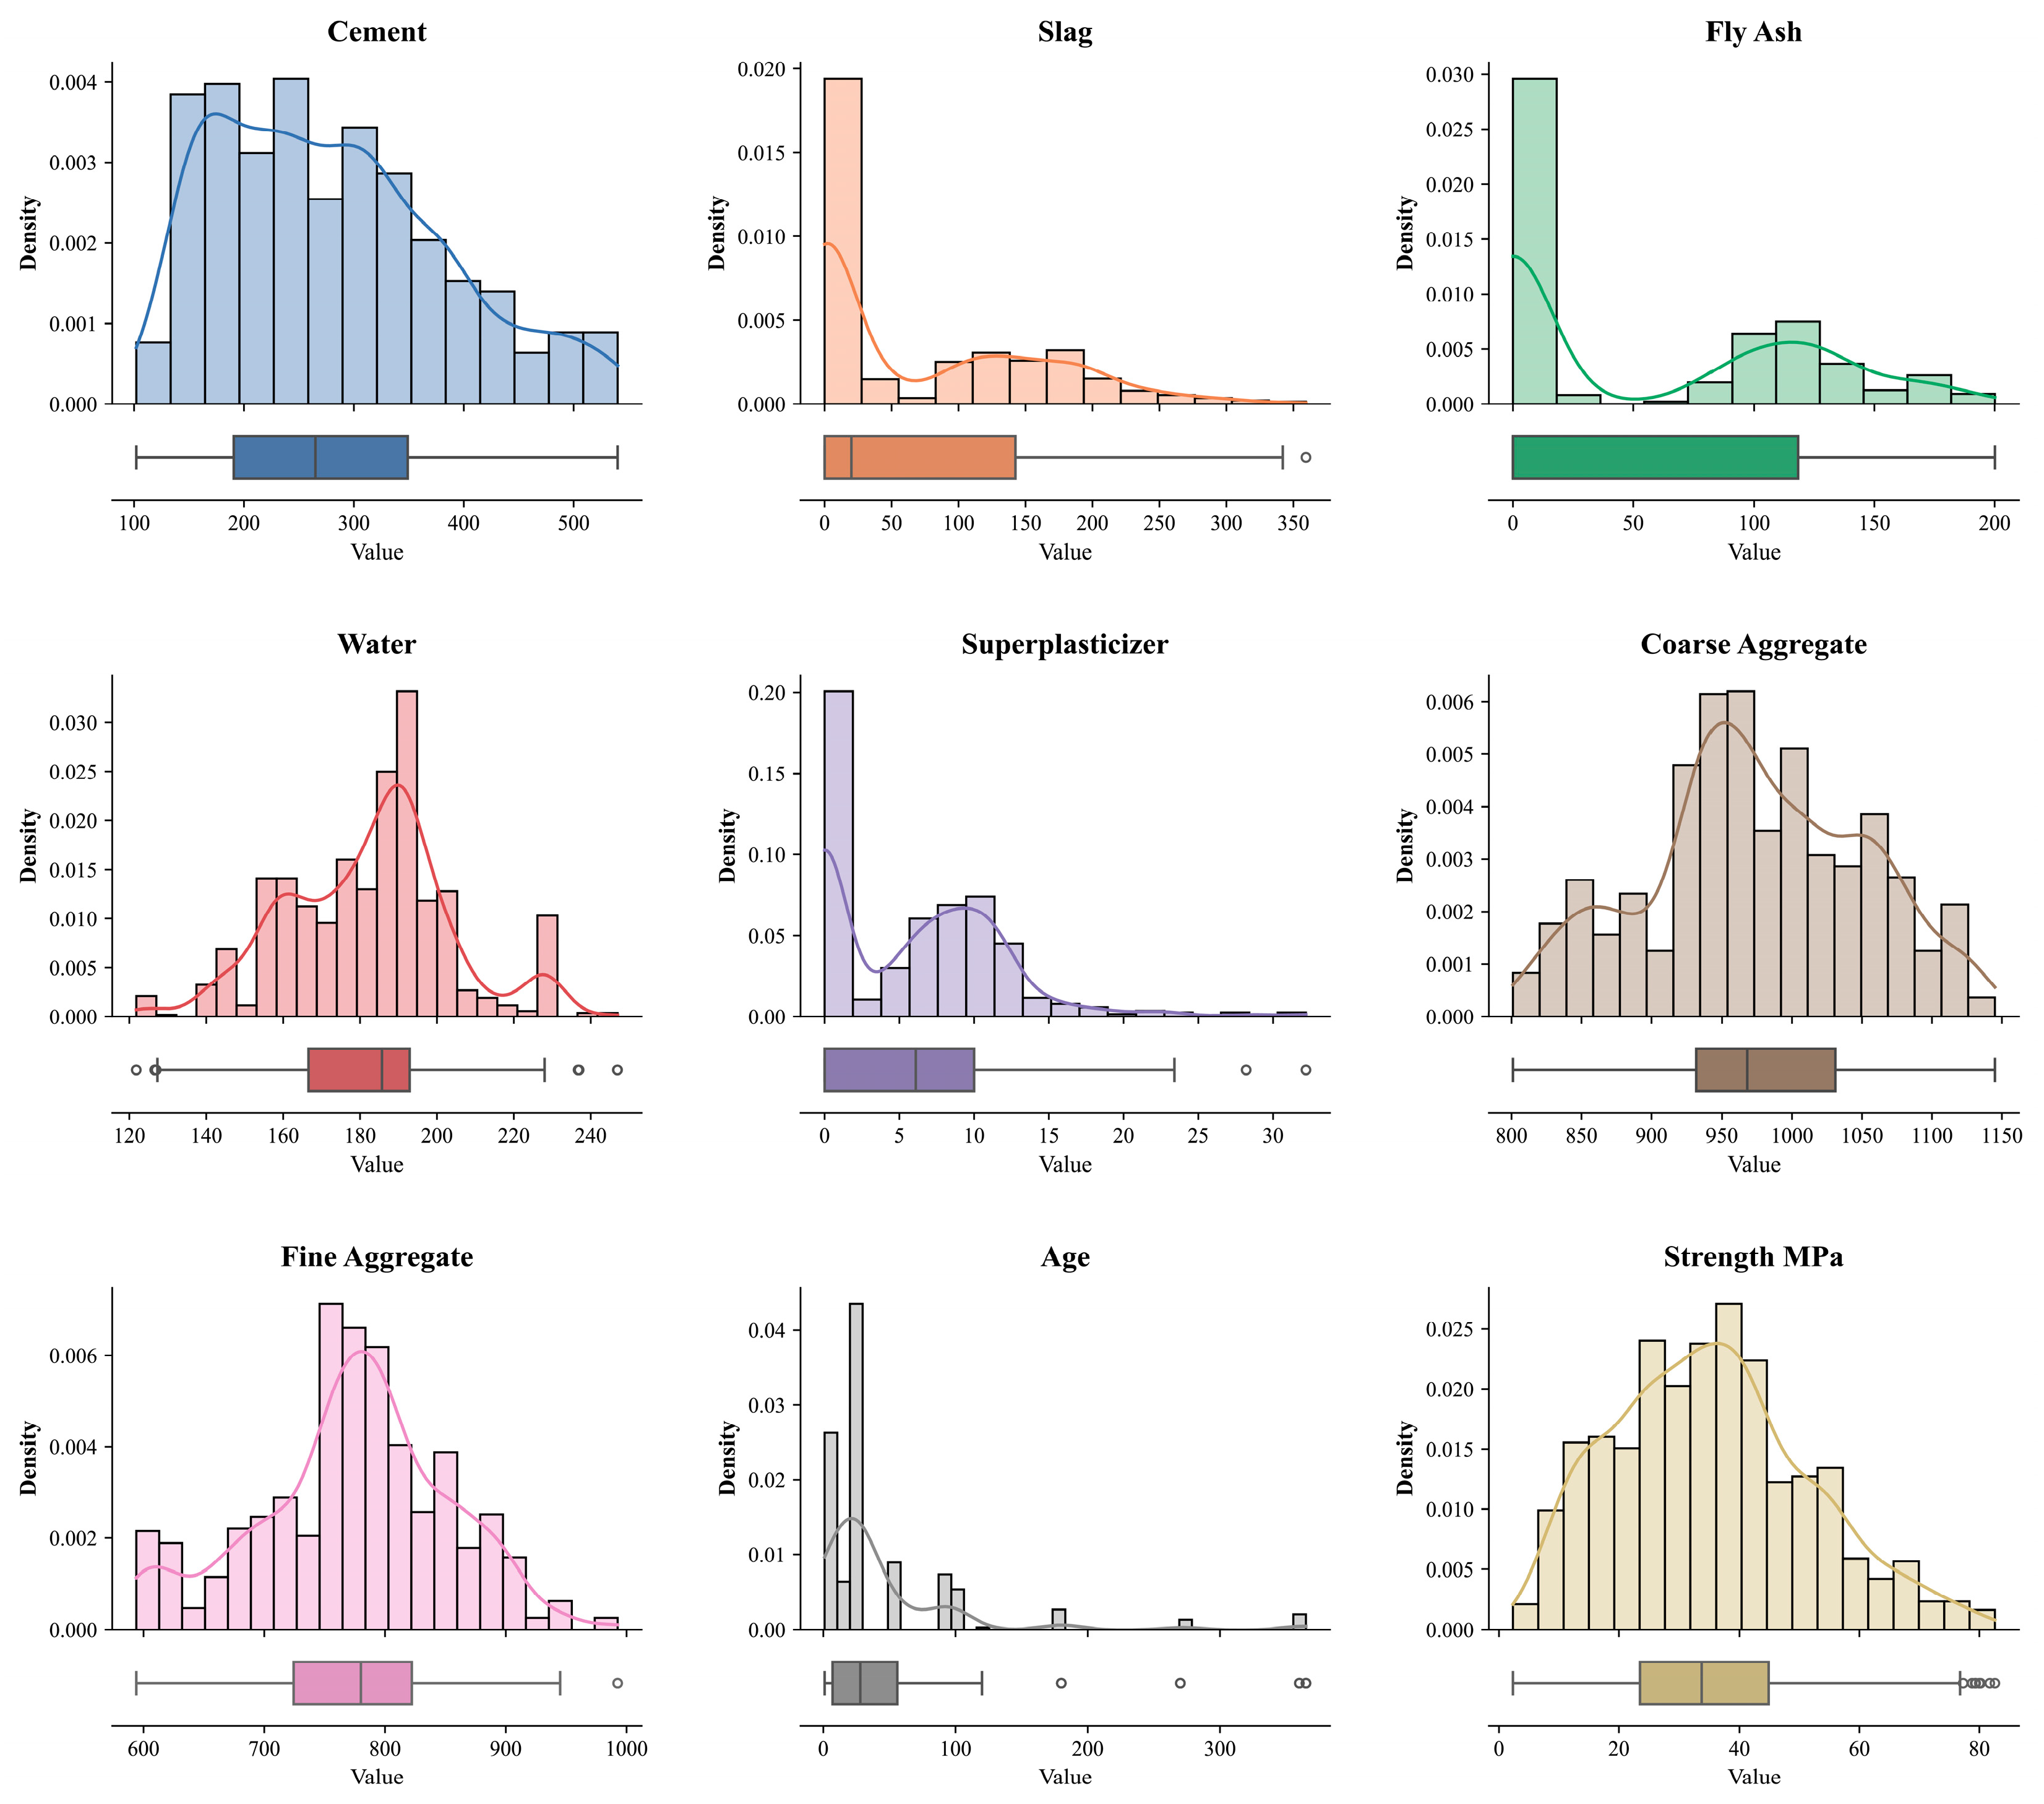
Feature-distribution patterns provide an important basis for algorithm selection. Kernel density estimation (KDE) was used to describe the distribution of each component [25]. Figure 1 shows that water and aggregate contents are relatively concentrated, whereas slag, fly ash, and superplasticizer exhibit pronounced right-skewed distributions. This indicates that samples are denser in low-dosage ranges and sparser in high-dosage ranges. The observation suggests that the prediction model should be able to handle nonlinear relationships and imbalanced distributions, but it does not by itself prove the existence of deterministic material thresholds or phase-transition mechanisms.
Figure 1.
Kernel density estimation (KDE) distributions of the input features.
To quantify linear associations among features, the Pearson correlation coefficient matrix was calculated [26]. This analysis was used mainly to describe the data distribution and was not intended to establish causal relationships. The Pearson coefficient is defined as follows:
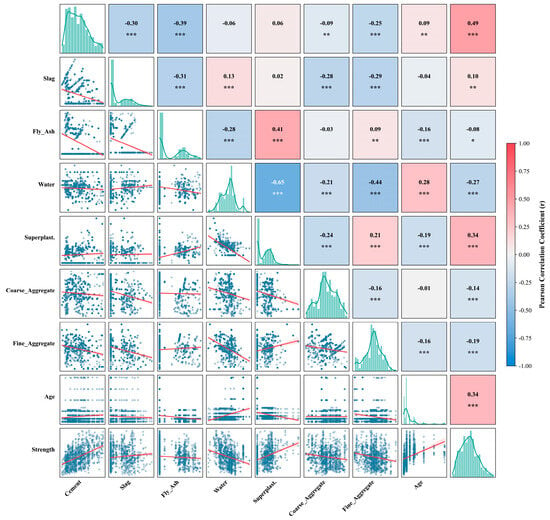
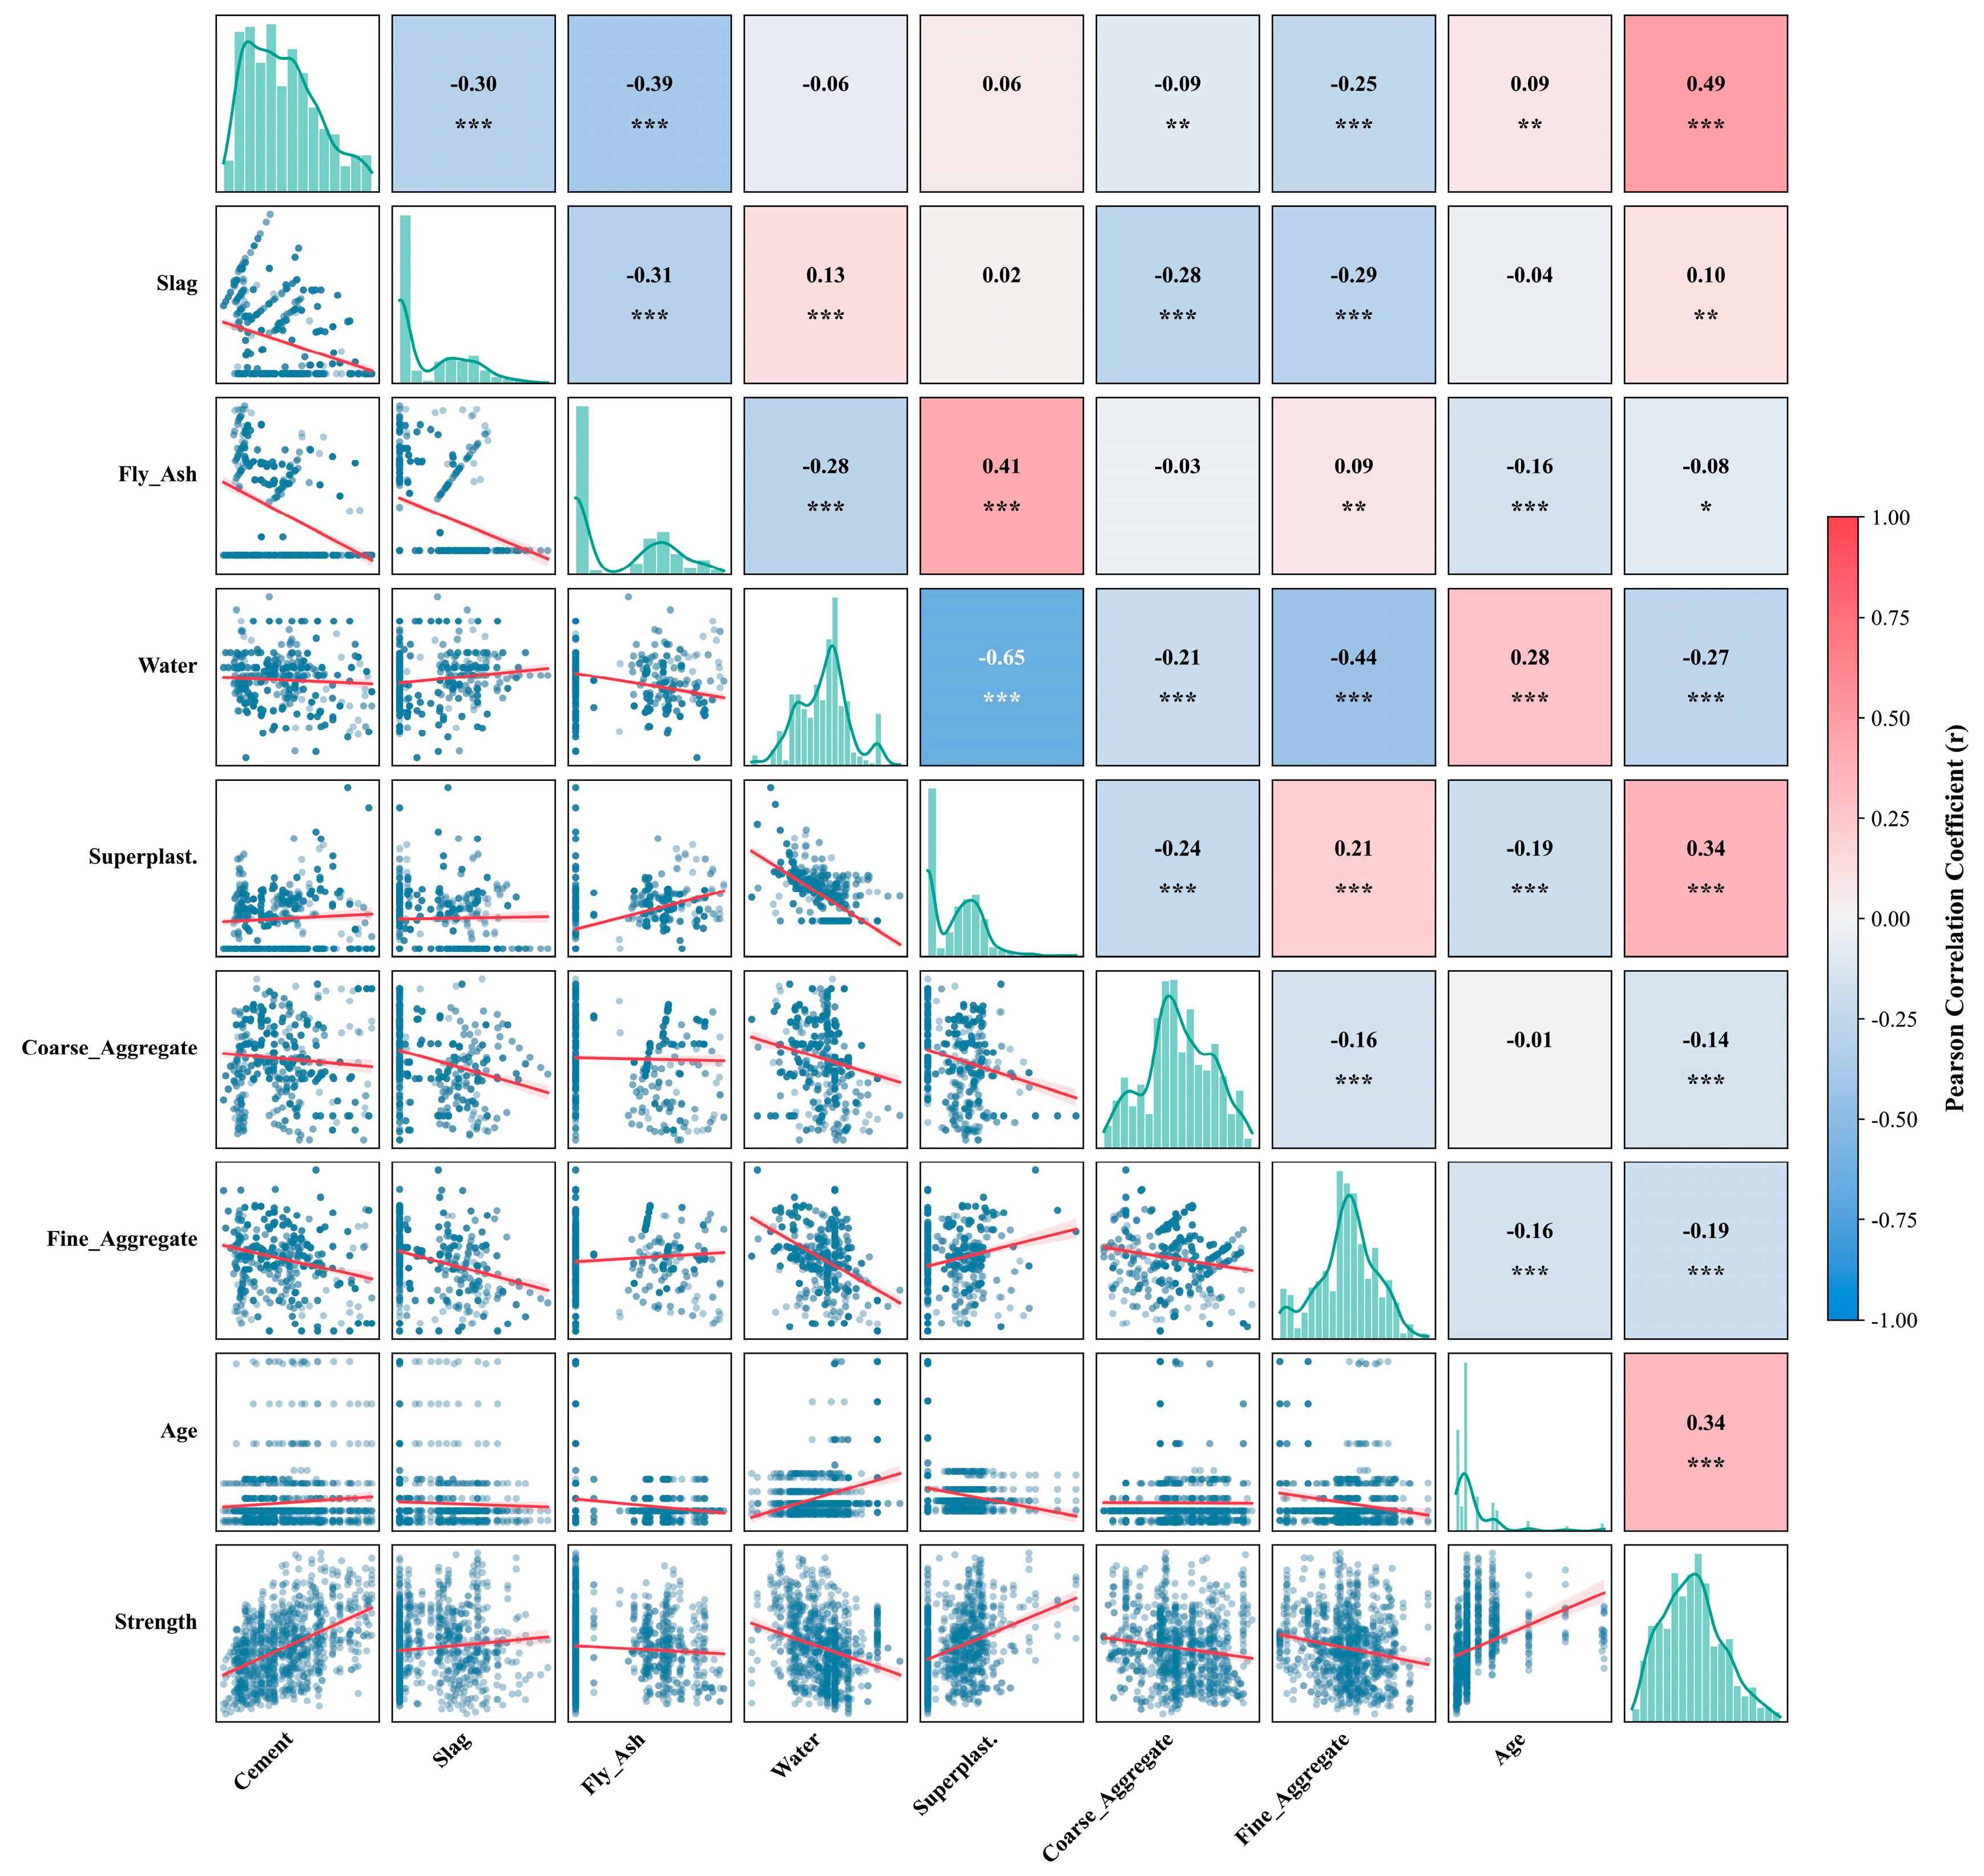
Figure 2 presents the Pearson correlation heat map between the input features and the target variable. Cement content shows a moderate positive correlation with compressive strength, whereas water content shows a negative correlation. These trends are generally consistent with common empirical knowledge in concrete technology.
Figure 2.
Pearson correlation heat map of the input features and target variable. *, **, and *** denote statistical significance at p < 0.05, p < 0.01, and p < 0.001, respectively.
In addition, water and superplasticizer exhibit a strong negative correlation (r = −0.65), indicating clear coupling between the two variables in this public dataset. This also suggests that subsequent prediction models should be able to handle interdependent variables rather than relying only on single linear relationships. From an engineering perspective, superplasticizers typically help reduce mixing-water demand while maintaining workability, which is consistent with the correlation direction shown in Figure 2 [27]. Pearson correlation reflects only linear statistical association and does not demonstrate direct causality. In concrete mixture data, component proportions are usually constrained jointly by volume balance, mix design rules, and experimental design. Therefore, the correlation analysis is used here as a descriptive data-analysis tool rather than as mechanistic evidence.
2.4. Benchmark Models and Implementation
To evaluate the applicability of TabPFN to concrete strength prediction, a benchmark model set was constructed consisting of support vector regression (SVR) [28], random forest (RF) [29], XGBoost [30], LightGBM [31], and CatBoost [32]. These models cover common machine learning paradigms, including kernel methods, bagged tree models, and gradient-boosted tree models, and have been widely used in concrete mechanical-property prediction. They therefore provide a broad comparative reference for TabPFN.
TabPFN uses a pretrained tabular foundation-model framework for inference-based prediction [11]. Unlike conventional machine learning models, TabPFN does not require long task-specific gradient-iteration training in the usual sense; instead, it uses priors acquired during pretraining to complete tabular prediction during inference. For concrete-material data, where experimental samples are costly, variables are strongly coupled, and dataset sizes are often limited, TabPFN has methodological appeal.
It should be emphasized that the comparison between TabPFN and conventional benchmark models is not an algorithmic comparison under identical training budgets. The main advantage of TabPFN lies in its pretrained inference paradigm and low task-specific tuning demand, whereas conventional models depend on explicit training and hyperparameter search on the current training set. Therefore, the results are interpreted as a practical performance comparison between two modeling paradigms on the present concrete strength prediction task, rather than as evidence that TabPFN has universal superiority across all concrete datasets.
2.5. Hyperparameter Optimization and Model Evaluation Metrics
Because conventional machine learning models are sensitive to hyperparameters, Bayesian optimization was used to search the hyperparameters of SVR, random forest, XGBoost, LightGBM, and CatBoost [33]. The optimization objective was the RMSE from 10-fold cross-validation within the training set. Each conventional benchmark model was optimized for 200 iterations, and the random seed was fixed at 42. All hyperparameter search, cross-validation, and model-selection procedures were strictly confined to the training set; the test set was used only for the final independent evaluation. The search spaces, selected hyperparameters, and implementation settings of the benchmark models are listed in Table 2.
Table 2.
Hyperparameter search spaces, selected parameters, and implementation settings of the benchmark models.
TabPFN was used with its default pretrained inference configuration and was not subjected to task-specific hyperparameter optimization. During the SHAP interpretation stage, TabPFN was initialized with ignore_pretraining_limits = True. This setting was used only for interpretation and was not part of hyperparameter search for performance evaluation.
The expected improvement function used in Bayesian optimization can be expressed as follows:
where denotes the best observed cross-validation RMSE, and represents the predicted objective value corresponding to the candidate hyperparameter configuration x.
In addition, regression error characteristic (REC) analysis was used to evaluate the proportion of predictions satisfying different absolute-error thresholds [34]. REC curves supplement average error metrics such as RMSE and MAE by describing model behavior under different engineering error tolerances. It should be noted that REC curves are error-tolerance statistics and are not equivalent to prediction intervals or formal uncertainty quantification.
2.6. Repeated Resampling Evaluation and Training-Sample-Size Sensitivity Analysis
A single train–test split may be affected by random sample distribution. To examine model sensitivity to data partitioning, repeated resampling evaluation was conducted after model configurations were fixed, and the distributions of R2 and RMSE were summarized. A limited-sample learning-curve experiment was also performed, with training sample sizes set to 50, 100, 200, 400, 600, and 800. This experiment analyzed model responses to changes in training sample size. The results reflect only the sample-size sensitivity of subsamples from the current UCI dataset and are not used to claim universal cross-dataset superiority.
2.7. SHAP-Based Model Interpretation
To interpret the prediction responses of TabPFN on the current dataset, the SHAP framework based on cooperative game theory was introduced [13,14]. In this study, SHAP results are treated as model-attribution evidence for examining directional consistency between the model output and general concrete-technology knowledge, rather than as proof of material causal mechanisms. The Shapley value of feature i is defined as follows:
where N denotes the complete set of input features, S is a background subset excluding the target feature i, and v(S) represents the mathematical expectation of the prediction model constrained by the feature subset S.
Because TabPFN is not compatible with the fast analytical explainer used for tree models, the model-agnostic KernelSHAP method was adopted. Considering the computational cost of applying KernelSHAP to the full dataset, K-means clustering was first used on the training set and 10 cluster centers were selected as the background reference set. Then, 100 samples were randomly drawn from the test set for attribution analysis. This strategy provides representative local explanations while maintaining manageable computational cost. The resulting global importance plots and single-feature dependence plots are used mainly to describe response patterns of the model under the current sample distribution and are not interpreted as direct evidence of microscopic material mechanisms.
2.8. Engineering-Constrained Candidate Mix Search Using TabPFN and NSGA-II
After constructing the compressive-strength prediction model, TabPFN was coupled with NSGA-II to generate candidate concrete mixes satisfying specified constraints. NSGA-II is a classical multiobjective evolutionary algorithm that uses non-dominated sorting and crowding distance to maintain solution quality and diversity [16]. In this study, it was used for the candidate mix search considering compressive strength, carbon emissions, and material cost simultaneously.
Three optimization objectives were defined as follows:
where denotes the scenario-based embodied carbon estimate per unit volume of concrete, denotes the estimated material cost, and denotes the 28-day compressive strength predicted by TabPFN. Because NSGA-II is typically implemented as a minimization algorithm, the strength maximization objective was converted into the minimization of .
The carbon emissions and cost were calculated as follows:
where is the dosage of the j raw material per unit volume, is the corresponding carbon-emission factor, is the corresponding unit material price, and m is the number of material components. The carbon-emission factors and cost parameters adopted in this study were obtained from existing literature and public sources. However, these parameters are strongly affected by region, system boundary, and time. They should therefore be regarded as scenario-specific inputs within the optimization framework rather than universal constants.
To reduce the risk of generating obviously unreasonable mixtures, the following engineering constraints were imposed in NSGA-II:
- (1)
- The evaluation age was fixed at 28 d;
- (2)
- The water-to-binder ratio (W/B) was constrained to 0.25–0.55;
- (3)
- The total binder content was constrained to 250–600 kg/m3;
- (4)
- The sand ratio was constrained to 0.35–0.55;
- (5)
- The absolute volume was required to satisfy 1.00 ± 0.02 m3;
- (6)
- The upper and lower bounds of all raw-material variables were restricted to the observed ranges of the deduplicated UCI dataset.
NSGA-II was implemented using pymoo. The population size was set to 150, the number of offspring to 100, the number of generations to 250, and the random seed to 42. Simulated binary crossover (SBX) was used with a crossover probability of 0.9 and a distribution index of 15. Polynomial mutation (PM) was used with a distribution index of 20, and duplicate elimination was enabled. The optimization objectives were minimization of scenario-based GWP, minimization of material cost, and maximization of TabPFN-predicted 28 d compressive strength; in the algorithmic implementation, strength maximization was converted to minimization of negative strength.
Although the optimization was constrained by univariate observed ranges, W/B, total binder content, sand ratio, and absolute volume, the genetic algorithm could still search relatively sparse combinations within the training distribution. Therefore, the mean 5-nearest-neighbor distance of representative candidate solutions in the standardized feature space was further calculated as a post-processing applicability-domain indicator. This indicator is used only for distribution-proximity screening and cannot replace prediction intervals, formal uncertainty quantification, or experimental verification.
3. Results and Discussion
3.1. Prediction Performance of the Benchmark Models
A high-accuracy prediction model is the basis for data-driven candidate concrete mix optimization [35]. Concrete compressive strength is jointly affected by binder composition, water content, admixtures, aggregate proportions, and curing age, resulting in nonlinear and coupled input-output relationships. Therefore, TabPFN, SVR, random forest, XGBoost, LightGBM, and CatBoost were compared under a unified data split, preprocessing pipeline, and metric set.
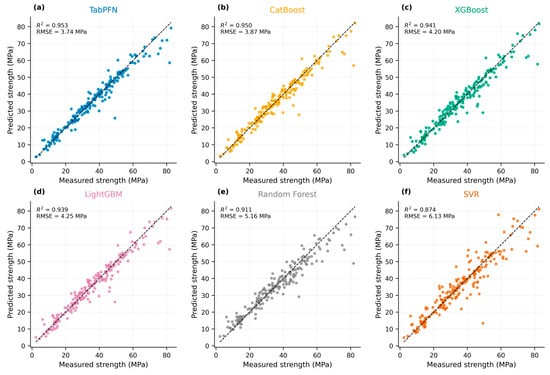
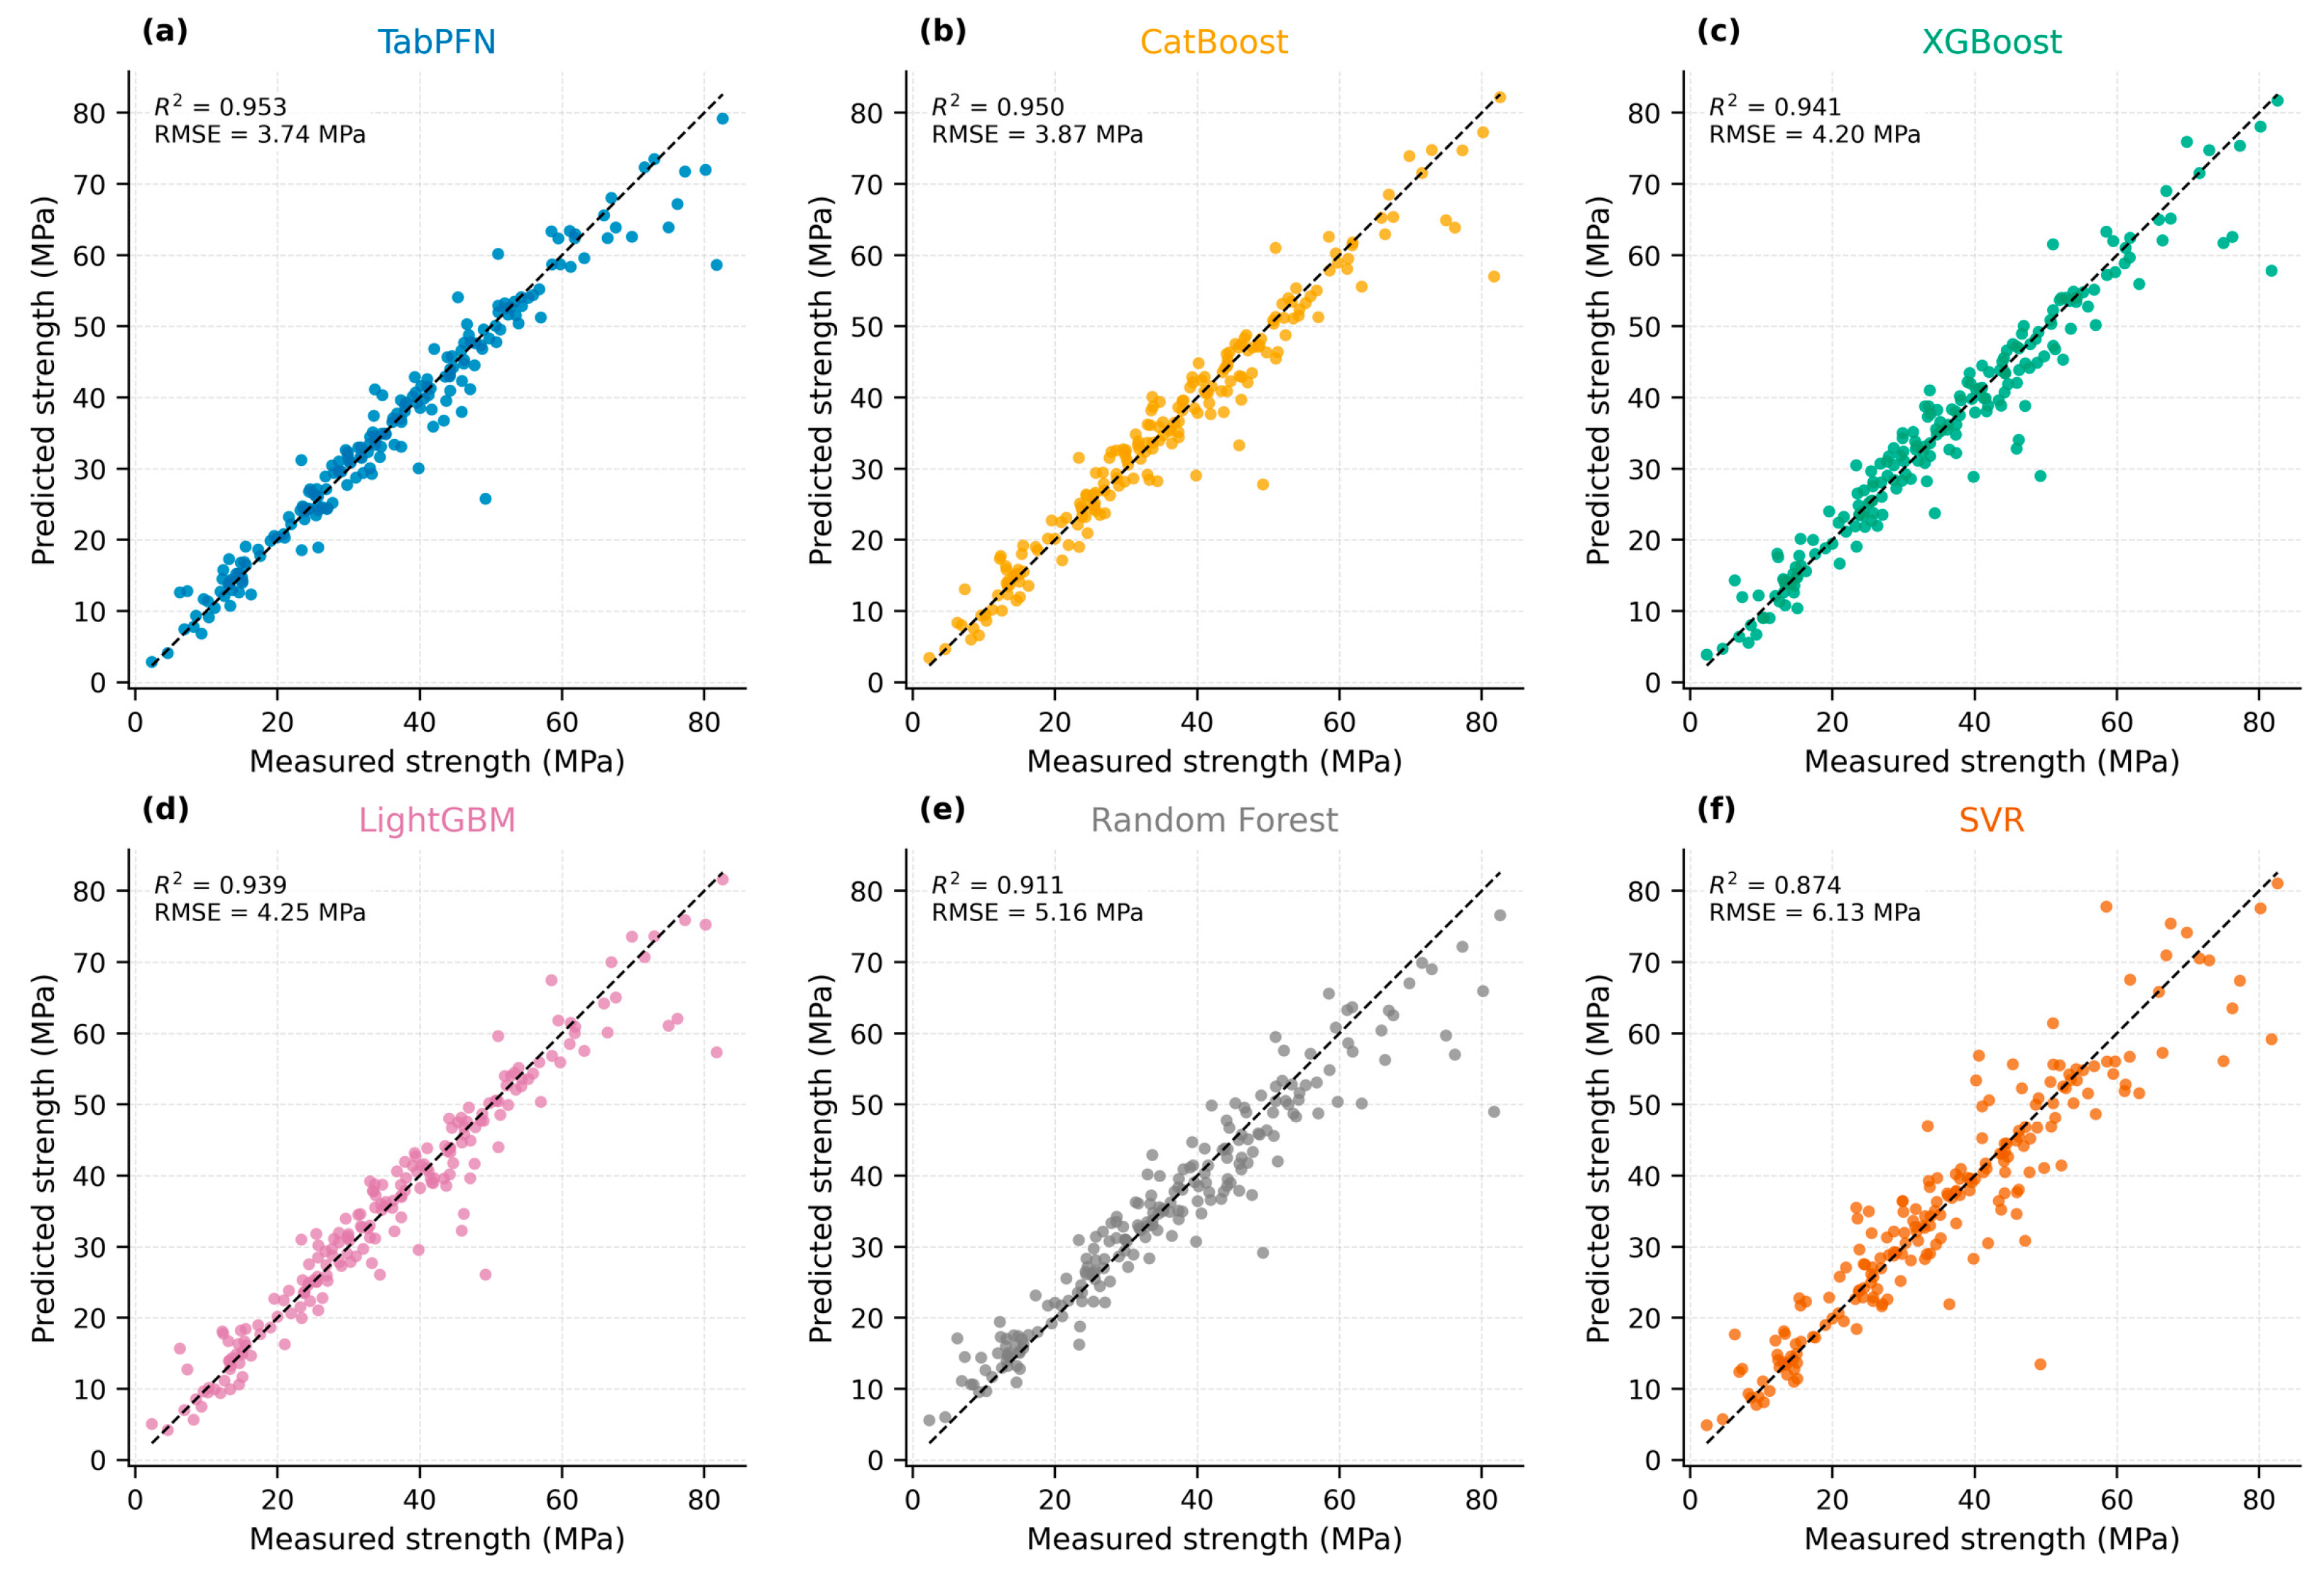
Table 3 shows that, under the current evaluation protocol and on the deduplicated UCI dataset, TabPFN achieved the highest test-set R2 and the lowest RMSE, MAE, and MAPE, with values of 0.953, 3.744 MPa, 2.265 MPa, and 7.580%, respectively. CatBoost was the closest competitor, with test-set R2 and RMSE values of 0.950 and 3.870 MPa, indicating that gradient-boosted tree models remain strong baselines for tabular concrete data. XGBoost and LightGBM also achieved high predictive performance, whereas random forest and SVR showed relatively larger test errors. Because TabPFN is a pretrained model, whereas the other benchmarks were locally trained and hyperparameter-tuned on the current training set, these results should be interpreted as a practical comparison between two modeling paradigms on the current task rather than as a definitive algorithmic ranking under identical training budgets.
Table 3.
Prediction performance of each model on the training and test sets.
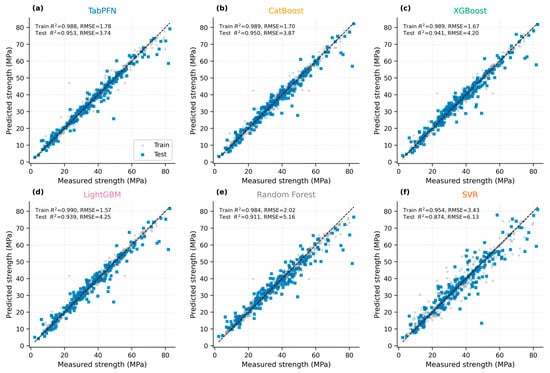
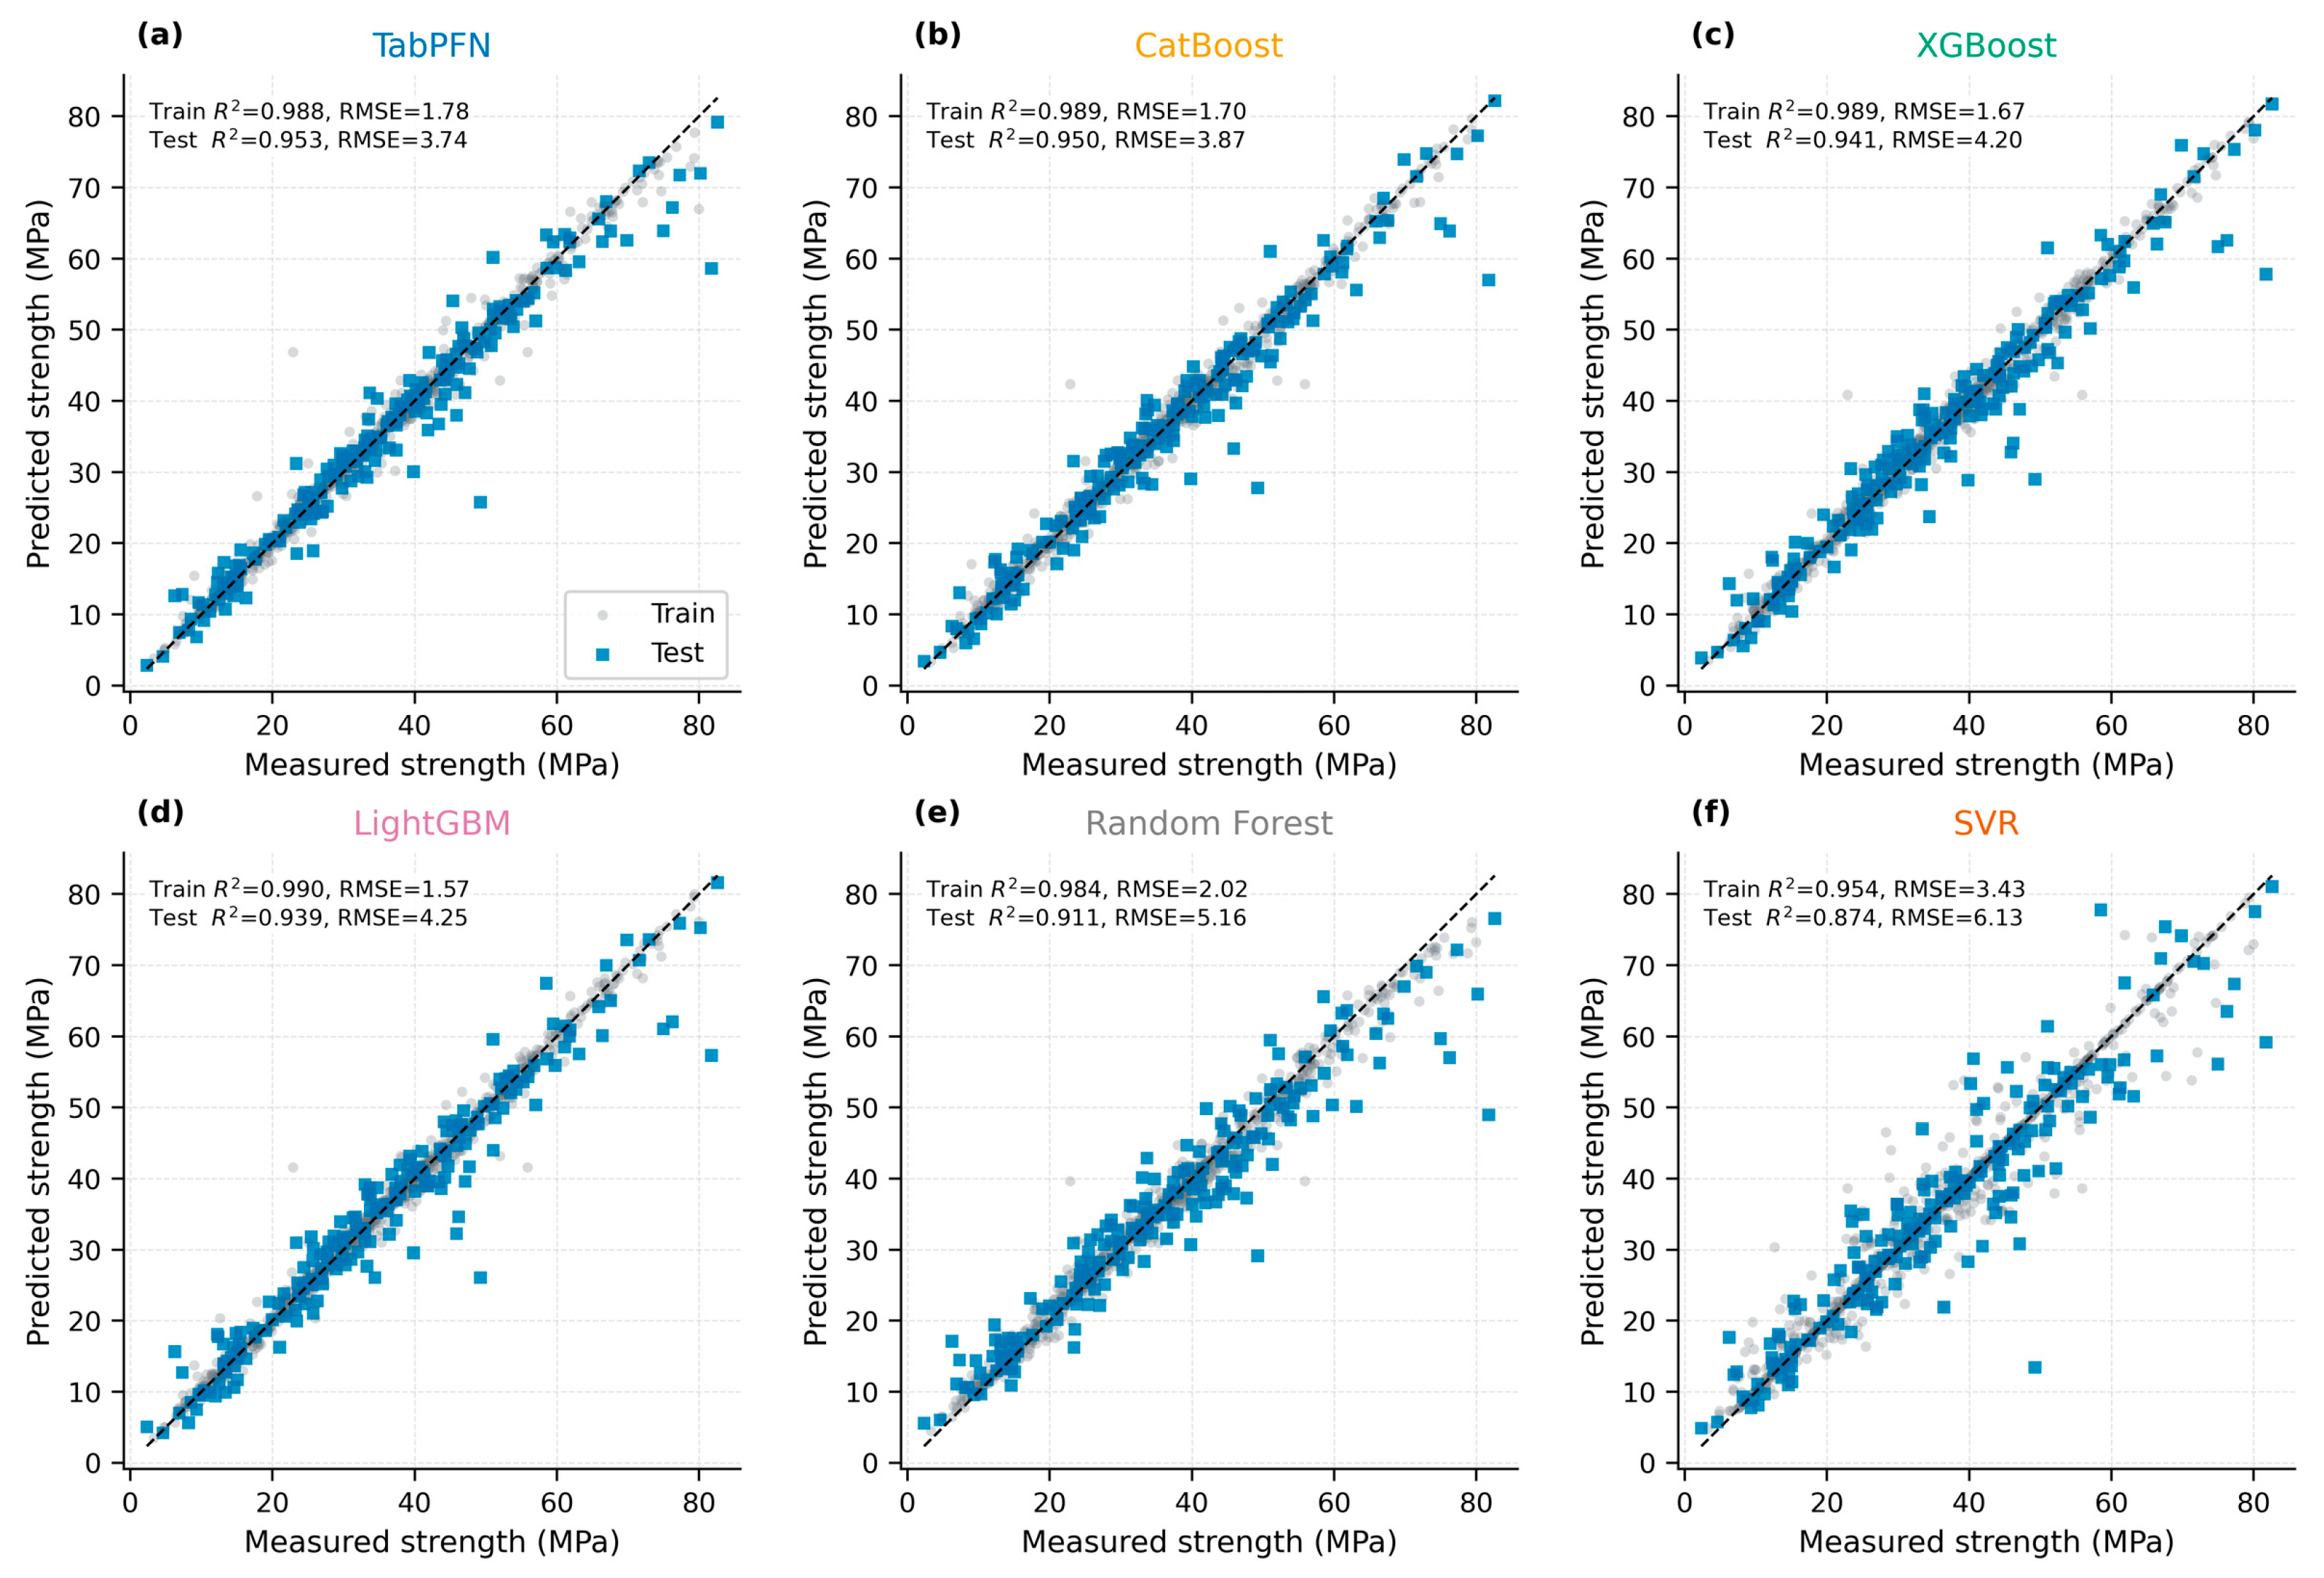
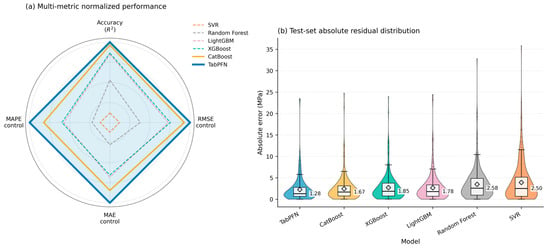
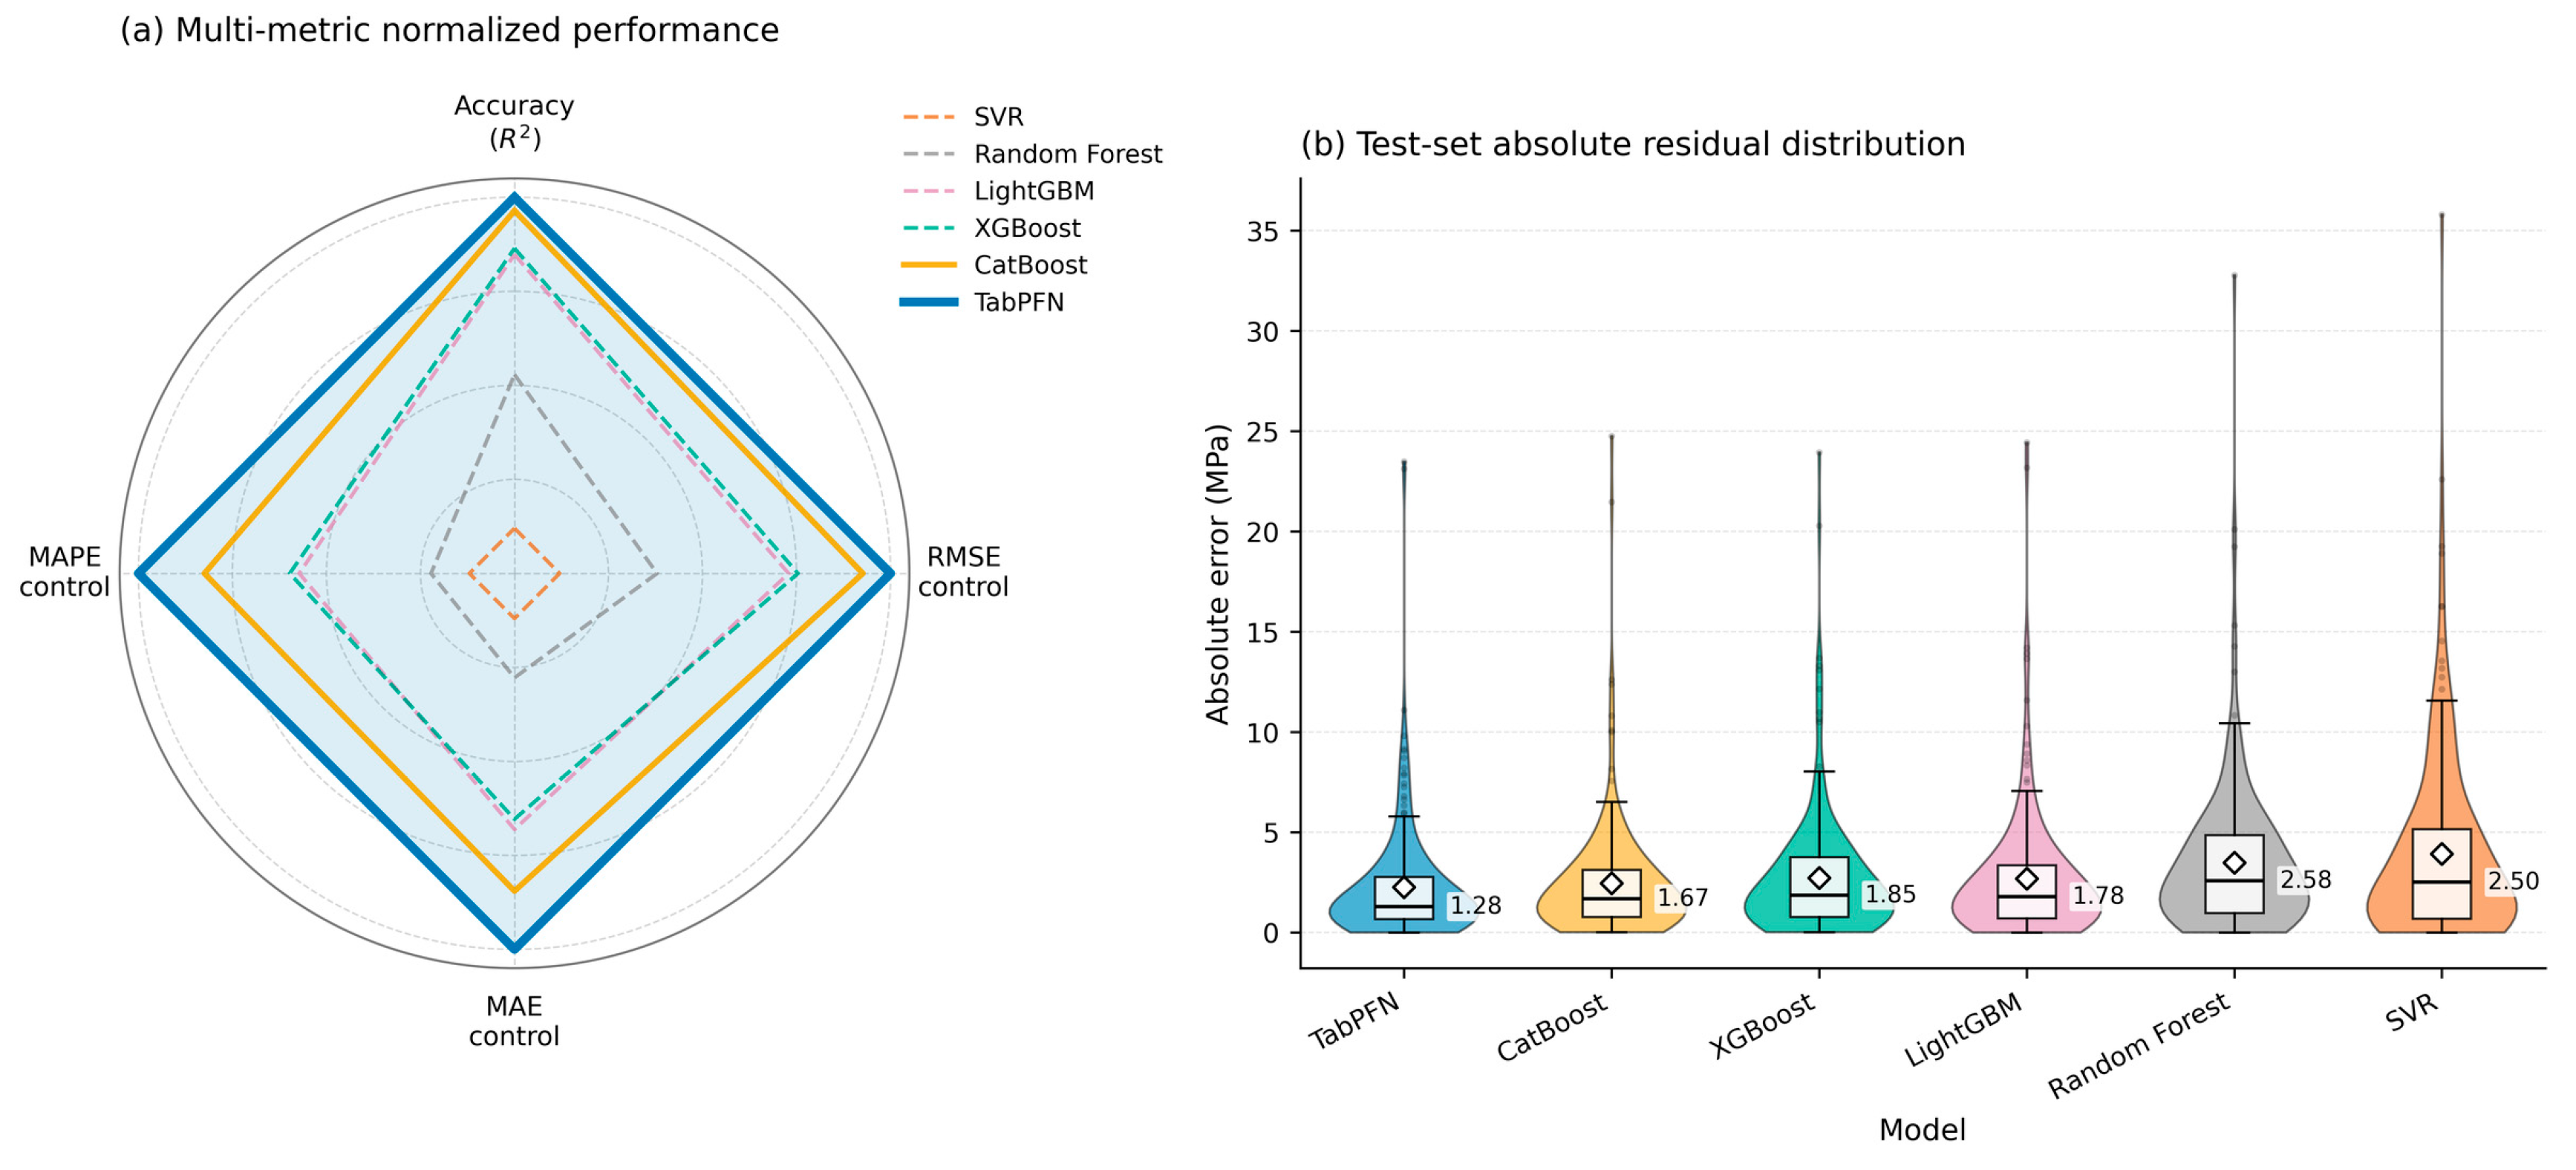
Figure 3, Figure 4 and Figure 5 further support the results in Table 3 from the perspectives of test-set scatter distributions, train–test fitting consistency, and absolute residual distributions. The prediction points of TabPFN and CatBoost are generally closer to the y = x line, and their residual distributions are more concentrated. SVR and random forest show greater dispersion in the high-strength range. These results indicate that TabPFN provides good error control within the current UCI source domain, but its improvement over CatBoost is limited. Thus, TabPFN should be interpreted as a competitive pretrained tabular model rather than as a clearly dominant predictor.
Figure 3.
Predicted versus measured values of each model on the test set: (a) TabPFN, (b) CatBoost, (c) XGBoost, (d) LightGBM, (e) Random Forest, and (f) SVR. The dashed line represents the ideal prediction line.
Figure 4.
Combined training- and test-set predicted versus measured values for each model: (a) TabPFN, (b) CatBoost, (c) XGBoost, (d) LightGBM, (e) Random Forest, and (f) SVR. Gray circles represent training samples, blue squares represent test samples, and the dashed line denotes the ideal prediction line.
Figure 5.
Normalized multi-metric model performance and test-set absolute residual distributions. (a) Normalized comparison of model performance based on multiple evaluation metrics; (b) test-set absolute residual distributions of different models.
Although the above results show that TabPFN performs well on the internal UCI test set after deduplication, this evaluation remains a source-domain internal test and cannot directly demonstrate transferability across data sources, testing protocols, or mixture spaces. Therefore, the Mendeley PCC external benchmark was introduced to evaluate prediction performance for all models under a non-training data source, and variable-range and 5NN-distance analyses were used to assess the effect of cross-source distribution shift on prediction error.
3.2. External Mendeley PCC Benchmark and Distribution-Shift Analysis
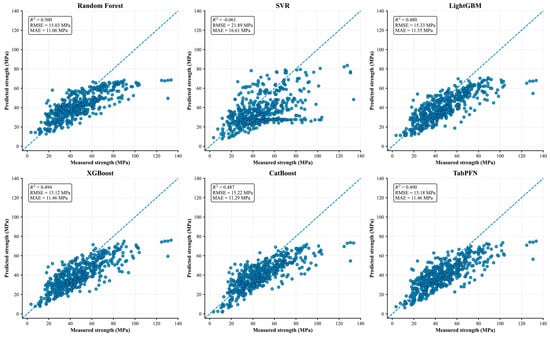
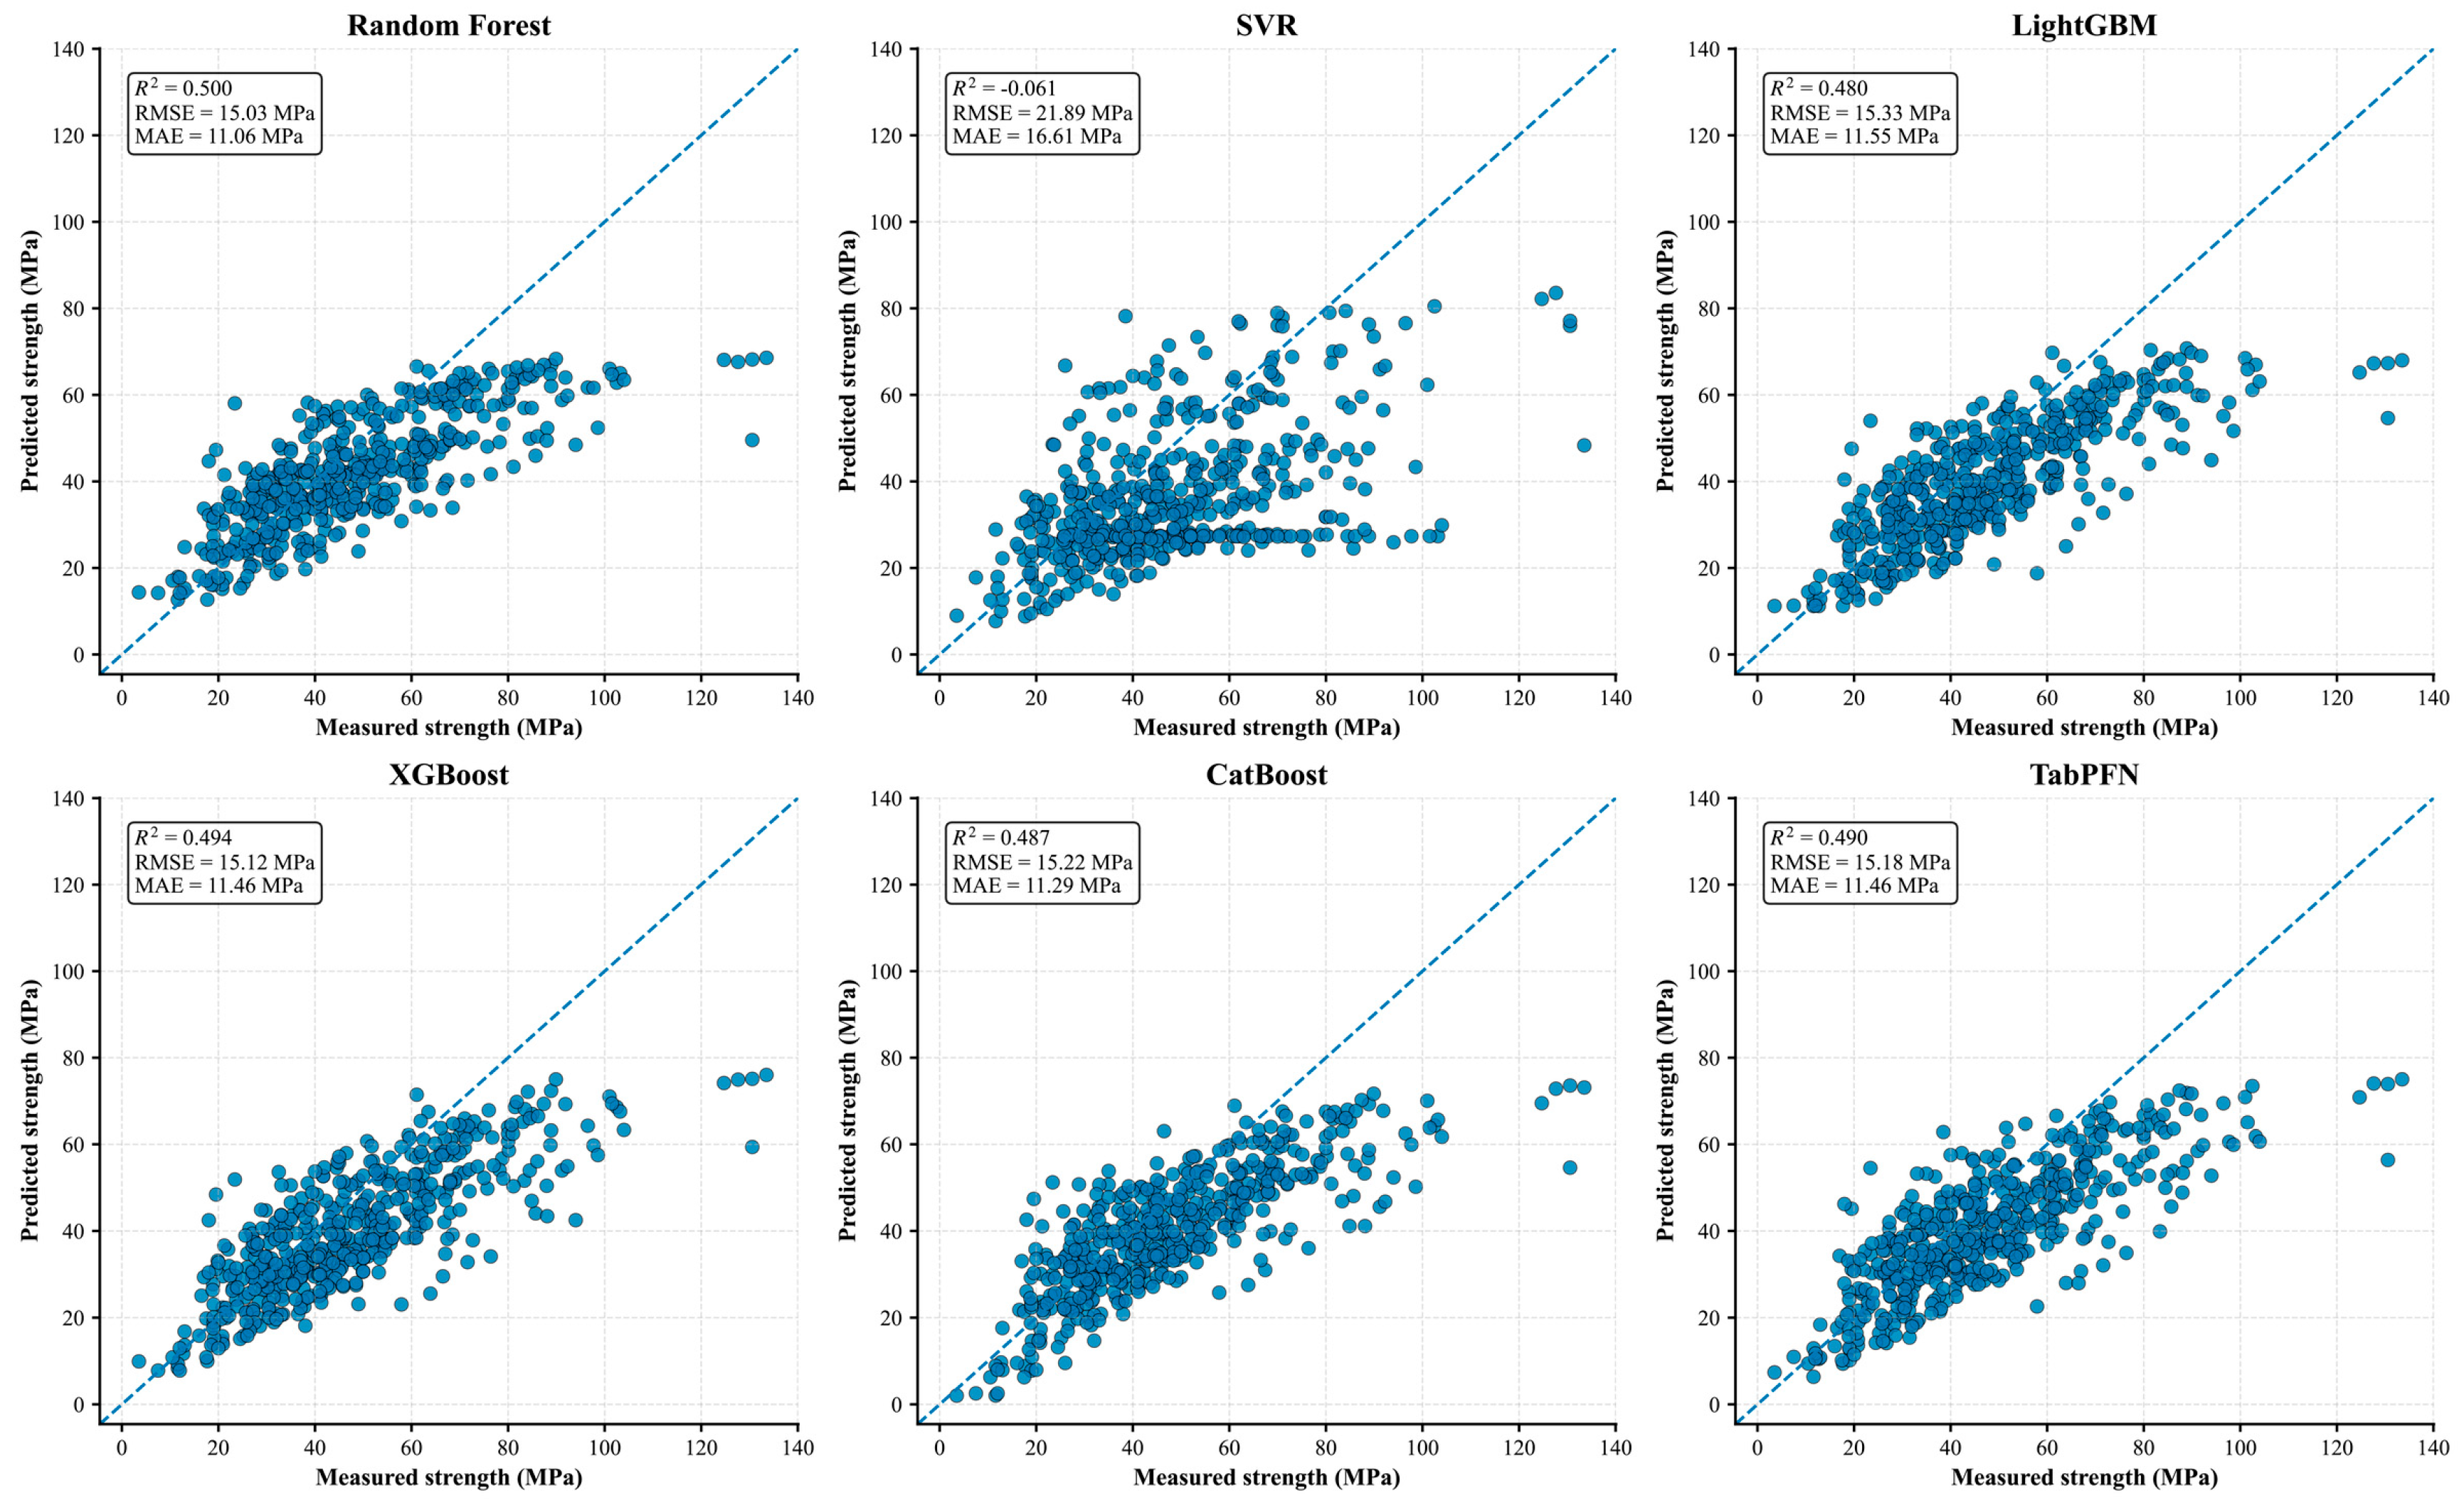
Table 4 summarizes the prediction performance of the models on the external Mendeley PCC benchmark. Compared with the internal UCI test results, all models show substantially increased prediction errors on the external data, indicating that high source-domain accuracy cannot be directly equated with cross-source generalization. On the 502 non-overlapping external PCC samples, random forest achieved the lowest RMSE of 15.031 MPa and an R2 of 0.500. XGBoost, CatBoost, and TabPFN performed close to random forest. TabPFN obtained R2, RMSE, MAE, and MAPE values of 0.490, 15.175 MPa, 11.457 MPa, and 24.028%, respectively. These results indicate that TabPFN remains competitive on the external dataset, but its performance is close to that of strong tree-based baselines. Therefore, the external benchmark does not support a claim of clear cross-source superiority for TabPFN.
Table 4.
Prediction performance of different models on the non-overlapping Mendeley PCC external benchmark.
Figure 6 further shows that the external prediction points are more dispersed than the internal UCI test predictions, especially for high-strength samples and samples with mixture proportions deviating from the source-domain training distribution. This suggests that the increase in external error is mainly related to cross-source distribution shift rather than to the failure of a single model. In the Mendeley PCC external prediction plots, RF, XGBoost, CatBoost, and TabPFN all have R2 values of approximately 0.48–0.50, whereas SVR performs markedly worse.
Figure 6.
External prediction results of different models on the Mendeley PCC benchmark.
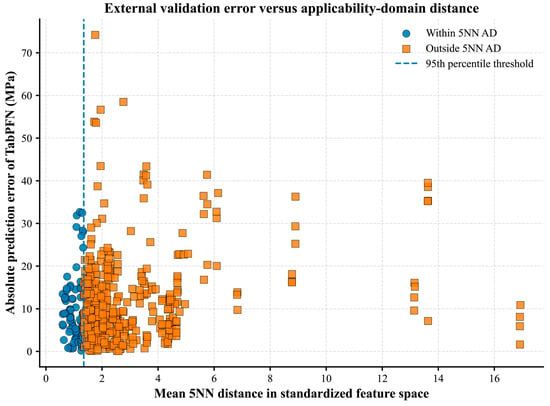
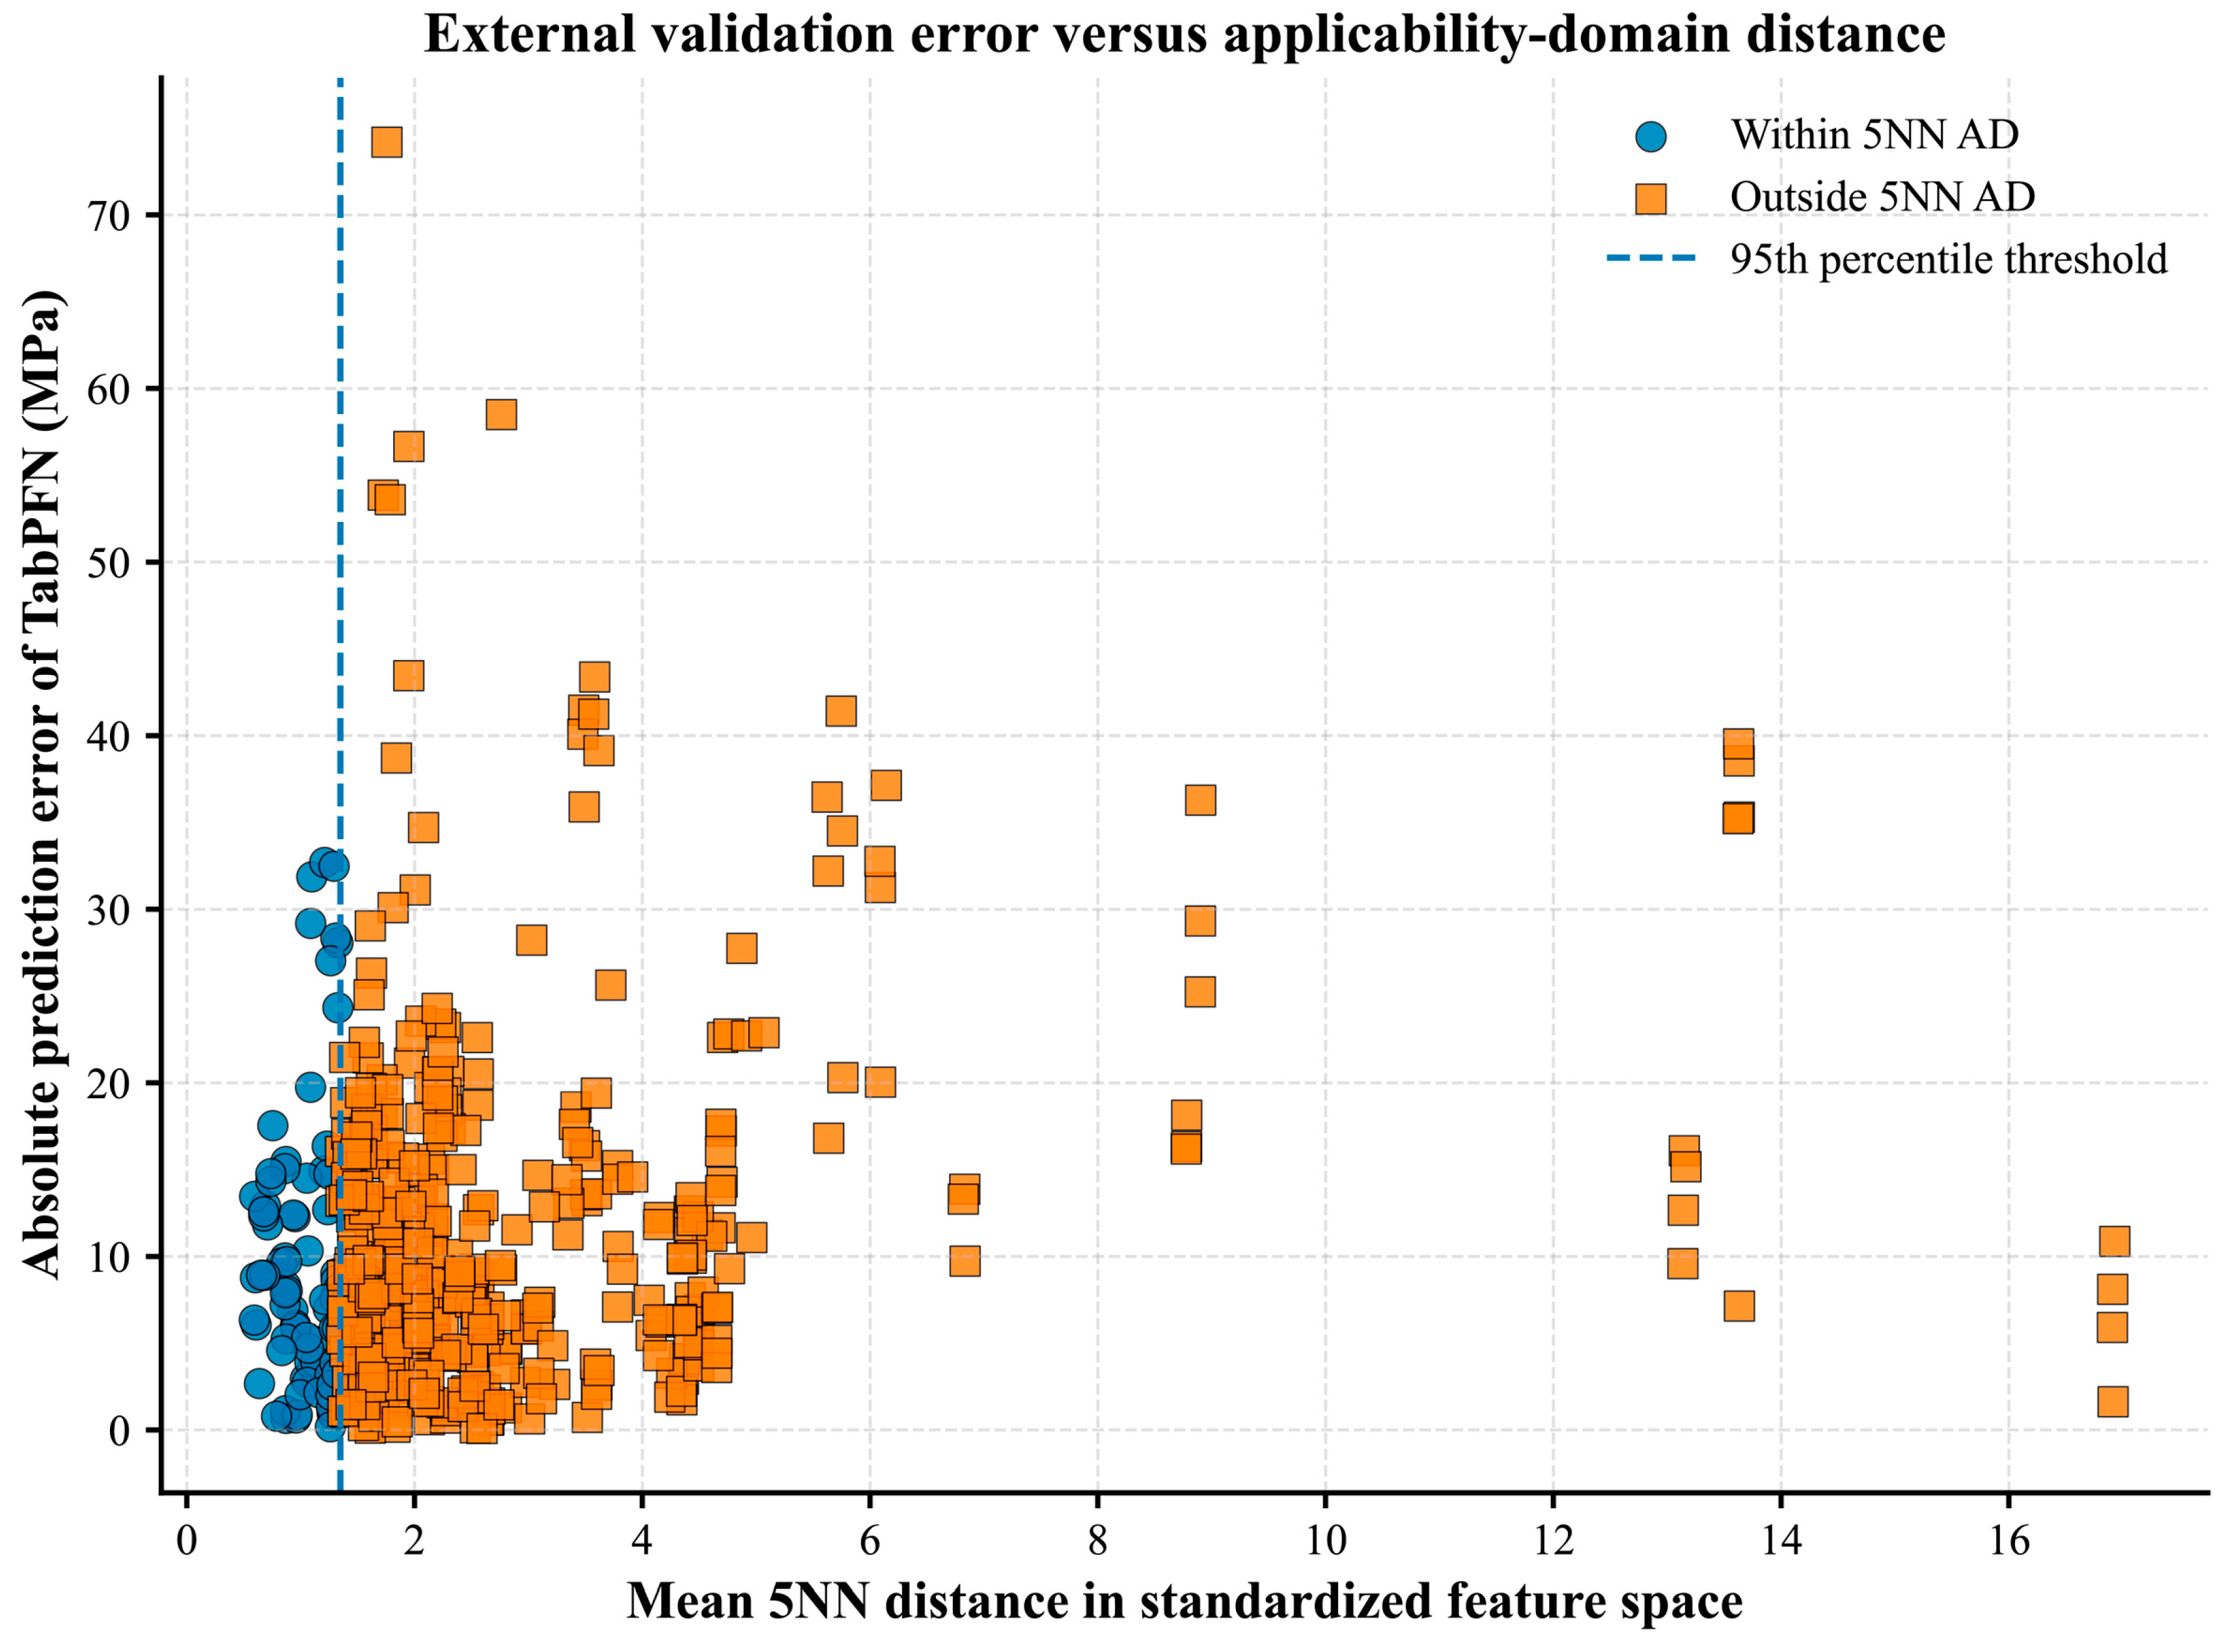
To further analyze distribution shift, external samples were stratified by univariate range overlap and 5NN applicability-domain status. For TabPFN, external samples whose variables all fell within the observed ranges of the UCI training set performed better than out-of-range samples: R2 increased from 0.490 for the full external set to 0.572, and RMSE decreased from 15.175 MPa to 13.207 MPa. After stratification using the 95% 5NN threshold, TabPFN showed better prediction performance for samples within the 5NN applicability domain, with R2 and RMSE values of 0.634 and 12.367 MPa, respectively. For samples outside the applicability domain, the corresponding R2 and RMSE values were 0.457 and 15.665 MPa, respectively.The corresponding domain-stratified prediction performance of TabPFN on the external Mendeley PCC benchmark is summarized in Table 5.
Table 5.
Domain-stratified prediction performance of TabPFN on the external Mendeley PCC benchmark.
Figure 7 shows a discernible association between the absolute prediction error of external samples and their mean 5NN distance in the standardized feature space. Some samples outside the 5NN applicability domain have high prediction errors, indicating that model reliability depends not only on whether each individual variable lies within the training-set bounds, but also on whether the multivariate combination is close to the source-domain empirical distribution. This result supports the use of applicability-domain checks in subsequent NSGA-II candidate mix screening, rather than relying solely on predicted strength, carbon emissions, and cost objective functions.
Figure 7.
External validation error versus applicability-domain distance.
3.3. Model Robustness, Training-Sample-Size Sensitivity, and Error Advantage
A single train–test split may be affected by accidental sample distribution. For concrete-material datasets, coverage across strength grades, curing ages, and binder combinations is often uneven. Therefore, evaluating model performance from only one split may introduce bias. To further examine model stability, repeated resampling evaluation was conducted, and box plots were used to show the performance distributions of different models over multiple evaluations.
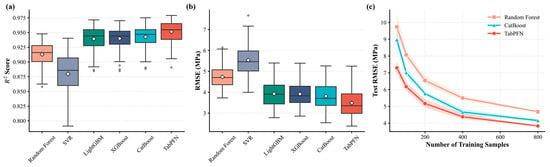
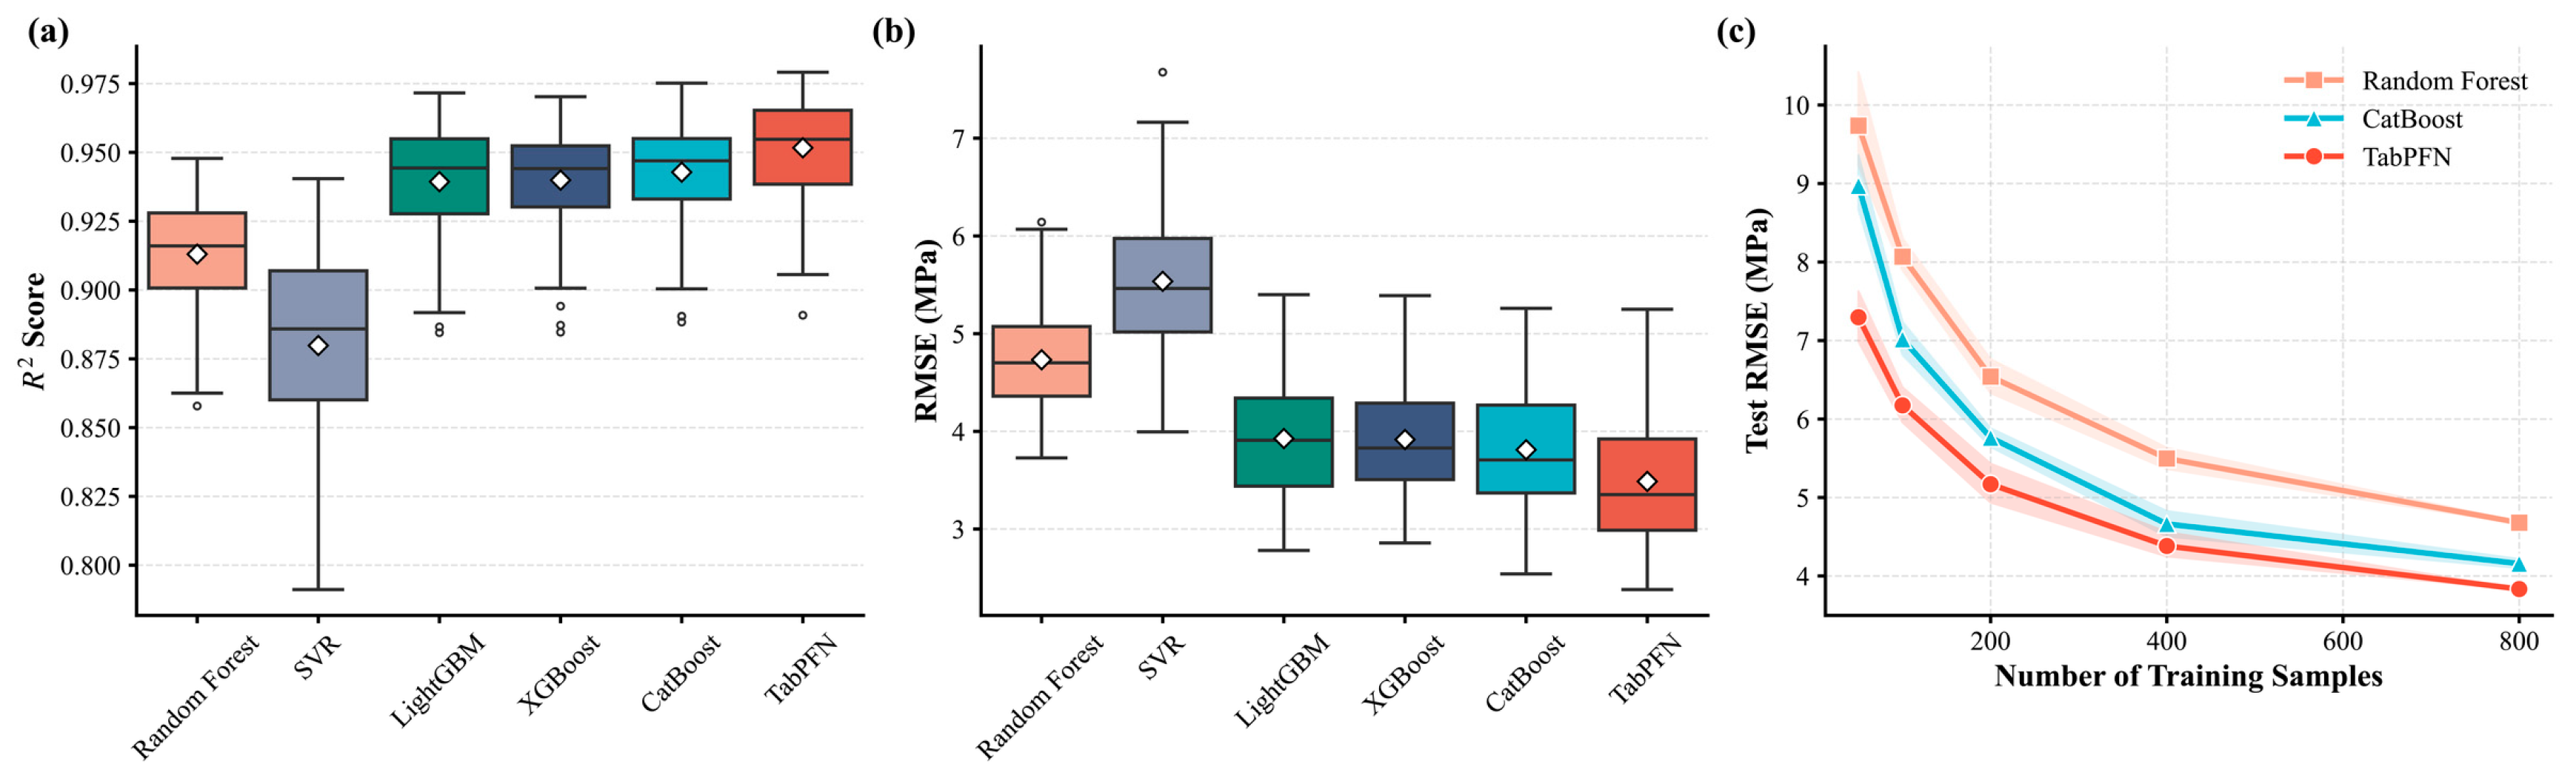
Figure 8a,b show that TabPFN has a relatively low median RMSE and a relatively high median R2 under repeated evaluation, with a comparatively narrow box range, indicating lower sensitivity to sample partitioning. CatBoost follows closely, further indicating that gradient-boosted tree models are strong competitors. Figure 8c shows that as the training sample size increases from 50 to 800, the test errors of all models generally decrease, indicating that increasing training data remains a major route to improving strength prediction. At smaller training sizes, TabPFN shows a relatively moderate increase in error; however, the deduplicated UCI dataset contains 1005 samples and should not be simply categorized as an extremely small dataset. Therefore, this result only indicates limited-sample stability on subsamples of the current dataset and does not prove a universal advantage of TabPFN for all small-sample concrete tasks.
Figure 8.
Model stability and sample-size sensitivity under repeated evaluation. (a) RMSE distributions of different models under repeated resampling; (b) R2 distributions of different models under repeated resampling; (c) training-sample-size sensitivity curves showing the variation in test RMSE with increasing training size.
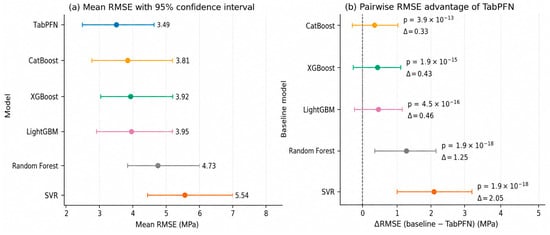
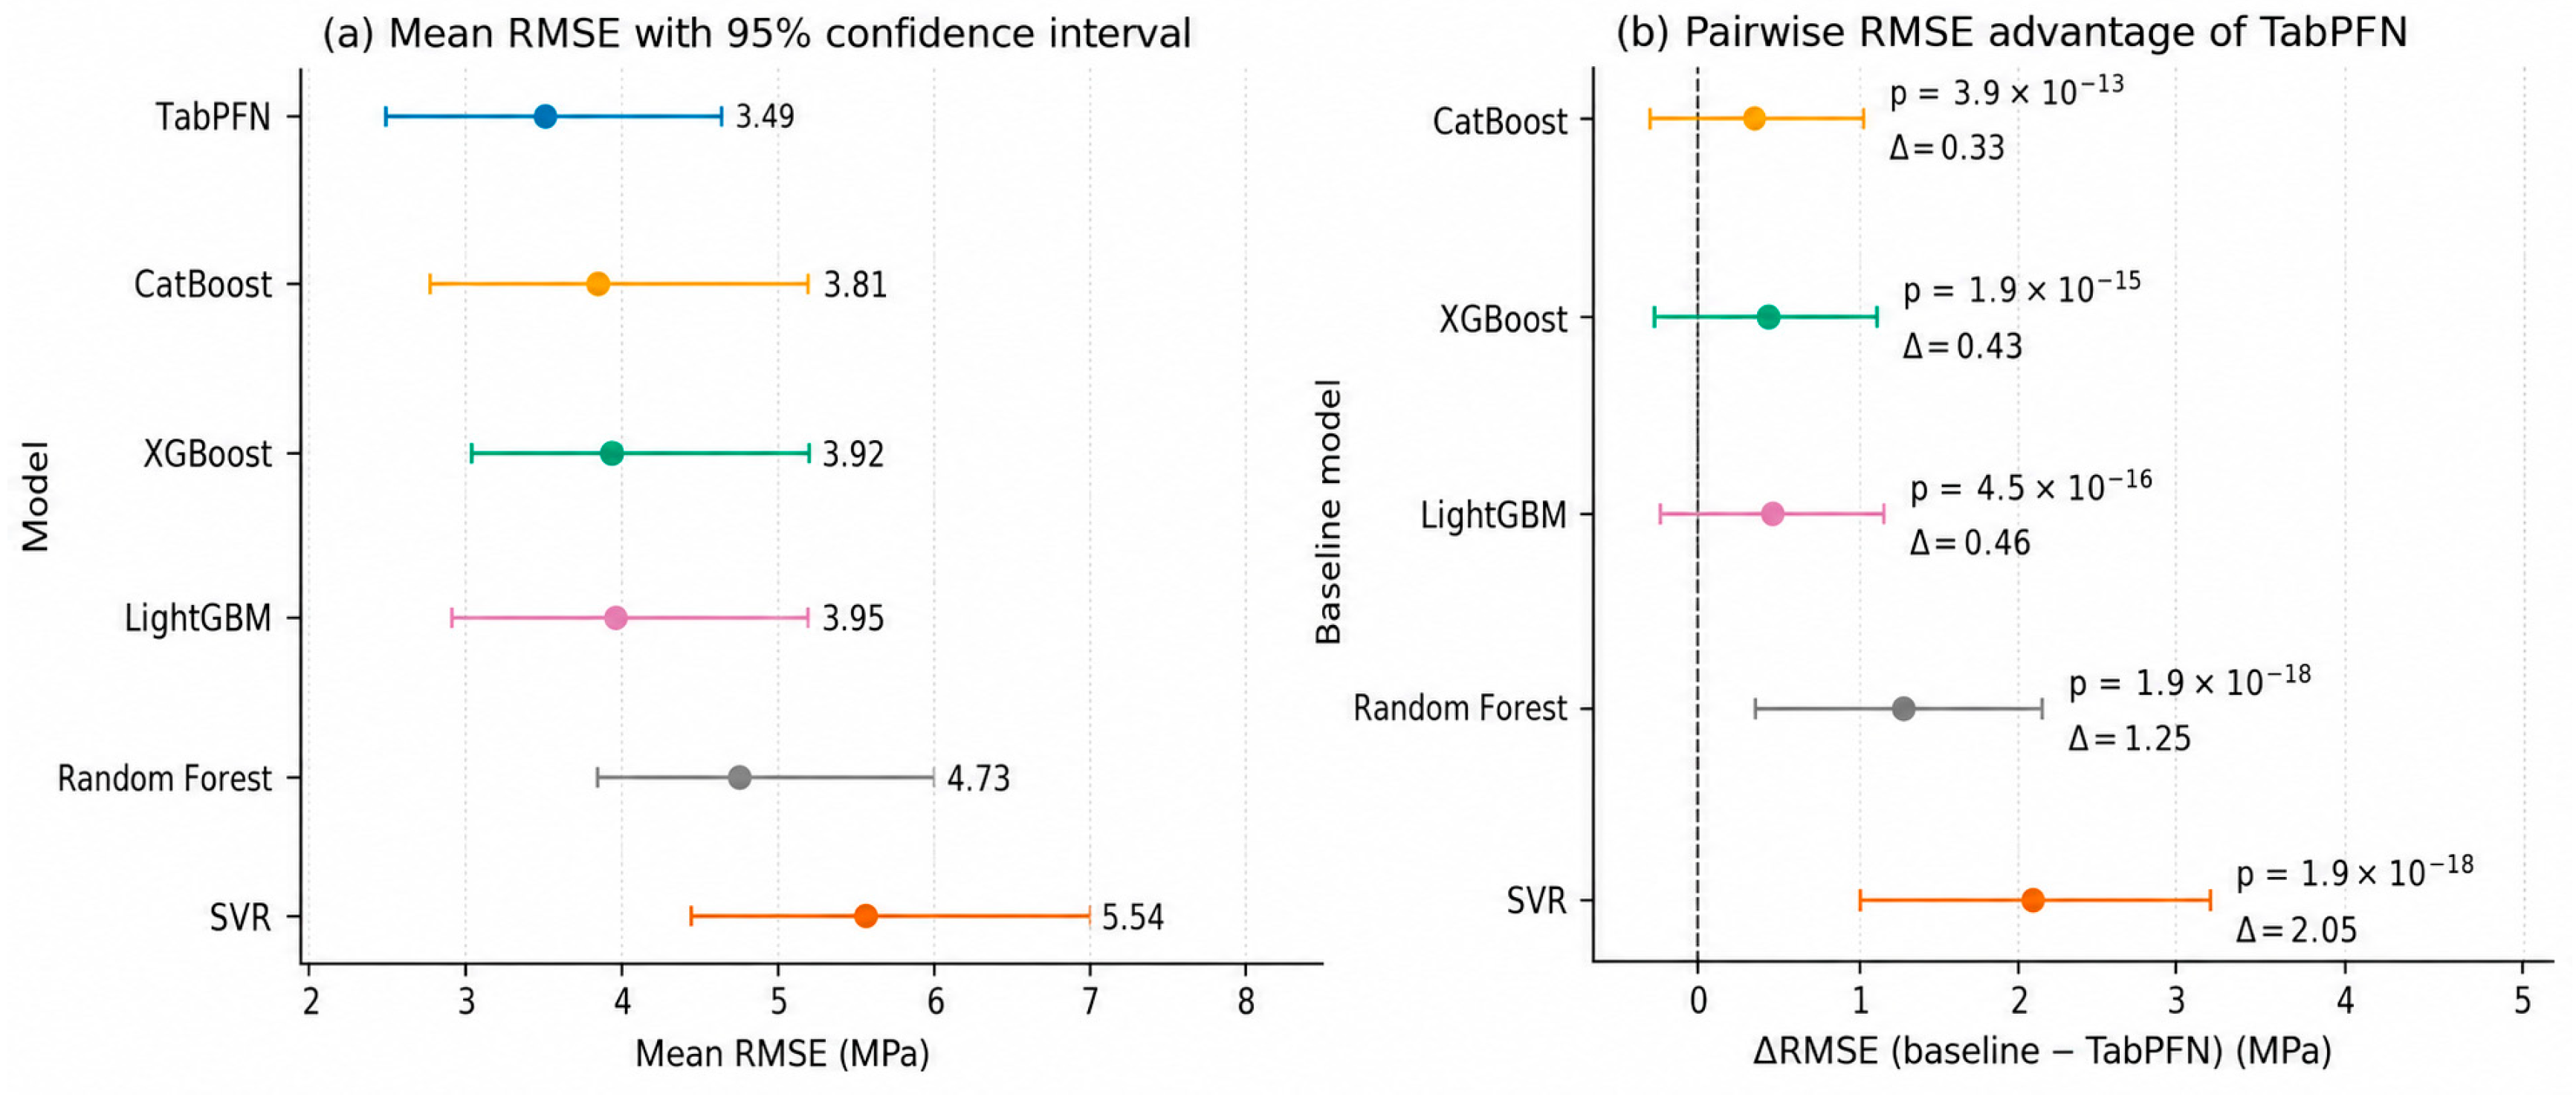
Figure 9 further indicates that TabPFN has a relatively low mean RMSE and a narrow 95% confidence interval under repeated evaluation. Its error advantage over random forest and SVR is clear, whereas its advantage over CatBoost, XGBoost, and LightGBM is limited. This finding is consistent with Table 3 and Figure 8: TabPFN has a certain performance advantage on the current dataset, but it does not overwhelmingly outperform strong baseline models.
Figure 9.
Confidence intervals of mean RMSE and relative error advantage of TabPFN under repeated evaluation.
3.4. Error-Tolerance Analysis Based on REC Curves
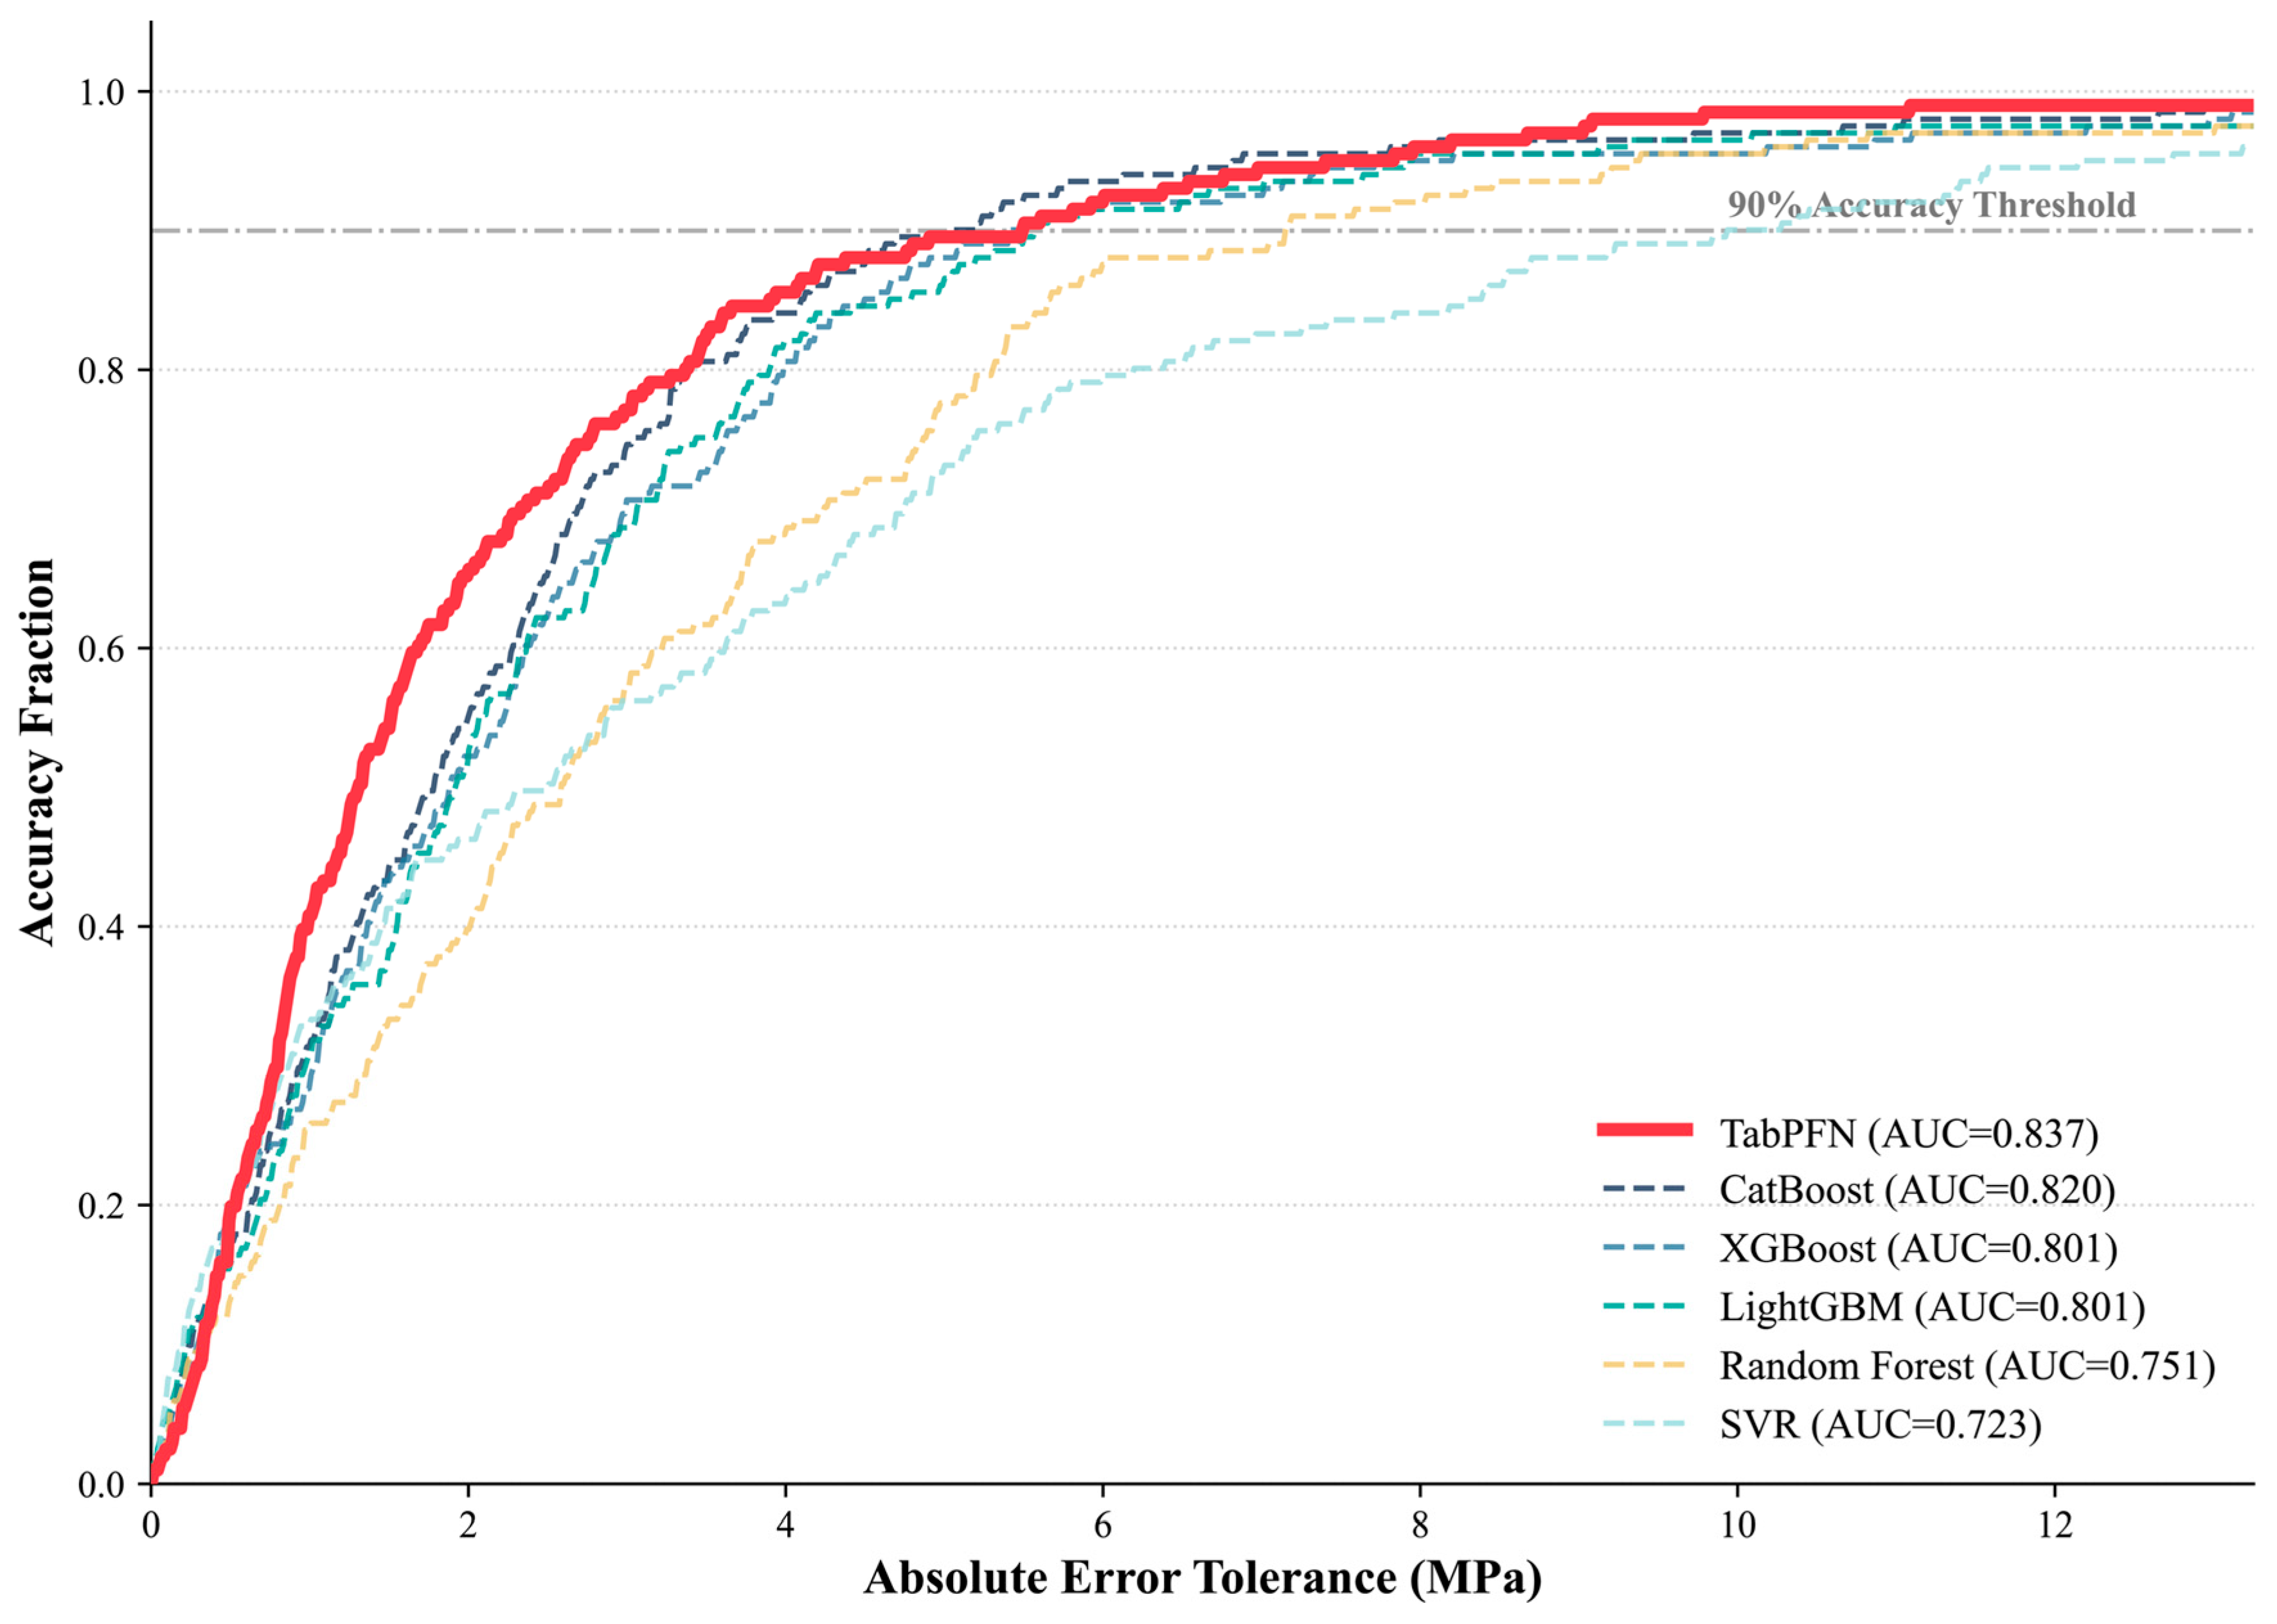
Conventional error metrics describe the overall prediction level but do not directly indicate model performance under different engineering error tolerances. For concrete compressive strength prediction, whether the prediction error is controlled within 2 MPa, 5 MPa, or 10 MPa has different engineering implications. Therefore, regression error characteristic curves were used to analyze the proportion of predictions satisfying different absolute-error thresholds [34].
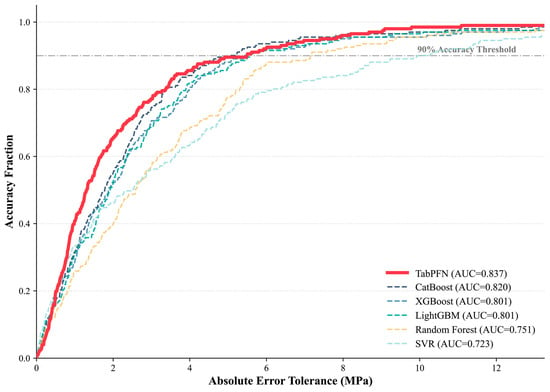
Figure 10 shows that TabPFN has a higher success rate in the low-error-tolerance range. When the absolute error is below 2 MPa, the success rate of TabPFN is 42.3%, slightly higher than the 39.8% of CatBoost. The REC-AUC of TabPFN is 0.837, which is also higher than those of CatBoost (0.820) and XGBoost (0.804). REC analysis supplements the evaluation of model performance under different error tolerances; however, it remains a test-set error-tolerance statistic and does not provide confidence intervals for individual predictions or determine whether optimized candidate mixes fall within a reliable model applicability domain.
Figure 10.
Regression error characteristic curves of the models.
3.5. Global Feature Attribution Based on SHAP
This section uses SHAP to perform global and local attribution analysis for the predictions of TabPFN on the current dataset [13,14]. Previous concrete strength prediction studies have also shown that SHAP can improve the transparency of black-box models [36]. In this study, SHAP is used mainly to examine whether the predictive basis of the model is directionally consistent with general concrete-technology knowledge, not to infer material causal mechanisms.
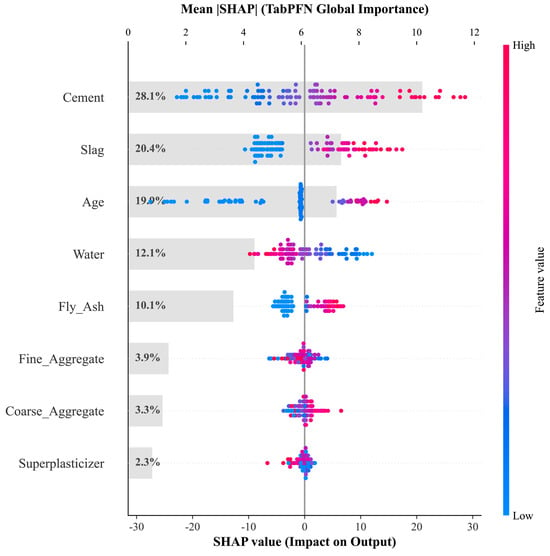
Figure 11 shows that cement content, slag content, and curing age are the three variables with the highest mean contributions to the current model output, with relative contributions of 28.1%, 20.4%, and 19.9%, respectively; together, they account for 68.4%. This indicates that, under the current UCI dataset and TabPFN model, the model relies mainly on binder composition and age information for strength prediction. In terms of SHAP direction, higher cement content and longer curing age are usually associated with positive SHAP values, whereas higher water content is usually associated with negative SHAP values. These directions are generally consistent with concrete-technology knowledge, but they only indicate empirical plausibility of the attribution and do not prove direct causal relationships between variables and strength. The lower mean contributions of superplasticizer, fly ash, coarse aggregate, and fine aggregate do not mean that their actual material roles are negligible; they only indicate lower average marginal contributions in the current model output.
Figure 11.
Global feature attribution of the TabPFN model based on SHAP analysis.
3.6. Nonlinear Response Patterns of Key Variables
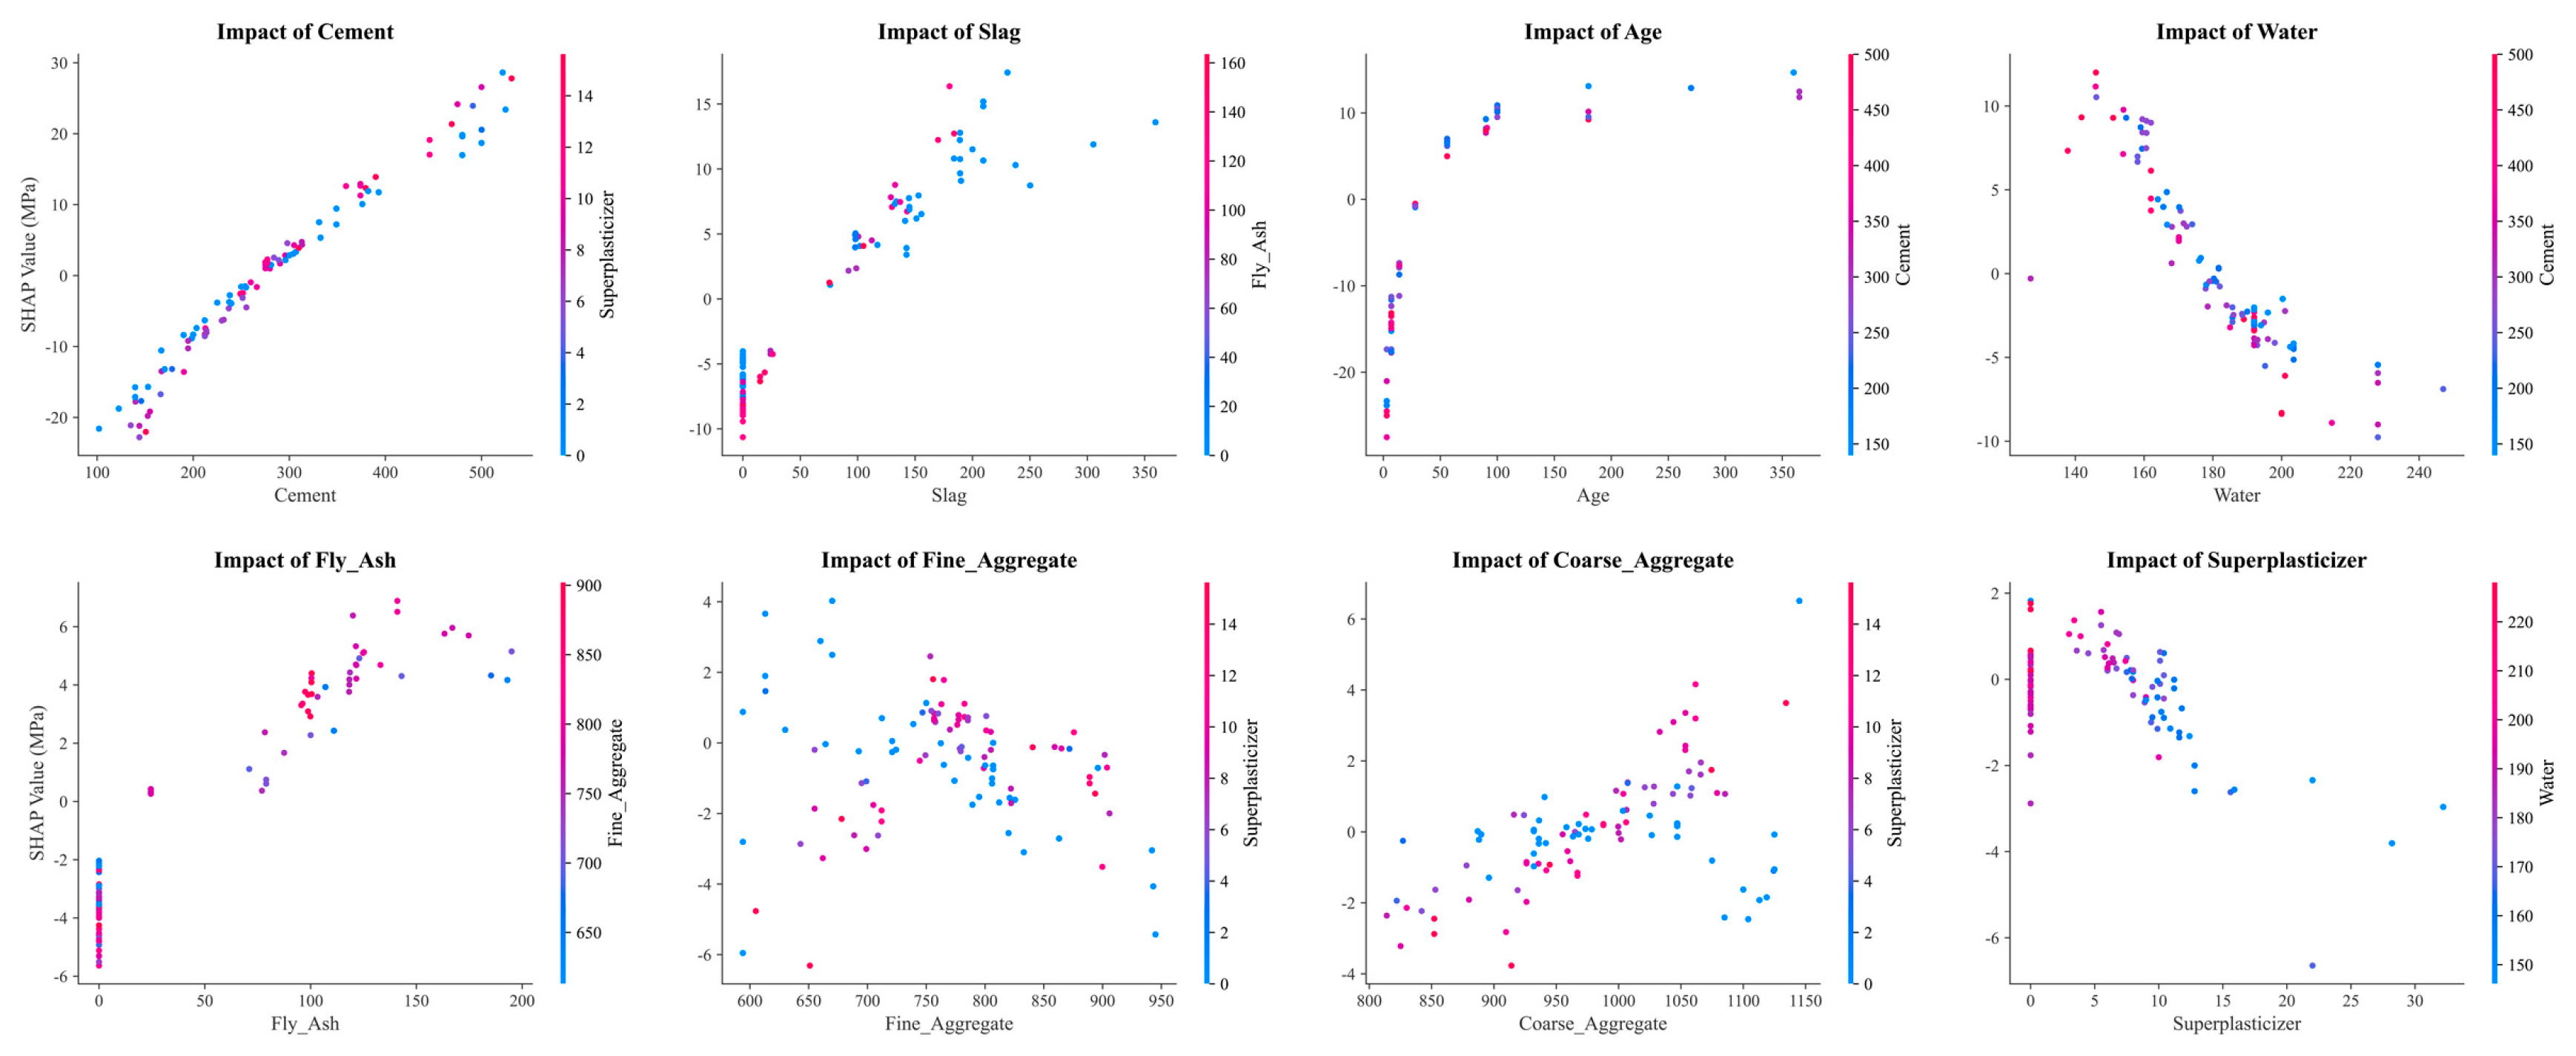
To further analyze how the model output changes with key variables, Figure 12 presents SHAP single-feature dependence plots for the major input variables. Unlike global importance rankings, SHAP dependence plots show the relationship between feature values and model-attribution values, thereby describing nonlinear response patterns under the current sample distribution.
Figure 12.
SHAP single-feature dependence plots of key input variables.
Figure 12 presents the SHAP dependence plots of the main input variables. Overall, cement, slag, curing age, and water show relatively clear model-response directions. Cement content shows an overall positive SHAP response as its value increases, indicating that the model tends to associate higher cement content with higher predicted compressive strength; this direction is consistent with the role of cement as the primary binder in strength development [37]. Slag exhibits a more nonlinear response: in the low-to-medium dosage range, SHAP values increase with slag content, whereas the increasing trend becomes weaker at higher dosages. This should be understood as the marginal response of the current model to the slag variable rather than as a universal material threshold. The strength contribution of slag and other supplementary cementitious materials is also affected by chemical composition, reactivity, fineness, water-to-binder ratio, alkalinity, and curing regime [38]. Curing age shows an overall positive response, indicating that the model captures the development of concrete strength with curing time. At longer ages, SHAP growth tends to flatten, suggesting that the model represents later-age strength gain as slower than early-age strength gain. In contrast, water shows an overall negative response: SHAP values generally decrease as water content increases, consistent with the direction implied by water-to-binder ratio theory.
The response of superplasticizer is more complex. Some high-dosage samples show positive contributions, which may reflect a statistical association among superplasticizer dosage, low water-to-binder ratio, and high-performance concrete mixtures. Because superplasticizers primarily improve dispersion, reduce mixing-water demand, and improve workability, their positive SHAP contribution is more appropriately interpreted as an indirect statistical signal within the mixture system rather than as evidence that superplasticizer alone increases strength. Overall, Figure 12 shows that the main response directions learned by TabPFN on the current dataset are broadly consistent with concrete-technology knowledge, indicating a degree of predictive plausibility. Nevertheless, the trends in the SHAP dependence plots should still be understood as response patterns under the current model and data distribution, not as engineering design thresholds or material causal conclusions.
3.7. Engineering-Constrained NSGA-II Multiobjective Candidate Mix Search
After TabPFN-based compressive strength prediction and SHAP attribution analysis, TabPFN was coupled with NSGA-II to conduct three-objective candidate mix search considering strength, scenario-based carbon emissions, and material cost. It must be emphasized that the optimization results in this section are not final construction mixtures validated by engineering tests. They are candidate solutions generated under specified data boundaries, engineering constraints, carbon-emission factors, and material prices, and are intended mainly for subsequent experimental screening.
During optimization, the evaluation age was fixed at 28 d; the water-to-binder ratio was constrained to 0.25–0.55; the total binder content was constrained to 250–600 kg/m3; the sand ratio was constrained to 0.35–0.55; the absolute volume was required to satisfy 1.00 ± 0.02 m3; and the dosage of each raw material was restricted to the observed range of the deduplicated UCI dataset. To ensure reproducibility of the optimization calculation, the material densities used in the absolute-volume calculation were cement 3150 kg/m3, slag 2900 kg/m3, fly ash 2300 kg/m3, water 1000 kg/m3, superplasticizer 1200 kg/m3, coarse aggregate 2600 kg/m3, and fine aggregate 2600 kg/m3.
The same set of GWP and cost parameters was used in NSGA-II fitness evaluation, Pareto-front plotting, representative candidate selection, and post-processing calculations to ensure consistency between the objective functions and the reported results. The carbon-emission factors, material prices, and data sources for the raw materials are listed in Table 6.
Table 6.
Carbon-emission factors and material unit prices of concrete raw materials.
The carbon-emission factors and material prices in Table 6 are region-specific, time-sensitive, and dependent on system boundaries. Therefore, the GWP and Cost results obtained in this study should be interpreted as scenario-based estimates under a specified parameter system rather than as complete life-cycle assessment conclusions.
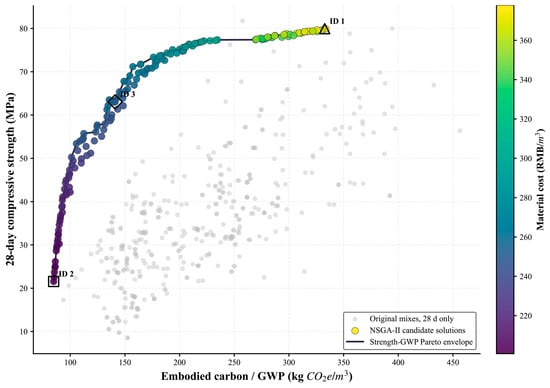
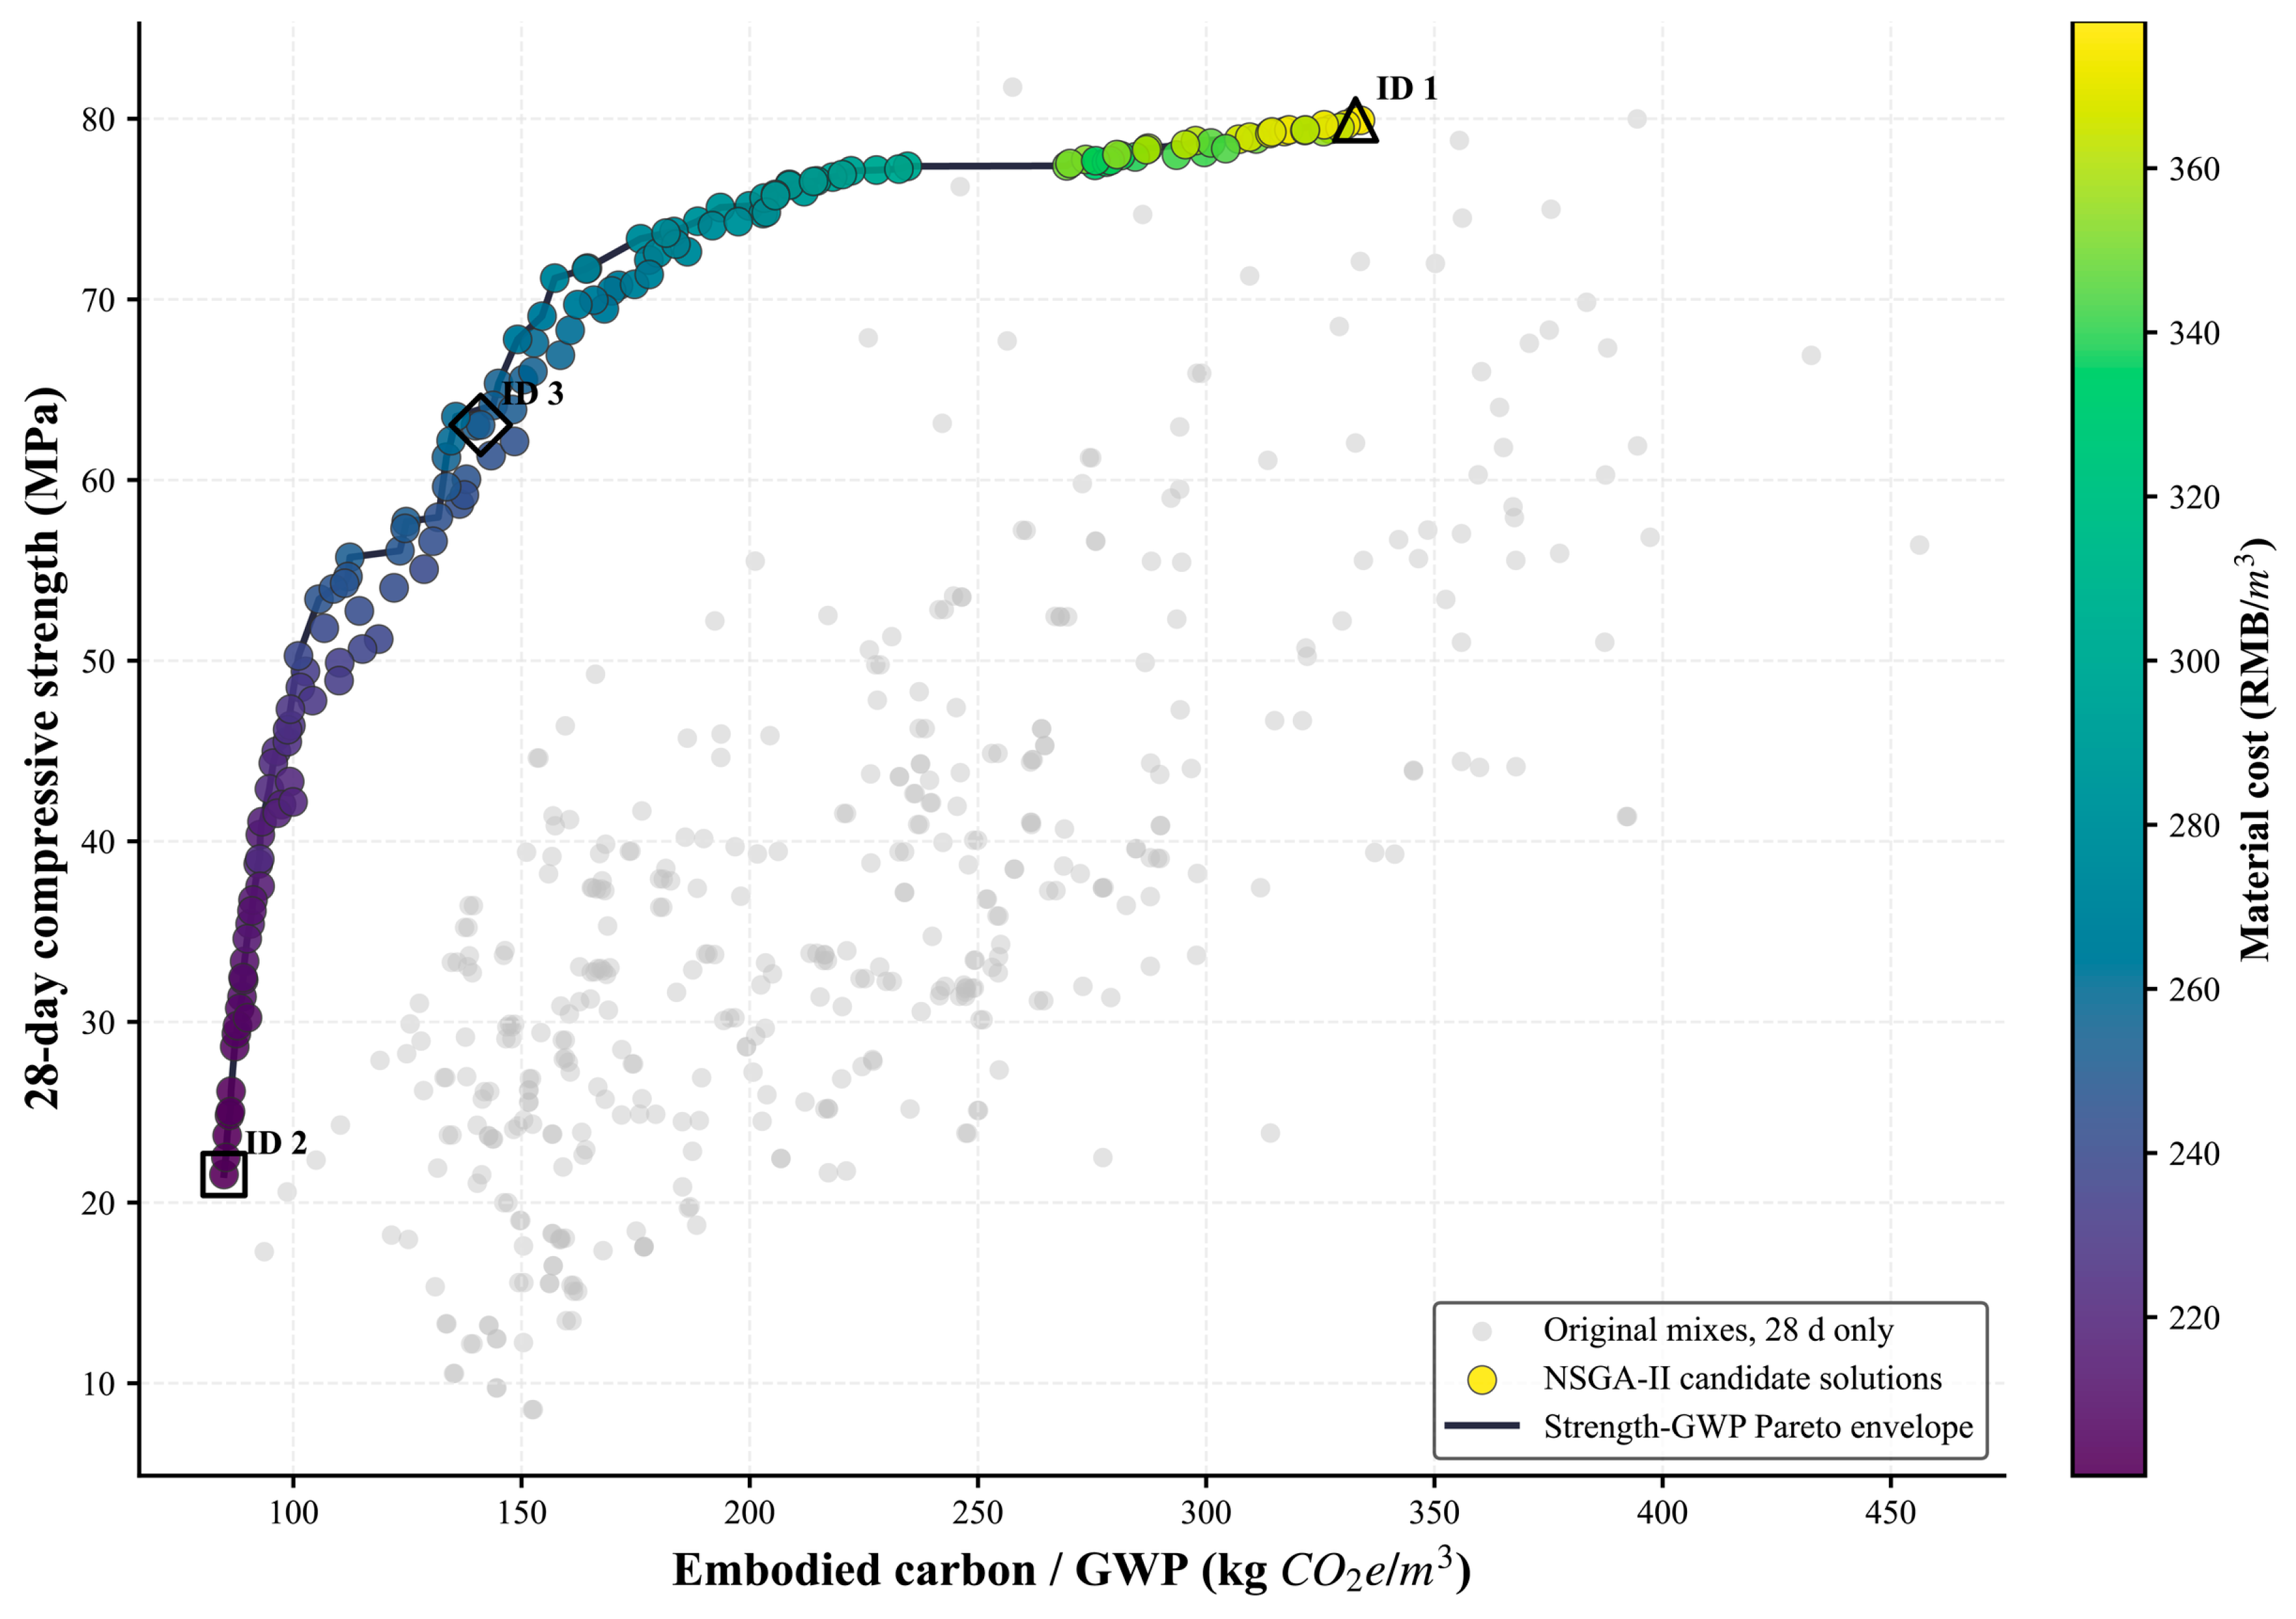
Based on the above constraints and parameter settings, NSGA-II generated a set of non-dominated candidate solutions. Their trade-offs among strength, GWP, and material cost are shown in Figure 13.
Figure 13.
Engineering-constrained NSGA-II multiobjective candidate mix search results.
As shown in Figure 13, gray points represent measured 28 d samples in the original dataset, and colored points represent candidate mixes generated by NSGA-II and evaluated by TabPFN. The candidate solutions are mainly distributed along the upper envelope of the empirical 28 d sample distribution, indicating that NSGA-II can search for representative trade-off combinations among strength, carbon emissions, and cost under the specified constraints. The overall trend shows that, as GWP increases, predicted strength first increases rapidly and then grows more slowly, indicating that the relationship between strength improvement and carbon-emission increase is not linear under the current model and scenario parameters.
To further illustrate the trade-off characteristics of different Pareto-front candidates, three representative mixtures were selected from the candidate set, corresponding to strength-prioritized, low-GWP-prioritized, and balanced compromise scenarios. The results are listed in Table 7.
Table 7.
Representative Pareto candidate mix proportions based on NSGA-II and engineering constraints (dosages in kg/m3; GWP in kg CO2e/m3; Cost in RMB/m3; strength in MPa).
Table 7 lists three representative candidate solutions. The strength-prioritized mixture (ID 1) has the highest predicted 28 d compressive strength of 79.9 MPa. It has a high cement dosage and total binder content and a W/B of 0.250, close to the lower bound of the constraint; however, its GWP and material cost also reach 332.7 kg CO2e/m3 and 377.9 RMB/m3, respectively. The low-GWP-prioritized mixture (ID 2) has the lowest GWP of 84.8 kg CO2e/m3, mainly achieved by reducing cement content and increasing fly ash content, but its predicted strength is only 21.6 MPa, making it more suitable as a candidate direction for low-strength or non-structural scenarios. The balanced compromise mixture (ID 3) provides a more balanced trade-off among predicted strength, GWP, and cost, with a predicted strength of 63.0 MPa, GWP of 141.0 kg CO2e/m3, and material cost of 250.7 RMB/m3. Compared with the strength-prioritized mixture, the balanced compromise mixture reduces predicted strength by approximately 21.1%, while reducing GWP and material cost by approximately 57.6% and 33.7%, respectively. The mean 5NN distances of the three representative candidate solutions are 1.885, 2.036, and 2.044. These values do not constitute a strict applicability-domain threshold, but they indicate that the candidate solutions are not simple repetitions of the original samples and are located in relatively sparse regions of the variable-combination space.
It should be emphasized that, although the candidate solutions in Table 7 satisfy the basic engineering constraints used in this study, they have not been validated by tests for workability, setting time, strength development, or durability. The additional 5NN analysis indicates that the representative candidates are not simple repetitions of the original samples but are located in relatively sparse regions of the empirical distribution. Therefore, these results should be regarded as model-suggested experimental screening candidates rather than final mix proportions that can be directly used in engineering construction.
The Mendeley PCC external benchmark shows that the UCI source-domain models exhibit substantially increased prediction errors under cross-source conditions. Therefore, although the NSGA-II candidate solutions satisfy the W/B, total binder content, sand ratio, absolute-volume, and variable-bound constraints set in this study, their predicted strengths remain limited by the applicability range of the source-domain model. In particular, genetic algorithms actively search high-objective regions and may generate variable combinations located in sparse parts of the training distribution. The external benchmark shows lower errors for samples within the 5NN applicability domain and higher errors for samples outside it, further indicating that candidate mix screening should not rely only on predicted strength and Pareto-front position. The 5NN distance used here is only an empirical applicability-domain indicator and cannot replace rigorous uncertainty quantification, workability testing, durability testing, or actual trial batching. Therefore, the representative mixtures in Table 7 should be interpreted as candidate directions for subsequent experimental design rather than engineering-validated low-carbon mixture proportions for direct practical application.
4. Conclusions and Future Work
Based on the deduplicated UCI Concrete Compressive Strength dataset, this study developed a leakage-controlled and applicability-domain-aware workflow for concrete compressive strength prediction, model-response attribution, external benchmark validation, and scenario-based candidate mixture screening. The main conclusions are as follows:
- (1)
- Under a unified data split, inner training-set cross-validation, and independent test-set evaluation protocol, TabPFN achieved strong prediction performance on the deduplicated internal UCI test set, with R2, RMSE, MAE, and MAPE values of 0.953, 3.744 MPa, 2.265 MPa, and 7.580%, respectively. However, its advantage over strong baseline models such as CatBoost was limited. Therefore, TabPFN should be positioned as a competitive pretrained tabular prediction model for the current task, rather than as a universally superior model for concrete strength prediction across different data sources.
- (2)
- The external Mendeley PCC benchmark indicates that UCI source-domain models suffer clear performance degradation under cross-source prediction. On 502 non-overlapping external PCC samples, TabPFN achieved R2, RMSE, and MAE values of 0.490, 15.175 MPa, and 11.457 MPa, respectively, which are close to those of random forest, XGBoost, and CatBoost. This result shows that high accuracy on the internal UCI test set cannot be directly equated with cross-source generalization, and that concrete machine learning models should be subjected to external benchmarking and domain-shift checks before being used for mix screening.
- (3)
- Stratified analysis based on variable ranges and 5NN distance shows that the prediction error of external samples is related to their distance from the UCI source-domain training distribution. For TabPFN, samples within the 95% 5NN applicability domain show better prediction performance, with R2 and RMSE values of 0.634 and 12.367 MPa, respectively. This supports the use of 5NN distance as a simple applicability-domain indicator for identifying samples or candidate mixes with higher prediction risk.
- (4)
- SHAP analysis indicates that cement, slag, curing age, and water are the main attribution variables in the current TabPFN model output, and their response directions are generally consistent with empirical knowledge in concrete technology. However, SHAP reflects only statistical responses learned by the current model under the current data distribution and should not be interpreted as a material causal mechanism, engineering design threshold, or optimal dosage recommendation.
- (5)
- Under constraints on 28 d age, W/B, total binder content, sand ratio, absolute volume, and variable bounds, NSGA-II generated a set of Pareto candidate mixes considering predicted strength, scenario-based GWP, and material cost. Because the UCI dataset was not developed for low-GWP mix screening or life-cycle assessment, and because the external benchmark shows that the model is sensitive to cross-source distribution shift, the candidate solutions obtained in this study should be treated as pre-experimental screening candidates rather than engineering-validated low-carbon concrete mixture proportions.
This study still has clear limitations. First, although the Mendeley PCC external benchmark provides cross-source validation, the screened external samples are mainly used for ordinary PCC strength prediction and cannot fully verify the engineering feasibility of SCM-rich low-GWP candidate mixes. Second, the NSGA-II candidate mixes have not been validated for workability, setting time, early-age strength, long-term strength, durability, or code compliance. Third, 5NN distance provides only an empirical applicability-domain indication and cannot replace formal prediction intervals, uncertainty quantification, or reliability thresholds. Future work should incorporate multi-source trial-batch datasets, workability and durability labels, code-based constraints, multiobjective uncertainty optimization, and closed-loop experimental validation to evaluate the applicability of this workflow in practical concrete mix design. Overall, the main value of this study is to provide a model-auditing and pre-experimental candidate-screening workflow for public concrete datasets, whose outputs can serve as preliminary screening evidence for subsequent trial batching, workability testing, and durability validation.
Author Contributions
Data curation, W.C., Y.L. and L.Z.; formal analysis, W.C. and Y.L.; methodology, L.Z. and X.Z.; investigation, X.Z.; resources, L.Z. and W.Z.; writing—review and editing, Y.Z.; supervision, Y.L., Y.Z., W.Z. and B.D.; funding acquisition, B.D. All authors have read and agreed to the published version of the manuscript.
Funding
Science and Technology Development Projects of the Silk Road Economic Belt Innovation-Driven Development Pilot Zone and the Urumqi-Changji-Shijiang National Independent Innovation Demonstration Zone: No. 2023LQ03002; Urumqi City’s “Hongshan Science and Technology Innovation Talent” Attraction Program: B241013012.
Data Availability Statement
The source datasets analyzed in this study are publicly available. The UCI Concrete Compressive Strength dataset is available from the UCI Machine Learning Repository at https://doi.org/10.24432/C5PK67 (accessed on 24 May 2026). The external PCC benchmark data were derived from the Mendeley Data dataset “Data for Life Cycle Assessment and Production Cost of Geopolymer Concrete: A Meta-Analysis”, Version 1, available at https://doi.org/10.17632/7ns5bvy6ry.1 (accessed on 24 May 2026).
Conflicts of Interest
Authors Liukui Zhu, Weifei Zhao, Xiaofang Zhao and Baoyu Dong were employed by the company Xinjiang Traffic Detection and Certification Co., Ltd. respectively Xinjiang Road and Bridge Construction Group Co., Ltd. The remaining authors declare that the research was conducted in the absence of any commercial or financial relationships that could be construed as a potential conflict of interest.
References
- Mehta, P.K.; Monteiro, P.J.M. Concrete: Microstructure, Properties, and Materials, 3rd ed.; McGraw-Hill Education: New York, NY, USA, 2006. [Google Scholar]
- Habert, G.; Miller, S.A.; John, V.M.; Provis, J.L.; Favier, A.; Horvath, A.; Scrivener, K.L. Environmental impacts and decarbonization strategies in the cement and concrete industries. Nat. Rev. Earth Environ. 2020, 1, 559–573. [Google Scholar] [CrossRef] [Scilit]
- Monteiro, P.J.M.; Miller, S.A.; Horvath, A. Towards sustainable concrete. Nat. Mater. 2017, 16, 698–699. [Google Scholar] [CrossRef] [Scilit]
- Scrivener, K.L.; John, V.M.; Gartner, E.M. Eco-efficient cements: Potential economically viable solutions for a low-CO2 cement-based materials industry. Cem. Concr. Res. 2018, 114, 2–26. [Google Scholar] [CrossRef] [Scilit]
- ACI Committee 211. ACI PRC-211.1-22; Selecting Proportions for Normal-Density and High-Density Concrete-Guide. American Concrete Institute: Farmington Hills, MI, USA, 2022.
- Chaabene, W.B.; Flah, M.; Nehdi, M.L. Machine learning prediction of mechanical properties of concrete: Critical review. Constr. Build. Mater. 2020, 260, 119889. [Google Scholar] [CrossRef] [Scilit]
- Li, Z.; Yoon, J.; Zhang, R.; Rajabipour, F.; Srubar, W.V., III; Dabo, I.; Radlinska, A. Machine learning in concrete science: Applications, challenges, and best practices. npj Comput. Mater. 2022, 8, 127. [Google Scholar] [CrossRef] [Scilit]
- Farooq, F.; Ahmed, W.; Akbar, A.; Aslam, F.; Alyousef, R. Predictive modeling for sustainable high-performance concrete from industrial wastes: A comparison and optimization of models using ensemble learners. J. Clean. Prod. 2021, 292, 126032. [Google Scholar] [CrossRef] [Scilit]
- Chen, J.; Bao, Y. Effect of dataset representation bias on generalizability of machine learning models in predicting flexural properties of ultra-high-performance concrete (UHPC) beams. Eng. Struct. 2025, 326, 119508. [Google Scholar] [CrossRef] [Scilit]
- Kaufman, S.; Rosset, S.; Perlich, C.; Stitelman, O. Leakage in data mining: Formulation, detection, and avoidance. ACM Trans. Knowl. Discov. Data 2012, 6, 15. [Google Scholar] [CrossRef] [Scilit]
- Hollmann, N.; Müller, S.; Purucker, L.; Krishnakumar, A.; Körfer, M.; Hoo, S.B.; Hutter, F. Accurate predictions on small data with a tabular foundation model. Nature 2025, 637, 319–326. [Google Scholar] [CrossRef] [Scilit]
- Lu, W.T.; Wang, Z.Z.; Zhao, X.Y. More trustworthy prediction of elastic modulus of recycled aggregate concrete using MCBE and TabPFN. Materials 2025, 18, 5221. [Google Scholar] [CrossRef] [Scilit]
- Lundberg, S.M.; Lee, S.I. A unified approach to interpreting model predictions. Adv. Neural Inf. Process. Syst. 2017, 30, 4768–4777. [Google Scholar]
- Molnar, C. Interpretable Machine Learning: A Guide for Making Black Box Models Explainable, 2nd ed.; Leanpub: Victoria, BC, Canada, 2022. [Google Scholar]
- Almutairi, A. Explainable machine learning-based prediction of compressive strength in sustainable recycled aggregate self-compacting concrete using SHAP analysis. Sustainability 2025, 17, 11334. [Google Scholar] [CrossRef] [Scilit]
- Deb, K.; Pratap, A.; Agarwal, S.; Meyarivan, T. A fast and elitist multiobjective genetic algorithm: NSGA-II. IEEE Trans. Evol. Comput. 2002, 6, 182–197. [Google Scholar] [CrossRef] [Scilit]
- Zhang, J.; Huang, Y.; Wang, Y.; Ma, G. Multi-objective optimization of concrete mixture proportions using machine learning and metaheuristic algorithms. Constr. Build. Mater. 2020, 253, 119208. [Google Scholar] [CrossRef] [Scilit]
- Fan, M.; Li, Y.; Shen, J.; Jin, K.; Shi, J. Multi-objective optimization design of recycled aggregate concrete mixture proportions based on machine learning and NSGA-II algorithm. Adv. Eng. Softw. 2024, 192, 103631. [Google Scholar] [CrossRef] [Scilit]
- Grinsztajn, L.; Oyallon, E.; Varoquaux, G. Why do tree-based models still outperform deep learning on typical tabular data? Adv. Neural Inf. Process. Syst. 2022, 35, 507–520. [Google Scholar]
- Yeh, I.C. Modeling of strength of high-performance concrete using artificial neural networks. Cem. Concr. Res. 1998, 28, 1797–1808. [Google Scholar] [CrossRef] [Scilit]
- Yeh, I.-C. Concrete Compressive Strength; UCI Machine Learning Repository: Irvine, CA, USA, 1998. [Google Scholar] [CrossRef]
- Periasamy, J.K.; Latha, B. Efficient hash function-based duplication detection algorithm for data deduplication, deduction and reduction. Concurr. Comput. Pract. Exp. 2021, 33, e5213. [Google Scholar] [CrossRef] [Scilit]
- Ahsan, M.M.; Mahmud, M.A.P.; Saha, P.K.; Gupta, K.D.; Siddique, Z. Effect of data scaling methods on machine learning algorithms and model performance. Technologies 2021, 9, 52. [Google Scholar] [CrossRef] [Scilit]
- Martinez, A.; Miller, S. Data for “Life Cycle Assessment and Production Cost of Geopolymer Concrete: A Meta-Analysis”; Mendeley Data, V1; University of California Davis: Davis, CA, USA, 2024. [Google Scholar] [CrossRef]
- Silverman, B.W. Density Estimation for Statistics and Data Analysis; Routledge: London, UK, 2018. [Google Scholar] [CrossRef] [Scilit]
- Benesty, J.; Chen, J.; Huang, Y.; Cohen, I. Pearson correlation coefficient. In Noise Reduction in Speech Processing; Springer: Berlin/Heidelberg, Germany, 2009; pp. 1–4. [Google Scholar] [CrossRef] [Scilit]
- Barbudo, A.; de Brito, J.; Evangelista, L.; Bravo, M.; Agrela, F. Influence of water-reducing admixtures on the mechanical performance of recycled concrete. J. Clean. Prod. 2013, 59, 93–98. [Google Scholar] [CrossRef] [Scilit]
- Smola, A.J.; Schölkopf, B. A tutorial on support vector regression. Stat. Comput. 2004, 14, 199–222. [Google Scholar] [CrossRef] [Scilit]
- Breiman, L. Random forests. Mach. Learn. 2001, 45, 5–32. [Google Scholar] [CrossRef] [Scilit]
- Chen, T.; Guestrin, C. XGBoost: A scalable tree boosting system. In Proceedings of the 22nd ACM SIGKDD International Conference on Knowledge Discovery and Data Mining, San Francisco, CA, USA, 13–17 August 2016; pp. 785–794. [Google Scholar] [CrossRef] [Scilit]
- Ke, G.; Meng, Q.; Finley, T.; Wang, T.; Chen, W.; Ma, W.; Ye, Q.; Liu, T.Y. LightGBM: A highly efficient gradient boosting decision tree. Adv. Neural Inf. Process. Syst. 2017, 30, 3149–3157. [Google Scholar]
- Prokhorenkova, L.; Gusev, G.; Vorobev, A.; Dorogush, A.V.; Gulin, A. CatBoost: Unbiased boosting with categorical features. Adv. Neural Inf. Process. Syst. 2018, 31, 6639–6649. [Google Scholar]
- Snoek, J.; Larochelle, H.; Adams, R.P. Practical Bayesian optimization of machine learning algorithms. Adv. Neural Inf. Process. Syst. 2012, 25, 2951–2959. [Google Scholar]
- Bi, J.; Bennett, K.P. Regression error characteristic curves. In Proceedings of the 20th International Conference on Machine Learning (ICML-03), Washington, DC, USA, 21–24 August 2003; pp. 43–50. [Google Scholar]
- Nikoopayan Tak, M.S.; Feng, Y.; Mahgoub, M. Advanced machine learning techniques for predicting concrete compressive strength. Infrastructures 2025, 10, 26. [Google Scholar] [CrossRef] [Scilit]
- Abioye, S.O.; Babatunde, Y.O.; Abikoye, O.A.; Shaibu, A.N.; Bankole, B.J. Optimized machine learning algorithms with SHAP analysis for predicting compressive strength in high-performance concrete. AI Civ. Eng. 2025, 4, 16. [Google Scholar] [CrossRef] [Scilit]
- Neville, A.M. Properties of Concrete, 5th ed.; Pearson: London, UK, 2011. [Google Scholar]
- Lothenbach, B.; Scrivener, K.; Hooton, R.D. Supplementary cementitious materials. Cem. Concr. Res. 2011, 41, 1244–1256. [Google Scholar] [CrossRef] [Scilit]
- Shen, W.; Cao, L.; Li, Q.; Zhang, W.; Wang, G.; Li, C. Quantifying CO2 emissions from China’s cement industry. Renew. Sustain. Energy Rev. 2015, 50, 1004–1012. [Google Scholar] [CrossRef] [Scilit]
- Hammond, G.P.; Jones, C.I. Embodied energy and carbon in construction materials. Proc. Inst. Civ. Eng. Energy 2008, 161, 87–98. [Google Scholar] [CrossRef] [Scilit]
- Schiefer, C.; Plank, J. CO2 emission of polycarboxylate superplasticizers (PCEs) used in concrete. J. Clean. Prod. 2023, 427, 138785. [Google Scholar] [CrossRef] [Scilit]
- Flower, D.J.M.; Sanjayan, J.G. Green house gas emissions due to concrete manufacture. Int. J. Life Cycle Assess. 2007, 12, 282–288. [Google Scholar] [CrossRef]

Disclaimer/Publisher’s Note: The statements, opinions and data contained in all publications are solely those of the individual author(s) and contributor(s) and not of MDPI and/or the editor(s). MDPI and/or the editor(s) disclaim responsibility for any injury to people or property resulting from any ideas, methods, instructions or products referred to in the content. |
© 2026 by the authors. Licensee MDPI, Basel, Switzerland. This article is an open access article distributed under the terms and conditions of the Creative Commons Attribution (CC BY) license.