1. Introduction
The global post-industrial transformation has left behind a large amount of waterfront industrial land, brownfields, and underused built-up spaces in many large cities. Transforming these spaces into urban parks, waterfront trails, open green spaces, and cultural and leisure spaces has become an important strategy for post-industrial waterfront regeneration [
1,
2]. Such regeneration projects are generally considered to improve ecological quality, enhance public health, increase the supply of public space, and promote the reshaping of urban image and regional economic revitalization [
1,
3].
However, urban greening does not always generate equal social benefits. Environmental improvement may produce a paradoxical outcome known as green gentrification, in which greening projects intended to benefit urban communities increase property values, reshape neighborhood composition, and intensify socio-spatial inequality [
1,
3]. Existing studies on green gentrification have produced rich empirical evidence in European and North American cities [
4,
5,
6,
7,
8], but Chinese cities remain insufficiently examined. Unlike the more typical market-driven gentrification observed in many Western contexts, green space development in China’s post-industrial areas is often embedded in government-led urban regeneration, land redevelopment, industrial upgrading, and city branding. Local governments are not only planners and builders of public space, but also important actors in the reorganization of land value and spatial reproduction [
9,
10,
11]. Therefore, green gentrification in the Chinese context cannot be understood simply as a replication of Western experience. It must be interpreted in relation to state-led regeneration, the land system, housing tenure, hukou stratification, and developmentalist expectations [
12,
13,
14].
Most existing research has focused on the objective identification of green gentrification, including changes in housing prices, population structure, land value, and green space distribution [
4,
12,
15,
16]. These indicators are essential for determining whether urban greening is accompanied by socio-spatial upgrading. However, from the perspective of planning and design evaluation, it is equally important to examine how residents perceive, interpret, and respond to regeneration. Post-industrial waterfront regeneration is not merely a physical transformation of derelict industrial land into attractive open space—it is also a process through which public accessibility, spatial justice, heritage memory, everyday use, and community belonging are redistributed. Therefore, the evaluation of such projects should not be limited to landscape quality, visitor numbers, land-value appreciation, or image enhancement. It should also include residents’ perceptions, place attachment, social acceptability, and the potential exclusionary effects of regeneration.
This perspective is particularly relevant to built-environment research because planning and design decisions shape not only the physical quality of urban space, but also the social relationships, everyday practices, and emotional meanings associated with that space. In post-industrial waterfront areas, the same green infrastructure may be perceived by some residents as an improvement in environmental quality and urban vitality, while being perceived by others as a sign of rising living costs, cultural displacement, and the weakening of existing neighborhood networks [
17,
18,
19]. If research only identifies whether green gentrification has occurred, but does not examine how residents understand and evaluate this process, it becomes difficult to explain why some residents continue to support green space development despite potential displacement risks. It also becomes difficult to provide practical evidence for more inclusive planning, participatory design, and post-occupancy evaluation of regenerated public spaces.
In terms of public attitude measurement, the Gentrification Worldview Instrument (GWI) provides an important tool for quantitatively analyzing residents’ attitudes toward gentrification [
20]. This scale divides gentrification worldviews into three dimensions: neighborhood preservation, development support, and social integration. It has been used to explain residents’ support for park construction, urban development, and neighborhood change [
18,
19]. However, the GWI has mainly been applied in North American cities, and its cross-cultural applicability remains to be tested [
19,
20]. In the context of urban regeneration in China, residents’ understanding of “development” involves not only commercial development, real estate appreciation, and population replacement, but also expectations of government planning, public investment, and urban modernization [
9,
10,
21]. Directly transplanting the original scale may therefore fail to capture the more complex psychological structure through which Chinese residents evaluate regeneration.
Based on this, this study takes Shanghai’s Yangpu Riverside as a case and combines the neighborhood-level identification of socio-spatial patterns associated with green gentrification with the measurement of residents’ subjective attitudes. Yangpu Riverside is an important post-industrial waterfront regeneration area in central Shanghai. It has long hosted industrial functions such as textiles, shipbuilding, water supply, and power generation, and has formed a large number of workers’ communities and work unit living spaces [
22,
23]. Since the beginning of the twenty-first century, industrial transformation, the opening of riverside public space, and the regeneration of industrial heritage have gradually transformed the area from an “industrial rust belt” into an urban regeneration demonstration area integrating public green space, cultural leisure, technological innovation, and high-end residence [
24,
25]. Yangpu Riverside is therefore a typical case for observing green gentrification in China’s post-industrial waterfront areas and an ideal site for examining how residents understand the relationship between regeneration benefits, community preservation, spatial justice, and green space development.
This study adopts a sequential mixed-methods design. First, based on census data, housing price data, and green space data from 2000, 2010, and 2020, the study identifies the socio-spatial characteristics of green gentrification in Yangpu Riverside. Second, the GWI is cross-culturally adapted, and localized items are added to reflect the Chinese urban regeneration context. Third, based on 317 resident questionnaires, the reliability and validity of the Chinese-adapted GWI are tested, and the relationships among gentrification worldviews, place attachment, and support for waterfront green space development are analyzed. Specifically, this study addresses the following four research questions:
RQ1. Between 2000 and 2020, what housing-market, educational-composition, and population changes associated with green gentrification were observed in and around Shanghai’s Yangpu Riverside?
RQ2. Does the cross-culturally adapted Chinese version of the GWI have acceptable reliability and validity in the context of urban regeneration in China?
RQ3. What are the structural characteristics of Yangpu Riverside residents’ gentrification worldviews, place attachment, and support for green space development?
RQ4. How are gentrification worldviews and place attachment jointly associated with residents’ support for waterfront green space development?
2. Literature Review and Research Hypotheses
2.1. Green Gentrification: Concepts, Mechanisms, and Identification
As a core issue emerging in the fields of urban studies and environmental justice in the early 21st century, “green gentrification” describes a profound spatial and social paradox: the construction of urban green spaces (such as large parks, greenways, and waterfront space regeneration), which are intended to improve environmental quality and enhance public health, may instead trigger or accelerate the gentrification process of surrounding communities, which is manifested in rising housing prices, the migration of high-income and highly educated groups, and the marginalization or direct displacement of original low-income residents at the material and cultural levels, ultimately exacerbating rather than alleviating social spatial inequality [
1,
3]. However, this paradox does not imply that urban greening is inherently undesirable. Rather, it draws attention to how the benefits, costs, and decision-making power associated with environmental improvement are socially and spatially distributed. This concern is consistent with integrated sustainability research, which argues that environmental performance should be evaluated together with social equity, vulnerability, governance, policy implementation, and community participation [
26].
Empirical identification of green gentrification generally relies on three groups of indicators. The first concerns changes in green space or environmental amenities, including the construction of parks, greenways, waterfront open spaces, and increases in green space coverage. The second concerns real-estate and land-market change, including housing prices, rents, land values, and redevelopment activity. The third concerns changes in neighborhood socioeconomic composition, such as increases in highly educated or higher-income residents and decreases in lower-income or otherwise vulnerable groups [
4,
5,
6,
7]. Early studies primarily used qualitative case studies and before-and-after census comparisons, whereas more recent research has employed longitudinal spatial models, difference-in-differences designs, propensity-score matching, Bayesian models, vulnerability indices, and machine-learning approaches [
4,
27,
28,
29].
These methodological developments demonstrate that green gentrification does not occur uniformly across all projects or neighborhoods. The effects associated with greening may vary according to park size, function and design, proximity to the city center, pre-existing green space provision, affordable-housing supply, initial socioeconomic conditions, and concurrent public or private investment [
8,
28]. A new green space alone is therefore neither a necessary nor a sufficient condition for neighborhood gentrification. Its social consequences depend on its interaction with broader processes of redevelopment, housing-market change, infrastructure investment, and neighborhood vulnerability.
Overall, existing research has established that urban greening may be associated with housing-market and socioeconomic change, but the strength, timing, and mechanisms of this association remain context-dependent. Green gentrification should therefore be examined within the specific housing system, governance structure, land market, social stratification, and regeneration trajectory of each city [
3,
8,
30].
2.2. Green Gentrification in the Chinese Context
Research on green gentrification in China developed later than the corresponding literature in Europe and North America, but it has expanded substantially in recent years. Existing studies have examined changes in green space accessibility, housing and land prices, educational and hukou composition, neighborhood vulnerability, and the distributional consequences of park and waterfront regeneration [
12,
15,
16,
31]. Recent longitudinal and quasi-experimental studies have provided evidence of spatially uneven green gentrification patterns in Shanghai and other major Chinese urban regions [
12,
15,
16].
Compared with the classic market-centered accounts developed in Western research, green gentrification in China is more directly embedded in state-led land redevelopment, infrastructure provision, industrial restructuring, and place promotion. Local governments may participate through planning, land assembly and transfer, environmental investment, demolition and compensation, industrial introduction, and coordination with private developers [
9,
10,
11]. However, state involvement should not be treated as a uniform mechanism. Recent research shows that government-only, market-led, and multi-actor regeneration projects may produce different social outcomes, and that stronger government involvement may sometimes moderate rather than intensify gentrification [
15]. The effects of state-led regeneration therefore depend on the form of state intervention, its relationship with market actors, and the initial conditions of the affected neighborhood.
China’s housing-tenure and hukou systems further differentiate the benefits and risks associated with regeneration. Housing ownership, compensation eligibility, work unit legacies, access to subsidized housing, and hukou status influence residents’ capacity to benefit from property appreciation or remain in regenerated areas [
13,
14]. Some property-owning local residents may receive replacement housing, compensation, or increased rental and property income, while tenants, migrants, and residents without secure tenure may be more exposed to rising costs or relocation [
21]. Hukou status also affects access to home ownership, mortgage finance, subsidized housing, and housing wealth [
13]. Consequently, redevelopment-related relocation should not automatically be interpreted as equivalent to displacement, and the distributional consequences of regeneration must be examined across different tenure and institutional groups.
Chinese residents may also hold developmentalist expectations toward urban regeneration. Long-term improvements in infrastructure and urban living conditions have contributed to public confidence in government-led development and to the perception of regeneration as an opportunity for modernization, environmental improvement, and neighborhood-value enhancement [
32]. At the same time, demolition, rising living costs, the weakening of neighborhood networks, and the loss of familiar community spaces may generate concerns about displacement, local memory, and social equity [
23]. Public attitudes toward regeneration may therefore combine support for development with concern for neighborhood preservation rather than conforming to a simple opposition between supporters and opponents.
Accordingly, research on green gentrification in China requires both institutionally sensitive spatial analysis and a systematic examination of residents’ attitudes. Existing studies have increasingly documented state-led greening, differentiated neighborhood outcomes, and green space inequality. However, comparatively little research has used a standardized and culturally validated instrument to examine how residents simultaneously evaluate development, neighborhood preservation, and social integration in regenerated areas. This limitation provides the basis for adapting the GWI to the Chinese context.
2.3. The Development of the Gentrification Worldview Instrument
When urban green space projects are implemented in neighborhoods undergoing socioeconomic restructuring, residents may interpret the same project in different ways. Some may regard new green spaces as improvements in environmental quality, public life, and neighborhood value, while others may associate them with rising living costs, commercial replacement, cultural displacement, and the erosion of community identity [
17,
18,
19,
33]. Objective indicators such as housing prices and census composition cannot directly reveal these interpretations. A standardized measure is therefore needed to examine how residents understand gentrification and how these views are associated with support for urban development. The GWI developed by Mullenbach et al. in 2020 fills this gap and becomes the first standardized psychometric tool that has been tested for reliability and validity and is used to measure people’s perceptions of gentrification [
20].
The GWI distinguishes three dimensions. Neighborhood preservation emphasizes the protection of local culture, established businesses, neighborhood relations, and community stability. Development support captures favorable evaluations of new development, commercial investment, higher-value housing, and property-value appreciation. Social integration concerns the coexistence and inclusion of residents from different socioeconomic and social groups [
20]. Previous studies have demonstrated the value of these dimensions in explaining attitudes toward park development and neighborhood change in North American cities [
17,
18,
19,
20].
Nevertheless, the application of GWI is mainly concentrated in the North American context (such as Philadelphia, St. Louis, Salt Lake City, etc.), and its item design is deeply influenced by the experience of gentrification in American cities. Items concerning high-end businesses, racial and ethnic integration, affordable housing, and market-led redevelopment may not have direct experiential or conceptual equivalence in China. Chinese residents’ understanding of redevelopment is also shaped by government planning, public investment, hukou, housing tenure, demolition compensation, and expectations of modernization. Applying the GWI in China therefore requires systematic cross-cultural adaptation and empirical validation rather than literal translation.
2.4. Place Attachment and Support for Green Space Development
Residents’ attitudes toward green space development depend not only on their general beliefs about gentrification, but also on their emotional and functional relationships with specific places [
34]. Place attachment is an important concept in environmental psychology and human geography to explain the relationship between people and places. It usually refers to the emotional, cognitive and functional connections formed between individuals and specific places. Classic studies usually divide place attachment into two dimensions: place identity and place dependence [
35]. Place identity emphasizes the emotional and symbolic connection between an individual and a place, that is, whether a place carries an individual’s memory, identity, sense of belonging and self-understanding. Place dependence emphasizes the degree to which a place meets the daily activities and functional needs of individuals, that is, whether a certain place provides residents with convenient conditions for leisure, communication, life services and daily activities [
36].
In the context of regeneration, place attachment may shape support in different ways. Residents with strong place identity may support a project when it is perceived as preserving local history, industrial heritage, collective memory, and meaningful public life. However, the same attachment may generate place-protective concern or opposition when redevelopment is perceived as threatening to neighborhood continuity or replacing familiar community meanings [
34,
37,
38,
39]. Place dependence may be positively associated with support when regenerated green space improves opportunities for walking, exercise, leisure, social interaction, and other everyday activities [
35,
36]. Heritage-led regeneration research similarly emphasizes that physical improvement should be reconciled with historical identity, accessibility, inclusivity, and contemporary community needs [
40].
Place attachment is also relevant to indirect or symbolic displacement. Residents may remain physically in a neighborhood while experiencing the loss of familiar businesses, meeting places, social networks, cultural references, or everyday rhythms [
37,
38,
39,
41]. Research has described these processes as cultural displacement, political displacement, symbolic displacement, place loss, or the slow violence of neighborhood change [
39,
42,
43]. In Shanghai, prolonged or suspended redevelopment may similarly produce uncertainty, deterioration, weakened community relations, and feelings of losing one’s place among residents who remain [
23]. These experiences differ from actual residential displacement, which requires evidence that specific residents moved or were forced to relocate. Place attachment therefore provides a conceptual connection between neighborhood transformation, residents’ interpretations of regeneration, and support for waterfront green space development.
2.5. Research Gap and Research Hypotheses
The preceding review shows that green gentrification research has developed across several related fields. Spatial and longitudinal studies identify housing-market and demographic changes associated with urban greening; institutional studies explain the roles of the state, market, land development, and housing tenure in China; GWI research provides standardized measures of beliefs about neighborhood change; and place-attachment research examines emotional, functional, and symbolic responses to spatial transformation.
Table 1 synthesizes the main advances and remaining limitations of these research strands and clarifies the position of the present study.
Against this body of scholarship, the main research gap is integrative rather than simply geographical. Recent studies have already provided longitudinal and quasi-experimental evidence of green gentrification and uneven green space accessibility in China, including Shanghai. However, neighborhood-level studies of socio-spatial change rarely connect their findings with standardized evidence on how residents interpret development, neighborhood preservation, and social inclusion. The GWI has not been sufficiently adapted and validated for a Chinese institutional context in which attitudes toward redevelopment are shaped by government planning, public investment, hukou, housing tenure, demolition compensation, and developmentalist expectations. Moreover, place attachment and indirect displacement have generally been examined separately from gentrification worldviews and support for post-industrial waterfront green space. Although previous studies of Yangpu Riverside have documented industrial restructuring, redevelopment, community change, and place loss, they have not combined neighborhood-level temporal indicators with a validated multidimensional model of the attitudes of surveyed and remaining residents.
This study addresses these gaps in four ways. Empirically, it examines housing-price, educational-composition, and population changes across 314 neighborhood committees in 2000, 2010, and 2020, with detailed attention to 58 neighborhood committees near Yangpu Riverside. Methodologically, it cross-culturally adapts and validates the GWI and combines neighborhood-level spatial evidence with a questionnaire survey. Conceptually, it develops an institutionally embedded account of green gentrification that links state-led spatial production and land-value capitalization with residents’ developmental, preservation-oriented, and integration-oriented worldviews, place attachment, and support for waterfront green space development. From a planning perspective, it connects environmental improvement with social equity, local memory, accessibility, and residents’ perceptions.
Based on the above literature, this study constructs a research hypothesis integrating GWI and place attachment to explain residents’ support for the construction of post-industrial waterfront green space. This hypothesis consists of three core sets of relationships:
First, the gentrification worldviews are expected to be associated with residents’ support for green space development. Among them, development support reflects residents’ positive attitudes towards urban regeneration, space improvement, commercial access and value enhancement, and is expected to be positively associated with support for green space development; neighborhood preservation reflects residents’ emphasis on community culture, local commerce and neighborhood stability, which is expected to have a negative impact on support, or make residents maintain a more cautious attitude towards green space development; social integration reflects residents’ recognition of mixed living and shared urban space by different social groups, and its direction of influence may depend on whether residents understand green space development as promoting inclusive sharing or exacerbating exclusion [
17,
18,
19].
Second, place attachment is expected to be associated with residents’ support for green space development. The stronger the place identity, the more likely residents are to pay attention to whether green space development continues local significance and community memory [
37]; the stronger the place dependence, the more likely residents are to evaluate green space development from the perspective of daily use and functional improvement [
35,
36]. If the updated waterfront green space can be perceived by residents as a meaningful, useful, accessible and shareable place, place attachment may enhance resident support [
34].
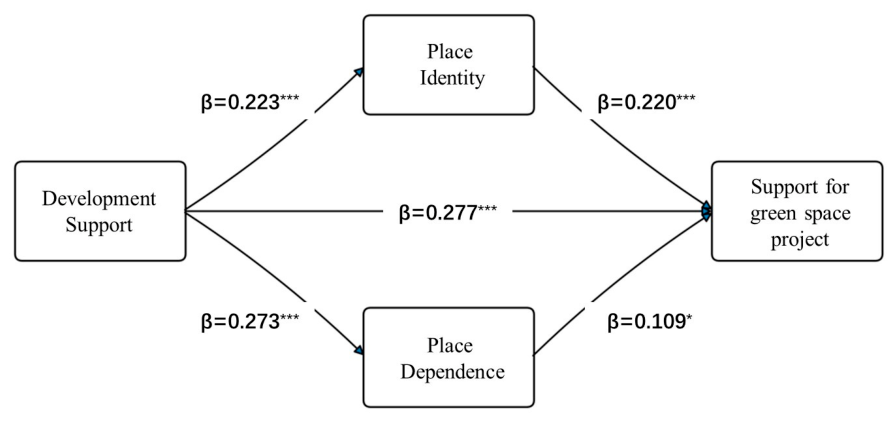
Third, place attachment may play a mediating role between development support and green space development support. In other words, residents’ positive perceptions of urban development and spatial renewal may further enhance their support for green space development by enhancing their emotional identification and functional dependence on the updated waterfront space [
17,
36]. For post-industrial waterfront regeneration areas such as Yangpu Riverside, green space development not only changes the physical space, but also reshapes the relationship between residents and the place. Therefore, development support not only directly promotes project support, but may also play an indirect role through the psychological mechanism of place attachment.
3. Study Area: Shanghai’s Yangpu Riverside
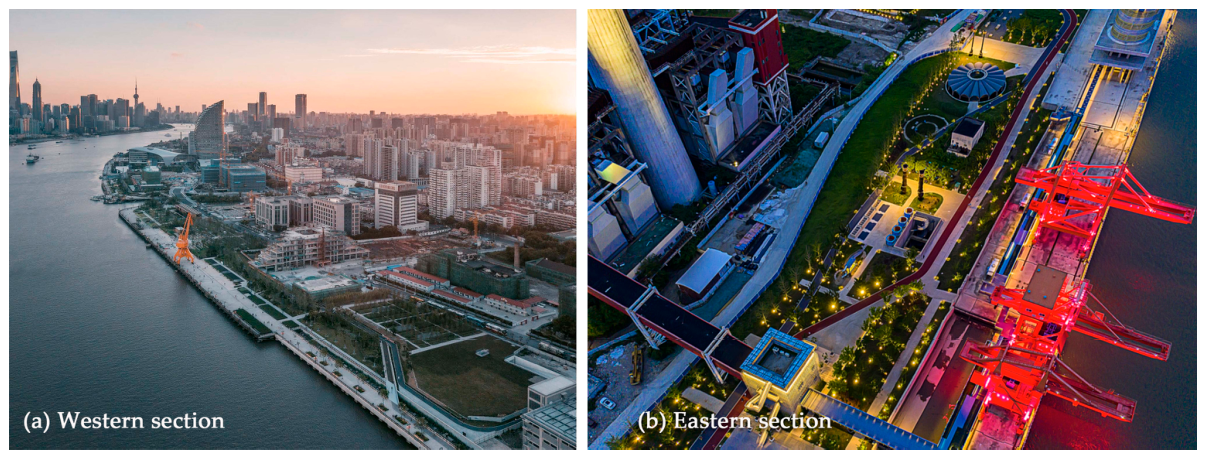
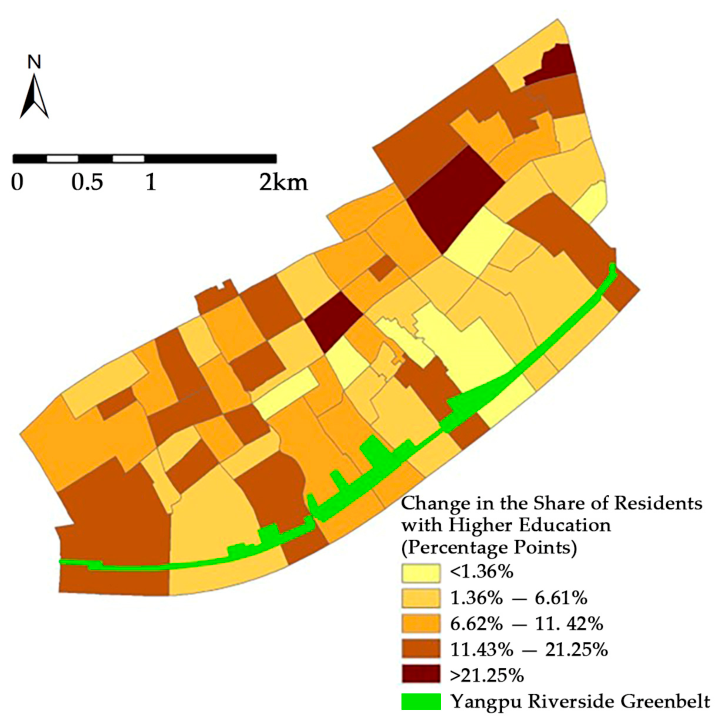
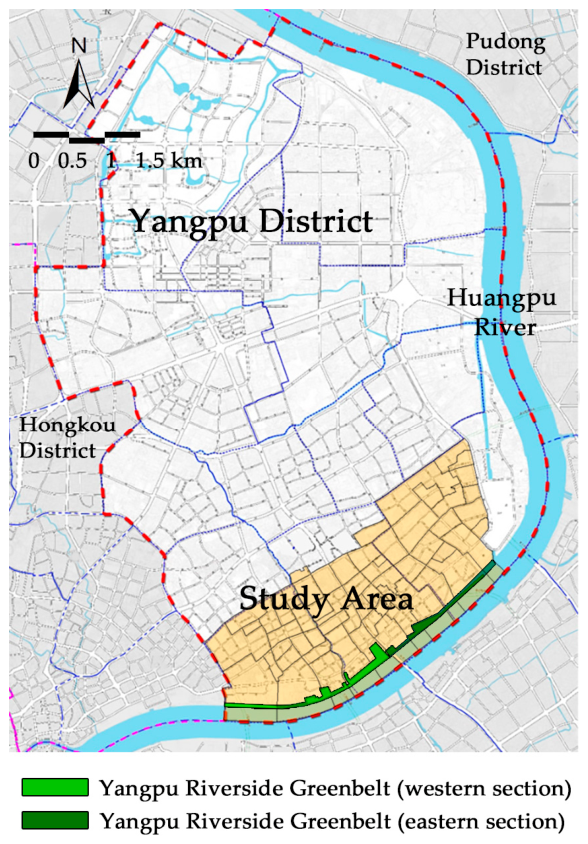
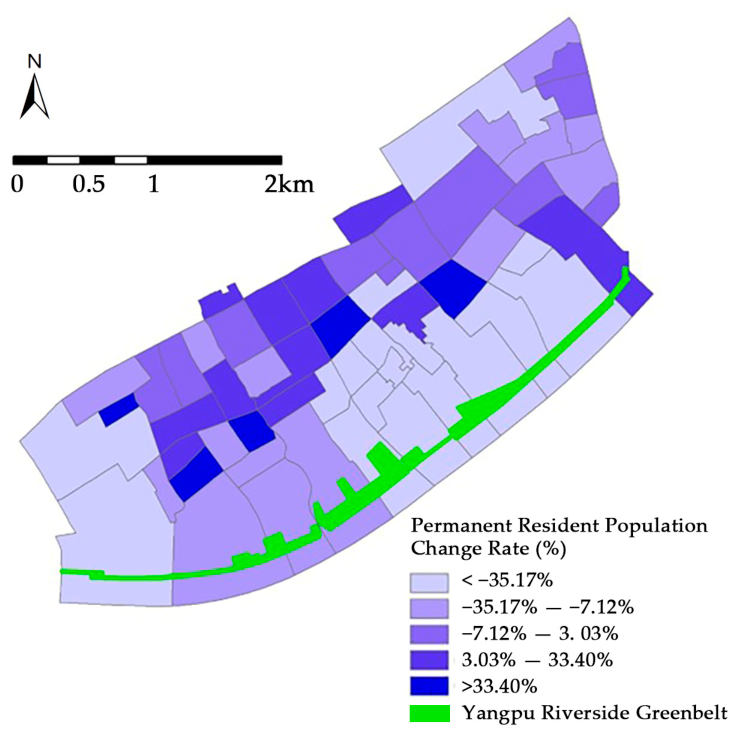
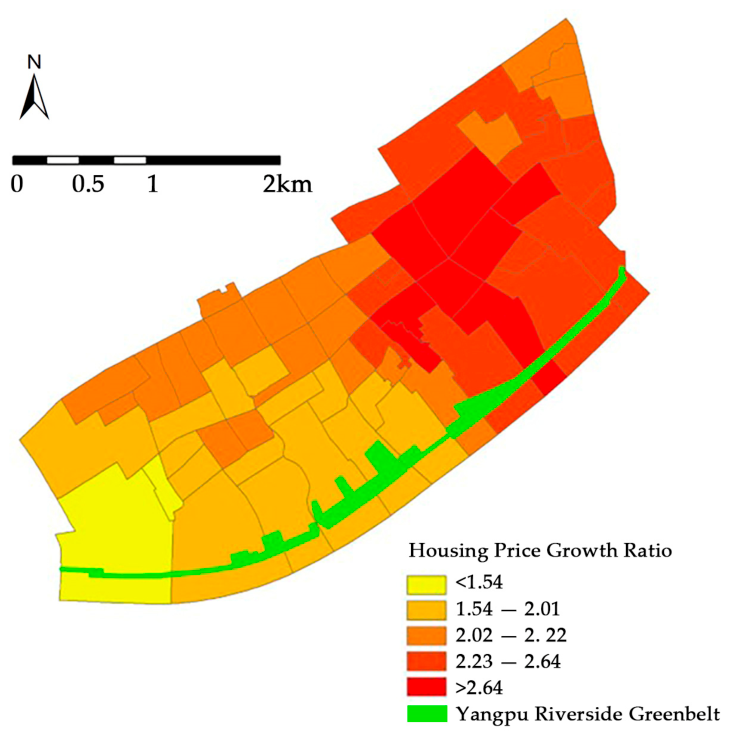
The research scope of this study is the communities within 1.5 km of Yangpu Riverside Greenbelt in Yangpu District, including a total of 58 neighborhood committees with a total area of approximately 9.7 square kilometers. This area is located on the northwest bank of the Huangpu River in Shanghai. The total length of public green space along the riverside is about 5.5 km. The 2.8 km western section was completed and opened in October 2017, and the 2.7 km eastern section was completed and opened in September 2019 (
Figure 1 and
Figure 2).
Since the 1880s, industrial enterprises such as textiles, shipbuilding, water supply, and power generation have gradually gathered in the Yangpu Riverside area, becoming one of the important birthplaces of modern Chinese industry [
22]. After the founding of the People’s Republic of China in 1949, along with the nationalization process and the establishment of the work unit system, a large number of worker communities around factories were included in the work unit welfare system, forming many typical worker communities where industrial production and workers’ living spaces are highly integrated [
23]. At the beginning of the 21st century, driven by Shanghai’s urban development and industrial structure adjustment, large-scale factories in the area gradually moved to suburban industrial parks or other provinces and cities. The Yangpu District Government immediately launched a series of riverside industrial zone regeneration plans [
24]. Against this background, some scattered commercial real estate development projects began to appear. Some worker communities experienced land acquisition and demolition processes, while other communities faced the suspension of demolition due to capital divestment [
23]. In 2019, according to the Yangpu Riverside Development Master Plan, 5.5 km of public space and green space in the southern section of Yangpu Riverside were fully completed and opened to the public [
25,
44]. In November of the same year, Chinese President Xi Jinping inspected the area, elevated the construction of Yangpu Riverside Greenbelt and the regeneration of surrounding industrial land to a national strategic level, and elaborated on the important concept of “People’s City”. Since then, the area has attracted a large amount of commercial and cultural investment. Many large-scale technology company headquarters have moved in one after another. Multiple high-end residential projects have been launched. Many villa areas with low floor area ratios and building height limits of less than 15 m are being planned and developed [
45,
46].
Although the transformation of the physical space of Yangpu Riverside has been widely praised, its social consequences are quite complex. The construction of high-quality green spaces and cultural and commercial facilities has been accompanied by a sharp increase in surrounding housing prices, a shift in the demographic structure towards high-income and highly educated residents, and the gradual replacement of long-standing working-class neighborhoods—both direct and indirect displacements [
23]. The large-scale construction of urban green space and the intense gentrification process make Yangpu Riverside an ideal case site to study green gentrification and its impact on the perceptions of affected residents.
4. Research Design and Methods
4.1. Identification of Green Gentrification in Yangpu Riverside
Green gentrification usually refers to the process in which environmental improvement projects such as urban greening, waterfront space regeneration, and parks or greenways enhance the attractiveness of a region, which further triggers an increase in housing prices, the entry of groups with a higher socioeconomic status, and the displacement or marginalization of original disadvantaged groups. Existing research emphasizes that quantitative identification should not rely on a single indicator, but should integrate multiple dimensions such as the housing market, socioeconomic structure, and population changes for cross-validation [
45].
This study uses 314 neighborhood committees in Yangpu District as the spatial unit of analysis. The neighborhood committee boundaries are based on the most recent administrative boundaries adopted in the 2020 population census. Because some neighborhood committee units in Shanghai were merged or divided between 2000 and 2020, the 2020 boundaries do not completely correspond to the 2000 and 2010 census boundaries. To ensure temporal comparability, we carefully checked boundary changes for each neighborhood committee across the three census years. For neighborhood committees that had been formed through the merger of multiple earlier units by 2020, the corresponding 2000 and 2010 census data were aggregated from the relevant earlier neighborhood committees. For neighborhood committees that had been split from a larger earlier unit by 2020, the corresponding 2000 and 2010 census data were allocated proportionally according to the administrative area. This harmonization procedure allowed all census and housing-price indicators to be analyzed using a consistent set of 314 neighborhood committees based on the 2020 boundary system.
Housing-price data were compiled from three sources. The 2000 housing-price data were obtained from the declared base prices of 540 residential developments reported in the Shanghai Real Estate Yearbook. The 2010 housing-price data were derived from transaction records of 981 newly opened residential developments in Shanghai compiled by the China Index Academy. The 2020 housing-price data were collected from average community-level transaction prices reported by Ke Holdings Inc in 2020. For each year, the spatial location of each housing-price observation was identified using geographic coordinates. The point-based housing-price data were then interpolated in QGIS (V3.34 LTR) using the ordinary kriging method to generate raster surfaces of housing prices for 2000, 2010, and 2020. Zonal statistics were subsequently used to calculate the average residential housing price for each of the 314 neighborhood committees in Yangpu District. Housing-price values were expressed in nominal terms and were not adjusted for inflation.
Green space exposure was measured by the spatial distance between each neighborhood committee and the Yangpu Riverside Greenbelt. Neighborhood committees were classified into four distance bands: 0–500 m, 501–1000 m, 1001–1500 m, and more than 1500 m from the greenbelt. Among the 314 neighborhood committees in Yangpu District, 58 are located within 1500 m of the Yangpu Riverside Greenbelt, while the remaining 256 are located outside this buffer and are used as a district-level comparison group. The 1500 m threshold was selected for both planning and empirical reasons. In Shanghai’s “15 min community life circle” planning framework, the accessibility of public service facilities, including green spaces, is commonly evaluated within a 15–20 min walking distance, which approximately corresponds to 1500 m. In addition, 1500 m is also a commonly used buffer distance in green space accessibility studies. Therefore, this study adopts the 1500 m threshold as a policy-relevant and literature-consistent measure of near-waterfront green space exposure.
In terms of indicator selection, this study refers to the two core characteristics of green gentrification research on the rise in housing prices and the migration of groups with higher socioeconomic status, and selects housing price, housing price growth, share of residents with higher education, the increase in the share of residents with higher education, and the change rate of the permanent resident population as the main observation indicators [
16]. Among them, the permanent resident population change rate is used to determine the spatial reorganization process that may be related to demolition, new house construction, and population return. However, it is not treated as direct evidence of actual displacement. Population decline may reflect multiple processes, including demolition and relocation, temporary vacancy during redevelopment, new housing construction, changes in household size, population aging, population return, and statistical effects caused by boundary adjustment. Therefore, this indicator is interpreted cautiously as evidence of population restructuring and potential displacement pressure, rather than as proof of actual displacement.
The specific analysis includes three steps: First, use the Welch independent-samples t-test to compare the 58 neighborhood committees within 1500 m of the Yangpu Riverside Greenbelt with the remaining 256 neighborhood committees in Yangpu District in terms of housing prices, housing-price growth, the share of residents with higher education, changes in the share of residents with higher education, and permanent resident population change across 2000, 2010, and 2020. Second, a stage interaction model is constructed to examine whether neighborhood committees within 1500 m experienced different changes during the 2010–2020 regeneration period compared with the 2000–2010 pre-regeneration baseline and with committees outside the 1500 m buffer. Third, the analysis focuses on the 58 neighborhood committees within the 1500 m buffer to examine the spatial relationship between distance from the waterfront green space and changes in population structure, housing prices, and educational composition.
4.2. Questionnaire Design, GWI Adaptation, and Survey Administration
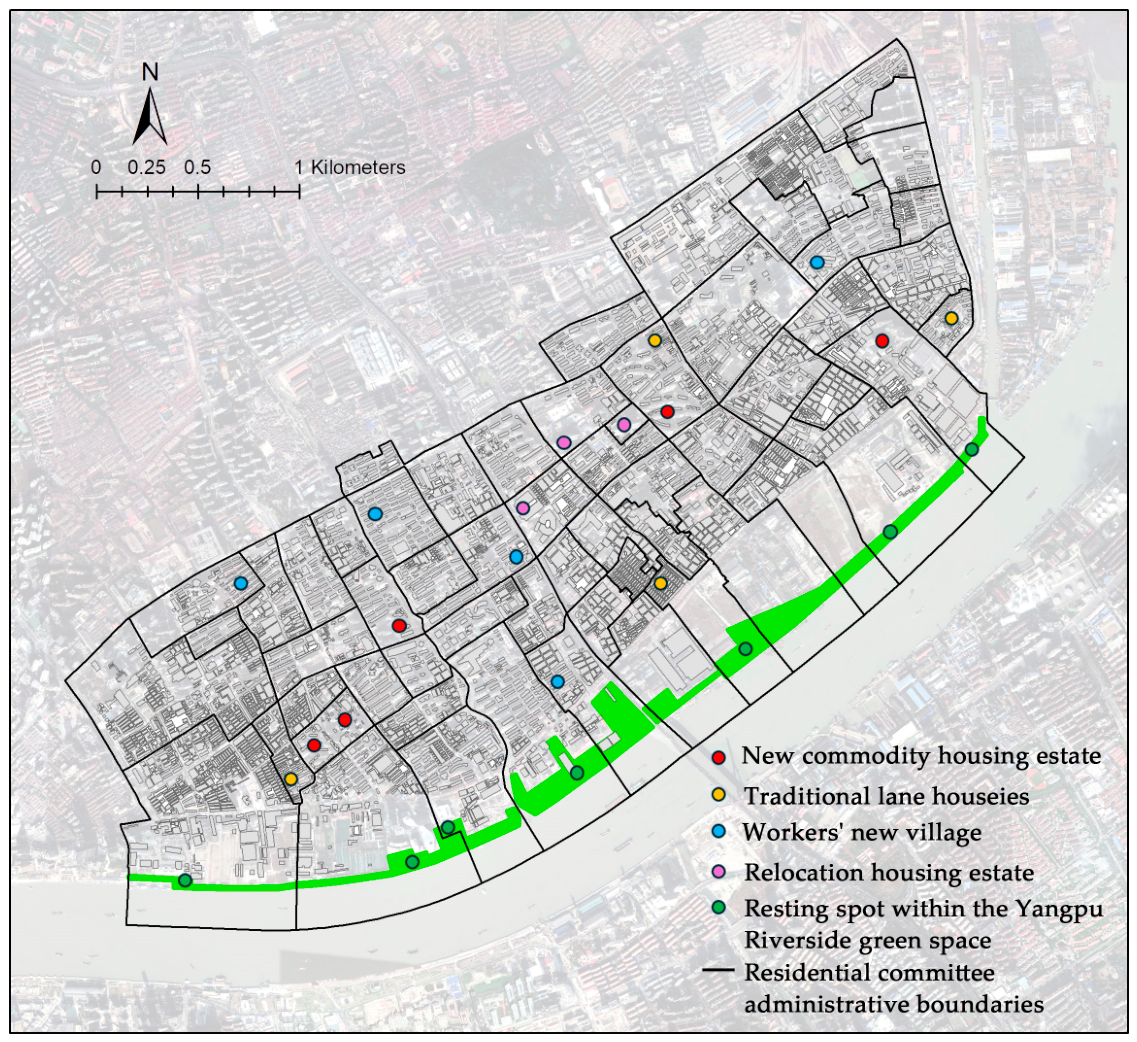
This study was conducted between November 2024 and June 2025. Based on the assessment results of green gentrification in the Yangpu Riverside area, 24 field survey sites were selected, including resting spaces within four types of residential communities—new commodity housing estates, traditional lane houses, workers’ new villages, and relocation housing estates—as well as seven resting spots within the waterfront green space (
Figure 3). Six trained researchers used a purposive sampling technique to administer questionnaire surveys to the target population. Respondents were included if they were at least 18 years old, were able to complete the questionnaire independently, and currently lived within 1.5 km of the Yangpu Riverside Greenbelt. To ensure data quality, an additional questionnaire-validity screening procedure was applied. In the Place Dependence section, Q28 was designed as a reverse-coded item conceptually paired with Q27. After reverse coding, the response direction of Q28 was checked against Q27. Questionnaires showing inconsistent response patterns between these two items were treated as invalid and excluded from the final analysis.
We developed a questionnaire based on a series of questions that have proven validity and reliability. The questionnaire included items on respondents’ support for waterfront green space development, gentrification worldviews, place attachment, and sociodemographic characteristics (see
Appendix A).
Following established cross-cultural adaptation procedures [
47,
48], the original GWI underwent forward translation, synthesis, back-translation, expert-panel review, and cognitive pretesting with nine local residents. The four-member expert panel included specialists in urban planning, environmental psychology, sociology, and community planning. The adaptation focused on semantic, experiential, and conceptual equivalence. Culturally unfamiliar commercial examples were replaced with locally recognizable examples, while the original race- and ethnicity-related social integration item was reformulated in relation to local and non-local hukou status. Full item-level adaptations and their rationales are reported in
Appendix B (
Table A1).
It is worth noting that in the expert panel review and a small sample size of nine people in the cognitive interview pre-test stage, when discussing the development support part, some experts and interviewees pointed out that a series of urban regeneration projects in the Yangpu Riverside area have strong government-led characteristics. The government is not only the planner of the plan, but also the direct leader of land transfer and infrastructure (such as large green spaces) construction [
49]. Urban regeneration is often regarded as a modernization dividend promoted by the government. A “developmentalist consensus”, characterized by public trust in and reliance on government-led development, is relatively common in China [
10]. Moreover, some local residents have received substantial financial compensation for housing demolition during the regeneration process, which may strengthen their expectations of and support for further urban development [
50]. However, this trust and dependence will also be intertwined with individuals’ indirect anxiety of homelessness. The questions in the original scale cannot effectively reflect people’s trust and dependence on the government and the country when facing development problems. On this basis, one item was added to measure confidence in the long-term benefits of government-led regeneration, and another was added to capture the acceptance of temporary costs in anticipation of future community improvement. These items were designed to extend the contextual content of development support without introducing a separate theoretical dimension.
The scale for place attachment in this study was adapted from Williams and Vaske’s 12-item place attachment scale, which is the most commonly used tool for measuring place attachment in leisure and tourism research. Williams and Roggenbuck operationalized place attachment into two dimensions: place dependence and place identity. The former refers to the extent to which a place meets an individual’s functional needs (“This is the best place to do what I like”), and the latter refers to the emotional and symbolic connection between an individual and a place (“This place reflects the kind of person I am”) [
35,
36].
The survey adopted a combination of face-to-face paper questionnaire filling and online questionnaire scanning and filling. Respondents were primarily contacted between 10:00 a.m. and 7:00 p.m. on Saturdays and Sundays. Respondents took an average of five minutes to complete the questionnaire and received a thank-you gift worth approximately 10 yuan (RMB) after completing the questionnaire. In particular, the survey may underrepresent residents who had already moved away, renters, non-users of waterfront public space, and vulnerable groups more exposed to displacement pressure. The questionnaire findings should therefore be interpreted as reflecting the perceptions of surveyed and remaining residents rather than all residents affected by regeneration. This study was approved by the Tongji University Ethical Review Committee, and all respondents verbally agreed to participate.
4.3. Analytical Strategy
To examine the psychometric properties of the localized GWI and the mechanisms shaping respondents’ support for waterfront green space development, this study employed a series of statistical analyses. First, reliability analysis and confirmatory factor analysis were conducted to assess the internal consistency and construct validity of the Chinese version of the GWI. Second, descriptive statistics, independent-samples t-tests, one-way ANOVA, and K-means cluster analysis were used to examine the characteristics and group differences in respondents’ support for green space development, gentrification worldviews, and place attachment. Finally, hierarchical regression models and a parallel mediation model were employed to further analyze how gentrification worldviews and place attachment jointly influence respondents’ support for waterfront green space development. Because all variables were measured in a single cross-sectional questionnaire, the mediation model was used to identify statistical indirect associations rather than to establish temporal order or causal mediation.
6. Discussion
6.1. Rethinking Green Gentrification in China’s Post-Industrial Waterfront Regeneration
The central theoretical implication of the Yangpu Riverside case is that green gentrification in China should be understood as a bundled regeneration process rather than as an amenity-driven sequence in which a new green space independently raises housing prices and displaces lower-income residents. The observed combination of an expanding housing-price premium, educational upgrading, and population decline is consistent with upward socio-spatial restructuring near the waterfront. However, the absence of a statistically significant relative acceleration in housing-price growth cautions against attributing this pattern to greenbelt construction alone.
Waterfront greening may plausibly contribute to neighborhood change by improving environmental quality and public space accessibility, enhancing the symbolic visibility of the waterfront, signaling sustained public investment, and strengthening expectations of future development [
3]. These mechanisms may increase residential attractiveness and create conditions for the capitalization of land and housing values [
5,
6]. Nevertheless, the greenbelt was developed within a wider transformation that also included industrial relocation, land assembly, demolition and neighborhood renewal, metro and transport-accessibility improvements, cultural and commercial projects, technological-industry development, infrastructure investment, and new residential construction [
10,
11]. Because these interventions overlapped in time and space, the available three-period data cannot isolate their separate effects or establish a causal sequence.
The Yangpu Riverside case can therefore be interpreted through three interrelated mechanisms. First, state-led spatial production reorganizes land uses, infrastructure, public space, and development priorities through planning, land assembly, demolition and compensation, and industrial policy. Second, market capitalization translates the scarcity, accessibility, environmental quality, and symbolic status of the regenerated waterfront into land and housing value. Third, developmental expectations shape how residents interpret these changes, particularly where government planning and public investment retain substantial legitimacy. In this framework, the greenbelt operates simultaneously as an environmental amenity, a public-investment signal, and a symbolic component of place promotion, but not as the sole causal driver of neighborhood restructuring [
9,
10,
51].
The absence of a simple distance–decay pattern further supports this bundled interpretation. More pronounced population decline in the 0–500 m band may be associated with demolition, industrial-land conversion, construction activity, or temporary vacancy, whereas housing-market capitalization and educational upgrading in the 501–1500 m hinterland may reflect differences in residential supply, accessibility, neighborhood conditions, and investment intensity. These processes also have differentiated distributional consequences. Property owners eligible for appreciation or demolition compensation may benefit from regeneration, whereas renters, migrants, residents without secure tenure, and households dependent on long-standing community networks may face greater affordability and indirect-displacement pressures. Because the aggregate data do not track individual movers, population decline is interpreted as population-restructuring and potential displacement pressure rather than proof of forced displacement.
The theoretical contribution is therefore not simply to document another case of green gentrification outside Europe and North America. Rather, the study develops an institutionally embedded explanation in which green public space production is shaped by state-led spatial restructuring, translated into housing and land values through market capitalization, and interpreted by residents through developmental expectations. This framework connects macro-level planning and land-market restructuring with micro-level attitudes toward development, neighborhood preservation, and social inclusion.
6.2. Localizing the GWI: From Western Gentrification Beliefs to Chinese Developmental Expectations
The localized GWI retained the original three-factor structure of neighborhood preservation, development support, and social integration, and the two added items loaded on the intended development support factor. These results support the use of the instrument for examining multidimensional attitudes toward regeneration among the surveyed residents in the present Chinese context. They should not, however, be interpreted as establishing universal validity across all Chinese cities or regeneration settings.
The adaptation also demonstrates that cross-cultural transfer requires conceptual and experiential equivalence rather than literal translation. In China, social integration is structured less by the racial categories emphasized in the original U.S. scale and more by hukou status, migration, housing tenure, and access to urban welfare. Likewise, development support must be interpreted within a context in which redevelopment is frequently coordinated through government planning, public investment, land management, and infrastructure provision.
The localized development support dimension therefore captures more than approval of new businesses, higher-value housing, or property appreciation. It also reflects institutional trust and expectations that government-led regeneration will produce long-term community improvement. The negative correlation between NP and DS, together with the weak or non-significant relationships involving SI, indicates that preservation, development, and integration remain related but empirically distinguishable orientations. The added items extend the contextual content of development support without introducing a separate theoretical dimension, thereby broadening the GWI from a predominantly market-centered account of development attitudes to one that also captures state-led developmental expectations.
6.3. Mixed Gentrification Worldviews and Conditional Support
The coexistence of relatively strong development support, neighborhood preservation, and social integration indicates a mixed rather than polarized gentrification worldview among the surveyed residents. The three-cluster solution reinforces this interpretation: one group placed greater emphasis on development benefits, another combined strong preservation and integration concerns with lower development support, and a third occupied an intermediate position. Support for waterfront regeneration and concern for neighborhood continuity are therefore not mutually exclusive orientations.
This finding is consistent with previous GWI studies showing that residents may support park investment while also valuing neighborhood preservation and social inclusion [
17,
18,
20]. The Yangpu Riverside case extends this insight by showing that such mixed attitudes also occur under a state-led regeneration regime. Compared with the U.S. context, however, the mixed attitude of the surveyed Yangpu Riverside residents shows a stronger orientation toward development approval. This may be related to the long-standing government-led model of urban regeneration in China and the policy legitimacy attached to public infrastructure improvement. For surveyed residents, waterfront greening may therefore signify both improvements in public space and confidence in the area’s future development. Therefore, residents’ relatively high evaluation of development support does not necessarily mean that they ignore the risks of gentrification. Instead, it reflects a comprehensive attitude of “supporting development while also demanding social equity”. This phenomenon is highly consistent with theories of “Chinese-style gentrification” proposed by Chinese scholars [
51]. Strong government leadership and the social consensus that “development is the overriding priority” provide a legitimacy basis for high development support, while place identity rooted in work unit memories and lilong neighborhood life gives rise to a strong awareness of neighborhood preservation.
6.4. From Conditional Support to Inclusive Waterfront Regeneration
The regression results indicate that support for waterfront green space development is conditional on anticipated development benefits, neighborhood-preservation concerns, and place identity. Together, these findings suggest that surveyed residents evaluate waterfront greening through three connected questions: whether regeneration is expected to produce future benefits, whether it threatens valued elements of the existing neighborhood, and whether the regenerated waterfront can become a meaningful part of local identity. This interpretation is consistent with previous GWI research showing that support for green space investment is shaped by broader beliefs about development, neighborhood preservation, and environmental justice [
17,
18,
19,
20].
The significant indirect association through place identity further suggests a statistical pattern in which more favorable development attitudes coexist with stronger emotional identification with the regenerated waterfront, which in turn is associated with stronger project support. By contrast, place dependence did not form a statistically significant indirect association after the other variables were considered. Functional use alone may therefore be insufficient to explain support unless the waterfront also acquires emotional, symbolic, or identity-related meaning [
34,
36,
52]. At the same time, place-based identification can be weakened when regeneration disrupts familiar social networks, everyday environments, and community meanings, even when residents are not physically displaced [
23,
38,
39]. Because all variables were measured at one time point, however, the observed pattern should not be interpreted as demonstrating that development support causally produces place identity or project support; reverse and reciprocal relationships remain plausible.
Taken together, these attitudinal findings do more than explain variation in project support. They identify the conditions under which waterfront regeneration is more likely to be regarded as socially legitimate by surveyed and remaining residents: anticipated development benefits must be accompanied by neighborhood continuity, meaningful place relations, equitable access, and protection from exclusionary pressures. Translating these conditions into practice requires coordinated interventions across distributive policy, housing and livelihood protection, public space design, and participatory governance. The following recommendations therefore connect the statistical findings with specific planning and policy instruments for inclusive waterfront regeneration.
First, distributional impact assessment should be incorporated into project approval, implementation, and post-occupancy evaluation. In addition to environmental quality, visitor numbers, and land-value enhancement, monitoring should track housing-price and rent pressures, affordable-housing supply, demographic restructuring, local-business continuity, green space accessibility, and the perceptions of different resident groups. These indicators should be examined across smaller distance bands and updated over time because green gentrification pressures are spatially uneven and depend on project characteristics, neighborhood vulnerability, and concurrent investment [
2,
4,
8,
26,
27]. Establishing a long-term monitoring system would enable planning authorities to identify emerging exclusionary pressures before they become entrenched and to adjust regeneration policies accordingly.
Second, greening and public space investment should be coordinated with housing and livelihood protections. Relevant measures include maintaining or replacing affordable rental housing, providing transparent and tenure-sensitive compensation, protecting rehousing or return opportunities for eligible long-term residents, extending consultation and assistance to renters and migrants, and supporting small local businesses that contribute to everyday community life [
2,
6,
7,
8]. In Yangpu Riverside, such coordination is particularly important because property owners may benefit from appreciation or compensation, whereas renters, migrants, and residents without secure tenure may be more exposed to rising costs, loss of familiar services, and indirect displacement [
23,
35,
36].
Third, waterfront design should connect environmental improvement with everyday accessibility and local identity. For Yangpu Riverside, this requires preserving industrial and working-class memory through adaptive reuse, interpretation, and the retention of recognizable cultural elements; creating continuous, legible, and barrier-free connections between existing neighborhoods and the waterfront; and providing seating, shade, toilets, safe crossings, tactile and visual wayfinding, and low-threshold recreational facilities for older adults, children, people with disabilities, and routine neighborhood users [
40].
Fourth, participation should be continuous, socially differentiated, and connected to decision making. The adapted GWI and place-attachment measures can be used before implementation to identify development expectations and preservation concerns, during design to compare the priorities of different resident groups, and after implementation to evaluate whether the waterfront is experienced as accessible, meaningful, and inclusive [
17,
18,
19,
20,
31]. Engagement should extend beyond one-off satisfaction surveys and should include mechanisms for reporting barriers, reviewing design performance, and adjusting management practices [
40]. Particular efforts should be made to involve renters, migrants, older adults, people with disabilities, non-users of waterfront space, residents facing relocation, and former residents who have moved away, because conventional surveys conducted in public spaces are unlikely to represent these groups adequately.
These measures translate inclusive waterfront regeneration from a general design aspiration into a coordinated policy framework linking environmental improvement with housing security, livelihood continuity, heritage conservation, universal accessibility, meaningful participation, and long-term social monitoring. Such an approach does not oppose greening or regeneration; rather, it seeks to ensure that their environmental and spatial benefits remain accessible to existing communities and are not disproportionately captured by groups already best positioned to benefit from rising land and housing values.
7. Limitations
This study has several limitations. First, the spatial analysis relies on census and housing-price observations for 2000, 2010, and 2020. Without annual transaction data, project-level timing, and detailed measures of concurrent interventions, the study cannot implement an event-study or rigorous difference-in-differences design or isolate the independent effect of greenbelt construction. Therefore, the 2010–2020 period is interpreted as the broader Yangpu Riverside regeneration period rather than as a strict post-construction period of the greenbelt. The spatial results should be understood as identifying socio-spatial changes associated with waterfront regeneration, rather than isolating the independent causal effect of green space construction. Future research could use annual transaction records, parcel-level redevelopment data, project opening dates, transport accessibility measures, and longitudinal resident tracking to estimate the separate effects of waterfront greening and other regeneration interventions more rigorously.
Second, population decline in this study is measured using aggregate census data at the neighborhood committee level. Such data cannot distinguish among demolition-related relocation, temporary vacancy during redevelopment, changes in household size, population aging, new housing supply, population return, or statistical effects caused by boundary harmonization. Nor can the data identify whether specific renters or homeowners moved away, where they moved, or why they moved. Therefore, the observed population decline is interpreted as population-restructuring and potential displacement pressure, rather than direct evidence of actual displacement. Future research should use longitudinal tracking of movers and renters, household-level panel data, relocation records, and qualitative follow-up interviews to distinguish actual displacement from other forms of demographic change.
Third, the purposive sampling strategy may limit the generalizability of the questionnaire findings. This fieldwork design may overrepresent remaining residents, users of public spaces, and people with direct exposure to the waterfront, while underrepresenting residents who had already moved away, renters, non-users of waterfront public space, highly vulnerable groups, and people unavailable during the survey period. Therefore, the questionnaire results should be interpreted as reflecting the views of surveyed and remaining residents rather than all residents affected by Yangpu Riverside regeneration. Future studies should combine probability sampling, longitudinal tracking, and targeted efforts to include displaced residents, renters, non-users, and residents who are difficult to reach through public space surveys.
Last, the questionnaire data are cross-sectional, and all variables in the regression and statistical mediation models were measured at the same time. Therefore, the analysis cannot establish temporal order or causal mediation among gentrification worldviews, place attachment, and support for waterfront green space development. The observed indirect association through place identity should be interpreted as a statistical mediation pattern rather than evidence that development support causally increases place identity and thereby increases project support. The results may also be affected by common-method bias because all psychological and attitudinal variables were collected using the same self-reported questionnaire. Reverse causality is also possible: residents who already support waterfront green space development may subsequently report stronger place identity or more positive development attitudes. In addition, alternative model specifications, such as treating support as a predictor of place attachment or testing reciprocal relationships between place attachment and development support, may also be plausible. Future research should adopt longitudinal designs, repeated surveys before and after regeneration interventions, or mixed-method panel data to test the temporal ordering and causal pathways more rigorously.
8. Conclusions
This study combined neighborhood-level census and housing-price analysis with a culturally adapted Gentrification Worldview Instrument to examine socio-spatial change and survey residents’ support for waterfront green space development in Yangpu Riverside. The spatial findings indicate socio-spatial restructuring associated with the broader state-led regeneration process rather than an independently identified effect of greenbelt construction.
The study’s main theoretical contribution is conceptualizing green gentrification in China as an institutionally embedded interaction among state-led spatial production, land-value capitalization, and developmental expectations. The localized GWI further shows that surveyed residents’ support is conditional: development-oriented attitudes and place identity are positively associated with support, whereas stronger neighborhood-preservation concerns are associated with greater caution.
Inclusive waterfront regeneration therefore requires environmental improvement to be coordinated with social safeguards. Planning authorities should monitor housing affordability and demographic change alongside environmental performance; align greening with affordable-housing, compensation, and local-business protections; preserve industrial and working-class memory; provide continuous and barrier-free everyday access; and institutionalize participation by renters, migrants, older adults, people with disabilities, non-users, and residents at risk of relocation. These measures can help ensure that waterfront regeneration improves environmental quality without concentrating its benefits among groups already best positioned to capture rising land and housing values.