


Abstract
Flooding poses a significant threat to commercial real estate investment, disrupting business operations, escalating maintenance costs, and heightening investment uncertainty, particularly in coastal and low-lying urban environments. This study examines the social dimensions of climate vulnerability by investigating how flood risk shapes stakeholders’ decisions to invest in commercial properties within flood-prone urban areas, with a focus on Lekki Phase 1, Lagos, Nigeria. A quantitative survey design was adopted. Data were collected from 87 commercial property investors through a structured questionnaire (FIIFRZQ) measured on a four-point Likert-type scale. The instrument demonstrated acceptable overall internal consistency (Cronbach’s α = 0.72), with subscale α values ranging from 0.62 to 0.81. Multiple regression analysis was used to assess the joint and individual contributions of seven factor categories (environmental, legal, economic, neighbourhood, structural, locational and behavioural) to investors’ willingness to invest in commercial property that is at risk of flooding. The seven predictors collectively explained 61.2% of the variance in investment willingness (R2 = 0.612; F(7, 79) = 17.91; p < 0.001). Five factors, namely legal, environmental, structural, economic, and locational, were statistically significant contributors to investment willingness, while neighbourhood and behavioural factors were not. Johnson’s relative weights analysis confirmed legal and environmental considerations as the dominant drivers. The findings illuminate the interplay between climate vulnerability and investor behaviour in urban real estate markets, with actionable implications for policymakers, real estate practitioners, and investors navigating decision-making in flood-exposed urban environments.
1. Introduction
Flooding represents one of the most prevalent environmental hazards globally, resulting in substantial property damage, population displacement, disruption to economic activities, and loss of life. The impact of flooding has intensified in urban areas due to accelerated urbanisation compounded by climate change, with consequential effects on real property markets [1]. Flooding is characterised by the accumulation of water in normally dry areas and can be attributed to both anthropogenic and natural causes. Anthropogenic factors include inadequate sewage and drainage systems and encroachment on natural water channels, while natural causes primarily involve heavy precipitation events.
Lagos State, situated on the Atlantic coast of southwestern Nigeria, serves as a major seaport for the nation, accounting for over 80% of the country’s maritime transport and more than 70% of Nigerian air traffic [2]. Recognised as the commercial, industrial, and business nucleus of Nigeria, Lagos contributed over $80 billion to the national economy in 2010, representing approximately 35% of the national GDP [2] and just over 50% of the nation’s non-oil GDP [3]. As the most populous city in both Nigeria and Africa, with a population exceeding 20 million, Lagos has experienced rapid demographic growth, generating substantial demand for land for residential and commercial purposes.
The demand for land in Lagos has created a scenario where demand significantly exceeds supply. Consequently, areas traditionally considered unattractive for property investment due to environmental constraints have experienced heightened developer and investor interest. Despite widespread awareness of flooding’s destructive potential, in-creasing urbanisation and population growth have led some investors to view flood risk as a manageable factor that can be mitigated with adequate resources. This perspective is particularly evident in the Lekki flood zone of Lagos, where investors knowingly acquire properties in flood-prone environments, while others remain unaware of the risks or lack access to comprehensive flood information [4].
Lekki, identified as one of the fastest-developing areas of Lagos State, is characterised as a flood-prone zone [5]. This phenomenon raises critical questions about the factors that influence stakeholders’ willingness to invest in such high-risk environments. Understanding the determinants of commercial property investment in flood risk zones offers valuable insights for shaping investment strategies and policy interventions in flood hazard areas.
Despite the substantial body of literature examining property investment determinants, research that systematically examines commercial property investment decisions in flood-prone urban areas of sub-Saharan Africa remains limited. Most existing studies focus on residential properties or examine investment decisions in non-flood-prone contexts. This study addresses three specific gaps: the residential property bias of the existing literature; the tendency to study factor categories in isolation rather than within an integrated multifactor model; and the under-representation of sub-Saharan African coastal urban contexts. The study aims to examine the extent to which environmental, legal, economic, neighbourhood, locational, behavioural and structural factors collectively and individually influence stakeholders’ willingness to invest in commercial properties located in flood risk zones of Lekki, Lagos State.
Specifically, the objectives are as follows:
- To ascertain the extent to which these seven factors jointly influence stakeholders’ willingness to invest in the flood risk zone of Lekki, Lagos State.
- To evaluate the relative contribution of each factor to stakeholders’ willingness to invest in the flood risk zone of Lekki, Lagos State.
2. Literature Review
2.1. Flood Risk and Urban Real Estate Markets
Flooding is the most globally pervasive climate-related hazard affecting real estate markets [1]. Recent decades have seen a marked rise in both the frequency and severity of urban flood events, particularly in coastal cities of the Global South [6,7]. Porter et al. [8] developed a high-precision flood risk assessment tool to estimate damages to commercial buildings across the United States, finding that office and retail properties accumulate disproportionate exposure where economic activity concentrates along coasts. Lamond et al. [9], drawing on 72 interviews with built-environment professionals across five countries, found that commercial flood risk valuation is consistently hampered by data heterogeneity, information asymmetry between sellers and buyers, and the absence of standardised mitigation-recognition mechanisms in valuation practice. For Lagos specifically, Faisal Koko et al. [6] documented an accelerating pattern of urban expansion onto land of marginal elevation, while Amadi [10] examined the uptake of structural and non-structural adaptation measures in flood-prone Port Harcourt, finding that adaptation is uneven and frequently inadequate relative to exposure.
Investment decision-making in real estate markets is influenced by multiple interrelated factors that the literature has commonly grouped into structural, economic, locational, environmental, legal, neighbourhood and behavioural dimensions. Each category encompasses specific variables that contribute to investors’ risk–return assessments in flood-prone areas. Sean and Hong [11] identified locational factors as major drivers of property investment decisions in Malaysia, alongside structural and financial considerations. Abidoye and Chan [12] working in the Lagos context ranked property location as the most critical attribute, followed by neighbourhood features and structural characteristics. Hudson [13] argued that structural factors such as property size, age and design are critical, particularly where multi-storey buildings or flood-resistant features can offset hazard exposure. Oyetunji et al. [4] developed a residential property version of a multifactor framework for Lekki flood zone investment, which the present study extends to the commercial property segment.
2.2. Economic Returns Versus Environmental Risk
Return on investment (ROI) is a primary consideration for property investors [14], reflecting the profitability of an investment relative to its cost. In flood-prone areas, however, ROI must be weighed against environmental hazard. Mohammed and Shonibare [15] established that perceived flood frequency, elevated insurance premiums, and rising maintenance costs significantly reduce willingness to invest in highly exposed locations such as Lekki and Victoria Island. Samoray et al. [16] observed that investors sometimes accept exposure to flood hazards in areas with strong market opportunities, suggesting a trade-off model in which environmental risk is balanced against expected economic rewards. The willingness-to-pay study of Seenath, Mahadeo and Blackett [17] complicates this picture: their experimental UK survey found that access to multiple flood prediction sources shifts demand toward lower-risk locations, but that investors discount predictive uncertainty itself. The tension between ROI maximisation and environmental risk avoidance is, then, neither resolved by the literature nor obviously stable across markets.
2.3. Behavioural and Institutional Decision-Making
Psychological drivers shape investment behaviour in flood risk zones. Risk aversion, anticipated returns, and confidence in government mitigation plans have been shown to determine residential investment behaviour [18,19]. Antony and Joseph [20] and Wangzhou et al. [21] documented the influence of regret aversion, herding behaviour, and financial literacy on residential real estate decisions. Whether these behavioural channels operate similarly in commercial property markets is, however, an open empirical question. Commercial investment decisions in Lagos are typically taken under institutional procedures—formal due diligence advised by registered estate surveyors and valuers—that may attenuate the role of individual psychological heuristics. The present study contributes evidence on this point by directly comparing commercial investor findings with the residential sector pattern documented in the cited literature.
2.4. The Legal and Regulatory Dimension
Institutional factors—including legal frameworks and environmental regulations—influence real estate investment through government policies [22]. Tu, Zou and Ding [23] found that investors weigh both profitability and legality when making decisions, highlighting the importance of clear property rights, land-zoning regulations, and compliance requirements. In commercial property markets specifically, Lamond et al. [9] documented how regulatory regimes around flood insurance and disclosure shape valuation practice. For Lagos, the relevant regulatory landscape is layered: the Lagos State Urban and Regional Planning and Development Law (2019) set out flood-prone setbacks; the Lagos State Building Control Agency enforces the National Building Code on flood-resilient construction; the Land Use Act 1978 governs titles; and the National Insurance Commission regulates flood insurance products. The interaction between this regulatory layering and commercial investment decision-making in flood risk zones has not been examined empirically and is one of the research gaps the present study addresses.
2.5. Research Gaps and Study Contribution
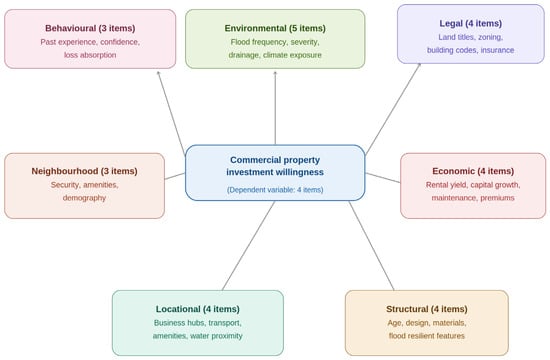
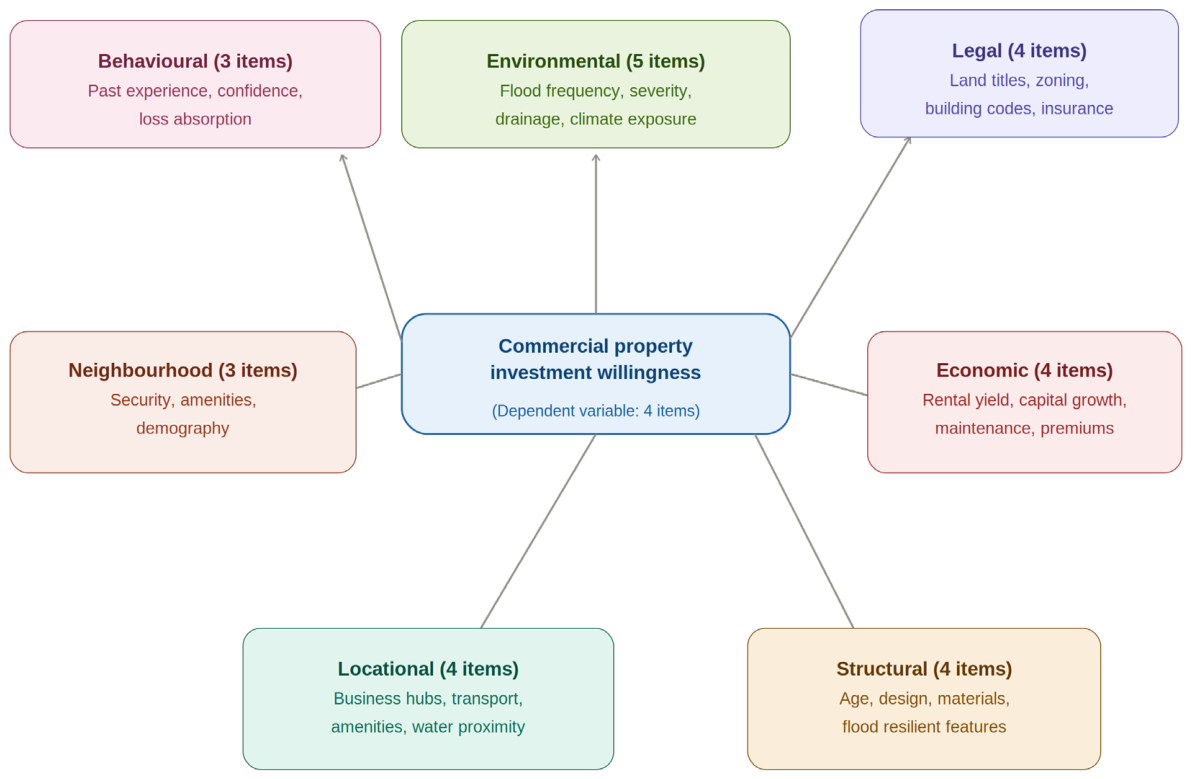
Three specific gaps emerge from the literature reviewed. First, the bulk of work on flood risk and real estate decision-making concerns residential properties; the commercial sector is comparatively under-studied, despite Porter et al. [8] showing its disproportionate exposure. Second, prior studies tend to examine factor categories in isolation, rarely placing them within an integrated multifactor model that permits the relative weight of each category to be compared. Third, sub-Saharan African coastal urban contexts are markedly under-represented in this literature, despite cities such as Lagos being among the most flood-exposed economic centres globally. The present study addresses these gaps by integrating seven factor categories into a single empirical model (Figure 1) and applying it to commercial property investment decisions in Lekki Phase 1, Lagos.
Figure 1.
Conceptual framework: factor categories hypothesised to influence commercial property investment willingness in flood risk areas.
3. Research Methodology
3.1. Research Design
This study employed a quantitative survey research design to examine the factors influencing commercial property investment decisions in flood-prone areas. The survey approach was selected for its effectiveness in collecting standardised data from a relatively large sample, enabling statistical analysis of relationships among multiple predictor variables and investment decision-making behaviour.
3.2. Study Area
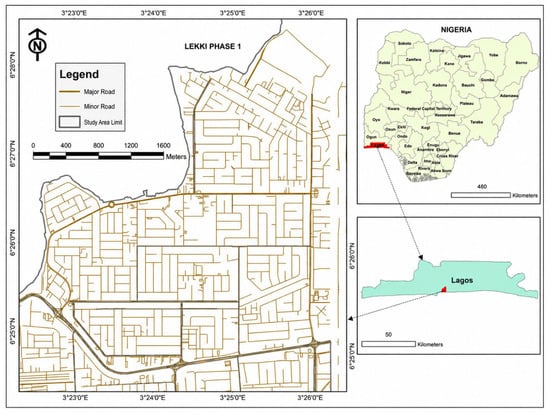
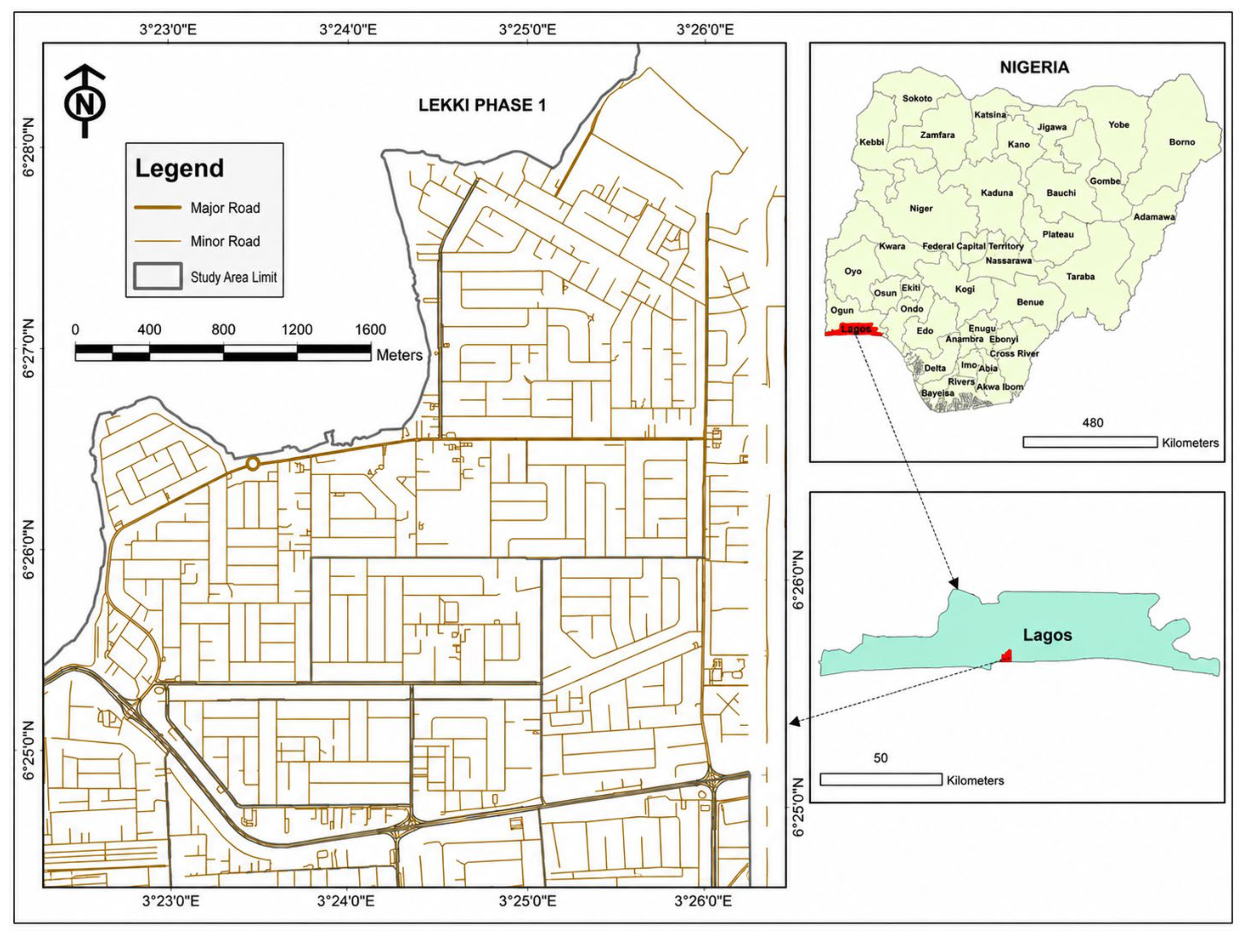
The research was conducted in Lekki Phase 1, a district on the Lekki Peninsula situated in the Eti-Osa Local Government Area of Lagos State, Nigeria (Figure 2). Lekki has recorded the highest built-up area expansion over time, increasing from 0.5% to 18% between 1984 and 2014 [5], and is located east of Victoria Island and Ikoyi. The study area is characterised by a coastal landscape situated at an elevation of 3–5 m above sea level, with approximately 37% and 63% of the land lying between 5 and 3 m, respectively [5,24]. The region is progressively vulnerable to recurrent flooding due to its coastal location, inadequate drainage systems, rapid urbanisation, population pressure, and waste mismanagement.
Figure 2.
Map of Nigeria showing the study area.
3.3. Target Population and Sampling
The study population comprised property investors in commercial real estate—specifically office and retail properties—occupying purpose-built properties in the flood risk zone of the study area. The selection of retail and office properties was driven by the dominance of these two property classes in the local built environment [25,26].
A non-probability sampling strategy was adopted, combining purposive and snowball techniques. Purposive sampling was used to identify commercial property occupants in Lekki Phase 1 whose properties fall within the recognised flood risk zone; this was supplemented by snowball referrals from local estate agents who manage portfolios in the area. The combination was chosen because no comprehensive sampling frame of commercial property investors exists for Lekki, and because direct experience of the flood risk environment was a defining inclusion criterion. The authors acknowledge that this approach does not yield a statistically representative sample of the wider Lagos commercial property investor population, and that a degree of selection bias toward investors who have remained engaged with the area despite flood events is possible. The implications for generalisability are discussed in Section 5.2.
A total of 121 structured questionnaires were distributed via Google Forms. Ninety questionnaires were retrieved (74.38% response rate). Following data screening, 87 responses were deemed valid for analysis (71.91% valid response rate). Table 1 shows the questionnaire administration data.
Table 1.
Questionnaire distribution.
Two rules of thumb were used to evaluate the adequacy of the sample size for multiple regression with seven predictors. The Hair et al. [27] guideline of at least 5–10 observations per predictor (i.e., 35–70 for seven predictors) is comfortably met. The more conservative Green [28] rule of N ≥ 50 + 8 m (where m is the number of predictors) gives a minimum N of 106, which our N of 87 does not meet. A post hoc power analysis using G*Power 3.1 [29], with the obtained R2 of 0.612 (effect size f2 = 1.58, large), α = 0.05 and N = 87, returned an observed power of >0.99 for the omnibus F-test and >0.85 for individual predictors at the medium-effect level. While the omnibus power is therefore strong, the failure to meet the Green threshold is acknowledged as a limitation: the precision of individual coefficient estimates is correspondingly limited, and replication with a larger sample is recommended.
3.4. Data Collection Instrument
A preliminary content analysis of the existing literature, combined with the researchers’ expertise in commercial property investment, was conducted to identify factors influencing investment decisions [4,26,30]. The analysis identified seven factor categories and 27 sub-factors. The structured questionnaire—FIIFRZQ (Factor Influencing Investments in Flood Risk Zone Questionnaire)—comprised two sections: Section A captured demographic characteristics, and Section B assessed the seven factor categories. Responses were recorded on a four-point Likert-type scale [31,32] denoted as 1 = not important at all, 2 = slightly important, 3 = important, and 4 = extremely important. The full questionnaire is reproduced in Appendix A.
The dependent variable—stakeholders’ willingness to invest in commercial property within the Lekki Phase 1 flood risk zone—was operationalised as a four-item subscale combining (i) overall willingness to invest, (ii) likelihood of investing again under current flood risk conditions, (iii) willingness to recommend such investment to a peer, (iv) intention to retain rather than divest current holdings. Items were rated on the same four-point Likert scale, and the composite score was the mean of the four items (Cronbach’s α = 0.81). This is therefore an attitudinal investment intention measure rather than a record of actual transactions; the distinction is acknowledged as a limitation in Section 5.2.
Three experts in real estate determined the instrument’s content validity. The overall internal consistency was Cronbach’s α = 0.72, exceeding the acceptable 0.70 threshold for exploratory research [27]. Subscale α coefficients are reported in Table 2. Five subscales met the 0.70 threshold; two—neighbourhood (α = 0.66) and behavioural (α = 0.62)—fell modestly below it. The implication of these lower subscale reliabilities for the regression results is detailed in Section 4.4 and Section 5.2. Table 2 reveals the factor category of the items used for the data analysis.
Table 2.
Seven factor categories: items, examples, sources and reliability.
3.5. Ethical Considerations
Ethical approval was obtained from the Robert Gordon University Research Ethics Review Committee prior to data collection. Informed consent was obtained from all participants in writing. Respondents’ confidentiality was assured, and anonymity was maintained throughout.
3.6. Index Construction and Data Analysis
Composite scores for each of the seven factor categories were computed as the unweighted mean of the constituent items in the FIIFRZQ subscale. Mean (rather than sum) scoring was chosen to keep the composite indices on the same 1–4 metric as the original Likert items, simplifying interpretation of the regression coefficients. Principal-axis factor scoring was considered but not adopted, on the grounds that the sample size (N = 87) does not meet conventional recommendations for stable factor score estimation. The same mean-scoring approach was applied to the four-item dependent variable subscale.
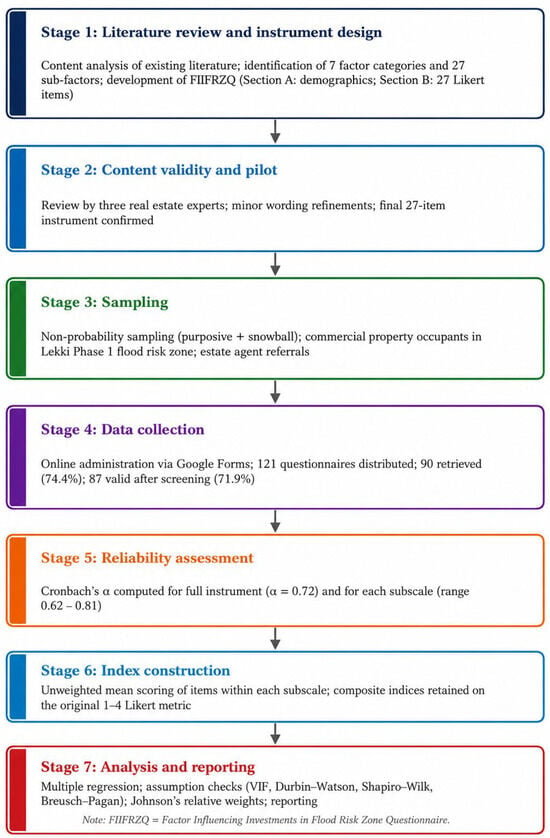
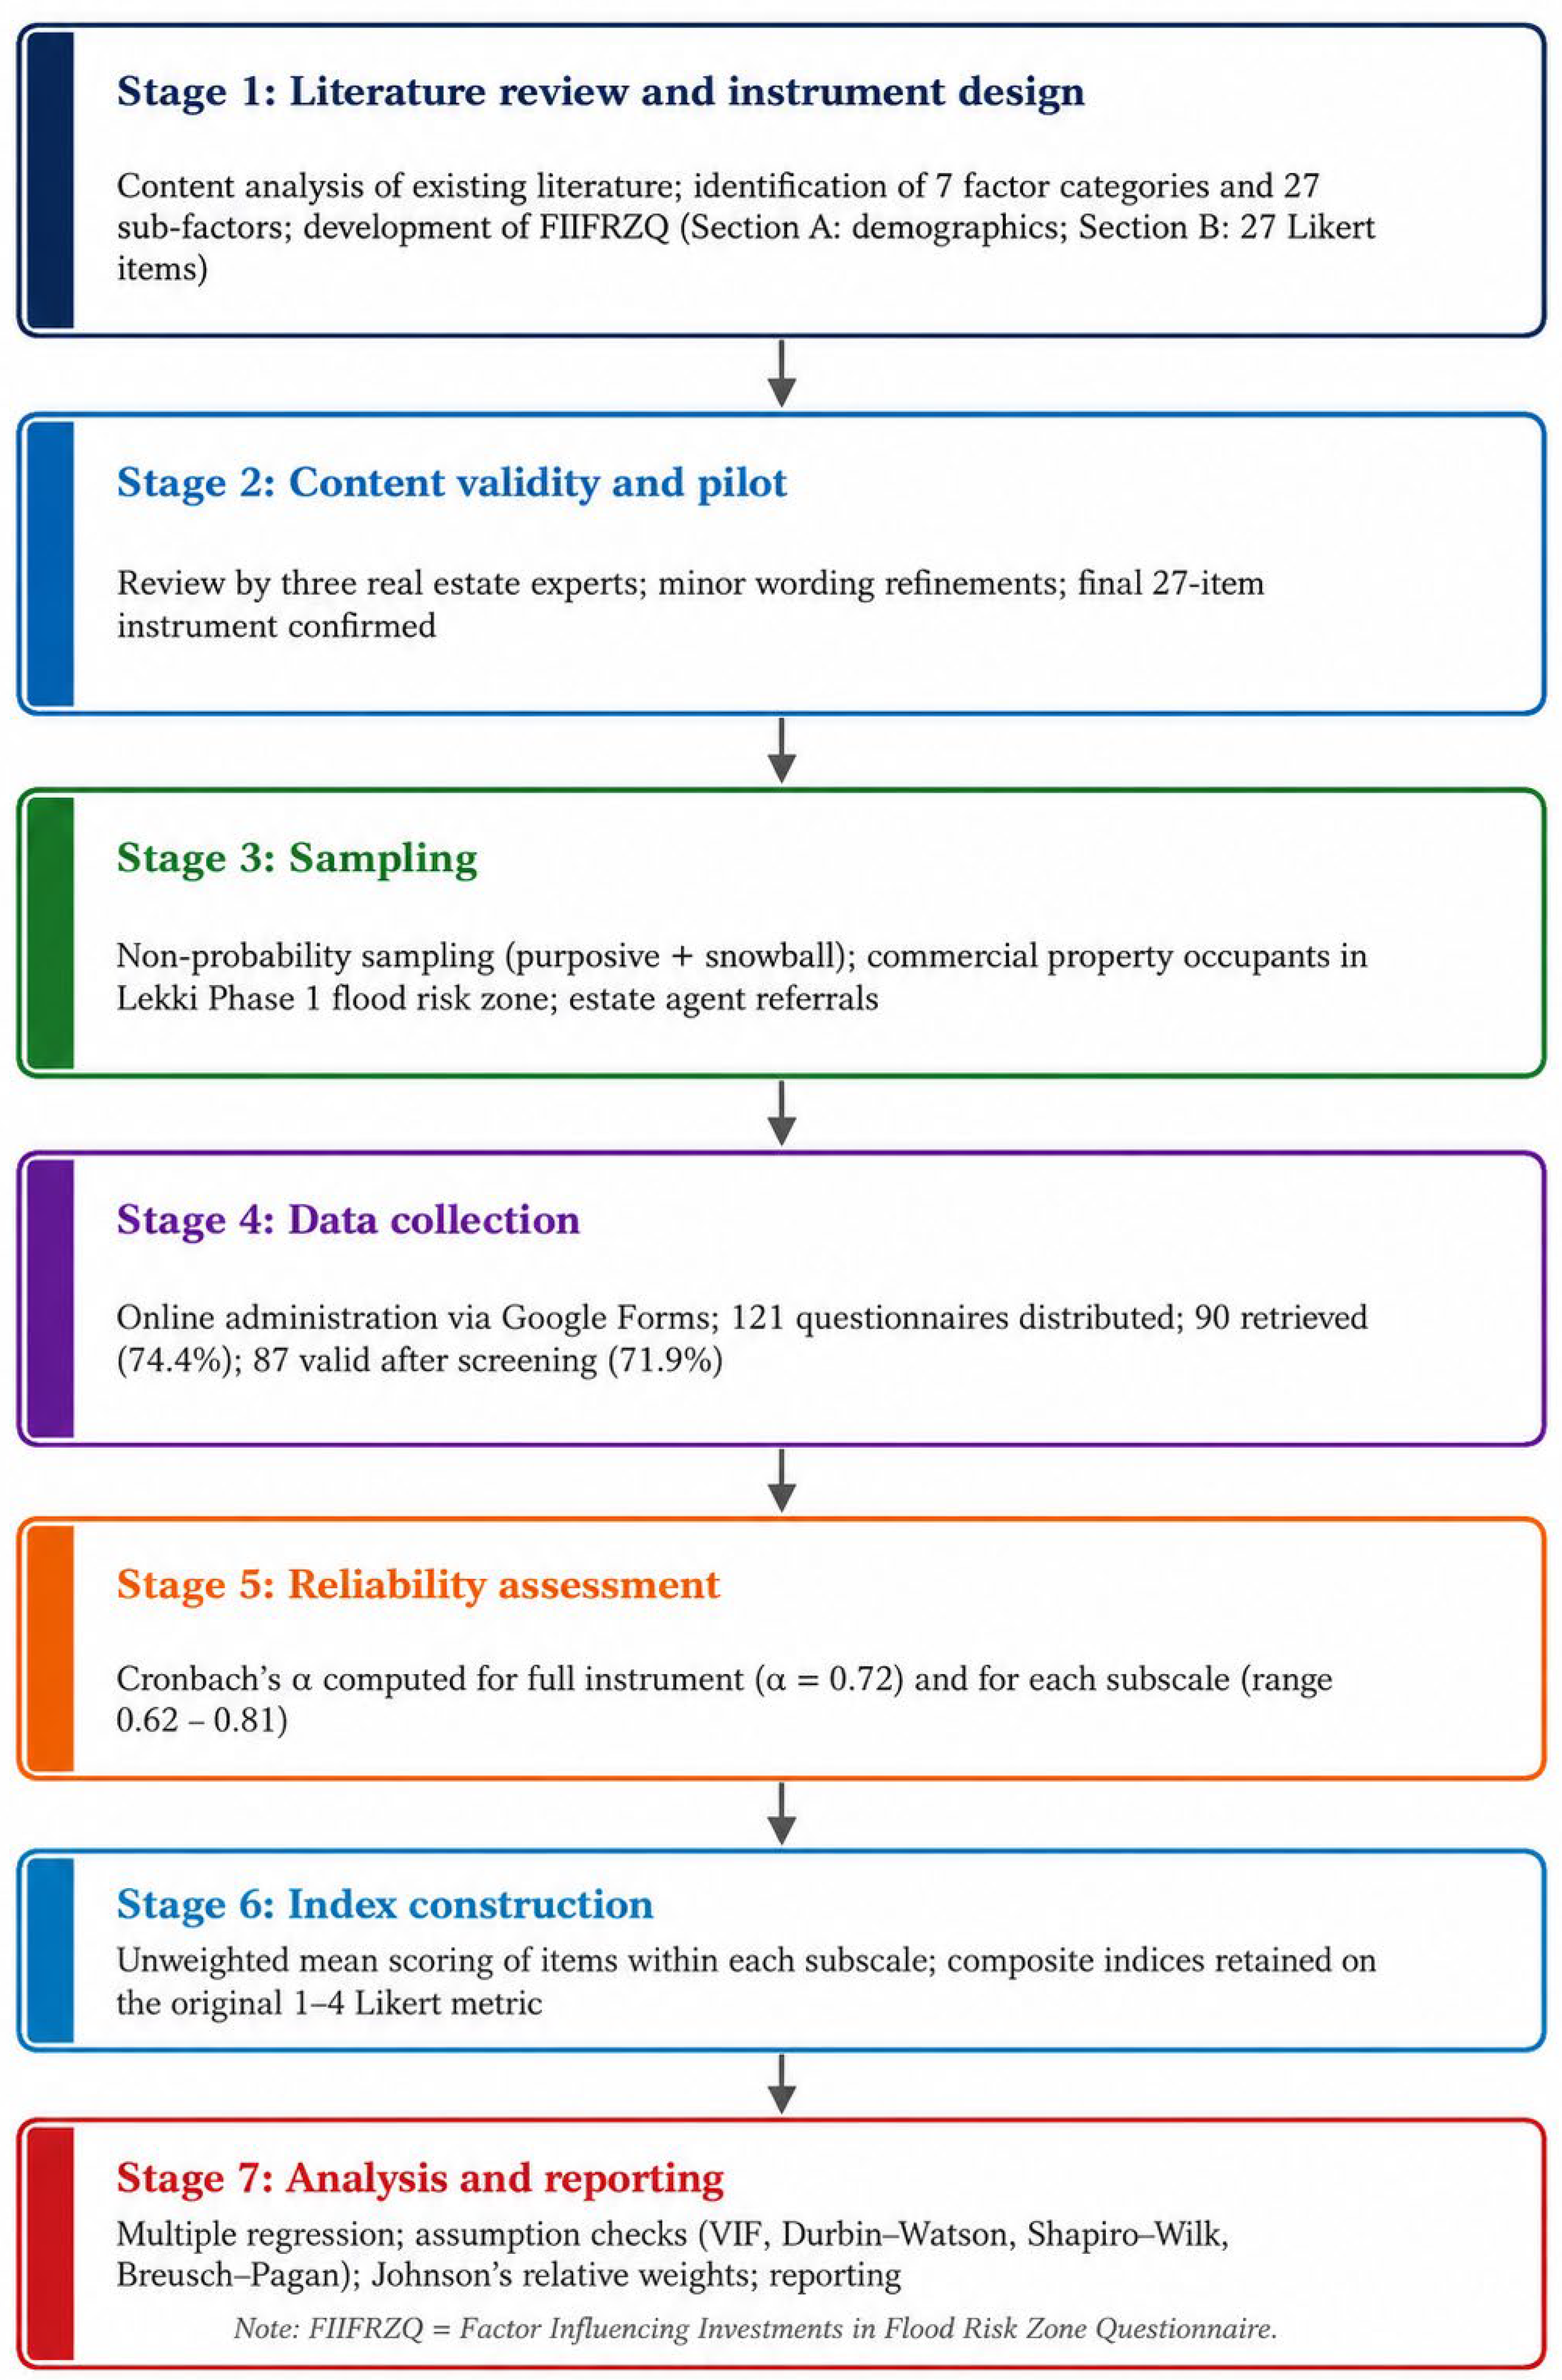
Multiple regression analysis was used to assess the joint and individual contributions of the seven factor categories to investment willingness. Prior to interpretation, the regression assumptions were checked: variance inflation factors (VIF) and tolerance values for multicollinearity, the Durbin–Watson statistic for residual autocorrelation, the Shapiro–Wilk test for residual normality, and the Breusch–Pagan test for homoscedasticity. All VIFs were below 2.5, tolerance values were above 0.40, the Durbin–Watson statistic was 1.94 (within the 1.5–2.5 acceptable range), and neither the Shapiro–Wilk nor the Breusch–Pagan test indicated a violation at α = 0.05. To complement the standardised beta ranking, Johnson’s relative weights [34] were also computed using the relweights package in R; these are robust to multicollinearity and provide an interpretable decomposition of the model’s explanatory power. Figure 3 shows the research process flow diagram adopted in this study.
Figure 3.
Research process flow diagram.
4. Results
4.1. Demographic Profile of Respondents
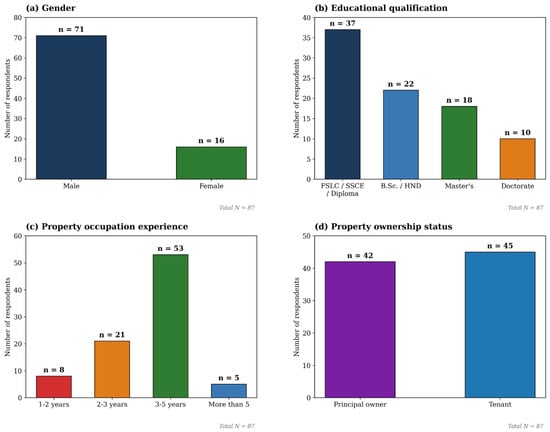
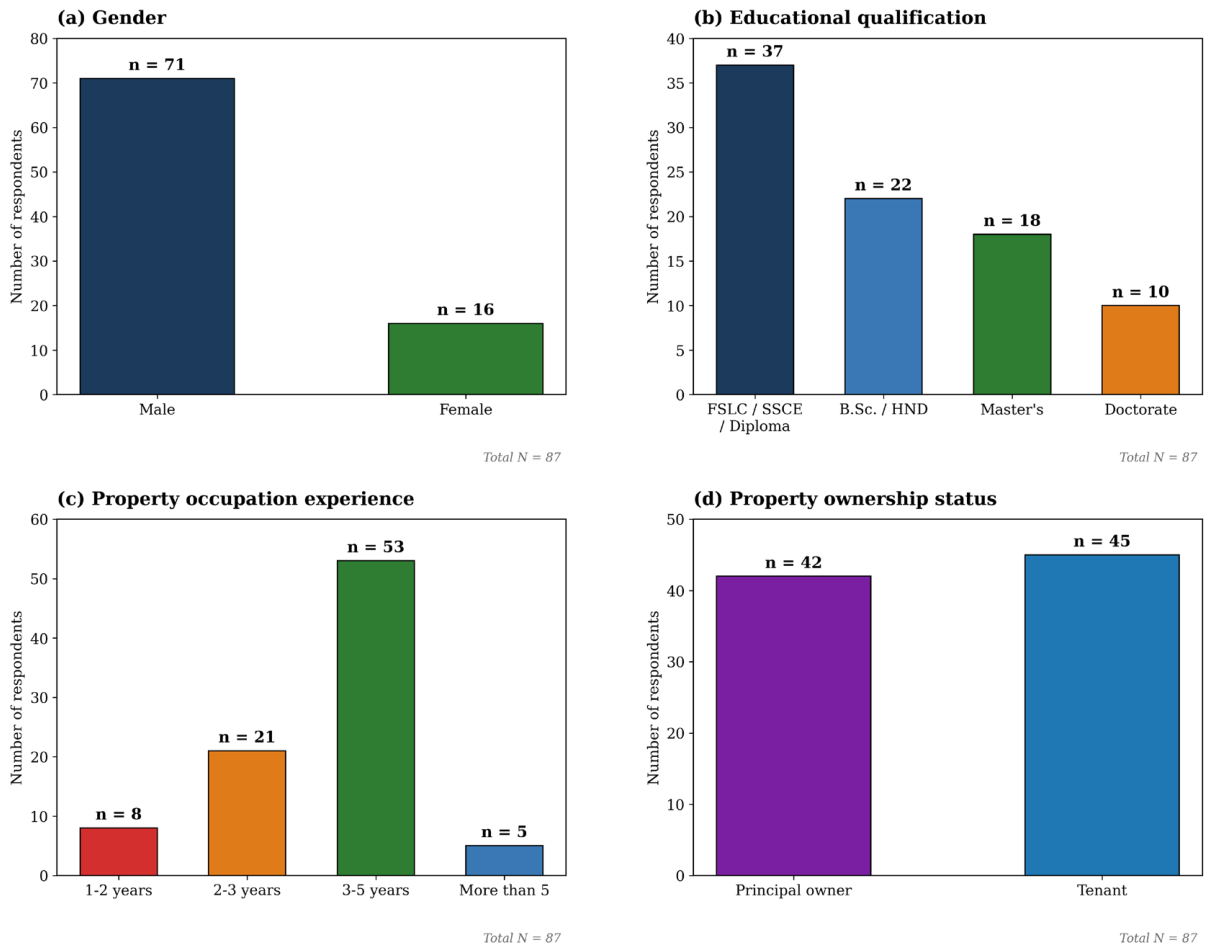
Figure 4 shows the demographic characteristics of respondents. Gender distribution was 71 male and 19 female (out of the 90 retrieved questionnaires; 71 male and 16 female within the 87 valid responses analysed). Educational attainment was distributed across other qualifications (FSLC/SSCE/diploma), B.Sc./HND, master’s, and doctoral degrees. Regarding property occupation experience, the majority of respondents had occupied their properties for 3–5 years. Property status was approximately balanced between principal owners and tenants.
Figure 4.
Demographic profile of commercial property investors: (a) gender; (b) educational qualification; (c) property occupation experience; (d) property ownership status.
4.2. Comparison of Owner–Occupier and Tenant Respondents
Mean factor ratings were compared across the two ownership groups (owner–occupiers, n = 42; tenants, n = 45) using independent samples t-tests. The two groups did not differ significantly on any of the seven factor subscales at α = 0.05, supporting the decision to pool the groups in the subsequent regression analysis. The largest between-group difference was with legal factors (M_owner = 3.41, M_tenant = 3.22; t(85) = 1.73, p = 0.087), which approached but did not reach significance.
4.3. Regression Model Summary and ANOVA
Table 3 presents the corrected multiple regression model summary while Table 4 shows the results of the analysis of variance for this study. The seven predictors collectively account for 61.2% of the variance in stakeholders’ investment willingness (R2 = 0.612), with an adjusted R2 of 0.578.
Table 3.
Multiple regression model summary.
Table 4.
ANOVA results.
4.4. Individual Factor Contributions and Multicollinearity Diagnostics
Table 5 presents the regression coefficients, t-statistics, p-values, and multicollinearity diagnostics. Five factors are statistically significant at α = 0.05: legal, environmental, structural, economic, and locational. Neighbourhood and behavioural factors are not statistically significant. All VIF values are below 2.5 and tolerance values are above 0.40, indicating that multicollinearity is not a concern.
Table 5.
Regression coefficients, t-statistics, p-values and multicollinearity diagnostics.
4.5. Relative Importance Analysis
To complement the standardised beta ranking and to address potential residual concerns about the multicollinearity-driven instability of the coefficient ordering, Johnson’s relative weights [33] were computed (Table 6). The relative weight ranking is broadly consistent with the standardised beta ranking, with legal and environmental factors as the dominant drivers.
Table 6.
Johnson’s relative weights for the seven predictors.
5. Discussion of Results
5.1. Introduction
The seven factor categories collectively account for 61.2% of the variance in commercial property investors’ willingness to invest in the Lekki Phase 1 flood risk zone (R2 = 0.612; F = 17.91; p < 0.001). This level of explanatory power is consistent with what comparable behavioural and real estate decision-making studies typically achieve. The result confirms—but does not exceed—prior findings that emphasise the multifactorial nature of real estate investment decisions [12,14]. The contribution of the present analysis lies less in the magnitude of R2 and more in the comparative weighting of factor categories within an integrated model, particularly in the commercial property segment.
5.2. Legal Factors: Grounding in Nigerian Regulatory Practice
Legal factors emerged as the strongest predictor of investment willingness (β = 0.345, p < 0.001; relative weight = 25.8% of explained variance). The Nigerian and Lagos-specific regulatory landscape that plausibly underlies the finding can be unpacked into several components. The Lagos State Urban and Regional Planning and Development Law (2019) prescribe flood-prone setbacks and confers planning permit authority on the Lagos State Physical Planning Permit Authority, creating a regulatory hurdle that investors must navigate. The Lagos State Building Control Agency (LASBCA) enforces the National Building Code (2006, revised 2024) on elevated foundations and flood-resilient design in coastal areas, with periodic high-profile demolitions of non-compliant structures generating salient signals to the investor community. The contested floodplain provisions within the Lekki Comprehensive Master Plan and the Lekki Free Trade Zone Master Plan introduce a further layer of uncertainty. The National Insurance Commission (NAICOM) regulates flood insurance, though the uptake of voluntary commercial flood insurance in Nigeria remains low relative to the comparator regimes documented by Lamond et al. [9]. Finally, the Land Use Act (1978) governs titles and interacts with floodplain restrictions in ways that can create unresolved exposure for investors. Taken together, this regulatory layering generates exactly the conditions under which legal due diligence becomes a dominant input to investment decisions—which is what the data show.
This finding extends rather than merely confirms the work of Oladiran et al. [35] and Lamond et al. [9], who had identified institutional factors as important without placing them within an integrated model that allowed direct comparison against the full factor set.
5.3. Environmental, Structural, Economic and Locational Factors
Environmental factors demonstrated the second-strongest influence on investment willingness (β = 0.298, p = 0.003), confirming the results from Mohammed and Shonibare [15], who found that perceived flood frequency, elevated insurance premiums, and rising maintenance costs significantly reduce willingness to invest in highly exposed locations such as Lekki. The growing salience of climate change in the Lagos public discourse plausibly amplifies this channel. Structural factors (β = 0.221, p = 0.022) align with Hudson [13] on the importance of property size, age, design, and flood-resilient features, and with Amadi [10] on the role of structural adaptation measures. Economic factors (β = 0.207, p = 0.037) confirm that profit considerations remain a meaningful driver even in environmentally vulnerable locations, supporting the trade-off model of Samoray et al. [16]. Locational factors (β = 0.194, p = 0.046) are significant but with smaller magnitude than legal or environmental factors, suggesting that in the commercial property context the regulatory and environmental dimensions weigh more heavily than the pure locational advantages that have been documented in residential property studies [4,11].
5.4. Why Neighbourhood and Behavioural Factors Did Not Register
Neighbourhood factors (β = 0.111, p = 0.266) and behavioural factors (β = 0.046, p = 0.633) did not reach statistical significance. This contrasts with the residential property literature, where these factors are often significant [4,12,20,21]. Three explanations can be put forward for this.
First, institutional rationality. Commercial property investment in Lekki is typically conducted under formal due diligence procedures, often advised by registered estate surveyors and valuers, which may attenuate the role of individual psychological heuristics [36] that drive much of the residential behavioural literature. The non-significance of behavioural factors is consistent with a market segment in which decisions are channelled through institutional procedures rather than personal judgement under uncertainty.
Second, measurement. The neighbourhood and behavioural subscales had the lowest Cronbach’s α values in the instrument (0.66 and 0.62 respectively). Attenuation of regression coefficients due to measurement error is a well-documented consequence of low subscale reliability, and we cannot rule out that this contributes to the observed non-significance.
Third, sample size and homogeneity considerations. With N = 87, standard errors are large enough that small true effects could fail to reach significance. The geographical concentration of respondents within Lekki Phase 1 may also have compressed the variance on neighbourhood items, reducing their explanatory leverage.
These three explanations are not mutually exclusive, and the authors do not claim definitive resolution among them. Replication with refined behavioural and neighbourhood scales and a more heterogeneous sampling frame would help distinguish their relative contributions.
5.5. Implications for Theory and Practice
Theoretically, the findings support the case for integrated multifactor frameworks for real estate investment in environmentally vulnerable contexts, particularly ones that explicitly account for legal and regulatory considerations. The prominence of legal factors and the non-significance of behavioural factors suggests that commercial property investment models cannot be straightforwardly transferred from residential property studies, and that market-segment-specific theorising is warranted.
For real estate investors and developers, the findings highlight the importance of legal due diligence, environmental risk assessment, and structural resilience in evaluating flood-prone investment opportunities [4,30,37]. For policymakers and urban planners, the findings underscore the need for clear, stable regulatory frameworks: regulatory uncertainty plausibly dampens investment activity, while well-designed regulations that balance development with environmental protection may facilitate sustainable investment. Public investments in flood mitigation infrastructure may, in turn, generate private investment multiplier effects.
6. Conclusions, Limitations and Future Research
6.1. Conclusions
This study examined the factors influencing commercial property investors’ willingness to invest in flood risk zones of Lekki Phase 1, Lagos State, Nigeria. The seven-factor model accounted for 61.2% of the variance in investment willingness, with legal and environmental considerations as the dominant predictors, followed by structural, economic and locational factors. Neighbourhood and behavioural factors did not reach statistical significance in this commercial property sample, contrasting with patterns reported in residential property studies and suggesting a market segment distinction worth further theoretical and empirical investigation. The findings are indicative for the specific context of Lekki Phase 1; generalisation to other flood risk contexts requires replication with broader sampling frames and refined measurement instruments.
6.2. Limitations
Four limitations are critical and should be foregrounded. First, the cross-sectional design prevents causal inference: the analysis identifies associations between factor categories and investment willingness, not temporal sequences or causal effects. Longitudinal designs tracking investment decisions over time would provide more robust evidence of causal mechanisms. Second, the single-site focus on Lekki Phase 1 limits external validity. The specific characteristics of Lekki—its high-growth profile, affluent demographic, and strategic location—may influence investment dynamics in ways that distinguish it from other flood-prone areas, and comparative studies are needed. Third, common method bias is a concern given that all variables were collected via a single self-report instrument at one point in time. Harman’s single-factor test was run post hoc, with the largest single factor accounting for 31.4% of the variance, below the 50% threshold of concern; nevertheless, future studies would benefit from collecting predictor and outcome data via different methods or at different times. Fourth, the broader risks of self-report data such as social desirability bias and recall bias cannot be ruled out.
Less critical but worth noting is that the modest reliability of the neighbourhood (α = 0.66) and behavioural (α = 0.62) subscales may have attenuated the corresponding regression coefficients; this study examined only office and retail commercial property, excluding industrial, hospitality and mixed-use assets; and the sample size of 87, while meeting one rule of thumb (Hair et al.), does not meet the more conservative Green threshold of 106 for seven predictors.
6.3. Future Research
Future research should consider the following: longitudinal designs tracking investment decisions and property values over time; comparative studies across multiple flood risk zones; mixed-methods approaches integrating qualitative inquiry with quantitative analysis; the use of actual property transaction data to complement self-reported measures; replication with refined and expanded behavioural and neighbourhood subscales; and analysis of how investment decisions respond to different climate change scenarios including sea level rise and changing precipitation patterns.
Author Contributions
Conceptualisation, N.N. Methodology, N.N. and A.K.O. Data collection, N.N. Data curation, N.N. and A.K.O. Formal analysis, N.N. and A.K.O. Writing—original draft preparation, N.N. Writing—review and editing, N.N. and A.K.O. All authors have read and agreed to the published version of the manuscript.
Funding
This research received no external funding.
Institutional Review Board Statement
All subjects gave their informed consent for inclusion before they participated in this study. This study was conducted in accordance with the Declaration of Helsinki, and the protocol was approved by the Ethics Committee of Robert Gordon University with reference number RESSAE/ETH/2023, May 2023.
Informed Consent Statement
Informed consent was obtained from all subjects involved in the study.
Data Availability Statement
The data supporting the findings of this study are not publicly available due to confidentiality constraints associated with an ongoing doctoral program.
Acknowledgments
The authors acknowledge the concerted efforts of the anonymous reviewers of the manuscript. The authors also acknowledge the Tertiary Trust Fund Education (TetFund), Nigeria for their support towards the doctoral program that culminated in this research.
Conflicts of Interest
The authors declare no conflicts of interest.
Appendix A
- Section A: Demographic information
A1. Gender: □ Male □ Female □ Prefer not to say
A2. Educational qualification: □ FSLC □ SSCE □ Diploma □ B.Sc./HND □ Master’s □ Doctorate
A3. Years of property occupation in Lekki Phase 1: □ 1–2 years □ 2–3 years □ 3–5 years □ More than 5 years
A4. Property ownership status: □ Principal owner □ Tenant
A5. Type of commercial property: □ Office □ Retail □ Mixed office/retail
- Section B: Factors influencing investment willingness
Instructions: Please rate the importance of each of the following items for your decision to invest, or to continue investing, in commercial property in the Lekki Phase 1 flood-risk zone. Use the following scale: 1 = Not important at all; 2 = Slightly important; 3 = Important; 4 = Extremely important.
- Environmental factors
E1. Recurring flood events in the area
E2. Severity of past flood events in the area
E3. Adequacy of drainage infrastructure
E4. Vulnerability of the property to future climate-change-related flooding
E5. Quality of the surrounding ecological environment
- Legal factors
L1. Clarity of land-title and zoning regulations
L2. Existence and enforcement of building codes for flood-prone areas
L3. Availability and regulation of commercial flood insurance
L4. Stability of government policy on floodplain development
- Economic factors
EC1. Expected rental yield in the area
EC2. Anticipated capital appreciation of the property
EC3. Cost of flood-related maintenance and repairs
EC4. Cost and availability of flood-insurance premiums
- Structural factors
S1. Age and condition of the building
S2. Presence of flood-resilient design features (elevated foundations, barriers, etc.)
S3. Building materials used (water-resistant materials, etc.)
S4. Size and configuration of the property
- Locational factors
LC1. Proximity to major business hubs and central business districts
LC2. Accessibility via major roads and transport links
LC3. Proximity to commercial amenities (banks, services, etc.)
LC4. Distance from known flood-prone water bodies
- Neighbourhood factors
N1. Neighbourhood security and crime levels
N2. Neighbourhood amenities and services
N3. Demographic profile of the surrounding area
- Behavioural factors
B1. My personal past experience with flood events at this or similar properties
B2. Confidence in government and authority response to flooding
B3. Perceived ability to absorb potential flood-related losses
- Dependent variable: Investment willingness
DV1. My overall willingness to invest in commercial property in this flood-risk area is high
DV2. I would invest again in commercial property in this flood-risk area under current conditions
DV3. I would recommend a peer to invest in commercial property in this flood-risk area
DV4. I intend to retain rather than divest my current commercial-property holdings in this flood-risk area
References
- Anshuka, A.; Fu, X.; White, I. High water, high stakes: A global review of flood risk and housing price effects. Int. J. Disaster Risk Reduct. 2025, 122, 105452. [Google Scholar] [CrossRef] [Scilit]
- Elias, P.; Omojola, A. Case study: The challenges of climate change for Lagos, Nigeria. Curr. Opin. Environ. Sustain. 2015, 13, 74–78. [Google Scholar] [CrossRef] [Scilit]
- Adelekan, S.A.; Arogundade, S.T.; Dansu, O.O. Entrepreneurship and economic growth in Nigeria: Evidence from small and medium scale enterprises (SMEs) financing using asymmetric auto-regressive distributed lag. Glob. J. Commer. Manag. Perspect. 2016, 5, 43–50. [Google Scholar] [CrossRef] [Scilit]
- Oyetunji, A.K.; Amaechi, C.V.; Dike, E.C.; Ayoola, A.B.; Olukolajo, M.A. Factors influencing stakeholders’ decision to invest in residential properties: A perceptual analysis of flood-risk areas. Buildings 2023, 13, 1560. [Google Scholar] [CrossRef] [Scilit]
- Obiefuna, J.N.; Nwilo, P.C.; Atagbaza, A.O.; Okolie, C.J. Land cover dynamics associated with the spatial changes in the wetlands of Lagos/Lekki Lagoon system of Lagos, Nigeria. J. Coast. Res. 2013, 29, 671–679. [Google Scholar]
- Faisal Koko, A.; Yue, W.; Abdullahi Abubakar, G.; Hamed, R.; Noman Alabsi, A.A. Analyzing urban growth and land cover change scenario in Lagos, Nigeria using multi-temporal remote sensing data and GIS to mitigate flooding. Geomat. Nat. Hazards Risk 2021, 12, 631–652. [Google Scholar] [CrossRef] [Scilit]
- Wedawatta, H.G.S.D. Resilience of Construction SMEs to Extreme Weather Events; University of Salford: Salford, UK, 2013. [Google Scholar]
- Porter, J.R.; Shu, E.G.; Amodeo, M.F.; Freeman, N.; Bauer, M.; Almufti, I.; Ackerson, M.; Mehta, J. Commercial real estate at risk: An examination of commercial building and economic impacts in the United States using a high-precision flood risk assessment tool. Front. Water 2022, 4, 875995. [Google Scholar] [CrossRef] [Scilit]
- Lamond, J.E.; Bhattacharya-Mis, N.; Chan, F.K.S.; Kreibich, H.; Montz, B.; Proverbs, D.G.; Wilkinson, S. Flood risk insurance, mitigation and commercial property valuation. Prop. Manag. 2019, 37, 512–528. [Google Scholar] [CrossRef] [Scilit]
- Amadi, A. Toward disaster resilience in property management: The nomenclature of structural and non-structural building adaptation measures relative to flood exposure. Prop. Manag. 2024, 42, 771–792. [Google Scholar] [CrossRef] [Scilit]
- Sean, S.L.; Hong, T.T. Factors affecting the purchase decision of investors in the residential property market in Malaysia. J. Surv. Constr. Prop. 2014, 5, 1–13. [Google Scholar] [CrossRef] [Scilit]
- Abidoye, R.B.; Chan, A.P. Critical determinants of residential property value: Professionals’ perspective. J. Facil. Manag. 2016, 14, 283–300. [Google Scholar] [CrossRef] [Scilit]
- Hudson, P. The affordability of flood risk property-level adaptation measures. Risk Anal. 2020, 40, 1151–1167. [Google Scholar] [PubMed]
- Chambers, D.; Spaenjers, C.; Steiner, E. The rate of return on real estate: Long-run micro-level evidence. Rev. Financ. Stud. 2021, 34, 3572–3607. [Google Scholar]
- Mohammed, A.A.; Shonibare, I. Flood risk and its influence on residential property values: A case study of Victoria Island, Lagos State. J. Biodivers. Environ. Res. 2025, 9, 211–226. [Google Scholar]
- Samoray, C.; Hino, M.; Siders, A.R.; Agopian, A.; Mach, K.J. Housing amenity and affordability shape floodplain development. Land Use Policy 2024, 144, 107216. [Google Scholar] [CrossRef] [Scilit]
- Seenath, A.; Mahadeo, S.M.R.; Blackett, M. Decision-making under flood predictions: A risk perception study of coastal real estate. Risk Anal. 2025, 45, 1899–1925. [Google Scholar] [CrossRef] [Scilit] [PubMed]
- Wong, W.C.; Azhari, A.; Abdullah, N.A.H.; Yip, C.Y. Estimating the impact of crime risk on housing prices in Malaysia. Int. J. Hous. Mark. Anal. 2020, 13, 769–789. [Google Scholar]
- Bucciol, A.; Miniaci, R.; Pastorello, S. Return expectations and risk aversion heterogeneity in household portfolios. J. Empir. Financ. 2017, 40, 201–219. [Google Scholar] [CrossRef] [Scilit]
- Antony, A.; Joseph, A.I. Influence of behavioural factors affecting investment decision—An AHP analysis. Metamorphosis 2017, 16, 107–114. [Google Scholar] [CrossRef] [Scilit]
- Wangzhou, K.; Khan, M.; Hussain, S.; Ishfaq, M.; Farooqi, R. Effect of regret aversion and information cascade on investment decisions in the real estate sector: The mediating role of risk perception and the moderating effect of financial literacy. Front. Psychol. 2021, 12, 736753. [Google Scholar] [CrossRef] [Scilit] [PubMed]
- Milala, S.I.; Ariffin, K.B.M. Exploring sustainable real estate finance barriers to Sustainable Development Goals (SDGs) attainment and economic growth. Int. J. Res. Innov. Soc. Sci. 2025, 9, 12–43. [Google Scholar] [CrossRef] [Scilit]
- Tu, F.; Zou, S.; Ding, R. How do land use regulations influence industrial land prices? Evidence from China. Int. J. Strateg. Prop. Manag. 2021, 25, 76–89. [Google Scholar]
- Ajibola, M.O.; Izunwanne, E.M.; Ogungbemi, A.O. Assessing the effects of flooding on residential property values in Lekki Phase I, Lagos, Nigeria. Int. J. Asian Soc. Sci. 2012, 2, 271–282. [Google Scholar]
- Ugwuejim, S.C.; Otegbulu, A.C. An assessment of the market performance of commercial and residential property investments in Lekki, Lagos, Nigeria. Int. J. Real. Estate Stud. 2024, 18, 76–90. [Google Scholar] [CrossRef] [Scilit]
- Anule, S.A.; Umeh, O.L. Investment performance indicators of selected Lagos commercial properties. J. Prop. Investig. Financ. 2016, 34, 83–97. [Google Scholar] [CrossRef] [Scilit]
- Hair, J.F.; Black, W.C.; Babin, B.J.; Anderson, R.E. Multivariate Data Analysis, 8th ed.; Cengage Learning: Andover, UK, 2019. [Google Scholar]
- Green, S.B. How many subjects does it take to do a regression analysis? Multivar. Behav. Res. 1991, 26, 499–510. [Google Scholar] [CrossRef] [Scilit] [PubMed]
- Faul, F.; Erdfelder, E.; Buchner, A.; Lang, A.-G. Statistical power analyses using G*Power 3.1: Tests for correlation and regression analyses. Behav. Res. Methods 2009, 41, 1149–1160. [Google Scholar] [CrossRef] [Scilit] [PubMed]
- Oyetunji, A.K.; Olukolajo, M.A.; Ndudirim, N. Motivations for investing in flood risk environments: An agreement analysis between property investors and estate agents. Int. J. Disaster Risk Reduct. 2025, 119, 105304. [Google Scholar] [CrossRef] [Scilit]
- Rokeman, N.R.M. Likert measurement scale in education and social sciences: Explored and explained. EDUCATUM J. Soc. Sci. 2024, 10, 77–88. [Google Scholar] [CrossRef] [Scilit]
- Memmedova, K.; Ertuna, B. Development of a fuzzy Likert scale to measure variables in social sciences. Inf. Sci. 2024, 654, 119792. [Google Scholar] [CrossRef] [Scilit]
- Freitas, Y.G.P.M.D.; Moreira, F.G.P.; Souza, A.H.F.D.; Santos, V.I.M.D. Hedonic approach to vertical residential rentals in the Brazilian Amazon: The case of Belém, Pará. Buildings 2024, 14, 728. [Google Scholar] [CrossRef] [Scilit]
- Johnson, J.W. A heuristic method for estimating the relative weight of predictor variables in multiple regression. Multivar. Behav. Res. 2000, 35, 1–19. [Google Scholar] [CrossRef] [Scilit] [PubMed]
- Oladiran, O.; Ogunbajo, R.A.; Kemiki, O.A.; Ayoola, A.B.; Dauda, J.A. The investment and valuation nexus: Exploring the perceptions of Nigerian real estate valuation professionals. J. Prop. Investig. Financ. 2025, 43, 521–542. [Google Scholar] [CrossRef] [Scilit]
- Nunnally, J.C. Psychometric Theory, 2nd ed.; McGraw-Hill: New York, NY, USA, 1978. [Google Scholar]
- Nkwunonwo, U.C.; Whitworth, M.; Baily, B. A review and critical analysis of the efforts towards urban flood risk management in the Lagos region of Nigeria. Nat. Hazards Earth Syst. Sci. 2016, 16, 349–369. [Google Scholar] [CrossRef] [Scilit]

Disclaimer/Publisher’s Note: The statements, opinions and data contained in all publications are solely those of the individual author(s) and contributor(s) and not of MDPI and/or the editor(s). MDPI and/or the editor(s) disclaim responsibility for any injury to people or property resulting from any ideas, methods, instructions or products referred to in the content. |
© 2026 by the authors. Licensee MDPI, Basel, Switzerland. This article is an open access article distributed under the terms and conditions of the Creative Commons Attribution (CC BY) license.