


Abstract
Traditional methods for the structural analysis of tunnel linings are often hampered by complexity and significant time consumption, creating the need for a more efficient analysis workflow. To address this issue, this study develops an application oriented surrogate modeling framework centered on parametric design-driven MINN. The framework of PD-driven MINN leverages parametric design to systematically generate a comprehensive dataset of 2000 parameter groups from FEA, providing a robust foundation for model training. Meanwhile, the MINN architecture is tailored to process these diverse inputs, effectively capturing complex parameter interactions while balancing computational speed and modeling accuracy. To validate the proposed strategy, the model’s predictions were rigorously compared against real-world engineering data from pre-buried sensor measurements in an actual transportation tunnel project. The results indicate the reliability of a parametric design-driven MINN surrogate model. A comparative analysis demonstrates its superior fitting performance and convergence over traditional artificial neural networks. This study demonstrates the practical value of adapting existing neural network techniques and integrating them with parametric design to support more efficient tunnel lining structural analysis.
1. Introduction
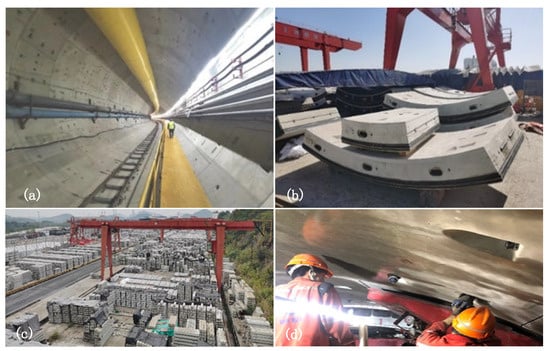
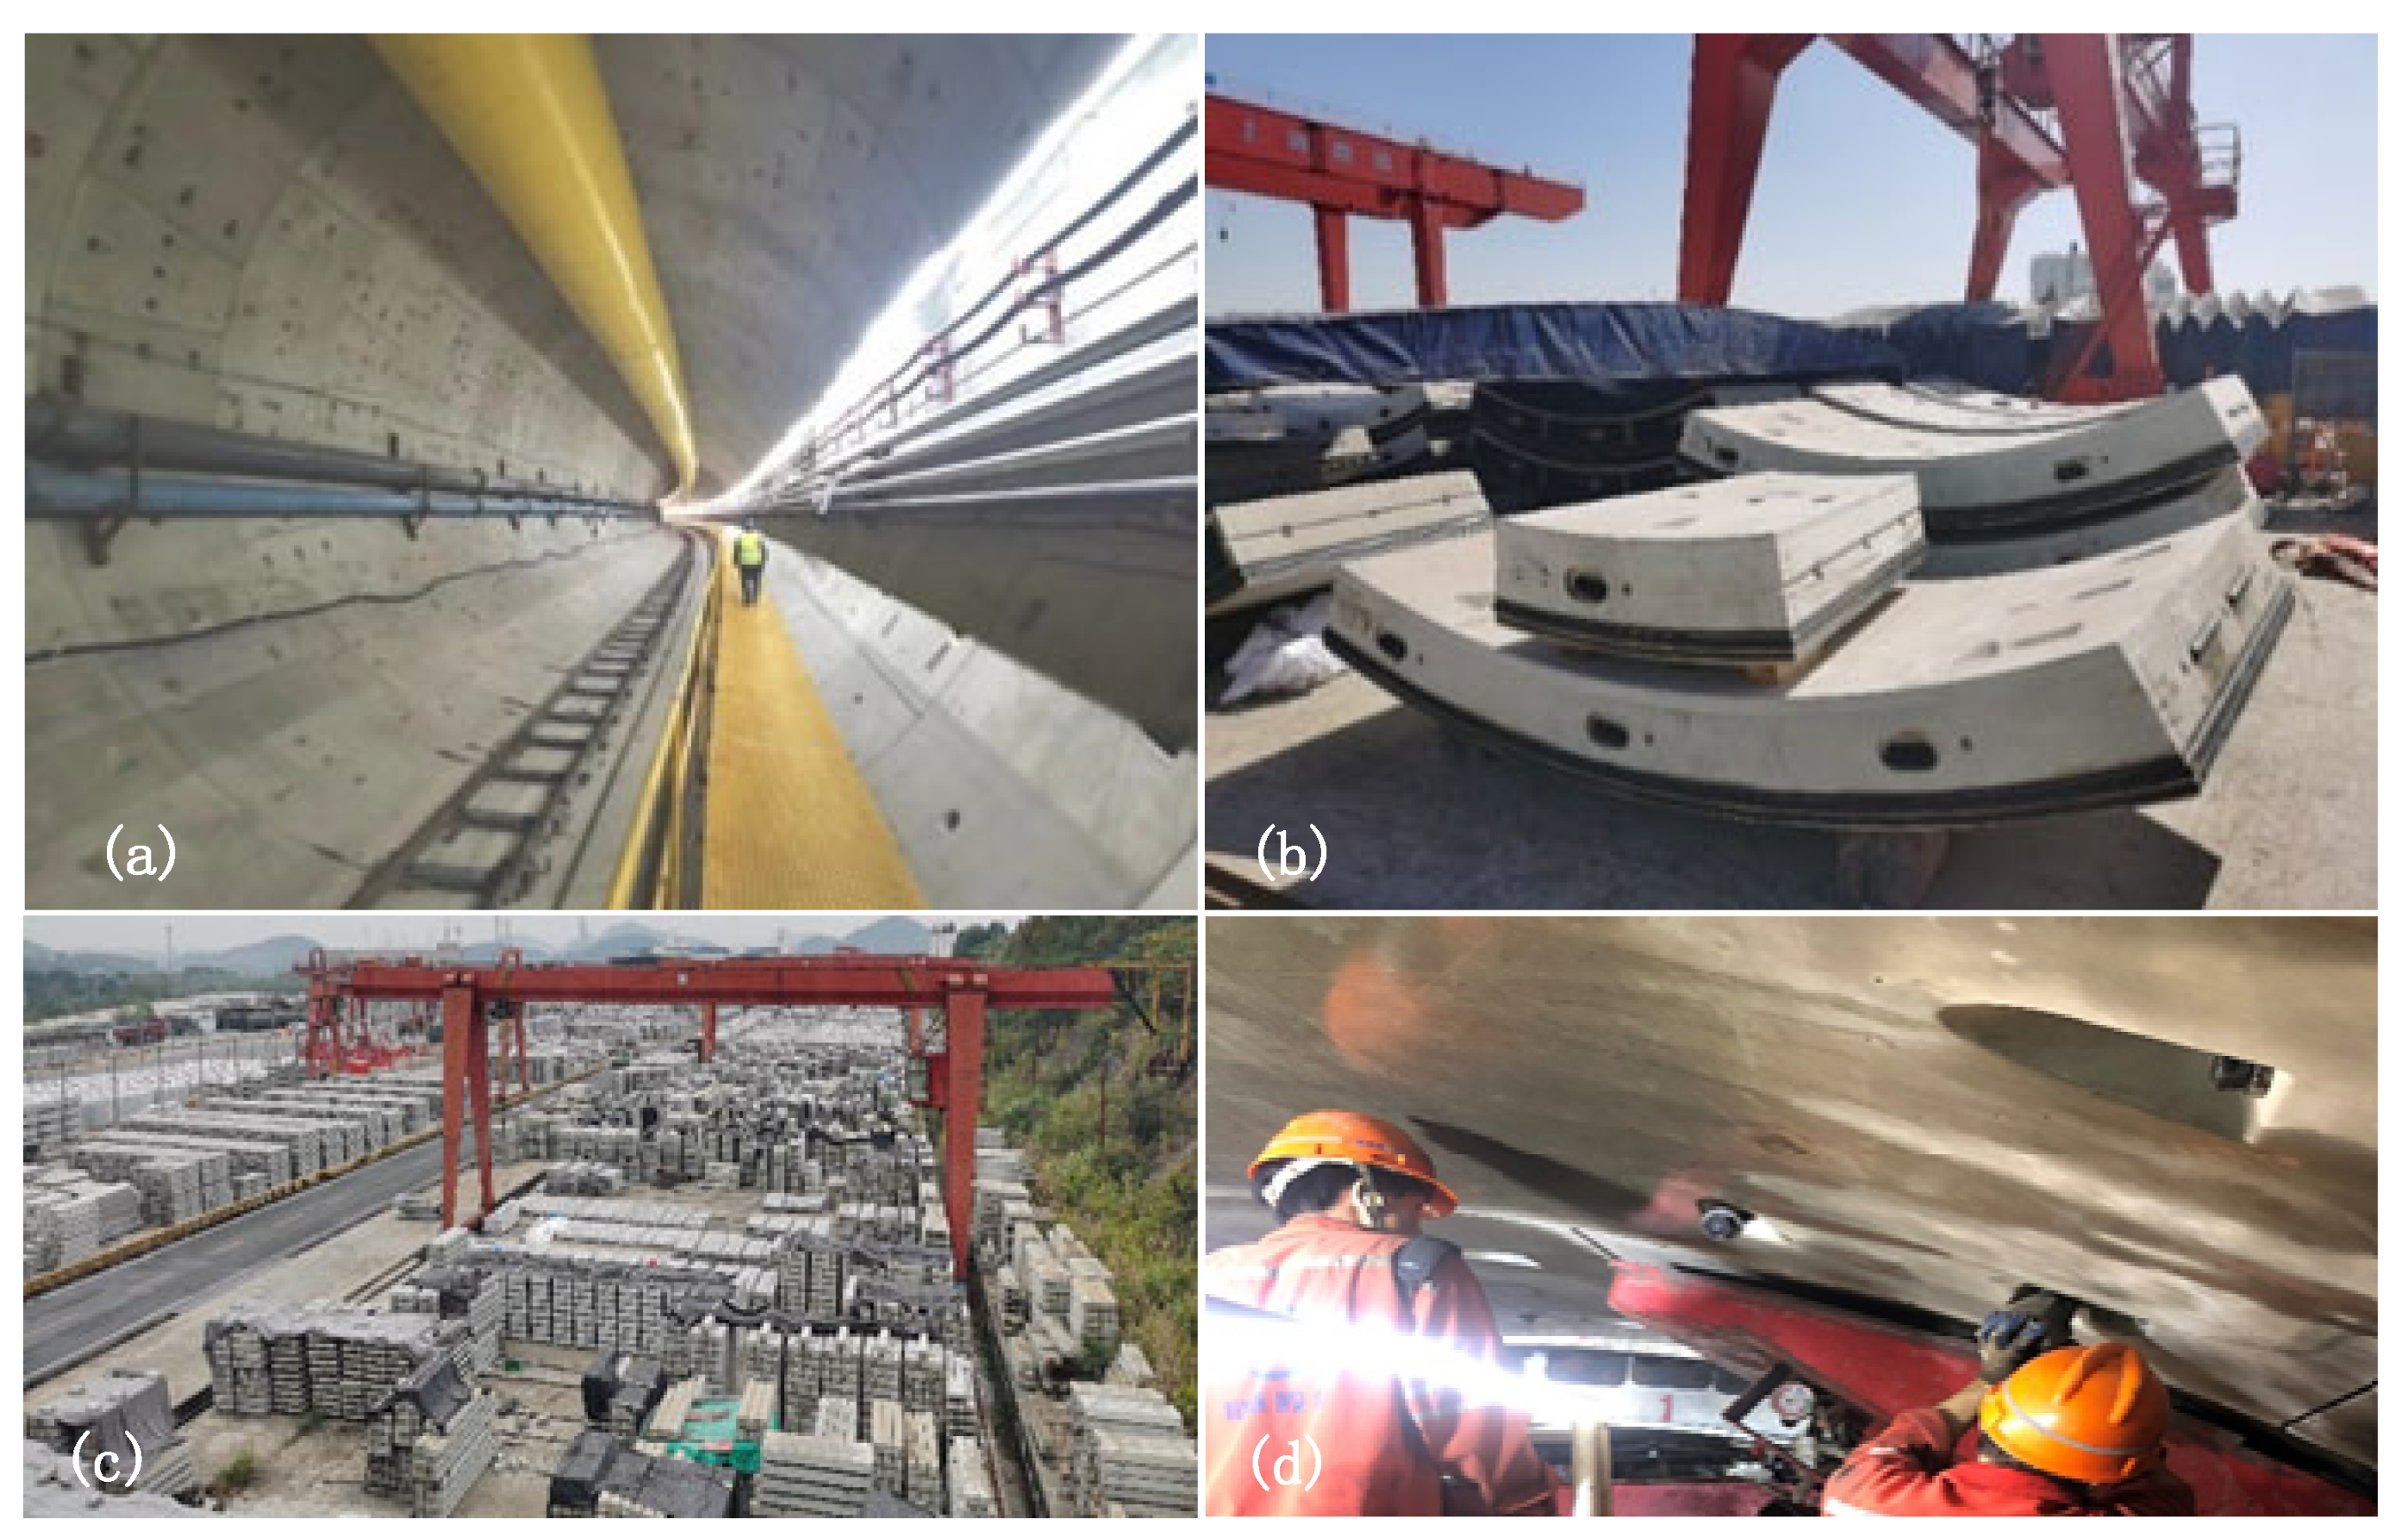
Shield tunnel linings(or shield linings) are the main structural components (see Figure 1) and are essential to the safety and durability of underground infrastructure. Structural performance analysis is therefore necessary to calculate the internal forces of tunnel linings and verify tunnel safety [1]. Numerical modeling has become an important tool for simulating and evaluating lining behavior under various conditions. With the development of digital technologies, their integration into the design process is increasingly important for improving information coordination and reducing operation errors [2].
Figure 1.
Photographs of tunnel linings in several different scenarios, referring shield tunnels. (a) Tunnel inside, (b) tunnel linings, (c) tunnel linings manufacturing, (d) tunnel linings assembly.
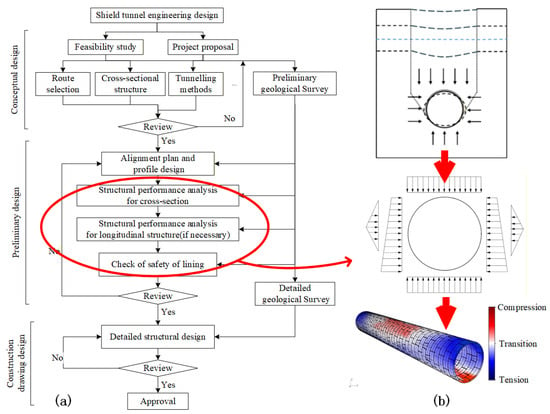
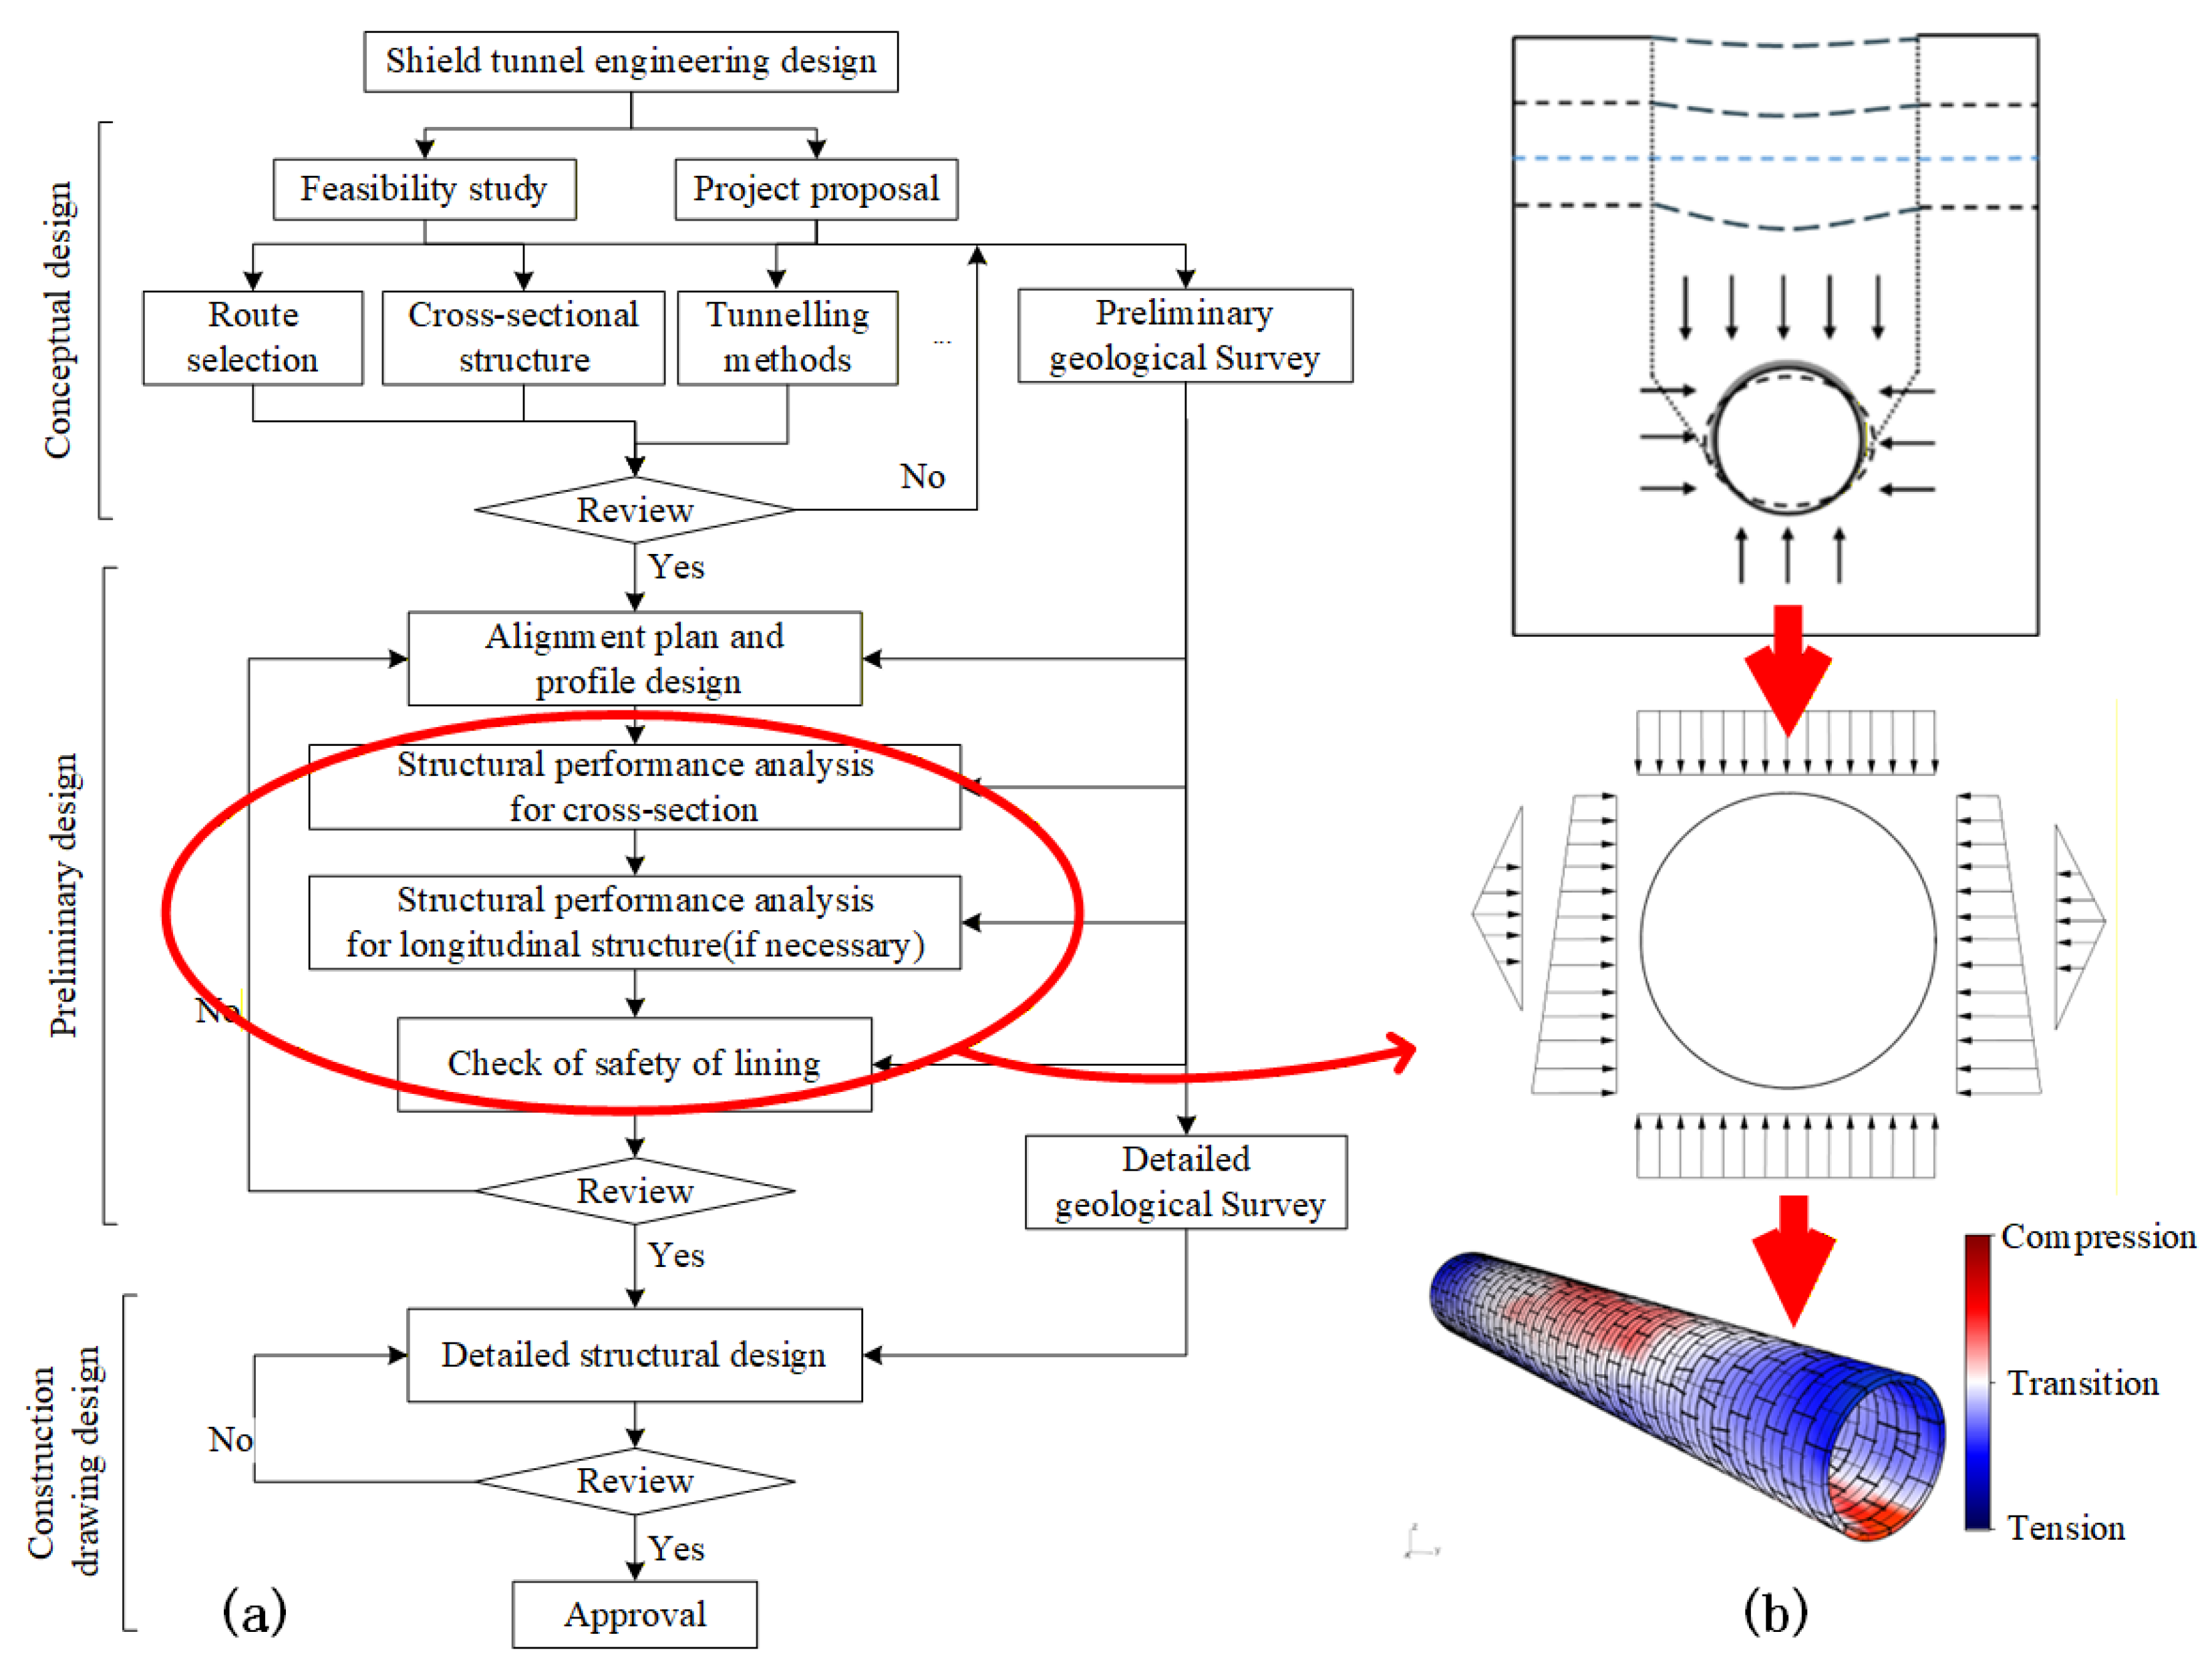
Traditional numerical modeling methods, such as finite element analysis (FEA), are often limited by high computational cost and long processing times [3]. They also require substantial preprocessing, including the definition of constraints and contact properties [4]. As shown in the conventional tunnel design workflow in Figure 2, a structural performance analysis using finite element analysis (FEA) may take approximately 20 to 120 min, which becomes a bottleneck in large-scale shield tunneling projects. Therefore, more efficient methods are needed to provide accurate results with lower computational demand. Digital technologies, such as machine learning and parametric design, offer potential solutions for reducing time consumption and computational cost while maintaining accuracy [5,6].
Figure 2.
Shield tunnel engineering design. (a) Design workflow. (b) Structural performance analysis.
Surrogate model provides an efficient alternative to traditional simulation methods by learning the latent associations underlying the complex relationships between variables and outcomes from historical computational data. It is particularly useful when conventional methods, such as finite element or finite difference simulations [7], are time-consuming and resource-intensive, and has shown value in engineering applications including shield tunnel design [8,9]. Neural networks are well suited for surrogate model construction because they can capture complex nonlinear relationships among variables and parameters, as demonstrated in the study by Wang et al. [10]. In particular, multi-input neural networks (MINNs) may be suitable for tunnel lining analysis, where interactions among multiple variables must be considered, as shown in the case study structural damage in beam structures by Dulgalam and Prakash [11]. This type of neural network provides a basis for improving computational efficiency and predictive accuracy in structural performance analysis.
The primary objective of this study is to develop an efficient optimization strategy for tunnel lining structural analysis, where multiple design variables and parameter definitions must be handled simultaneously. To this end, parametric design (PD) is adopted to convert the conventional structural analysis workflow into a programmable and repeatable process, so that large amounts of high-consistency training data can be generated efficiently under different design conditions. Based on these data, a multi-input neural network (MINN) is established to capture the interactions and dependencies among multiple input parameters and corresponding structural responses. Through this combination, a PD-driven MINN surrogate model is developed as an efficient alternative to traditional numerical analysis in shield tunnel engineering design. The proposed strategy is further trained and validated through a real tunneling project.
2. Literature Review
This section reviews the literature relevant to surrogate modeling for structural analysis to provide theoretical foundations for proposing the methodology. It first examines common neural network architectures and the critical role of dataset preparation. Subsequently, the review narrows its focus to the specific applications of these models in structural performance analysis, identifying the research gap that this study to address.
2.1. Architectures and Datasets of Neural Networks
Neural network architectures, particularly in surrogate modeling, have emerged as efficient alternatives to traditional computational methods like FEA due to their ability to approximate complex system behaviors with reduced computational resources. Multi-Layer Perceptrons offer a universal framework capable of modeling intricate nonlinear relationships between variables [12] and have been successfully applied to optimize designs in various engineering fields [13]. However, a standard Multi-Layer Perceptron architecture treats all inputs uniformly, which can be a limitation when the input parameters represent fundamentally different physical concepts, such as geometric properties, material characteristics, and external loads. Other architectures, such as convolutional neural networks, have shown strong performance in handling spatially structured data [14]. For tasks involving heterogeneous inputs, multi-input neural networks (MINNs) offer an important advantage, because they can process variables with different physical meanings in separate branches and then model their interactions in an integrated manner [15]. These studies indicate that a neural network’s architecture design is closely related to the nature of the input data and the target engineering task.
In addition to network architecture, dataset definition and training strategy are also critical to the performance of surrogate models. Preprocessing operations such as normalization and standardization are essential for improving feature extraction and training stability, particularly in FEA-based structural analysis. Liao et al. [16] and Jiang et al. [17] emphasized the importance of properly defining structural design features and loading conditions as model inputs. At the training stage, techniques such as dropout [18], regularization [19], and suitable optimizer selection [20] contribute to balancing fitting accuracy and generalization ability. These studies collectively show that surrogate modeling performance depends not only on the neural network structure itself, but also on the consistency, quality, and organization of the training data.
2.2. Applications in Structural Analysis
The use of artificial neural networks as surrogate models has gradually expanded in structural and mechanical analysis. In tunnel lining research, Rastbood et al. [21] reported an early application of artificial neural networks (ANNs) to the mechanical analysis of tunnel linings. More broadly, deep neural network and ANN have been applied in structural performance analysis for the prediction of engineering responses such as natural frequencies and stress fields [22,23]. Mortazavi and Ince [24] further showed that ANN models could be used to estimate J-integral values near crack tips. These studies demonstrate that neural network-based surrogate models are feasible tools for approximating structural responses in engineering mechanics.
Another common feature of recent studies is the integration of surrogate models with high-fidelity numerical simulations, particularly FEA, to reduce the repeated computational cost of structural analysis [25,26]. In such workflows, simulation results are commonly used as training data, while the trained surrogate model is then applied to accelerate response prediction, parametric studies, and optimization [27,28]. Recent studies have further shown that this strategy can support probabilistic analysis and even real-time or interactive engineering applications [29]. These developments further confirm the practical value of surrogate modeling in structural analysis, while also suggesting that the way training data are generated and organized is crucial to the final applicability of the model.
Overall, previous studies have confirmed the value of neural network-based surrogate models in structural analysis, and they have highlighted the importance of both architecture design and data preparation. However, for tunnel lining structural analysis, three issues remain insufficiently addressed. First, existing studies have not fully developed a surrogate model architecture specifically suited to the multi-source input characteristics of tunnel lining design parameters. Second, although the importance of training data has been widely recognized, the literature has paid less attention to integrating parametric design with numerical analysis to enable automated and consistent large-scale dataset generation. Third, engineering validation based on field measurements is still limited in this area.
3. Methodology
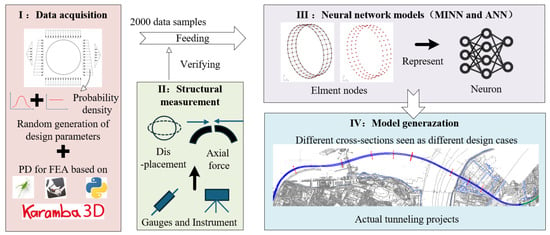
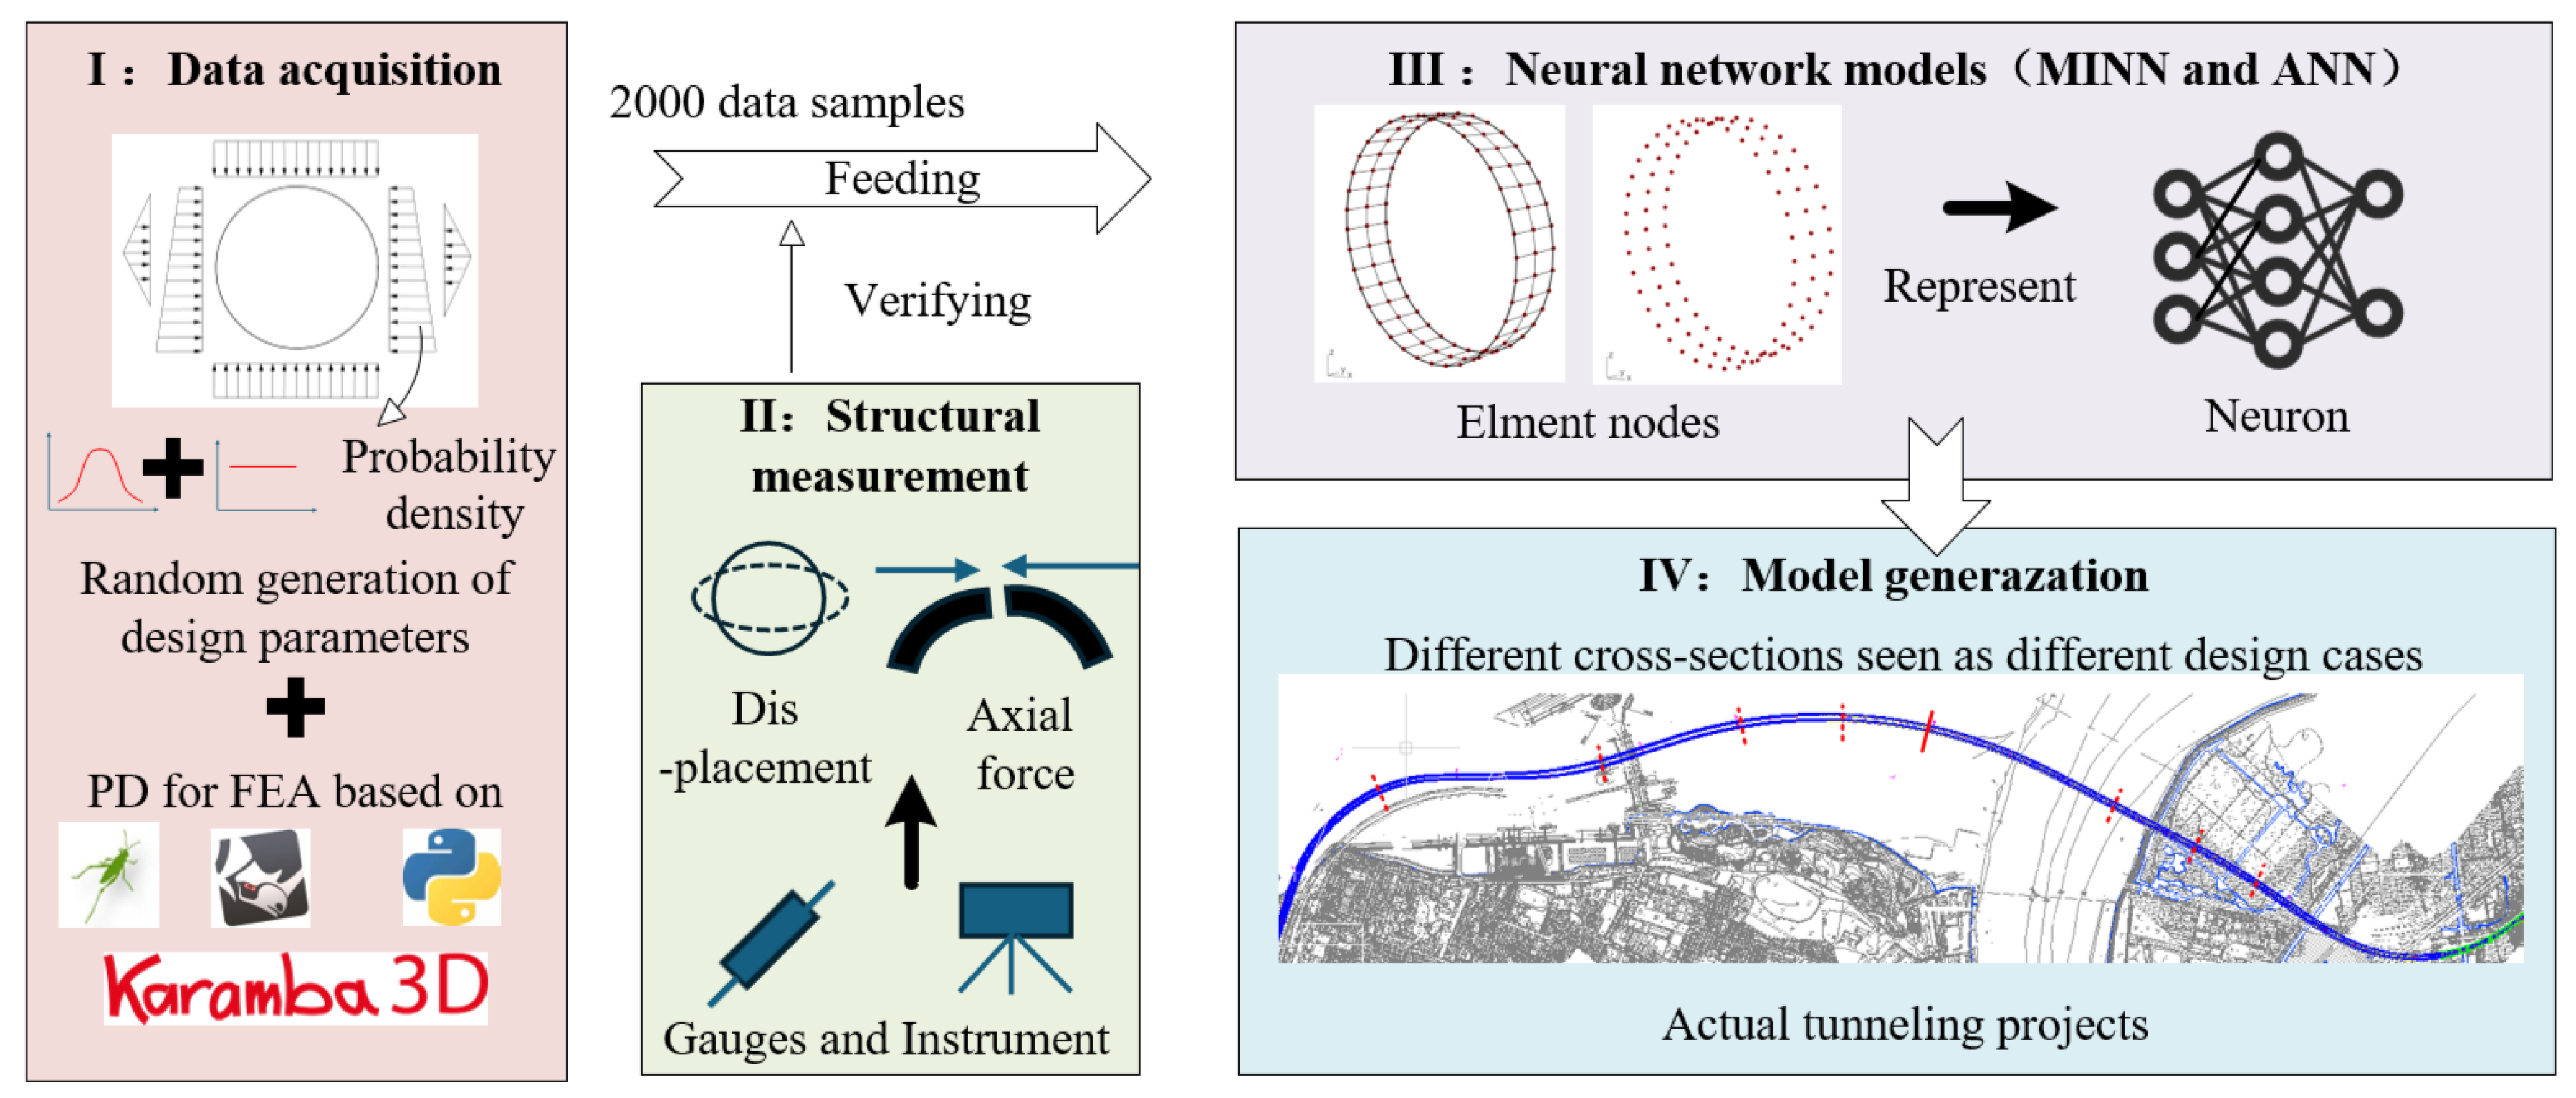
The workflow of this study is illustrated in Figure 3, which integrates experimental methods, simulations, and characterization data techniques. The process encompasses four major components, spanning training data acquisition to model generation. The PD-based FEA workflow is implemented in Grasshopper 1.0 within the Rhino 8 3D platform, and Karamba3D 2.2 is used as the finite element solver for the shell analysis. Keras 3.14.0 integrated with TensorFlow 2.21.0 is adopted for neural network development.
Figure 3.
The workflow of developing MINN in this study.
Initially, PD for structural modeling is employed to perform FEA. This process, hereafter referred to as PD structural analysis, is encapsulated and repeatedly utilized as a programmable module. Subsequently, the rationality of the results will be verified through structural measurements using pre-buried sensors in a real tunnel. Then, to extract data characteristics from the FEA results produced by PD, certain ANN models are proposed. A MINN model will be constructed and trained using 2000 data samples to drive its feature extraction capabilities for structural analysis. In the PD stage, an auxiliary SVM-based classifier is used only for the automatic regrouping of shell elements when assigning loads and boundary conditions; it is not used for structural response prediction. The MINN model is exclusively trained using datasets generated by PD.
3.1. Training Data Acquisition from Parametric Design
The training data acquisition process for analyzing the structural performance of tunnel linings using PD relies on a homogeneous ring assumption with equivalent stiffness treatment. In other words, the simulations do not employ a nonlinear constitutive law for the concrete segments or joints; instead, the segmental lining ring is idealized as a continuous ring, and the joint effect is introduced through equivalent parameters. This type of assumption is widely used in practical shield tunnel design because it preserves the global ring response while keeping the model compact enough for repeated parametric calculations.
In this study, the ring is represented by shell elements, and the ground resistance is introduced by equivalent springs. The linings are primarily modeled using shell elements for two reasons: Firstly, shell elements effectively capture the bending and torsional behavior of the lining, which are critical mechanical characteristics in tunnel design; secondly, compared to solid elements, shell elements significantly reduce computational costs, enabling large-scale parametric analysis. Although this assumption disregards the consideration of whether the load is uniformly distributed along the longitudinal direction, it achieves a balance between computational efficiency and accuracy, making it particularly suitable for rapid design iterations in the preliminary design phase.
To account for the segmental nature of the lining, the joint influence is not modeled explicitly by contact or interface elements. Instead, an equivalent stiffness coefficient η is used to reduce the ring stiffness so that the segmented lining can be transformed into an equivalent continuous ring for structural analysis. In addition, the staggered-joint effect on bending response is represented by a bending moment amplification factor ζ. Therefore, η controls the equivalent stiffness reduction in the ring, whereas ζ is used to correct the bending moment level after the global ring response has been obtained. This modeling and calculation process can be defined by the following equation:
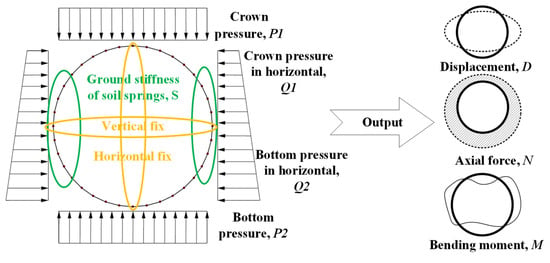
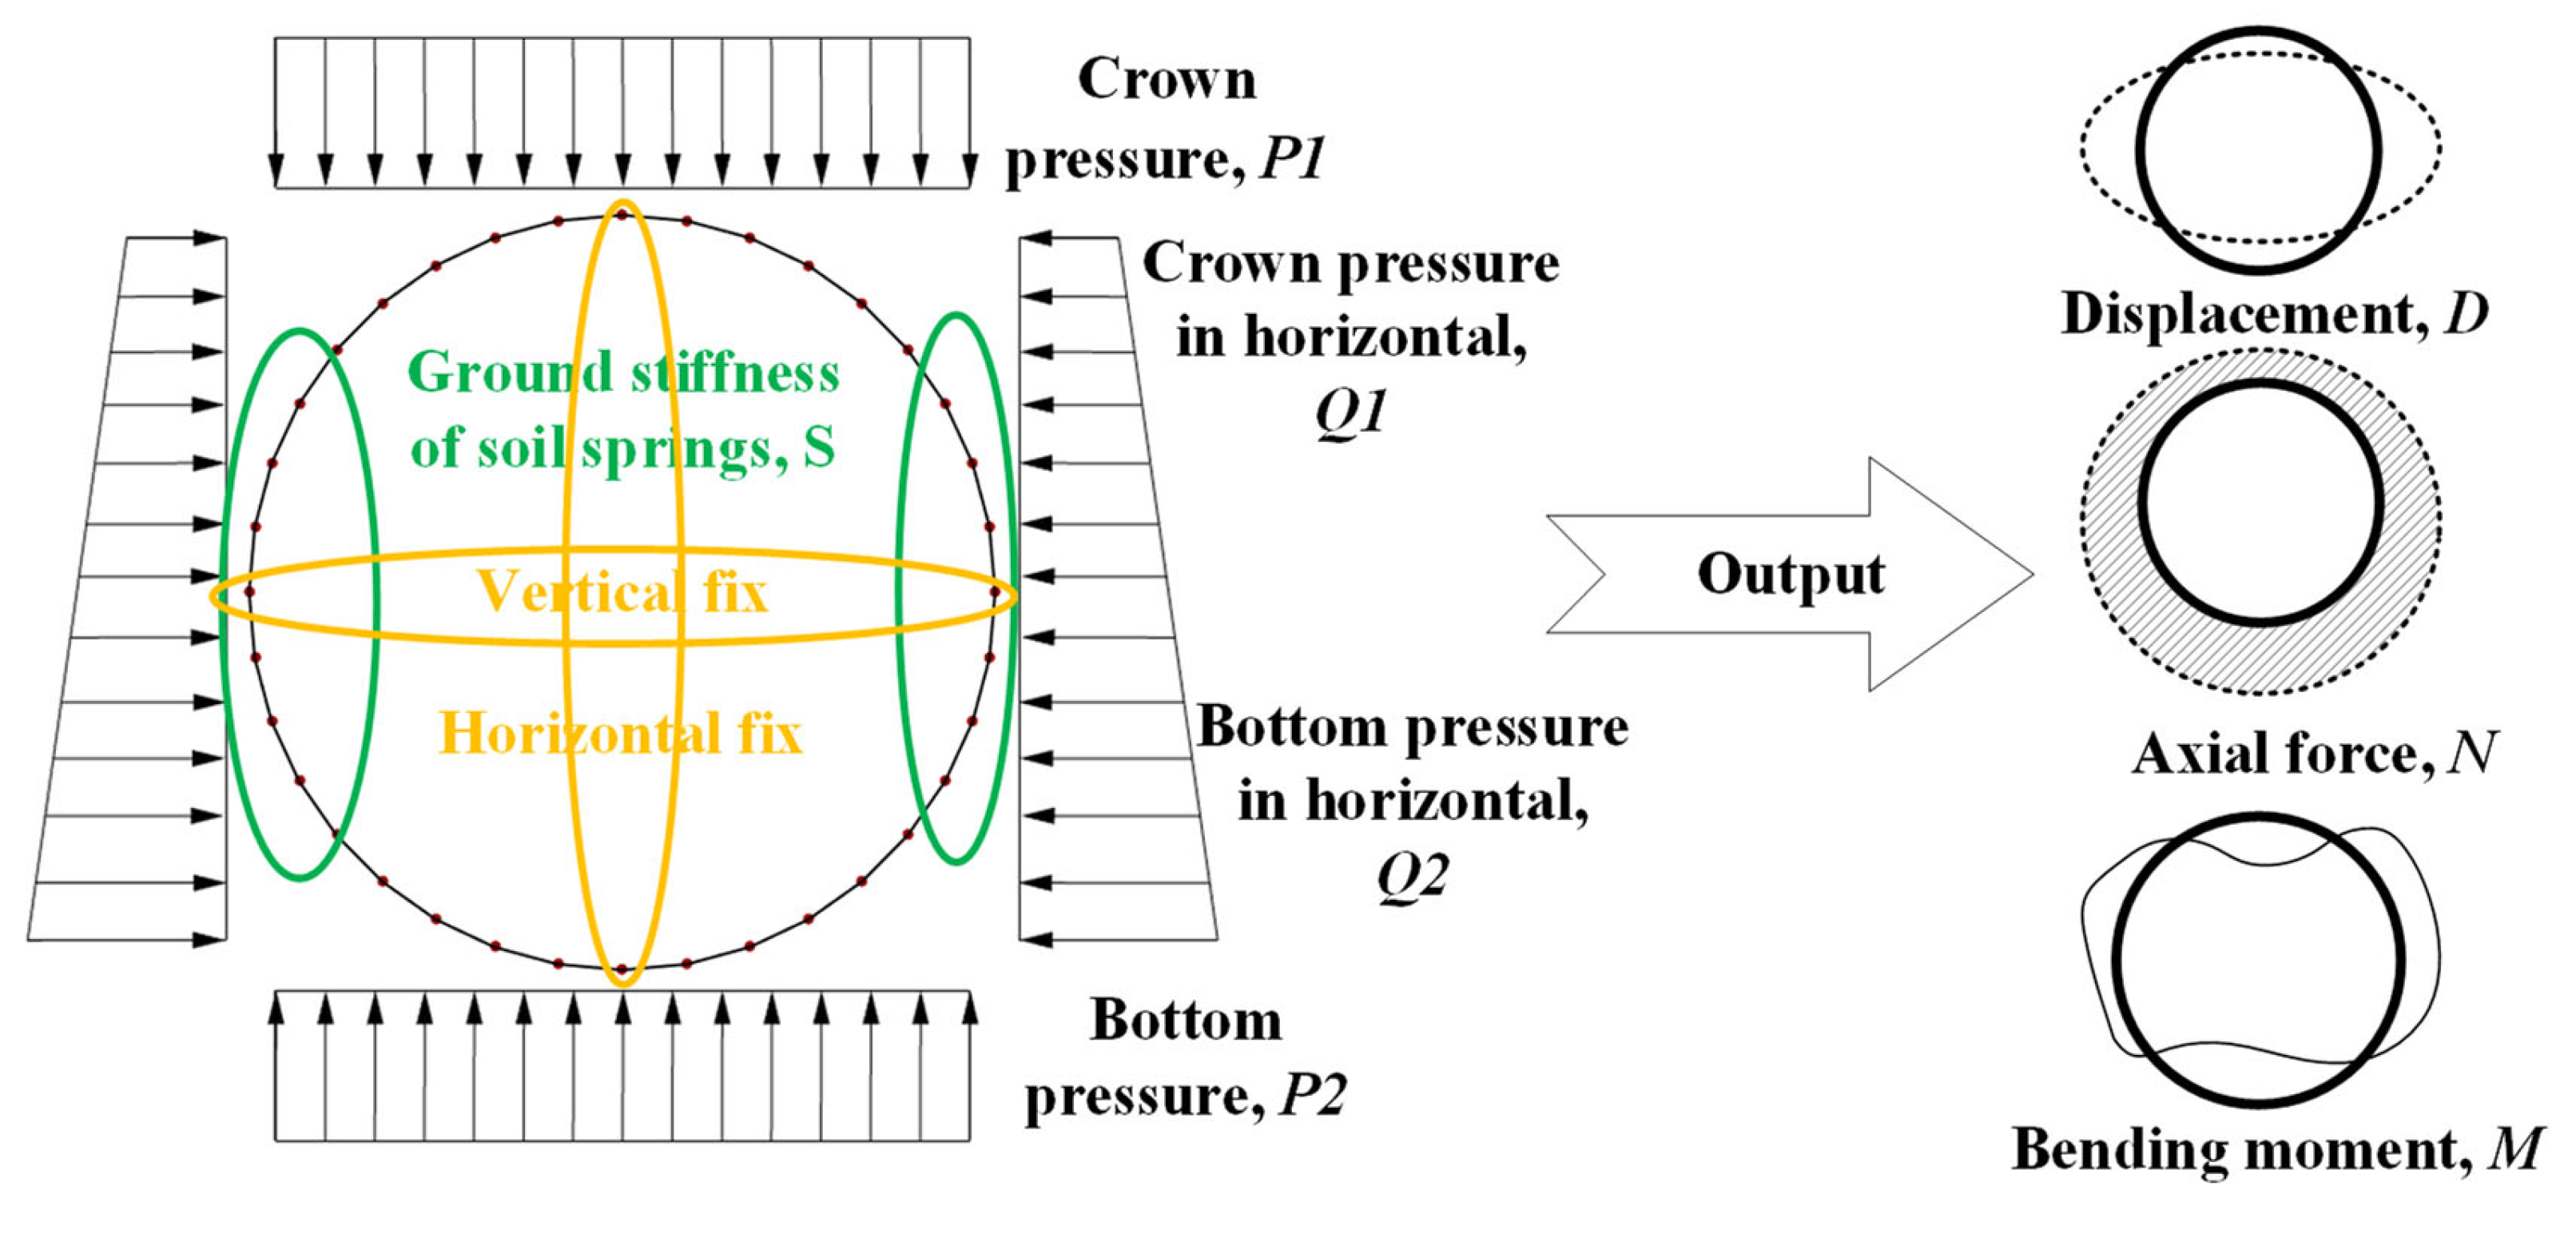
where function f ( ) represents PD for structural analysis, R represents the lining ring’s outside radius, H represents the thickness, B represents the width, η represents the equivalent stiffness coefficient for the homogenized ring, P1 represents the crown pressure from earth load and groundwater on the linings, P2 represents the bottom pressure, Q1 represents the horizontal crown pressure, Q2 represents the horizontal bottom pressure, S represents the equivalent ground stiffness of the soil springs used to simulate the surrounding subsoil support around the lining, D represents the analyzed lining ring’s displacement, N represents the analyzed lining ring’s axial force, and M represents the analyzed lining ring’s bending moment. In other words, the stiffness of the subsoil is taken into account through the equivalent spring stiffness parameter S, while the discontinuity effect of joints is introduced through η and ζ rather than through explicit joint elements.
The parameter ζ does not need to appear directly in Equation (1) because it is applied as a correction factor to the bending moment results. Therefore, the present simulations should be understood as a linear shell–spring analysis based on a homogeneous ring model with equivalent stiffness treatment, instead of a detailed nonlinear material constitutive model. This process can be regarded as one that involves inputting the design parameters of the size and constraint conditions and outputting structural mechanic responses, like Figure 4 illustrates. In this way, training data acquisition from PD structural analysis should encompass two key components: the logic of parametric modeling and the automatic definition of the constraint conditions.
Figure 4.
The structural performance analysis of tunnel linings through using equivalent stiffness theory.
3.1.1. Parametric Modeling for Tunnel Linings with Shell Elements
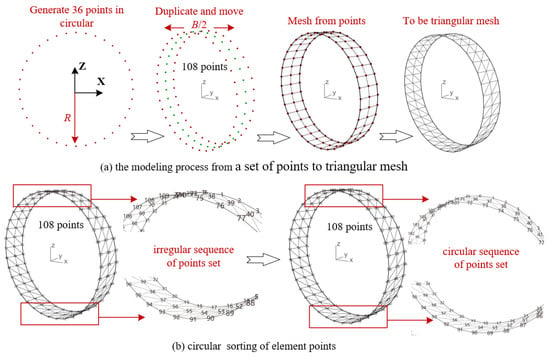
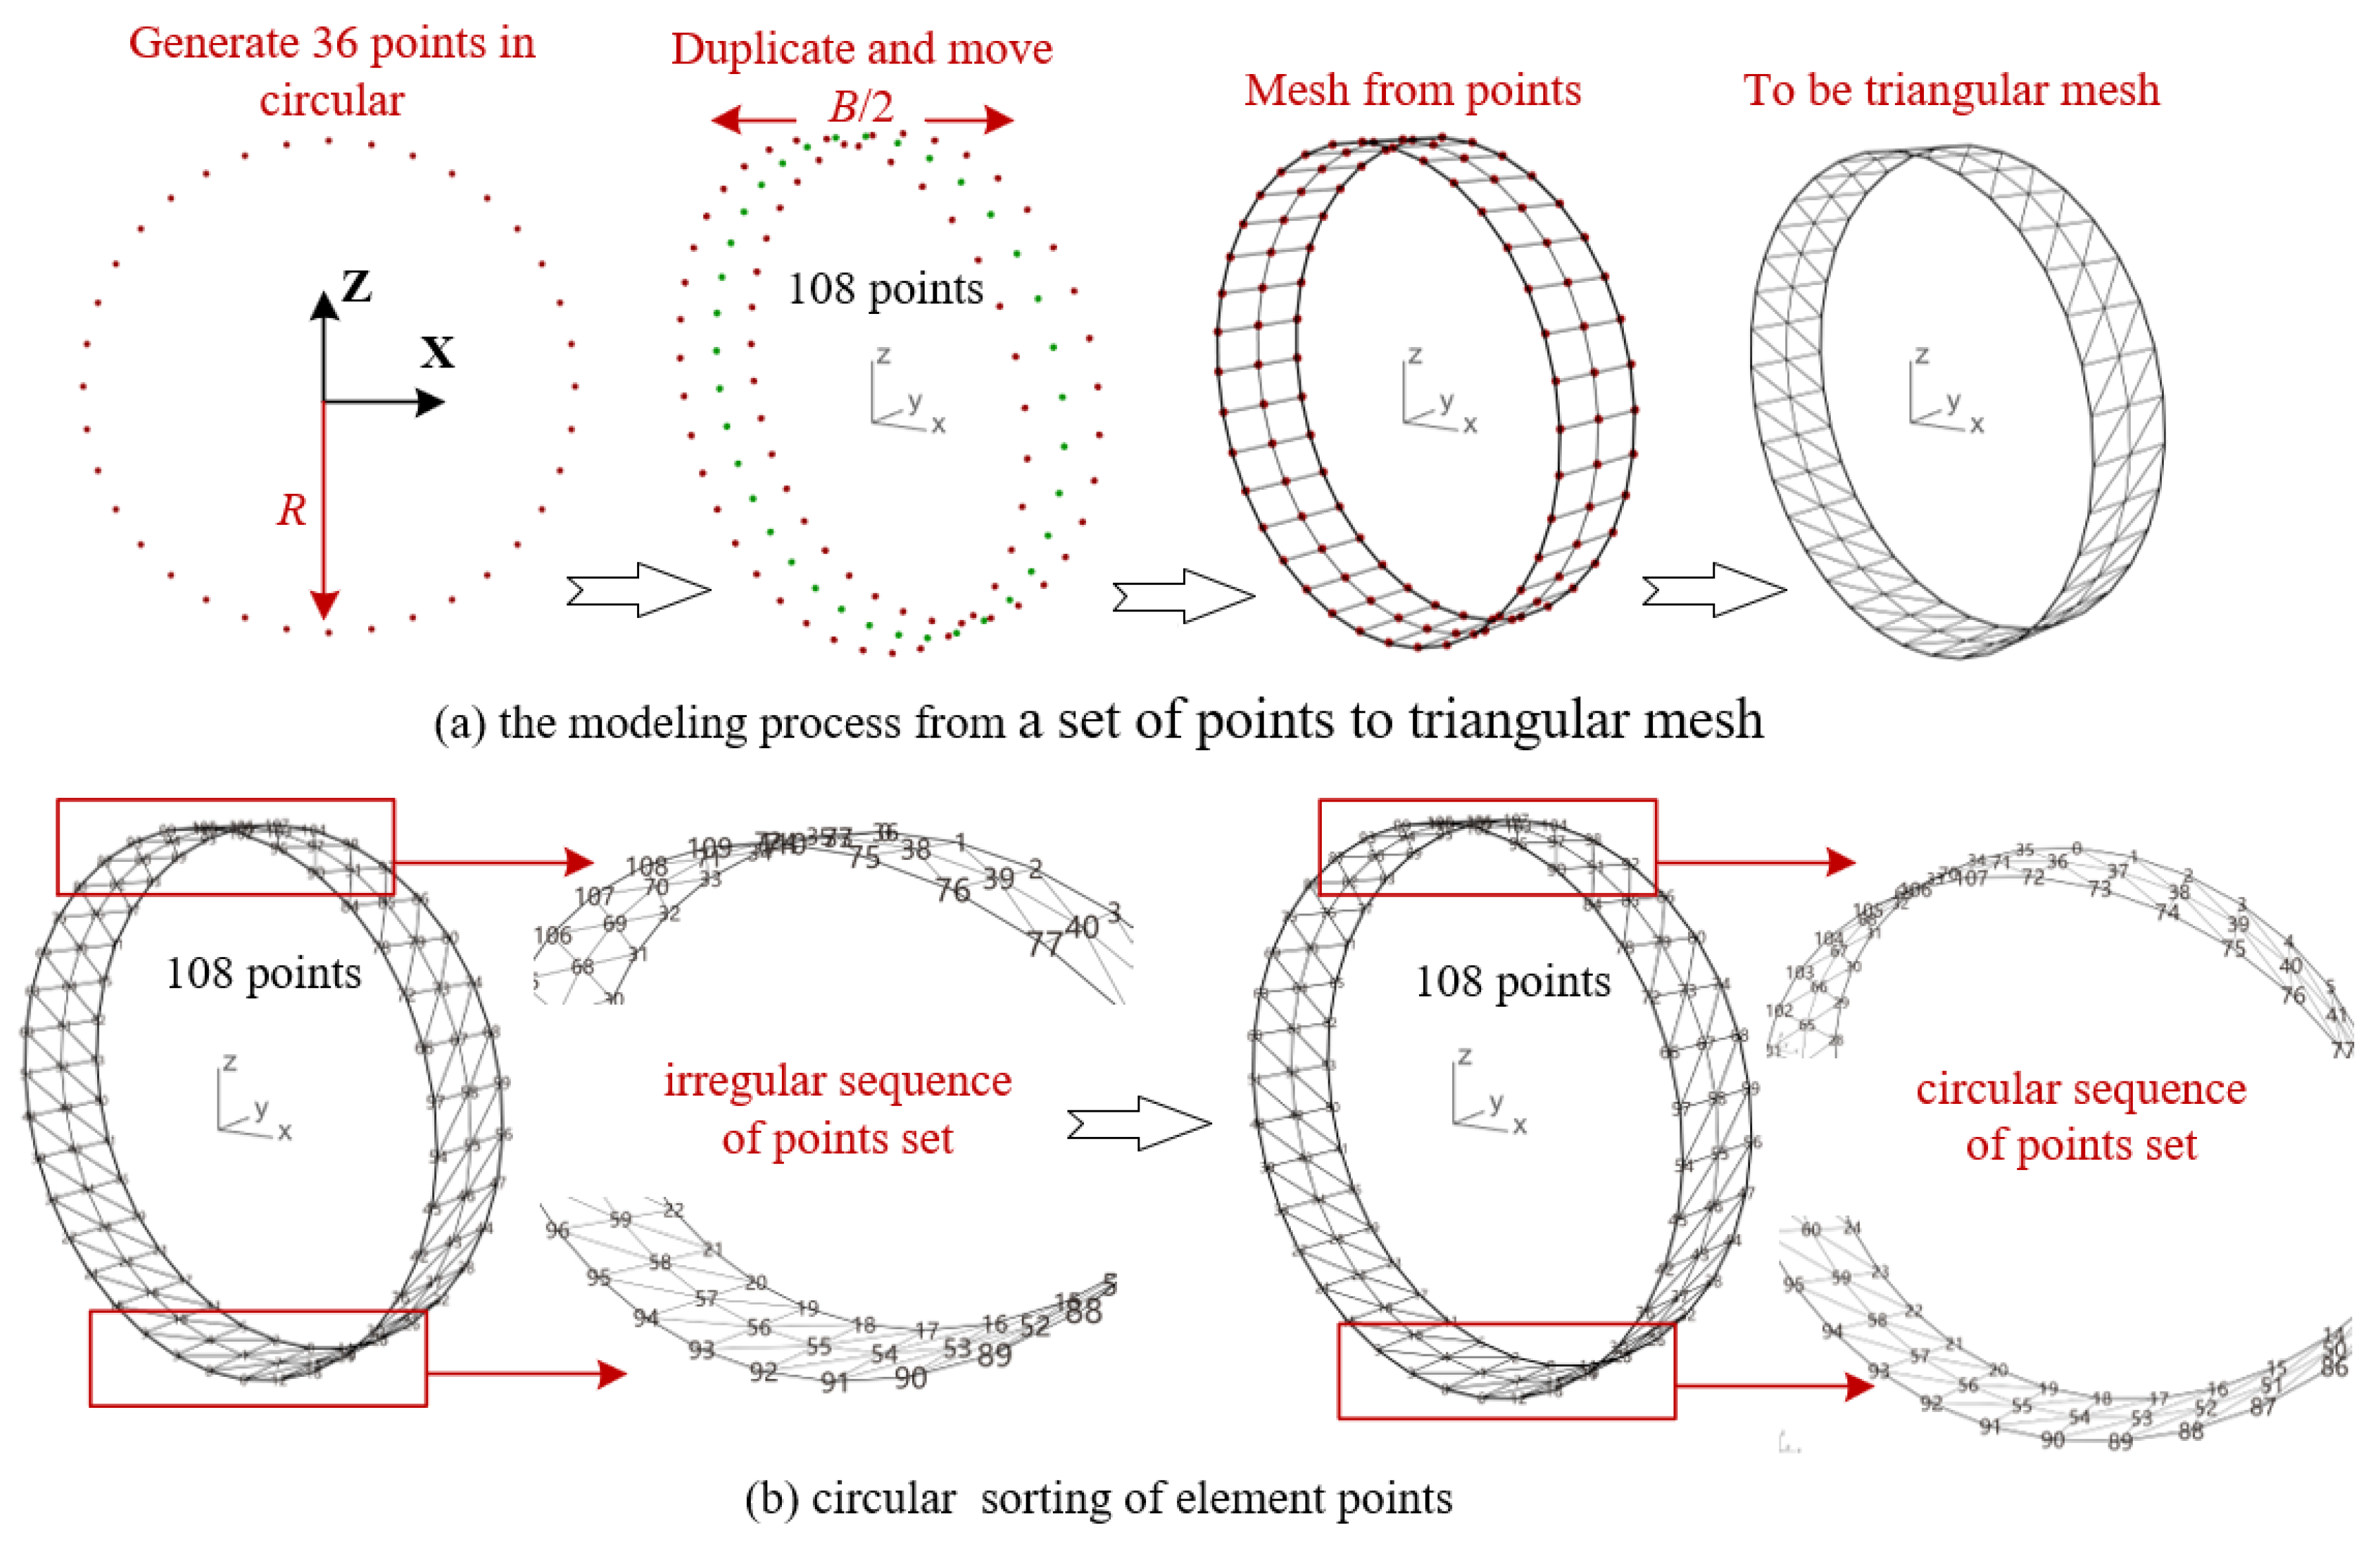
The tunnel linings are modeled as a homogeneous ring using shell elements. In this study, the final finite element calculation is performed with triangular shell elements. However, to obtain a regular and traceable nodal arrangement along the lining ring, the mesh is first generated as a structured quadrilateral grid from the grid points, and each quadrilateral face is then subdivided into two triangular shell elements before analysis. In this way, the quadrilateral mesh serves only as an intermediate template for orderly node layout and automatic mesh generation, whereas the final computation remains based on triangular elements. This strategy is adopted because it keeps the point numbering and circular sorting regular for subsequent data characterization, while also retaining the geometric flexibility of triangular elements in the shell analysis. This paper proposes Algorithm 1 to accomplish modeling for a homogeneous ring using shell elements. The modeling process begins with identifying a set of points, which are then used to generate the structured quadrilateral faces and their derived triangular shell elements, and finally, the point set of the shell elements is sorted. The purpose of this circular sorting is to facilitate data characterization in subsequent neural network training. Figure 5 illustrates the details of each step in the modeling process. Ultimately, the mesh model will be generated automatically through a text format, which can be illustrated as Equation (2).
| Algorithm 1 Logical modeling procedure and rules of parametric shield linings modeling |
| Input: lining ring’s radius, R; lining ring’s width, B; Output: the homogeneous ring with shell elements, Shell_model
|
Figure 5.
The homogeneous ring of tunnel linings generated from PD structural analysis.
3.1.2. Automatic Definition of Constraint Conditions Based on SVM
The automatic definition of constraint conditions requires the classification of shell elements so that loads, springs, and boundary constraints can be assigned to the correct areas automatically. For instance, top loads are only allocated to the upper half of the elements, and ground springs are positioned on the left and right 90° regions to represent the supporting stiffness of the surrounding subsoil. In this shell–spring assumption, the spring stiffness is defined by the parameter S in Equation (1). The elements located at specific positions, such as the upper and lower vertices and the left and right vertices, should have their horizontal or vertical movements fixed to prevent non-convergence in parametric calculations. This process is achieved through a systematic regrouping of shell elements based on their angular positions.
Although the main predictive model of this study is the MINN surrogate, the SVM introduced here serves a different purpose. It is used only as an auxiliary classifier in the PD preprocessing stage to automate the regrouping of shell elements for dataset generation rather than for the prediction of structural responses. This regrouping task is essentially a small-scale geometric classification with discrete labels such as top/bottom and left/right and laterally constrained regions. For this purpose, SVM was adopted because it can provide stable decision boundaries with limited labeled samples and low computational overhead, which is sufficient for repeated automatic generation of PD cases. Different regrouping tasks require different kernel functions, because their decision boundaries are not identical. In Table 1, the top/bottom and left/right regroupings are approximately linearly separable, so a linear kernel is used. By contrast, the lateral constraint regrouping corresponds to two side sectors within a specified angular range and is better represented by a nonlinear boundary, so the radial basis function kernel is adopted. Several kernel types within the SVM family were tested during implementation, and the final selection was made according to whether the resulting regrouping could correctly reproduce the intended geometric partition under repeated parameter settings.
Table 1.
Kernel function selections in SVM model for regrouped shell elements.
Furthermore, the input variables of η, H, and material properties require additional configuration. However, this must correspond to specific engineering cases and design requirements rather than being predetermined through automation.
3.2. Structural Measurement Based on Multi-Sensors
Field measurements were conducted to provide independent engineering validation for the outputs of the parametric structural model. In this study, the monitored quantities were limited to displacement and axial force, which are also the two response indices used in the subsequent validation. The measurements were not used for model training because the available field data were sparse, section-specific, and partially incomplete; instead, they were reserved as external reference data for validation.
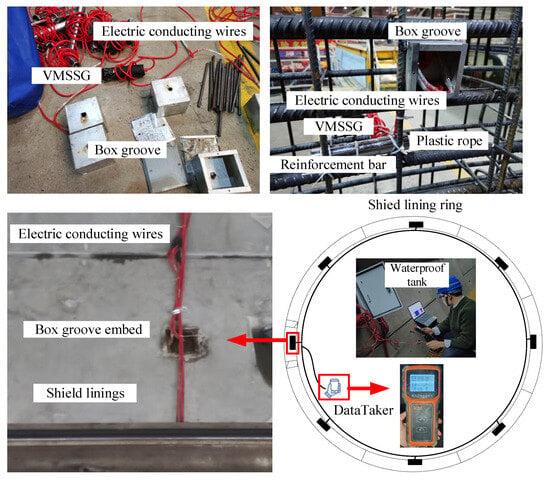
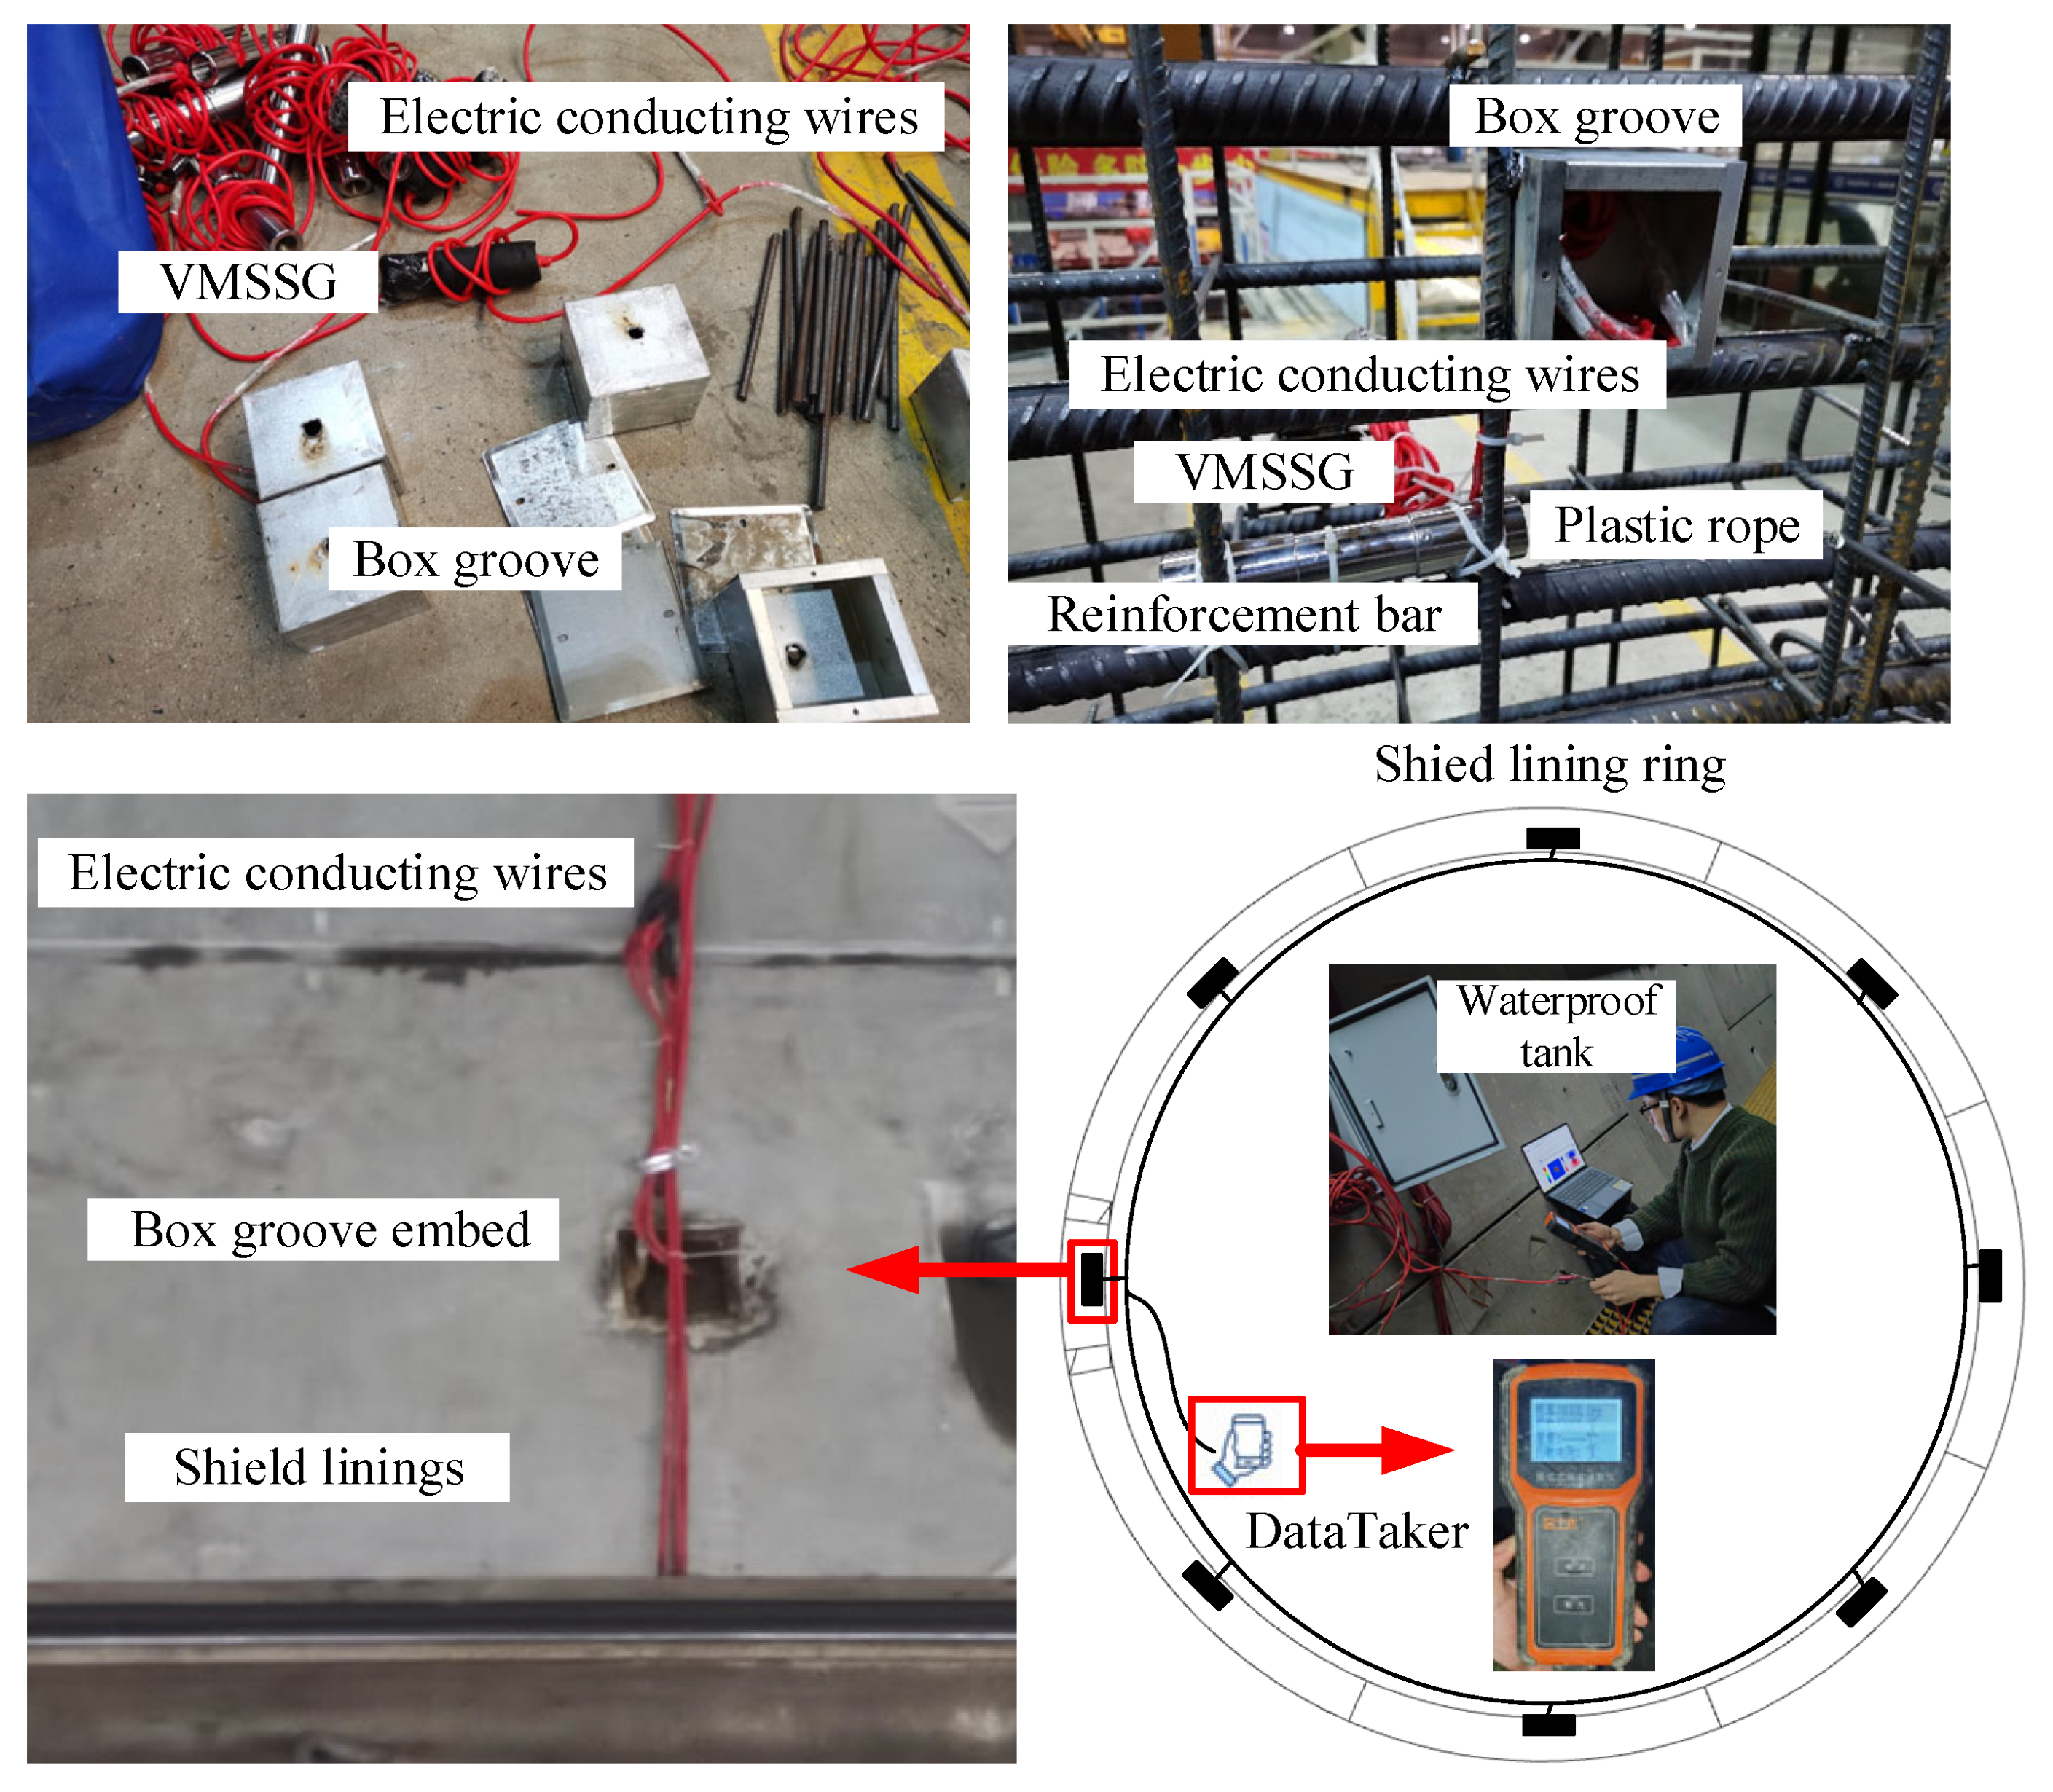
JXGJJ-100 Vibrating Wire Steel Stress Gauge (VMSSG), which planned to be pre-embedded in the tunnel linings, is manufactured from JINTUMU Co. Ltd. in Changzhou, China. VMSSG has a diameter of 20 mm and can measure a stress range spanning 0~400 kPa. Additionally, VMSSG is capable of withstanding 0~300 kPa water seepage pressure. The testing error is conserved within a margin of 0.5% relative to the stress values. VMSSG was connected with the linings’ main reinforcement bar using plastic ropes before the linings were prepared and cast with concrete (as shown in Figure 6). The electric conducting wires of VMSSGs will be pulled out through box grooves and collected in a waterproof tank. The testers can use a DataTaker to read the data from the gauges near the waterproof tank.
Figure 6.
Preparation and testing of VMSSG inside the shield tunnel.
JTM-V10A DataTaker from China is employed to perform data reading from the gauges. Following installation and maintenance, each VMSSG should be checked to ensure its survival by testing VMSSG’s frequency value with the DataTaker. The axial force calculation from the frequency values is explained as Equations (3)–(4):
where σ represents testing stress, kPa; N represents testing axial force, kN; S represents VMSSG’s cross-sectional area, m2; k represents the calibration coefficient; Ft represents the recorded frequency value on testing day; and F0 represents the recorded frequency value. When the segment lining finishes assembly, the testing schedule starts from the date of the lining’s assembly, taking measurements every 2 days until the values are essentially stable.
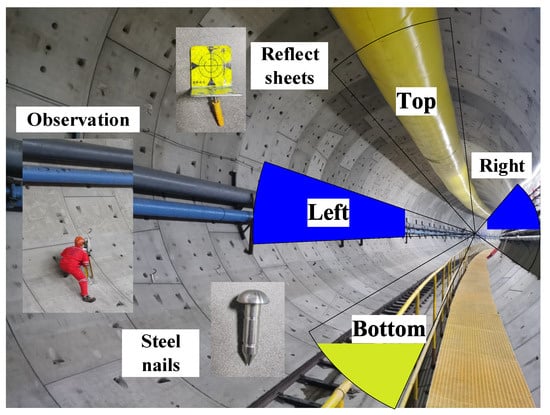
The Sokkia total station IM-101 from Japan is employed to quantify the displacements at the top, left, and right edges of the lining ring, while the level station DINI-03 (produced by Trimble company in USA) is utilized to measure the displacement at the bottom. The parameters associated with the two instruments are presented in Table 2, and the auxiliaries are illustrated later. Among the measurements, the top, left, and right places inside the tunnel are conducted via reflective sheets, and the bottom observation relies on the vertical height of steel nails (Figure 7). The reflective sheet and steel nail tools will be embedded on the tunnel lining’s internal surface after the reinforced concrete blocks are assembled. Throughout the tunnel’s construction, the existence of ventilation pipes (possessing a diameter of approximately 2 m), slurry pipes, tracks, and other impediments bring about the unavoidable repositioning of measuring points, deviating marginally towards surrounding areas. Consequently, the actual measurement point might not be positioned centrally or horizontally, as previously explained. Furthermore, inaccuracies in linings’ assembly could introduce confounding variables, leading to changes in the ovality of the lining ring.
Table 2.
Information on the displacement measurement instruments for the lining structure.
Figure 7.
Description of the structural measurements inside the shield tunnel during construction, including the observation points and the positions of the embedded instruments.
3.3. Neural Network Architecture Designs
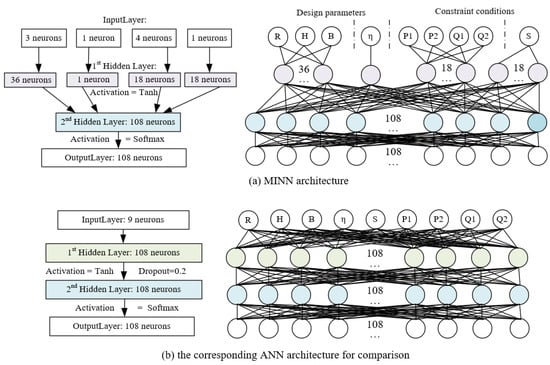
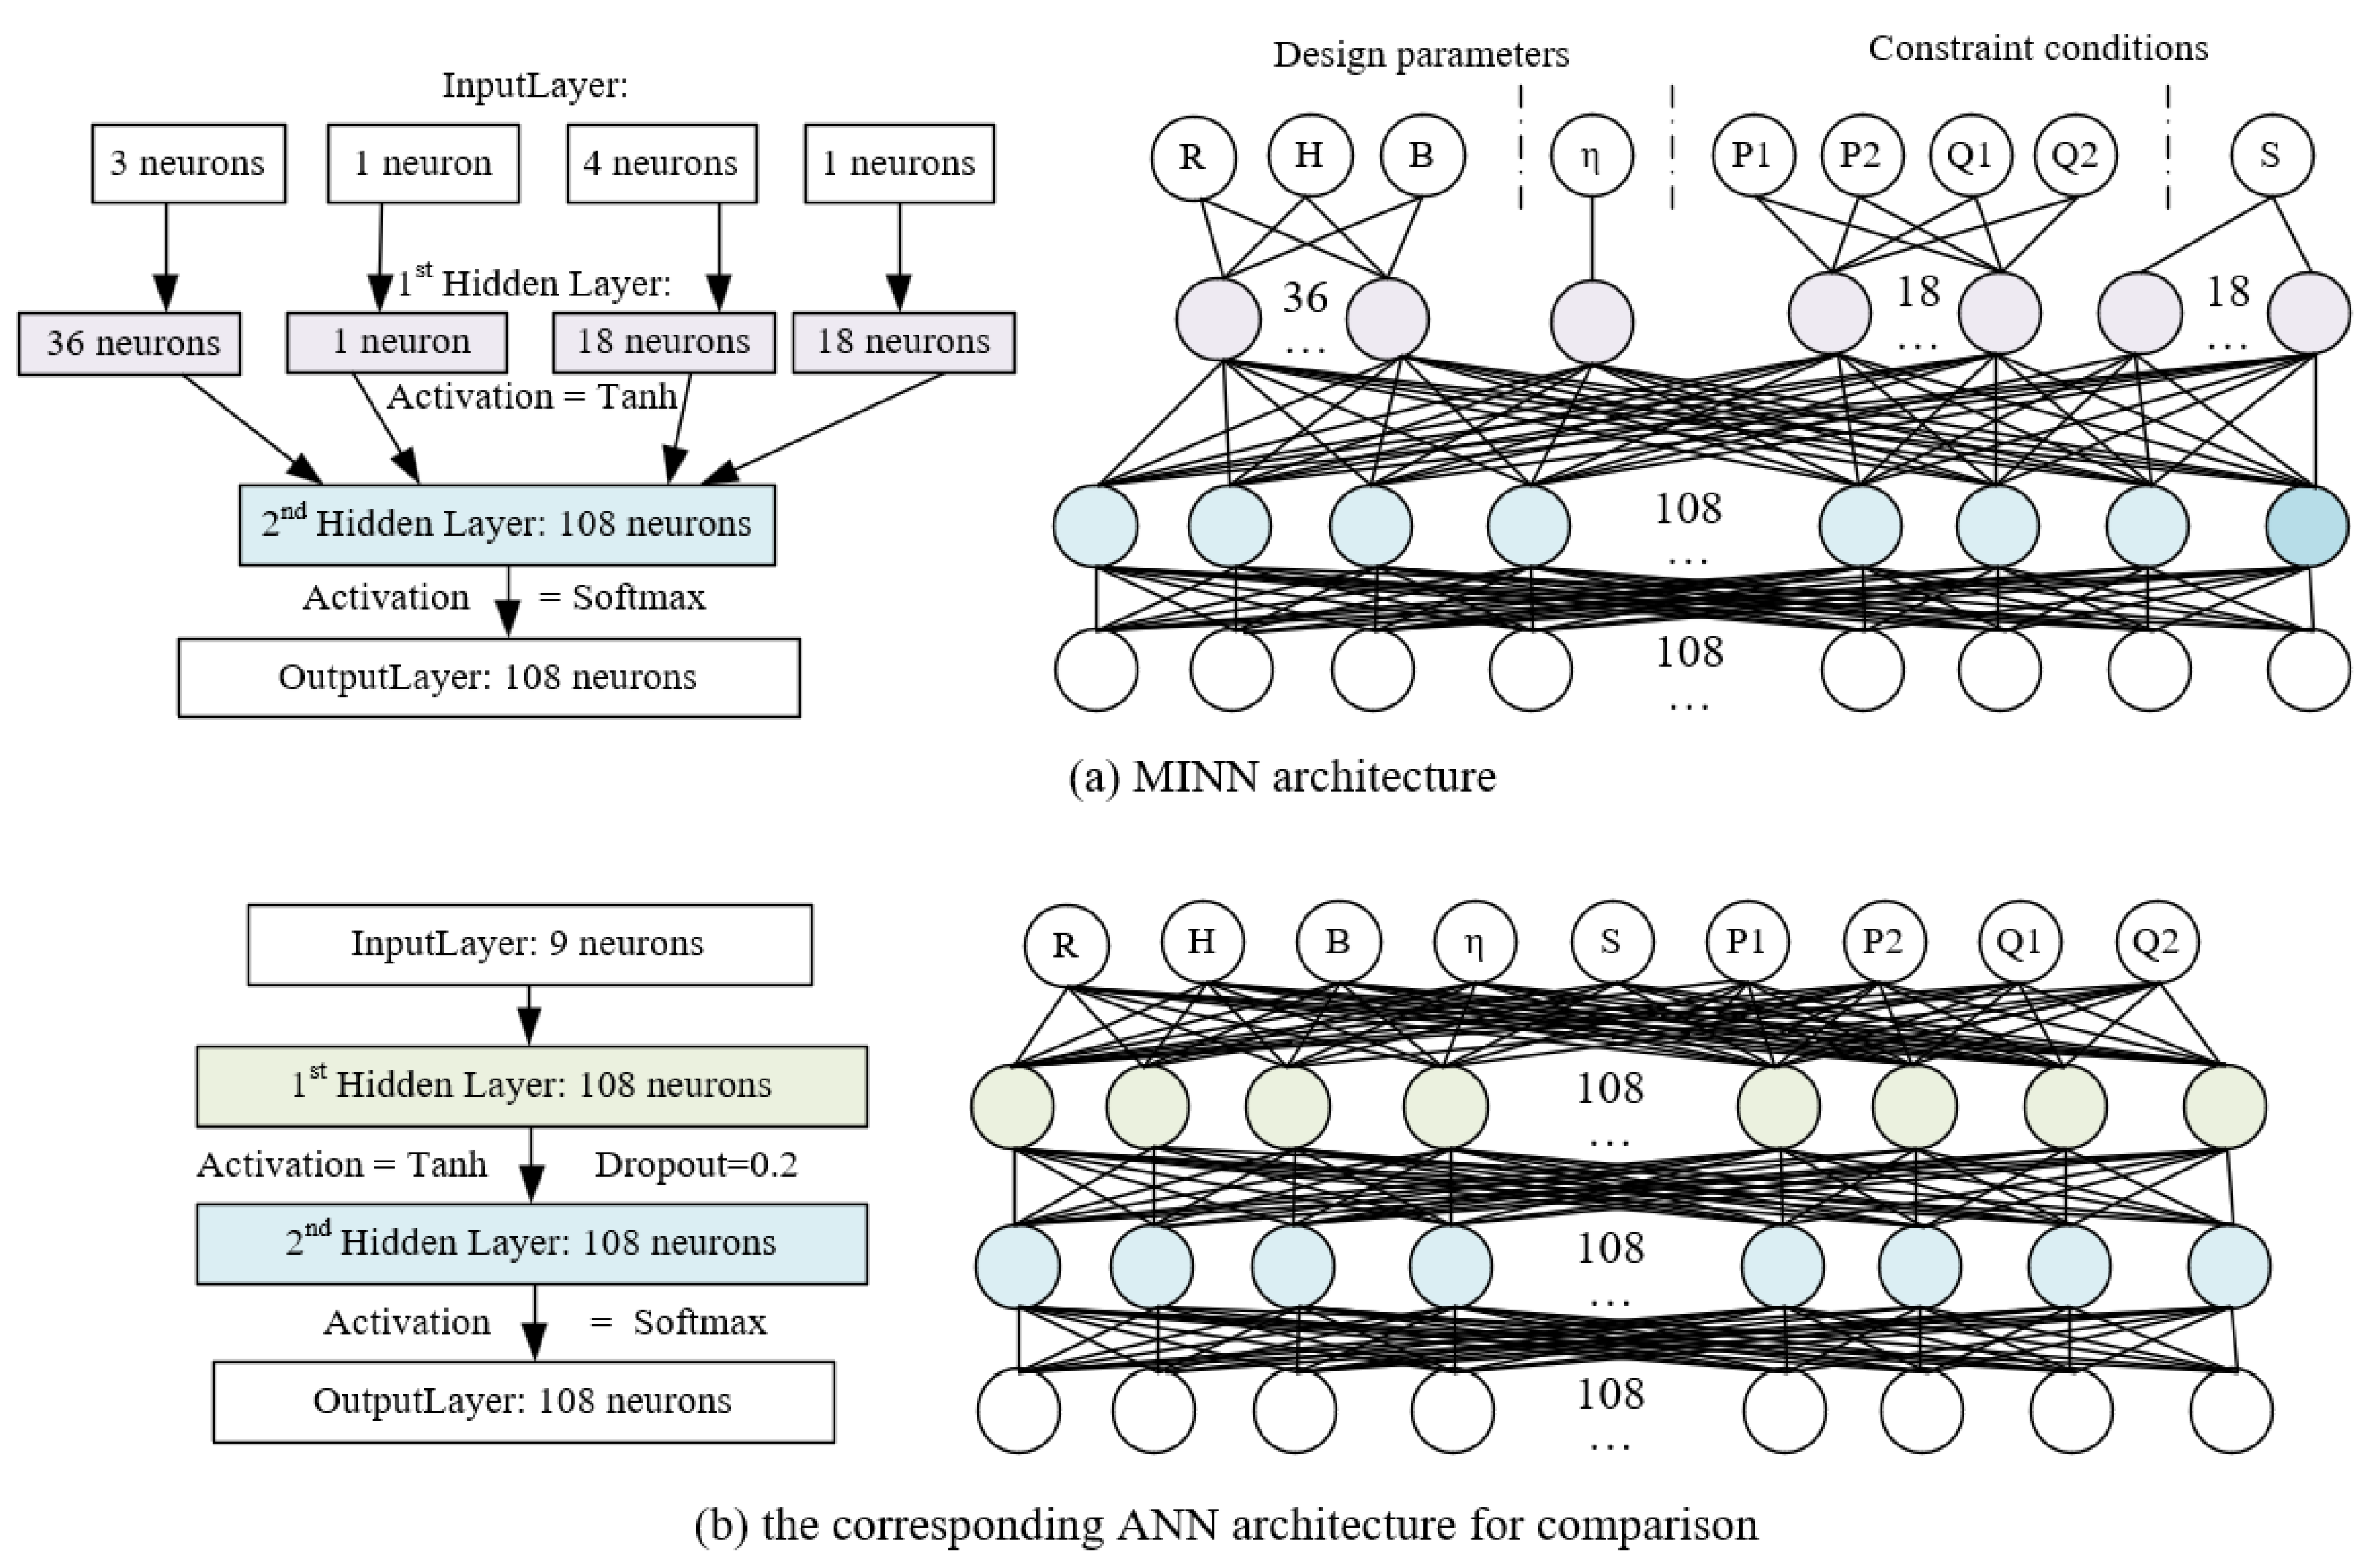
In this study, PD-driven MINN is a specially designed non-fully connected feedforward neural network tailored for processing the multi-input parameters of shield tunnel lining structures. Unlike traditional fully connected artificial neural networks (ANN), MINN enhances the efficiency of fitting complex engineering data by reducing redundant parameter interactions through selective connections. Its architecture is inspired by the concept of weight regularization from Chen et al. [30], optimizing the computational performance by cutting certain neurons.
PD-driven MINN will be developed as a surrogate model to analyze the structural performance of tunnel linings. Simultaneously, an ANN with a similar architecture is developed for comparative study.
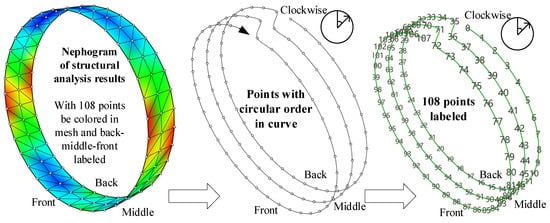
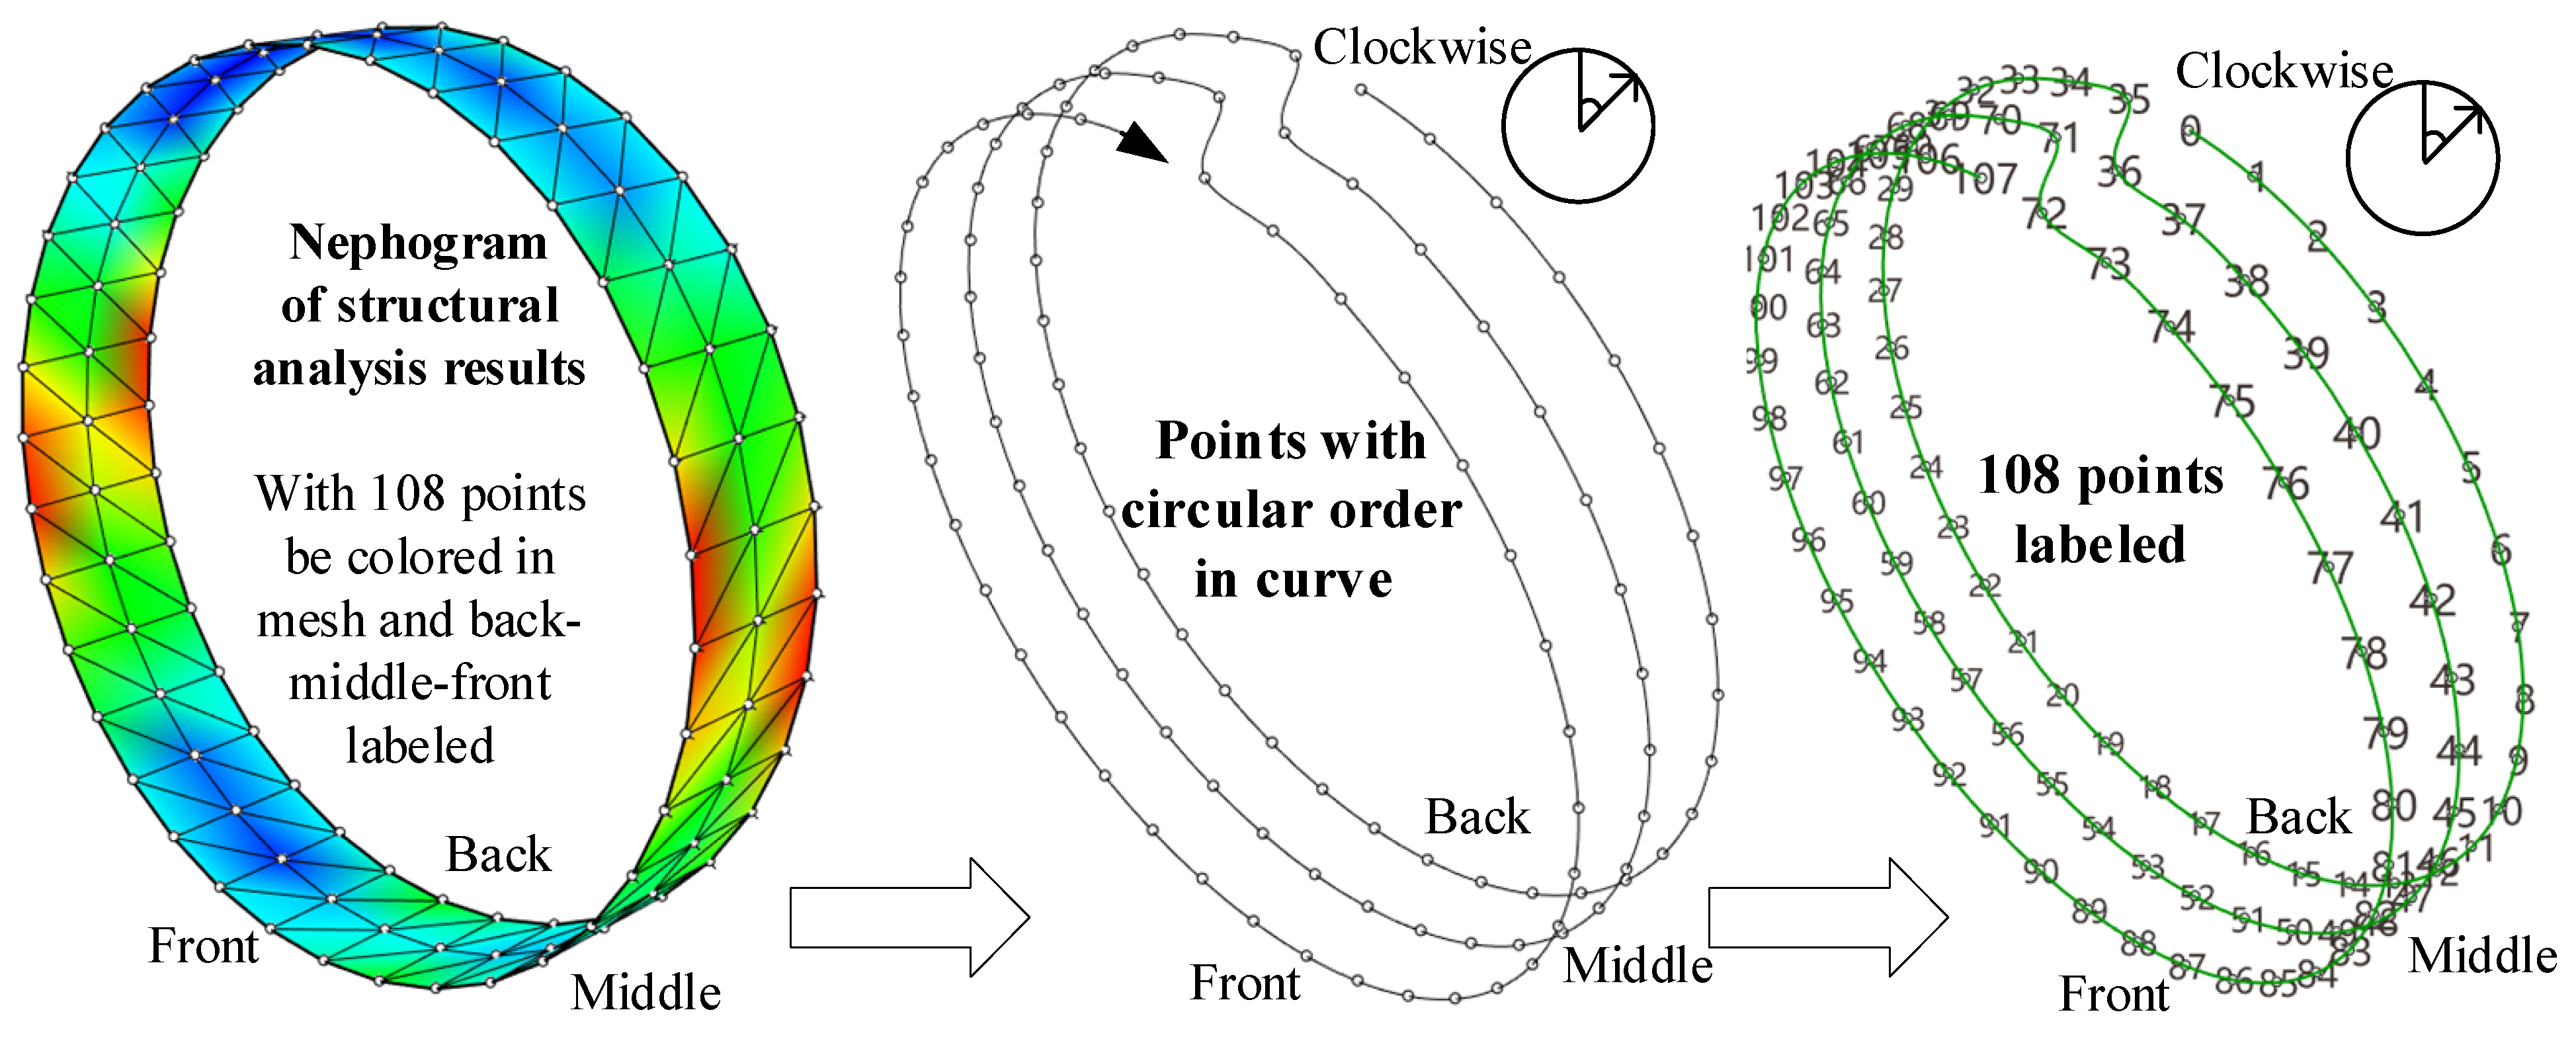
The inputs and outputs of the two neural networks are defined according to Equation (1), ensuring consistency with the input and output format used in PD structural analysis. Upon completion of PD structural analysis, the mechanic response results will be rendered as a nephogram. The colors in the nephogram will be assigned sequentially based on the circular order of 108 points in the mesh model, accurately representing the distribution of values (as shown in Figure 8). Among these 108 points, they are further divided into three parts—front, middle, and back—each comprising 36 points. The objective concerning the adjustment of the clockwise circular order of 108 points is twofold: firstly, to accelerate the characterization of analyzed data features through an ordered sequence, and secondly, to observe the distribution of structural mechanical response results from an understandable perspective.
Figure 8.
The relationship between nephogram and the value distribution points with back–middle–front labeled.
In this way, PD analysis resulting in the nephogram format can be regarded as the dataset for neural networks training. The output layer should be configured with 108 neurons to correspond to 108 points. In the input layer, the nine inputs are represented as R, H, B, η, P1, P2, Q1, Q2, and S. The difference between structural analysis and neural network computing is that the output layer values in neural networks should be processed within a normalization range of 0 to 1. The specific normalization methods will vary depending on the types of output analysis results.
A total of 2000 groups of analysis results that are computed by PD structural analysis serve as the dataset for ANN and MINN training. The division between the training set and testing set follows a 4:1 ratio. Furthermore, the process involves 100 training epochs and a batch size of 32. Each group of analysis results is computed by randomly selecting 9 distinct variables as input parameters. Table 3 displays the probability density and the range of random selection thresholds for the variables. For output data normalization, to accelerate the decrease in loss and enhance fitting accuracy during the training process, the axial force values (unit: kN) will be divided by 10,000, and the displacement values (unit: mm) will be divided by 10.
Table 3.
Selecting the probability density and range for randomly selecting the 9 input variables.
The MINN and ANN models developed in this study each consist of an input layer with 9 parameters and an output layer with 108 parameters. Figure 9 illustrates the connectivity structure of neurons and the associated configuration information within these two neural networks. When comparing the parameter information of these two neural networks, MINN has a total of 8264 trainable parameters, which is significantly less than 12,852 parameters in ANN. In the MINN architecture, the neurons in the input layer are categorized into four distinct groups. The categorization is based on the fundamental differences in the meanings represented by the nine input parameters, with some serving as size parameters and others as constraint conditions. Therefore, by considering the types of parameter units, it is decided to categorize them into four groups. The definition of the number of neurons connected after the input layer is determined based on the proportion each parameter directly affects at 108 points. In the subsequent 2nd hidden layer, the neurons from the previous four groups are concatenated. At this layer, the number of neurons in the 2nd hidden layer will correspond to the quantity of 108 points. Subsequently, 108 neurons are defined as the output layer. In the ANN architecture, the configuration of the second hidden layer and the output layer will be consistent with that of MINN. However, the primary distinction lies in the full connection between the input layer and 1st hidden layer of the ANN, where 9 input neurons are directly connected to 108 hidden neurons.
Figure 9.
Developed architectures of MINN and ANN as surrogate models.
The definitions of certain hyperparameters in the two aforementioned neural networks are largely consistent. Considering that the outputs of the dataset have already been subjected to normalization processing, only the Mean Square Error (MSE) and Mean Absolute Error (MAE) are employed to evaluate the loss during model training, thereby assessing the discrepancy between the predicted values and the actual dataset values. The neuronal parameters of both the MINN and ANN models are updated using the Adam optimizer with a learning rate of 0.001, leveraging its rapid convergence properties. It is worth noting that to prevent overfitting caused by an excessive number of neurons in the hidden layers of an ANN, a dropout layer with a probability of 0.2 is applied after ANN’s 1st hidden layer.
Once the MINN and ANN are trained, they can be used to perform a structural performance analysis of tunnel linings. Moreover, the process of denormalization for the output layer should not be overlooked. This study will primarily focus on discussing axial force and displacement in the analysis results, as these two types of results can be assessed directly through structural measurements in practice.
4. Case Study
4.1. Project Overview
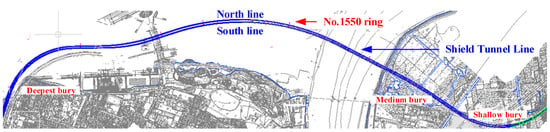
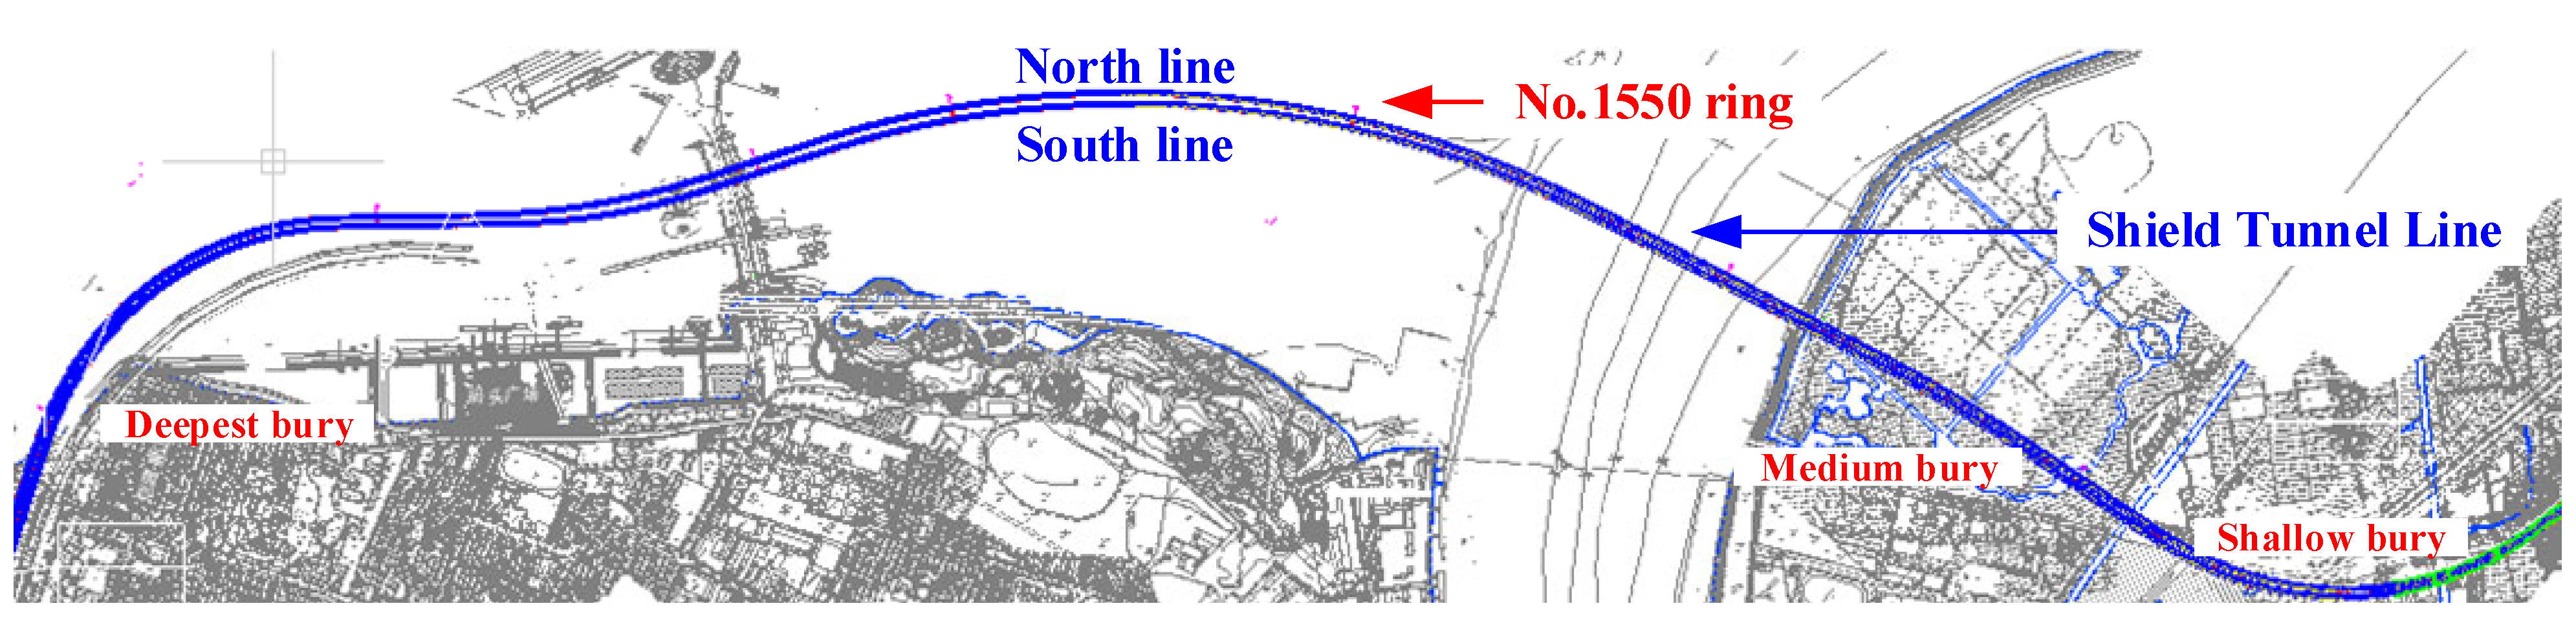
This section introduces a high-speed railway transportation tunnel construction project across rivers, in which large-diameter tunnel linings are applied. The layout plan for the transportation lines (north and south) is depicted in Figure 10. The tunnel structure is composed of a series of universal lining rings, with a diameter of 10.3 m. The project involves the construction of two shield tunnels, which are named the North Line and the South Line, respectively. In this study, two representative cross-sections will be selected for structural measurement, and some additional cross-sections will also be chosen by various depths for a comparison study.
Figure 10.
Layout map of the high-speed railway tunnel across rivers.
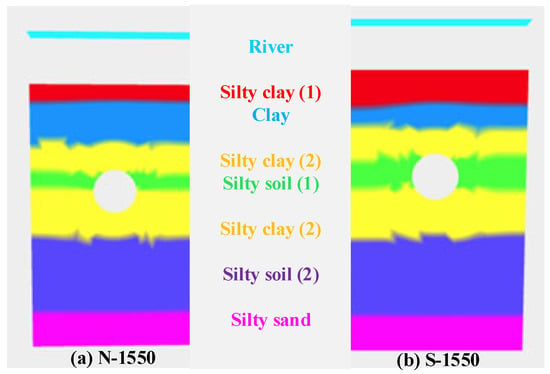
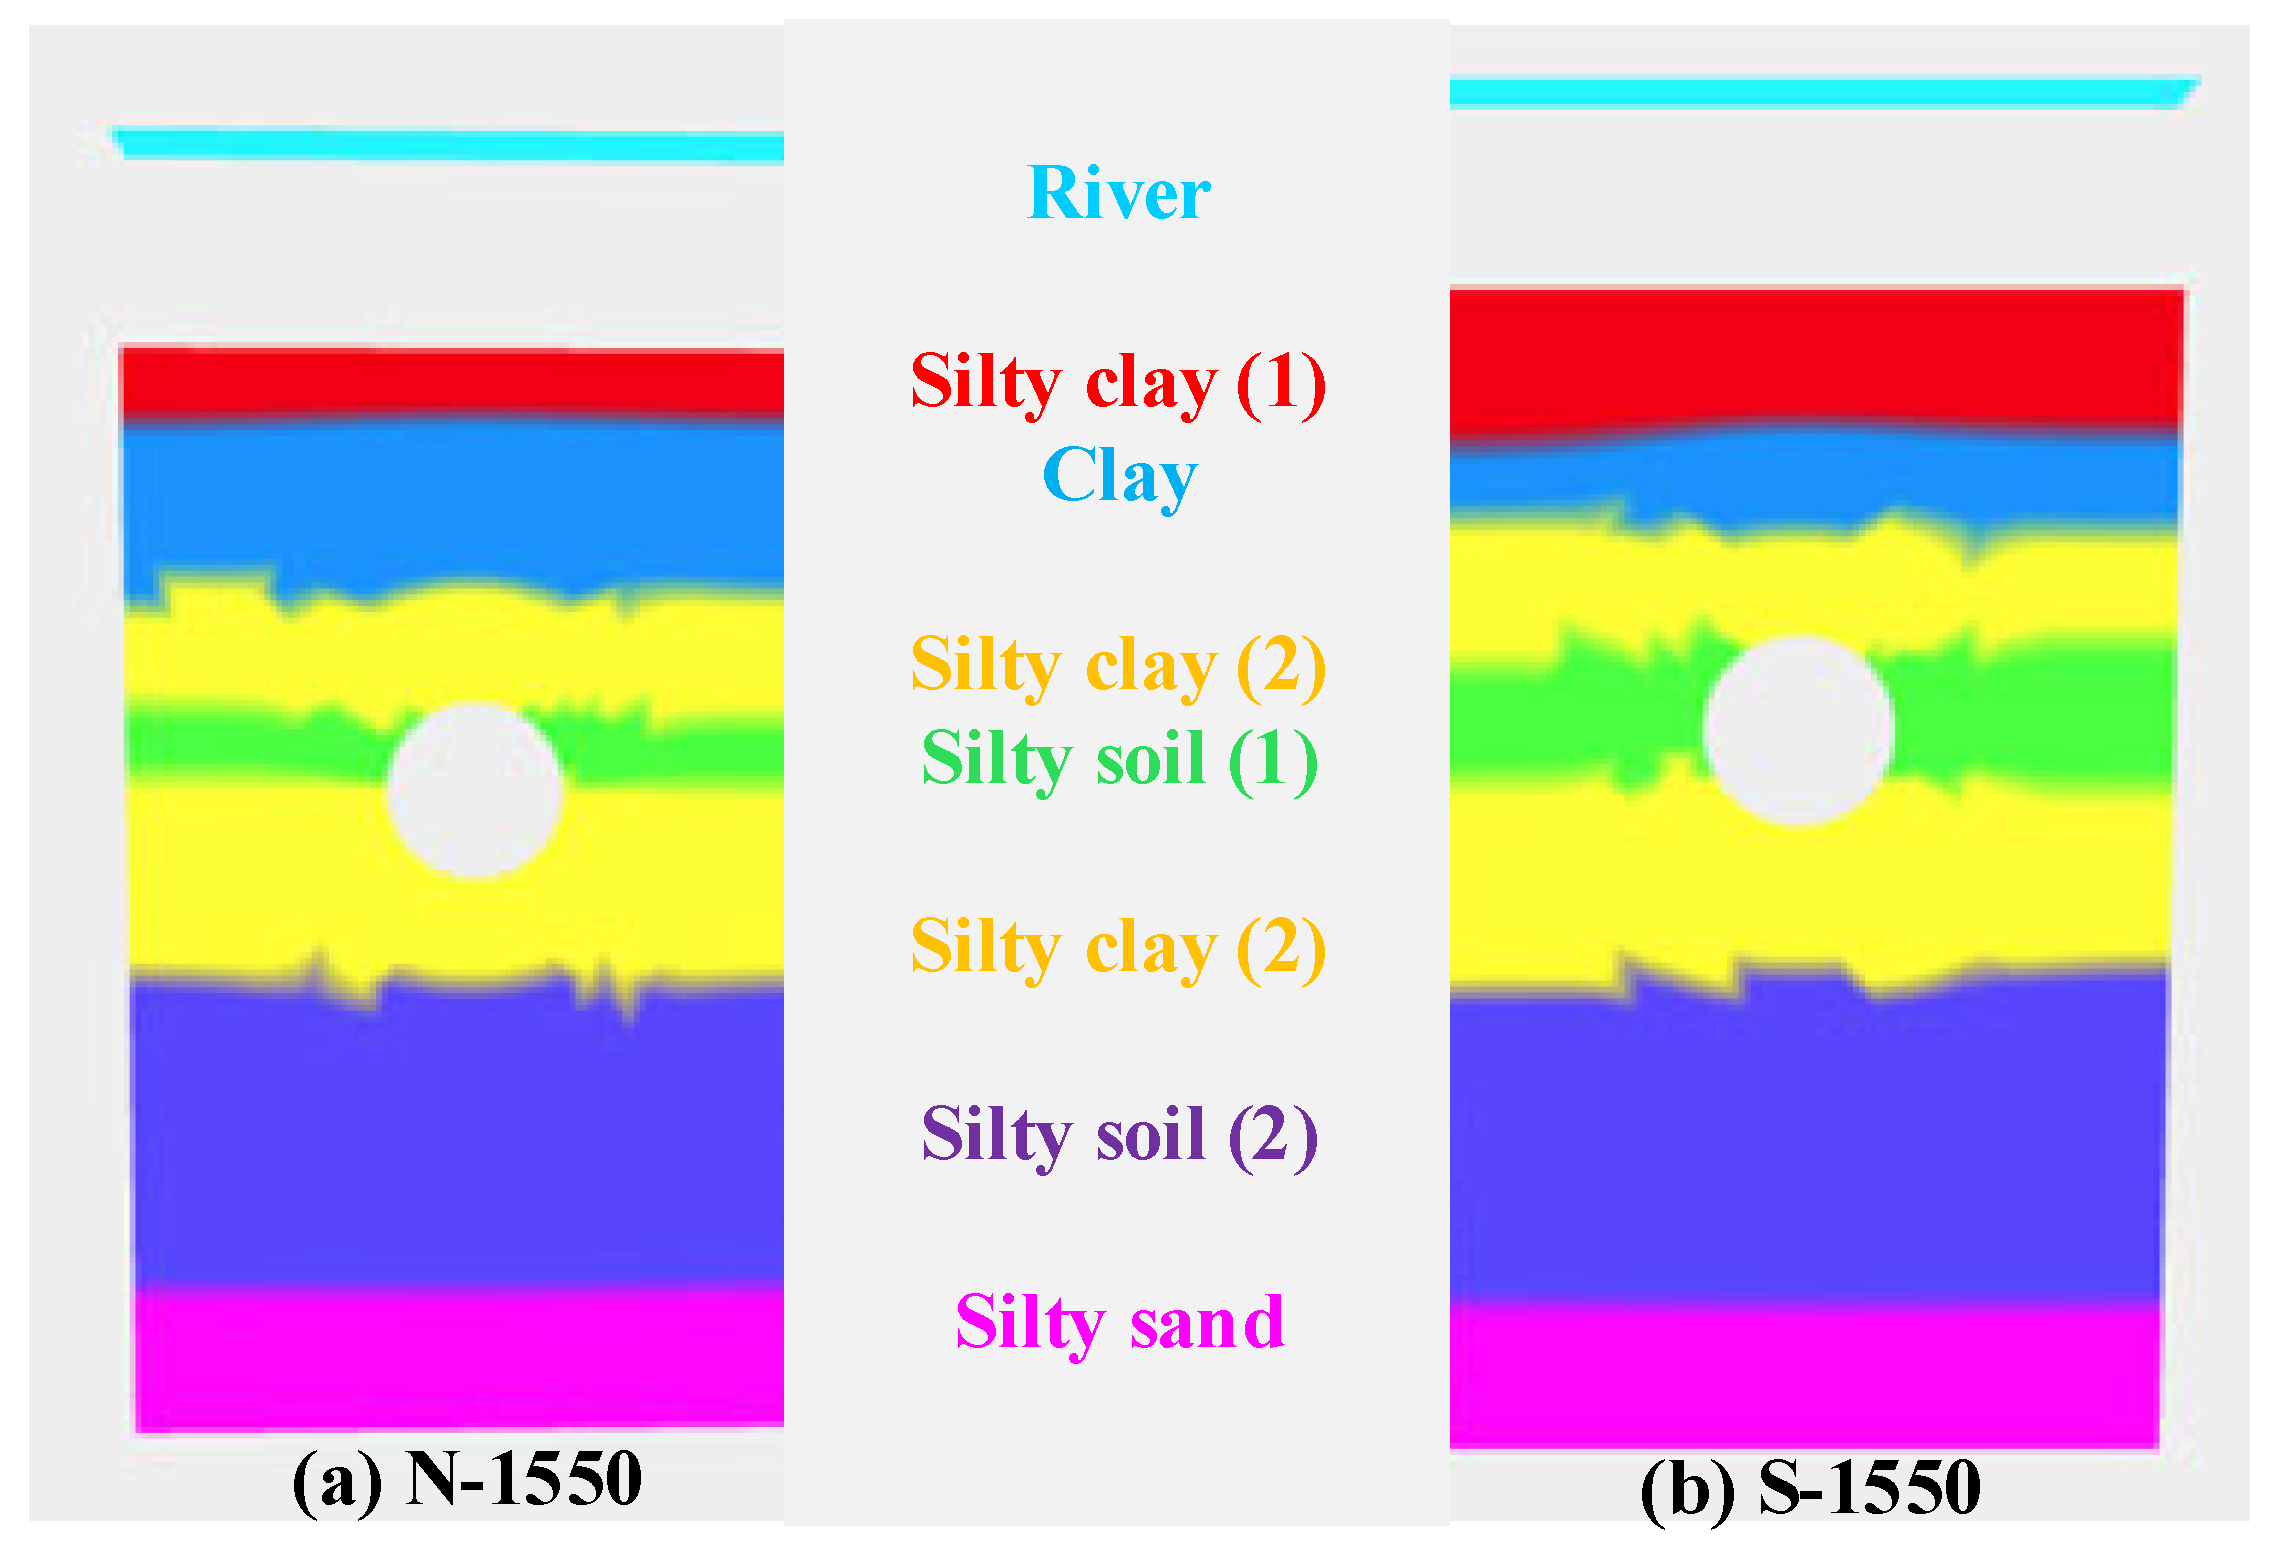
The structural measurements were conducted specifically at lining Ring No. 1550 in the North Line and the South Line, respectively, because this location is typically situated in the central section of the interval and lies beneath the riverbed. The water level and surrounding soil distributions of the two selected tunnel cross-sections are illustrated in Figure 11. The soils around the tunnels mainly consist of silty sand and mucky clay, and the related property parameters are listed in Table 4, including unit weight, friction angle, cohesion, lateral-compression coefficient, and foundation stiffness, and were used as the geotechnical basis for determining these load and support conditions in the engineering case. Specifically, they were used to calculate the vertical and horizontal loading parameters (P1, P2, Q1, and Q2) and to define the equivalent ground spring stiffness S adopted in the structural analysis. Because the detailed geotechnical derivation of these parameters follows conventional engineering practice and is not the main focus of this study, it is not presented here in detail.
Figure 11.
The soil strata diagrams of Ring No. 1550 in North and South Lines.
Table 4.
The related soil property parameters for tunnel lining structural design.
Table 5 presents the size parameters of the universal tunnel lining ring and provides the constraint conditions of Ring No. 1550 as reference information. The dimension sizes of the tunnel linings remain consistent in the two lines. Some slight variation can be noted on the surrounding earth loads and ground stiffness. This ground stiffness is the equivalent stiffness assigned to the soil springs surrounding the lining, namely, parameter S in Equation (1), through which the subsoil stiffness is considered in the structural analysis.
Table 5.
The definition of the design parameters for PD structural analysis.
4.2. Verification of Computing Through Structural Measurement
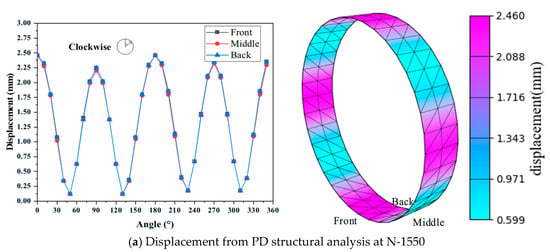
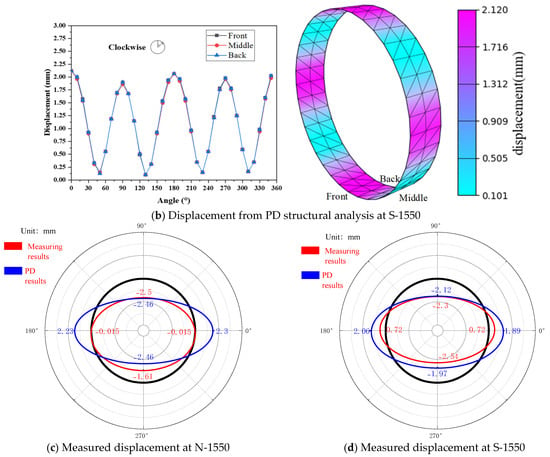
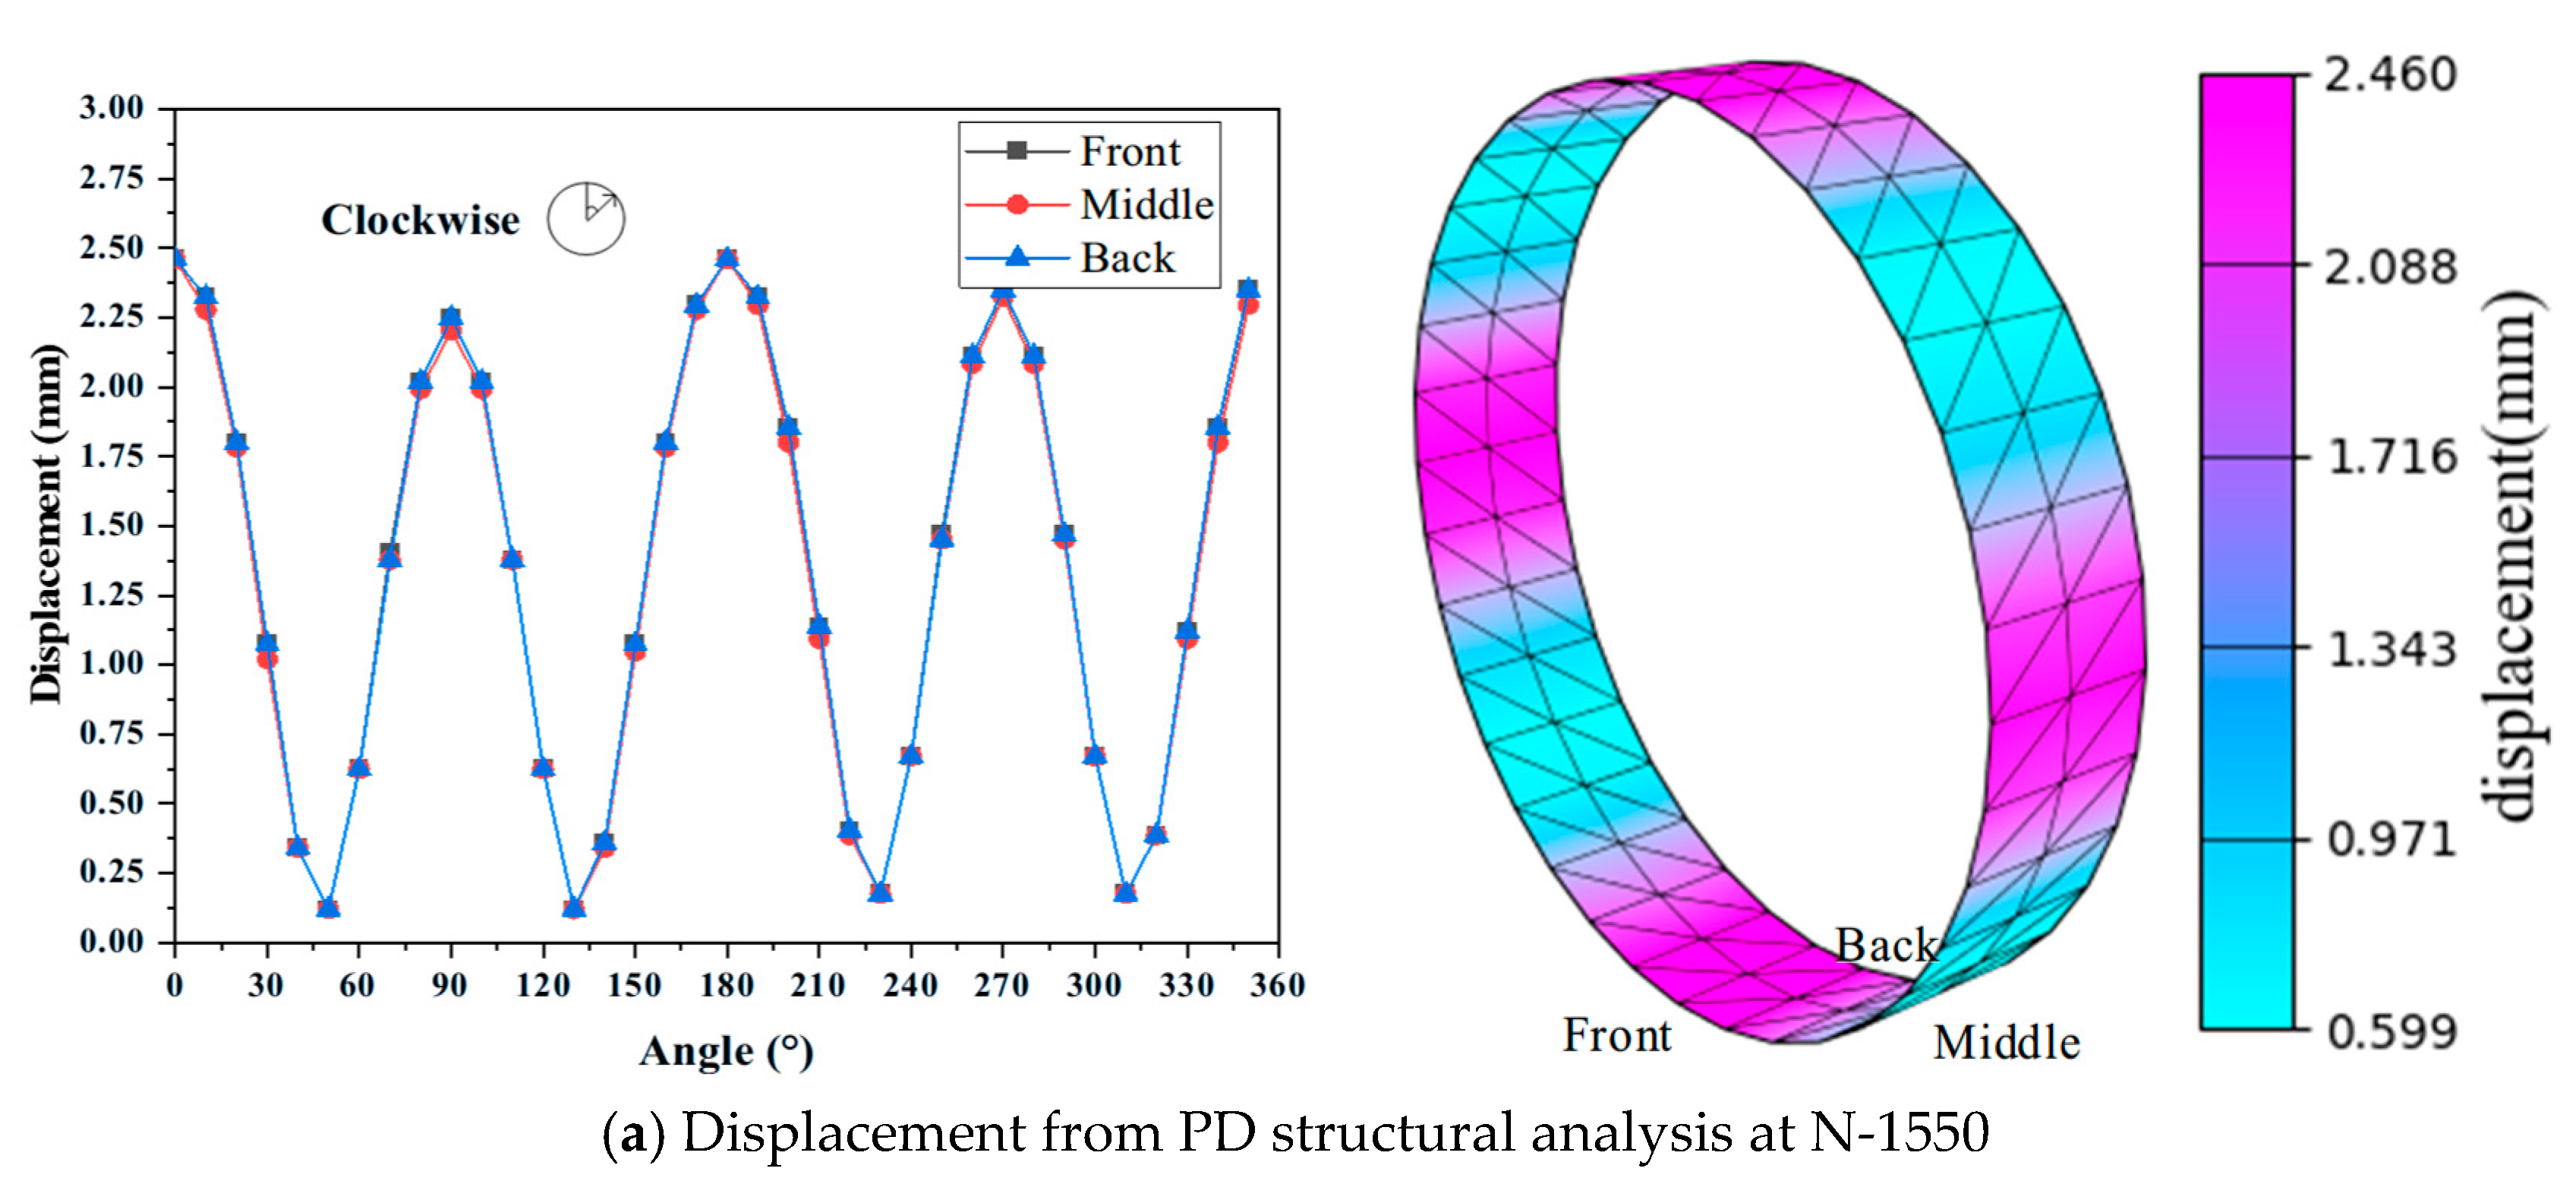
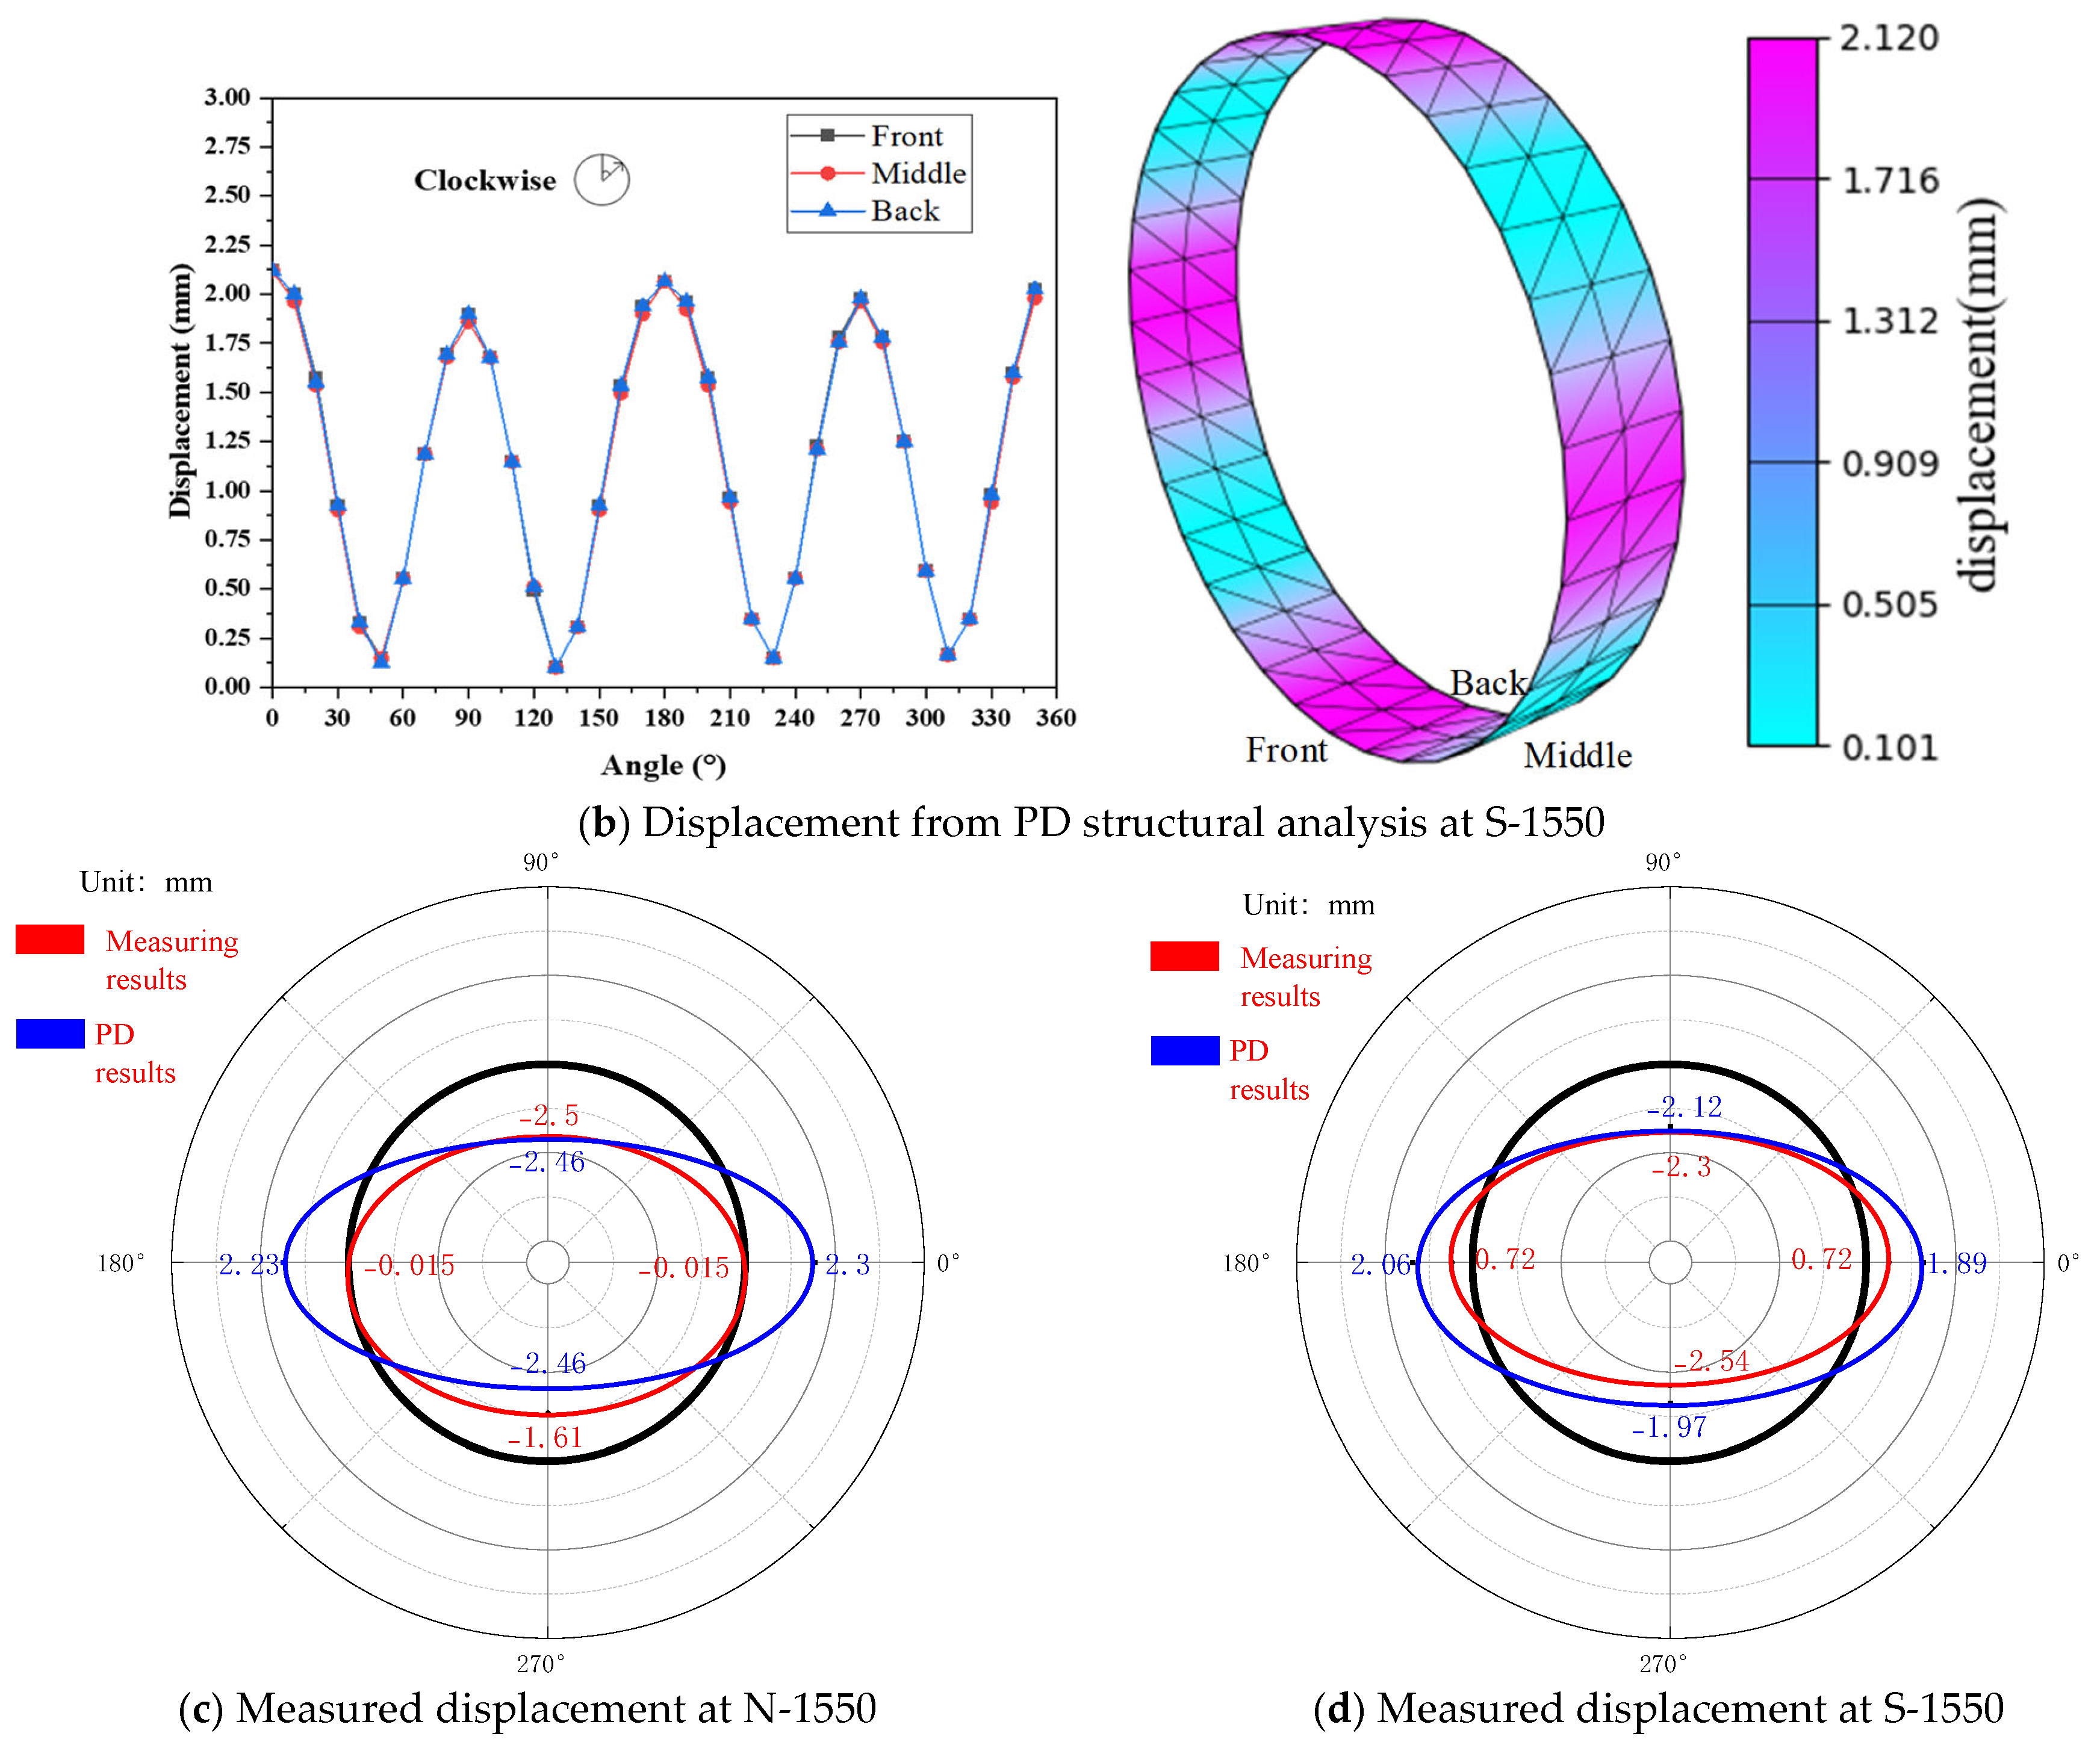
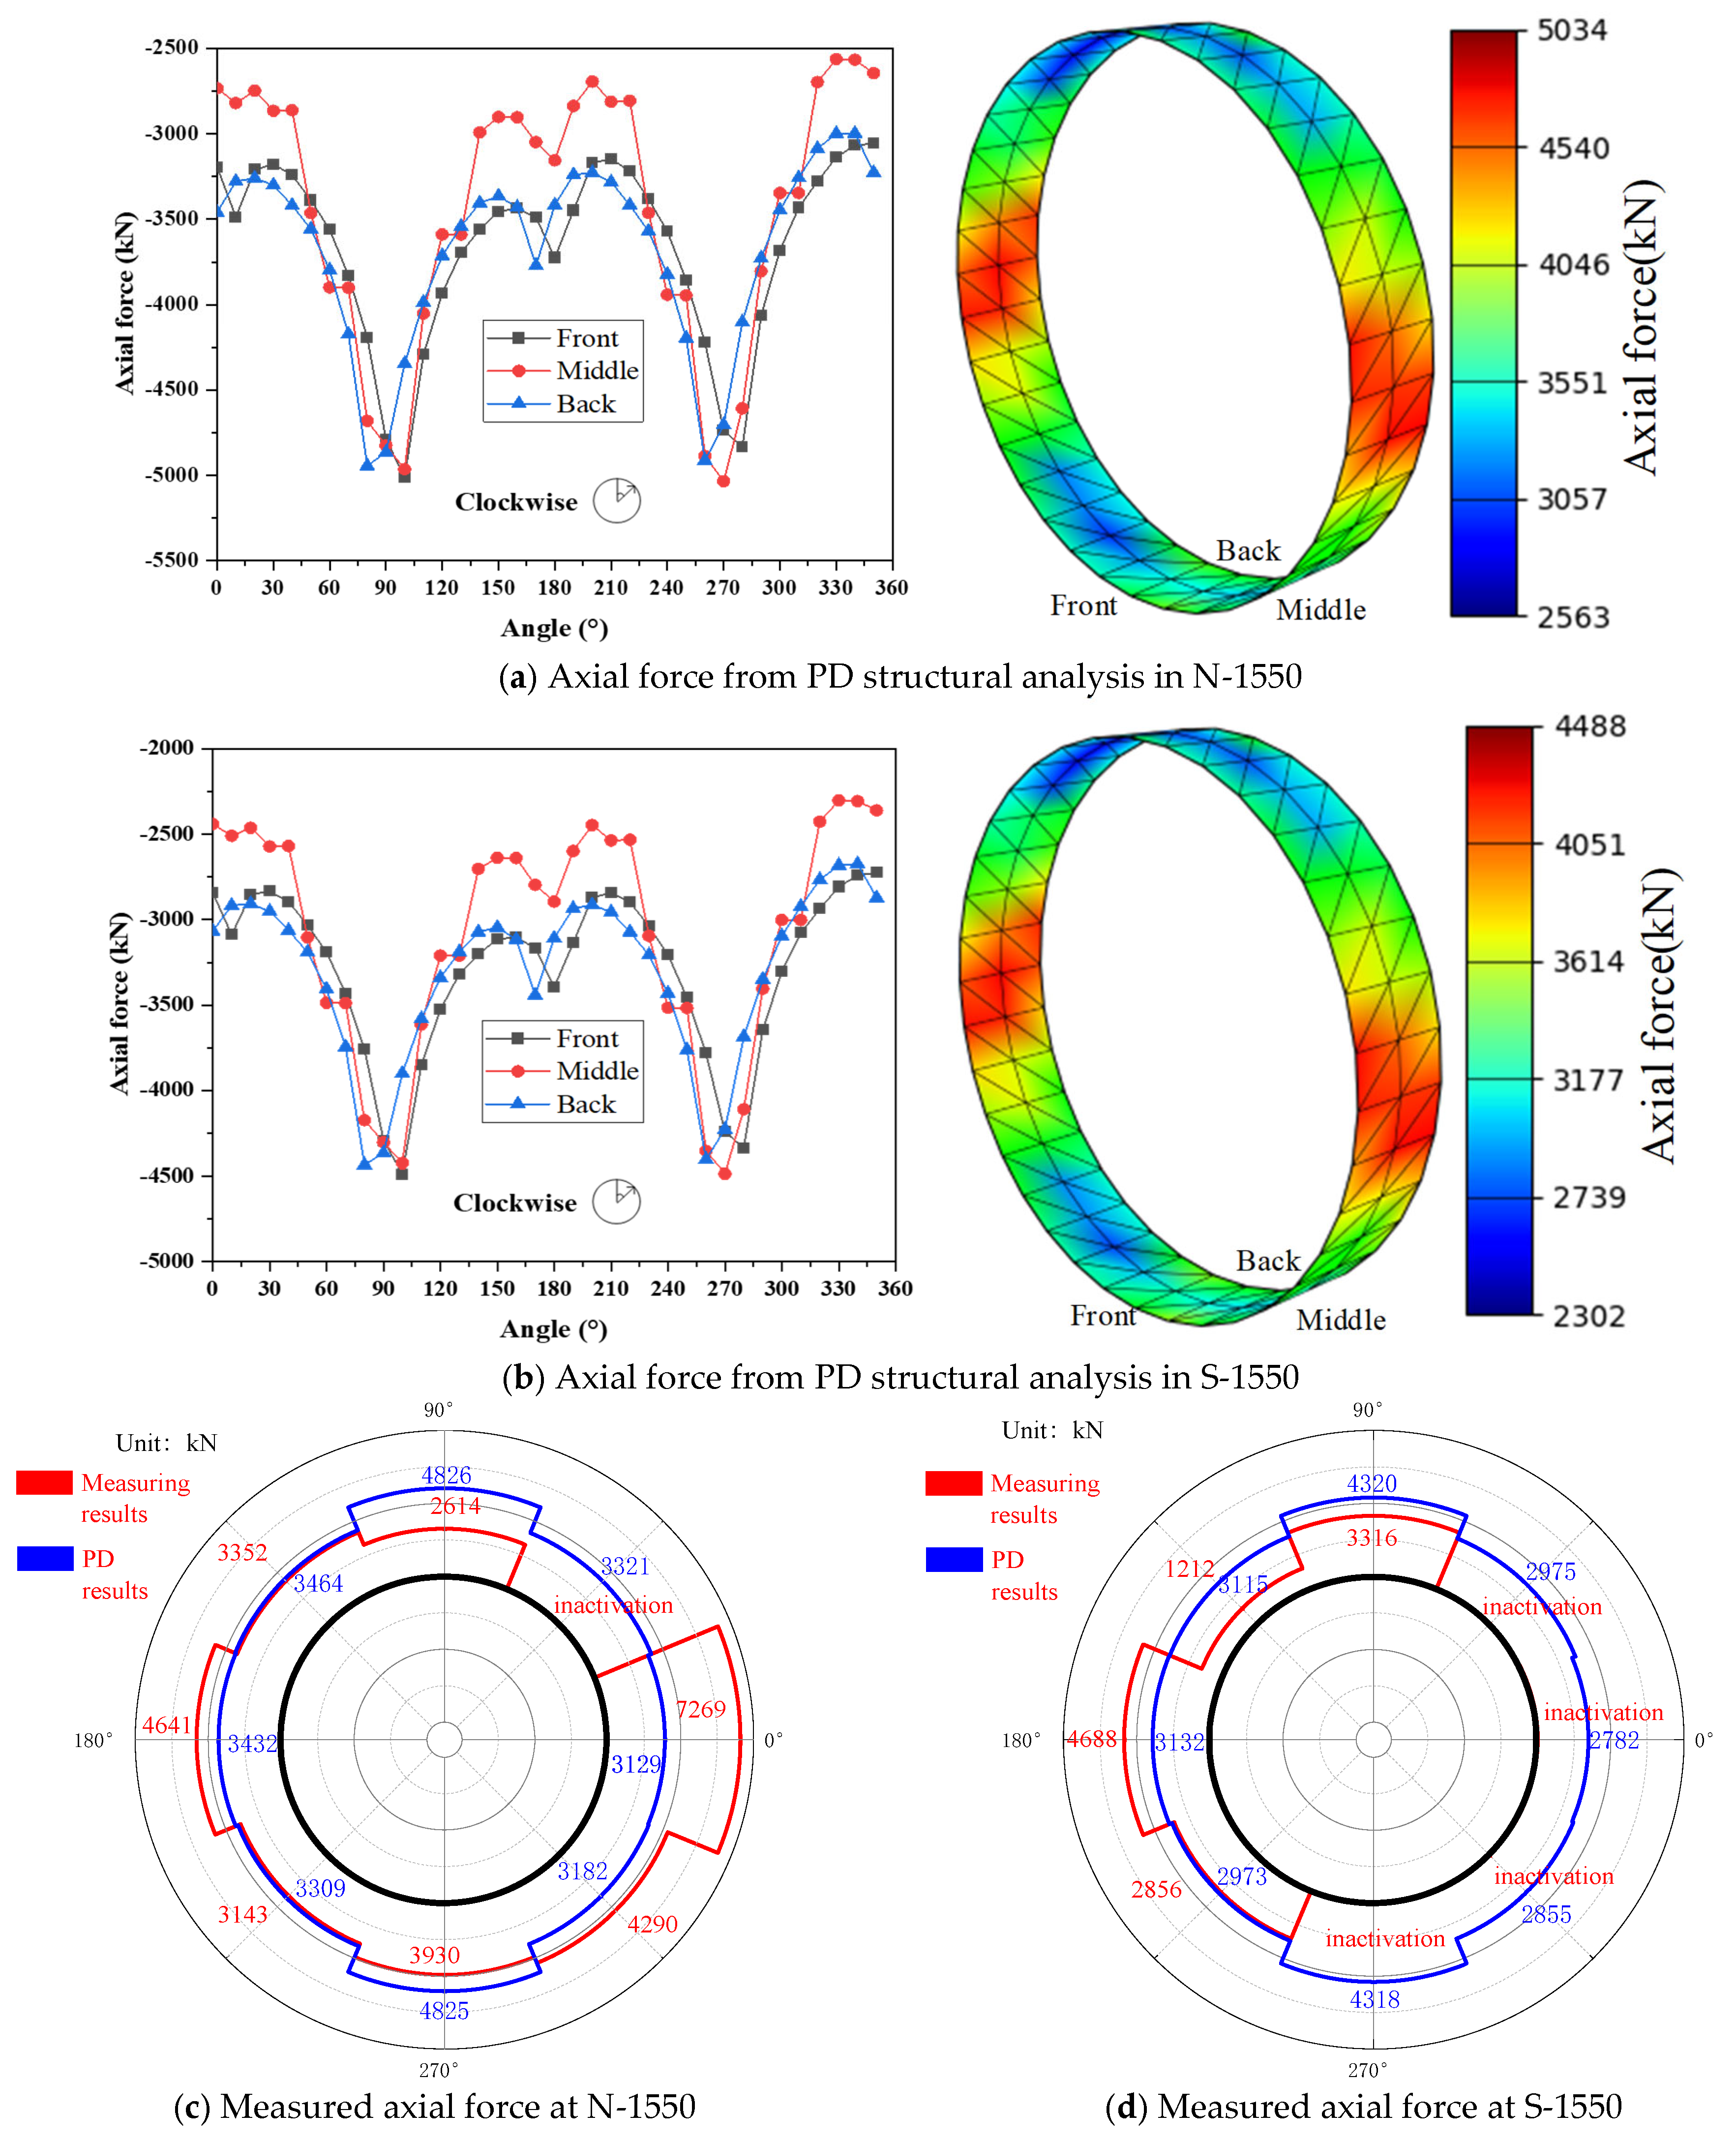
It is essential to validate the dataset output from PD structural analysis. The structural measurement exclusively focuses on testing the indices of displacement and axial force for the tunnel lining rings at both N-1550 and S-1550. Because the field measurements are sparse and section-specific, they are used here as an external validation benchmark rather than as direct training for the surrogate model. Figure 12 and Figure 13 present the computed and measured results in the same figure to enable direct comparison at the corresponding sections and positions. Owing to the limited number of monitored cross-sections and the partial inactivation of VMSSGs, this comparison is intended as specific case engineering validation.
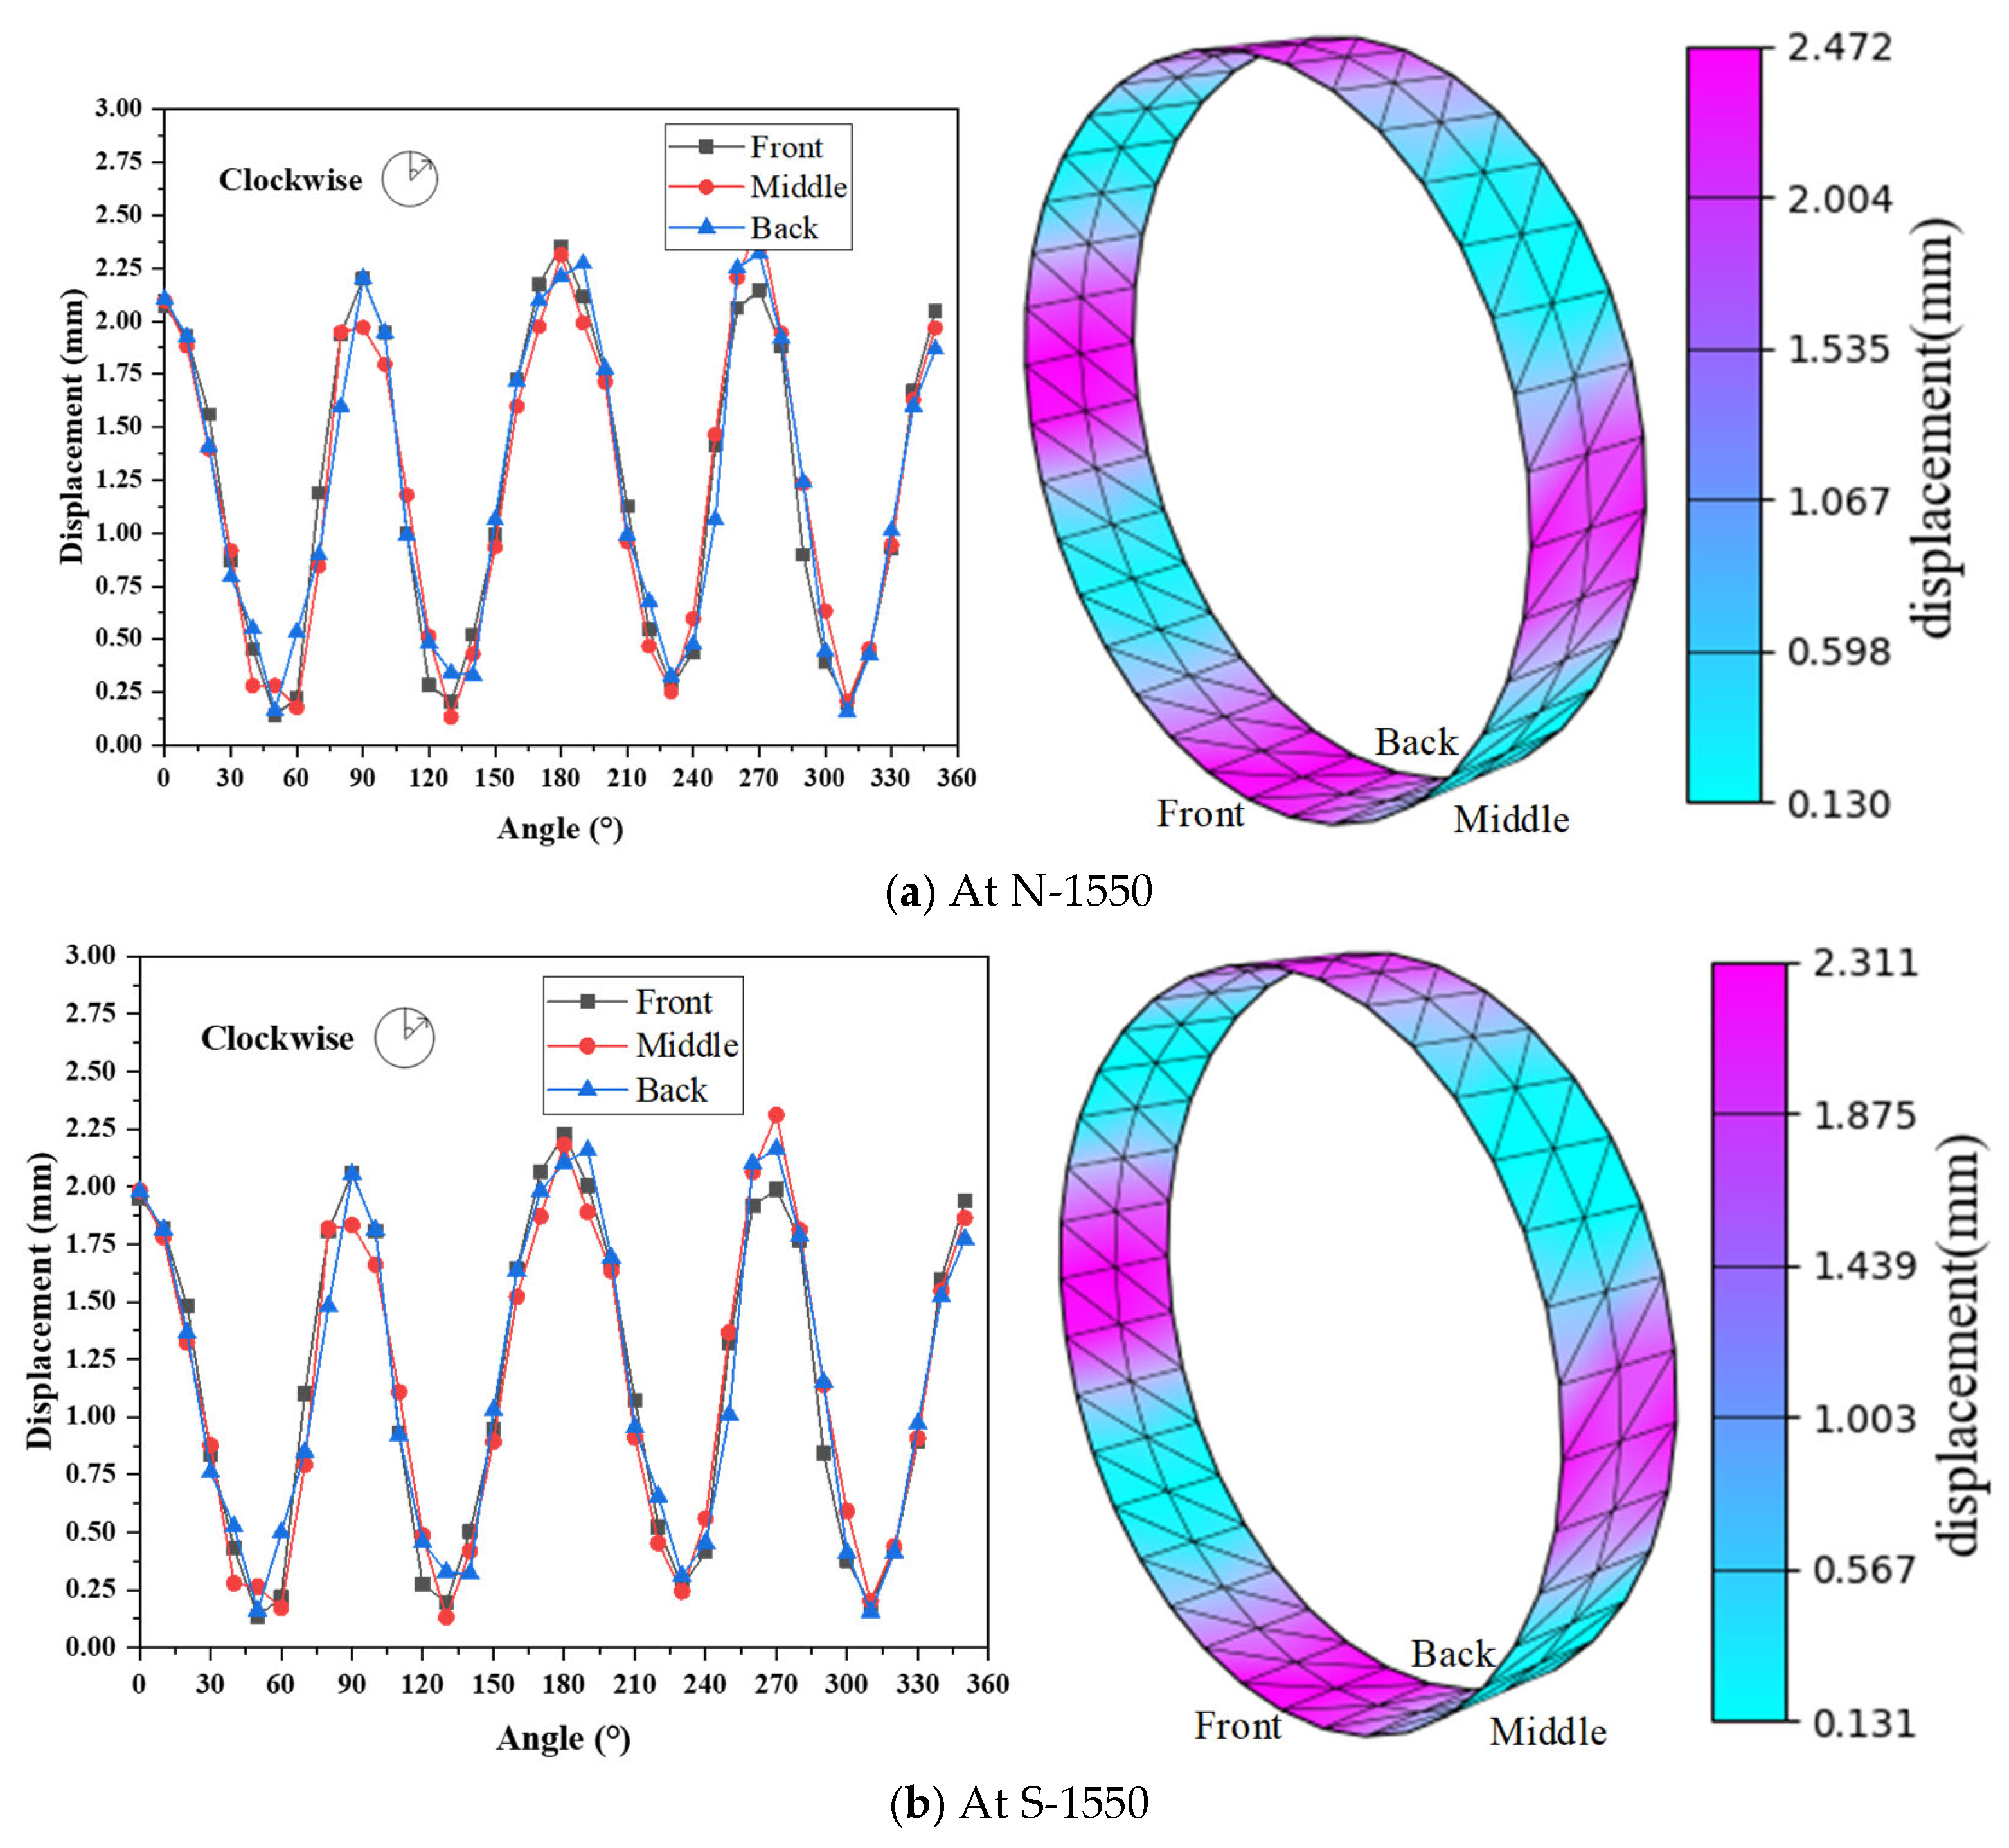
Figure 12.
Comparisons of displacement results between PD structural analysis and the structural measurement.
Figure 13.
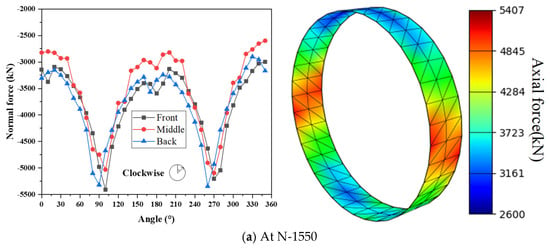
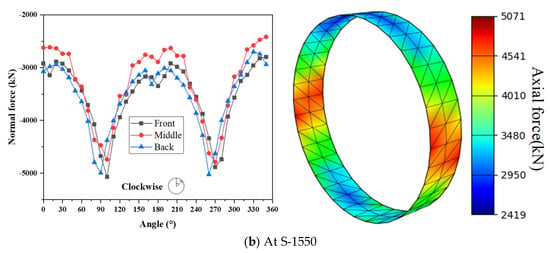
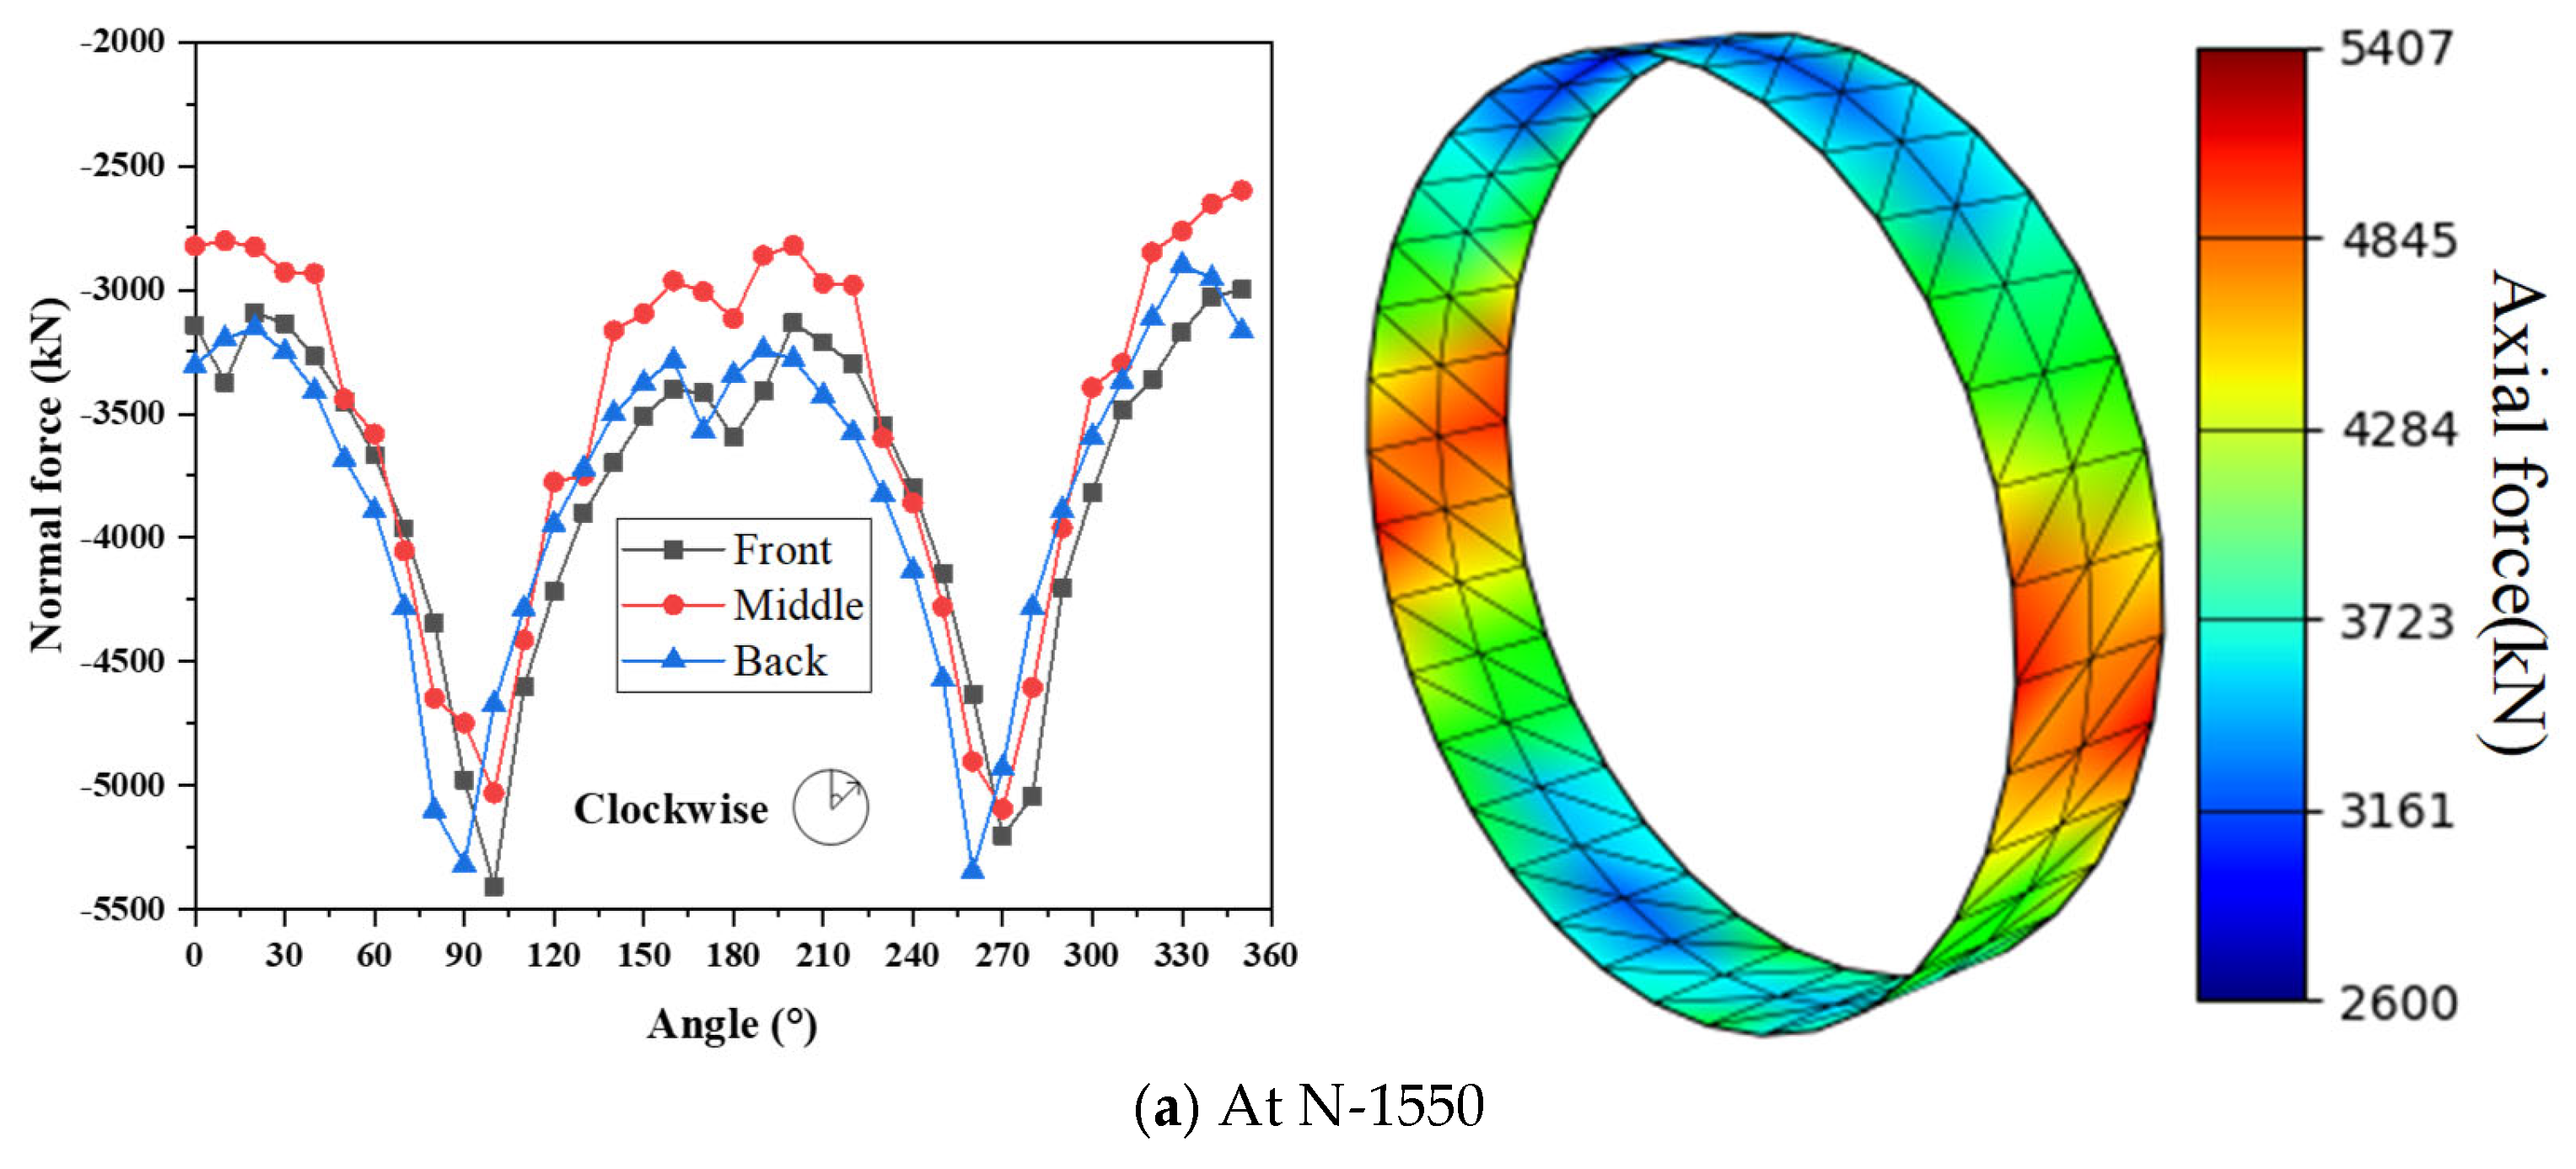
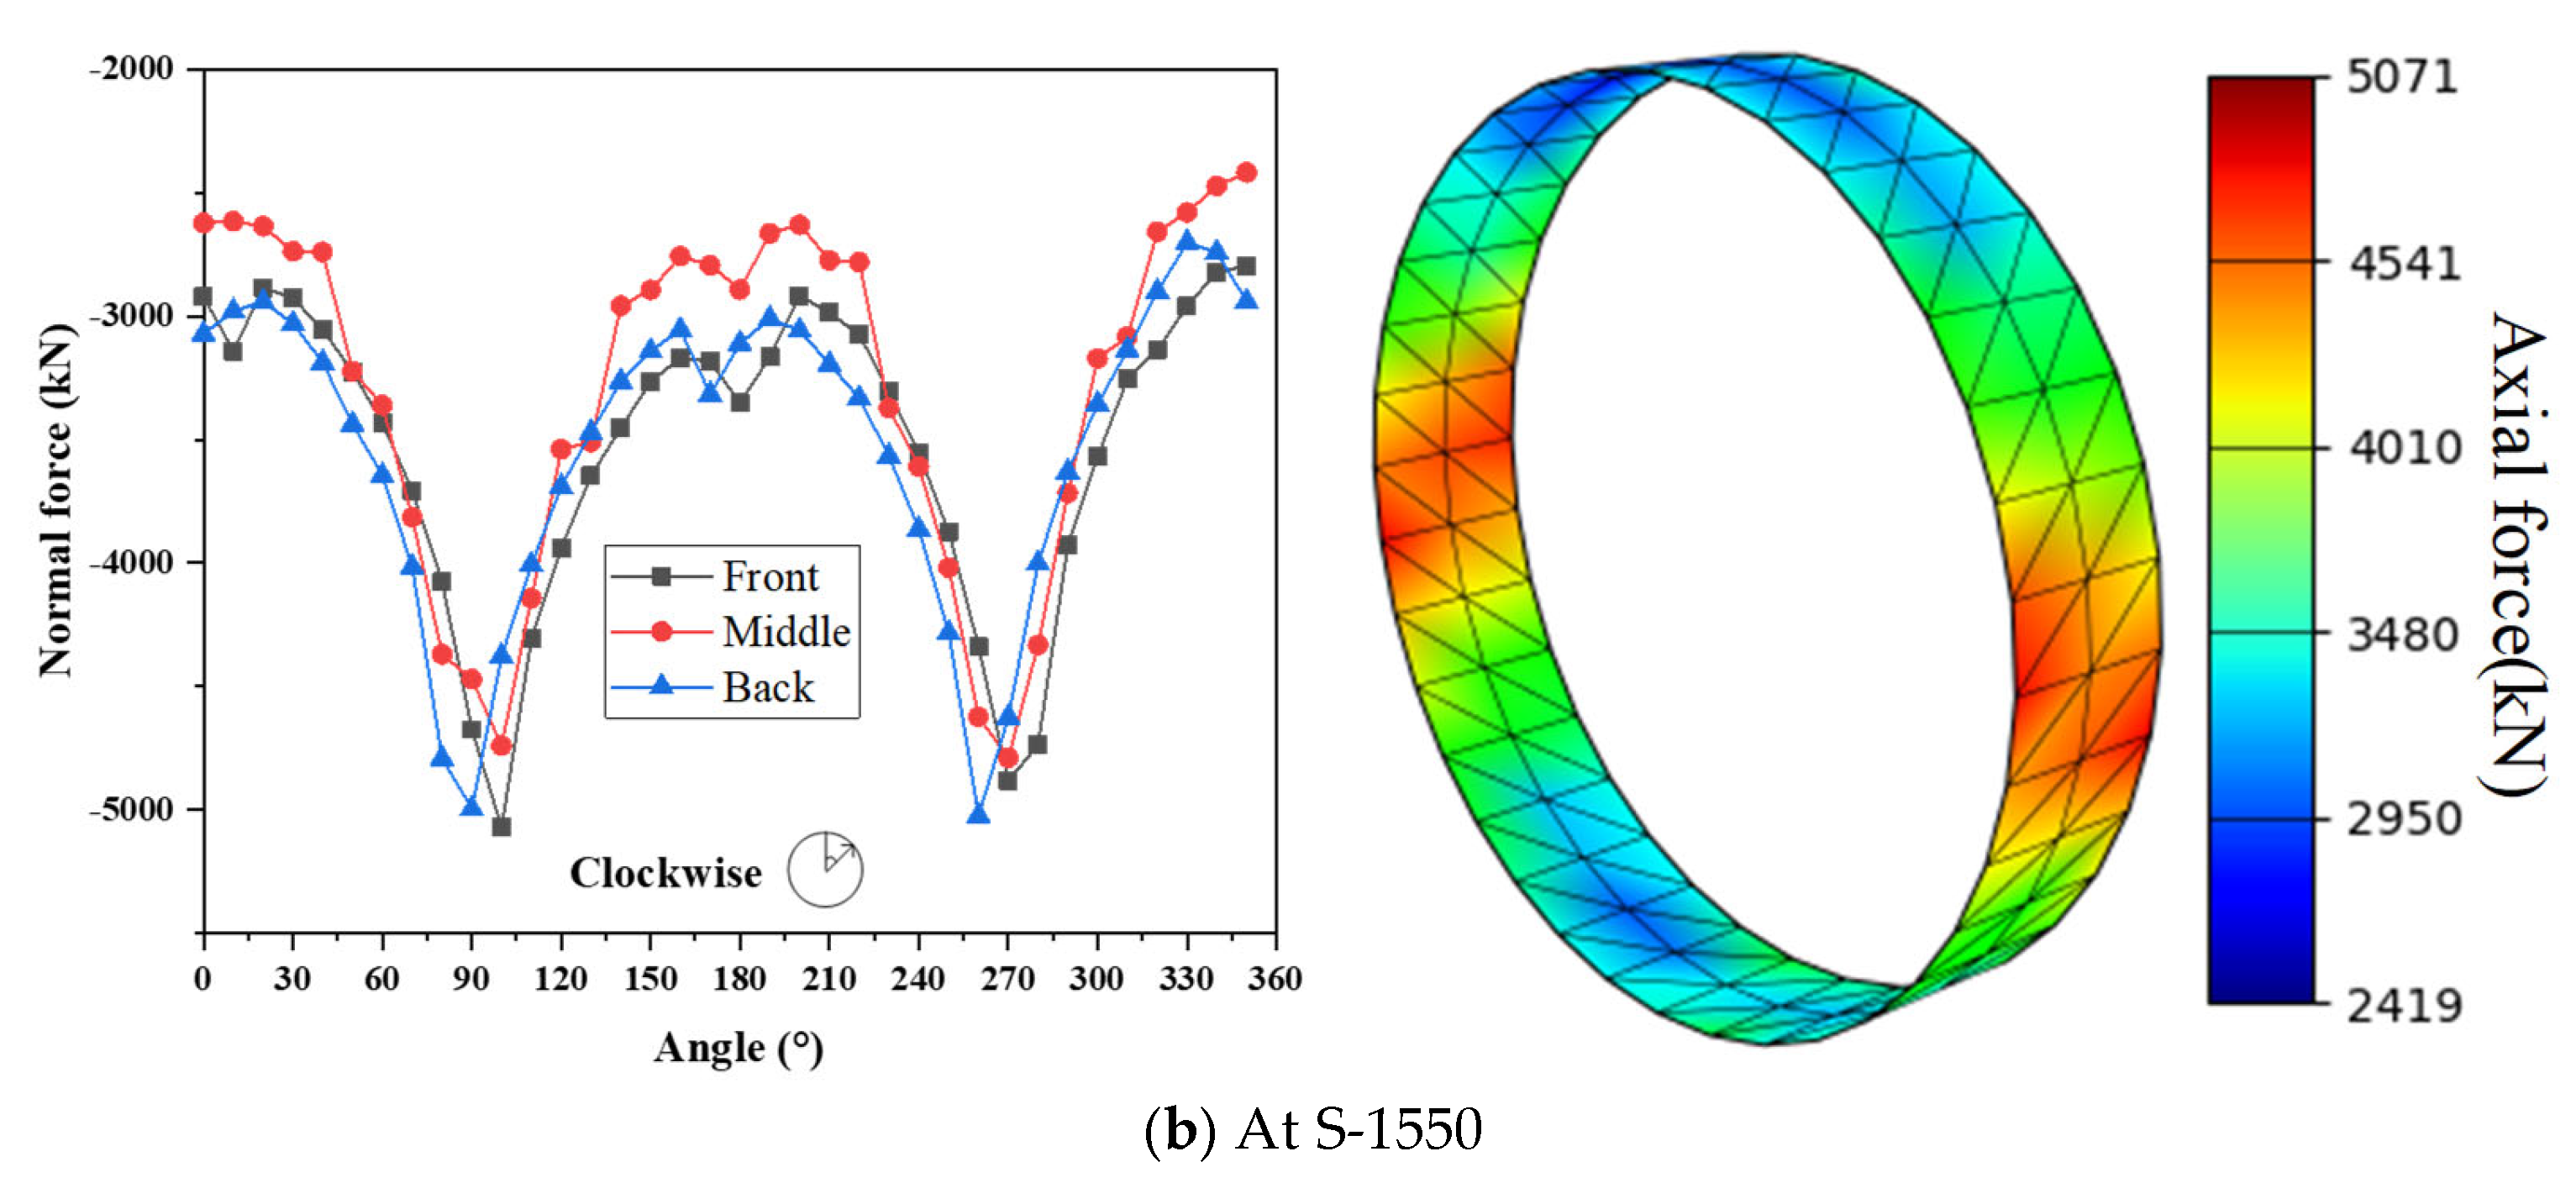
Comparisons of axial force results between PD structural analysis and the structural measurement.
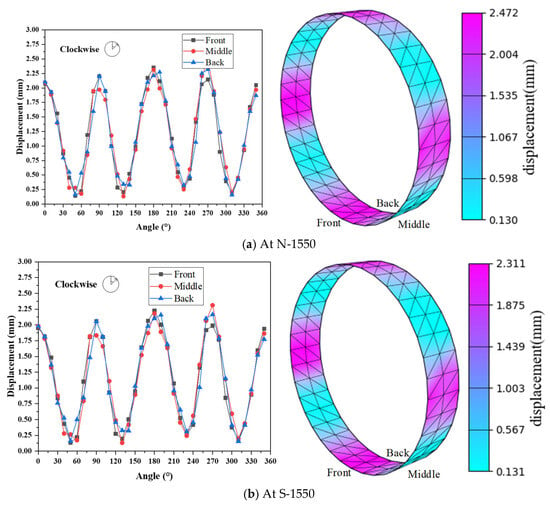
Figure 12a depicts the displacement analysis results of the No. 1550 ring on the northern line using PD structural analysis, while Figure 12b presents the results for the southern line. Figure 12c,d illustrate the displacement measurement results for these two sections. The measurement feedback indicates that the highest magnitudes of displacement occur at the top and bottom positions of the tunnel linings. This trend is similarly reflected in the PD structural analysis results. Specifically, at location N-1550, structural measurements have identified a peak displacement of 2.5 mm, while the PD structural analysis computes a maximum displacement of 2.46 mm. For location S-1550, measurements reveal a maximum displacement of 2.54 mm at the bottom and 2.3 mm at the top. Correspondingly, the PD structural analysis results indicate a maximum displacement of 2.12 mm.
Figure 13a and Figure 13b respectively present the axial force results for the 1550 ring in the North and South Lines by using PD structural analysis. In contrast, Figure 13c,d illustrate the structural measurement results on axial force obtained from VMSSGs. Despite challenges related to the incomplete resolution of survival issues, a portion of VMSSGs experienced inactivation. Nevertheless, the survival rate of VMSSGs pre-embedded in tunnel linings for each line is assured to exceed 50%. The measurement results for N-1550 revealed significant variations, with values ranging from a minimum force of 2614 kN to a maximum of 7269 kN. Correspondingly, the structural analysis results range from 2563~5034 kN, which fall within the measured value range. For S-1550 measurements, the axial force ranges from 1212~4688 kN, while the computational results span from 2302~4488 kN.
4.3. Training of MINN and ANN
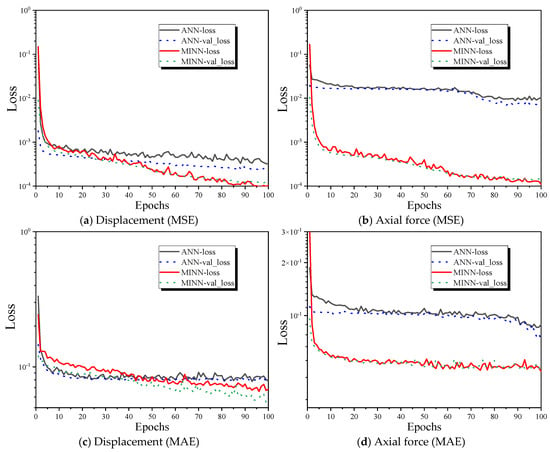
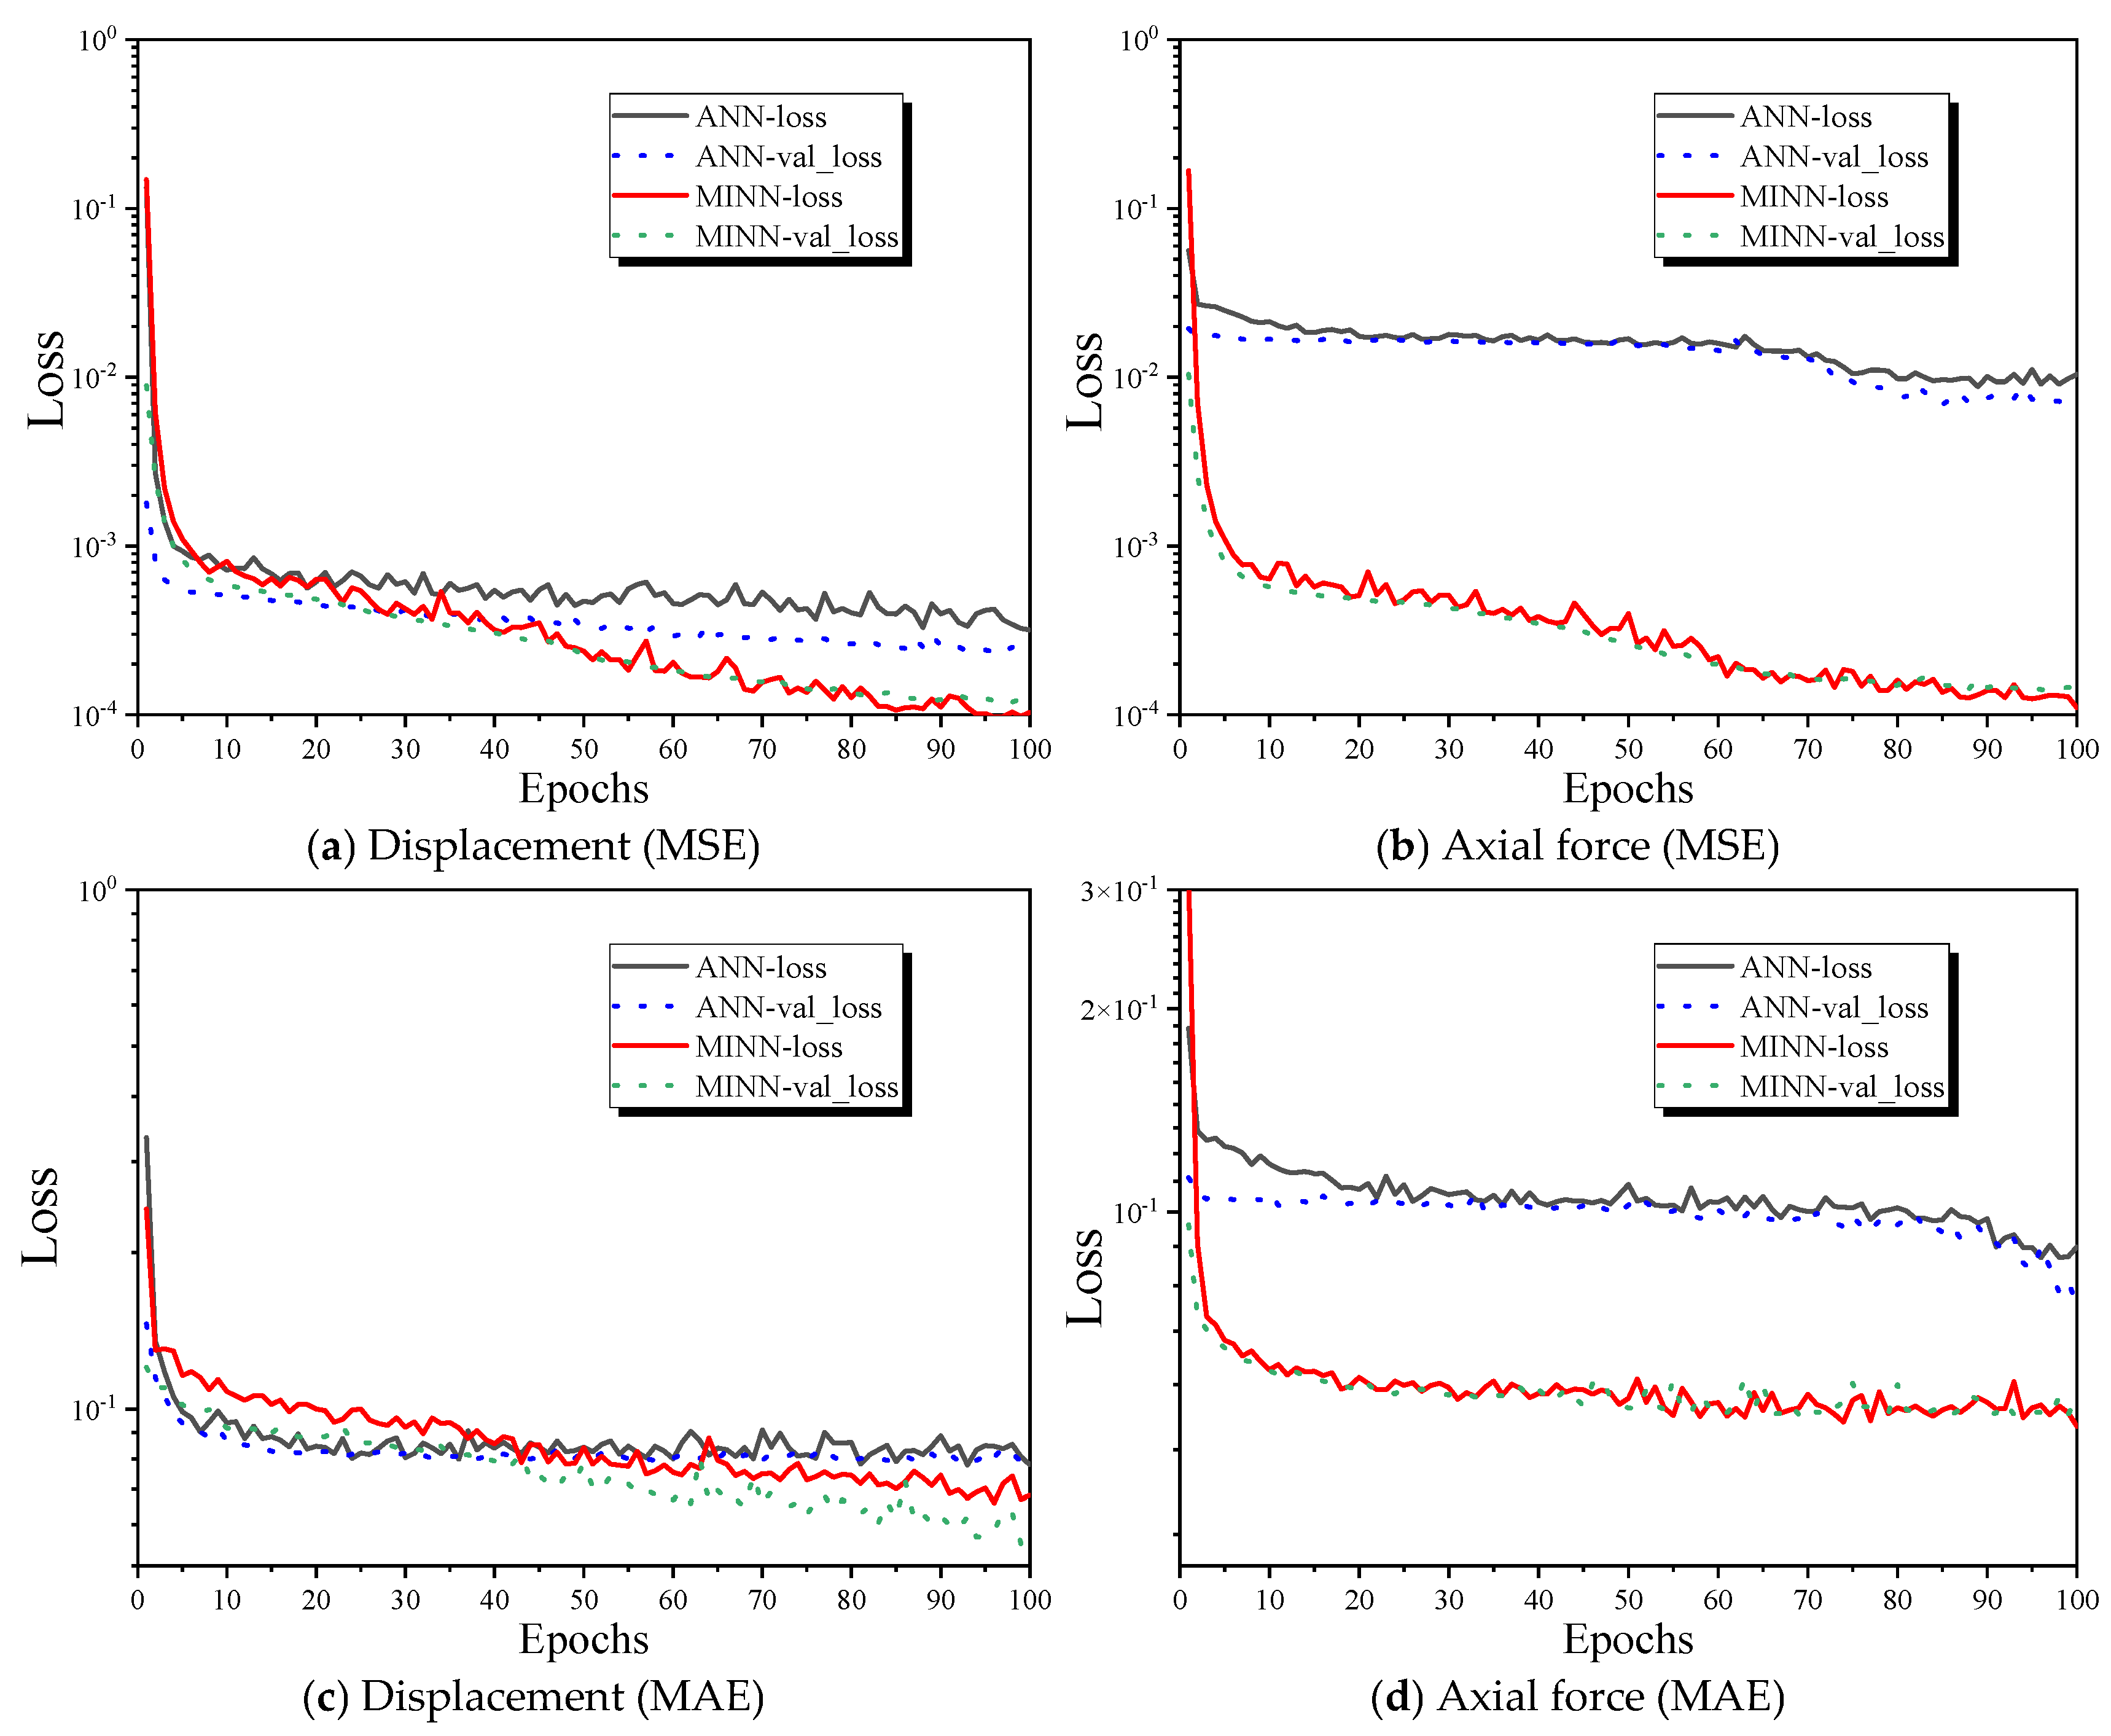
The training and fitting parameter settings for MINN and ANN are identical. The dataset is divided into a training set and a testing set with a ratio of 4:1, while the model is trained for 100 epochs with a batch size of 32. Figure 14 illustrates the evolutions of various performance indices (MSE and MAE) on the dataset after each epoch. During the training of datasets involving displacement and axial force, it can be observed that MINN consistently demonstrates stable fitting capabilities, whereas ANN tends to demonstrate relatively weak fitting performance in the later stages of training iterations. After comparing the loss values following 100 epochs of training, MINN demonstrated a higher precision in fitting capabilities than ANN across both datasets.
Figure 14.
Loss values evolution during neural network training through different performance indices.
4.4. Fitting in Computation
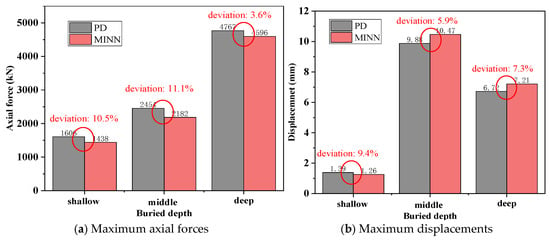
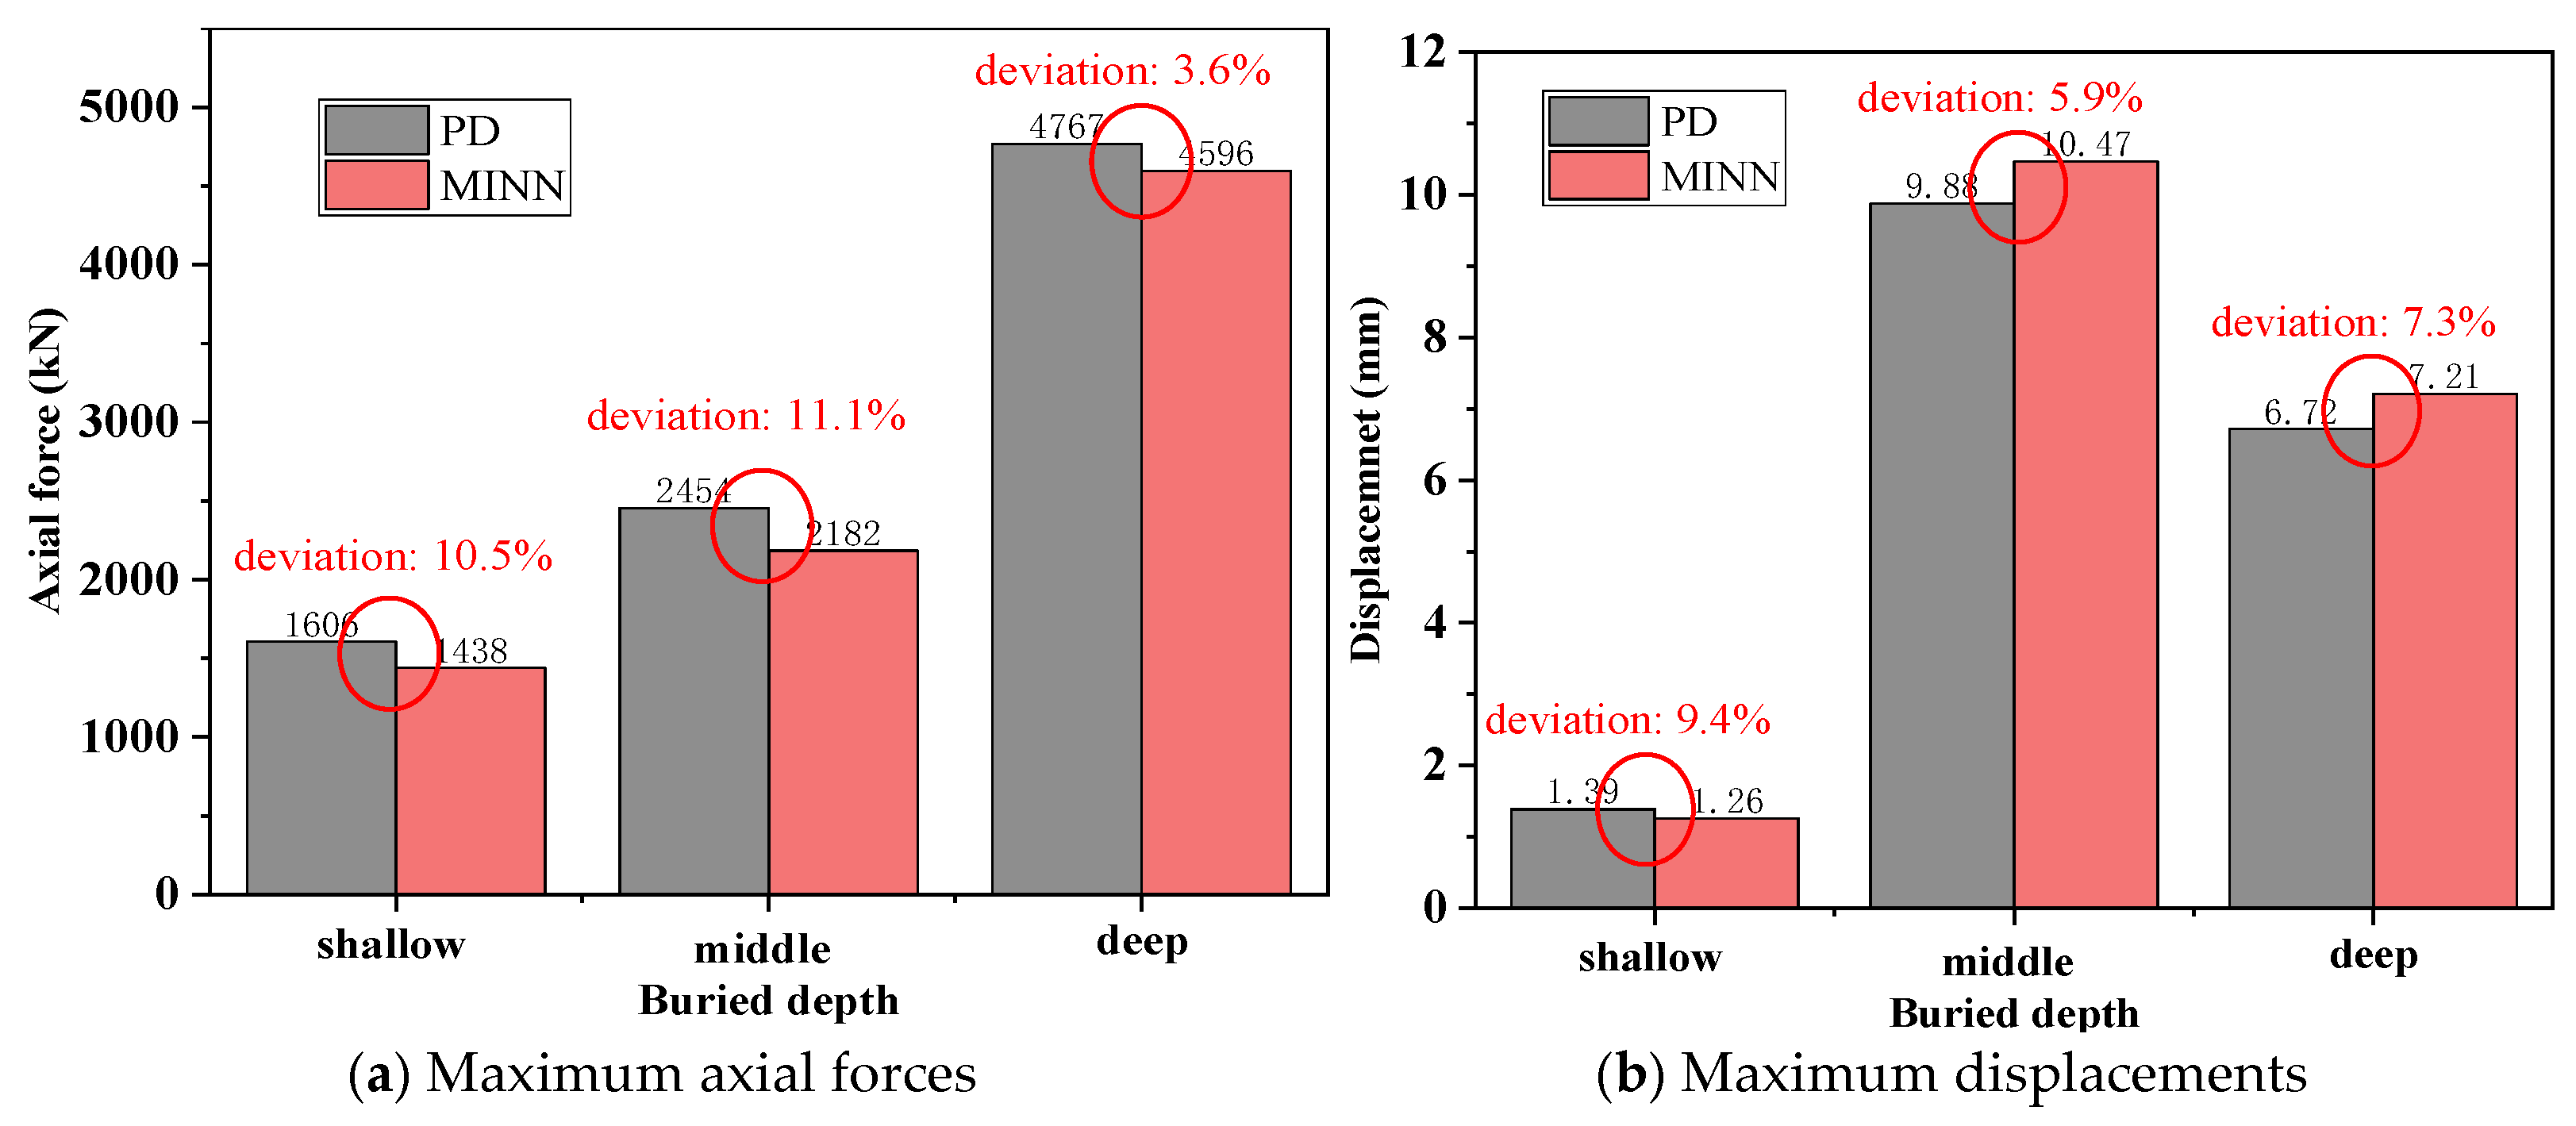
After confirming that MINN can serve as a surrogate model for tunnel lining structural analysis, this section compares its predictions with the corresponding results of PD structural analysis at sections N-1550 and S-1550. Figure 15 and Figure 16 present the pointwise response distributions of displacement and axial force, respectively, so that the consistency in spatial variation along the lining ring can be examined directly. The quantitative deviations of the principal engineering response indices, namely, the maximum displacement and the maximum axial force, are further summarized in Figure 17.
Figure 15.
Displacement results computed from MINN.
Figure 16.
Axial force results computed from MINN.
Figure 17.
Quantitative comparison between PD-driven MINN and PD structural analysis for representative cross-sections with different buried depths.
Figure 15 presents the displacement results of Ring No. 1550 for both the North and South Lines. The displacement calculated using MINN computing shows a larger range of values compared to PD structural analysis. The analysis of the nephogram results indicates that MINN effectively replicates the displacement distribution characteristics of tunnel lining structures with high accuracy. Meanwhile, the numerical outputs of MINN for individual points within the mesh model can achieve a high level of consistency with those of PD structural analysis.
Figure 17 displays the axial force results of the 1550th rings in the South and North Line respectively, which are computed from MINN. Compared to the related results from PD structural analysis, the axial force of MINN is observed to have a larger range of values. Moreover, there are smaller local deviations in the numerical values at various points within the mesh model compared to PD structural analysis. It is worth noting that the axial forces analyzed by MINN for N-1550 predominantly fall within the range of 2600 to 5400 kN, while those for S-1550 mostly lie between 2400 and 5000 kN. This distribution pattern is generally consistent with the range of numerical results calculated by PD structural analysis.
4.5. Generalization Ability
To complement the quantitative comparisons, three additional cross-sections with different buried depths are selected to quantify the predictive deviation of MINN in terms of the maximum displacement and maximum axial force. Figure 18 summarizes these quantitative comparisons. The deviations between PD-driven MINN and PD structural analysis can generally be controlled within 10%.
Figure 18.
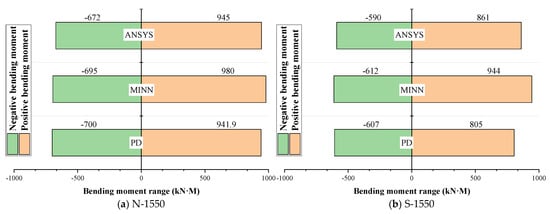
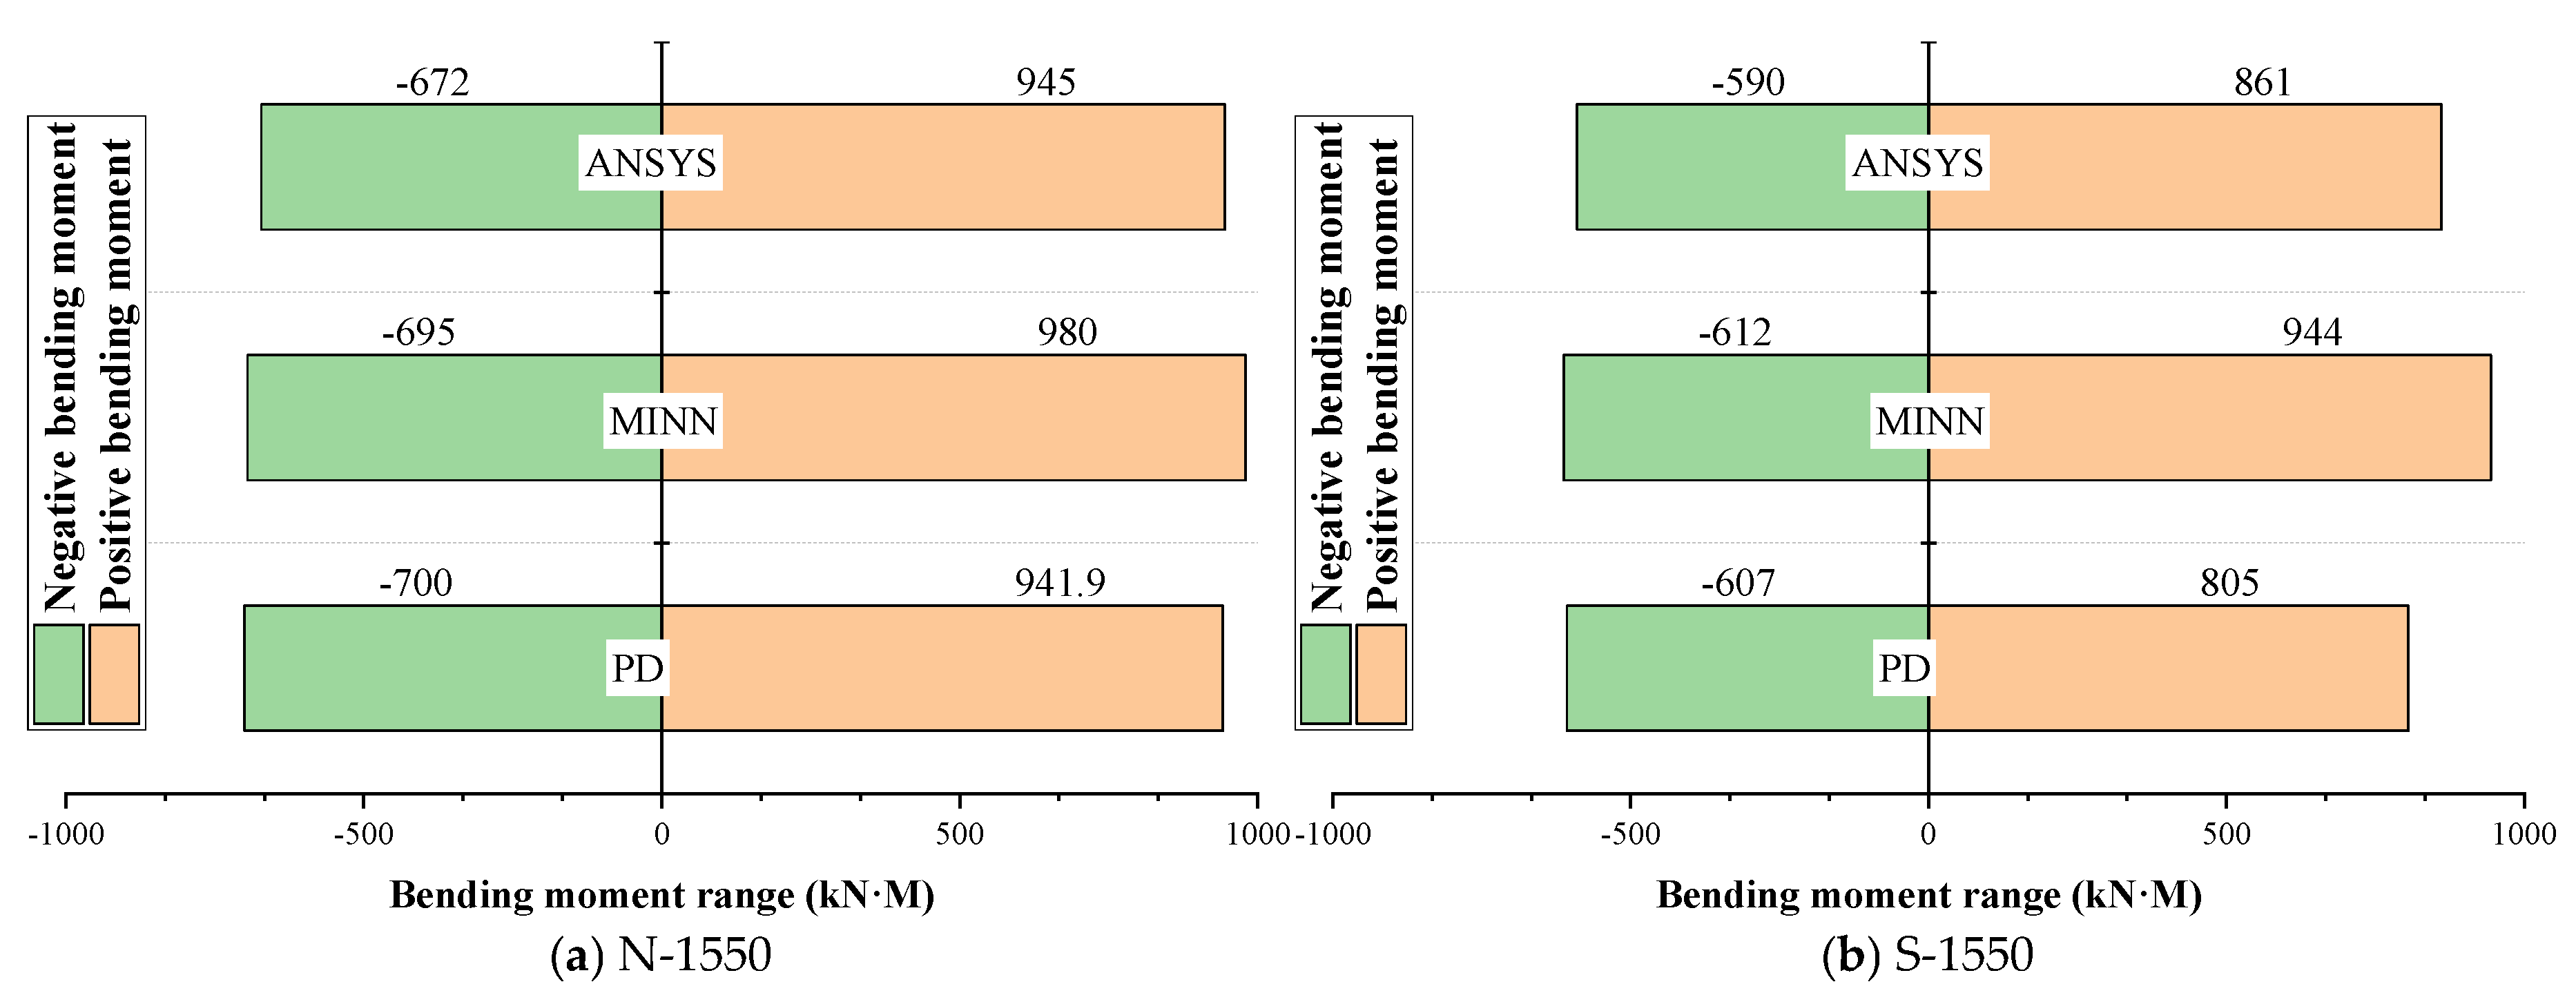
Comparisons of the linings’ bending moment range results from different computing methods at No. 1550 rings.
After completing the investigations of axial force and displacement results using MINN as a surrogate model, we proceed to investigate the comparative results for bending moments. Bending moments have a greater impact on the reinforcement bars’ design for tunnel lining structures compared to axial forces. In this way, a bending moment dataset of 2000 groups is generated using PD structural analysis for data fitting and training with MINN. This study employs the same method used for calculating axial force and displacement to enable MINN to compute the bending moment response of the tunnel linings’ structure. As this study does not conduct the actual measurement for the bending moment of the No. 1550 ring, the FEA results from PD structural analysis are still used as a control group. In addition, the FEA results for the same load conditions using ANSYS 17.2 software are also introduced as a comparative reference. Additionally, considering the characteristic of distribution for the positive and negative bending moment results, the activation function in the output layer of MINN needs to be changed from ‘Softmax’ to the ‘Tanh’ function, while keeping other MINN’s configurations unchanged. The comparative results for the bending moments calculated in different ways are illustrated in Figure 18. It is evident that MINN can still effectively fit the bending moment dataset, and as a surrogate model, it is capable of calculating the bending moments of the tunnel linings’ structure.
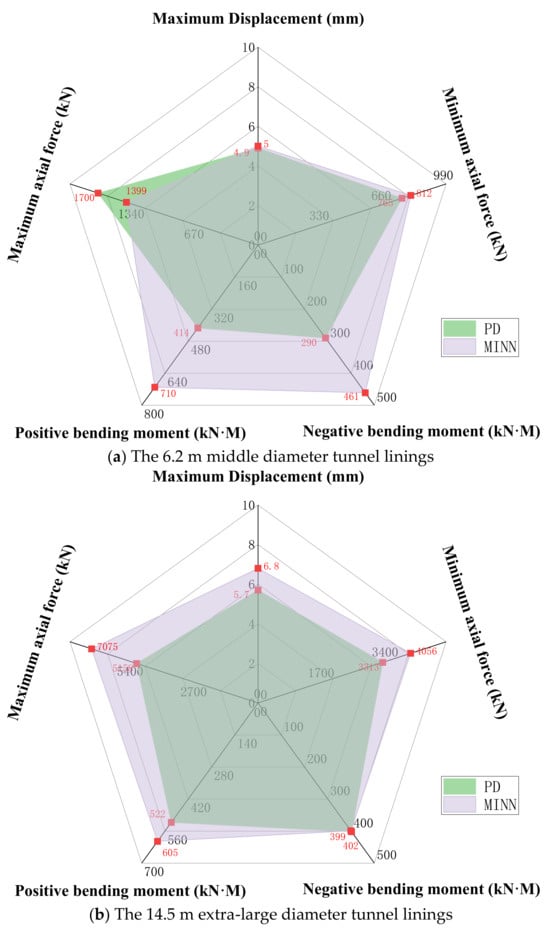
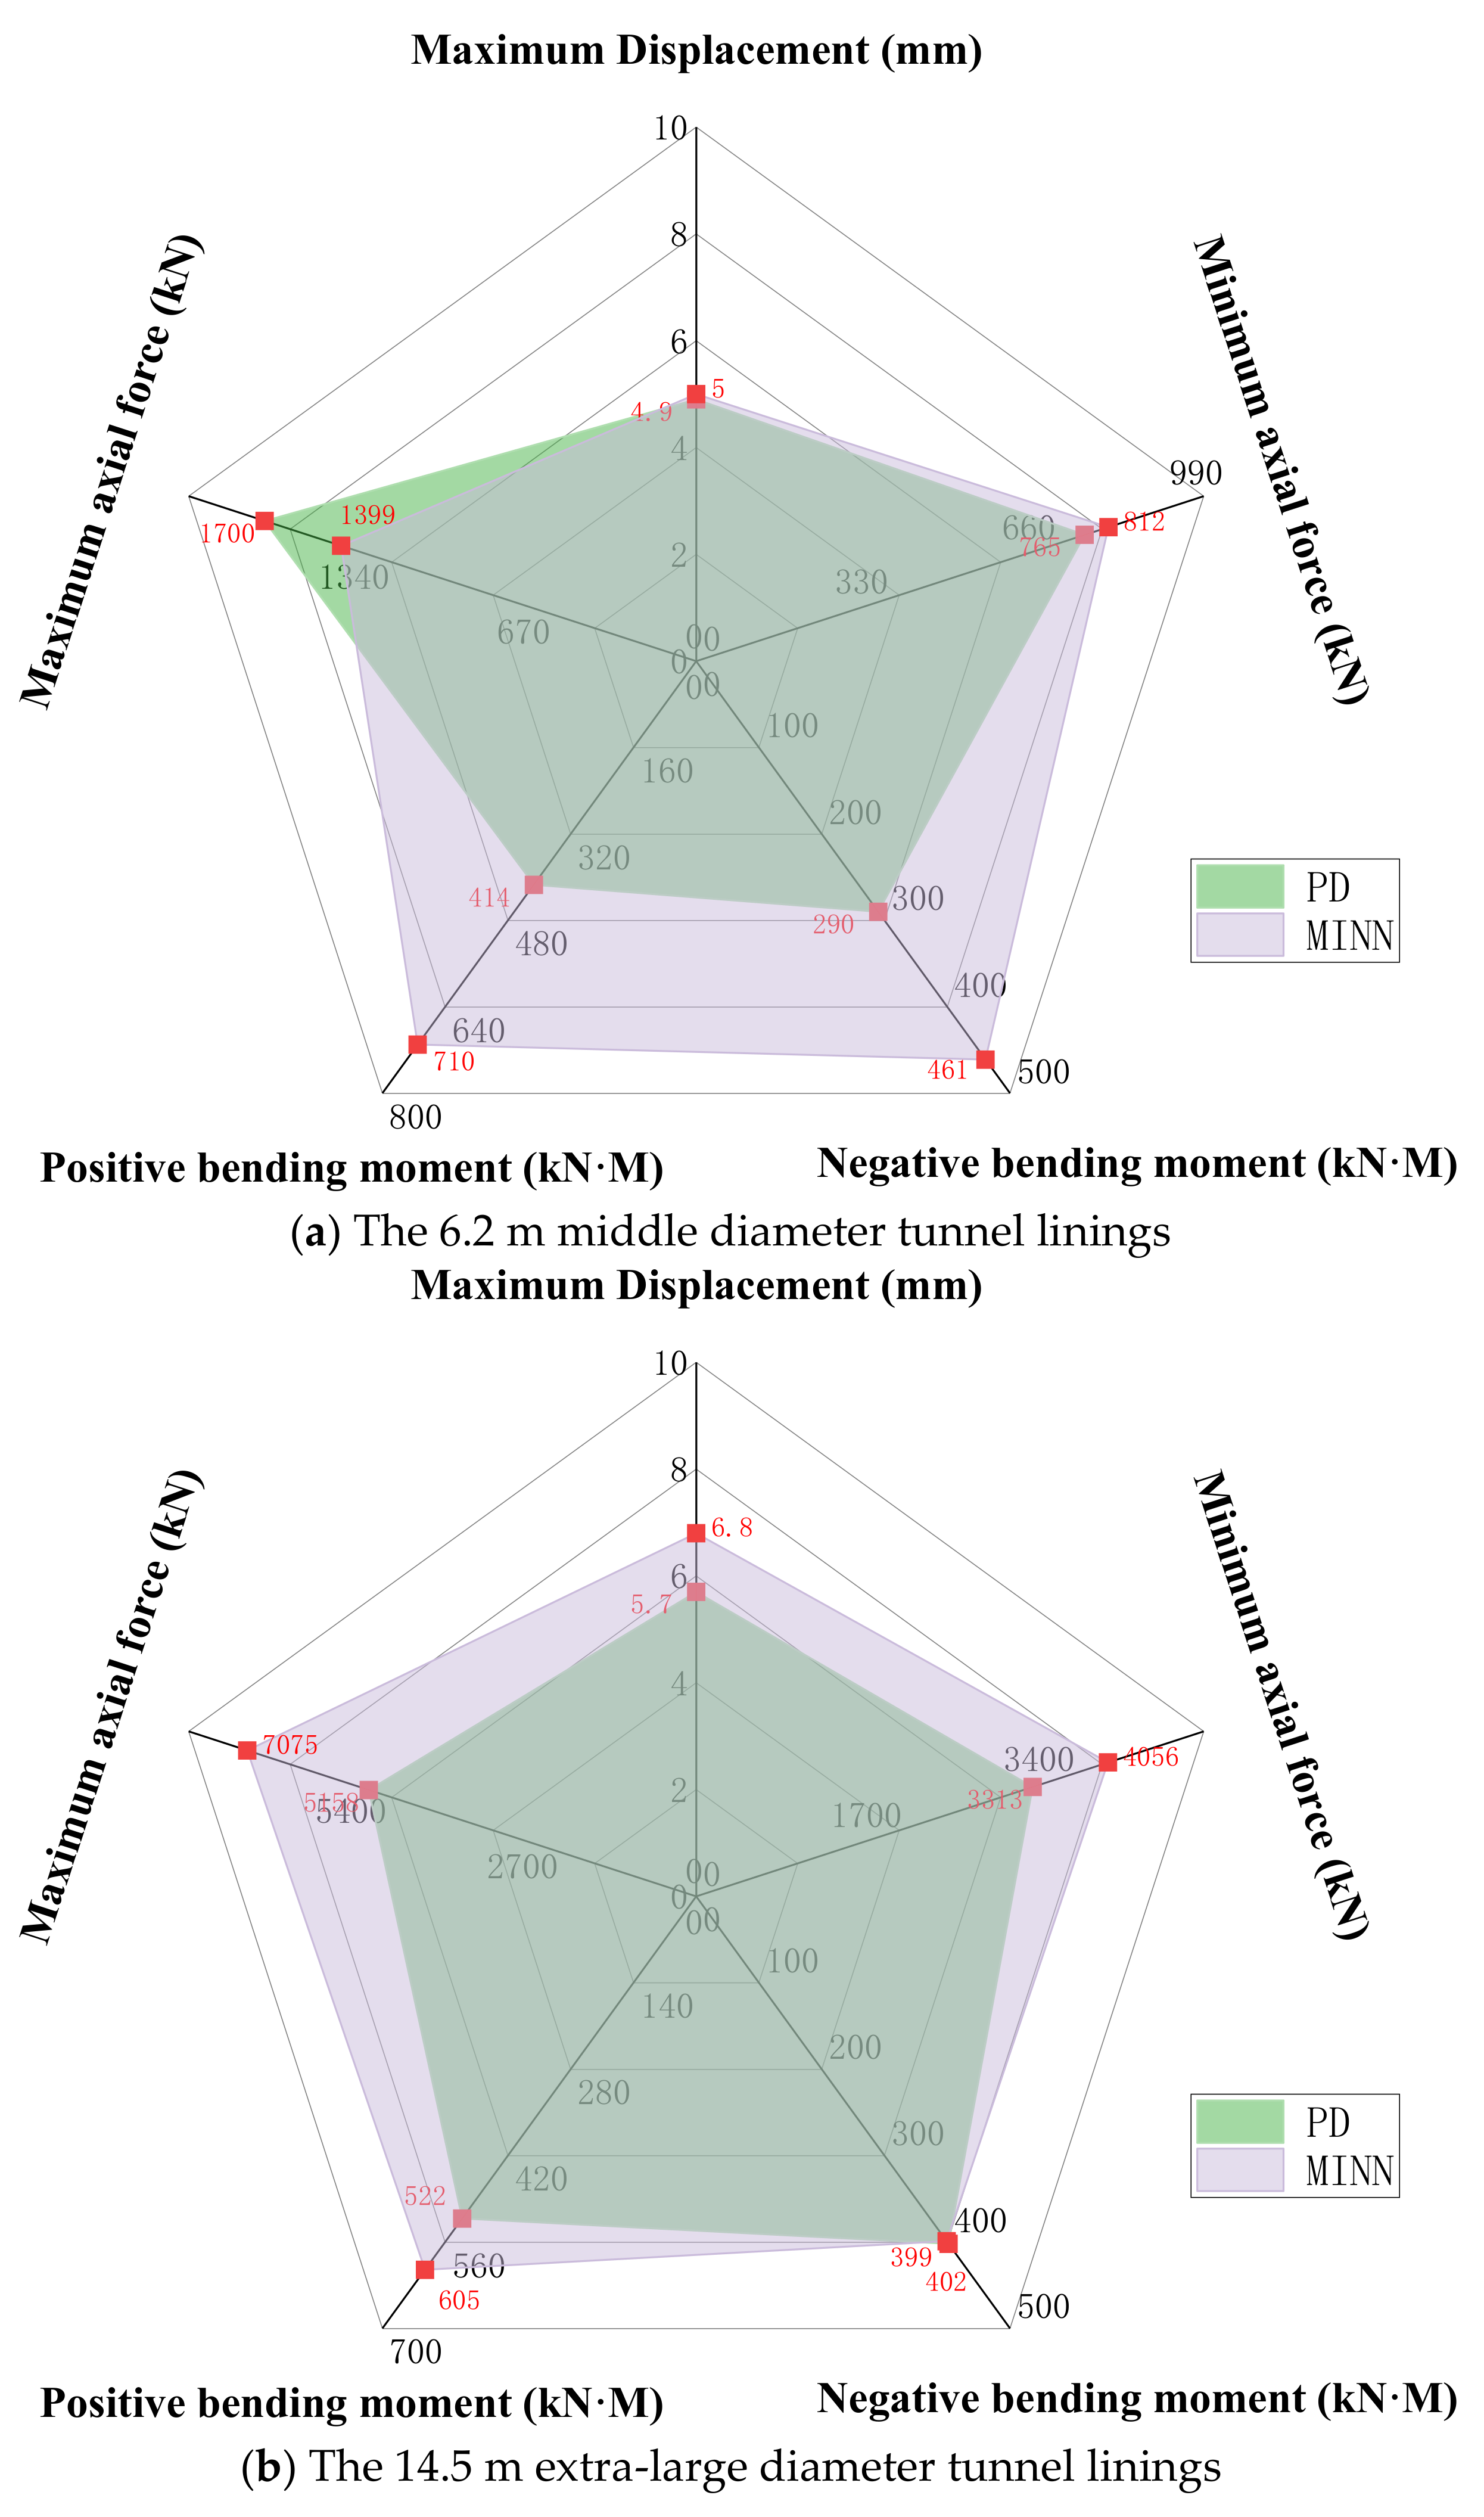
Alongside the large-diameter linings for this project, investigations are also being conducted on tunnel linings of both medium and extra-large diameters. Two cases, with diameters of 6.2 m and 14.5 m, respectively, are selected for comparative analysis to evaluate the results of axial forces, displacements, and bending moments obtained from PD structural analysis and PD-driven MINN. The other conditions in the cases, including design dimensions and loads, will not be elaborated upon here. The comparative results of structural analysis for cases with large and medium diameters are illustrated in Figure 19. The 6.2 m middle diameter case still shows clearly larger deviations in positive and negative bending moments than the other response indices. This result is retained intentionally, because it reveals an important limitation of the present surrogate model: when the size parameters approach the boundary of the training range, the results calculated by PD-driven MINN can differ more significantly from the FEA results obtained by PD structural analysis, especially for bending moments.
Figure 19.
The structural performance analysis results comparisons with different diameters computed using PD structural analysis and MINN.
5. Discussion
The reliability and significance of the proposed PD structural analysis and PD-driven MINN should be further investigated through comparative discussion and software application.
5.1. Comparative Analysis
To assess the validity of the PD structural analysis results, this study employs pre-buried sensors for structural measurement to conduct comparative verification of axial force and displacement. The measurements are reserved for external validation rather than MINN training. This choice is mainly due to the limited amount and incomplete spatial coverage of the monitoring data, which are restricted to two representative sections and affected by partial VMSSG inactivation. In addition, ANSYS results are used as a reference for bending moment comparison. The displacement comparison shows strong agreement between the measured data and the computed results, highlighting the rationality of the PD structural analysis for predicting tunnel lining deformation. This is consistent with the findings of An et al. [31], whose models also achieved high accuracy in capturing complex structural responses through data-driven methods.
The field comparison indicates that the PD structural analysis can reproduce the global response of the lining with reasonable accuracy: the maximum displacement differs by about 5%, and most axial force differences are within 10%. This relatively good agreement suggests that the adopted equivalent stiffness model is adequate for capturing the overall deformation mode and the general level of internal force. More specifically, the simulations are based on a homogeneous ring shell–spring assumption, in which joint discontinuities are treated by the equivalent stiffness coefficient η and the bending moment amplification factor ζ rather than by explicit segment joint constitutive interfaces. Nevertheless, several axial force sensors show larger deviations. These deviations should be interpreted cautiously, because previous studies, like Birrell et al. [32], Pitz & Pochiraju [33], and Liu et al. [34], have shown that structural responses are sensitive to parameter uncertainty, data uncertainty, and simplifying assumptions in homogenized models, especially for local quantities. In this study, additional case-specific factors may include slight mismatches between the actual and idealized measurement locations, survival and stability issues of embedded gauges, and local construction-induced nonuniformity that are not fully represented in the homogeneous ring model.
When comparing the PD-driven MINN with the corresponding ANN, the MINN shows a significantly lower loss during training when fitting the PD structural analysis results. This improvement can be attributed to certain neurons that are cut off in PD-driven MINN, which produces an effect similar to weight regularization and thus helps reduce overfitting. In addition, MINN categorizes input parameters according to their practical significance, thereby improving interpretability, which remains an important challenge highlighted by Li et al. [35]. Furthermore, the use of activation functions tailored to different output distributions, such as Softmax for non-negative values and Tanh for values with both positive and negative ranges, is consistent with the refined modeling strategies discussed in Shin et al. [36].
For the final optimization of neuron numbers and hidden layer depths, 108 neurons and two hidden layers are sufficient for the surrogate modeling of tunnel linings’ structural mechanics. Comparisons between the nephograms of structural analysis results indicate that the computational performance of the PD-driven MINN closely matches that of the PD structural analysis. In terms of result range and spatial distribution, the PD-driven MINN demonstrates reasonable agreement with the reference results. Training on bending moment datasets also shows high consistency between the PD-driven MINN and the PD structural analysis. This finding is consistent with that of Mu et al. [37], which underscores the importance of accurate predictive models for engineering safety and infrastructure protection.
5.2. Engineering Application
In evaluating the generalization capability of the PD-driven MINN model under various loading conditions, the prediction error of maximum axial force and displacement is generally around 10%. While the bending moment results agree well with those obtained by conventional FEA methods for most cases, the deviations become more evident when the lining size approaches extreme values within the studied parameter range. As shown in Figure 20, this feature is most apparent in the 6.2 m middle diameter case, where the positive and negative bending moments show noticeably larger differences than the corresponding displacement and axial force results. This suggests that bending moments are more sensitive to geometric boundary effects and local stiffness redistribution than the other response indices, so the predictive error of the surrogate model is amplified when the input parameters approach the edge of the sampled domain. Therefore, these results should be interpreted as a limitation of generalization near boundary value samples rather than as a systematic loss of accuracy over the entire parameter space. This is consistent with the findings of Wu et al. [38], which emphasize the influence of geotechnical uncertainty on predictive accuracy. Expanding the training samples around boundary value cases and optimizing the probability density of training data during data acquisition may help mitigate such discrepancies, as suggested by the active learning approach by Saadallah et al. [39].
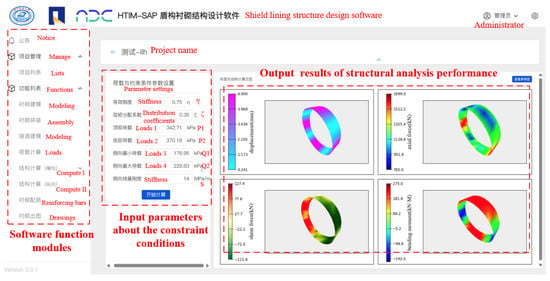
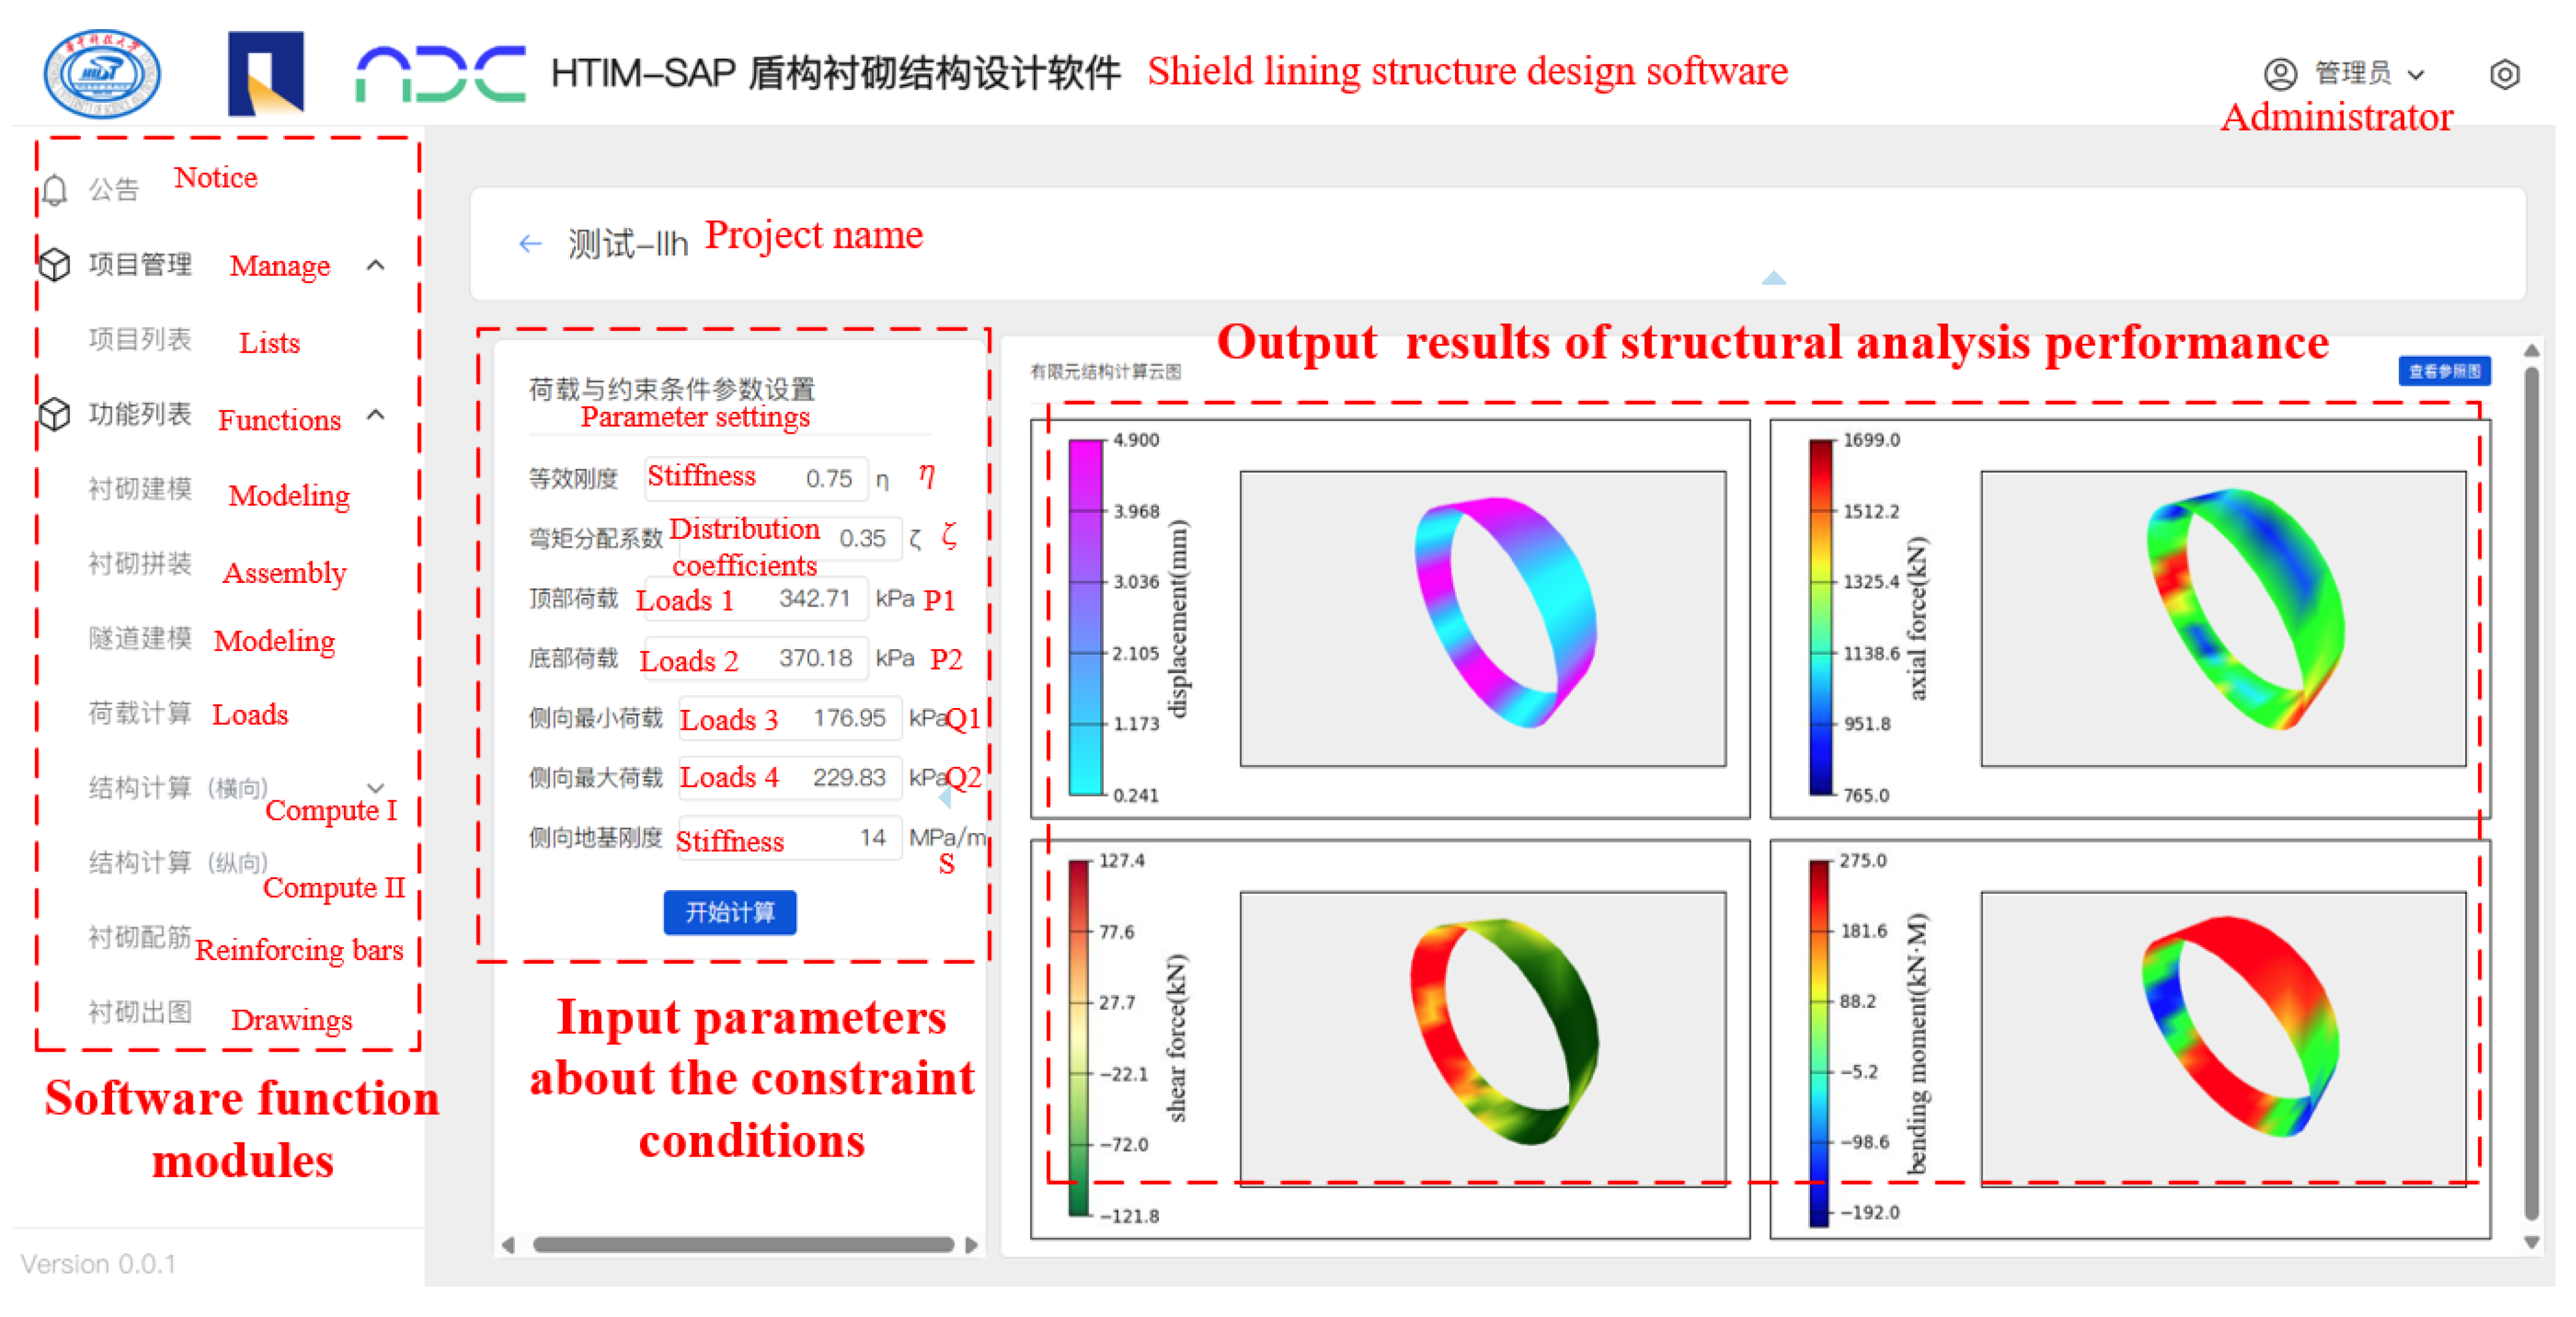
Figure 20.
A functional prototype design of a web-based software with MINN encapsulated as a computational kernel.
By leveraging Keras model encapsulation technology, MINN can be further embedded into web-based design software and developed into a computational functional module, as illustrated in the interface prototype design shown in Figure 20. This approach is analogous to that of Fei et al. [40] and further aligns with the perspectives presented by Li et al. [35], who stressed the importance of modular and integrative approaches for technological applications in underground engineering. Unlike traditional computational cores such as ANSYS or ABAQUS, the developed MINN architecture can be directly applied as a surrogate computational service, thereby reducing dependence on external tools and improving usability.
Overall, the successful application of MINN demonstrates its value for rapid structural response prediction and supports the broader use of machine learning-based surrogate models in complex engineering scenarios.
6. Conclusions
This study developed a PD-driven MINN surrogate model for tunnel lining structural analysis. By combining PD-based automatic data generation with a MINN architecture for multi-parameter inputs, the proposed method improves analysis efficiency while preserving engineering accuracy. The main conclusions are as follows.
(1) PD structural analysis can provide reliable and efficient training data for surrogate modeling. PD can transform the conventional analysis workflow into a programmable and repeatable process for data acquisition. The rationality of the PD structural analysis results can be supported by field measurements from a real transportation tunnel project.
(2) Compared with ANN, MINN showed better fitting performance and training stability under the same training settings, while requiring fewer trainable parameters. In the case study, the PD-driven MINN effectively reproduced the displacement and axial force responses of tunnel linings and showed good agreement with PD structural analysis.
(3) The proposed framework also shows acceptable generalization ability within the studied parameter range.
Future research could incorporate more refined physical models, such as solid elements that account for joint stiffness, to further broaden the strategy’s scope and depth of application.
Author Contributions
Conceptualization, L.L. and H.L.; methodology, L.L.; resources, L.L.; writing—original draft, L.L.; writing—review and editing, H.L.; supervision, H.L.; funding acquisition, L.L. and H.L. All authors have read and agreed to the published version of the manuscript.
Funding
This study is supported by the National Natural Science Foundation of China (52378303) and the Hunan Provincial Transportation Science and Technology Project of China (202609).
Data Availability Statement
The dataset and the source code that support the findings of this study are available from the corresponding author upon reasonable request.
Acknowledgments
The authors would still like to thank Fan Long from Wuhan Municipal Engineering Design Research Institute Co., Ltd., Wenping Huang and Mingkun Hu from Shanghai Tunnel Construction Co., Ltd., and other colleagues from China Railway Siyuan Survey and design group Co., Ltd. for providing technical guidance.
Conflicts of Interest
Author Linhao Li was employed by Hunan Provincial Expressway Group Co., Ltd. The remaining authors declare that the research was conducted in the absence of any commercial or financial relationships that could be construed as a potential conflict of interest.
References
- Chen, X.; Shen, J.; Bao, X.; Wu, X.; Tang, W.; Cui, H. A review of seismic resilience of shield tunnels. Tunn. Undergr. Space Technol. 2023, 136, 105075. [Google Scholar] [CrossRef] [Scilit]
- Luo, H.; Li, L.; Chen, K. Parametric modeling for detailed typesetting and deviation correction in shield tunnelling construction. Autom. Constr. 2022, 134, 104052. [Google Scholar] [CrossRef] [Scilit]
- Ereiz, S.; Duvnjak, I.; Jiménez-Alonso, J.F. Review of finite element model updating methods for structural applications. Structures 2022, 41, 684–723. [Google Scholar] [CrossRef] [Scilit]
- Li, L.; Chen, K.; Wang, J.; Jiang, Z. Parametric Structural Calculation of Shield Linings for Large-Diameter Tunnels Based on the Shell-Spring Model. KSCE J. Civ. Eng. 2023, 27, 2716–2732. [Google Scholar] [CrossRef] [Scilit]
- Huang, H.; Ruan, B.; Wu, X.; Qin, Y. Parameterized modeling and safety simulation of shield tunnel based on BIM-FEA automation framework. Autom. Constr. 2024, 162, 105362. [Google Scholar] [CrossRef] [Scilit]
- Huang, M.Q.; Ninić, J.; Zhang, Q.B. BIM, machine learning and computer vision techniques in underground construction: Current status and future perspectives. Tunn. Undergr. Space Technol. 2021, 108, 103677. [Google Scholar] [CrossRef] [Scilit]
- Liu, J.; Shi, C.; Wang, Z.; Lei, M.; Zhao, D.; Cao, C. Damage mechanism modelling of shield tunnel with longitudinal differential deformation based on elastoplastic damage model. Tunn. Undergr. Space Technol. 2021, 113, 103952. [Google Scholar] [CrossRef] [Scilit]
- Li, S.; Yang, Y. A deep generative framework for data-driven surrogate modeling and visualization of parameterized nonlinear dynamical systems. Nonlinear Dyn. 2023, 111, 10287–10307. [Google Scholar] [CrossRef] [Scilit]
- Sun, L.; Gao, H.; Pan, S.; Wang, J.X. Surrogate modeling for fluid flows based on physics-constrained deep learning without simulation data. Comput. Methods Appl. Mech. Eng. 2020, 361, 112732. [Google Scholar] [CrossRef] [Scilit]
- Wang, G.; Fang, Q.; Du, J.; Wang, J.; Li, Q. Deep learning-based prediction of steady surface settlement due to shield tunnelling. Autom. Constr. 2023, 154, 105006. [Google Scholar] [CrossRef] [Scilit]
- Dugalam, R.; Prakash, G. A hybrid multiple input multiple output (MIMO) model for simultaneous localization and quantification of structural damage in beam structures. Structures 2023, 60, 105879. [Google Scholar] [CrossRef] [Scilit]
- Etemadi, S.; Khashei, M.; Tamizi, S. Etemadi reliability-based multi-layer perceptrons for classification and forecasting. Inf. Sci. 2023, 651, 119716. [Google Scholar] [CrossRef] [Scilit]
- Abyani, M.; Bahaari, M.R.; Zarrin, M.; Nasseri, M. Predicting failure pressure of the corroded offshore pipelines using an efficient finite element based algorithm and machine learning techniques. Ocean Eng. 2022, 254, 111382. [Google Scholar] [CrossRef] [Scilit]
- Yan, X.; Mohammadian, A.; Ao, R.; Liu, J.; Yang, N. Two-dimensional convolutional neural network outperforms other machine learning architectures for water depth surrogate modeling. J. Hydrol. 2023, 616, 128812. [Google Scholar] [CrossRef] [Scilit]
- Ren, M.; Wang, C.; Moshrefi-Torbati, M.; Yurchenko, D.; Shu, Y.; Yang, K. Optimization of a comb-like beam piezoelectric energy harvester using the parallel separated multi-input neural network surrogate model. Mech. Syst. Signal Process. 2025, 224, 111939. [Google Scholar] [CrossRef] [Scilit]
- Liao, W.; Lu, X.; Fei, Y.; Gu, Y.; Huang, Y. Generative AI design for building structures. Autom. Constr. 2024, 157, 105187. [Google Scholar] [CrossRef] [Scilit]
- Jiang, H.; Nie, Z.; Yeo, R.; Farimani, A.B.; Kara, L.B. Stressgan: A generative deep learning model for two-dimensional stress distribution prediction. J. Appl. Mech. 2021, 88, 051005. [Google Scholar] [CrossRef] [Scilit]
- Hu, J.; Chen, Y.; Zhang, L.; Yi, Z. Surrogate dropout: Learning optimal drop rate through proxy. Knowl. Based Syst. 2020, 206, 106340. [Google Scholar] [CrossRef] [Scilit]
- Chen, D.; Levin, D.I.; Sueda, S.; Matusik, W. Data-driven finite elements for geometry and material design. ACM Trans. Graph. (TOG) 2015, 34, 1–10. [Google Scholar] [CrossRef] [Scilit] [PubMed]
- Pan, Y.; Zhang, L. Mitigating tunnel-induced damages using deep neural networks. Autom. Constr. 2022, 138, 104219. [Google Scholar] [CrossRef] [Scilit]
- Rastbood, A.; Gholipour, Y.; Majdi, A. Stress analysis of segmental tunnel lining using artificial neural network. Period. Polytech. Civ. Eng. 2017, 61, 664–676. [Google Scholar] [CrossRef] [Scilit]
- Yoo, S.; Lee, S.; Kim, S.; Hwang, K.H.; Park, J.H.; Kang, N. Integrating deep learning into CAD/CAE system: Generative design and evaluation of 3D conceptual wheel. Struct. Multidiscip. Optim. 2021, 64, 2725–2747. [Google Scholar] [CrossRef] [Scilit]
- Nie, Z.; Jiang, H.; Kara, L.B. Stress field prediction in cantilevered structures using convolutional neural networks. J. Comput. Inf. Sci. Eng. 2020, 20, 011002. [Google Scholar] [CrossRef] [Scilit]
- Mortazavi, S.N.S.; Ince, A. Artificial neural networks-based J-integral prediction for cracked bodies under elasto-plastic deformation state–monotonic loading. Int. J. Fatigue 2023, 167, 107311. [Google Scholar] [CrossRef] [Scilit]
- Zhao, Z.; Wang, J.; Wu, N. Machine Learning-Based Surrogate Ensemble for Frame Displacement Prediction Using Jackknife Averaging. Buildings 2025, 15, 2872. [Google Scholar] [CrossRef] [Scilit]
- Hoffer, J.G.; Geiger, B.C.; Ofner, P.; Kern, R. Mesh-Free Surrogate Models for Structural Mechanic FEM Simulation: A Comparative Study of Approaches. Appl. Sci. 2021, 11, 9411. [Google Scholar] [CrossRef] [Scilit]
- Quevedo, R.R.; Alamo, G.M.; Aznarez, J.J. ANN-based surrogate model for the structural evaluation of jacket support structures for offshore wind turbines. Ocean Eng. 2025, 317, 119984. [Google Scholar] [CrossRef] [Scilit]
- Hürkamp, A.; Rothe, F.; Dröder, K. A data-driven approach for the structural analysis of hybrid metal-plastic composites. Proc. Appl. Math. Mech. 2021, 21, e202100247. [Google Scholar] [CrossRef] [Scilit]
- Bui, H.G.; Cao, B.T.; Freitag, S.; Hackl, K.; Meschke, G. Surrogate modeling for interactive tunnel track design using the cut finite element method. Eng. Comput. 2023, 39, 4025–4043. [Google Scholar] [CrossRef] [Scilit]
- Chen, L.; Wang, Y. Feature-consistent field inversion and machine learning framework with regularized ensemble Kalman method for improving the k-ω shear stress transport model in simulating separated flows. Phys. Rev. Fluids 2025, 10, 024603. [Google Scholar] [CrossRef] [Scilit]
- An, X.; Luo, H.; Zheng, F.; Jiao, Y.; Qi, J.; Zhang, Y. Explainable deep learning-based dynamic prediction of surface settlement considering temporal characteristics during deep excavation. Appl. Soft Comput. 2024, 167, 112273. [Google Scholar] [CrossRef] [Scilit]
- Birrell, M.; Li, Y.; Astroza, R. A Gaussian Process surrogate approach for analyzing parameter uncertainty in mechanics-based structural finite element models. Eng. Struct. 2025, 336, 120435. [Google Scholar] [CrossRef] [Scilit]
- Pitz, E.; Pochiraju, K. A neural network transformer model for composite microstructure homogenization. Eng. Appl. Artif. Intell. 2024, 134, 108622. [Google Scholar] [CrossRef] [Scilit]
- Liu, F.; Ma, J.; Ye, Z.; Wang, L.; Sun, Y.; Yu, J.; Qin, Y.; Zhang, D.; Cai, W.; Li, H. Cross-Scale Reliability Analysis Framework for LNG Storage Tanks Considering Concrete Material Uncertainty. J. Mar. Sci. Eng. 2024, 12, 276. [Google Scholar] [CrossRef] [Scilit]
- Li, T.; Rui, Y.; Zhao, S.; Zhang, Y.; Zhu, H. A quantitative digital twin maturity model for underground infrastructure based on D-ANP. Tunn. Undergr. Space Technol. 2024, 146, 105612. [Google Scholar] [CrossRef] [Scilit]
- Shin, Y.J.; Kim, D.H.; Lee, I.M. Numerical simulation of seepage-induced behavior of tunnel for analyzing deformation characteristic and estimating geotechnical parameters. KSCE J. Civ. Eng. 2014, 18, 659–671. [Google Scholar] [CrossRef] [Scilit]
- Mu, L.; Zhang, P.; Shi, Z.; Zhu, M.; Gu, Z. Predicting longitudinal tunnel deformation due to deep excavation-induced ground movement. Tunn. Undergr. Space Technol. 2023, 131, 104793. [Google Scholar] [CrossRef] [Scilit]
- Wu, W.; Lu, H.; Chen, S.; Zhang, D. Effect and control of foundation pit excavation on existing tunnels: A state-of-the-art review. Tunn. Undergr. Space Technol. 2024, 147, 105704. [Google Scholar] [CrossRef] [Scilit]
- Saadallah, A.; Egorov, A.; Cao, B.T.; Freitag, S.; Morik, K.; Meschke, G. Active learning for accurate settlement prediction using numerical simulations in mechanized tunneling. Procedia CIRP 2019, 81, 1052–1058. [Google Scholar] [CrossRef] [Scilit]
- Fei, Y.; Liao, W.; Zhang, S.; Yin, P.; Han, B.; Zhao, P.; Chen, X.; Lu, X. Integrated Schematic Design Method for Shear Wall Structures: A Practical Application of Generative Adversarial Networks. Buildings 2022, 12, 1295. [Google Scholar] [CrossRef] [Scilit]

Disclaimer/Publisher’s Note: The statements, opinions and data contained in all publications are solely those of the individual author(s) and contributor(s) and not of MDPI and/or the editor(s). MDPI and/or the editor(s) disclaim responsibility for any injury to people or property resulting from any ideas, methods, instructions or products referred to in the content. |
© 2026 by the authors. Licensee MDPI, Basel, Switzerland. This article is an open access article distributed under the terms and conditions of the Creative Commons Attribution (CC BY) license.