


Abstract
Safety risk prediction in construction is a fundamental basis for accident prevention, and its scientific rigor directly affects the effectiveness of safety management decision-making. However, traditional approaches rely heavily on subjective judgment in weight determination, while accident datasets are often constrained by limited sample sizes and imbalanced class distributions, which hinder model training performance. To address these limitations, this study proposes an improved model based on data augmentation, termed SAE-SMOTE-AWBN (SSA). The proposed approach employs SMOTE to alleviate data imbalance, integrates a stacked autoencoder (SAE) to enhance feature representation, and utilizes AWBN to perform probabilistic inference of risk factors alongside adaptive weight adjustment. Results obtained from five-fold cross-validation indicate that, compared with the 58.6% prediction accuracy achieved by traditional methods, the SSA model improves accident prediction accuracy to 78.3 ± 2.4%, thereby demonstrating the effectiveness and applicability of the proposed approach.
1. Introduction
1.1. Research Background
The construction industry consistently faces severe safety management challenges due to its inherent complexity, multi-party involvement, and high-risk operational environment, with an accident rate significantly higher than other sectors [1]. Particularly in China, construction safety performance still lags behind that of developed nations. Moreover, the aging workforce is becoming increasingly prominent—in 2021, migrant workers aged 50 and above accounted for 24.6% of the total, which further intensifies difficulties in risk identification and control [2]. This complexity and dynamism make traditional experience-based risk assessment methods inadequate for rapidly changing construction sites, creating an urgent need for more precise and intelligent risk early-warning technologies to improve management effectiveness [3,4].
Current research indicates that while machine learning demonstrates considerable potential in construction risk management, it still encounters challenges such as the scarcity of high-quality datasets, insufficient model interpretability, and the dynamic nature of construction projects [5]. Furthermore, existing studies remain insufficient in addressing the intrinsic complexity of the construction industry, particularly in real-time hazard identification involving factors such as heterogeneous stakeholders, operational concurrency, and harsh environmental conditions. To address these limitations, this study aims to develop a framework capable of learning from limited and imbalanced data to achieve high-accuracy, interpretable risk warning by integrating deep learning with probabilistic reasoning, thereby advancing the intelligence level of construction safety management [6,7].
By introducing a deep stacked autoencoder for data augmentation, this study effectively mitigates the issue of scarce accident samples, significantly enhancing the model’s capability to identify major and severe accidents. Additionally, through adaptive weighted Bayesian inference, the framework can objectively quantify the contribution of causal factors, thereby improving both the accuracy and transparency of risk prediction and providing a solid data-driven foundation for preventing serious safety accidents [8]. This approach not only avoids the subjective biases inherent in traditional expert experience-based assessments but also achieves objective quantification of risk causes through mutual information theory, offering decision-makers more scientifically grounded evidence [9].
This framework, which combines data-driven augmentation with intelligent probabilistic reasoning, opens new pathways for developing adaptive and precise construction safety management systems. It demonstrates notable advantages, particularly in handling complex, dynamic, and data-scarce real-world scenarios [10]. The proposed framework helps bridge the gaps of traditional safety management methods in dealing with complex on-site risks by automatically identifying and quantifying various potential human and material risk factors, thereby facilitating proactive safety management [11]. Moreover, it provides a new technical route for intelligent supervision, enabling automatic extraction of deep features and objective early warning from limited accident text data [12].
1.2. Literature Review
1.2.1. Current Research Status on Data-Driven Analysis of Construction Safety Risks
In recent years, with the rapid advancement of machine learning and data mining technologies, researchers have begun leveraging empirical data from accident reports and sensor monitoring systems to develop risk prediction methods based on models such as Bayesian networks, random forests, and support vector machines, thereby addressing the subjectivity inherent in traditional expert-experience approaches. In the domain of uncertainty reasoning, Bayesian networks (BN) have demonstrated notable advantages: Leu and Chang [13] were among the first to establish the potential of BN in handling multi-level risk dependencies; Zhang et al. [14] enhanced model robustness by incorporating fuzzy probabilities and expert credibility. To meet the demands of complex construction environments, BN models have evolved from static to dynamic and hybrid architectures: scholars, including Wang, Wu, Piao, and Yang Wen’an [15,16,17,18], successfully characterized the temporal and procedural evolution of risks in prefabricated construction, tunnel engineering, and personnel fall scenarios by introducing dynamic Bayesian networks. Beyond these core applications, BN has been widely employed across specialized subdomains, including safety compliance pathway identification [19], training effectiveness tracking [20], ergonomic assessment [21], elevated work prediction [22], mental health analysis [23], and safety performance forecasting [24]. In specific engineering contexts, Wang, Shen, Yao, Zhang, Wang Junwu, and Wang Xin’an et al. [25,26,27,28,29,30] respectively integrated BN with fuzzy evaluation, text mining, association rules, design structure matrices, STPA, and DEMATEL, enhancing both the depth and breadth of risk identification in metro construction, deep excavation, and lifting operations. Meanwhile, Wang Ru et al. [31] combined knowledge graphs with BIM to achieve a transition from quantitative risk computation to visual risk management.
In the area of accident severity and consequence prediction, data-driven machine learning models have demonstrated powerful capabilities in classification and regression tasks. Ayhan, Choi, Kang, Zhu et al. [32,33,34,35,36], drawing on accident records from multiple countries, developed predictive models targeting the consequences of construction injuries and the characteristics of fatal accidents. To address the data imbalance problem prevalent in construction safety research, Salarian, Koc et al. [37,38] conducted in-depth investigations into the importance of resampling techniques, clustering algorithms, and automated preprocessing for identifying high-consequence accidents, while Zermane et al. [39] focused on classification prediction for the high-risk scenario of falls from height. With the rise in the leading indicator concept, Poh and Gondia [40,41] introduced machine learning into predictive safety management, enabling continuous monitoring of dynamic risks throughout the project lifecycle. In terms of model architecture innovation, Baker [42] leveraged natural language processing to achieve multi-attribute joint prediction; Koc et al. [43] employed a hybrid wavelet–machine learning approach to capture non-stationary time-series features; and Toğan et al. [44] reduced the barrier to model tuning through automated machine learning. Notably, graph neural networks (GNN) and attention mechanisms are emerging as frontier directions in this field: Mostofi et al. [45,46,47] constructed multi-head attention graphs, sparse accident networks, and graph convolutional models to deeply mine latent associations among construction accidents at the topological level, offering new pathways for building intelligent construction safety risk assessment and recommendation systems.
1.2.2. Current Research Status of Data Enhancement Techniques in Small-Sample Risk Analysis Scenarios
In small-sample scenarios, to address the challenges of limited sample sizes and imbalanced class distributions, existing research has introduced various techniques that leverage data augmentation to improve model generalization and robustness under extremely data-scarce conditions. As a representative deep unsupervised feature learning model, the Stacked Autoencoder (SAE) compresses high-dimensional raw data into a low-dimensional latent space through a multi-layer nonlinear encoding-decoding architecture, achieving data reconstruction and augmentation while preserving key discriminative information, and has progressively become an important tool in industrial safety and risk analysis. Yuan et al. [48] proposed an enhanced stacked autoencoder that achieves data-driven soft sensing of quality variables through an improved loss function; Han et al. [49] applied a data-augmented stacked autoencoder to scenarios with insufficient mechanical fault classification samples and employed visualization techniques to interpret the feature learning mechanism; Yu et al. [50] designed a novel stacked autoencoder model with a reinforcement iterative learning style, effectively addressing the small-sample challenge in industrial fault detection; Xu et al. [51] further integrated long short-term memory networks with deep stacked sequence-to-sequence autoencoders to achieve time-series prediction of worker health risks in enclosed environments based on wearable devices. In specific risk assessment applications, Zhou et al. [52] employed a feature-distance stacked autoencoder combined with linear regression for electricity market risk assessment; Feng et al. [53] utilized the latent representations of a stacked autoencoder to achieve granular risk assessment of earthquake-induced landslides, validating the effectiveness of SAE in extracting features from complex risk factors.
In the field of construction safety, data augmentation techniques are evolving from simple sample expansion toward deeper knowledge enhancement. Leach et al. [54] designed diverse image augmentation schemes for building inspection and post-disaster assessment scenarios to improve the robustness of deep learning models; Kim et al. [55] proposed an object scope extension synthesis method that enriches the image sample space for safety monitoring through mask insertion techniques; Lee et al. [56,57] explored generative AI-driven data augmentation strategies to enhance construction hazard detection performance. However, the aforementioned studies predominantly focus on computer vision tasks. When confronting the high-dimensional sparsity and extreme class imbalance inherent in textual data from construction accident reports, the applicability of SAE faces particular challenges: since SAE targets global reconstruction error minimization, it tends during training to preferentially learn the distributional features of majority classes, resulting in poor reconstruction quality for minority-class samples; the generated augmented samples consequently inherit the imbalanced distribution of the original data, and may further erode the representational capacity of minority classes through the averaging effect of reconstruction error. To address this limitation, researchers have attempted to integrate SAE with other sampling techniques to optimize data distribution. Li et al. [58] improved the classification accuracy of structural damage in civil infrastructure through a machine learning-driven augmentation strategy; Li et al. [59] combined weighted Bayesian networks with data augmentation methods to achieve safety assessment of high-speed railway interval structures. Overall, however, studies that organically combine SAE latent-space feature extraction with oversampling techniques and systematically apply them to construction safety risk analysis remain scarce, and the mechanisms by which the manifold structural properties of SAE in low-dimensional latent space may mitigate class imbalance problems have yet to be thoroughly explored.
Although the aforementioned studies have made valuable contributions, several limitations remain. First, most existing models rely on relatively large and balanced datasets, whereas construction accident data are typically limited in scale and exhibit imbalanced class distributions, with high-risk accidents accounting for a relatively small proportion. Second, while many machine learning methods achieve acceptable levels of accuracy, they often lack interpretability, which restricts their applicability in practical construction safety management. Third, traditional approaches involve strong subjectivity in weight determination, which can compromise the objectivity of prediction results.
1.3. Research Work and Contributions
To address these issues, this study proposes a data-driven framework that integrates an SAE for data augmentation, mutual information (MI) for objective feature weighting, and AWBN for interpretable probabilistic reasoning, while employing SMOTE to achieve a relatively balanced distribution of accident instances across different risk levels.
- (1)
- A baseline model based on the Analytic Hierarchy Process (AHP) is constructed, in which experts, drawing on samples from the 2023 accident dataset, identify a total of 22 factors across four dimensions—human, machine, environment, and management. The AHP method is employed to calculate factor weights, and predictions are subsequently made based on expert judgment. This model reveals notable limitations, including a high degree of subjectivity in weight determination and low sample utilization efficiency.
- (2)
- An SAE-AWBN (SA) prediction model is constructed, adopting the 22 factors used in the traditional approach. After classifying the data according to the aforementioned accident severity levels, a stacked autoencoder (SAE) is used to perform unconstrained augmentation of each category-specific sample set, while mutual information (MI) is applied to compute feature weights. Subsequently, adaptive weighted Bayesian networks (AWBN) are utilized to predict accident severity levels. The results indicate that the SA model achieves a prediction accuracy of 61.7% ± 3.4%; however, the augmented dataset remains imbalanced.
- (3)
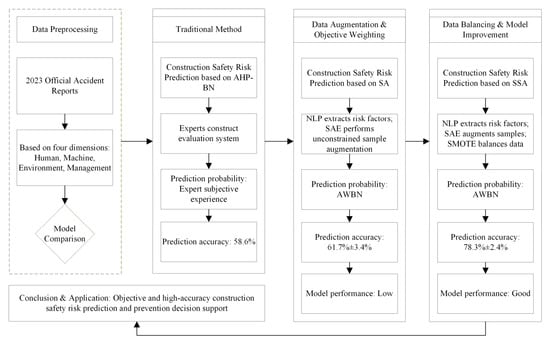
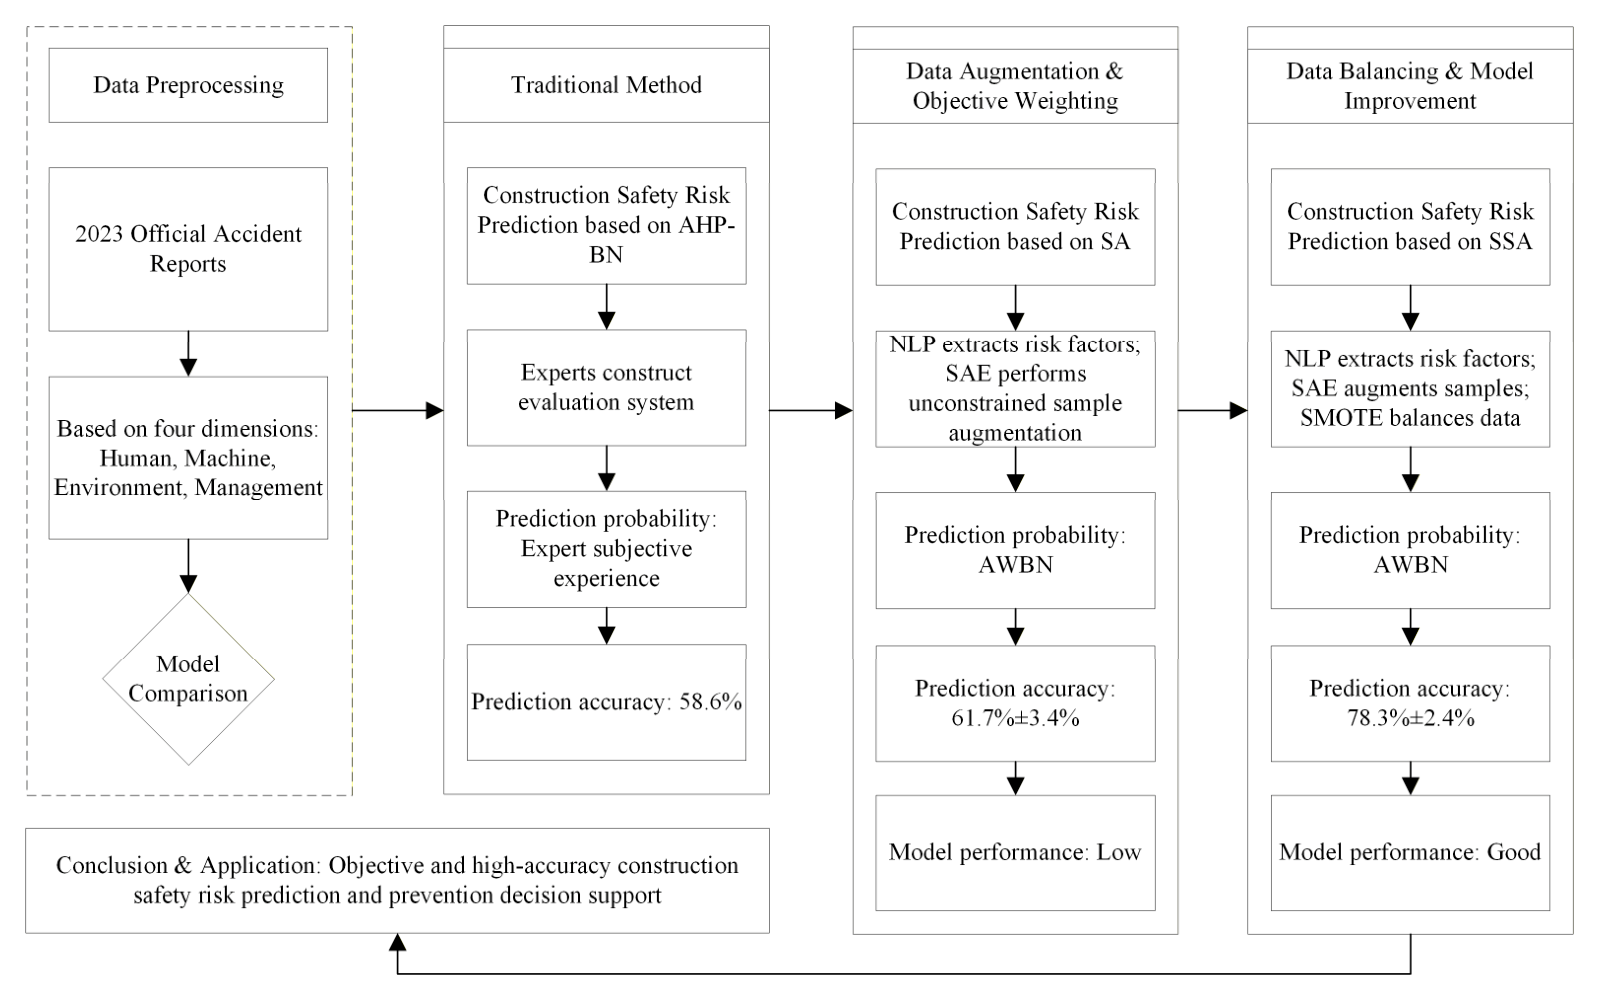
- An SAE-SMOTE-AWBN (SSA) prediction model is developed, adopting the 22 factors used in the traditional approach. After categorizing the data according to the aforementioned accident severity levels, a stacked autoencoder (SAE) is used to perform unconstrained augmentation of each class-specific dataset. Subsequently, SMOTE is introduced to balance the SAE-generated dataset, while mutual information (MI) is applied to compute feature weights. Adaptive weighted Bayesian networks (AWBN) are then utilized to predict accident severity levels. The results indicate that the SSA model achieves a prediction accuracy of 78.3% ± 2.4%, with the post-augmentation class imbalance effectively mitigated. The model demonstrates superior performance compared to the SA model. The detailed technical workflow is illustrated in Figure 1.Figure 1. Technical roadmap.
2. Data Description & Preprocessing
2.1. Data Description
The accident investigation report data used in this study are sourced from construction safety accident cases disclosed on official government information platforms of provinces, municipalities, and counties across the People’s Republic of China. A web crawler developed in Python 3.11 was employed to automatically collect construction safety accident investigation reports published by these governmental entities during 2023, yielding a total of 1446 original accident records.
2.2. Data Preprocessing
To quantify the severity of accident consequences, it is necessary to assign risk level labels to accident samples. In this study, based on the provisions for accident classification stipulated in the Regulation on the Reporting, Investigation, and Handling of Production Safety Accidents promulgated by the State Council of the People’s Republic of China, and in consideration of the practical requirements of construction safety risk analysis, the severity of accident consequences is categorized into three levels: low risk, medium risk, and high risk.
According to the Regulation, production safety accidents are classified into the following four categories based on the number of fatalities:
- (1)
- Extraordinarily major accidents: fatalities ≥ 30.
- (2)
- Major accidents: 10 ≤ fatalities < 30.
- (3)
- Relatively major accidents: 3 ≤ fatalities < 10.
- (4)
- General accidents: fatalities < 3.
In the context of this study, these categories are mapped onto the three risk levels—low, medium, and high—used in the proposed risk evaluation model. Considering that extraordinarily major accidents are extremely rare in construction, the above categories are consolidated accordingly. The specific mapping rules are presented in Table 1.
Table 1.
Classification Criteria for Accident Risk Levels.
According to the above rules, the risk levels of a total of 1446 accident investigation reports were individually marked. The annotation results are shown in Table 2.
Table 2.
Distribution of samples in the experimental dataset.
2.3. Accident Cause Feature Extraction Based on NLP
To systematically and objectively extract construction safety risk factors from 1446 valid accident samples, this study employs natural language processing (NLP) to perform text mining on the accident narratives and direct/indirect causes recorded in the accident reports. The processing pipeline comprises text preprocessing, term frequency statistics, and visualization.
2.3.1. Text Preprocessing and Word Frequency Statistics
The accident texts were first preprocessed through the following steps:
- (1)
- Chinese word segmentation was performed using Python’s JIEBA library.
- (2)
- Punctuation marks and semantically meaningless stop words were removed.
- (3)
- Synonymous terms were merged.
- (4)
- Nouns, verbs, and verb-noun combinations were retained as candidate feature terms.
Based on the preprocessed corpus, the frequency of each risk factor keyword across the 1446 samples was tallied. Table 3 presents the statistical results for high-frequency factors.
Table 3.
Word Frequency Statistics of Accident Factors.
To visually illustrate the distribution of high-frequency terms, a word cloud was generated, as shown in Figure 2. As indicated in the figure, terms such as economy, climate, subcontracting, and safety awareness appear in larger fonts, which is consistent with the term frequency statistics.
Figure 2.
Factor Word Cloud Map.
2.3.2. Keyword Co-Occurrence and Association Analysis
To reveal the intrinsic associations among factors, a high-frequency term co-occurrence matrix was constructed based on the detailed factor keyword list derived from the full-factor identification results. The top 8 keywords by frequency were selected, and the number of times each pair co-occurred within the same accident description was counted. The co-occurrence results are presented in Table 4.
Table 4.
Co-occurrence Matrix of High Frequency Words.
The co-occurrence data reveal structural characteristics in the associations among causal factors:
The three elements of environment, management, and personnel are highly coupled. The pairs climate substandard–economic pressure (868 co-occurrences), economic pressure–hazard investigation (838 co-occurrences), and safety awareness–economic pressure (825 co-occurrences) rank as the top three in co-occurrence frequency, indicating that economic factors form strong associative chains with climatic conditions, hazard investigation, and safety awareness. Economic pressure not only amplifies the impact of climate-related risks but also constrains investment in hazard investigation and the improvement of personnel safety awareness.
The co-occurrence network reveals a typical causal chain for construction accidents: the compounding of economic and environmental risks → deficiencies in subcontracting management modes → inadequate hazard investigation and insufficient safety protection → weakened safety awareness → ultimately leading to accidents. This chain provides a quantitative basis for constructing the variable dependency relationships in the subsequent adaptive weighted Bayesian model.
It is acknowledged that among the causal factors considered in this study, certain pairs exhibit non-negligible correlations. However, empirical studies have consistently demonstrated that Naive Bayes classifiers maintain robust classification performance even when the conditional independence assumption is moderately violated, particularly in high-dimensional, sparse tabular data settings. Furthermore, the exponential weighting mechanism introduced in AWBN partially compensates for inter-feature correlations by down-weighting redundant features with lower mutual information scores, thereby mitigating the adverse effects of feature dependence on prediction accuracy.
3. Methodology
3.1. Vectorized Representation of Accident Features
Since the raw data originate from unstructured accident investigation reports across various provinces, the accident sample set is first defined as shown in Equation (1):
is the total number of samples. For the -th accident sample, its feature vector contains causal dimensions, and denotes the three-level risk label of low, medium, or high.
To eliminate scale differences, Min-Max normalization was applied to continuous variables, mapping the data to the interval , as shown in Equation (2):
3.2. Stacked Autoencoder
A stacked autoencoder is a deep neural network architecture composed of multiple, sequentially layered autoencoders, widely used for feature extraction and latent pattern recognition in high-dimensional, complex data. An autoencoder is essentially an unsupervised learning model. Its core logic involves a symmetrical encoding and decoding process, projecting input data into a low-dimensional latent space and striving to reconstruct the original signal as completely as possible.
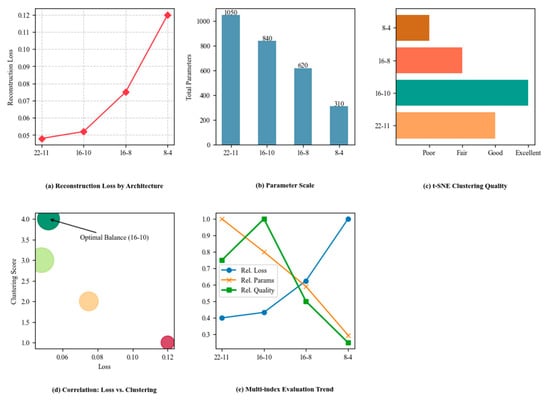
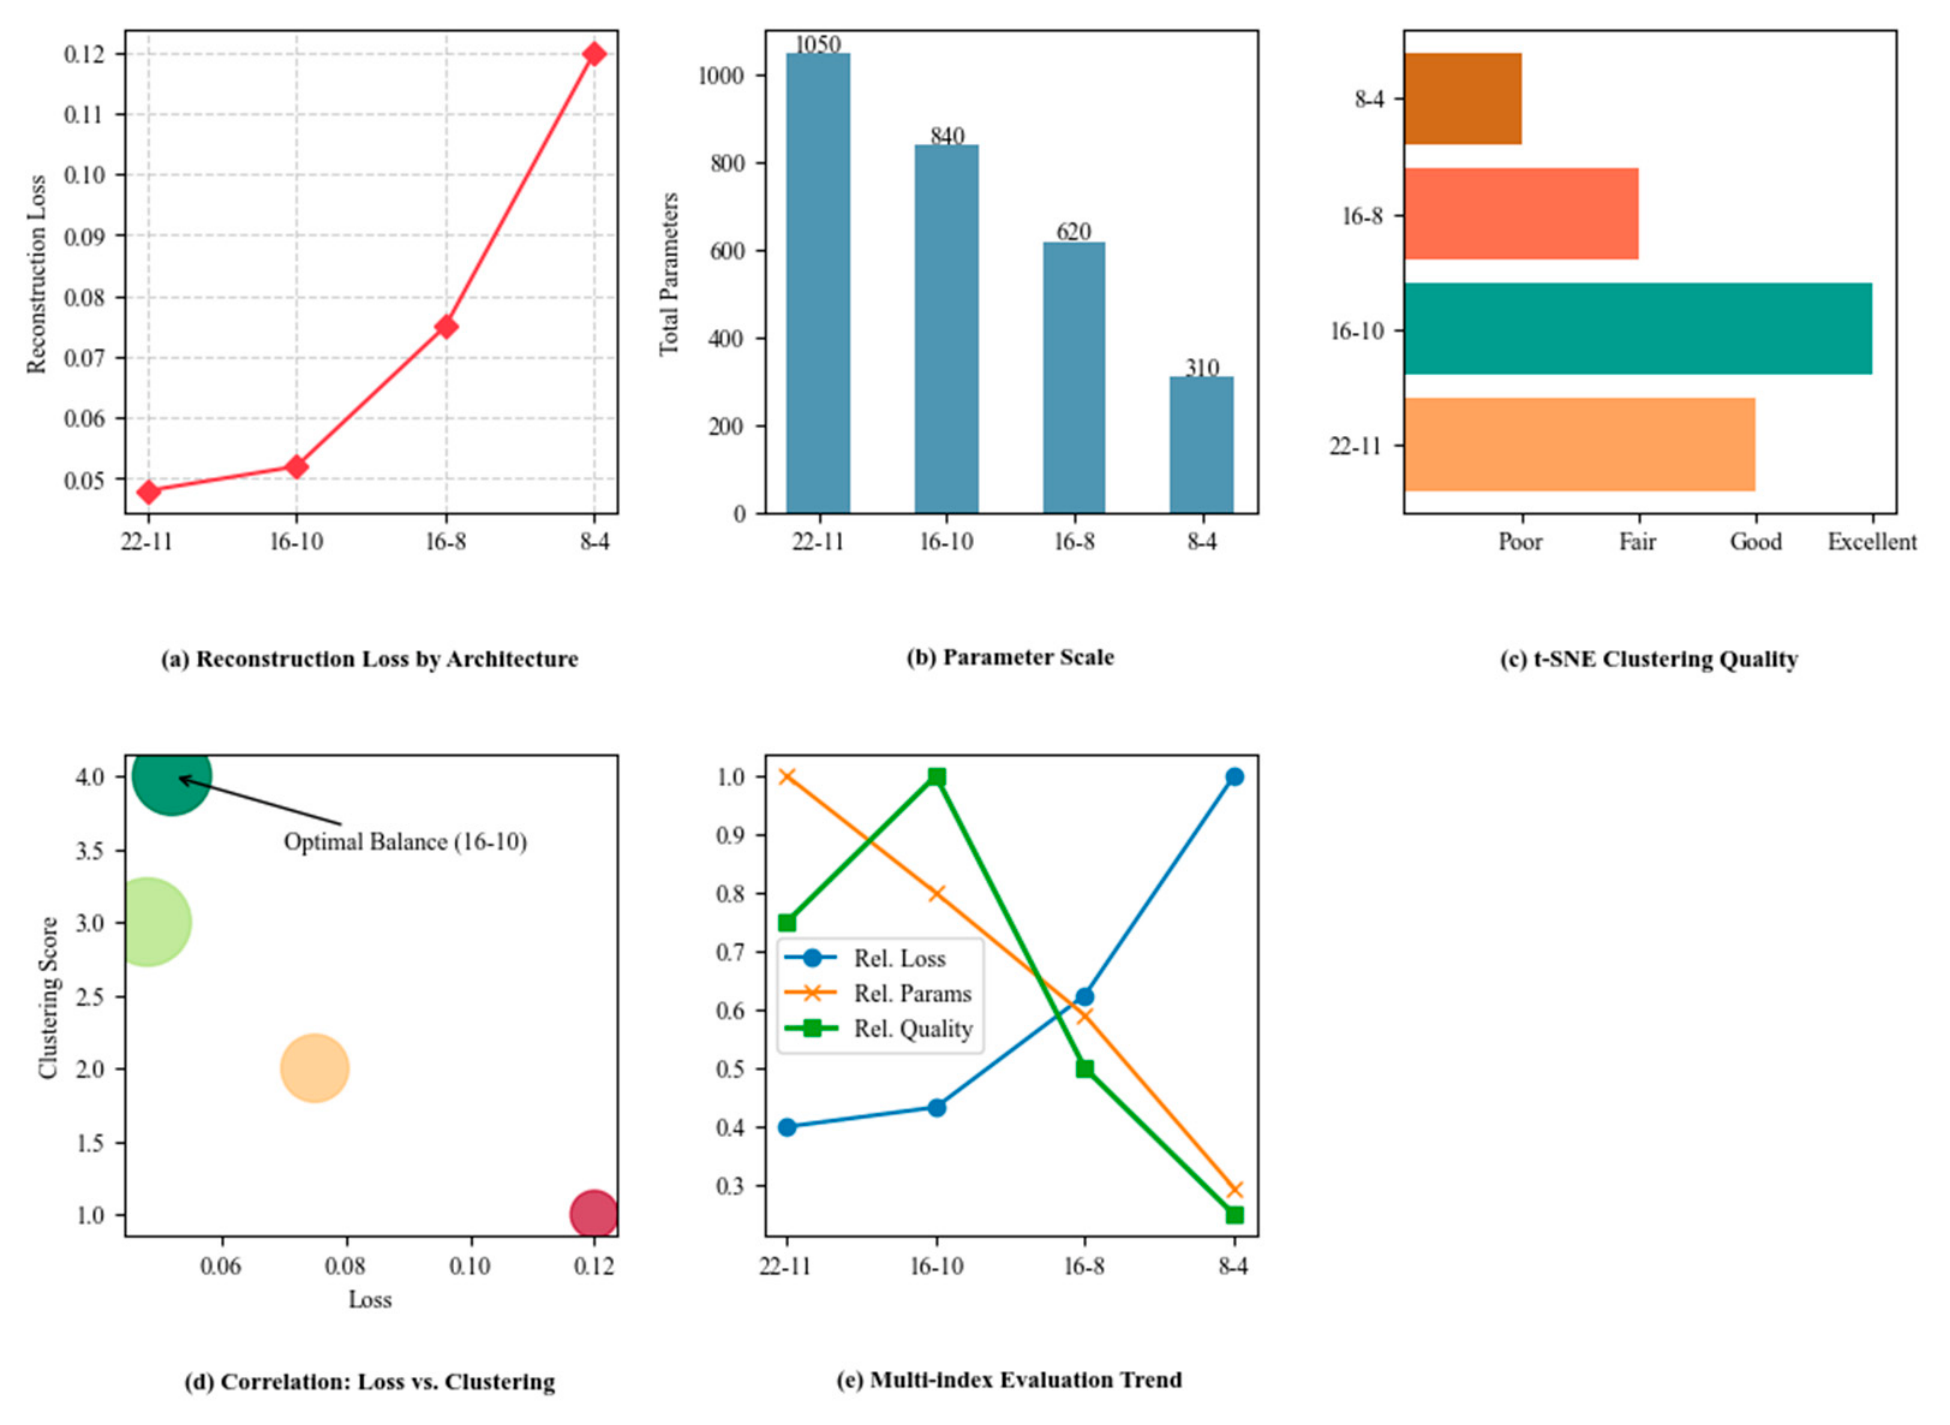
Through experimental comparison and analysis, the SAE adopts a symmetric encoding–decoding architecture. The number of neurons in the input layer is set to 16, with binary values (0 or 1), while the number of neurons in the hidden layer is set to 10, as determined through experimentation. In this study, a grid search method is employed to explore multiple combinations of dimensions for the first encoding layer and the latent feature layer. The evaluation criteria include reconstruction loss (measured by MSE) and the separability of the latent space (assessed by t-SNE visualization). The comparative experimental results are presented in Figure 3.
Figure 3.
Optimization Results of SAE Parameter Design Experiment.
Therefore, the parameters of the SAE are set as follows:
- Input Layer: The number of neurons is set to 16, corresponding to the 16 core accident causation keyword features extracted after preprocessing.
- First Hidden Layer: The number of neurons is set to 10. This layer aims to perform preliminary feature compression, removing redundant information from the raw data.
- Second Hidden Layer: The number of neurons is set to 6. Serving as the core encoding layer, the low-dimensional vectors extracted here represent the deep manifold features of accidents, which are used for subsequent risk classification.
- Output Layer: The number of neurons is 16, guiding the network training by reconstructing the original input.
- Activation Function: The ReLU function is used for the hidden layers to handle non-linear feature mapping; a linear activation function is used for the output layer to achieve data reconstruction.
- Learning Rate: Set to 0.05 for fine-tuning connection weights layer-by-layer via the backpropagation algorithm.
- Loss Function: Mean Squared Error (MSE) is used, with L2 weight regularization introduced to prevent model overfitting.
- Sparsity Proportion: Set to 0.05. By introducing a sparsity constraint, the model is forced to activate only a few critical neurons, thereby extracting more discriminative key features of accidents.
- Training Epochs: Both the pre-training for each layer and the overall fine-tuning were set to run for 200 iterations.
Feature Augmentation Logic: With the above settings, the SAE learns the distribution pattern of accident data within the manifold space. During the model training phase, the feature representations generated by the encoding layer are used to perform reconstruction-based sampling for the scarce high-risk accident samples. This approach, without altering the underlying physical principles, alleviates the severe imbalance between the 149 high-risk samples and the 782 low-risk samples by increasing the coverage of high-dimensional features.
3.2.1. Stacked Autoencoder Construction
A deep neural network composed of multiple encoder and decoder layers is constructed. Let the input layer be , and the output of the first hidden layer be . The encoding process can be expressed as a nonlinear mapping:
and represent the weight matrix and bias vector of the -th layer, respectively, and f denotes the ReLU activation function. The output of the deepest hidden layer, , constitutes the compressed representation of the data in the low-dimensional manifold space. The decoding process aims to reconstruct the latent features back to the original dimensions:
The objective of model training is to minimize the Mean Squared Error (MSE) loss function between the input and the reconstructed output :
denotes the regularization term, which is used to prevent overfitting.
3.2.2. Linear Interpolation in Latent Space
Unlike traditional algorithms that perform linear interpolation in the original high-dimensional space, sampling is conducted in the compressed latent space after SAE processing. Assuming and are the latent feature vectors of two samples belonging to the same high-risk category, the synthesized new sample feature is calculated as follows:
is a random interpolation coefficient. Subsequently, is mapped back to the original space via the decoder to obtain the augmented sample :
This approach ensures that the generated sample points lie on the manifold surface of accident causation factors, thereby maintaining the consistency of physical logic.
3.3. Mutual Information
Mutual information is a measure in information theory that quantifies the degree of mutual dependence between two random variables. Unlike traditional linear correlation coefficients, mutual information can capture complex non-linear statistical relationships between variables and does not require the variables to follow a normal distribution. When dealing with construction accident data, the relationship between causal factors and accident severity levels often exhibits highly non-linear coupling characteristics. Mutual information provides an effective mathematical tool for quantifying such complex associations.
3.4. Adaptive Weighted Bayesian Network
Combining the augmented dataset with the objective weights, an enhanced Naïve Bayes classifier is constructed.
3.4.1. Fundamentals of Bayesian Network Theory
A Bayesian network is a directed acyclic graph based on probabilistic reasoning, consisting of two main components: a structural model and a parameter model. In the context of construction risk prediction, a BN can clearly represent the causal dependencies between accident causes and outcomes through its graphical structure. Previous studies have shown that BNs possess significant advantages in handling uncertain information and missing data. Their core relies on Bayes’ theorem, which is used to infer the posterior probability of potential risks based on known evidence.
3.4.2. Limitations of Traditional Bayesian Inference
Although traditional Bayesian networks are widely applied, they exhibit inherent limitations when dealing with complex construction accident datasets. Since the contribution of various causal factors to risk outcomes varies, and under small-sample conditions, the conditional probability tables learned via maximum likelihood estimation are highly susceptible to data noise or sample distribution bias. Scholars have pointed out that without differentiated treatment of the association strengths between nodes, the model often struggles to accurately identify the key triggers leading to major or severe accidents from a vast array of features, thereby reducing the sensitivity of early warnings.
3.4.3. Adaptive Weighting Mechanism
To address the aforementioned limitations, this study proposes an Adaptive Weighted Bayesian Network model. Its core concept involves effectively integrating the mutual information weights , calculated in Section 3.3, into the Bayesian inference framework to dynamically adjust the prior probabilities or conditional distributions of nodes. In the AWBN, the joint probability distribution is no longer a simple product of conditional probabilities but incorporates weighting factors that reflect the importance of causes. Let be the causal nodes and be the risk level node. The revised inference process accounts for the varying contributions of factors to the outcome. Based on the weighting principle, the conditional probability distribution is adaptively adjusted, allowing factors with higher relevance to the risk level to play a more dominant role in the inference path:
The adjustment function adopts an exponential weighting mechanism, wherein the likelihood probability of each feature is raised to the power of its corresponding mutual information weight . Specifically, the weighted posterior probability is computed as:
where denotes the normalized mutual information weight of feature j, satisfying . This exponential form ensures that features with higher discriminative power exert a disproportionately greater influence on the final classification decision, while suppressing the contribution of low-relevance features in a differentiable and interpretable manner. By introducing adaptive weights, the model can further strengthen the critical causal chains on the basis of the deep features extracted by SAE. This approach not only significantly improves prediction accuracy on class-imbalanced data but also preserves the “interpretability” of the model through explicit weighting parameters, enabling managers to intuitively identify which factors are the core triggers of the current risk level.
The denominator serves as a normalizing constant ensuring that posterior probabilities sum to unity across all risk classes. Since classification relies solely on the relative magnitude of posterior probabilities, remains constant across classes and does not affect the final prediction.
3.4.4. Kernel Density Estimation
Considering that accident data typically do not follow a standard normal distribution, the Gaussian kernel function is employed for non-parametric estimation of the likelihood probability for continuous variables:
is the number of samples belonging to class , and is the bandwidth parameter.
3.4.5. Weighted Posterior Probability Derivation
According to Bayes’ theorem, after introducing the feature weights , the posterior probability of a sample belonging to risk level is updated as follows:
Finally, the sample is assigned to the risk level with the maximum posterior probability as follows:
Through the exponential weighting mechanism, key causal factors with high mutual information will play a dominant role in the probability reasoning process, thereby significantly enhancing the model’s interpretability and predictive accuracy.
3.5. Synthetic Minority Over-Sampling Technique
SMOTE is applied in the SAE-enhanced feature space rather than in the original feature space. This modification is motivated by two key observations:
- (1)
- Feature dimensionality reduction and decoupling: The encoder of the SAE maps the original high-dimensional inputs into a low-dimensional latent representation, which exhibits improved linear separability and a more compact manifold structure. Performing Euclidean distance computation and linear interpolation in this latent space effectively mitigates the curse of dimensionality, and the interpolated samples are more likely to lie on the true data manifold.
- (2)
- Noise suppression: The reconstruction process of the SAE has a denoising effect, whereby anomalous samples are pulled back toward the normal distribution region after reconstruction. Conducting SMOTE interpolation on these denoised samples helps avoid the generation of invalid synthetic samples caused by measurement errors or recording inaccuracies in the original data.
4. Experimental Results and Analysis
4.1. Traditional Method
4.1.1. Traditional Method for Weight Calculation
To validate the superiority of the proposed framework, a traditional Naïve Bayes model based on expert knowledge is first constructed as a benchmark. In this model, input features are directly derived from keyword matching in accident reports. Feature weights are assigned by domain experts using the AHP. The model considers four dimensions: personnel, machinery and equipment, management, and environment. No data augmentation techniques are employed; instead, probabilistic distribution fitting is performed directly on the original imbalanced dataset. The resulting weights are as illustrated in Table 5 and Table 6.
Table 5.
Primary Factor Weighting Table.
Table 6.
Secondary Factor Weighting Table.
4.1.2. Traditional Method Weight Analysis
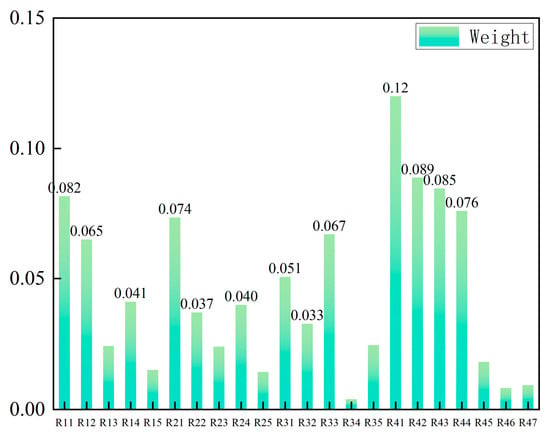
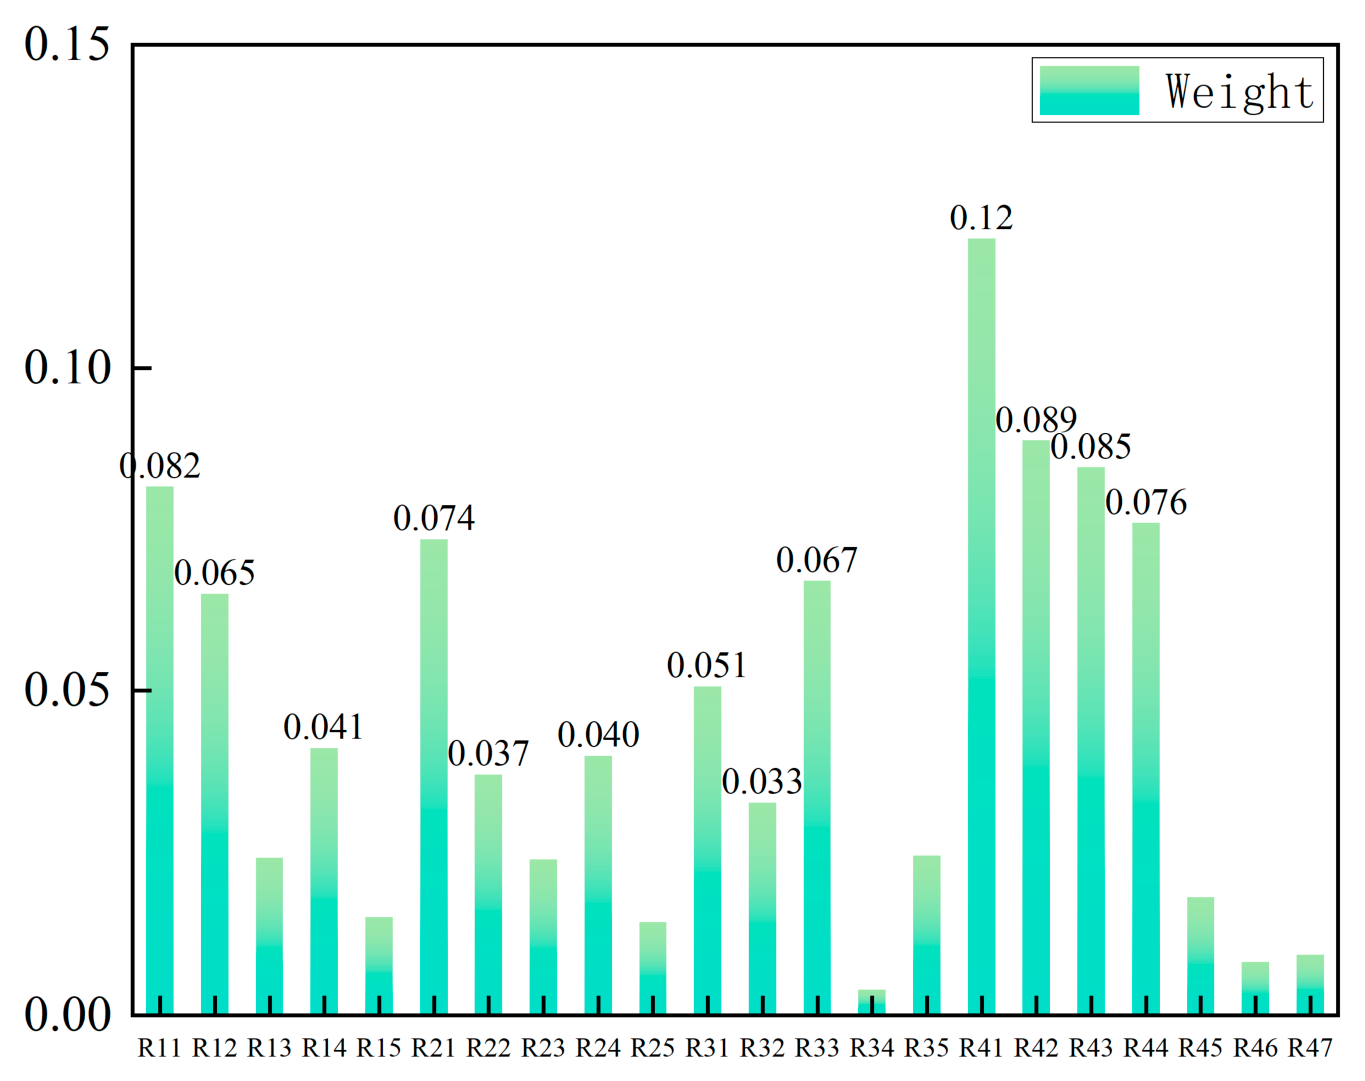
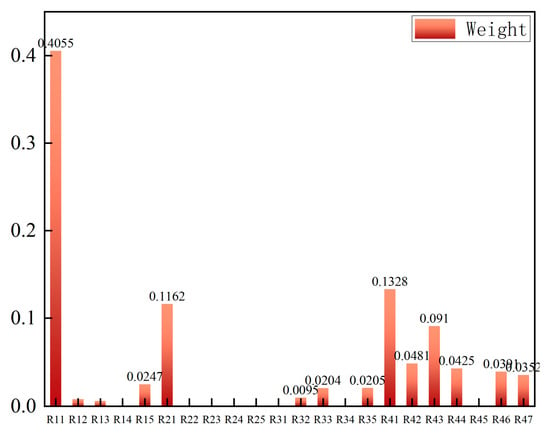
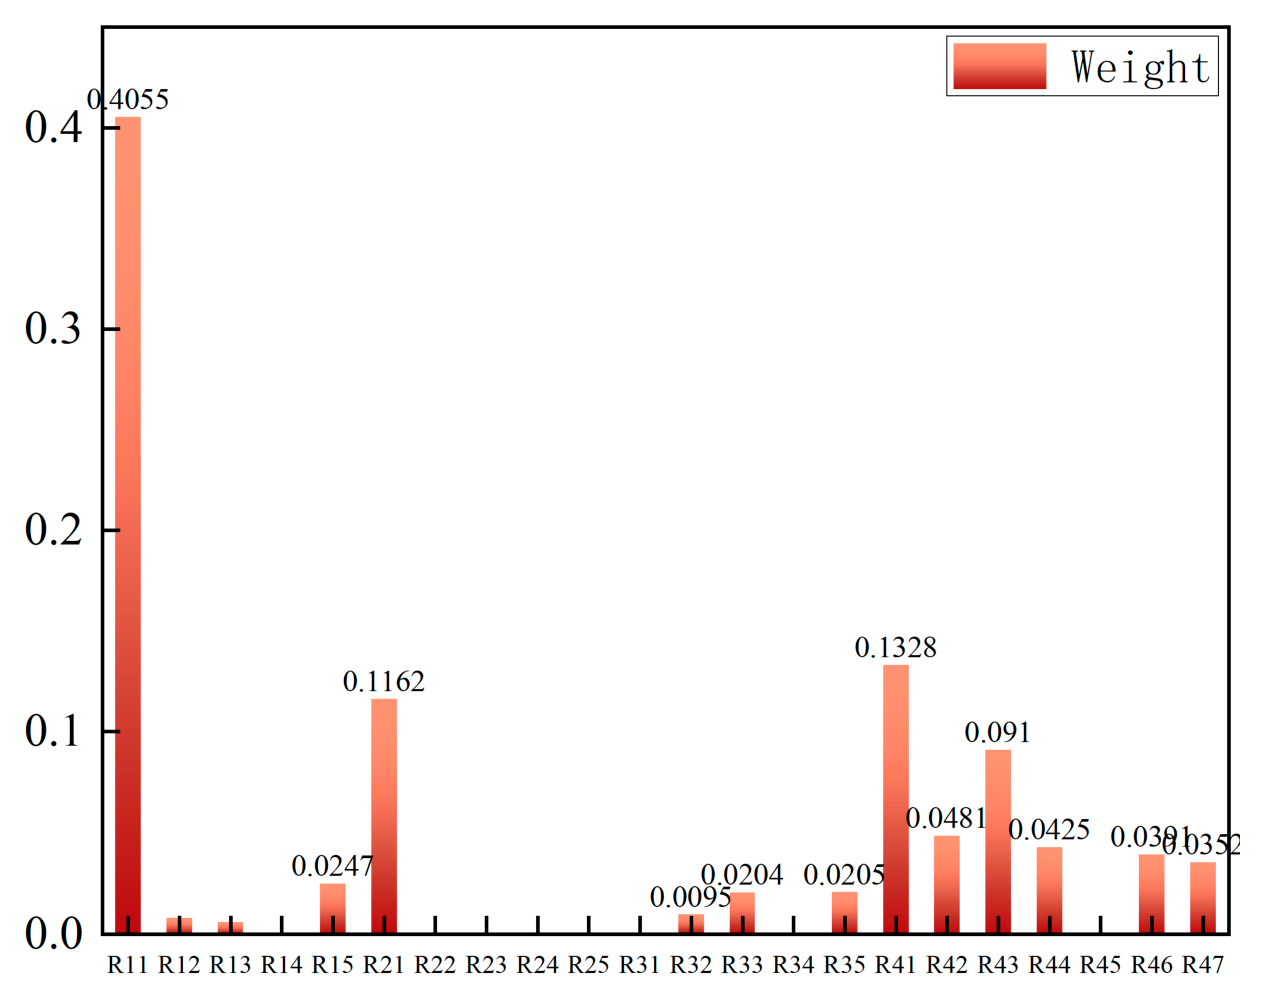
Figure 4 presents the weights of each factor on risk prediction in the baseline model. Under the traditional Naïve Bayes framework, the weight assignment of features relies heavily on prior expert scoring:
Figure 4.
Weights of Causal Factors in Risk Prediction.
- (1)
- Limitations of Feature Extraction: Traditional methods rely on simple keyword matching to construct a binary feature matrix. While intuitive, this approach represents shallow feature extraction and fails to capture the deep semantic relationships and underlying causal logic embedded within accident report texts.
- (2)
- Distortion Issues with Static Weights: As shown in Figure 2, the management dimension was assigned the highest weight by experts. However, in the actual computational process, due to the lack of a data-driven dynamic adjustment mechanism, the model forces the risk assessment of all accident cases to be predominantly attributed to management deficiencies. This analytical pattern overlooks the dominant role that on-site environmental factors or individual unsafe behaviors may play in specific accidents, leading to a significant decrease in the model’s explanatory power when dealing with sudden, environmentally triggered incidents.
- (3)
- Deficiencies in Handling Prediction Uncertainty: Although kernel distributions were employed in the code to model continuous variables, the extreme asymmetry in sample sizes across risk levels results in highly sparse conditional probability distributions within the minority class spaces. This is reflected in the results as the theoretically higher contribution weights for high-risk factors become ineffective in actual predictions due to insufficient data support.
4.1.3. Traditional Method Performance
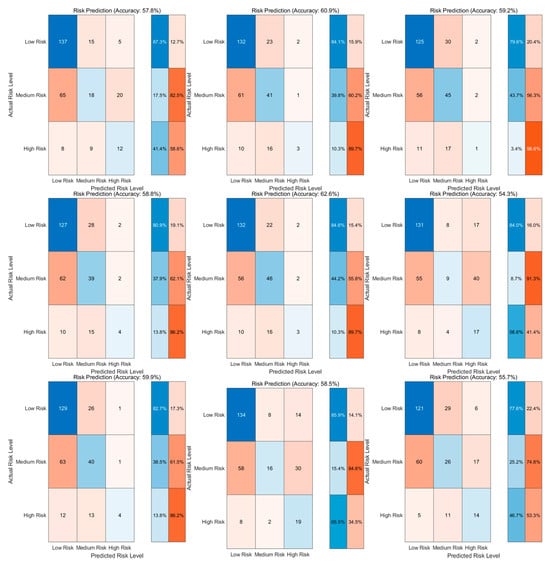
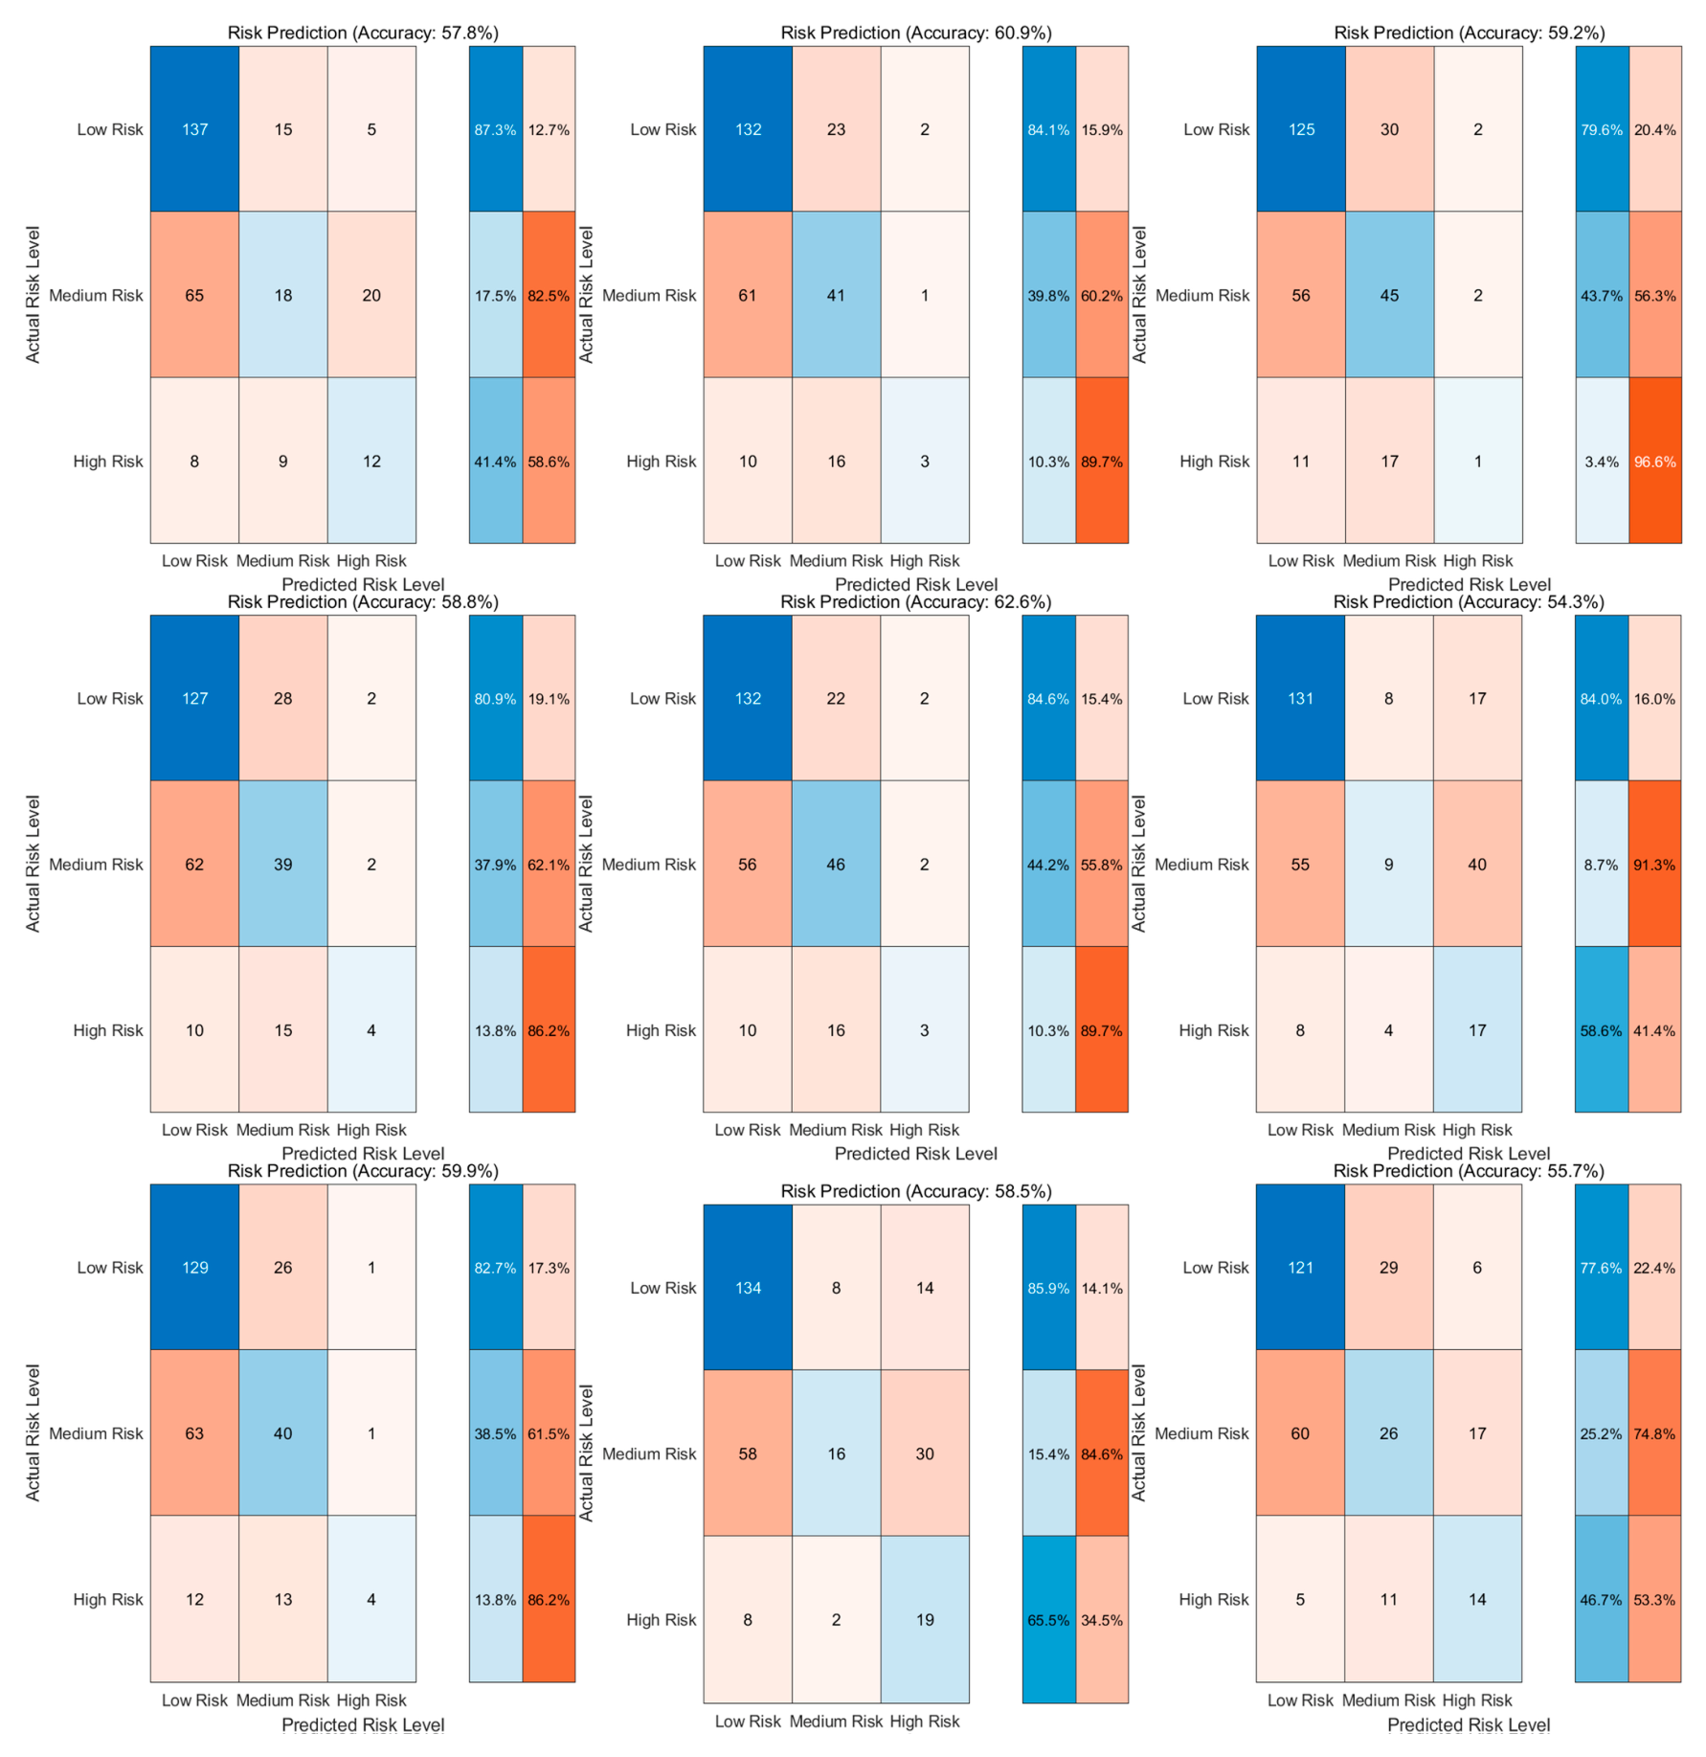
Figure 5 presents the classification confusion matrix of the traditional Naïve Bayes model on the test set. The experimental results indicate that the overall average predictive accuracy of the model is 58.6%. Through an in-depth analysis of the classification details, the following significant deficiencies of the traditional model can be identified:
Figure 5.
Confusion Matrix for Predictions of the Traditional Bayesian Model.
- (1)
- Failure in Identifying High-Risk Samples: As seen in the third row of the confusion matrix, for high-risk accidents, most of the model’s predictions incorrectly point to the “medium-risk” or “low-risk” categories, with its recall rate significantly below average. This occurs because among the original 1446 cases, high-risk samples constitute only 10.3%. The traditional model was “overwhelmed” by the vast number of low-risk data points during training, making it difficult to capture the subtle characteristic signals of major and severe accidents.
- (2)
- Influence of Expert Subjective Bias: The model heavily relies on preset expert weights. While this aligns with general knowledge in construction safety, it overlooks the dynamic fluctuations of causal factors across different provinces and accident types. This “one-size-fits-all” static weighting approach lacks flexibility when processing strongly non-linear accident features, leading to a certain degree of misjudgment.
- (3)
- Indistinct Prediction Boundaries: Due to the lack of deep feature extraction, the traditional model shows poor differentiation between “medium-risk” and “low-risk” samples. As illustrated in the figure, a large number of medium-risk accidents are incorrectly classified as low-risk. In practical engineering early warning, this could result in gaps in safety supervision, potentially leading to hidden safety hazards.
4.2. SAE-AWBN Method
4.2.1. SAE-AWBN Method for Weight Calculation
To verify the superiority of the proposed framework, the same set of accident-related factors as those used in the baseline model is first selected. The model considers four dimensions: personnel, machinery and equipment, management, and environment. A SAE is employed for data augmentation, and mutual information is used to derive the feature weights, as illustrated in Table 7 and Table 8.
Table 7.
Primary Factor Weighting Table (SA).
Table 8.
Secondary Factor Weighting Table (SA).
4.2.2. SAE-AWBN Method Weight Analysis
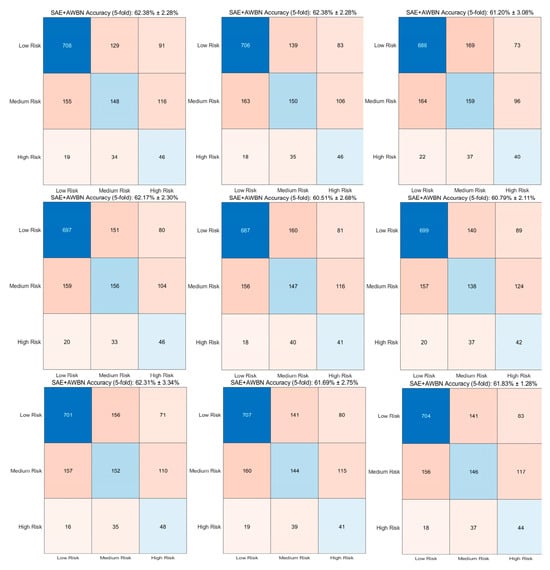
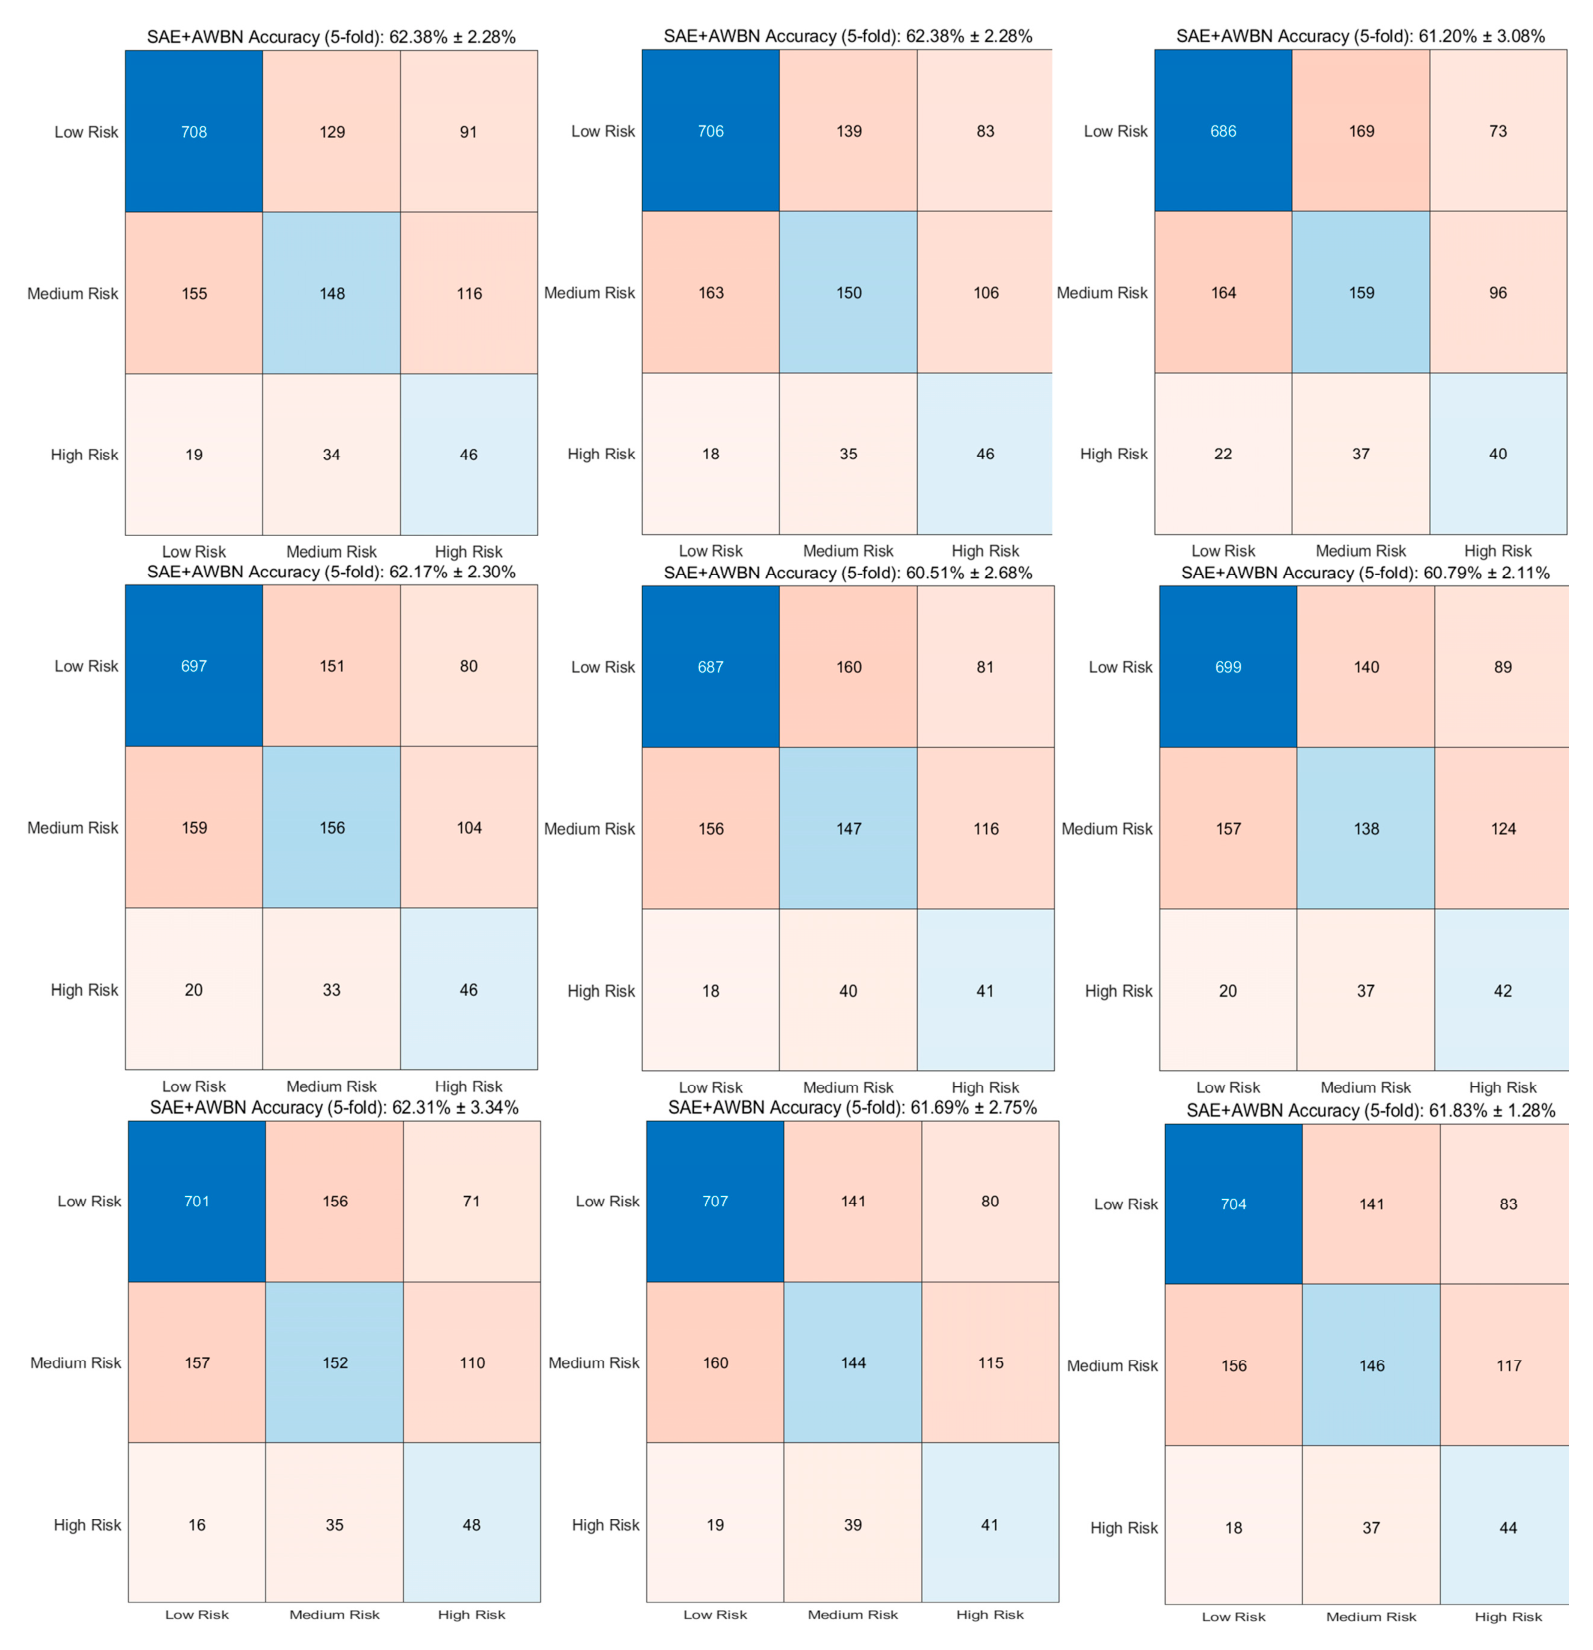
Figure 6 illustrates the confusion matrix following SAE-AWBN processing, 5-fold cross-validation, and performance calibration. Experimental results demonstrate that the model achieves an average accuracy of 61.7% ± 3.4%, representing an improvement of approximately 3.1% compared to the baseline models; however, several issues persist:
Figure 6.
Confusion matrix of the calibrated SAE-AWBN model.
Utilizing SAE encoder layer weights and mutual information theory, the improved model achieves automated weight assignment. As illustrated in Figure 7, operating entirely independent of subjective expert scoring, the top three weights identified through this data-driven approach are:
Figure 7.
Weights of Causal Factors in Risk under the SAE-AWBN.
- (1)
- Safety Awareness
- (2)
- Supervision
- (3)
- Safety Protection
A comparison with the traditional model’s factor rankings in Section 4.1.2 reveals significant discrepancies. In the traditional method, the primary factors were identified as “Supervision” (first), “Subcontracting” (second), and “Hazard Inspection” (third). This divergence indicates that the data augmented by the SAE possesses distinct limitations: the generated dataset is predominantly composed of low-risk accident samples, followed by medium-risk samples, with high-risk accidents being the least represented. Consequently, the model fails to accurately identify the core factors influencing major accidents. Therefore, it is imperative to integrate the SMOTE to achieve a more balanced data distribution.
4.2.3. SAE-AWBN Method Performance
- (1)
- Imbalance in High-Risk Accident Data: Under the extreme condition where high-risk samples constitute only about 10% of the total dataset, the confusion matrix shows no significant improvement in the recall rate for the high-risk category.
- (2)
- Robustness: While the misjudgment rate for low-risk samples has decreased, the reduction in misjudgment rates between medium-risk and high-risk samples remains limited. Nevertheless, compared to the traditional Naïve Bayes method, the model demonstrates a marginal enhancement in robustness.
- (3)
- Reliability Verification: Compared to the traditional baseline models, the data augmentation for medium-risk and high-risk accidents remains relatively weak. Further validation of the generated synthetic data is required.
4.3. SAE-SMOTE-AWBN Method
4.3.1. SAE-SMOTE-AWBN Method for Weight Calculation
In this section, the SMOTE algorithm is introduced to perform a secondary balancing of the SAE-augmented dataset, thereby alleviating the severe class imbalance present in both the original data and the SAE-enhanced data. On this basis, mutual information is employed to recalculate the objective weights of each risk factor, as presented in Table 9 and Table 10.
Table 9.
Primary Factor Weighting Table (SSA).
Table 10.
Secondary Factor Weighting Table (SSA).
4.3.2. SAE-SMOTE-AWBN Method Weight Analysis
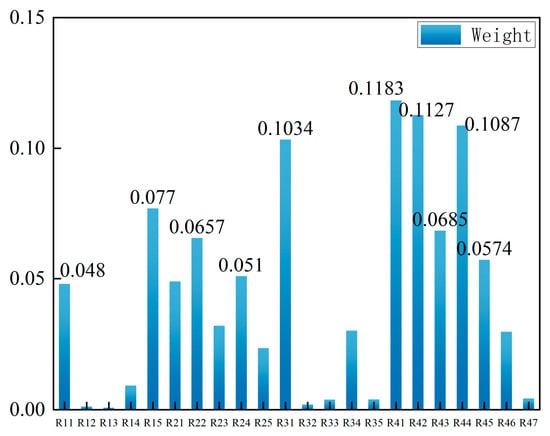
The model integrated with SMOTE for data balancing demonstrates a significant refinement in weight assignment. As illustrated in Figure 8, operating entirely independent of subjective expert scoring, the top three weight factors identified through this data-driven approach are:
Figure 8.
Weights of Causal Factors in Risk under the SAE-SMOTE-AWBN.
- (1)
- Supervision
- (2)
- Subcontracting
- (3)
- Contracting
A comparison with Section 4.1.2 reveals that the improved model identifies “Contracting” as one of the top three core incentives, whereas the traditional method focused on “Hidden Hazard Investigation.” This indicates that, from a data perspective, source management possesses greater discriminative power over the final risk level than process-based hazard investigation. Furthermore, a comparison with Section 4.2.2 highlights the irrationalities in the risk assessment results obtained without SMOTE-based data balancing. The integrated SAE-SMOTE-AWBI mechanism not only enhances predictive accuracy but also, through objective weighting, corrects the over-reliance on “Hidden Hazard Investigation” inherent in expert experience, providing data-driven support for achieving “Source Governance.”
4.3.3. SAE-SMOTE-AWBN Method Performance
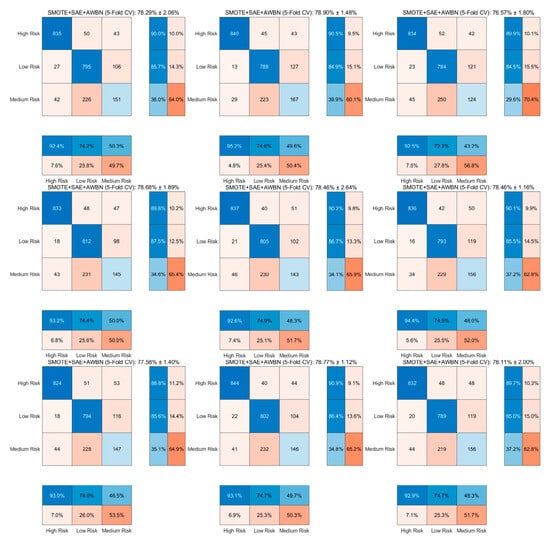
Due to the inherent imbalance in the data samples generated by the SAE, SMOTE is employed to balance the SAE-augmented dataset. Figure 9 presents the confusion matrix obtained after SMOTE processing and 5-fold cross-validation:
Figure 9.
Confusion matrix of the calibrated SAE-SMOTE-AWBN model.
Compared to the SAE-AWBN method in Section 4.2.3, the integration of SMOTE for data balancing demonstrates stronger robustness across various evaluation indicators. The model achieves an average overall accuracy of 78.3% ± 2.4%, representing an improvement of approximately 19.7% over the baseline model and 16.6% over the model utilizing only SAE-based data augmentation. Key improvements include:
- (1)
- Leap in High-Risk Identification Rate: The confusion matrix clearly illustrates a significant increase in the recall rate for the high-risk category. Even under the extreme condition where high-risk samples constitute only about 10% of the total dataset, the model—leveraging the synergy of SAE data augmentation and SMOTE data balancing—is able to accurately capture the triggering signals of high-risk accidents.
- (2)
- Enhanced Predictive Robustness: The misjudgment rate between medium-risk and low-risk samples has decreased substantially, with row-normalized and column-normalized accuracy rates becoming more balanced. This indicates that following the introduction of the SMOTE balancing and calibration mechanism, the model no longer blindly favors categories with larger sample sizes, but instead achieves balanced identification across all risk-level dimensions.
- (3)
- Reliability Verification: The accuracy rate of approximately 78% demonstrates that the model can effectively extract key features from complex construction accident texts through a purely data-driven approach, without the need for prior expert intervention.
4.4. Summary
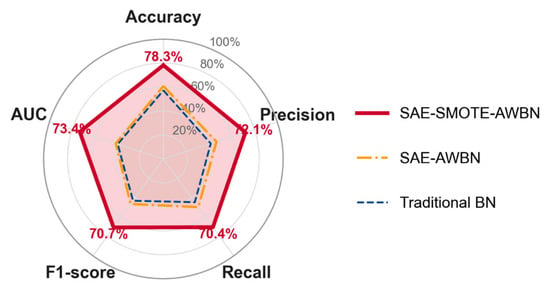
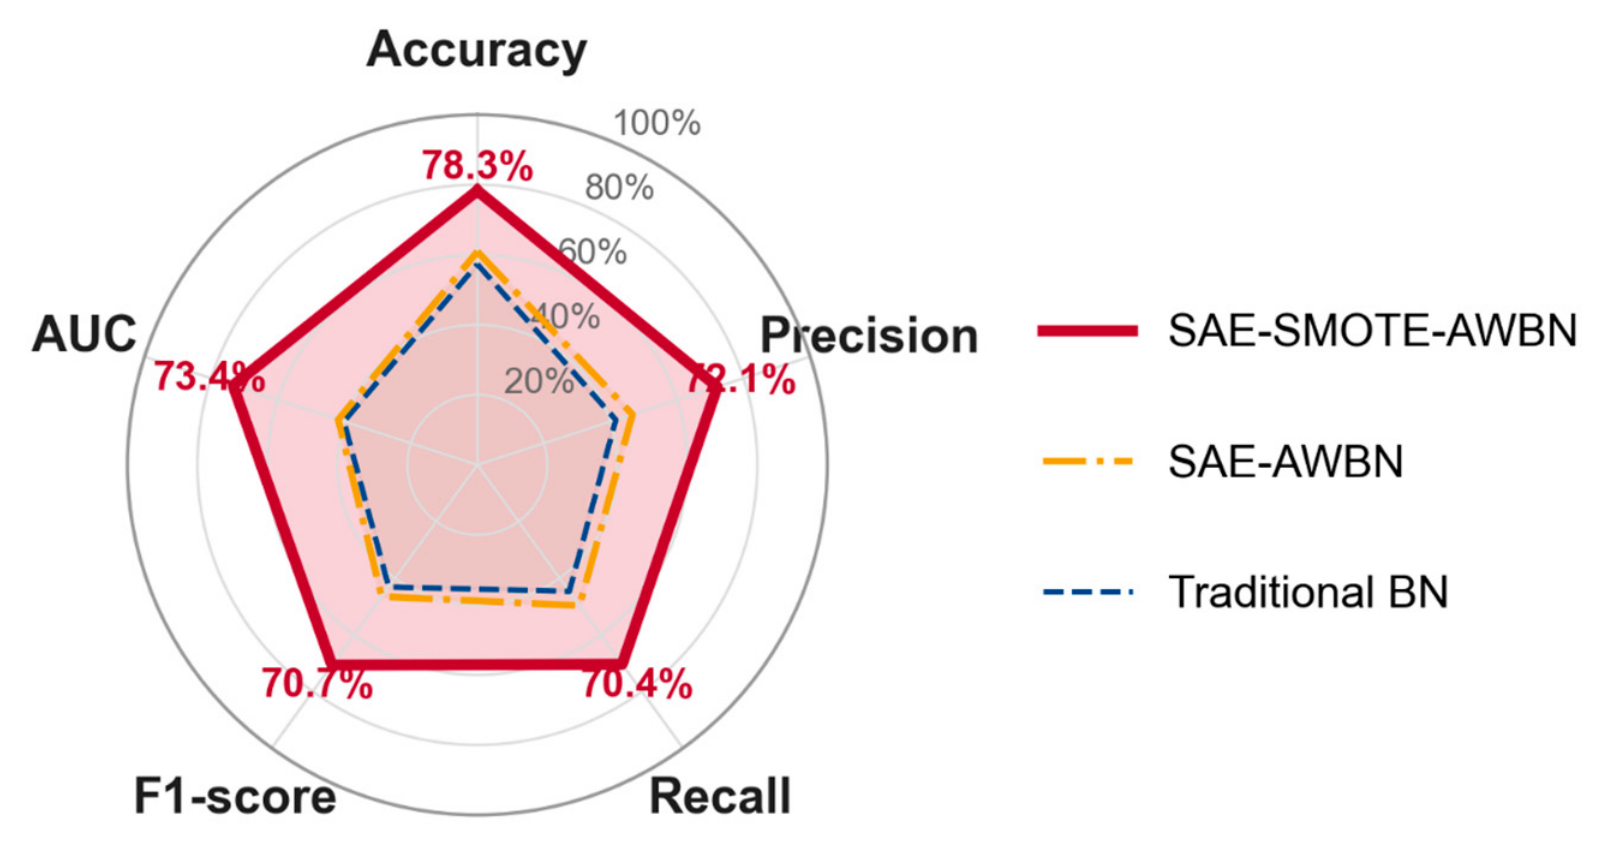
The SAE-SMOTE-AWBN framework proposed in this study demonstrates significant performance advantages. As indicated by the results in Table 11 and Figure 10, the predictive accuracy of the improved model increased substantially from 58.6% for the traditional Naïve Bayes model to 78.3%. The standard Naïve Bayes model achieves an accuracy of 58.1%, with an AUC of 0.546, establishing the data-driven probabilistic baseline. The introduction of AHP-based expert weighting yields a marginal accuracy gain to 58.6%, yet results in a notable decline in AUC from 0.546 to 0.401, suggesting that subjective weight assignment amplifies prediction bias toward the majority class under severely imbalanced data conditions, thereby degrading the model’s overall discriminative capability.
Table 11.
Performance Comparison of the Four Methods.
Figure 10.
Comparative performance of the Traditional Bayesian Model, SAE-AWBN model and SAE-SMOTE-AWBN model.
This improvement is primarily attributed to the deep excavation of manifold features from scarce high-risk samples by the SAE, coupled with the precise calibration of data balance provided by SMOTE, which effectively overcomes the prediction bias caused by the severe imbalance in the original accident data. At the level of causal factor identification, the model achieves a logical transition from “subjective experience” to “objective data-driven” analysis. Compared to the top three weights identified by traditional methods: Supervision, Subcontracting, and Hidden Hazard Investigation. The improved model maintains the core importance of supervision and subcontracting while identifying “Contract Awarding” as the third most significant core cause through data correlation analysis, replacing the traditional “Hidden Hazard Investigation.” This shift highlights the critical influence of source management in the evolution of safety risks, demonstrating that the framework not only enhances risk assessment accuracy but also, through objective correction, guides the focus of safety management from “mid-process/end-of-pipe investigation” toward “Source Governance.”
To further validate the superiority of the proposed SAE-SMOTE-AWBN framework over mainstream ensemble and kernel-based classification methods, three additional strong baseline models were constructed under identical 5-fold stratified cross-validation settings: SMOTE + Random Forest, SMOTE + XGBoost, and SMOTE + Support Vector Machine. As presented in Table 12, SMOTE + RF achieves an accuracy of 67.8% with an F1-score of 0.403 and AUC of 0.483, while SMOTE + XGBoost attains an accuracy of 66.4%, an F1-score of 0.516, and an AUC of 0.587. SMOTE+SVM yields the lowest accuracy among the three at 59.8%, with an F1-score of 0.529 and an AUC of 0.554.
Table 12.
Performance Comparison of the Three Methods.
Although SMOTE + XGBoost achieves a relatively competitive AUC of 0.587, all three baseline methods fall substantially short of the SAE-SMOTE-AWBN framework across the primary evaluation metrics. Specifically, the proposed framework surpasses SMOTE+RF by 10.5 percentage points in accuracy, SMOTE + XGBoost by 11.9 percentage points, and SMOTE+SVM by 18.5 percentage points, while simultaneously achieving superior F1-score and AUC.
This performance gap can be attributed to two key structural advantages of the SAE-SMOTE-AWBN framework. First, whereas ensemble and kernel methods operate directly on the original binary feature space, the SAE component performs nonlinear manifold learning to extract latent representations that better characterize the underlying risk patterns in accident reports. Second, the adaptive mutual information weighting mechanism within AWBN provides principled, data-driven calibration of feature contributions, which black-box ensemble methods such as Random Forest and Gradient Boosting cannot offer in an interpretable form. Consequently, the SSA framework not only achieves higher predictive accuracy but also preserves the causal interpretability essential for practical construction safety management.
5. Discussion
The SSA method achieves a prediction accuracy of 78.3% ± 2.4% under imbalanced data conditions, which are common in construction safety datasets. By integrating SMOTE with SAE-based feature learning, the model enhances the representation of minority-class samples and improves overall classification robustness.
Similar challenges have also been reported in other construction-related domains, such as Automated Fault Detection and Diagnosis (AFDD) systems. In these systems, data imbalance and limited labeled samples likewise affect model performance. Wang. S [60] proposed a joint training strategy aligned with fault class coverage and demonstrated that model performance largely depends on the degree of alignment between the fault class distributions of the training and target datasets. In that study, under strong coverage alignment, an optimized TabNet model achieved F1 scores of 97.43%, 92.01%, and 92.25% on datasets from an auditorium, a hospital, and an office building, respectively. However, when coverage alignment was weak, performance gains declined significantly—for example, the macro-F1 score for the hospital dataset decreased from 95.40% (single-building training) to 92.01% (unified training), due to incomplete fault coverage.
In another study, a category-aware temporal and contextual contrastive framework (CA-TCC) was developed for semi-supervised AFDD tasks [61]. Using only 5% labeled data, CA-TCC achieved macro-F1 scores of 76.45%, 74.18%, and 79.84% on the same three building datasets, with a performance gap of only approximately 1–1.5 percentage points compared to fully supervised models. By contrast, the SSA model in this study attains a macro-F1 score of 70.7% and an AUC of 0.734 under conditions of extreme imbalance (with the high-risk class accounting for 10.3%), without requiring temporal sequence modeling. These results suggest that SAE-based latent space augmentation combined with SMOTE-based balancing can serve as a viable alternative to contrastive or coverage-aware strategies, particularly in tabular data settings where class distributions differ significantly across risk levels.
These comparisons indicate methodological parallels between the SSA framework and AFDD research, particularly in addressing data scarcity and imbalance through data augmentation and representation learning. Although direct numerical comparisons are difficult due to differences in domains and evaluation metrics, the consistent performance improvements observed suggest that SAE-SMOTE-based enhancement strategies may provide a generally applicable solution for small-scale and imbalanced classification tasks beyond the construction safety domain.
6. Conclusions
This study investigates the challenges of small sample size, class imbalance, and subjective weight assignment in construction safety risk prediction through a progressive modeling framework, including the traditional AHP model, the data-driven SA model, and the proposed SSA model. The comparative results indicate that different modeling approaches lead to substantially different prediction outcomes. The key findings are summarized as follows:
- (1)
- The traditional method demonstrates advantages in constructing a structured indicator system; however, it suffers from strong subjectivity and limited utilization of available accident data. The prediction accuracy is 58.6%. While this confirms the effectiveness of expert knowledge in indicator design, it also highlights the limitations associated with subjective weight assignment.
- (2)
- The SA model improves objectivity by incorporating data-driven feature extraction and weighting mechanisms. Combined with adaptive weighted Bayesian inference, the model achieves a prediction accuracy of 61.7% ± 3.4%. However, due to persistent class imbalance after data augmentation, the model exhibits biased predictions, with a low recall rate of only 49.7%. This indicates a tendency to underestimate critical risks.
- (3)
- The SSA model mitigates the class imbalance issue by introducing a latent-space SMOTE mechanism. By implementing a k-nearest neighbor parameter and a dynamic balancing strategy, the model achieves significant performance improvements, with a prediction accuracy of 78.3% ± 2.4% and an AUC value of 0.732. The relatively balanced distribution of risk levels after data augmentation further confirms that the integration of SAE-based latent feature learning and SMOTE-based resampling is effective for handling small and imbalanced datasets.
Although this study achieves certain progress in construction safety risk prediction by introducing data augmentation techniques and an adaptive weighted Bayesian model, several limitations remain and warrant further investigation:
- (1)
- Data-related limitations: This study is primarily based on 1446 construction safety accident investigation reports disclosed by governmental entities at various levels in 2023. The sample scope is relatively limited, and variations in the level of detail and textual descriptions across accident reports may, to some extent, affect the generalizability of the findings.
- (2)
- Methodological limitations: The study mainly adopts the SSA model. Although this model mitigates the imbalance of static samples through data augmentation and achieves objective weighting, it essentially remains a static correlation analysis at discrete time points. The study does not incorporate additional methods to perform multidimensional validation of deeper causal chains among contributing factors, which constrains the interpretability and explanatory depth of the model to some extent.
Author Contributions
Conceptualization, Q.W. and J.L.; methodology, J.L.; software, J.L.; validation, J.L., S.L. and J.Y.; formal analysis, J.L.; investigation, Q.W.; resources, Q.W.; data curation, J.L.; writing—original draft preparation, J.L.; writing—review and editing, S.L. and J.Y.; visualization, J.L.; supervision, Q.W.; project administration, Q.W.; funding acquisition, Q.W. All authors have read and agreed to the published version of the manuscript.
Funding
This research was funded by [the R&D Program of Beijing Municipal Education Commission] grant number [KM202410016004] And The APC was funded by [Jian Li].
Data Availability Statement
The data used in this study are derived from the 2023 Annual Report on Construction Safety Accidents published by governmental authorities at various levels in the People’s Republic of China. The original reports were publicly accessible online during the data collection period (2023), but have since been removed from the official websites by the publishers. The processed dataset constructed based on these reports is available from the corresponding authors upon reasonable request.
Conflicts of Interest
The authors declare no conflict of interest.
References
- Wang, J.; Liu, Y.; Feng, J. Integrating Bayesian networks and ontology to improve safety knowledge management in construction behavior: A conceptual framework. Ain Shams Eng. J. 2024, 15, 102906. [Google Scholar] [CrossRef] [Scilit]
- Xiao, L.; Tang, L.; Wen, Y. An Innovative Construction Site Safety Assessment Solution Based on the Integration of Bayesian Network and Analytic Hierarchy Process. Buildings 2023, 13, 2918. [Google Scholar] [CrossRef] [Scilit]
- Lung, L.-W.; Wang, Y.R.; Chen, Y. Leveraging Deep Learning and Internet of Things for Dynamic Construction Site Risk Management. Buildings 2025, 15, 1325. [Google Scholar] [CrossRef] [Scilit]
- Pandithawatta, S.; Ahn, S.; Rameezdeen, R.; Chow, C.W.; Gorjian, N. Systematic literature review on knowledge-driven approaches for construction safety analysis and accident prevention. Buildings 2024, 14, 3403. [Google Scholar] [CrossRef] [Scilit]
- Junjia, Y.; Alias, A.H.; Haron, N.A.; Bakar, N.A. Machine learning algorithms for safer construction sites: Critical review. Build. Eng. 2024, 2, 544. [Google Scholar] [CrossRef] [Scilit]
- Argiolas, C.; Carbonari, A.; Melis, F.; Quaquero, E. A Bayesian model for real-time safety management in construction sites. Gerontechnology 2012, 11, 149. [Google Scholar]
- Hou, L.; Chen, H.; Zhang, G.; Wang, X. Deep Learning-Based Applications for Safety Management in the AEC Industry: A Review. Appl. Sci. 2021, 11, 821. [Google Scholar] [CrossRef] [Scilit]
- Khan, N.; Zaidi, S.F.A.; Yang, J.; Park, C.; Lee, D. Construction Work-Stage-Based Rule Compliance Monitoring Framework Using Computer Vision (CV) Technology. Buildings 2023, 13, 2093. [Google Scholar] [CrossRef] [Scilit]
- Li, J.; Wang, T. Data-driven Bayesian networks for risk scenario mapping of Falls from height accidents. PLoS ONE 2025, 20, e0334611. [Google Scholar] [CrossRef] [Scilit] [PubMed]
- Zhou, J.Q.; Liu, Q.M.; Ma, C.X.; Li, D. Cost Prediction of Tunnel Construction Based on Interpretative Structural Model and Stacked Sparse Autoencoder. Eng. Lett. 2024, 32, 1966–1980. [Google Scholar]
- Park, J.; Seong, S.; Park, S.; Kim, M.; Kim, H.Y. Multi-label material and human risk factors recognition model for construction site safety management. J. Saf. Res. 2024, 91, 354–365. [Google Scholar] [CrossRef] [Scilit] [PubMed]
- Sun, K.; Lan, T.; Goh, Y.M.; Huang, Y.-H. Overcoming Imbalanced Safety Data Using Extended Accident Triangle. Knowl.-Based Syst. 2025, 327, 114120. [Google Scholar] [CrossRef] [Scilit]
- Leu, S.S.; Chang, C.M. Bayesian-network-based safety risk assessment for steel construction projects. Accid. Anal. Prev. 2013, 54, 122–133. [Google Scholar] [CrossRef] [Scilit] [PubMed]
- Zhang, L.; Wu, X.; Skibniewski, M.J.; Zhong, J.; Lu, Y. Bayesian-network-based safety risk analysis in construction projects. Reliab. Eng. Syst. Saf. 2014, 131, 29–39. [Google Scholar] [CrossRef] [Scilit]
- Wang, J.; Chen, Z.; Song, Y.; Liu, Y.; He, J.; Ma, S. Data-driven dynamic bayesian network model for safety resilience evaluation of prefabricated building construction. Buildings 2024, 14, 570. [Google Scholar] [CrossRef] [Scilit]
- Wu, X.; Liu, H.; Zhang, L.; Skibniewski, M.J.; Deng, Q.; Teng, J. A dynamic Bayesian network based approach to safety decision support in tunnel construction. Reliab. Eng. Syst. Saf. 2015, 134, 157–168. [Google Scholar] [CrossRef] [Scilit]
- Piao, Y.; Xu, W.; Wang, T.K.; Chen, J.H. Dynamic fall risk assessment framework for construction workers based on dynamic Bayesian network and computer vision. J. Constr. Eng. Manag. 2021, 147, 04021171. [Google Scholar] [CrossRef] [Scilit]
- Yang, W.A.; Li, J.X. Safety risk analysis of prefabricated building hoisting construction based on dynamic Bayesian network. J. Saf. Environ. 2024, 24, 1328–1336. [Google Scholar]
- Al-Kasasbeh, M.; Mujalli, R.O.; Abudayyeh, O.; Liu, H.; Altalhoni, A. Bayesian network models for evaluating the impact of safety measures compliance on reducing accidents in the construction industry. Buildings 2022, 12, 1980. [Google Scholar] [CrossRef] [Scilit]
- Xu, S.; Sun, M.; Fang, W.; Chen, K.; Luo, H.; Zou, P.X. A Bayesian-based knowledge tracing model for improving safety training outcomes in construction: An adaptive learning framework. Dev. Built Environ. 2023, 13, 100111. [Google Scholar] [CrossRef] [Scilit]
- Tao, Y.; Hu, H.; Xu, F.; Zhang, Z. Ergonomic risk assessment of construction workers and projects based on fuzzy Bayesian network and DS evidence theory. J. Constr. Eng. Manag. 2023, 149, 04023034. [Google Scholar] [CrossRef] [Scilit]
- Nguyen, L.D.; Tran, D.Q.; Chandrawinata, M.P. Predicting safety risk of working at heights using Bayesian networks. J. Constr. Eng. Manag. 2016, 142, 04016041. [Google Scholar] [CrossRef] [Scilit]
- Sun, C.; Hon, C.K.; Way, K.A.; Jimmieson, N.L.; Xia, B.; Wu, P.P.Y. A Bayesian network model for the impacts of psychosocial hazards on the mental health of site-based construction practitioners. J. Constr. Eng. Manag. 2023, 149, 04022184. [Google Scholar] [CrossRef] [Scilit]
- Xia, N.; Zou, P.X.; Liu, X.; Wang, X.; Zhu, R. A hybrid BN-HFACS model for predicting safety performance in construction projects. Saf. Sci. 2018, 101, 332–343. [Google Scholar] [CrossRef] [Scilit]
- Wang, Z.Z.; Chen, C. Fuzzy comprehensive Bayesian network-based safety risk assessment for metro construction projects. Tunn. Undergr. Space Technol. 2017, 70, 330–342. [Google Scholar] [CrossRef] [Scilit]
- Shen, J.; Liu, S.; Zhang, J. Using text mining and bayesian network to identify key risk factors for safety accidents in metro construction. J. Constr. Eng. Manag. 2024, 150, 04024052. [Google Scholar] [CrossRef] [Scilit]
- Yao, H.; She, J.; Zhou, Y. Risk assessment of construction safety accidents based on association rule mining and Bayesian network. J. Intell. Constr. 2024, 2, 9180015. [Google Scholar] [CrossRef] [Scilit]
- Zhang, Y.; Xing, X.; Antwi-Afari, M.F. A hybrid approach for optimizing deep excavation safety measures based on Bayesian network and design structure matrix. Adv. Eng. Inform. 2023, 58, 102223. [Google Scholar] [CrossRef] [Scilit]
- Wang, J.W.; Pan, Z.Y.; Wang, J.; Tian, M.Y.; Liu, S. Safety risk analysis of prefabricated building hoisting construction based on STPA and fuzzy BN. J. Saf. Sci. Technol. 2022, 18, 12–19. [Google Scholar]
- Wang, X.A.; Bai, Y.P.; Wu, J.S. Research on risk management and control of university building construction based on the improved accident-causing “egg” model. J. Saf. Sci. Technol. 2025, 21, 12–20. [Google Scholar]
- Wang, R.; Zhao, J.H.; Huang, W.; Liu, X.Z. Quantification and analysis of construction safety risks based on knowledge graph. J. Saf. Environ. 2024, 24, 2138–2147. [Google Scholar]
- Ayhan, B.U.; Tokdemir, O.B. Predicting the outcome of construction incidents. Saf. Sci. 2019, 113, 91–104. [Google Scholar] [CrossRef] [Scilit]
- Choi, J.; Gu, B.; Chin, S.; Lee, J.S. Machine learning predictive model based on national data for fatal accidents of construction workers. Autom. Constr. 2020, 110, 102974. [Google Scholar] [CrossRef] [Scilit]
- Kang, K.; Ryu, H. Predicting types of occupational accidents at construction sites in Korea using random forest model. Saf. Sci. 2019, 120, 226–236. [Google Scholar] [CrossRef] [Scilit]
- Zhu, R.; Hu, X.; Hou, J.; Li, X. Application of machine learning techniques for predicting the consequences of construction accidents in China. Process Saf. Environ. Prot. 2021, 145, 293–302. [Google Scholar] [CrossRef] [Scilit]
- Zhu, J.; Shi, Q.; Li, Q.; Shou, W.; Li, H.; Wu, P. Developing predictive models of construction fatality characteristics using machine learning. Saf. Sci. 2023, 164, 106149. [Google Scholar] [CrossRef] [Scilit]
- Salarian, A.A.; Etemadfard, H.; Rahimzadegan, A.; Ghalehnovi, M. Investigating the role of clustering in construction-accident severity prediction using a heterogeneous and imbalanced data set. J. Constr. Eng. Manag. 2023, 149, 04022161. [Google Scholar] [CrossRef] [Scilit]
- Koc, K.; Gurgun, A.P. Scenario-based automated data preprocessing to predict severity of construction accidents. Autom. Constr. 2022, 140, 104351. [Google Scholar] [CrossRef] [Scilit]
- Zermane, A.; Tohir, M.Z.M.; Zermane, H.; Baharudin, M.R.; Yusoff, H.M. Predicting fatal fall from heights accidents using random forest classification machine learning model. Saf. Sci. 2023, 159, 106023. [Google Scholar] [CrossRef] [Scilit]
- Poh, C.Q.; Ubeynarayana, C.U.; Goh, Y.M. Safety leading indicators for construction sites: A machine learning approach. Autom. Constr. 2018, 93, 375–386. [Google Scholar] [CrossRef] [Scilit]
- Gondia, A.; Moussa, A.; Ezzeldin, M.; El-Dakhakhni, W. Machine learning-based construction site dynamic risk models. Technol. Forecast. Soc. Change 2023, 189, 122347. [Google Scholar] [CrossRef] [Scilit]
- Baker, H.; Hallowell, M.R.; Tixier, A.J.P. AI-based prediction of independent construction safety outcomes from universal attributes. Autom. Constr. 2020, 118, 103146. [Google Scholar] [CrossRef] [Scilit]
- Koc, K.; Ekmekcioğlu, Ö.; Gurgun, A.P. Accident prediction in construction using hybrid wavelet-machine learning. Autom. Constr. 2022, 133, 103987. [Google Scholar] [CrossRef] [Scilit]
- Toğan, V.; Mostofi, F.; Ayözen, Y.E.; Behzat Tokdemir, O. Customized AutoML: An automated machine learning system for predicting severity of construction accidents. Buildings 2022, 12, 1933. [Google Scholar] [CrossRef] [Scilit]
- Mostofi, F.; Toğan, V. Construction safety predictions with multi-head attention graph and sparse accident networks. Autom. Constr. 2023, 156, 105102. [Google Scholar] [CrossRef] [Scilit]
- Mostofi, F.; Toğan, V. A data-driven recommendation system for construction safety risk assessment. J. Constr. Eng. Manag. 2023, 149, 04023139. [Google Scholar] [CrossRef] [Scilit]
- Mostofi, F.; Toğan, V.; Ayözen, Y.E.; Tokdemir, O.B. Construction safety risk model with construction accident network: A graph convolutional network approach. Sustainability 2022, 14, 15906. [Google Scholar] [CrossRef] [Scilit]
- Yuan, X.; Qi, S.; Wang, Y. Stacked enhanced auto-encoder for data-driven soft sensing of quality variable. IEEE Trans. Instrum. Meas. 2020, 69, 7953–7961. [Google Scholar] [CrossRef] [Scilit]
- Han, B.; Wang, X.; Ji, S.; Zhang, G.; Jia, S.; He, J. Data-enhanced stacked autoencoders for insufficient fault classification of machinery and its understanding via visualization. IEEE Access 2020, 8, 67790–67798. [Google Scholar] [CrossRef] [Scilit]
- Yu, J.; Yan, X. A new deep model based on the stacked autoencoder with intensified iterative learning style for industrial fault detection. Process Saf. Environ. Prot. 2021, 153, 47–59. [Google Scholar] [CrossRef] [Scilit]
- Xu, W.; He, J.; Li, W.; He, Y.; Wan, H.; Qin, W.; Chen, Z. Long-short-term-memory-based deep stacked sequence-to-sequence autoencoder for health prediction of industrial workers in closed environments based on wearable devices. Sensors 2023, 23, 7874. [Google Scholar] [CrossRef] [Scilit] [PubMed]
- Zhou, S.; Xu, M.; Huang, Z.; Lin, J. Risk assessment in power markets using feature distance stacked autoencoder with linear regression. In 2025 2nd International Conference on Software, Systems and Information Technology; IEEE: Piscataway, NJ, USA, 2025; pp. 1–5. [Google Scholar]
- Feng, Y.; Yang, W.; Wan, J.; Li, H. Granular risk assessment of earthquake induced landslide via latent representations of stacked autoencoder. Front. Environ. Sci. 2023, 11, 1308808. [Google Scholar] [CrossRef] [Scilit]
- Leach, S.; Xue, Y.; Sridhar, R.; Paal, S.; Wang, Z.; Murphy, R. Data augmentation for improving deep learning models in building inspections or postdisaster evaluation. J. Perform. Constr. Facil. 2021, 35, 04021029. [Google Scholar] [CrossRef] [Scilit]
- Kim, J.; Wang, I.; Yu, J.; Lee, S. A practical image augmentation method for construction safety using object range expansion synthesis. Buildings 2025, 15, 1447. [Google Scholar] [CrossRef] [Scilit]
- Lee, Y.J.; Kang, G.N.; Kim, J.; Yoon, S.; Jeon, J. Generative AI-driven data augmentation for enhanced construction hazard detection. Autom. Constr. 2025, 177, 106317. [Google Scholar]
- Lee, J.; Ahn, S.; Kim, D.; Kim, D. Performance comparison of retrieval-augmented generation and fine-tuned large language models for construction safety management knowledge retrieval. Autom. Constr. 2024, 168, 105846. [Google Scholar] [CrossRef] [Scilit]
- Li, L.; Betti, R. A machine learning-based data augmentation strategy for structural damage classification in civil infrastructure system. J. Civ. Struct. Health Monit. 2023, 13, 1265–1285. [Google Scholar] [CrossRef] [Scilit]
- Li, Y.; Ding, S.; Wang, S.; Sun, Y.; Ge, D. Safety assessment method of high-speed rail interval structure based on weighted Bayesian network. KSCE J. Civ. Eng. 2024, 28, 3286–3300. [Google Scholar] [CrossRef] [Scilit]
- Wang, S. Fault-class coverage–aligned combined training for AFDD of AHUs across multiple buildings. Sci. Rep. 2025, 15, 41192. [Google Scholar] [CrossRef] [Scilit]
- Wang, S. Class-aware temporal and contextual contrastive framework for semi-supervised automated fault detection and diagnosis in air handling units. Energy Build. 2026, 358, 117233. [Google Scholar] [CrossRef] [Scilit]



Disclaimer/Publisher’s Note: The statements, opinions and data contained in all publications are solely those of the individual author(s) and contributor(s) and not of MDPI and/or the editor(s). MDPI and/or the editor(s) disclaim responsibility for any injury to people or property resulting from any ideas, methods, instructions or products referred to in the content. |
© 2026 by the authors. Licensee MDPI, Basel, Switzerland. This article is an open access article distributed under the terms and conditions of the Creative Commons Attribution (CC BY) license.