


Abstract
The reduction in energy demand in buildings through the adaptation of energy-efficient strategies is attracting significant attention from the research community. In this context green building concepts can contribute towards achieving national sustainable development goals (SDGs) and NetZero targets. Given the substantial energy demand associated with heating and cooling in commercial and residential buildings, enhancing energy efficiency has become essential for achieving sustainable development, particularly amid ongoing global energy challenges. The Envelope Thermal Transfer Value (ETTV) model has been established as a simplified method of calculating building loads; however, its integration with green building elements remains limited, particularly in subtropical climates. Furthermore, the combined effects of living walls, green façades, and green roofs on building energy performance have not been comprehensively investigated. In this study, an extensive experimental investigation was conducted using prototype buildings under controlled conditions to evaluate the thermal performance of green elements. Modified ETTV formulations incorporating green envelope systems have been developed, and the thermodynamic effects of these green elements on the building energy performance have been analysed. The results demonstrate that integrating green elements significantly reduces thermal heat gain and cooling energy demand. Specifically, a combination of a living wall on a west facing wall and a green roof could reduce the thermal heat gain by up to 30%.
1. Introduction
Energy production and consumption have significant influence on global warming due to the emission of CO2. The Rio Conference (1992) and the Kyoto Protocol (1997) on climate change and its consequences on the earth have drawn worldwide attention, and climate mitigation has remained a global priority for governments to date. The Paris agreement at COP 21 in December 2015 marked a major milestone in global climate change negotiation [1,2]. Energy efficiency and energy demand reduction have been highlighted as the key mitigation steps by intergovernmental Panel on Climate Change (IPCC) assessment reports and United Nations Framework Convention on Climate Change (UNFCCC) documents, protocols and international agreements [3].
In September 2015, a political agreement on future global sustainability was signed at the United Nations (UN) Sustainable Development Summit at the UN Headquarters in New York. The 2030 Agenda sets a framework that has been recognised and adopted by many countries worldwide. In accordance with the 2030 Agenda, many countries have developed responsive sustainable development strategies based on their specific requirements [4]. This framework includes 17 sustainable development goals (SDGs) of which SDG 11 emphasises sustainable cities, building and infrastructure.
Buildings worldwide account for a surprisingly high (40%) proportion of global energy consumption, which is responsible for over a third of the total greenhouse gas emissions [5]. When the embodied energy associated with construction materials such as steel, cement, aluminium and glass is considered, it can account for more than 50% of the total life-cycle energy/carbon of buildings, particularly in modern energy-efficient buildings [6]. Since a building uses energy throughout its life, the demand for energy in buildings in their lifecycle is both direct and indirect. Due to this problem, energy efficiency and comfort conditions in commercial buildings have become one of crucial concerns in the design decision-making phase for sustainable green buildings. According to Mumovic and Santamouris [7], because buildings play crucial roles in energy and environmental issues, applying energy-efficient and sustainable building strategies has received serious attention worldwide. Alrashed et al. [8] indicated that many forms of sustainable residential buildings (e.g., low-energy homes, zero-energy homes, passive houses, etc.) have been developed across the world to address some of these concerns. In Australia, the energy used by buildings accounts for approximately 20% of Australia’s greenhouse gas emissions; this split is fairly even between homes and commercial buildings [9].
To reduce thermal radiation, shading is one of the options of passive cooling techniques, which can be achieved in many ways. Buildings can be orientated to take advantage of winter sun, i.e., longer in the east or west dimension, while shading walls and windows from direct hot summer sun. Green buildings are promoted globally nowadays as they can be one of the effective solutions to mitigate climate change and global warming. Living wall, green facade and green roofs are passive cooling techniques used in envelope and roof design [10]. Deciduous plantings are effective methods for shading against the low eastern and western sun. Climbing plants can be fitted to existing buildings to reduce solar heat gain.
Envelope Thermal Transfer Value (ETTV) is an established metric used to quantify heat gain through building envelopes and is adopted in building energy design guidelines. As reported in previous studies [11,12], ETTV provides a simplified yet effective method for estimating and reducing building cooling loads. However, the integration of ETTV with green building elements remains unexplored. Therefore, the selection of appropriate orientations for living wall and green facade application to reduce ETTV and cooling energy consumption improves building energy performance.
The benefits of living walls, green façades, and green roofs have been widely reported in the literature, demonstrating significant economic (energy savings), environmental (urban heat island mitigation and air quality improvement), and social (thermal comfort and well-being) advantages [13,14,15]. These approaches improve the thermal and energy performance of buildings, as well as indoor air quality, and encourage the practice of using green and clean energy. However, some studies show that green buildings do not perform as they are predicted or designed to be during their operational stage [16] due to the difference between actual and predicted building performance. This is normally known as building performance gap or energy performance gap when only energy consumption is taken in consideration. Not only the technical issue but social aspects (e.g., occupancy behaviour, construction process, project management, etc.) can also contribute to energy performance gap [12].
Despite significant progress in building energy performance improvement, there remains a lack of experimentally validated models that integrate green building elements into ETTV frameworks for subtropical climates. This study addresses this gap by combining experimental investigation with mathematical modelling and the key objectives of this study are:
- (i)
- To experimentally evaluate the thermal performance of living walls, green façades, and green roofs in a subtropical climate;
- (ii)
- To develop modified ETTV formulations incorporating green envelope systems;
- (iii)
- To quantify the impact of these systems on building heat gain and cooling energy consumption.
The novelty of this work lies in the integration of experimentally validated green element performance into ETTV-based models, providing a new and scalable framework for energy-efficient building design in subtropical regions.
2. Methodology
The methodology to quantify energy performance of buildings has been divided into two parts. In the first part, extensive experimental investigations were conducted using an experimental prototype building to investigate the benefits of green elements in the buildings under the sub-tropical climatic conditions of Australia. In the second part, ETTV-based mathematical models were developed to quantify energy performance in real building application. The detailed methodology is described in the following sections.
2.1. Experimental Set Up
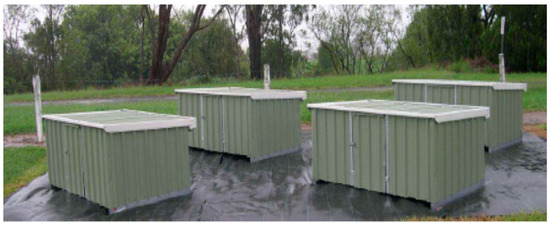
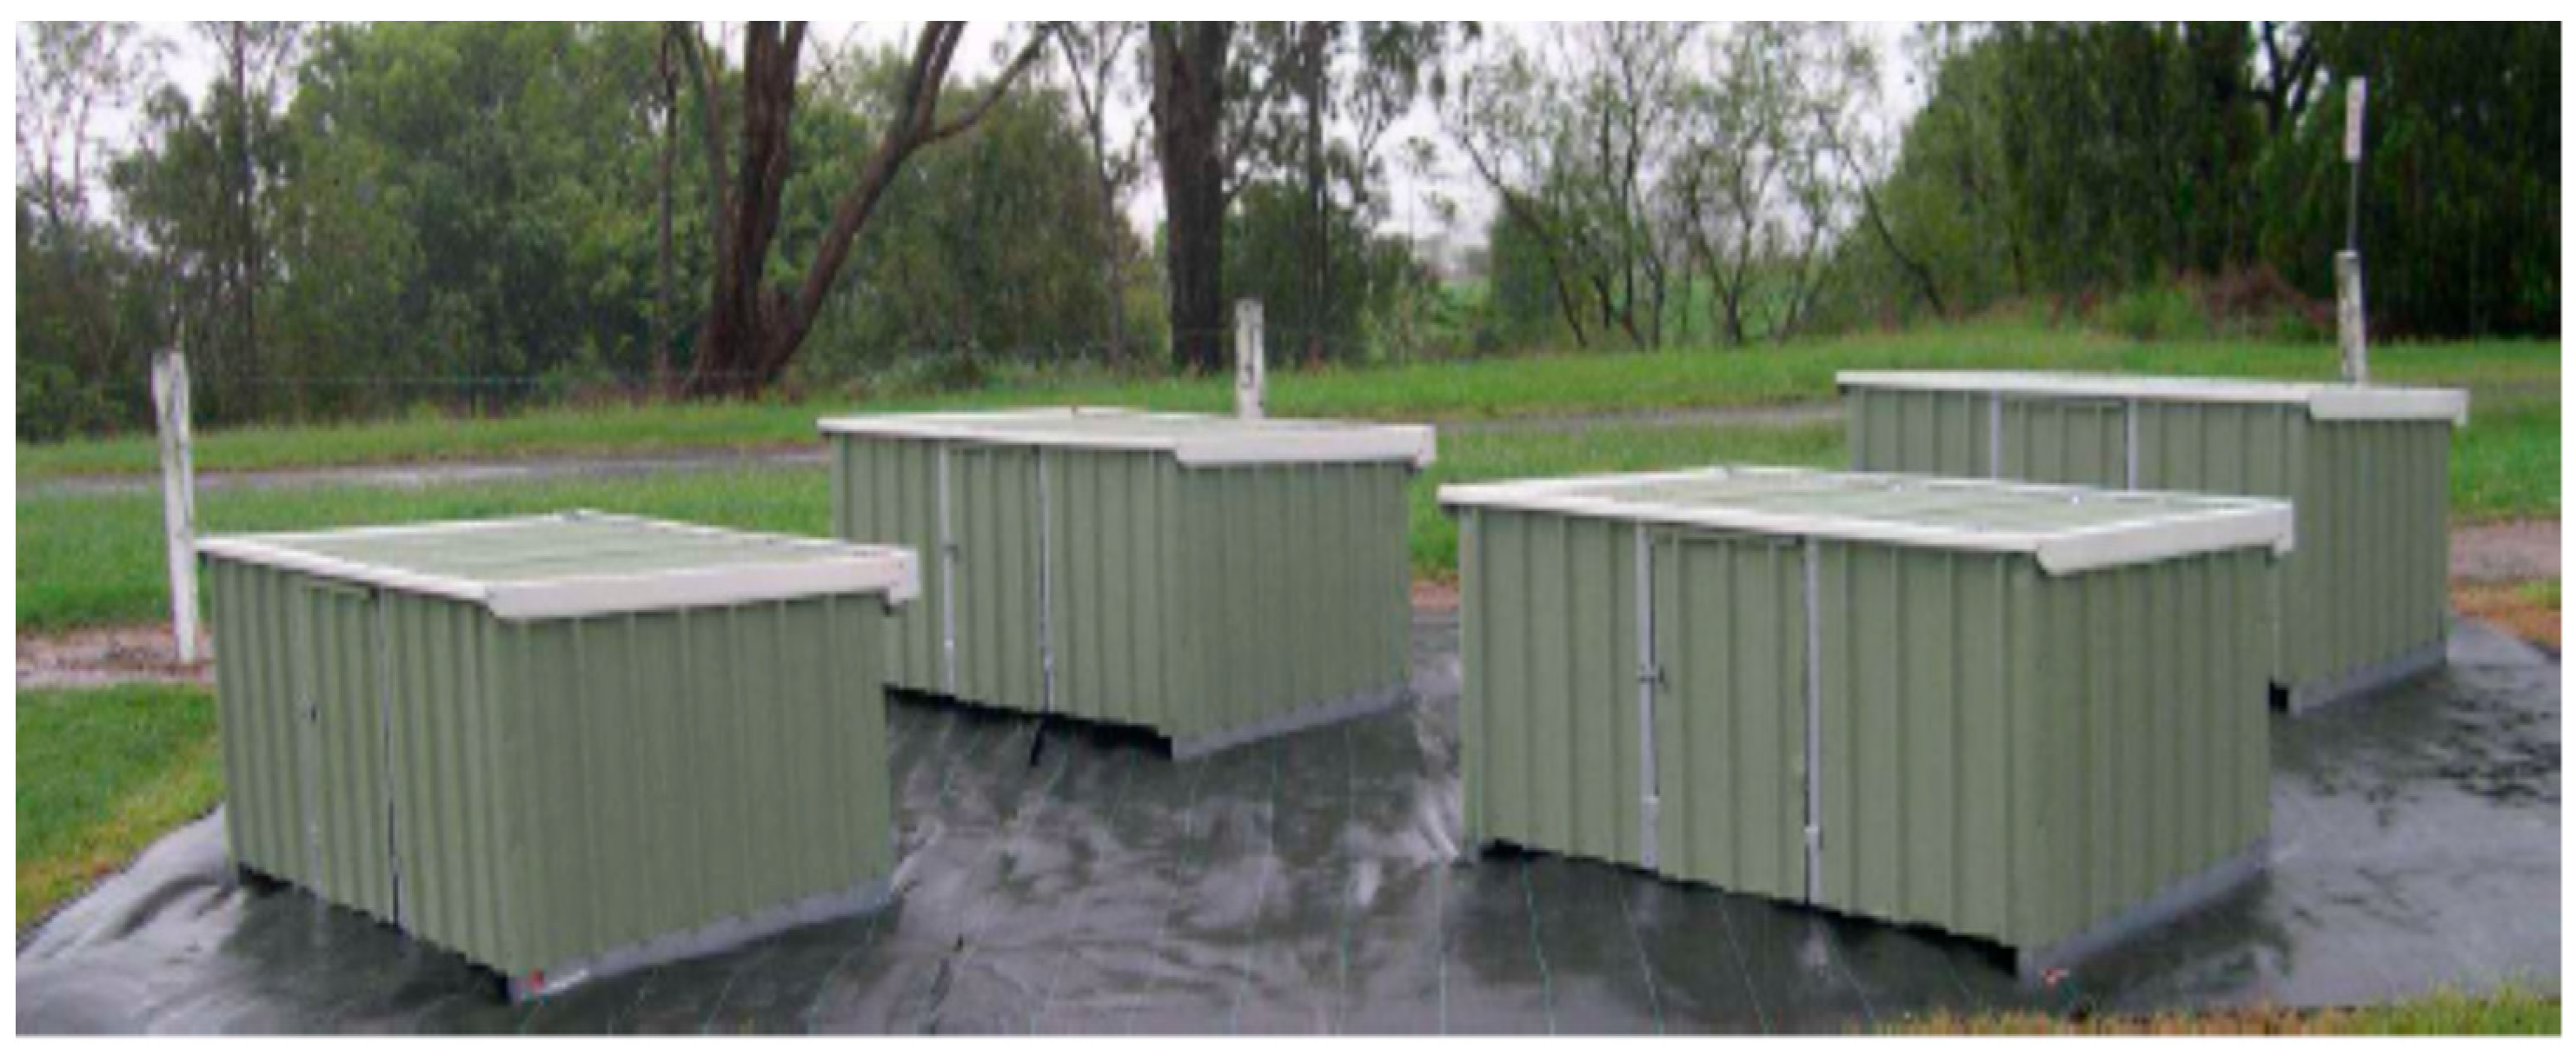
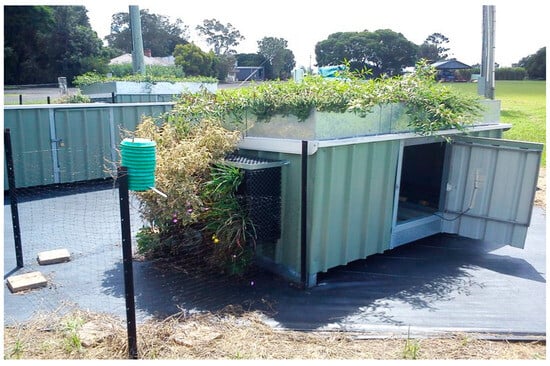
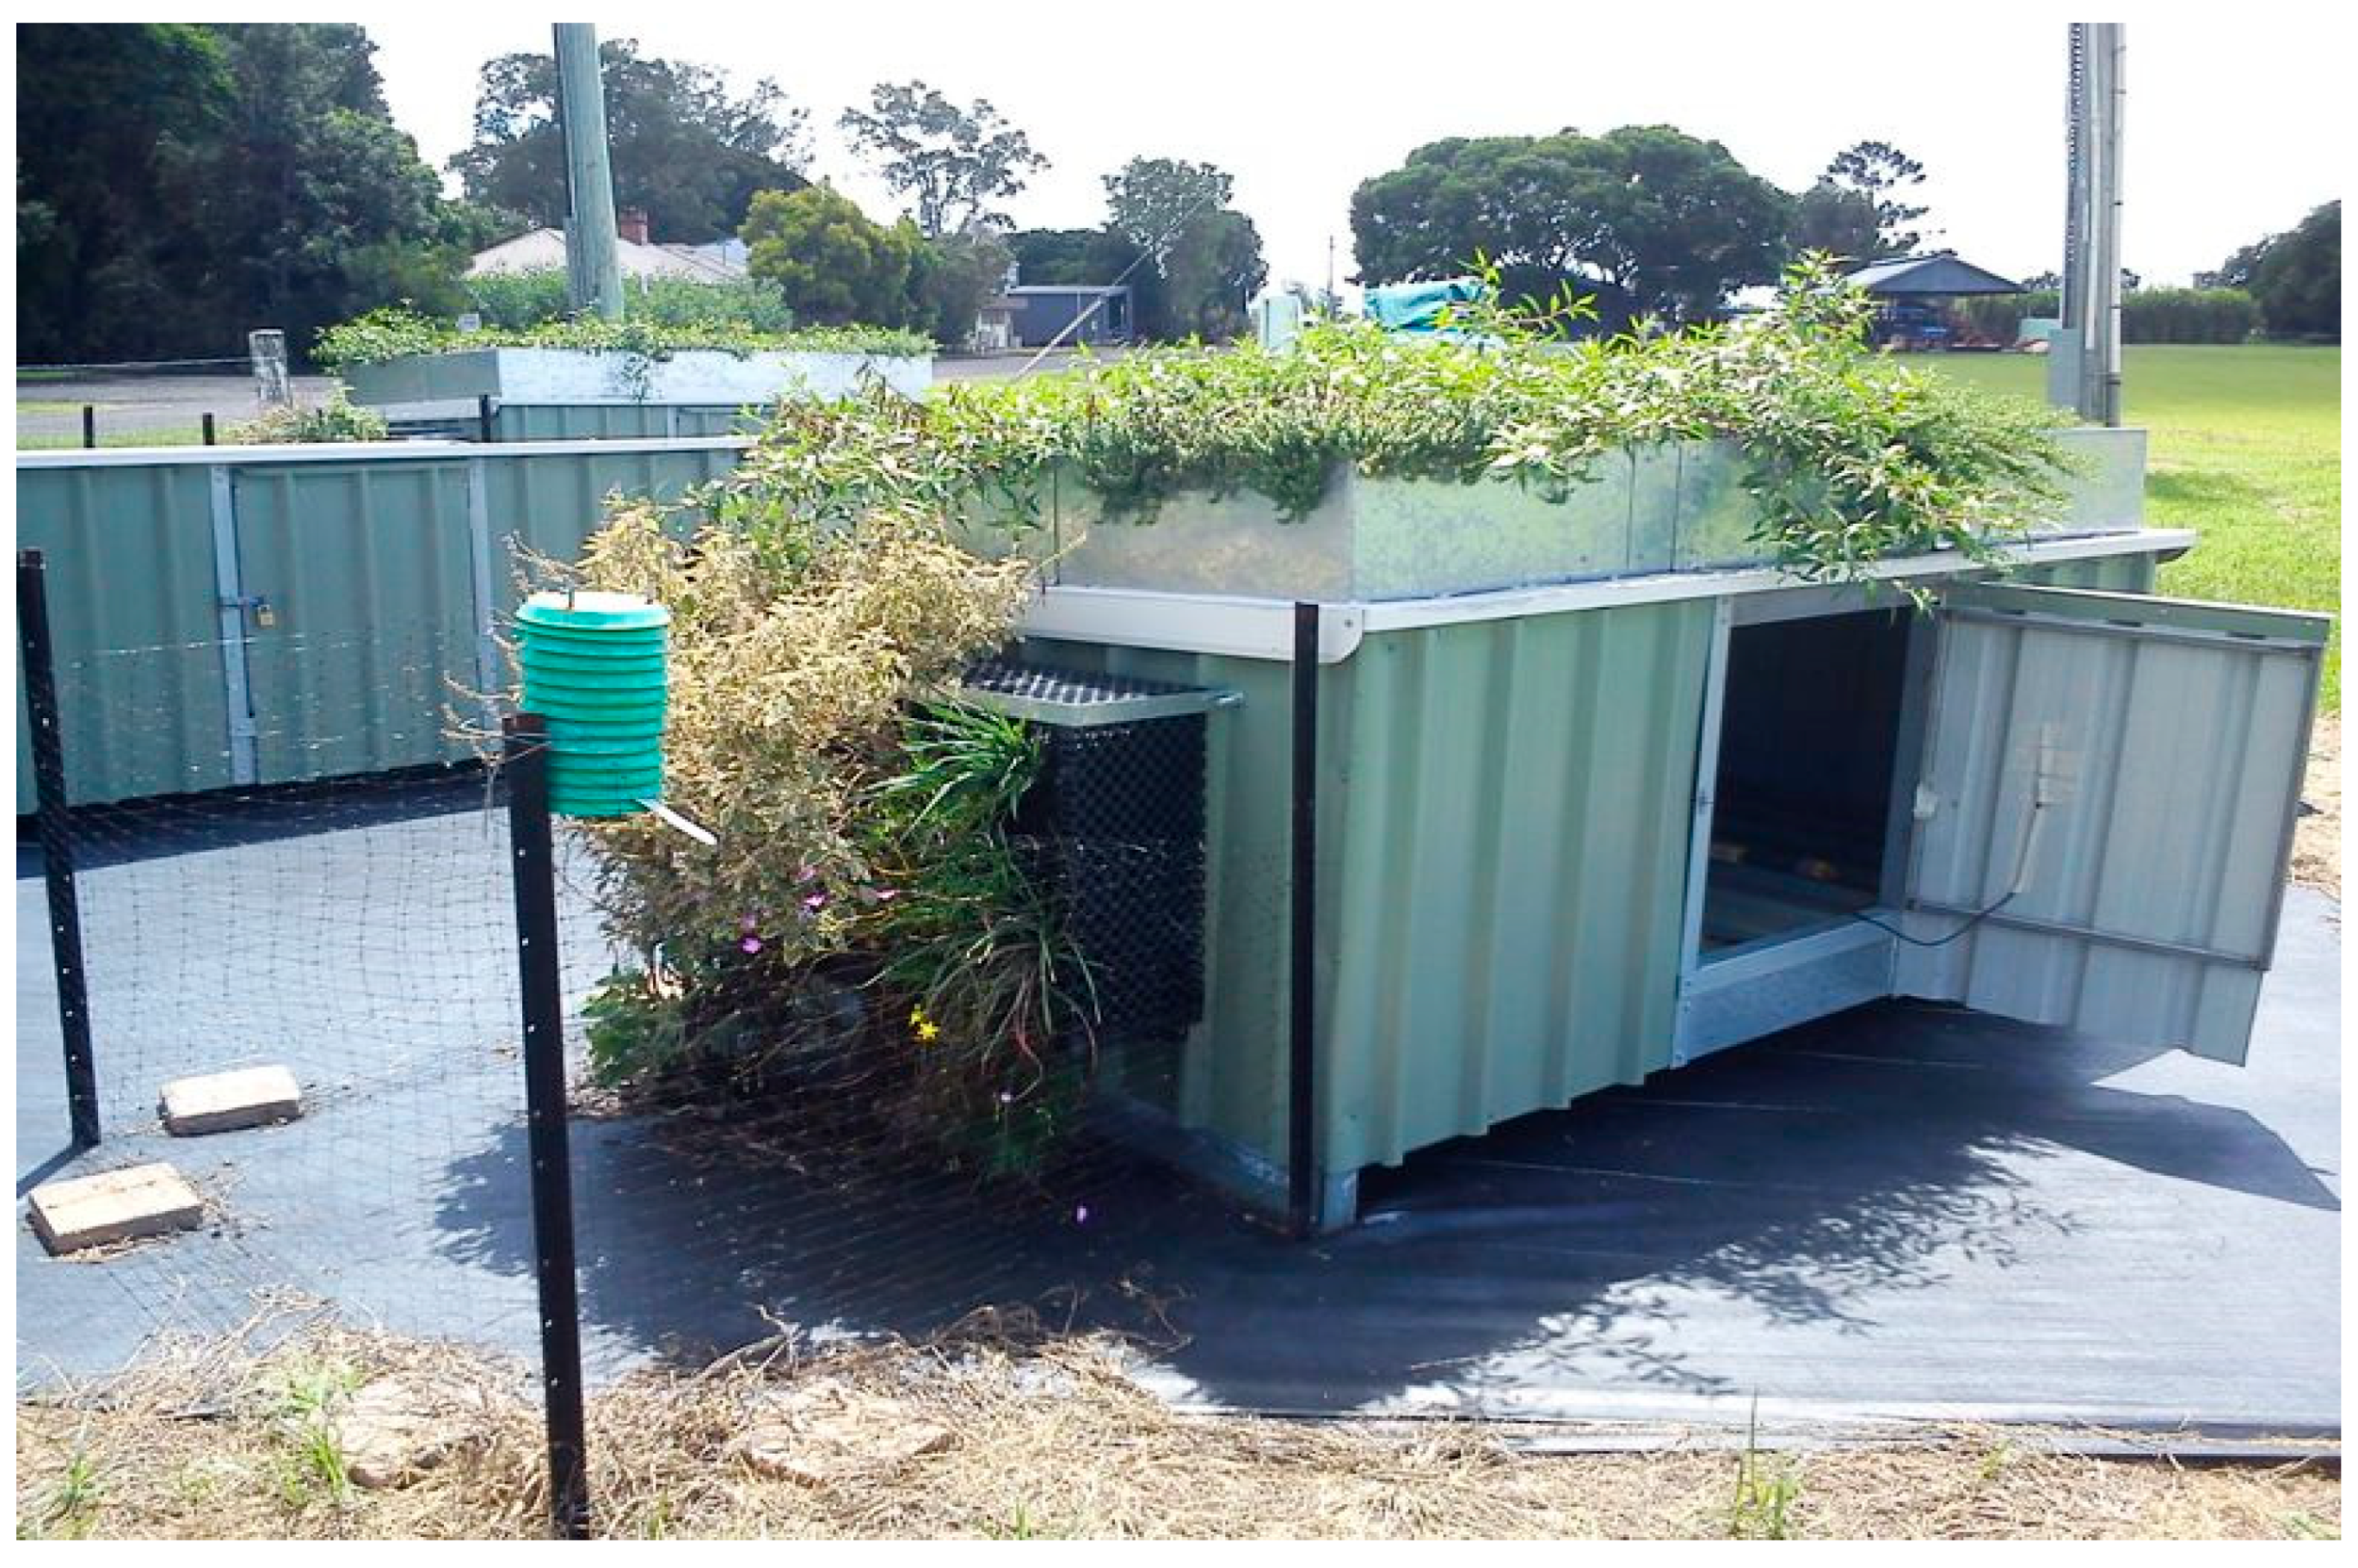
For this study, the following two prototype experimental buildings were used: one with living wall and green roof modules and the other as a reference building, without living wall and green roof, as shown in Figure 1 and Figure 2. The experimental facility was located at the University of Queensland, Gatton Campus. The structures were made of steel and designed to replicate simplified building envelope conditions.
Figure 1.
Experimental facilities built for the living wall and green roof investigations.
Figure 2.
Experimental facilities with living wall and green roof.
The experimental buildings were located on open and flat ground, ensuring minimal external shading effects. The nearest Bureau of Meteorology (BOM) station was approximately 1 km away, providing reliable climatic data. The observation period (October–November and February–March) was selected to represent late spring and summer conditions in subtropical Queensland, characterised by increasing solar radiation, stable plant growth, and minimal extreme weather events.
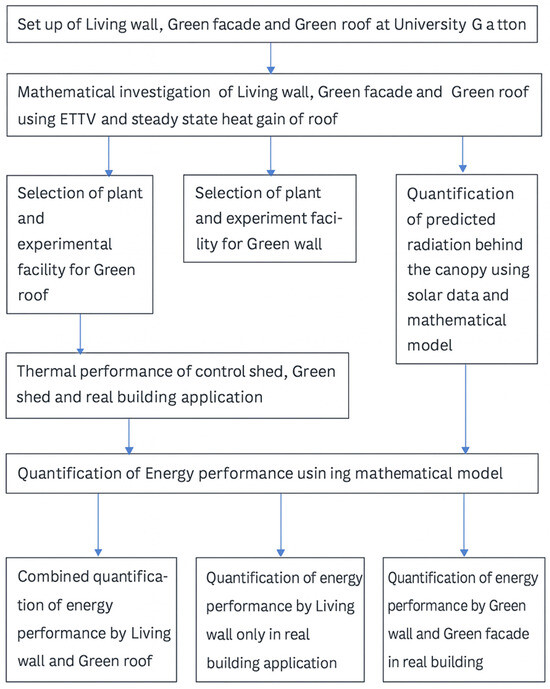
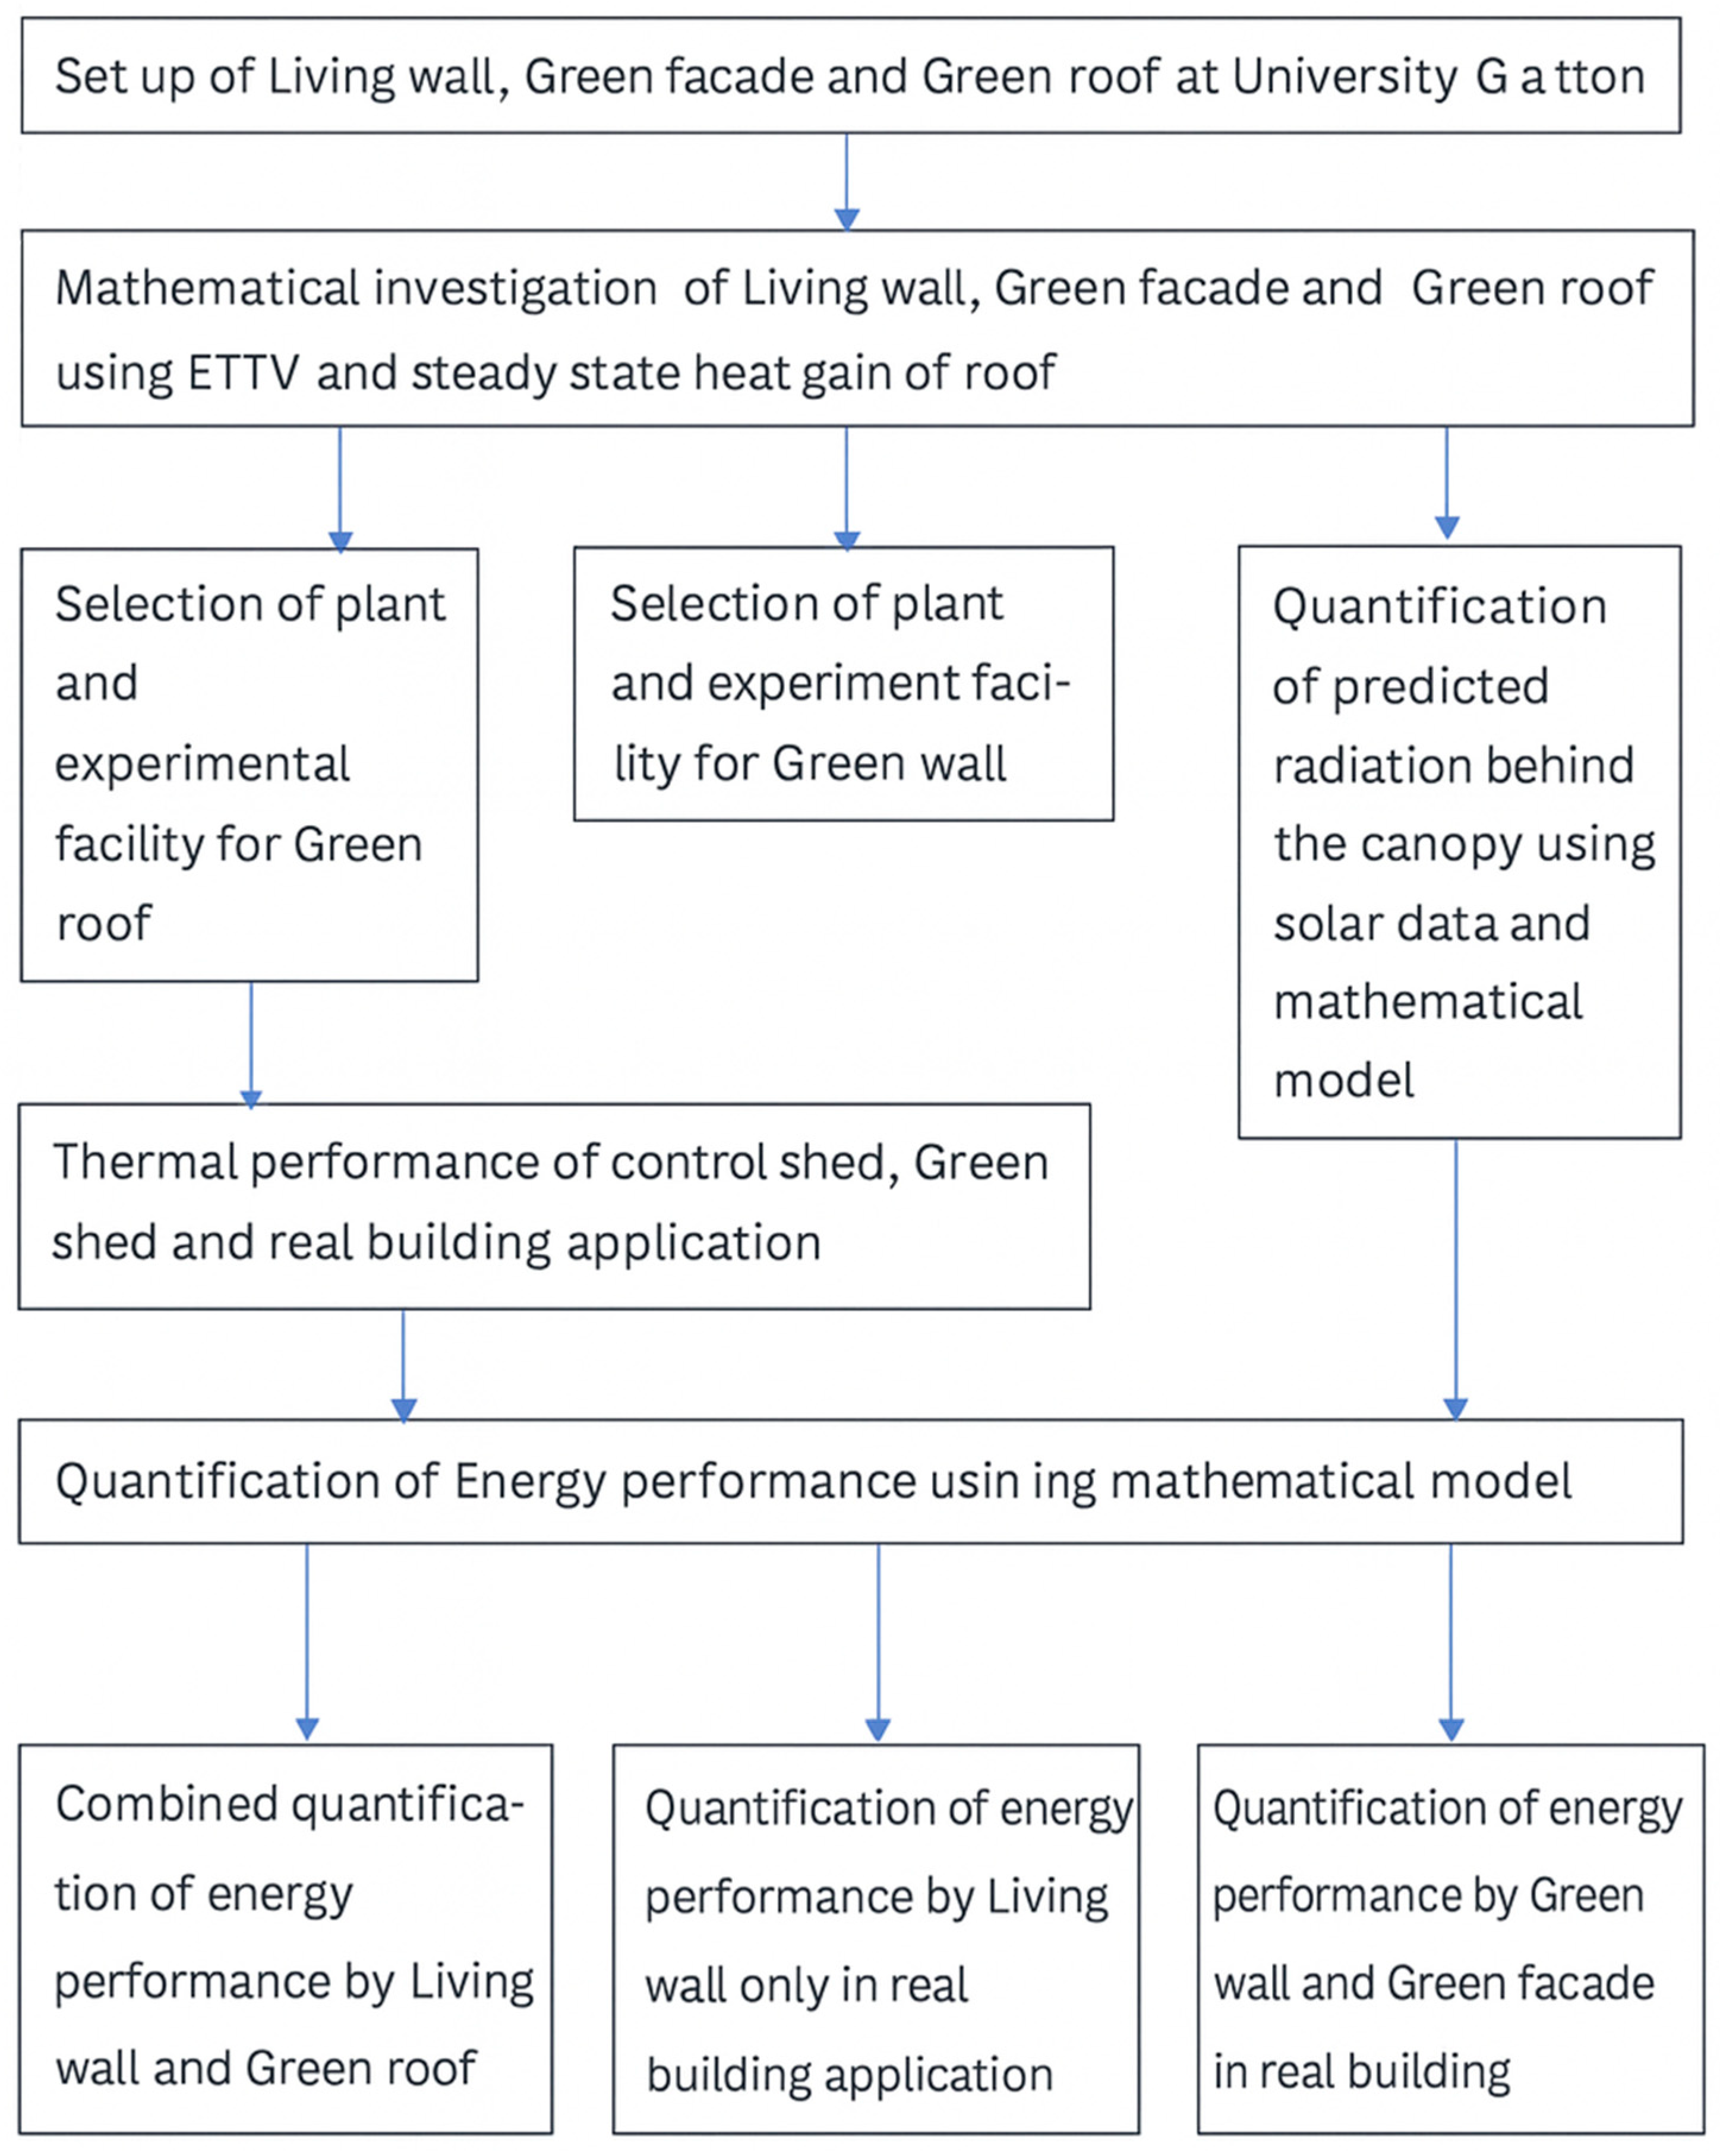
The methodology followed in this research is illustrated in Figure 3.
Figure 3.
Process of quantification of energy performance of commercial building (by living wall, green facade and green roof).
2.1.1. Living Wall and Green Roof Systems
The living wall system was made up of Elmich green wall modules, Geotextile liner and Enviroganics Bioganic Earth green wall mix. The selected plant species included Plectranthus argentatus, Plectranthus parviflorus ‘Blue Spires’, and Bulbine vagans. These species were chosen due to their high leaf density, adaptability to subtropical climates, and suitability for vertical growth systems, ensuring effective shading and evapotranspiration. The green roof system comprising multiple layers of materials including polyurethane waterproof membrane, 25 mm polystyrene panels, Elmich Versicell® drainage module, Elmich Versidrain® 25P drainage sheet, Geotextile, Enviroganics Bioganic Earth green Roof Mix (150 mm) and Enviroganics Envirohydrate Mulch (15 mm) and the plants planted were Calandrinia balonensis, Myoporum parvifolium, Sedum sexangul which are all very short, dense vegetation that looks similar to a carpet of grass. These plants have a high survival rate as the experiment was performed after one year of plantation.
2.1.2. Orientation Selection
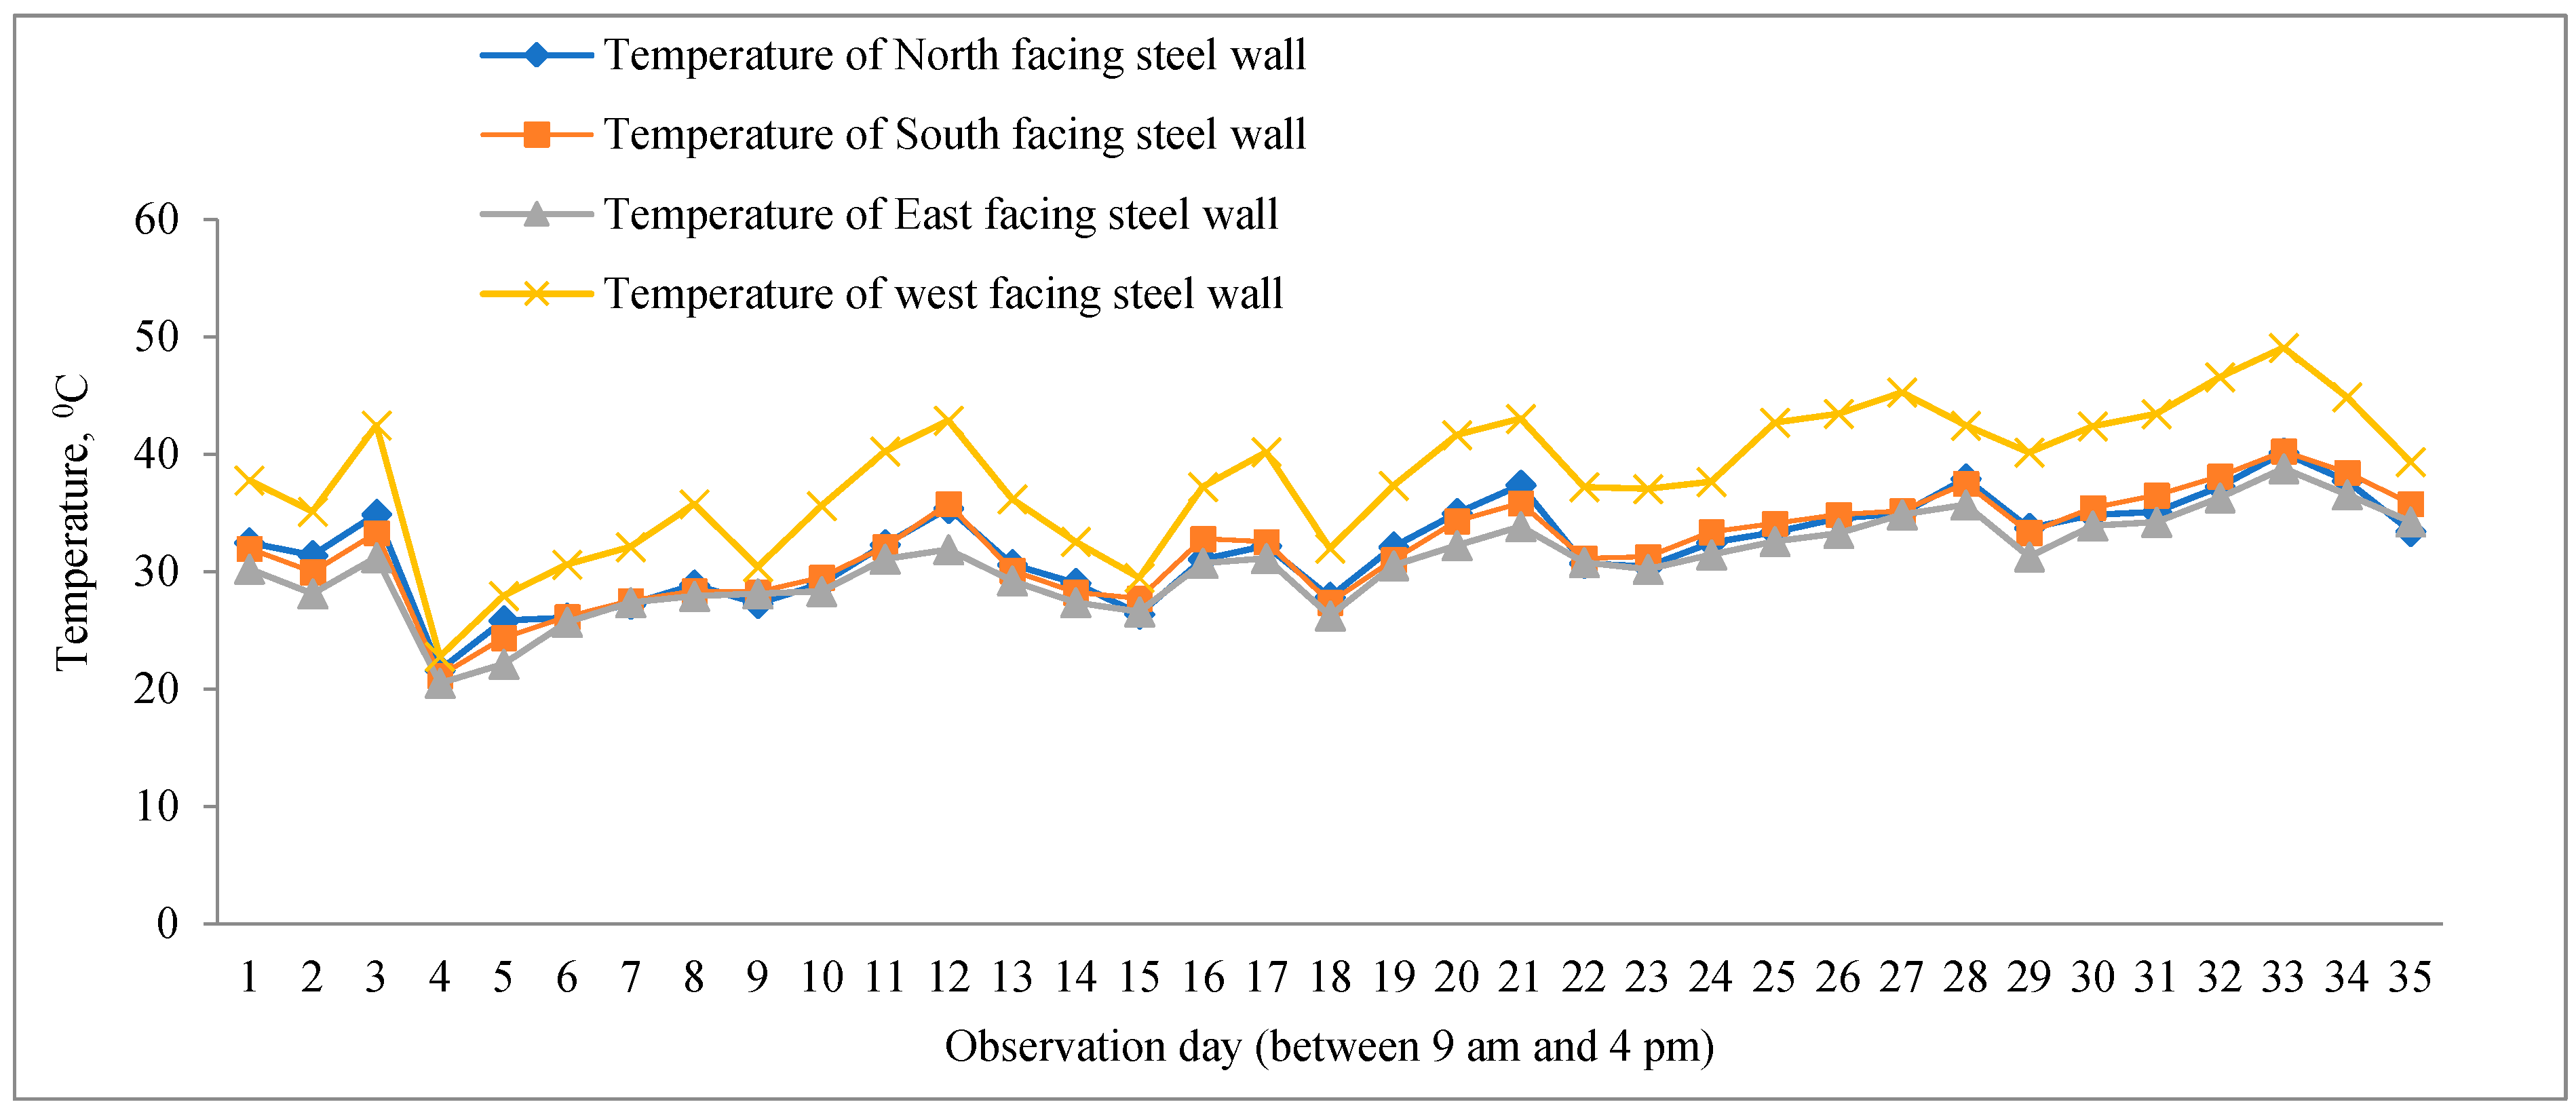
The orientation of the living wall was selected based on measured thermal exposure. The temperature of each wall orientation was monitored over a period of 35 days. Results shown in Figure 4 indicated that the west-facing wall experienced the highest thermal load due to intense afternoon solar radiation. Therefore, the living wall was installed on the west-facing wall to maximise its cooling effectiveness.
Figure 4.
Temperature data for four different orientations (14 October–17 November).
2.2. Instrumentation
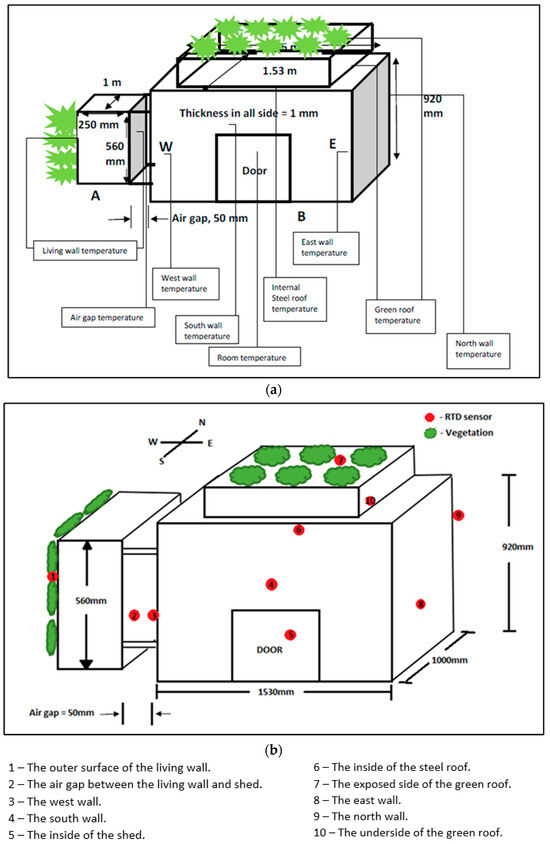
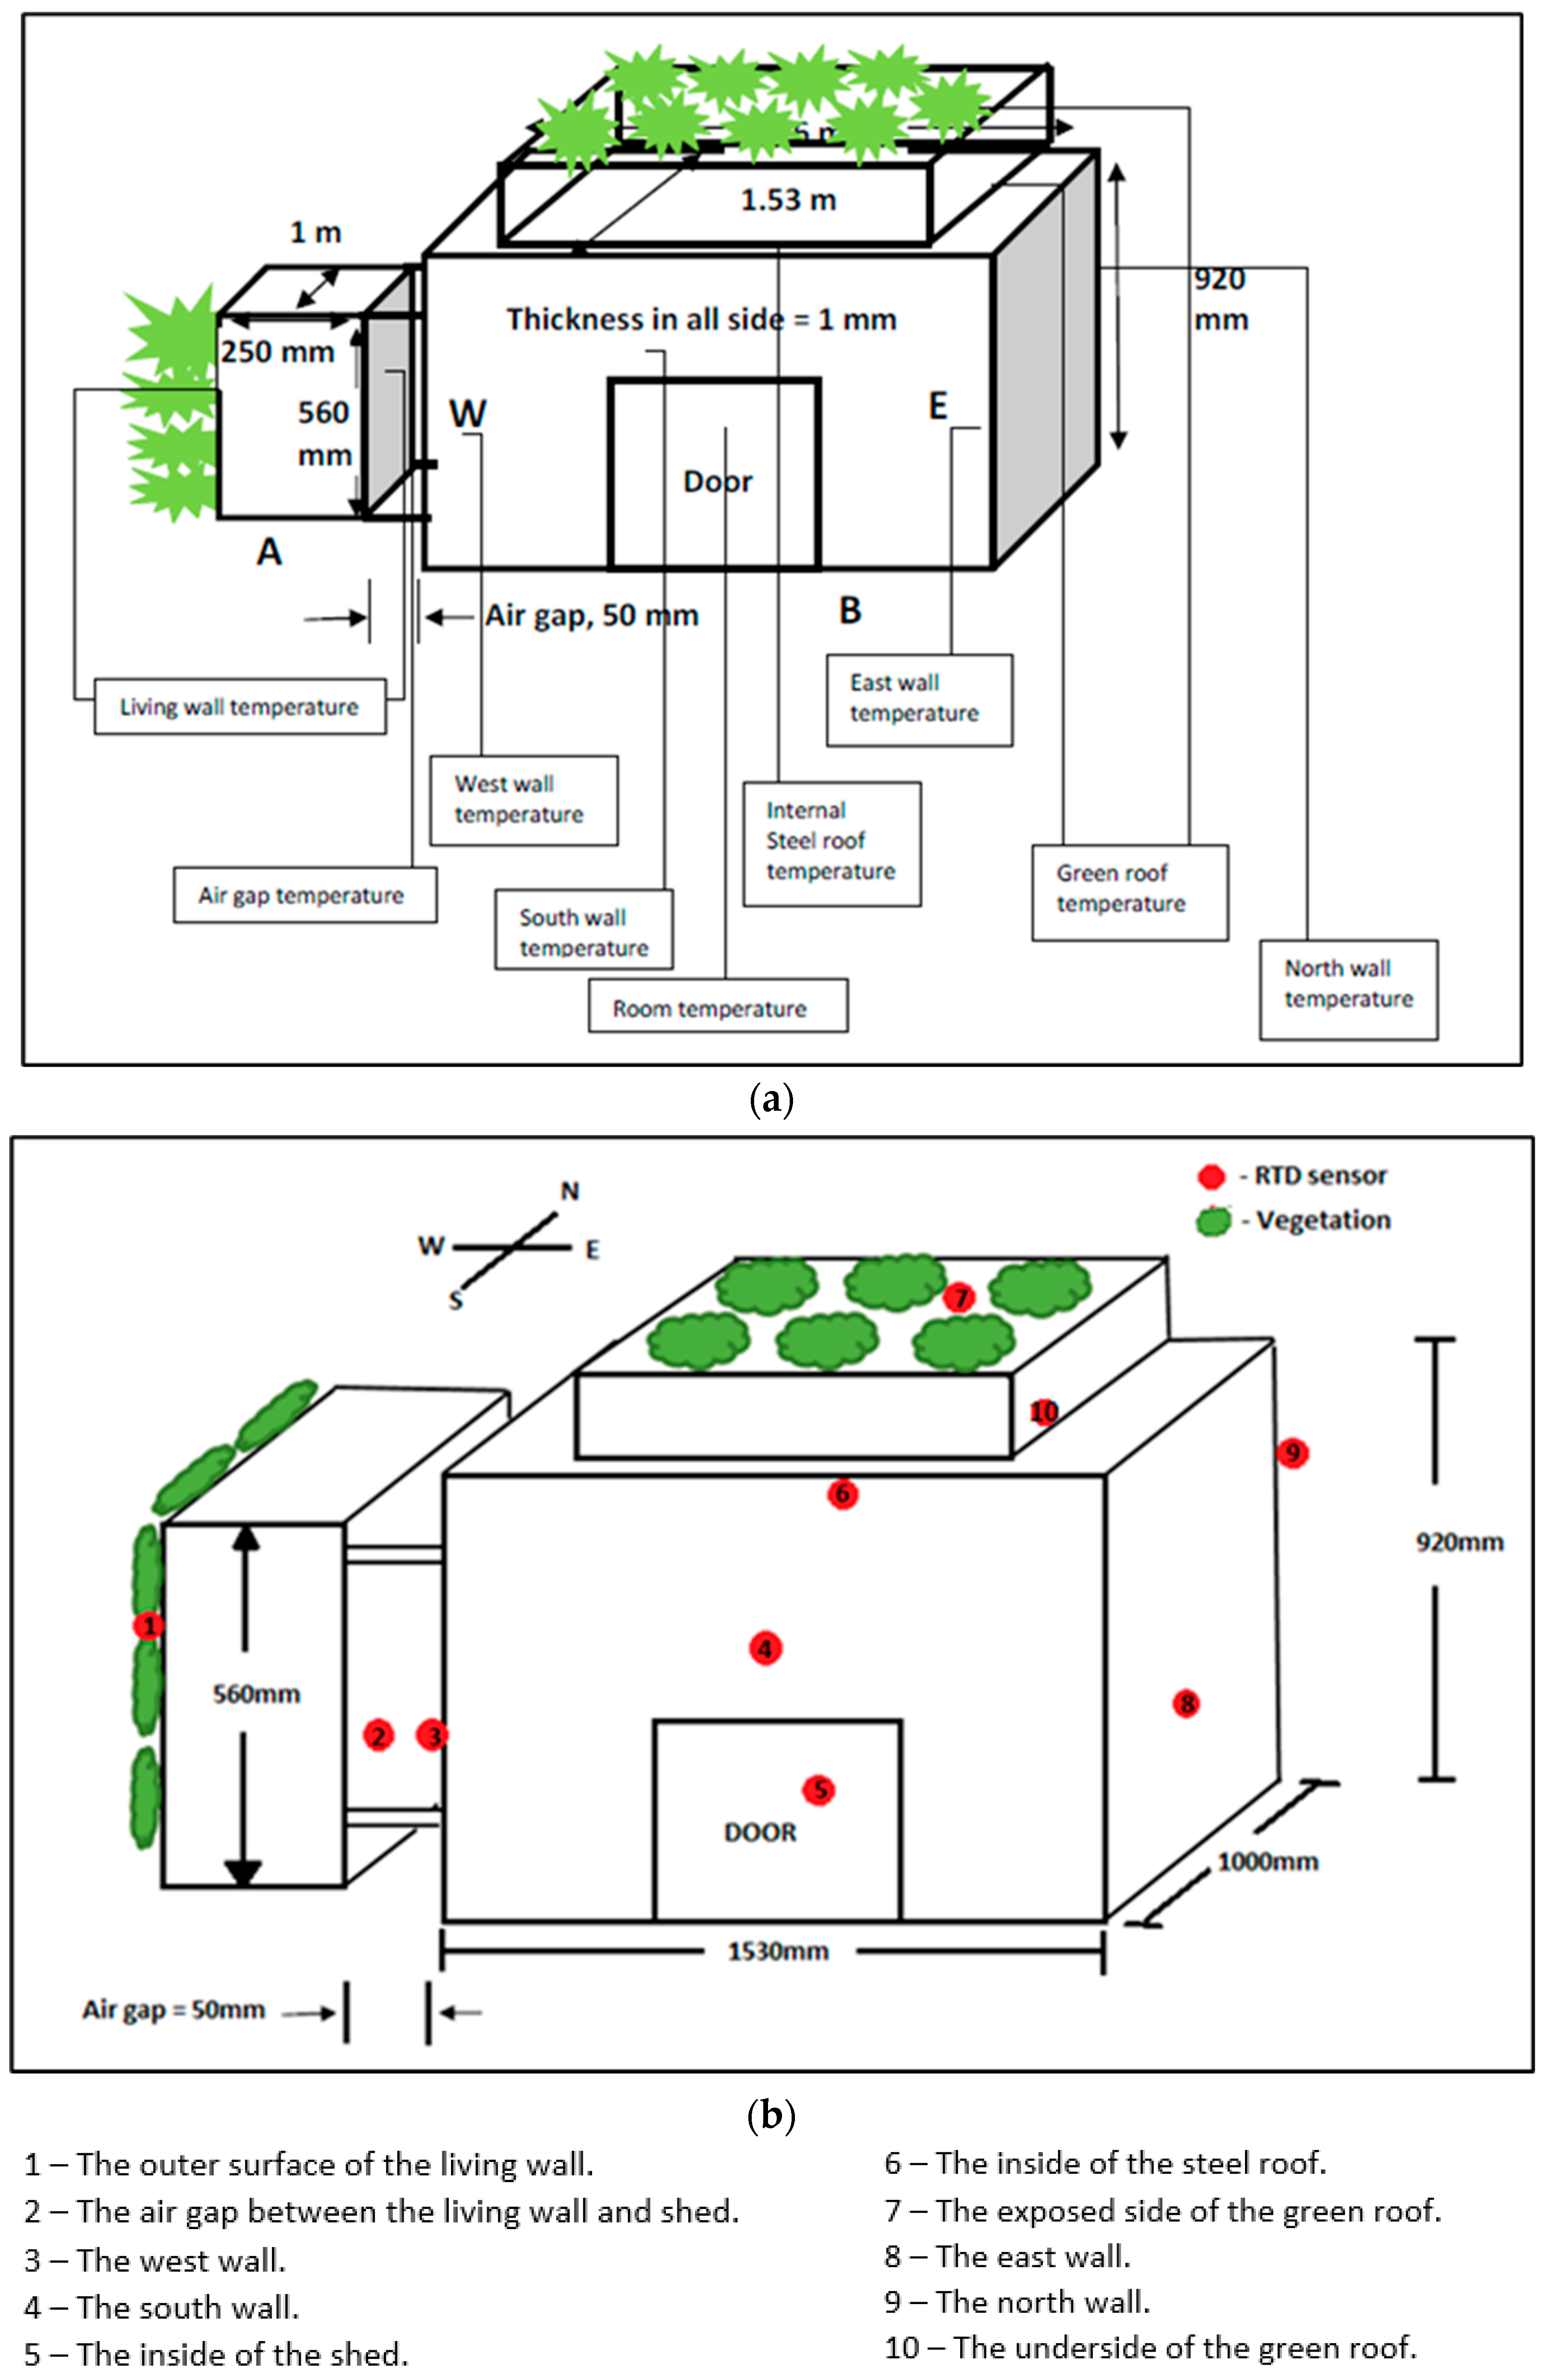
To evaluate energy efficiency, the temperature was measured at various points. The schematic of experimental set up and measurement points are presented in Figure 5, and the description and location of different temperature monitoring devices are given in Table 1. The measurement system included thermistor probes and Type-K thermocouples connected to data loggers. The PB-5002 thermistor probe provides a resolution of approximately 0.02 °C, while the measurement accuracy is typically ±0.2–0.5 °C; it depends on the associated data logger and calibration conditions. The Type-K thermocouples have a resolution of 0.1 °C and ±1.5 °C measurement accuracy. All sensors were calibrated prior to the experiments using standard reference measurements. Data were recorded at regular intervals (5–10 min), ensuring high temporal resolution and reliability of the dataset.
Figure 5.
(a) Details of the experimental facility. (b) Location of temperature measuring device.
Table 1.
Locations and purposes of different temperature sensors in the experimental set up.
2.3. Mathematical Formulation for ETTV
Using the temperature data of living wall and green roof, the mathematical models were formulated to determine the energy performance of commercial with green elements.
2.3.1. Effective Thermal Transmittance of Building Envelopes with Living Walls and Green Roofs
To determine the heat energy gain and cooling energy requirements, the thermal transmittance value ‘u’ needs to be determined by considering material type, thickness and thermal conductivity. The resulting ‘u’ value formulation for the living wall is given in Equation (1).
Ut = 1/Rt = (1/Rc + 1/Rl)
2.3.2. Mathematical Formulation of ETTV
The ETTV equation without green elements is taken from Chua K., et al. [12] and Karim et al. [11] as shown in Equation (2).
ETTV = (1 − WWR) × Uw × TDeq + WWR × Uf × ΔT + WWR × SC × SF
The following assumptions and boundary conditions were applied in the model:
- Steady-state heat transfer conditions;
- Uniform material properties across the envelope;
- Negligible internal heat generation;
- Constant shading coefficient for green façade systems.
Using the fundamental equation of ETTV, the following Equation (3) was developed for west-facing walls of a building located in Australian sub-tropical region.
ETTVW = CNW UW (1 − WWR) + [CDT (Uf)2 + DDT (Uf)] (WWR) + SFW (CF) (WWR) (SC)
The total heat gain by envelope (Ht) is the weighted average value of ETTV for all orientations, as shown in Equation (4) below:
Ht = (ETTV w × Aw + ETTVn × An + ETTV s × As + ETTVe × Ae)/(Aw + An+ As + Ae)
Chua and Chou’s [12] mathematical model of cooling energy requirements (Ec) for a building without green elements is given in Equation (5).
Esc = γ Ht ∗ At ∗ 24 (D) (a) (b)/∆t (COP)n
Esc is an external shading multiplier for the wall, which is due to the green facade absorbing the direct sunlight on the wall, but it can also be applied to the window.
When the green façade is positioned on a west-facing wall, the thermodynamic transfer for that wall can be modelled with Equation (6):
ETTVgf1 = TDeq (1 − WWR) Uwa ∗ Esc + [CDT (Uf)2 + DDT (Uf)] (WWR) + SFW (CF) (WWR) (SC)
If the building has the west-facing wall covered by a green façade and the remaining walls uncovered as shown in Figure 6, the resulting ETTV equation would be:
ETTVb1 = (ETTVgf1 × Aw + ETTVn × An + ETTVs × As +ETTVe × Ae)/(Aw + An + As + Ae)
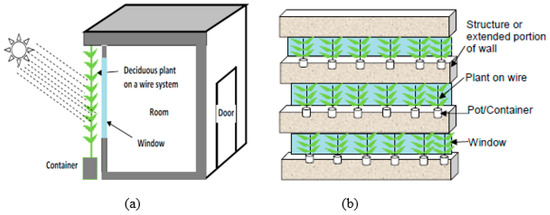
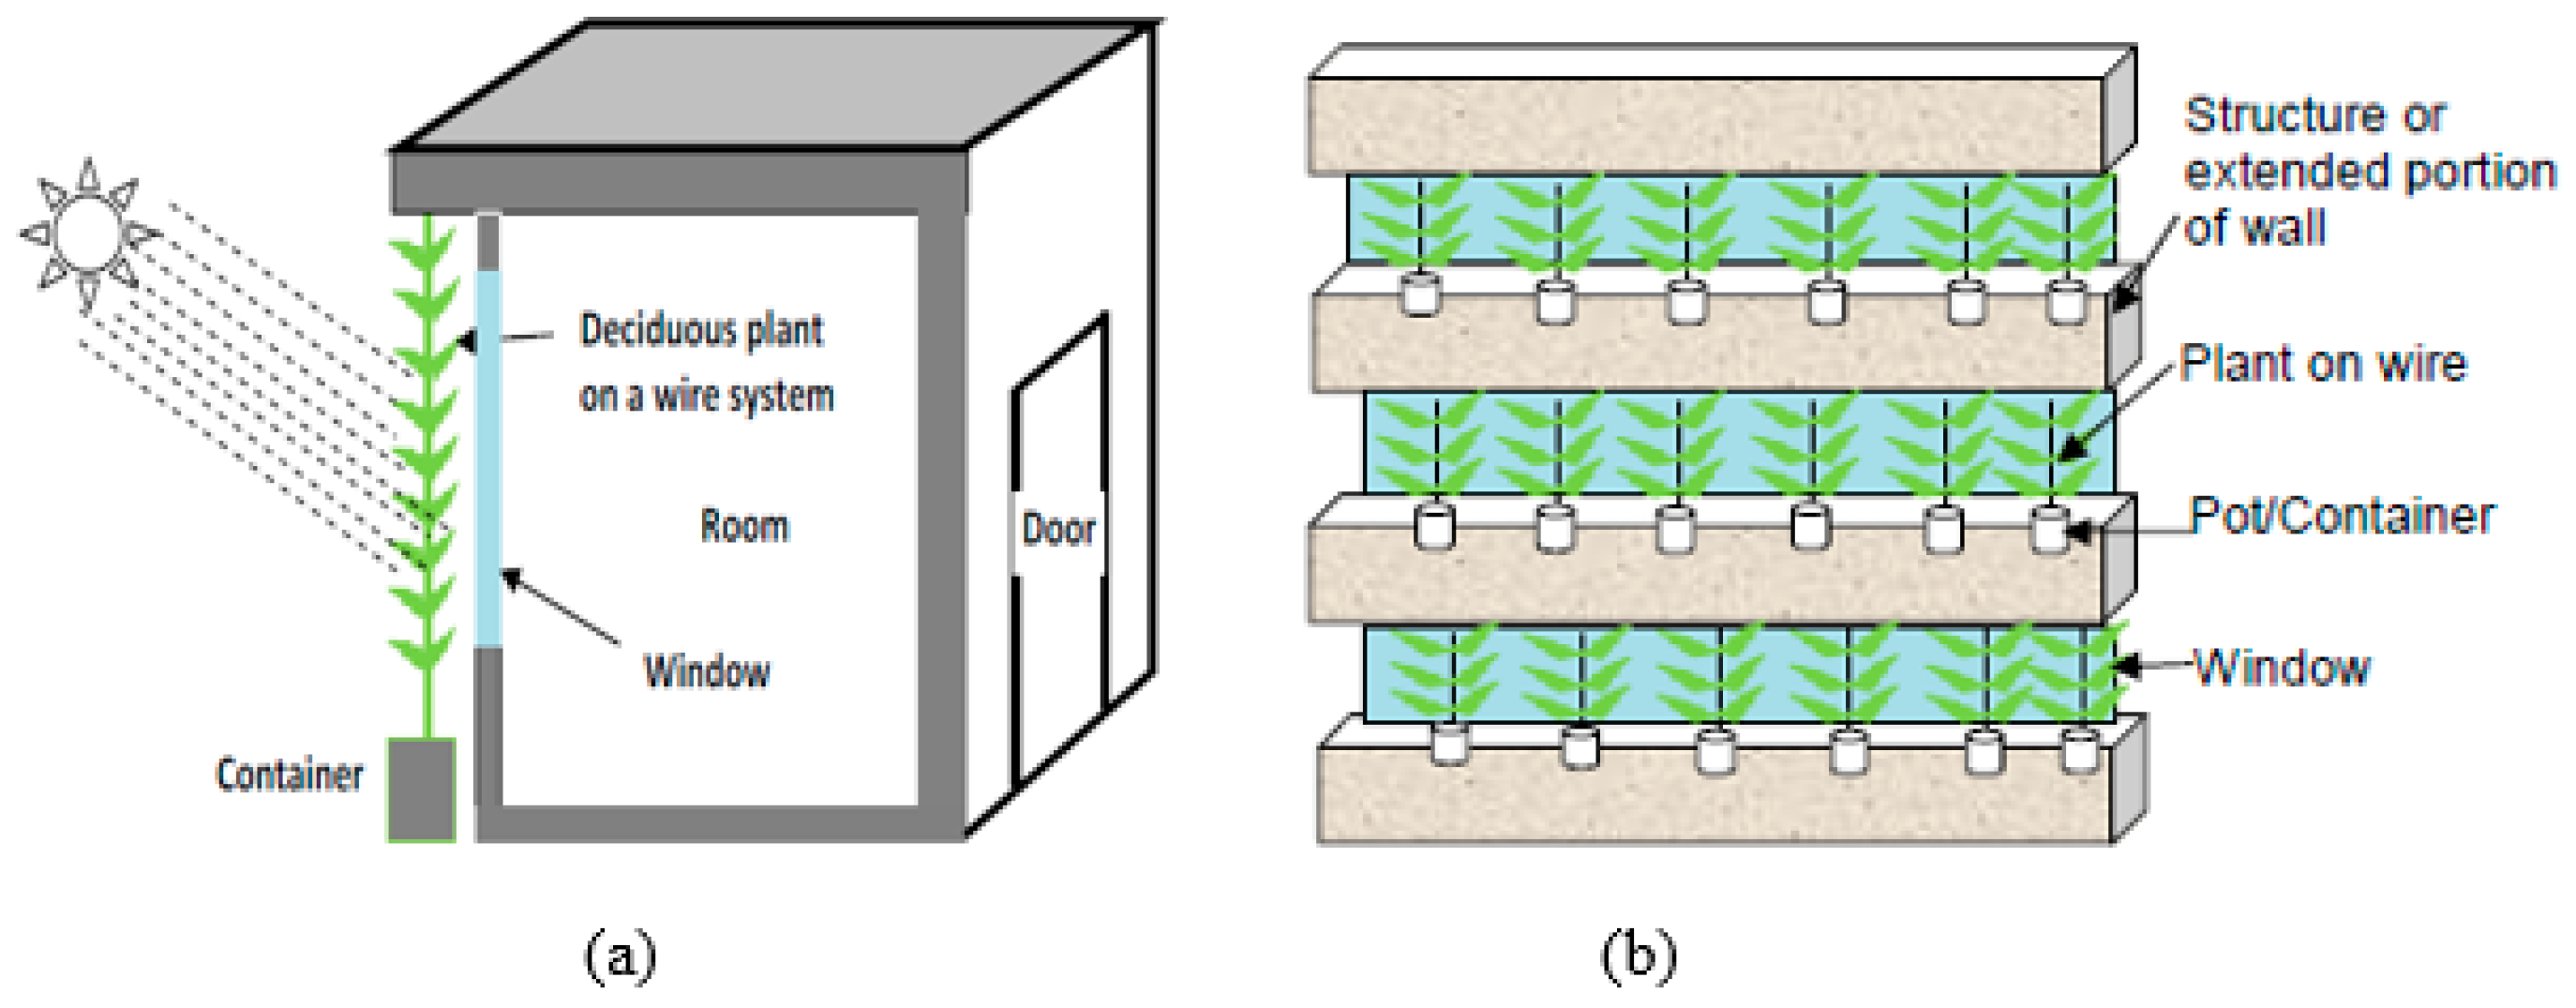
Figure 6.
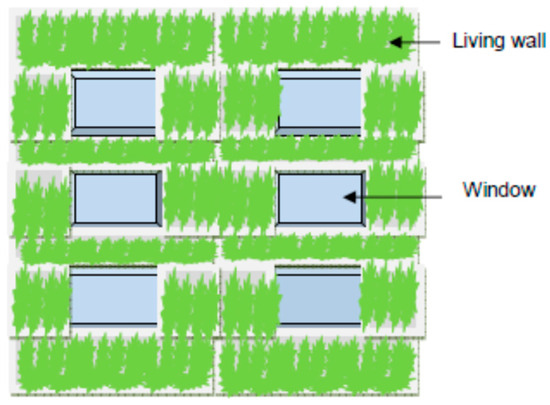
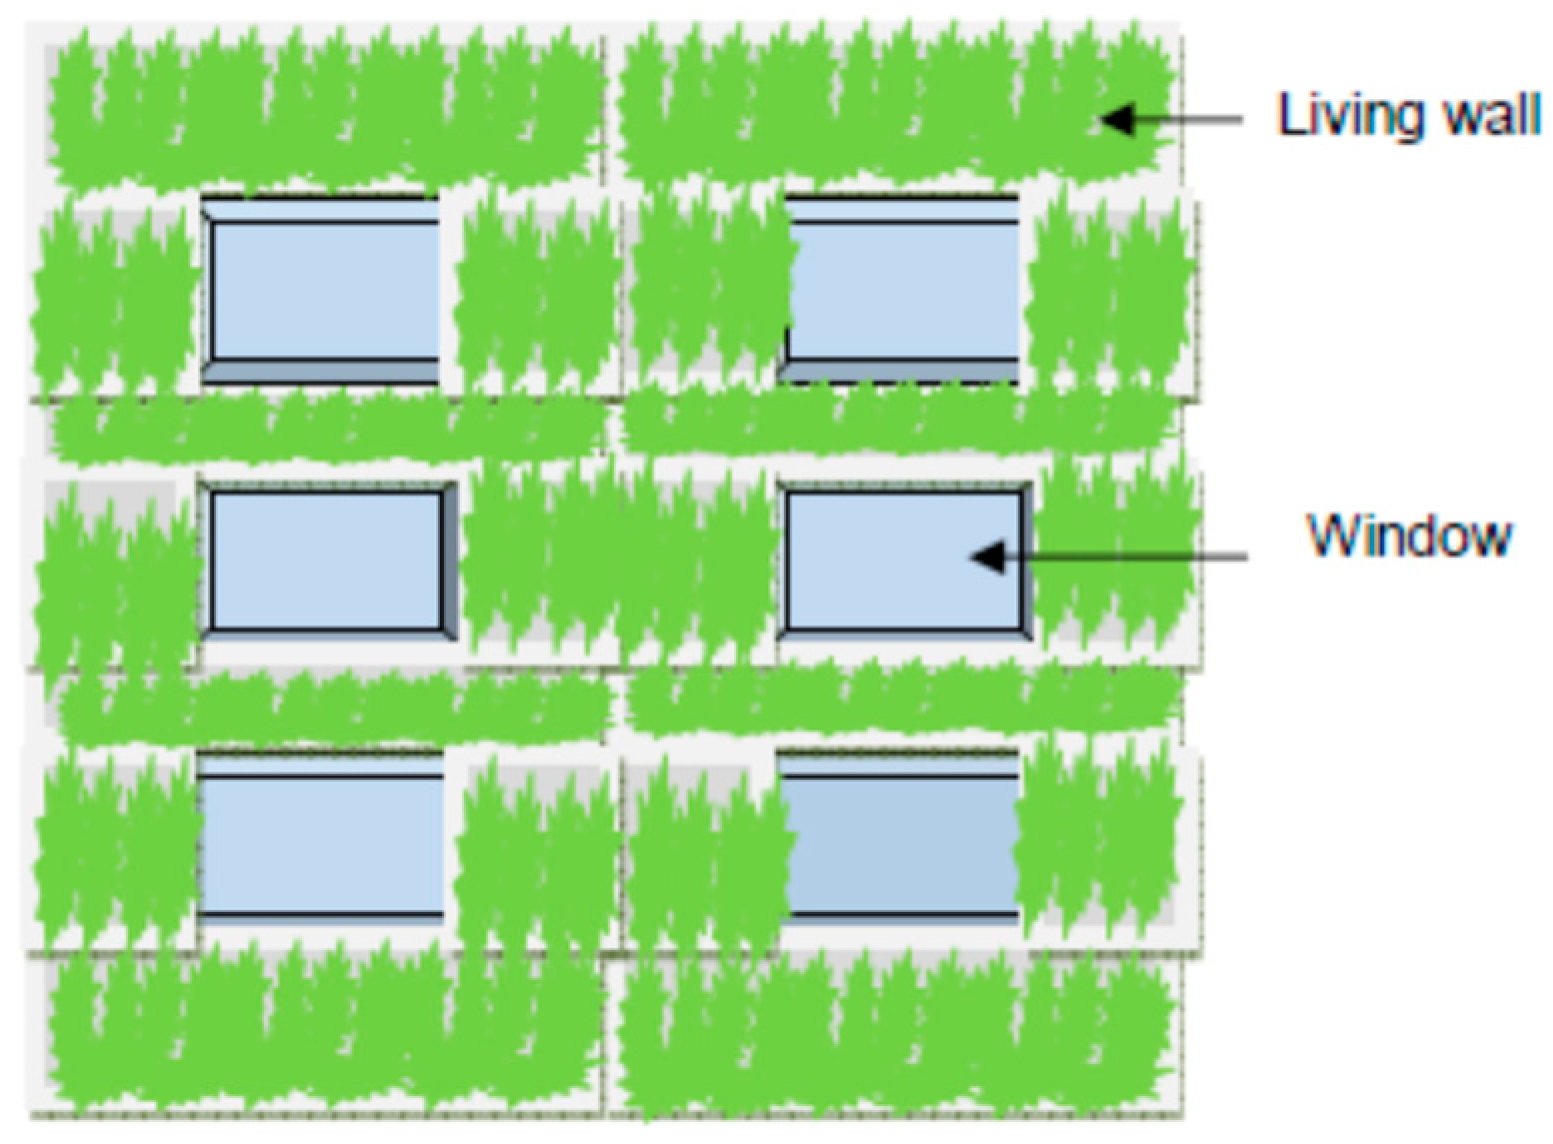
(a) Green facade in front of window, (b) green facade on fenestration of building.
Relative to Equation (5), the cooling energy requirement is found with:
Ecf1 = γ ∗ At (ETTVb1) ∗ 24 (D) (a) (b)/∆t (COP)n
If the green facade was placed in front of the window on the west-facing side as shown in Figure 7, then the equation for the shading coefficient would be:
Tsc = SC1 × Esc
Figure 7.
Living wall on building wall and green facade on window side in a combined system.
Then, the ETTV equation would be updated to:
ETTVgf2 = TDeq (1 − WWR) Uw + [CDT (Uf)2 + DDT (Uf)] (WWR)] + SFW (CF) (WWR) (Tsc)
If the green facade was placed in front of the fenstration on the west side while the other fenestrations remained uncovered, the relevant equation would be as presented in Equation (11):
ETTVb2 = (ETTVgf2 × Aw + ETTVn × An + ETTVs × As + ETTVe × Ae)/(Aw + An + As + Ae)
The relating cooling energy requirements can be expressed as follows:
Ecf2 = γ ∗ At (ETTVb2) ∗ 24 (D) (a) (b)/∆t (COP)n
The total heat gain of a concrete roof in unison with a green roof is denoted by ‘Qt‘ and the resulting equation is
Qt = Ut [ΔTair + ΔTsolar] = Ut [(Ta − Ti) + α G/h0]
To find the total heat transfer coefficient between green roof and the outside ambient air, the equation illustrated below is used:
where ‘hrg’ represents the radiative heat transfer coefficient between the green roof and the sky and is expressed as follows:
h0g = hc + hrg (Tg − Tsky)/(Tg − Ta)
hrg = σε (Tg2 + T2sky) (Tg + Tsky)
If the west-facing wall is covered by a living wall while other walls remain uncovered, the weighted average ETTV equation will be:
ETTVb = (ETTVlw × Aw + ETTVn × An + ETTVs × As + ETTVe × Ae)/(Aw + An + As + Ae)
Also, the cooling energy requirements would be:
Ecw = γ ∗ At (ETTVb) ∗ 24 (D) (a) (b)/∆t (COP)n
The equations adapted to calculate ETTV for having a living wall on the opaque parts of the wall and the green façade on the fenestration of the west wall is expressed as follows:
ETTVlg = TDeqg (1 − WWR) Uwa + [CDT (Uf)2 + DDT (Uf)] (WWR) + SFW (CF) (WWR) (Tsc)
If the remaining walls are left uncovered, then the heat gain equation is:
ETTVbo = (ETTVlg × Aw + ETTVn × An + ETTVs × As + ETTVe × Ae)/(Aw + An + As + Ae)
The relative cooling requirements is found with:
Ecb = γ ∗ At (ETTVbo) ∗ 24 (D) (a) (b)/∆t (COP)n
A heat gain model which includes the thermal properties of a west-facing living wall, three plain walls and a concrete green roof is illustrated below:
ETTVb = (ETTVlw × Aw + ETTVn × An + ETTVs × As +ETTVe × Ae)/(Aw + An + As + Ae)
The total heat gain of the building is found with:
Hg = ETTVb + Urg [(Ta − Ti) + αG/hog]
The required energy for cooling can be identified with:
Ec = (γ ∗ Ate) ∗ Hg ∗ 24 (D) C/∆t (COP)n
Thermal transmittance or heat transfer coefficient value of living wall and green roof is an important consideration in living wall and green roof heat gain and cooling energy estimation. In the present analysis, the U value of living wall and green roof has been determined based on construction details, i.e., type of material used with thickness consideration and based on the thermal conductivity of the original material used in the construction. The total U value of living wall has been calculated. Details of these walls and U values are provided in Table 2 and Table 3.
Table 2.
U value of living wall Ul (construction characteristics retrieved from Elmich supplier).
Table 3.
U value of green roof Ug (from Elmich supplier and the available literature [17,18]).
Following boundary conditions d, the following assumptions were made:
- Steady-state heat transfer conditions assumed;
- Uniform material properties across envelope;
- Constant shading coefficient for green systems;
- Negligible internal heat generation;
- Environmental effects such as wind, humidity, and evapotranspiration are not explicitly modelled.
2.4. Internal Surface Temperature Modelling
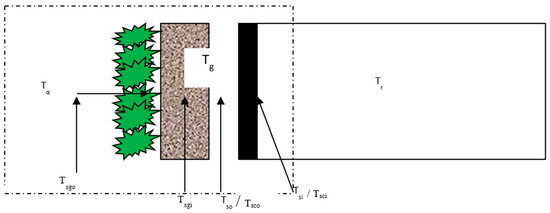
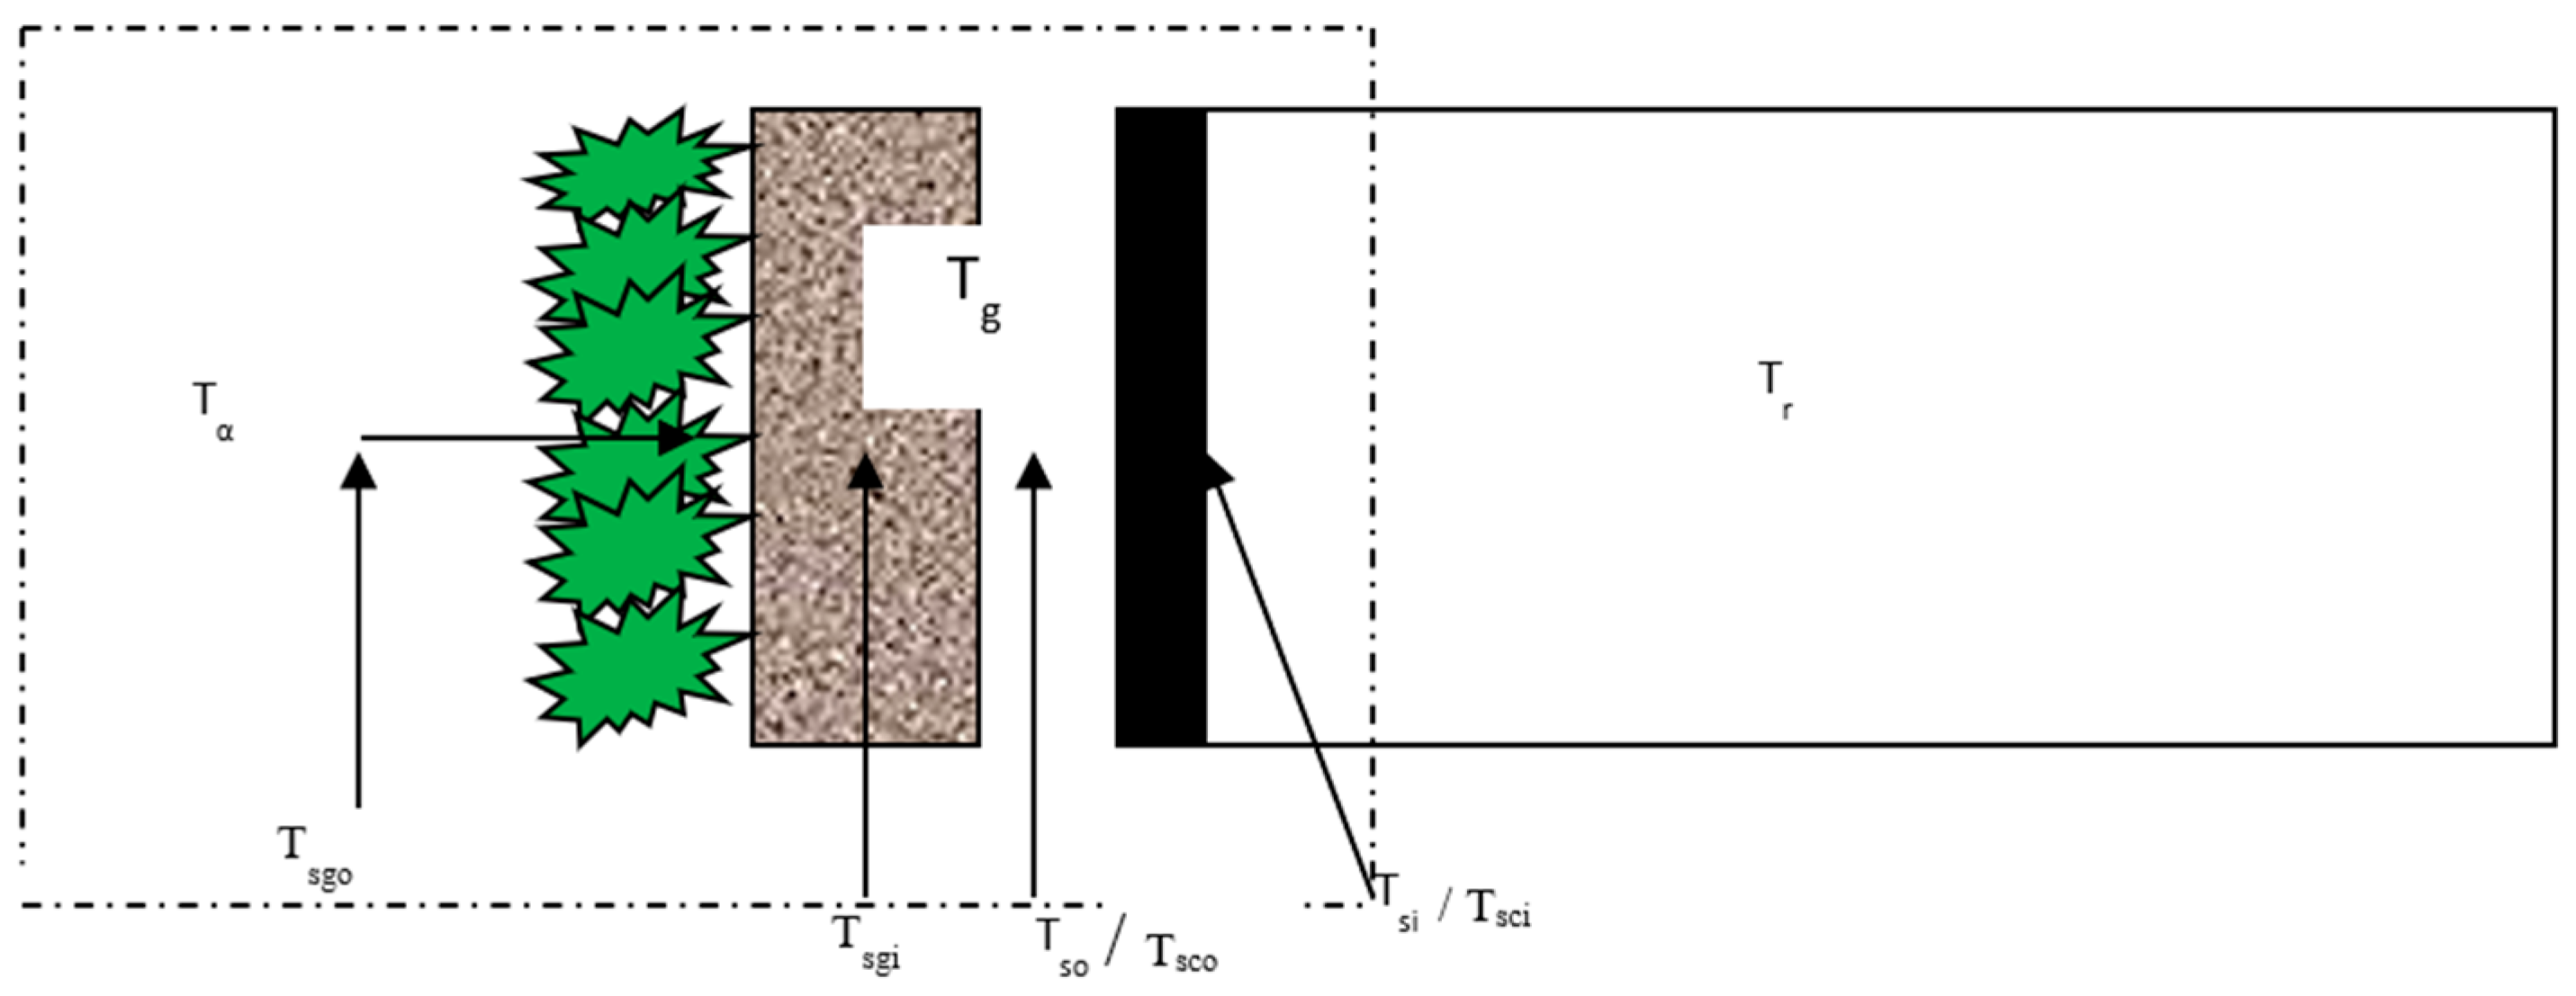
To estimate internal wall temperatures, a thermodynamic model was developed and validated against experimental data. The model considers convective and conductive heat transfer through the living wall, air gap, and building wall. Simplifying assumptions include negligible thermal resistance of thin steel walls and steady-state heat transfer conditions. A schematic diagram of the living and building walls is shown in Figure 8.
Figure 8.
Thermodynamic transfer through living wall and a building wall.
The governing Equations (24)–(28) describe heat transfer across different layers of the building envelope. The model assumes the living wall to have a gap of 50 mm–100 mm and therefore the experimental living wall was placed 50 mm away. The current model is:
h × (Tα − Tsgo) + Ug × (Tsgo − Tsgi) + Ua × (Tl − Tsgi) + h × (Tg − Tso) + Us × (Tso − Tsi) = h × (Tsi − Tr)
As steel thickness was 1 mm for the experimental set up, we consider Tso = Tsi and the equation for steel wall becomes:
h × (Tα − Tsgo) + Ug × (Tsgo − Tsgi) + Ua × (Tl − Tsgi) + h × (Tl − Tsi) = h × (Tsi − Tr)
Tsi = [h × (Tα − Tsgo) + Ug × (Tsgo − Tsgi) + Ua × (Tl − Tsgi) + h × Tl + h × Tr]/2 h
Tsi = [h × (Tα − Tsgo) + Ug × (Tsgo − Tsgi) + Ua × (Tl − Tsgi) + h × Tl + h × Tr]/2 h
Then, the model for the concrete wall is:
hx (Tα − Tsgo) + Ug × (Tsgo − Tsgi) + Ua × (Tl − Tsgo) + Uc × (Tsco − Tsci) = h × (Tsci − Tr)
Tsci = [h × (Tα − Tsgo) + Ul × (Tsgo − Tsgi) + Ua × (Tsco − Tsgo) + Uc × Tsco + h × Tr]/(Uc + h)
Tsci = [h × (Tα − Tsgo) + Ul × (Tsgo − Tsgi) + Ua × (Tsco − Tsgo) + Uc × Tsco + h × Tr]/(Uc + h)
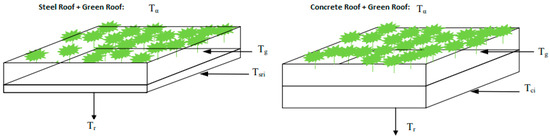
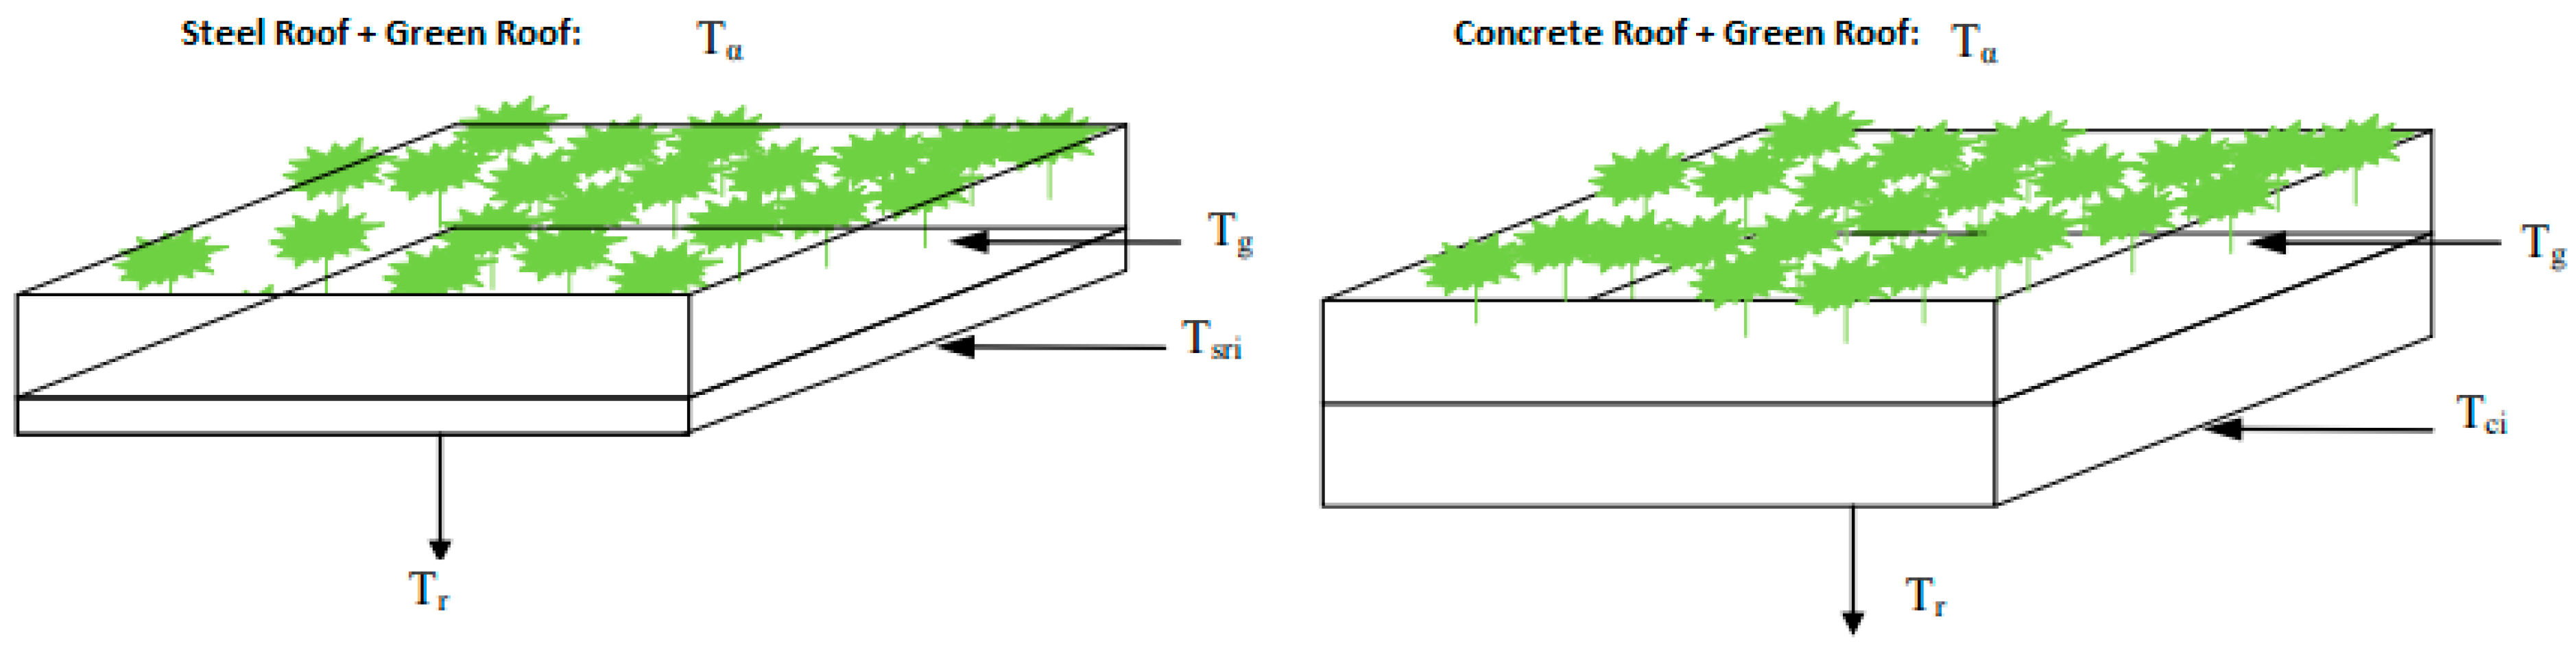
Similarly, the model for the internal surface temperature of steel roof and concrete roof with a green roof was proposed and compared with the experimental results. The schematic diagram of both the steel and concrete roof with green cover is given in Figure 9.
Figure 9.
Steel roof and concrete roof, both with green roof cover.
The model for the steel roof with green roof is:
h × (Tα − Tg) + Ut × (Tg − Tsri) = h × (Tsri − Tr)
Tsri = [h × (Tα − Tg) + Ut × Tg + h × Tr]/(Ut + h)
Tsri = [h × (Tα − Tg) + Ut × Tg + h × Tr]/(Ut + h)
The model for the concrete roof with green roof:
Tci = [(h × (Tα − Tg)) + Ut × Tg + h × Tr]/(h + Ut)
It should be noted that the current model does not explicitly incorporate the following:
- Solar radiation variability;
- Wind-induced convective heat transfer;
- Humidity and evapotranspiration effects.
These factors may influence the accuracy of the model and are identified as areas for future improvement.
3. Results
The experimental data were collected over two seasons, spring (14 October–17 November) and summer (16 February–9 March). The data were analysed under the following three scenarios—(1) the living wall (2) the green roof, and (3) the combination of both. The performance of green elements was compared with a control shed (without green elements) to evaluate their effectiveness under identical environmental conditions.
3.1. Living Wall
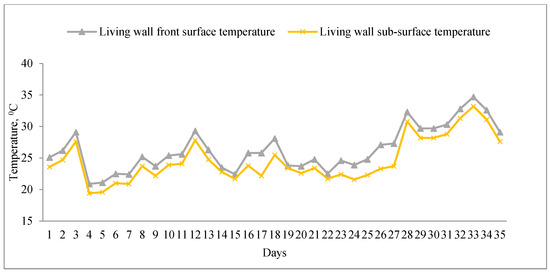
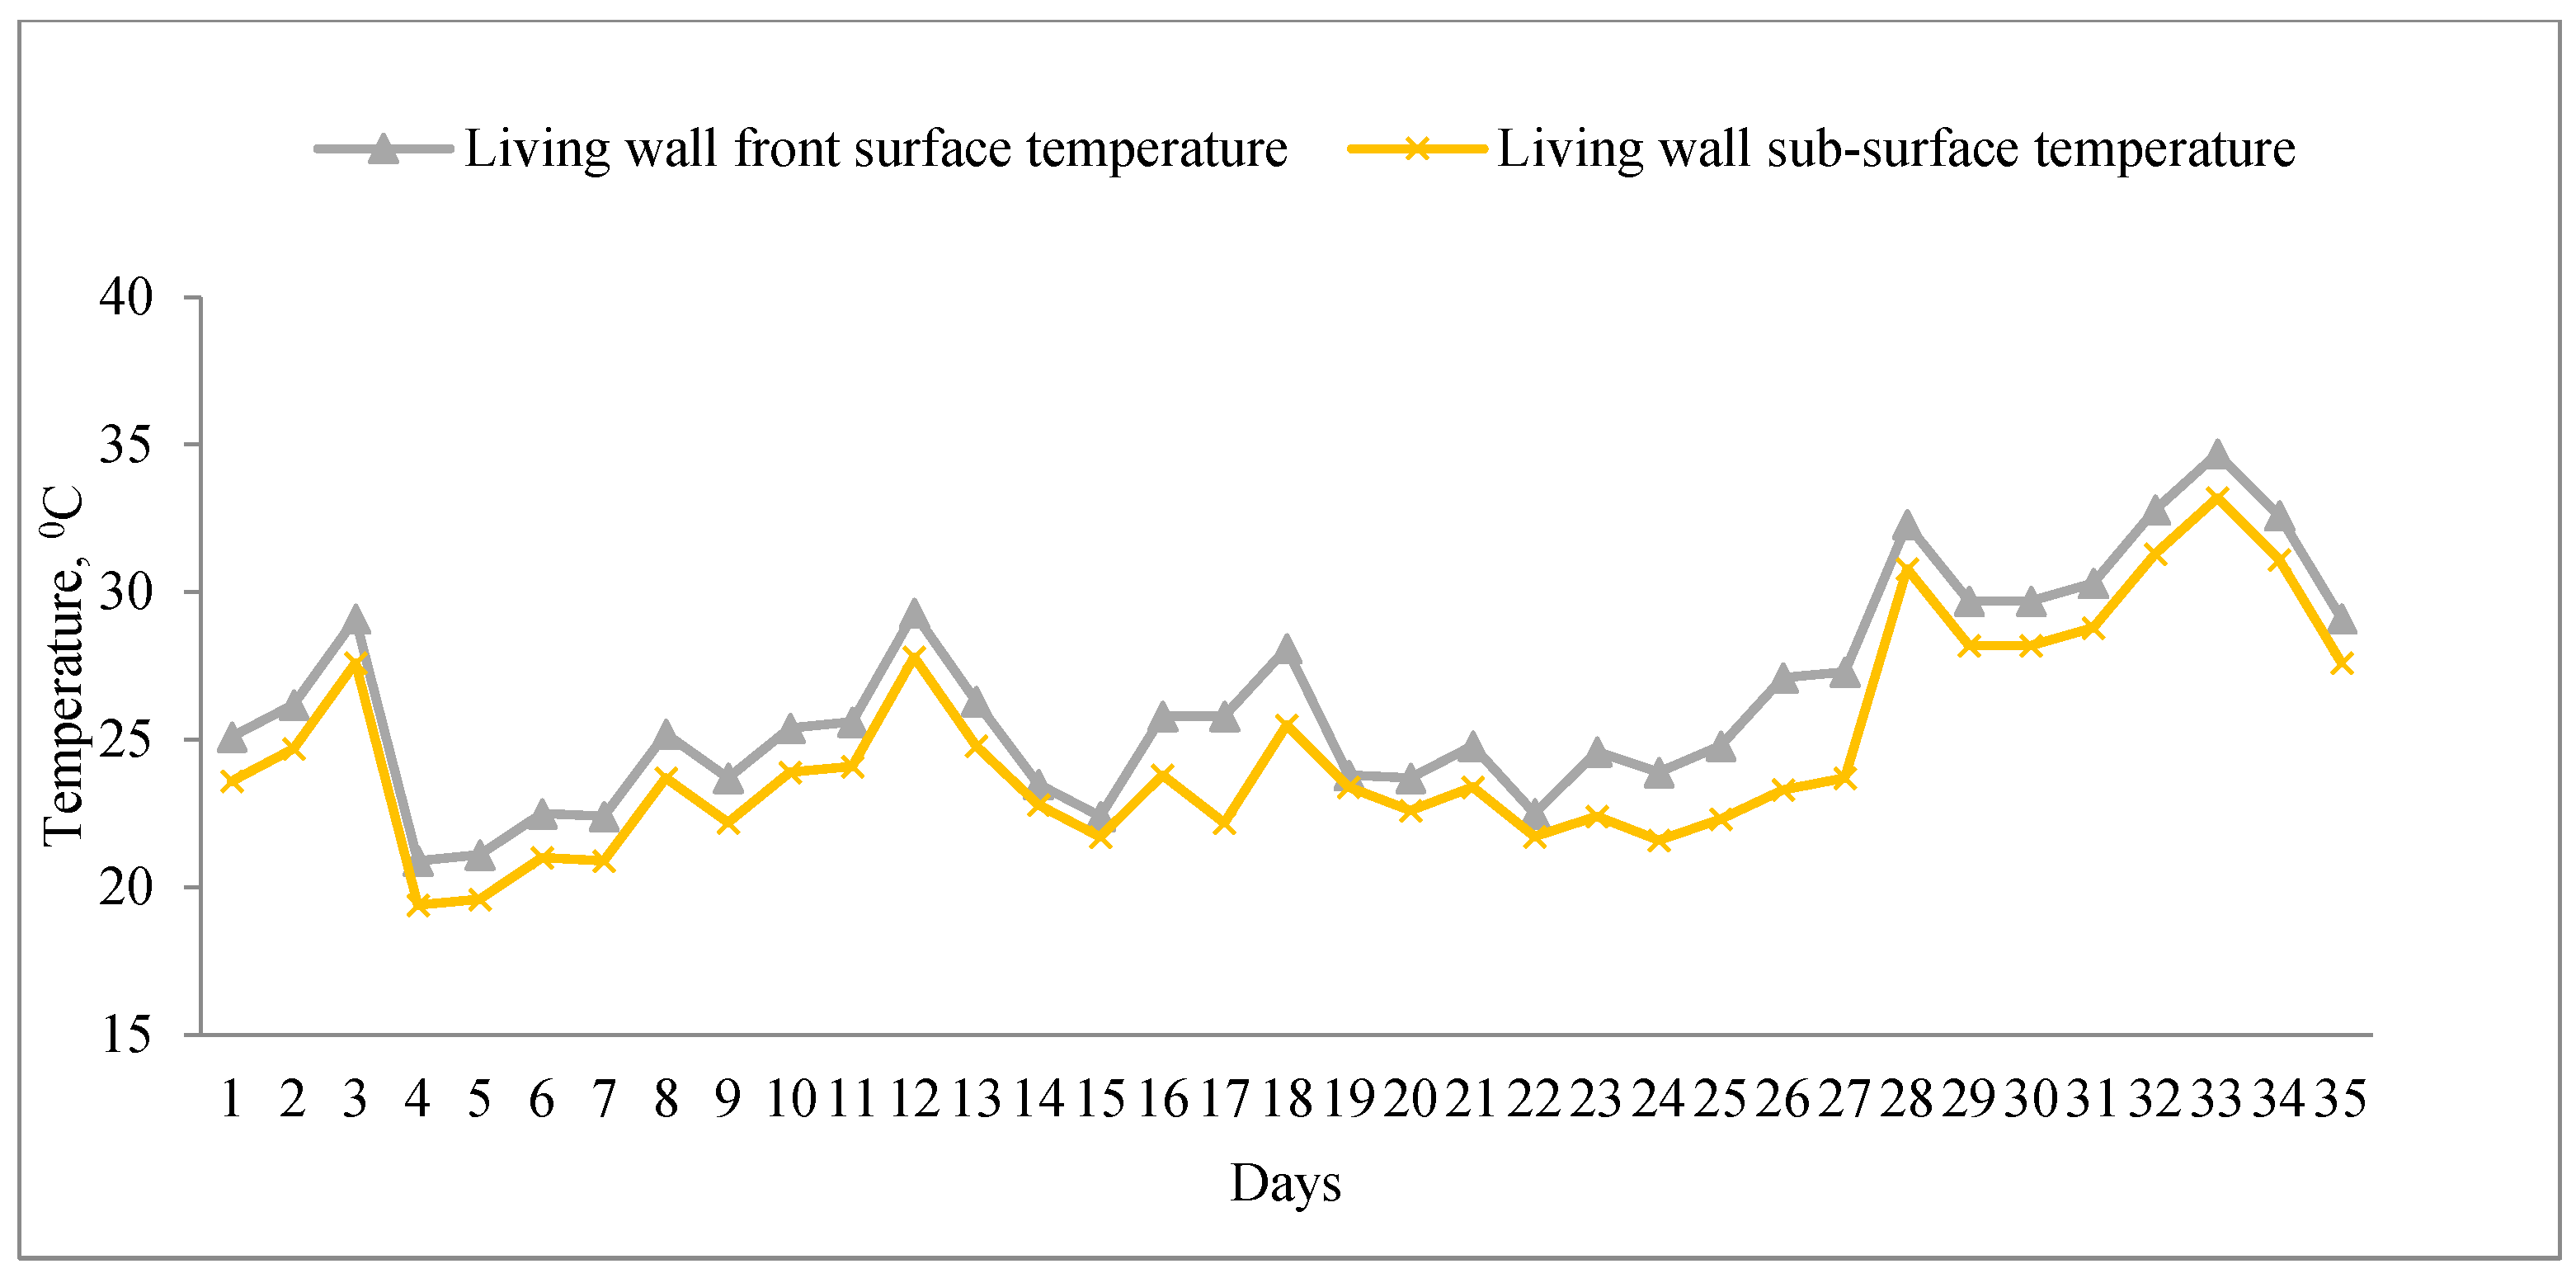
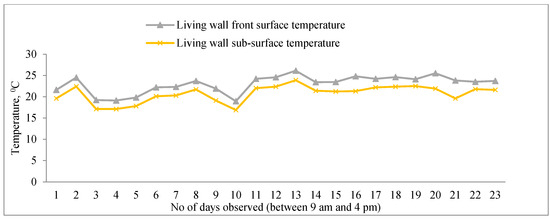
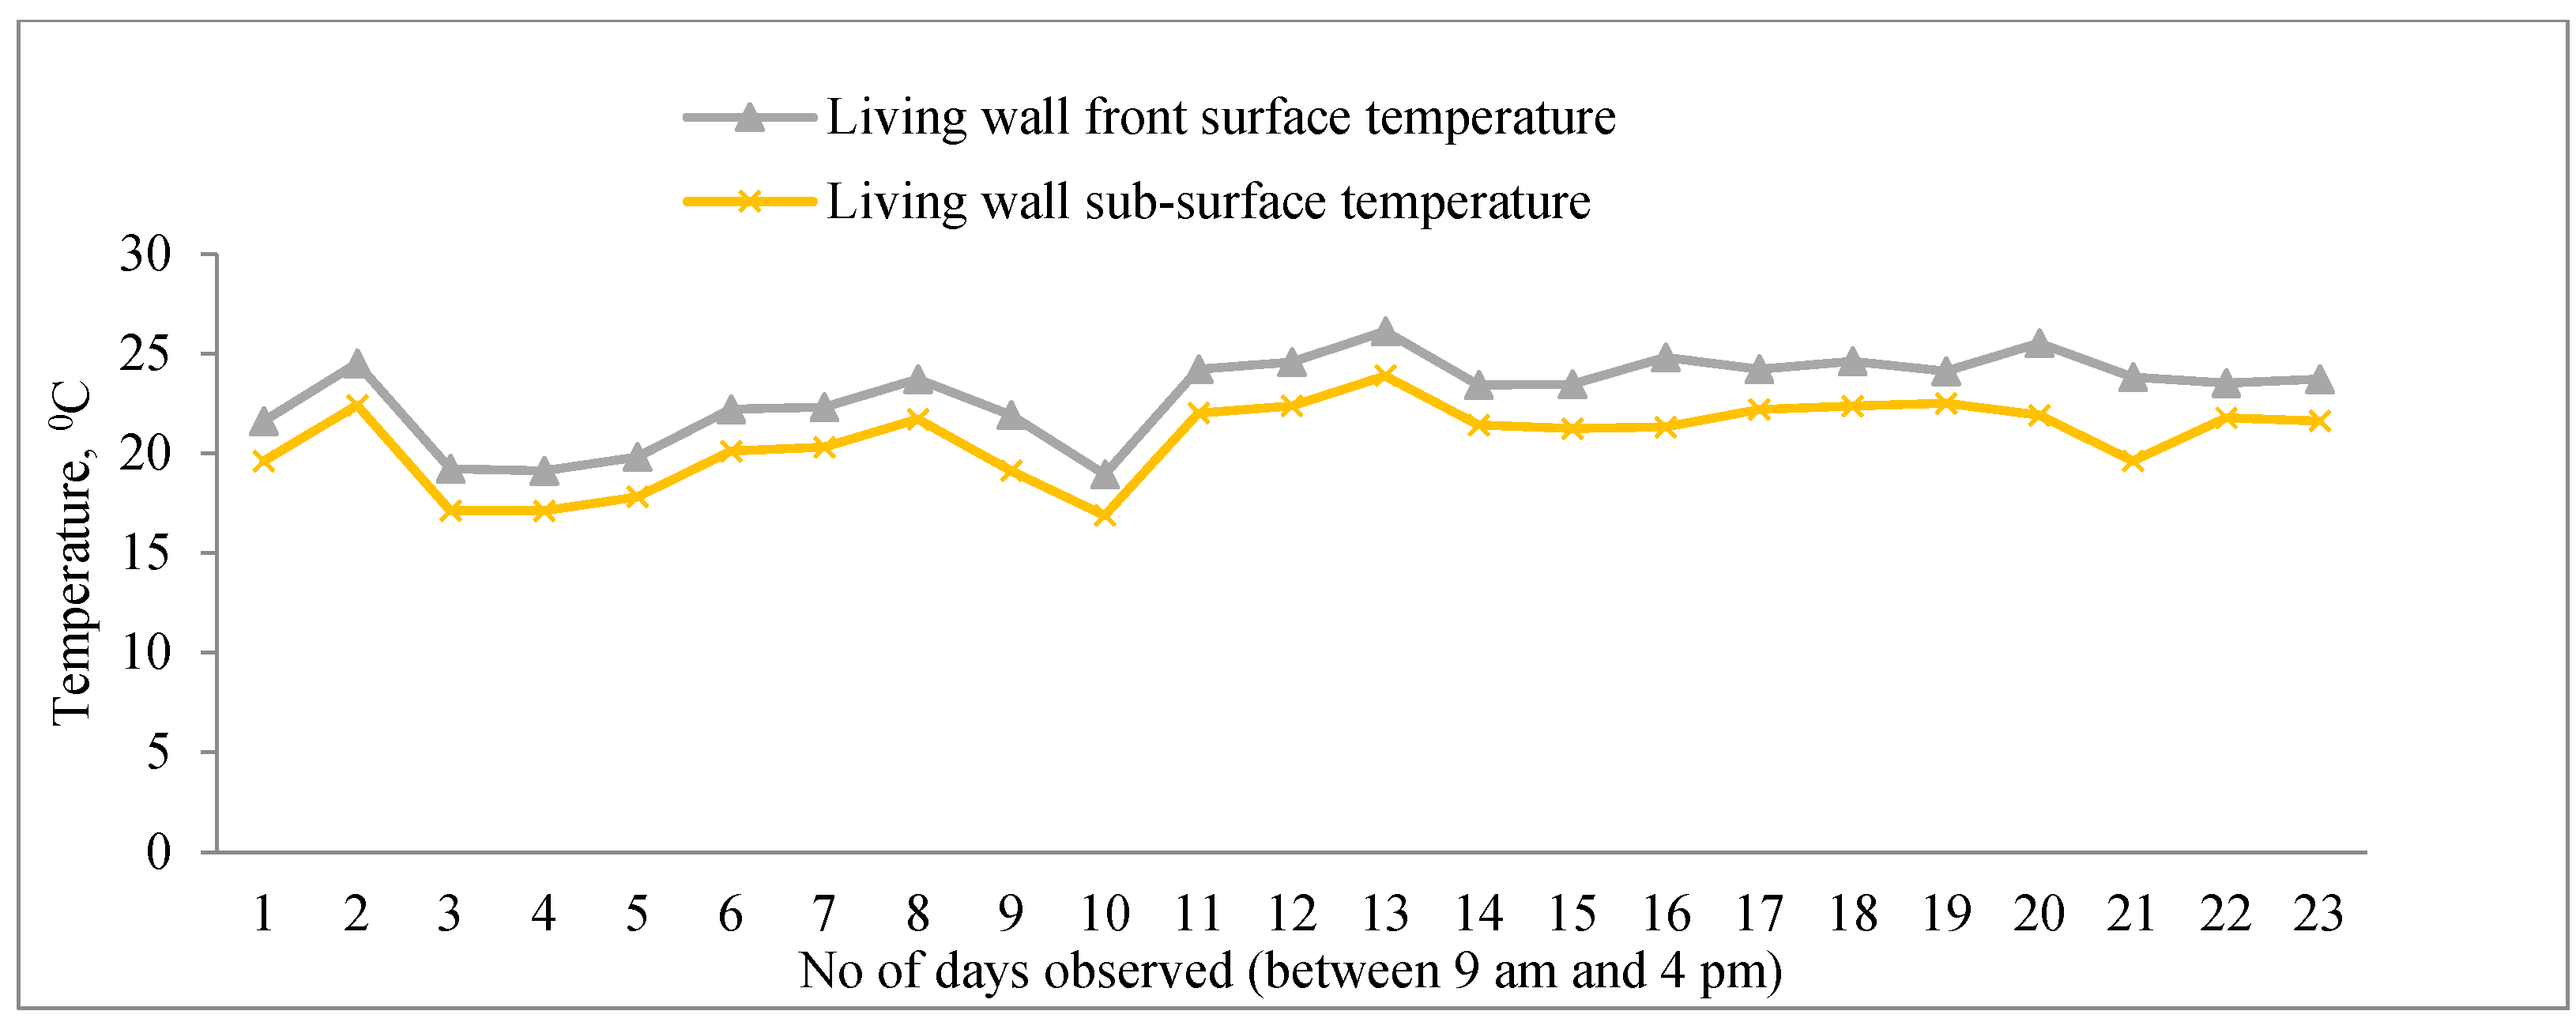
The temperature variation between the two sides of the living wall—one exposed to direct solar radiation, and the other facing the steel shed during the spring and summer—is presented in Figure 10 and Figure 11 respectively.
Figure 10.
Peak temperature variation in front surface and sub-surface of living wall (14 October–17 November).
Figure 11.
Peak temperature variation in front and sub-surface of living wall (16 February–9 March).
The sub-surface of the living wall evidently showed a lower temperature, as was expected. For the spring months the maximum temperature difference between the surfaces was 3.8 °C, with a minimum value of 0.5 °C and the standard deviation of 1.6 °C. For the summer months, the maximum temperature change on any given day was 3.5 °C, and the standard deviation was around 2 °C. This temperature attenuation demonstrates the insulating and evaporative cooling effects of the vegetation layer, which reduces heat transfer into the building envelope.
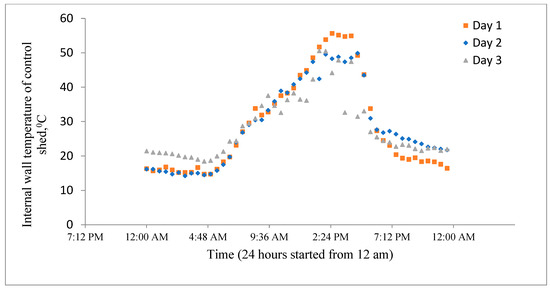
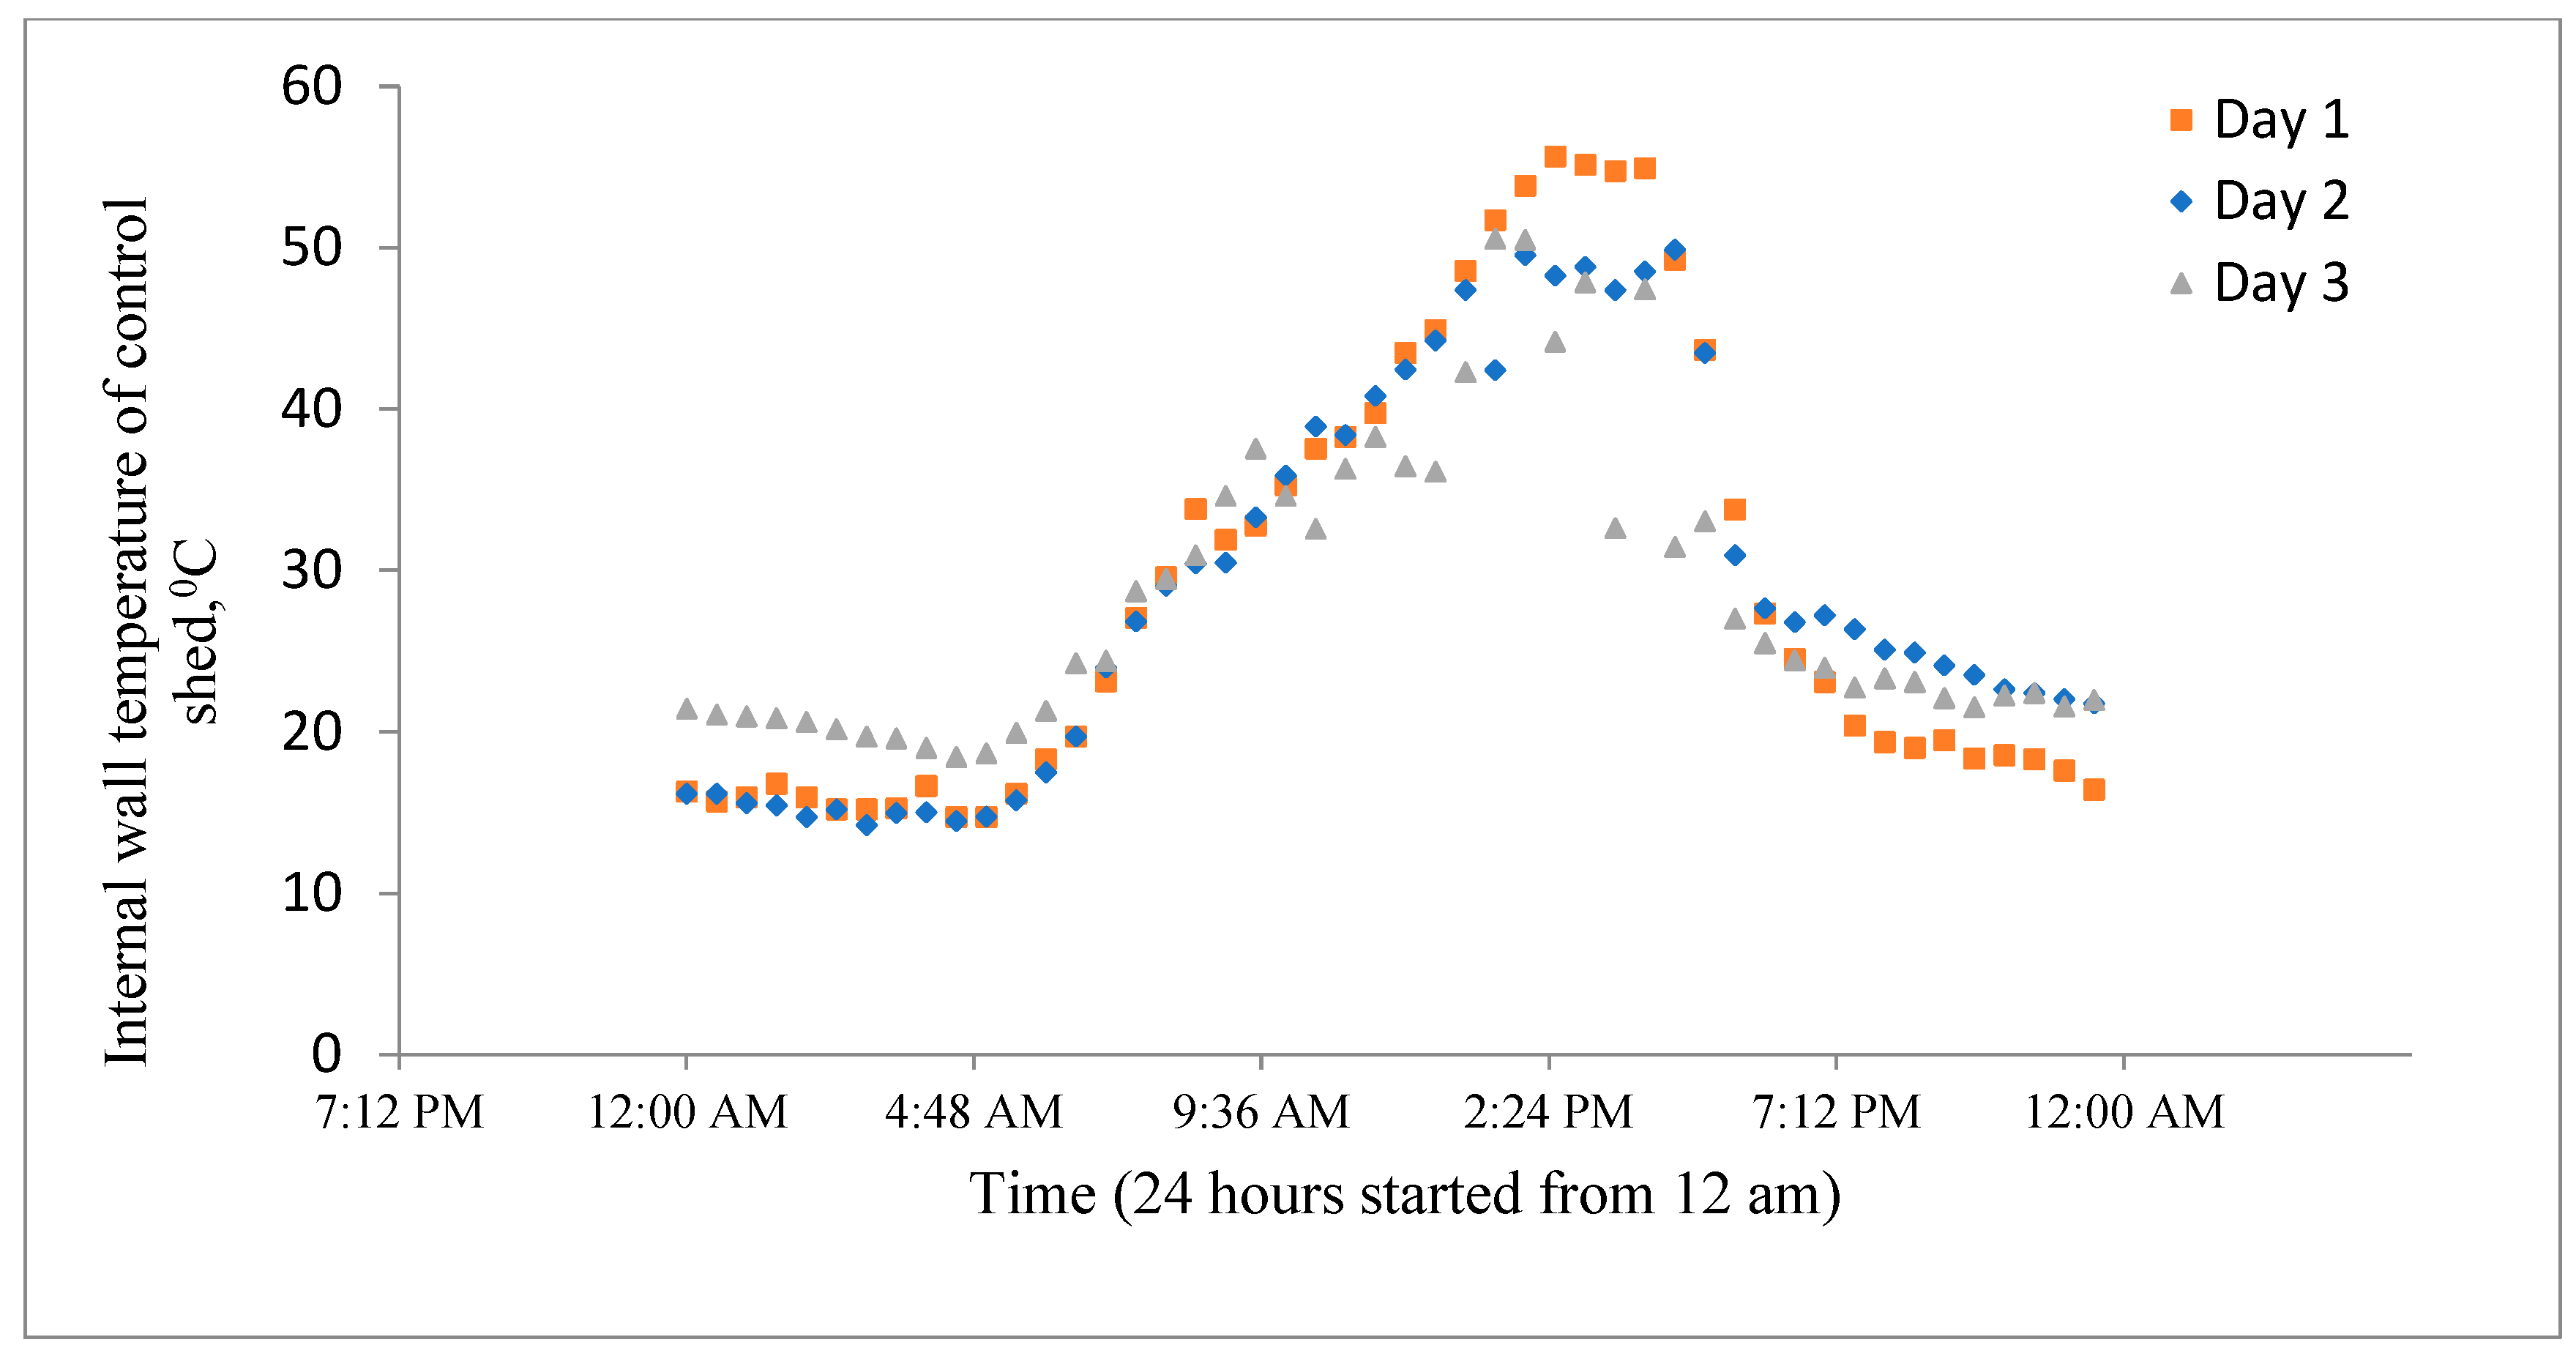
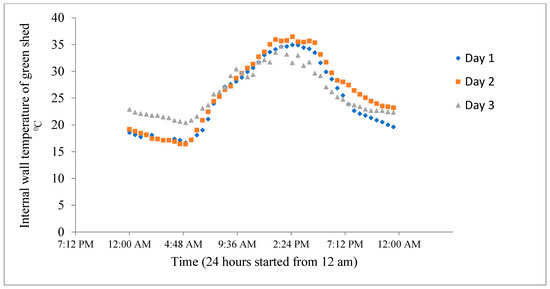
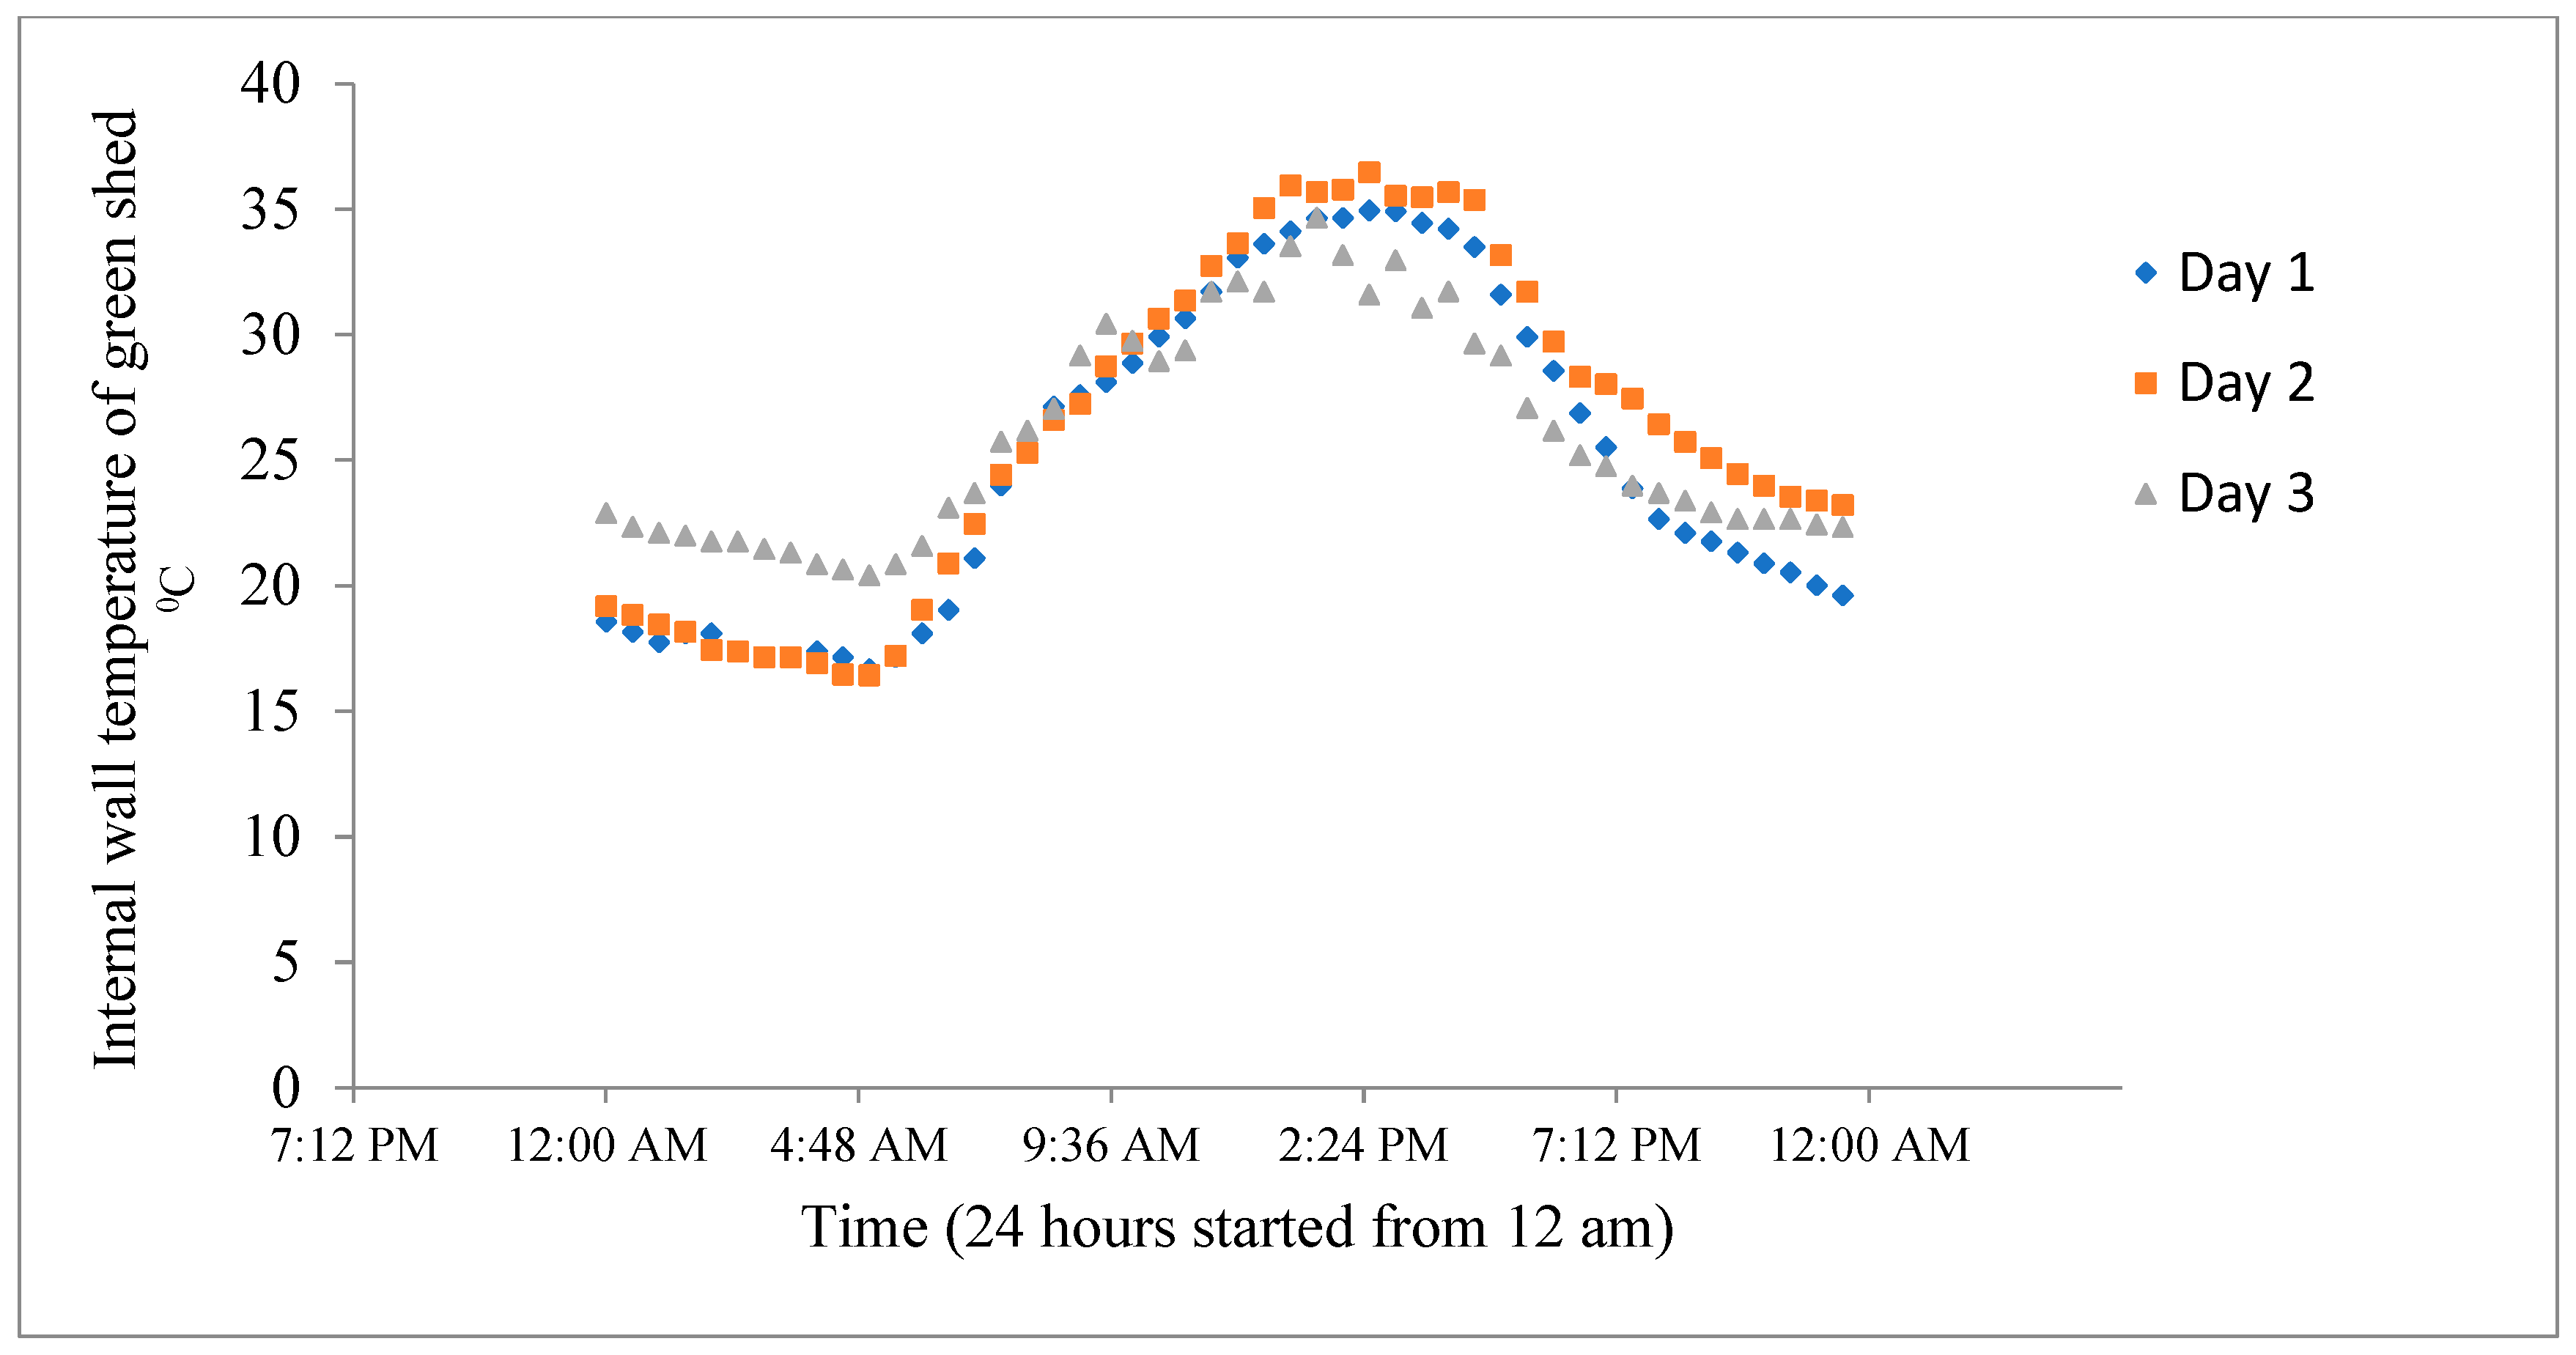
In Figure 12 and Figure 13, the changes in internal temperature of the west-facing wall for both the control and the green sheds are presented for over 3 days. The data were collected for 24 h on each day.
Figure 12.
Internal wall temperature of control shed.
Figure 13.
Internal wall temperature of green shed.
It is clearly evident from the figures that the peak temperature of west living wall was substantially lower than that without a living wall. The highest temperature recorded for the plain shed was 56 °C on day 1, whereas that for the green shed was 36 °C, which equates to 36% cooling load reduction.
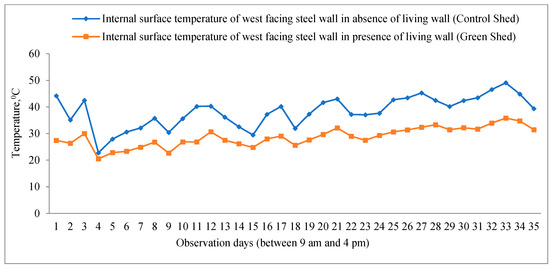
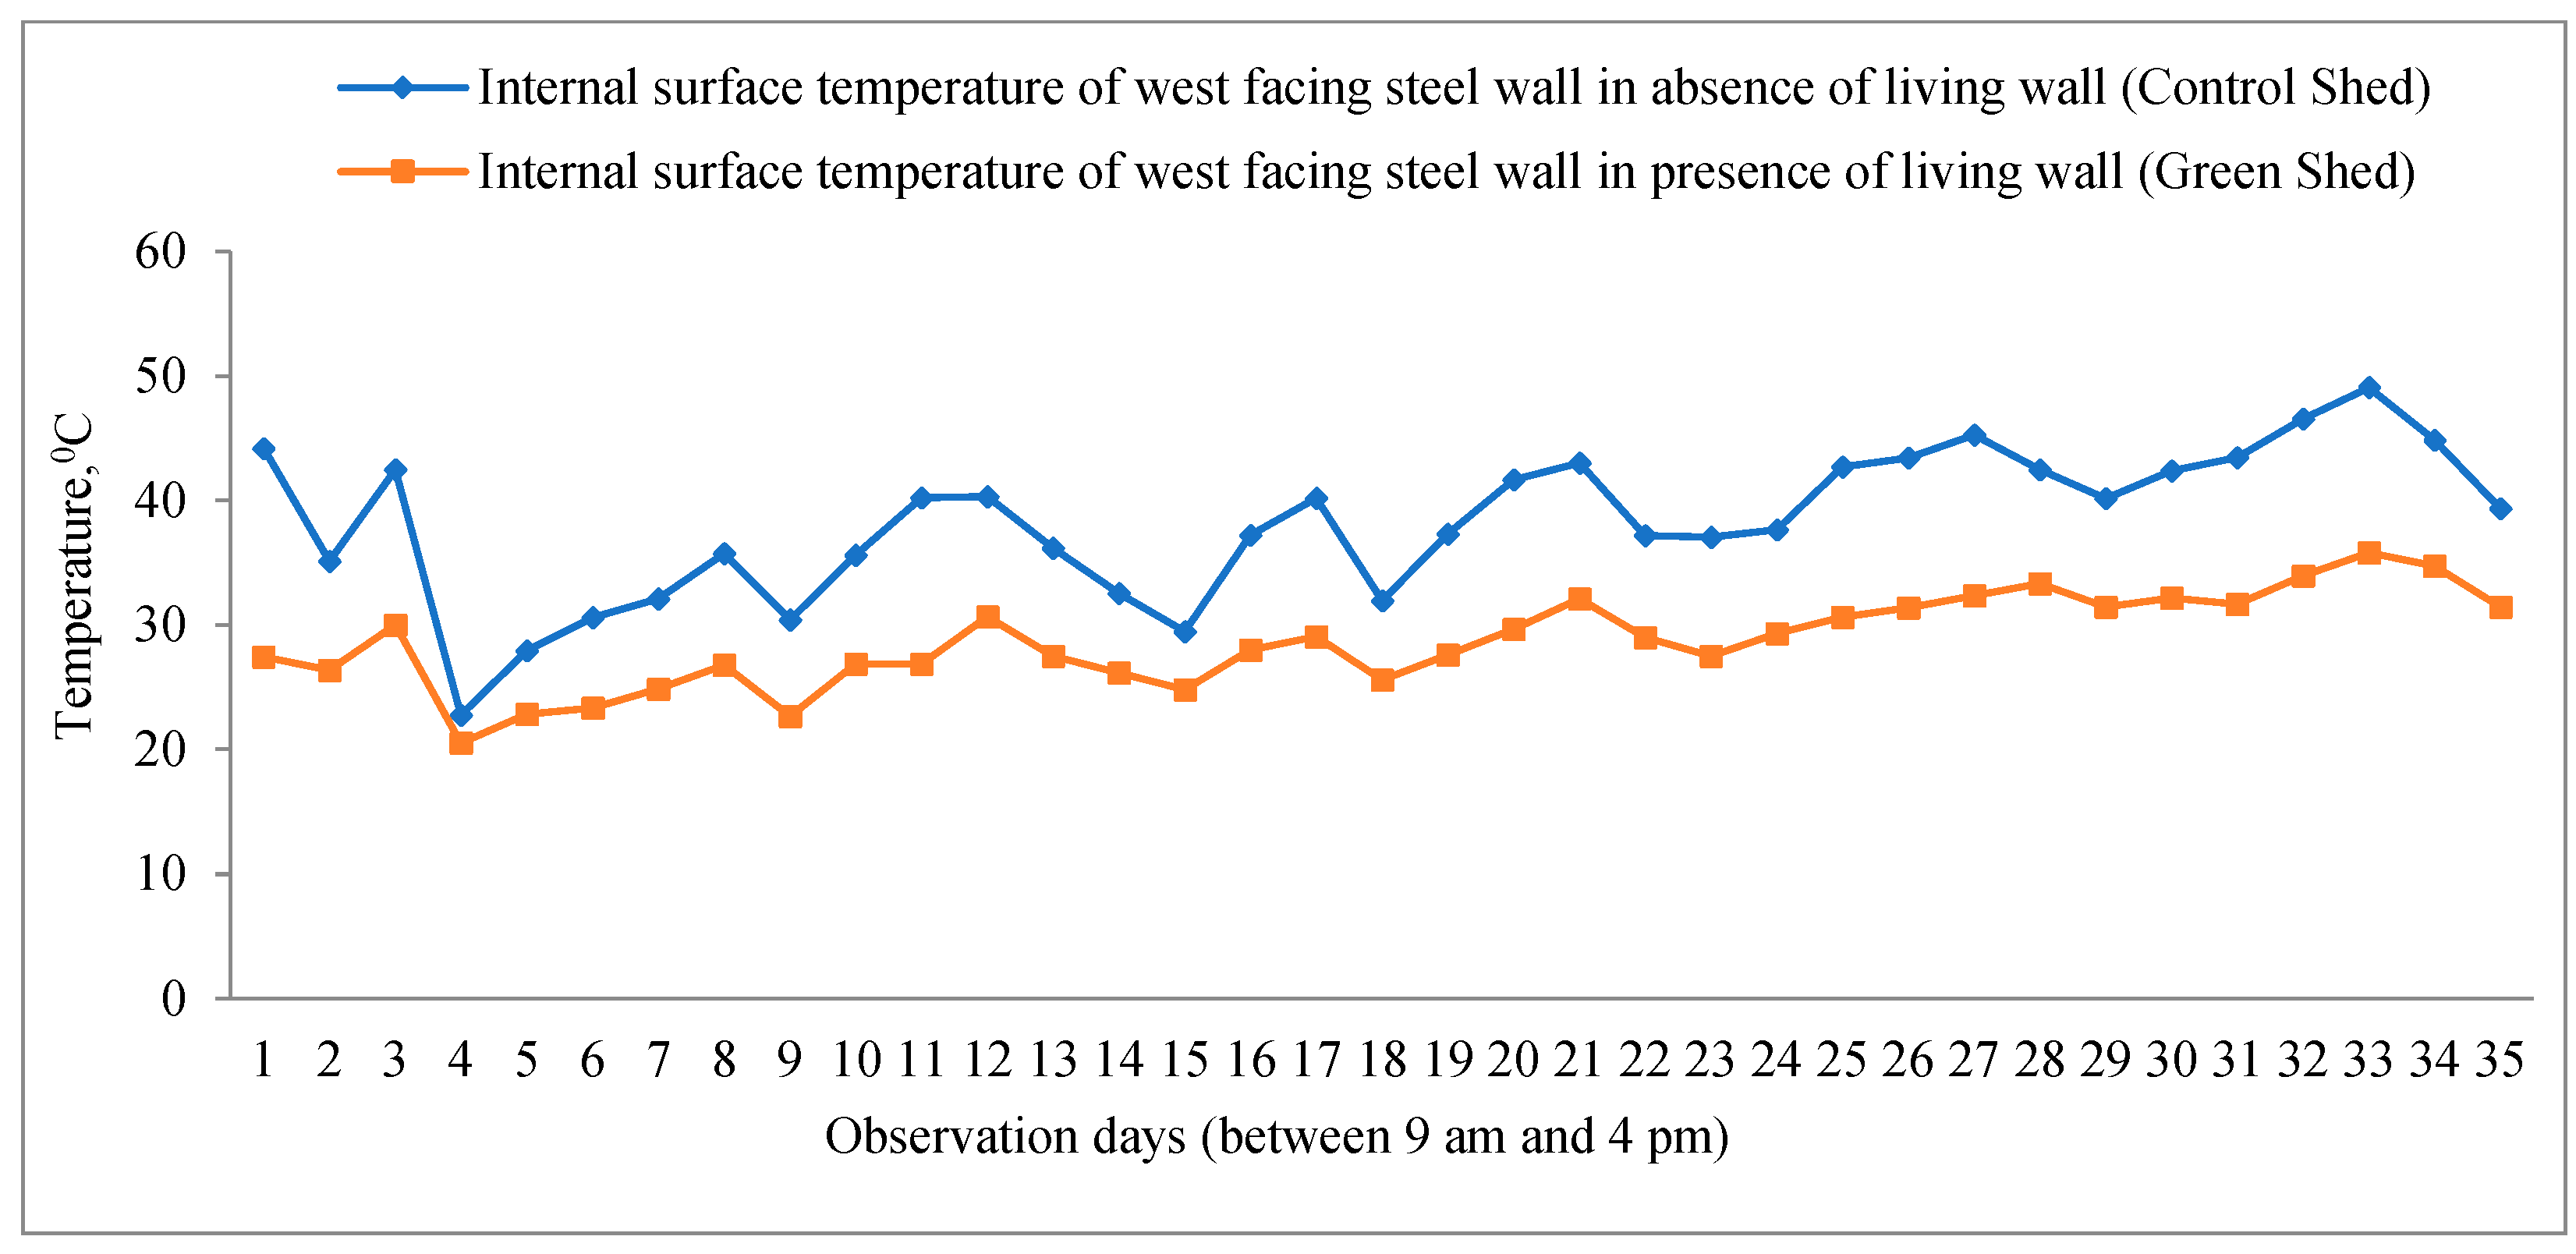
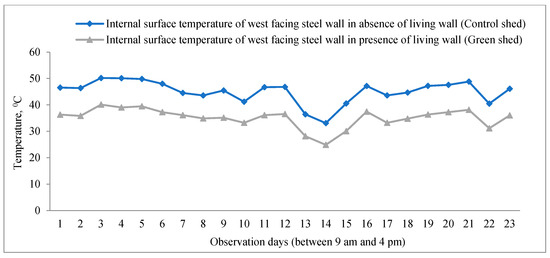
The differences in internal temperature of the west steel wall between the control and green sheds are illustrated in Figure 14 and Figure 15 for spring and summer respectively.
Figure 14.
Peak temperature variation in west-facing wall (14 October–17 November).
Figure 15.
Peak temperature variation in west-facing wall (16 February–9 March).
As can be seen from the figures, both in spring and summer, the internal temperature of the steel wall (west) is substantially higher when there is no living wall present. It was observed from Figure 14 that the average temperature difference between the green and control shed west walls was approximately 15 °C. However, for the same configuration on day 4, the temperature difference was quite small. This is because it was a cloudy day and therefore the sheds were exposed to little solar radiation on that day, as evident from weather data from 17 October. This indicates that the performance of the living wall is also dependent on solar intensity, with maximum effectiveness observed under high solar radiation conditions.
3.2. Green Roof
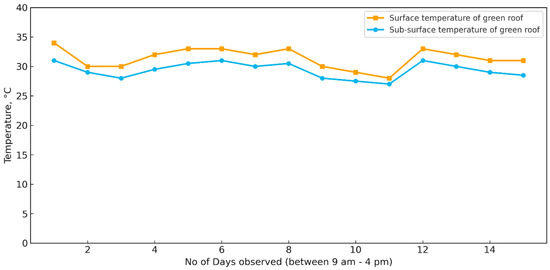
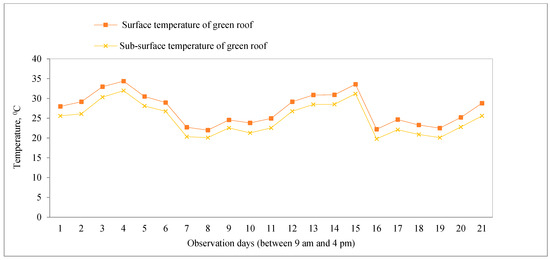
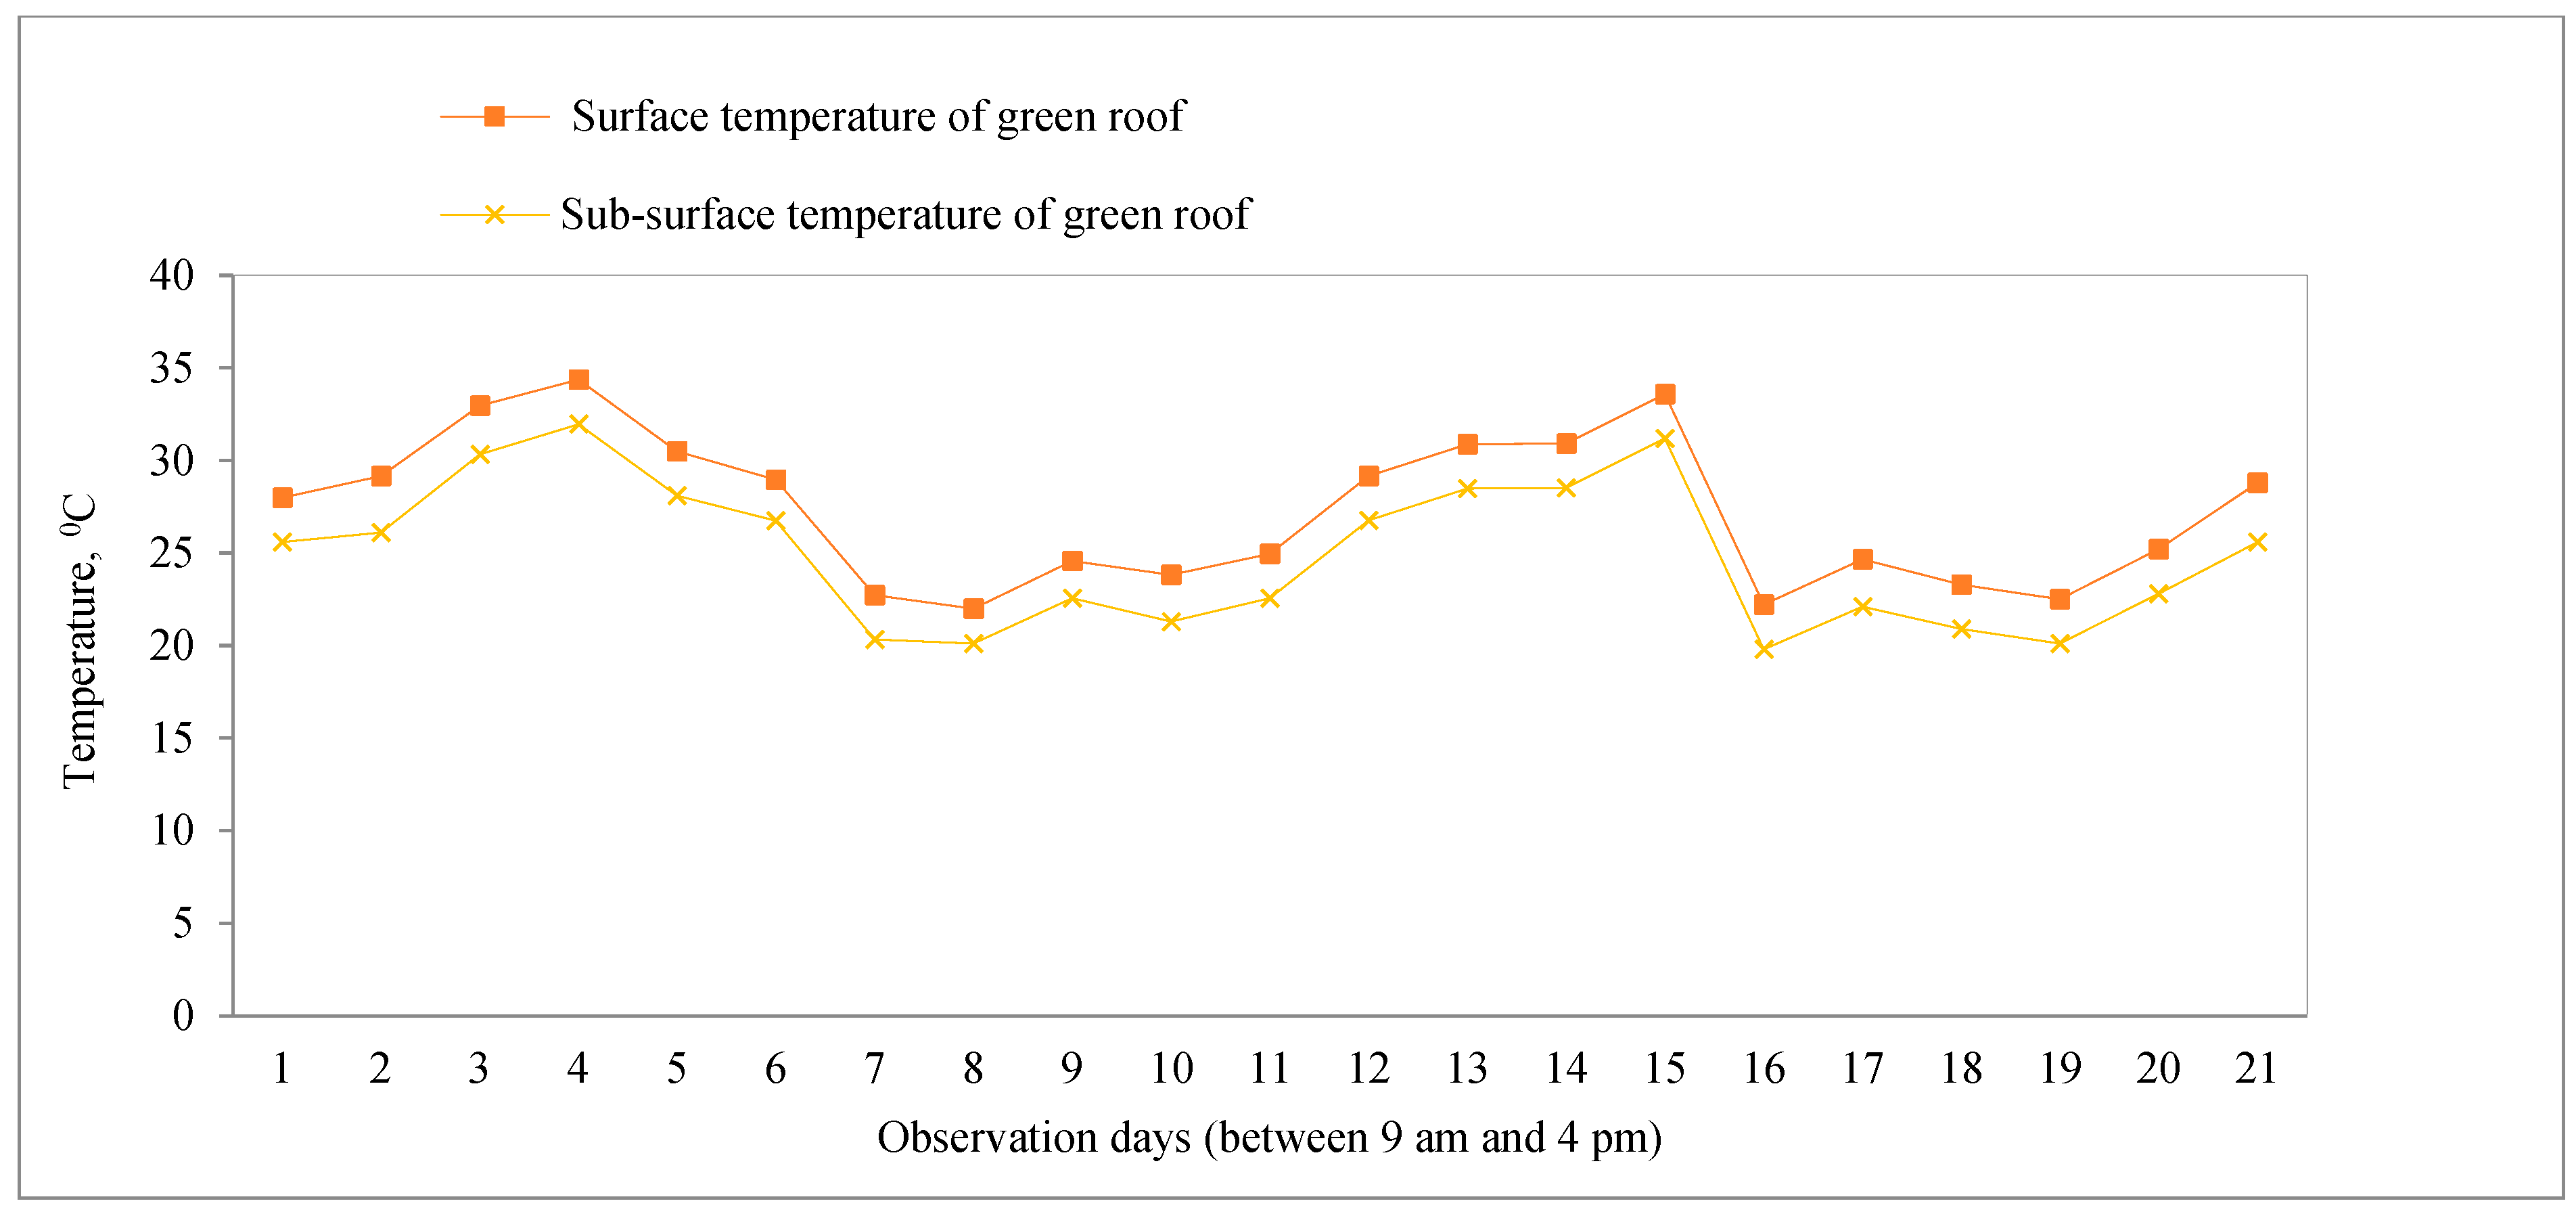
The peak temperature of the exposed surface and the sub-surface of the green roof is presented in Figure 16 and Figure 17 for spring and summer respectively. The peak temperatures were also identified for both spring and summer.
Figure 16.
Peak temperature variation in surface and sub-surface of green roof (16 November–30 November).
Figure 17.
Peak temperature variation in surface and sub-surface of green roof (16 February 2012–9 March 2012).
As expected, the top face of the roof, which received direct solar radiation, was around 10–13% hotter than the underside during the spring. For the summer/autumn months the sub-surface was about 8–10% cooler. The reduced temperature at the sub-surface confirms the role of the green roof in providing thermal insulation and reducing heat penetration into the building.
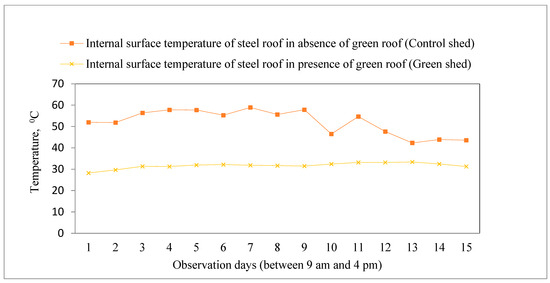
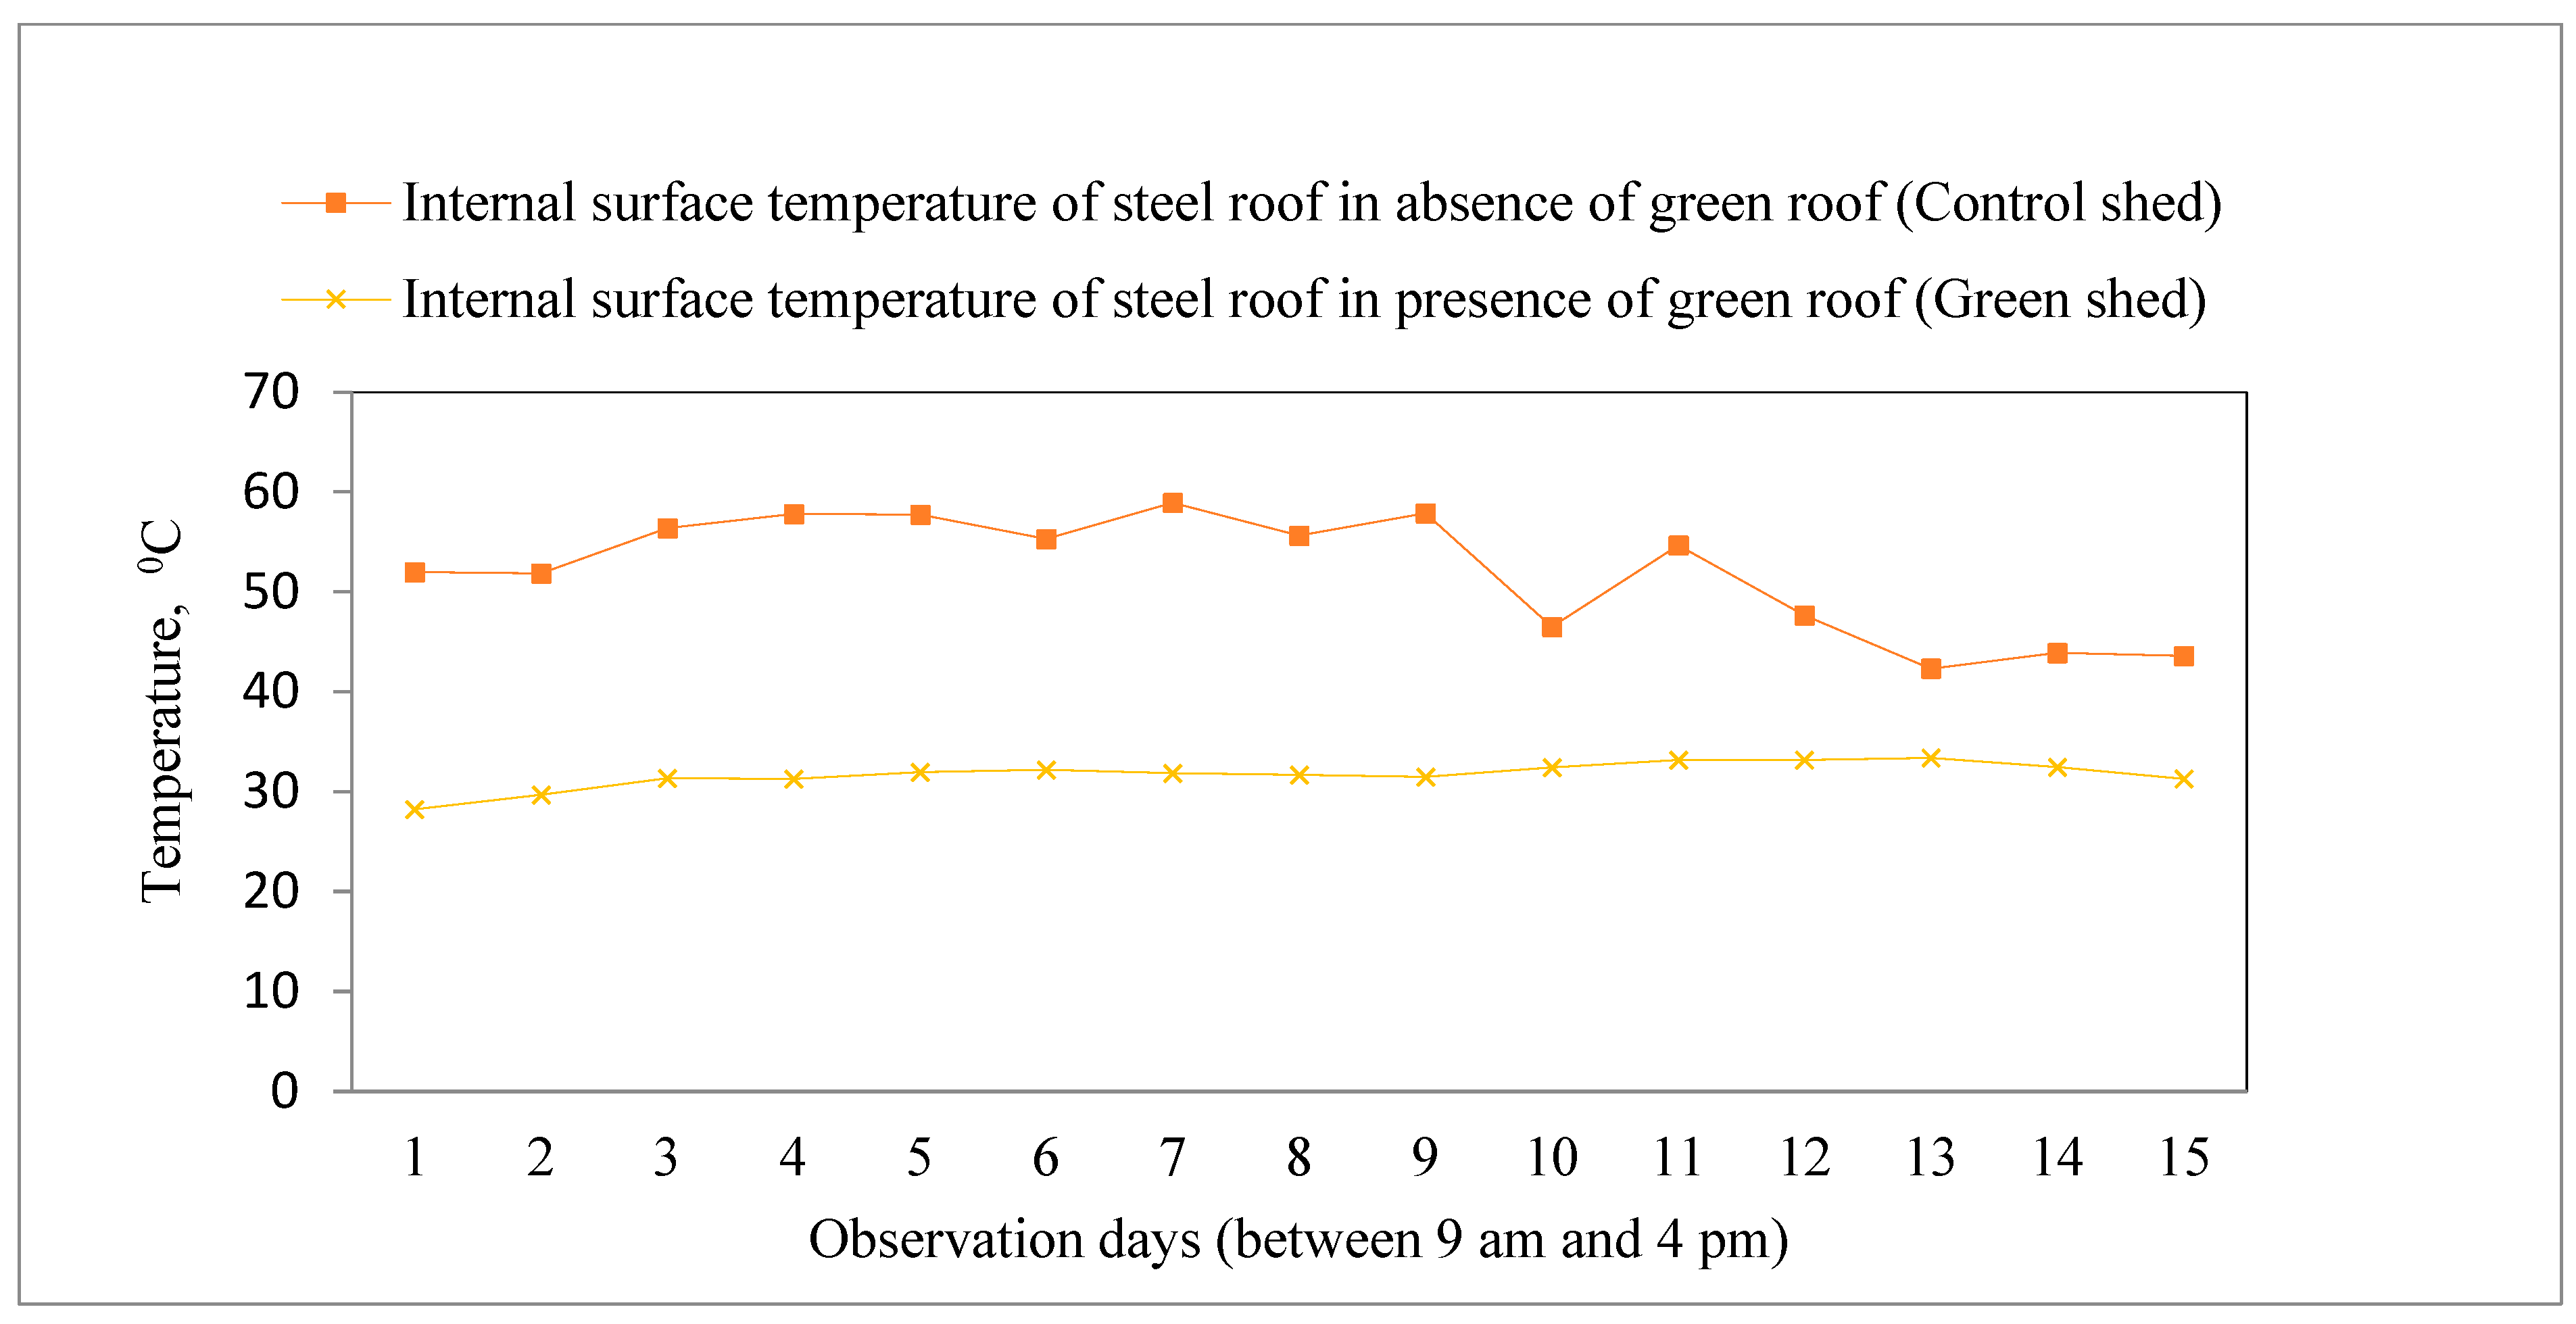
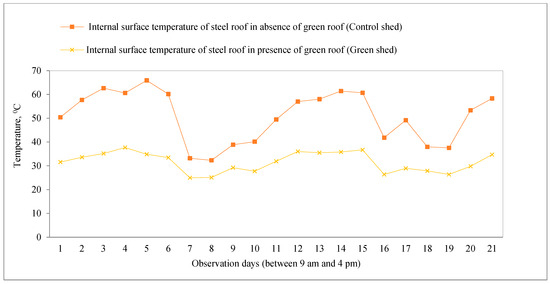
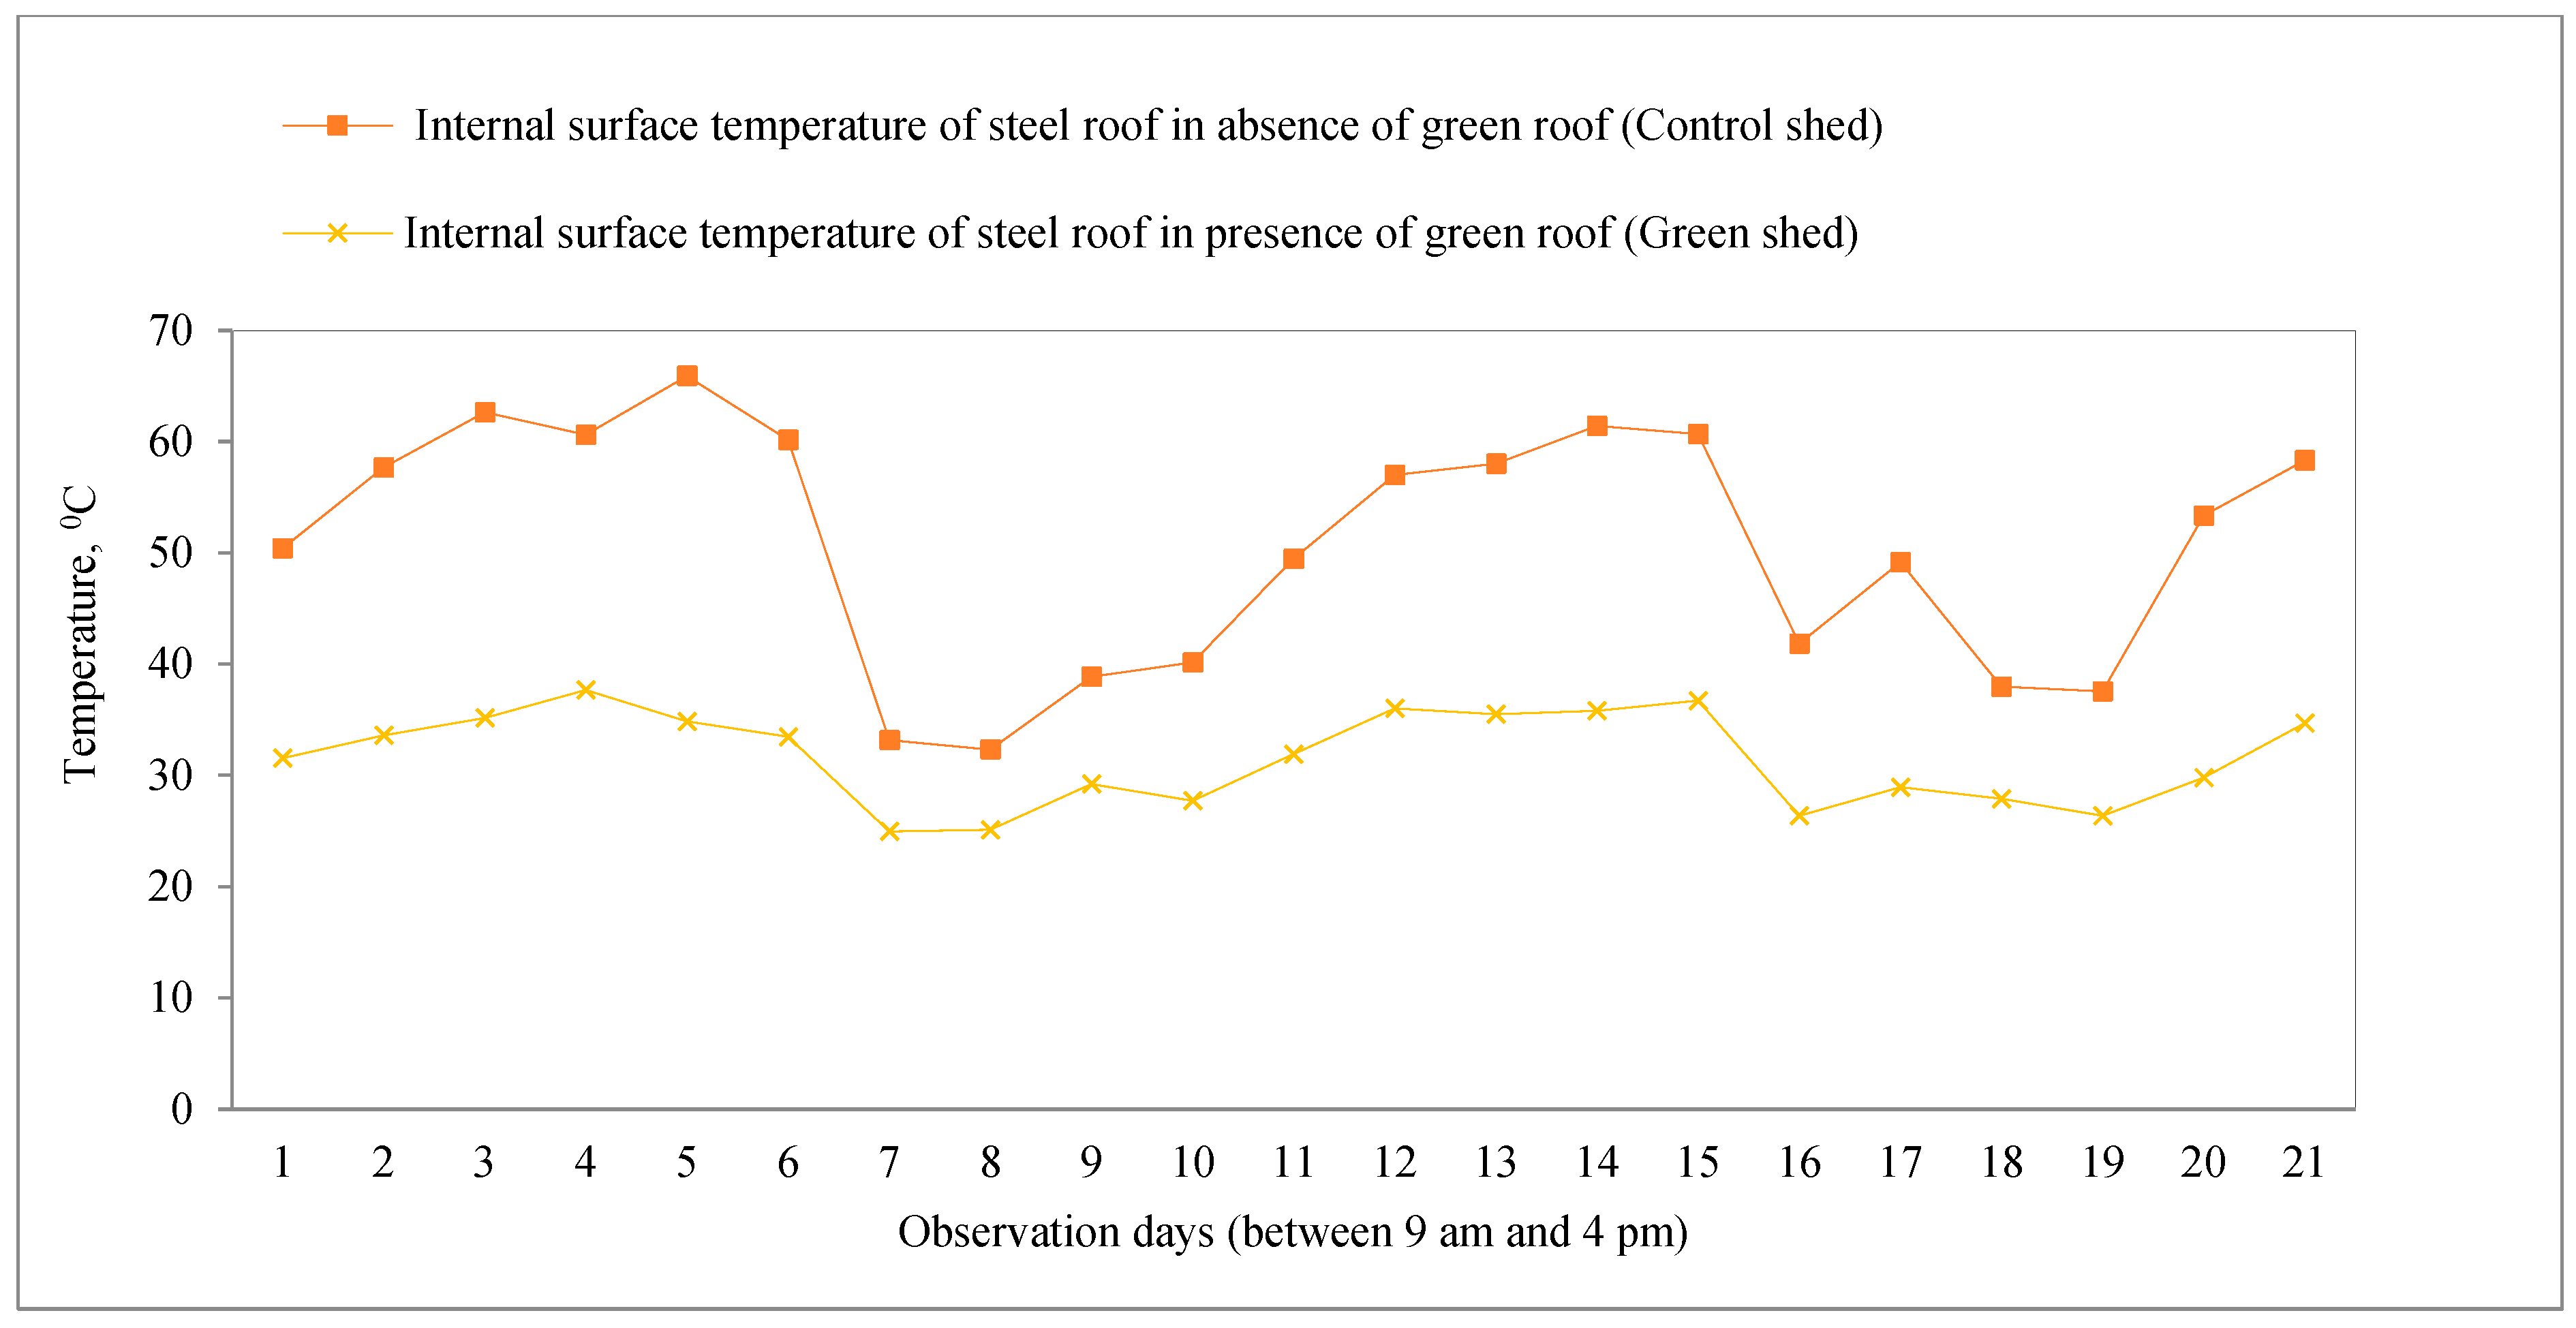
Figure 18 and Figure 19 below show the internal steel roof temperature for the control and green shed during spring and summer.
Figure 18.
Peak temperature variation in internal surface of steel roof (16 November–30 November).
Figure 19.
Peak temperature variation in internal surface of steel roof (16 February–9 March).
The internal temperature during spring was cooler in the green shed than in the plain shed by around 40%. Roughly the first 6 days were consistently around 40% cooler compared to the control shed, and in the rest of days the variation was between 10 and 40; it was hypothesised that the solar radiation might have a substantial impact on a steel shed, as steel is a good thermal conductor. Therefore, on cloudy days the peak temperatures reached in the plain shed were lower. This is evident in Figure 19, as the green shed had a rather steady peak temperature compared to that of the plain shed.
The relatively stable temperature profile observed in the green shed suggests that the green roof also moderates thermal fluctuations, thereby improving indoor thermal stability.
3.3. Combined System (Living Wall + Green Roof)
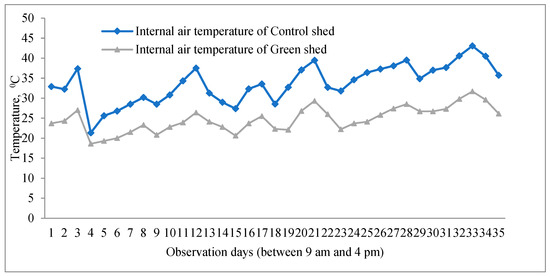
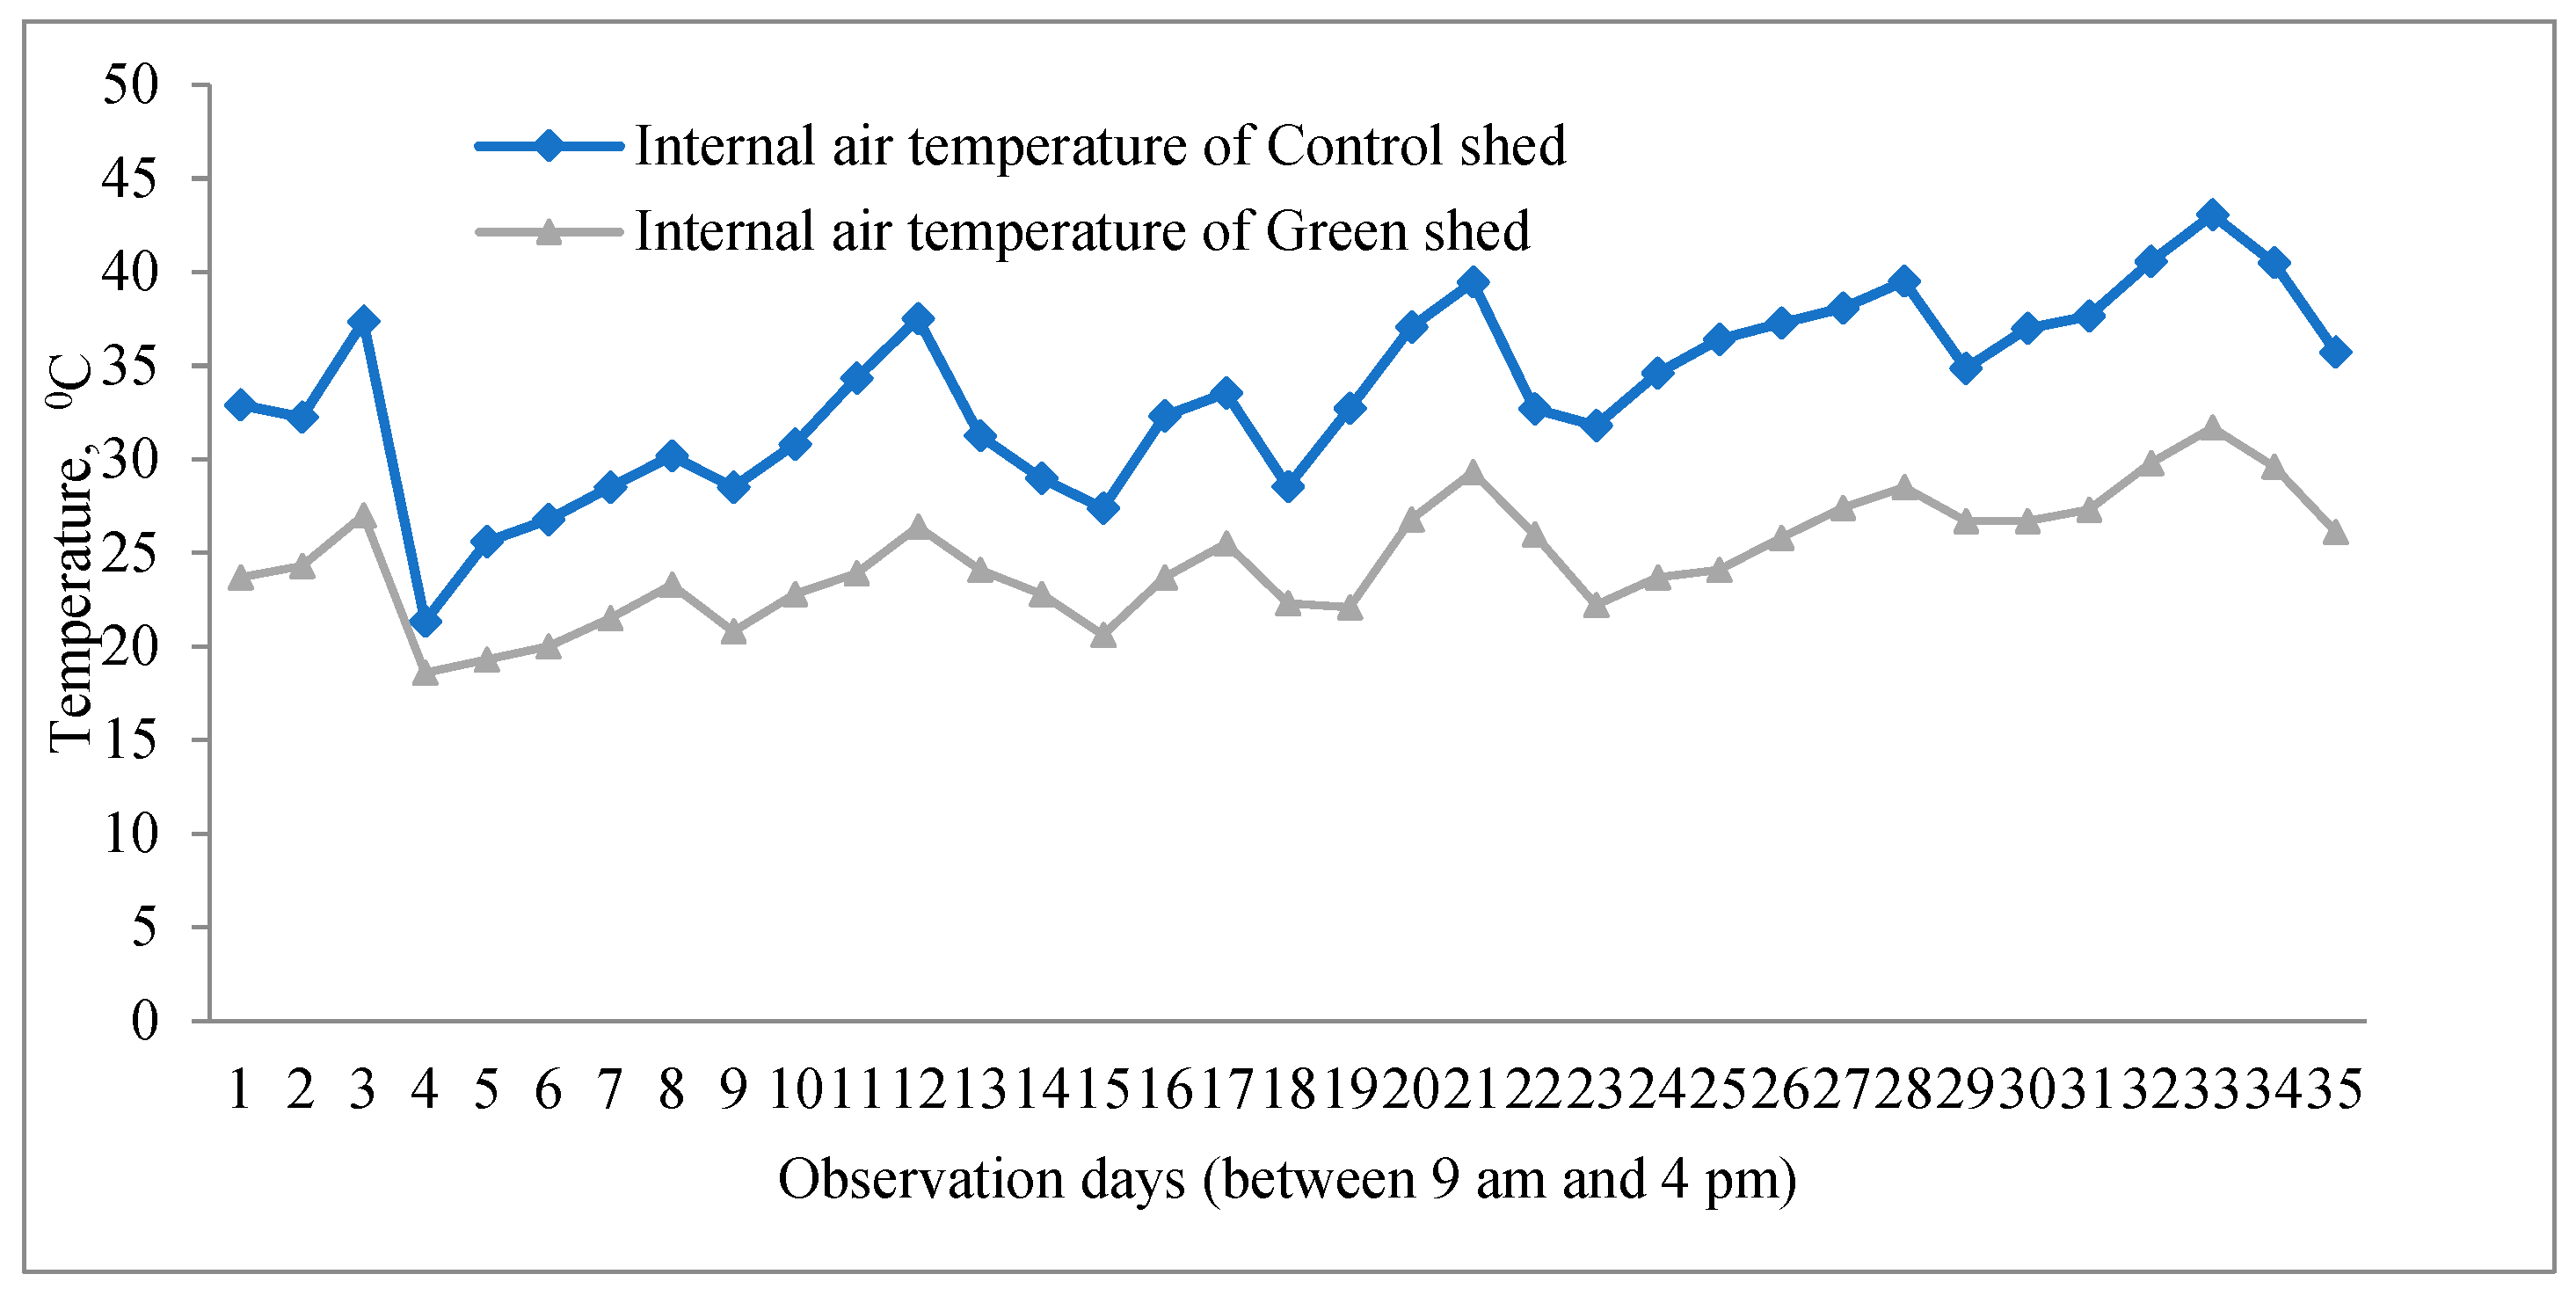
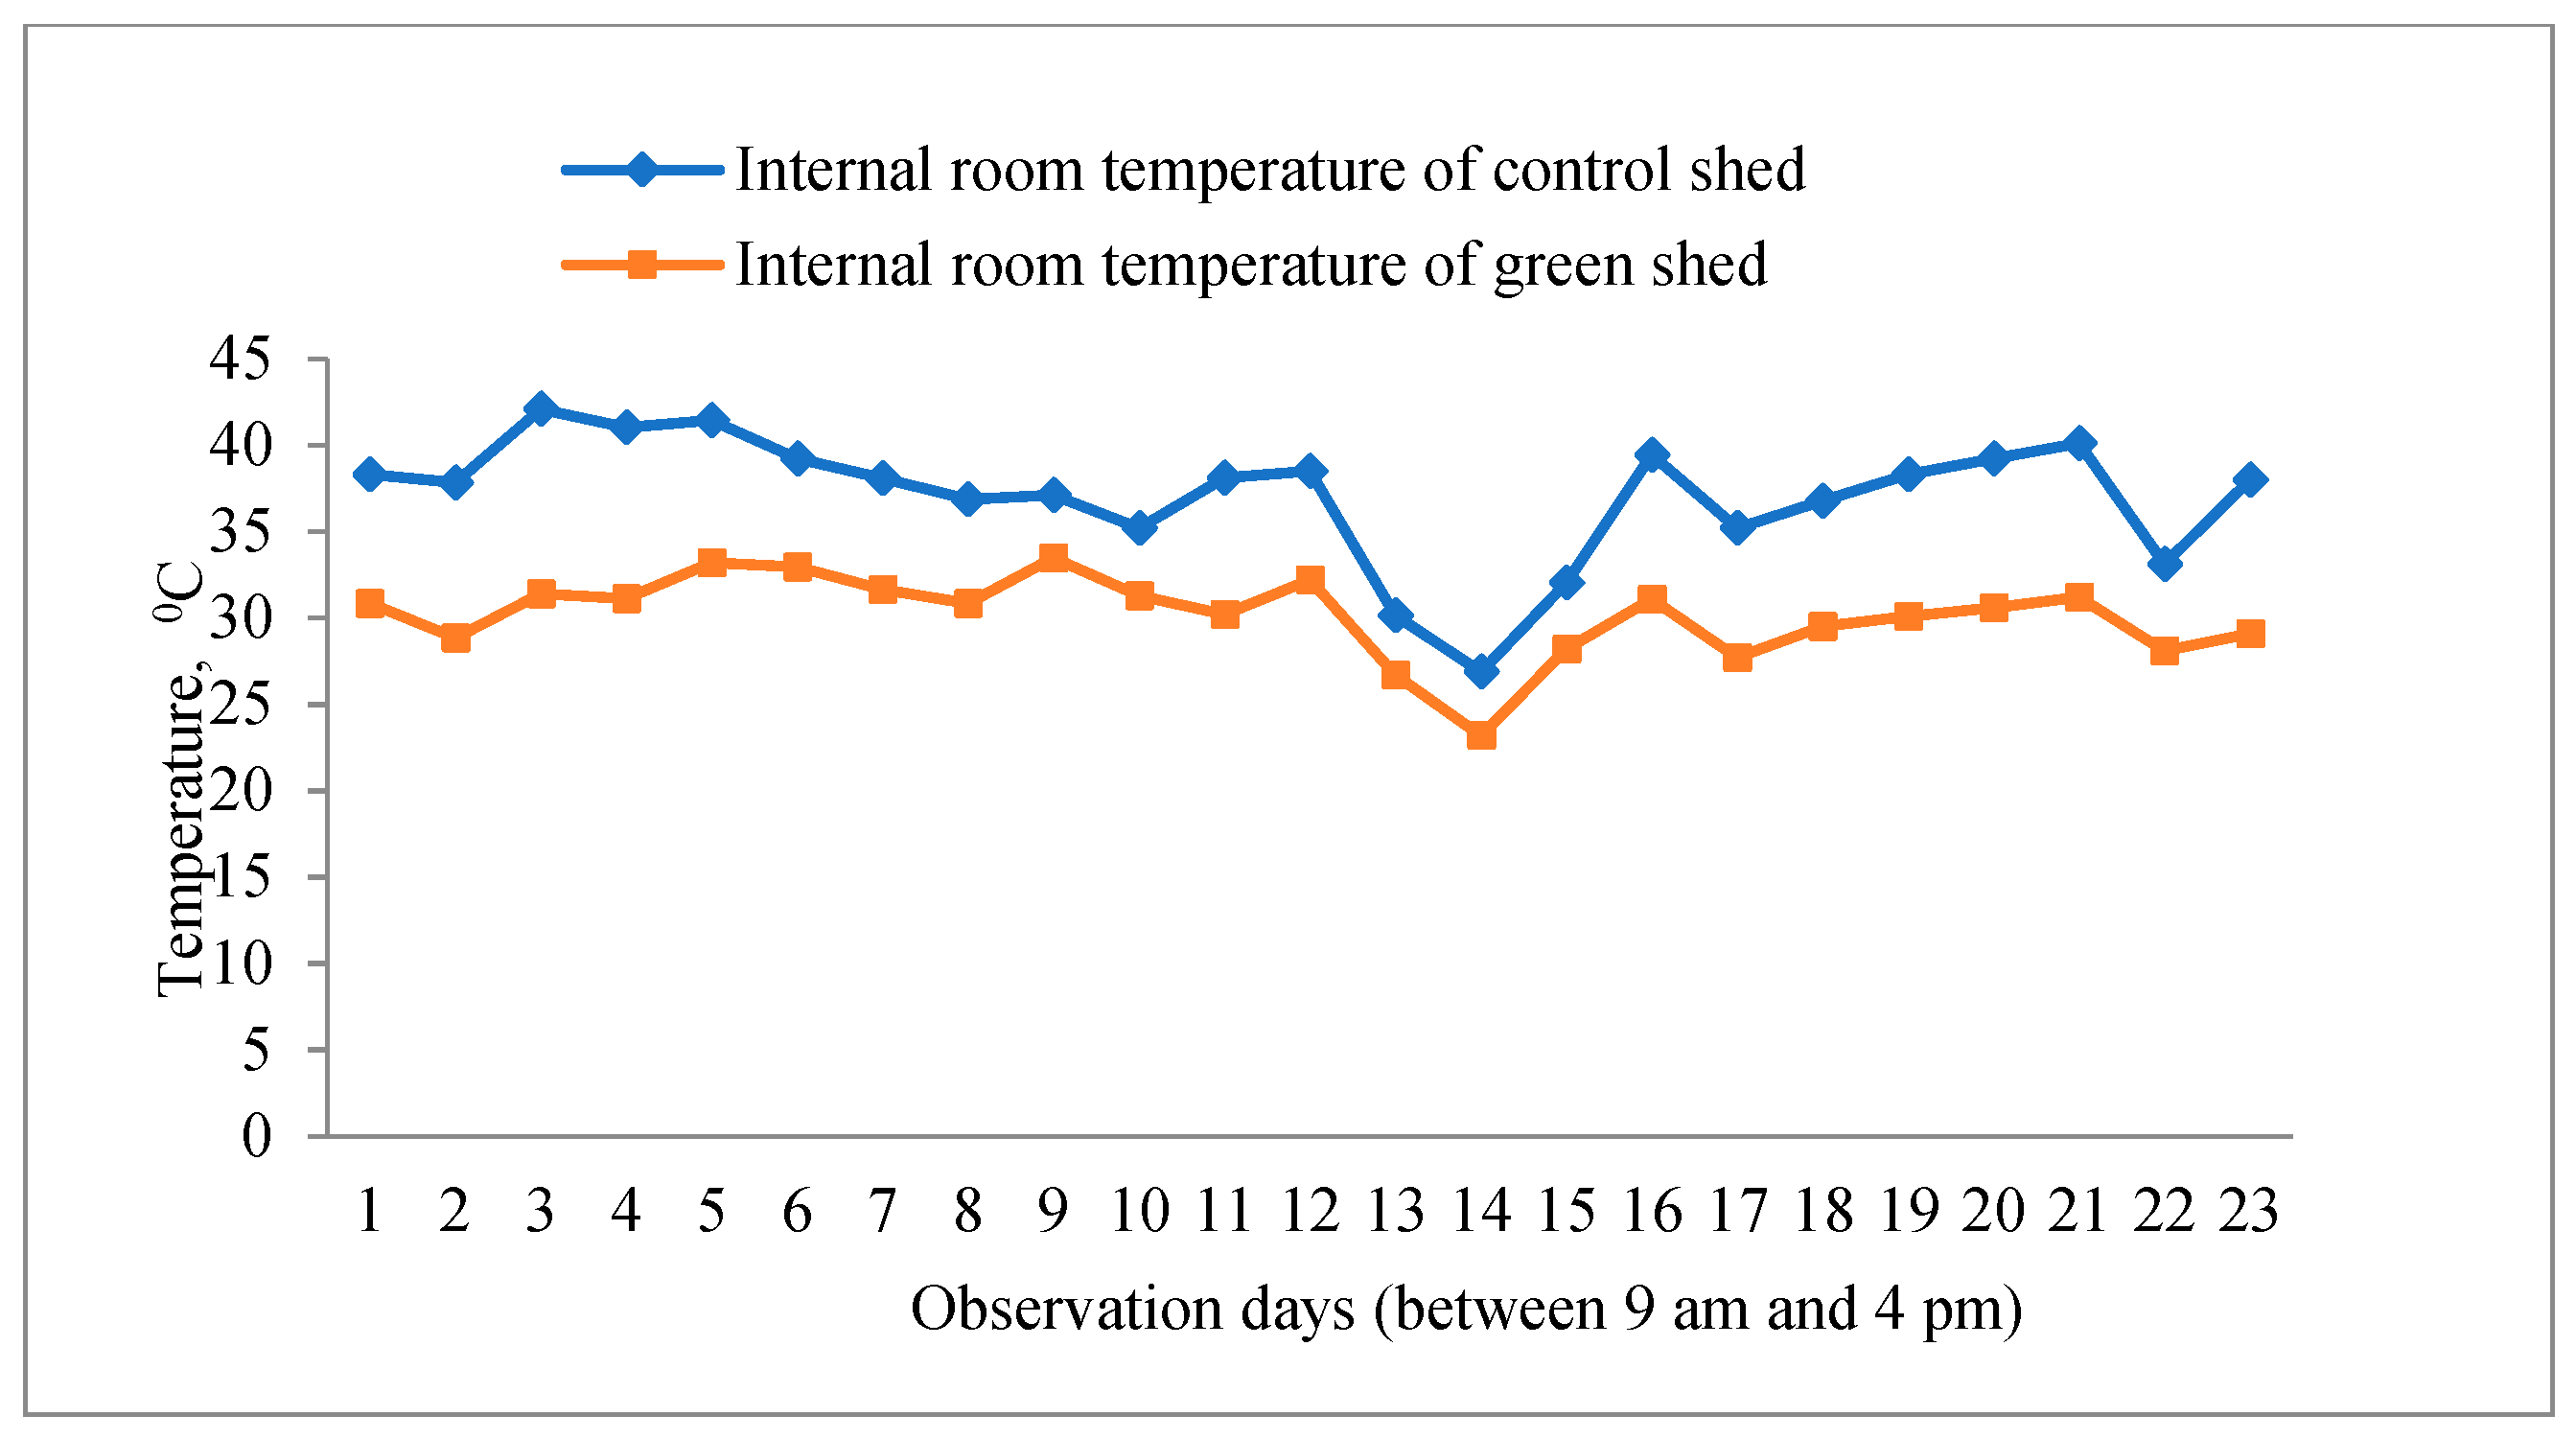
The results from both the living wall and green roof are compared with the results of the control shed (no green elements) in Figure 20 and Figure 21; they are for spring and summer respectively.
Figure 20.
Peak temperature variation in internal air (14 October–17 November).
Figure 21.
Peak temperature variation in internal air (16 February–9 March).
It is observed from both plots that the green shed is significantly cooler inside compared to its counterpart, with October and November averaging about 35 °C for the control shed and 27 °C for the green shed. For the months of February and March, the peak temperatures were around 36 °C and 30 °C for the control shed and green shed respectively. This is equivalent to the average cooling effect of approximately 29.6% for the spring months and 20% for the summer months. The combined system demonstrates synergistic behaviour, where the interaction between roof insulation and wall shading enhances overall thermal performance beyond individual contributions.
3.4. Air Gap and Ambient Temperature Analysis
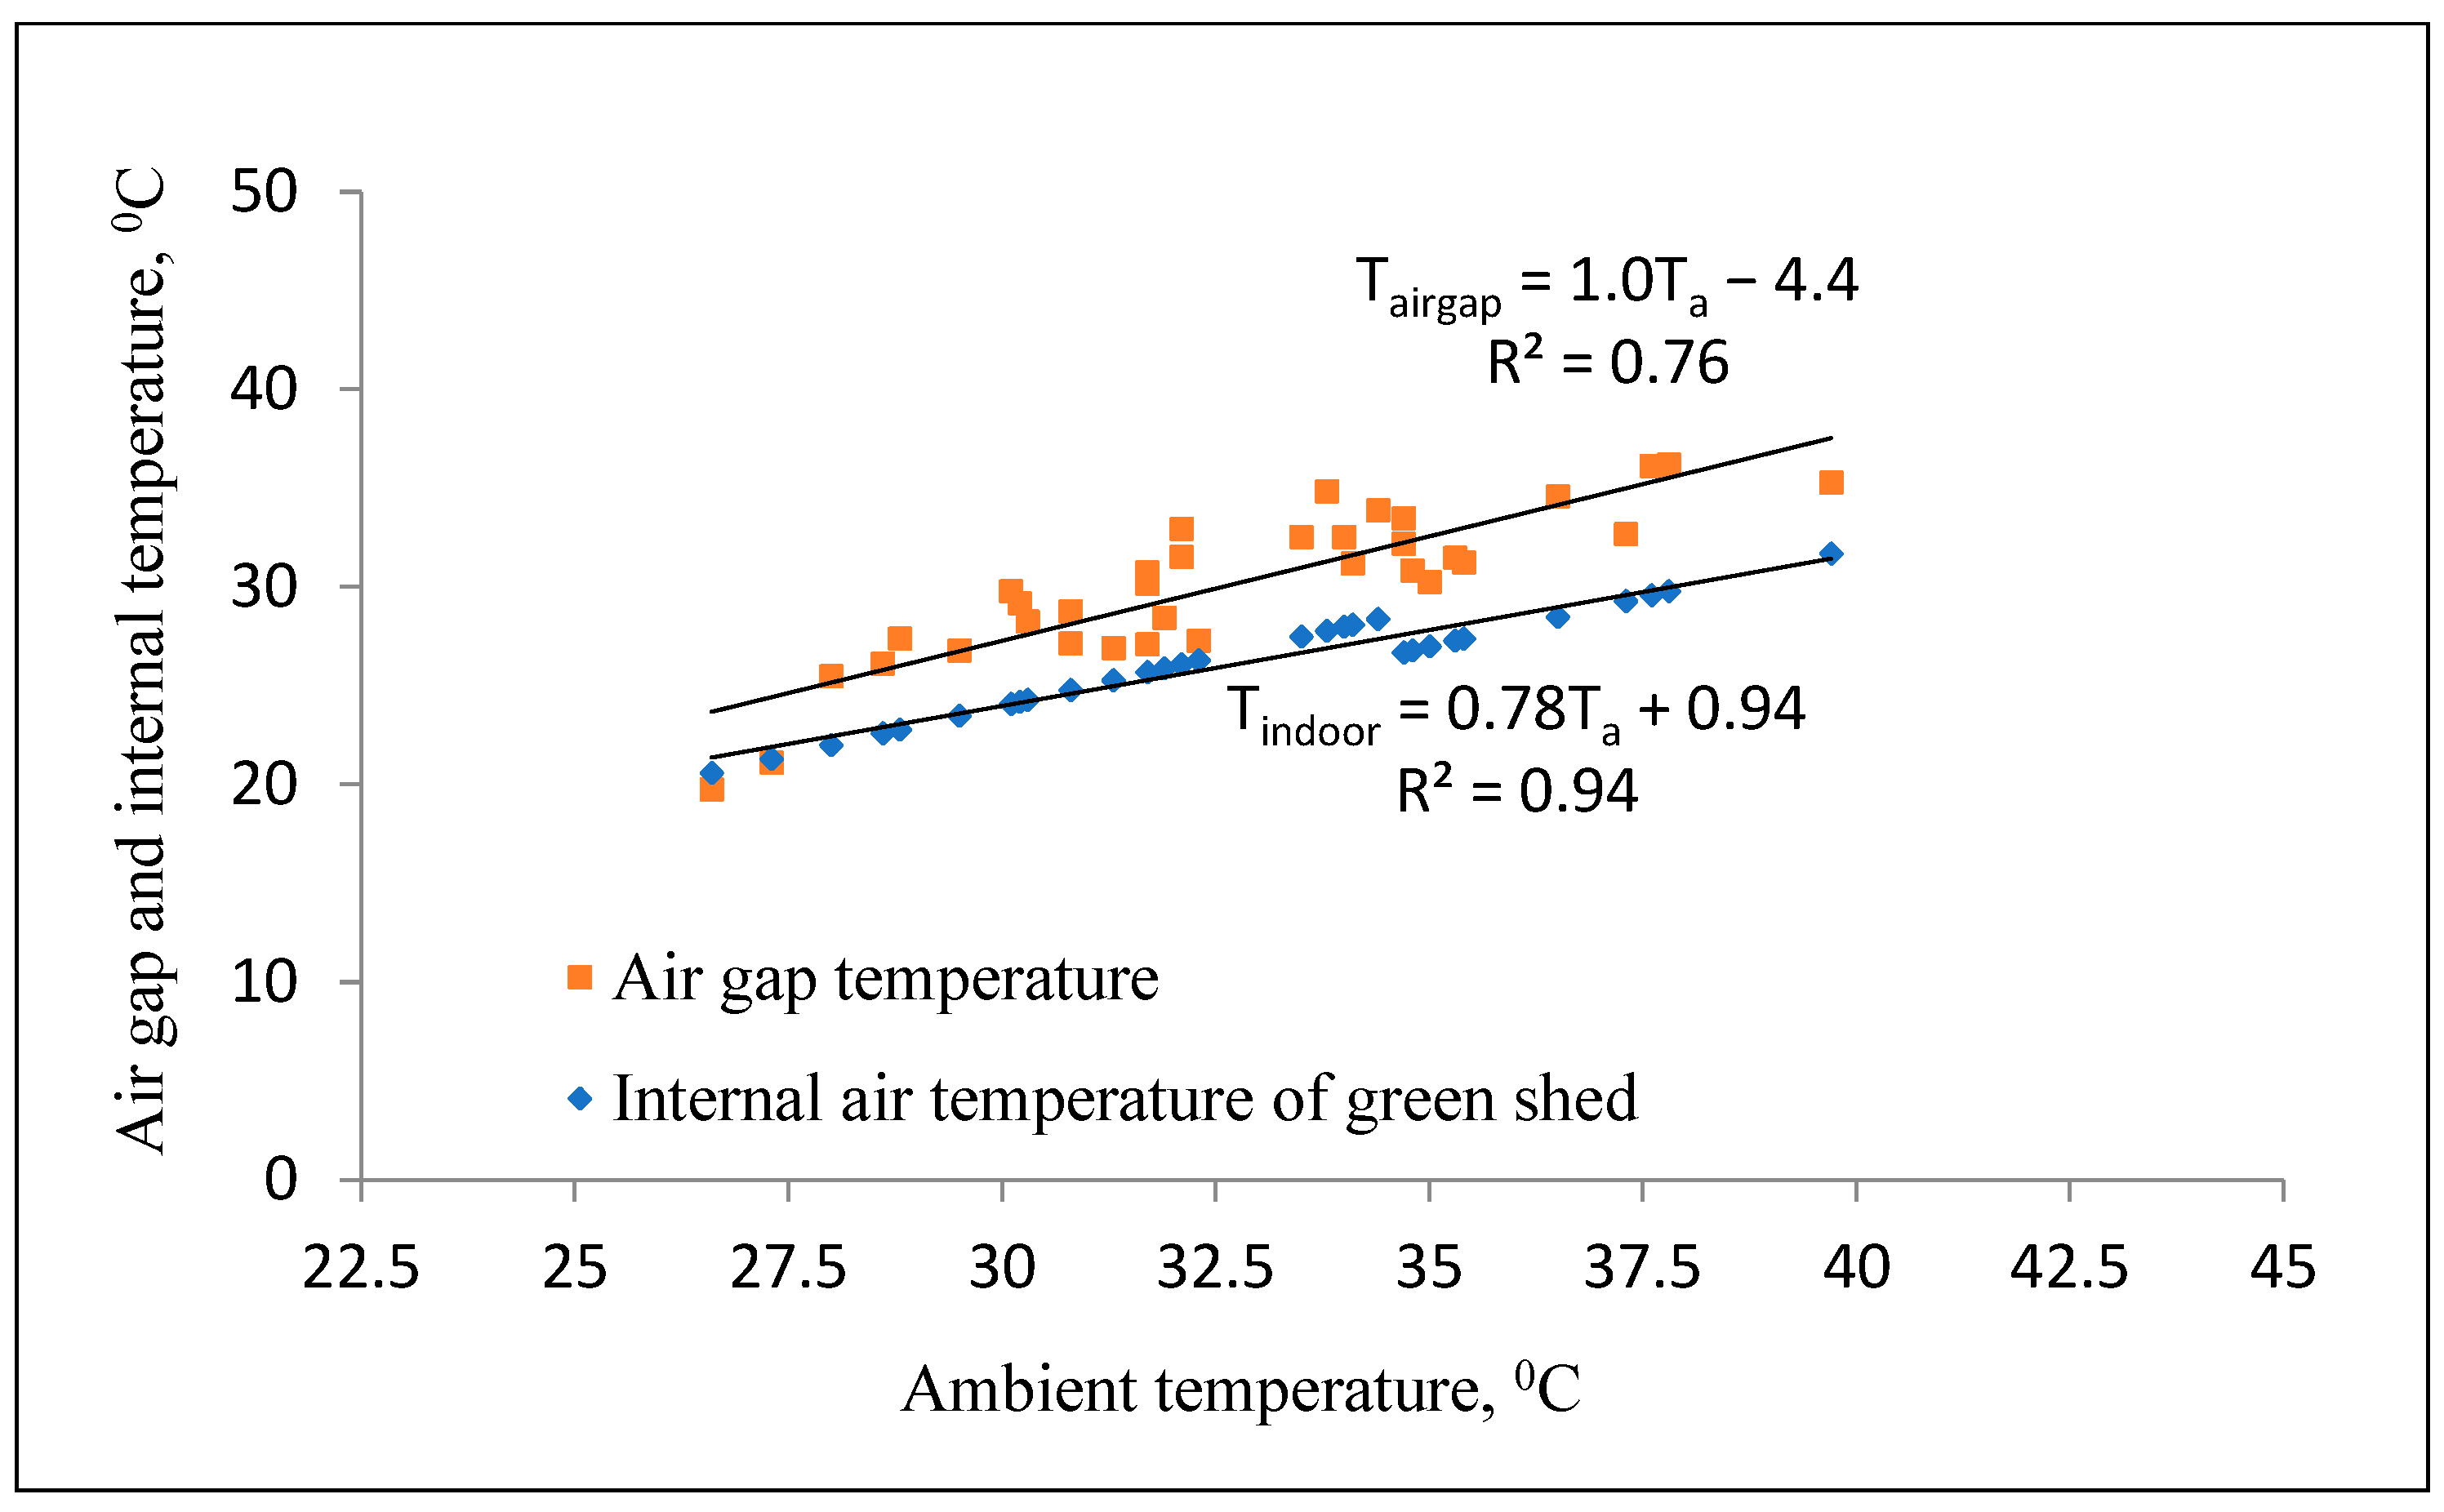
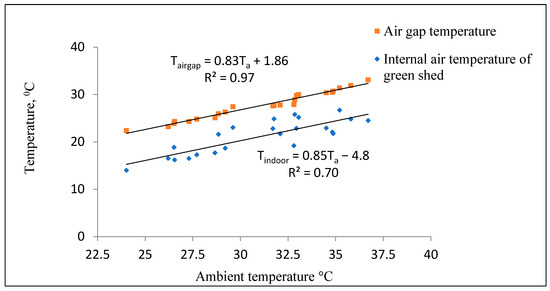
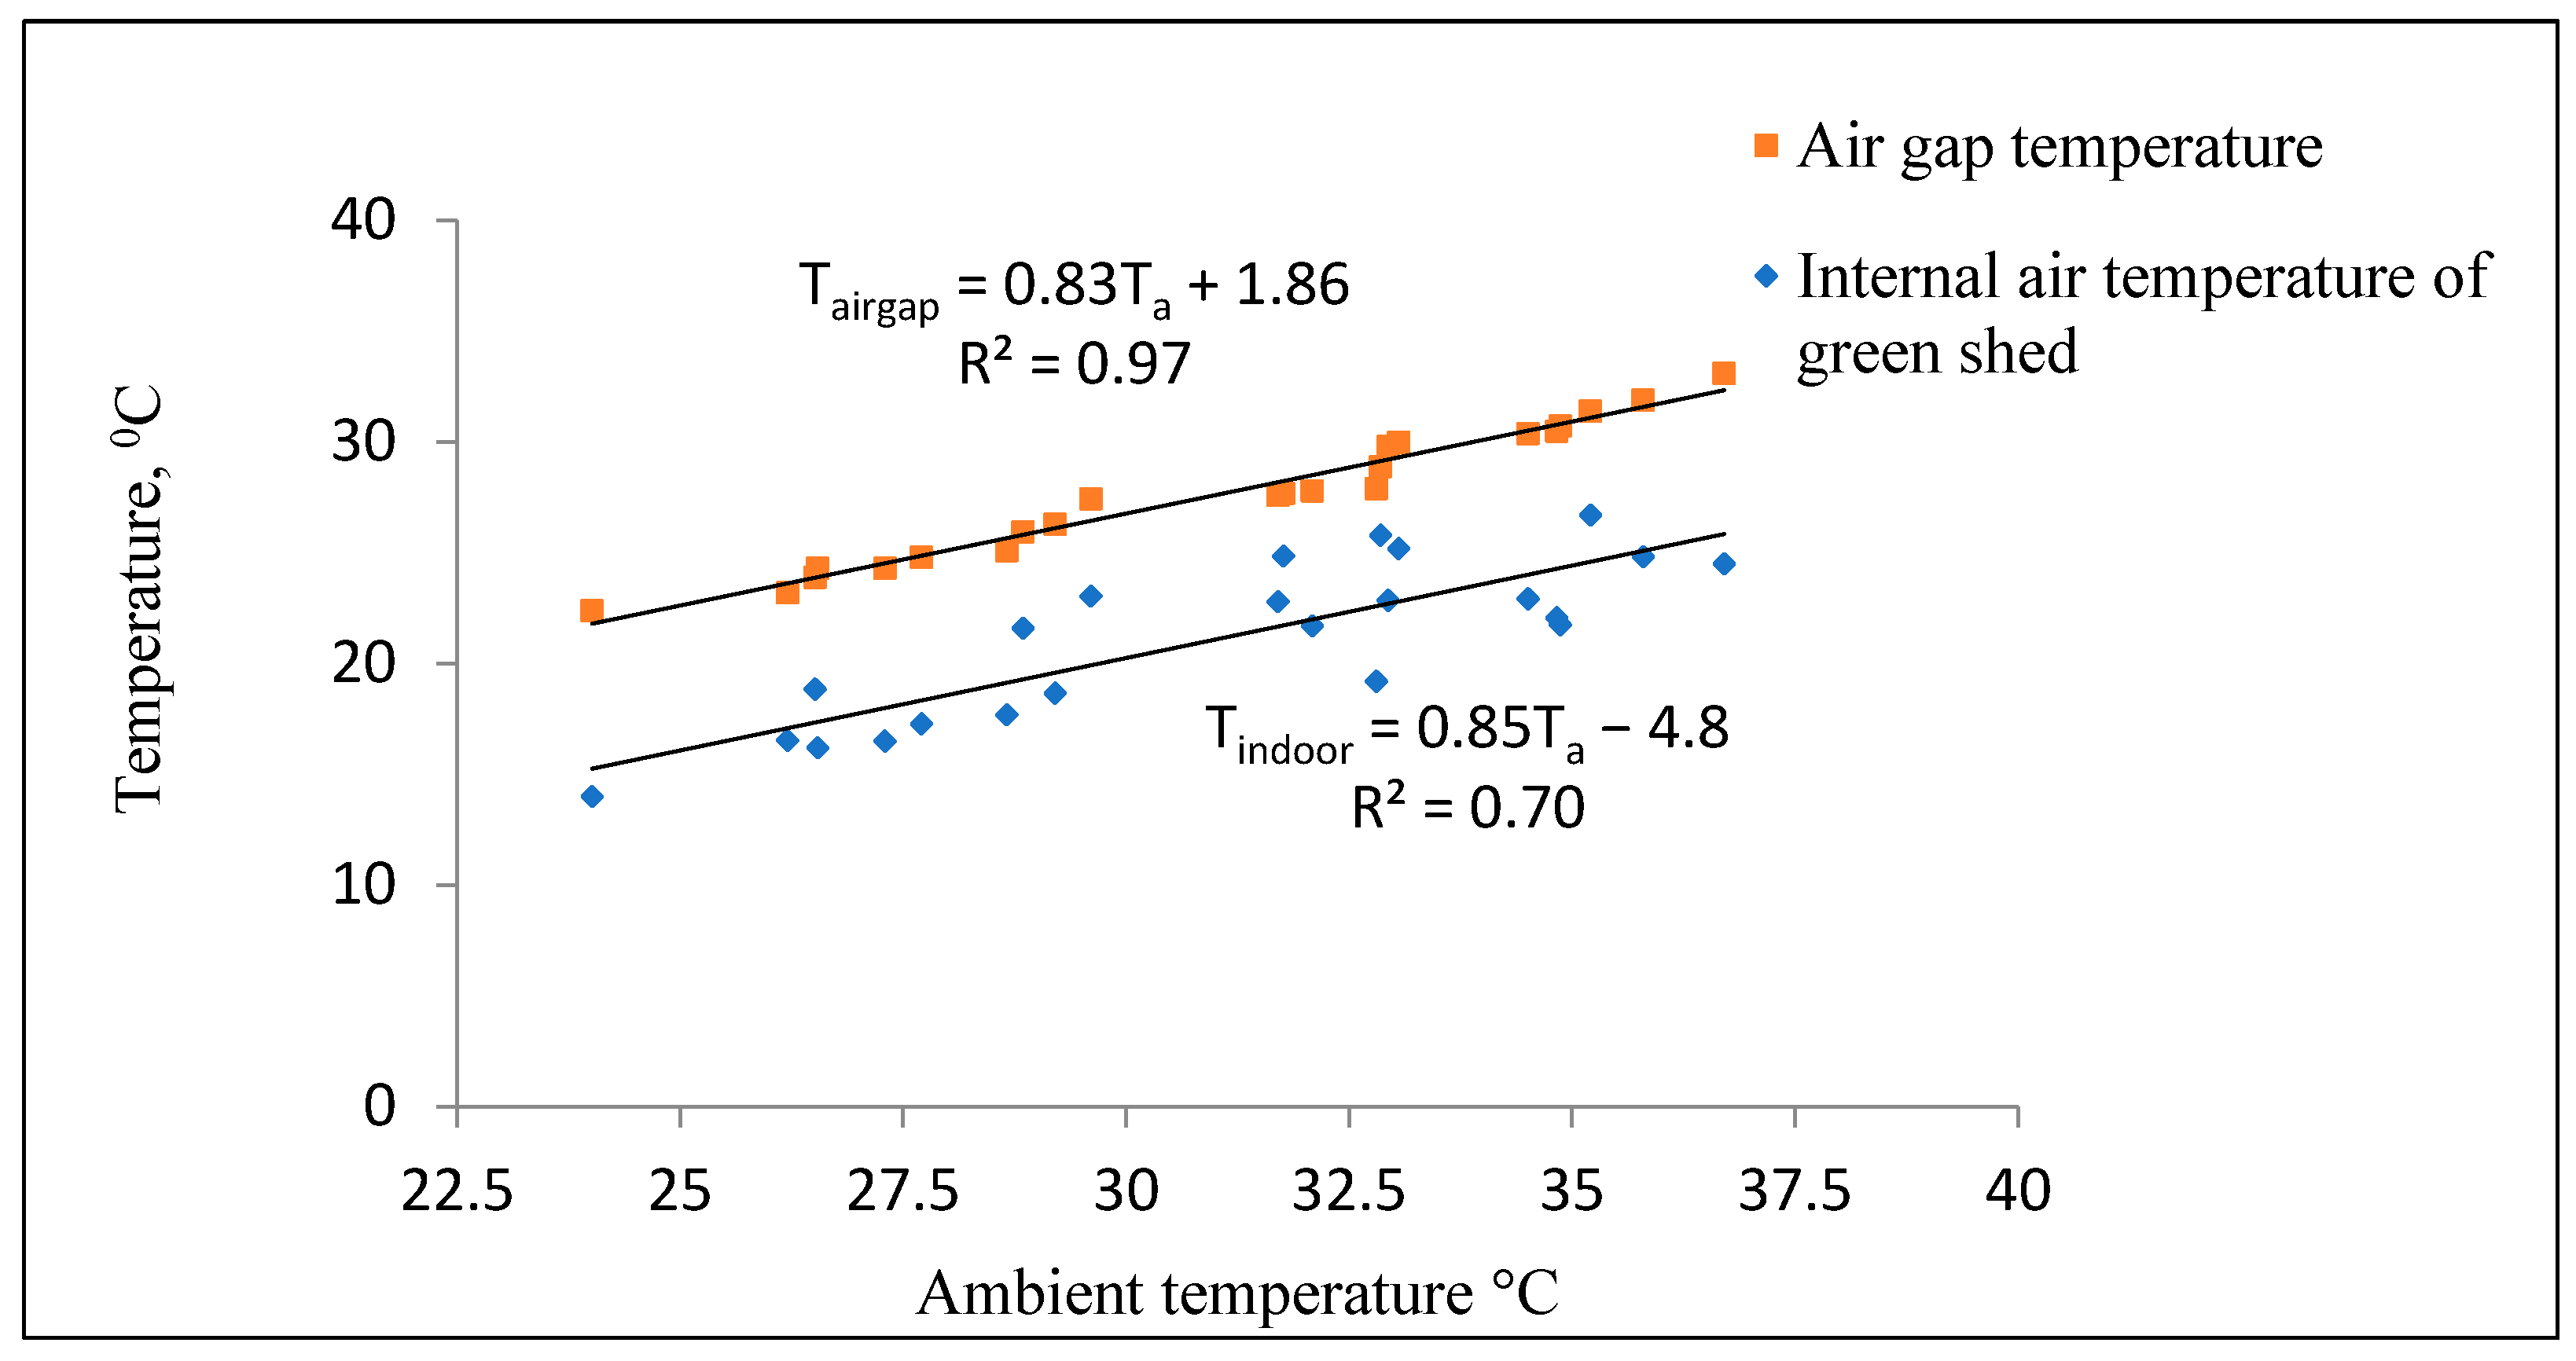
As the living wall is separated from the shed wall by a gap of 50 mm, the impact of the air gap needs to be properly understood. To understand the insulating effects air gap on the steel wall temperature, the air gap temperature was plotted against the internal air temperature for the spring and summer seasons as shown in Figure 22 and Figure 23 respectively.
Figure 22.
Air gap temperature vs internal air temperature with ambient temperature (14 October–17 November) [Tairgap, Tindoor and Ta refer to air gap, indoor and ambient temperatures respectively].
Figure 23.
Air gap temperature vs internal air temperature (16 February 2012–9 March 2012) [Tairgap, Tindoor and Ta refer to air gap, indoor and ambient temperatures respectively].
Except for a few initial data points, the internal air temperature of the shed remained consistently lower than the air gap temperature, as expected. These initial points correspond to early morning conditions, before significant heating had commenced, which explains the minimal difference between the air gap and internal air temperatures. Starting at an ambient temperature of approximately 28 °C, the shed air temperature is about 14% lower, increasing to a maximum reduction of approximately 18% at an ambient temperature of around 36 °C.
Again, the internal air of the green shed was consistently cooler than the air gap temperature. From the linear regression plots, it can be seen that the air temperature inside the shed was 26% to 37.5% cooler than the air gap temperature. This confirms that the air gap acts as an additional thermal resistance layer, reducing conductive and convective heat transfer into the building interior.
Overall, the experimental results clearly demonstrate the following:
- Living walls primarily reduce heat gain through shading and evapotranspiration;
- Green roofs provide thermal insulation and reduce roof heat flux;
- The combination of both systems produces enhanced cooling of the building.
The effectiveness of these systems is strongly influenced by solar radiation intensity, plant characteristics, and climatic conditions. It should be noted that the results are based on prototype steel structures under controlled conditions. While the trends are representative, the absolute values may vary for concrete buildings due to differences in material properties and thermal mass.
4. Discussions
The experimental and modelling results for steel structure with and without green elements are first discussed. The results from the models were compared with experimental data to assess the validity of the models. An error analysis was also conducted to validate the accuracy of the results. As most real-life buildings are concrete structures, theoretical temperature profiles of concrete structures, using developed mathematical models, are also presented.
Overall, the results demonstrate that green envelope systems significantly influence building thermal performance through multiple coupled mechanisms, including shading, insulation, and evapotranspiration.
4.1. Steel Wall with Living Wall
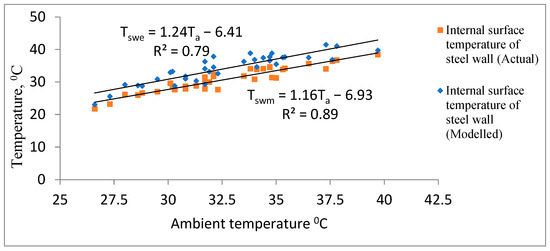
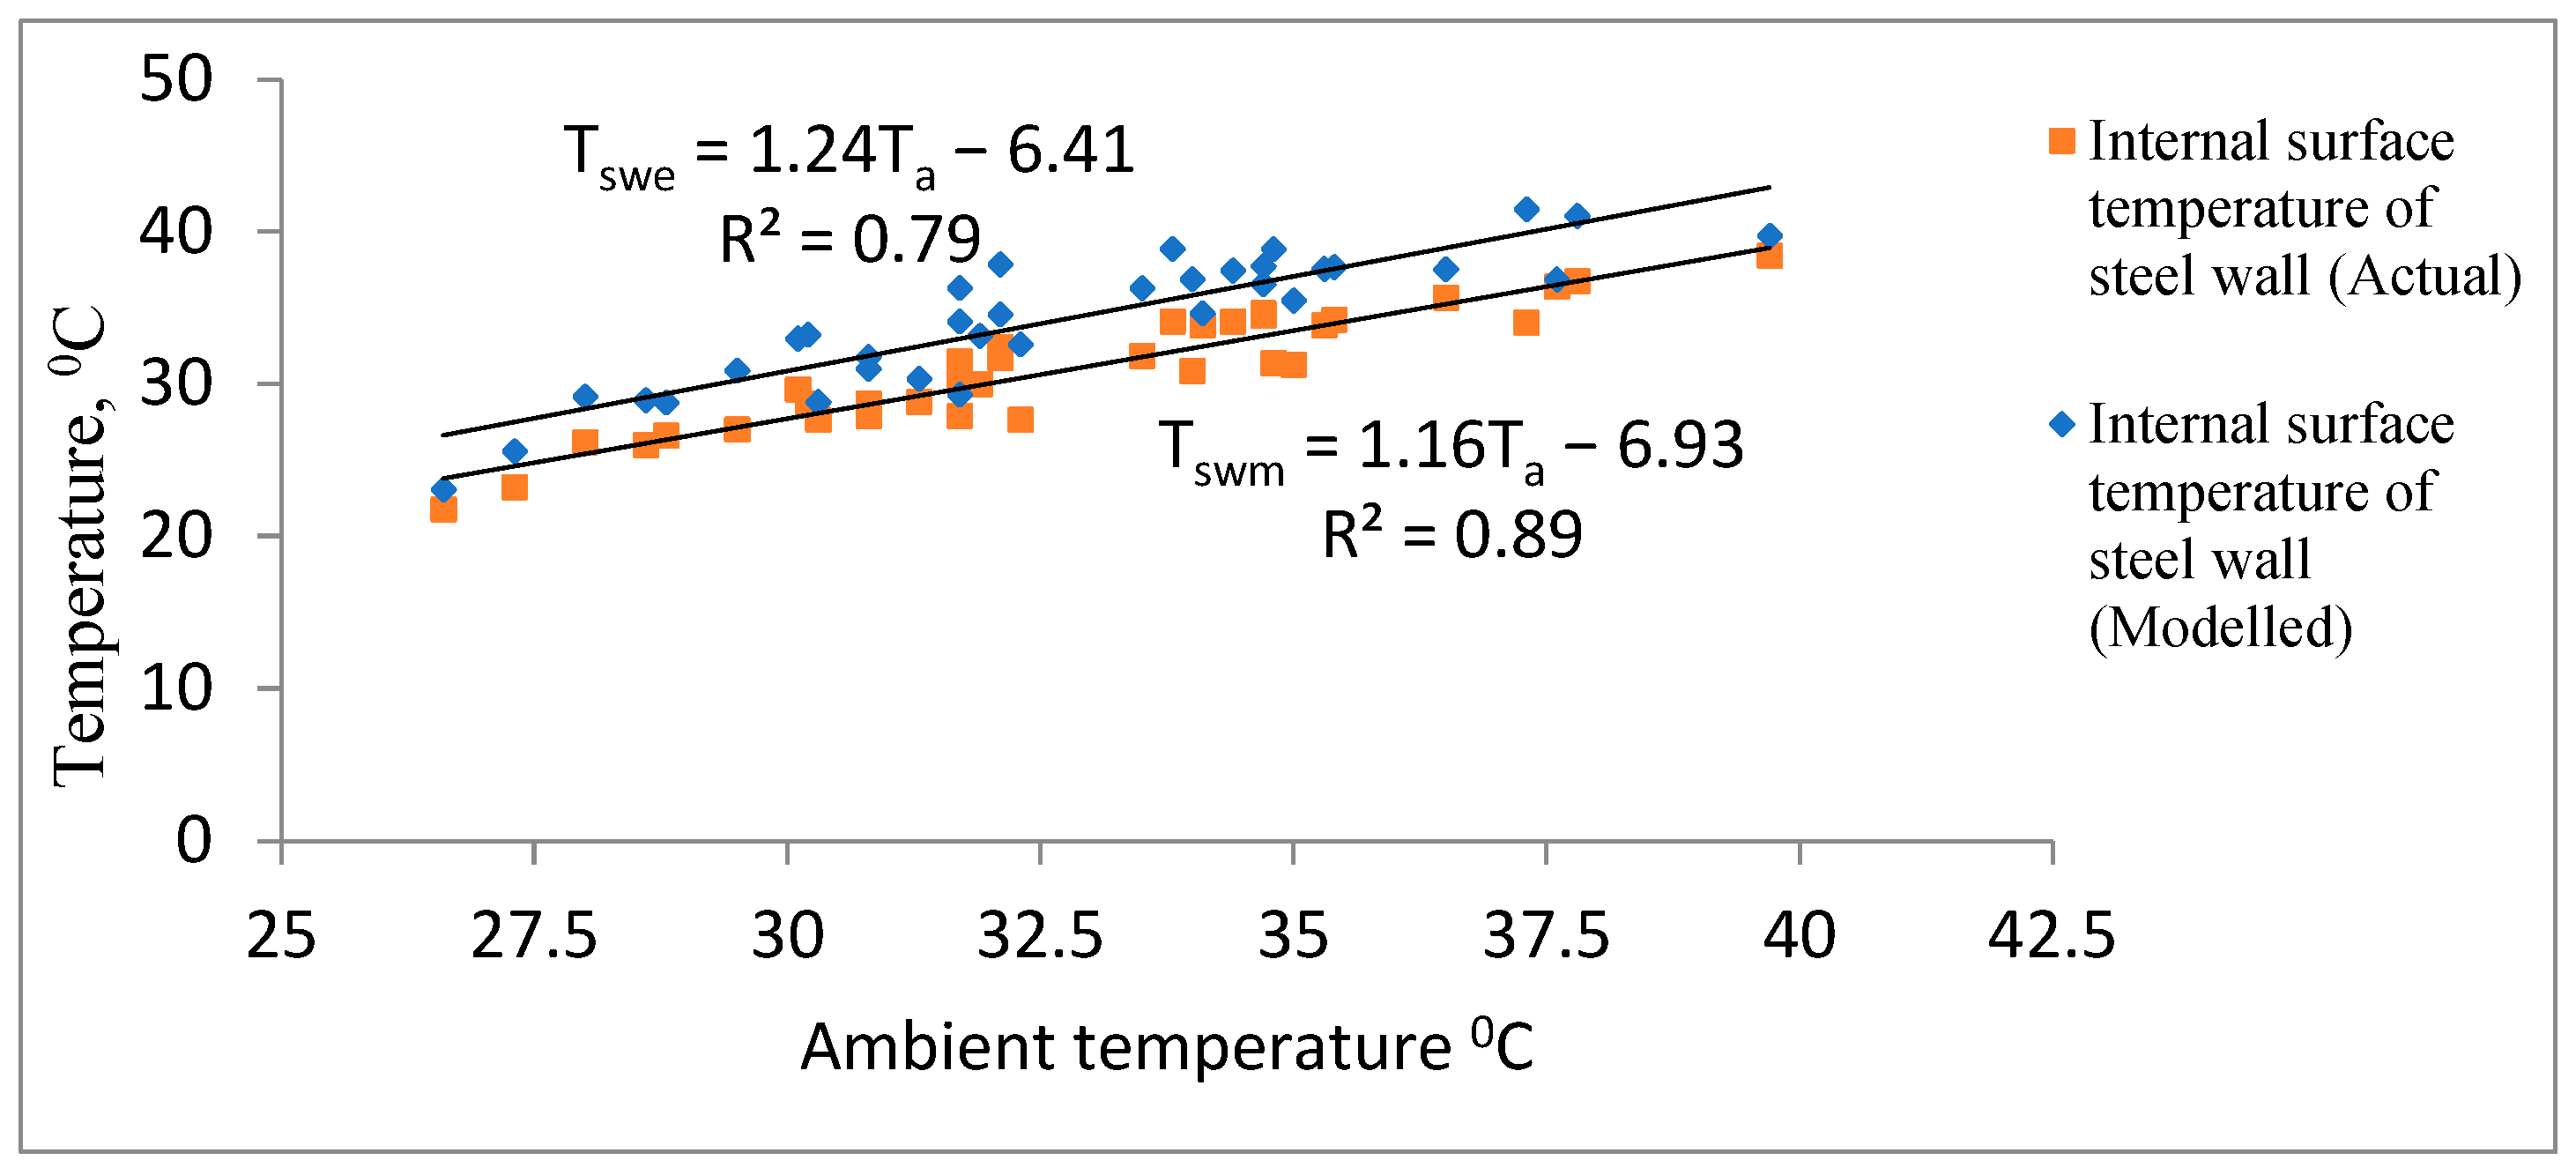
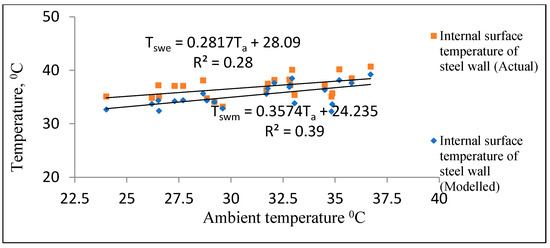
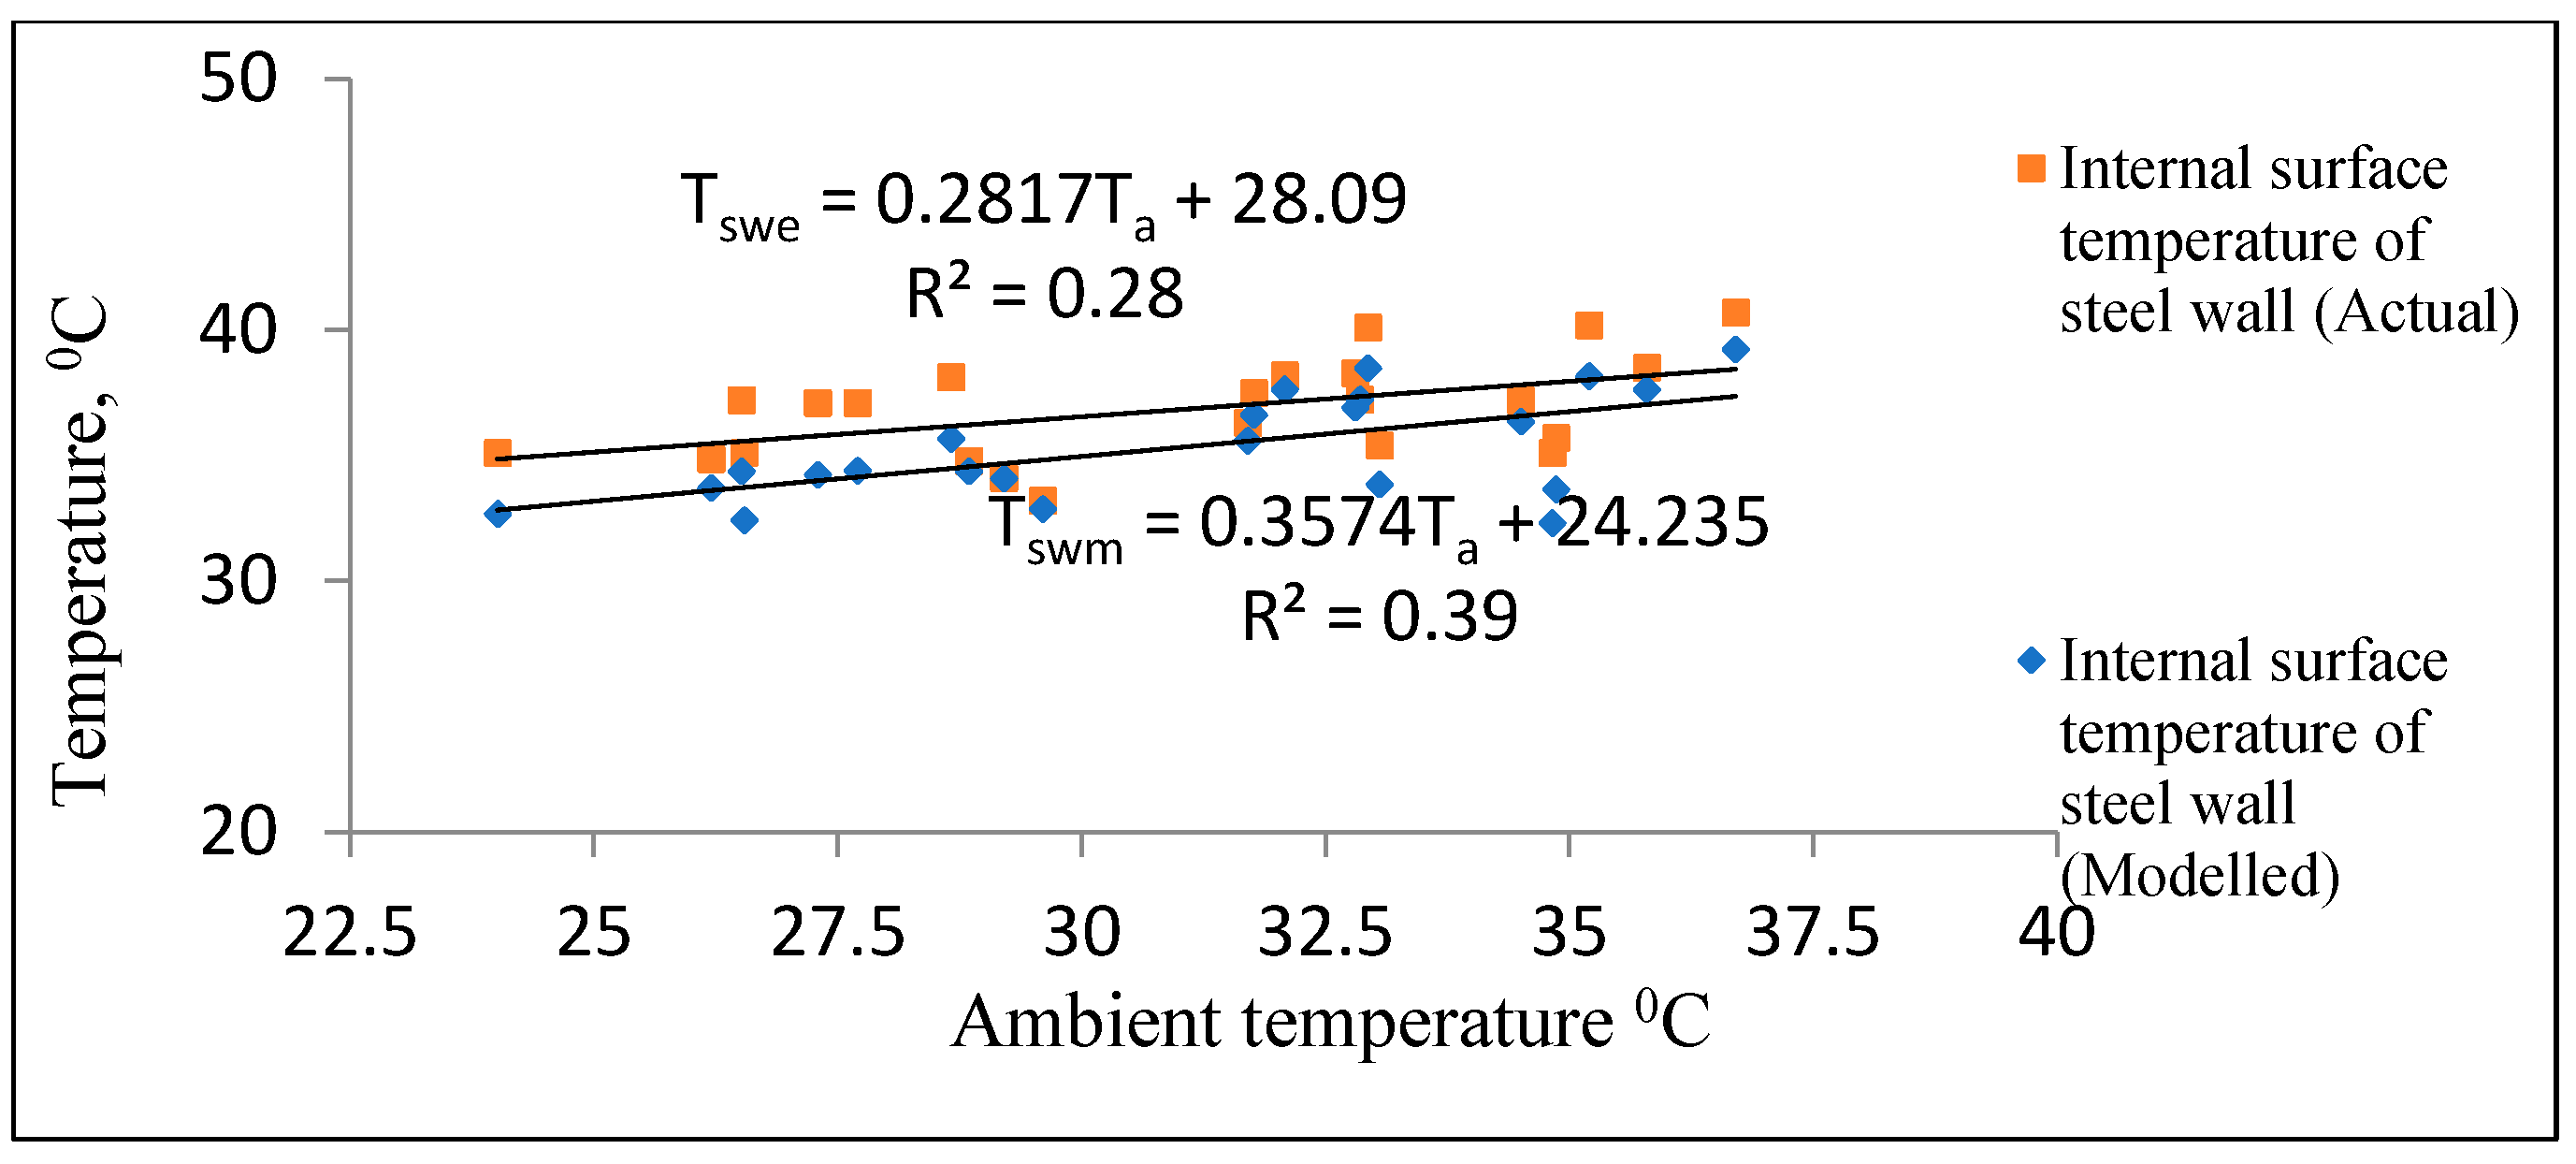
The comparison between modelled and experimental results for the steel wall with living wall for different seasons is presented in Figure 24 and Figure 25. In Figure 24, the model exhibits a gradient of 1.16, while the experimental results show a gradient of 1.24, indicating good agreement. Similarly, the data in Figure 25 also show close agreements.
Figure 24.
Comparison of experimental and simulated results with living wall (14 October–17 November) [Tswe, Tswm and Ta refer to experimental wall, model predicted wall and ambient temperatures respectively].
Figure 25.
Comparison of experimental and simulated results with living wall (16 February–9 March) [Tswe, Tswm and Ta refer to experimental wall, model predicted wall and ambient temperatures respectively].
This close correlation confirms that the proposed model can reliably capture the dominant heat transfer mechanisms in lightweight steel structures.
However, minor deviations can be attributed to model simplifications, particularly the neglect of transient effects and environmental variables such as wind speed and humidity.
Similar findings have been reported by recent studies [19,20], which highlight that living walls significantly reduce surface temperatures and heat flux in lightweight building envelopes. For example, previous experimental and modelling studies have reported reductions in façade surface temperatures typically in the range of approximately 2–10 °C, depending on vegetation density, climatic conditions, and façade configuration. These trends are consistent with temperature attenuation observed in the present study for the west-facing wall.
However, a key distinction of the present work lies in the integration of these experimentally observed thermal effects into an ETTV-based modelling framework. While previous studies primarily focused on surface temperature reduction and heat flux measurements, the current study extends this understanding by quantifying the impact on overall building heat gain and cooling energy demand. This demonstrates that the reduction in surface temperature due to living walls can translate into measurable reductions in ETTV and annual cooling energy consumption, particularly in subtropical climates.
4.2. Concrete Wall with Living Wall
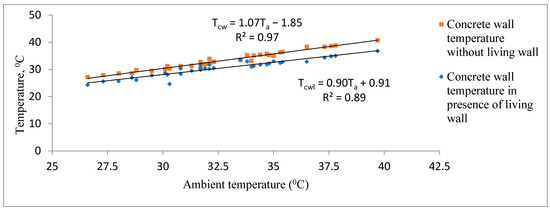
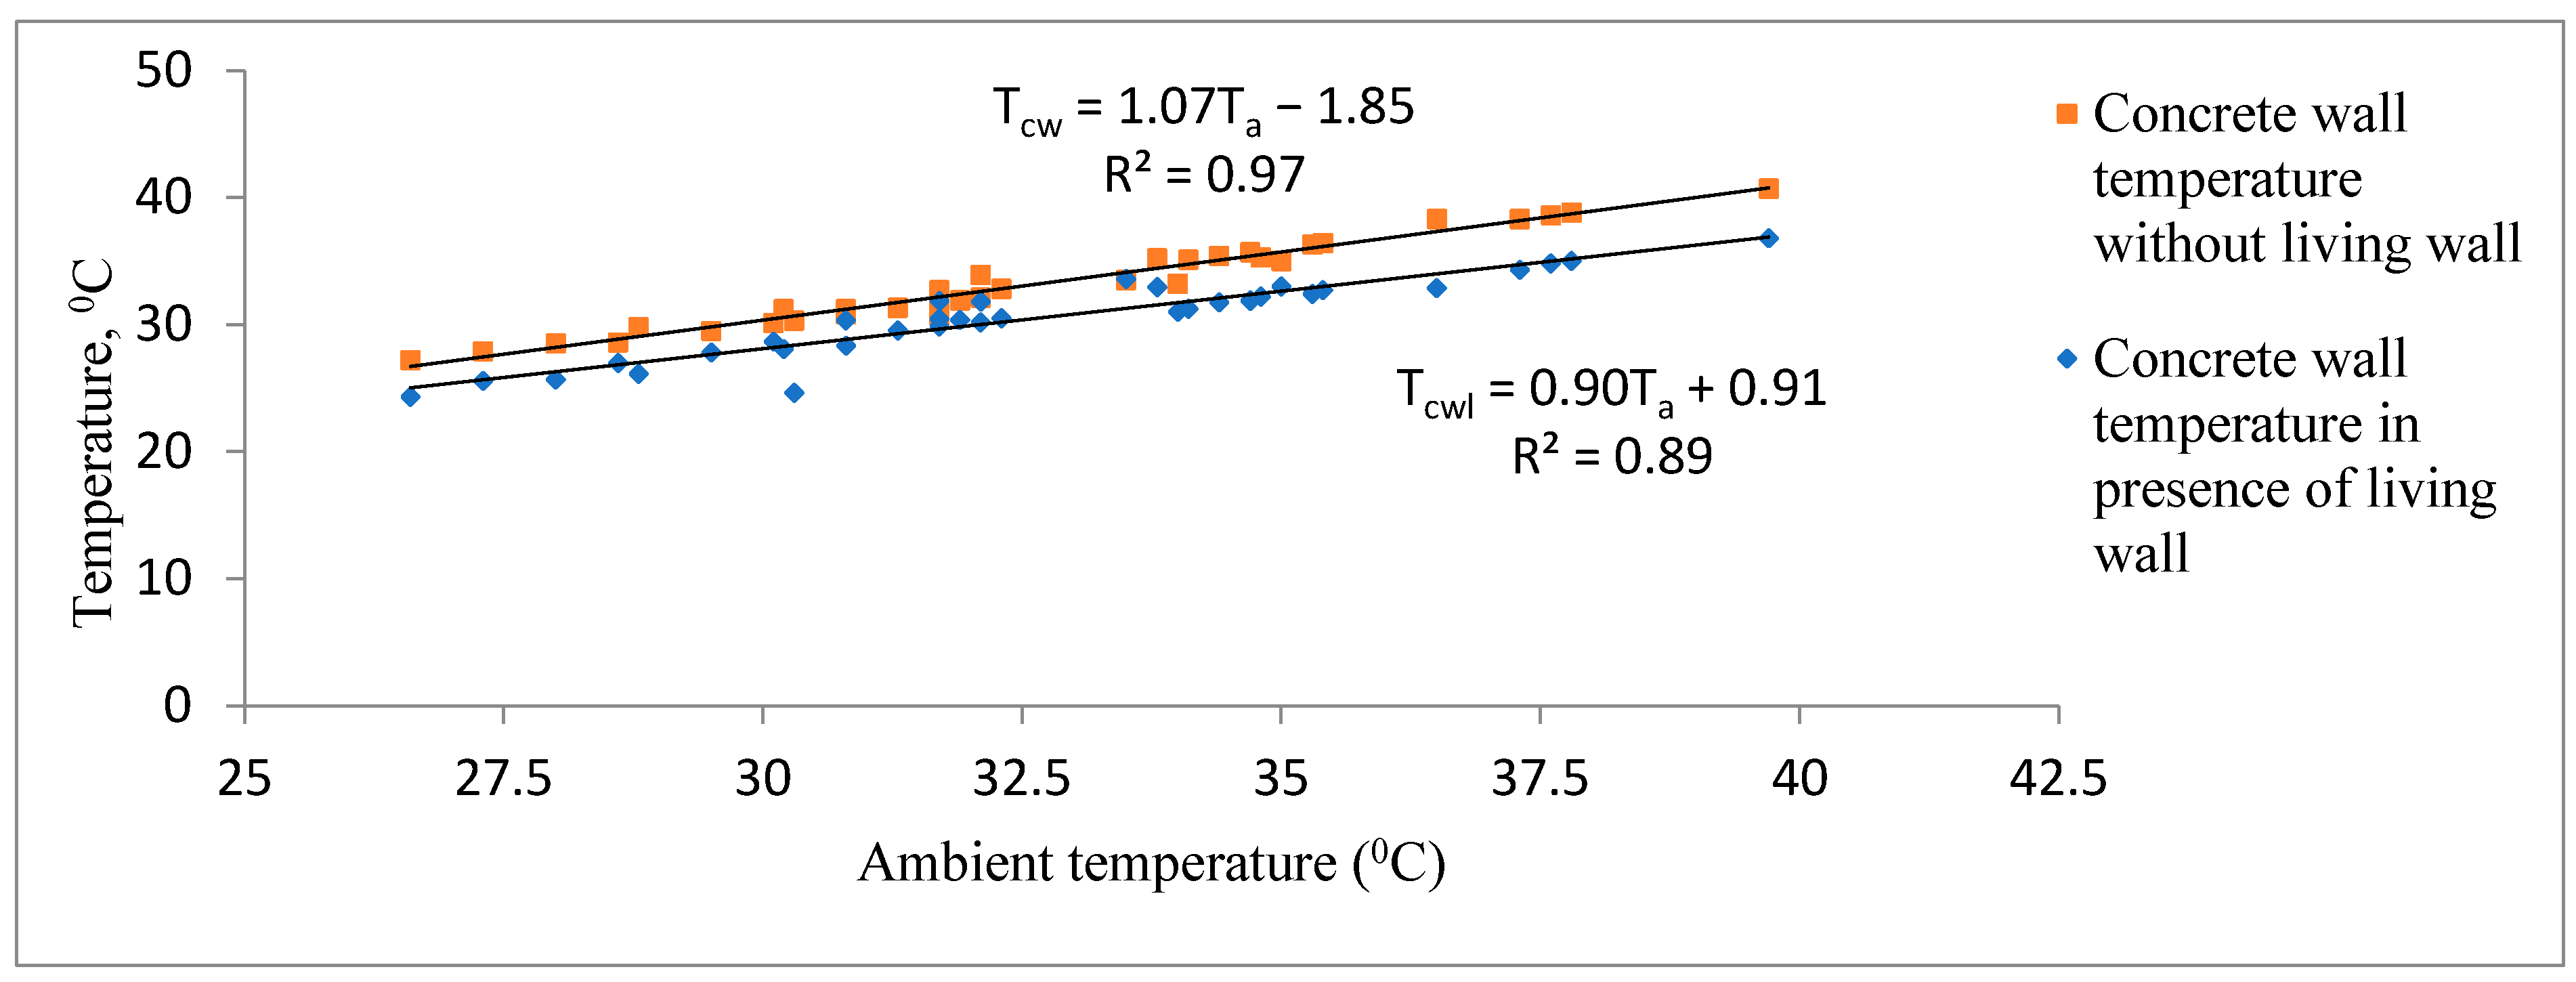
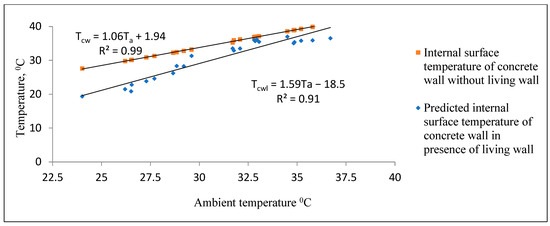
The modelled results for concrete structures with and without living wall are plotted in Figure 26 and Figure 27 for spring and summer seasons respectively.
Figure 26.
Peak temperature variation in internal surface of concrete wall in the presence and absence of living wall in spring (14 October–17 November) [Tcw, Tcwl and Ta refer to concrete wall, concrete wall with living elements and ambient temperatures respectively].
Figure 27.
Peak temperature variation in internal surface of concrete wall in the presence and absence of living wall in summer (16 February–9 March) [Tcw, Tcwl and Ta refer to concrete wall, concrete wall with living elements and ambient temperatures respectively].
From the linear regression charts in Figure 26, it can be concluded that around 2.3 to 3.8 °C temperature reduction can be obtained in the internal surface temperature of the concrete wall with living wall system in springtime. However, in summer, as shown in Figure 27, around 2 to 7.8 °C temperature reduction can be obtained with a living wall. On an average, 10 °C temperature of internal surface of a concrete roof can be obtained during summertime.
4.3. Steel Roof with Green Roof
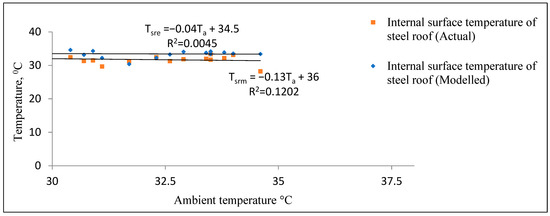
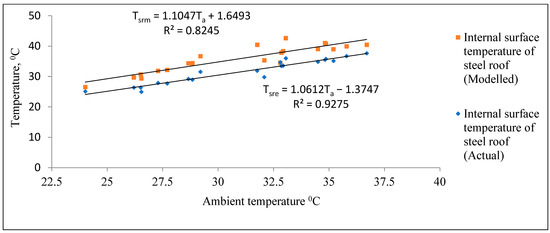
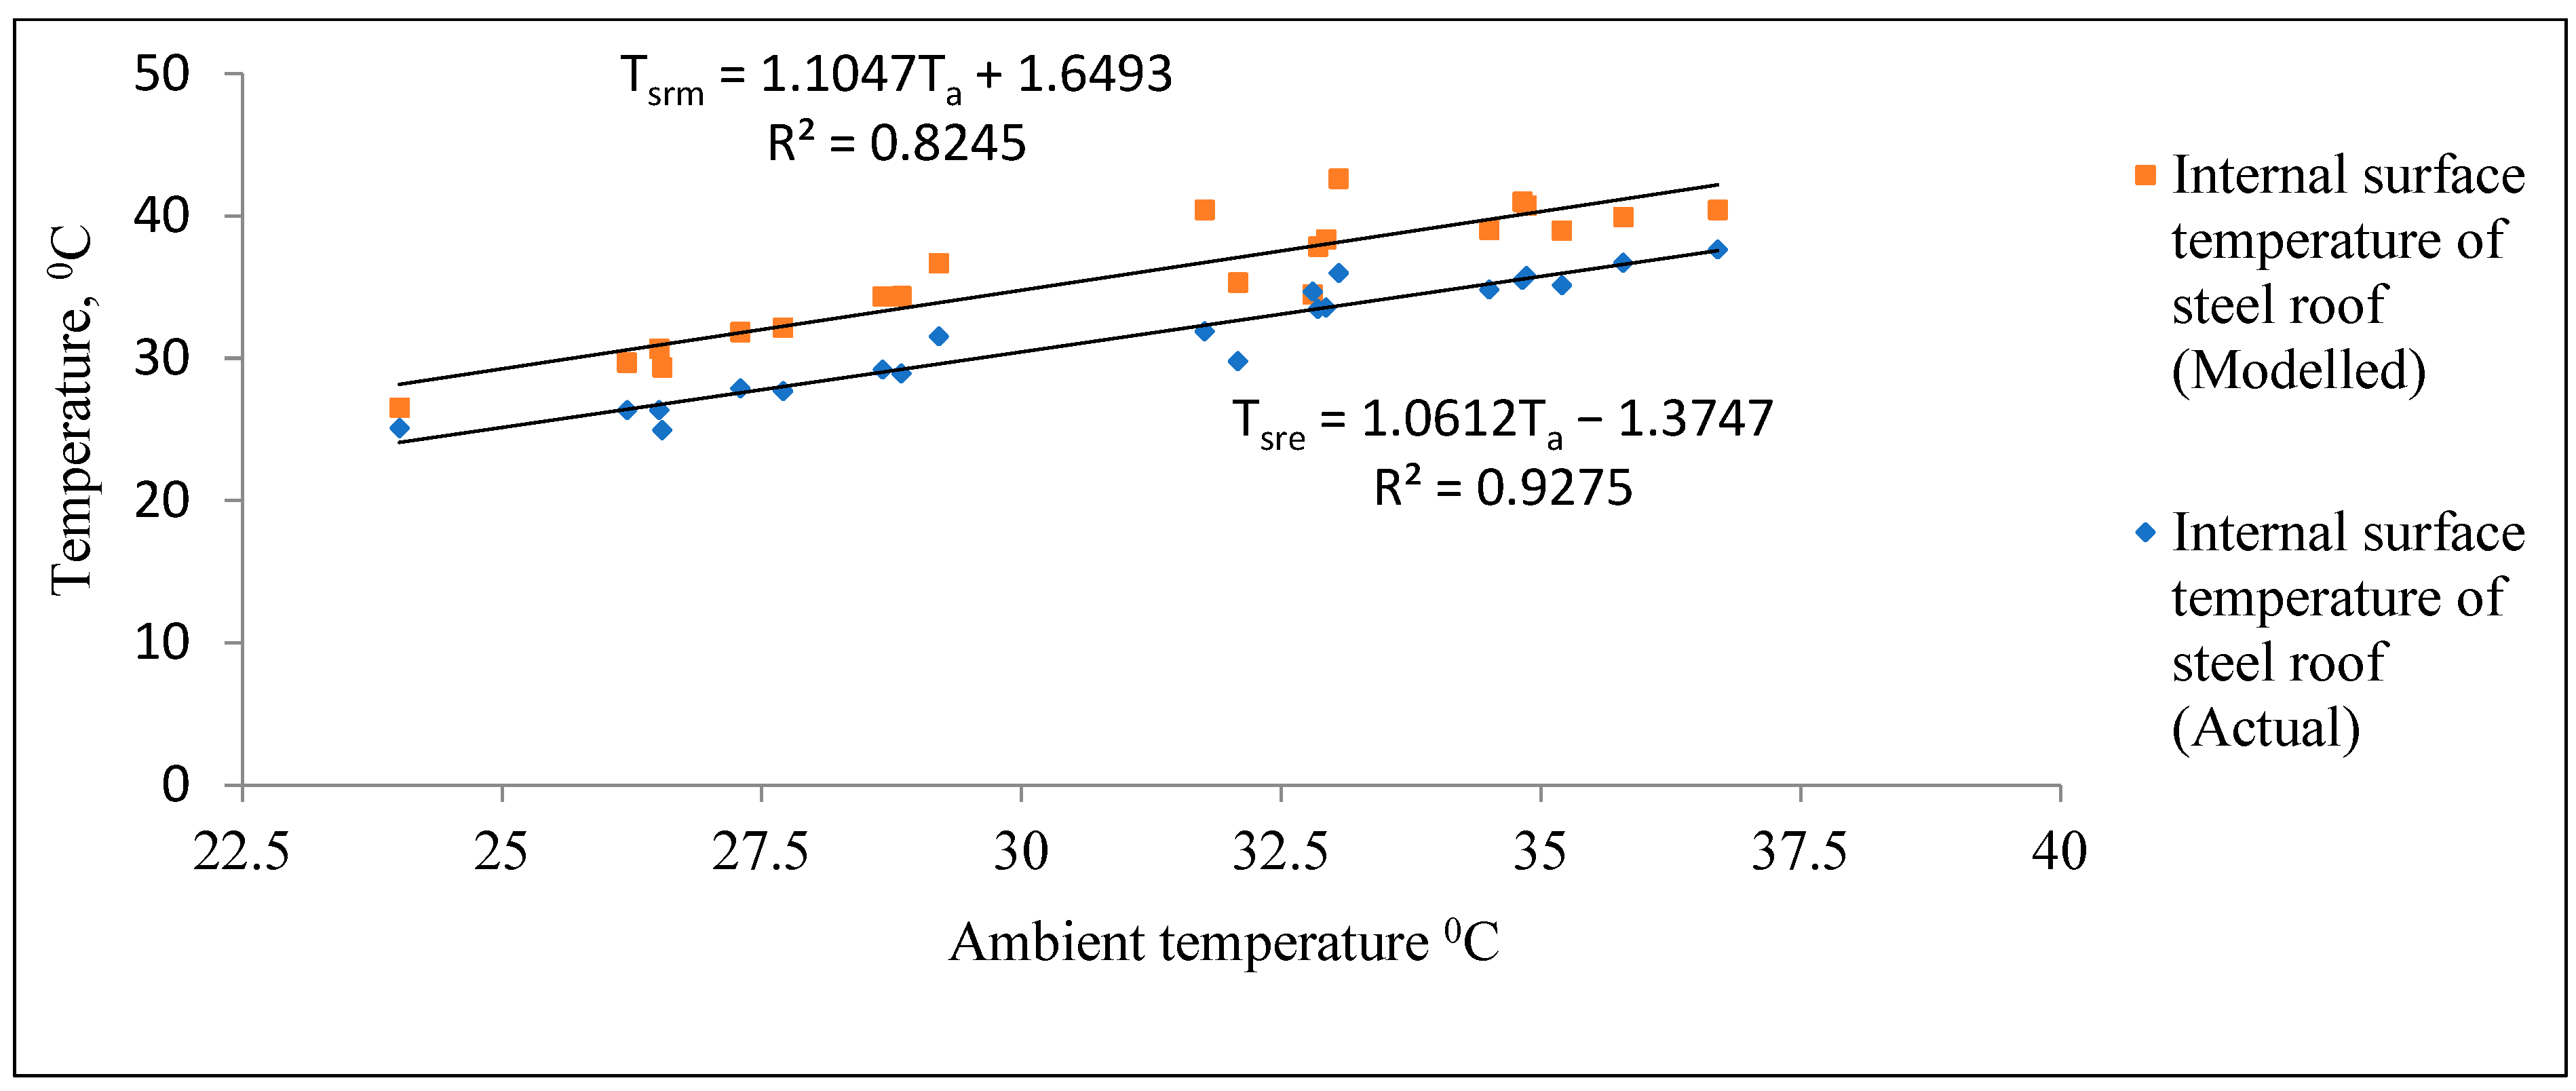
Experimental and modelled internal surface temperatures of the steel roof with green roof in spring and summer are presented in Figure 28 and Figure 29 respectively.
Figure 28.
Experimental vs modelled results, steel roof with green roof in spring (16 November–30 November) [Tsre and Tsrm refer to internal roof surface measured and modelled temperatures respectively and Ta refers to ambient temperature].
Figure 29.
Experimental vs modelled results, steel roof with green roof in summer (16 February–9 March) [Tsre and Tsrm refer to internal roof surface measured and modelled temperatures respectively and Ta refers to ambient temperature].
It has been demonstrated from linear regression of Figure 28 that internal surface temperature of the steel roof has a similar trend with the modelled internal surface temperature of a steel roof corresponding to ambient condition. During spring the modelled line of best fit follows the same trend as the experimental, with the percentage of error less than 10% in most of the days during the measurement period. Similar results were obtained in summer months as shown in Figure 29. However, the percentage of error was slightly higher in the summer months. This variation can be attributed to increased solar radiation intensity and dynamic environmental conditions during summer, which are not fully captured in the steady-state model.
Previous studies [19,20] have reported similar behaviour, where green roofs reduce peak temperatures but exhibit variability under changing climatic conditions.
4.4. Concrete Roof with Green Roof
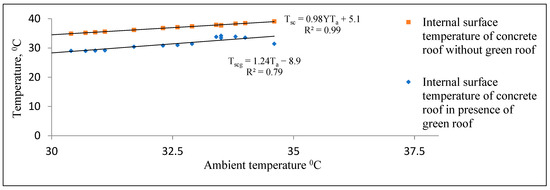
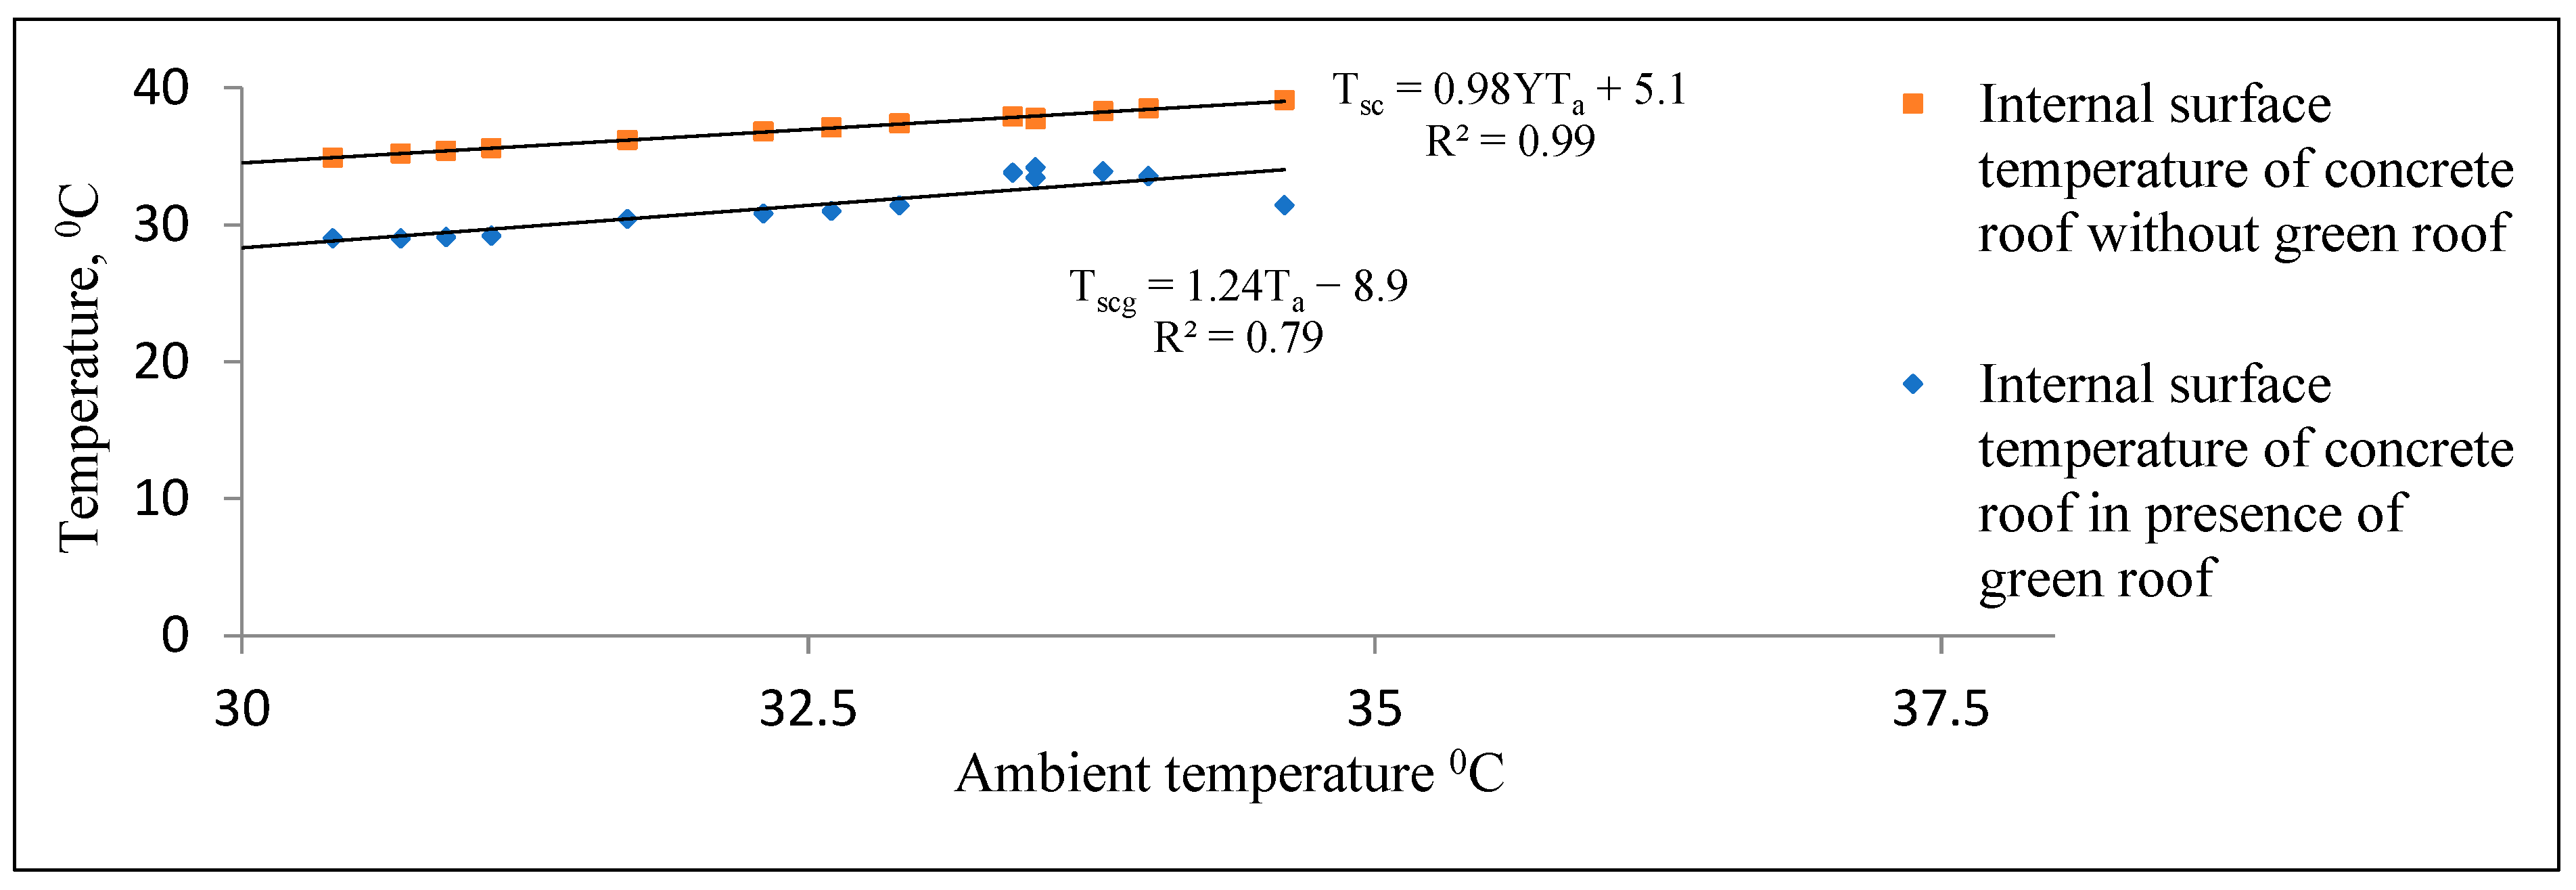
The modelled results for concrete structures with and without green roof are presented in Figure 30 and Figure 31 for spring and summer seasons respectively.
Figure 30.
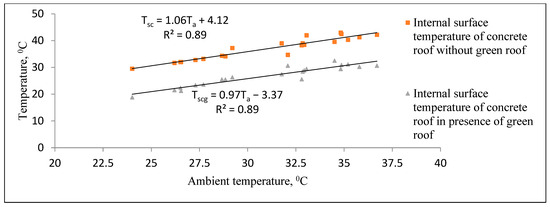
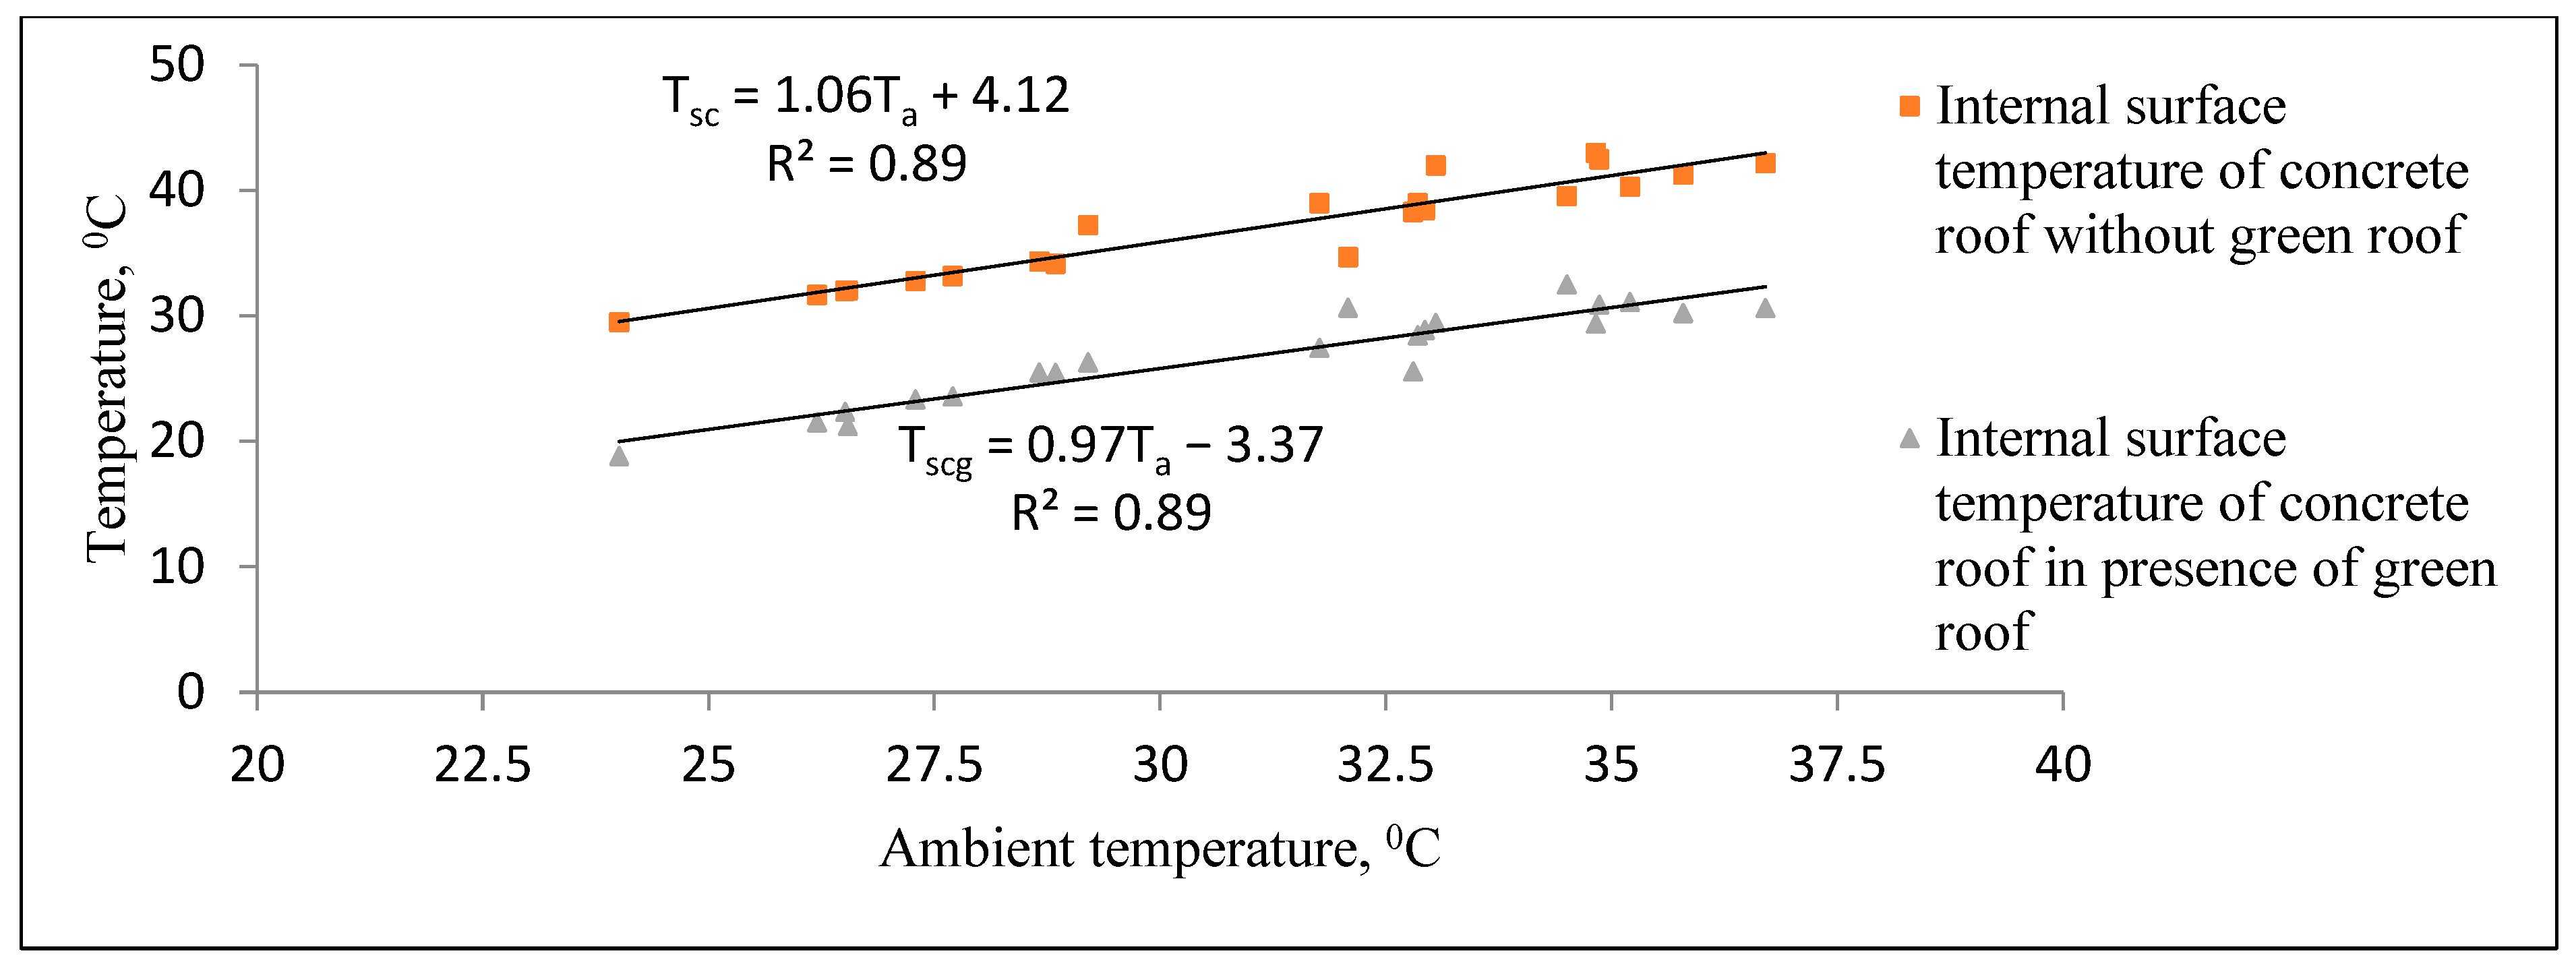
Peak temperature variation in internal surface of concrete roof in the presence of green roof in spring (16 November–30 November) [Tsc and Tscg refer to internal concrete roof surface without and with green elements respectively and Ta refers to ambient temperature].
Figure 31.
Peak temperature variation in internal surface of concrete roof in presence of green roof in summer (16 February–9 March) [Tsc and Tscg refer to internal concrete roof surface without and with green elements respectively and Ta refers to ambient temperature].
From the linear regression in Figure 30, it can be concluded that around 3.6 to 7.7 °C temperature reduction can be obtained in the internal surface temperature of a concrete roof with green roof system compared to a concrete roof without living wall system. On average, 5.6 °C lower temperature of the internal surface of a concrete roof can be obtained during springtime. Similarly, from Figure 31, it can be concluded that around 8 to 12 °C temperature reduction can be obtained in internal surface temperature of a concrete roof with green roof system compared to a concrete roof without green roof system. On average, 10 °C temperature of internal surface of a concrete roof can be obtained during summertime.
The omission of several critical factors in the model, including solar radiation variability, wind-induced convection and thermal inertia effects of concrete, may have contributed the discrepancies between predicted and measured values. It was observed by Convertino et al. [21] that the wind speed is an accountable variable which can affect the results. It was hypothesised that for commercial high-rise buildings, the increase in thermodynamic heat transfer was relative to the wind speed, claiming that the cooling energy requirements could be increased by up to 10% from high winds. In sub-tropical climates, where the humidity is much higher, it is believed that would further increase the heat gain. As the models created in this investigation do not consider the thermal effects of wind, perhaps this could explain the reason for some differences in experimental and modelled values. Additionally, moisture dynamics and evapotranspiration from vegetation layers, which significantly influence heat transfer in green roofs, are not explicitly included in the model.
It was also evident that the summer season was more sporadic. This could possibly be due to the summer season having more intense solar radiation than the spring.
In subtropical climates, evapotranspiration plays a key role in reducing surface temperature through latent heat exchange. The omission of this effect, along with humidity and microclimatic variations, introduces uncertainty in the quantitative estimation of cooling energy savings.
Future models should incorporate coupled heat and mass transfer processes, including moisture transport and latent heat effects, to improve predictive accuracy.
4.5. Evaluation of Application of Living Wall, Green Roof and Green Facade on Real Buildings
In the subtropical regions of Australia, the application of living walls, green roofs, and green façades in real buildings is still at an early stage, with only a limited number of implementations reported in commercial settings. One of the primary reasons for this slow adoption is the lack of reliable, real-world performance data. Therefore, it is essential to systematically investigate their thermal performance through comprehensive experimental measurements and analysis across different seasons, enabling the assessment of seasonal variability and overall effectiveness.
Once the thermal behaviour is established based on temperature data, the potential reduction in building cooling energy demand can be predicted with greater confidence. Furthermore, it may not be practical to directly implement living wall and green façade systems on buildings without first conducting detailed thermal and energy performance analyses tailored to specific climatic conditions.
Due to the lack of real-world performance data for living walls, green roofs, and green façades applied to commercial buildings, a computational investigation of their energy performance was undertaken. Four representative commercial buildings were selected for this study, and their key physical characteristics are summarised in Table 4. The analysis evaluates the cooling energy consumption of these buildings before and after the implementation of green technologies, thereby quantifying the potential energy savings achievable in practical scenarios.
Table 4.
Characteristics of the case-studied building.
4.5.1. The Living Wall
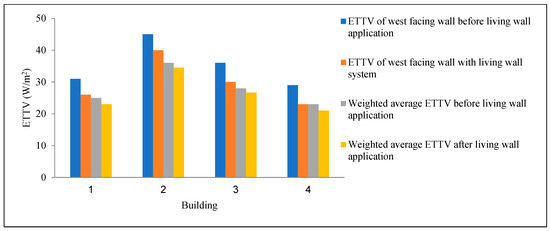
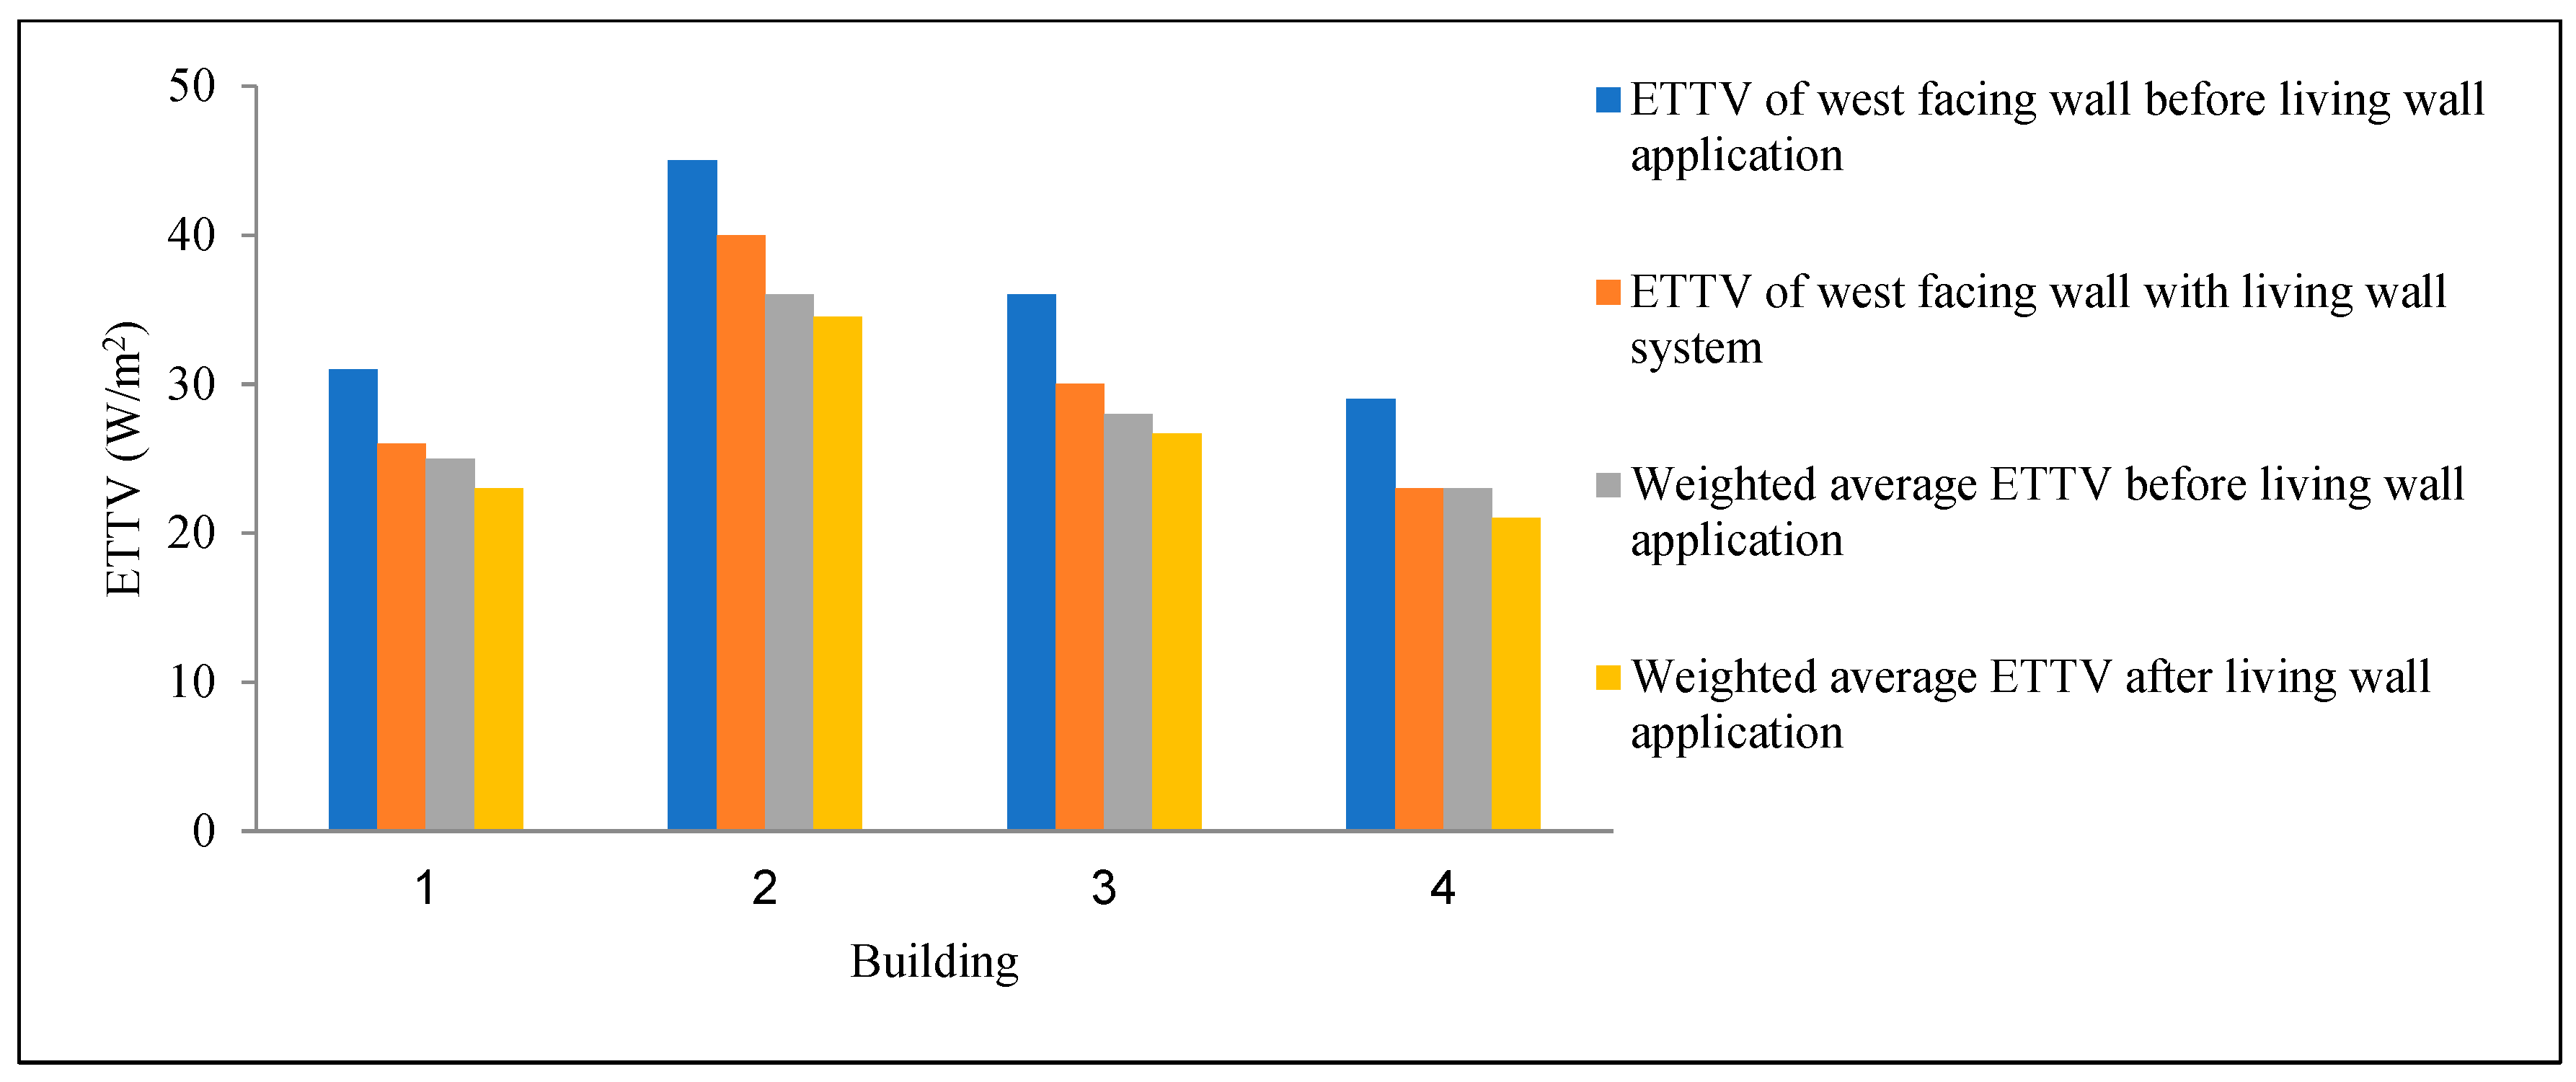
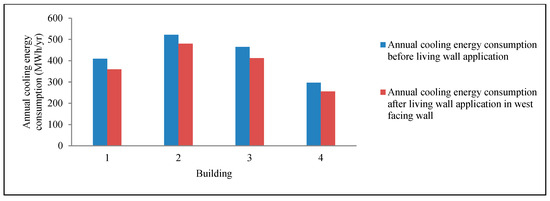
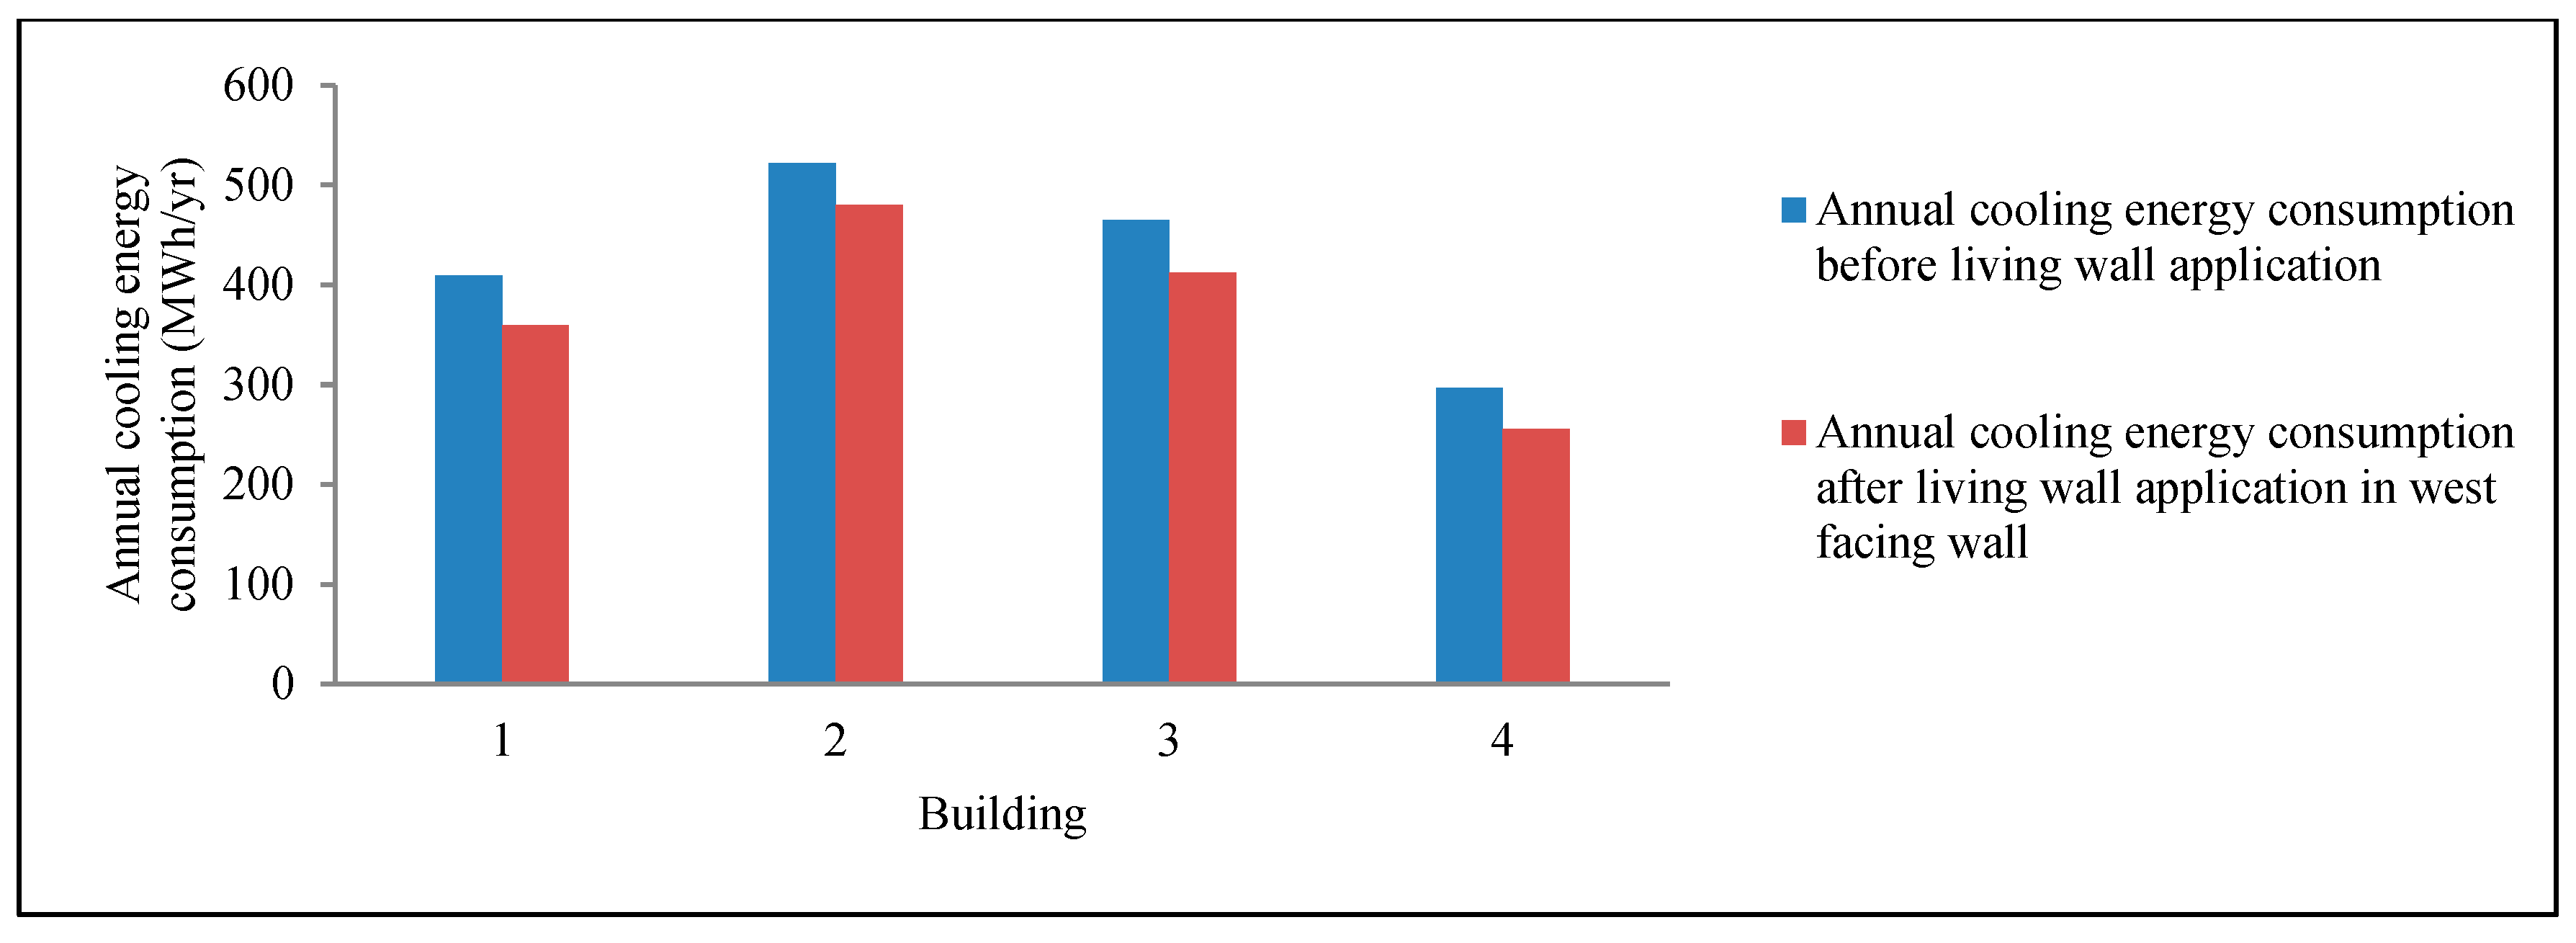
This study demonstrated that the air gap temperature was consistently lower than the ambient temperature; therefore, the presence of the living wall resulted in a reduction in the exterior wall temperature. Consequently, the living wall influenced the overall thermal transfer value (ETTV) of the building envelope. As the experimental setup was applied to a west-facing wall, a noticeable reduction in ETTV for this orientation was observed across all four case-study buildings, as illustrated in Figure 32. The weighted average ETTV across all orientations was found to be approximately 8–10% lower compared to buildings without a living wall system on the west-facing wall. This improvement translated into a reduction in annual cooling energy consumption of approximately 8–13%, as shown in Figure 33. The observed reduction in ETTV and cooling energy consumption is consistent with previous studies [22,23], which have demonstrated that vertical greenery systems can lead to measurable reductions in building heat gain and cooling energy demand, with the magnitude of improvement strongly dependent on façade configuration, vegetation characteristics, and climatic conditions. For example, reported energy savings in the literature typically range from a few percent up to around 5–10% under realistic building configurations. In the present study, the reduction in weighted average ETTV (8–10%) and cooling energy consumption (8–13%) is within or slightly above this reported range, thereby supporting the validity of the experimental and modelling approach.
Figure 32.
ETTV of west-facing wall and weighted average ETTV of case-studied building before and after living wall application on west-facing wall.
Figure 33.
Cooling energy consumption before and after living wall application.
However, the present work extends beyond these studies by explicitly linking experimentally measured temperature reductions to ETTV-based energy performance metrics. This provides a more comprehensive framework for evaluating the effectiveness of vertical greenery systems in real building applications, particularly in subtropical environments.
4.5.2. Green Facade System on Wall
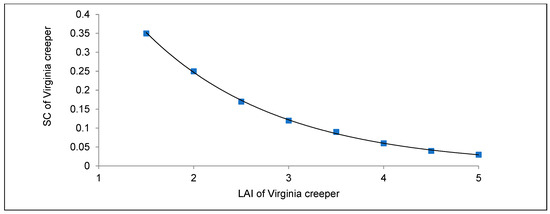
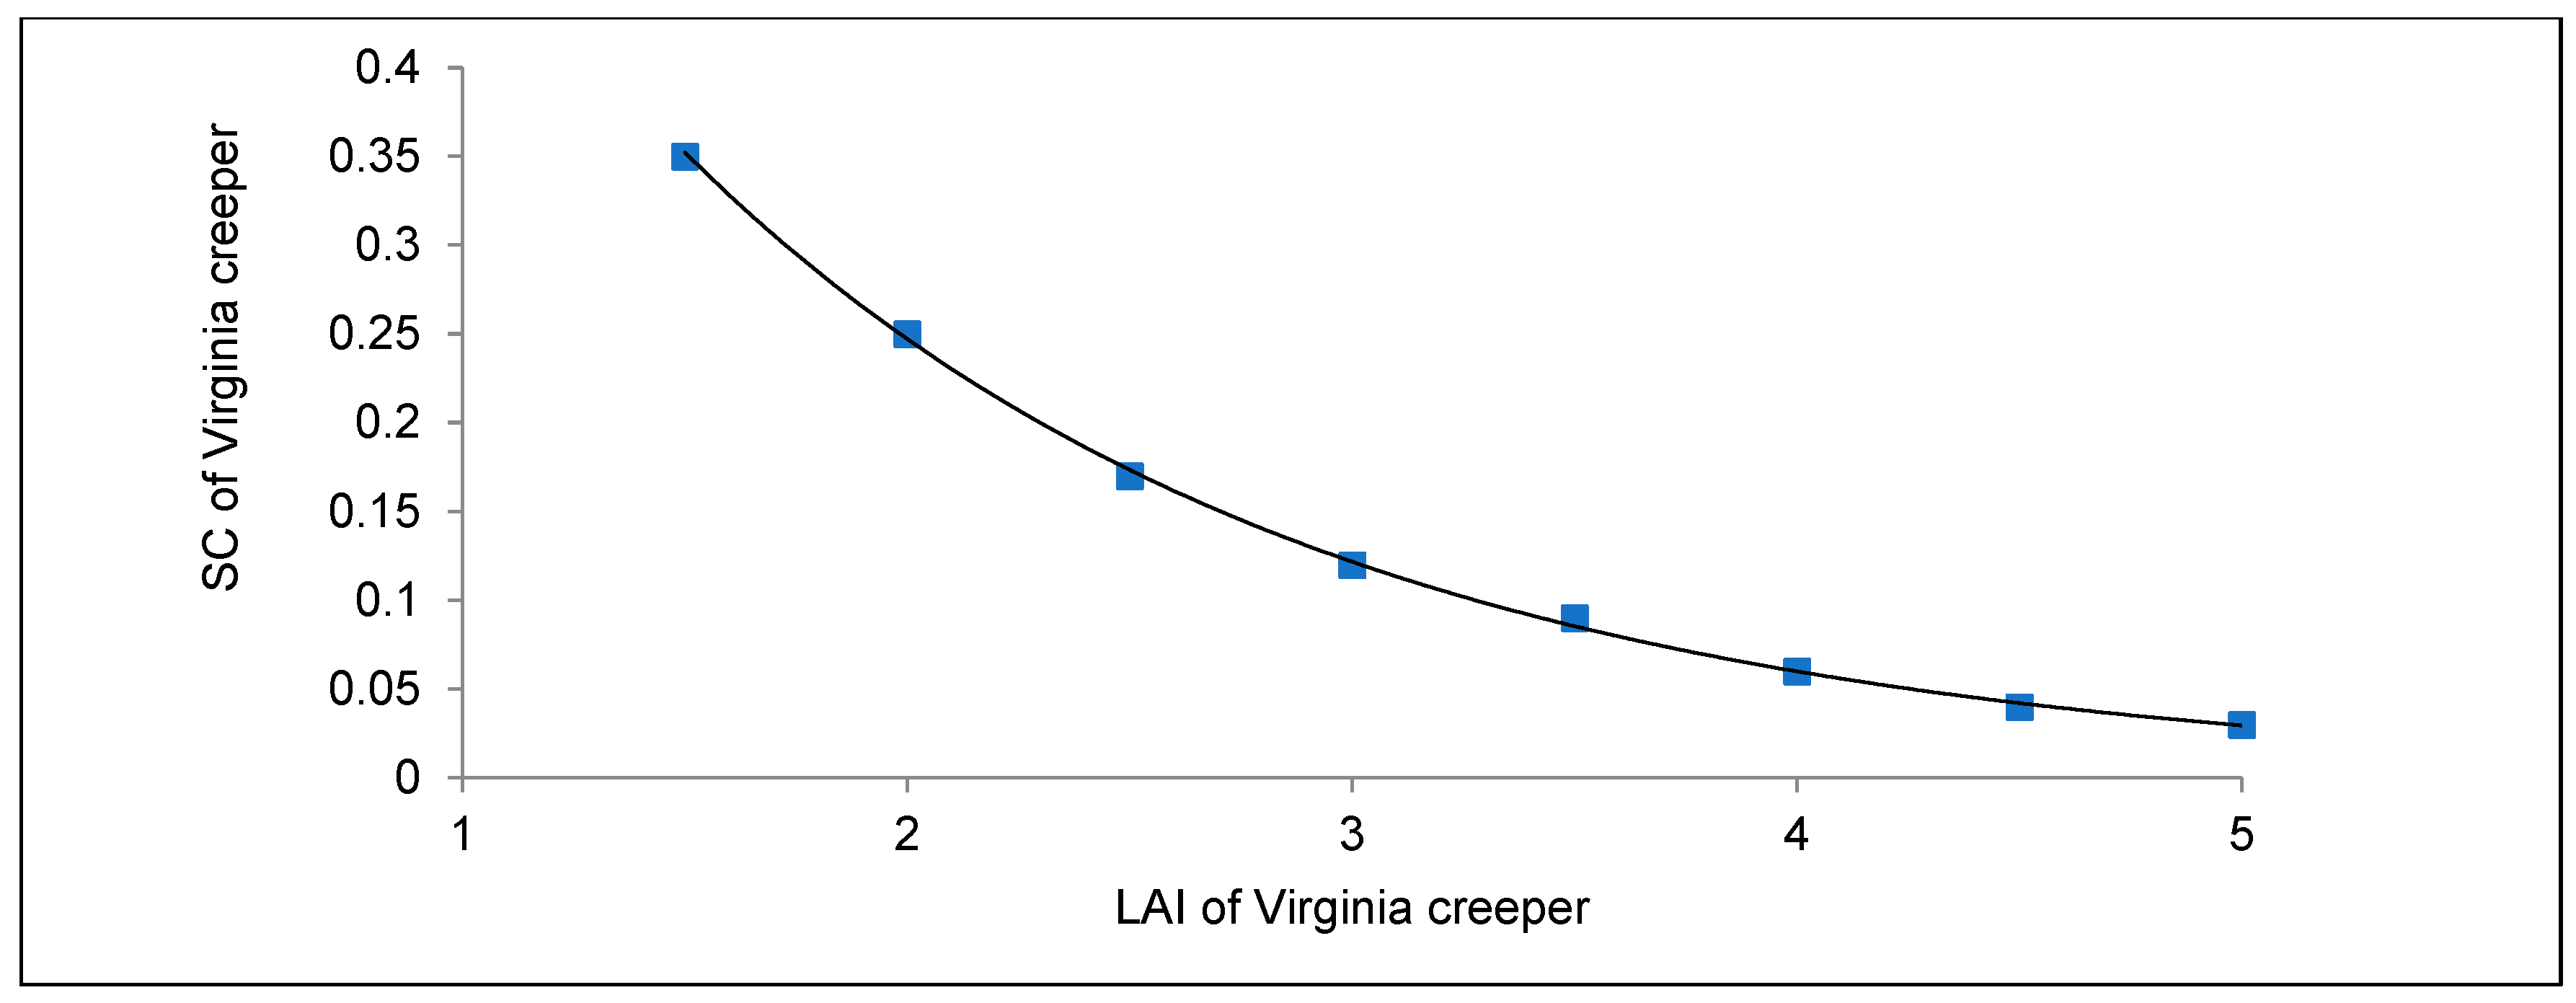
The calculated total solar irradiation, including both direct and diffuse components transmitted through the Virginia creeper canopy in a green façade system, was used to determine the predicted shading coefficient of the vegetation under subtropical Australian climatic conditions. An exponential relationship was observed between the shading coefficient and the leaf area index (LAI). Specifically, the shading coefficient was highest at lower LAI values and decreased with increasing LAI, as illustrated in Figure 34.
Figure 34.
Relationship and SC of Virginia creeper.
When applied in front of a building wall, the shading coefficient of Virginia creeper effectively functions as an external shading factor, reducing incident solar radiation and contributing to façade cooling for specific orientations. Using the mathematical model presented earlier, the resulting heat gain and cooling energy performance of commercial buildings incorporating a green façade on the west-facing wall were also quantified. These findings highlight the critical role of façade orientation in maximising the effectiveness of passive cooling strategies.
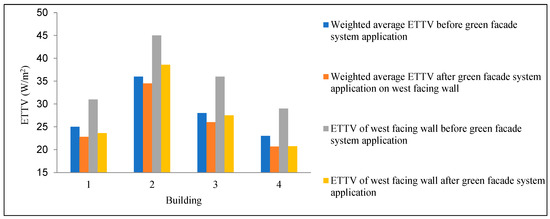
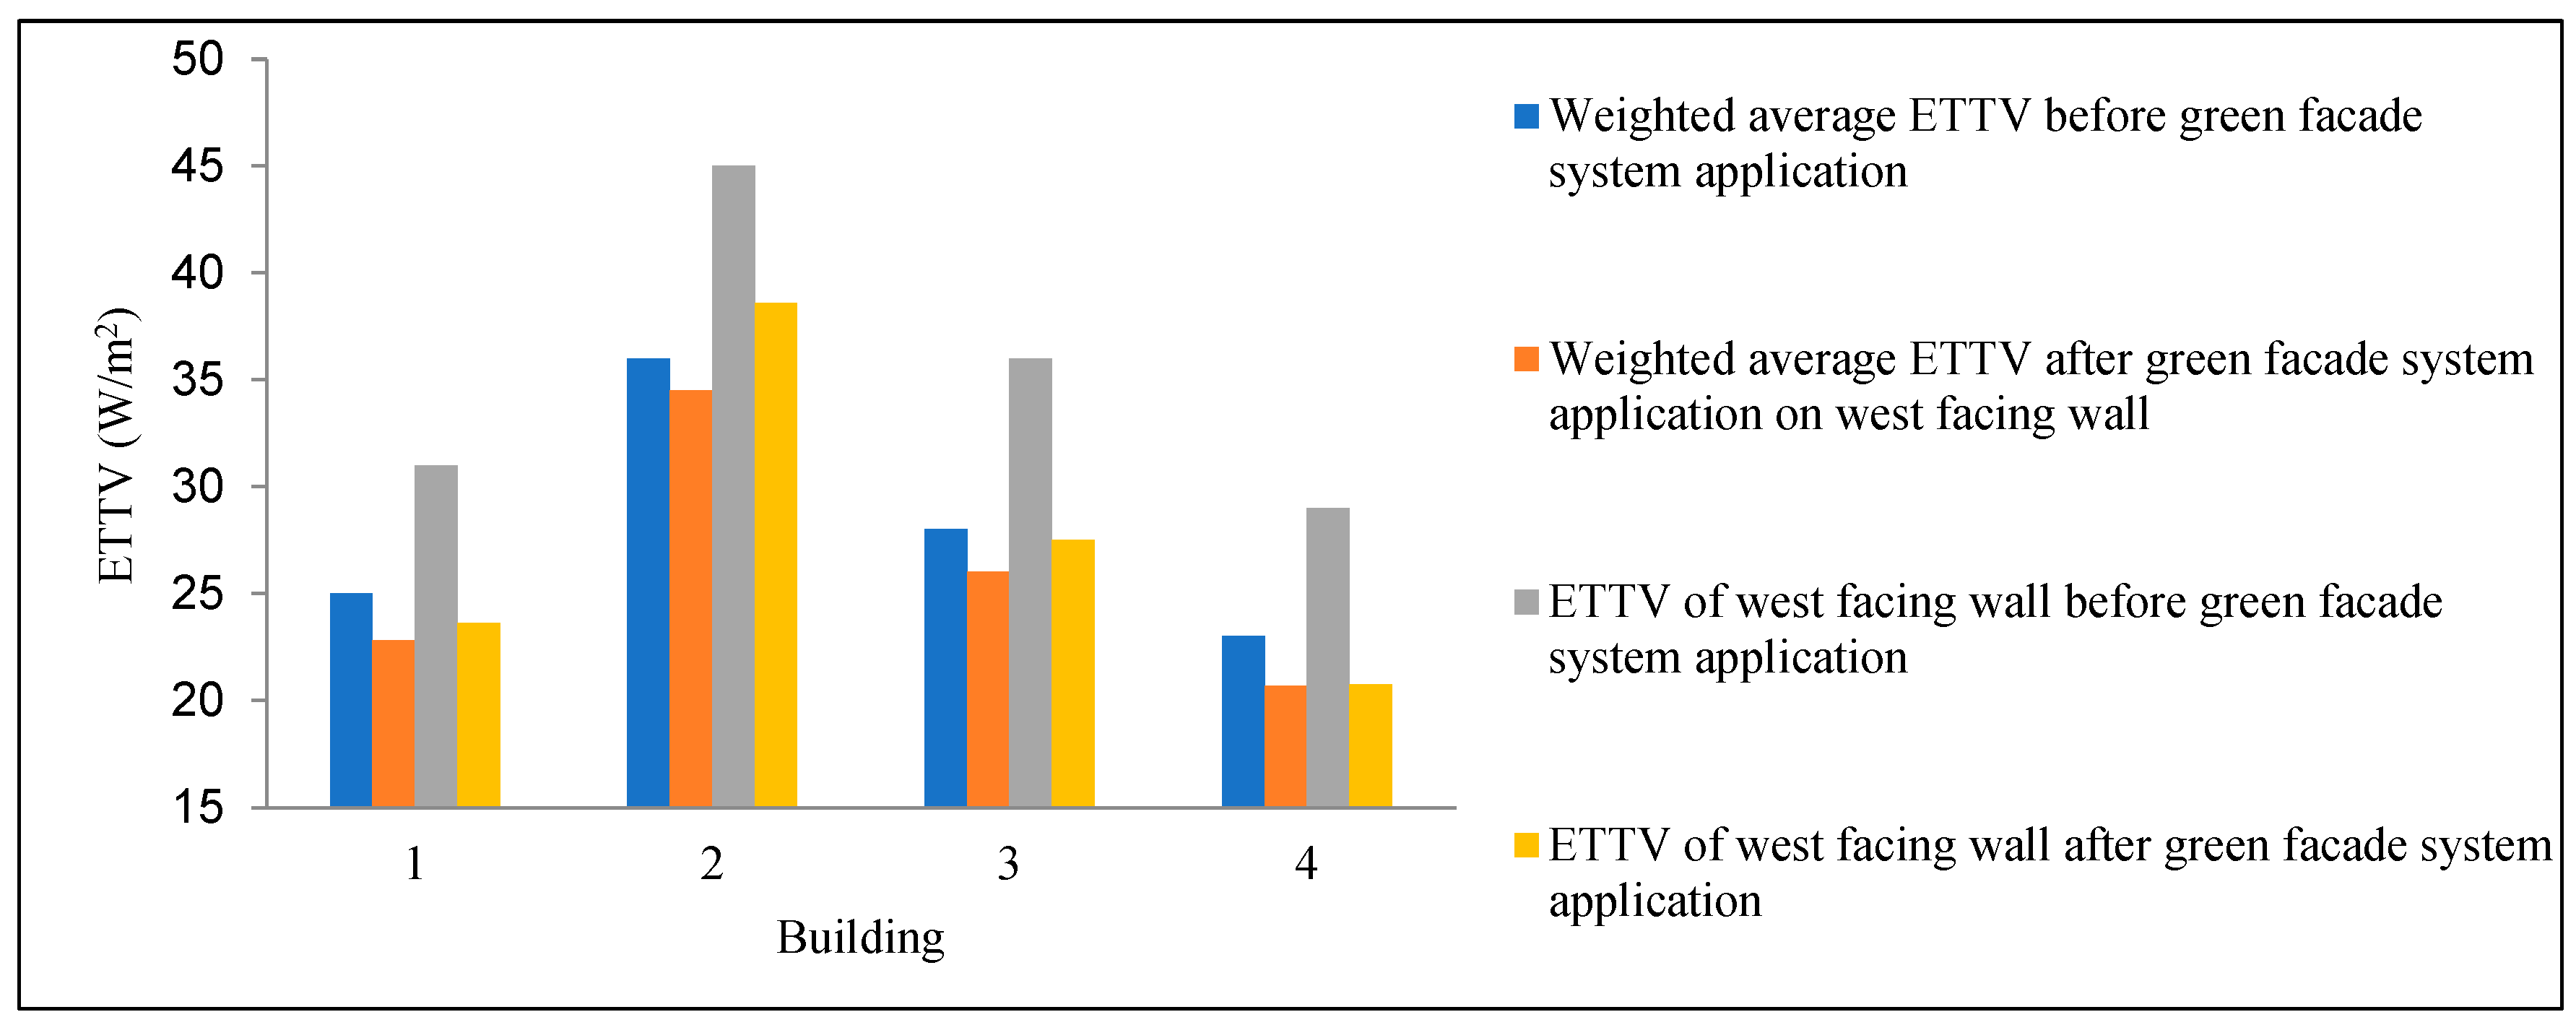
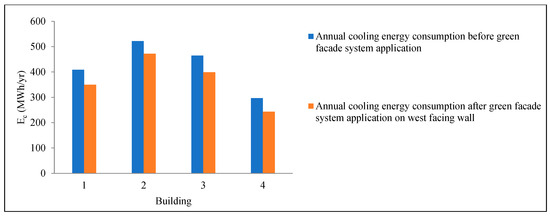
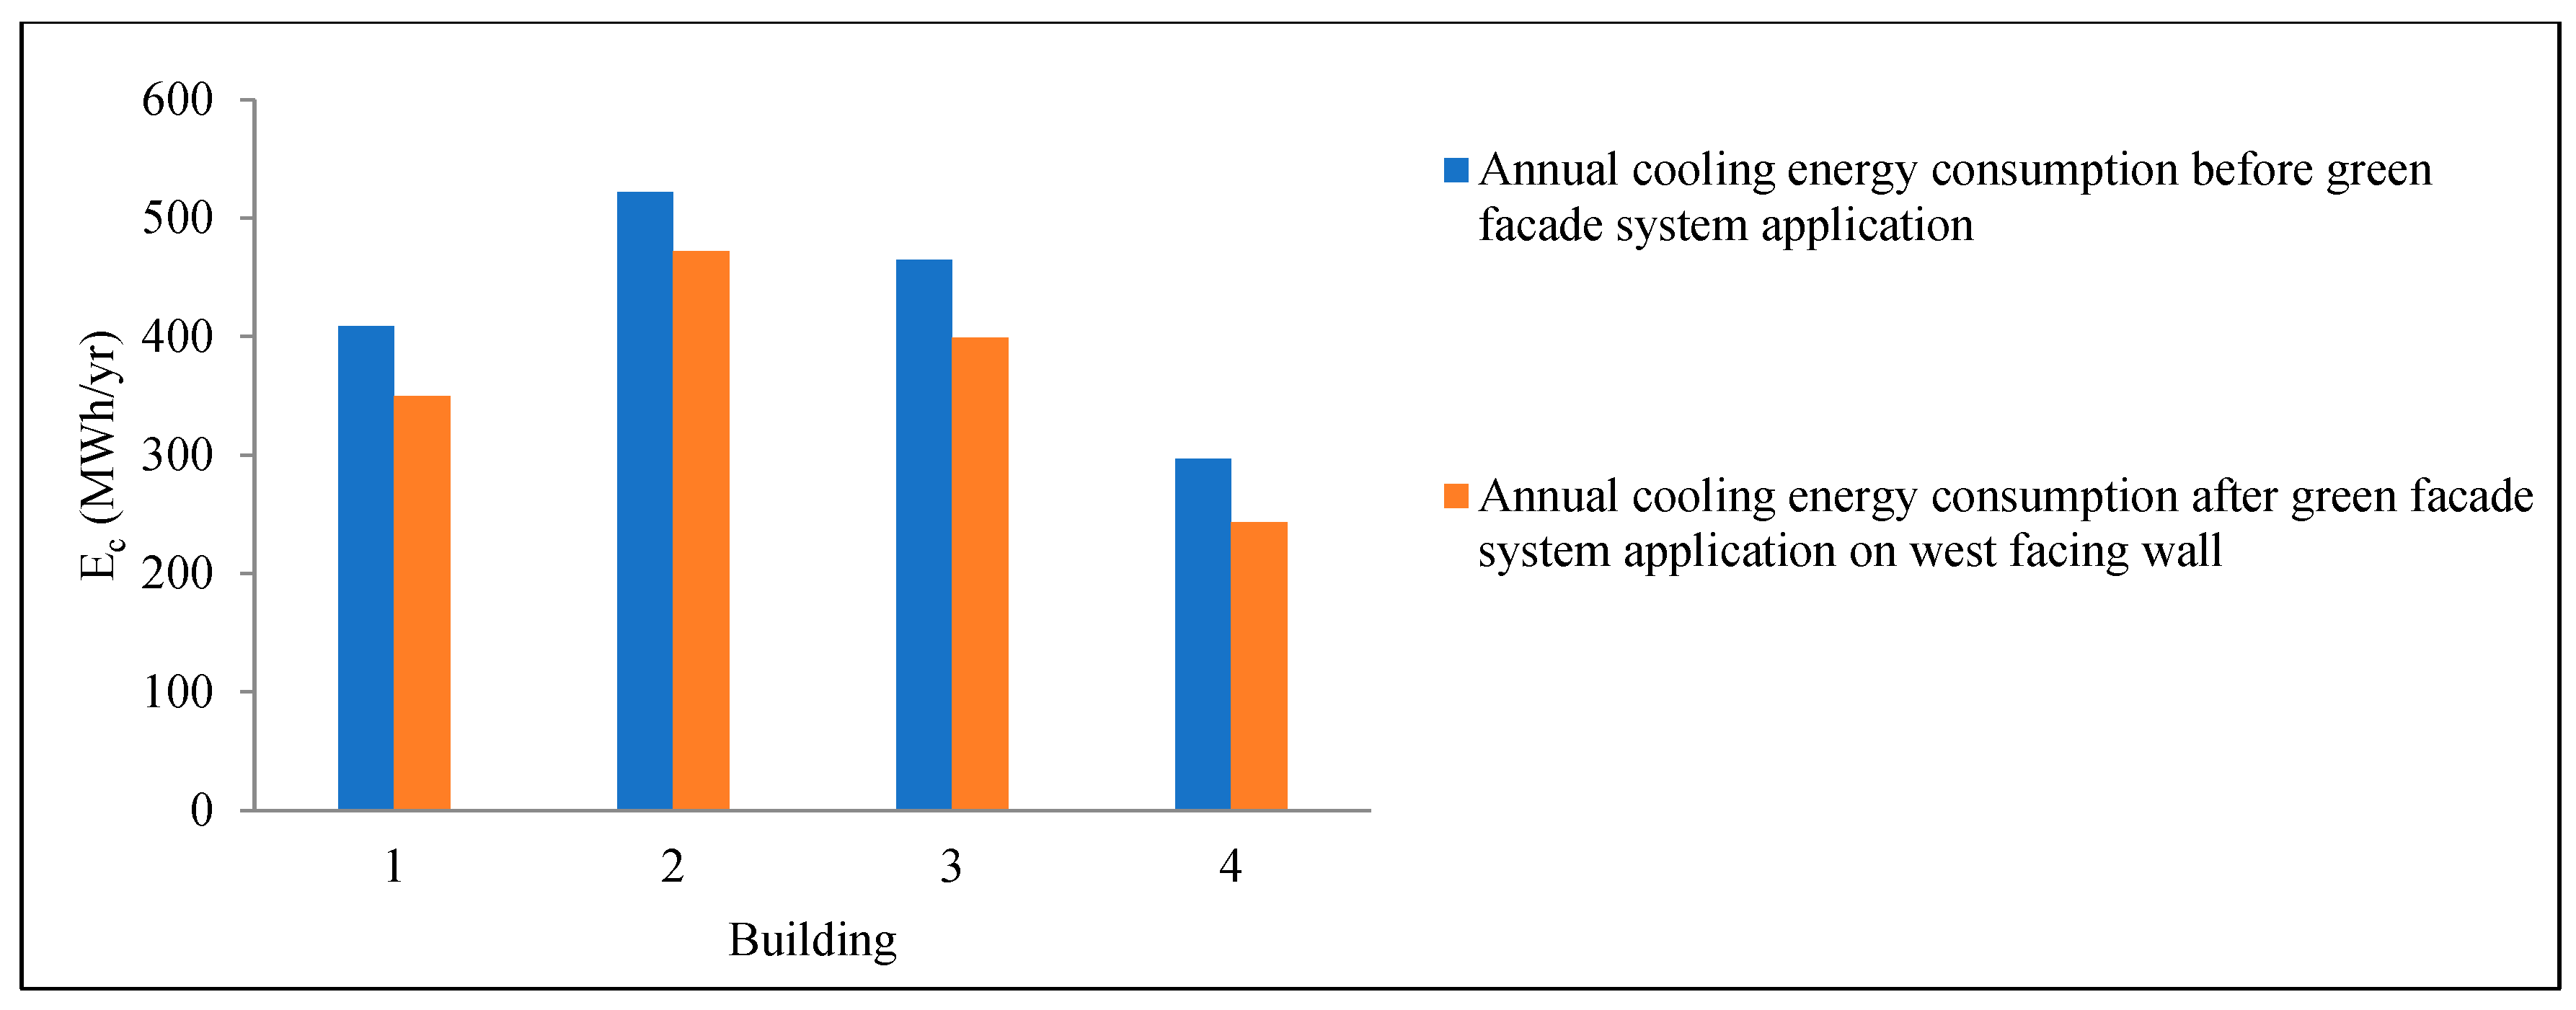
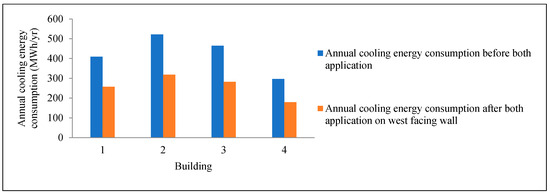
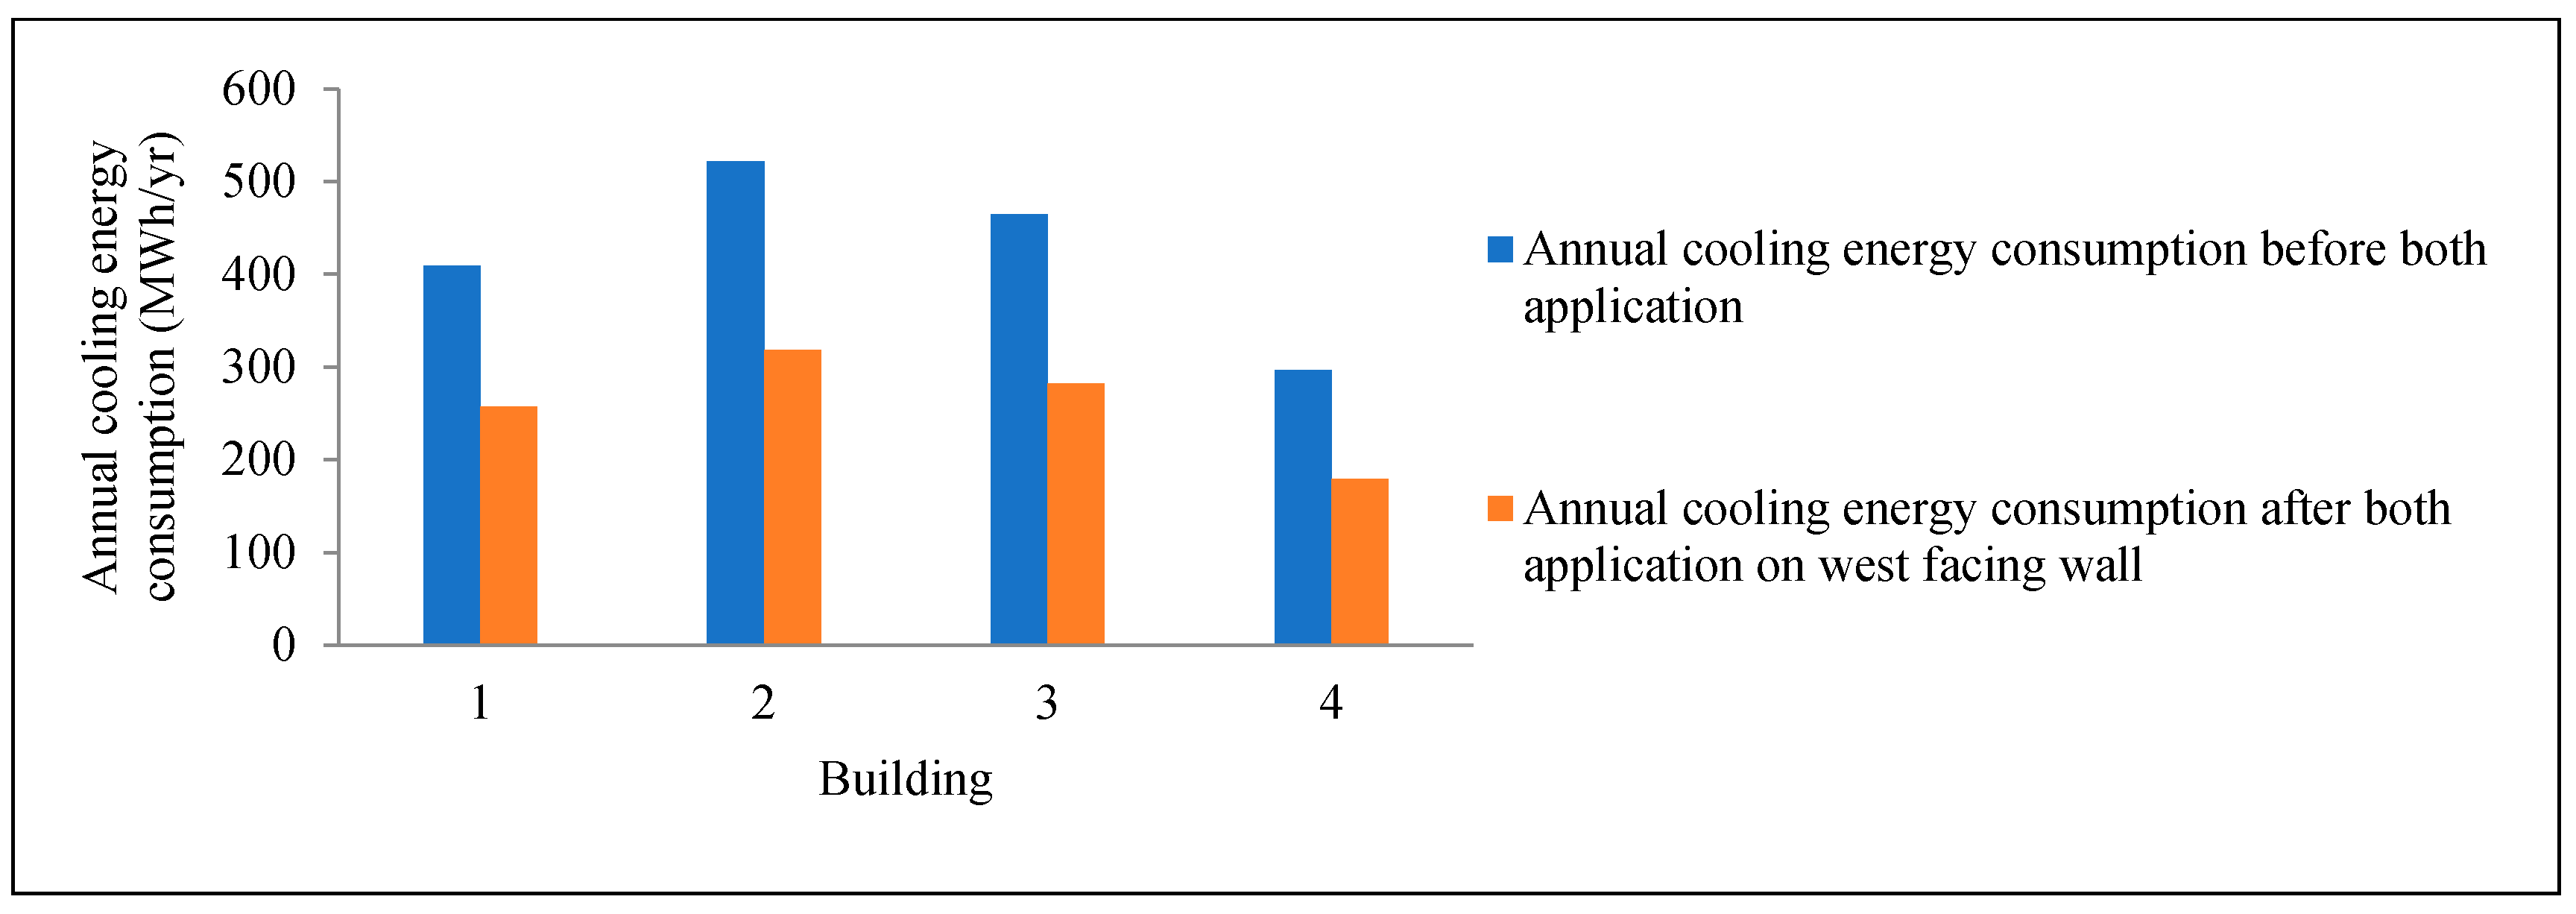
From Figure 35, it was depicted that weighted average ETTV was reduced to 8–10% in each case-studied building. Again, the reduction was significant in west-facing wall and it was between 23 and 29; the total annual cooling energy consumption of commercial building was reduced to 9.5–18% due to green façade system application as shown in Figure 36.
Figure 35.
ETTV of west-facing wall and weighted average ETTV of case-studied buildings.
Figure 36.
Annual cooling energy consumption before and after green facade application on west-facing wall.
4.5.3. Green Facade System on Window
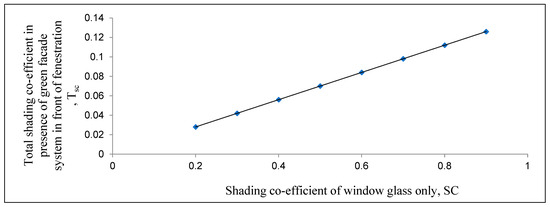
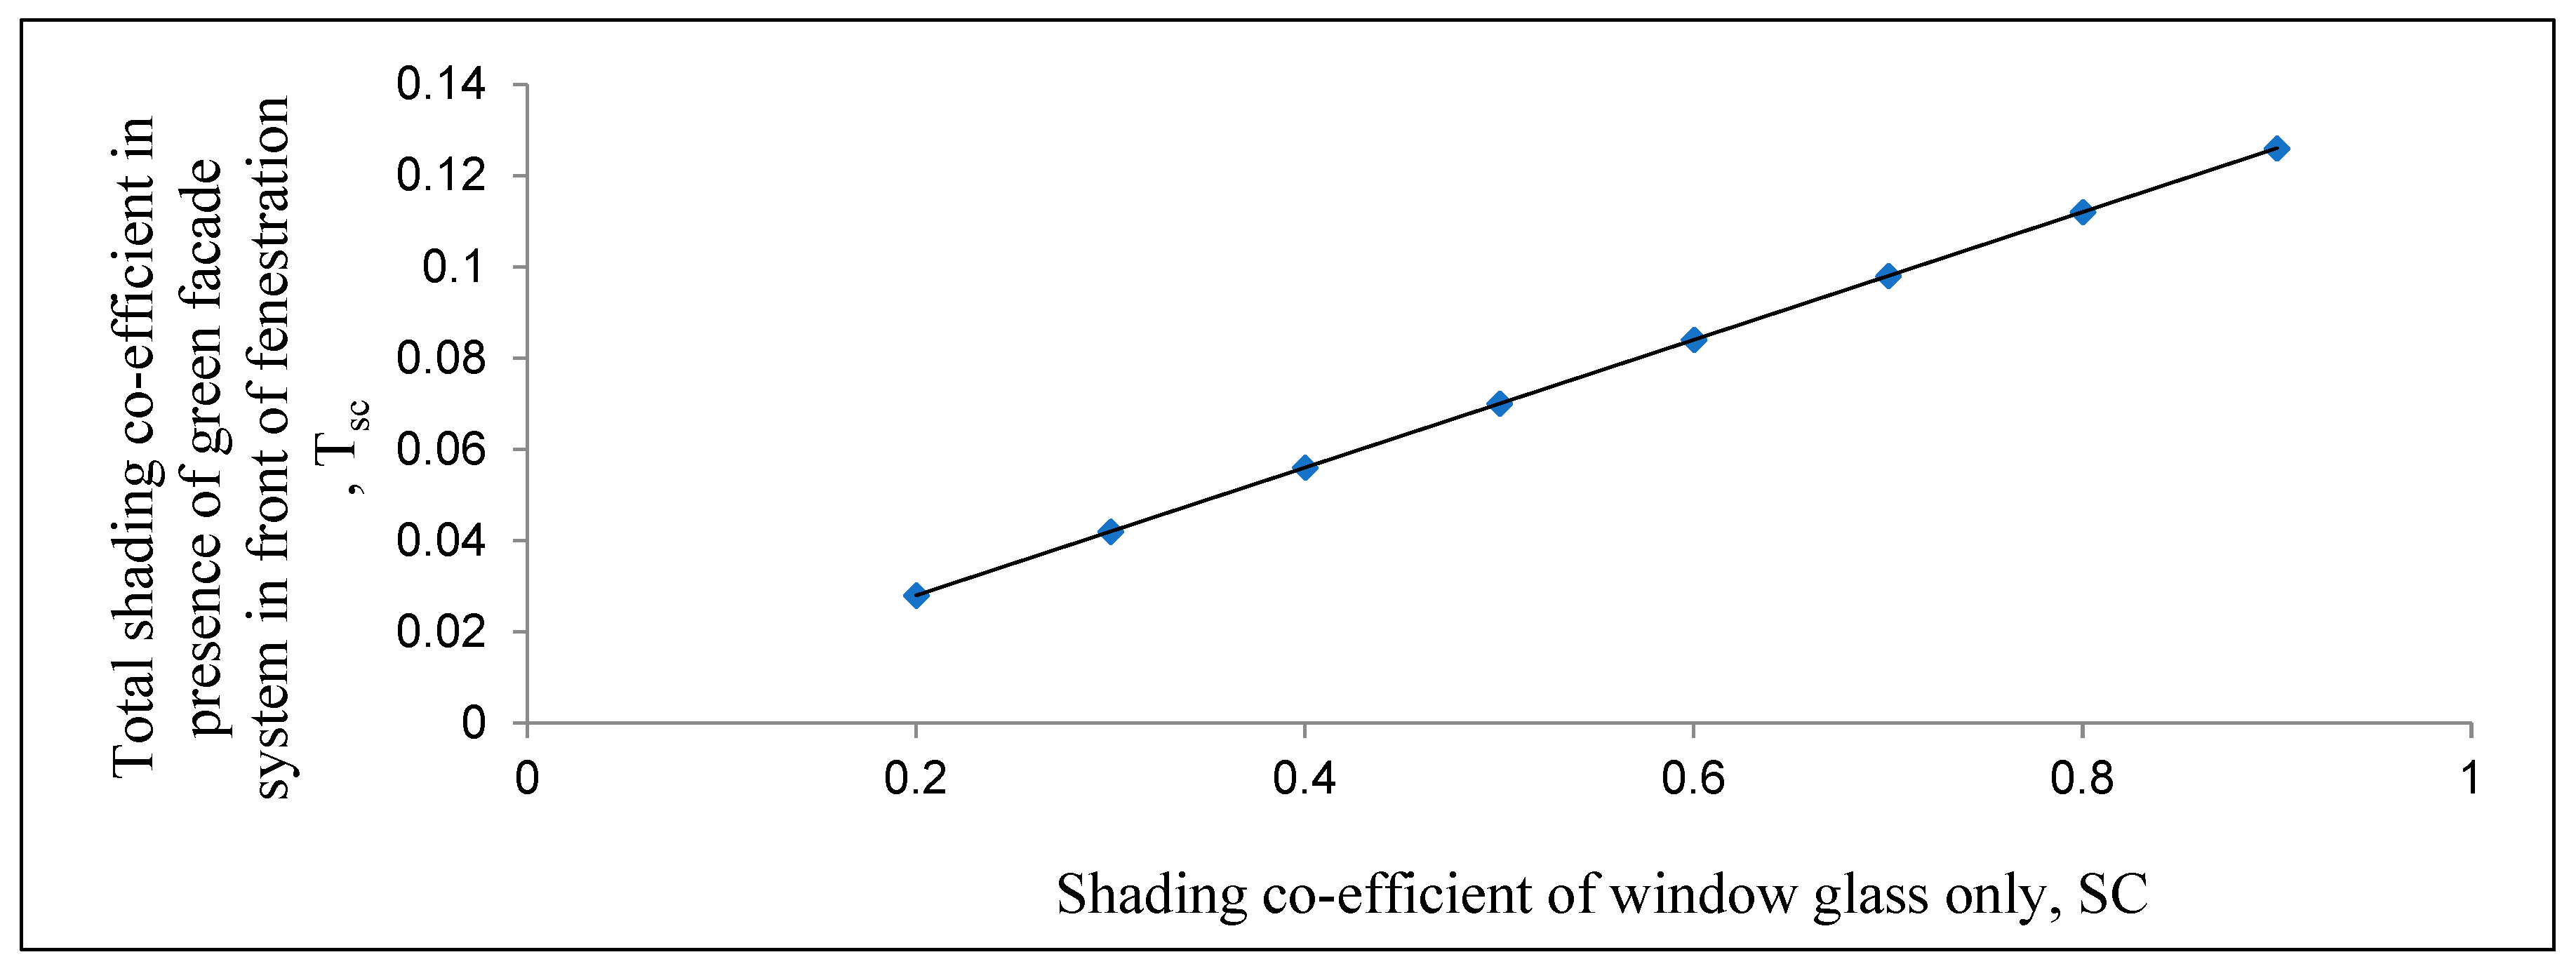
The average value of shading coefficient of Virginia creeper was 0.14 and it was considered during heat gain and cooling energy estimation. The total shading coefficient value of the fenestration system was lower as external shading coefficient value due to Virginia creeper’s shading coefficient affected the total shading coefficient as shown in Figure 37.
Figure 37.
The relationship between shading coefficient of window and total shading coefficient in presence of green facade system.
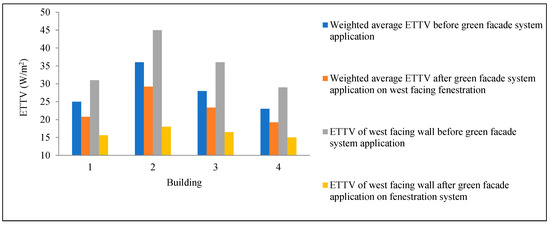
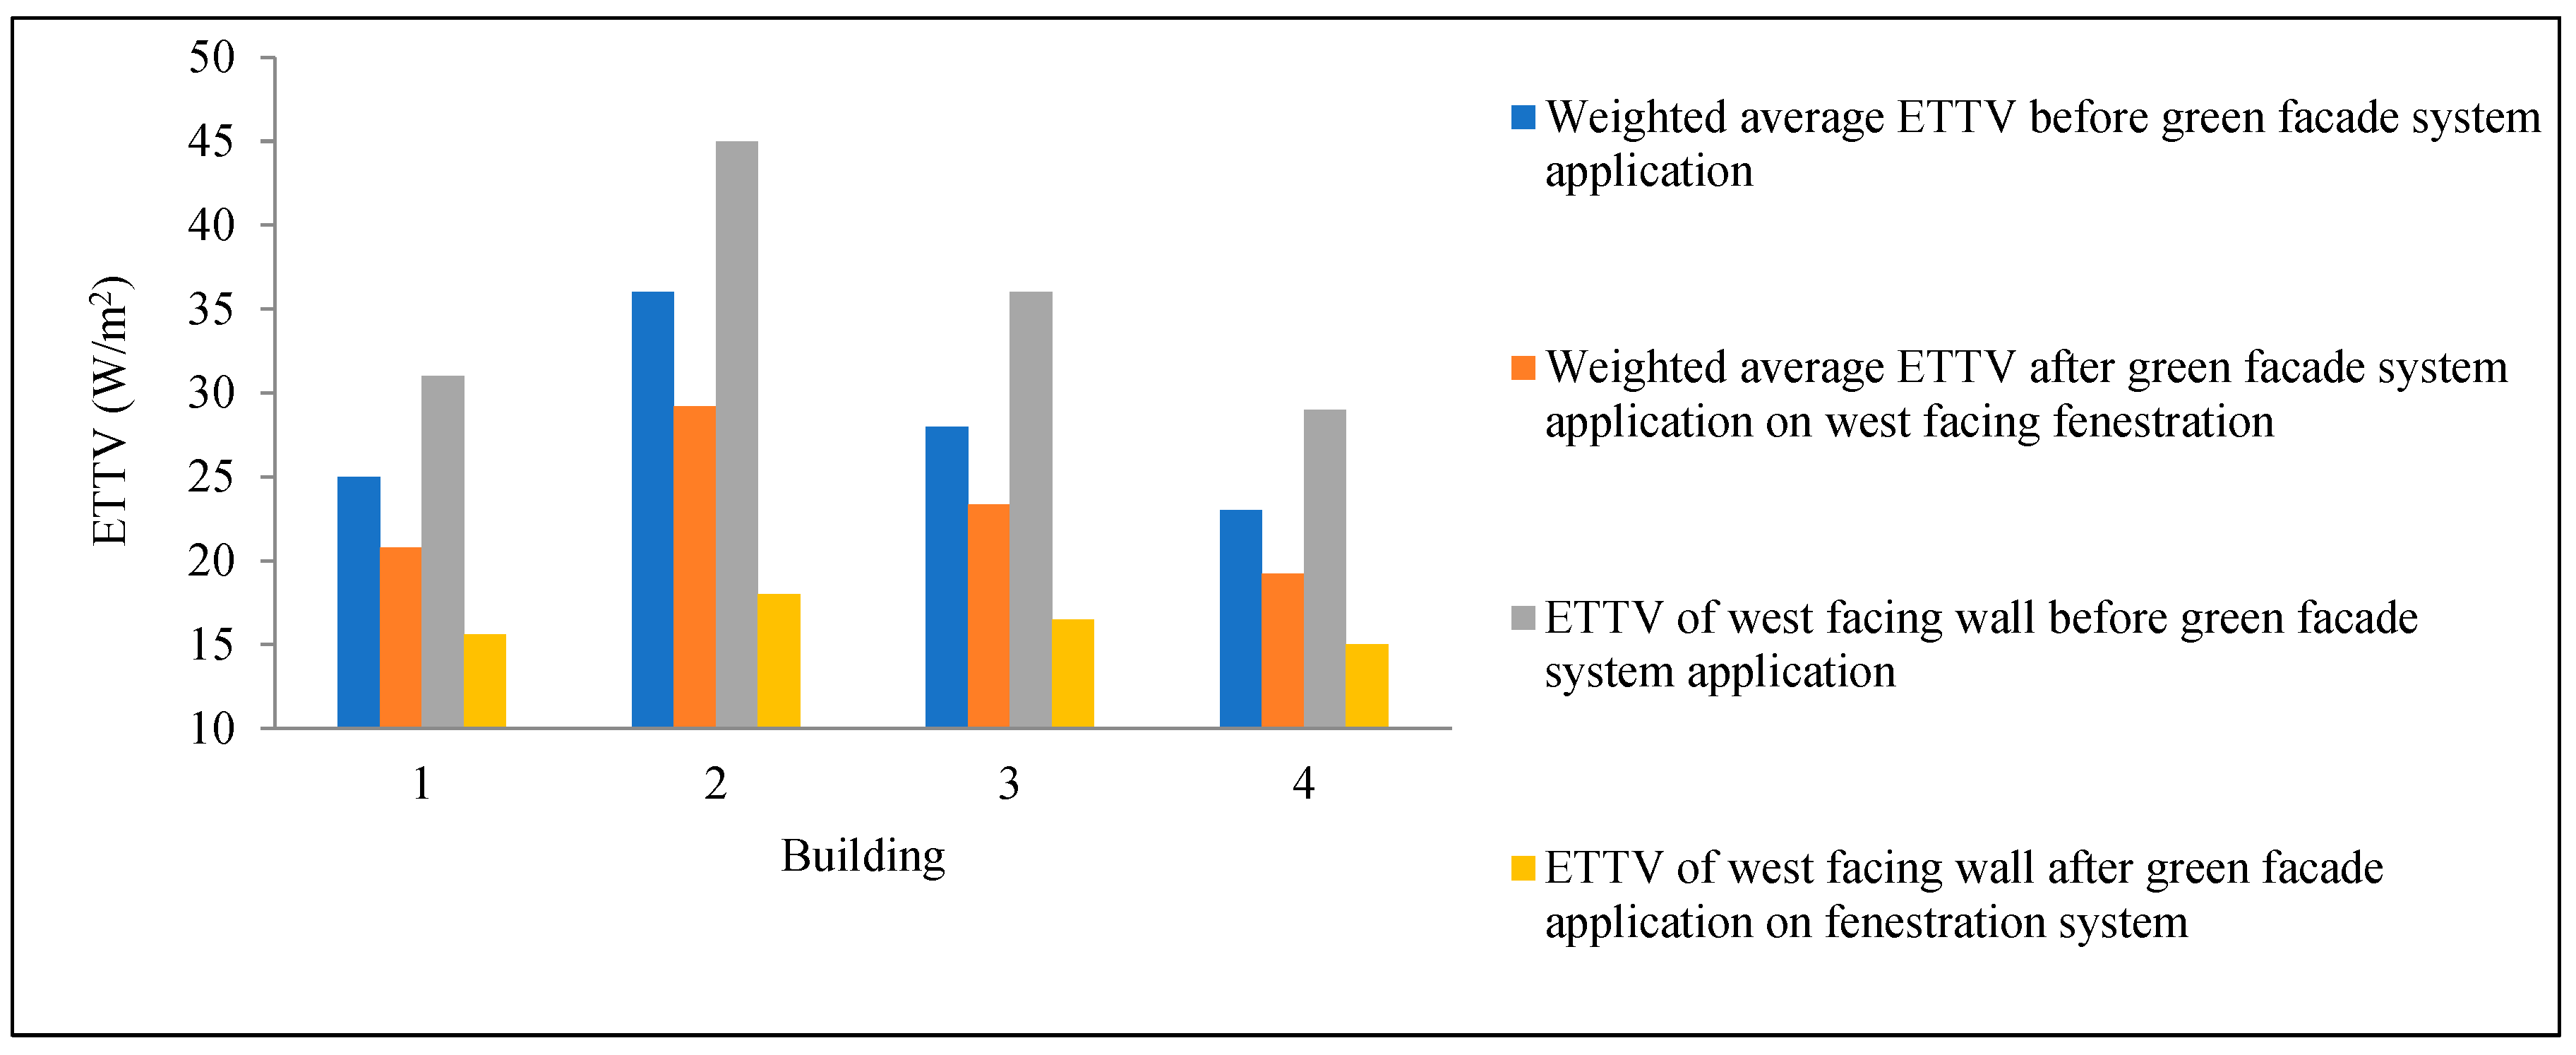
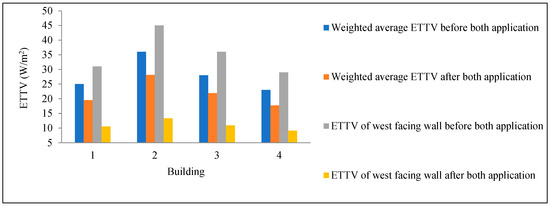
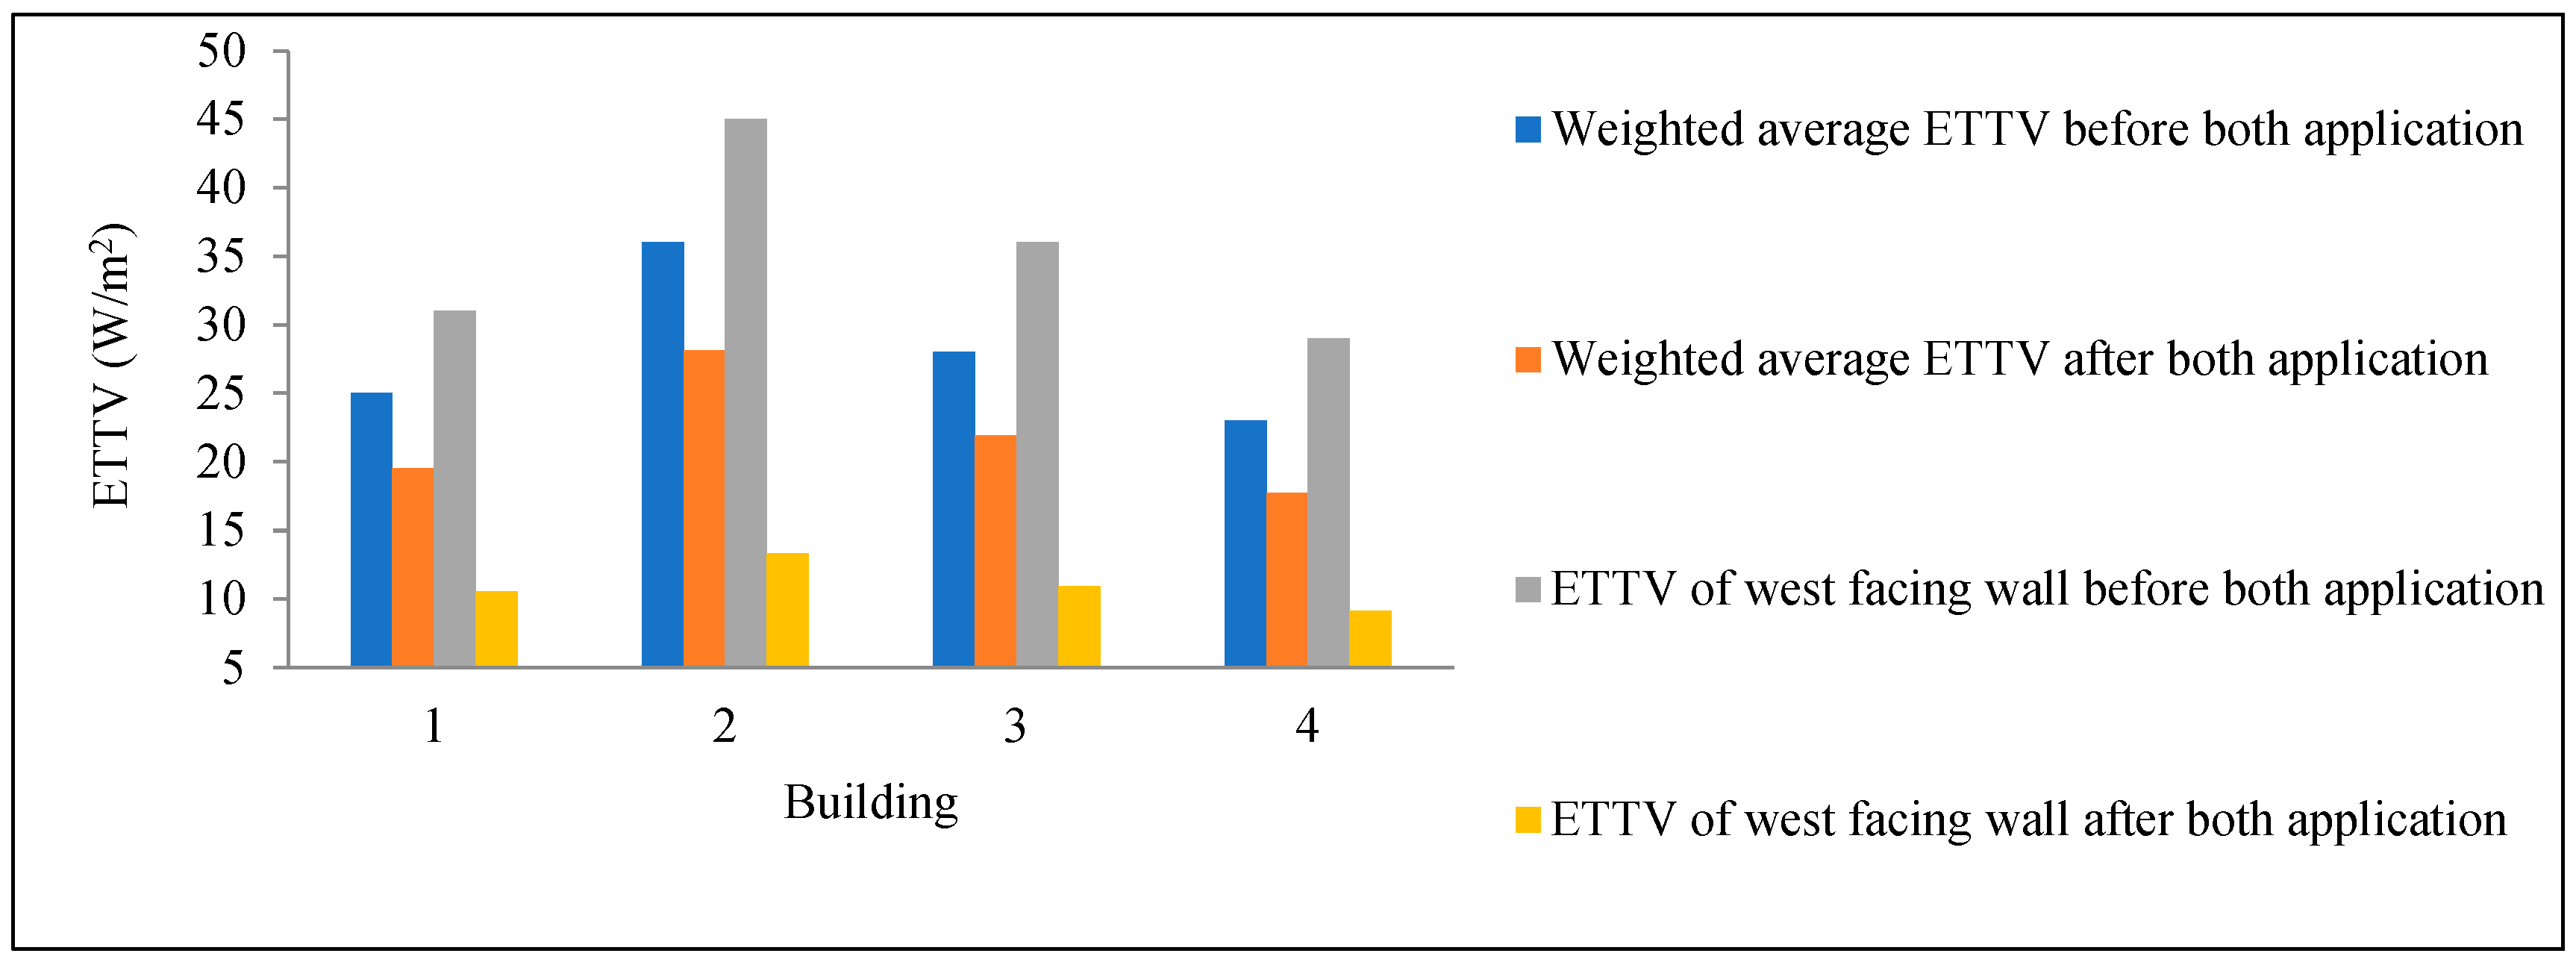
Using the mathematical model developed, the heat gain and cooling energy performance of a commercial building with a green façade applied to the west-facing window were quantified. As illustrated in Figure 38, the weighted average ETTV decreased due to the application of the green façade on the fenestration portion of the west-facing wall. Across all case-study buildings, the weighted average ETTV was reduced by approximately 16–18%. However, the reduction was more pronounced for the west-facing wall itself, ranging between 48% and 60% depending on the building configuration.
Figure 38.
ETTV of west-facing wall and weighted average ETTV after green facade application on west-facing fenestration.
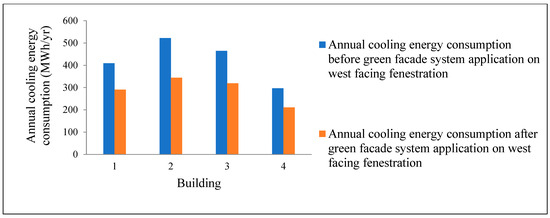
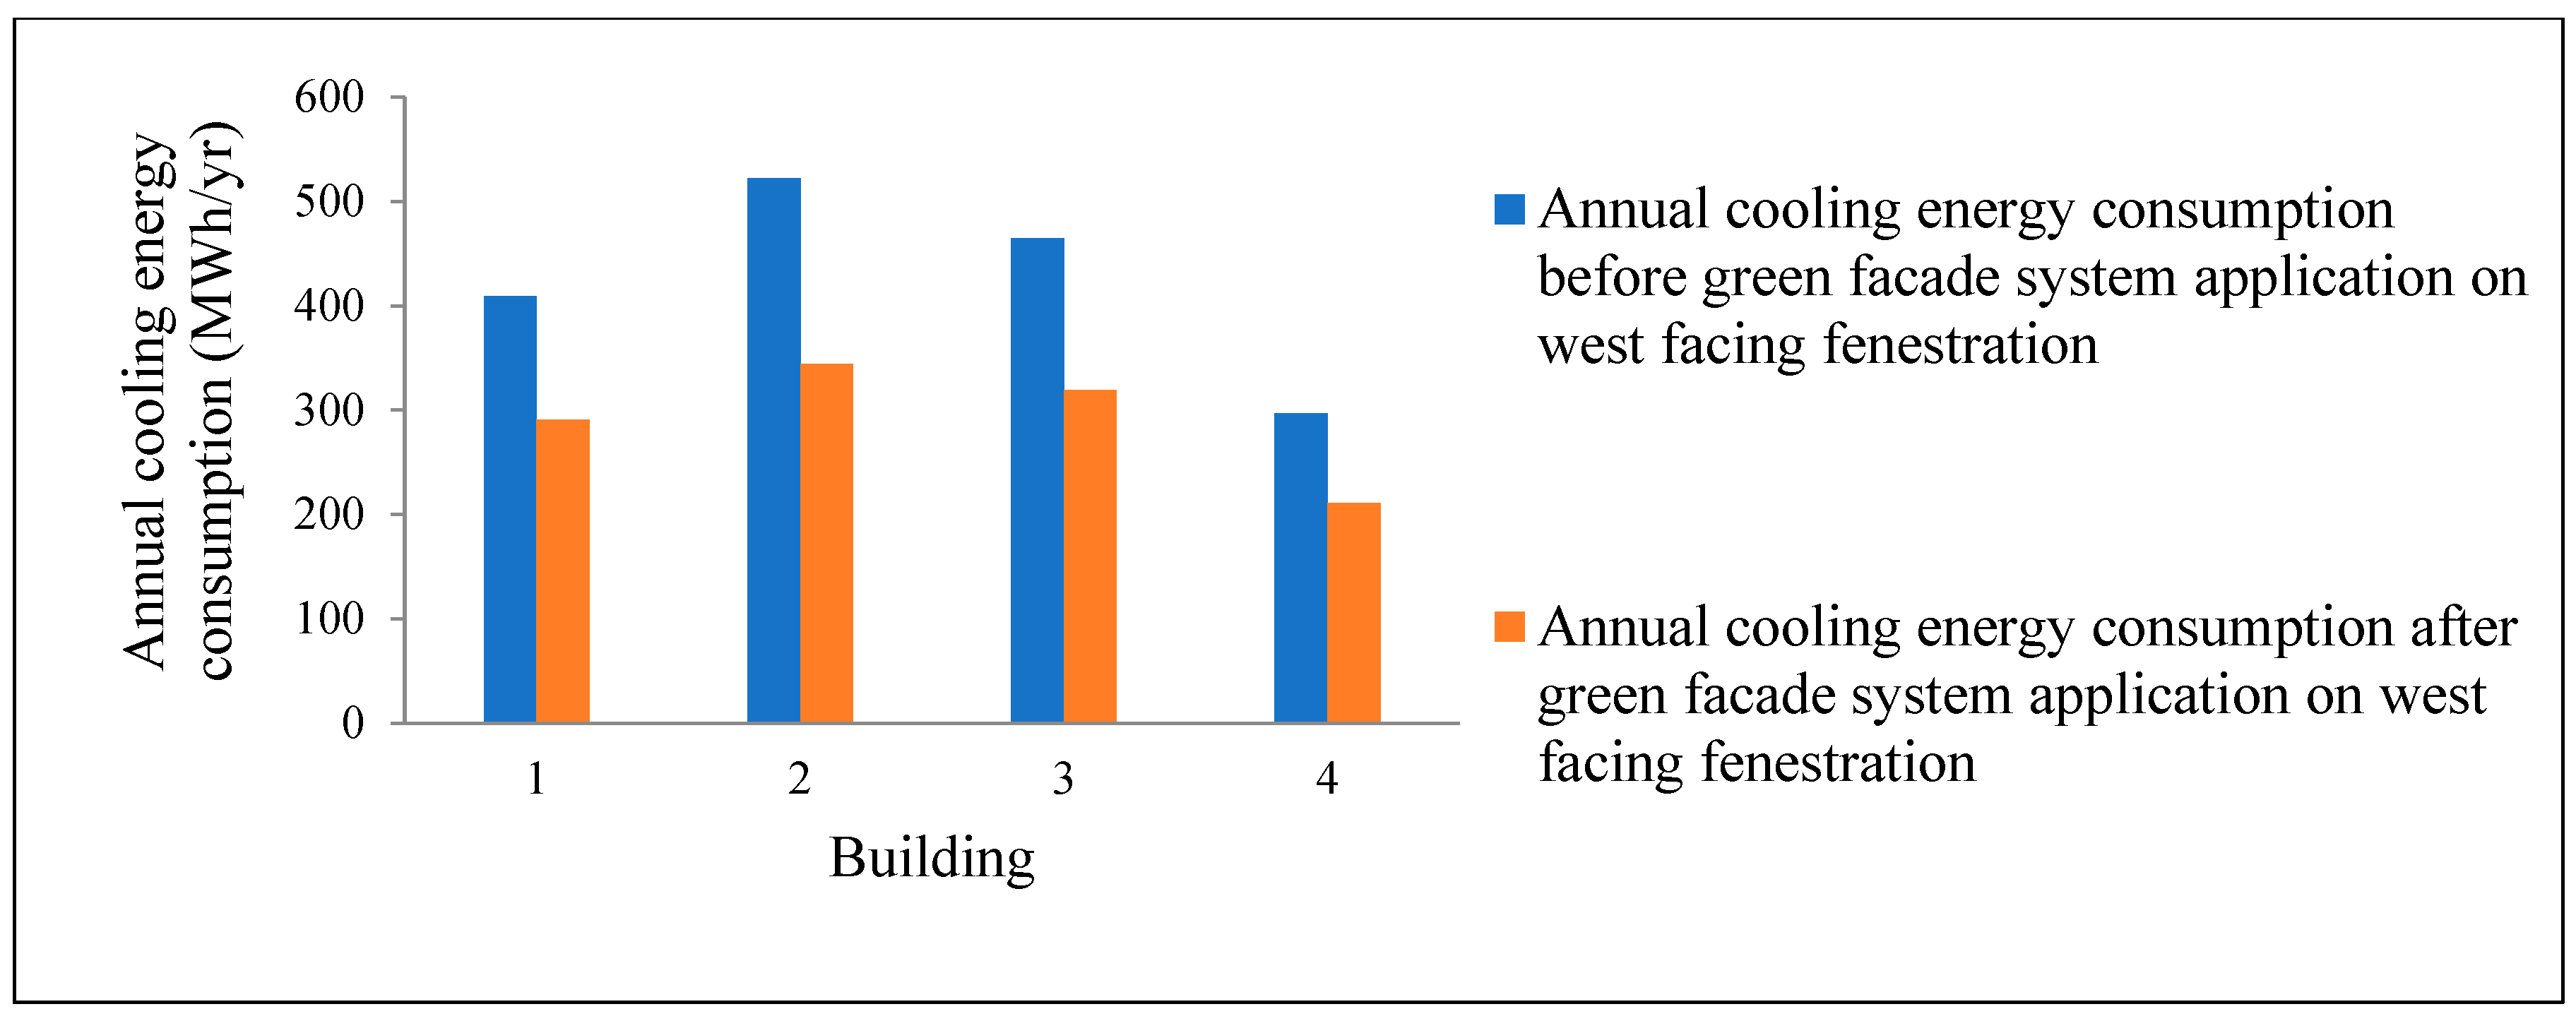
Overall, the annual cooling energy consumption of the commercial buildings decreased by approximately 28–35% following the application of the green façade system to the west-facing wall, as shown in Figure 39.
Figure 39.
Annual cooling energy consumption before and after green facade application on west-facing window.
4.5.4. A Combination of Living Wall and Green Facade
Figure 40 illustrates that the weighted average ETTV is reduced when a combined system—comprising a living wall applied to the opaque portion and a green façade applied to the fenestration—was implemented on the west-facing wall. Across all case-study buildings, the weighted average ETTV decreased by approximately 21–23%.
Figure 40.
ETTV of west-facing wall and weighted average ETTV after combined living wall and green facade application.
The reduction was more pronounced for the west-facing wall itself, where ETTV decreased by approximately 65–70%, depending on the building configuration. This substantial improvement demonstrates the effectiveness of integrating both systems on different façade components.
Overall, the annual cooling energy consumption of the commercial buildings was reduced by approximately 37–40% following the application of the combined green façade and living wall system on the west-facing walls, as shown in Figure 41. These results indicate a strong synergistic effect, where the combined application of both systems delivers greater performance improvements than individual implementations.
Figure 41.
Annual cooling energy consumption before and after combined living wall and green facade application.
4.5.5. Combination of Living Wall and Green Roof
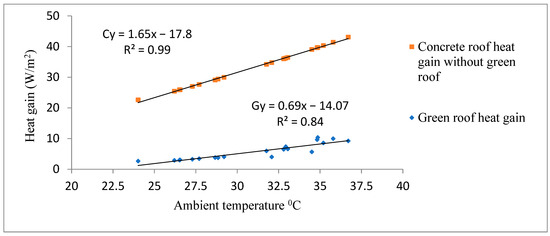
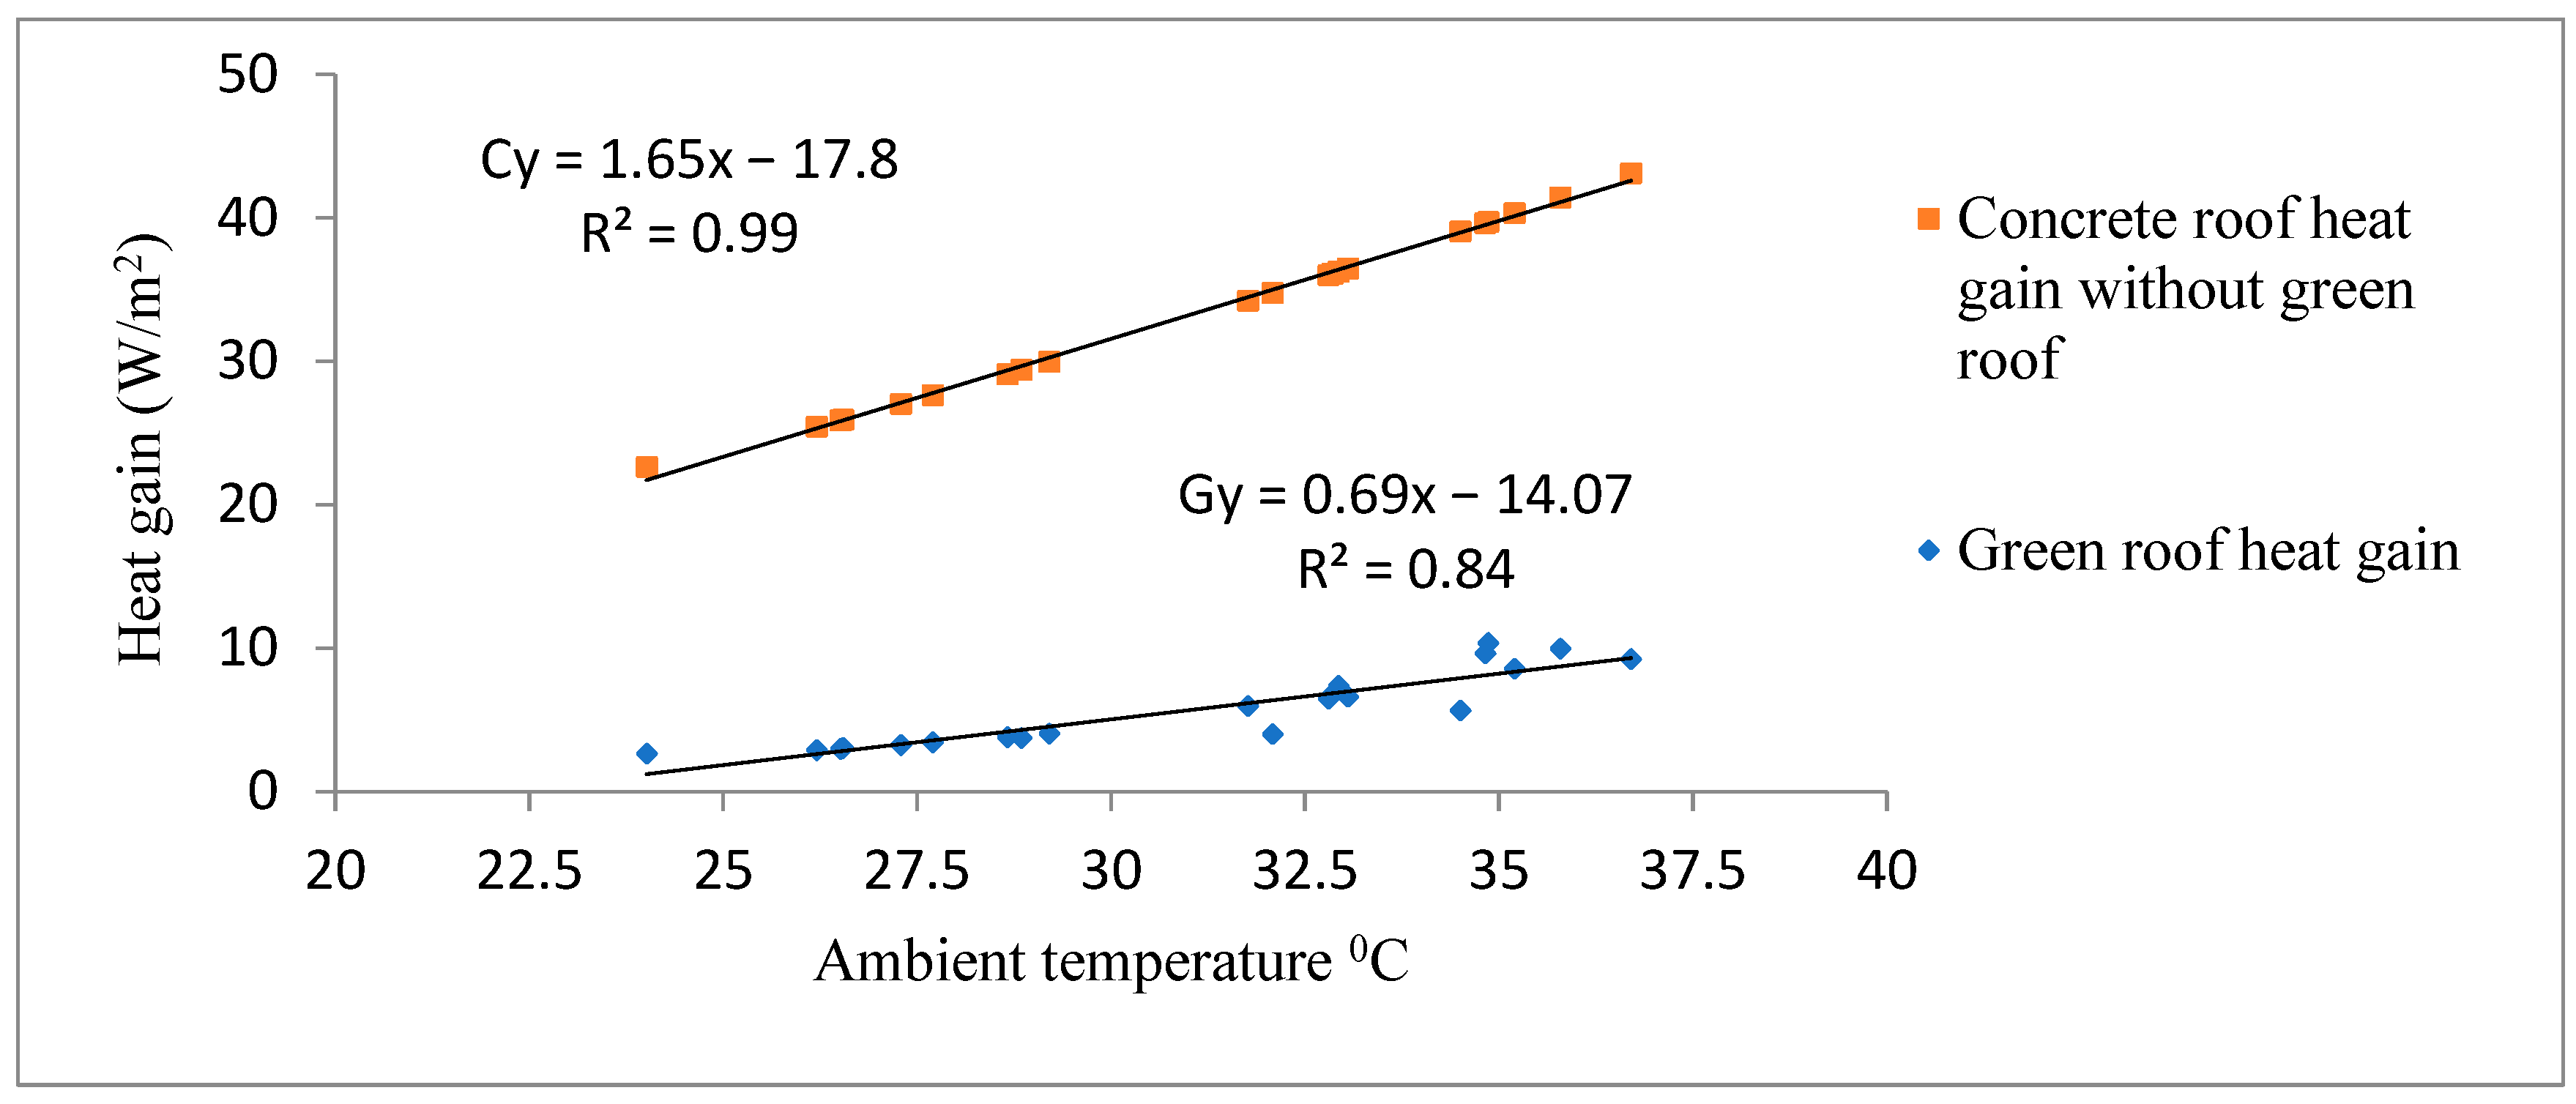
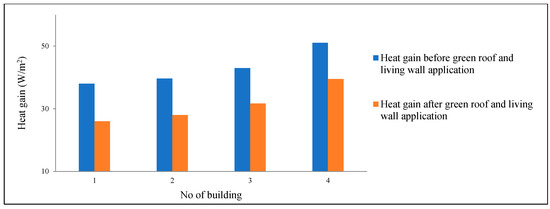
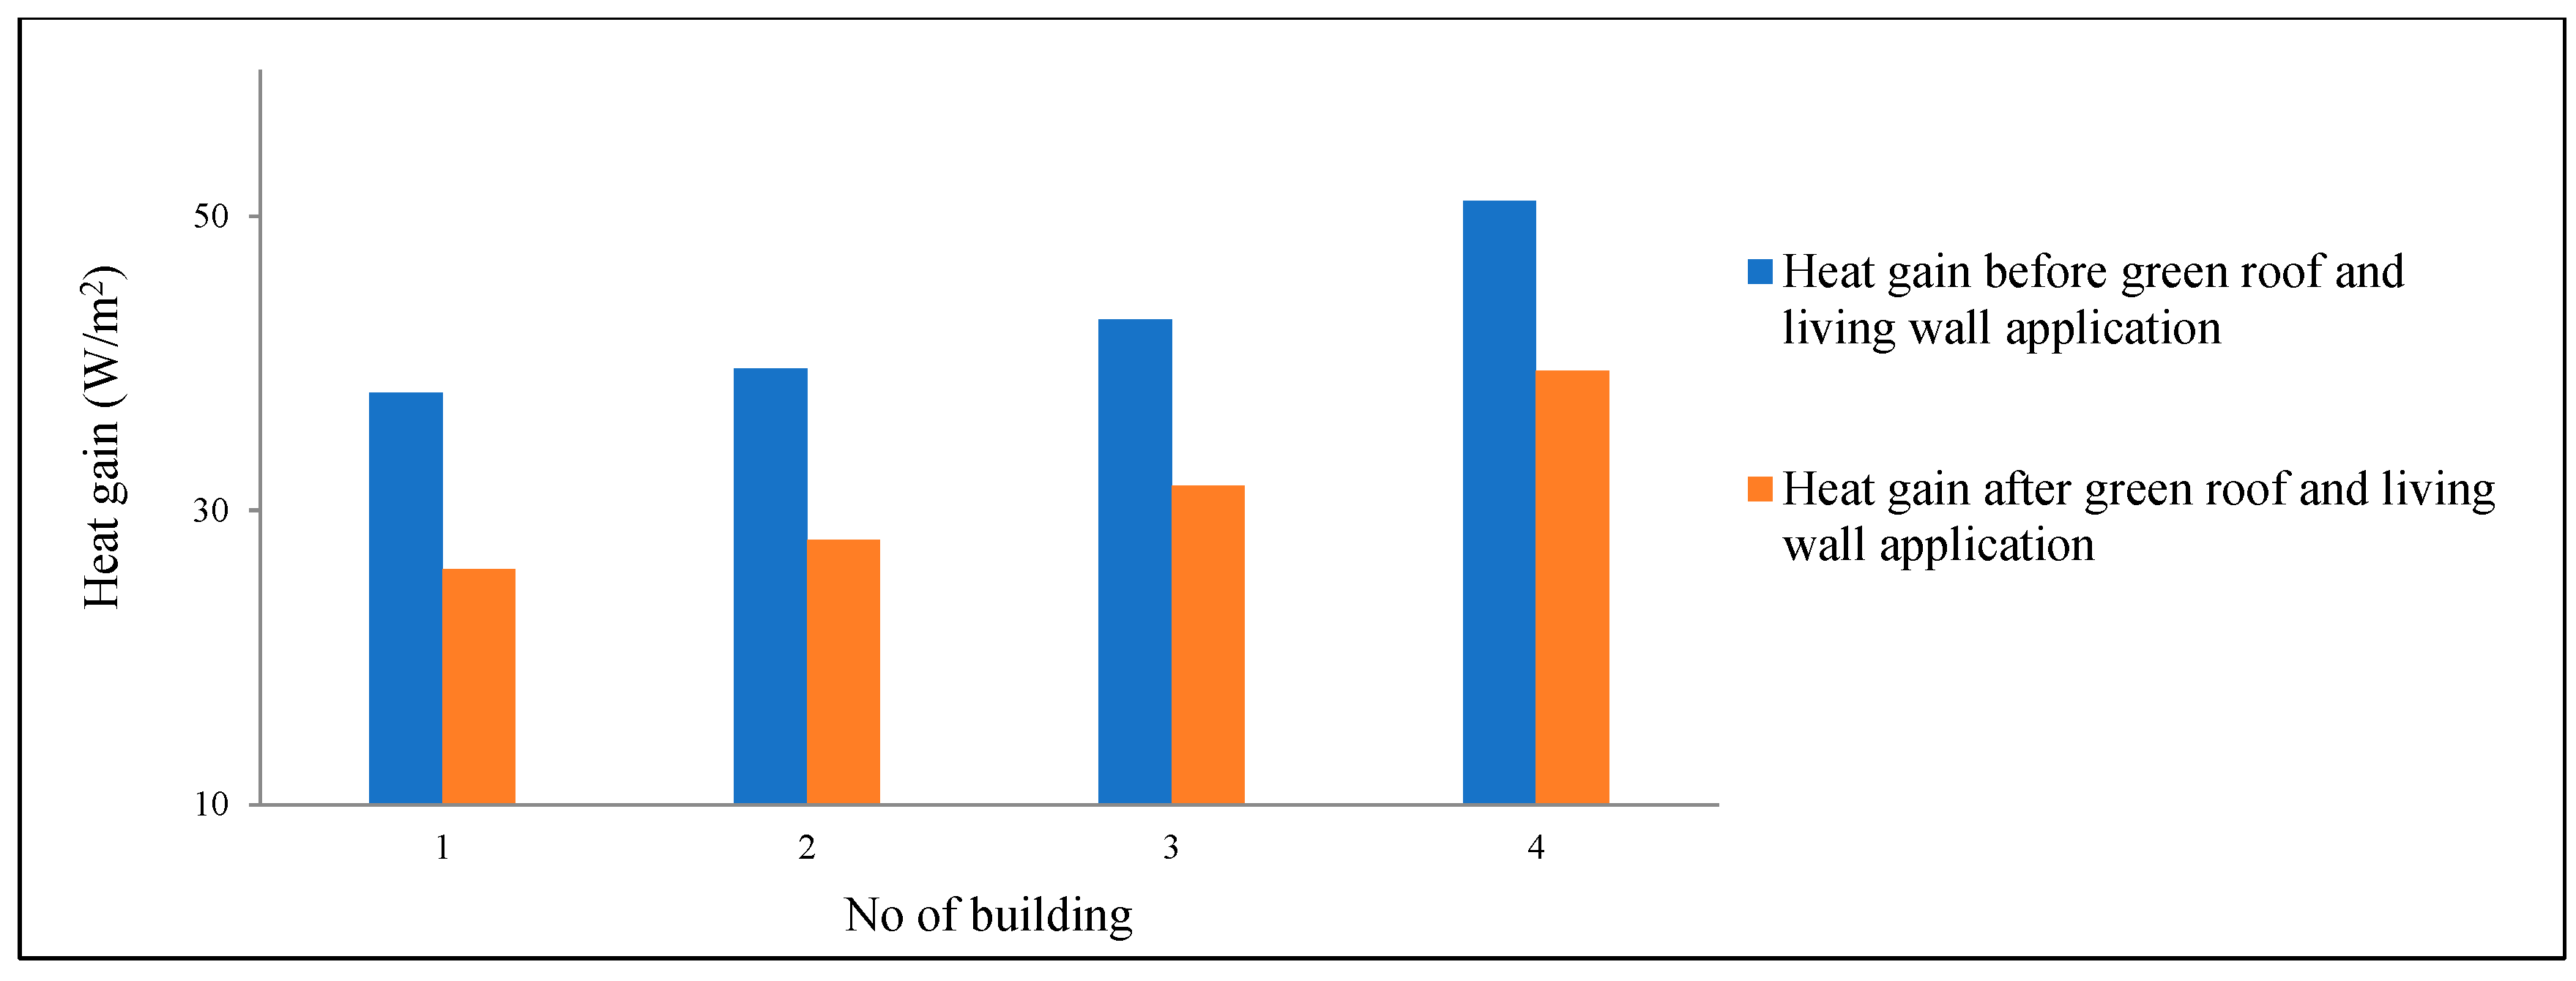
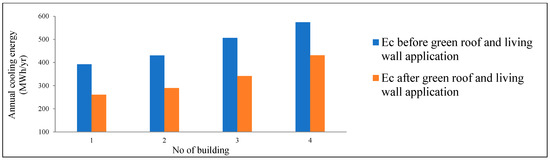
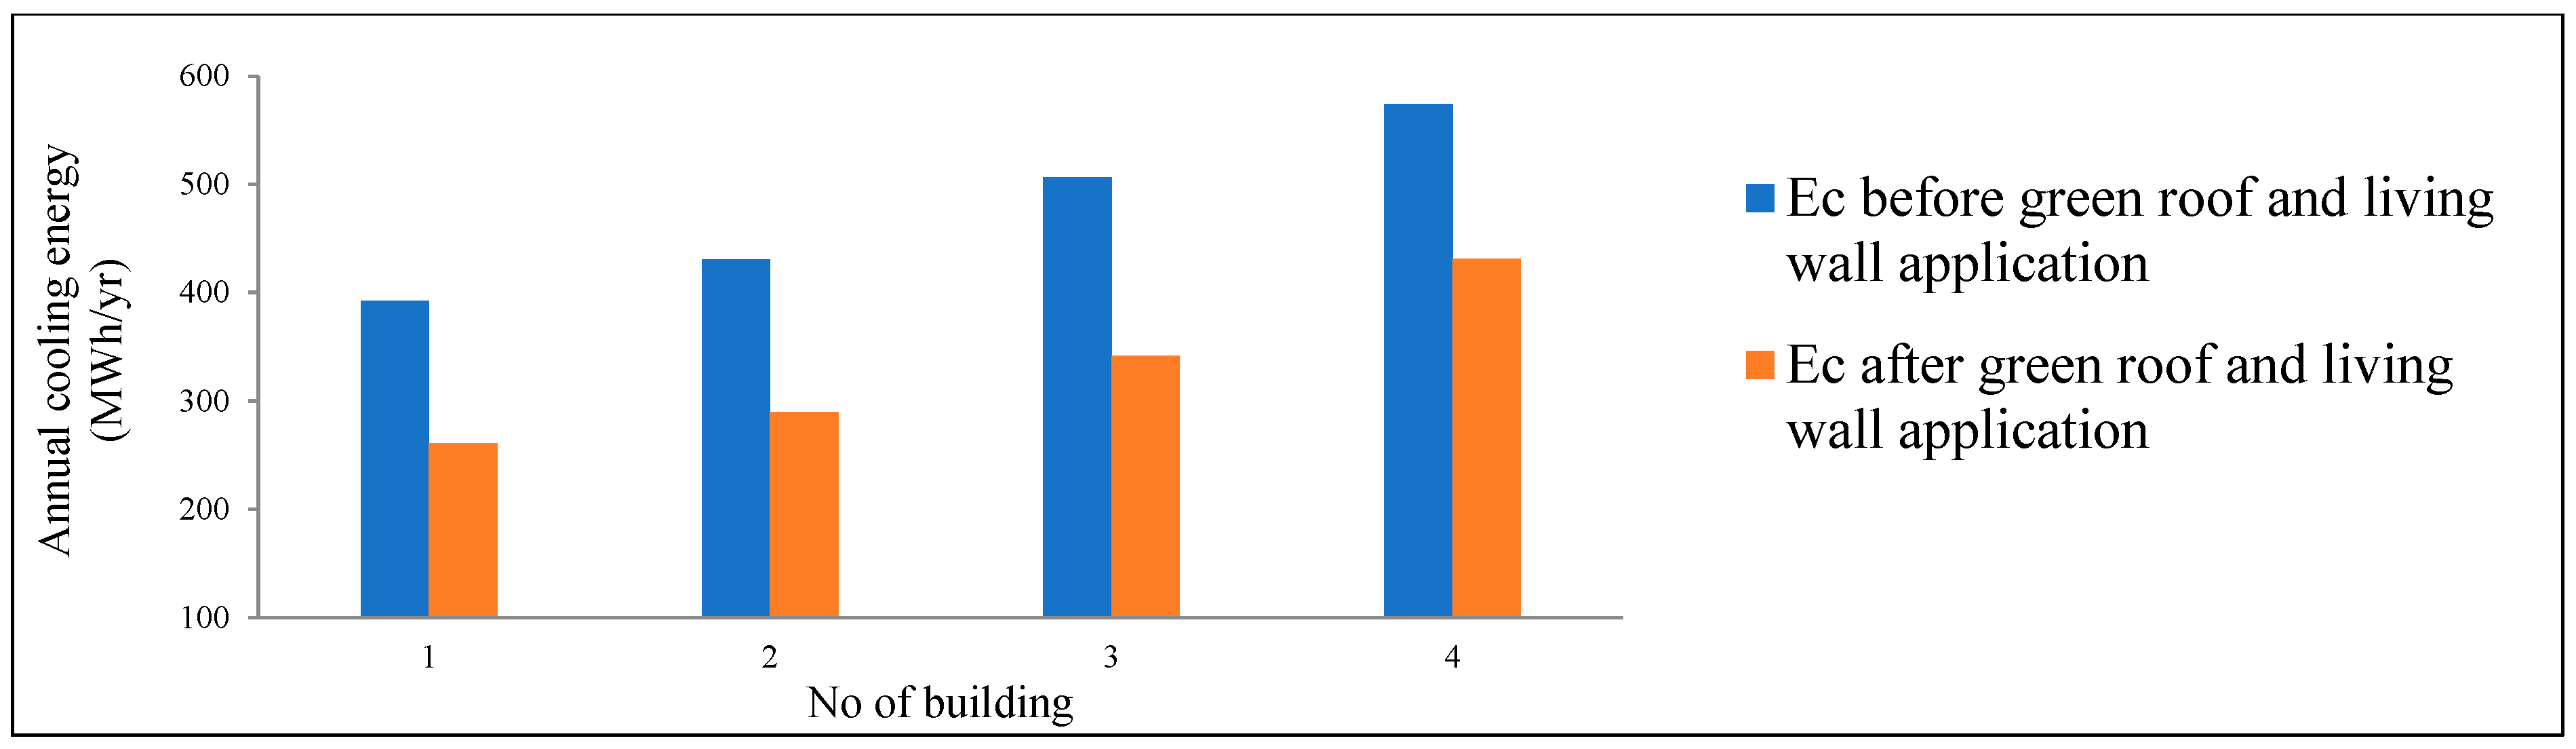
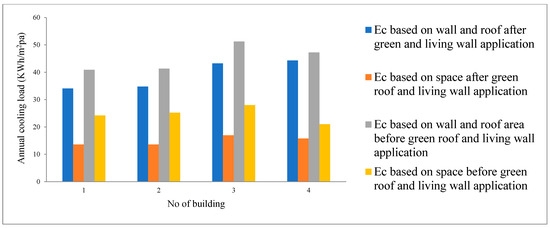
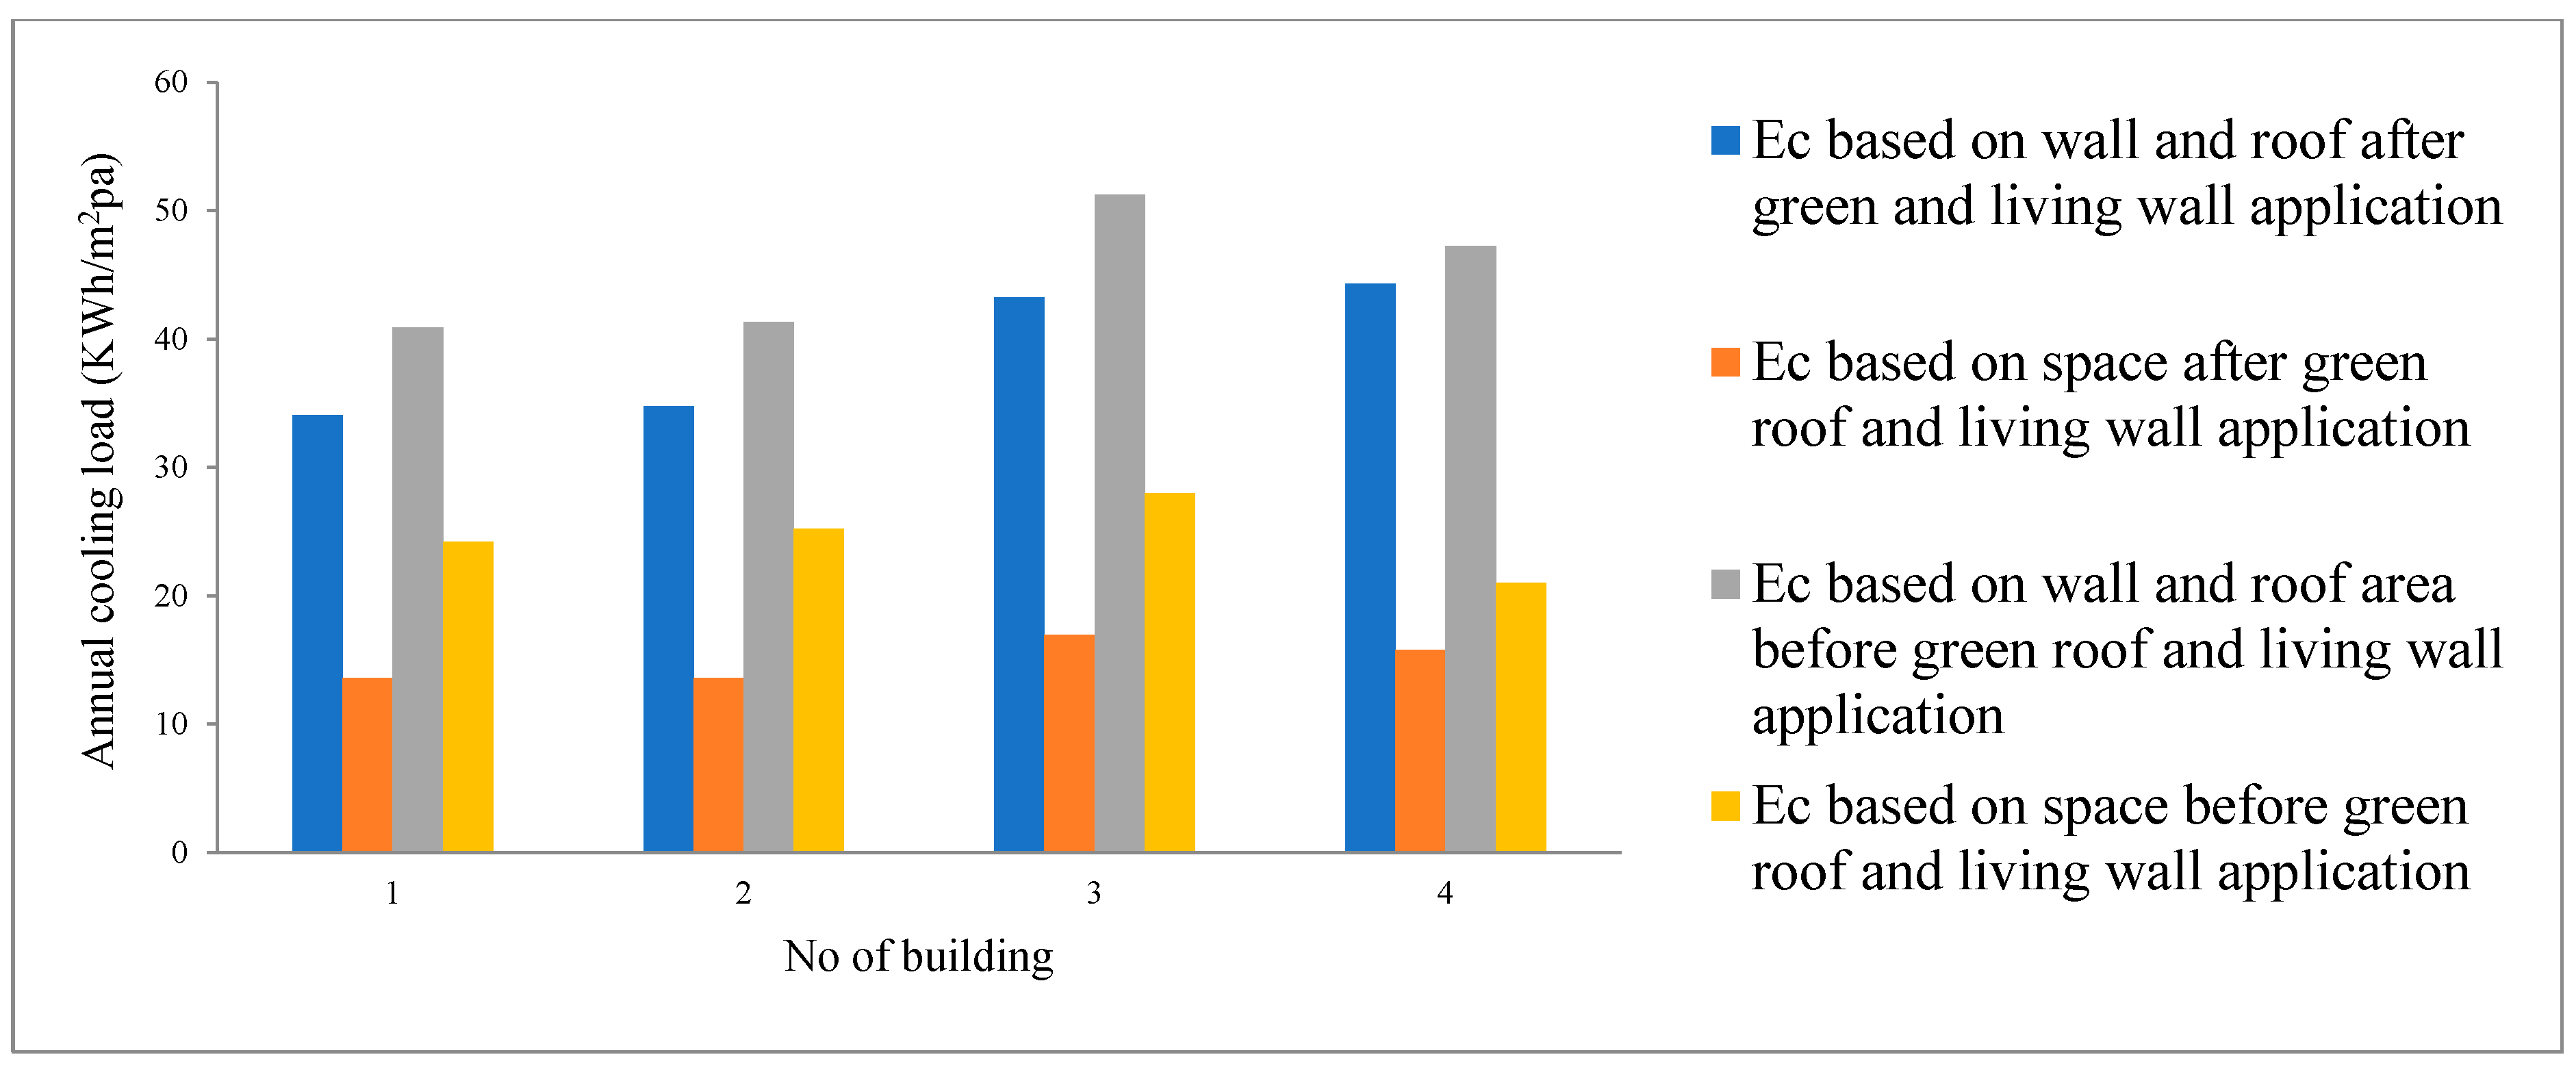
The calculated value of heat gain for a concrete roof was within the range 20–40 W/m2 whereas estimated heat gain in the presence of a green roof was within 4–10 W/m2 as demonstrated in Figure 42, with varying ambient temperature condition. On average, total heat gain after application of living wall on west-facing wall and green roof on concrete roof has shown a reduction in heat gain around 10 to 12 (W/m2) in the buildings taken for investigation, as shown in Figure 43. Figure 44 demonstrated that 130–164 MWh/yr cooling energy can be saved which can contribute around 25–32% annual cooling energy consumption. This amount of saving can be obtained by using living wall in west-facing wall and green roof. Figure 45 showed that cooling energy can be saved annually, 3–8 (KWh/m2pa) based on wall and roof area, while 5–12 (KWh/m2pa) savings can be made based on space area. However, the reduction would be greater if living wall was placed on east, north and south sides of building as well. This confirms that integrating vertical and horizontal green systems provides enhanced thermal performance through complementary mechanisms.
Figure 42.
Concrete roof and green roof heat gain variation with ambient temperature.
Figure 43.
Heat gain of case-studied building before and after living wall green roof application.
Figure 44.
Annual cooling energy consumption before and after living wall and green roof application.
Figure 45.
Annual cooling energy consumption based on wall and roof area and based on space area before and after living wall and green roof application.
Beyond thermal performance, practical considerations such as installation cost, maintenance requirements, irrigation needs, and user acceptance play a critical role in the adoption of green building systems. While these aspects are not quantitatively analysed in this study, they are essential for real-world implementation and should be considered in future research.
It should also be noted that this study focuses on operational energy performance and does not include life-cycle assessment (LCA) of green systems. The embodied energy associated with materials, installation, and maintenance may influence overall sustainability outcomes.
The overall trend clearly indicates a reduction in heat gain and cooling energy demand due to the application of green elements. The reduction in ETTV and cooling energy consumption is primarily driven by:
- shading of building surfaces (reducing solar heat gain);
- thermal insulation provided by vegetation and substrate layers;
- evaporative cooling through plant transpiration.
4.6. Limitations of the Study
While the present study provides valuable insights into the thermal performance of green building elements and their integration into ETTV-based modelling, several limitations should be acknowledged.
First, the mathematical modelling framework is based on steady-state heat transfer assumptions. In reality, building thermal behaviour is inherently transient, particularly under fluctuating solar radiation and ambient temperature conditions. The omission of transient effects may therefore introduce deviations between predicted and actual performance, especially during periods of rapid climatic variation. Also, the model does not explicitly account for some environmental factors, including solar radiation variability, wind-induced convective heat transfer, humidity, and evapotranspiration processes.
Second, the experimental validation was conducted using lightweight steel structures, whereas the application to concrete buildings was based on theoretical modelling. Due to differences in thermal mass and heat storage characteristics, the quantitative results for concrete structures should be interpreted as indicative rather than directly validated.
Furthermore, the study focuses primarily on operational energy performance and does not include life-cycle assessment (LCA) considerations such as embodied energy, installation, and maintenance impacts of green systems. These factors may influence the overall sustainability of such solutions and should be considered in future investigations.
Future research should aim to address these limitations by incorporating transient modelling approaches, coupled heat and mass transfer mechanisms, full-year climatic data, and life-cycle sustainability assessment to provide a more comprehensive evaluation of green building systems.
5. Conclusions
This study demonstrates that green building elements have a significant impact on reducing thermal heat transfer into buildings, particularly under subtropical climatic conditions. During the spring, the green building was about 30% cooler when the steel shed was covered with a living wall and green roof. The reduction in heat transfer is primarily attributed to the following three key mechanisms:
- solar shading provided by vegetation layers;
- thermal insulation due to substrate and plant structure;
- evaporative cooling resulting from plant transpiration.
It is anticipated that there might be fewer of these improvements when a concrete building is used, as metal structures quite quickly reach extensive temperatures when they come under direct sunlight. External living wall in an opaque part of the west-facing wall reduced cooling energy consumption of a commercial building by 10–12% whereas green facade system on an opaque part of the west-facing wall reduced 10–18% of cooling energy consumption. Again, green facade in fenestration system of the west-facing wall reduced 28–35% cooling energy consumption of a commercial building. A substantial reduction in cooling energy consumption (15–20%) of commercial buildings in the sub-tropical climate of Australia was achieved by applying an external living wall on an opaque part of the west-facing wall and an extensive green roof made up of Australian native plants.
While additional energy savings may be achieved by extending green systems to other orientations (north, south, and east), this has not been experimentally validated in the present study and requires further investigation. It should also be noted that the results are based on controlled experimental conditions using prototype steel structures. Therefore, quantitative findings may vary for buildings with different materials (e.g., concrete) and under different climatic conditions. The best results would be obtained from a combination of living wall system in the opaque part of the west-facing wall and green facade system in fenestration system, made up of deciduous planting for the west-facing wall. This combination showed a reduction of 35–40% of cooling energy consumption of a commercial building. The modified formulations demonstrate that the heat gain equation based on ETTV and steady-state heat gain by roof can be used for estimation of energy consumption. It is highly expected that this study will contribute to deeper understanding and new perspective to take reformed measures to improve the building energy efficiency.
The current study has several limitations. The mathematical model does not explicitly incorporate solar radiation variability, wind effects, humidity, or evapotranspiration processes, which may influence thermal performance. Furthermore, the study focuses on operational energy performance and does not include life-cycle assessment (LCA) of green systems, such as embodied energy, installation, and maintenance impacts. Future research should integrate coupled heat and mass transfer modelling, include full-year climatic data, and consider life-cycle sustainability assessment to provide a more comprehensive evaluation.
Despite these limitations, this study provides a validated framework for integrating green building elements into ETTV-based energy performance models. The findings contribute to the development of practical, scalable strategies for improving building energy efficiency and supporting sustainable urban development in subtropical regions.
Author Contributions
Conceptualization, A.K. and M.H.; methodology, A.K. and M.H.; formal analysis, A.K. and M.H.; investigation, A.K. and M.H.; resources, A.K. and S.F.; writing—original draft, A.K., M.H., S.B. and S.F.; writing—review and editing, A.K., M.H., S.B. and S.F.; supervision, A.K.; project administration, A.K.; funding acquisition, A.K. All authors have read and agreed to the published version of the manuscript.
Funding
This research received no external funding.
Data Availability Statement
The original contributions presented in this study are included in the article. Further inquiries can be directed to the corresponding author.
Conflicts of Interest
The authors declare no conflicts of interest.
Nomenclature
| Symbol | Description | Unit |
| a | Operating hours of a day for air-conditioning | h |
| A | Area of building envelope surface | m2 |
| b | Operating days in a week for air-conditioning | days |
| B | Atmospheric extinction coefficient | – |
| C | Ratio of diffuse radiation on a horizontal surface to direct normal irradiation | – |
| CF | Solar correction factor for fenestration | – |
| CH | Non-dimensional bulk heat transfer coefficient | – |
| Cm | Multiplication of operating hours of building per day and per week | – |
| Cpa | Specific heat of air | kJ/(kg·K) |
| D | Number of cooling degree days | °C·days |
| E | Annual cooling energy consumption | MWh/yr |
| Esc | Effective shading coefficient of external shading devices | – |
| ETTV | Envelope thermal transfer value; heat gain through building envelope | W/m2 |
| G | Average solar radiation on a roof surface | W/m2 |
| Gnd | Normal direct irradiation | W/m2 |
| h | Convective heat transfer coefficient for air | W/(m2·K) |
| ho | Outside total heat transfer coefficient between roof and ambient | W/(m2·K) |
| hc | Convection heat transfer coefficient | W/(m2·K) |
| Hg | Total heat gain of the building including wall, roof and internal gain | W/m2 |
| I0 | Solar intensity behind canopy | W/m2 |
| It | Average total irradiance on vertical surface | W/m2 |
| K | Light extinction coefficient | – |
| LAI | Leaf area index of plant | – |
| n | Correction factor for part-load performance of chiller | – |
| Qint | Internal heat gain due to occupants, lighting and equipment | W/m2 |
| R | Thermal resistance of building element | m2·K/W |
| Rso | Surface film resistance | m2·K/W |
| SC | Shading coefficient of fenestration | – |
| SF | Solar factor | W/m2 |
| T | Temperature | °C |
| TDeq | Equivalent temperature difference for opaque wall | °C |
| Tsc | Total shading coefficient due to window glass and plants in front of window | – |
| U | Thermal transmittance of building element | W/(m2·K) |
| u | Wind velocity | m/s |
| WWR | Window to wall ratio | – |
| α | Solar absorption coefficient of wall surface | – |
| γ | Correlation function for design space cooling load | – |
| ρa | Density of air | kg/m3 |
| σ | Stefan–Boltzmann constant | W/(m2·K4) |
| ε | Surface emissivity for long-wave thermal radiation | – |
| ΔT | Temperature difference between outdoor and indoor condition for window | °C |
| Δt | Design indoor-outdoor temperature difference | °C |
| Subscripts | ||
| Symbol | Description | |
| a | Ambient/air | |
| ai | Indoor air (design condition) | |
| ao | Monthly mean outdoor | |
| b | Building (combined/both systems) | |
| bo | Both systems present | |
| c | Concrete/concrete roof surface | |
| ci | Internal surface of concrete wall | |
| co | Outside surface of concrete wall | |
| e | East-facing | |
| f | Fenestration (glazing) | |
| gf1 | Green facade system in front of west-facing wall | |
| gf2 | Green facade system in front of west-facing window | |
| g | Green roof surface | |
| i | Internal surface/indoor | |
| l | Living wall system | |
| lg | Living wall on west wall and green facade on west-facing window | |
| lw | Living wall on west-facing wall | |
| n | North-facing | |
| o | Outside/outdoor | |
| og | Outside, green roof side | |
| r | Roof/indoor air in green shed | |
| rg | Radiative, between green roof and sky | |
| ri | Internal surface of steel roof under green roof | |
| s | South-facing | |
| si | Internal surface of steel wall | |
| sky | Sky | |
| so | Outside surface of steel wall | |
| sgo | Surface of living wall (outer side) | |
| sgi | Sub-surface of living wall (inner side) | |
| t | Total | |
| te | Total envelope and roof | |
| w | West-facing/wall | |
| wa | Wall (transmittance basis) | |
| wi | Wall (conductance basis) |
References
- Kinley, R. Climate change after Paris: From turning point to transformation. Clim. Policy 2017, 17, 9–15. [Google Scholar] [CrossRef] [Scilit]
- Tobin, P.; Schmidt, N.M.; Tosun, J.; Burns, C. Mapping states’ Paris climate pledges: Analysing targets and groups at COP 21. Glob. Environ. Change 2018, 48, 11–21. [Google Scholar] [CrossRef] [Scilit]
- Economidou, M.; Todeschi, V.; Bertoldi, P.; D’Agostino, D.; Zangheri, P.; Castellazzi, L. Review of 50 years of EU energy efficiency policies for buildings. Energy Build. 2020, 225, 110322. [Google Scholar] [CrossRef] [Scilit]
- Saeed, K. Towards Sustainable Development: Essays on System Analysis of National Policy; Routledge: London, UK; New York, NY, USA, 2019. [Google Scholar]
- Li, Y.; Luo, H.; Wang, S.; Liu, Y.; Yang, Z.; Meng, X.; Yang, X. Energy-related carbon emissions in the building sector: Drivers, forecasting, and multi-scenario analysis. Energy Rep. 2026, 15, 109128. [Google Scholar] [CrossRef] [Scilit]
- Lützkendorf, T.; Balouktsi, M. Embodied carbon emissions in buildings: Explanations, interpretations, recommendations. Build. Cities 2022, 3, 964–973. [Google Scholar] [CrossRef] [Scilit]
- Mumovic, D.; Santamouris, M. (Eds.) A Handbook of Sustainable Building Design and Engineering: An Integrated Approach to Energy, Health and Operational Performance, 2nd ed.; Routledge: London, UK, 2018; pp. 1–474. [Google Scholar]
- Alrashed, F.; Asif, M.; Burek, S. The role of vernacular construction techniques and materials for developing zero-energy homes in various desert climates. Buildings 2017, 7, 17. [Google Scholar] [CrossRef] [Scilit]
- Climate Change in Australia. 2025. Available online: http://www.climatechange.gov.au/what-you-need-to-know/buildings.aspx (accessed on 20 November 2025).
- Zhang, L.; Deng, Z.; Liang, L.; Zhang, Y.; Meng, Q.; Wang, J.; Santamouris, M. Thermal behavior of a vertical green facade and its impact on the indoor and outdoor thermal environment. Energy Build. 2019, 204, 109502. [Google Scholar] [CrossRef] [Scilit]
- Karim, M.A.; Hasan, M.M.; Khan, M.I.H. A simplistic and efficient method of estimating air-conditioning load of commercial buildings in the sub-tropical climate. Energy Build. 2019, 203, 109396. [Google Scholar] [CrossRef] [Scilit]
- Chua, K.; Chou, S. An ETTV-based approach to improving the energy performance of commercial. Energy Build. 2010, 42, 491–499. [Google Scholar] [CrossRef] [Scilit]
- Santamouris, M. Cooling the cities—A review of reflective and green roof mitigation technologies to fight heat island and improve comfort in urban environments. Sol. Energy 2014, 103, 682–703. [Google Scholar] [CrossRef] [Scilit]
- Manso, M.; Castro-Gomes, J. Green wall systems: A review of their characteristics. Renew. Sustain. Energy Rev. 2015, 41, 863–871. [Google Scholar] [CrossRef] [Scilit]
- Besir, A.B.; Cuce, E. Green roofs and facades: A comprehensive review. Renew. Sustain. Energy Rev. 2018, 82, 915–939. [Google Scholar] [CrossRef] [Scilit]
- van Dronkelaar, C.; Dowson, M.; Spataru, C.; Mumovic, D. A review of the energy performance gap and its underlying causes in non-domestic buildings. Front. Mech. Eng. 2016, 1, 17. [Google Scholar] [CrossRef] [Scilit]
- Wong, N.H.; Cheong, D.K.W.; Yan, H.; Soh, J.; Ong, C.L.; Sia, A. The effects of rooftop garden on energy consumption of a commercial building in Singapore. Energy Build. 2003, 35, 353–364. [Google Scholar] [CrossRef] [Scilit]
- Montague, T.; Kjelren, R. Energy balance of six common landscape surfaces and the influence of thermal properties on gas exchange of four containerized tree species. Sci. Hortic. 2004, 100, 229–249. [Google Scholar] [CrossRef] [Scilit]
- Pérez, G.; Coma, J.; Martorell, I.; Cabeza, L.F. Vertical Greenery Systems (VGS) for Energy Saving in Buildings: A Review. Renew. Sustain. Energy Rev. 2018, 39, 139–165. [Google Scholar] [CrossRef] [Scilit]
- Susorova, I.; Angulo, M.; Bahrami, P.; Stephens, B. A model of vegetated exterior facades for evaluation of wall thermal performance. Build. Environ. 2019, 67, 1–13. [Google Scholar] [CrossRef] [Scilit]
- Convertino, F.; Vox, G.; Schettini, E. Convective heat transfer in green facade system. Biosyst. Eng. 2019, 188, 67–81. [Google Scholar] [CrossRef] [Scilit]
- Wong, N.H.; Tan, A.Y.K.; Tan, P.Y.; Chiang, K.; Wong, N.C. Thermal evaluation of vertical greenery systems for building walls. Build. Environ. 2010, 45, 663–672. [Google Scholar] [CrossRef] [Scilit]
- Alexandri, E.; Jones, P. Temperature decreases in an urban canyon due to green walls and green roofs in diverse climates. Build. Environ. 2008, 43, 480–493. [Google Scholar] [CrossRef] [Scilit]

Disclaimer/Publisher’s Note: The statements, opinions and data contained in all publications are solely those of the individual author(s) and contributor(s) and not of MDPI and/or the editor(s). MDPI and/or the editor(s) disclaim responsibility for any injury to people or property resulting from any ideas, methods, instructions or products referred to in the content. |
© 2026 by the authors. Licensee MDPI, Basel, Switzerland. This article is an open access article distributed under the terms and conditions of the Creative Commons Attribution (CC BY) license.