


Abstract
Gate hoist structures are safety-critical appurtenant systems in hydropower projects, yet their seismic behavior has received far less attention than that of dam bodies. This study investigates the seismic performance of a gate hoist structure in a roller-compacted concrete gravity dam using a three-dimensional finite element model of the foundation–dam–gate hoist structure system. Linear-elastic time-history analyses are performed for both unreinforced and brace-reinforced configurations under the design earthquake. Seismic performance is evaluated using principal stress, the point safety factor, the section safety factor, and demand-to-capacity ratio (DCR). The results show that tensile stress is concentrated mainly at beam–column joints in the unreinforced structure, where the maximum principal stress exceeds the concrete tensile strength and local cracking may occur. Brace reinforcement reduces the peak tensile stress and improves the safety level at critical locations, while vulnerable regions may shift to the beam–brace joints rather than being completely eliminated. These findings indicate that the seismic safety of gate hoist structures is better assessed within an integrated dam–structure system, while multi-index evaluation provides a more comprehensive basis for identifying vulnerable regions and assessing reinforcement effectiveness.
1. Introduction
The gate hoist structure is a load-bearing appurtenant structure used to support gate-hoisting equipment and provide access for operation. It is typically composed of reinforced concrete columns, beams, and operation platforms, and functions to ensure stable gate operation while transferring loads to the dam body or foundation. Such structures are widely used in hydraulic and hydropower engineering. Owing to operational and maintenance requirements, gate hoist structures are often designed with considerable height, while substantial self-weight is concentrated in the upper components, such as the main beams and hoist house. This configuration results in a relatively high center of gravity, which is detrimental to seismic resistance. Damage observations from past earthquakes have demonstrated the seismic vulnerability of such structures. During the 2008 Wenchuan earthquake, gate hoist structures at several hydropower stations suffered varying degrees of damage, including cover spalling, beam–column damage accompanied by exposed reinforcement and through-cracks, column failure, and infill wall damage in the hoist house [1,2].
Over the past several decades, remarkable advances have been made in the dynamic analysis models and seismic design concepts of high concrete dams. In terms of safety assessment, approaches have evolved from experience-based evaluation to stress-based safety criteria under linear elastic analysis and, more recently, to damage assessment under nonlinear conditions [3,4,5,6]. In terms of analysis methods, seismic assessment has evolved from pseudo-static approaches to dynamic analysis methods [7]. Numerical modeling has also progressed from massless foundation models [8] to semi-infinite foundation models incorporating radiation damping effects [9,10], and further to integrated dynamic models of the dam–reservoir–foundation system [11,12,13]. Seismic design provisions have likewise evolved from single-level loading conditions to multi-level fortification criteria under earthquakes of different intensities. In Chinese dam engineering practice, the corresponding performance objectives are commonly expressed as no damage under moderate earthquakes, reparable damage under strong earthquakes, and collapse prevention under extreme earthquakes, associated with return periods of 500, 5000, and 10,000 years, respectively [14].
Under these developments, a number of studies have been conducted to better capture the interaction mechanisms and seismic response characteristics of high concrete dams. Løkke and Chopra [15,16] developed a direct finite element method for nonlinear earthquake analysis of three-dimensional semi-unbounded dam–water–foundation systems, incorporating practical implementation simplifications, nonlinear-mechanism modeling strategies, and damping calibration procedures. Qiu et al. [17] proposed a geometrically simplified method for modeling shear-key arrangements and verified it through nonlinear seismic analysis of the Xulong arch dam. The proposed method can more reasonably represent the nonlinear dynamic behavior of shear keys without substantially increasing modeling effort. Zhang et al. [18] investigated the response-index correlation of high arch dams under obliquely incident near-fault SV waves and found that pulse-like waves were more destructive than non-pulse waves, with different response indices corresponding to different unfavorable incident angles. Wang et al. [19] showed that near-fault pulse-like ground motions induced more significant dynamic responses and concrete damage in high arch dams than ordinary records, with an approximately 40% increase in damage volume, and that the directionality effect was significant under pulse-containing motions. However, existing seismic design frameworks have mainly focused on the safety and stability of the dam body itself. In practical analysis, appurtenant structures are often neglected or simplified, and attention is primarily paid to their effects on the dam rather than to their own seismic response and safety performance. This practice does not adequately capture the actual in-service behavior of high concrete dams.
In China, hydropower projects along major rivers are commonly developed as cascade systems, many of which are located in the geologically complex and seismically active southwestern region [20]. Under extreme earthquakes, damage to appurtenant structures may lead to loss of key operational functions of the dam and, consequently, threaten both project safety and the safety of the cascade system as a whole, potentially triggering a chain of secondary hazards. Therefore, the seismic safety assessment of appurtenant structures, such as gate hoist structures, is of considerable practical importance. However, existing studies on the seismic behavior of frame-type structures have mainly concentrated on bridges, industrial buildings, and related structural systems [21,22,23,24]. In the field of hydraulic structures, Zhang et al. [25] investigated the gate-top bent structure of the Three Gorges ship lift and compared dynamic response results obtained from the mode superposition method, acceleration response spectrum method, and displacement response spectrum method. Jing et al. [2] used the finite element method to analyze the dynamic characteristics of a high bent structure and evaluated the effectiveness of different seismic measures; however, only the bent structure itself was considered, without accounting for the influence of the overall project system. Li [26] compared the dynamic responses of intake tower bent structures with different steel section types and evaluated their seismic performance. Gu et al. [27] summarized damage cases of aqueduct bent structures and analyzed their failure modes.
Motivated by these considerations, this study considers a roller-compacted concrete gravity dam at a hydropower station as a case study. A three-dimensional finite element model of the foundation–dam–gate hoist structure system is established to account for the interaction between the dam section and the gate hoist structure, as well as the amplification effect of the dam on seismic acceleration, thereby overcoming the limitation of conventional approaches that analyze the hoist structure in isolation. A multi-index seismic safety evaluation framework integrating stress, the point safety factor, the section safety factor, and DCR is then proposed to assess the seismic safety of the gate hoist structure and the effectiveness of reinforcement measures, providing a more comprehensive assessment than methods based on a single stress index. In addition, the influence and underlying mechanism of brace reinforcement are systematically investigated, with particular attention to the redistribution of structural response and the shift in vulnerable regions.
2. Seismic Analysis Model
2.1. Simplified Modeling of the Reinforced Concrete Gate Hoist Structure
The gate hoist structure is made of reinforced concrete. According to Section 5.7.4 of the Standard for Seismic Design of Hydraulic Structures (GB 51247-2018) [28], when the dynamic method is used to determine the seismic action effects of reinforced concrete members, a reduction factor of 0.35 should be applied. In the present dynamic analysis, the gate hoist structure is modeled as plain concrete. Therefore, a seismic effect reduction factor of 0.35 is adopted to represent the ductility and energy dissipation capacity of the reinforced concrete frame structure.
2.2. Viscous-Spring Artificial Boundary for Infinite Foundation Rock
In the dynamic analysis, the radiation damping effect of the semi-infinite foundation is considered using a viscoelastic artificial boundary model [29,30,31,32]. Viscoelastic artificial boundaries are applied to the lateral sides and bottom of the truncated foundation domain in the finite element model. A continuously distributed spring–dashpot system arranged in parallel is assigned to the artificial truncation boundaries. The mechanical parameters of the springs and dashpots are determined by the material properties of the foundation rock mass:
where and are the stiffness coefficients of the tangential and normal springs; and are the damping coefficients of the tangential and normal dashpots; and are the correction coefficients of the viscous-spring boundary; is the distance from the wave source to a point on the artificial boundary; and are the density and shear modulus of the rock; and and are the shear wave velocity and compressional velocity of the rock, which are expressed as:
where is the elastic modulus of the rock and is Poisson’s ratio of the rock.
2.3. Impounded Water
The earthquake-induced hydrodynamic pressure of the reservoir water is determined using the Westergaard added-mass method [33,34]:
where is the hydrodynamic pressure acting at a point on the upstream dam face; is the mass density of reservoir water; is the reservoir water depth in front of the dam; is the elevation of the point above the dam foundation surface; and is the nodal acceleration at the dam face.
3. Multi-Index Seismic Safety Evaluation Method
Traditional evaluation indices, such as stress and the point safety factor, have certain limitations and cannot fully capture the seismic safety of gate hoist structures under strong earthquakes, particularly in assessing crack development and the potential for overall instability. To overcome these limitations, the section safety factor method and the DCR criterion are incorporated into the conventional evaluation framework. Accordingly, a multi-index seismic safety evaluation method integrating stress, the point safety factor, the section safety factor, and DCR is established to assess the seismic performance of the structure from multiple perspectives and at different scales.
3.1. Stress Criterion
The maximum principal stress and the minimum principal stress are adopted as the stress indices for seismic safety evaluation. The structure is considered to remain in a safe stress state when the maximum principal stress does not exceed the tensile strength of the material and the minimum principal stress does not exceed the compressive strength of the material in absolute value. Otherwise, the structure is considered to have a risk of tensile cracking or compressive damage. The corresponding criteria are expressed as follows:
where is the maximum principal stress; is the minimum principal stress; is the tensile strength of the material; and is the compressive strength of the material.
3.2. Point Safety Factor Criterion
According to Section 5.7.1 of the Standard for Seismic Design of Hydraulic Structures (GB 51247-2018) [28], the seismic strength and stability of hydraulic structures under the most unfavorable combination of static and dynamic actions shall satisfy the following requirement:
where is the importance factor of the structure and is taken as 1.0 under seismic conditions; is the design situation factor and is taken as 0.85 under seismic conditions; is the action effect function of the structure; is the partial factor for permanent actions; is the characteristic value of permanent actions; is the partial factor for variable actions; is the characteristic value of variable actions; is the partial factor for seismic action; is the representative value of seismic action; is the characteristic value of geometric parameters; is the structural coefficient used in the ultimate limit state check and is taken as 1.2 for reinforced concrete structures; is the structural resistance function; is the characteristic value of material properties; and is the partial factor for material properties.
Based on Equation (8), the point safety factor is calculated, and the ultimate limit state requirement is considered satisfied when :
where is the maximum principal stress at a given point and is the tensile strength of the material.
3.3. Section Safety Factor Criterion
Based on the ultimate limit state criterion described in Section 3.2, the section safety factor is calculated. The section is considered to satisfy the ultimate limit state requirement when :
where is the resultant normal tensile force obtained by integrating the normal tensile stress over the section, and is the resultant tensile resistance obtained by integrating the tensile strength over the section.
3.4. DCR Criterion
According to Section 4.2 of the U.S. Army Corps of Engineers guideline Time-History Dynamic Analysis of Concrete Hydraulic Structures (EM 1110-2-6051) [35], structural seismic performance can be evaluated using three indices: demand-to-capacity ratio (DCR), cumulative inelastic duration (CID), and the performance curve.
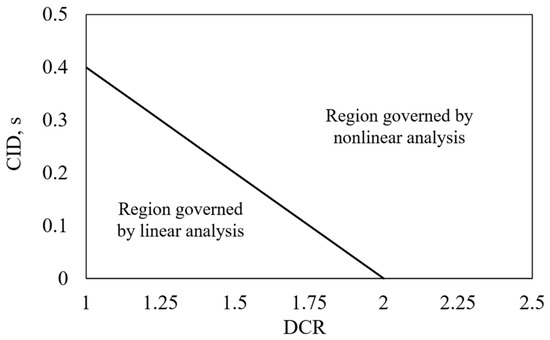
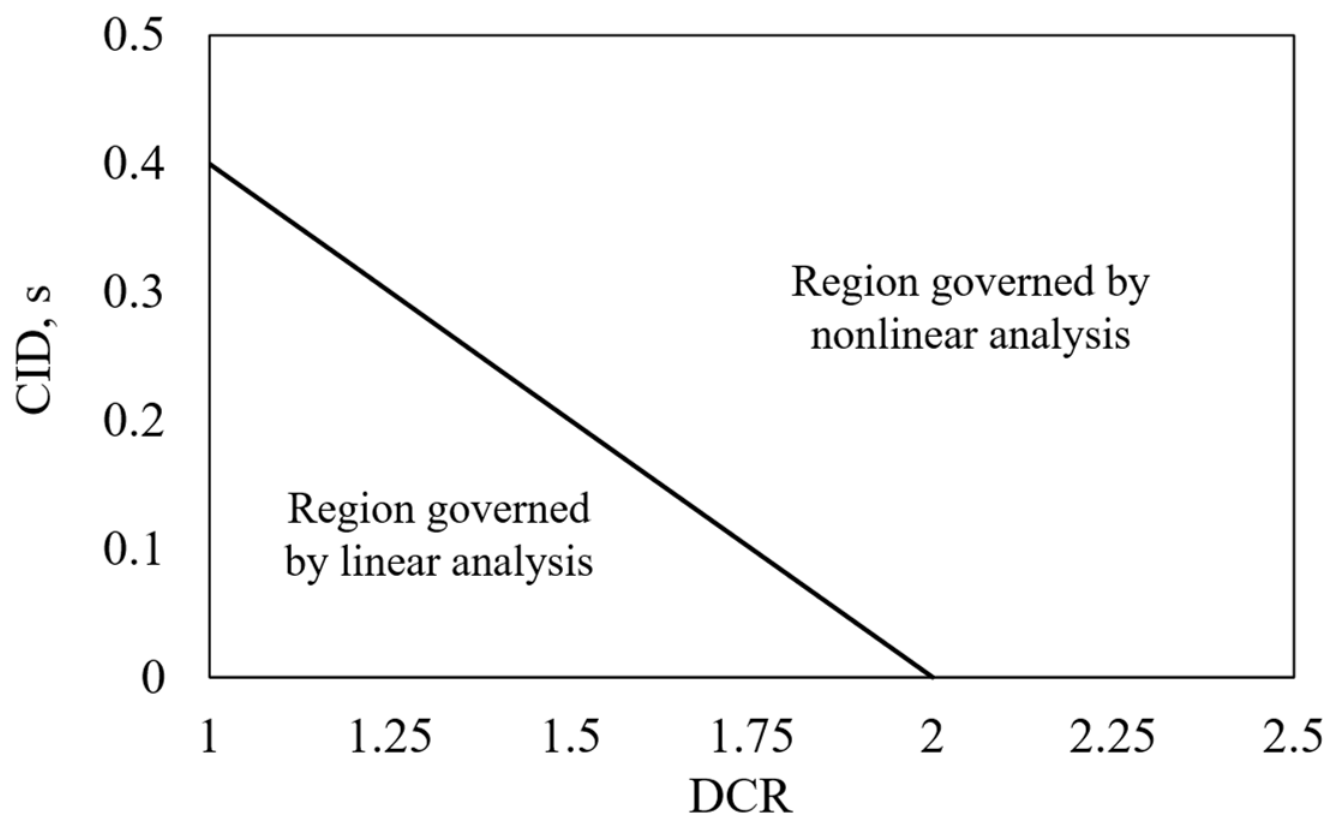
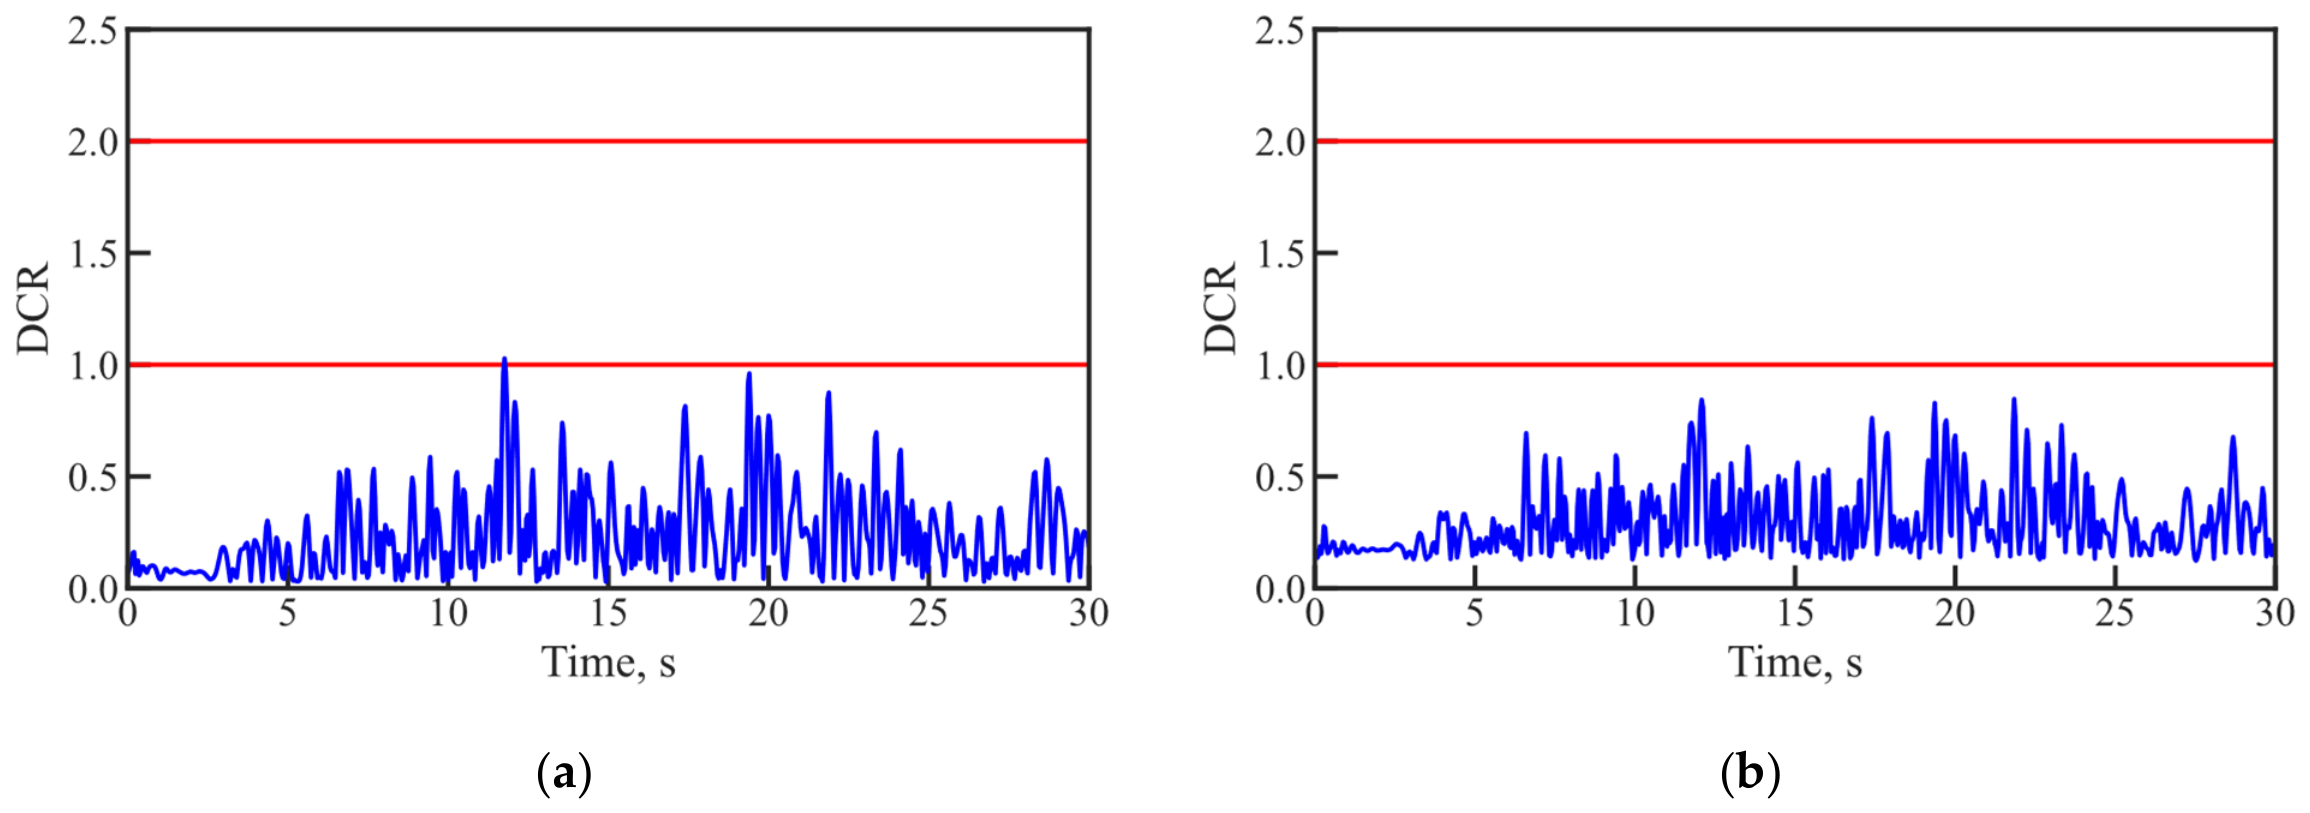
In the present study, for a given section of the gate hoist structure, the DCR at each instant is defined as the ratio of the maximum absolute principal stress among all nodes on the section to the tensile strength of concrete. Over the entire time-history duration, the total time during which the DCR exceeds the specified threshold is defined as the CID. When DCR = 1, the upper limit of CID is taken as 0.4 s; when DCR = 2, the upper limit of CID is taken as 0 s. A linear performance curve is then constructed accordingly. Based on the DCR time history of a section, together with the CID and the performance curve, the dynamic response of the gate hoist structure can be classified into the following three performance levels:
(1) Slight or no damage. If DCR ≤ 1, the response of the gate hoist structure is considered to remain within the linear elastic range, with little or no likelihood of damage, corresponding to no visible cracking or only minor cracks.
(2) Acceptable damage. If DCR > 1, the gate hoist structure exhibits a nonlinear response in the form of cracking. If DCR < 2, and the CID corresponding to 1 < DCR < 2 is below the performance curve shown in Figure 1, the level of nonlinear response or cracking is considered acceptable, and structural failure is not expected, corresponding to limited tensile cracking that does not affect the overall load-bearing capacity or serviceability.
Figure 1.
Schematic illustration of the performance curve.
(3) Severe damage. If DCR ≥ 2, or if the CID corresponding to 1 < DCR < 2 exceeds the performance curve shown in Figure 1, the gate hoist structure is considered to have sustained severe damage, corresponding to extensive cracking and potential loss of structural integrity. In such cases, nonlinear time-history analysis is generally required.
4. Numerical Examples
A spillway section of a roller-compacted concrete gravity dam at a hydropower station serves as the case study. The section is 173 m high, with a base width of 174 m, a crest width of 30 m, and a transverse thickness of 17 m. The normal reservoir water level is 3054 m. The elevation of the upstream slope break point is 2945 m, the upstream slope ratio is 1:0.3, and the downstream slope ratio is 1:0.78. The base elevation of the gate hoist structure is 2996 m. Its longitudinal dimension along the river is 21 m, its transverse width is 15.5 m, and its height is 23.5 m.
4.1. Finite Element Meshes
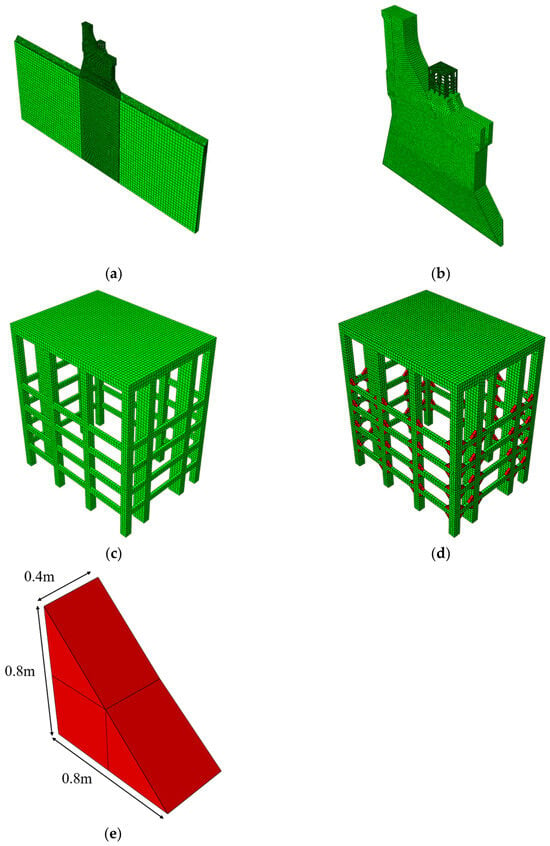
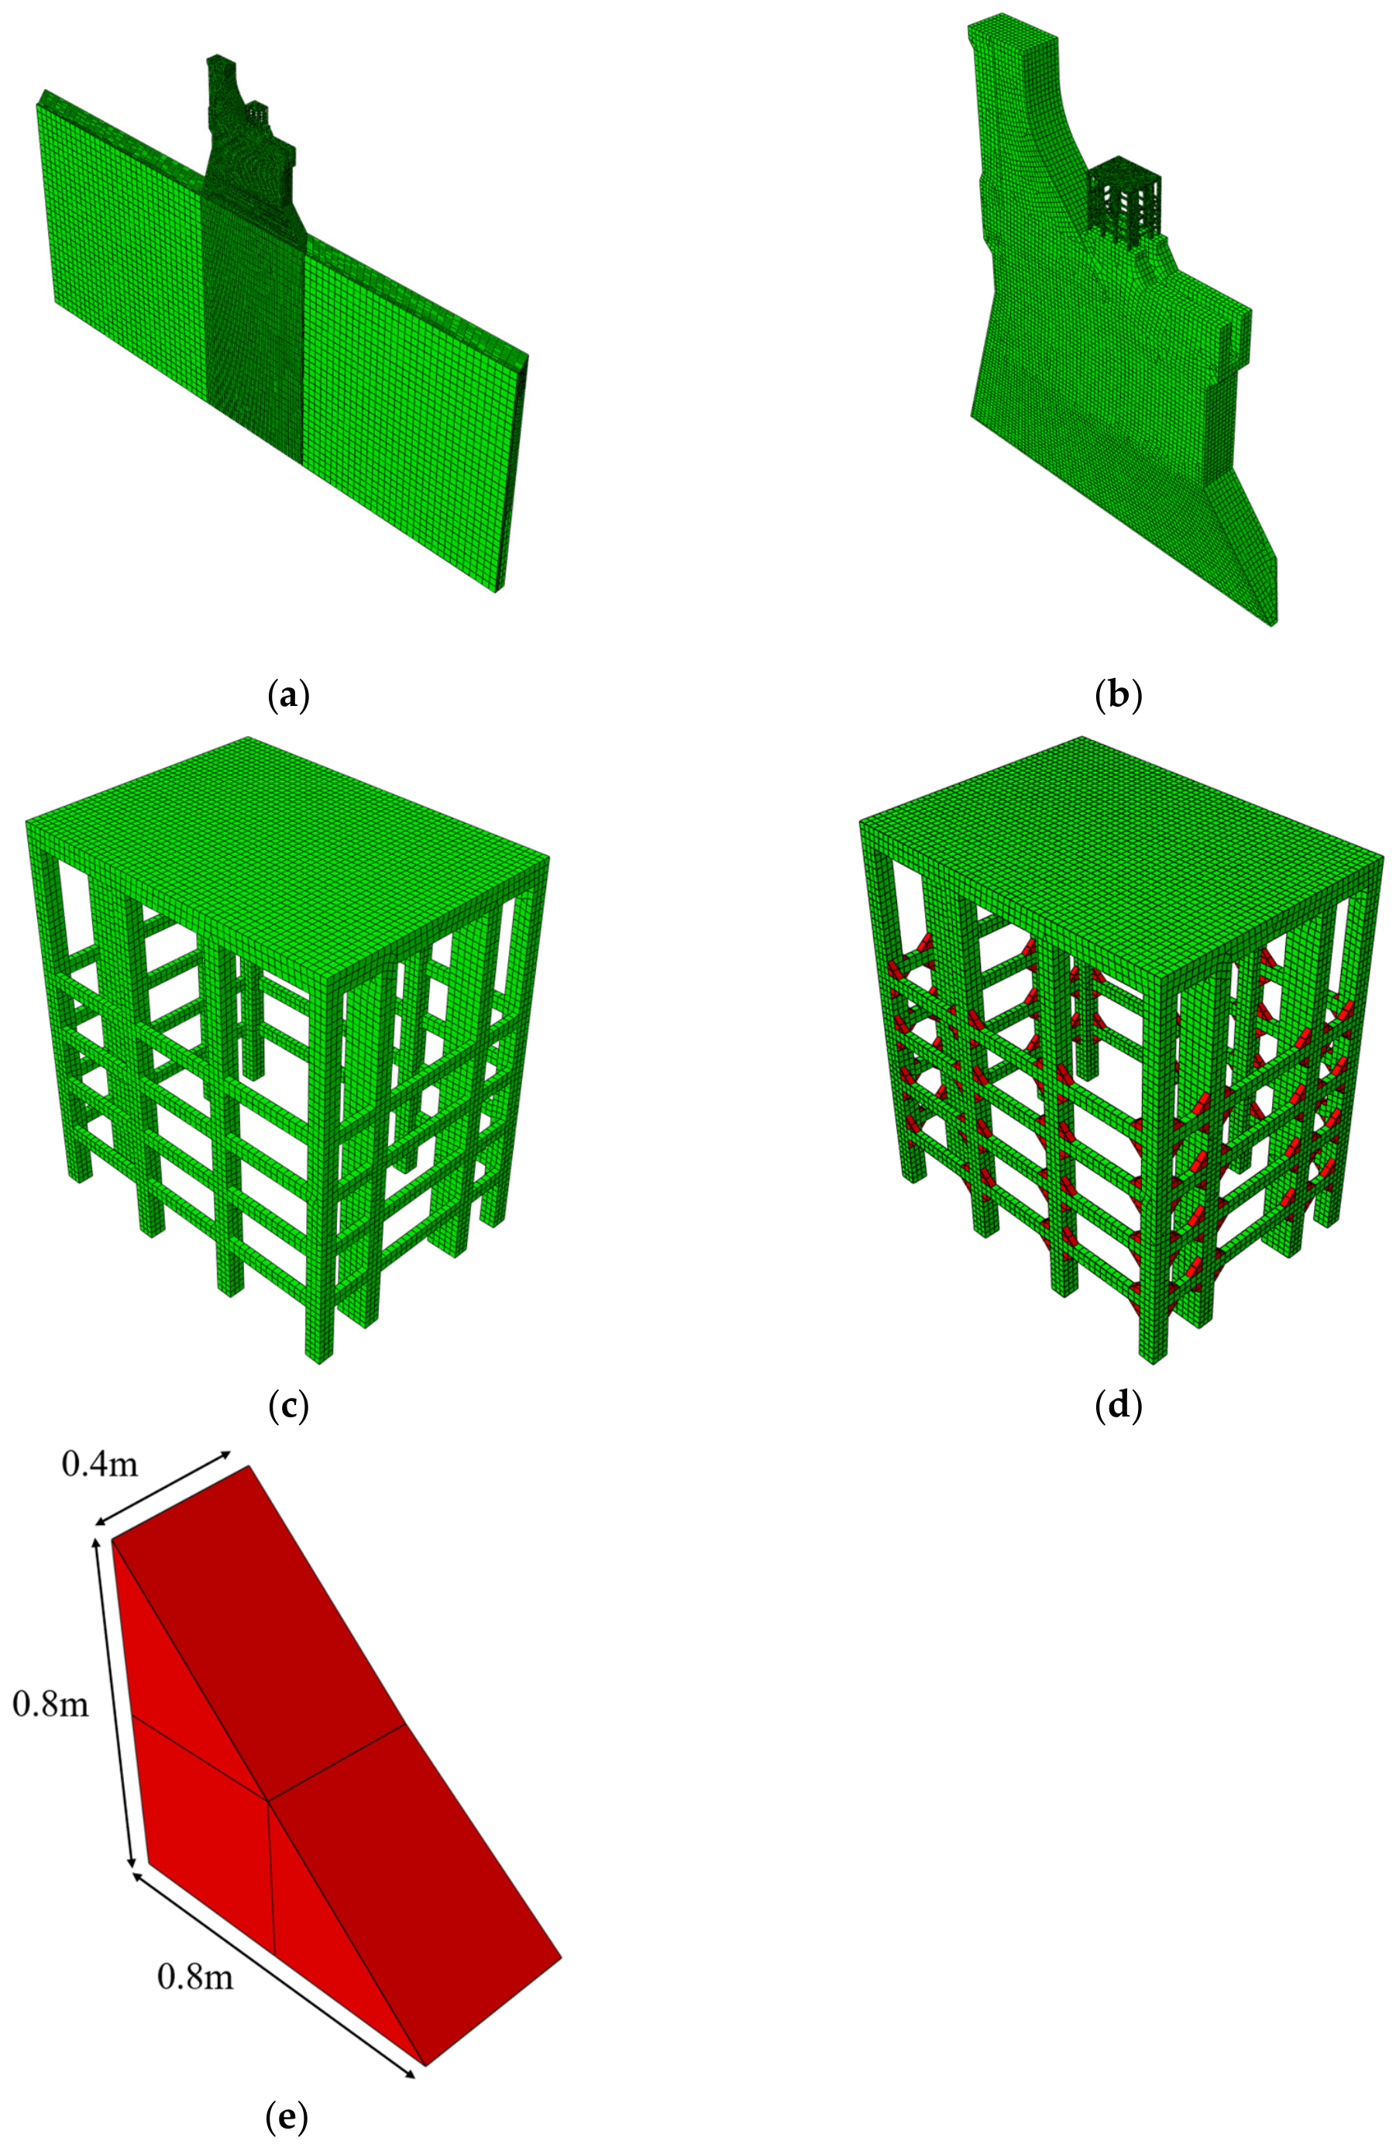
A finite element model of the foundation–dam–gate hoist structure system for the spillway section is established, as shown in Figure 2a, and the dam–gate hoist structure model is shown in Figure 2b. The foundation extends 320 m upstream from the dam heel, 320 m downstream from the dam toe, and 320 m below the foundation surface. The transverse thickness is consistent with that of the dam section, which is 17 m. To better evaluate the seismic performance of the gate hoist structure, two structural models are developed. The unreinforced model is shown in Figure 2c. To reinforce the structure, triangular prism-shaped concrete braces are added at the beam–column joints. The reinforced model is shown in Figure 2d, where the concrete braces are highlighted in red, and the geometry and dimensions of the concrete brace are shown in Figure 2e.
Figure 2.
Finite element models: (a) overall model; (b) dam section model; (c) unreinforced gate hoist structure model; (d) reinforced gate hoist structure model (green: gate hoist structure and red: concrete brace); and (e) concrete brace.
The finite element model is mainly discretized using hexahedral elements, while wedge or tetrahedral elements are used in local regions. The mesh size is approximately 2.0 m for the dam, 10.0 m for the foundation, and 0.4 m for the gate hoist structure. The unreinforced model contains 168,638 nodes and 346,089 elements, including 52,050 nodes and 45,618 elements for the dam, and 38,407 nodes and 142,935 elements for the gate hoist structure. In the reinforced model, the finite element models of the foundation and dam remain the same as those in the unreinforced model, whereas the gate hoist structure contains 39,054 nodes and 143,514 elements.
4.2. Material Parameters
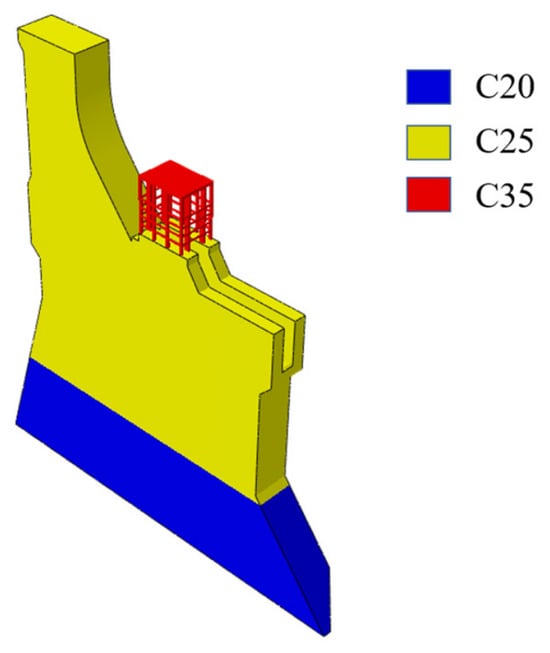
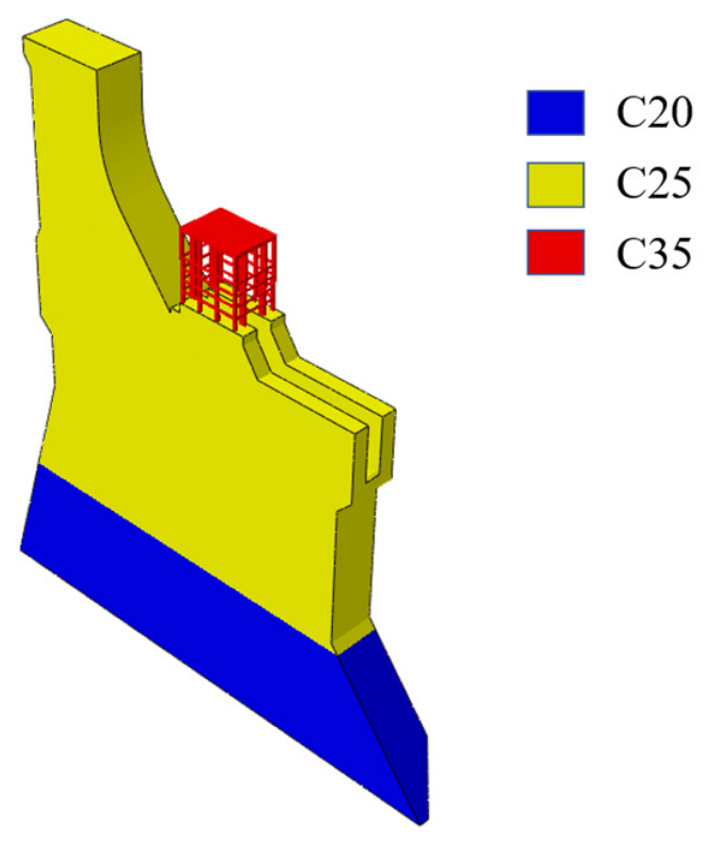
According to the actual engineering design, the dam body is divided into two concrete zones, namely C20 and C25, while the gate hoist structure is assigned C35 concrete. The material zoning is shown in Figure 3. The static mechanical parameters of the concrete and the foundation are selected according to the design values of the project and the Code for Design of Hydraulic Concrete Structures (NB/T 11011-2022) [36], as listed in Table 1. According to Section 5.6.2 of the Standard for Seismic Design of Hydraulic Structures (GB 51247-2018) [28], the dynamic elastic modulus of concrete is taken as 1.5 times its static elastic modulus. The dynamic mechanical parameters of the foundation are assumed to be identical to the corresponding static values. In addition, according to Section 5.5.4 of the Standard for Seismic Design of Hydraulic Structures (GB 51247-2018) [28], the damping ratio of concrete is taken as 10%.
Figure 3.
Material zones of the dam.
Table 1.
Static material parameters of the model.
4.3. Applied Loads and Analyzed Cases
A linear elastic dynamic time-history analysis is performed. The static loads considered include the self-weight of the dam, hydrostatic pressure, uplift pressure, and sediment pressure, while the dynamic loads include seismic action and hydrodynamic pressure.
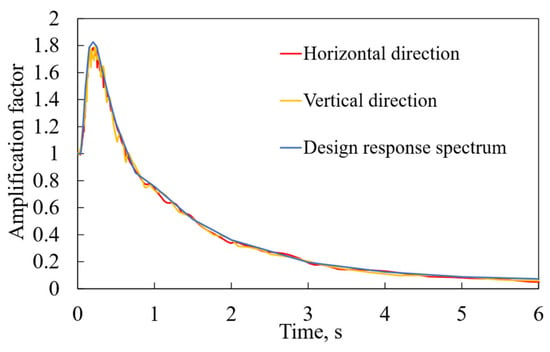
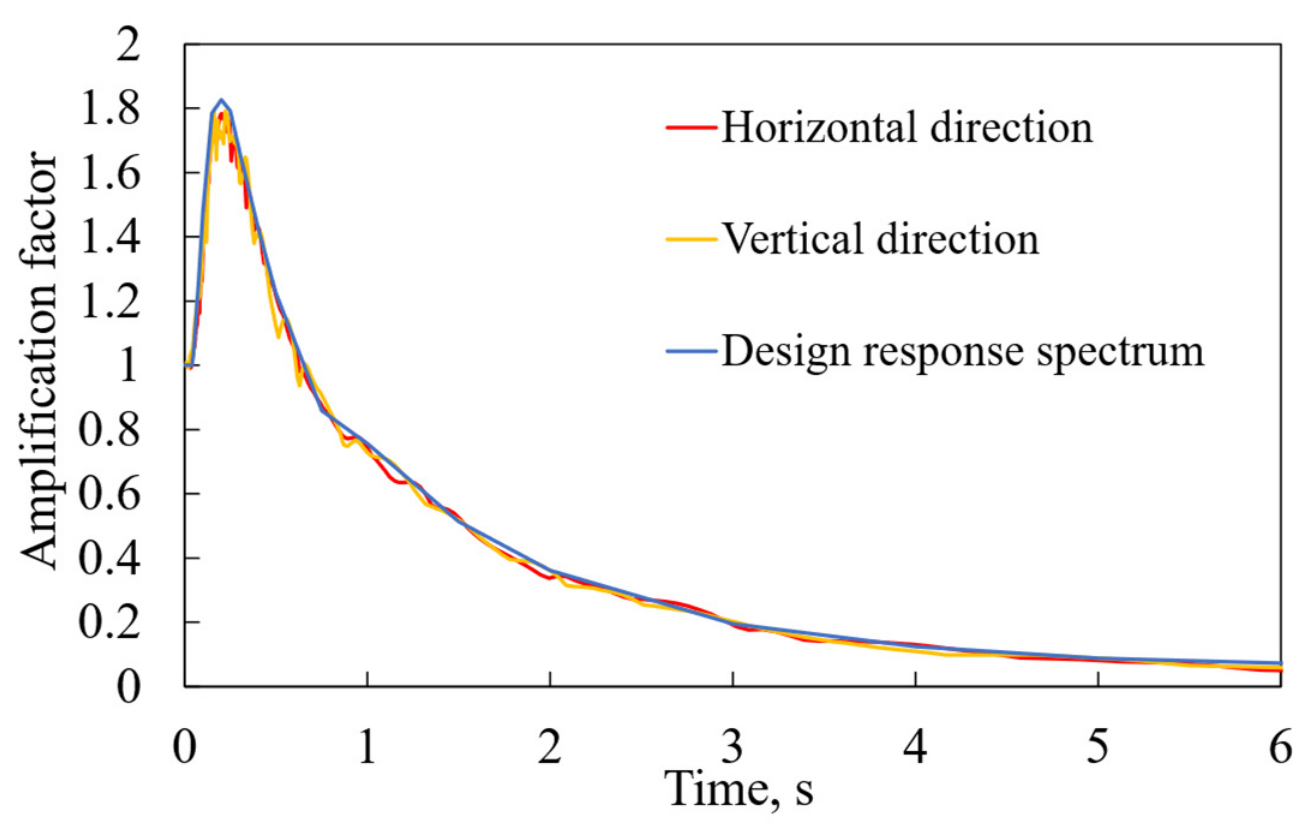
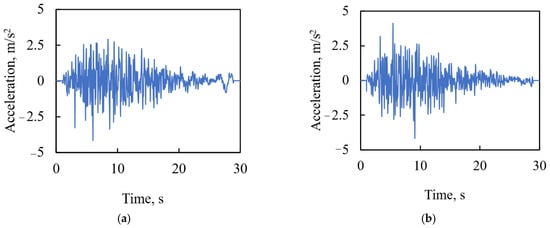
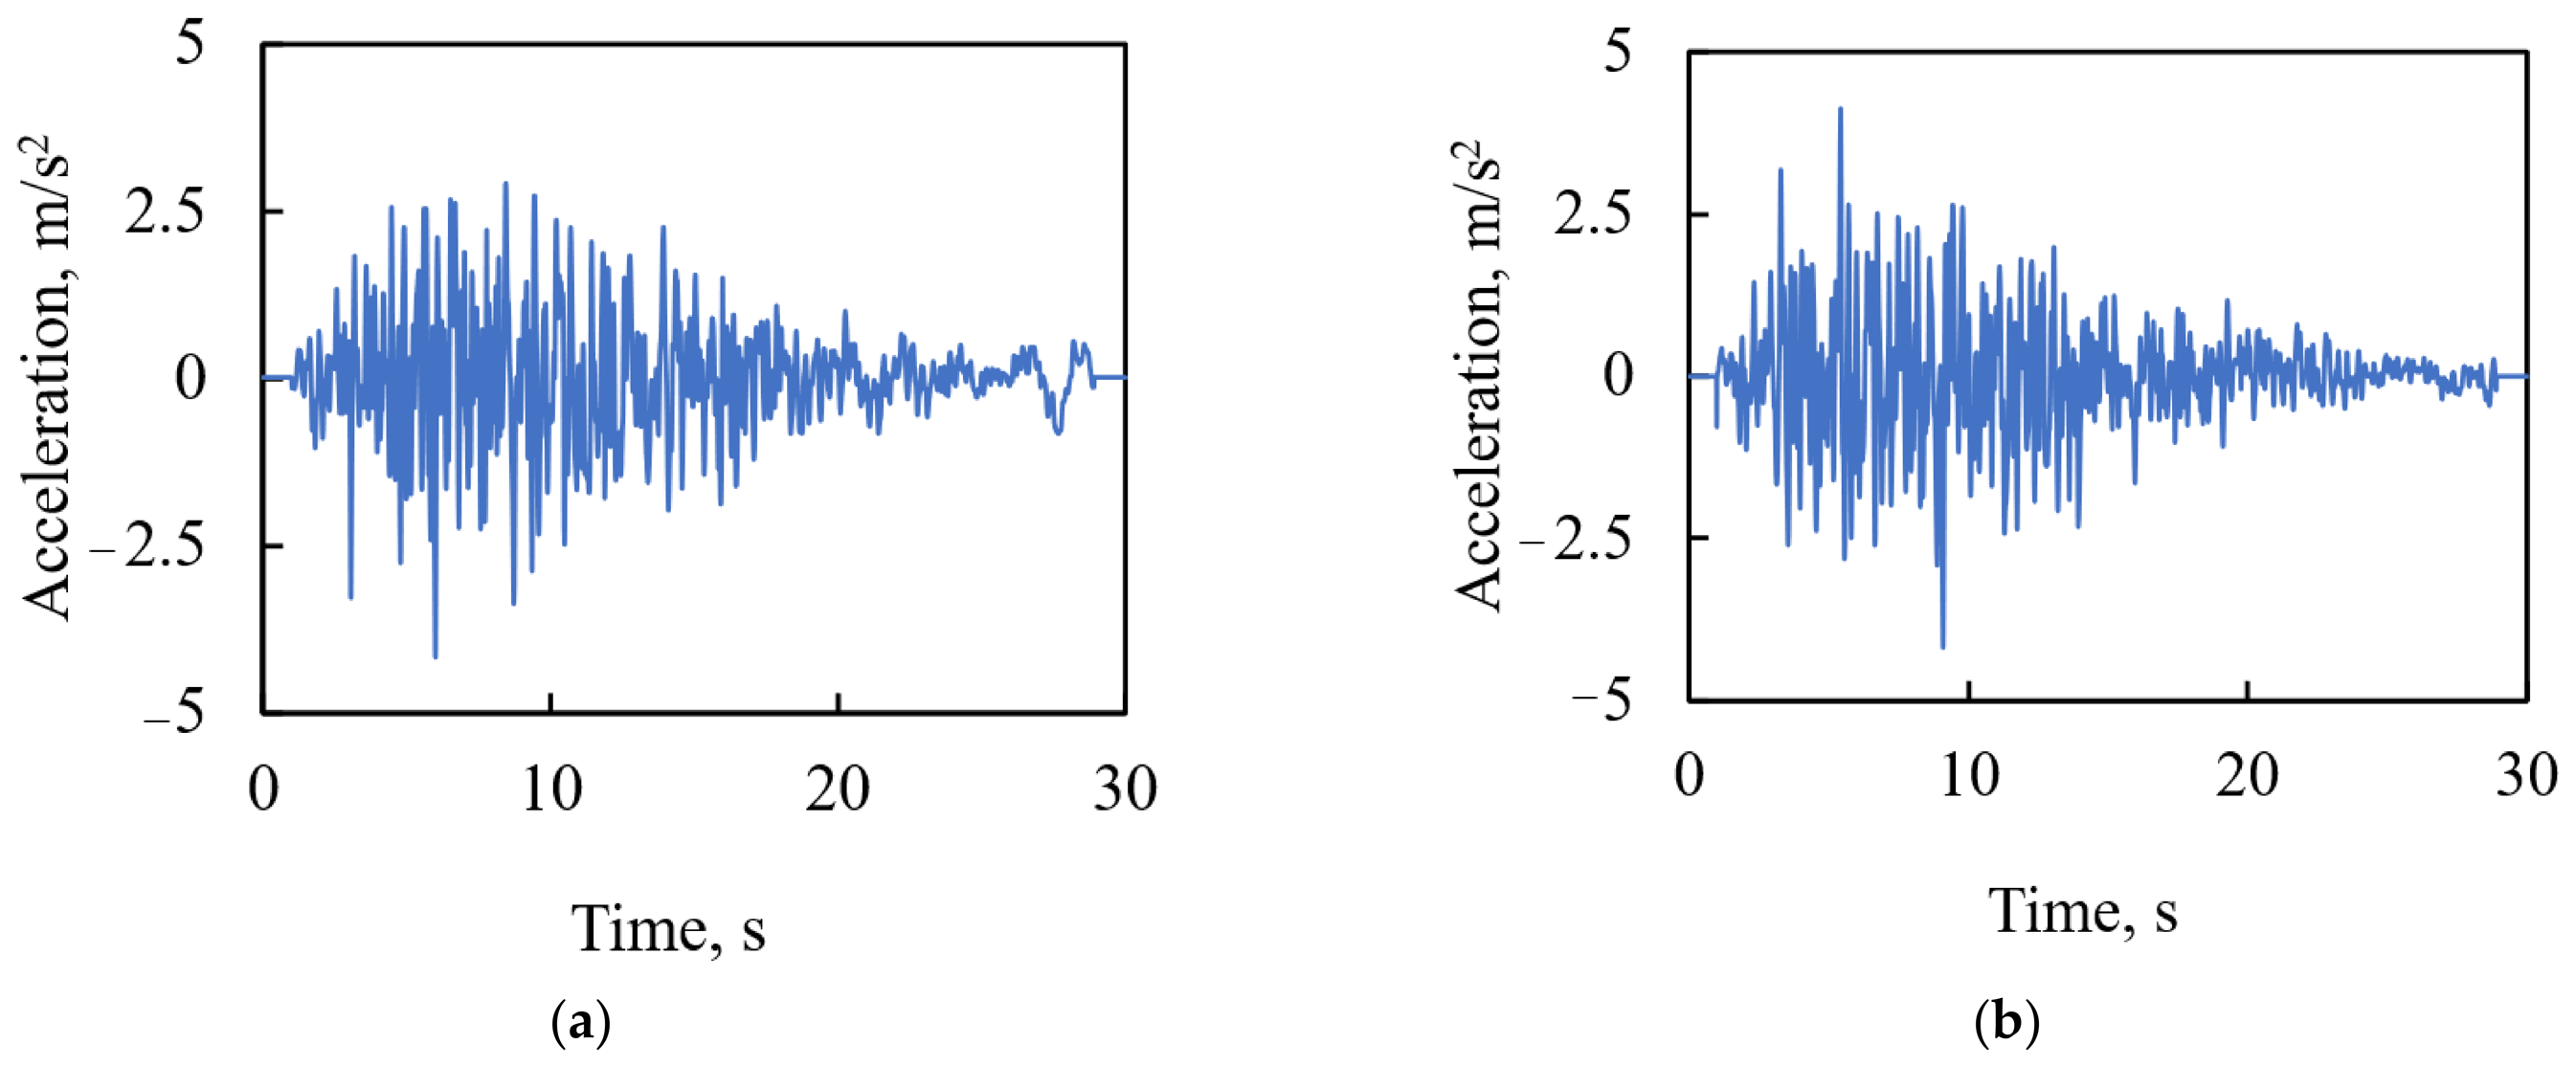
According to the design response spectrum specified for this project, two sets of artificial acceleration time histories are generated for the stream and vertical seismic input directions, respectively. The corresponding horizontal peak ground acceleration is 420 Gal. Seismic input in the cross-stream direction is not considered. The site-specific design response spectrum and the generated artificial acceleration time histories are shown in Figure 4 and Figure 5, respectively.
Figure 4.
Site-specific design response spectrum.
Figure 5.
Artificial acceleration time histories: (a) stream direction and (b) vertical direction.
5. Results
5.1. Stress
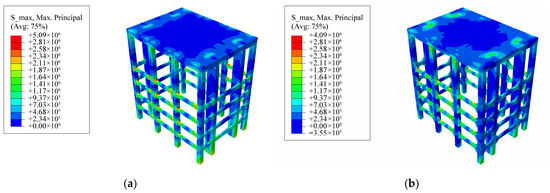
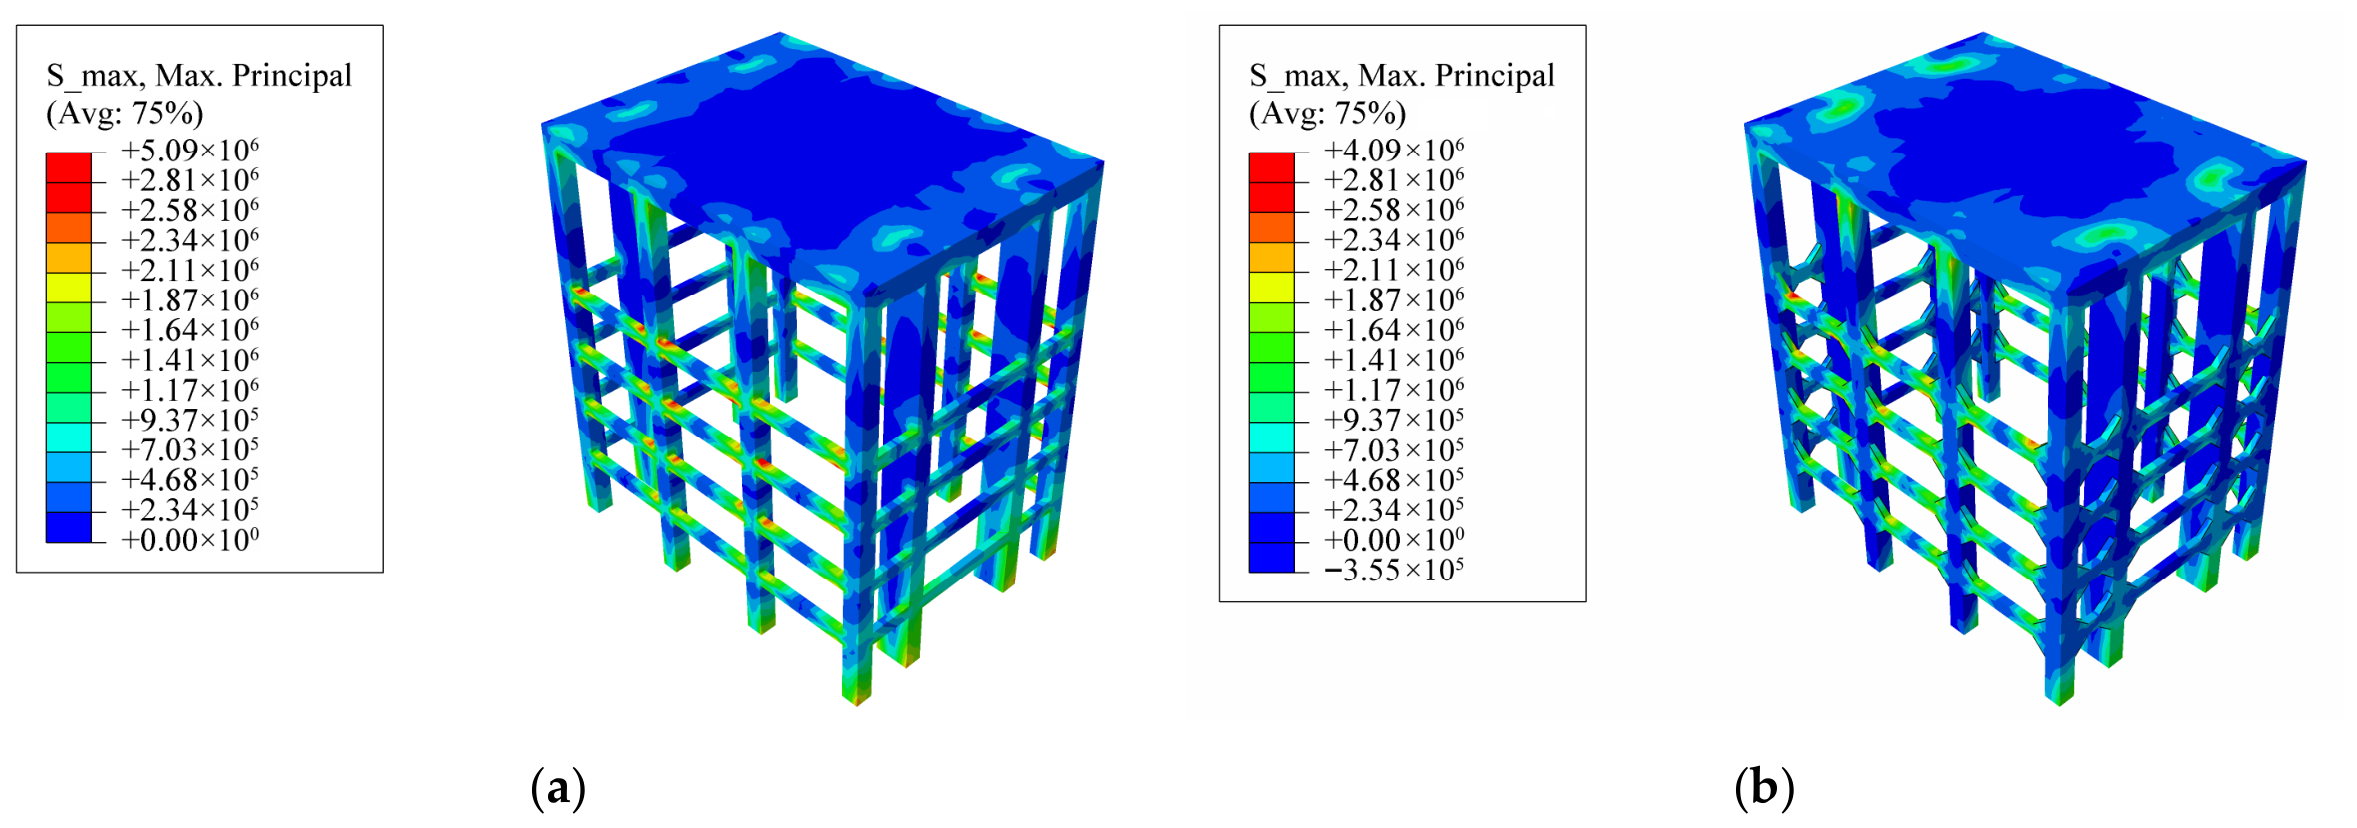
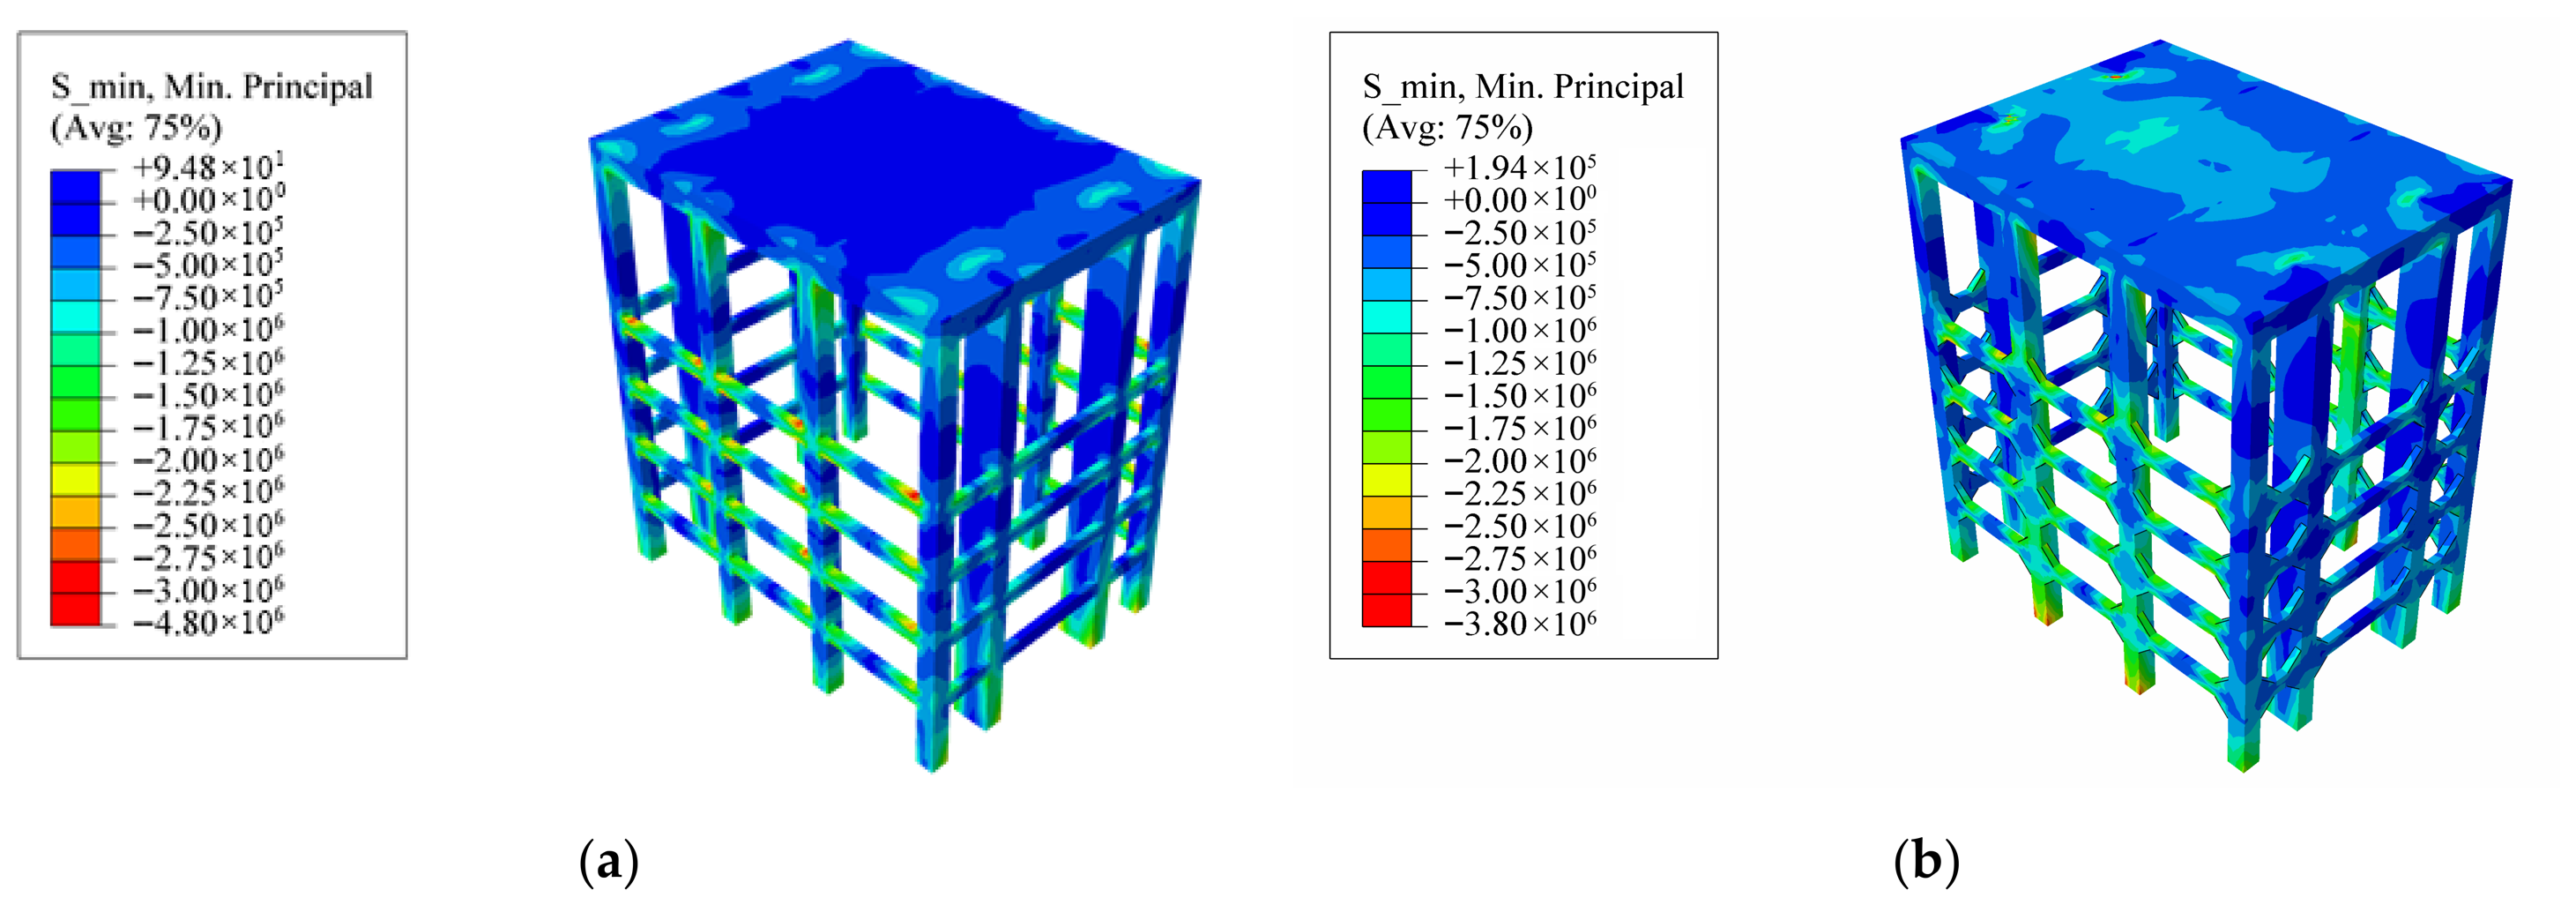
Under linear-elastic time-history analysis, the envelopes of the maximum principal stress and minimum principal stress for the unreinforced and reinforced models are shown in Figure 6 and Figure 7, respectively. The reported stresses represent the combined effects of static and dynamic loading, with tension taken as positive and compression taken as negative.
Figure 6.
Comparison of the maximum principal stress between the unreinforced and reinforced models (Pa): (a) unreinforced model; (b) reinforced model.
Figure 7.
Comparison of the minimum principal stress between the unreinforced and reinforced models (Pa): (a) unreinforced model; (b) reinforced model.
The results show that, before reinforcement, the tensile stress in most regions of the gate hoist structure is lower than the tensile strength of the material, which is 2.81 MPa. However, a few local regions at the beam–column joints exhibit tensile stresses exceeding the material tensile strength, indicating potential weak zones where cracking may occur. This phenomenon can be attributed to stiffness discontinuities and the concentration of internal force transfer at beam–column joints, where geometric changes lead to localized stress amplification. These regions are shown in red in the figures, and the maximum tensile stress reaches 5.09 MPa. After reinforcement, due to the introduction of the braces, the high-tensile-stress region shifts from the beam–column joints to the beam–brace joints located in the middle and upper parts of the structure, while the high-tensile-stress region in the lower part of the structure is reduced. The maximum tensile stress decreases to 4.09 MPa. For both the unreinforced and reinforced models, the compressive stress in the gate hoist structure remains lower than the compressive strength of the material. The maximum compressive stress is 4.80 MPa before reinforcement and 3.80 MPa after reinforcement.
5.2. Point Safety Factor
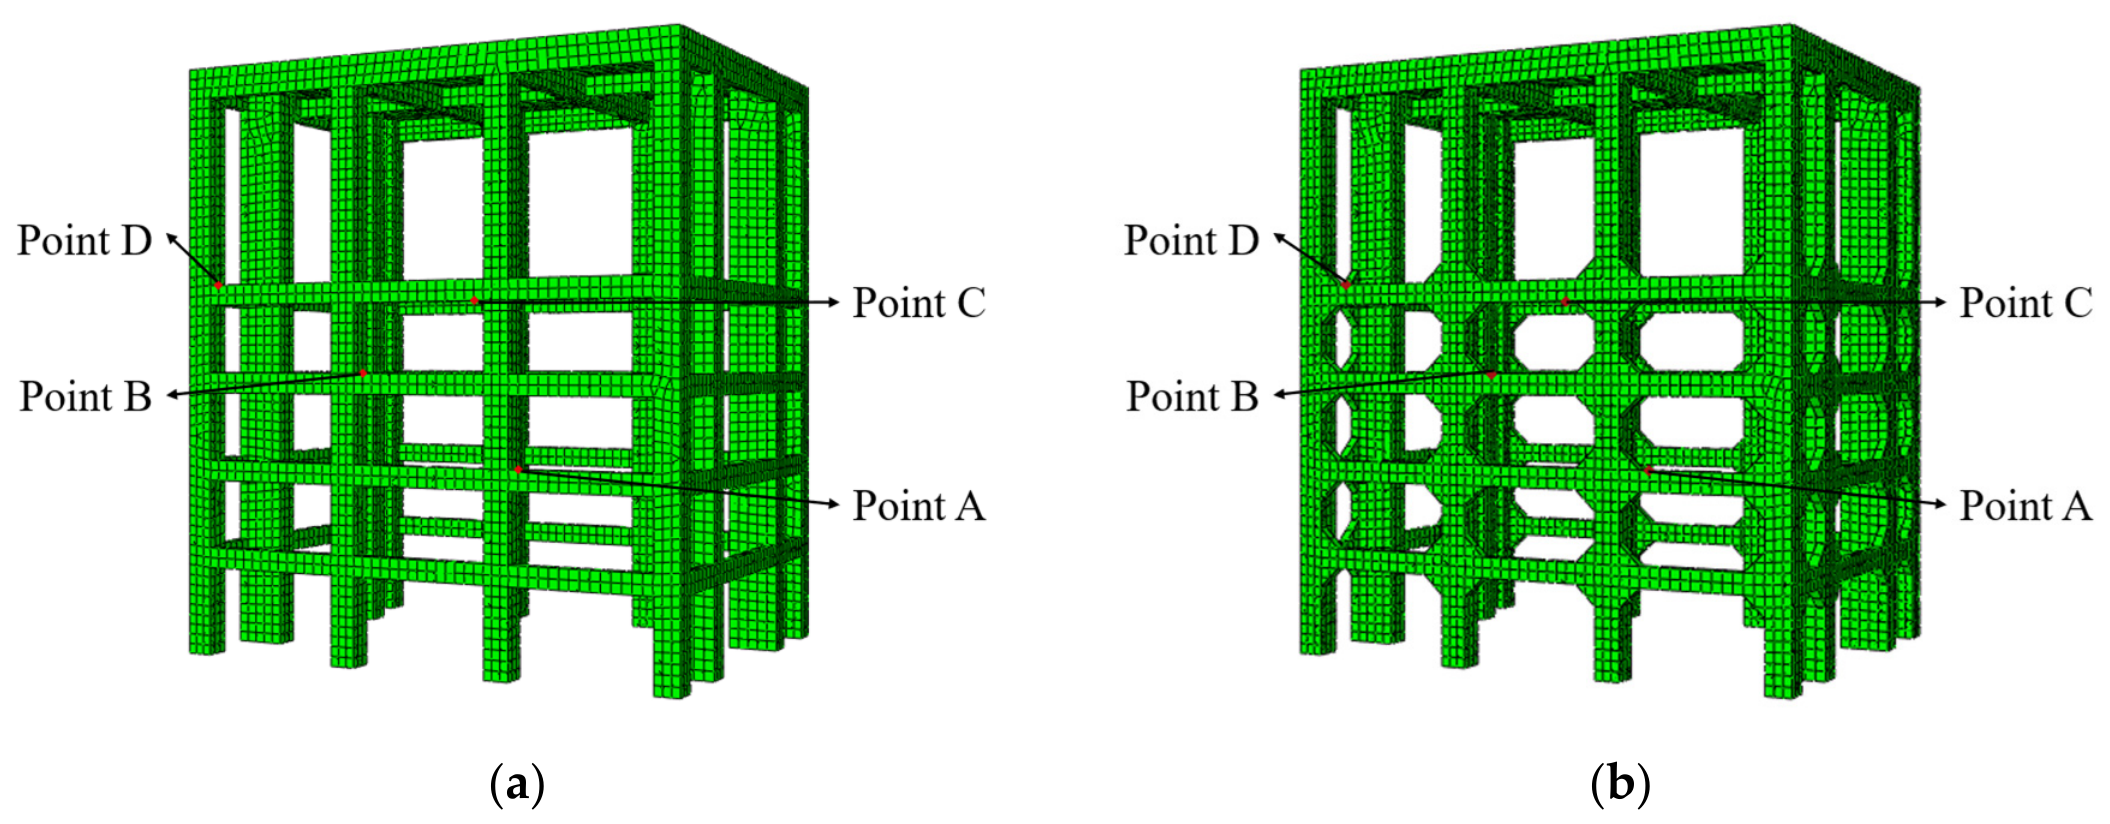
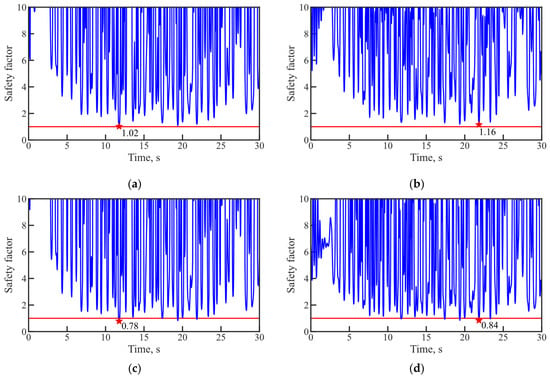
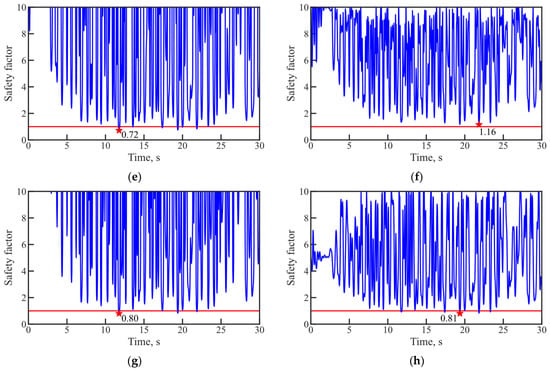
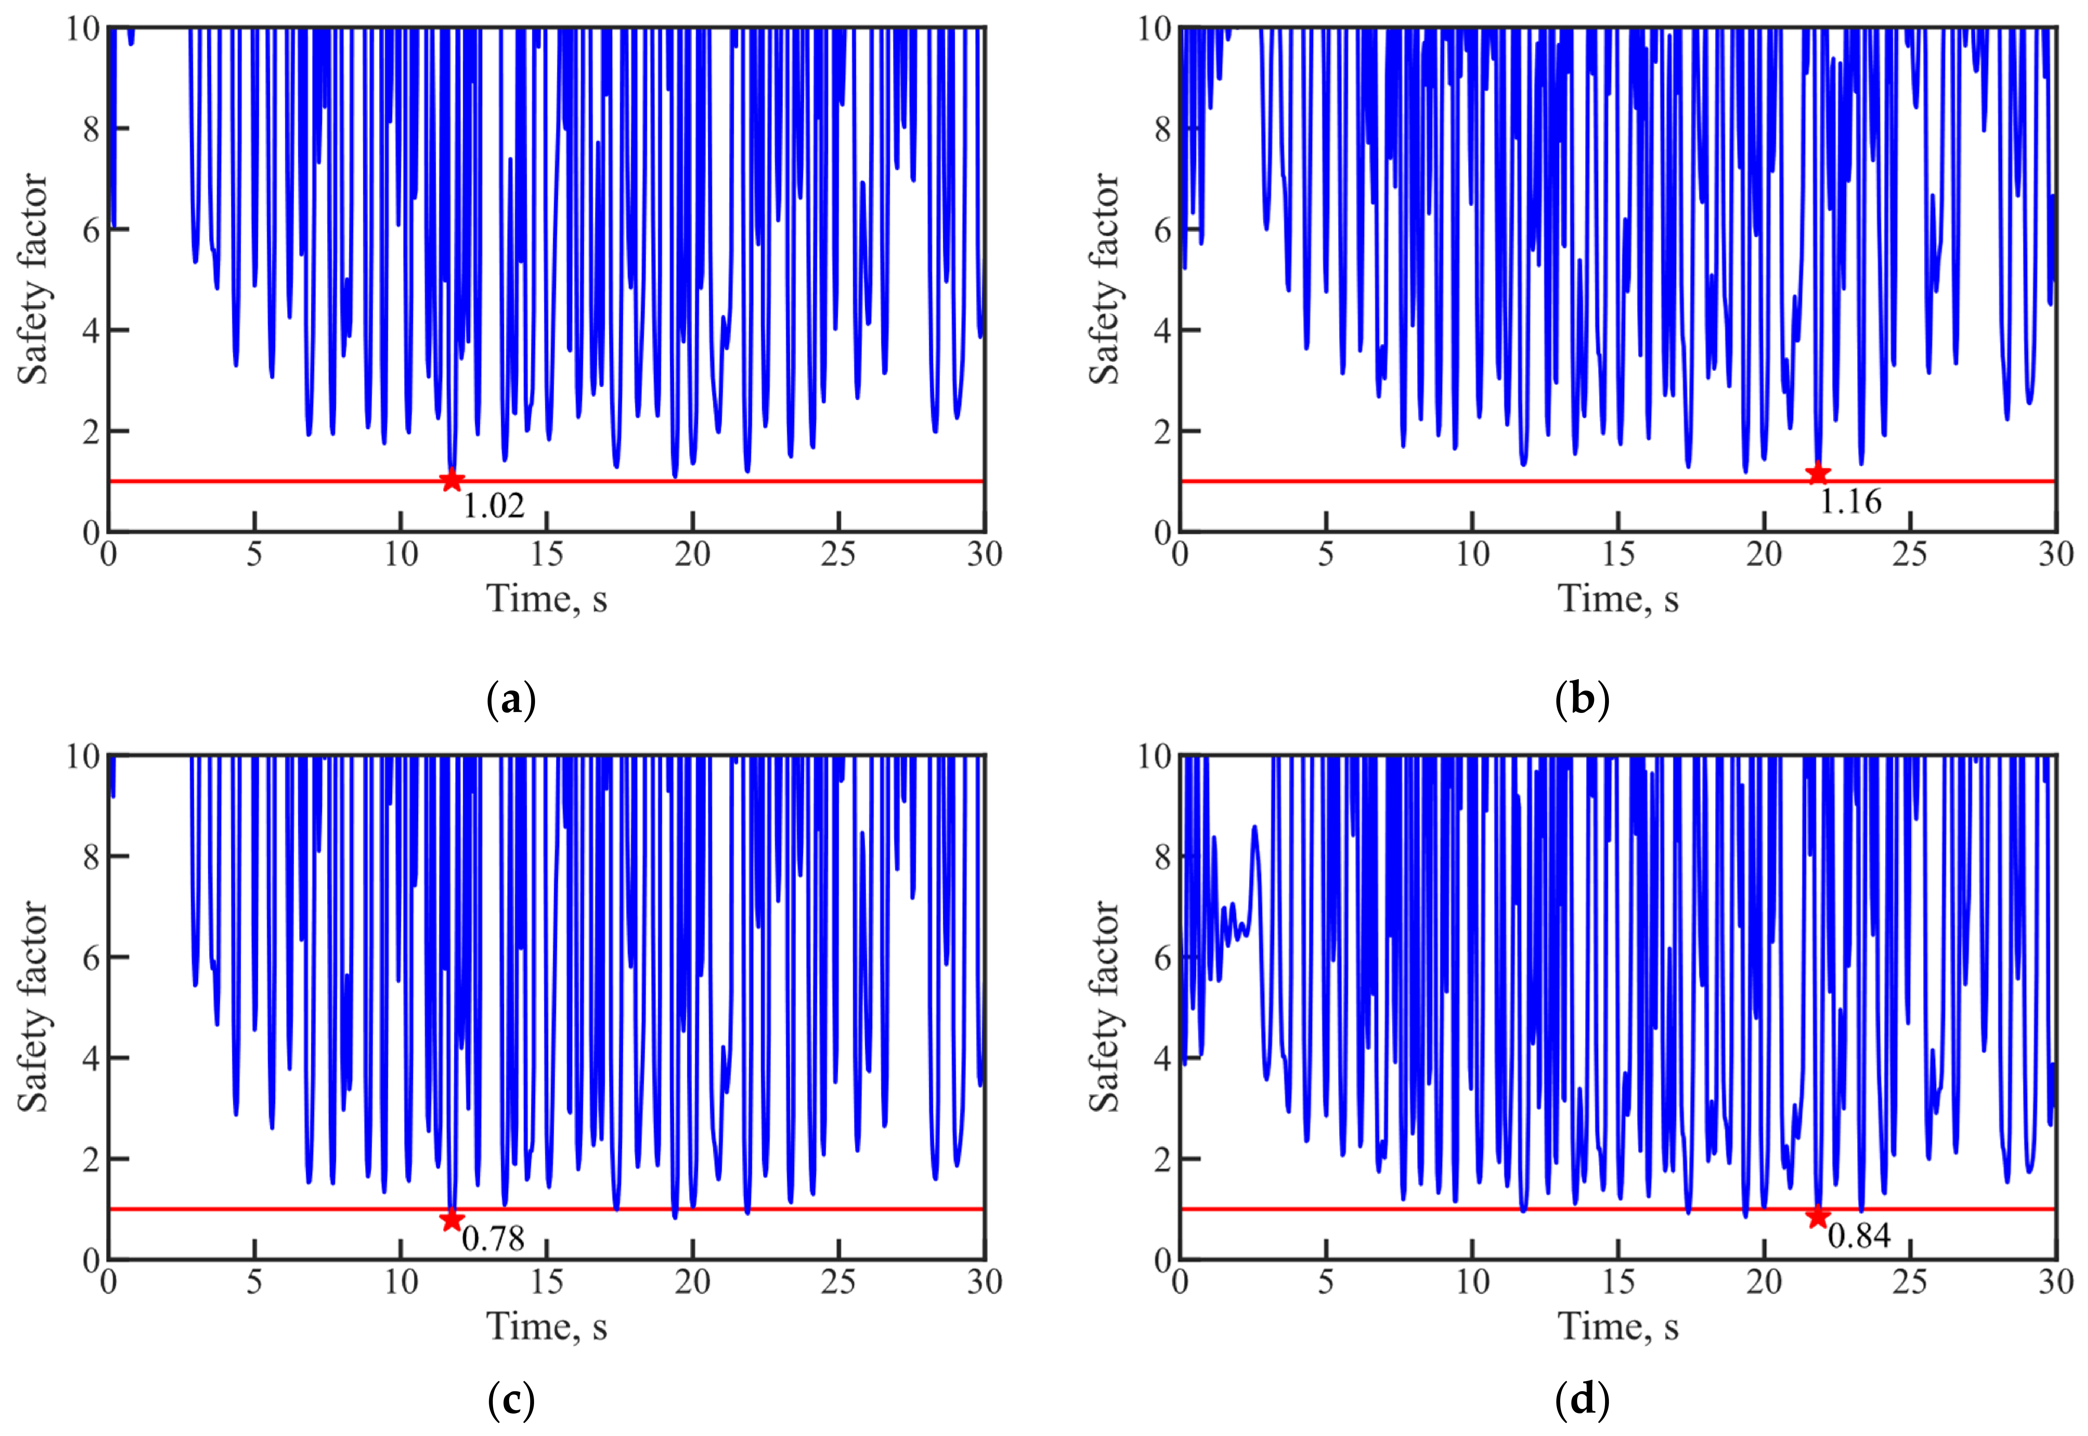
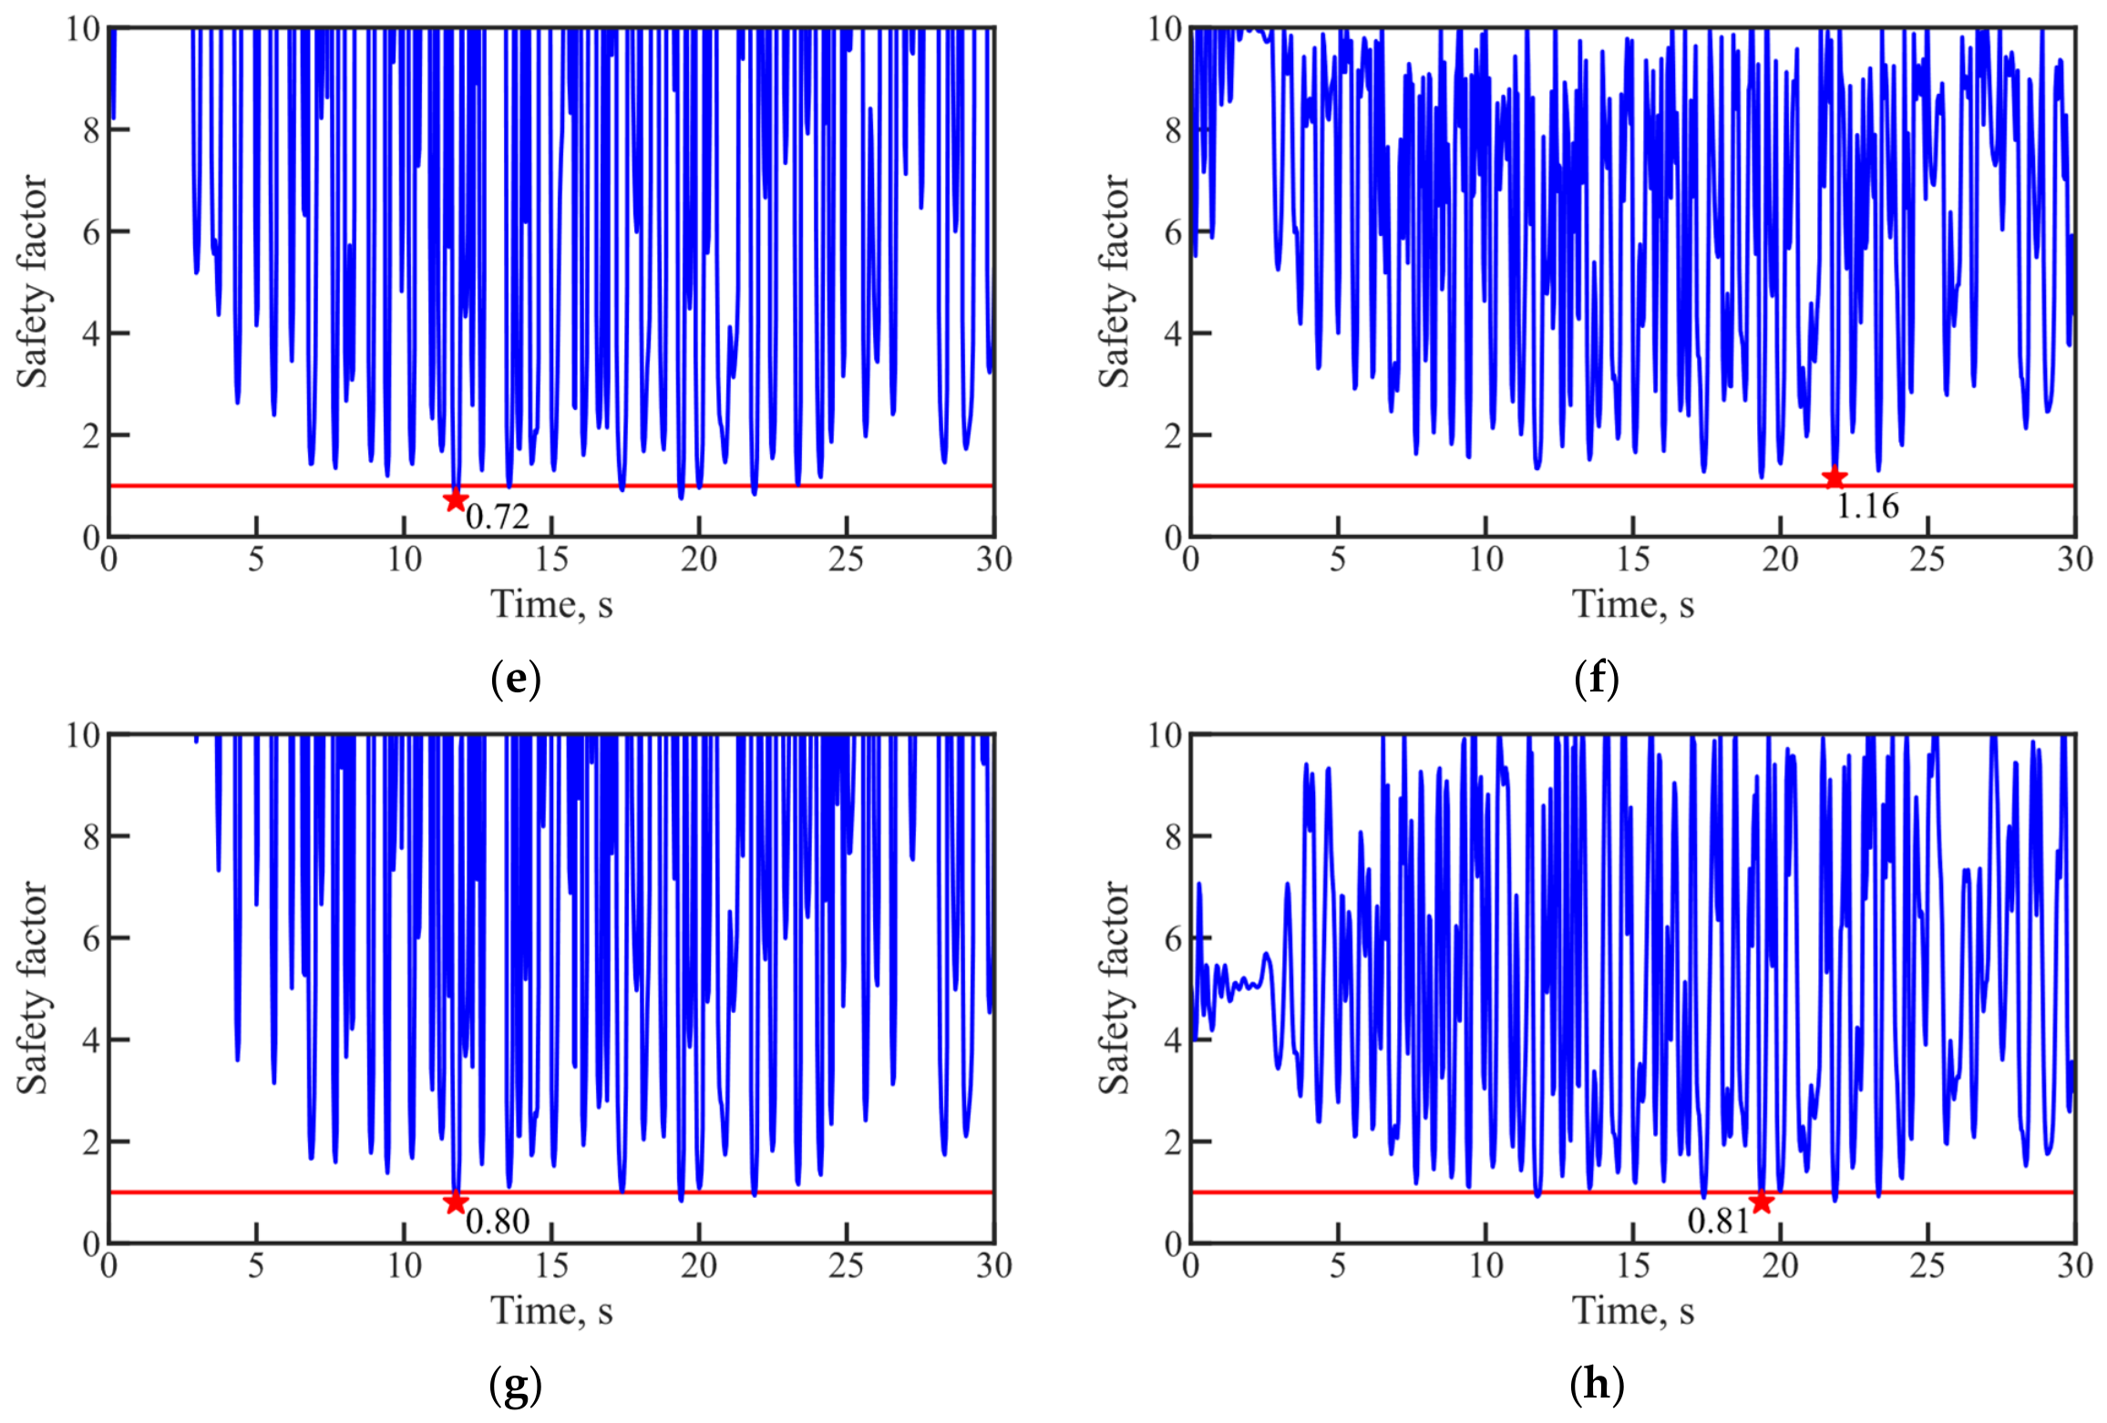
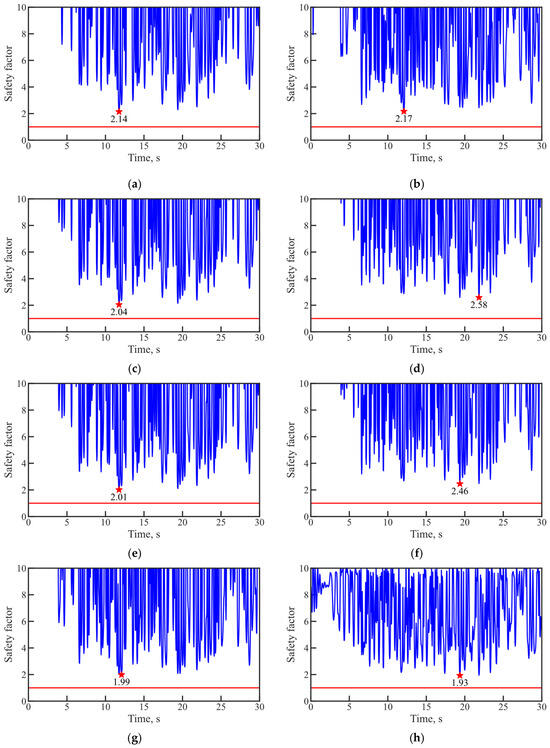
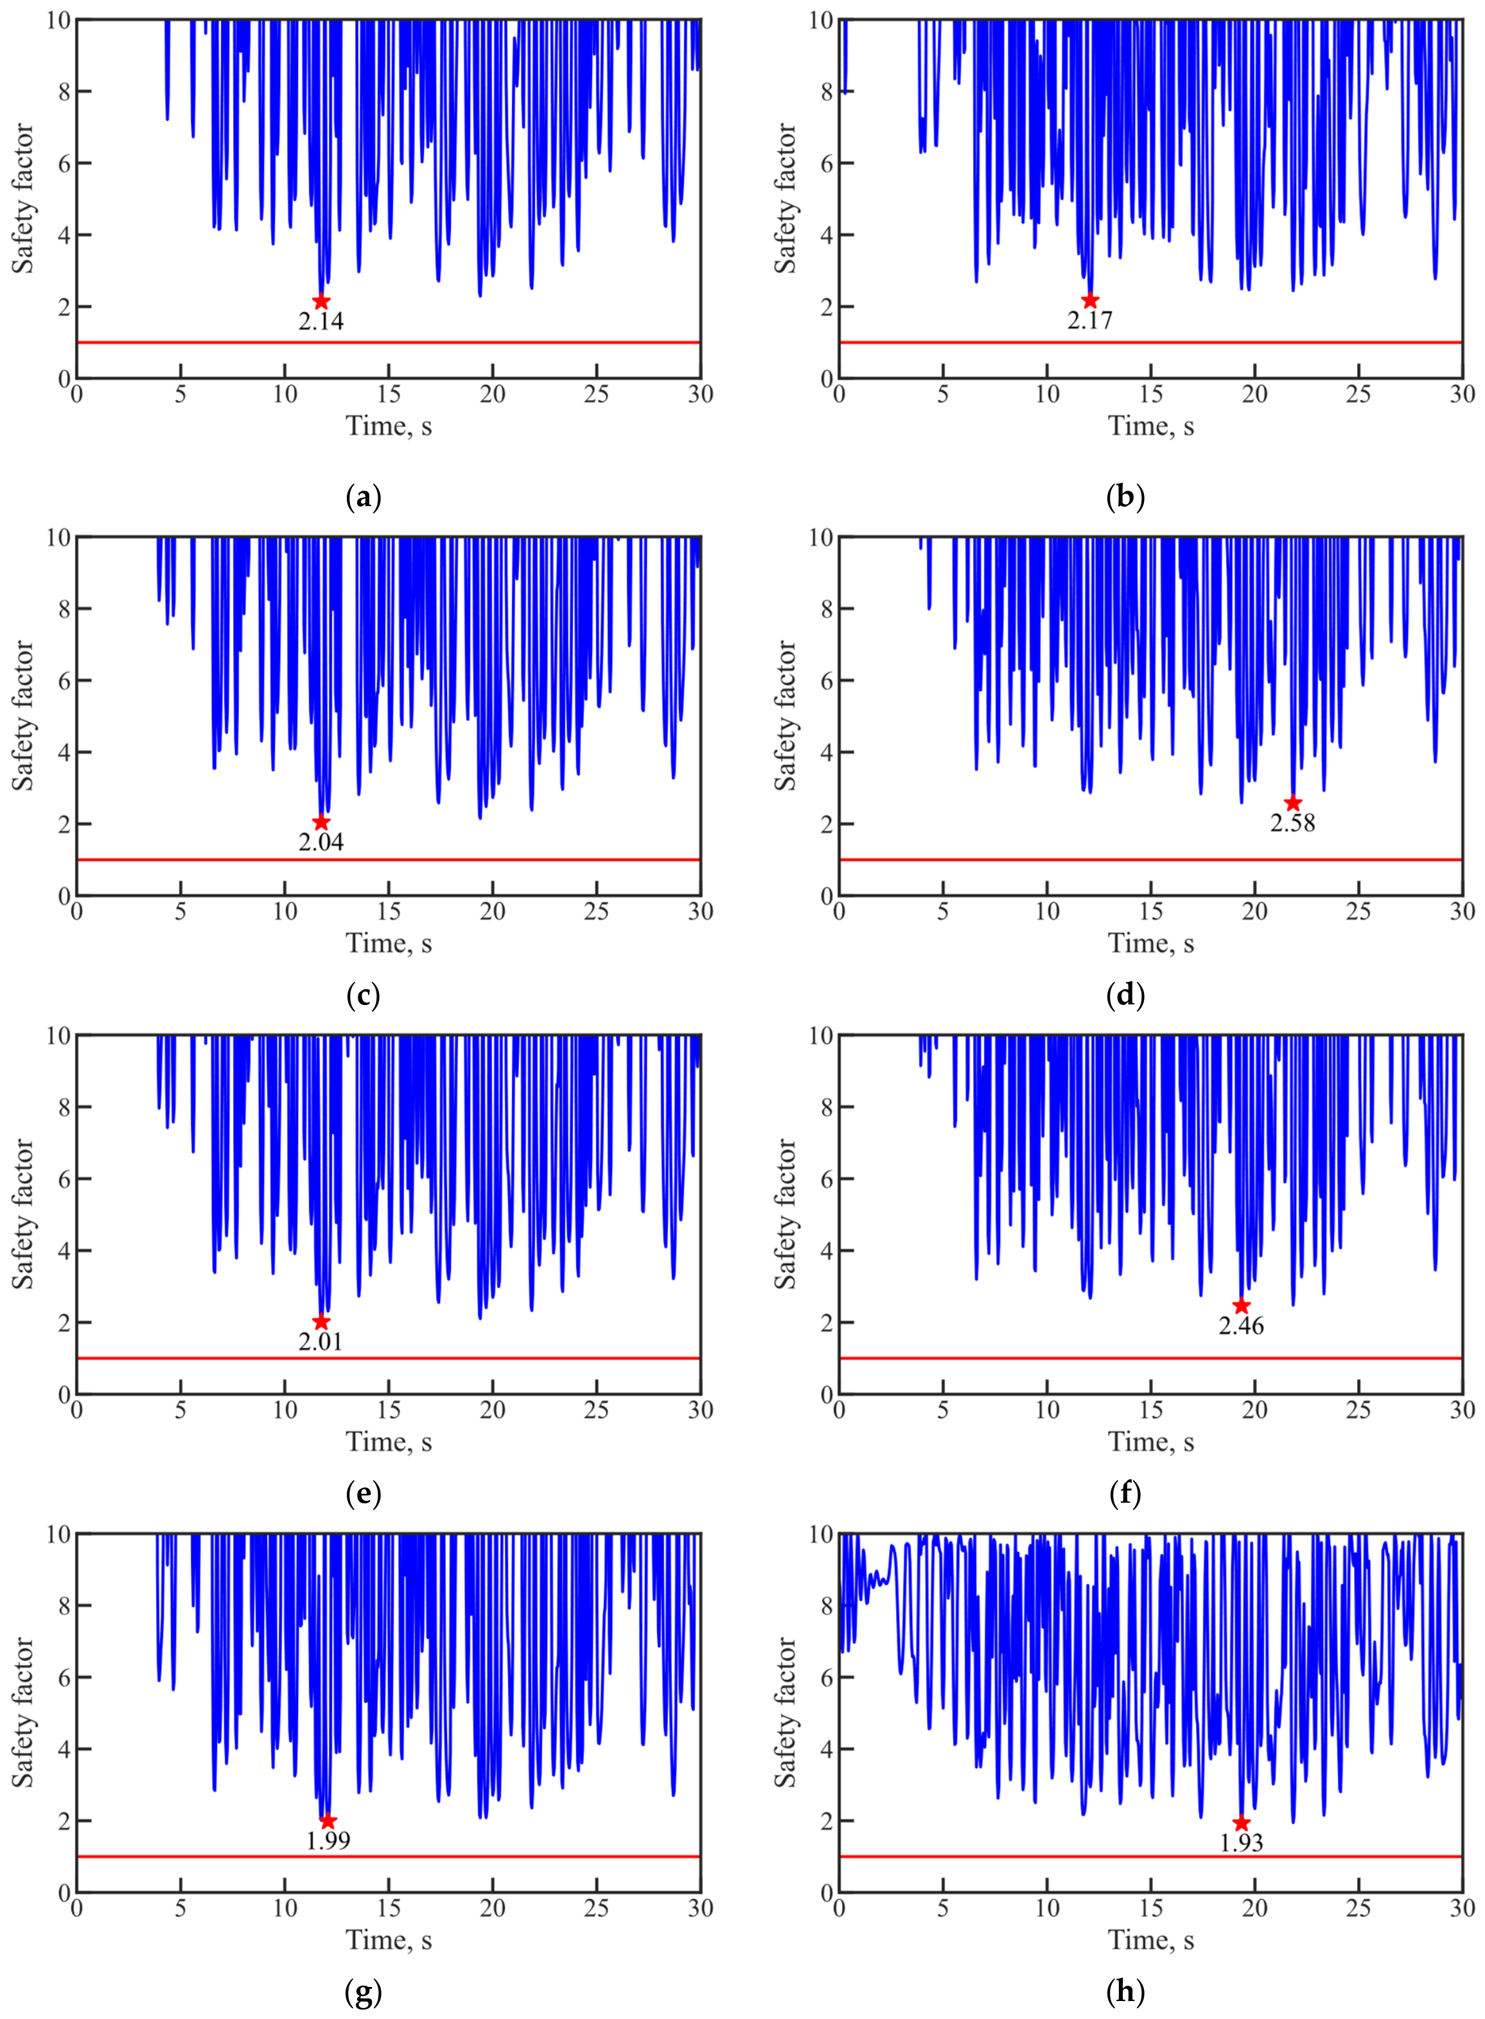
Based on the stress results presented in Section 5.1, four points located in regions of high tensile stress in the gate hoist structure are selected for strength evaluation using the point safety factor method. Owing to the change in the stress distribution after brace reinforcement, the selected points in the reinforced model are shifted to the outer side of the braces. The locations of these points are shown in Figure 8. The time-history curves of the point safety factor for each point are shown in Figure 9. The minimum point safety factor and the duration of the ultimate limit state at each point before and after reinforcement are listed in Table 2.
Figure 8.
Locations of the selected points: (a) unreinforced model; (b) reinforced model.
Figure 9.
Time histories of point safety factor at the selected points: (a) Point A, unreinforced model; (b) Point A, reinforced model; (c) Point B, unreinforced model; (d) Point B, reinforced model; (e) Point C, unreinforced model; (f) Point C, reinforced model; (g) Point D, unreinforced model; (h) Point D, reinforced model. The red line represents the threshold value of the point safety factor, and the star symbol marks the minimum point safety factor over the time history.
Table 2.
Minimum point safety factors and ultimate limit state durations.
The results indicate that, before reinforcement, the safety factor at Point A remains greater than 1 throughout the time history, whereas the safety factors at Points B, C, and D fall below 1 at certain instants, indicating local cracking at these points. Among the four points, Point C exhibits the smallest minimum safety factor and the longest duration of the ultimate limit state, with values of 0.72 and 0.56 s, respectively, indicating the most severe cracking at this location. After reinforcement, the minimum safety factors at all points increase relative to the unreinforced case. In particular, the minimum safety factor at Point C becomes greater than 1, and no ultimate limit state occurs. However, the durations of the ultimate limit state at Points B and D increase slightly. This is because the added braces increase the overall stiffness and reduce peak tensile stress, while introducing local stiffness discontinuities at the beam–brace joints. As a result, although the stress magnitude is reduced, the response may remain close to the ultimate limit state threshold for a longer duration, leading to a slight increase in the cumulative duration of the ultimate limit state.
5.3. Section Safety Factor
The sections used for analysis are defined as the cross-sections passing through the vertical axes of the beams containing the points described in Section 5.2. The time-history curves of the section safety factor for each section are shown in Figure 10. The minimum section safety factor and the duration of the ultimate limit state for each section before and after reinforcement are listed in Table 3.
Figure 10.
Time histories of section safety factor at the selected sections: (a) Section A, unreinforced model; (b) Section A, reinforced model; (c) Section B, unreinforced model; (d) Section B, reinforced model; (e) Section C, unreinforced model; (f) Section C, reinforced model; (g) Section D, unreinforced model; (h) Section D, reinforced model. The red line represents the threshold value of the section safety factor, and the star symbol marks the minimum section safety factor over the time history.
Table 3.
Minimum section safety factors and ultimate limit state durations.
The results show that the safety factors of all four selected sections remain greater than 1 throughout the seismic time history, both before and after reinforcement. For the unreinforced model, the minimum section safety factor occurs at Section D and is 1.99. For the reinforced model, the minimum section safety factor also occurs at Section D and is 1.93, which is slightly lower due to the redistribution of structural response caused by the addition of the braces. In both cases, the sections satisfy the safety and stability requirements. Compared with the point safety factors, the section safety factors are higher because the tensile stresses at other locations on the section are lower than those at the selected points. These results indicate that the gate hoist structure is unlikely to develop through-cracks under the design seismic loading.
5.4. DCR–CID
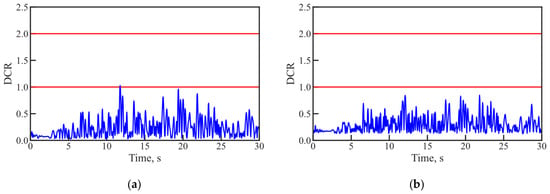
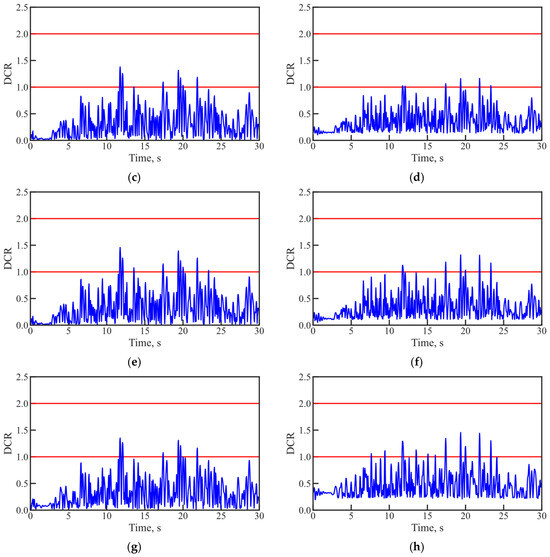
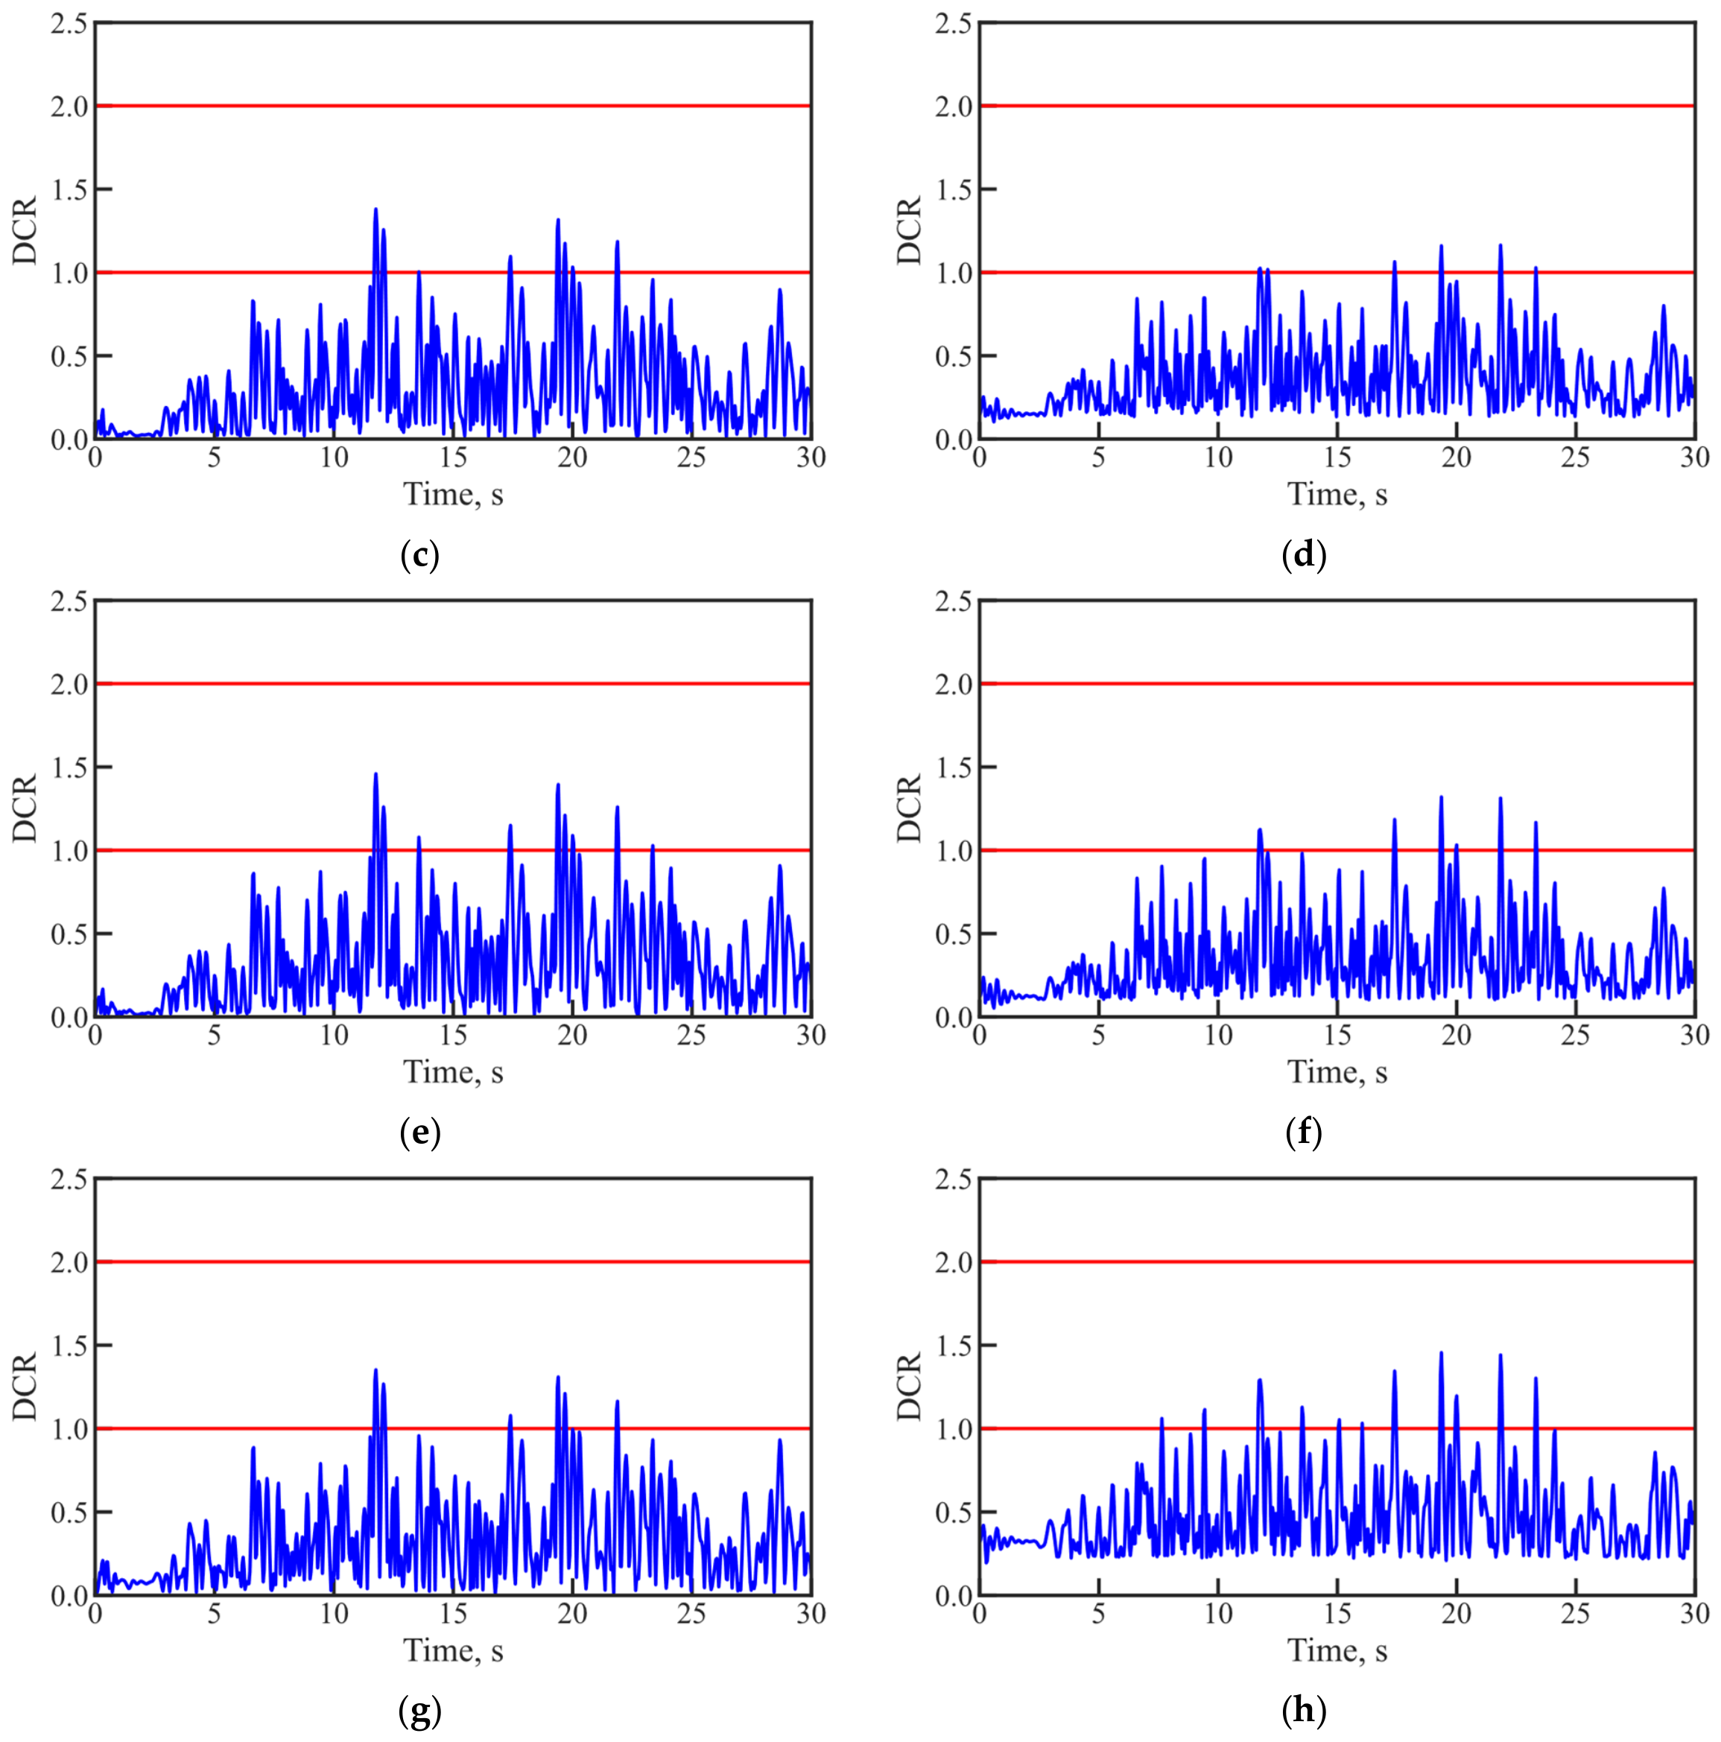
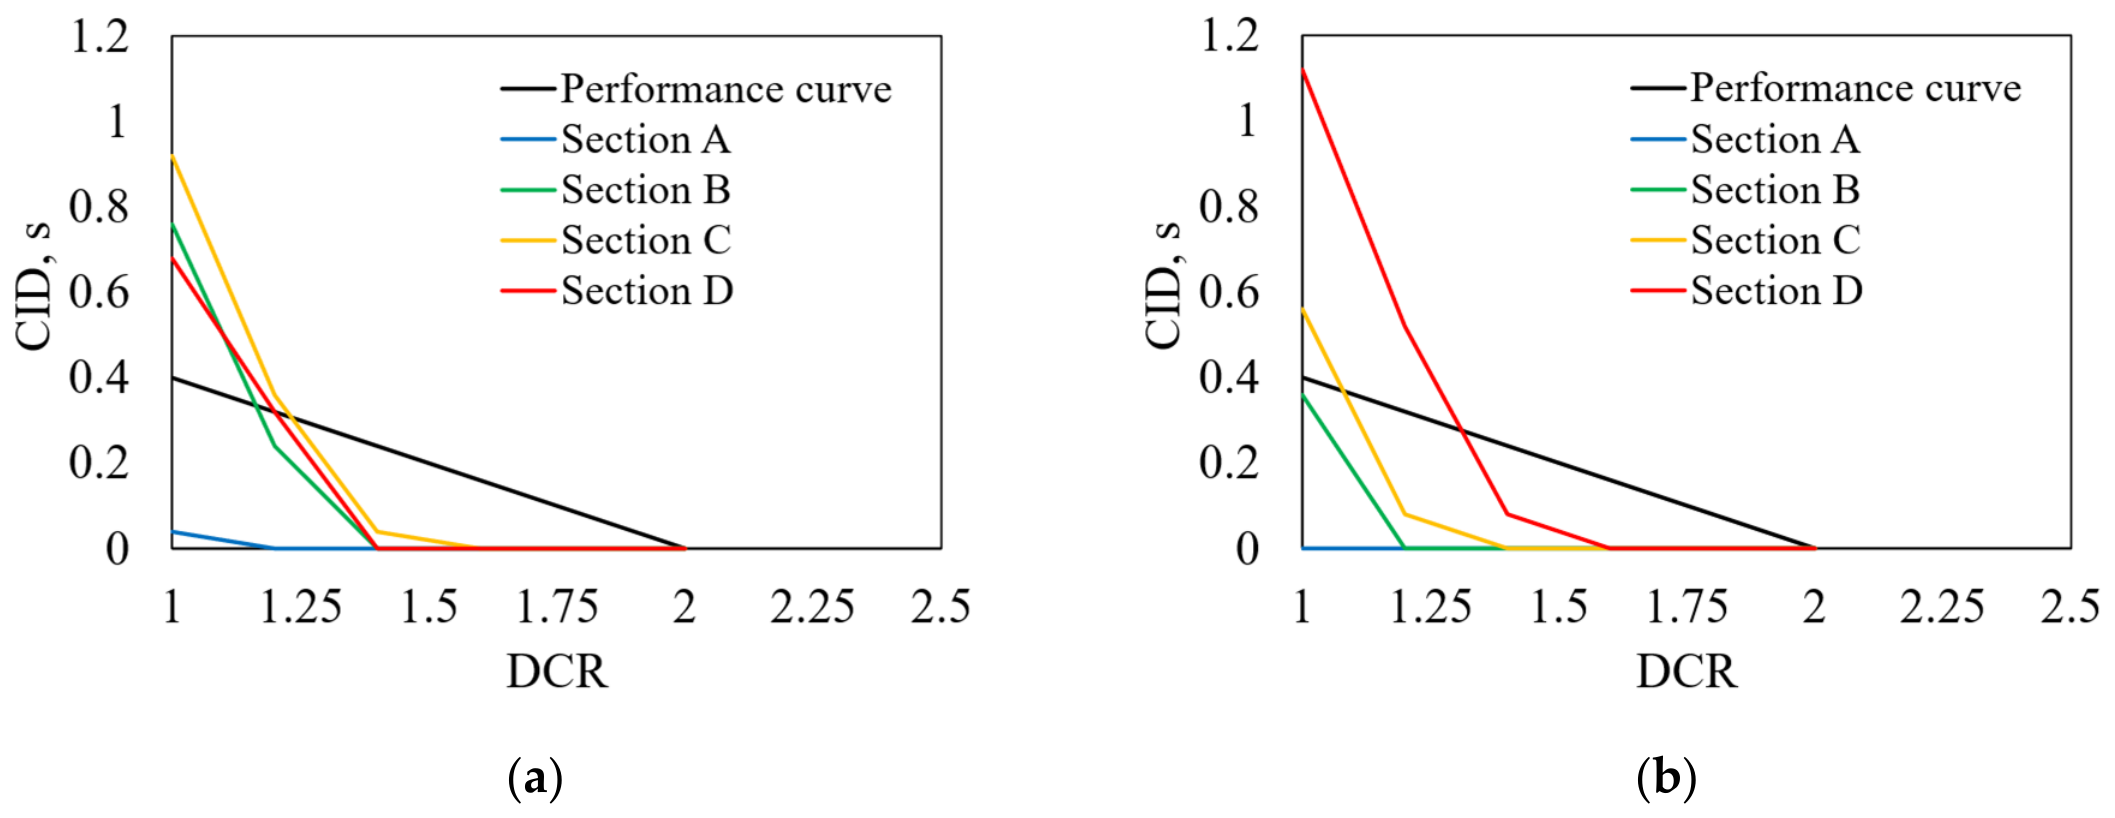
The DCR time histories of the four selected sections in the unreinforced and reinforced models, as defined in Section 5.3, are shown in Figure 11. The corresponding DCR–CID relationships for each section are summarized in Table 4 and plotted in Figure 12.
Figure 11.
Time histories of DCR at the selected sections: (a) Section A, unreinforced model; (b) Section A, reinforced model; (c) Section B, unreinforced model; (d) Section B, reinforced model; (e) Section C, unreinforced model; (f) Section C, reinforced model; (g) Section D, unreinforced model; (h) Section D, reinforced model.
Table 4.
DCR–CID relationships of the selected sections.
Figure 12.
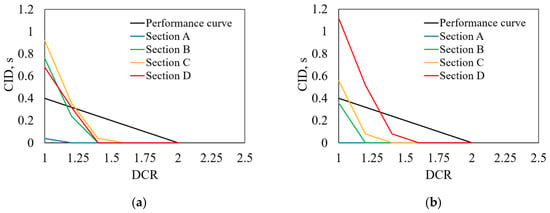
DCR-CID curves at the selected sections: (a) unreinforced model; (b) reinforced model.
The results show that, for the unreinforced model, Section A falls within Performance Level 2, indicating an acceptable level of damage, with limited tensile cracking that does not affect the overall load-bearing capacity or serviceability. Sections B, C, and D all exhibit cumulative overstress durations exceeding the performance curve and are therefore classified as Performance Level 3, indicating the potential for severe damage, with pronounced cracking likely to occur. Among them, Section C shows the most severe damage. After reinforcement, Sections A and B fall within Performance Level 2, whereas Sections C and D remain in Performance Level 3, corresponding to severe damage. Among them, Section D exhibits the largest area beyond the performance curve in the DCR–CID plot, indicating the most severe damage. This also reflects the shift in vulnerable regions and the redistribution of structural response after reinforcement.
6. Conclusions
A three-dimensional finite element model of the foundation–dam–gate hoist structure system is established to investigate the seismic response of a gate hoist structure in a roller-compacted concrete gravity dam. Based on linear-elastic time-history analysis and a multi-index evaluation framework, the following conclusions can be drawn.
- (1)
- Under seismic loading, the seismic response of gate hoist structures is characterized by pronounced localized tensile effects. Tensile stress tends to concentrate at beam–column joints and other regions with abrupt stiffness changes, making these locations the most likely sites for crack initiation.
- (2)
- Local brace reinforcement can reduce peak tensile demand and improve the safety level at critical locations, with its effect being mainly reflected in the alleviation and redistribution of seismic demand rather than the complete elimination of structural vulnerability. Potential weak regions may therefore shift after reinforcement.
- (3)
- Different seismic evaluation indices reflect structural performance at different scales and from different perspectives. Stress and the point safety factor are more sensitive to localized tensile overstress and crack initiation, the section safety factor is more suitable for evaluating sectional safety, and DCR reflects the relative level of seismic demand with respect to structural capacity. Therefore, the seismic safety of gate hoist structures can hardly be fully characterized by a single index, and a multi-index framework provides a more comprehensive basis for identifying damage-prone regions and evaluating reinforcement effectiveness.
- (4)
- The seismic behavior of gate hoist structures is influenced not only by their own configuration, but also by their interaction with the supporting dam body. For similar hydraulic appurtenant structures, integrated modeling of the foundation–dam–gate hoist system is recommended to capture interaction effects and seismic amplification.
- (5)
- Seismic design and reinforcement of gate hoist structures should focus on both global stiffness improvement and local detailing. Local brace reinforcement can be used to reduce peak tensile stress at vulnerable regions such as beam–column joints, and proper connection detailing and stiffness transition at beam–brace joints are required to avoid new stress concentrations and to ensure reliable long-term performance of these critical regions.
The present study is based on linear-elastic analysis under the design earthquake. For a more complete evaluation of structural safety margins and post-cracking behavior, nonlinear analysis under higher seismic intensity levels should be considered in future work.
Author Contributions
Conceptualization, J.P.; methodology, J.P.; software, J.S.; validation, J.S.; investigation, J.M.; resources, J.M. and B.C.; data curation, J.S.; writing—original draft preparation, J.S.; writing—review and editing, J.P. and J.W.; visualization, J.S.; supervision, J.P. and J.W.; project administration, J.P. and J.W.; funding acquisition, J.P. All authors have read and agreed to the published version of the manuscript.
Funding
This research was funded by the National Natural Science Foundation of China (No. 52350393), the Science and Technology Project of China Huaneng Group Co., Ltd. (Nos. HNKJ22-H108, HNKJ25-H99), and the Science and Technology Project of Power Construction Corporation of China, Ltd. (No. DJ-ZDXM-2021-03).
Data Availability Statement
The data presented in this study are available on request from the corresponding author. The data are not publicly available due to privacy.
Conflicts of Interest
Authors Jun Miao and Benlong Chen were employed by the company PowerChina Guiyang Engineering Co., Ltd. The remaining authors declare that the research was conducted in the absence of any commercial or financial relationships that could be construed as a potential conflict of interest. The authors declare that this study received funding from the Science and Technology Project of China Huaneng Group Co., Ltd. and the Science and Technology Project of Power Construction Corporation of China, Ltd. The funder was not involved in the study design, collection, analysis, interpretation of data, the writing of this article or the decision to submit it for publication.
Abbreviations
The following abbreviations are used in this manuscript:
| DCR | Demand-to-capacity ratio |
| CID | Cumulative inelastic duration |
References
- Song, Y.; Wang, X.; Wen, Y.; Liang, Y. Damage characteristics of frame-bent structure of large-scale factory building in Wenchuan Ms 8.0 earthquake. J. Nat. Disasters 2009, 18, 6–11. (In Chinese) [Google Scholar] [CrossRef]
- Jing, X.; Shi, T.; Sa, W.; Yang, D. Seismic design measures for long-span high-bay bent structures. Yangtze River 2015, 46, 92–95. (In Chinese) [Google Scholar] [CrossRef]
- Cervera, M.; Oliver, J.; Faria, R. Seismic evaluation of concrete dams via continuum damage models. Earthq. Eng. Struct. Dyn. 1995, 24, 1225–1245. [Google Scholar] [CrossRef] [Scilit]
- Zhang, C.H.; Jin, F.; Wang, J.T.; Xu, Y. Seismic Safety Evaluation of Concrete Dams: A Nonlinear Behavioral Approach; Butterworth-Heinemann: Oxford, UK, 2013. [Google Scholar]
- Chopra, A.K. Earthquake Engineering for Concrete Dams: Analysis, Design, and Evaluation; John Wiley & Sons Ltd.: Hoboken, NJ, USA, 2020. [Google Scholar]
- Wang, J.; Zhang, C.; Jin, F. Nonlinear earthquake analysis of high arch dam–water–foundation rock systems. In Seismic Safety Evaluation of Concrete Dams; Butterworth-Heinemann: Oxford, UK, 2013; pp. 311–340. [Google Scholar]
- Lin, G. Developing tendency of the seismic safety evaluation of large concrete dams. J. Disaster Prev. Mitig. Eng. 2006, 26, 1–12. (In Chinese) [Google Scholar] [CrossRef]
- Clough, R.W. Non-linear mechanisms in the seismic response of arch dams. In Proceedings of the International Research Conference on Earthquake Engineering, Skopje, Yugoslavia, 30 June–3 July 1980; Available online: https://nisee.berkeley.edu/elibrary/Text/2014062612 (accessed on 1 May 2026).
- Deeks, A.J.; Randolph, M.F. Axisymmetric time-domain transmitting boundaries. J. Eng. Mech. 1994, 120, 25–42. [Google Scholar] [CrossRef] [Scilit]
- Liu, J.; Lü, Y. A direct method for analysis of dynamic soil-structure interaction. China Civ. Eng. J. 1998, 31, 55–64. (In Chinese) [Google Scholar] [CrossRef]
- Tan, H.; Chopra, A.K. Earthquake analysis of arch dams including dam–water–foundation rock interaction. Earthq. Eng. Struct. Dyn. 1995, 24, 1453–1474. [Google Scholar] [CrossRef] [Scilit]
- Wang, Y.; Lin, G.; Hu, Z. A coupled FE and scaled boundary FE-approach for the earthquake response analysis of arch dam-reservoir-foundation system. IOP Conf. Ser. Mater. Sci. Eng. 2010, 10, 012212. [Google Scholar] [CrossRef] [Scilit]
- Zhang, C.; Jin, F.; Wang, J.; Xu, Y.; Pan, J. Key issues and developments on seismic safety evaluation of high concrete dams. J. Hydraul. Eng. 2016, 47, 253–264. (In Chinese) [Google Scholar] [CrossRef]
- Zhang, C.; Jin, F.; Pan, J.; Kou, L. On seismic fortification criteria after Wenchuan Earthquake for high dam in China. Water Resour. Hydropower Eng. 2009, 40, 74–79. (In Chinese) [Google Scholar] [CrossRef]
- Løkke, A.; Chopra, A.K. Direct finite element method for nonlinear earthquake analysis of 3-dimensional semi-unbounded dam–water–foundation rock systems. Earthq. Eng. Struct. Dyn. 2018, 47, 1309–1328. [Google Scholar] [CrossRef] [Scilit]
- Løkke, A.; Chopra, A.K. Direct finite element method for nonlinear earthquake analysis of concrete dams: Simplification, modeling, and practical application. Earthq. Eng. Struct. Dyn. 2019, 48, 818–842. [Google Scholar] [CrossRef] [Scilit]
- Qiu, Y.-X.; Wang, J.-T.; Jin, A.-Y.; Xu, Y.-J.; Zhang, C.-H. Simple models for simulating shear key arrangement in nonlinear seismic analysis of arch dams. Soil Dyn. Earthq. Eng. 2021, 151, 107006. [Google Scholar] [CrossRef] [Scilit]
- Zhang, T.R.; Xu, Q.; Chen, J.Y.; Li, J. Nonlinear seismic response and index correlation of high arch dams under cross-stream oblique incidence of near-fault SV waves based on wavelet decomposition. Soil Dyn. Earthq. Eng. 2023, 164, 107635. [Google Scholar] [CrossRef] [Scilit]
- Wang, G.; Yan, S.-D.; Li, D.-Q.; Du, W.Q. Seismic performance assessment of high arch dams considering the pulse-like and directionality effects of near-fault ground motions. Eng. Struct. 2024, 321, 119010. [Google Scholar] [CrossRef] [Scilit]
- Wan, W.; Liang, X.; Zheng, H.; Liu, Y.; Yuan, Y. Database construction, verification and quantitative analysis of hydropower stations in China. Water Resour. Hydropower Eng. 2022, 53, 185–195. (In Chinese) [Google Scholar] [CrossRef]
- Lü, Z.; Xue, W. Seismic behavior of prestressed concrete portal frames and bent structures. China Civ. Eng. J. 1996, 29, 57–62. (In Chinese) [Google Scholar] [CrossRef]
- Wu, T.; Bai, G.; Liu, B. Experimental study on seismic behavior of RC frame-bent structure of a large-scale power plant. J. Build. Struct. 2007, 28, 46–52. (In Chinese) [Google Scholar] [CrossRef]
- Sun, Z.; Si, B.; Chen, C.; Wang, D. Seismic analysis method for RC bridge bents in mountain areas. J. Vib. Shock 2015, 34, 1–6. (In Chinese) [Google Scholar] [CrossRef]
- Shi, Y.; Li, J.; Qin, H.; Wang, D.; Wang, J.; Sun, Z. Review on seismic performance of bridge double-column bents. China J. Highw. Transp. 2021, 34, 134–154. (In Chinese) [Google Scholar] [CrossRef]
- Zhang, L.; Chen, H.; Zhu, H. Earthquake resistance analysis of the framed bent on the top of lock head of the Three Gorges project ship lift. World Inf. Earthq. Eng. 2001, 17, 115–119. (In Chinese) [Google Scholar] [CrossRef]
- Li, X. Seismic Analysis of Bent Structure of Steel Reinforced Concrete Column on the Upper Part of Intake Tower. Master’s Thesis, Xi’an University of Technology, Xi’an, China, 2020. (In Chinese) [Google Scholar] [CrossRef]
- Gu, P.; Wang, L.; Deng, C.; Tang, L. Review of typical failure characteristics of aqueduct structures in China. Adv. Sci. Technol. Water Resour. 2017, 37, 1–8. (In Chinese) [Google Scholar] [CrossRef]
- GB 51247-2018; Standard for Seismic Design of Hydraulic Structures. Ministry of Housing and Urban-Rural Development of the People’s Republic of China; China Planning Press: Beijing, China, 2018; (In Chinese). Available online: https://www.mohurd.gov.cn/gongkai/zc/wjk/art/2019/art_17339_239999.html (accessed on 1 May 2026).
- Zhang, C.; Pan, J.; Wang, J. Influence of seismic input mechanisms and radiation damping on arch dam response. Soil Dyn. Earthq. Eng. 2009, 29, 1282–1293. [Google Scholar]
- Wang, Z.; Jing, L.; Lu, X.; Qi, W. Comparative study of viscous-spring boundary element and methods of seismic motion input. World Earthq. Eng. 2023, 39, 167–177. (In Chinese) [Google Scholar] [CrossRef]
- Liu, J.; Bao, X.; Li, S.; Wang, F.; Wang, D. Stability improvement of explicit algorithm when using viscoelastic artificial boundary. Eng. Mech. 2023, 40, 20–31. (In Chinese) [Google Scholar] [CrossRef]
- Olmos, B.; Jara, J.M.; Martínez, G. Radiation damping for rigid foundations. Approximate expressions. Vibroeng. Procedia 2019, 27, 103–108. [Google Scholar] [CrossRef] [Scilit]
- Westergaard, H.M. Water pressures on dams during earthquakes. Trans. Am. Soc. Civ. Eng. 1933, 98, 418–433. [Google Scholar] [CrossRef] [Scilit]
- Qiu, Y.; Wei, C.; Wu, Z.; Wang, J. Effects of reservoir water on simulations of arch dam dynamic characteristics. J. Hydroelectr. Eng. 2020, 39, 109–120. (In Chinese) [Google Scholar] [CrossRef]
- EM1110-2-6051; Time-History Dynamic Analysis of Concrete Hydraulic Structures. U.S. Army Corps of Engineers: Washington, DC, USA, 2003. Available online: https://www.publications.usace.army.mil/Portals/76/Publications/EngineerManuals/EM_1110-2-6051.pdf (accessed on 1 May 2026).
- NB/T 11011-2022; Code for Design of Hydraulic Concrete Structures. National Energy Administration; China Water & Power Press: Beijing, China, 2022; (In Chinese). Available online: https://hbba.sacinfo.org.cn/stdDetail/e2d3119cdfbc52e06e5137d4b13175f4696db70c08cd25c9921e0c5d3f6db4f2 (accessed on 1 May 2026).

Disclaimer/Publisher’s Note: The statements, opinions and data contained in all publications are solely those of the individual author(s) and contributor(s) and not of MDPI and/or the editor(s). MDPI and/or the editor(s) disclaim responsibility for any injury to people or property resulting from any ideas, methods, instructions or products referred to in the content. |
© 2026 by the authors. Licensee MDPI, Basel, Switzerland. This article is an open access article distributed under the terms and conditions of the Creative Commons Attribution (CC BY) license.