


Abstract
Fire risks during the construction phase remain one of the most critical challenges in the construction industry, often leading to property losses, casualties, project delays, and long-term reputational damage. To address these issues, this study proposes a risk-informed emergency optimization framework for construction fire scenarios. Utilizing a disaster chain network framework derived from previous case analyses, including 25 secondary events and 59 causal connections, the study focuses on identifying high-risk transmission paths and optimizing emergency response. Through risk-based edge evaluation, high-risk transmission pathways—particularly those linked to casualties—were detected, forming the basis for targeted intervention strategies. An optimized multi-agency collaborative rescue process was designed to address these critical links. Using Colored Petri Net (CPN) simulation, the proposed process was validated on a representative major fire case, demonstrating a 36.3% reduction in overall emergency response time and a 19.5% decrease in firefighting duration. The results highlight that integrating disaster chain analysis, risk-weighted edge disruption, and CPN-based simulation can significantly enhance emergency coordination and operational efficiency. This study provides actionable insights for policymakers and project managers to strengthen fire risk management strategies and build more resilient emergency systems for the construction sector.
1. Introduction
Building fires continue to pose a serious threat to human safety and economic stability despite ongoing technological and regulatory advancements. In 2019, approximately 32% of all reported fire incidents worldwide were building-related, resulting in the highest rate of casualties among all fire types—accounting for 92% of fire-related deaths and 85% of injuries [1]. Beyond the immediate toll on human life, building fires inflict extensive physical, environmental, and economic damage. They often lead to irreversible structural failure, resource depletion, and even the collapse of built assets. Environmentally, fires directly pollute air, water, and soil, while indirectly driving higher resource consumption, waste generation, and embodied carbon emissions, further intensifying climate change [2,3]. For instance, in May 2023, a cable line fault triggered a blaze in a high-rise residential building in Shanxi Province, China, causing five fatalities and an estimated CNY 8.4 million in direct economic losses [4]. The scale of such impacts is shaped by factors including fire duration, transmission pathways, and the vulnerability of the surrounding environment [5].
Construction sites, in particular, are highly vulnerable to fire hazards due to their dynamic, complex, and resource-intensive nature [6]. Temporary structures, frequent use of open flames or heat-generating equipment (e.g., welding, grinding, soldering), and abundant flammable materials (e.g., fuels, solvents, construction waste) create a high-risk environment for fire ignition and propagation [7,8]. Moreover, oxygen-rich atmospheres, often enhanced by stored oxidizers, further increase the risk of rapid fire spread. Studies have identified numerous causes of fire hazards in construction, including illegal smoking, poor material storage, lack of fire protection systems, low safety awareness [9], and faulty electrical installations [10].
Although fire safety protocols have become more stringent in recent years, fire-related emergencies in the construction phase remain under-addressed [11]. Emergency response strategies tend to be generalized, relying on static risk assessments and standard emergency plans. However, construction fires evolve rapidly and often lead to cascading secondary hazards such as structural collapse, toxic exposure, and delayed evacuation [12]. These cascading effects are seldom captured in traditional fire risk management models, which fail to represent the temporal and spatial complexity of construction projects.
Several recent studies have emphasized the importance of understanding fire evolution mechanisms and integrating full-chain fire risk modeling into emergency planning. For instance, frameworks for performance-based assessment in post-earthquake fires [13], construction site evacuation behavior [14], and high-rise site evacuation modeling [15] have shed light on complex hazard scenarios. However, research specifically addressing the disaster chain mechanism in construction fires—where risks propagate through a network of causally linked events—remains limited. Colored Petri Net (CPN) [16] is a graphical and executable modeling tool that supports simulation, behavioral verification, and performance evaluation of complex systems. CPN models are composed of places, transitions, arcs, and guards, which collectively define the operational behavior of a system under emergency conditions. In addition, CPN [17] is a formal graphical modeling language designed for systems in which concurrency, synchronization, and resource sharing play a central role. Furthermore, it has been widely applied in the formal specification, analysis, and verification of a variety of complex systems, such as Insulin Infusion Pump Systems [18], manufacturing [19], and security protocol analysis [20], but its application in construction fire scenarios remains relatively unexplored and unstandardized.
Unlike static flowcharts, CPNs offer a dynamic, visual framework to capture state-token interactions and simulate both system logic and performance. Jensen et al. [21] describe the typical workflow: abstracting the target system into concurrent events, state transitions, and data flows; organizing these into hierarchical models; validating color sets and variables; generating executable models; and performing formal verification with state-space analysis to check properties like boundedness and liveness. Simulations then produce visual outputs and performance logs for validation and optimization. In construction fire disaster chains, CPN’s capacity to model cascading events, verify emergency logic, and test intervention strategies makes it a powerful tool for refining multi-stage fire management and lowering overall disaster chain risk. CPNs have been widely utilized in fire-related research, primarily focusing on bottleneck identification and resource allocation optimization. Such as Deng et al. [22] and Zhou et al. [23], which directly apply CPNs to analyze bottlenecks or resource allocation for improved deployment efficiency, this study first identifies critical steps in the emergency process through complex network analysis and then validates them via CPN simulation. Compared to traditional complex network validation methods, like Yang et al. [24], who used the Susceptible-Infected (SI) model on datasets like Zachary’s karate club to assess node importance, or Khaoula et al. [25], who employed SI simulations on networks like US aviation and dolphin social to evaluate influential nodes, this dual-dimensional framework integrates static topological analysis with dynamic process simulation.
Compared to existing studies, this research proposes a novel “structure-process” dual-dimensional framework, integrating complex network topology analysis with CPN dynamic simulation to model construction fire disaster chains. The framework first employs complex network analysis to reveal the topological structure of disaster chains, using a dual-factor node importance evaluation model based on weighted in-out degree and betweenness centrality, alongside a composite edge vulnerability index incorporating betweenness, connectivity, and path length. This approach enables precise identification of critical nodes and vulnerable paths in the disaster chain. Subsequently, an optimized emergency response process is proposed, modeled, and validated through CPN simulation, which abstracts the dynamic execution of concurrent events, state transitions, and resource flows. Applied to a real-world case—the 17 April 2023, factory fire causing 11 fatalities and significant economic losses—the CPN model verifies the optimized multi-agency emergency process. In this study, we utilize CPN as a dynamic simulation tool to validate an optimized multi-agency emergency response process for construction fire disaster chains, leveraging their strengths in modeling complex, concurrent, and distributed systems. CPNs are particularly suited for this purpose due to their ability to express intricate resource types and state interaction logic through color extensions, aligning well with the multi-agency coordination inherent in construction fire emergency management. The advantages of using CPNs include: (1) visualizing multi-agency collaboration, enabling assessment of the optimized process’s coordination and efficiency; (2) quantifying key process stages by measuring node execution times to identify potential bottlenecks; and (3) empirically validating improvements by comparing simulation results with real-world case data. Node trigger delay intervals, critical to simulation accuracy, are set using a combination of case report data (e.g., firefighter arrival times), scholarly research for evacuation time calculations, and regulatory response time requirements, ensuring scientifically grounded parameters. Overall, this research enriches multi-dimensional analysis for construction fire disaster management, enhancing risk identification and response optimization with a more actionable and robust method compared to single-dimensional analyses in prior research.
Building on this foundation, the study proposes a risk-informed framework to optimize emergency procedures for construction fires by identifying and mitigating critical links within the disaster chain. Causally connected events (network edges) are quantitatively assessed to pinpoint high-risk transmission paths, with targeted interventions designed to disrupt them. Based on this analysis, a multi-agency collaborative emergency process is developed to enhance coordination and response efficiency. The study contributes by formulating an optimization strategy grounded in risk-weighted edge analysis and validating the refined process through CPN-based simulation using real fire cases, with a focus on completeness, logical coherence, and performance. By integrating risk stratification, network modeling, and formal simulation, this research provides a scalable approach to reduce systemic vulnerabilities and advance toward an “all-hazards, full-cycle” emergency management system for the construction sector.
2. Literature Review
2.1. Construction Fire Risk Identification and Emergency Process Optimization
In recent years, fire risk assessment has predominantly focused on industrial and commercial buildings. Studies such as those by Cvetković et al. [26] and De la Hoz et al. [27] employed statistical and descriptive methods to explore factors like occupant behavior and compliance with safety regulations, yet they lacked structured frameworks for risk classification or prioritization.
Some researchers have turned to multi-criteria decision-making (MCDM) methods. For instance, Wang et al. [28] and Yilmaz et al. [29] applied fuzzy Analytic Hierarchy Process (AHP) to determine weightings of risk factors, while Alkış et al. [30] used traditional AHP to assess facilities most at risk during fire incidents. Although these methods are widely adopted, their complexity—especially in collecting consistent expert input through pairwise comparisons—can be time-consuming and cognitively demanding [31]. Compared to AHP, the Best-Worst Method (BWM) used in the present study offers improved consistency and ease of application [32]. Omidvari et al. [31] further integrated Failure Mode and Effect Analysis (FMEA), and BWM in a hybrid Multi-Criteria Decision Making (MCDM) framework to prioritize fire risks in hospital settings; however, their model did not fully account for crucial factors like the functional impact of fire alarm systems on risk severity. Similarly, although Brzezinska and Bryant [33] proposed a performance-based index for sustainable fire safety, overlapping index values often limited the clarity of their rankings. Other efforts, such as that of Rahardjo and Prihanton [34], emphasized identifying high-risk buildings but did not delve into the relative prioritization of risk sources or mitigation strategies.
Despite the growing body of literature on fire risk assessment in static building environments, limited attention has been directed toward the construction phase, which presents a highly dynamic and risk-prone context [35]. For instance, Li et al. [36] proposed a fire risk assessment model for high-rise buildings under construction based on unascertained measure theory, with index weights determined by the entropy weight method and validated through a case study in Xi’an. Unlike completed buildings, construction sites are characterized by frequent changes in spatial layout, temporary electrical installations, open flame operations, and incomplete fire protection systems. These conditions not only elevate the likelihood of fire outbreaks but also complicate the implementation of conventional fire safety measures [37]. Moreover, fire incidents during construction often exhibit chain-like propagation effects, where initial hazards rapidly trigger secondary risks across multiple subsystems.
The core methodology of emergency management systems for construction fires is grounded in systems theory and cybernetics, emphasizing how safety science transforms information into protective actions. Silva et al. [38] highlighted that process management converts inputs into outputs of value for stakeholders within fire emergencies, this means turning incident data into critical responses like evacuation and containment. Attaran [39] framed this as process logic: integrating fire response teams, emergency plans, and intelligent monitoring to form a closed loop system of hazard warning, emergency activation, and on-site handling. Similarly, Shams Abadi et al. [40] demonstrated how simulation combining building information model (BIM), computational fluid dynamics (CFD)-based fire modeling, and agent-based modeling (ABM) evacuation analysis can inform safety-driven scheduling decisions. Building on these principles, this study advances construction fire management by identifying and mitigating critical links in the fire disaster chain, applying risk-based analysis to guide multi-agency intervention strategies, and validating optimized emergency procedures through CPN simulation, thereby strengthening both responsiveness and systemic resilience.
2.2. Secondary and Derivative Disaster Chains in Construction Fires
Building construction covers all stages from permit issuance to project completion, including new builds, renovations, and expansions. Ji et al. [41] define a construction fire as a sudden, uncontrolled blaze on-site, typically caused by loss of control over a fire source. Such fires act as primary events, triggering chains of secondary and derivative events that escalate hazards and impacts.
In recent years, research on disaster chains has made considerable advances in both theoretical development and practical application. Alexander et al. [42] provided a systematic review of cascading disasters based on disaster chain theory, analyzing the formation and impacts of secondary hazards such as earthquakes and landslides. Fan et al. [43] investigated earthquake-induced geological disaster chains (e.g., landslides) using disaster chain theory, and proposed a systematic analytical framework for understanding secondary hazards such as river blockages and floods. Recently, machine learning algorithms are increasingly being used to study fires in buildings and their components [44,45,46]. For example, Su et al. [47] combined disaster chain theory with deep learning techniques to study the susceptibility and risk assessment of landslide chains triggered by earthquakes in Maoxian County, Sichuan Province. The study introduced a DNN-based model for geological hazard prediction, enhancing early warning capabilities. Collectively, these studies elucidate how primary disasters can trigger cascading secondary events and provide a scientific foundation for disaster prevention, highlighting the early practical value of disaster chain theory in natural hazard contexts. Similarly, Choi et al. [48] proposed a set of fire risk assessment models based on statistical machine learning and optimized risk indexing, demonstrating that their logistic regression and deep neural network (DNN) approaches significantly outperformed traditional models in predicting fire occurrences using real-world data from Korea.
In the domain of construction fire research, significant advancements have been made in recent years, particularly in early warning, fire risk assessment, and disaster chain modeling. Hao et al. [49] developed a fire risk grading model based on multi-source data, enhancing the accuracy of early fire detection and classification in complex construction environments. Su et al. [50], on the other hand, leveraged image recognition technology to improve real-time monitoring and intelligent identification of fire scenarios on construction sites, effectively reducing response time in early warning systems. Expanding the analytical dimension, Tang et al. [51] applied complex network theory to historical fire case analysis, constructing a framework for identifying secondary and derivative disaster chains in construction fires. Their work offered a novel perspective on the dynamic propagation of multi-stage hazards, facilitating more comprehensive risk control strategies in construction safety management.
Yi et al. [52] developed a fuzzy pattern recognition model for assessing fire risks in high-rise buildings, combining AHP-based weighting with fuzzy evaluation to produce quantified risk grades that support performance-based fire protection design, validated through a Xi’an hotel case. Similarly, Li et al. [53] proposed a multi-method model integrating gray relational analysis, AHP, and fuzzy evaluation to assess risks across hardware, evacuation, prevention, and management dimensions. Their study of five buildings showed that office towers generally scored safer than malls or residential complexes, which lacked adequate smoke partitioning and emergency planning. Together, these works provide practical, data-driven tools for improving fire prevention and preparedness in high-risk construction.
2.3. Theoretical Foundations and Simulation Applications of CPN
Petri Net theory [54], originally proposed by Carl Adam Petri in Germany in 1962, is a formal modeling method widely used to describe and analyze the behavior of distributed systems. With further development, CPNs were introduced by Danish scholar Kurt Jensen in 1981 as an advanced Petri Net extension [55]. The key distinction between standard Petri Nets and CPN lies in the introduction of the concept of “color”—typed data values—which effectively addresses the challenges of state-space explosion and model complexity in large-scale systems [56]. By incorporating data types and values, CPN enhances the expressiveness and abstraction capabilities of the model [57]. Currently, CPN has been widely applied in diverse domains such as production line optimization in manufacturing, replication pipelining [58], and emergency management workflow optimization [59]. For instance, Derni et al. [60] modeled emergency department workflows in a hospital using CPN and simulated various improvement scenarios in the field of emergency response, resulting in reduced patient waiting and hospitalization times. Furthermore, Zeinalnezhad et al. [61] utilized CPN simulation to optimize patient flow and reduce healthcare worker exposure risks during the COVID-19 pandemic, providing evidence-based process designs for epidemic response.
CPNs have emerged as a powerful modeling and simulation tool for capturing the dynamic, concurrent, and event-driven nature of construction systems [62]. Early research demonstrated the applicability of CPNs and related Petri Net variants [63] in modeling construction operations, offering advantages in representing sequencing, concurrency, and resource constraints that traditional tools struggle to address. In particular, CPNs [64] have been employed to simulate dispatching processes and emergency resource coordination, as shown in urban fire-fighting systems such as the Shanghai 119 Command Center. Their flexibility allows integration of both discrete and continuous events [65], as demonstrated by hybrid CPN models used for analyzing emergency response actions in industrial fire scenarios.
In broader safety and risk domains, Petri nets [66] have been highlighted as promising tools to overcome the combinatorial limitations of traditional methods in accident modeling and hazard propagation. For example, timed hybrid CPNs [67] were used to assess emergency responses and the likelihood of domino effects in industrial chemical fires, demonstrating their utility in both fire prevention and mitigation planning. In multi-site fire scenarios caused by external threats (e.g., vandalism or terrorism), Zhou et al. [68] used CPN-based simulations helped evaluate firefighter deployment strategies and resource allocations under uncertainty. Furthermore, Wang et al. [69] proposed that the CPNs have been integrated into the socio-technical frameworks like System-Theoretic Process Analysis Based on Formalization Model (BFM-STPA) to identify hazards arising from complex human-system interactions, organizational structures, and latent safety conditions.
Collectively, these studies underscore the applicability of CPNs in construction and emergency contexts, where their ability to capture both system logic and temporal behavior supports performance evaluation, emergency planning, and risk-informed decision-making.
3. Methodology
The following research is from the topology of the fire disaster chain network of the construction of the basic model [51]. This paper firstly calculates the risk degree of the connected edges and then optimizes the rescue process according to the ranking of the risk degree.
3.1. Calculation of Construction Fire Risk
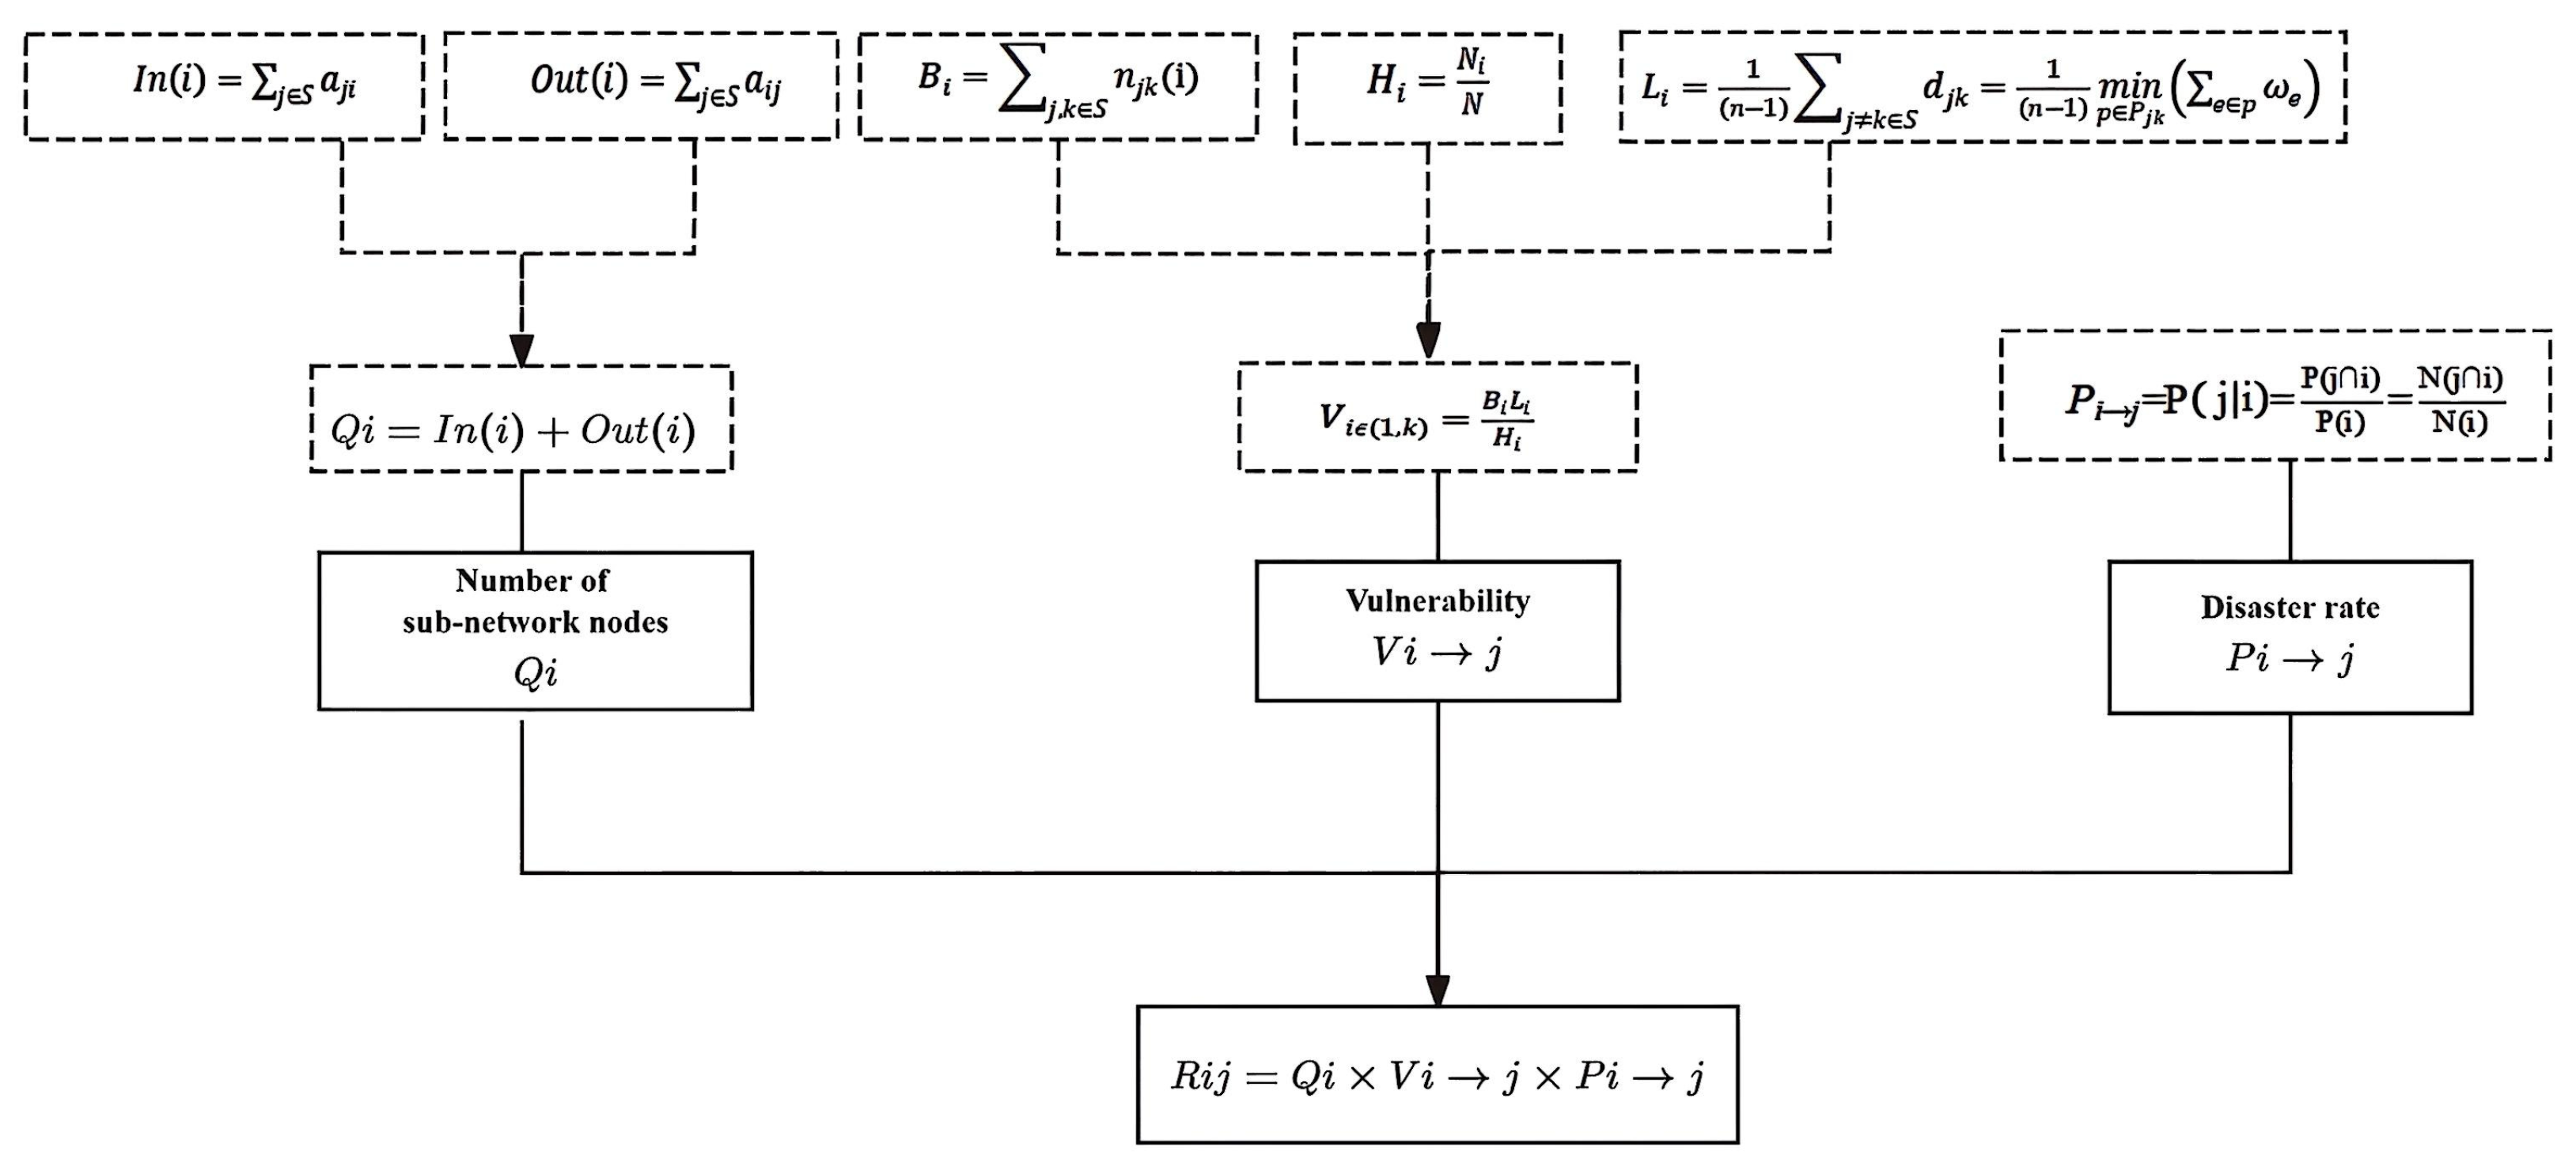
In risk assessment, risk degree is a relatively objective value that converts the complex and changeable risk environment into a manageable and operable priority sequence, guiding the investment of limited resources into risk response actions to avoid the maximum potential loss. The risk assessment model is shown in Figure 1.
Figure 1.
Network Node Risk Assessment Model.
The specific calculation steps of edge risk degree are as follows:
- (1)
- Number of Sub-network Nodes
The sum of the access and deviation degrees of nodes is the number of sub-network nodes, which represents the loss degree of the disaster event. Pajek (version 6.01) is a software tool for analyzing and visualizing large networks. In the study, Pajek is used to calculate the entry, exit and sub-node degrees of each node in the model, and the results are shown in Table 1.
Table 1.
Quantification indicators of nodes.
- (2)
- Vulnerability
Vulnerability refers to the degree of impact on the network topological structure after removing edge in the construction fire complex network [70].
refers to the i-th edge; k refers to the total number of edges; represents the hub strength of a specific risk transmission path in the entire disaster evolution system. Its value is obtained by normalizing the frequency of all potential disaster event pairs (including multi-hazard nodes such as initial fire, secondary structural damage, and derivative environmental pollution) passing through this path in their shortest causal transmission chains; Li represents the average shortest path length between nodes in the network, reflecting the connectivity and risk transmission efficiency of the network; represents the ratio of the number of nodes that can remain connected after edge is removed to the total number of nodes N in the original network. According to Equation (1), the vulnerability results of each edge are obtained. A higher value indicates a higher risk of the edge.
- (3)
- Disaster rate
The disaster rate of the connecting edge is essentially a description of the conditional probability of disaster propagation between nodes, and when a disaster occurs at node i, the possibility of disaster occurring at node j due to this connecting edge is the conditional probability of for any directional edge.
represents the independent occurrence frequency of the event, which is the co-occurrence frequency caused by the event. The calculation results of conditional probability are shown in Table 2.
Table 2.
Disaster rate of connecting edges (excerpt).
- (4)
- Risk Degree
When evaluating the risk degree of edges in the construction fire disaster chain, disaster-causing rate, node loss degree, and edge vulnerability are selected as the main indicators. The risk degree of each side is obtained according to the probability of disaster conditions, the number of subnet nodes, and the vulnerability, and the results are shown in Table 3.
Table 3.
Risk degree of edges in the disaster chain (top ten).
refers to the risk degree from node i to node j; refers to the disaster-causing rate from node i to node j; refers to the node loss degree, which can be obtained by adding the out-degree and in-degree of the node, meaning the number of sub-network nodes in this paper; is the vulnerability of the edge connecting nodes i and j.
The higher the risk, the greater the potential harm to the system under the combined effect of “probability” and “severity of consequences”. It can be either a single-dimensional extreme performance or a two-dimensional superposition, and its core meaning is to suggest that the risk needs to be focused on and prioritized to reduce the likelihood of actual losses.
The risk ranks in Table 3 reflect statistical patterns from 102 diverse historical construction fire cases [51], encompassing minor incidents to major disasters. Major fires (e.g., flashover) are less prevalent, leading to lower conditional probabilities and vulnerabilities for related edges compared to more frequent behavioral links (e.g., S8 Reduced visibility → S10 Crowd panic). This may result in seemingly counter-intuitive outcomes, but it underscores the importance of addressing common propagation paths to mitigate systemic risks. Particularly, vulnerability is based on edge connectivity, while disaster rates and node losses derive from event frequencies via conditional probabilities, ensuring empirical grounding.
The uneven gradient in the risk degree ranks arises from a combination of methodological and empirical factors. Firstly, the risk degree is intentionally designed as a multiplicative model. This approach amplifies the impact of high values in any of the three parameters (number of sub-network nodes, vulnerability and disaster rate) to highlight the most critical paths. While effective for identifying top risks, this multiplicative property can indeed lead to significant numerical gaps between the top-ranked edges, as their high scores compound, creating a “step-change” effect compared to lower-ranked edges. Secondly, the results are fundamentally a reflection of the real-world characteristics captured in our dataset of 102 construction fire cases. The edge rank 1 (S4 Release of thick smoke and toxic gas → S17 Casualties) connects to the node with the highest possible loss value (S17 Casualties, = 8). Historical data shows this path also has a very high conditional probability and our network analysis confirms its high structural vulnerability. The confluence of these three high values naturally results in a risk score that is substantially larger than others. This discontinuity, therefore, may not be a flaw but an accurate quantification of the dominant role certain “key risk paths” play in the disaster chain. Finally, other factors could influence this distribution. These include the potential for sampling bias in the historical cases and so on.
In the specific case study, the clear demarcation among the rank1, rank2 and the others enabled the precise identification of high-priority intervention targets, which significantly benefited the optimization of emergency processes. However, this characteristic may not be universally applicable across all decision-making contexts. To improve the model’s generalizability and robustness, future research should focus on following.
- (1)
- Investigate alternative formulations or normalization techniques for the risk degree calculation to smooth the distribution while preserving its ability to identify critical paths.
- (2)
- Conduct comprehensive sensitivity analyses to understand how each parameter affects the final rank stability.
- (3)
- Validate the model on a larger and more diverse set of case studies to further assess the robustness of the prioritization.
3.2. Optimization of Emergency Response Process
Based on the analysis of the complex network of the construction fire disaster chain, through the calculation of complex network nodes and edges, the key nodes and key risk transmission edges are identified. Taking chain-breaking measures for edges with high-risk degrees can effectively block potential construction fire risk transmission paths. In the following, aiming at the top 10 edges with the highest risk degrees, combined with the characteristics of complex construction site environments, a multi-department collaborative emergency response framework is proposed, as shown in Table 4. By clarifying the responsibilities of each emergency team, priority is given to handling edges with high-risk degrees, so as to effectively improve the speed and quality of emergency response.
Table 4.
Multi-department rescue measures.
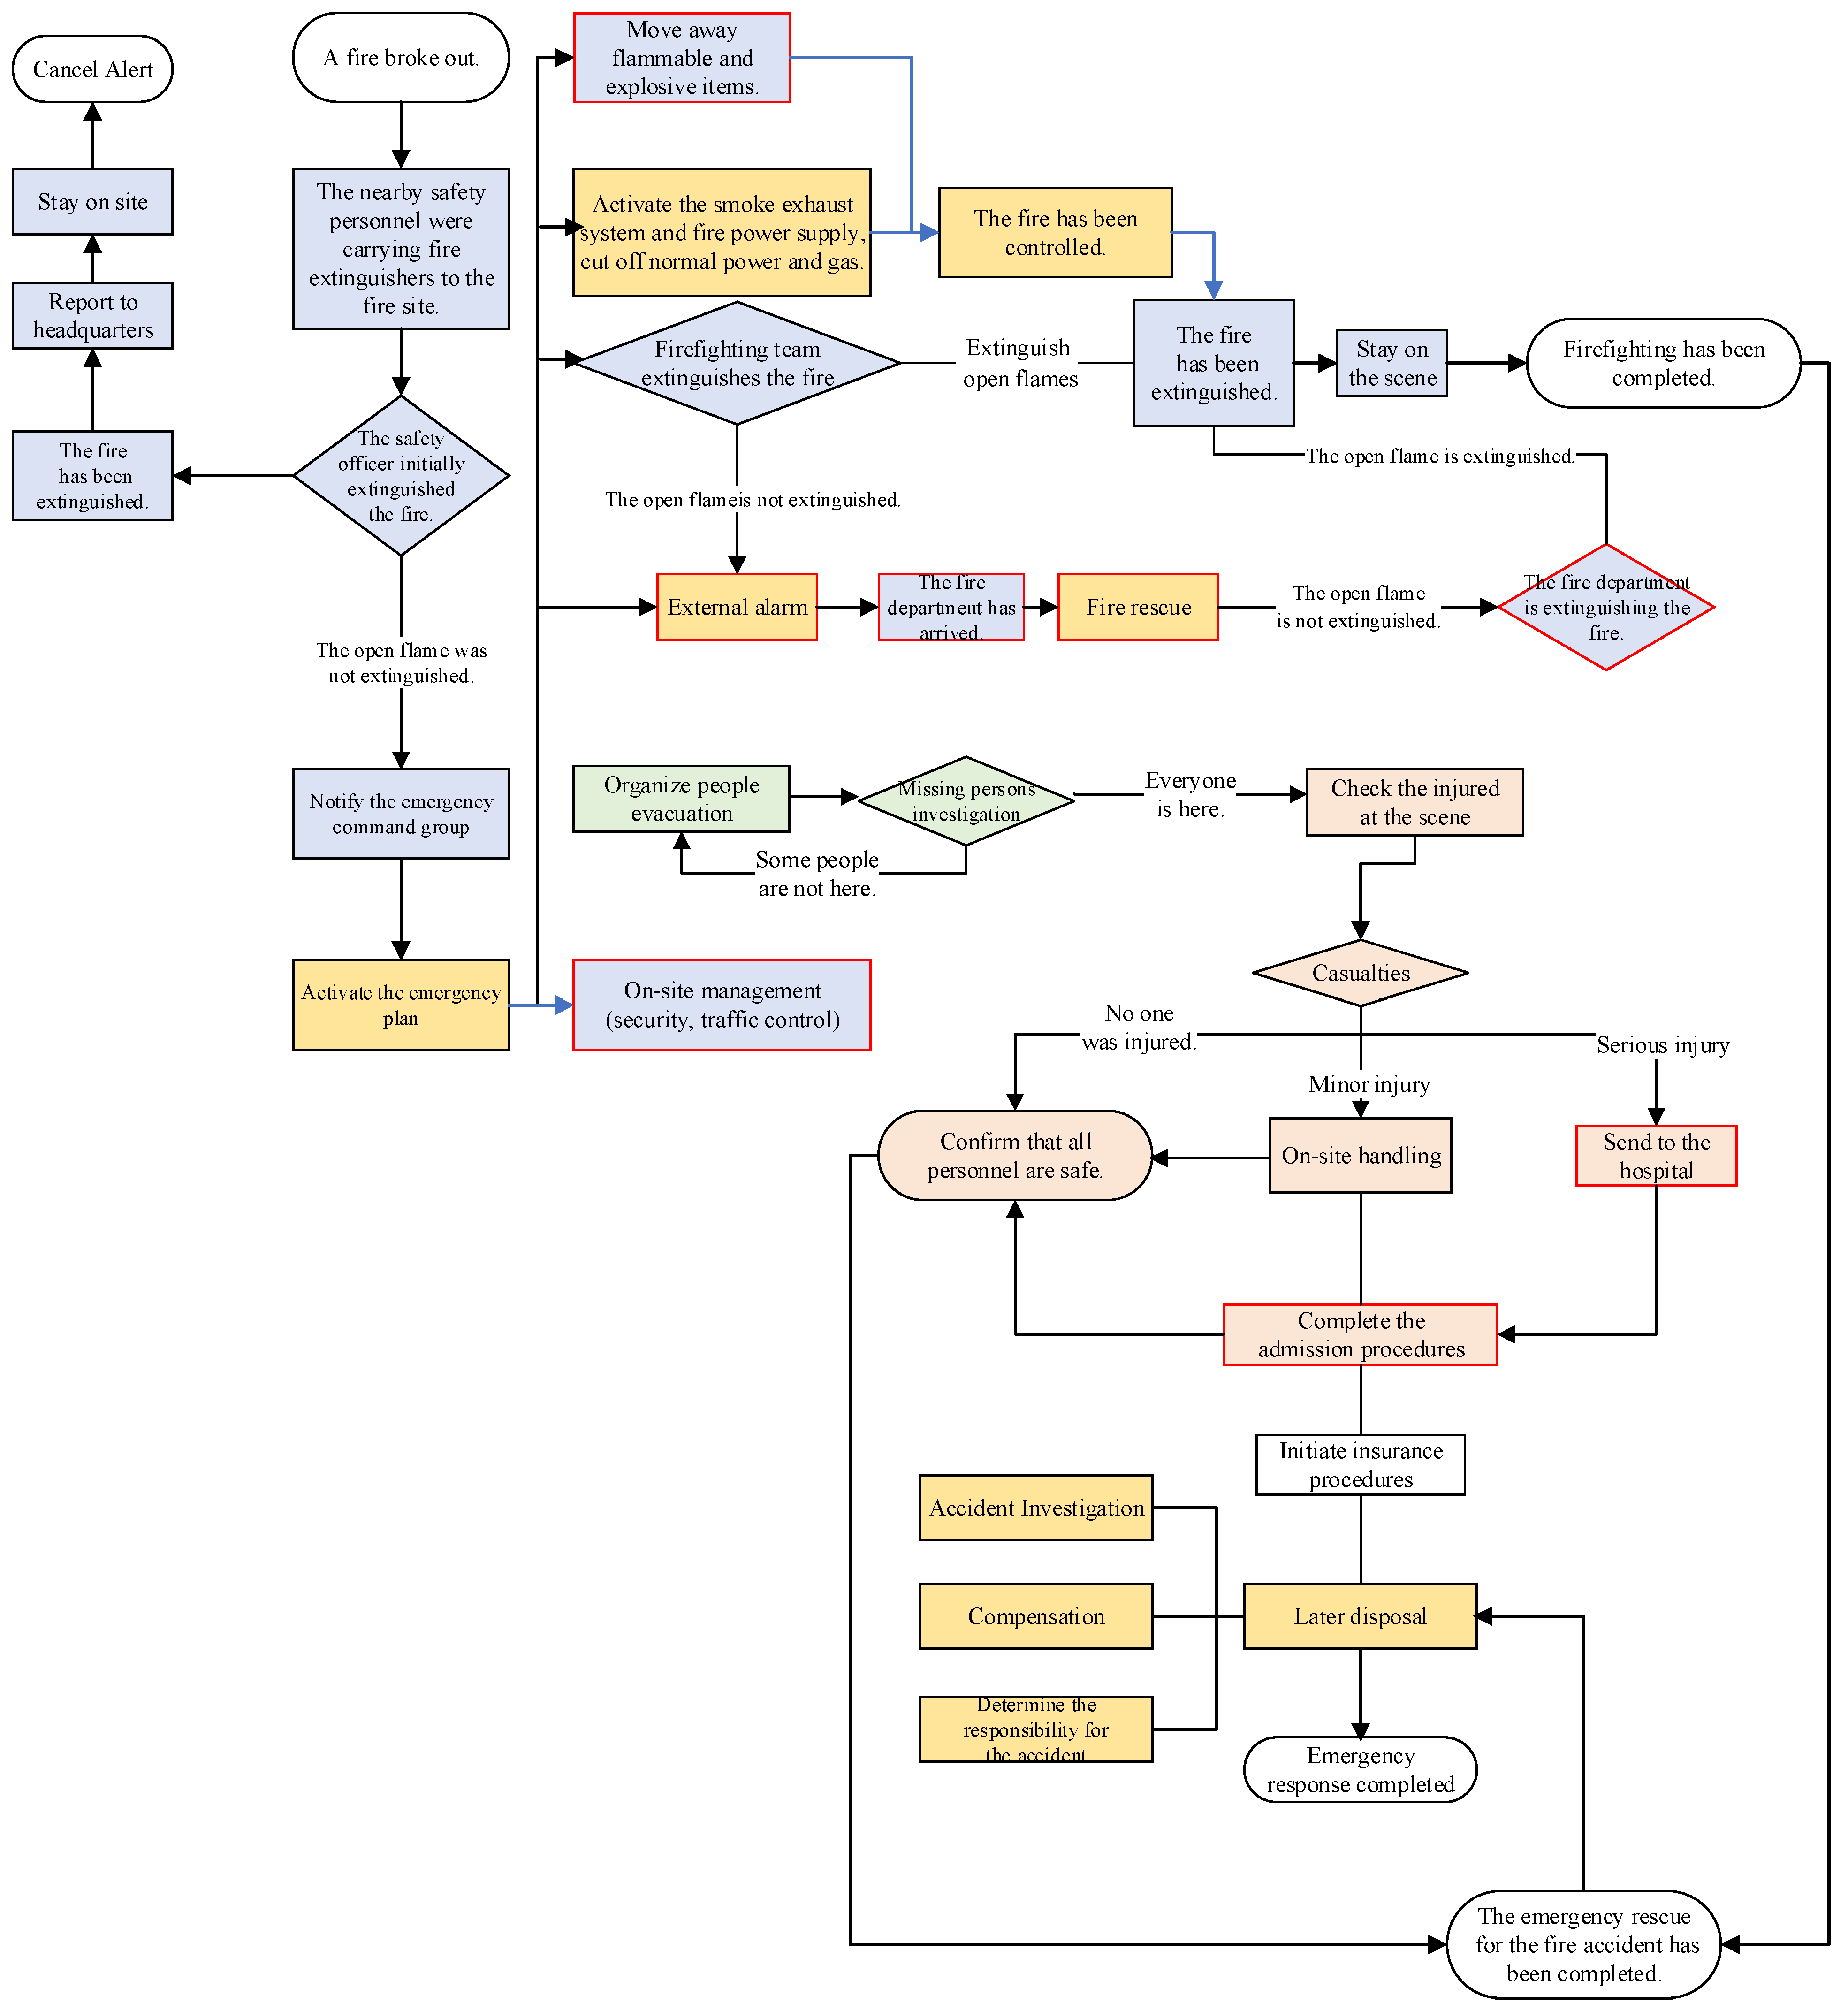
To ensure the efficient implementation of the emergency process, based on the above functional department settings, the specific action steps of each department in the emergency response are further clarified, the whole process of construction fire emergency response is intuitively displayed, and the emergency response process is drawn as shown in Figure 2.
Figure 2.
Emergency response and rescue process.
4. Experiment
In order to verify the multi-department collaborative emergency process optimization plan proposed in the previous article, the CPN tool is used to simulate and verify a fire accident.
4.1. Fire Accident Situation and Analysis
4.1.1. Background of the Accident
The accident occurred at 14:01 on 17 April 2023, and it was classified as a major fire incident. Investigation revealed multiple layers of responsibility among the involved parties. Company A, the lessor of the factory where the fire occurred, had illegally constructed and altered the building’s use, leading to fire protection facilities that failed to meet regulatory standards. Company B, the tenant where the fire originated, was found to have conducted welding operations in violation of safety regulations, which ignited wire-drawing paint stored improperly on-site. Tragically, the blaze resulted in the deaths of 11 employees from Company C, who were working in the facility at the time, underscoring the devastating consequences of compounded regulatory violations and safety negligence.
4.1.2. Process of the Accident
On the day of the accident, Company B hired unlicensed welders to perform welding operations on the second floor. At 14:01, welding slag fell to the first floor, igniting the wire drawing paint stored in the paint mixing room and causing a fire (A1). As the factory evacuation stairs were not closed and the freight elevator had no floor doors, the “chimney effect” caused the fire (S2) and toxic smoke (S4) to spread rapidly to the second and third floors. The employees of Yeli Company were unable to evacuate in time (S11, S10), ultimately resulting in the tragic death of 11 people (S17). The detailed process and rescue log are shown in Table 5. Consequently, the accident caused 11 people died, the fire area was about 9000 m2, and the direct economic loss exceeded 20 million yuan.
Table 5.
Emergency rescue log.
4.1.3. Topological Graph Modeling
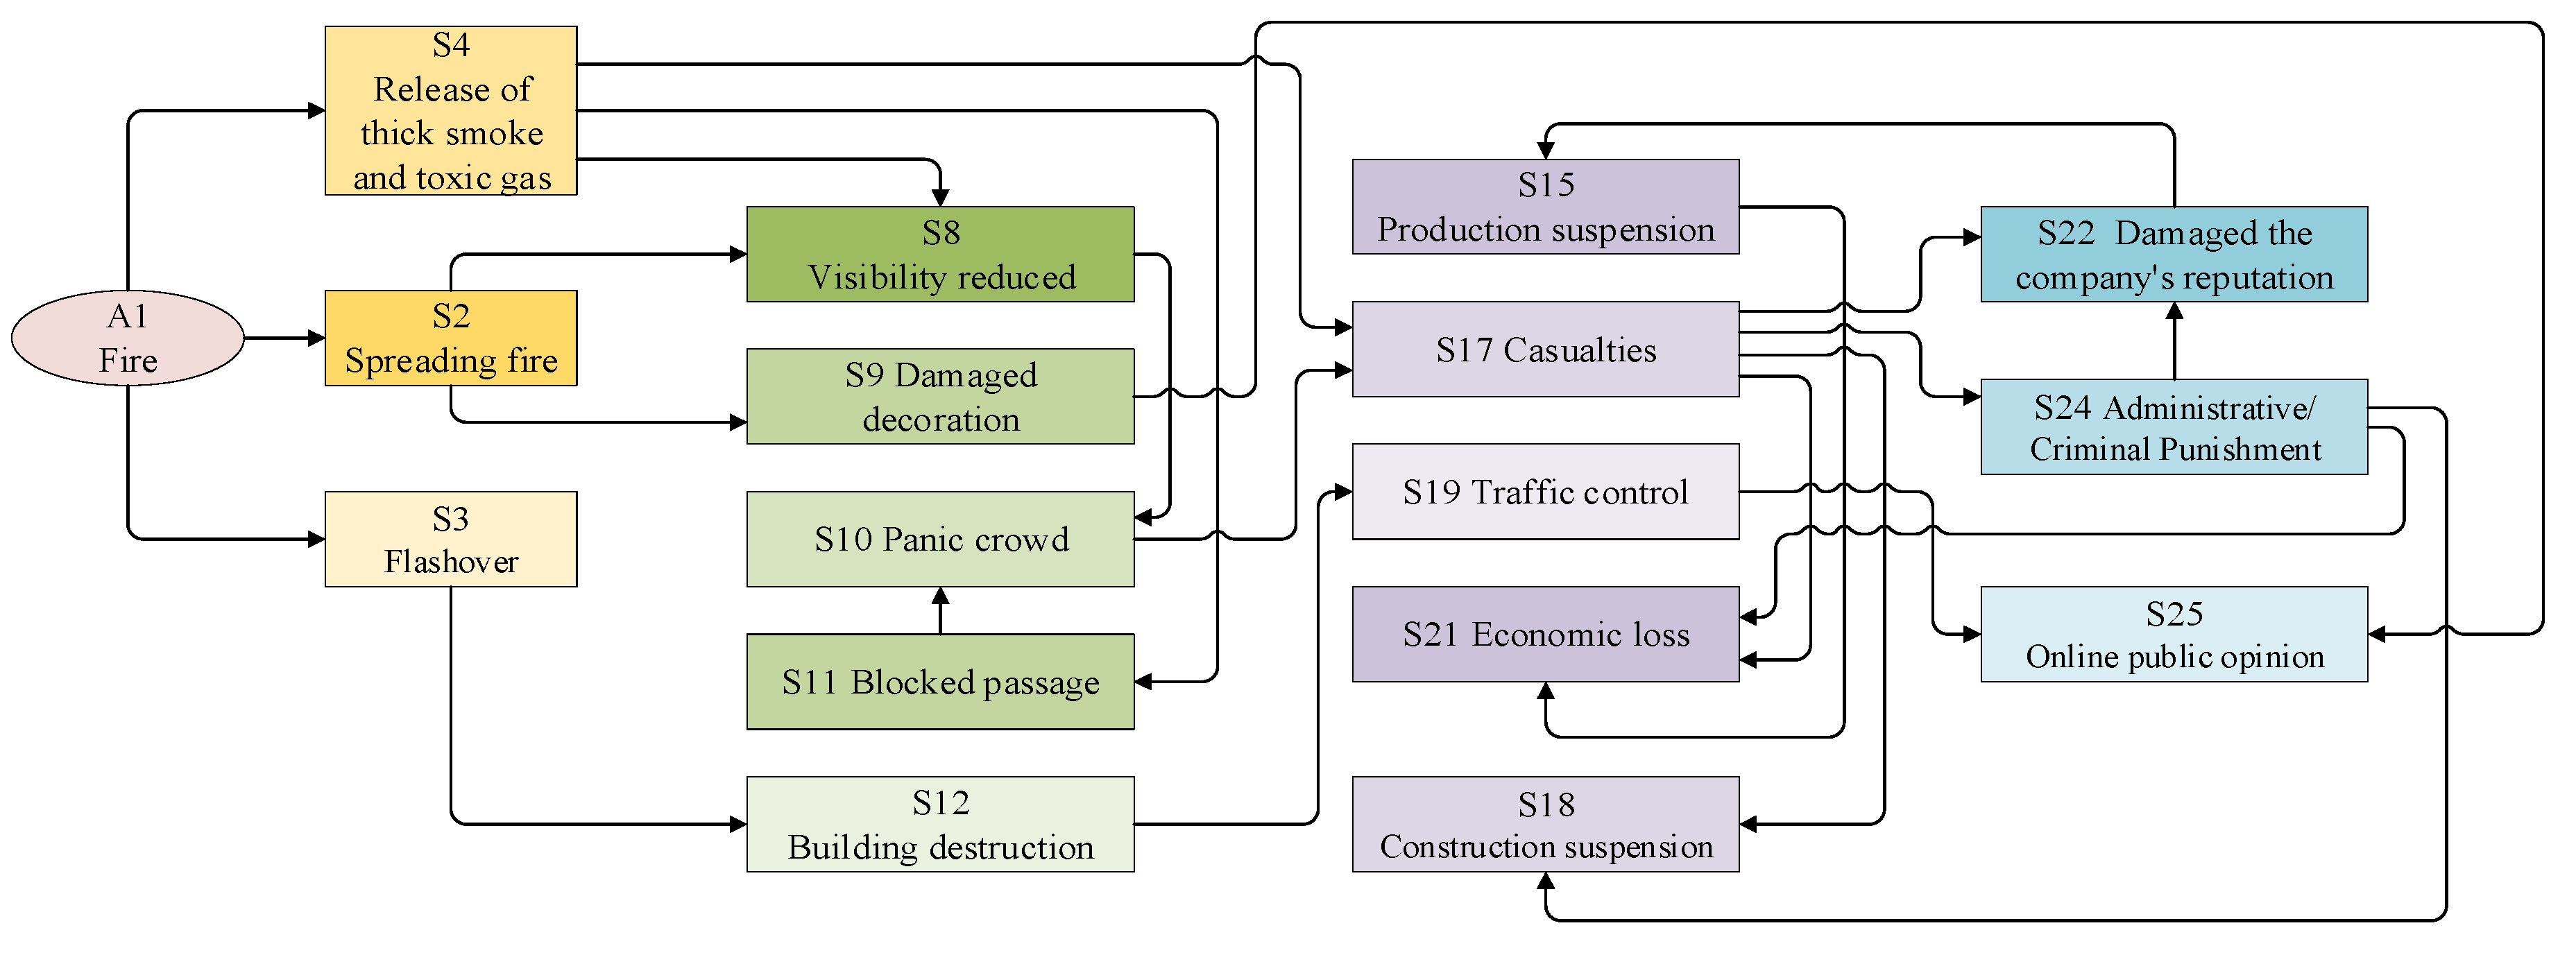
As evidenced by the case background, emergency response logs (Table 5), and the accident investigation report—which identified that “the mixing room was non-compliant with regulations, lacking explosion-proof and fire prevention measures”—the resultant flashover (S3) caused damage to the decorations (S9) and structural components (S12). This sequence ultimately led to the criminal detention of eight relevant personnel from Company B (S24). Based on the previously mentioned information, the evolution topology of the fire disaster chain was illustrated in Figure 3.
Figure 3.
Topology of the disaster chain of the fire case.
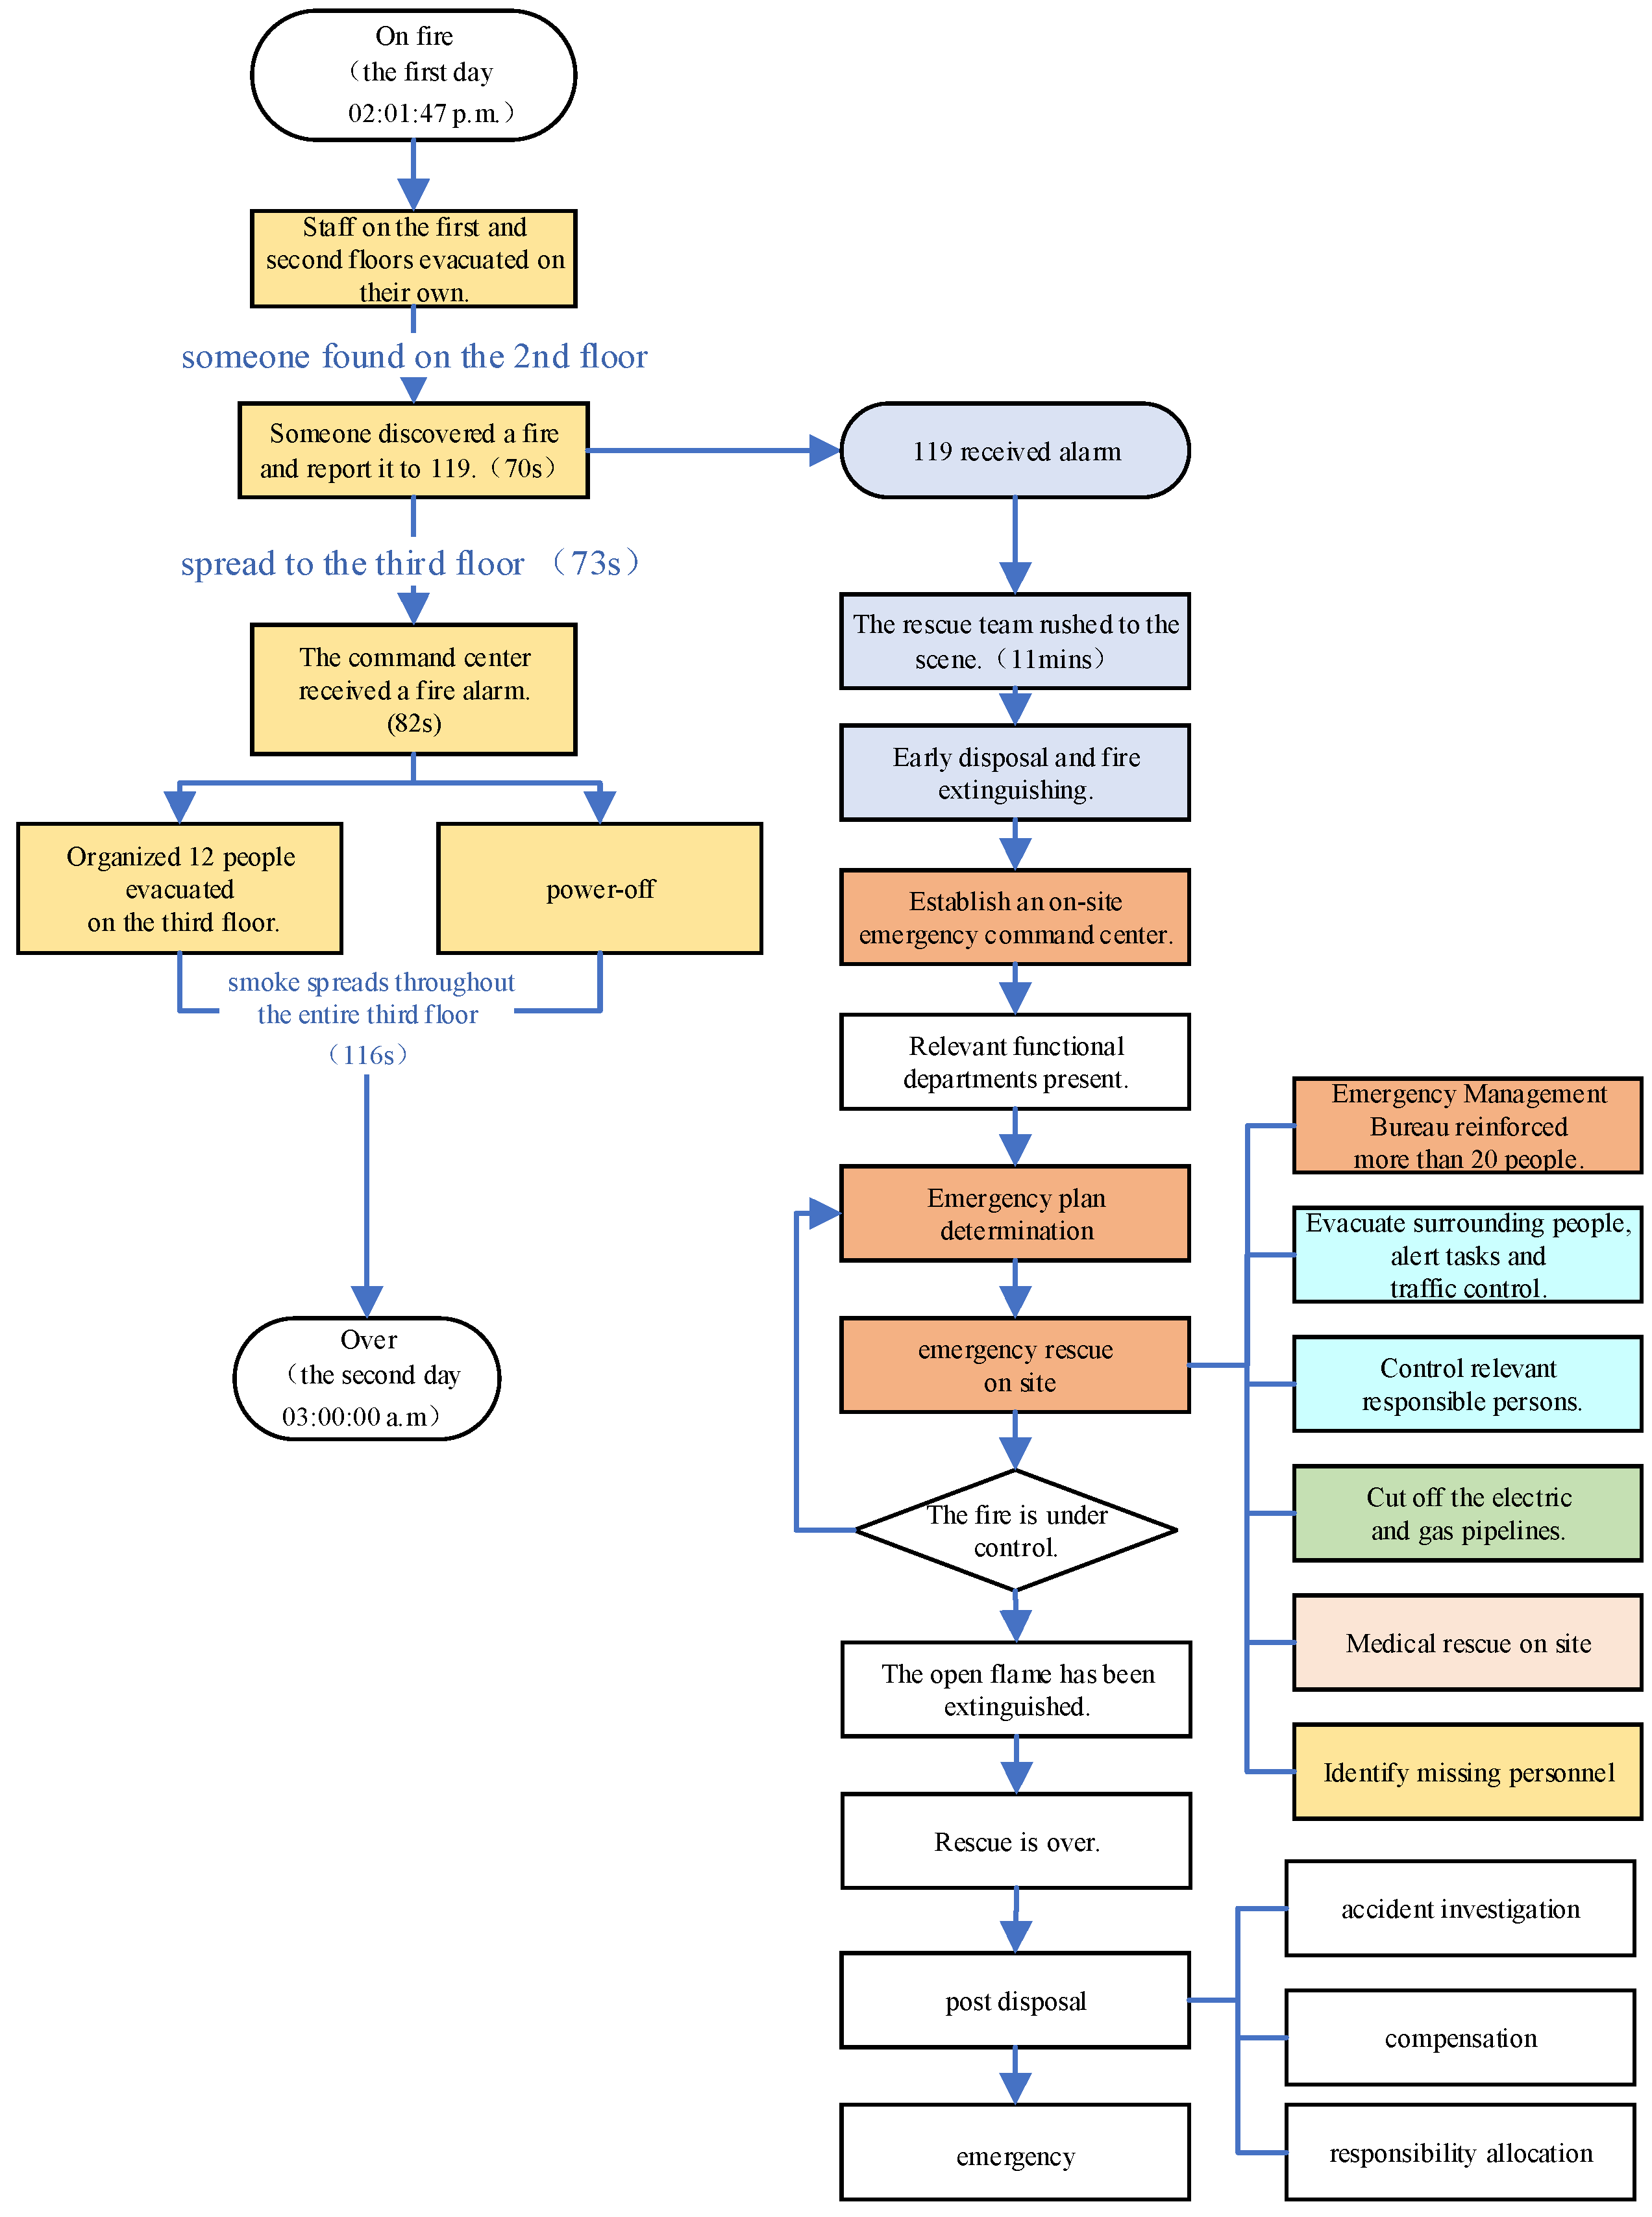
Based on the emergency response logs (Table 5), the corresponding case emergency rescue process flowchart (Figure 4) was developed. This flowchart details the response procedures across each emergency rescue phase, commencing from the initial pre-alarm stage.
Figure 4.
Case emergency rescue flowchart.
4.2. CPN Simulation Verification
4.2.1. Assumptions
To overcome the limitation that case investigation reports cannot comprehensively record all relevant variables, this paper introduces a series of idealized assumptions when conducting CPN simulations to create a controllable analysis environment. Firstly, it is assumed that the emergency rescue force structure is complete. Based on the official data (total personnel exceeding 600), rescue forces are divided by function: Firefighting (250 people), Emergency Core (20 people), Public Security (200 people), Medical Team (80 people), Hazardous Materials Response Team (30 people), Social Rescue (20 people), and it is assumed resource allocation meets the minimum requirements [71]. Secondly, it is assumed that the entire communication link system is highly reliable, with information transmission delay determined solely by physical layer latency, ignoring potential compatibility issues of communication equipment or human operational delays in reality. Finally, unfavorable variables not explicitly mentioned (e.g., personnel quality differences or equipment failure rates) are selectively ignored to reduce model complexity.
When constructing the CPN model, node triggering delay intervals serve as key parameters directly affecting the accuracy of simulation results. Based on the above idealized assumptions, this study integrates multiple data sources to ensure the scientificity and rationality of parameter settings. Firstly, the case investigation report provides actual fire emergency response time data (e.g., fire brigade arrival time), forming the basis for setting initial values of node triggering delays. Secondly, referencing scholarly research results [72], combined with path length calculations from case floor plans, the total evacuation time is derived; combined with the assumed firefighter count (250 people) and building terrain information from the investigation report, the theoretical firefighting time range is deduced. Furthermore, based on response time requirements stipulated in relevant regulations [73,74], the upper and lower bounds of the triggering delay intervals are further constrained, ensuring parameters comply with standardization requirements. These data collectively provide scientific support for model parameters, making the simulation results reliable under idealized assumptions.
4.2.2. Model Construction
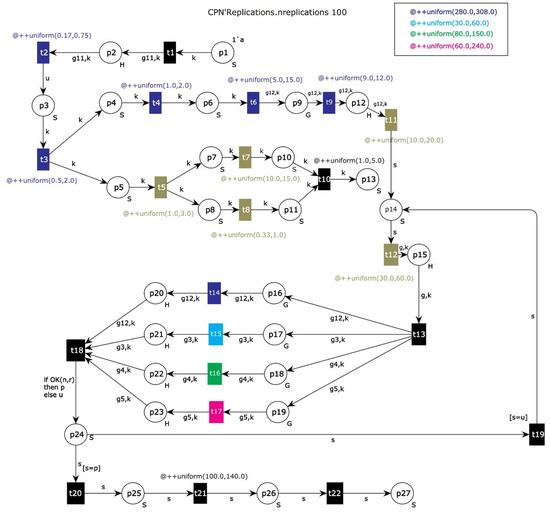
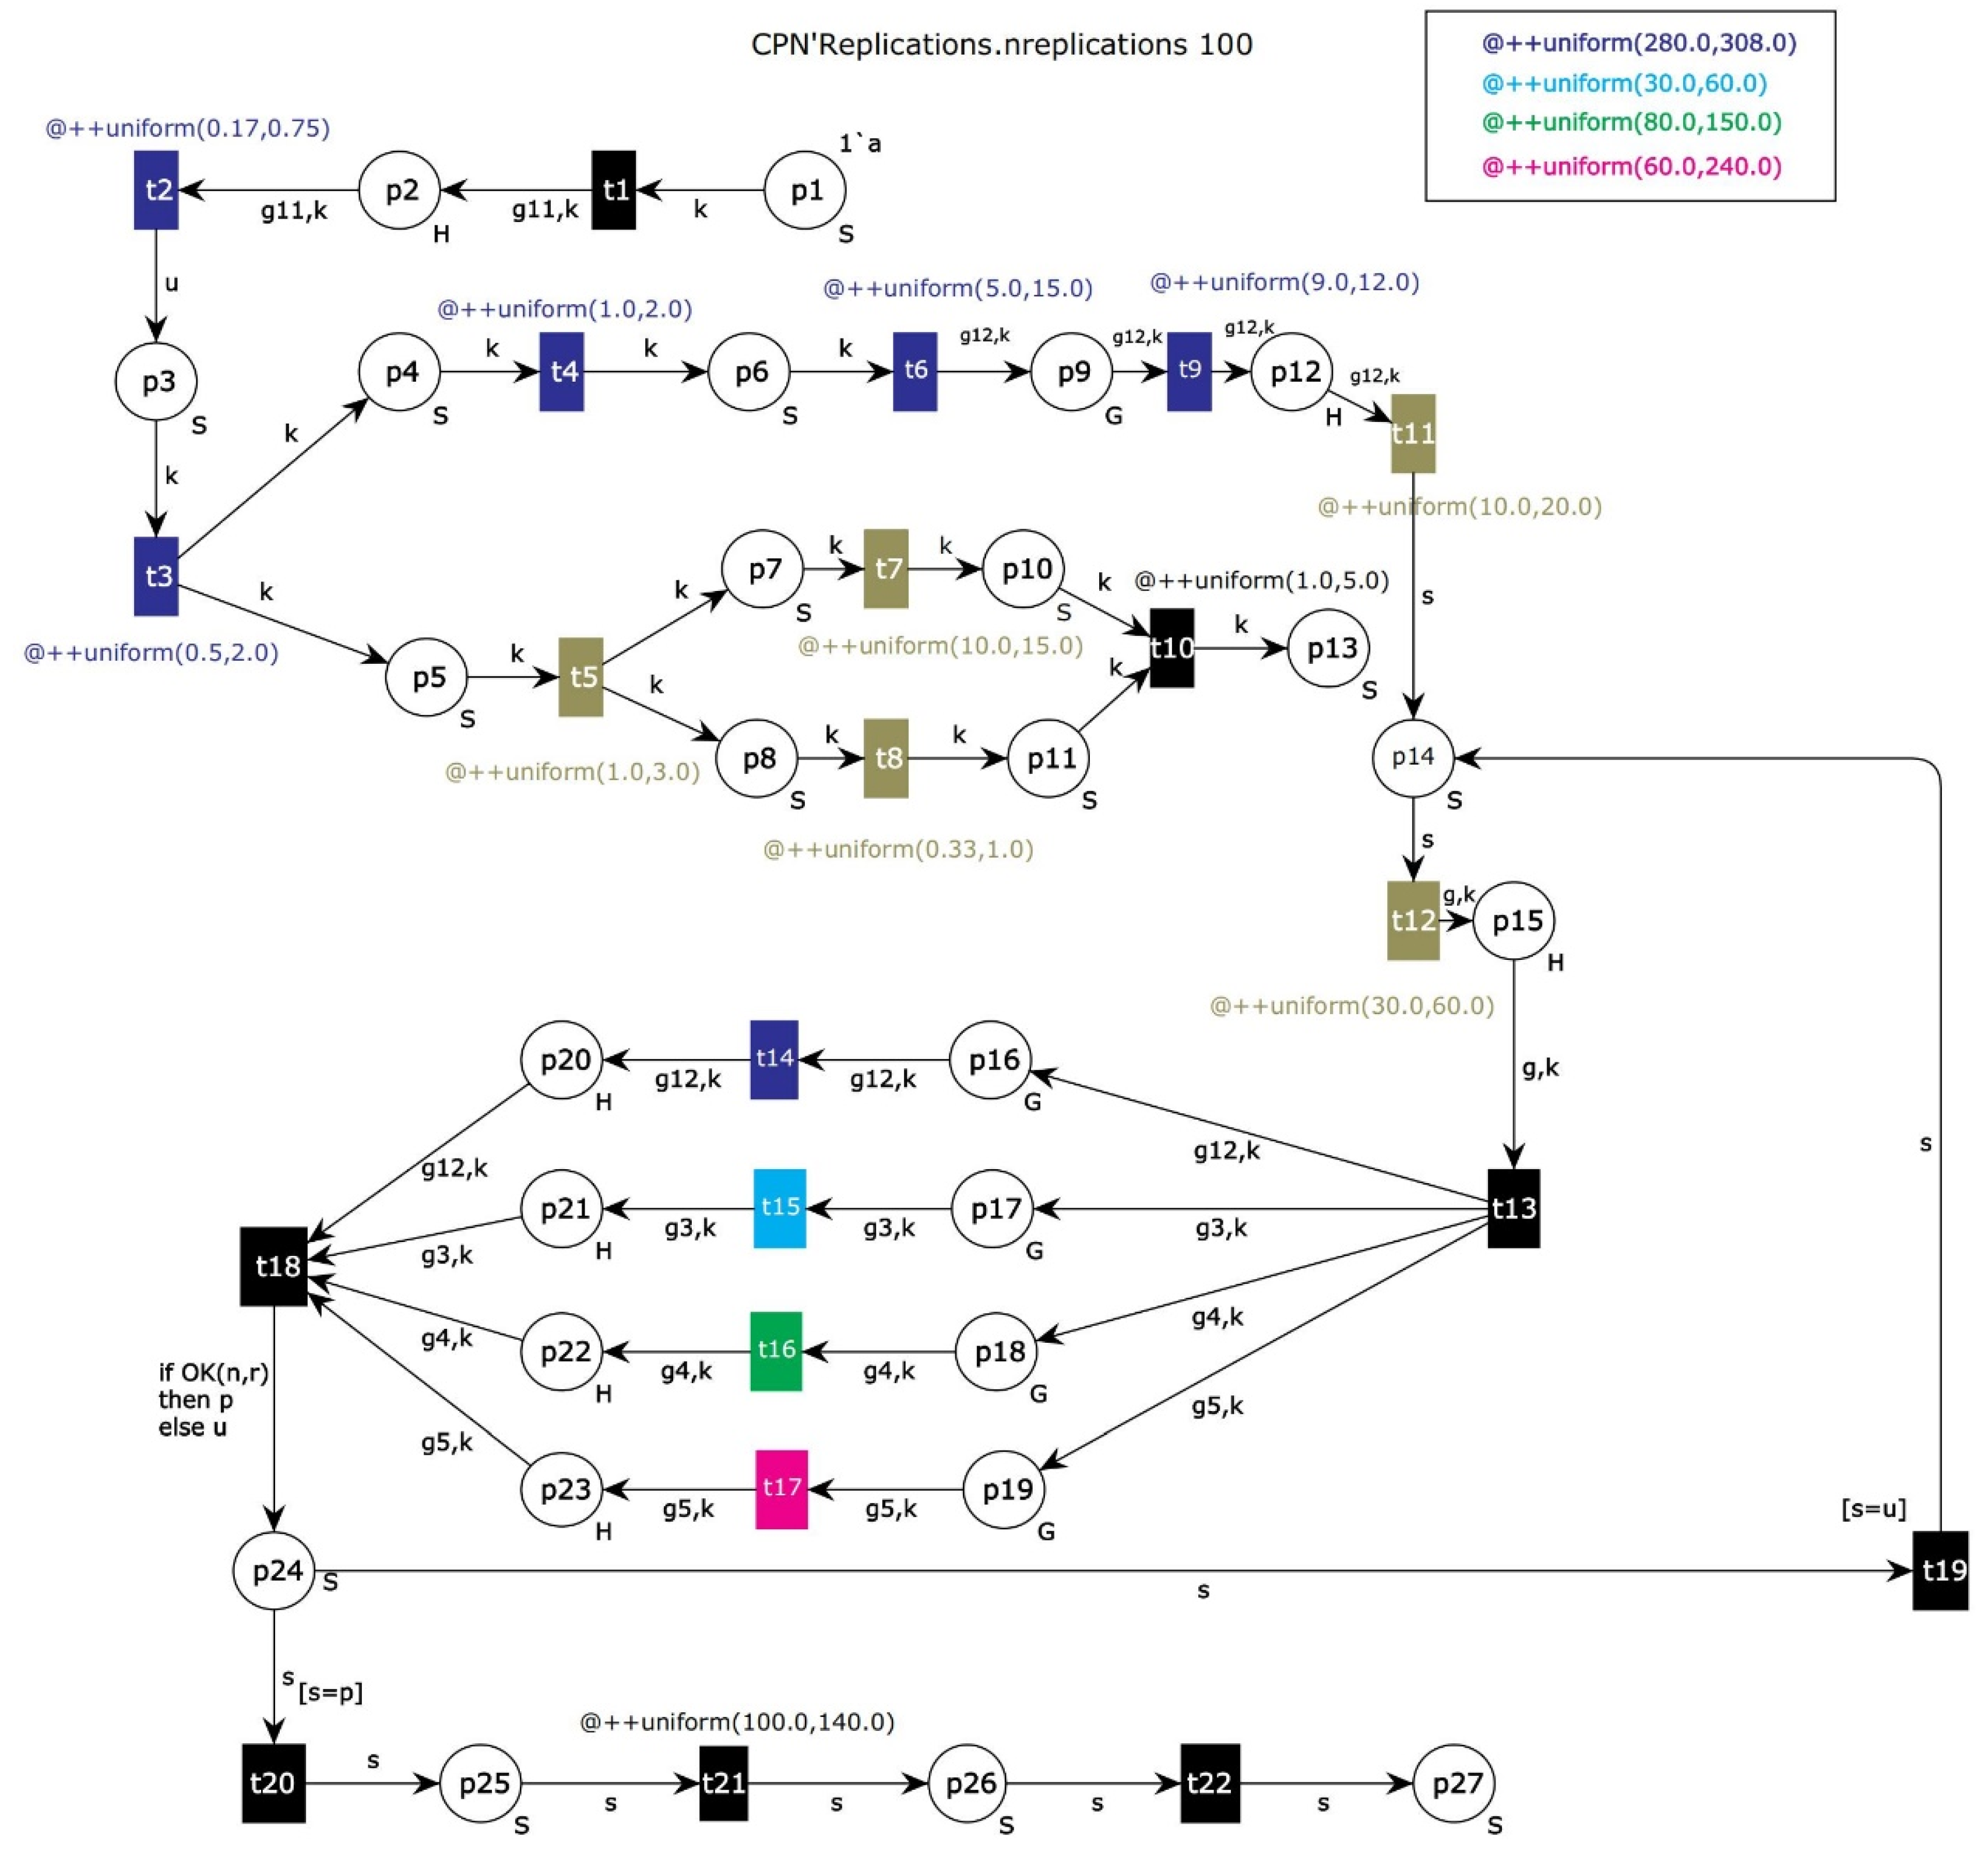
Based on the optimized flowchart (Figure 2) and on the foundation of Figure 4, the responsibilities of each link have been further clarified, the information transmission paths have been optimized, redundant links have been reduced, and risk prevention measures at key nodes have been added in response to the characteristics of secondary disasters from construction fires. Using the optimized rescue process, a colored Petri net model for the emergency rescue process of a construction fire event has been constructed, as shown in Figure 5. The parameter system of the CPN model in this study is constructed using a multi-source heterogeneous data fusion method, specifically achieved through the calibration of empirical case data, the deduction results of fire dynamics models, and a three-dimensional collaborative mechanism constrained by normative documents, allowing for the quantitative analysis of the temporal logic at key nodes in the emergency process.
Figure 5.
Fire emergency response CPN model.
The semantic definitions of Places and Transitions in the model and their triggering delay intervals are shown in Table 6.
Table 6.
Meaning of Places and Transitions.
The CPN model, incorporates post-fire phases such as smoldering suppression, scene investigation, and environmental monitoring within the transition t21 (“End of rescue”), as detailed in Figure 5 and Table 6. Based on the government investigation report of the 17 April 2023, this transition assigned a trigger delay interval of 100–140 min, accounts for activities like site cleanup and accident investigation, shown as the case study log (Table 5, “on-site rescue completed, accident investigation launched”).
However, real-world post-fire phases may extend to 2–4 h, suggesting that the current t21 interval may underestimate the total emergency response duration. This potential underestimation arises from reliance on a single case’s data, which may not fully capture the variability in post-fire phase durations across different fire scenarios.
To enhance the temporal accuracy and practical applicability of the CPN model, future research can analyze a broader set of construction fire cases, encompassing diverse project types, to compute average durations for post-fire activities. By aggregating data from multiple incidents, the t21 trigger delay interval can be refined to better reflect realistic time requirements, enhancing the accuracy of the CPN model time estimates and strengthening its applicability to real-world emergency management.
As shown in Table 7, the model generates 153 state nodes and 406 transition arcs, originating from the decision loops and concurrent path branching embedded in the emergency process. For instance, the logical branches (controlled/uncontrolled) triggered by dynamic fire assessment (t18) cause state divergence, with each judgment round generating independent nodes. Concurrent multi-department tasks (e.g., parallel firefighting and medical rescue) employ color marking to isolate resource contention, thereby avoiding state redundancy. Although the node count is relatively high, it reflects the model’s capacity to depict complex interaction scenarios rather than state explosion caused by redundant logic. The strong connectivity (SCC node count of 1) further corroborates the closed-loop design of the process, indicating that all operations can ultimately lead to system reset. The state space comprises 153 nodes, a figure that represents all possible state combinations within the model. The contents for verifying the model are as follows:
Table 7.
State Space Report.
- (1)
- Boundedness Analysis
Boundedness means that the number of tokens in each Place in the model does not exceed a preset capacity limit in any reachable state, reflecting the finiteness and controllability of resource allocation. According to the report (Table 8), the integer bounds for all Places are [Upper = 1, Lower = 0], indicating that the maximum number of tokens in any Place is 1, and the minimum is 0. This boundedness aligns with the actual characteristic of limited resources in fire emergency response. For example, Place p1 (Fire Occurrence) only holds a token in the initial state and transfers it to p2 immediately after triggering t1 (Fire Alarm Info. Transmission), avoiding accumulation of repeated alarm signals; Place p24 (Fire Control Status Judged) only stores instantaneous logical results (e.g., u or p), with no risk of token stagnation. This boundedness ensures resources in the model do not accumulate limitlessly, avoiding state explosion risks, and reflects the controllability and stability of the model in simulating fire emergency response.
Table 8.
Boundedness Analysis Report.
- (2)
- Liveness Verification
Used to assess whether the model contains deadlocks and whether transitions have the ability to be executed. No deadlock means that from any state, at least one transition can be enabled, and the model will not get stuck in an inexecutable stagnant state; live transitions mean that each transition can be executed under certain conditions, reflecting the liveness of the model. Table 9 shows that there are no dead markings (Dead Markings: None), meaning the emergency response process can always proceed from any stage without being blocked by certain states. Also, there are no dead transition instances (Dead Transition Instances: None), indicating all transitions (e.g., t1 Fire Alarm Info. Transmission, t14 Firefighting & Rescue) have the opportunity to be enabled. More importantly, all transitions are live (Live Transition Instances: All), meaning that from any reachable state, there exists a path enabling every transition to be executed. This liveness ensures that every emergency action (e.g., alarm, rescue, fire control) can be realized under appropriate conditions, and the emergency process is continuous and unobstructed.
Table 9.
Liveness Analysis Report.
- (3)
- Home Marking Property Verification
In Petri nets, a Home Marking is a special set of marking states with the core property that from any reachable state, it is possible to return to these home markings by firing a sequence of transitions. This property reflects the recoverability or cyclicity of the model, meaning the system can be reset to a key state under specific conditions. The existence of home markings typically indicates that the model has good behavioral properties, theoretically supporting repeated analysis and verification of the system. In this model, the initial marking is designed as a home marking (Table 10). This means that no matter which reachable state the model runs to, there exists a transition sequence that can bring the system back to the initial state. To achieve this, a key mechanism was introduced: enabling the termination state (e.g., the state at the end of the process) to return directly or indirectly to the initial state. This design ensures the home status of the initial marking.
Table 10.
Home Properties Report.
- (4)
- Verification Conclusion
Through the structural inspection of CPN Tools, the constructed construction fire emergency response model satisfies the formal verification requirements in terms of boundedness, liveness, and home properties. The model exhibits no token overflow, deadlocks, or unreachable states, proving its logical validity and behavioral soundness. This provides a reliable formal foundation for subsequent timeliness simulation and performance optimization.
4.3. Optimization Effect Evaluation
According to the rescue log in Table 5, it can be seen that before optimization, the time taken for this fire incident from ignition to rescue completion was 12 h, 58 min, and 41 s, of which the firefighting phase took 7 h. The main bottleneck appeared in the firefighting phase: due to delayed and ineffective initial response (construction workers fled directly upon discovering the fire without taking any firefighting measures), the fire spread rapidly, prolonging the firefighting time and consequently extending the overall processing duration.
During the optimization process, a series of measures were taken. For example, early training for nearby workers enabled them to quickly take initial firefighting actions during the fire’s early stages, effectively controlling fire spread. Simultaneously, the optimized process introduced multi-department coordination and rational resource allocation, achieving parallel processing. According to Table 6, after 100 iterations of CPN simulation, the average total process time was reduced to 8 h, 17 min, and 21 s, representing an efficiency improvement of approximately 36.3%. Among this, the firefighting phase time decreased from 7 h to 5 h, 38 min, and 6 s. The critical process also shifted from singular firefighting to multi-department collaborative emergency rescue, significantly enhancing response efficiency and effectiveness.
To estimate a more realistic improvement effect of emergency response and rescue process, the study considers a sensitivity analysis that incorporates some of the real-world constraints into the CPN model.
- (1)
- Communication Delays
Introduce a delay factor based on historical data or case-specific logs (e.g., the 82 s delay in the command headquarters response noted in Table 6). If it assumes an additional 1–2 min of communication delays across key transitions (e.g., t1, t3, t5), the total optimized time could increase by 3–6 min.
- (2)
- Resource Constraints
Reduce the assumed rescue force by 20–30% to reflect potential shortages. This could extend firefighting and rescue phases (t14, t17) by 10–20%, adding approximately 30–60 min to the firefighting phase.
- (3)
- Human Errors
Account for human-related delays by increasing trigger delay intervals for transitions involving worker actions (e.g., t2 for initial firefighting by nearby personnel) by 20–50%, adding another 1–3 min per transition.
Considering the collective impact of these factors, the optimized process duration could increase by approximately one hour, reaching an estimated total of 9 h and 17 min. This adjusted result corresponds to a more realistic improvement rate of around 28.5%, which remains substantial though lower than the originally reported 36.3%.
The model is tailor-made against a single fire case study to enhance the framework’s generalizability, and the model can be adjusted through these actions:
The current complex network model relies on historical fire case data, but future work can incorporate real-time fire data using artificial intelligence algorithms (e.g., machine learning or deep neural networks) to dynamically update node and edge weights in the disaster chain network. This would enable rapid identification and prediction of high-risk paths during fire incidents, improving real-time emergency response efficiency.
IoT technologies can monitor on-site conditions (e.g., temperature, humidity, smoke concentration), providing precise inputs for CPN trigger delay intervals (e.g., adjusting t6 for firefighter arrival based on rural access constraints).
The framework supports reconfiguration for diverse scenarios by redefining nodes (e.g., “elevator failure” for high-rises, “limited water supply” for rural sites) and adjusting parameters (e.g., scaling firefighter numbers or TDIs for low-rise projects).
This study’s data-rich argumentation and validation provide a scalable foundation for comprehensive fire risk management, with future multi-case studies poised to further strengthen its generalizability.
5. Conclusions
Fire risks remain a critical challenge in the construction industry, particularly during the building phase, where fires can cause severe property loss, casualties, project delays, operational disruptions, and long-term reputational damage. This study addressed these challenges by analyzing the construction fire disaster chain, quantifying the risk degrees of network edges, and identifying critical links such as S4 Dense smoke and toxic gas release → S17 Casualties and S10 Crowd panic → S17 Casualties. These edges, determined by the interplay of disaster-inducing probability, node loss severity, and edge vulnerability, were shown to pose the greatest hazard to system stability and thus demand targeted management.
Building on this analysis, an optimized rescue process was designed, focusing on high-risk pathways and enhancing multi-agency collaboration. Using a major fire incident as a case study, the proposed framework was validated through CPN simulation, which revealed significant improvements in emergency response efficiency. The total process duration decreased from 12 h, 58 min, and 41 s to an average of 8 h, 17 min, and 21 s—a 36.3% efficiency gain. Firefighting time was also reduced by 19.5%, from 7 h to 5 h, 38 min, and 6 s, reflecting better coordination, clearer departmental responsibilities, and more effective intervention at critical points in the disaster chain.
Overall, this study presents a risk-informed, simulation-validated framework to improve construction fire emergency management. By combining disaster chain theory, risk-weighted analysis, and CPN-based process optimization, it provides practical tools to enhance response speed and effectiveness. The results offer valuable guidance for managers, contractors, and policymakers—especially in emerging economies—to build sustainable, full-chain fire risk strategies.
Author Contributions
Conceptualization, H.Z. and Y.T.; Investigation, J.T. and Q.L.; Methodology, H.Z. and Y.T.; Writing—original draft, J.T. and H.Z.; Writing—review and editing, Y.T. and Q.L. All authors have read and agreed to the published version of the manuscript.
Funding
This research was funded by Key Project of Basic and Applied Basic Research of Jiangmen City in 2022 (Project No.: 2220002000176).
Data Availability Statement
All data generated or analyzed during this study were included in this published article.
Conflicts of Interest
The authors declare no conflicts of interest.
References
- Yang, L.; Zhou, X.; Deng, Z.; Fan, W.; Wang, Q. Fire Situation and Fire Characteristic Analysis Based on Fire Statistics of China. Fire Saf. J. 2002, 37, 785–802. [Google Scholar] [CrossRef] [Scilit]
- Barua, U.; Han, H.; Mojtahedi, M.; Ansary, M.A. Integration of Proactive Building Fire Risk Management in the Building Construction Sector: A Conceptual Framework to Understand the Existing Condition. Buildings 2024, 14, 3372. [Google Scholar] [CrossRef] [Scilit]
- Yao, Y.; Li, Y.Z.; Lönnermark, A.; Ingason, H.; Cheng, X. Study of Tunnel Fires during Construction Using a Model Scale Tunnel. Tunn. Undergr. Space Technol. 2019, 89, 50–67. [Google Scholar] [CrossRef] [Scilit]
- Zhang, Y.; Wang, G.; Wang, X.; Kong, X.; Jia, H.; Zhao, J. Regional High-Rise Building Fire Risk Assessment Based on the Spatial Markov Chain Model and an Indicator System. Fire 2024, 7, 16. [Google Scholar] [CrossRef] [Scilit]
- Zakaria, Z.; Ismail, S.; Rani, W.N.M.W.M.; Che Amat, R.; Hussaini Wahab, M. Fire Hazard Assessment During Construction of a Mixed-Use Development Project in Kuala Lumpur. Int. J. Eng. Technol. 2018, 7, 5–10. [Google Scholar] [CrossRef] [Scilit]
- Liu, H.; Wang, Y.; Sun, S.; Sun, B. Study on Safety Assessment of Fire Hazard for the Construction Site. Procedia Eng. 2012, 43, 369–373. [Google Scholar] [CrossRef] [Scilit]
- Wu, A.; Shi, S.; Li, R.; Tang, D.; Tang, X. City Fire Risk Analysis Based on Coupling Fault Tree Method and Triangle Fuzzy Theory. Procedia Eng. 2014, 84, 204–212. [Google Scholar] [CrossRef] [Scilit]
- Abdullah, J. Fire in Tall Buildings: Occupant’s Safety and Owner’s Liability. In Kuala Lumpur: International Law Book Services; International Law Book Services: Kuala Lumpur, Malaysia, 2001. [Google Scholar]
- Ju, W. Study on Fire Risk and Disaster Reducing Factors of Cotton Logistics Warehouse Based on Event and Fault Tree Analysis. Procedia Eng. 2016, 135, 418–426. [Google Scholar] [CrossRef] [Scilit]
- Hu, Y. Research on the Application of Fault Tree Analysis for Building Fire Safety of Hotels. Procedia Eng. 2016, 135, 524–530. [Google Scholar] [CrossRef] [Scilit]
- Davidson, M.T.; Harik, I.E.; Davis, D.B. Fire Impact and Passive Fire Protection of Infrastructure: State of the Art. J. Perform. Constr. Facil. 2013, 27, 135–143. [Google Scholar] [CrossRef] [Scilit]
- Zhang, C. Review of Structural Fire Hazards, Challenges, and Prevention Strategies. Fire 2023, 6, 137. [Google Scholar] [CrossRef] [Scilit]
- Lou, T.; Wang, W.; Izzuddin, B.A. A Framework for Performance-Based Assessment in Post-Earthquake Fire: Methodology and Case Study. Eng. Struct. 2023, 294, 116766. [Google Scholar] [CrossRef] [Scilit]
- Hulse, L.M.; Deere, S.; Galea, E.R. Fire Safety in Construction: Site Evacuation and Self-Reported Worker Behaviour. Saf. Sci. 2022, 145, 105482. [Google Scholar] [CrossRef] [Scilit]
- Deere, S.; Xie, H.; Galea, E.R.; Cooney, D.; Lawrence, P.J. An Evacuation Model Validation Data-Set for High-Rise Construction Sites. Fire Saf. J. 2021, 120, 103118. [Google Scholar] [CrossRef] [Scilit]
- Kristensen, L.M.; Christensen, S.; Jensen, K. The Practitioner’s Guide to Coloured Petri Nets. Int. J. Softw. Tools Technol. Transf. (STTT) 1998, 2, 98–132. [Google Scholar] [CrossRef] [Scilit]
- Jensen, K.; Kristensen, L.M. Colored Petri Nets. Commun. ACM 2015, 58, 61–70. [Google Scholar] [CrossRef] [Scilit]
- Fernandes Costa, T.; Sobrinho, Á.; Chaves e Silva, L.; da Silva, L.D.; Perkusich, A. Coloured Petri Nets-Based Modeling and Validation of Insulin Infusion Pump Systems. Appl. Sci. 2022, 12, 1475. [Google Scholar] [CrossRef] [Scilit]
- Kristensen, L.M.; Jørgensen, J.B.; Jensen, K. Application of Coloured Petri Nets in System Development. In Advanced Course on Petri Nets; Springer: Berlin/Heidelberg, Germany, 2004; pp. 626–685. [Google Scholar]
- Zhang, J.; Miao, X. Application of Colored Petri Nets in Security Protocol Analysis. In Proceedings of the International Conference on Algorithms Software Engineering and Network Security, Nanchang, China, 26–28 April 2024; ACM: New York, NY, USA, 2024; pp. 676–682. [Google Scholar]
- Jensen, K.; Kristensen, L.M.; Wells, L. Coloured Petri Nets and CPN Tools for Modelling and Validation of Concurrent Systems. Int. J. Softw. Tools Technol. Transf. 2007, 9, 213–254. [Google Scholar] [CrossRef] [Scilit]
- Deng, J.; Liu, S.; Zeng, X. An Emergency Response Framework Design and Performance Analysis for Ship Fire Incidents in Waterway Tunnels. Fire 2025, 8, 278. [Google Scholar] [CrossRef] [Scilit]
- Zhou, J.; Reniers, G.; Cozzani, V. A Petri-Net Approach for Firefighting Force Allocation Analysis of Fire Emergency Response with Backups. Reliab. Eng. Syst. Saf. 2023, 229, 108847. [Google Scholar] [CrossRef] [Scilit]
- Yang, Y.; Yu, L.; Wang, X.; Zhou, Z.; Chen, Y.; Kou, T. A Novel Method to Evaluate Node Importance in Complex Networks. Phys. A: Stat. Mech. Its Appl. 2019, 526, 121118. [Google Scholar] [CrossRef] [Scilit]
- Ait Rai, K.; Machkour, M.; Antari, J. Influential Nodes Identification in Complex Networks: A Comprehensive Literature Review. Beni-Suef Univ. J. Basic Appl. Sci. 2023, 12, 18. [Google Scholar] [CrossRef] [Scilit]
- Cvetković, V.M.; Dragašević, A.; Protić, D.; Janković, B.; Nikolić, N.; Milošević, P. Fire Safety Behavior Model for Residential Buildings: Implications for Disaster Risk Reduction. Int. J. Disaster Risk Reduct. 2022, 76, 102981. [Google Scholar] [CrossRef] [Scilit]
- Lara, R.D.L.H.; Vergara, K.A.F.; Arrieta, J.C.; Mariano, L.E.M.; Ahumada, K.C. Fire Regulations in Industrial Companies and the Level of Impact and Risk: The Case of the Municipality of Soledad, Atlántico. Int. J. Saf. Secur. Eng. 2022, 12, 179–183. [Google Scholar] [CrossRef] [Scilit]
- Wang, Y.; Hou, L.; Li, M.; Zheng, R. A Novel Fire Risk Assessment Approach for Large-Scale Commercial and High-Rise Buildings Based on Fuzzy Analytic Hierarchy Process (FAHP) and Coupling Revision. Int. J. Environ. Res. Public Health 2021, 18, 7187. [Google Scholar] [CrossRef] [Scilit]
- Yilmaz, F.; Alp, S.; Oz, B.; Alkoc, A. Analysis of the Risks Arising from Fire Installations in Workplaces Using the Ranking Method. Eng. Technol. Appl. Sci. Res. 2020, 10, 5914–5920. [Google Scholar] [CrossRef] [Scilit]
- Alkış, S.; Aksoy, E.; Akpınar, K. Risk Assessment of Industrial Fires for Surrounding Vulnerable Facilities Using a Multi-Criteria Decision Support Approach and GIS. Fire 2021, 4, 53. [Google Scholar] [CrossRef] [Scilit]
- Omidvari, F.; Jahangiri, M.; Mehryar, R.; Alimohammadlou, M.; Kamalinia, M. Fire Risk Assessment in Healthcare Settings: Application of FMEA Combined with Multi-Criteria Decision Making Methods. Math. Probl. Eng. 2020, 2020, 8913497. [Google Scholar] [CrossRef] [Scilit]
- Rezaei, J. Best-Worst Multi-Criteria Decision-Making Method: Some Properties and a Linear Model. Omega 2016, 64, 126–130. [Google Scholar] [CrossRef] [Scilit]
- Brzezińska, D.; Bryant, P. Risk Index Method–A Tool for Sustainable, Holistic Building Fire Strategies. Sustainability 2020, 12, 4469. [Google Scholar] [CrossRef] [Scilit]
- Rahardjo, H.A.; Prihanton, M. The Most Critical Issues and Challenges of Fire Safety for Building Sustainability in Jakarta. J. Build. Eng. 2020, 29, 101133. [Google Scholar] [CrossRef] [Scilit]
- Zou, Y.; Kiviniemi, A.; Jones, S.W. A Review of Risk Management through BIM and BIM-Related Technologies. Saf. Sci. 2017, 97, 88–98. [Google Scholar] [CrossRef] [Scilit]
- Li, W.; Li, H.; Liu, Y.; Wang, S.; Pei, X.; Li, Q. Fire Risk Assessment of High-Rise Buildings under Construction Based on Unascertained Measure Theory. PLoS ONE 2020, 15, e0239166. [Google Scholar] [CrossRef] [Scilit]
- Chow, W.K. Proposed Fire Safety Ranking System EB-FSRS for Existing High-Rise Nonresidential Buildings in Hong Kong. J. Archit. Eng. 2002, 8, 116–124. [Google Scholar] [CrossRef] [Scilit]
- Silva, J.S.R.F. Towards Integrated Fire Management—Outcomes of the European Project Fire Paradox; European Forest Institute: Joensuu, Finland, 2010; ISBN 970-952-5453-48-5. [Google Scholar]
- Attaran, M. Information Technology and Business-process Redesign. Bus. Process Manag. J. 2003, 9, 440–458. [Google Scholar] [CrossRef] [Scilit]
- Shams Abadi, S.T.; Moniri Tokmehdash, N.; Hosny, A.; Nik-Bakht, M. BIM-Based Co-Simulation of Fire and Occupants’ Behavior for Safe Construction Rehabilitation Planning. Fire 2021, 4, 67. [Google Scholar] [CrossRef] [Scilit]
- Ji, X.; Wen, W.; Zhao, Q. Quantitative Disaster Chain Risk Analysis. J. Tsinghua Univ. Sci. Technol. 2009, 11, 1749–1752. [Google Scholar]
- Alexander, D.; Pescaroli, G. What Are Cascading Disasters? UCL Open Environ. 2019, 1, e003. [Google Scholar] [CrossRef] [Scilit] [PubMed]
- Fan, X.; Scaringi, G.; Korup, O.; West, A.J.; van Westen, C.J.; Tanyas, H.; Hovius, N.; Hales, T.C.; Jibson, R.W.; Allstadt, K.E.; et al. Earthquake-Induced Chains of Geologic Hazards: Patterns, Mechanisms, and Impacts. Rev. Geophys. 2019, 57, 421–503. [Google Scholar] [CrossRef] [Scilit]
- Yıldız, M.A. Machine Learning for Fire Safety in the Built Environment: A Bibliometric Insight into Research Trends and Key Methods. Buildings 2025, 15, 2465. [Google Scholar] [CrossRef] [Scilit]
- Zhang, Z. Estimating the Concrete Ultimate Strength Using a Hybridized Neural Machine Learning. Buildings 2023, 13, 1852. [Google Scholar] [CrossRef] [Scilit]
- Liu, G.; Liu, J.; Wang, N.; Xue, X.; Tan, Y. Machine Learning-Aided Prediction of Post-Fire Shear Resistance Reduction of Q690 HSS Plate Girders. Buildings 2022, 12, 1481. [Google Scholar] [CrossRef] [Scilit]
- Su, Y.; Rong, G.; Ma, Y.; Chi, J.; Liu, X.; Zhang, J.; Li, T. Hazard Assessment of Earthquake Disaster Chains Based on Deep Learning—A Case Study of Mao County, Sichuan Province. Front. Earth Sci. 2022, 9, 683903. [Google Scholar] [CrossRef] [Scilit]
- Choi, M.-Y.; Jun, S. Fire Risk Assessment Models Using Statistical Machine Learning and Optimized Risk Indexing. Appl. Sci. 2020, 10, 4199. [Google Scholar] [CrossRef] [Scilit]
- Hao, L. Fuzzy Evaluation on Fire Risk Assessment of High-Rise Building Construction Site Based on AHP. Hebei J. Ind. Sci. Technol. 2015, 3, 224–229. [Google Scholar] [CrossRef]
- Su, Y. Study on Fire Safety Management of Building Construction Based on Image Recognition Technology. Master’s Thesis, Chongqing University, Chongqing, China, 2021. [Google Scholar] [CrossRef]
- Tang, J.; Zeng, H.; Zheng, Q. Research on Complex Network Modeling and Emergency Chain Disruption Strategies for Secondary Disaster Chains in Construction Fires. Value Eng. 2025, 11, 62–65. [Google Scholar]
- Yi, G.; Qin, H. Fuzzy Comprehensive Evaluation of Fire Risk on High-Rise Buildings. Procedia Eng. 2011, 11, 620–624. [Google Scholar] [CrossRef] [Scilit]
- Li, S.; Tao, G.; Zhang, L. Fire Risk Assessment of High-Rise Buildings Based on Gray-FAHP Mathematical Model. Procedia Eng. 2018, 211, 395–402. [Google Scholar] [CrossRef] [Scilit]
- Jensen, K. Coloured Petri Nets; Monographs in Theoretical Computer Science; An EATCS Series; Springer: Berlin/Heidelberg, Germany, 1996; ISBN 978-3-642-08243-6. [Google Scholar]
- Jensen, K.; van der Aalst, W.M.; Ajmone Marsan, M.; Franceschinis, G.; Kleijn, J.; Kristensen, L.M. (Eds.) Transactions on Petri Nets and Other Models of Concurrency VI; Lecture Notes in Computer Science; Springer: Berlin/Heidelberg, Germany, 2012; Volume 7400, ISBN 978-3-642-35178-5. [Google Scholar]
- Kristensen, L.M.; Christensen, S. Implementing Coloured Petri Nets Using a Functional Programming Language. High.-Order Symb. Comput. 2004, 17, 207–243. [Google Scholar] [CrossRef] [Scilit]
- Ng, K.M.; Reaz, M.B.I.; Ali, M.A.M. A Review on the Applications of Petri Nets in Modeling, Analysis, and Control of Urban Traffic. IEEE Trans. Intell. Transp. Syst. 2013, 14, 858–870. [Google Scholar] [CrossRef] [Scilit]
- Zhou, W. MSCFS-RP: A Colored-Petri-Net-Based Analysis Model for Master–Slave Cloud File Systems with Replication Pipelining. Electronics 2024, 13, 2852. [Google Scholar] [CrossRef] [Scilit]
- Cavone, G.; Dotoli, M.; Seatzu, C. A Survey on Petri Net Models for Freight Logistics and Transportation Systems. IEEE Trans. Intell. Transp. Syst. 2018, 19, 1795–1813. [Google Scholar] [CrossRef] [Scilit]
- Derni, O.; Boufera, F.; Khelfi, M.F. Coloured Petri Net for Modelling and Improving Emergency Department Based on the Simulation Model. Int. J. Simul. Process Model. 2019, 14, 72. [Google Scholar] [CrossRef] [Scilit]
- Zeinalnezhad, M.; Chofreh, A.G.; Goni, F.A.; Klemeš, J.J.; Sari, E. Simulation and Improvement of Patients’ Workflow in Heart Clinics during COVID-19 Pandemic Using Timed Coloured Petri Nets. Int. J. Environ. Res. Public Health 2020, 17, 8577. [Google Scholar] [CrossRef] [Scilit]
- Wakefield, R.R.; Sears, G.A. Petri Nets for Simulation and Modeling of Construction Systems. J. Constr. Eng. Manag. 1997, 123, 105–112. [Google Scholar] [CrossRef] [Scilit]
- Wakefield, R.R. Application of Extended Stochastic Petri Nets to Simulation and Modelling of Construction Systems. Civ. Eng. Environ. Syst. 1998, 15, 1–22. [Google Scholar] [CrossRef] [Scilit]
- Han, X.; Jie, L.; Zuyan, S. Non-Autonomous Coloured Petri Net-Based Methodology for the Dispatching Process of Urban Fire-Fighting. Fire Saf. J. 2000, 35, 299–325. [Google Scholar] [CrossRef] [Scilit]
- Zhou, J. Petri Net Modeling for the Emergency Response to Chemical Accidents. J. Loss Prev. Process Ind. 2013, 26, 766–770. [Google Scholar] [CrossRef] [Scilit]
- Vernez, D.; Buchs, D.; Pierrehumbert, G. Perspectives in the Use of Coloured Petri Nets for Risk Analysis and Accident Modelling. Saf. Sci. 2003, 41, 445–463. [Google Scholar] [CrossRef] [Scilit]
- Zhou, J.; Reniers, G. Petri-Net Based Evaluation of Emergency Response Actions for Preventing Domino Effects Triggered by Fire. J. Loss Prev. Process Ind. 2018, 51, 94–101. [Google Scholar] [CrossRef] [Scilit]
- Zhou, J.; Reniers, G. Petri-Net Based Simulation Analysis for Emergency Response to Multiple Simultaneous Large-Scale Fires. J. Loss Prev. Process Ind. 2016, 40, 554–562. [Google Scholar] [CrossRef] [Scilit]
- Wang, R.; Zheng, W.; Liang, C.; Tang, T. An Integrated Hazard Identification Method Based on the Hierarchical Colored Petri Net. Saf. Sci. 2016, 88, 166–179. [Google Scholar] [CrossRef] [Scilit]
- Wu, S.; Shao, B.; Bian, G.; Zhang, Z. Analysis of Fire Disaster Chain and Emergency Management Decision-Making in Universities Based on Complex Networks. J. Catastrophology 2022, 37, 156–161. [Google Scholar] [CrossRef]
- GB50140-2005; Design Specification for Fire Extinguisher Configuration in Buildings. Ministry of Construction of the People’s Republic of China: Beijing, China, 2005.
- Miao, Z.; Li, Z. Coupled SPH Model and Simulation of Personnel Evacuation in Fire Environment. J. Syst. Simul. 2016, 28, 292–300. [Google Scholar]
- GB50116-2013; Code for Design of Automatic Fire Alarm Systems. Ministry of Housing and Urban-Rural Development of the People’s Republic of China, General Administration of Quality Supervision, Inspection and Quarantine of the People’s Republic of China, China Planning Press: Beijing, China, 2013.
- GB/T38315-2019; Guidelines for the Preparation and Implementation of Fire Emergency Rescue Plans. State Administration for Market Regulation, China Planning Press: Beijing, China, 2019.

Disclaimer/Publisher’s Note: The statements, opinions and data contained in all publications are solely those of the individual author(s) and contributor(s) and not of MDPI and/or the editor(s). MDPI and/or the editor(s) disclaim responsibility for any injury to people or property resulting from any ideas, methods, instructions or products referred to in the content. |
© 2025 by the authors. Licensee MDPI, Basel, Switzerland. This article is an open access article distributed under the terms and conditions of the Creative Commons Attribution (CC BY) license (https://creativecommons.org/licenses/by/4.0/).