


Abstract
Unequal-wall-thickness X80-X60 girth welded joints used in pipeline transition sections exhibit strong local mechanical heterogeneity, while the wall-thickness transition also introduces a separate structural geometry effect. Conventional homogeneous or weld-metal-only descriptions may therefore be insufficient for interpreting the fracture response of single-edge-notched tension (SENT) specimens sampled from such joints. In this study, a constraint-driven fracture toughness assessment was conducted for single-edge-notched tension (SENT) specimens representing the X80 base metal, X80 heat-affected zone (HAZ), weld metal, X60 HAZ, and X60 base metal as five distinct material regions. Miniature tensile tests provided the local constitutive input for these regions. The numerical procedure was verified against published SENT force versus crack-mouth-opening-displacement (CMOD) data; because direct SENT fracture-toughness tests for the present X80-X60 target joint are not yet available, the literature comparison is treated as verification of the modeling procedure rather than direct validation of the target joint. Parametric analyses were then performed for an initial crack ratio of a0/W = 0.10–0.30, a thickness-to-width ratio of B/W = 0.50–1.50, weld width = 10–30 mm, HAZ width = 1–9 mm, and different weld/HAZ strength combinations. The simulations show asymmetric crack-tip plastic deformation toward the lower-strength X60 side. Increasing the crack length increases crack-tip opening displacement (CTOD), whereas increasing B/W, weld width, or HAZ width generally reduces CTOD by increasing local constraint. The influence of weld strength is strongly coupled with the strength level of the adjacent HAZs. The results are therefore interpreted as numerical CTOD-response trends for a heterogeneous SENT specimen; direct experimental fracture-toughness measurements of the target X80-X60 joint remain an important subject of follow-up work.
1. Introduction
High-grade pipeline steels have been widely used in long-distance oil and gas transmission systems because of their high strength, improved transportation efficiency, and potential for reducing pipeline construction costs. In practical engineering, pipeline systems are frequently composed of pipe sections with different steel grades and wall thicknesses because of variations in design pressure, terrain conditions, service requirements, and construction constraints. As a result, girth welded joints connecting dissimilar pipelines, such as X80-X60 unequal-wall-thickness joints, are commonly encountered in transition sections of pipeline systems. These joints often exhibit pronounced mechanical heterogeneity caused by differences in base-metal strength, weld-metal properties, HAZ characteristics, and local geometric discontinuity. Under internal pressure, axial tension, ground movement, or other external loads, such heterogeneity can significantly alter the local stress–strain distribution, crack-tip constraint, and fracture driving force, thereby affecting the fracture resistance and structural integrity of the welded joint.
The structural integrity of girth welds is one of the key factors governing the safe operation of high-pressure pipelines. Compared with homogeneous pipe materials, dissimilar girth welded joints contain multiple material regions, including the high-strength base metal, low-strength base metal, HAZs on both sides, and weld metal. Each region may possess a different yield strength, tensile strength, strain-hardening capacity, and plastic deformation behavior. In particular, unequal-wall-thickness girth welds introduce additional complexity because local structural geometry and material mismatch are coupled. When a crack or notch is located in or near the weld region, the crack-tip driving force is no longer controlled only by the applied load and crack size but also by the constraint imposed by adjacent heterogeneous materials. Therefore, accurately evaluating the fracture toughness of unequal-wall-thickness, dissimilar-girth welds requires a detailed understanding of the interaction among crack configuration, specimen geometry, weld dimensions, HAZ dimensions, and strength mismatch.
Fracture mechanics testing of pipeline girth welds has traditionally relied on a deeply notched, single-edge notched bend (SE(B)) or compact tension (C(T)) specimens. These specimens are convenient for standard fracture-toughness testing, but they usually generate a relatively high crack-tip constraint. For circumferential flaws in pipelines subjected primarily to tensile loading, such high-constraint specimens may provide overly conservative fracture-toughness values and may not accurately represent the actual crack-tip stress state in service. Pisarski and co-workers demonstrated, from crack-tip constraint considerations, that deeply notched SE(B) specimens generally give conservative fracture-toughness estimates for pipeline girth welds, whereas single-edge notched tension (SE(T) or SENT) specimens and shallow-notched specimens can provide fracture-resistance values more representative of circumferential flaws in pipelines [1,2]. Subsequent studies by Shen et al. and Xu et al. further promoted the use of clamped SENT specimens for measuring J-R and CTOD-R resistance curves of pipeline steels and clarified the effects of crack depth and specimen size on ductile crack-growth resistance [3,4,5]. Tang et al. proposed a double crack-opening displacement (COD) gauge method for measuring the CTOD resistance curve of SENT specimens. This method makes the test procedure simpler and faster while overcoming the limitations of the J-integral under large plastic deformation conditions [6]. Hertelé and Denys et al. proposed a potential drop method for measuring the CTOD resistance curve of SENT specimens and experimentally verified the accuracy of the method [7,8,9,10,11]. These studies collectively indicate that SENT testing is a more pipeline-relevant method for low-constraint fracture-toughness assessment. Classical two-parameter fracture mechanics provide a quantitative basis for describing such a geometry-dependent constraint. In addition to J or CTOD as crack-driving force measures, the nonsingular T-stress and the Q parameter have been used to characterize deviations from a high-constraint reference field and to rank crack-tip triaxiality [12,13,14]. These concepts are particularly relevant when comparing deeply notched bend specimens with lower-constraint SENT geometries.
The standardization and optimization of SENT testing have also received considerable attention. The introduction of BS 8571:2014 provided a formal basis for determining fracture toughness using SENT specimens [15], while later studies examined practical issues such as notch depth, specimen geometry, side-grooving, unloading compliance, clamping conditions, and local compression for weld specimens [16,17,18,19]. It has been shown that the notch-depth ratio (a/W) can significantly influence the obtained fracture resistance because shallow cracks generally produce lower constraint and higher apparent toughness than deep cracks. However, despite the substantial progress in SENT testing methodology, most available studies have focused on homogeneous pipe steels, equal-wall-thickness welded joints, or simplified material configurations. The fracture response of SENT specimens extracted from unequal-wall-thickness, dissimilar-girth welds remains insufficiently understood. In such joints, the crack-tip plastic zone may develop asymmetrically because of the mechanical mismatch between X80 and X60 pipe steels and the property gradients across the weld metal and HAZs. This asymmetric deformation may lead to a constraint-driven fracture response that cannot be captured by homogeneous or equivalent-material models.
In parallel with SENT-based fracture testing, extensive research has been conducted on fracture assessment methods for pipeline girth welds. Engineering critical assessment procedures usually evaluate defects in girth welds using fracture parameters such as J-integral, CTOD, or failure assessment diagrams. These methods are effective for many conventional pipeline integrity problems, but their reliability depends strongly on the accuracy of the input fracture toughness and on whether the constraint condition in the test specimen is consistent with that in the actual pipeline [20,21,22,23]. For high-grade pipelines and strain-based design applications, the mismatch between laboratory specimen constraint and full-scale pipeline constraint becomes more critical. Full-scale or wide-plate tests can provide direct structural evidence, but they are expensive and difficult to use for parametric studies [24,25,26]. Finite element analysis therefore plays an important role in bridging small-scale fracture toughness tests and full-scale pipeline-integrity assessment. Nevertheless, many existing numerical studies still simplify the girth weld as a homogeneous or bilinear material region, which limits their ability to describe the local constraint effect induced by multiple material zones in dissimilar-girth welds [27,28,29,30].
Strength mismatch is another important factor affecting the fracture behavior of welded joints. In welded structures, the weld metal may be undermatched, evenly matched, or overmatched relative to the adjacent base metal. In pipeline engineering, overmatched welds are often preferred to reduce plastic localization in the weld metal. However, the fracture response of a dissimilar-girth weld cannot be determined by weld-metal strength alone. Su et al. numerically investigated the strength-mismatch effect on ductile-crack growth resistance in welded pipes using SE(B), SENT, and circumferentially cracked pipe models and showed that the mismatch ratio strongly affects CTOD-R curves, crack-tip stress fields, and ductile tearing resistance [31]. Their results also confirmed that SENT specimens exhibit fracture resistance behavior closer to that of cracked pipes than standard SE(B) specimens. However, the majority of strength-mismatch studies define mismatch using the strength ratio between the weld metal and base metal, whereas the additional role of HAZs is often simplified or ignored. For dissimilar unequal-wall-thickness joints, the two sides of the weld are not mechanically equivalent, and the HAZs adjacent to X80 and X60 pipe steels may have different yield strengths and strain-hardening characteristics. Therefore, the fracture behavior depends not only on weld-metal overmatch or undermatch but also on the combined constraint generated by the weld metal, X80 HAZ, X60 HAZ, and the two base metals.
The integrity assessment of unequal-wall-thickness girth welds has recently attracted increasing interest because wall-thickness transition, misalignment, and local geometric discontinuity can significantly affect strain distribution and failure capacity. Chen et al. developed a tensile strain capacity prediction model for an X80 pipeline with improper transitioning and an undermatched girth weld, emphasizing that unequal wall thickness can change strain demand and strain capacity and that the thin-wall side may experience more severe plastic deformation [32]. More recently, Guo et al. performed a three-dimensional finite element investigation of X80 girth welds and reported that the wall-thickness ratio, misalignment, strength-matching coefficient, yield-to-tensile ratio of the weld metal, and internal pressure significantly influence stress triaxiality and local-strain concentration [33]. These studies demonstrate the importance of geometric features and weld-metal properties in girth-weld assessment. However, they mainly focus on tensile strain capacity, stress triaxiality, or strain concentration at the structural level. Less attention has been paid to CTOD-based fracture-toughness assessment of SENT specimens extracted from unequal-wall-thickness dissimilar X80-X60 girth welds, particularly considering the coupled effects of crack length, specimen thickness-to-width ratio, weld width, HAZ width, and different HAZ strength scenarios. Relative to recent pipe-level heterogeneous-weld studies, the present work addresses a different scale and objective: Chen et al. [32] and Guo et al. [33] focused primarily on structural strain capacity, misalignment, the wall-thickness ratio, and stress triaxiality of pipe joints, whereas the present model resolves five local material zones inside a SENT specimen and isolates their effects on CTOD over controlled-crack, specimen, weld-width, HAZ-width, and strength-mismatch ranges. Thus, the unequal wall thickness defines the source joint and its heterogeneous property distribution, while the SENT model is intentionally used to examine specimen-scale fracture response rather than to reproduce the complete pipe-transition geometry.
Despite these advances, several limitations remain in the current understanding of dissimilar-girth-weld fracture response. Existing approaches often simplify the joint as homogeneous, equivalent, or weld/base-metal regions and therefore do not resolve the five-zone property sequence considered here. The role of HAZ strength is also commonly secondary to the weld/base-metal mismatch ratio, and the sensitivity to local weld and HAZ widths is seldom examined together with crack and specimen geometry. Table 1 summarizes these unresolved issues and quantifies the parameter space addressed in the present numerical study. Importantly, two limitations remain outside the current scope: direct SENT fracture-toughness testing of the target X80-X60 joint and quantitative constraint evaluation using Q, T-stress, J-Q, or stress-triaxiality metrics. Welding residual stresses, distortion, anisotropy, and probabilistic interaction effects are likewise not explicitly modeled and are discussed as limitations below.
Table 1.
Quantified research gaps and scope of the present study.
To address the specimen-scale gaps identified above, this study investigates the CTOD response of SENT specimens representing an X80-X60 unequal-wall-thickness girth welded joint. Miniature tensile tests are used to obtain local properties for the X80 base metal, X80 HAZ, weld metal, X60 HAZ, and X60 base metal, and these measured properties are assigned to a three-dimensional heterogeneous finite element model. The numerical procedure is verified against published SENT data. Because the target X80-X60 joint has not yet been subjected to a direct SENT fracture-toughness program, the calculations are used to analyze relative CTOD trends and constraint-sensitive crack-tip deformation rather than to report experimentally validated critical toughness values for the target joint.
The main contribution of this work is a five-region heterogeneous SENT modeling approach for the dissimilar X80-X60 joint, coupled with local micro-tensile characterization and systematic parameter ranges for the crack ratio, specimen thickness, weld width, HAZ width, weld strength, and HAZ strength. This extends weld-metal-only or homogeneous descriptions by retaining the asymmetric X80/weld/X60 property sequence. The present paper uses stress and plastic-strain fields together with CTOD to interpret relative constraint effects; recognized constraint parameters such as Q, T-stress, stress triaxiality, and J-Q characterization are not evaluated here and are identified as an important extension for subsequent work.
2. Experimental Characterization of Local Mechanical Properties
2.1. Joint Materials and Welding Procedure
The joint used for local-property characterization was taken from an X80-X60 pipeline transition weld produced between pipes of the same 914 mm outside diameter but different wall thicknesses: 33 mm on the X80 side and 22 mm on the X60 side (thickness ratio of 1.50). The joint employed external-surface alignment and a 20° transition on the thicker-side root region.
The girth weld used a V-groove and a GTAW + SMAW procedure. Manual root welding employed ER50-6 wire (2.5 mm diameter), whereas filling and capping used E6015-G electrodes (3.2 mm diameter) (Atlantic China Welding Consumables, Inc., Zigong, China). The weld consisted of one root layer, multiple filling layers (2–8), and one capping layer. The welding procedure followed Q/SY GJX0221-2012, with consumables selected in accordance with GB/T8110-2008 and GB/T5118-2012 [34,35,36]. The measured chemical compositions (wt.%) were X80 base metal: C 0.070, Mn 1.68, Si 0.19, Ni 0.21, Mo 0.20, balance Fe; X60 base metal: C 0.059, Mn 1.36, Si 0.21, Ni 0.011, Mo 0.03, balance Fe; and girth-weld metal: C 0.068, Mn 1.69, Si 0.20, Ni 0.21, Mo 0.20, balance Fe.
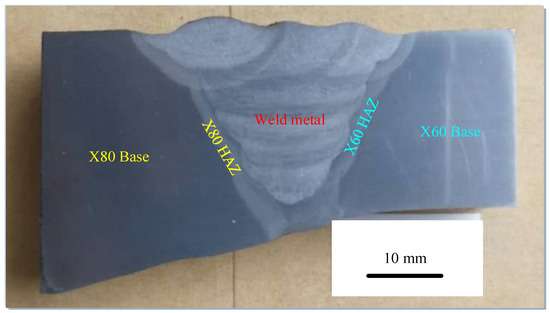
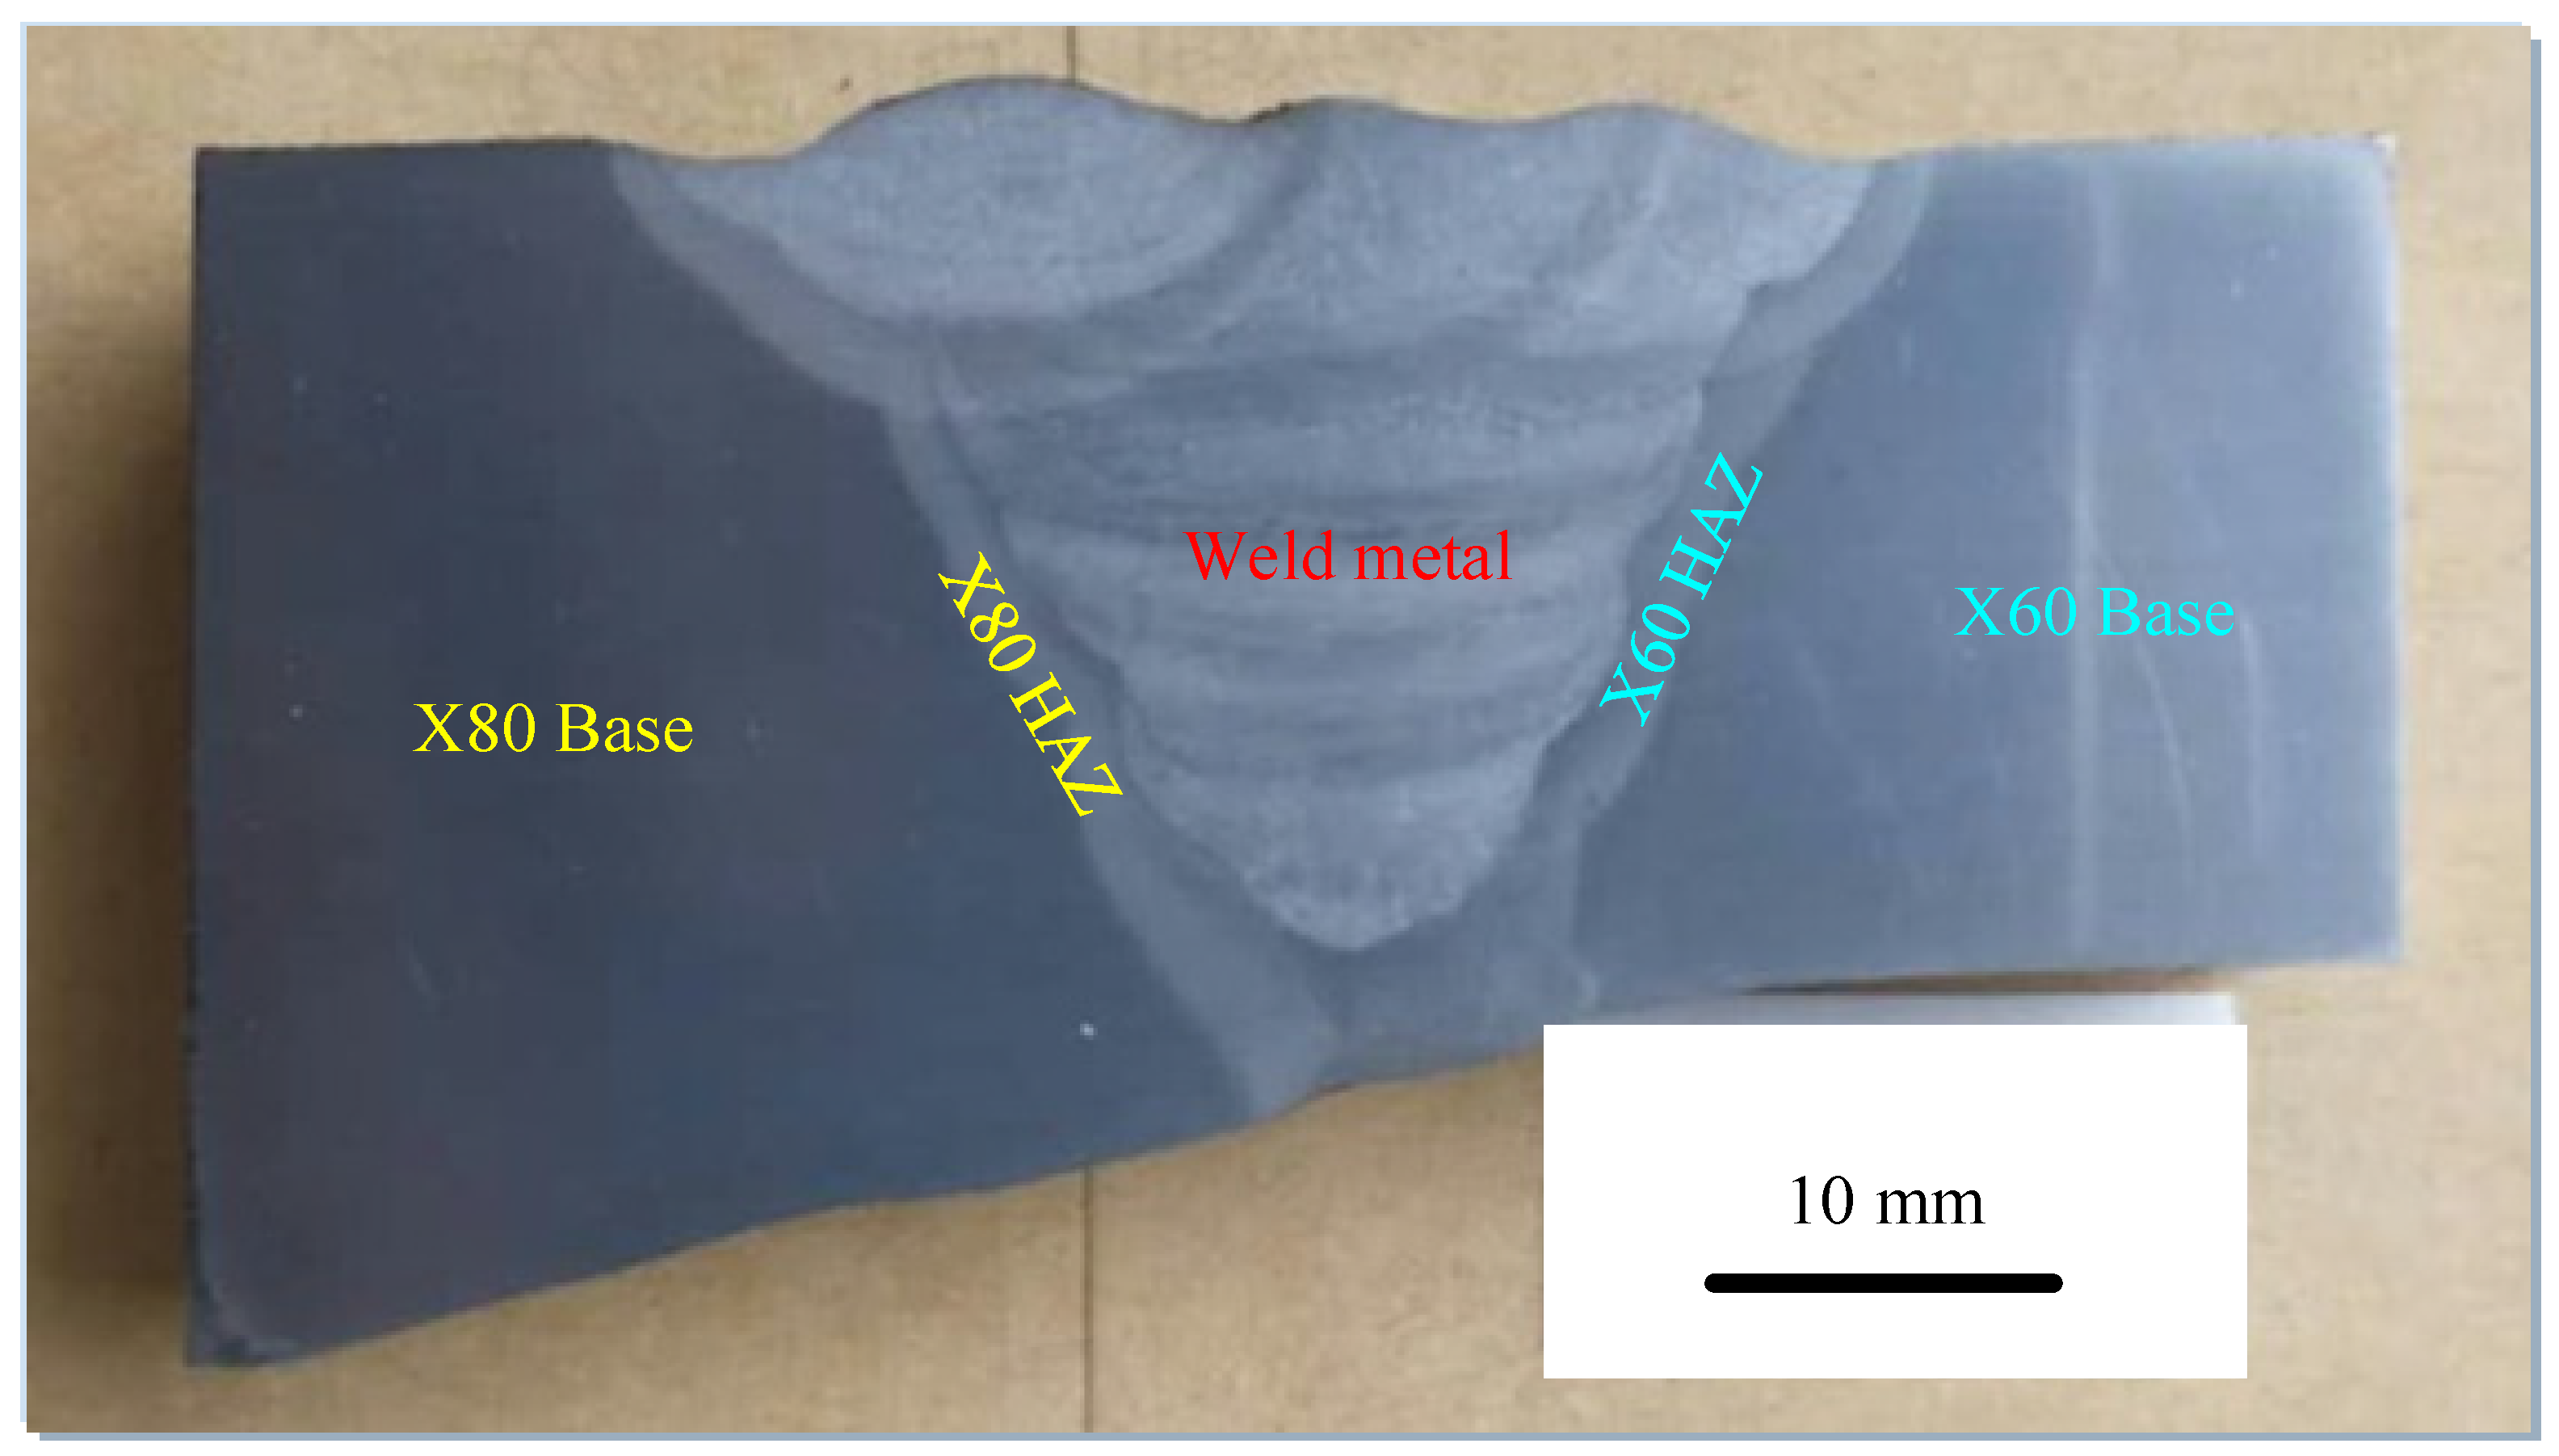
A full-thickness transverse section containing the X80 base metal, X80 HAZ, weld metal, X60 HAZ, and X60 base metal was extracted along the welded pipe pipe’s longitudinal direction. A photograph of the extracted full-section girth-weld specimen is shown in Figure 1.
Figure 1.
Full-section specimen extracted from the pipeline girth weld.
2.2. Micro-Tensile Specimen Preparation and Testing
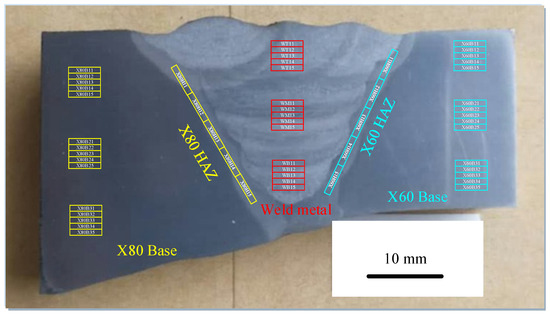
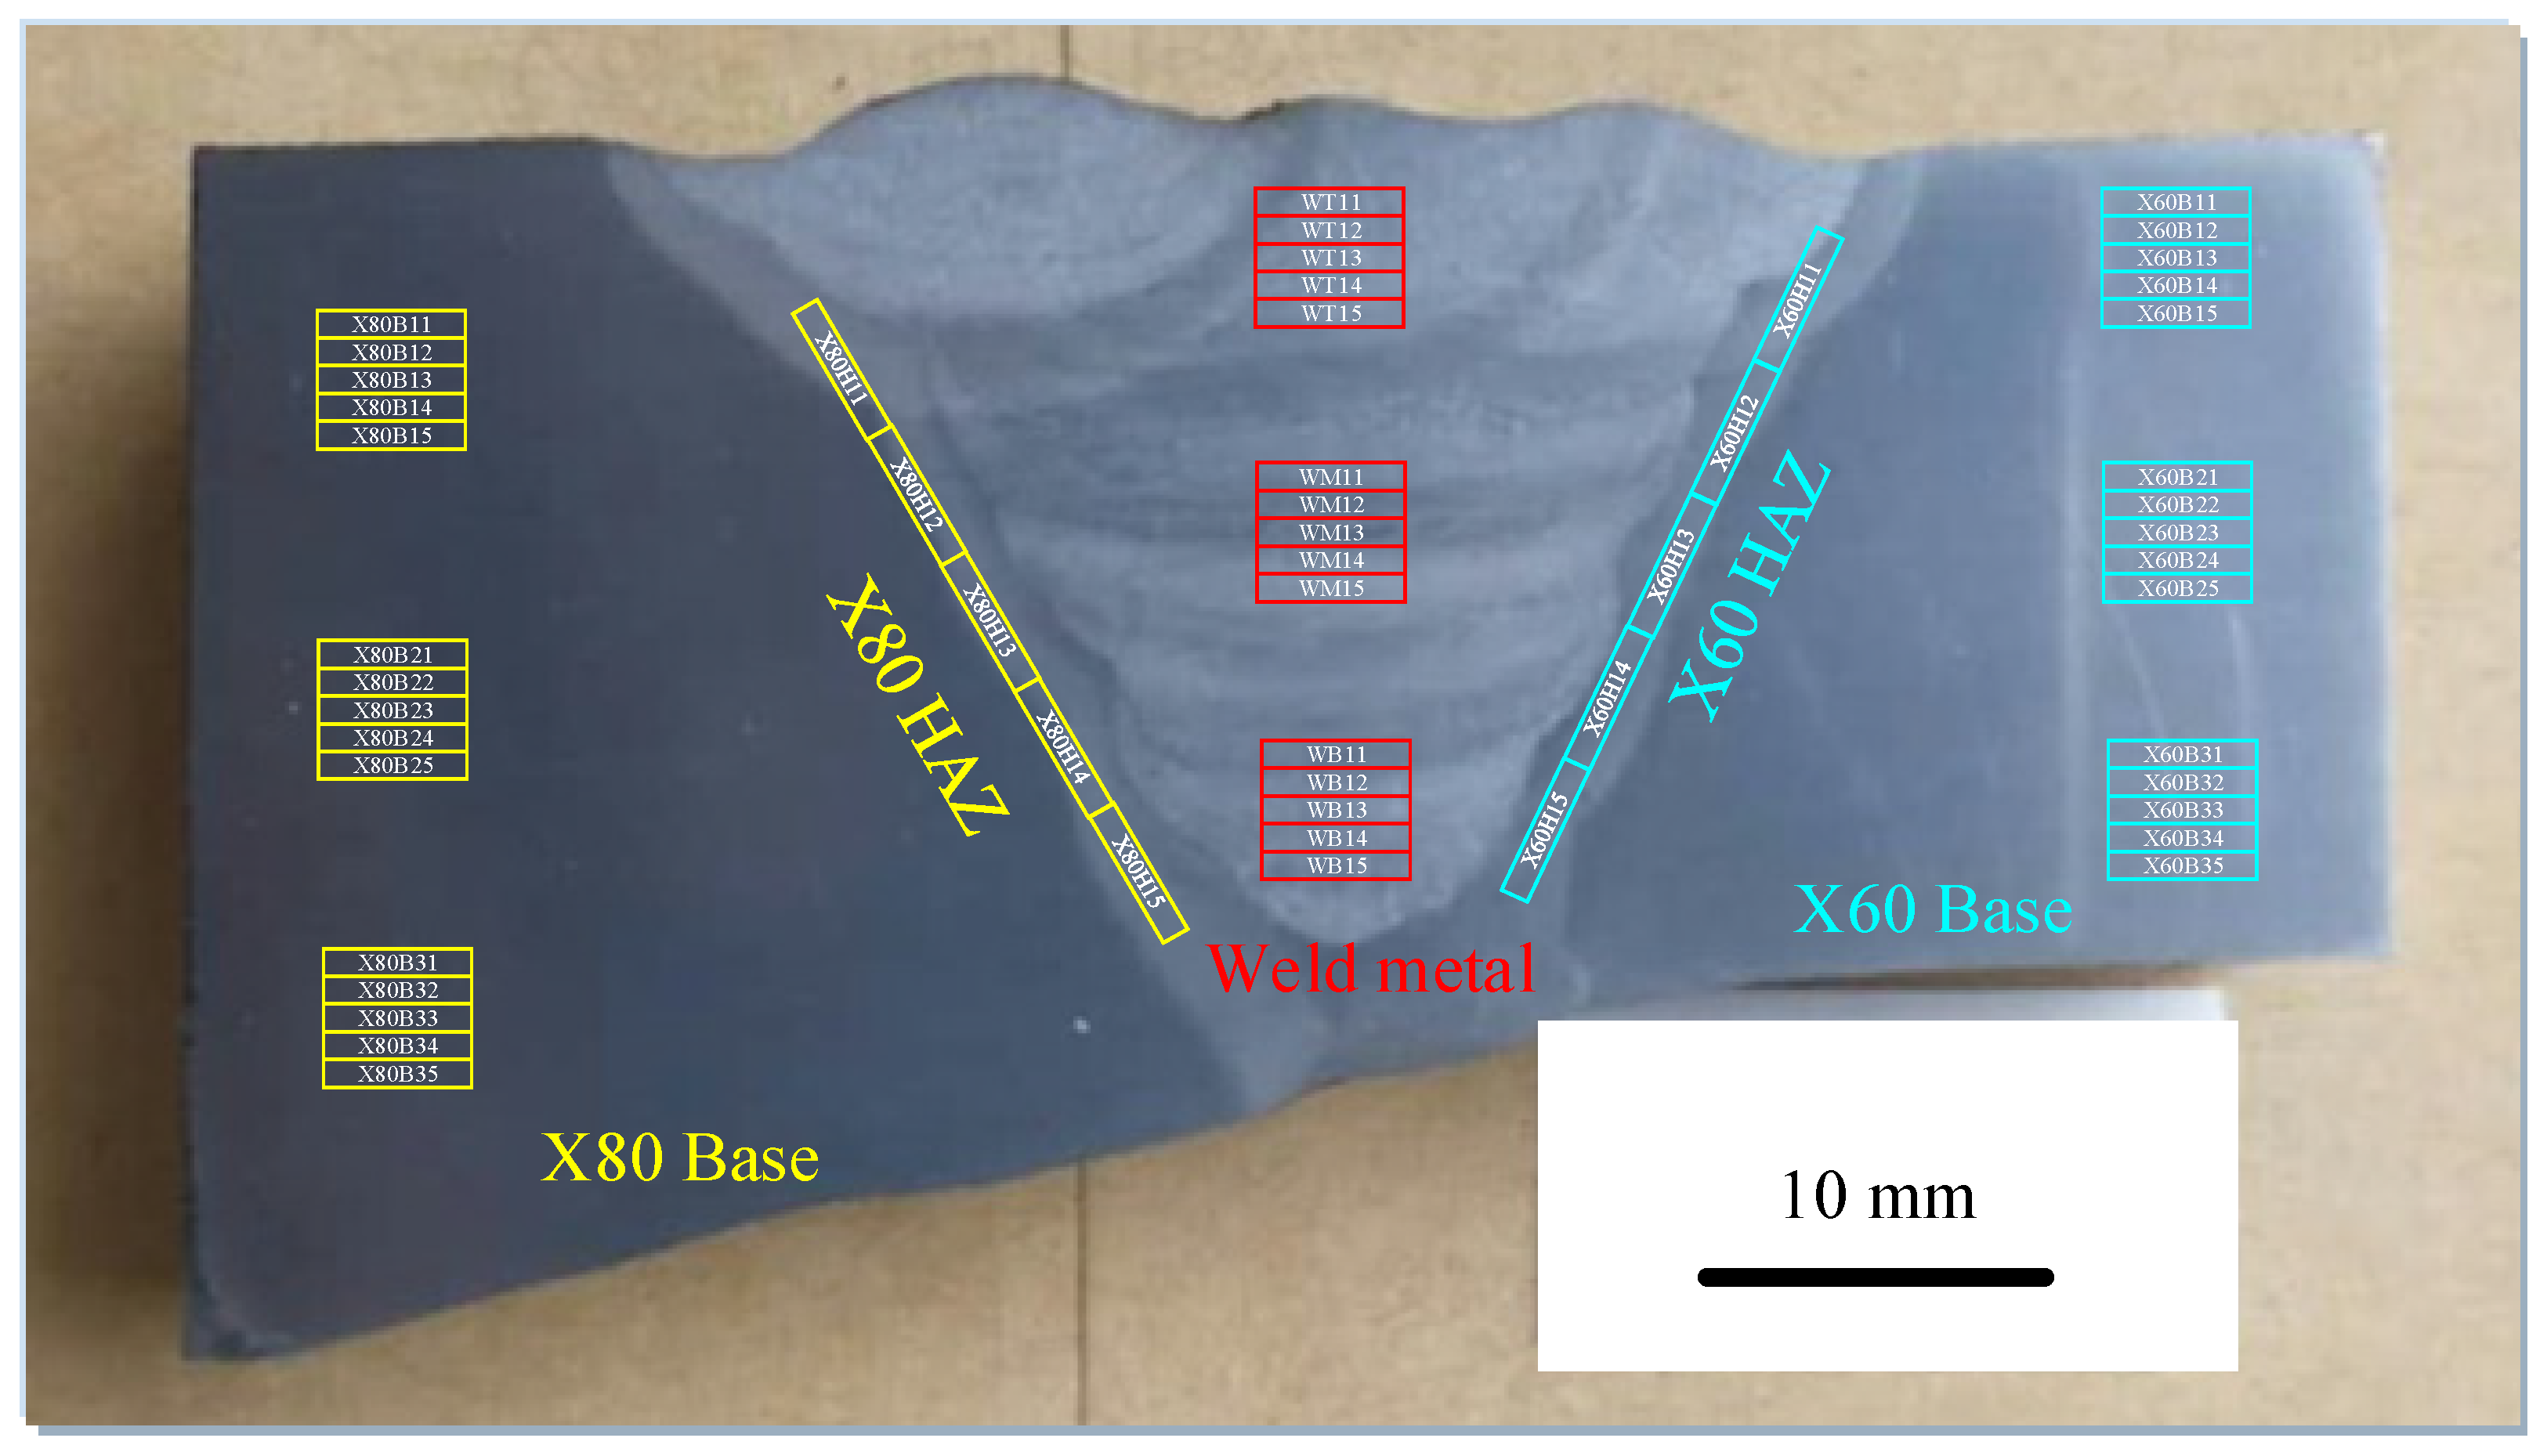
A longitudinal-radial section crossing the complete weld was first removed from the pipe, and the characteristic zones were identified from the weld macrostructure. Miniature tensile blanks were then extracted by slow wire electrical-discharge cutting. Five specimens were prepared for each representative region used in the present model (X80 base metal, X80 HAZ, weld metal, X60 HAZ, and X60 base metal), with the locations distributed through the relevant region as shown in Figure 2. Slow wire cutting was selected to limit mechanical deformation during machining. No separate cutting-method sensitivity test was conducted; to further minimize possible surface effects, the machined specimens were subsequently ground and polished before testing.
Figure 2.
Sampling layout of miniature tensile specimens across the X80-X60 girth welded joint.
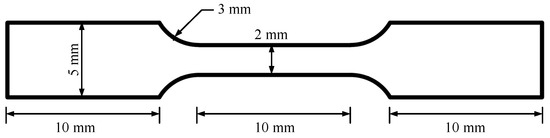
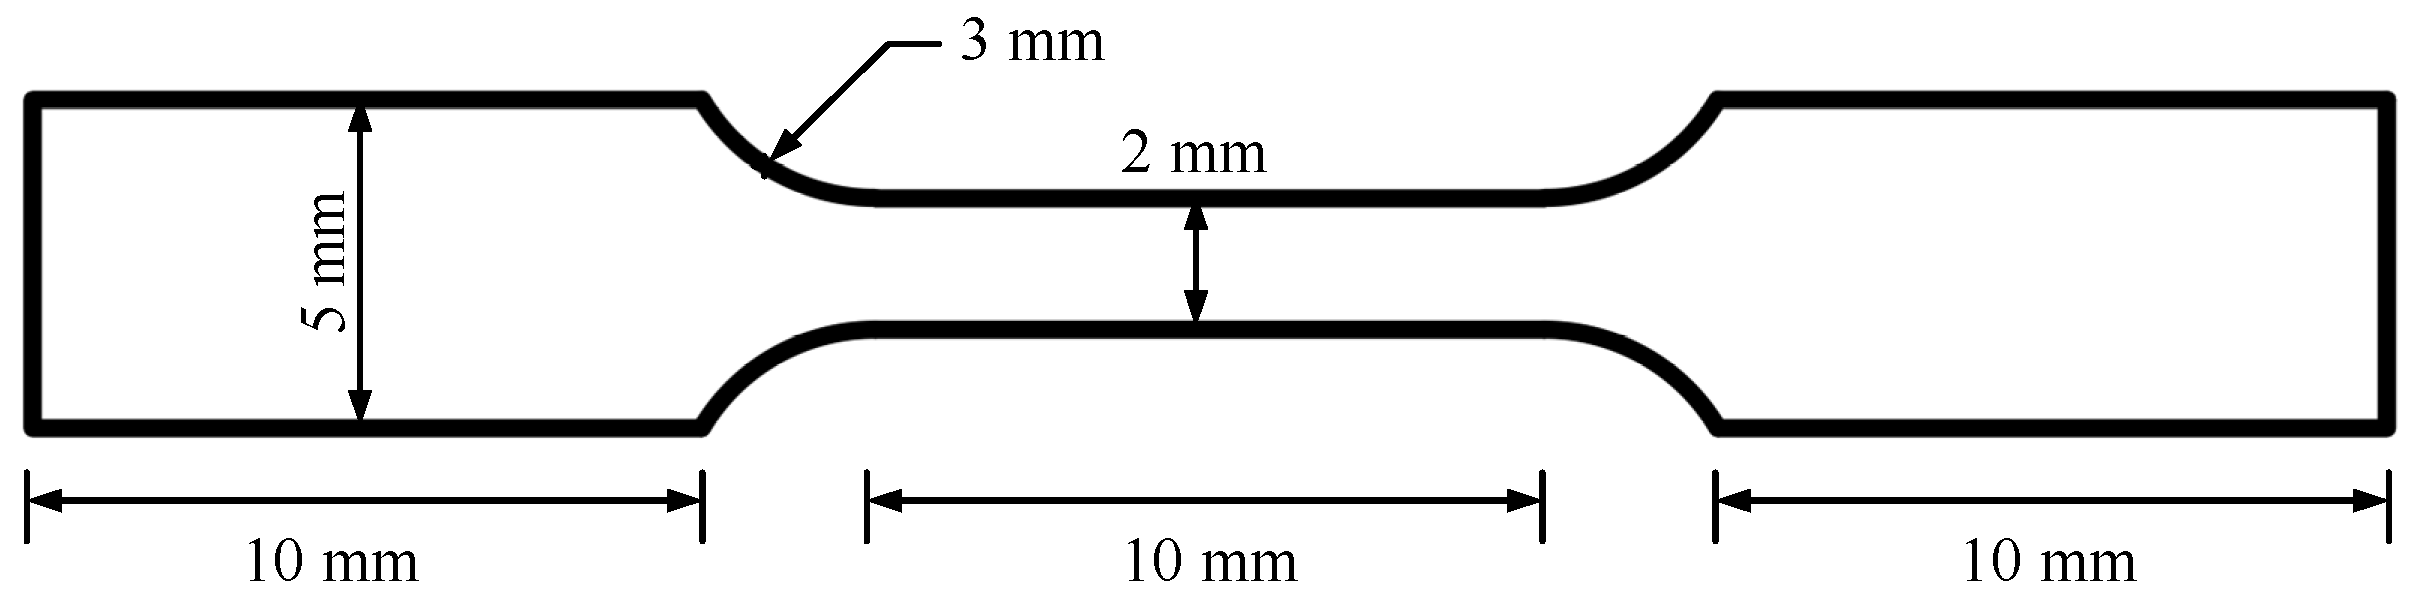
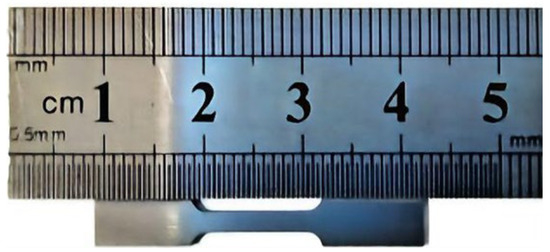
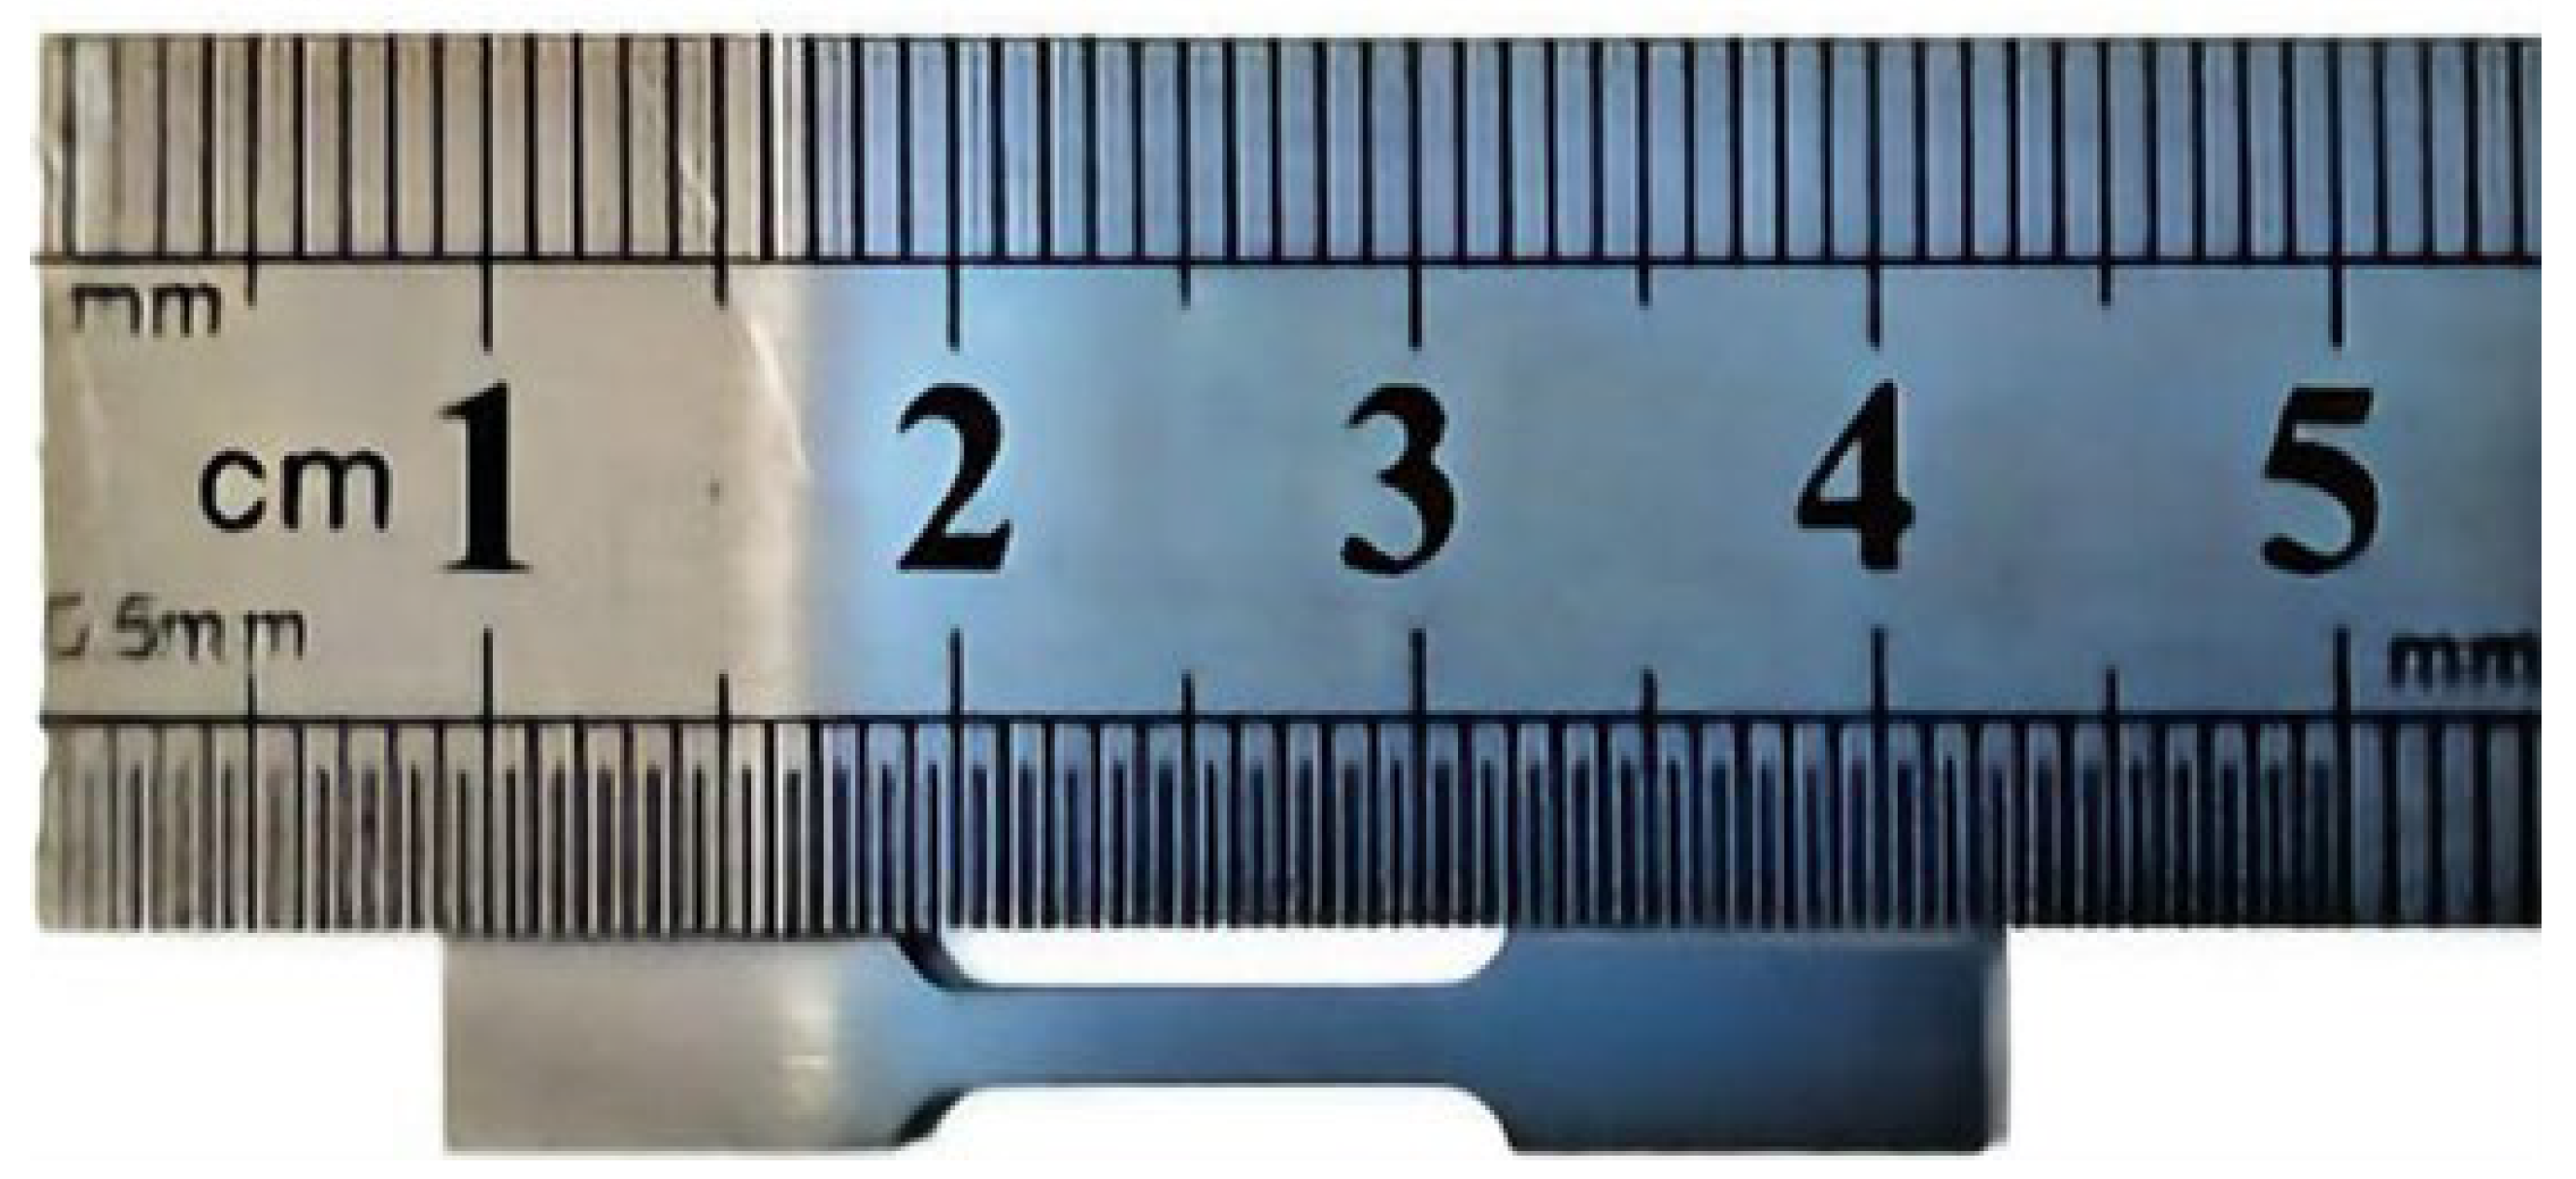
The miniature specimen geometry was selected to fit the narrow weld and HAZ regions and was therefore not a conventional full-size ASTM/ISO tensile specimen. The gauge section was 10 mm long and 2 mm wide, the grip sections were 10 mm long and 5 mm wide, and the specimen thickness was approximately 0.8 mm. The specimen geometry and the machined miniature tensile specimen are shown in Figure 3 and Figure 4, respectively. After slow-wire cutting, surfaces were ground with 400-grit paper, polished with 1500-grit paper, and cleaned. Gauge-section dimensions were measured three times before testing, and the mean dimensions were used in stress calculations. This micro-specimen approach follows the local-zone testing method used in the authors’ earlier work [37]; direct equivalence with a conventional full-size tensile specimen was not separately established in the present study.
Figure 3.
Geometry and dimensions of the miniature tensile specimen.
Figure 4.
Machined miniature tensile specimen.
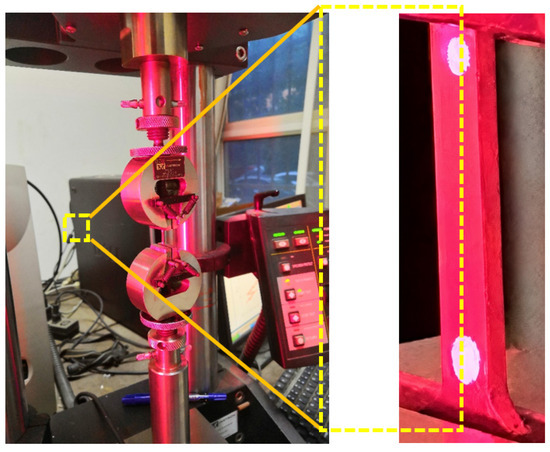
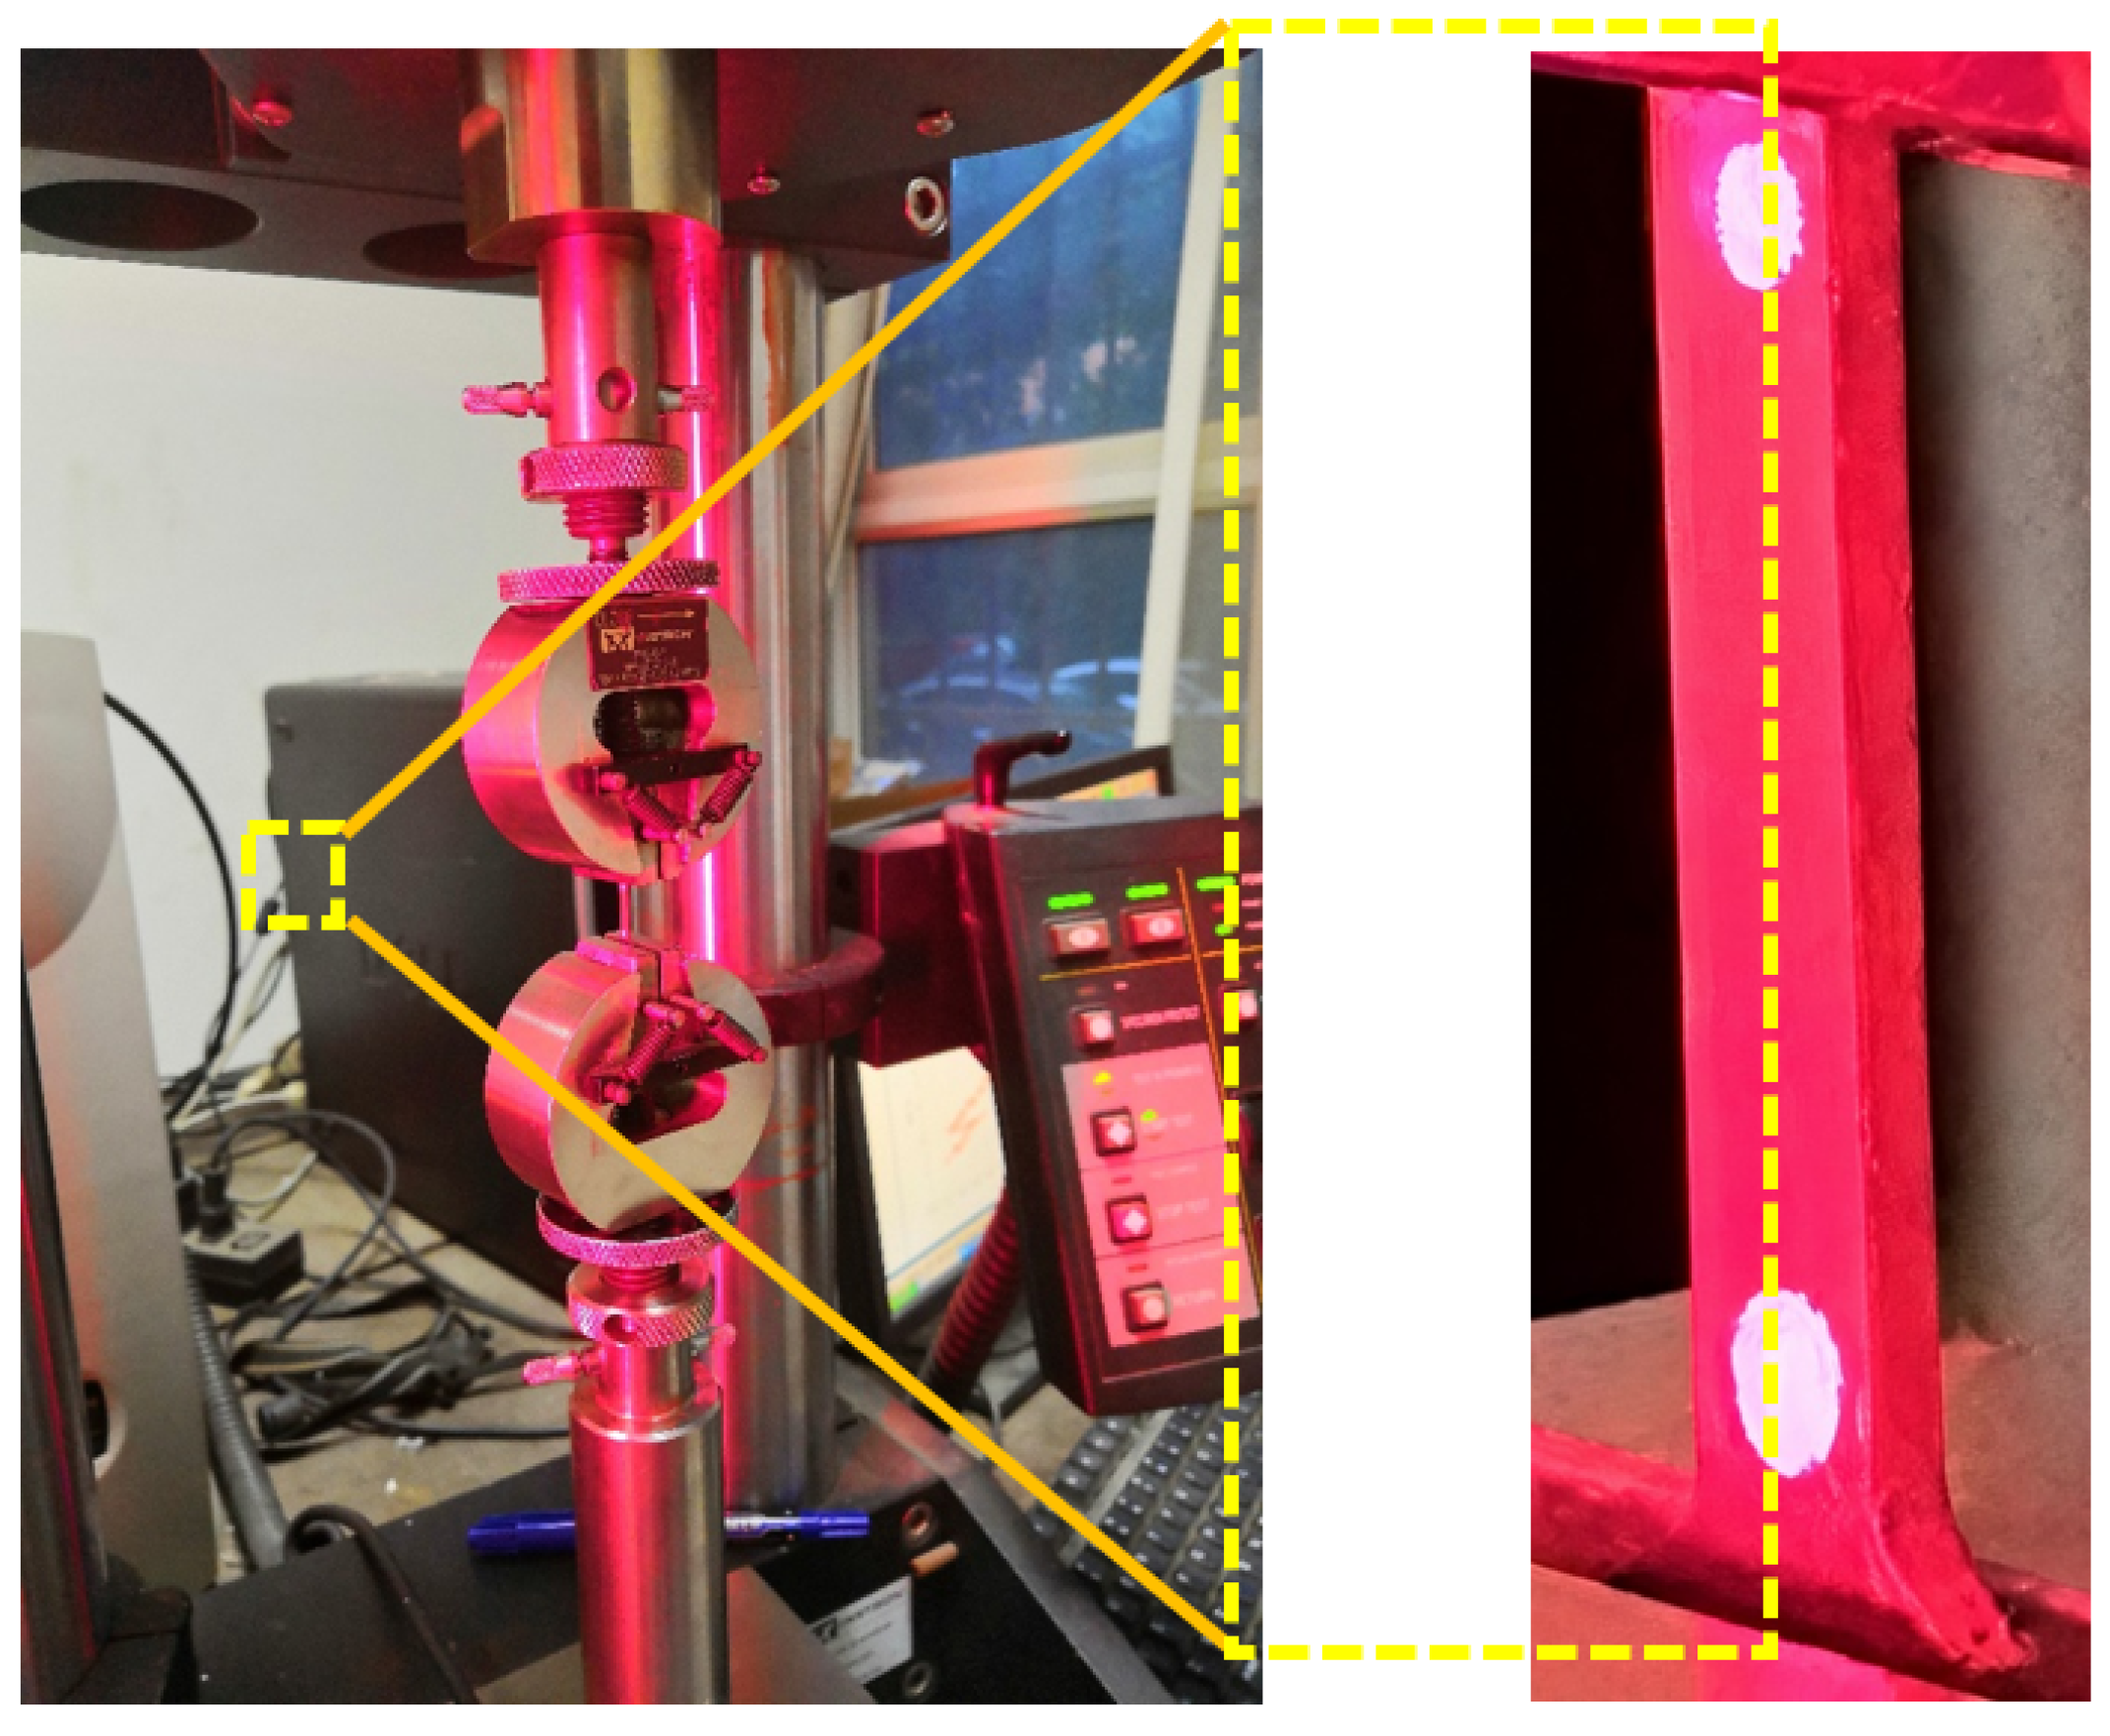
Quasi-static uniaxial tensile tests were performed using an Instron 5848 system (Instron Corporation, Norwood, MA, USA) equipped with a 2000 N load cell at a nominal strain rate of 5 × 10⁻⁴ s−1. Axial strain was measured by the integrated video extensometer tracking two white optical marks on the gauge section. The video extensometer was calibrated before testing; the load signal was zeroed before clamping, and the initial preload was adjusted to less than 10 N. The yield strength reported in this study is the 0.2% proof strength (Rp0.2) as determined by the 0.2% offset method. The enlarged specimen view in Figure 5 shows the optical gauge marks used for strain tracking.
Figure 5.
Experimental details for miniature tensile testing: Instron/video-extensometer setup; enlarged specimen surface showing the optical gauge marks used for strain measurement.
2.3. Local Properties and Statistical Treatment
The material constants used in the baseline FE model are the mean values obtained from the five replicate micro-tensile tests in each representative region and are summarized in Table 2. Scatter is important because these local properties control the subsequent numerical trends. The joint exhibits an overall overmatched weld configuration: the weld metal shows the highest ultimate tensile strength, and its yield strength is higher than that of the X60 side. The yield and ultimate tensile strengths of the X80 HAZ are significantly higher than those of the X60 HAZ. In addition, both HAZs exhibit higher yield and ultimate tensile strengths than their corresponding base metals. The region-specific mean curves are used as deterministic material inputs for the present parametric analyses.
Table 2.
Local mechanical properties obtained from miniature tensile tests.
3. Development of the Finite Element Model
A three-dimensional finite element (FE) model of a SENT specimen containing an unequal-wall-thickness, dissimilar-girth weld was developed. The model consists of the geometric configuration, region-specific constitutive descriptions, mesh discretization, and displacement-controlled boundary conditions. Its applicability was verified by comparison with published SENT test results.
3.1. Geometric Model
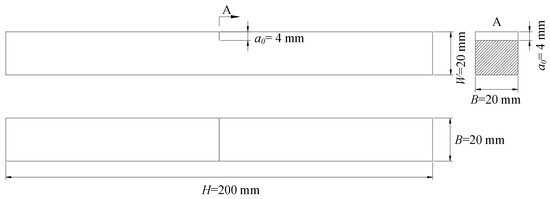
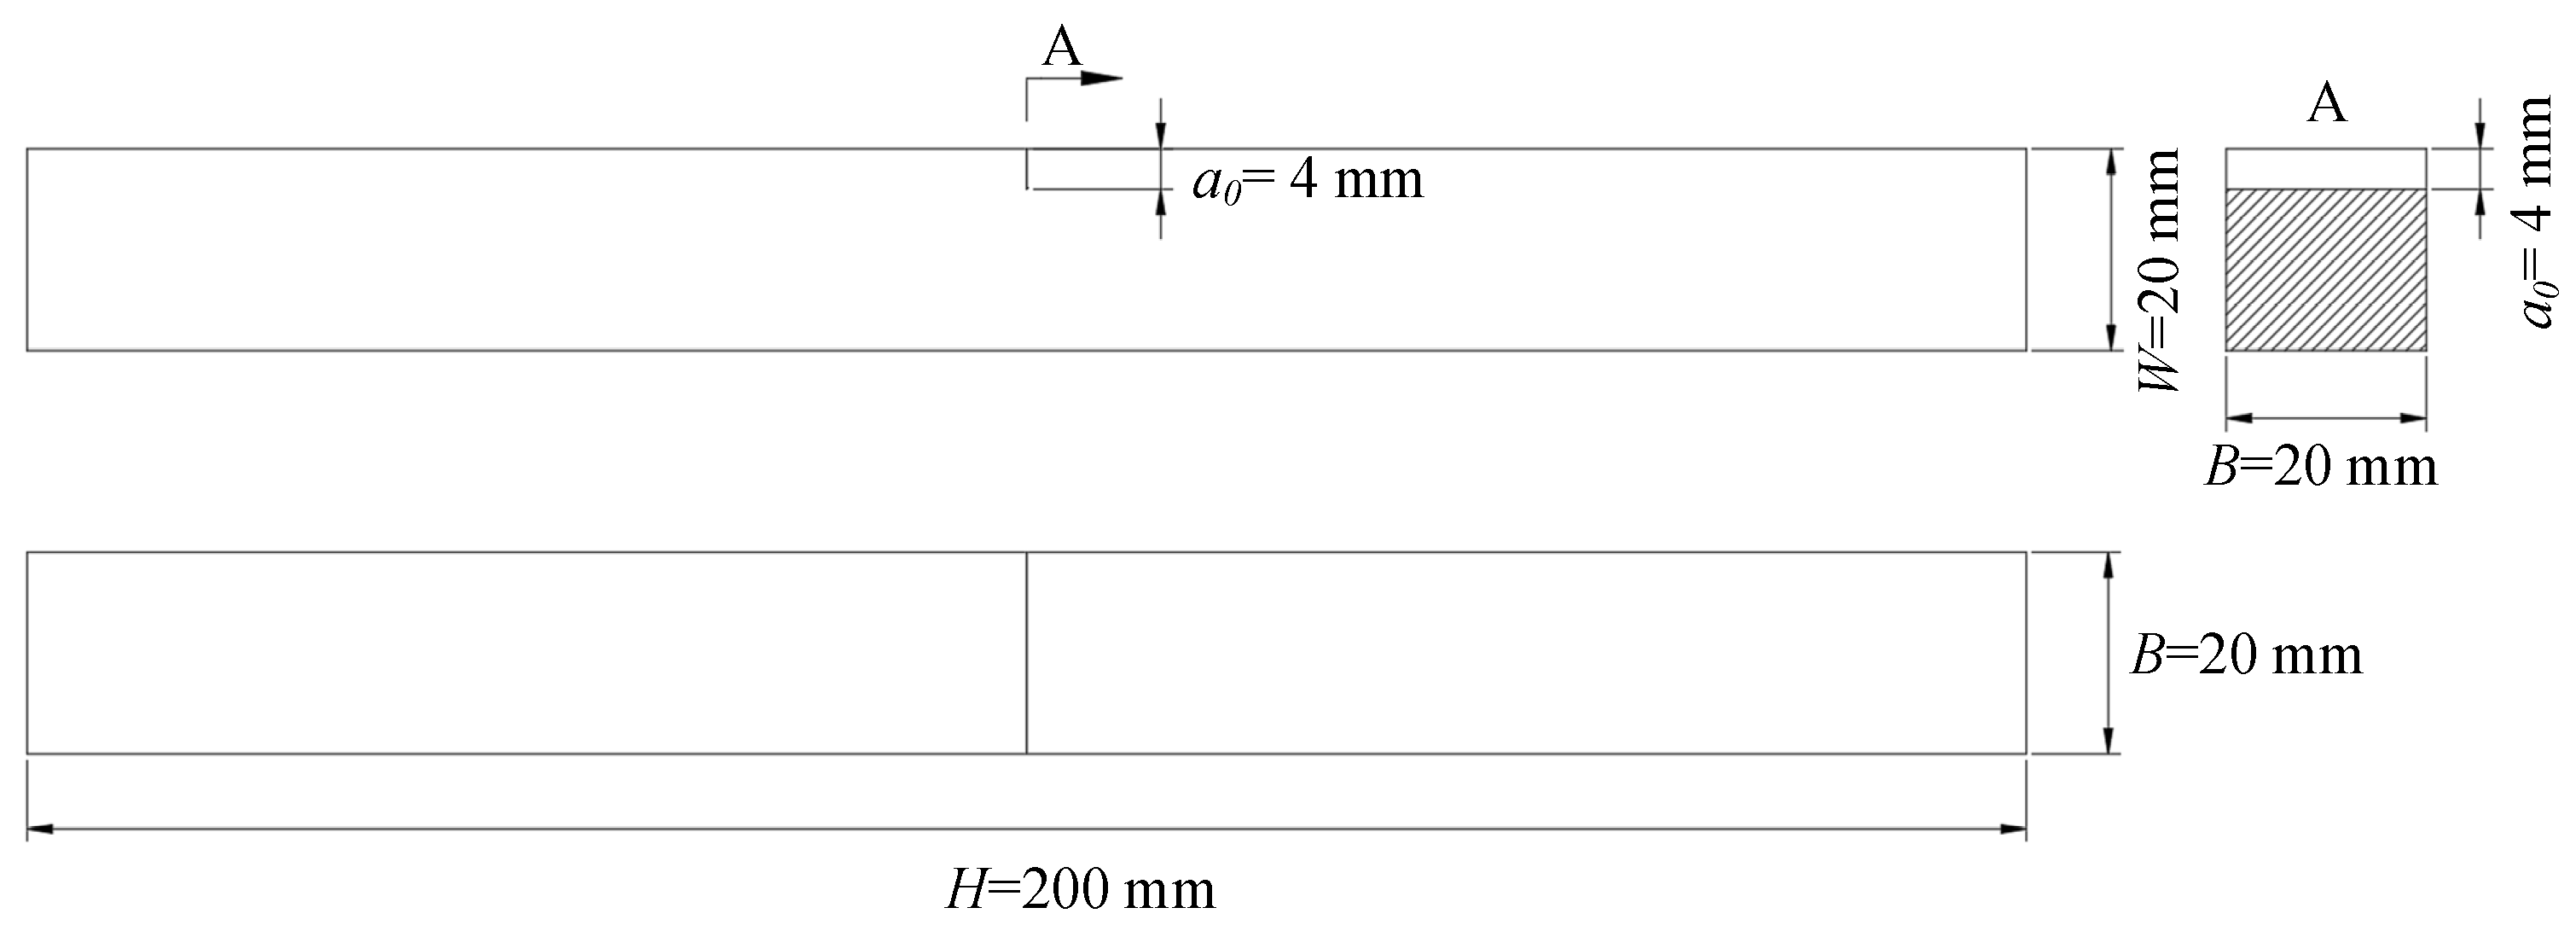
A three-dimensional solid SENT specimen was established with reference to the low-constraint SENT configuration used in BS 8571:2014 and previous pipeline SENT studies [3,4,5,12,13,14,15,16,31]. Unless otherwise stated, the specimen width is W = 20 mm, the specimen thickness is B = 20 mm (B/W = 1), the specimen length is H = 200 mm (H/W = 10), and the initial crack length is a = 4 mm (a0/W = 0.20). The crack was located at the specimen mid-length. The specimen dimensions are shown in Figure 6. These dimensions define a numerical baseline rather than the physical 22 or 33 mm pipe-wall thickness. The source joint connects Φ914 × 33 mm X80 pipe to Φ914 × 22 mm X60 pipe with a 20° transition, but the full pipe-thickness transition and any misalignment are intentionally not reproduced in this SENT model. Fracture toughness/CTOD characterization is a material- and specimen-level property assessment, whereas the complete unequal-wall-thickness geometry governs structural strain demand and should be treated separately in pipe-level integrity models.
Figure 6.
Geometric dimensions of the SENT specimen.
3.2. Constitutive Model
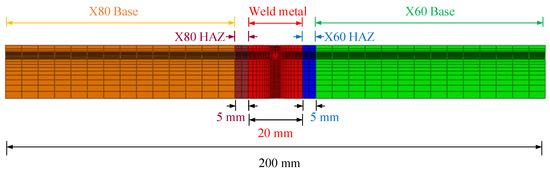
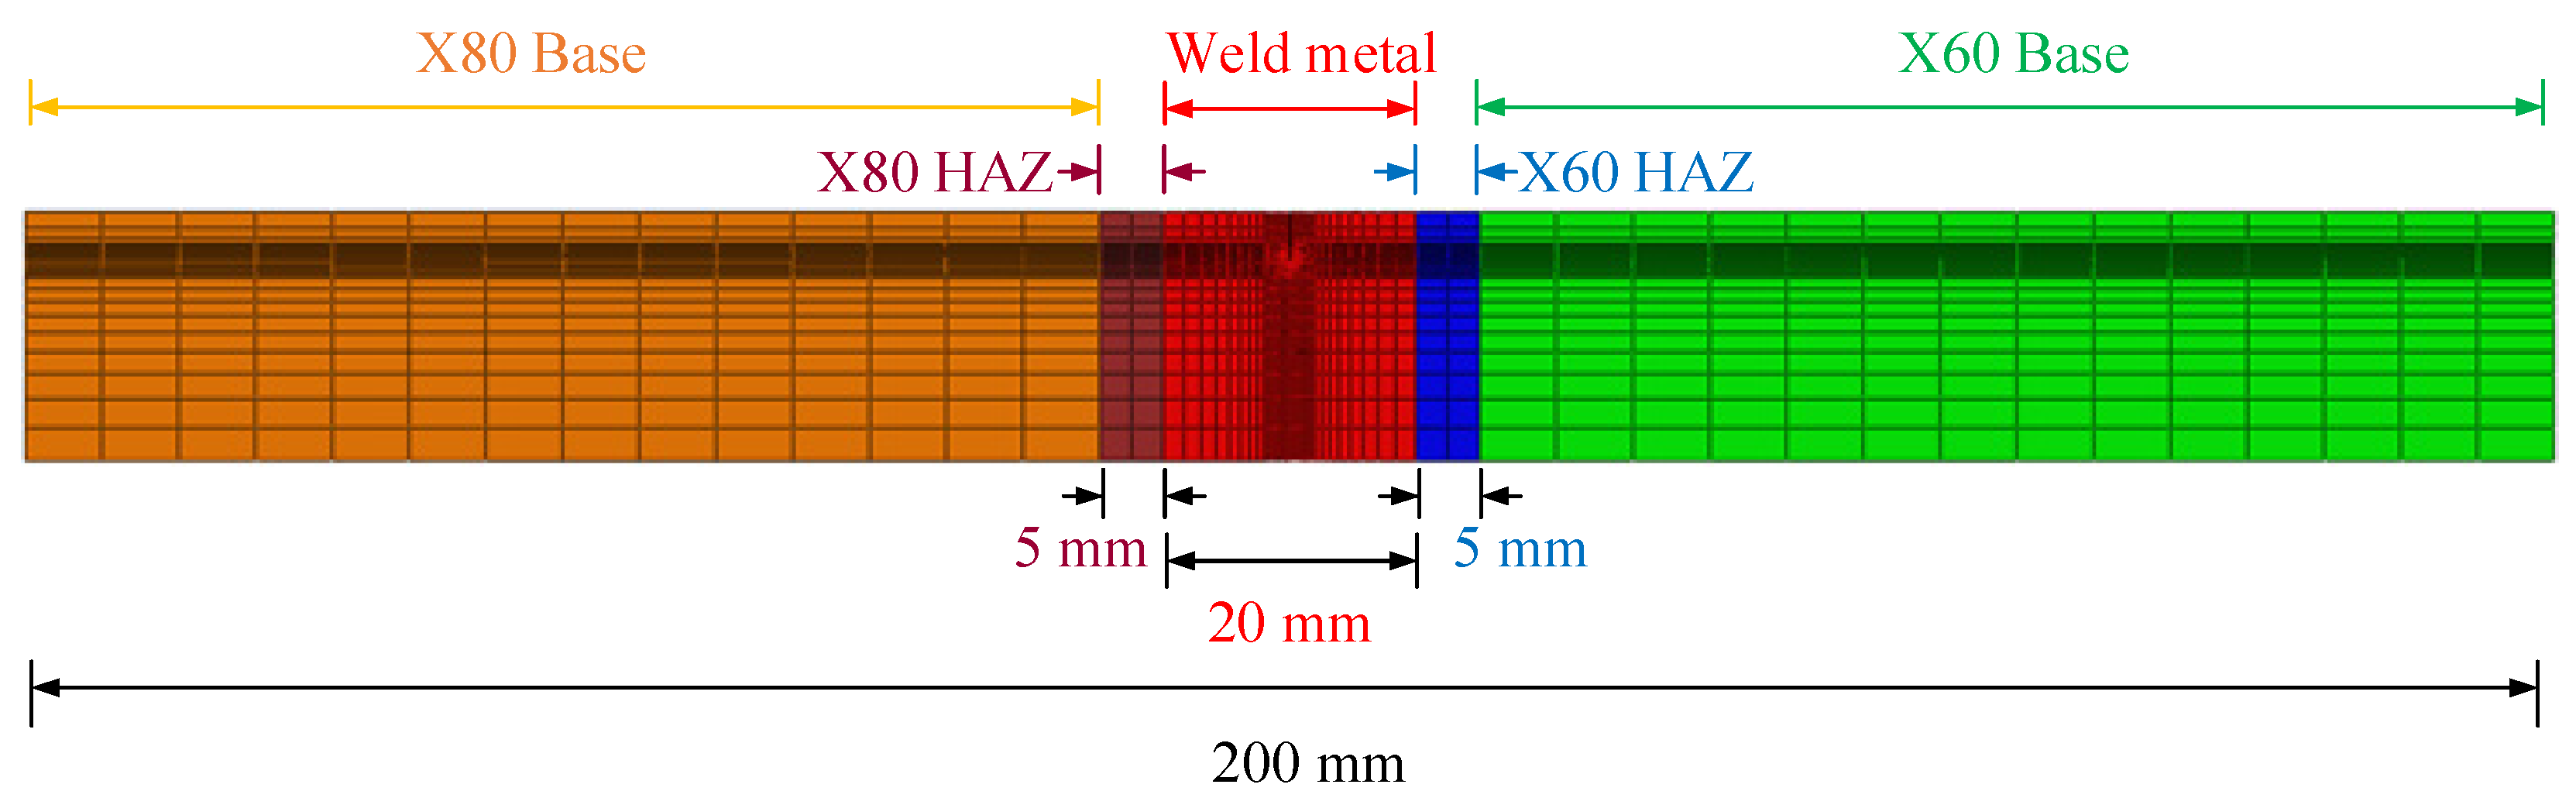
The heterogeneous SENT specimen was partitioned into five material bands: X80 base metal, X80 HAZ, weld metal, X60 HAZ, and X60 base metal. The partitioning of the five material regions is shown in Figure 7. The baseline weld width of 20 mm and HAZ width of 5 mm on each side were selected as representative idealized dimensions for the parameter study, not as an assertion that the real fusion/HAZ boundaries are perfectly straight. Their suitability is examined explicitly by varying the weld width from 10 to 30 mm and the HAZ width from 1 to 9 mm. The actual weld macrostructure is curved/keyhole-like, whereas straight interfaces are used here to isolate material and width effects. This idealization and the fact that local properties can vary continuously within an HAZ are acknowledged as model limitations.
Figure 7.
Partitioning of the X80 base metal, X80 HAZ, weld metal, X60 HAZ, and X60 base metal in the heterogeneous SENT model.
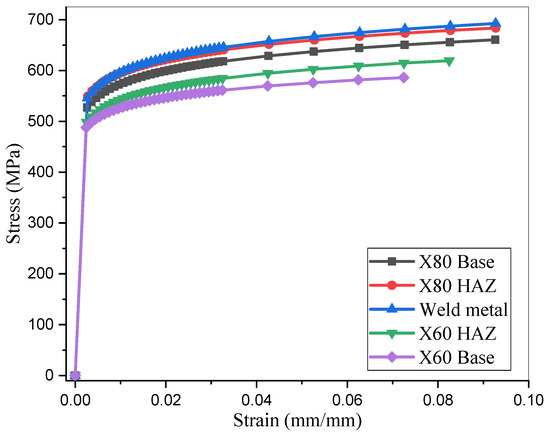
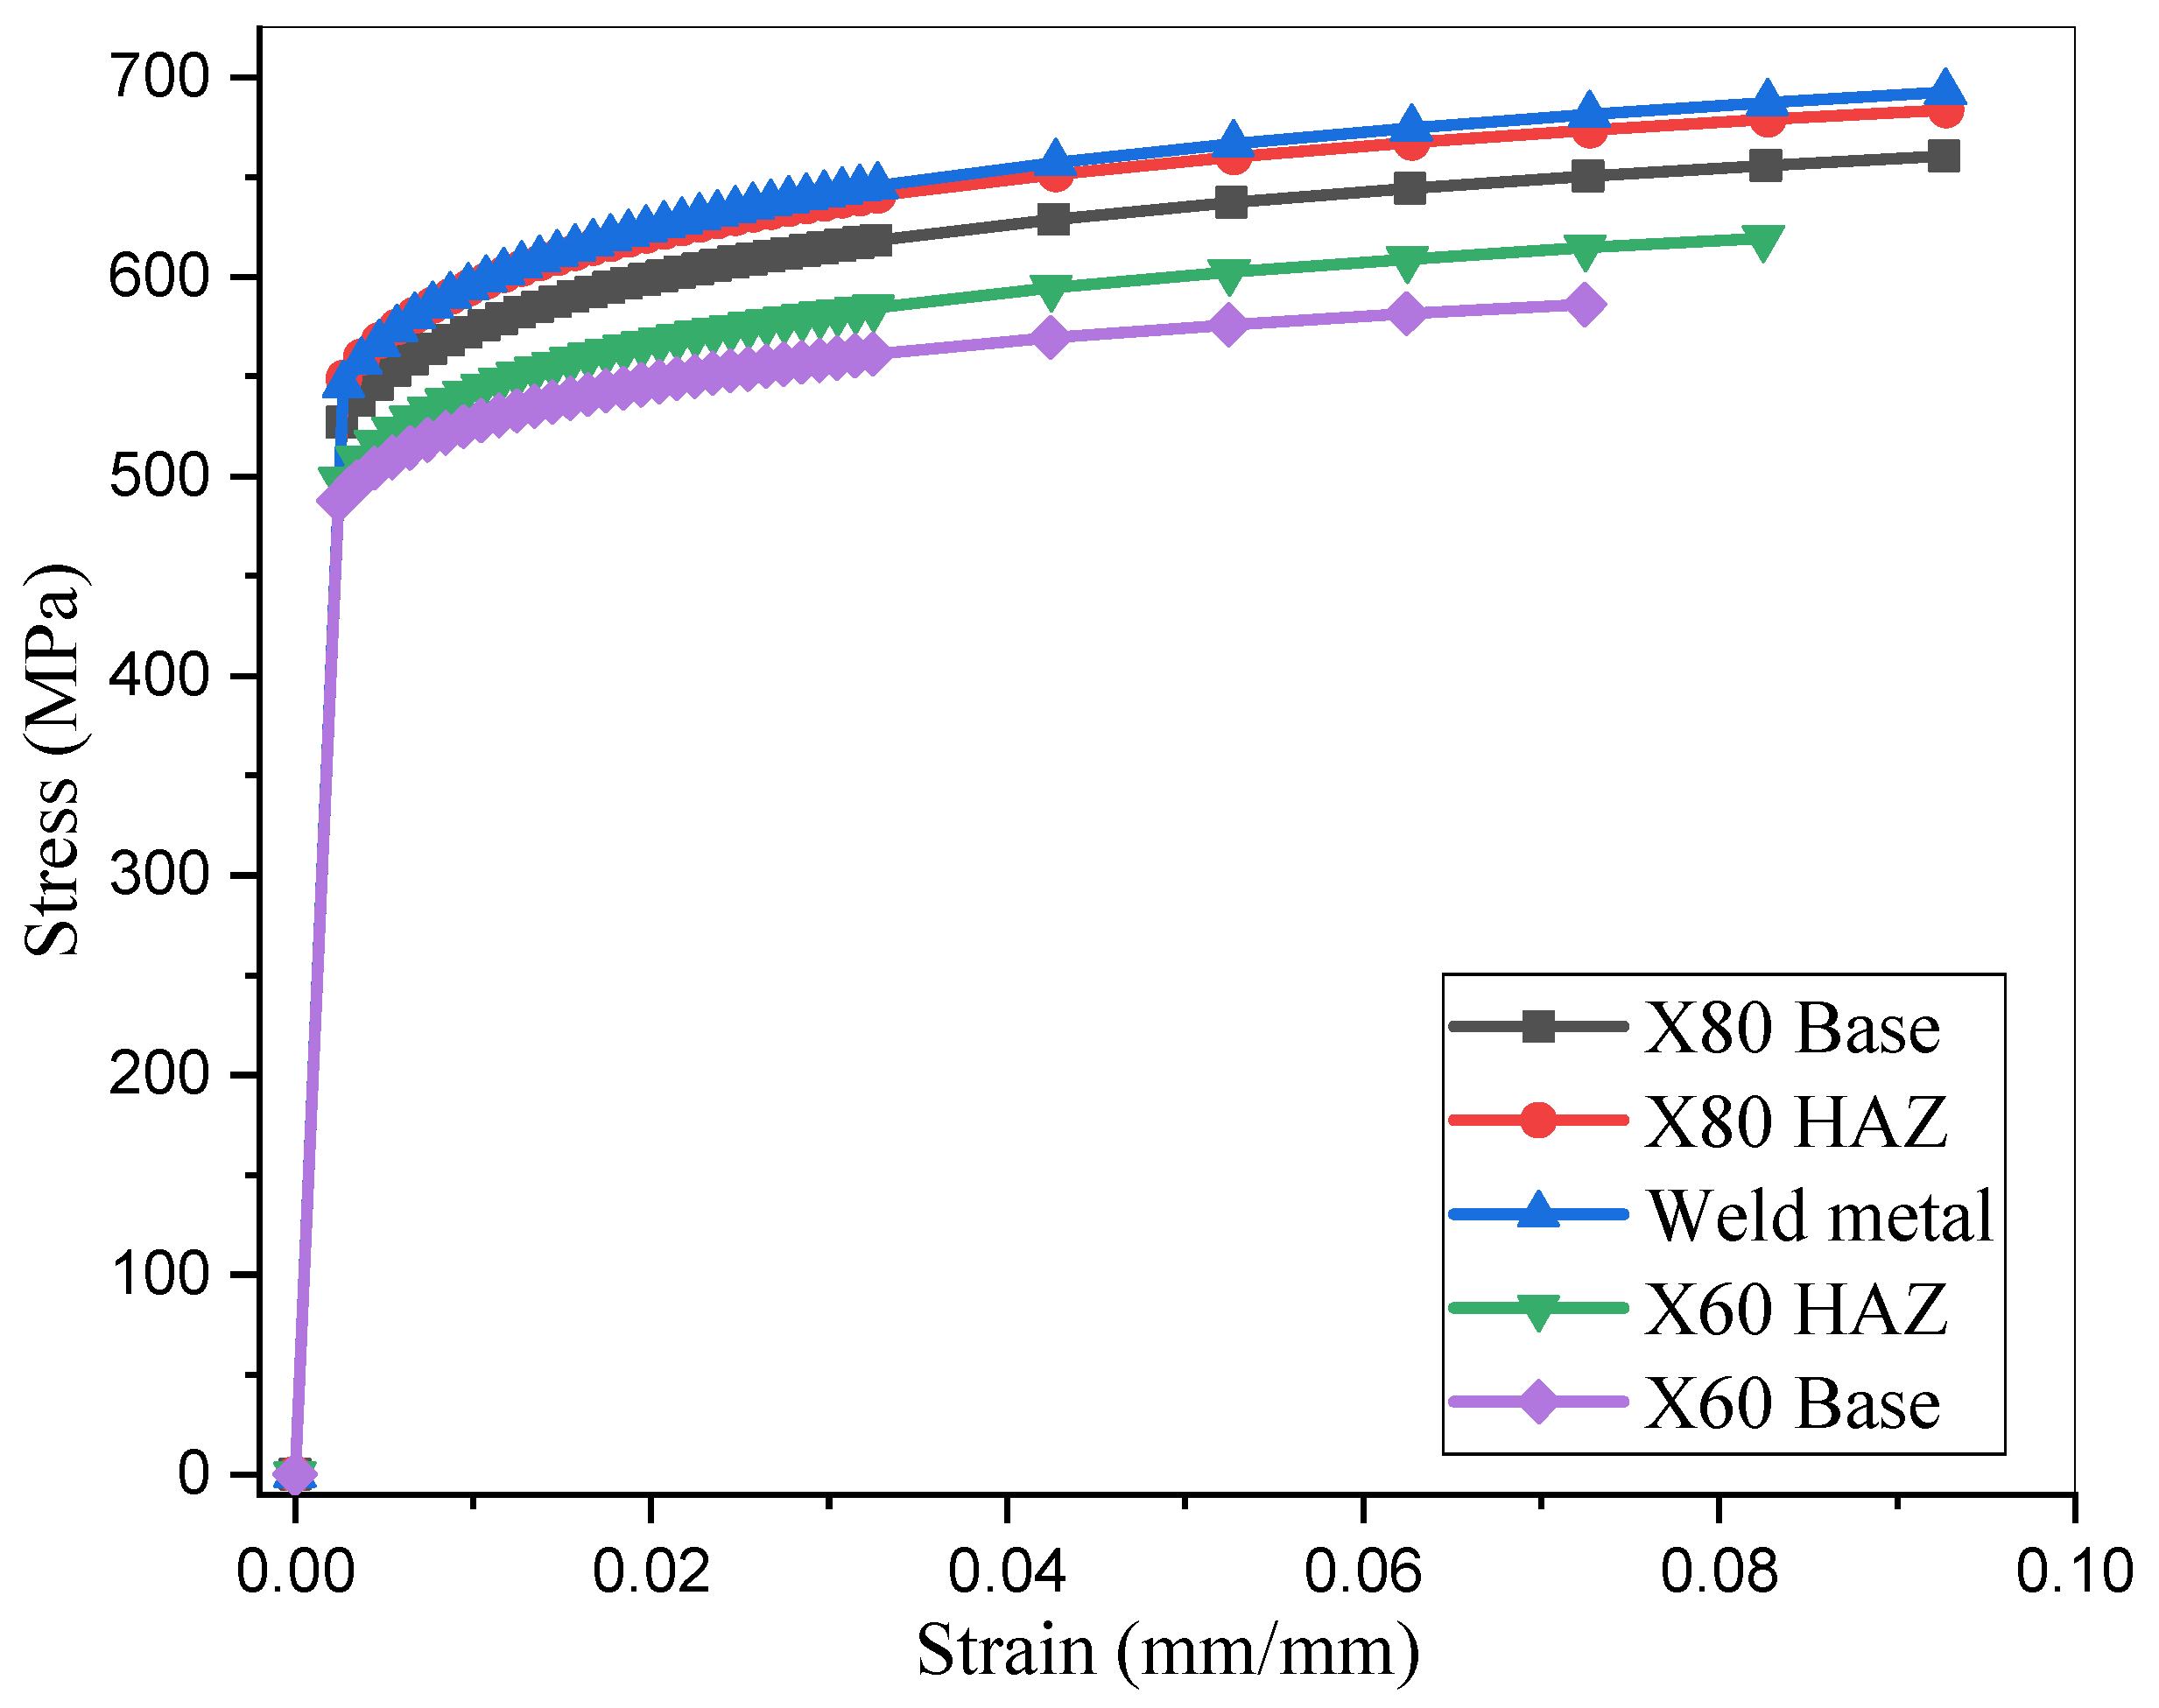
The tensile curves measured in Section 2 were used to define the true stress–strain behavior of each material region in the dissimilar-girth weld. The true stress–strain curves adopted in the FE analysis are shown in Figure 8.
Figure 8.
True stress–strain curves of the five characteristic regions in the girth welded joint.
For the parametric analyses, the material behavior was described by a power-law hardening relationship, as expressed in Equation (1).
In Equation (1), σf is the flow stress, σ0 is the 0.2% proof/yield stress used in the constitutive idealization, is the equivalent plastic strain, and ε0 = σ0/E is the reference yield strain. The exponent is 1/n. Accordingly, n is reported here as a hardening parameter: increasing n reduces the 1/n exponent and therefore gives a lower strain-hardening rate. No damage-initiation or damage-evolution law is included in the present model. The crack is stationary, and the calculations quantify CTOD and near-tip deformation before explicit ductile tearing; simulation of crack extension and a CTOD-R/J-R curve would require an additional damage/tearing formulation and associated calibration, which are outside the present scope.
3.3. Mesh Configuration
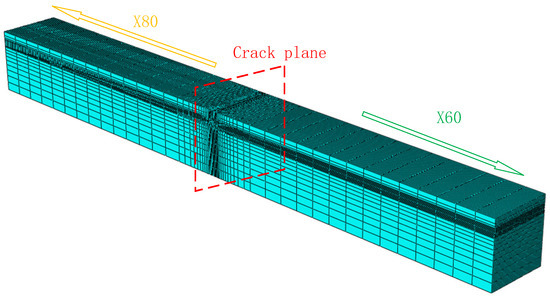
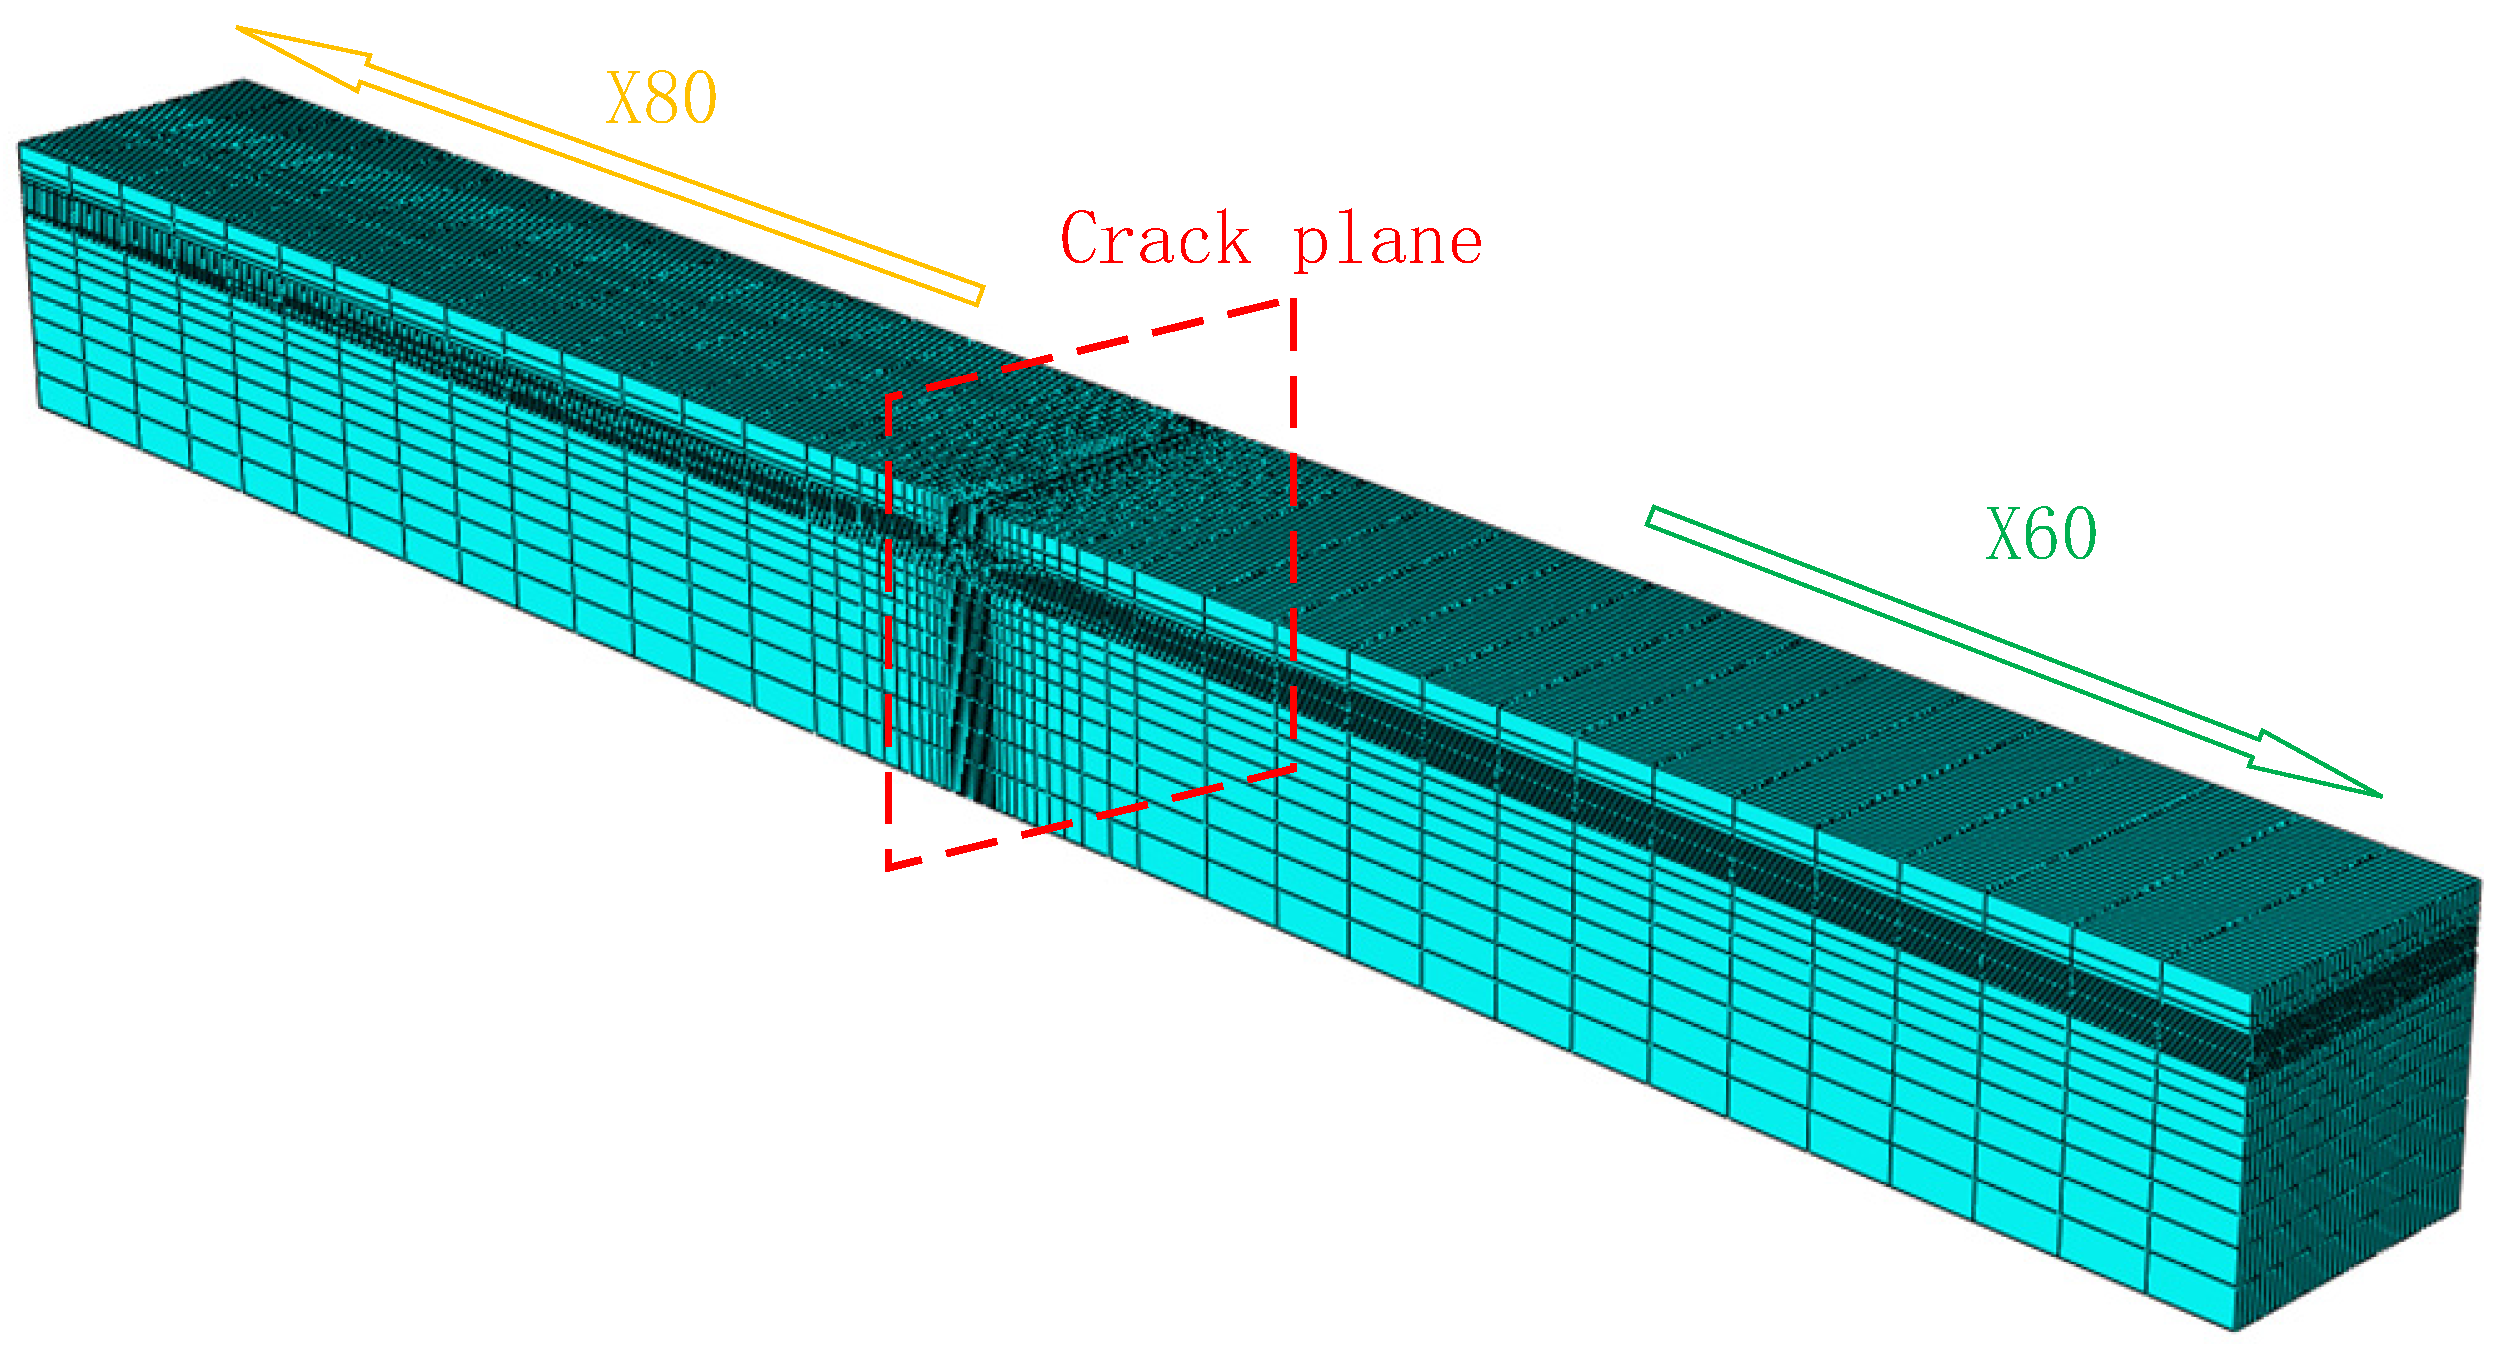
All FE calculations were performed with ABAQUS 6.14 using ABAQUS/Standard. Twenty-node quadratic hexahedral C3D20 elements (full integration) were used throughout the model, with a Poisson ratio of ν = 0.30 for all regions. Geometric nonlinearity was activated (NLGEOM = ON), and the quasi-static solution used automatic increment control. The complete heterogeneous SENT geometry was modeled. A structured refined mesh was used near the crack and gradually transitioned to a coarser remote mesh. Forty elements were assigned through the thickness; along the specimen width, 55 elements were used near the crack and gradually reduced to 26 toward the remote side. The minimum and maximum element sizes near the crack plane were approximately 0.1 and 2 mm, respectively, and the remote element size was approximately 6 mm. The resulting baseline model contained about 86,000 elements. The global mesh is shown in Figure 9. For each initial crack-length ratio (a0/W), the crack front was repositioned by remeshing the ligament while retaining the same structured crack-tip topology, a 0.02 mm baseline tip size, through-thickness discretization, and remote-mesh transition so that crack-length effects were not confounded by a different local mesh strategy.
Figure 9.
Overall mesh of the SENT specimen.
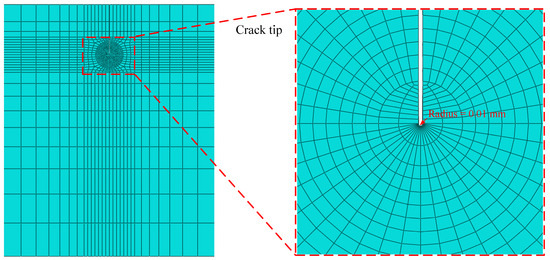
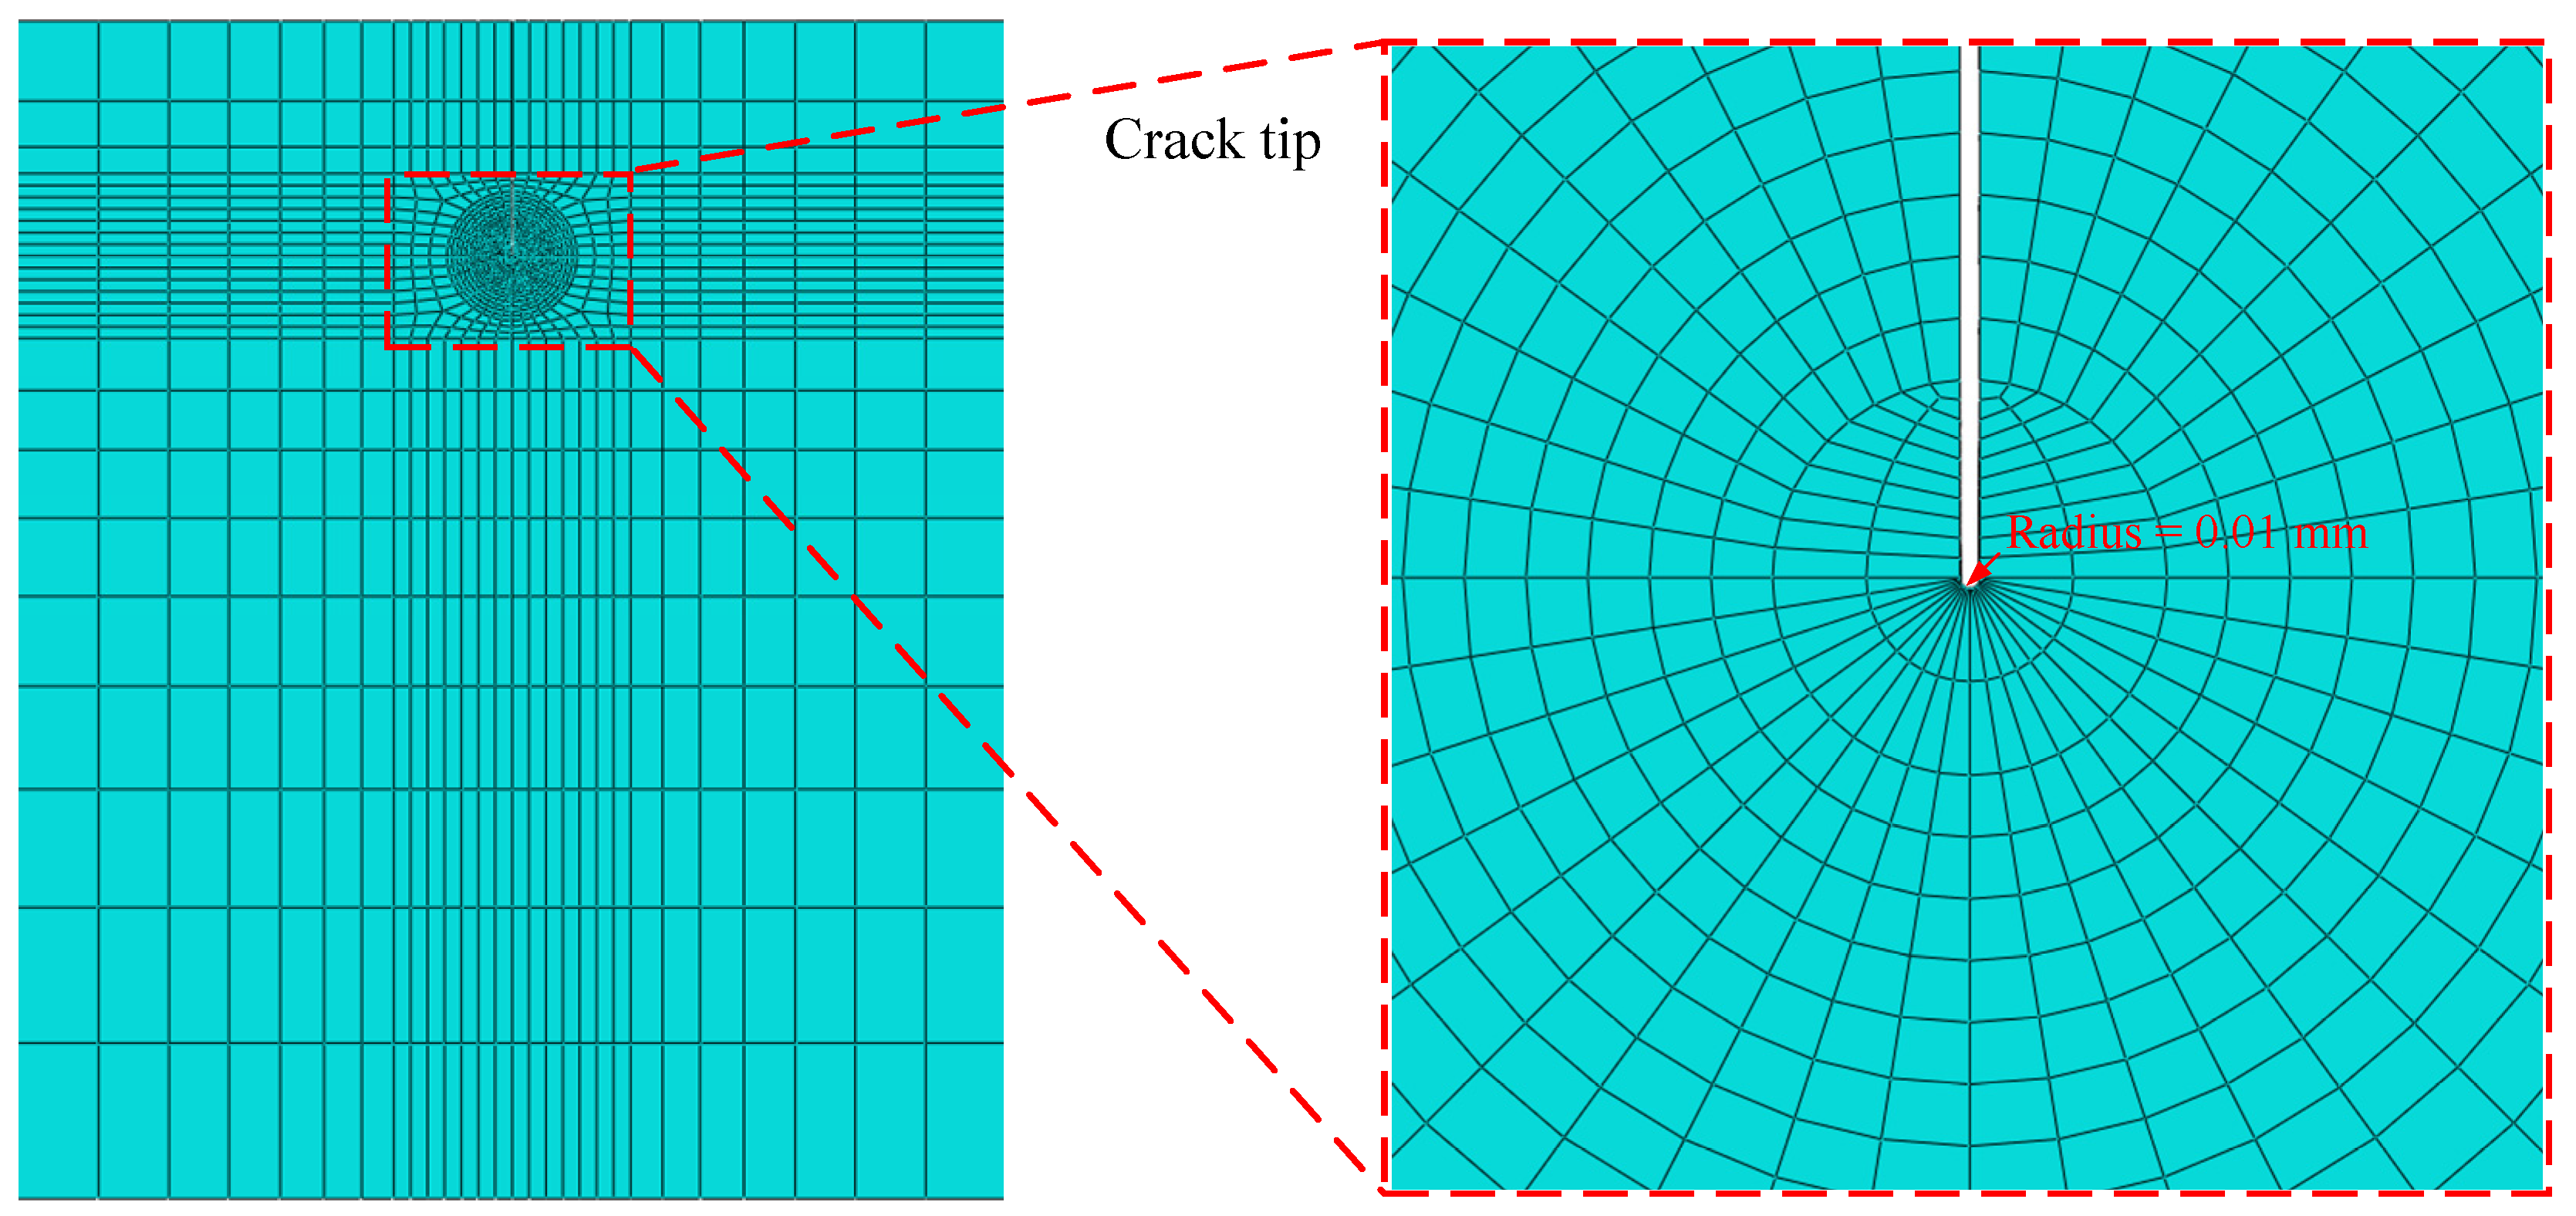
For fracture analysis, a structured spider-web crack-tip mesh was used with 40 elements distributed around the crack-tip circumference. The local element size ranged from approximately 0.02 to 0.1 mm, and a rounded crack-tip notch with a radius of 0.01 mm was introduced to capture crack-tip blunting behavior, following the approach proposed by Østby et al. [38,39,40]. The crack-tip mesh is shown in Figure 10. C3D20 elements were maintained in the refined region. The 0.02 mm baseline size was selected from the existing local mesh study because further refinement to 0.01 mm produced only a small change in the previously monitored near-tip response while substantially increasing computational cost.
Figure 10.
Local mesh around the crack tip.
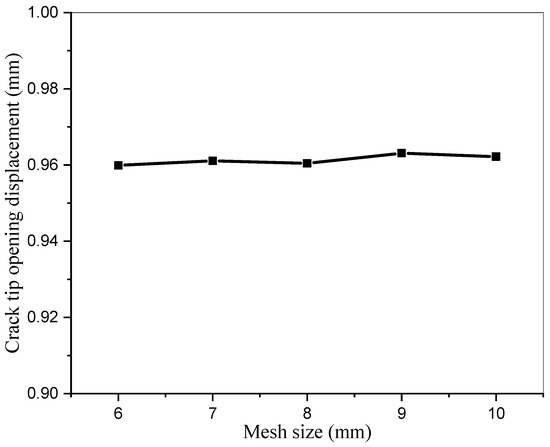
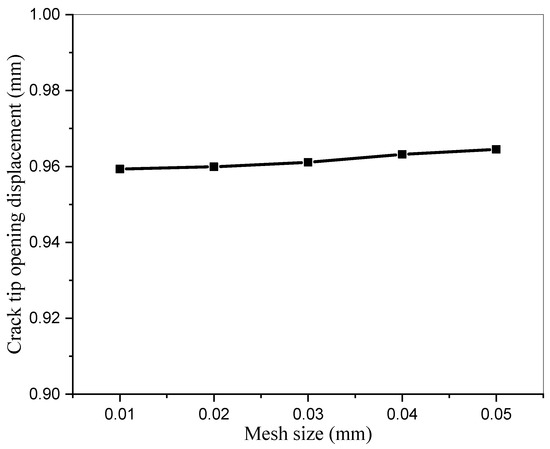
Mesh-convergence analyses were performed for both the global specimen mesh and the local crack-tip mesh. For the global mesh, element sizes of 6, 7, 8, 9, and 10 mm were examined along the specimen length, and the CTOD at the same tensile displacement was compared, as shown in Figure 11. The CTOD remained nearly unchanged with mesh size. For the crack-tip mesh, local element sizes of 0.01, 0.02, 0.03, 0.04, and 0.05 mm were tested in the crack-extension direction. The CTOD at a point 1 mm ahead of the crack tip was extracted at the same tensile displacement (Figure 12). The CTOD was also insensitive to the local mesh size. Therefore, a global element size of 6 mm along the specimen length and a crack-tip element size of 0.02 mm were selected for the subsequent analyses.
Figure 11.
Global mesh-convergence analysis based on CTOD.
Figure 12.
Preliminary local mesh-convergence check based on CTOD.
3.4. Boundary Conditions and Loading
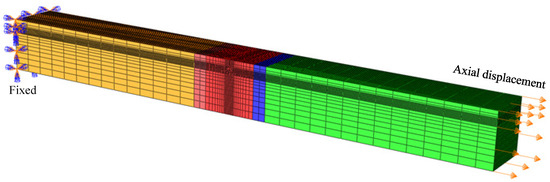
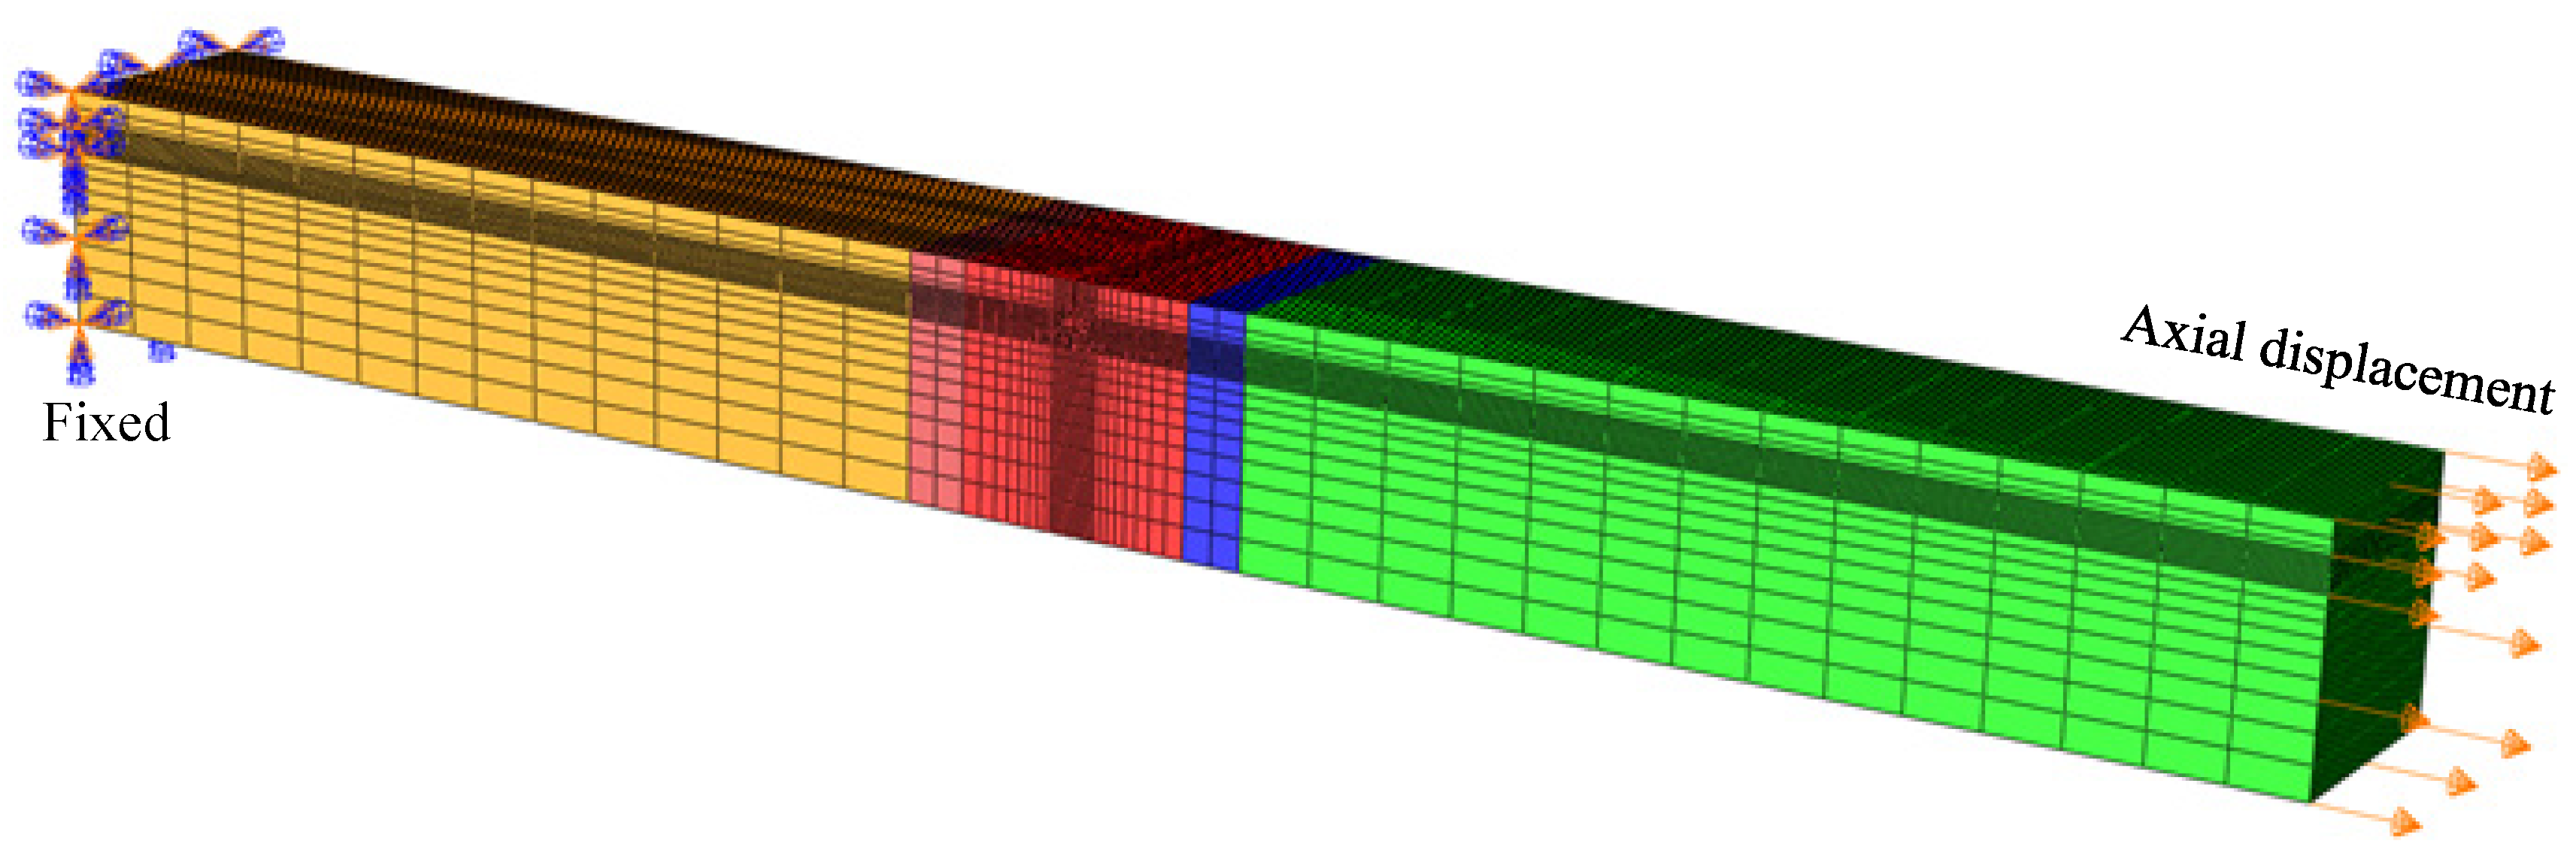
The SENT specimen was analyzed in a quasi-static implicit step under displacement control. One end was fully constrained, and an axial displacement was prescribed at the opposite end. Geometric large-deformation effects were included (NLGEOM = ON), and ABAQUS automatic time-increment control was used to advance the solution while satisfying the program’s equilibrium iterations. The loading and boundary conditions are illustrated in Figure 13.
Figure 13.
Boundary conditions and displacement-controlled loading applied to the SENT specimen.
3.5. CTOD Evaluation
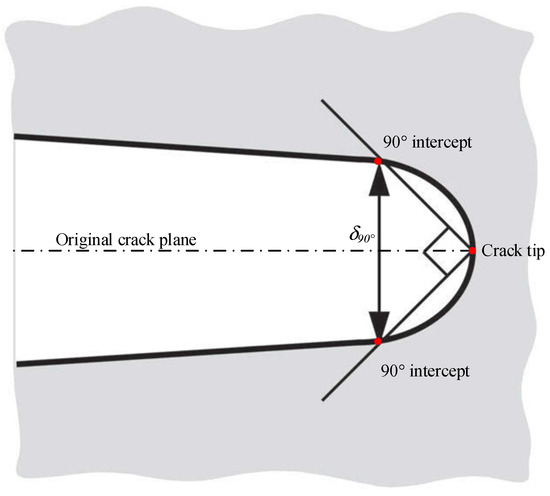
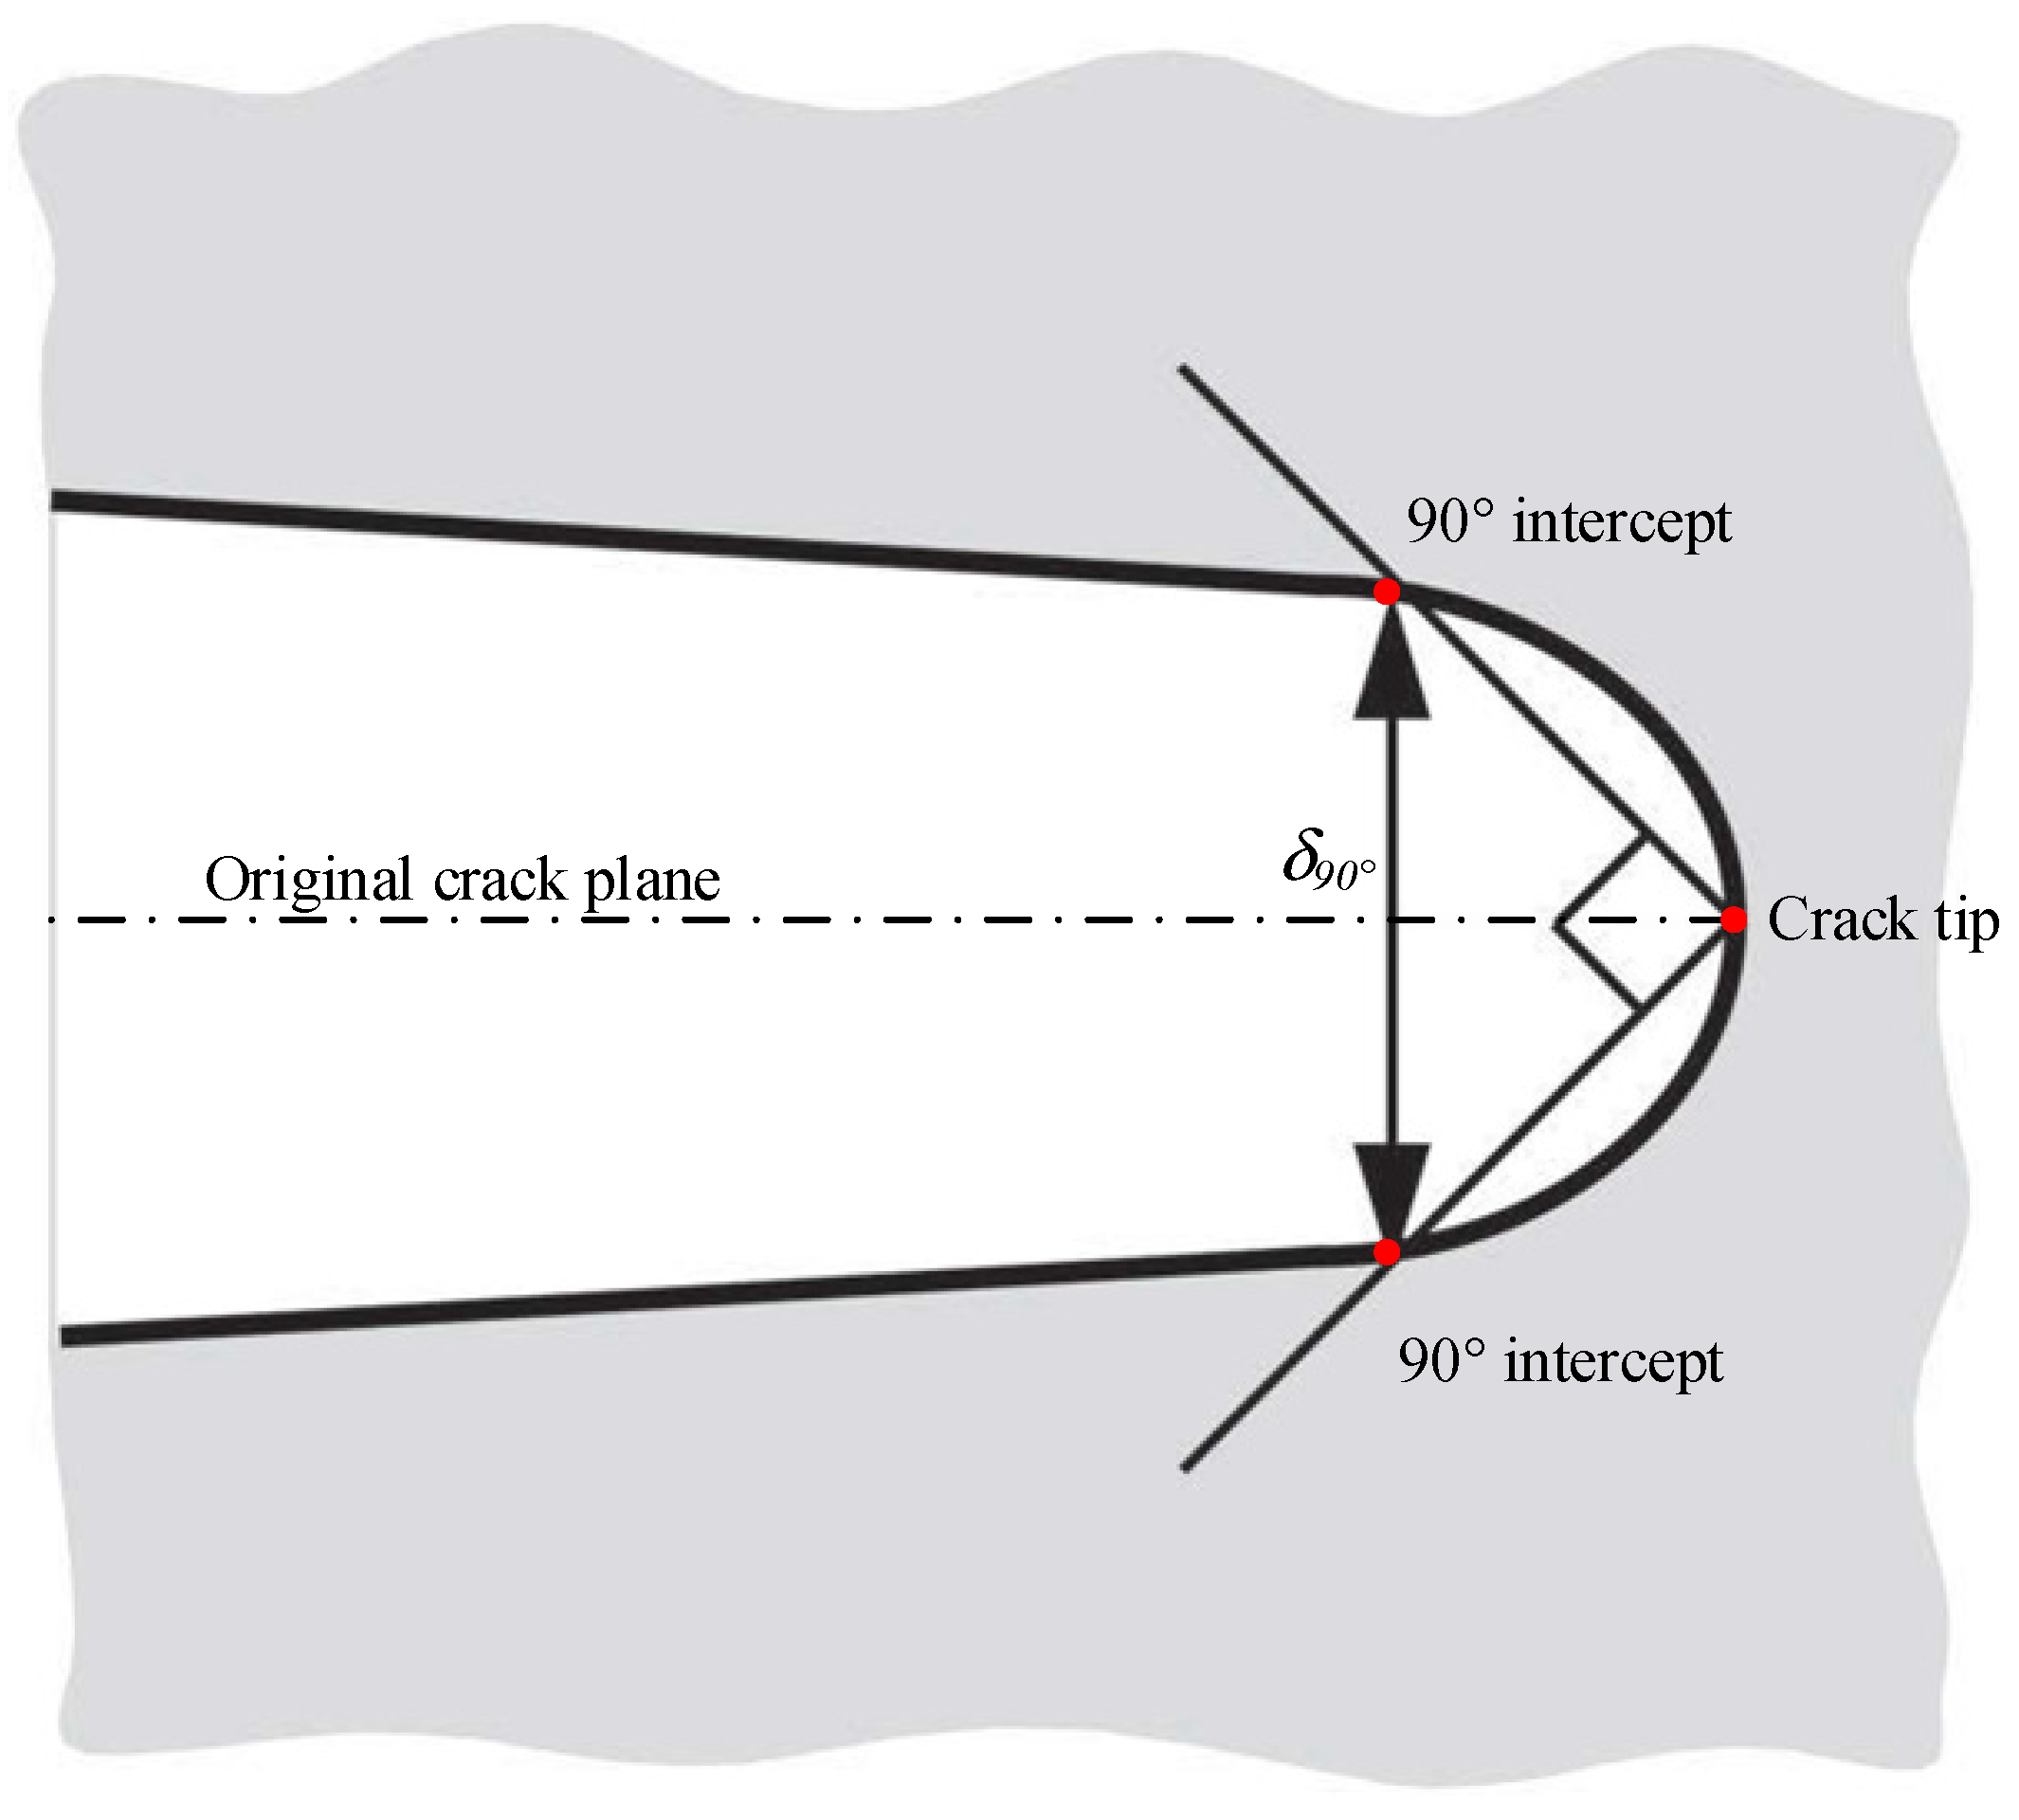
The crack-tip opening displacement (CTOD) was adopted as the principal fracture-response parameter for the subsequent parametric analyses. In the present study, CTOD was determined using the 90-intercept method suggested by Rice [41]. According to this definition, CTOD is denoted as δ90°. In the deformed crack-tip configuration, two straight lines forming an included angle of 90° are constructed, with their vertex located at the crack tip. The intersections between these lines and the two crack flanks are identified, and the distance between the two intersection points is defined as δ90°. Therefore, the CTOD measurement points are determined geometrically by the 90-intercept construction rather than by prescribing an arbitrary fixed distance behind the crack tip. A schematic illustration of the δ90° definition is shown in Figure 14.
Figure 14.
Schematic definition of CTOD using the δ90° 90-intercept method.
Because the present SENT model is three-dimensional, the CTOD may vary along the crack front, owing to the difference in out-of-plane constraint between the free surface and the specimen interior. To ensure a consistent comparison among all numerical cases, the CTOD reported in this study was extracted at the mid-thickness position along the SENT crack front, corresponding to B/2. Thus, all CTOD values presented in the following sections represent the mid-thickness CTOD rather than the free-surface value, maximum value, median value, or a through-thickness averaged value. The same δ90° definition and mid-thickness extraction position were consistently applied to all specimen geometries, crack-length ratios, weld/HAZ dimensions, and material-strength combinations investigated in this study.
3.6. Model Validation
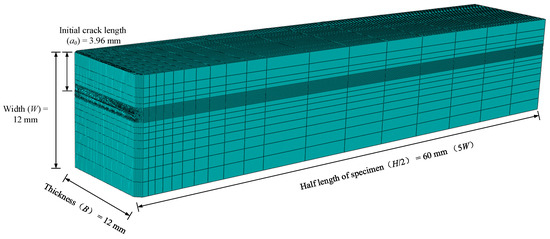
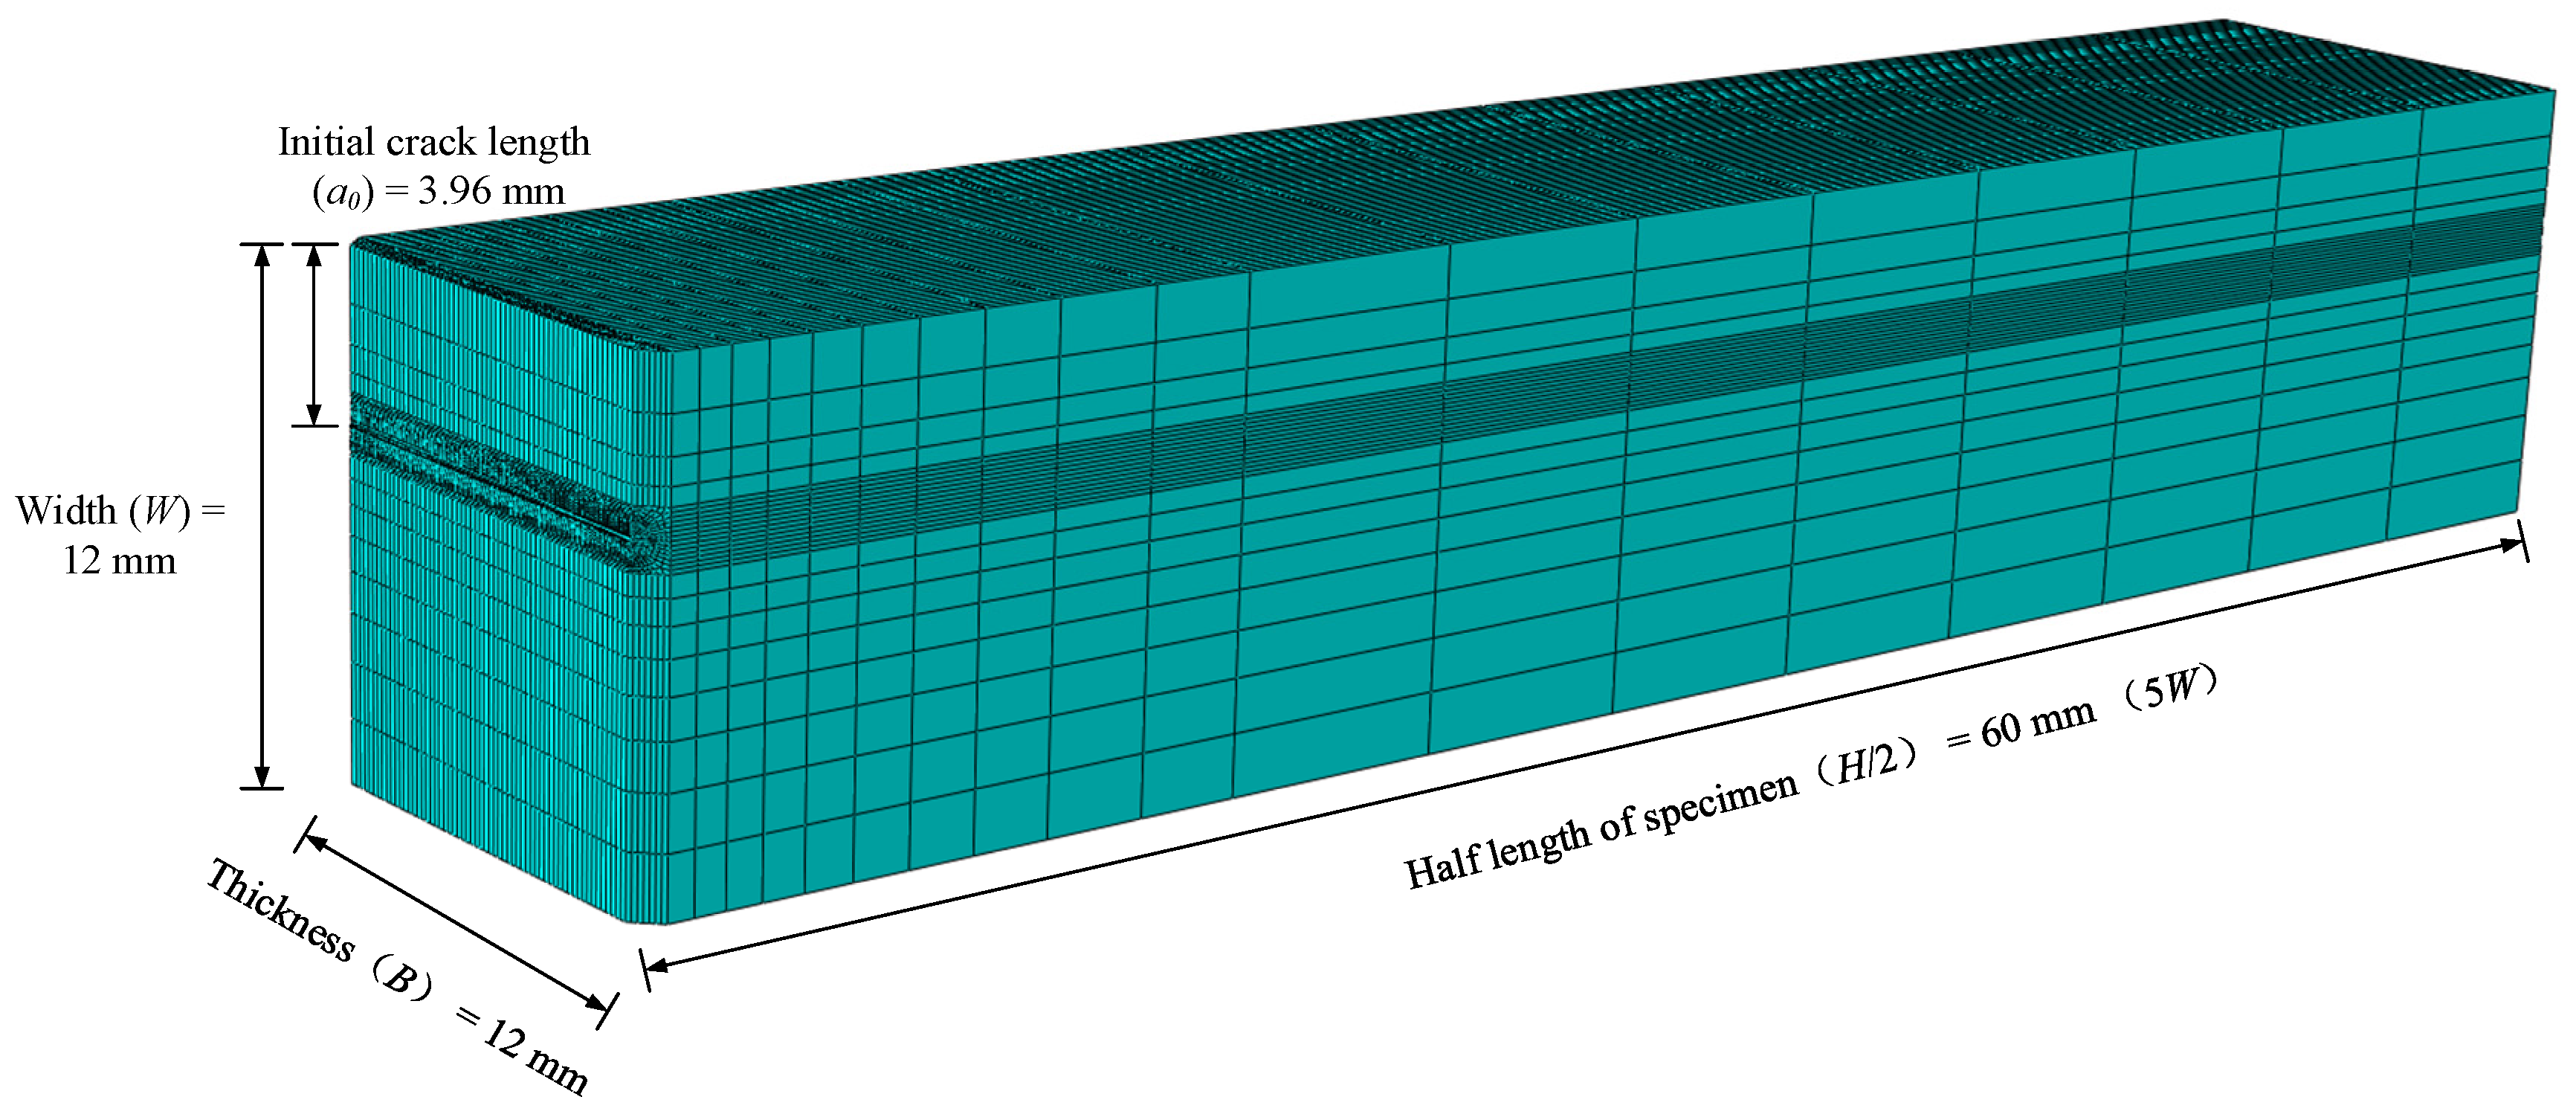
Because no direct SENT fracture-toughness tests have yet been completed for the present X80-X60 target joint, the numerical implementation was verified against the published X42 SENT tests of Ameli et al. [42]. The verification model reproduced the reported specimen dimensions and material input (W = B = 12 mm, H = 120 mm, a0 = 3.96 mm, and a0/W = 0.33) and used the same modeling strategy as the parametric model. The validation model is shown in Figure 15. This comparison is intended to verify the SENT FE procedure and force-CMOD response; it is not presented as direct experimental validation of the heterogeneous X80-X60 joint.
Figure 15.
FE model used for validation against published SENT test data.
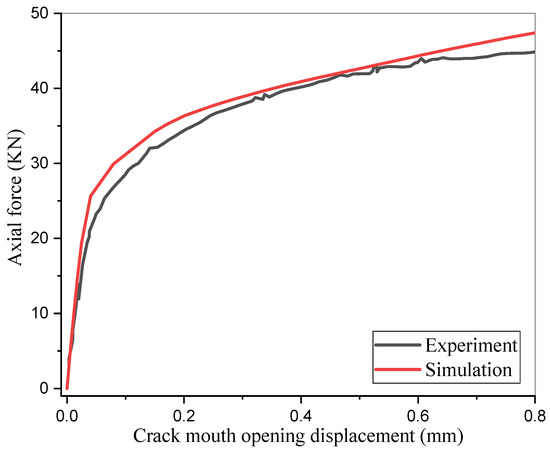
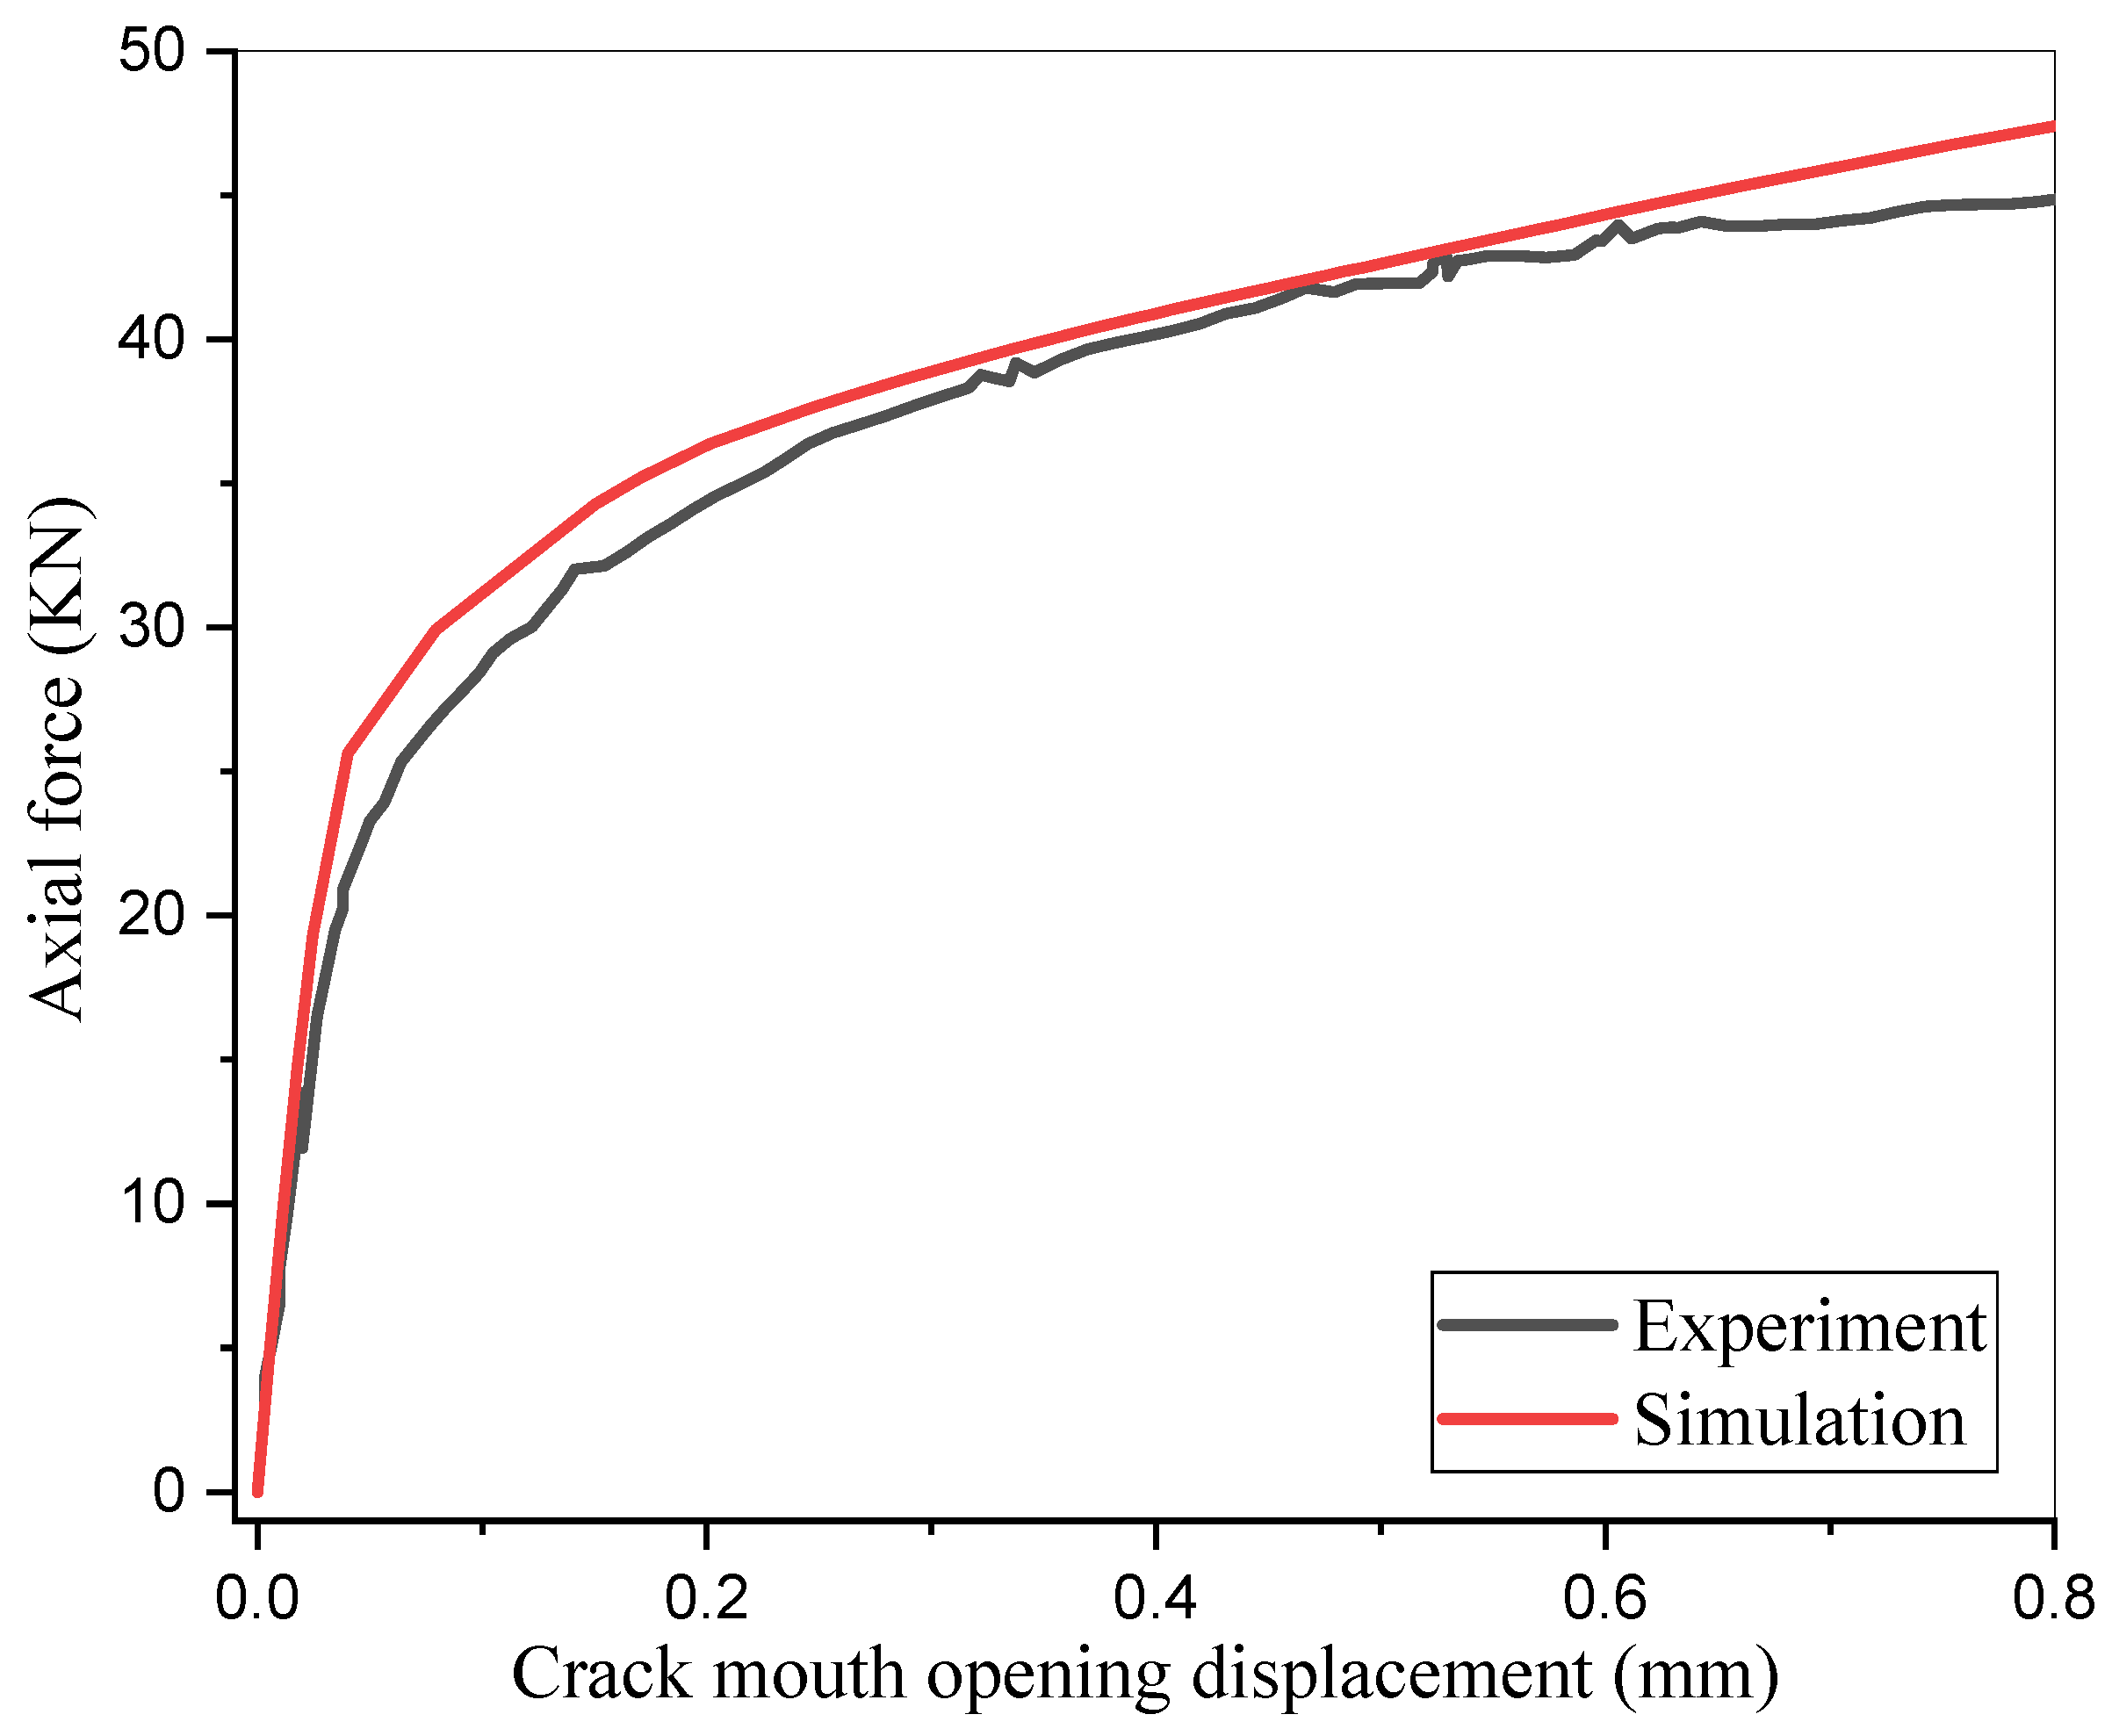
The simulated remote axial force was compared with the experimental force-CMOD response reported by Ameli et al. [42], as shown in Figure 16. At matched CMOD coordinates, the relative force deviation is evaluated as |FFE − Fexp|/Fexp × 100%, and the maximum value over the compared range was less than 6.59%. Because the published dataset used for this verification does not provide full-field crack-tip stress/strain data for the exact model output locations, no unsupported point-by-point stress or strain validation is added. Likewise, direct validation of CTOD for the target X80-X60 joint awaits the planned SENT test program. The comparison is therefore described as numerical-procedure verification rather than target-joint validation.
Figure 16.
Comparison between experimental and simulated force-CMOD responses.
4. Results and Discussion
The validated three-dimensional heterogeneous FE model was used to investigate the constraint-driven fracture response of SENT specimens extracted from unequal-wall-thickness X80-X60 girth welded pipelines. Since the joint contains five mechanically distinct regions—namely, the X80 base metal, X80 HAZ, weld metal, X60 HAZ, and X60 base metal, the fracture response cannot be interpreted solely from the nominal crack size or the global specimen geometry. Instead, it is governed by the coupled effects of material mismatch, local weld geometry, crack configuration, and specimen constraint. Therefore, the following analyses focus on the evolution of crack-tip stress and plastic deformation fields, as well as the resulting CTOD response under different geometric and material conditions.
4.1. Mechanical Response of the SENT Specimen
The global and local mechanical responses of the heterogeneous SENT specimen were evaluated in terms of equivalent stress distribution and crack-tip plasticity. These two indicators reveal how material heterogeneity modifies the crack-tip constraint.
4.1.1. Equivalent Stress Distribution
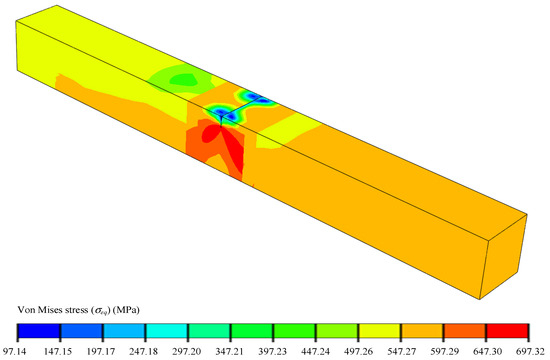
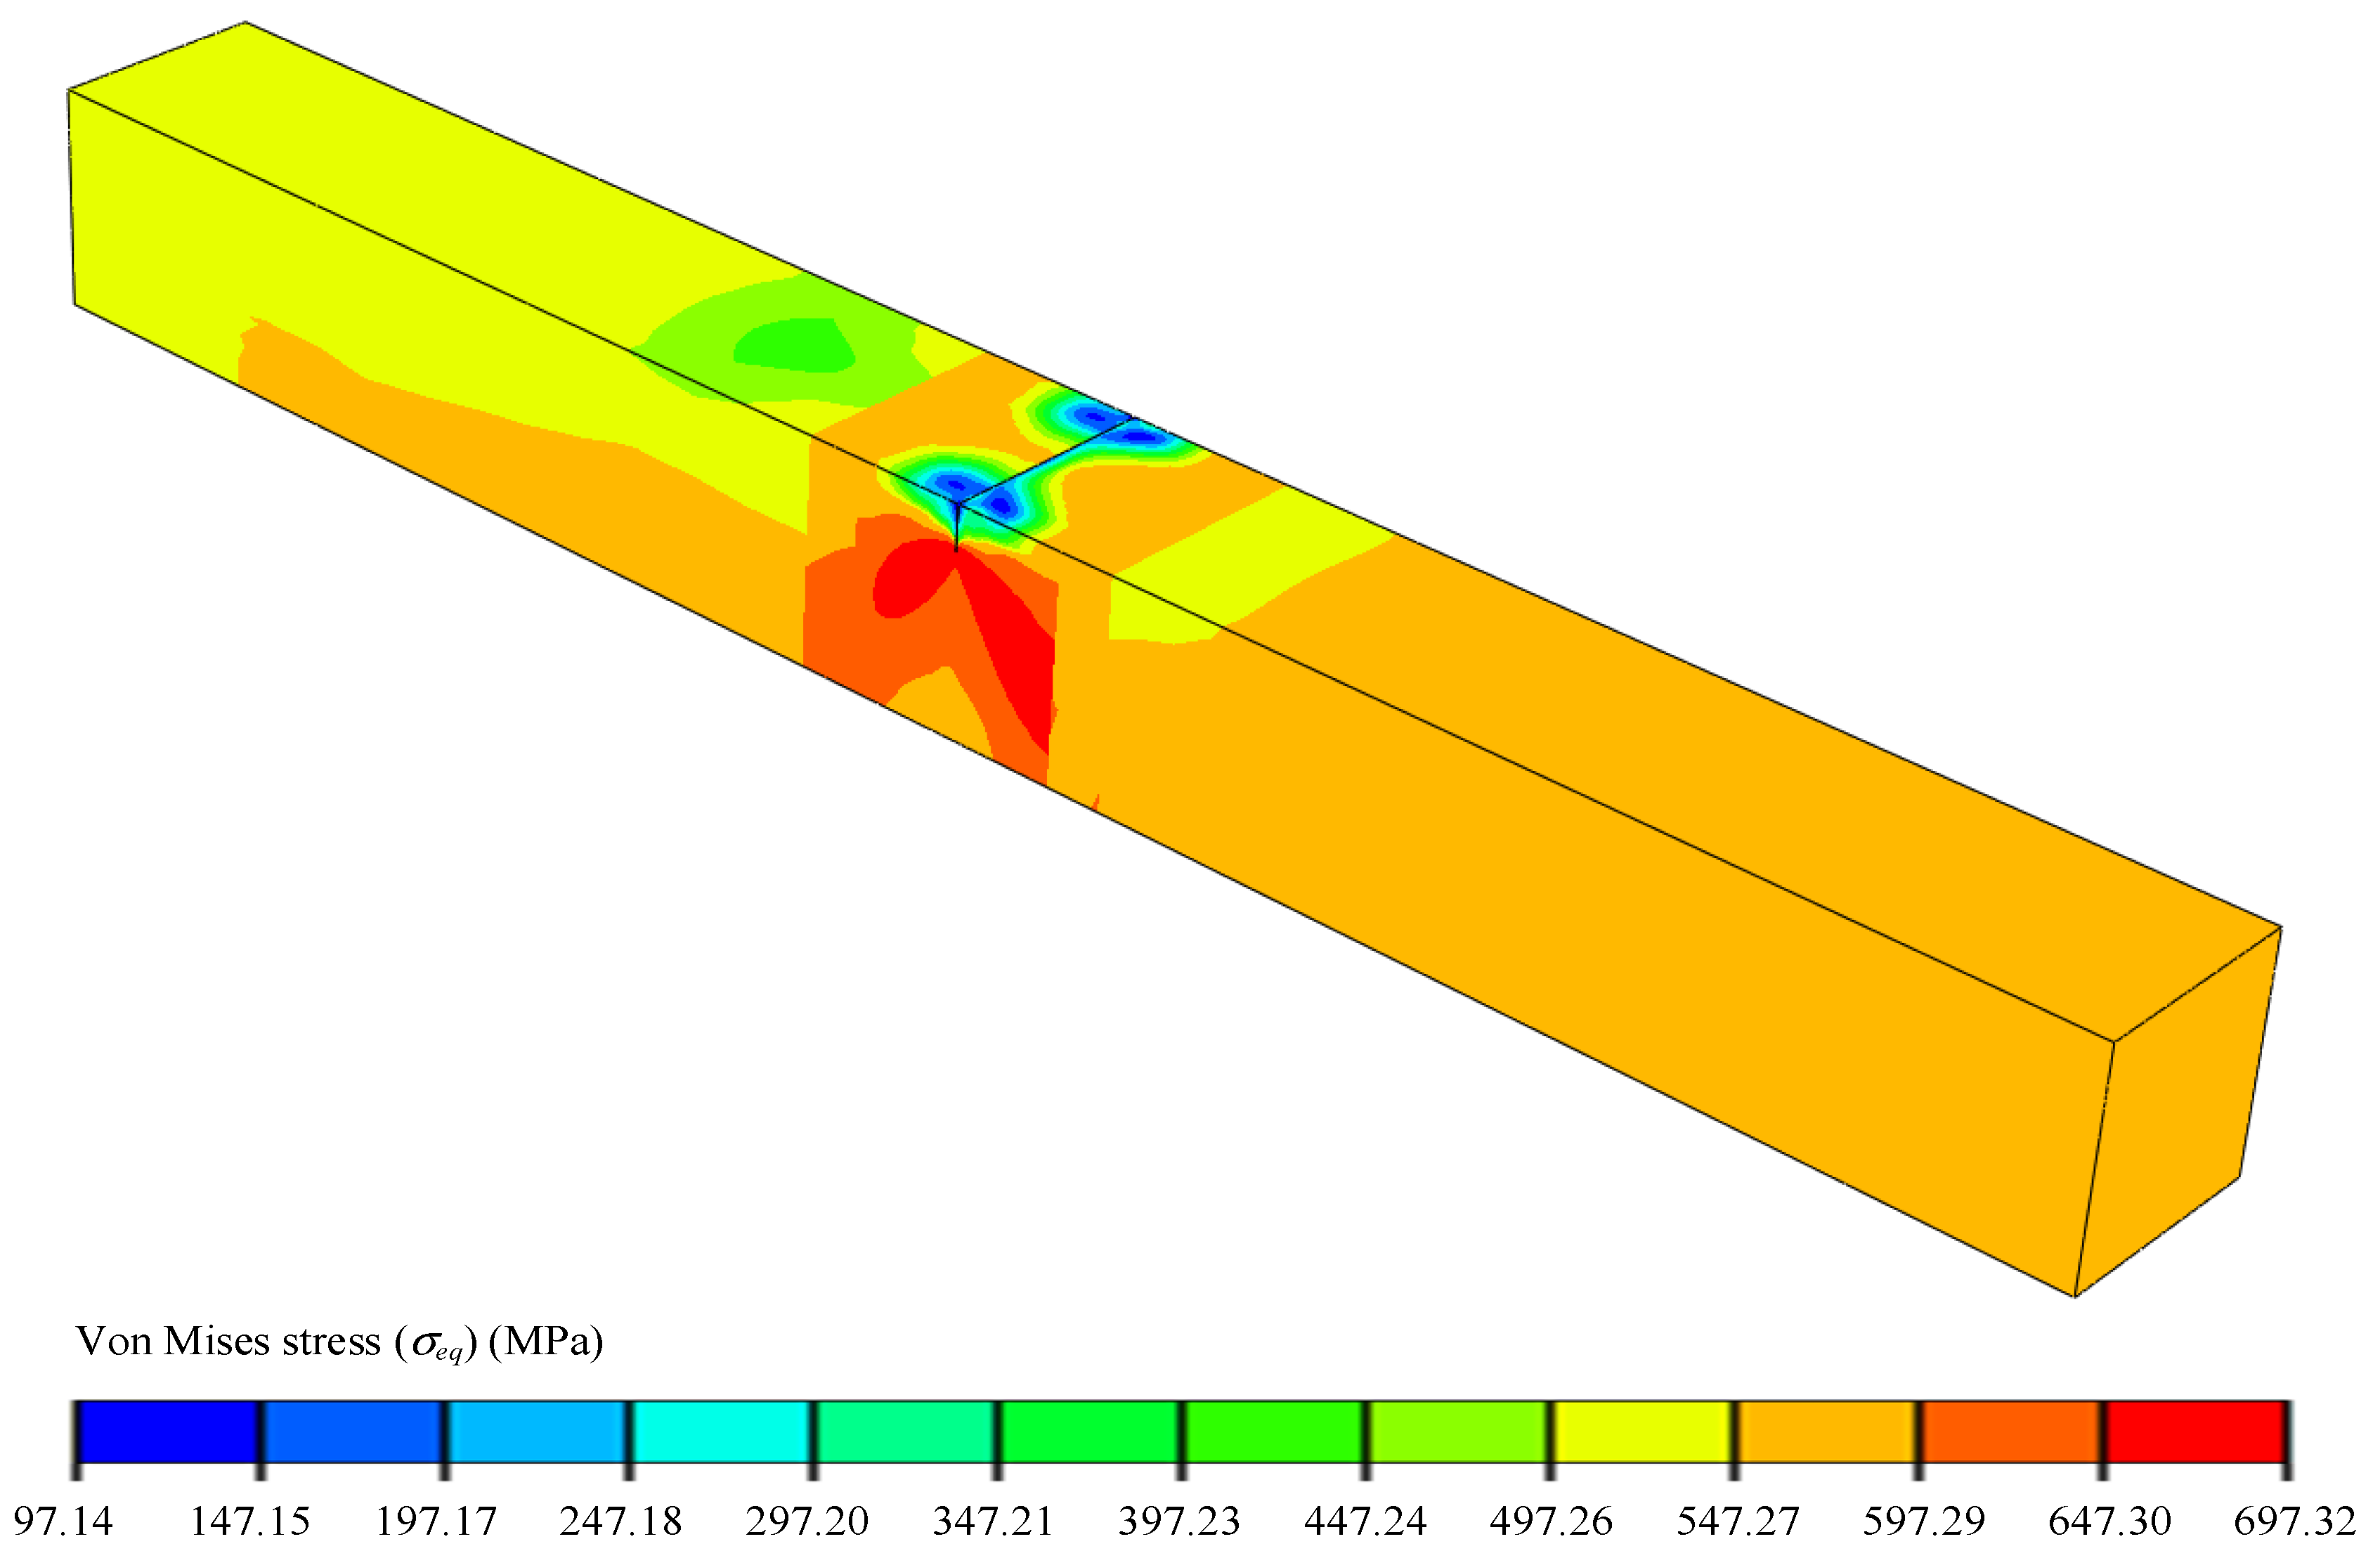
The baseline specimen had W = B = 20 mm, B/W = 1, H = 200 mm (10W), and a0/W = 0.2. The specimen was fixed at one end and subjected to an axial displacement of 4 mm at the opposite end. The evolution of the equivalent stress distribution during tensile loading is shown in Figure 17. Distinct stress discontinuities appear at the interfaces among the weld metal, HAZs, and base metals because of the mismatch in local material properties. The maximum equivalent stress initiates at the crack tip and spreads into the adjacent weld region, but its extension is constrained by the heterogeneous material interfaces. The stress field is asymmetric with respect to the crack plane, indicating that the X80-X60 strength mismatch alters the local constraint state around the crack tip. The nonzero equivalent plastic strain shown in Figure 17 confirms that the crack-tip region has exceeded the local elastic limit; where plastic strain develops, the von Mises stress has reached the current local flow strength. Regions with essentially zero equivalent plastic strain remain predominantly elastic. This distinction is now stated explicitly because a contour of equivalent stress alone does not identify yielding without reference to the local constitutive response.
Figure 17.
Equivalent stress contours of the entire SENT specimen.
4.1.2. Crack-Tip Plastic Zone
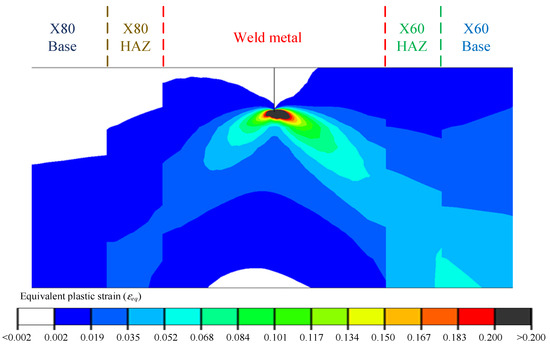
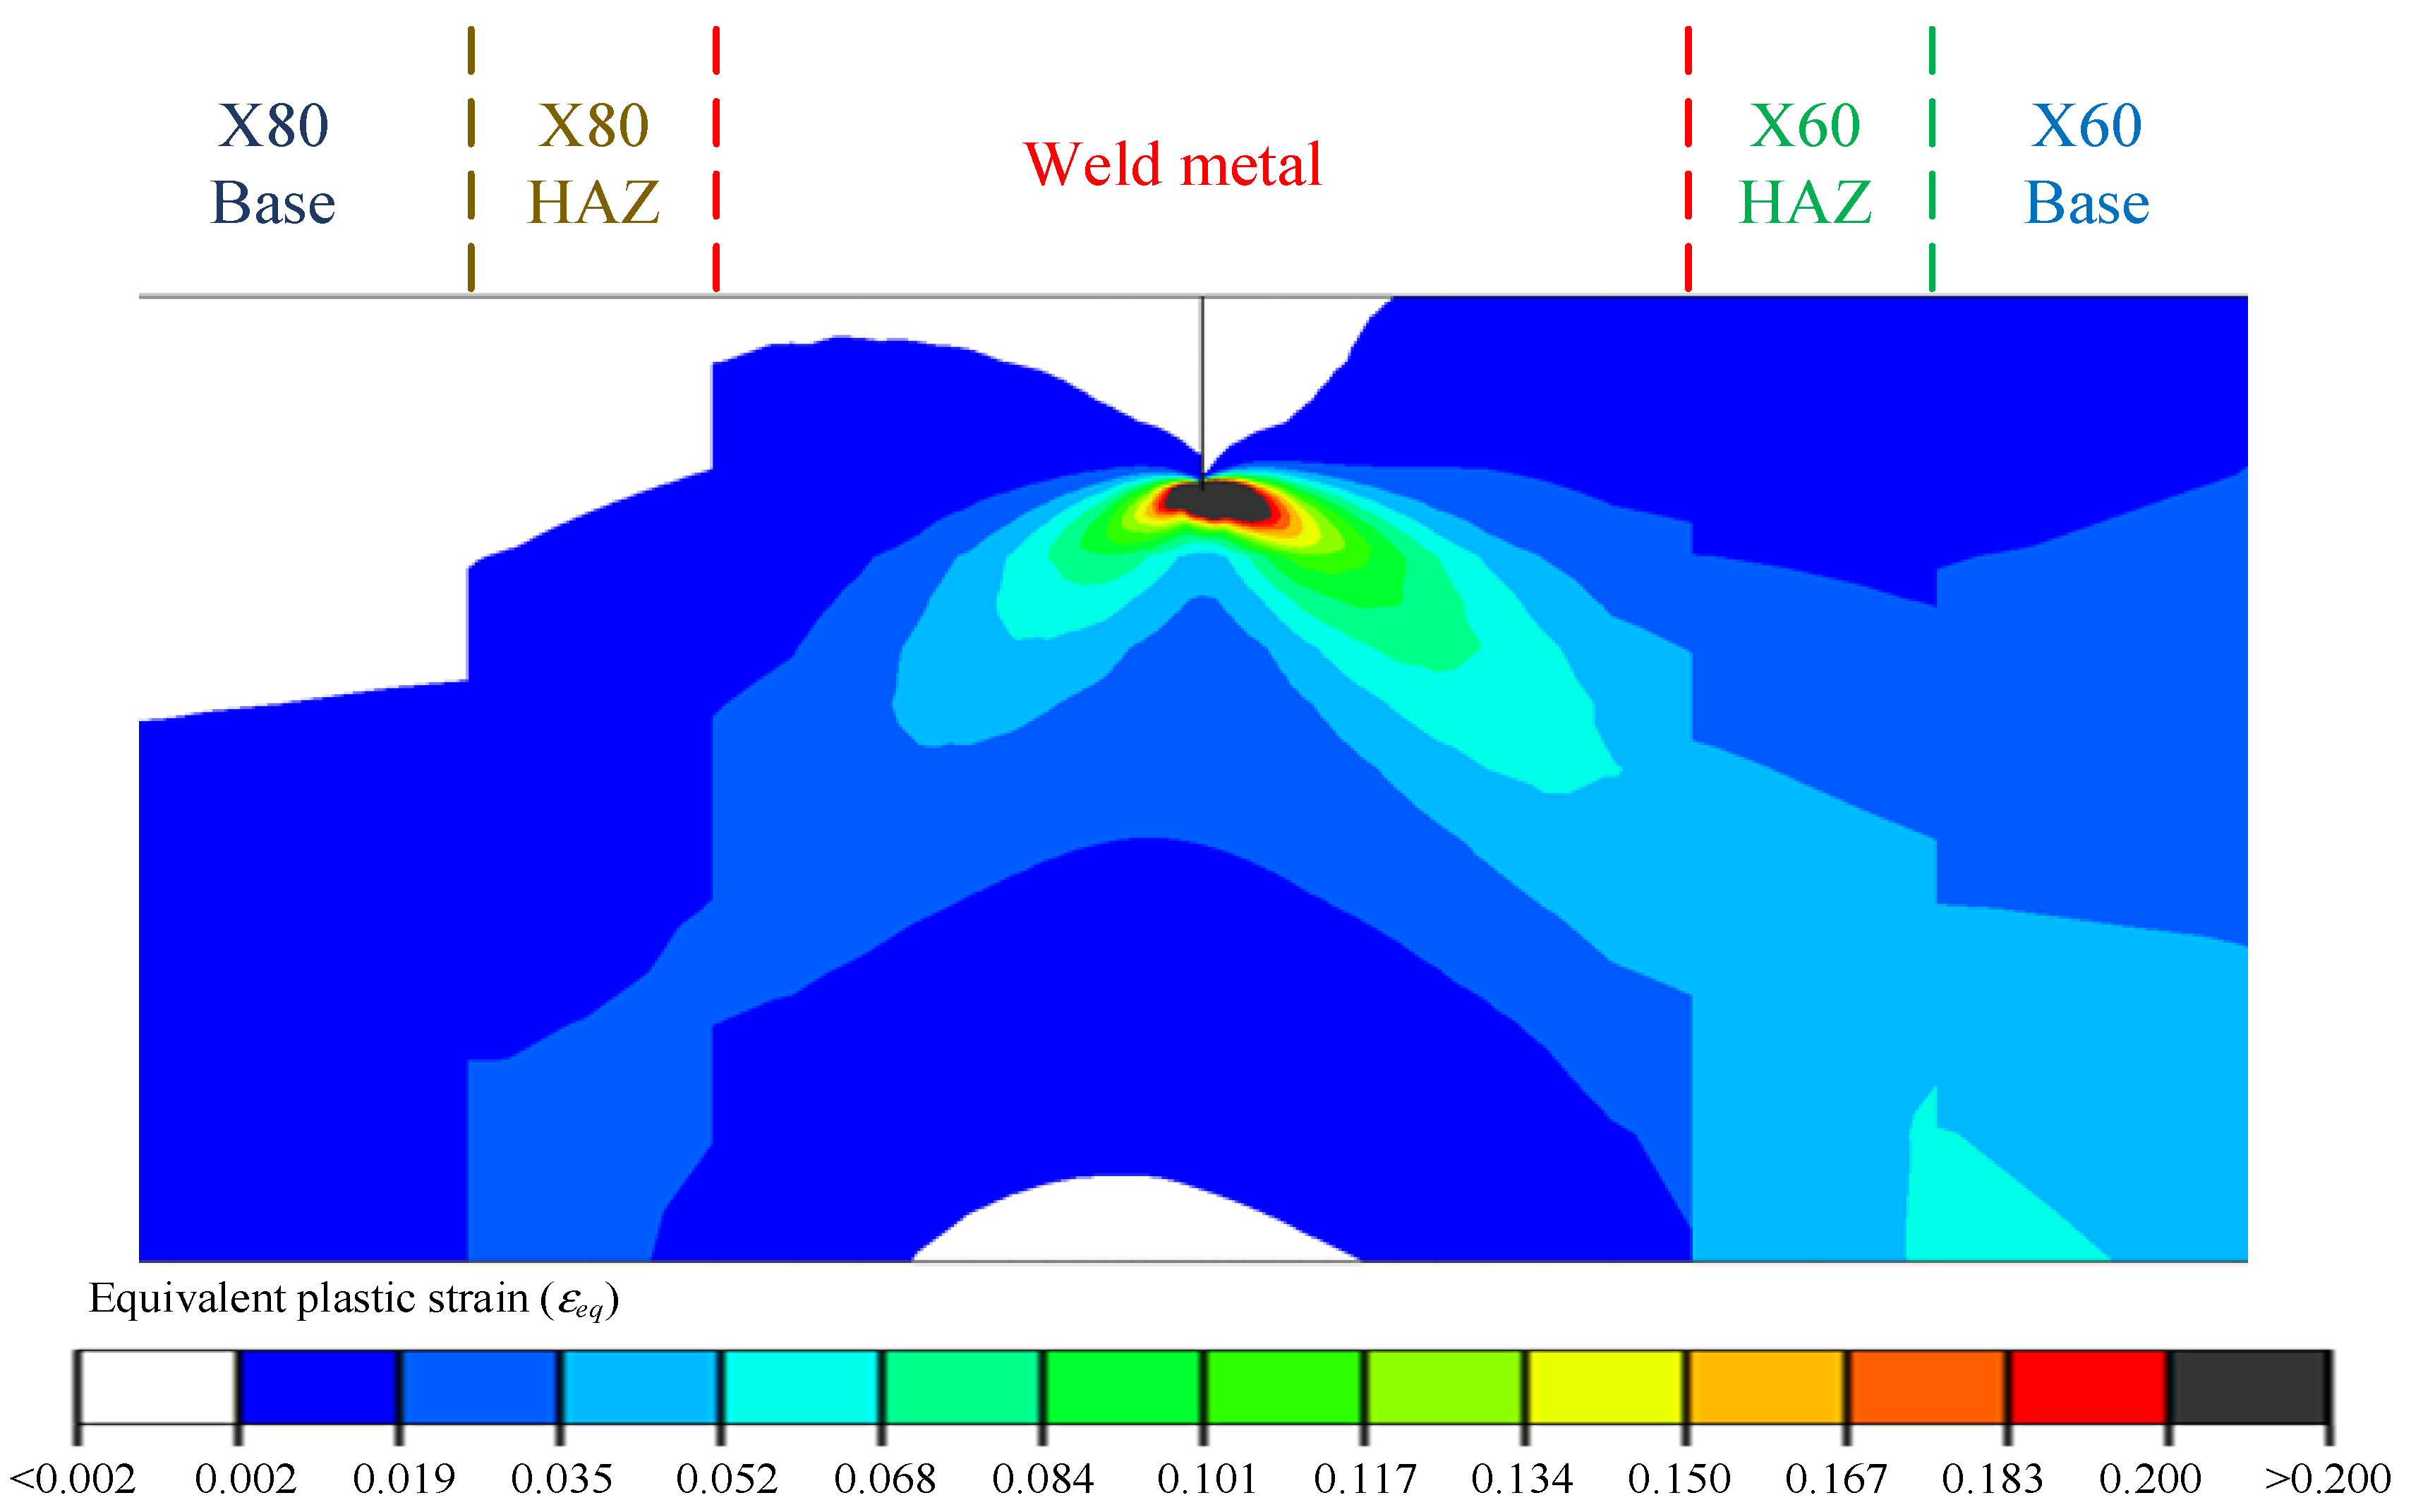
Figure 18 shows the equivalent plastic strain contours near the crack tip. The highest plastic strain originates at the stationary crack tip, and the dominant near-tip plastic zone remains within the weld region in the baseline Wweld = 20 mm model. The polar data subsequently extracted at radii of 0.2–1.0 mm are therefore well inside the 10 mm weld half-width and do not directly intersect the idealized weld/HAZ interfaces. The observed left–right asymmetry within this near-tip field reflects the non-symmetric surrounding material constraint, but the exact keyhole/curved interface morphology is not resolved. The straight-interface assumption is consequently expected to have a limited influence on the immediate <1 mm crack-tip sampling paths in the baseline geometry, while its influence may become more important for narrower welds or larger deformation and remains a limitation of the model.
Figure 18.
Equivalent plastic strain contours near the crack tip.
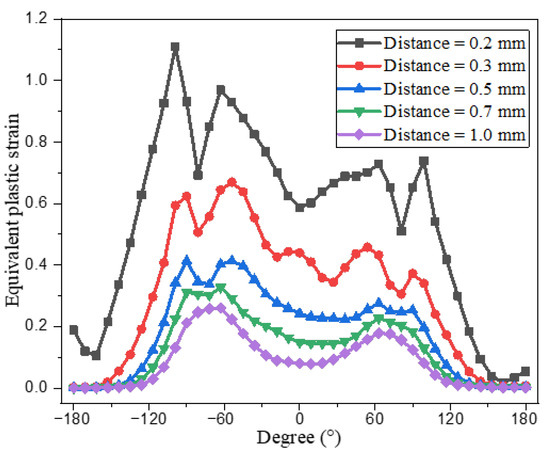
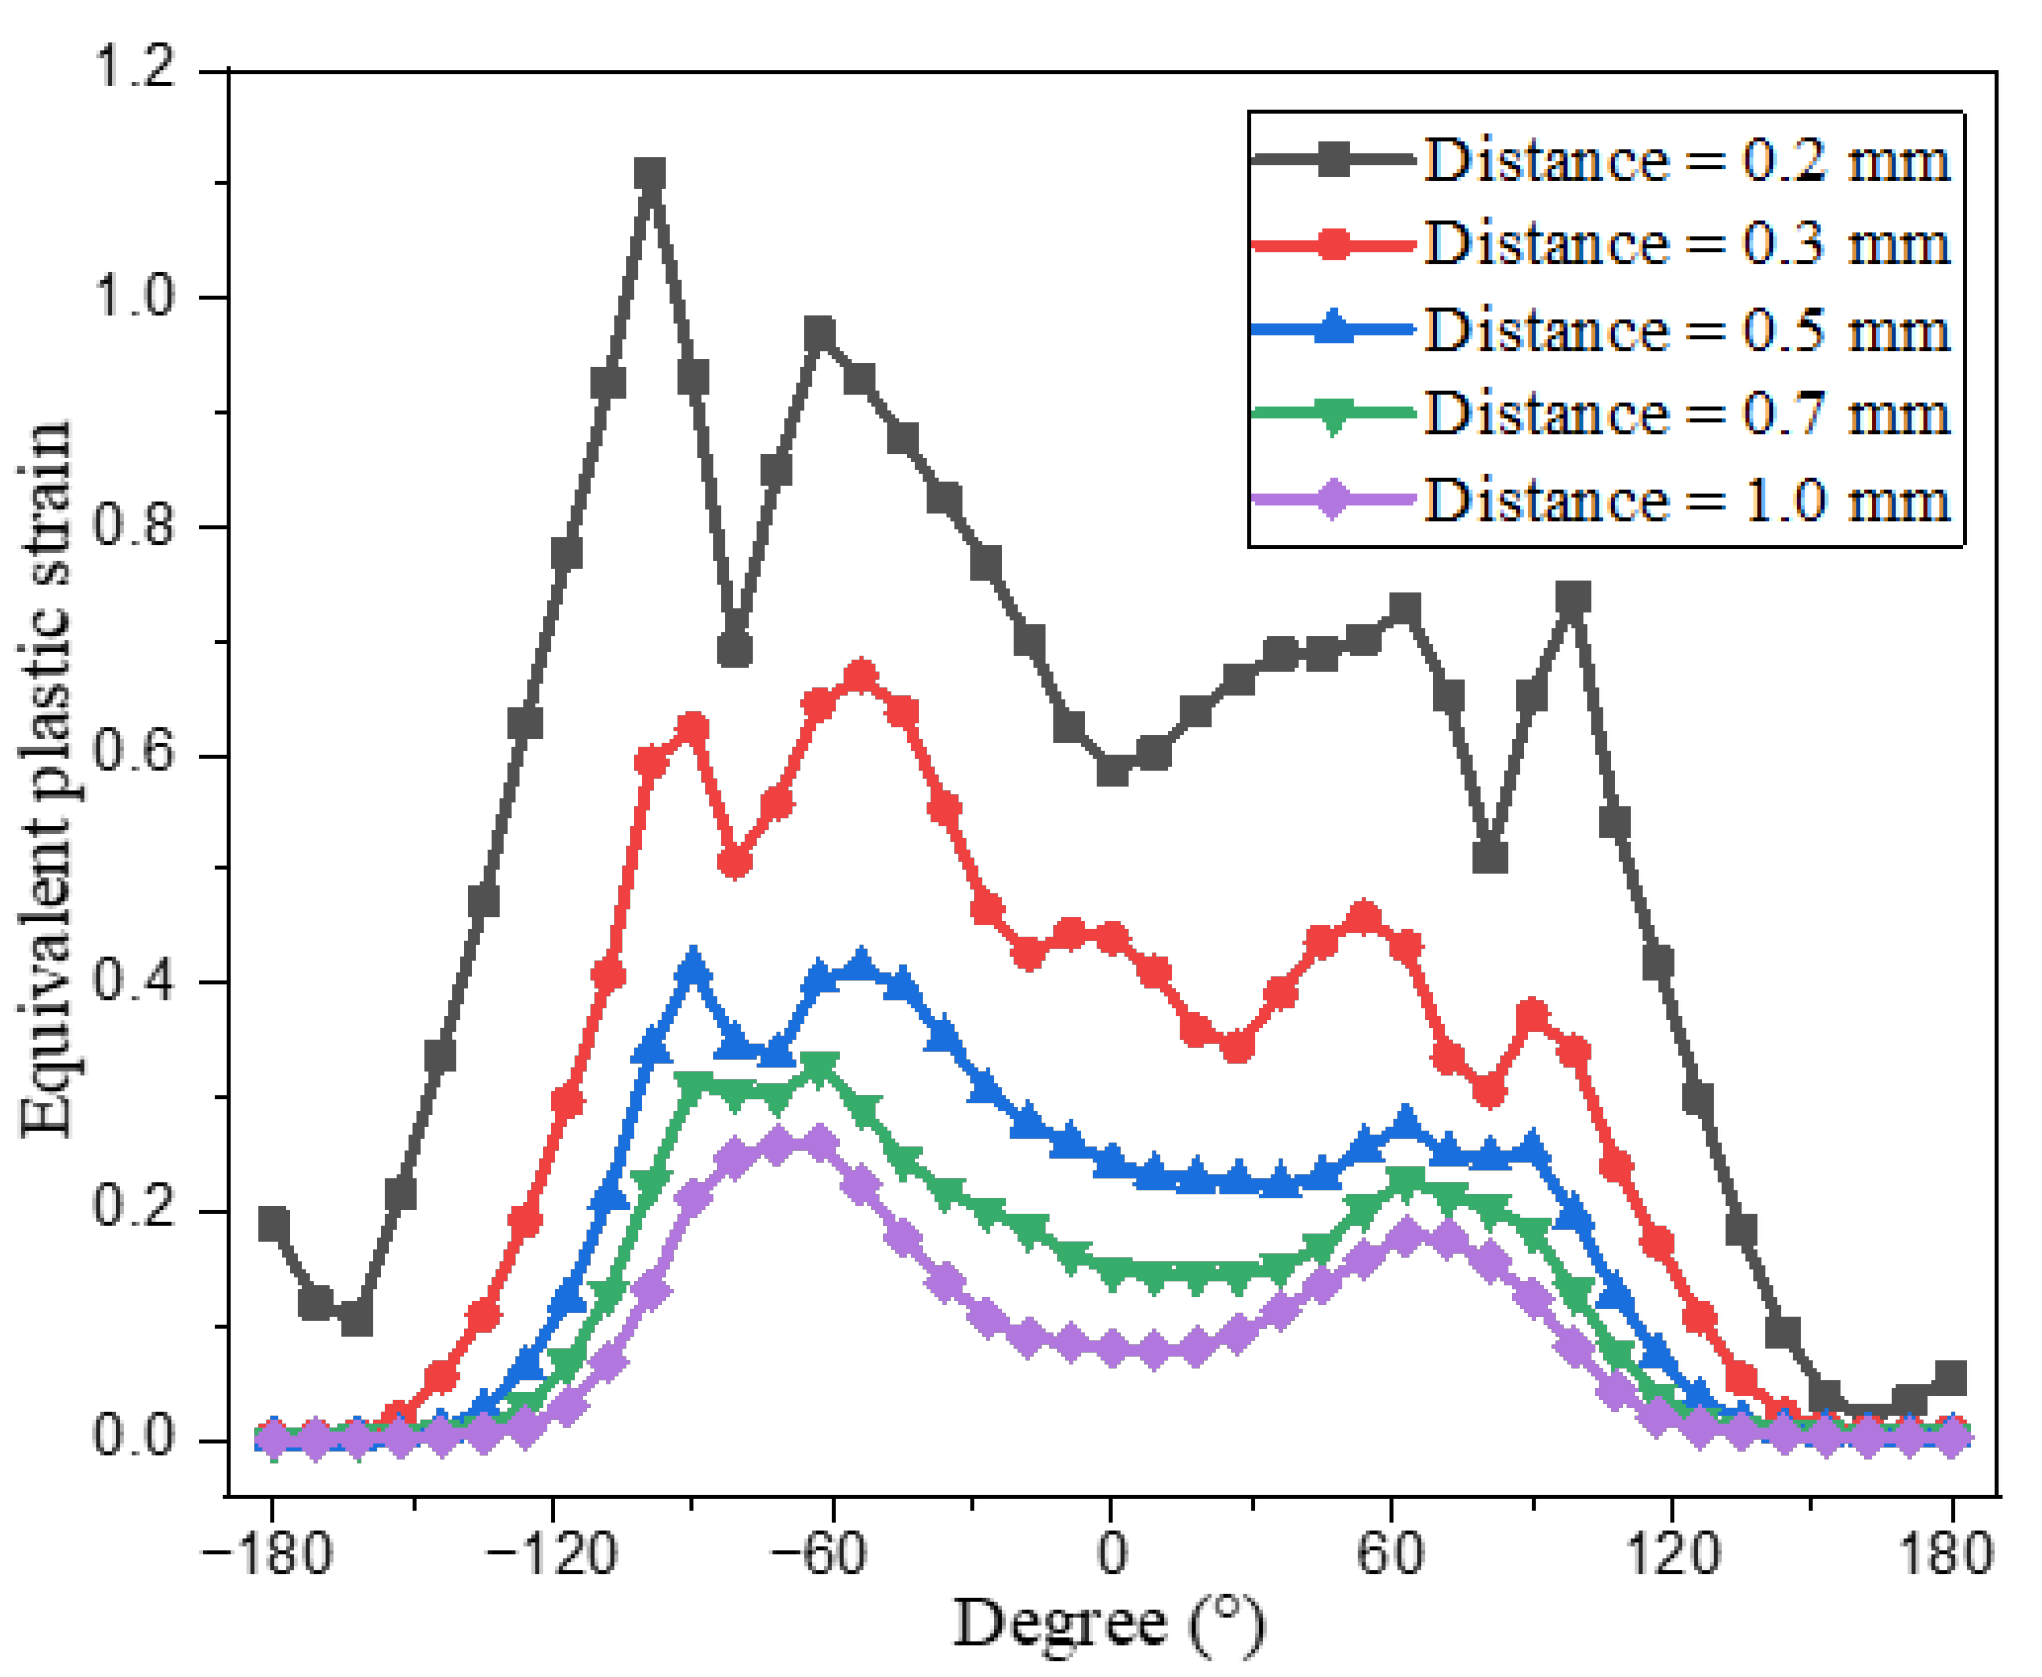
A polar coordinate system was established with the crack tip as the origin and the crack-extension direction as the positive radial direction. The equivalent plastic strain was extracted along circumferential paths at distances of 0.2, 0.3, 0.5, 0.7, and 1.0 mm from the crack tip, as shown in Figure 19. Within 0.5 mm of the crack tip, the equivalent plastic strain varies strongly with circumferential angle and exhibits multiple local peaks, indicating a highly nonuniform crack-tip plastic zone. As the distance from the crack tip increases, the angular variation becomes smoother, and the influence of local crack-tip singularity gradually weakens. The asymmetric distribution further confirms that the adjacent heterogeneous material zones impose a constraint-driven plastic deformation pattern.
Figure 19.
Circumferential variation of equivalent plastic strain around the crack tip.
4.2. Effects of Crack Configuration and Specimen Dimension on CTOD Response
Crack configuration and specimen dimension influence the CTOD response of SENT specimens by changing the crack-tip constraint level. In this section, the effects of initial crack length and specimen thickness-to-width ratio are quantified to clarify specimen-configuration-related contributions to the apparent fracture toughness.
4.2.1. Effect of Crack Length
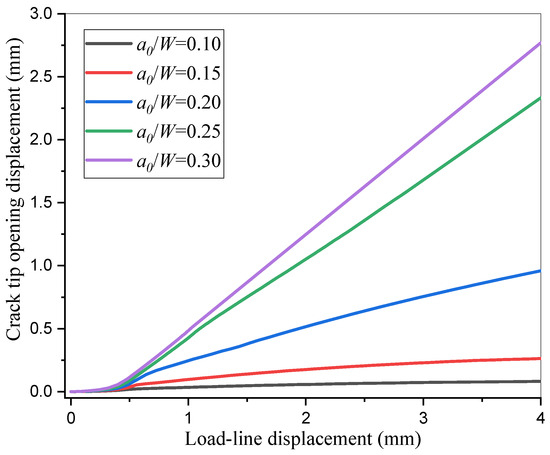
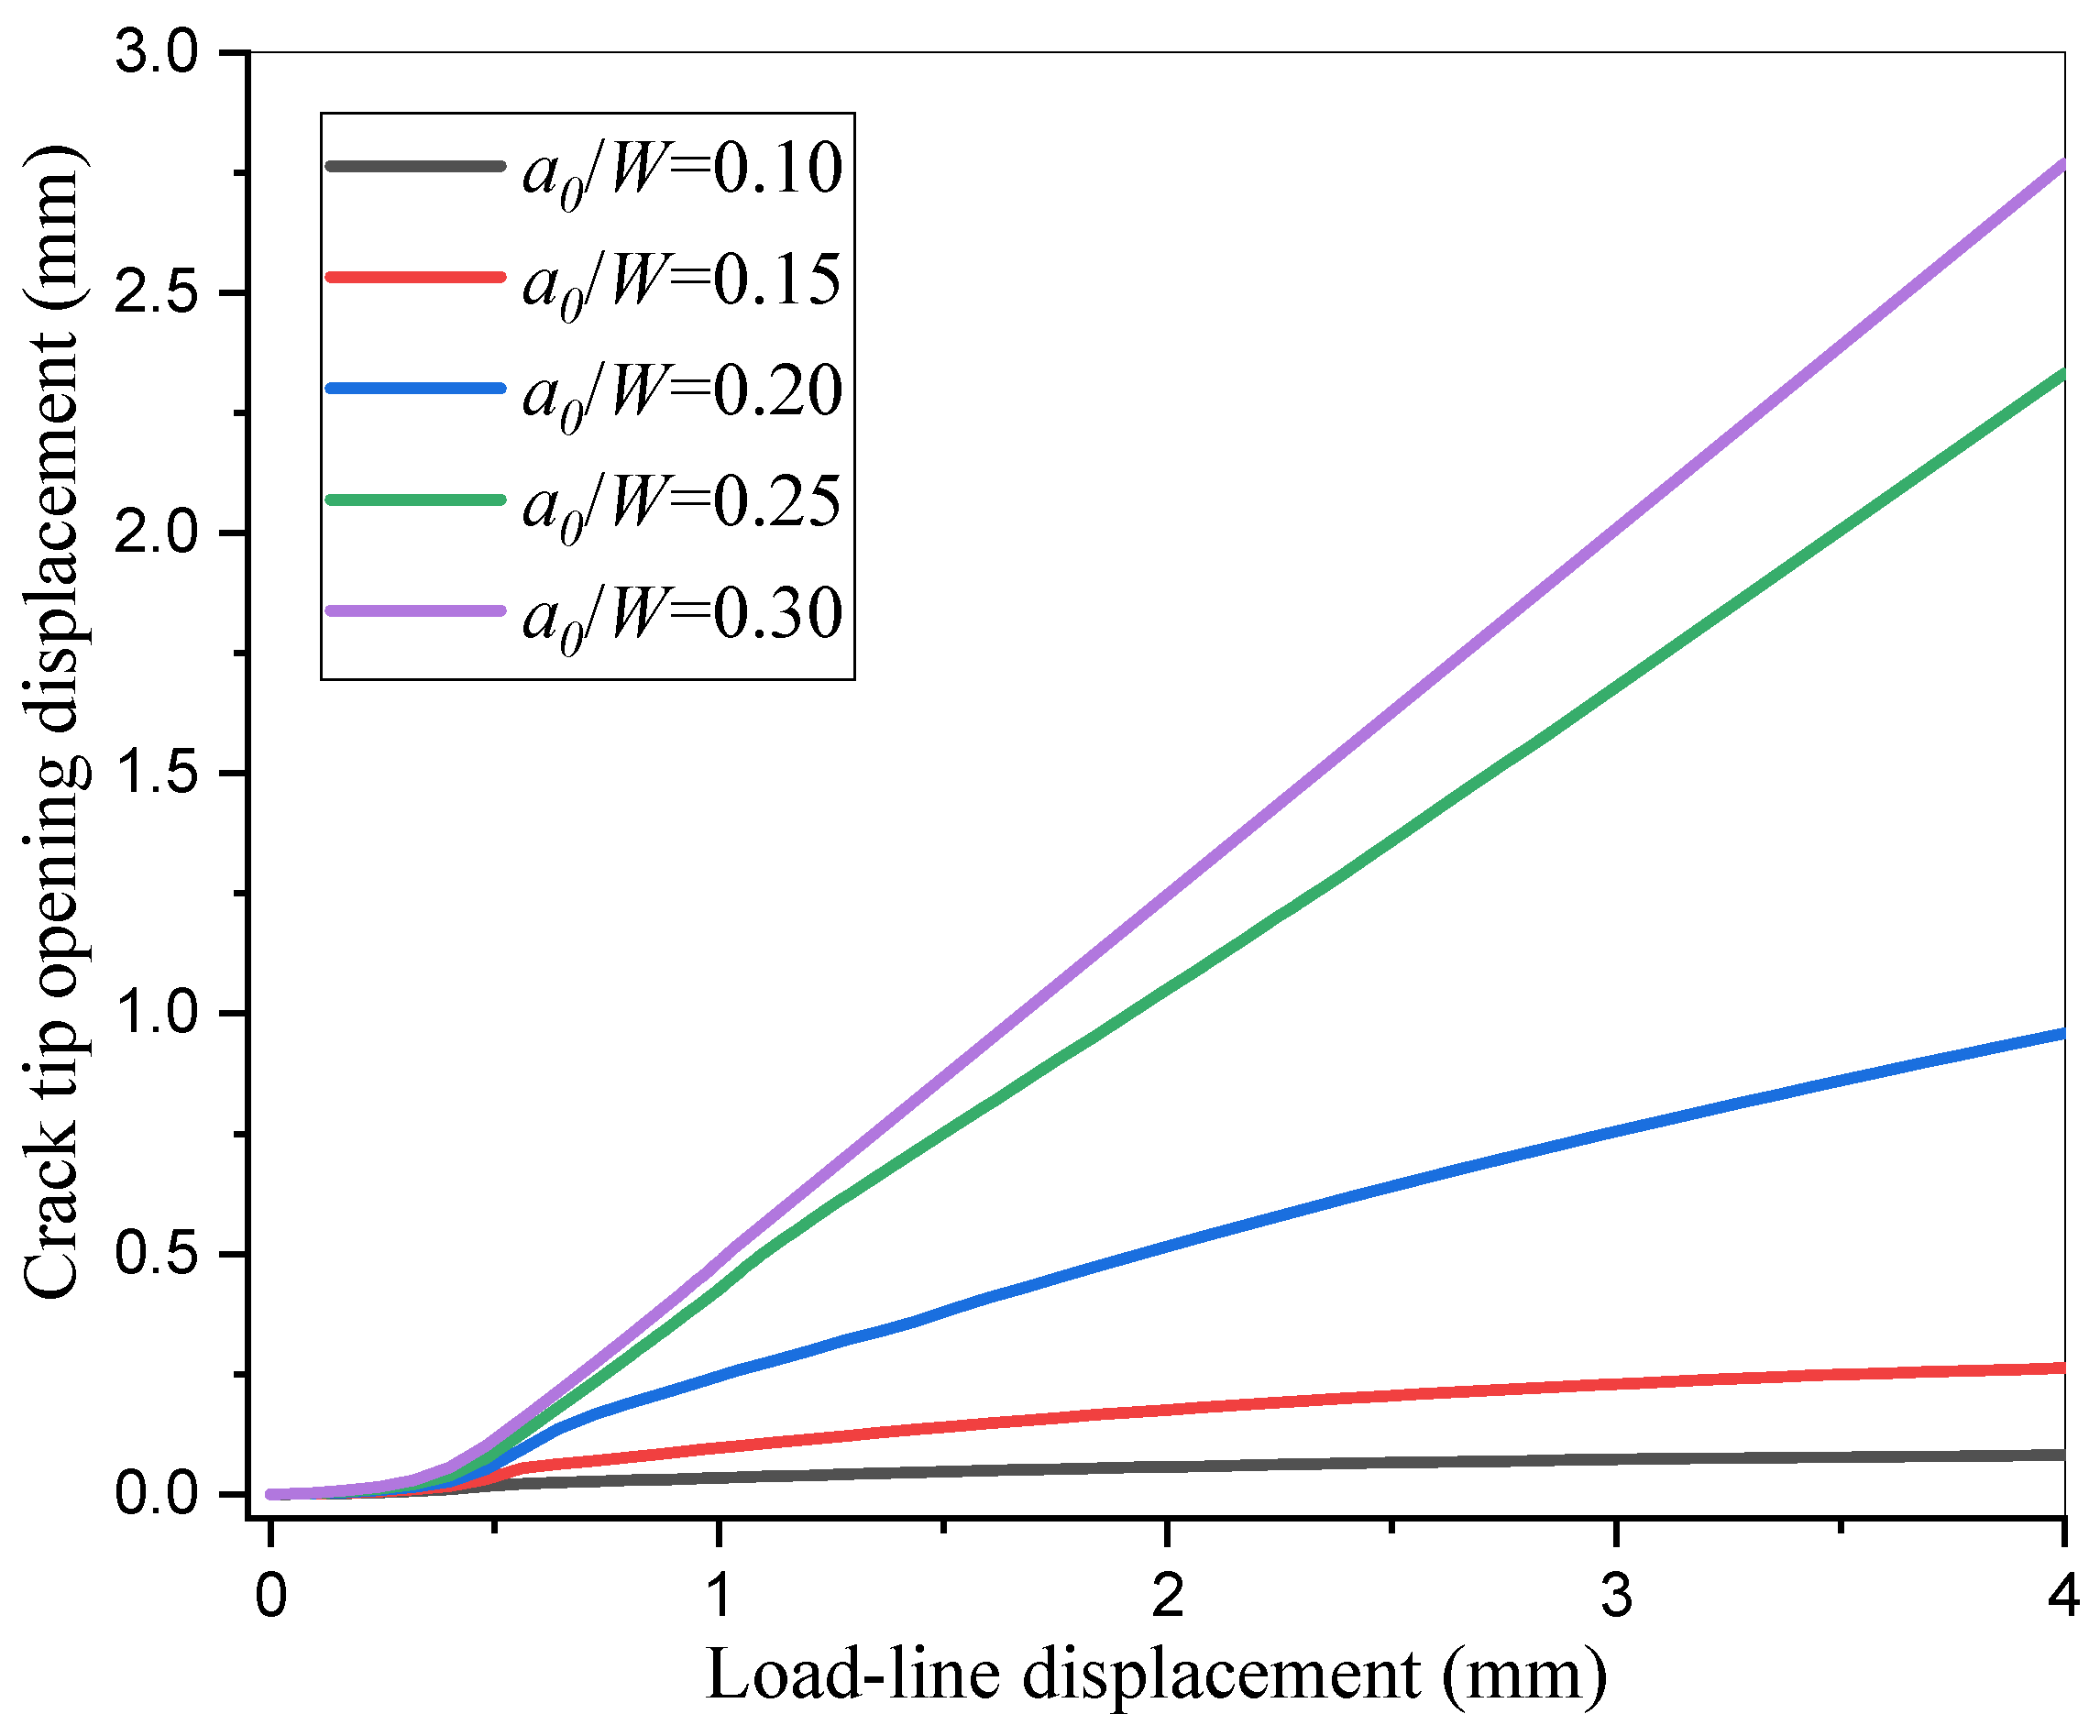
Five crack lengths within a0/W = 0.1–0.3 were analyzed while keeping B/W = 1.0. The resulting CTOD versus loading line displacement curves are shown in Figure 20. For shallow cracks (a0/W ≤ 0.2), CTOD increases rapidly at the early loading stage, then develops more gradually at larger displacements. For deeper cracks (a0/W > 0.2), CTOD increases continuously with loading-line displacement. At the same displacement level, CTOD increases with crack length, and the difference among crack lengths becomes more pronounced in the later loading stage. This indicates that increasing crack depth increases the local fracture driving force in the SENT specimen.
Figure 20.
CTOD response of SENT specimens with different initial crack lengths.
4.2.2. Effect of Specimen Thickness-to-Width Ratio
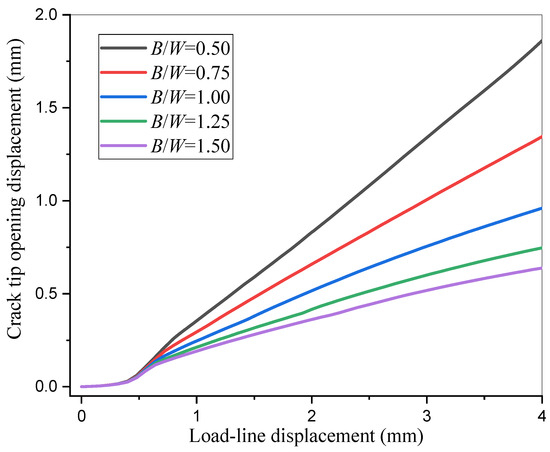
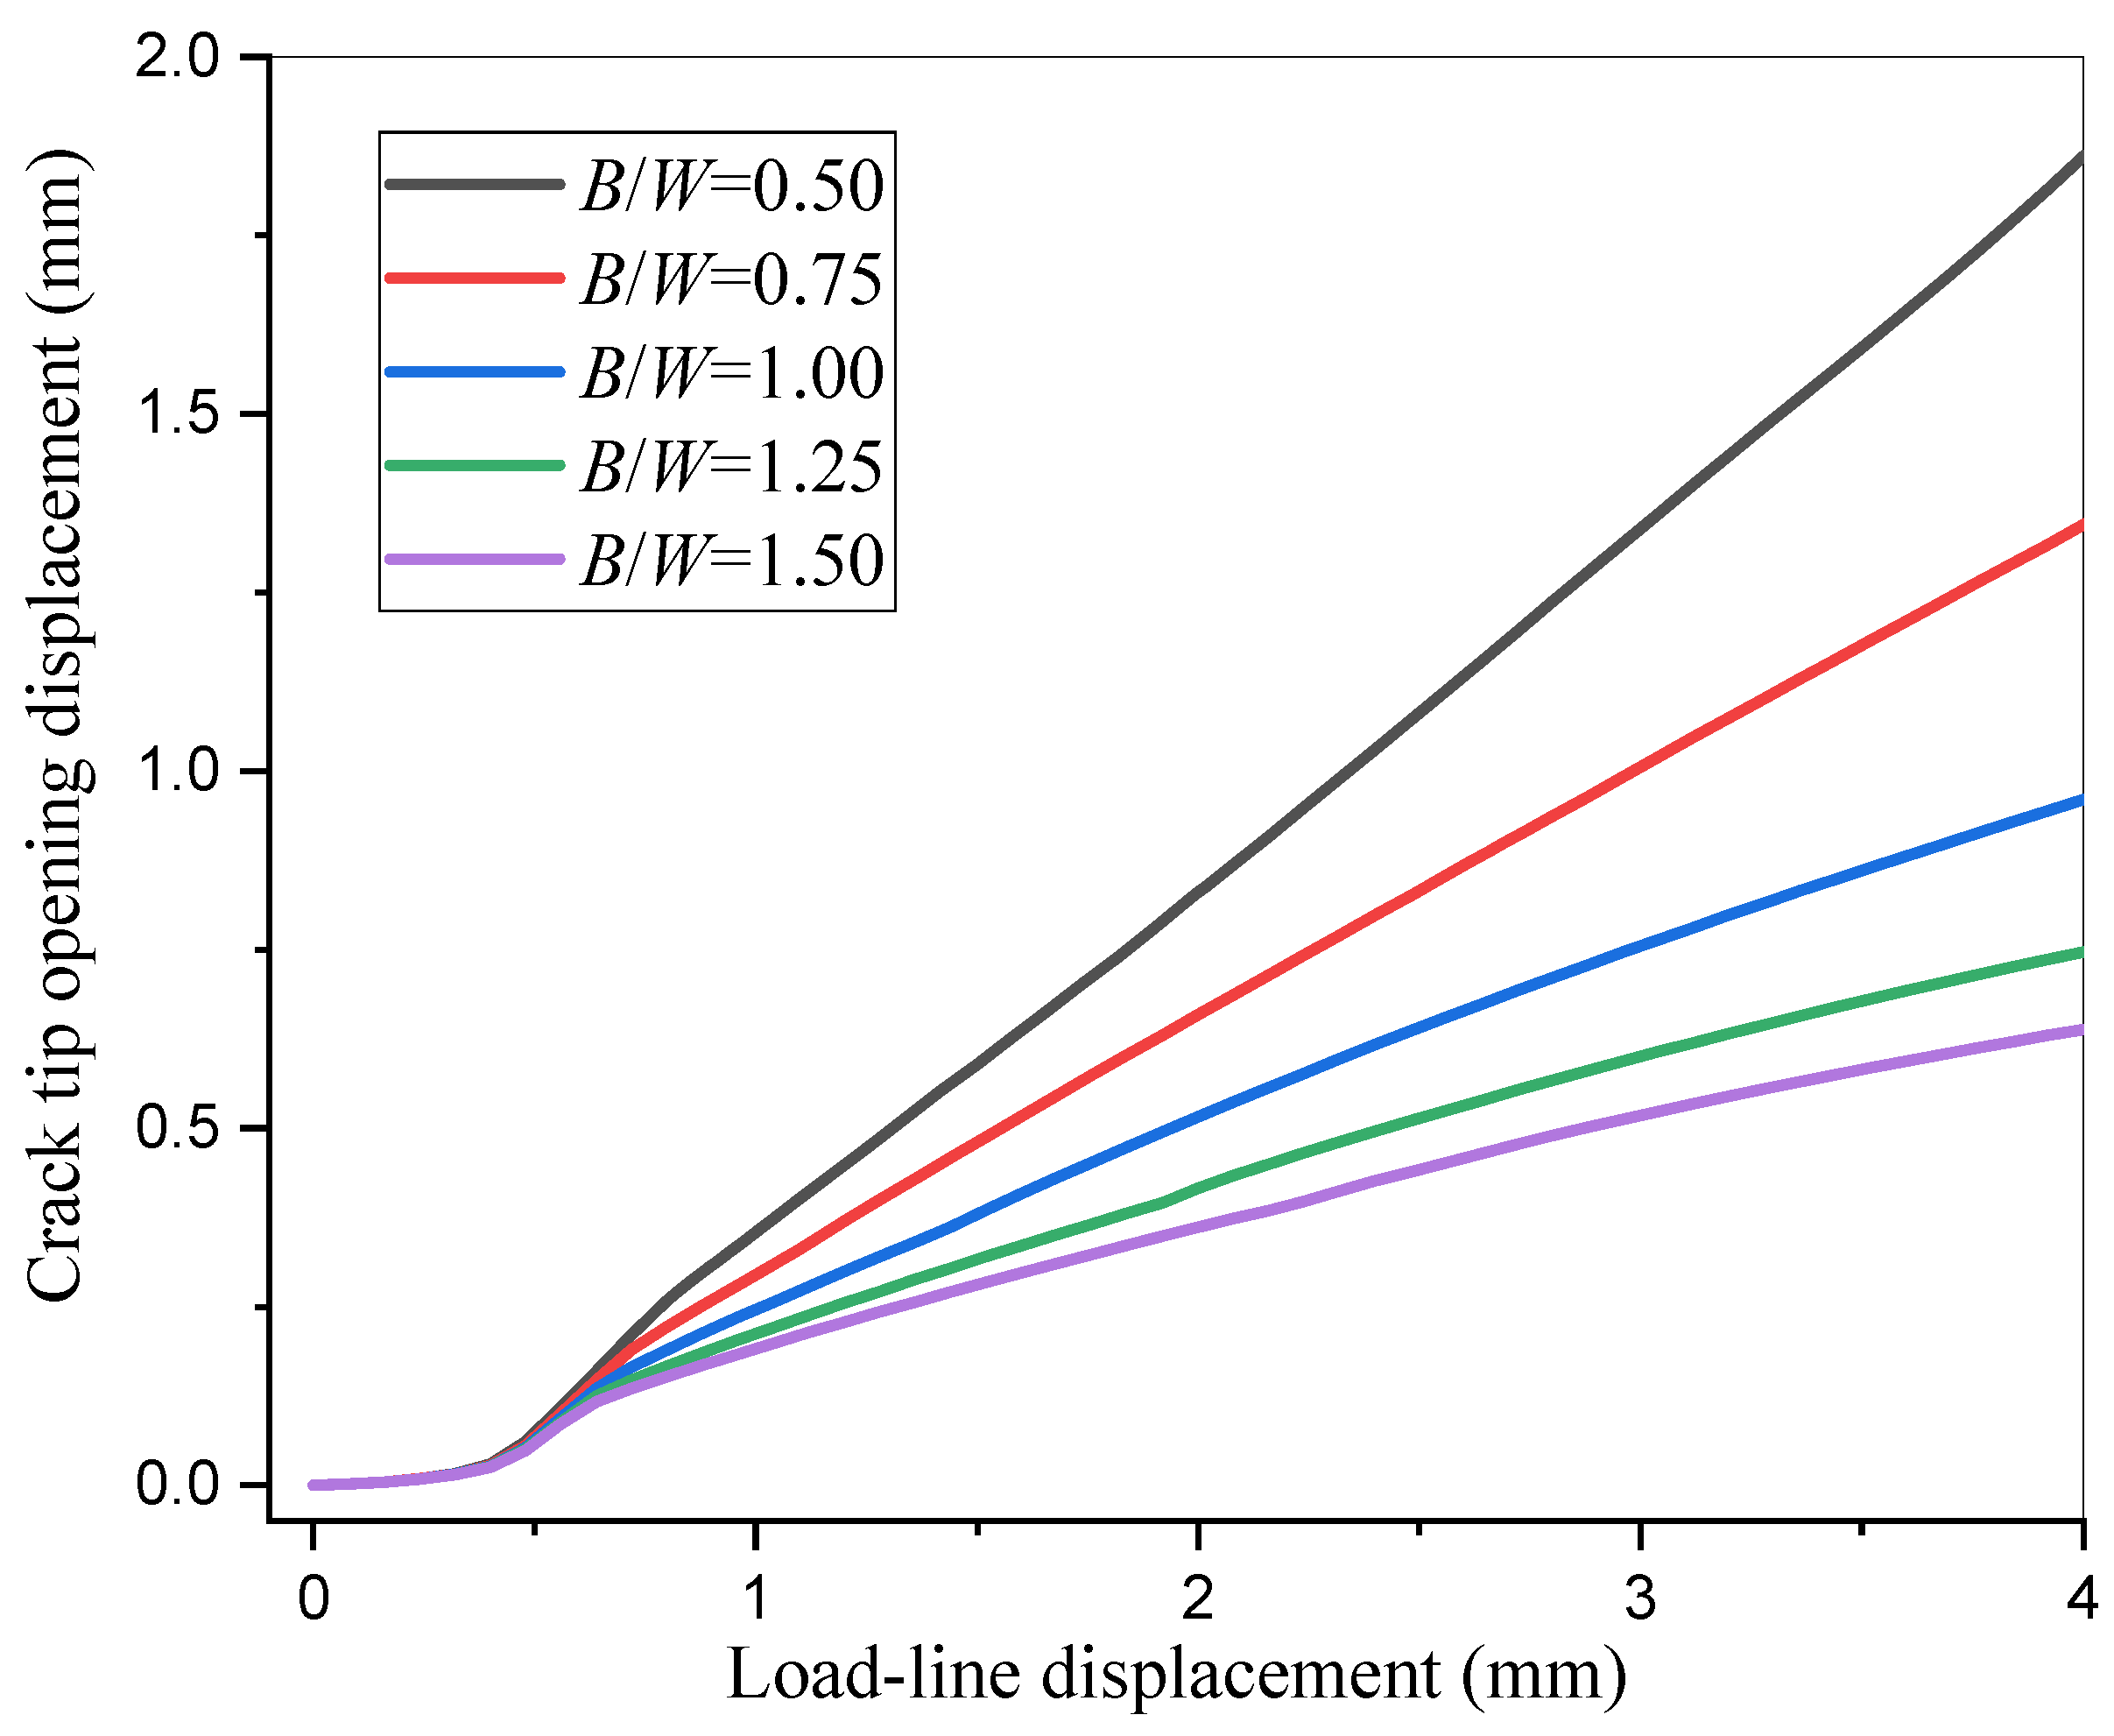
Five thickness-to-width ratios within B/W = 0.5–1.5 were analyzed while keeping a0/W = 0.20. Figure 21 compares the CTOD versus loading-line-displacement responses. During the early loading stage, CTOD increases rapidly, and the influence of B/W is limited. After the loading-line displacement reaches approximately 0.6 mm, the CTOD growth rate decreases, and the reduction becomes more evident for larger B/W values. Overall, increasing B/W decreases CTOD, indicating that a thicker specimen provides a higher out-of-plane constraint and leads to a lower apparent fracture toughness.
Figure 21.
CTOD response of SENT specimens with different thickness-to-width ratios.
4.3. Effect of Weld Dimensions on CTOD Response
Because the weld metal, HAZs, and base metals have different mechanical properties, variations in local weld geometry can modify material constraint and thereby affect fracture toughness. In practical welding, weld width and HAZ width cannot be controlled with absolute precision. Therefore, this section quantifies the effects of weld width and HAZ width on the CTOD response of SENT specimens to clarify how local geometric variations influence constraint-driven fracture behavior.
4.3.1. Effect of Weld Width
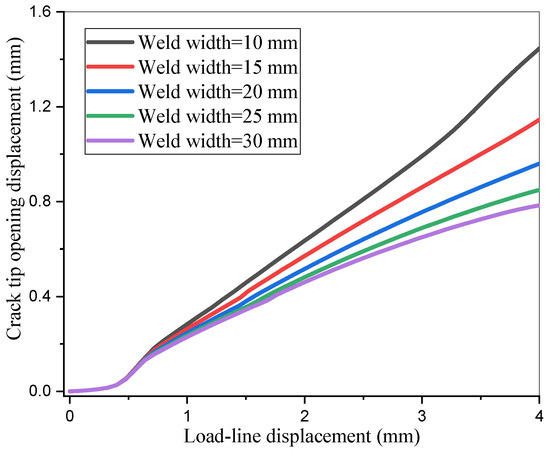
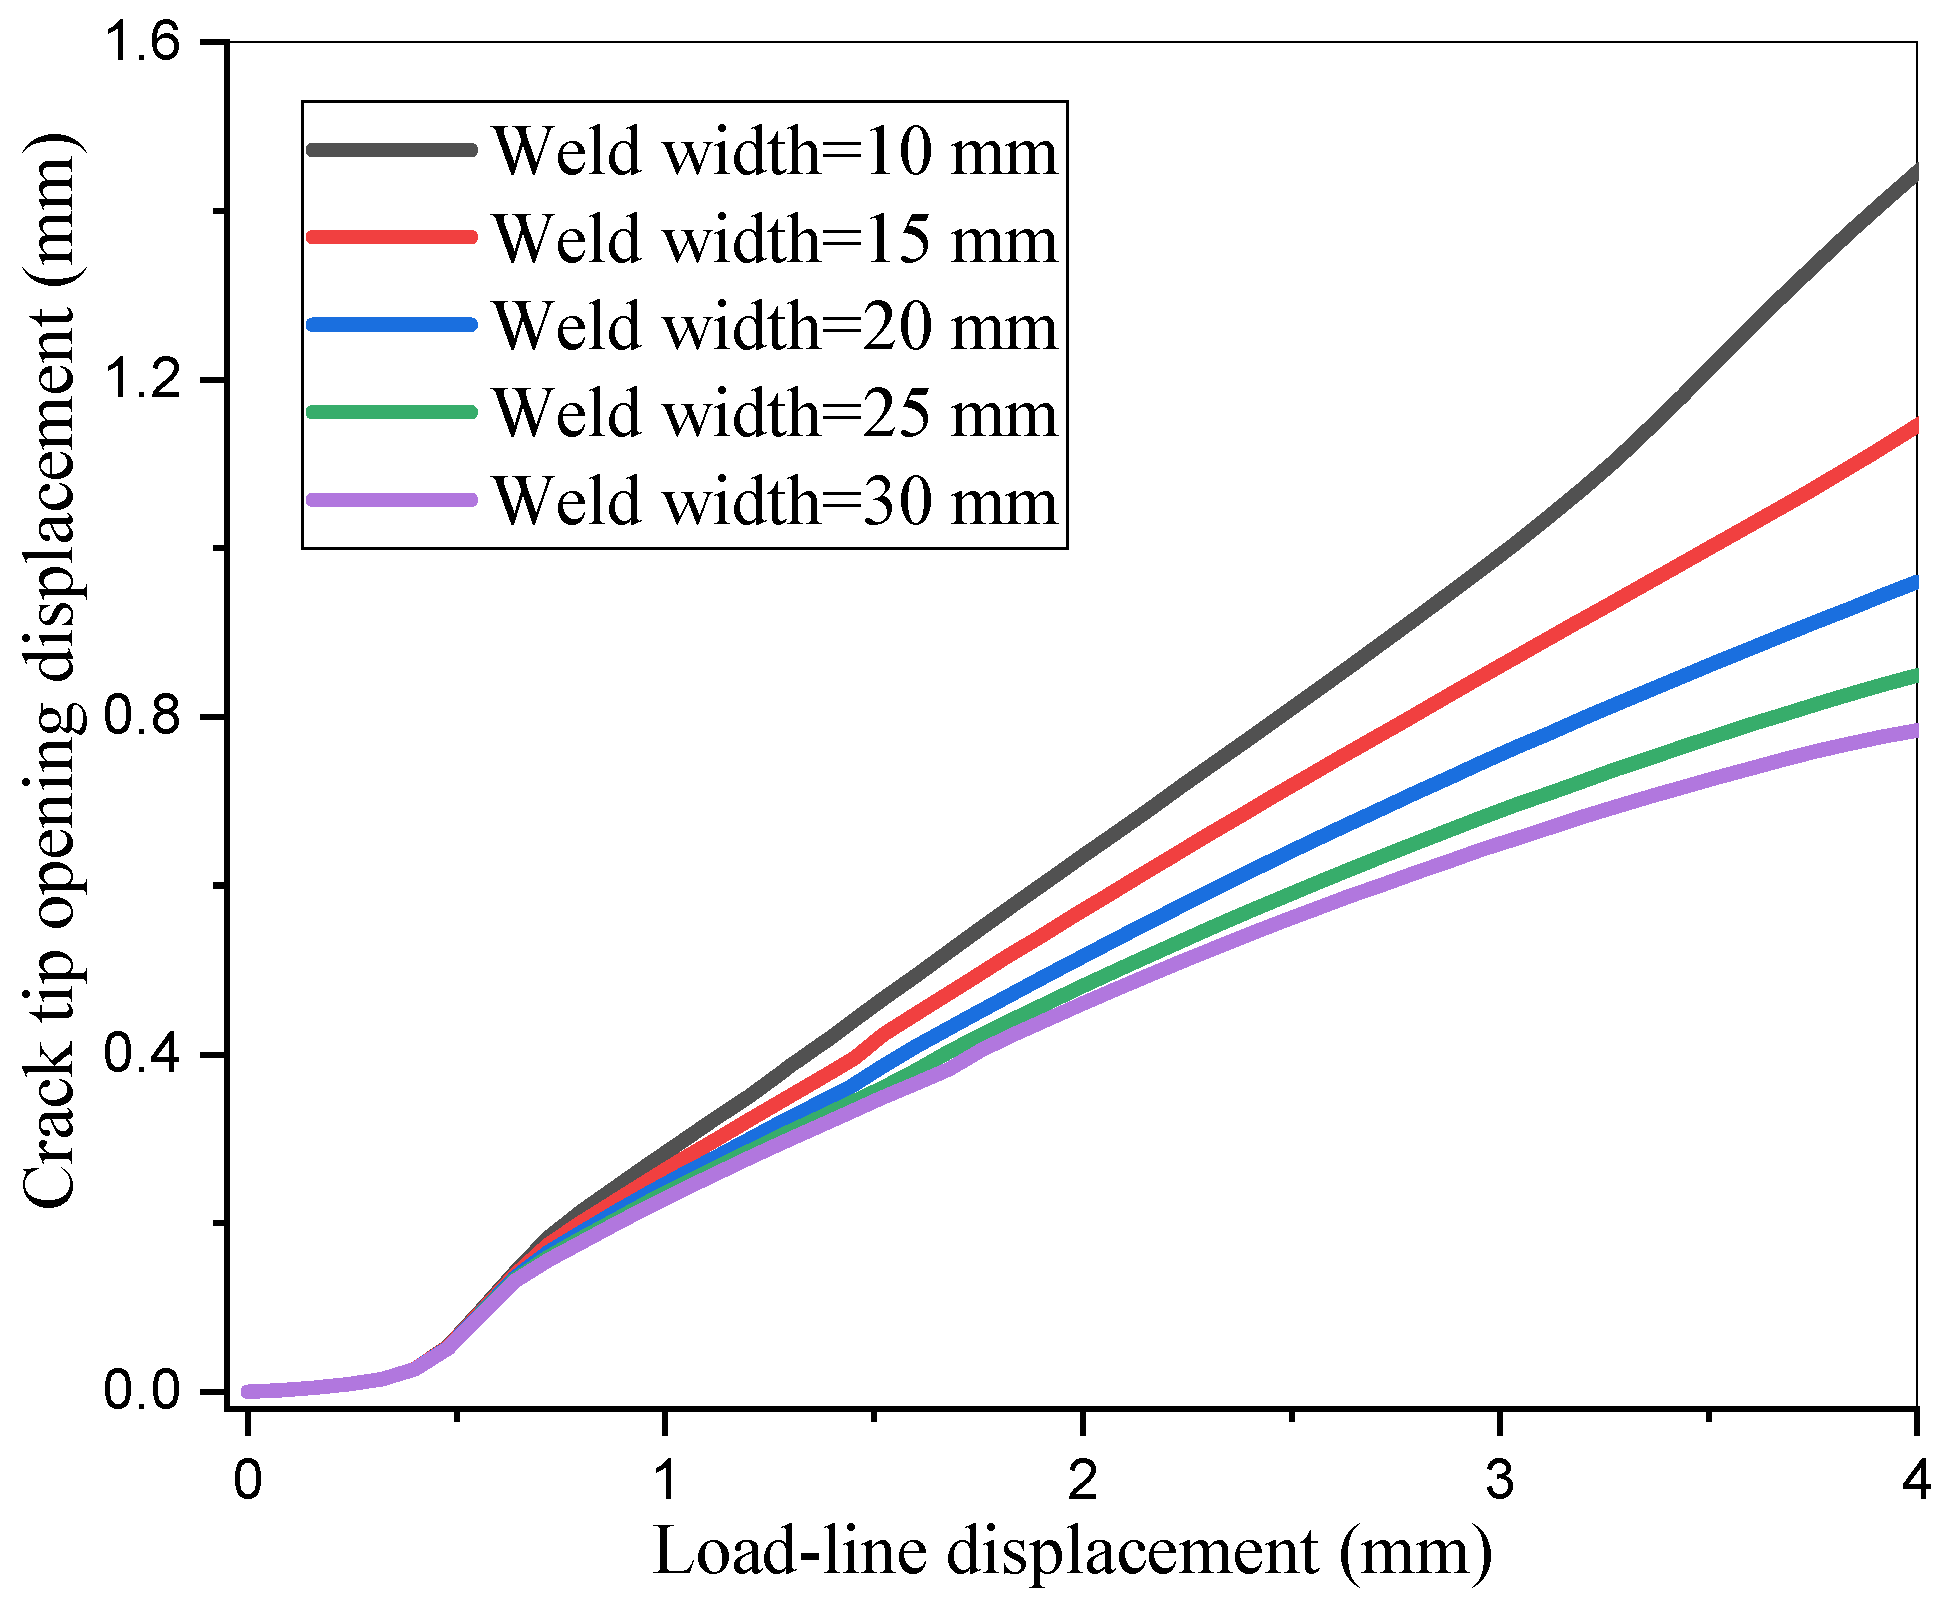
Five weld widths within 10–30 mm were analyzed while keeping the HAZ width at 5.0 mm. The CTOD responses are shown in Figure 22. At the early loading stage, CTOD increases rapidly, and the differences among weld widths are small. When the loading-line displacement exceeds approximately 0.7 mm, the CTOD growth rate decreases, particularly for larger weld widths. CTOD decreases with increasing weld width, which indicates that a wider overmatched weld region strengthens the local material constraint around the crack tip and reduces the apparent fracture toughness.
Figure 22.
CTOD response of SENT specimens with different weld widths.
4.3.2. Effect of HAZ Width
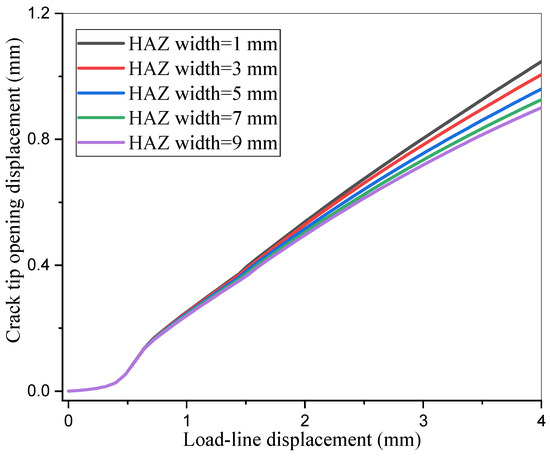
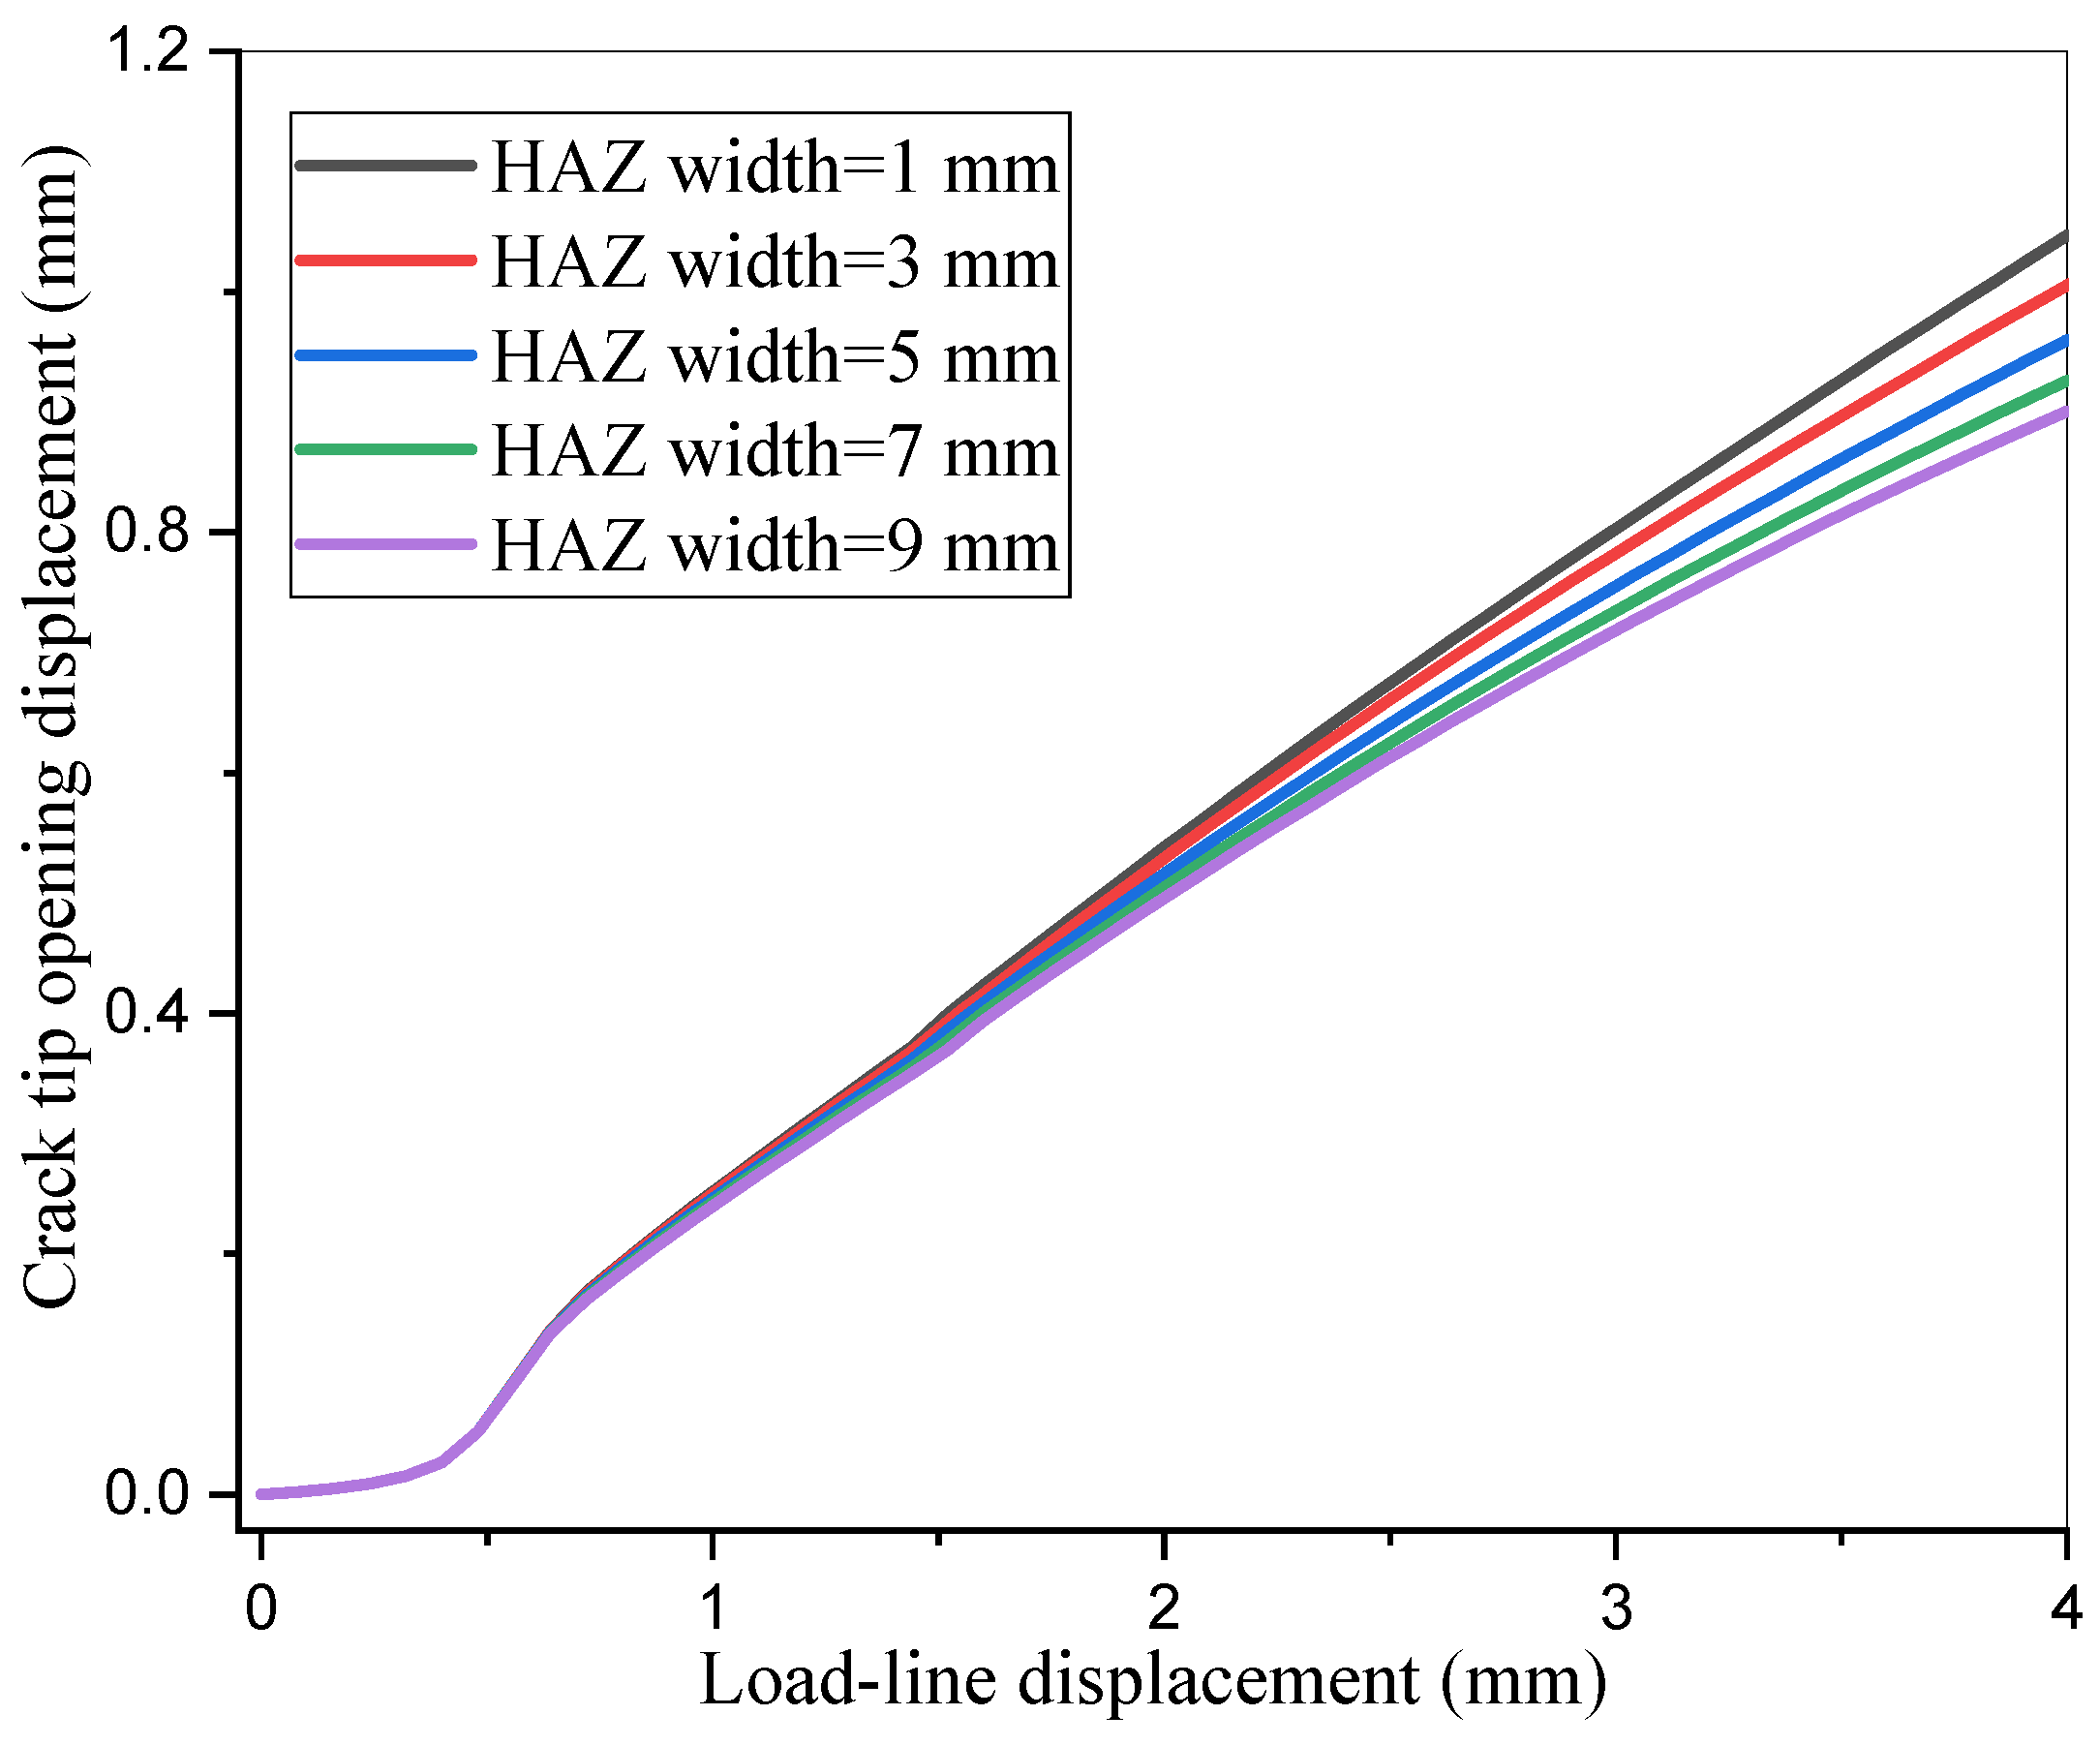
Five HAZ widths within 1–9 mm were analyzed while keeping the weld width at 20 mm. The CTOD responses are shown in Figure 23. CTOD increases rapidly at the early stage, then grows more slowly at larger loading-line displacements. With increasing HAZ width, CTOD decreases, although the reduction is more gradual than that caused by weld-width variation. This suggests that widening the HAZ increases the extent of the intermediate constraint region between the weld metal and base metals, thereby reducing the CTOD response in a relatively uniform manner.
Figure 23.
CTOD response of SENT specimens with different HAZ widths.
4.4. Effect of Strength Mismatch on CTOD Response
In addition to geometric variations, the mechanical properties of the weld metal and HAZs are difficult to control precisely during welding. Weld strength matching can be classified as undermatching, even matching, or overmatching, whereas HAZ properties may vary substantially because of welding heat input, the cooling rate, and microstructural transformation. In this study, the effects of weld-strength mismatch were examined under three representative HAZ strength scenarios: HAZ yield strength higher than, equal to, and lower than the yield strength of the corresponding base metal. These analyses clarify the coupled influence of weld mismatch and HAZ strength on the CTOD response.
4.4.1. HAZ Yield Strength Higher than Base-Metal Yield Strength
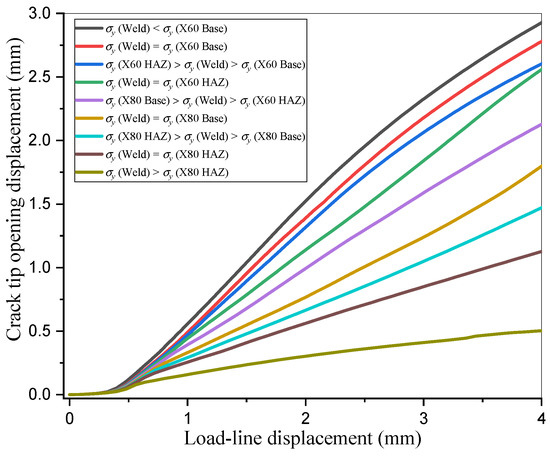
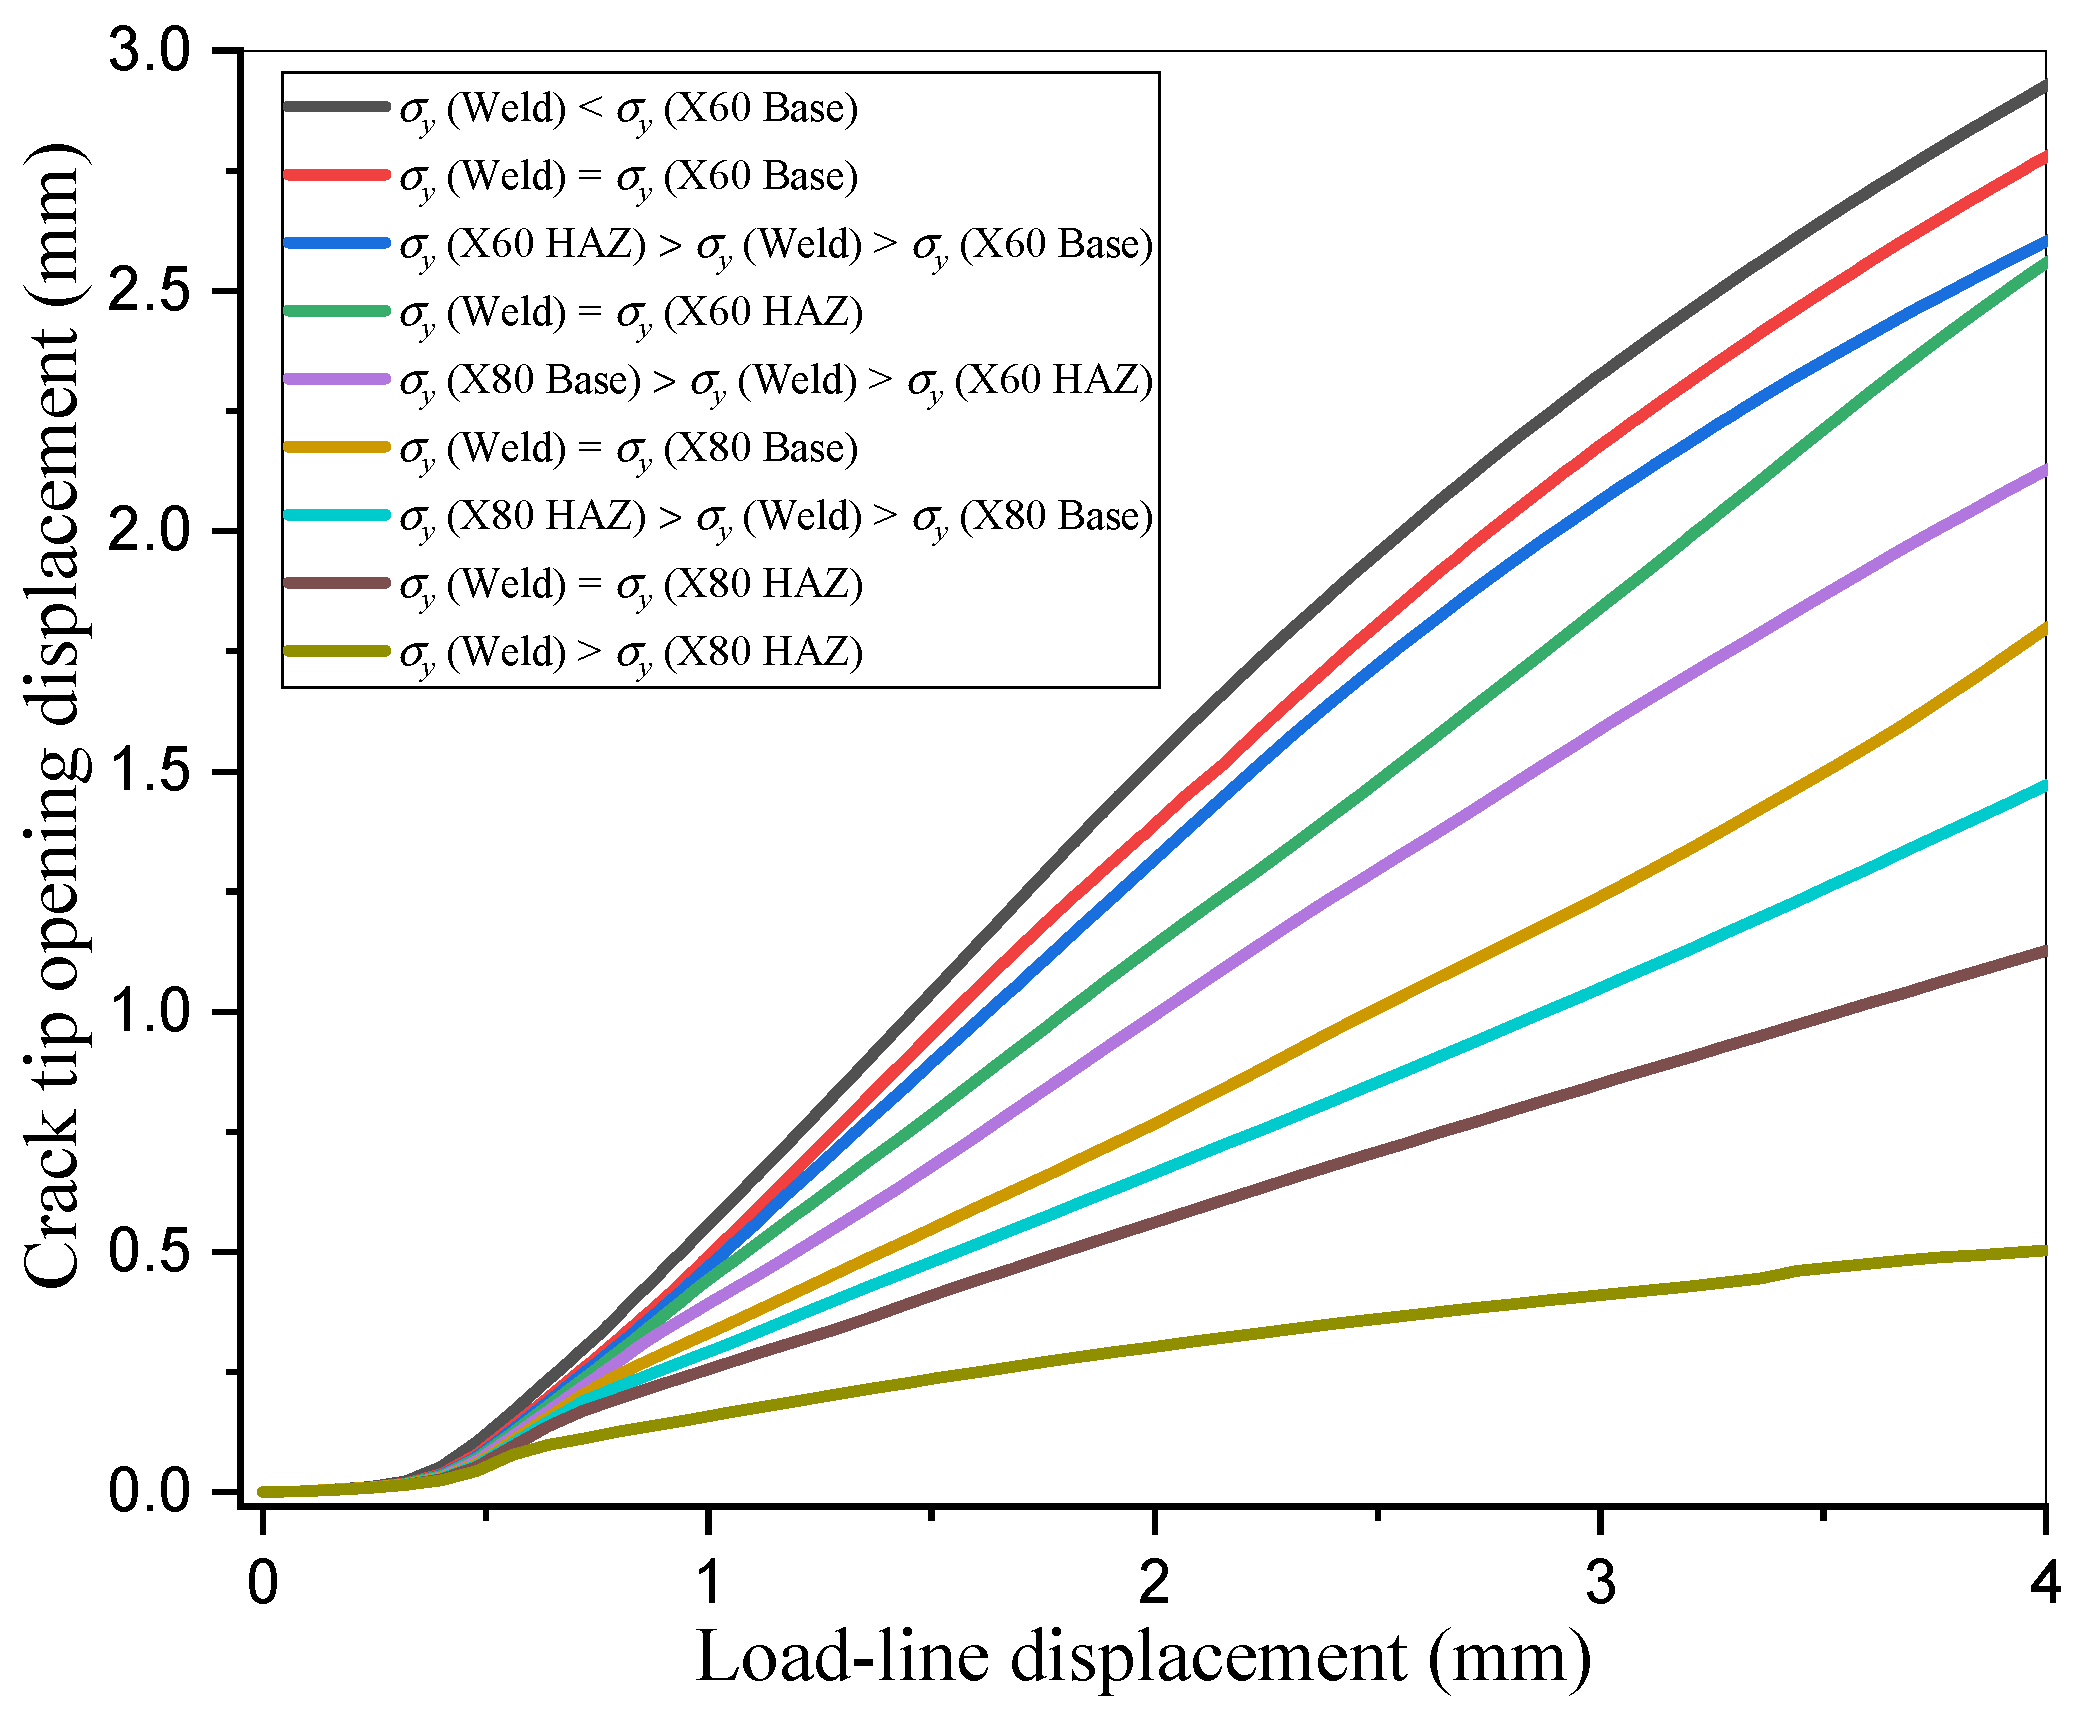
For the case in which the HAZ yield strength is higher than that of the corresponding base metal, nine weld-strength levels were considered. The weld yield strength was set to be lower than the X60 base metal, equal to the X60 base metal, between the X60 base metal and X60 HAZ, equal to the X60 HAZ, between the X60 HAZ and X80 base metal, equal to the X80 base metal, between the X80 base metal and X80 HAZ, equal to the X80 HAZ, and higher than the X80 HAZ. The CTOD responses for these mismatch conditions are shown in Figure 24. CTOD decreases progressively as the weld yield strength increases. Thus, when the HAZs are stronger than their adjacent base metals, increasing weld strength enhances crack-tip constraint and reduces the apparent fracture toughness.
Figure 24.
CTOD response for different weld-strength levels when HAZ yield strength is higher than base-metal yield strength.
4.4.2. HAZ Yield Strength Equal to Base-Metal Yield Strength
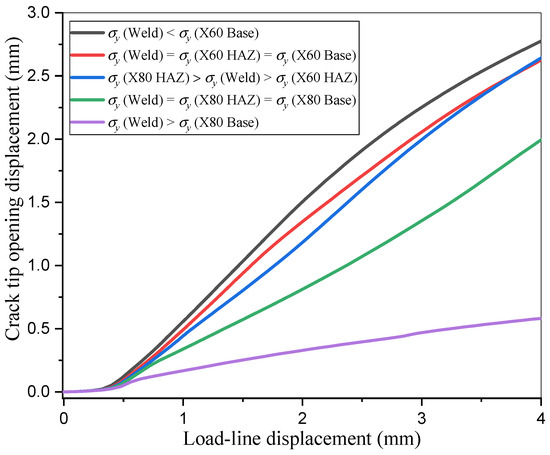
For the case in which the HAZ yield strength is equal to that of the corresponding base metal, five weld-strength levels were considered: lower than the X60 base/HAZ strength, equal to the X60 base/HAZ strength, between the X60 and X80 base/HAZ strengths, equal to the X80 base/HAZ strength, and higher than the X80 base/HAZ strength. The CTOD responses are shown in Figure 25. As the weld yield strength increases, CTOD decreases, but the sensitivity is lower than that observed when the HAZ is stronger than the base metal. This result indicates that when the HAZ does not introduce an additional strength gradient, the weld-metal mismatch remains the dominant source of material constraint.
Figure 25.
CTOD response for different weld-strength levels when HAZ yield strength is equal to base-metal yield strength.
4.4.3. HAZ Yield Strength Lower than Base-Metal Yield Strength
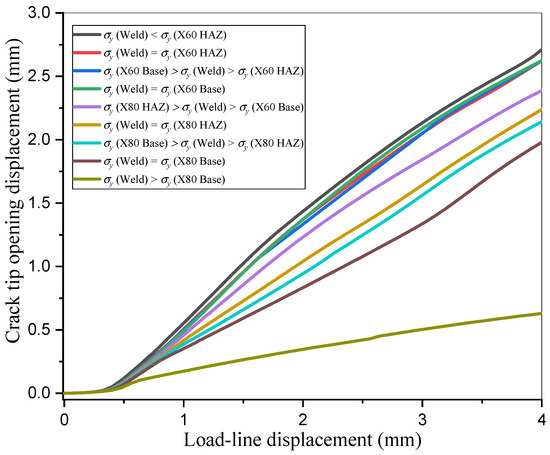
For the case in which the HAZ yield strength is lower than that of the corresponding base metal, nine weld-strength levels were considered. The weld yield strength was set to be lower than the X60 HAZ, equal to the X60 HAZ, between the X60 HAZ and X60 base metal, equal to the X60 base metal, between the X60 base metal and X80 HAZ, equal to the X80 HAZ, between the X80 HAZ and X80 base metal, equal to the X80 base metal, and higher than the X80 base metal. The CTOD responses are shown in Figure 26. Increasing weld strength generally reduces CTOD; however, the presence of a softened HAZ weakens the constraint effect and promotes local plastic deformation in the HAZ region. Therefore, the fracture-toughness response cannot be determined from weld strength alone. The relative strength of the HAZ must be explicitly incorporated into mismatch assessment for unequal-wall-thickness, dissimilar-girth welds.
Figure 26.
CTOD response for different weld-strength levels when HAZ yield strength is lower than base-metal yield strength.
4.5. Scope of Constraint Interpretation, Residual Stress, Uncertainty, and Model Limitations
The term constraint in this study is interpreted from changes in CTOD, together with the equivalent-stress and plastic-strain fields under controlled geometric and material variations. Classical Q-stress, T-stress, J-Q, and stress-triaxiality measures are highly relevant for a quantitative constraint assessment [36,37,38], but they are not evaluated here because the present work focuses on isolating the effects of five-zone material heterogeneity, crack/specimen dimensions, weld/HAZ widths, and strength mismatch. A dedicated comparison of these constraint metrics with CTOD is reserved for follow-up work.
Welding residual stresses and welding distortion are also excluded from the current FE initial state. This choice isolates the material-mismatch and idealized geometry effects and corresponds to an initially stress-free specimen. Residual stresses can modify crack-tip hydrostatic stress, local yielding, and fracture-driving force, so the present CTOD trends should not be interpreted as a complete as-welded structural-integrity assessment. A future coupled welding–thermal–mechanical/fracture analysis will be required to quantify these effects.
Additional simplifications concern material anisotropy and spatial gradients. Each of the five zones is modeled as isotropic and homogeneous using one representative tensile curve, although base metal, HAZ, and weld metal can exhibit directionality and continuously varying properties. Likewise, the geometry parametric study varies weld/HAZ widths while holding the assigned material curves fixed; in real welding, a change in heat input or bead geometry may change both the region width and local properties simultaneously. The present one-factor-at-a-time parameter sweeps therefore identify first-order sensitivities but do not quantify statistical uncertainty or interaction effects. A factorial/global-sensitivity study incorporating the finalized experimental scatter is identified as future work.
Finally, no direct SENT fracture-toughness measurement is currently available for the investigated X80-X60 joint. Consequently, the numerical results are presented as CTOD-response trends supported by local tensile experiments and literature-based verification of the FE procedure rather than as a fully experimentally validated critical toughness dataset for the target joint.
5. Conclusions
A five-region heterogeneous SENT model was developed to investigate the CTOD response associated with an unequal-wall-thickness X80-X60 girth welded joint by integrating local miniature tensile characterization with three-dimensional FE analysis. The study quantifies the relative effects of material heterogeneity, crack configuration, specimen constraint, weld geometry, weld/HAZ strength mismatch, and HAZ strength variation. Because direct SENT fracture-toughness tests for the target joint are not yet available, the conclusions below refer to numerical CTOD-response trends rather than experimentally measured critical toughness values.
- The unequal-wall-thickness X80-X60 girth welded joint exhibited pronounced local mechanical heterogeneity among the X80 base metal, X80 HAZ, weld metal, X60 HAZ, and X60 base metal. The experimentally measured tensile properties showed that the weld metal and HAZs had higher strength levels than their corresponding base metals, indicating that the use of nominal pipe-grade properties or homogeneous material assumptions is insufficient for fracture assessment of dissimilar-girth welds.
- The SENT FE procedure was verified against published X42 SENT force-CMOD data, with a reported maximum pointwise force deviation below 6.59% over the compared CMOD range. This literature comparison supports the numerical implementation but does not replace direct validation for the target X80-X60 joint. The heterogeneous model predicts discontinuities in stress/strain across material regions and asymmetric near-tip plastic deformation toward the lower-strength X60 side.
- Crack configuration and specimen dimension significantly affected the CTOD response. Increasing the initial crack length increased CTOD at the same loading-line displacement, reflecting an enhanced fracture-driving force for deeper cracks. In contrast, increasing the specimen thickness-to-width ratio reduced CTOD because of the higher out-of-plane constraint introduced by thicker specimens. Therefore, both crack depth and specimen geometry should be carefully controlled or corrected when using SENT specimens for fracture-toughness evaluation.
- Local weld geometry had a marked influence on apparent fracture toughness. Increasing weld width reduced CTOD by strengthening the constraint imposed by the overmatched weld region, while increasing HAZ width also decreased CTOD by enlarging the intermediate constraint zone between the weld metal and base metals. The influence of HAZ width was more gradual than that of weld width, but it remained non-negligible for CTOD-based assessment of dissimilar-girth welds.
- Weld-strength mismatch affected CTOD in a manner strongly dependent on the relative strength of the HAZ. When the HAZs were stronger than the corresponding base metals, increasing weld yield strength progressively reduced CTOD by enhancing crack-tip constraint. When the HAZ strength was equal to the base-metal strength, the weld-metal mismatch remained the dominant factor, but its influence was less pronounced. When softened HAZs were present, local plastic deformation in the HAZ weakened the constraint effect, demonstrating that the fracture response cannot be determined from weld-strength mismatch alone.
- The numerical results demonstrate that CTOD-based interpretation of heterogeneous X80-X60 girth-weld SENT specimens is sensitive to weld strength, HAZ strength, weld width, HAZ width, crack length, and specimen thickness. The full unequal-wall-thickness pipe-transition geometry, welding residual stress/distortion, quantitative Q/T/triaxiality constraint metrics, damage evolution, interaction effects, and direct target-joint SENT testing remain outside the present scope and should be addressed in subsequent work.
Author Contributions
Conceptualization, K.W. and M.Z.; Methodology, K.W.; Software, K.W. and W.H.; Validation, K.W. and D.C.; Formal analysis, K.W., W.H. and X.Y.; Investigation, K.W., D.C. and W.M.; Resources, M.Z., D.C. and W.M.; Data curation, K.W., D.C. and W.M.; Writing—original draft, K.W.; Writing—review and editing, M.Z., W.H. and X.Y.; Visualization, K.W.; Supervision, M.Z. and D.C.; Project administration, M.Z. and W.M.; Funding acquisition, M.Z. All authors have read and agreed to the published version of the manuscript.
Funding
This research was funded by by the National Key R&D Program of China (No. 2023YFB4606604) and the CNPC Science and Technology Project (No. 2023ZZ11-04).
Data Availability Statement
The original contributions presented in this study are included in the article. Further inquiries can be directed to the corresponding author.
Conflicts of Interest
Authors Ke Wang, Weifeng Ma, Weizhe Hao and Xuan Yang were employed by the company Tubular Goods Research Institute of CNPC. Author Dan Chen was employed by the company The Tenth Oil Production Plant of Changqing Oilfield Company. The remaining authors declare that the research was conducted in the absence of any commercial or financial relationships that could be construed as a potential conflict of interest.
References
- Pisarski, H.G.; Wignall, C.M. Fracture toughness estimation for pipeline girth welds. In Proceedings of the 4th International Pipeline Conference, Calgary, AB, Canada, 3 October–29 September 2002. [Google Scholar]
- Pisarsk, H.G. Determination of pipe girth weld fracture toughness using sent specimens. In Proceedings of the 2010 8th International Pipeline Conference, Calgary, AB, Canada, 1 October–27 September 2010. [Google Scholar]
- Shen, G.; Gianetto, J.A.; Tyson, W.R. Measurement of J-R Curves Using Single-Specimen Technique on Clamped SE(T) Specimens; International Society of Offshore and Polar Engineers Press: Osaka, Japan, 2009; pp. 72–81. [Google Scholar]
- Shen, G.; Gianetto, J.A.; Tyson, W.R. Development of Procedure for Low-Constraint Toughness Testing Using a Single-Specimen Technique; CANMET Materials Technology Laboratory: Hamilton, ON, Canada, 2008; Technical Report 2008-18. [Google Scholar]
- Xu, J.; Zhang, Z.L.; Østby, E.; Nyhus, B.; Sun, D. Effects of crack depth and specimen size on ductile crack growth of SENT and SENB specimens for fracture mechanics evaluation of pipeline steels. Int. J. Press. Vessels Pip. 2009, 86, 787–797. [Google Scholar] [CrossRef] [Scilit]
- Tang, H.; Macia, M.; Minnaar, K.; Gioielli, P.; Kibey, S.; Fairchild, D. Development of the SENT Test for Strain-Based Design of Welded Pipelines; University of Toronto Press: Calgary, AB, Canada, 2010; pp. 112–123. [Google Scholar]
- Verstraete, M.; Denys, R.; Van Minnebruggen, K.; Hertelé, S.; De Waele, W. Determination of CTOD resistance curves in side-grooved Single-Edge Notched Tensile specimens using full field deformation measurements. Eng. Fract. Mech. 2013, 110, 12–22. [Google Scholar] [CrossRef] [Scilit]
- Verstraete, M.A.; Hertelé, S.; Denys, R.M.; Van Minnebruggen, K.; De Waele, W. Evaluation and interpretation of ductile crack extension in SENT specimens using unloading compliance technique. Eng. Fract. Mech. 2014, 115, 190–203. [Google Scholar] [CrossRef] [Scilit]
- Geldhof, N.; Van Iseghem, J.; Verstraete, M.; Hertelé, S.; Van Minnebruggen, K.; De Waele, W. R-curve evaluation of pipeline girth welds using advanced measurement techniques. Int. J. Sustain. Constr. Des. 2015, 5, 10. [Google Scholar] [CrossRef] [Scilit]
- Verstraete, M.A.; De Waele, W.; Van Minnebruggen, K.; Hertelé, S. Single-specimen evaluation of tearing resistance in SENT testing. Eng. Fract. Mech. 2015, 148, 324–336. [Google Scholar] [CrossRef] [Scilit]
- Minnebruggen, K.V.; Verstraete, M.; Hertelé, S.; De Waele, W. Evaluation and Comparison of Double Clip Gauge Method and Delta 5 Method for CTOD Measurement in SE(T) Specimens. J. Test. Eval. 2016, 44, 20150127. [Google Scholar] [CrossRef] [Scilit]
- O’Dowd, N.P.; Shih, C.F. Family of crack-tip fields characterized by a triaxiality parameter-I. Structure of fields. J. Mech. Phys. Solids 1991, 39, 989–1015. [Google Scholar] [CrossRef] [Scilit]
- O’Dowd, N.P.; Shih, C.F. Family of crack-tip fields characterized by a triaxiality parameter-II. Fracture applications. J. Mech. Phys. Solids 1992, 40, 939–963. [Google Scholar] [CrossRef] [Scilit]
- Ainsworth, R.A.; O’Dowd, N.P. Constraint in the failure assessment diagram approach for fracture assessment. J. Press. Vessels Technol. 1995, 117, 260–267. [Google Scholar] [CrossRef] [Scilit]
- BS 8571:2014; Method of Test for Determination of Fracture Toughness in Metallic Materials Using Single Edge Notched Tension (SENT) Specimens. British Standards Institution: London, UK, 2014.
- Ruggieri, C. Low constraint fracture toughness testing using SE(T) and SE(B) specimens. Int. J. Press. Vessels Pip. 2017, 156, 23–39. [Google Scholar] [CrossRef] [Scilit]
- Tyson, W.R.; Ruggieri, C.; Zhou, W.; Wang, E.; Wang, X.; Ding, P. Effective modulus for crack size measurement with SENT specimens using unloading compliance. J. Test. Eval. 2017, 45, 20150488. [Google Scholar] [CrossRef] [Scilit]
- Menezes, J.T.O.D.; Ipiña, J.E.P.; Castrodeza, E.M. Normalization method for J-R curve determination using SENT specimens. Eng. Fract. Mech. 2018, 199, 658–671. [Google Scholar] [CrossRef] [Scilit]
- Liu, Z.; Wang, X.; Shi, S.; Shen, Y.; Chen, X. Application of modified normalization method for J-R curve determination using clamped SENT specimens with varying in-plane and out-of-plane constraints. Eng. Fract. Mech. 2020, 230, 106968. [Google Scholar] [CrossRef] [Scilit]
- Zhao, H.S.; Lie, S.T.; Zhao, Y. Fracture assessment of mismatched girth welds in oval-shaped clad pipes subjected to bending moment. Int. J. Press. Vessels Pip. 2018, 160, 1–13. [Google Scholar] [CrossRef] [Scilit]
- Xiao, Q.; Liu, Y.; Dai, Y. Developments of strain-based failure assessment diagram applications: Measuring reference strain by displacement and a modified assessment method. Int. J. Mech. Sci. 2018, 140, 27–36. [Google Scholar] [CrossRef] [Scilit]
- Lee, J.S.; Kim, M.H. Strain-based failure assessment based on a reference strain method for welded pipelines. J. Offshore Mech. Arct. Eng. 2020, 142, 041701. [Google Scholar] [CrossRef] [Scilit]
- Wu, K.; Liu, X.; Zhang, H.; Sui, Y.; Zhang, Z.; Yang, D.; Liu, Y. Fracture response of 1422-mm diameter pipe with double-V groove weld joints and circumferential crack in fusion line. Eng. Fail. Anal. 2020, 115, 104641. [Google Scholar] [CrossRef] [Scilit]
- Yang, Y.; Liu, X.; Wu, K.; Sui, Y.; Feng, Q.; Wang, D.; Zhang, H. Full-scale experimental investigation of the fracture behaviours of welding joints of APL X80 wide plate based on DIC technology. Eng. Fail. Anal. 2022, 131, 105832. [Google Scholar] [CrossRef] [Scilit]
- Zhang, T.; Shuai, Y.; Shuai, J.; Lv, Z.; Zhang, J.; Zhang, Y.; Wang, X.; Zhang, L. Study on fracture behaviour of pipeline girth welds based on curved wide plate specimens: Experimental and numerical analysis. Eng. Fract. Mech. 2024, 311, 110522. [Google Scholar] [CrossRef] [Scilit]
- Liu, X.; Zhang, J.; Chen, J.; Yang, Y.; Wang, Y.; Chen, P.; Ji, B. Full-scale tests and numerical investigation on the bending strain failure of low-strength-matched X80 pipeline girth welds. J. Pipeline Sci. Eng. 2026, 6, 100456. [Google Scholar] [CrossRef] [Scilit]
- Yang, Y.; Zhang, H.; Wu, K.; Chen, P.; Sui, Y.; Yang, D.; Liu, X. Strain capacity analysis of the mismatched welding joint with misalignments of D 1,422 mm X80 steel pipelines: An experimental and numerical investigation. J. Pipeline Sci. Eng. 2021, 1, 212–224. [Google Scholar] [CrossRef] [Scilit]
- Jiang, Q.; Zhang, X.; Cao, Y.; He, Y.; Zhen, Y.; Wu, G. Research on tensile strain capacity model for FCAW/SMAW girth weld pipeline. Int. J. Press. Vessels Pip. 2026, 221, 105759. [Google Scholar] [CrossRef] [Scilit]
- Jiang, J.; Wu, K.; Dai, L.; Li, M.; Liu, X.; Zhang, H. Investigation on fracture mechanism and tensile strain capacity of X80 pipeline welded joints with centerline/fusion line crack. Int. J. Press. Vessels Pip. 2026, 222, 105854. [Google Scholar] [CrossRef] [Scilit]
- Zhang, Y.; Wang, F.; Lv, Z.; Zhang, T.; Shuai, J. Study on the fracture failure mechanism of full-scale pipeline girth welds with central/interfacial crack. Int. J. Press. Vessels Pip. 2026, 219, 105655. [Google Scholar] [CrossRef] [Scilit]
- Su, L.; Xu, J.; Song, W.; Chu, L.; Gao, H.; Li, P.; Berto, F. Numerical investigation of strength mismatch effect on ductile crack growth resistance in welding pipe. Appl. Sci. 2020, 10, 1374. [Google Scholar] [CrossRef] [Scilit]
- Chen, H.; Dai, L.; Xuan, H.; Gao, X.; Yang, K.; Wang, L.; Chi, Q.; Huo, C. Tensile strain capacity prediction model of an X80 pipeline with improper transitioning and undermatched girth weld. Materials 2022, 15, 7134. [Google Scholar] [CrossRef] [Scilit] [PubMed]
- Guo, B.; Deng, C.; Gong, B.; Liu, Y.; Ning, J.; Zhang, K. Numerical investigation of the influence of geometric features and weld metal properties on stress and strain states in X80 girth welds. Metals 2025, 15, 986. [Google Scholar] [CrossRef] [Scilit]
- Q/SY GJX0221-2012; Technical Specification for Welding of Station Pipeline Networks in the West-East Gas Pipeline Phase III Project. China Petroleum Publishing House: Beijing, China, 2012.
- GB/T8110-2008; Welding Electrodes and Rods for Gas Shielding Arc Welding of Carbon and Low Alloy Steel. Standard Press of China: Beijing, China, 2009.
- GB/T5118-2012; Covered Electrodes for Manual Metal Arc Welding of Creep-Resisting Steels. Standard Press of China: Beijing, China, 2012.
- Wang, K.; Zhang, M.; Cao, J.; Tan, C.; Li, J.; Ma, W.; Nie, H.; Ren, J. Micro-Tensile Characterization of Heterogeneous Girth Welds in Unequal Wall Thickness X80/X60 Pipelines. Metals 2026, 16, 252. [Google Scholar] [CrossRef] [Scilit]
- Østby, E.; Nyhus, B.; Hauge, M.; Levold, E.; Sandvik, A.; Thaulow, C. Strain capacity of SENT specimens—Influence of weld metal mismatch and ductile tearing resistance. In Proceedings of the Eighteenth International Offshore and Polar Engineering Conference, Vancouver, BC, Canada, 6–11 July 2008. [Google Scholar]
- Cravero, S.; Bravo, R.E.; Ernst, H.A. Constraint evaluation and effects on J-R resistance curves for Pipes under combined load conditions. In Proceedings of the Eighteenth International Offshore and Polar Engineering Conference, Vancouver, BC, Canada, 6–11 July 2008. [Google Scholar]
- Xia, L.; Shih, C.F.; Hutchinson, J.W. A computational approach to ductile crack growth under large scale yielding conditions. J. Mech. Phys. Solids 1995, 43, 389–413. [Google Scholar] [CrossRef] [Scilit]
- Rice, J.R. A path independent integral and the approximate analysis of strain concentration by notches and cracks. J. Appl. Mech. 1968, 35, 379–386. [Google Scholar] [CrossRef] [Scilit]
- Ameli, I.; Asgarian, B.; Lin, M.; Agbo, S.; Imanpour, A.; Duan, D.-M.; Cheng, R.; Adeeb, S. Determination of CMOD-force curves and R-curves in side-grooved single edge notched tensile (SENT) specimens in welded X42 pipeline steel. Int. J. Press. Vessels Pip. 2018, 163, 68–74. [Google Scholar] [CrossRef] [Scilit]

Disclaimer/Publisher’s Note: The statements, opinions and data contained in all publications are solely those of the individual author(s) and contributor(s) and not of MDPI and/or the editor(s). MDPI and/or the editor(s) disclaim responsibility for any injury to people or property resulting from any ideas, methods, instructions or products referred to in the content. |
© 2026 by the authors. Licensee MDPI, Basel, Switzerland. This article is an open access article distributed under the terms and conditions of the Creative Commons Attribution (CC BY) license.