


Abstract
In this study, an “oxide layer” was formed on the surface of Cu-0.97Cr-0.11Zr alloy sheets by introducing oxygen via a non-vacuum solid solution treatment, followed by vacuum solid solution and aging treatments to obtain a layered composite microstructure. The macro- and microstructures were characterized using optical microscopy (OM), scanning electron microscopy (SEM), and transmission electron microscopy (TEM). Furthermore, the properties of the alloy were evaluated through electrical conductivity and hardness measurements. The results indicate that during the non-vacuum solid solution process, oxygen atoms diffused into the copper alloy matrix and underwent an in situ oxidation reaction with the solute Cr. As the temperature increased from 800 °C to 900 °C, the thickness of the oxide layer grew from 23.2 μm to 77.8 μm. The formation of Cr2O3 nanophases within the oxide layer increased the alloy hardness from 87.3 HV to 101.8 HV and the electrical conductivity from 68.75% IACS to 78.85% IACS. Following subsequent vacuum solid solution and aging treatments, both hardness and electrical conductivity were significantly enhanced, reaching an edge hardness of 114.6 HV, a core hardness of 125.1 HV, and a conductivity of 80.32% IACS. Through this method, a layered composite structure of the Cu-0.97Cr-0.11Zr alloy, characterized by a highly conductive surface and a high-hardness core, can be successfully obtained.
1. Introduction
Cu-Cr-Zr alloys, as typical precipitation-strengthened copper alloys, have been widely applied in electrical connectors, contact wires for electrified railways, and spring contacts due to their excellent mechanical properties, outstanding electrical and thermal conductivities, and high softening resistance [1,2,3,4,5]. The performance of Cu-Cr-Zr alloys primarily relies on the control of precipitates during the solution-aging process. Although traditional solution-aging treatments significantly improve the overall properties of alloys, this process inevitably falls into a dilemma. Mechanical strength and electrical conductivity are mutually exclusive. Specifically, solution treatment effectively increases solute supersaturation for subsequent precipitation. However, the lattice distortion induced by solute atoms intensifies electron scattering, thereby reducing the conductivity [6,7,8,9]. A higher solid solubility can enhance precipitation strengthening during aging. Yet, it often leads to incomplete matrix purification and sacrifices conductivity. On the other hand, over-pursuing high conductivity inevitably causes the coarsening of precipitates and decreases the strength [10,11]. Therefore, maximizing the solid solubility of Cr during the solution treatment and promoting its effective precipitation during aging are crucial for the comprehensive properties of Cu-Cr-Zr alloys.
In recent years, researchers have begun to focus on the effect of oxygen on the microstructural evolution of copper alloys during high-temperature treatments. Oxygen exhibits a high diffusion rate in copper, capable of both grain boundary diffusion and lattice diffusion at elevated temperatures [12,13]. More importantly, oxygen has a strong affinity for Cr, enabling it to preferentially react with the dissolved Cr in the matrix to form chromium oxides. These oxides typically exhibit poor crystallographic matching with the Cu matrix and high interfacial energy, making them highly prone to precipitate from the matrix [14]. This provides a novel strategy based on oxygen-induced in situ precipitation: by introducing oxygen during the solution treatment, a portion of Cr is promoted to precipitate early in the form of oxides. This process significantly reduces the concentration of dissolved Cr in the matrix, thereby enhancing the electrical conductivity, while the oxide particles themselves may also contribute to the mechanical properties.
Fundamentally, internal oxidation is a method of selectively oxidizing solute elements in an alloy via oxygen diffusion. Unlike traditional internal oxidation processes that require oxygen-supplying media such as Cu2O, the direct internal oxidation process in air developed in recent years is much simpler and more practical [15,16]. In Cu-Cr alloys, internal oxidation promotes the precipitation of Cr from the matrix to form dispersedly distributed Cr2O3 particles. Because of their excellent thermal stability, these particles not only improve the electrical conductivity but also significantly enhance the softening resistance and wear resistance of the alloy [17,18,19,20]. Furthermore, studies have shown that the thickness of the internal oxide layer can be regulated by controlling the non-vacuum solution temperature and time, enabling the precise design of layered composite structures [21,22,23]. Previous fundamental research has confirmed the viability of the internal oxidation method in Cu-Al and Cu-Cr alloy systems. Meanwhile, recent advancements have extended this concept to design layered gradient structures in complex alloys. This offers a novel approach to fabricating layered composites characterized by a “highly conductive surface and a high-hardness core.”
However, a critical review of the existing literature reveals several significant limitations. First, most internal oxidation mechanisms have been investigated within simplified binary systems, leaving the complex competitive element interactions and precipitation behaviors in ternary Cu-Cr-Zr alloys largely unexplored. Second, conventional single-step oxidation treatments often fail to precisely control the spatial distribution of the microstructure; while surface hardening is achieved, it frequently sacrifices the core’s potential for subsequent precipitation strengthening. We introduced a combined process integrating internal oxidation, vacuum solution treatment, and aging treatments. The macroscopic properties, including electrical conductivity and hardness, were carefully evaluated. Concurrently, by analyzing the microstructural evolution in both the surface and core regions, we systematically elucidated how internal oxidation dictates the overall microstructure and performance of the Cu-Cr-Zr alloy.
2. Materials and Methods
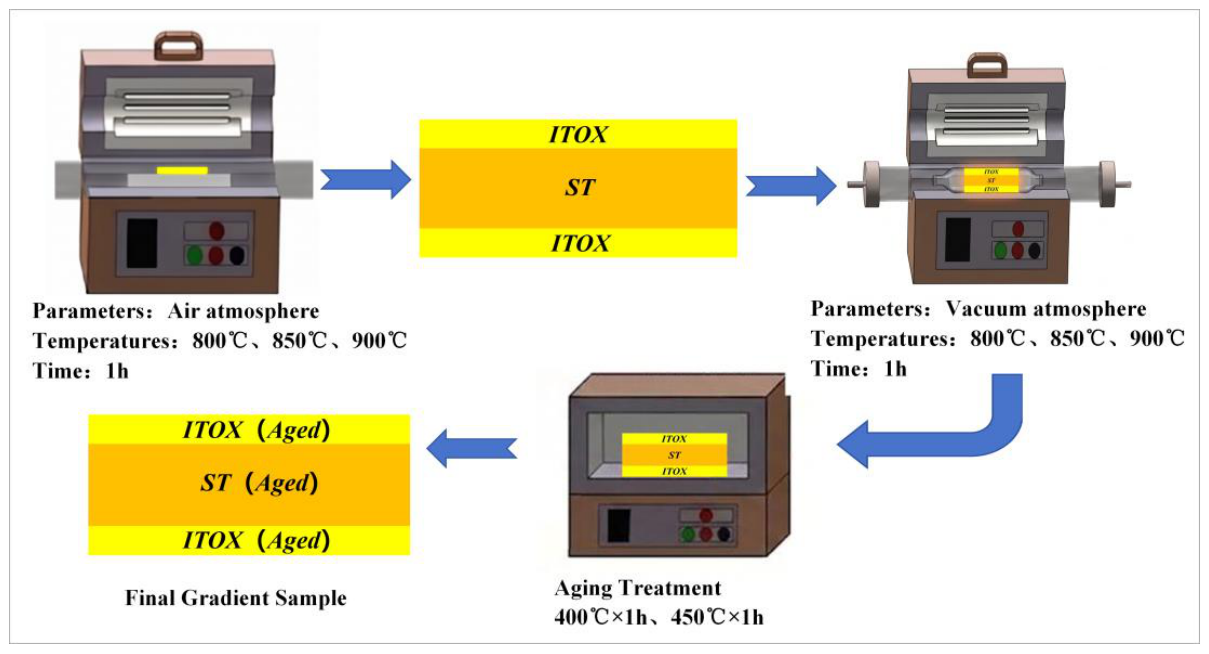
The starting materials used in this study were continuously extruded Cu-0.97Cr-0.11Zr alloy sheets. The samples for microstructural observation and property testing were cut into dimensions of 20 mm × 20 mm × 2 mm along the transverse cross-section perpendicular to the extrusion direction. While continuous extrusion inevitably induces crystallographic texture, its effect on the mechanical and electrical properties is considered secondary in this study, as the massive precipitation of nanoscale particles during subsequent treatments plays an absolutely dominant role [24,25,26]. Subsequently, a non-vacuum solution treatment was performed. The selected temperatures were 800 °C, 850 °C, and 900 °C, with a holding time of 1 h. The furnace atmosphere was static air, and no protective gas was introduced during the heating process. Following this treatment, an internal oxidation layer (denoted as ITOX) formed on the surface of the alloy, while the unoxidized core region effectively underwent a standard solution treatment (denoted as ST). Subsequently, the treated samples were subjected to a vacuum solution treatment (denoted as VST) at 950 °C for 1 h, aiming to further dissolve the residual Cr phases in the surface layer into the matrix. Finally, the samples underwent aging treatments at 400 °C and 450 °C for 1 h. The experimental flow is illustrated in Figure 1.
Figure 1.
Experimental procedure.
The electrical conductivity of the samples was measured using a SIGMATEST 2.070 (Institut Dr. Foerster GmbH & Co. KG, Reutlingen, Germany) eddy current conductivity meter. The testing frequency was set at 480 kHz. The final conductivity value was determined by averaging three measurements. All results are expressed in % IACS. Vickers microhardness measurements were performed on a fully automatic INNOVATEST FALCON 500 (INNOVATEST Europe B.V., Maastricht, The Netherlands) tester using an applied load of 50 g and a dwell time of 15 s. The edge hardness was measured in the region 20 to 40 μm from the surface. The core hardness was measured in the region 0.5 to 1.5 mm from the surface. To ensure the accuracy of the results, at least five different positions were measured within the test area. The spacing between adjacent test points was 0.3 mm. Their average was taken as the final hardness value. The alloy specimens were initially rough-ground with SiC paper and subsequently polished using W2.5 and W1.5 diamond pastes. The polished samples were then etched in a custom etchant (5 g FeCl3 + 10 mL HCl + 100 mL C2H5OH) and sequentially rinsed with water and absolute ethanol. Ultimately, their cross-sectional microstructures were examined under a Keyence VHX-6000 (Keyence Corporation, Osaka, Japan) optical microscope (OM). To characterize the morphology and elemental composition, a Zeiss Merlin Compact (Carl Zeiss Microscopy GmbH, Jena, Germany) scanning electron microscope (SEM) was employed at an operating voltage of 20 kV. The SEM samples shared the same preparation procedure and observation plane as the OM samples. Furthermore, an FEI Talos F200X (Thermo Fisher Scientific (FEI), Waltham, MA, USA) transmission electron microscope (TEM) was utilized to analyze the detailed microstructure and precipitate features. For TEM observation, the specimens were thinned using the Gatan 695 ion milling system. The milling was conducted at an ion beam energy of 5 kV and a gun angle of ±8° for 5 min until perforation. The selected area electron diffraction (SAED) patterns were indexed by measuring the distances and angles between diffraction spots. The interplanar spacings were calculated using the camera constant equation and then compared with standard crystallographic data to identify the corresponding crystal phases and zone axes.
3. Results and Discussion
3.1. Effect of Non-Vacuum Solution Treatment on the Microstructure and Properties of Cu-Cr-Zr Alloys
3.1.1. Effect of Non-Vacuum Solution Treatment on the Microstructure of Cu-Cr-Zr Alloys
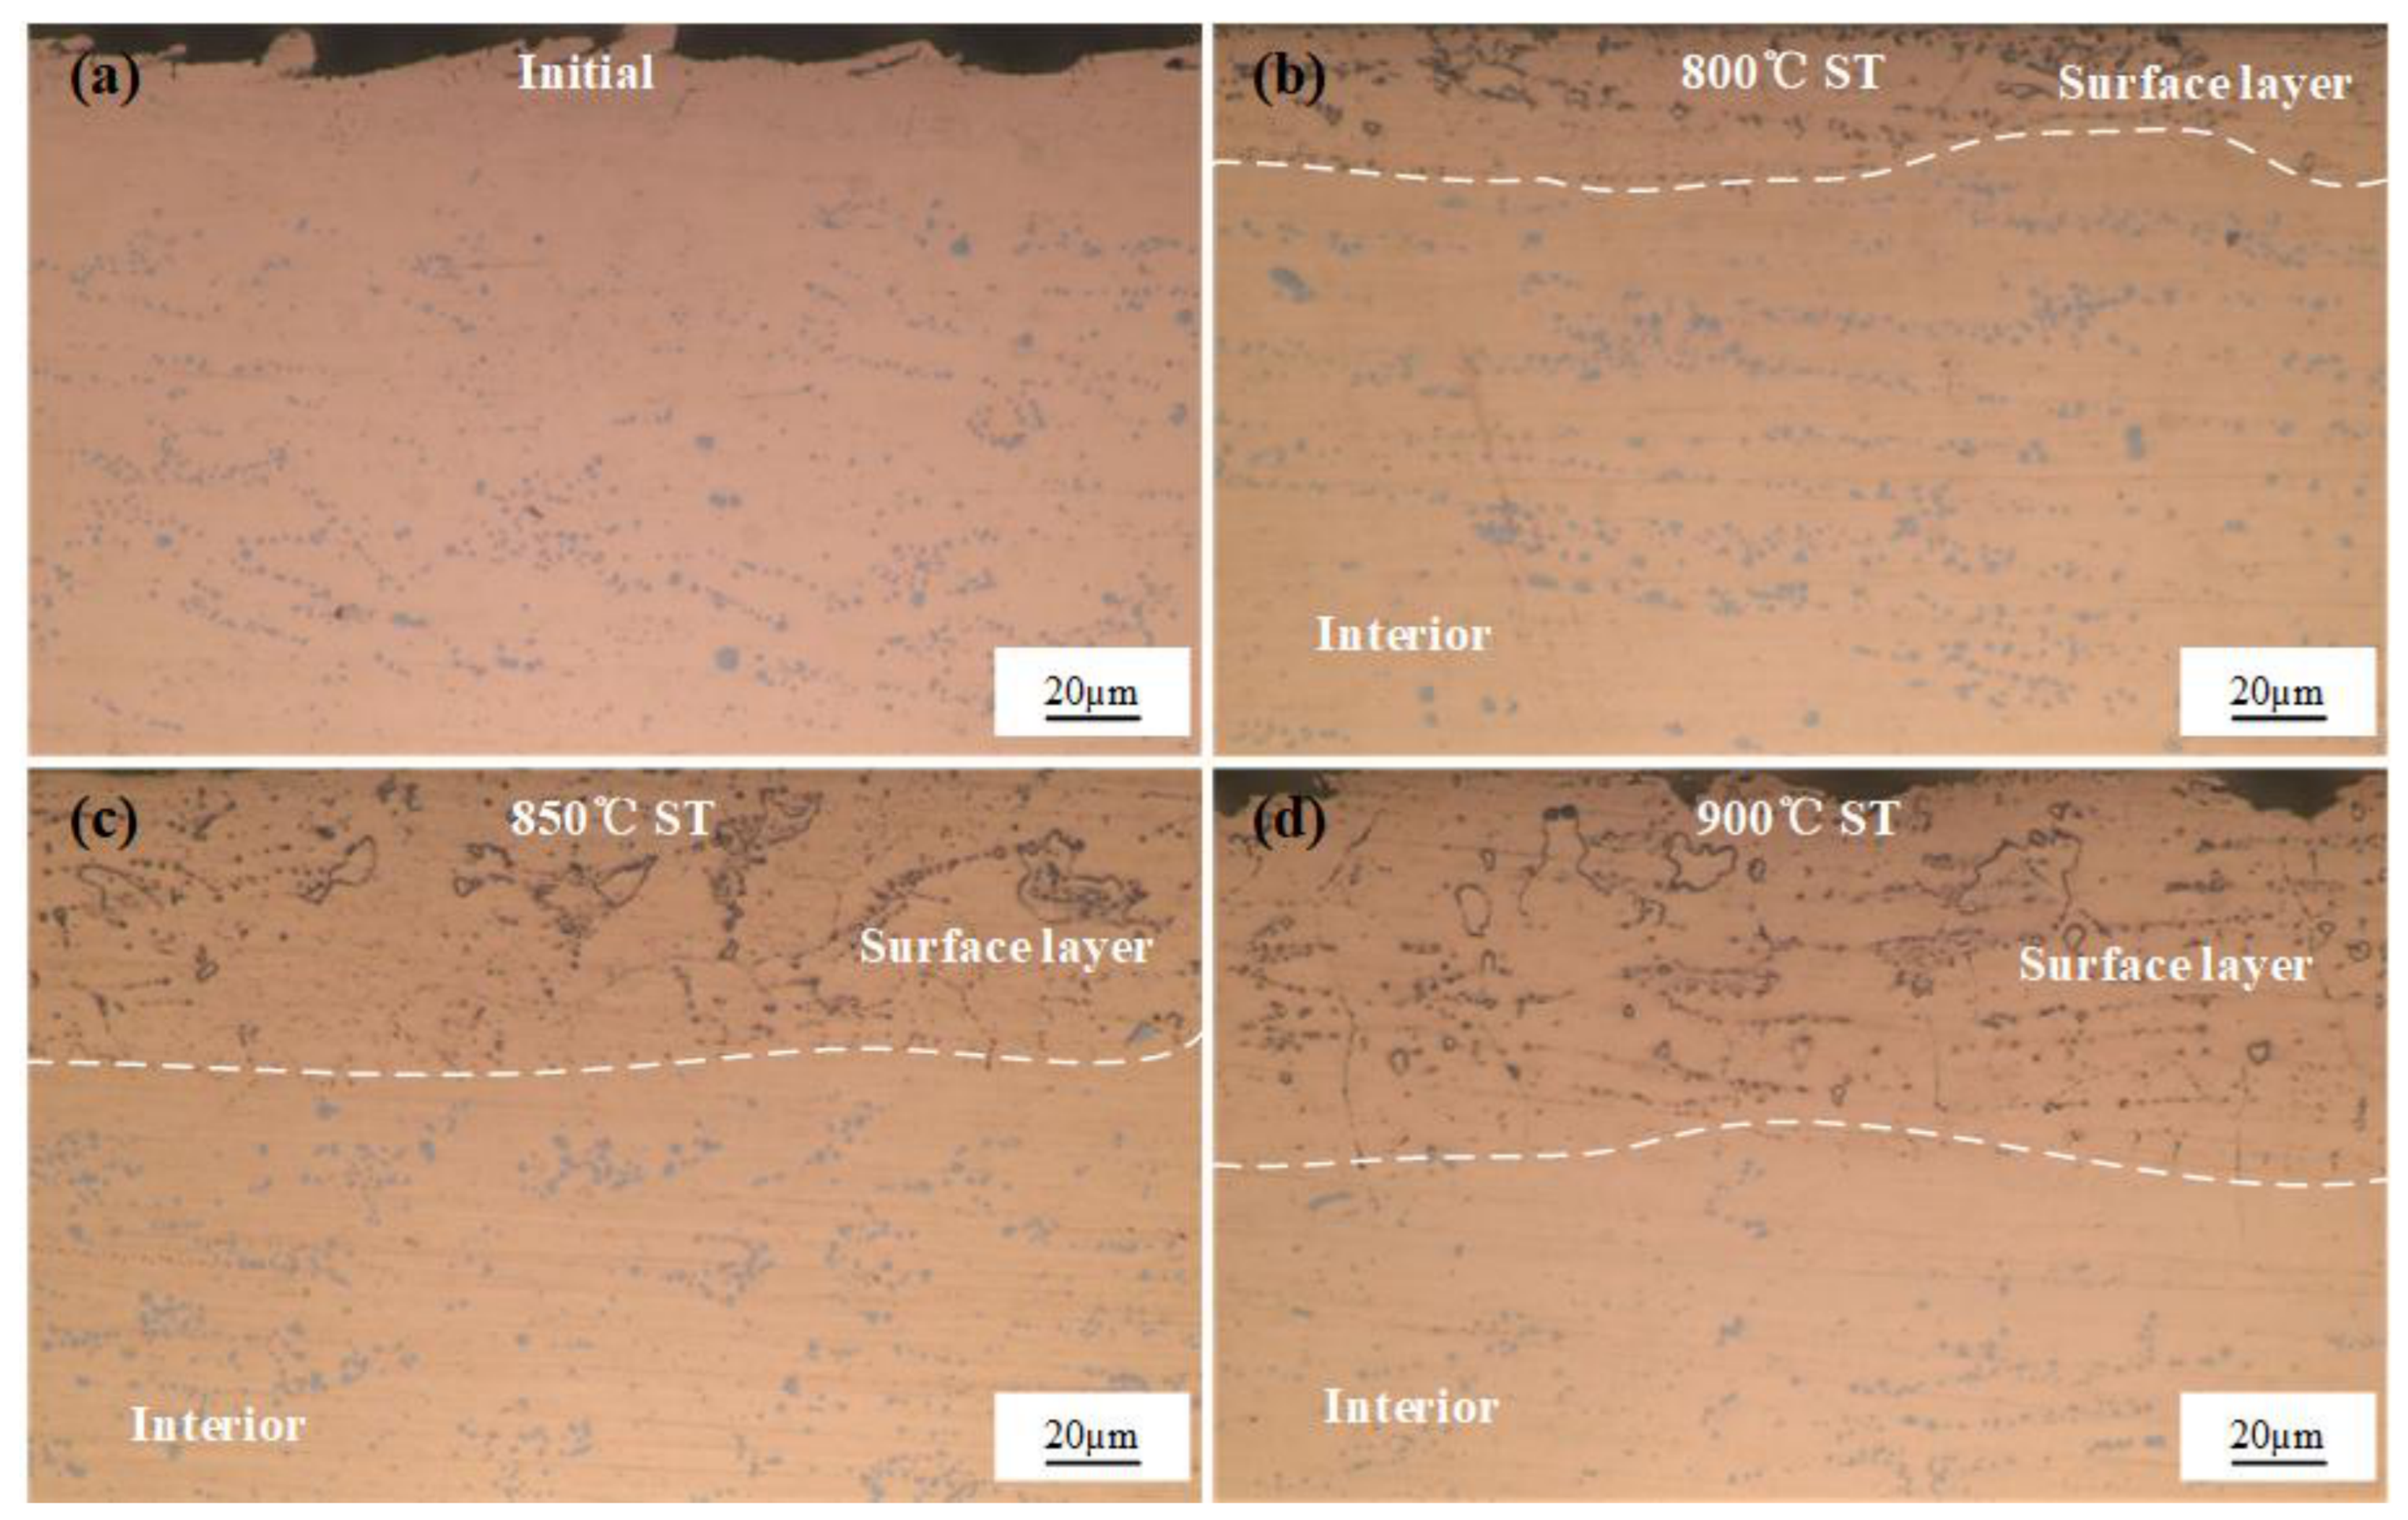
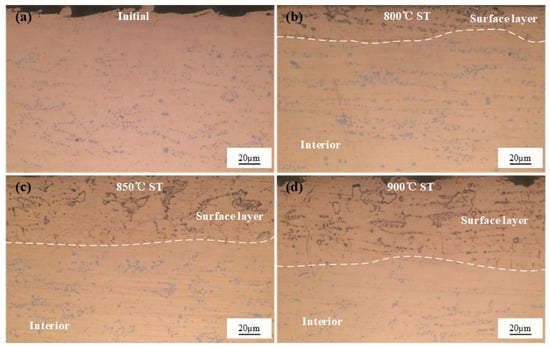
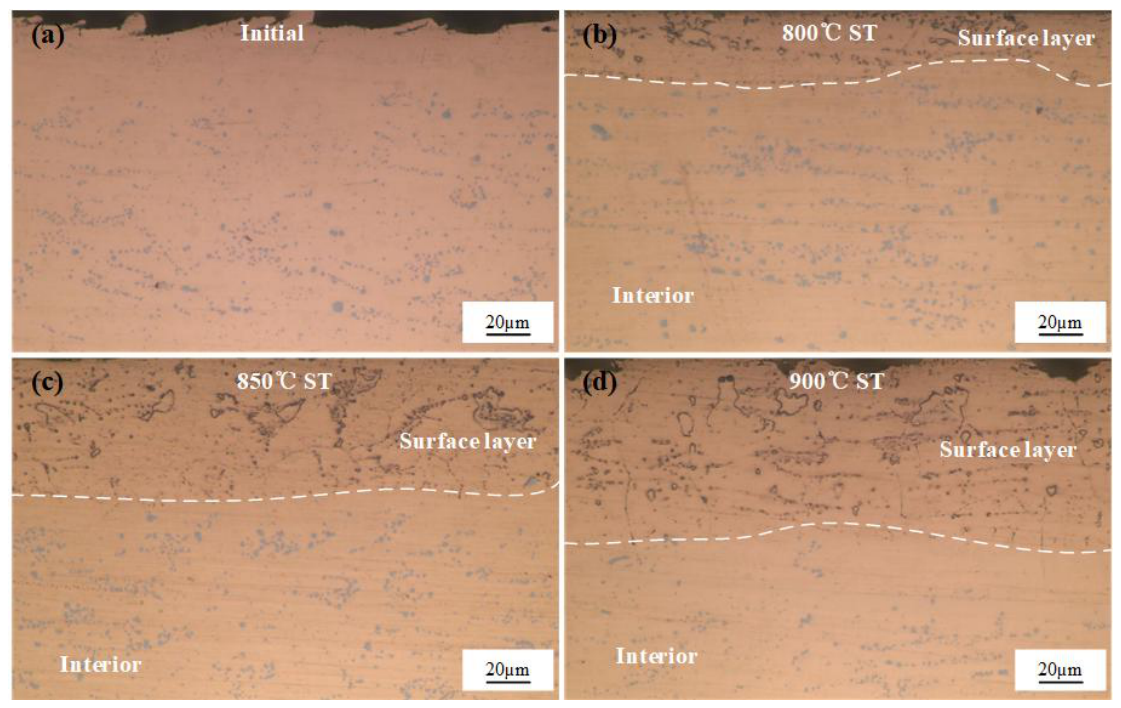
Figure 2 shows the unetched optical micrographs of the alloy samples following the non-vacuum solution treatment at different temperatures for 1 h. As observed in the initial alloy (Figure 2a), a large amount of light-blue granular and reticular primary Cr phases was distributed with a certain directionality. When the solution temperature was 800 °C (Figure 2b), a relatively thin oxide layer began to form on the surface, with a thickness of approximately 23.2 μm. Within this oxide layer, numerous fine black oxide particles and ring-like structures were observed. Additionally, some incompletely dissolved Cr phases (indicated by the black box and green arrows) still remained in the microstructure, exhibiting a solid center and a ring-like edge. Meanwhile, the alloy core retained abundant light-blue undissolved primary Cr phases, indicating that the 800 °C solution treatment was insufficient for the complete dissolution of the primary Cr phases. At a solution temperature of 850 °C (Figure 2c), the oxide layer thickness increased significantly to about 57.1 μm. Within this oxide layer, grain boundaries gradually became distinct, and the granular phases decreased notably, starting to transform into ring-like structures. The light-blue particles in the core began to decrease, suggesting that more Cr dissolved into the Cu lattice as the temperature rose. When the temperature reached 900 °C (Figure 2d), the internal oxide layer thickness further increased to around 77.8 μm. The ring-like structures in the oxide layer increased significantly, and the black oxide particles formed a continuous network along the grain boundaries. The light-blue phases in the core decreased substantially, resulting in a cleaner matrix, which indicates that most of the Cr had dissolved into the Cu lattice at 900 °C. The above microstructural features demonstrate that after the non-vacuum solution treatment, the alloy sheet has evidently formed a layered composite structure composed of a surface internal oxidation zone and a core unoxidized solid solution zone.
Figure 2.
Unetched optical micrographs of the alloy after non-vacuum solution treatment for 1 h: (a) initial state; (b) 800 °C; (c) 850 °C; (d) 900 °C.
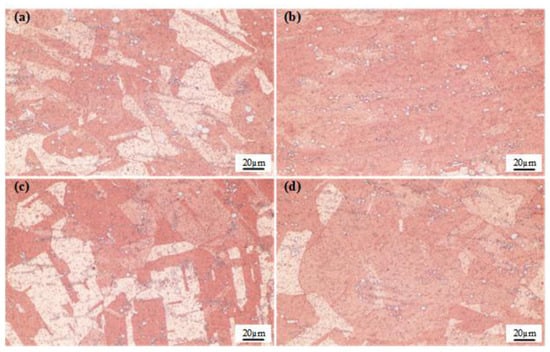
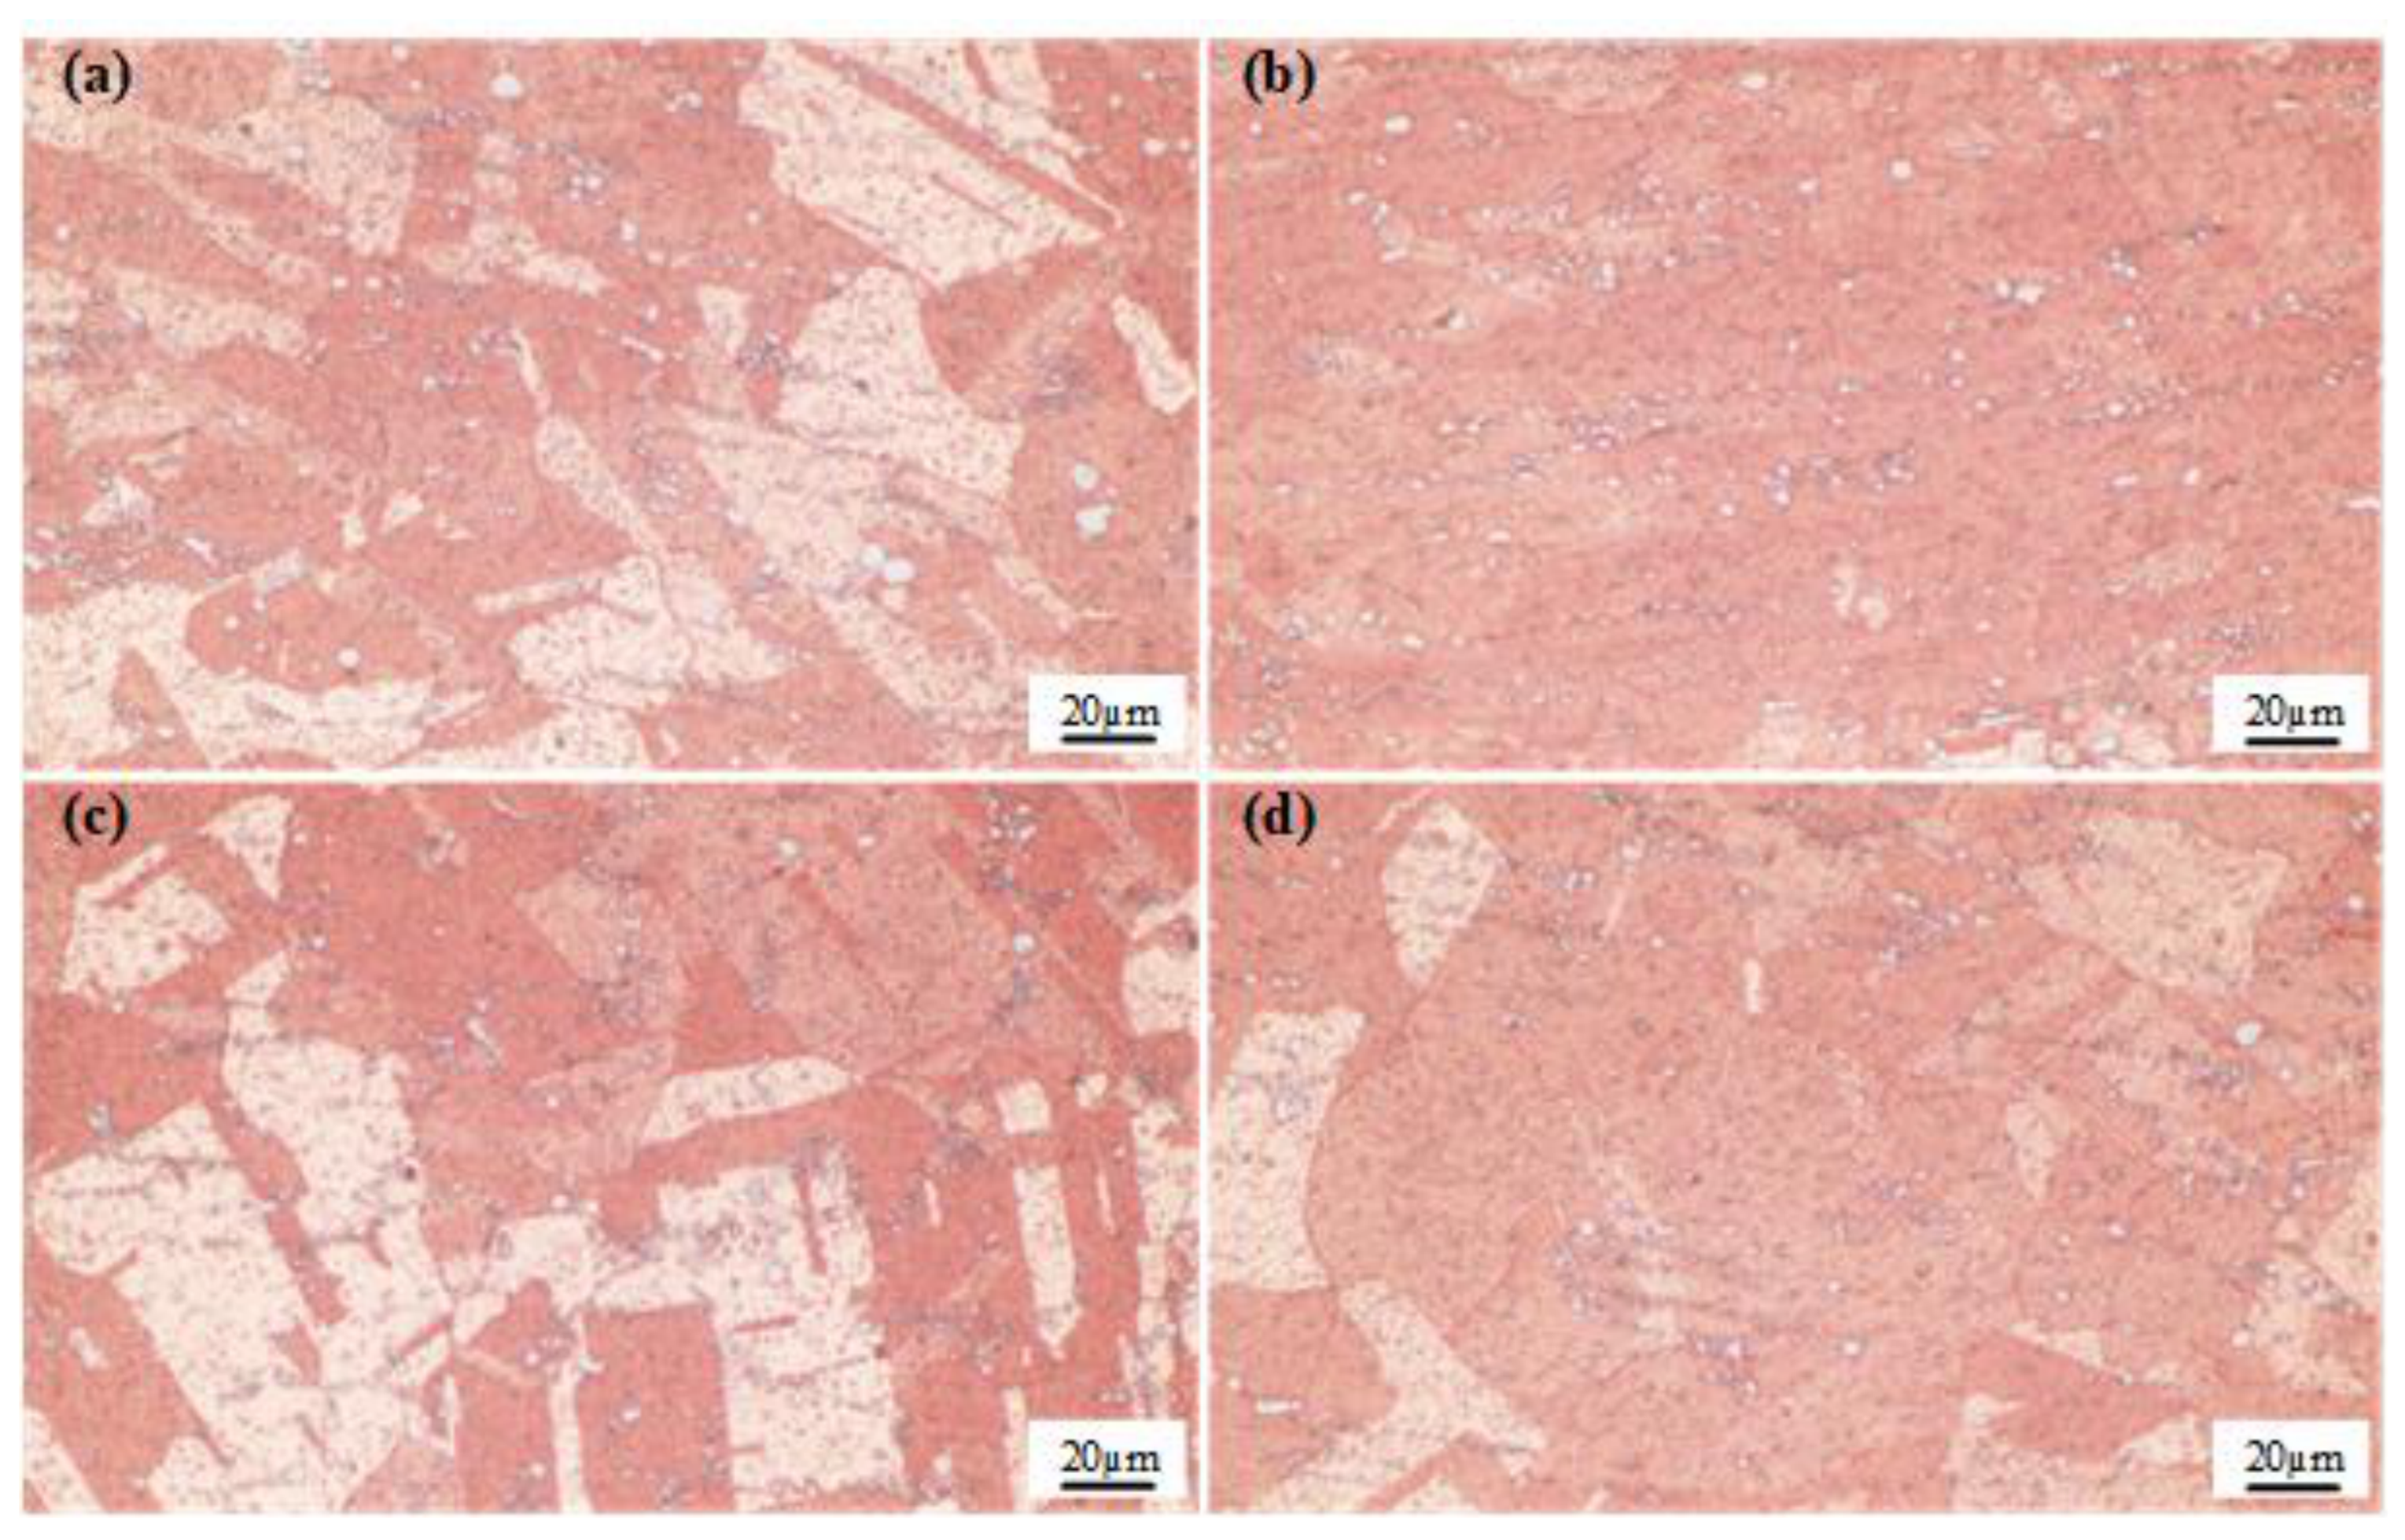
To observe the evolution of grain morphology following solution treatments at various temperatures, the non-vacuum solution-treated alloy specimens were etched, and their metallographic microstructures were characterized (Figure 3). As observed in the figure, the grains in the initial alloy exhibited elongated fibrous or band-like structures aligned along the rolling direction, forming typical deformation streamlines. Following the solution treatment at 800 °C, the deformation streamlines still persisted, and the grain boundaries appeared blurry and irregular. In the alloy treated at 850 °C, relatively uniformly distributed polygonal equiaxed grains with straight boundaries, along with annealing twins, were observed. This indicates the occurrence of recrystallization in the alloy, which alleviated the work hardening and reduced the hardness. When the solution temperature reached 900 °C, the grains became distinctly coarsened, accompanied by a further decrease in hardness.
Figure 3.
Etched optical micrographs of the alloy after non-vacuum solution treatment for 1 h: (a) initial state; (b) 800 °C; (c) 850 °C; (d) 900 °C.
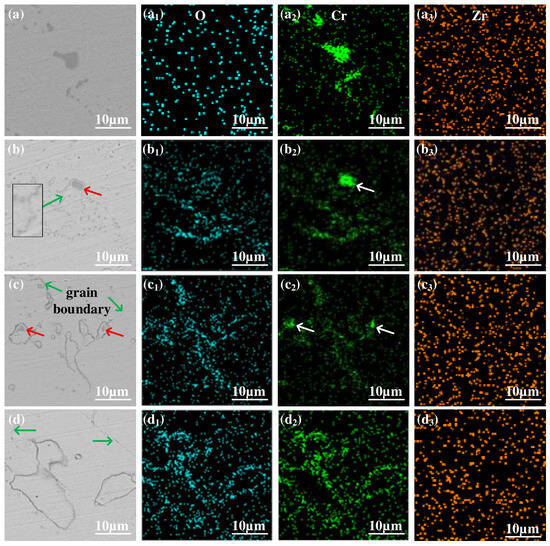
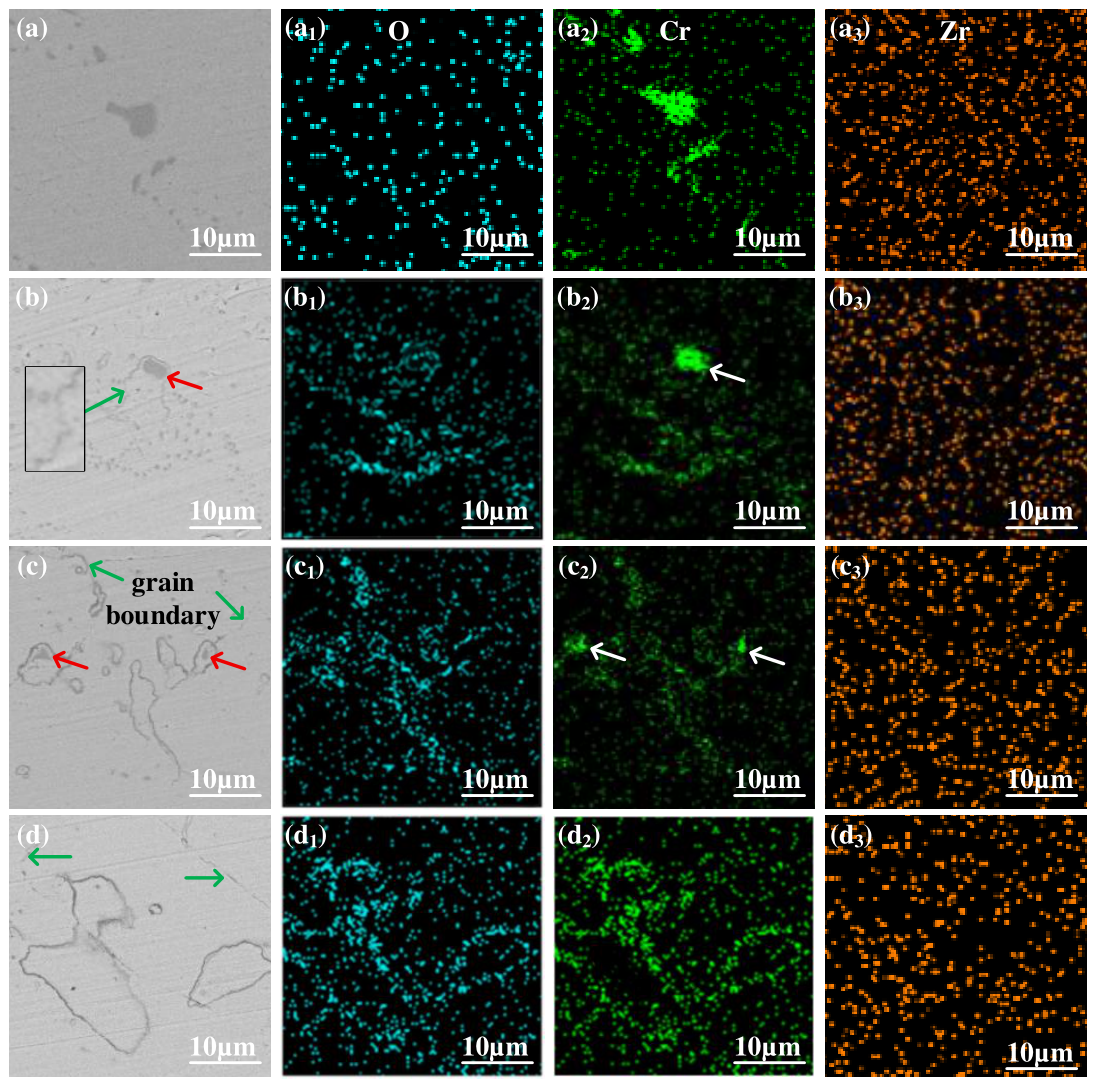
Figure 4 shows the SEM backscattered electron images and elemental mapping images of the alloy subjected to the non-vacuum solution treatment at different temperatures. In the initial alloy, a large number of granular phases were present, with the larger ones being approximately 6 μm in size, as shown in Figure 4a. When the solution temperature was 800 °C, grain boundaries (indicated by green arrows), smaller ring-like structures, and ring-like structures encapsulating undissolved granular phases (indicated by red arrows) began to appear in the near-surface microstructure of the alloy sample. At a solution temperature of 850 °C, the size of the granular phases within the ring-like structures decreased significantly, while the overall size of the ring-like structures increased. When the solution temperature reached 900 °C, the granular phases inside the ring-like structures completely disappeared, leaving only the larger ring-like structures in the matrix.
Figure 4.
SEM backscattered electron (BSE) images and elemental mapping images of the alloy after solution treatment: (a–a3) initial state; (b–b3) 800 °C; (c–c3) 850 °C; (d–d3) 900 °C.
To confirm the elemental composition of the ring-like structures, SEM elemental mapping was performed. Figure 4(a1–a3) show the elemental mapping images of the alloy in its initial state, from which it can be seen that the granular phases present in the alloy are composed of Cr. When the solution temperatures were 800 °C and 850 °C, it could be observed that the ring-like structures were mainly composed of Cr and O, while the undissolved granular phases primarily consisted of Cr with almost no O (as indicated by the white arrows in Figure 4(b2,c2)). When the solution temperature was increased to 900 °C, the size of the ring-like structures increased significantly, and the enrichment of Cr and O in these structures became more obvious. Therefore, the formation of the ring-like structures is related to the participation of oxygen during the non-vacuum solution process.
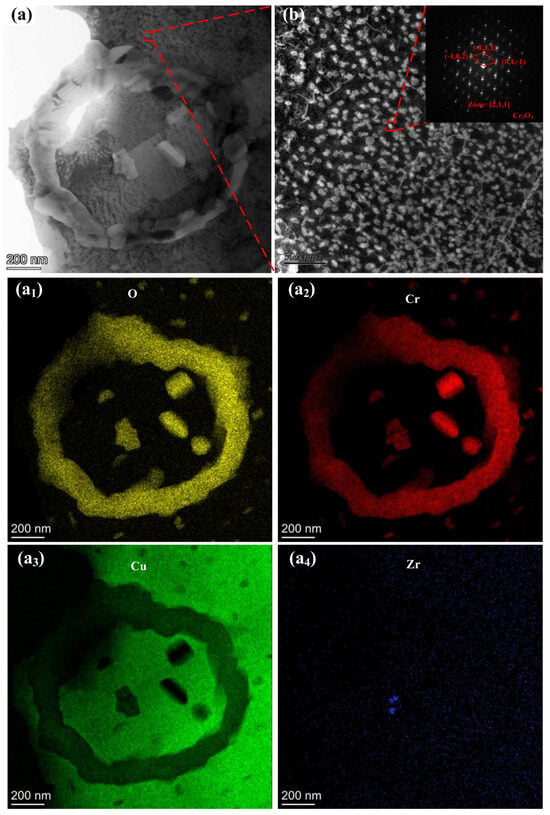
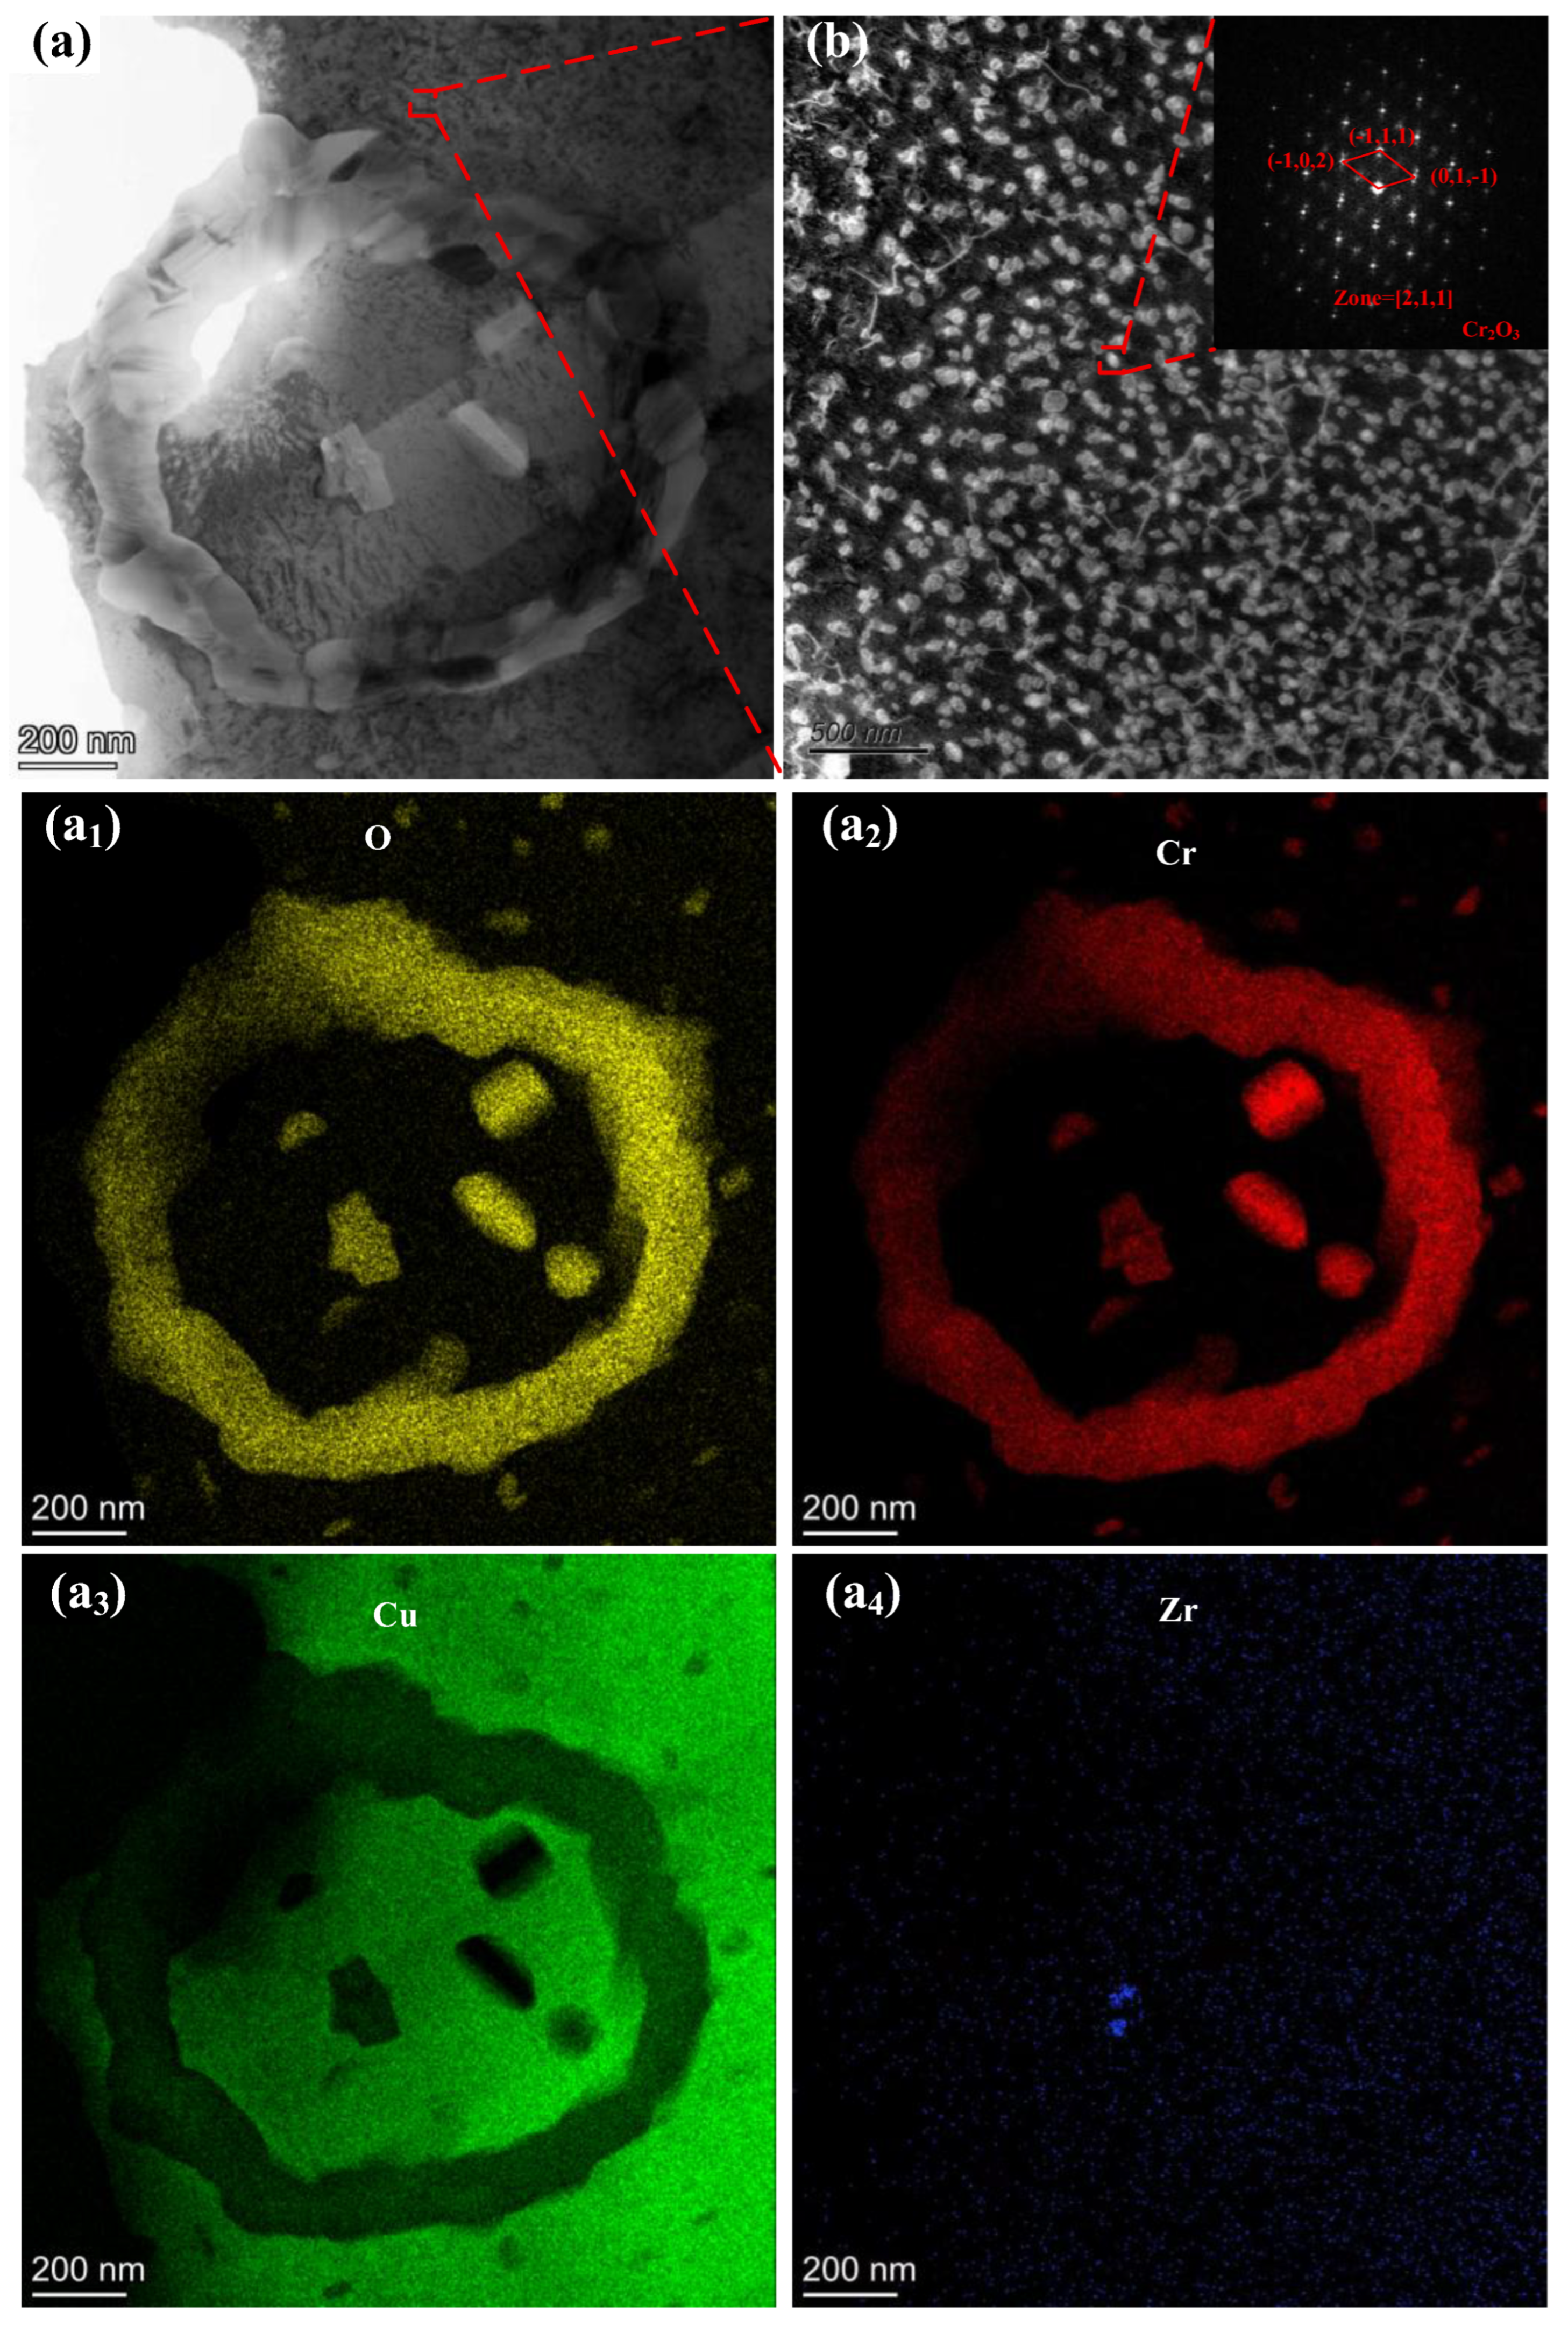
As demonstrated by the preceding SEM and EDS results, the non-vacuum solution treatment constructed a Cr-O compound network in the surface layer of the alloy, preliminarily confirming the formation of an internal oxide skeleton. To further determine the crystal structure of the Cr-O compounds within the ring-like structures, the surface layer of the sample was analyzed using transmission electron microscopy (TEM), as shown in Figure 5.
Figure 5.
TEM images of the surface layer after non-vacuum solution treatment at 900 °C for 1 h: (a–a4) Elemental mapping images of the ring-like structure; (b) selected area electron diffraction (SAED) patterns.
In Figure 5a, a ring-like structure composed of Cr-O compounds can be clearly observed. Combined with the EDS results, the findings suggest that O and Cr atoms reacted in situ during the non-vacuum solution stage, generating large-sized Cr-O compounds. Furthermore, a large number of nanoscale precipitates are uniformly dispersed in the matrix surrounding the ring-like structures, as shown in Figure 5b. With an average size of 17.24 nm, these precipitates can be identified as the Cr2O3 phase based on the diffraction spots. This indicates that during the high-temperature non-vacuum solution stage, the inward diffusion of O atoms not only promoted the formation of a continuous oxide network but also reacted with the dissolved Cr in the matrix to form nanoscale Cr2O3. Because of the large difference in lattice constants between Cr2O3 and Cu, the nanoscale Cr2O3 phase precipitated out, providing a dispersion-strengthening effect for the surface layer of the alloy, which promotes a simultaneous increase in electrical conductivity and hardness.
3.1.2. Effect of Non-Vacuum Solution Treatment on the Properties of Cu-Cr-Zr Alloys
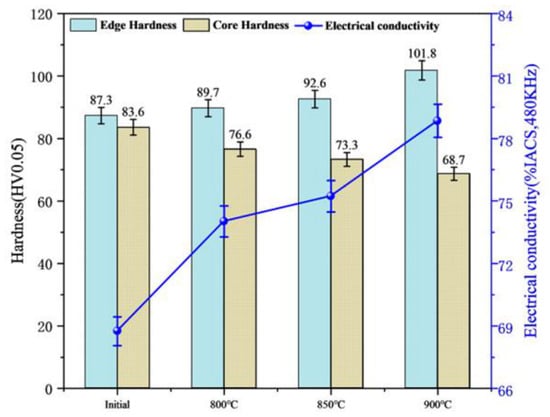
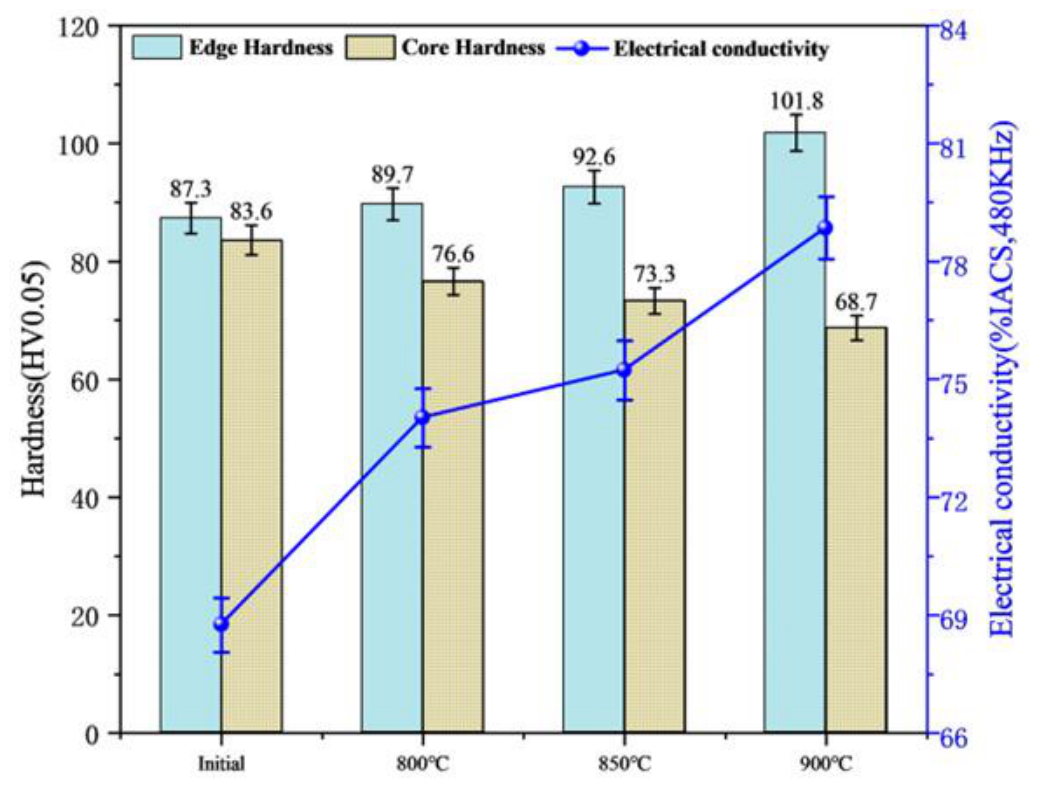
Figure 6 illustrates the hardness distribution and electrical conductivity of the alloy samples after the non-vacuum solution treatment. Experimentally, as the solution temperature increased, the electrical conductivity exhibited a clear upward trend, rising from 68.75% IACS to 78.85% IACS. This improvement is mechanistically attributed to matrix purification via in situ oxidation. Normally, solute-induced lattice distortion increases electron scattering and reduces conductivity. However, the high-temperature non-vacuum environment drove external O atoms into the Cu matrix to react with dissolved Cr. The resulting oxide formation consumed the dissolved Cr atoms, thereby alleviating lattice distortion and purifying the matrix.
Figure 6.
Variations in electrical conductivity and hardness of the alloy after non-vacuum solution treatment.
Regarding mechanical properties, the near-surface hardness increased from 87.3 HV to 101.8 HV with rising temperature. This surface hardening is driven by the formed oxide particles, which provided strong dispersion strengthening and effectively pinned the grain boundaries to suppress high-temperature grain coarsening. Conversely, the hardness in the core region decreased from 83.6 HV to 68.7 HV. Because the core region exceeded the diffusion depth of O atoms, it lacked a protective oxide network. Without this pinning effect, the core matrix underwent significant recovery, recrystallization, and drastic grain growth under the high-temperature environment.
3.2. Effect of Vacuum Solution Treatment on the Microstructure and Properties of Layered Composite Cu-Cr-Zr Alloys
3.2.1. Effect of Vacuum Solution Treatment on the Microstructure of Layered Composite Cu-Cr-Zr Alloys
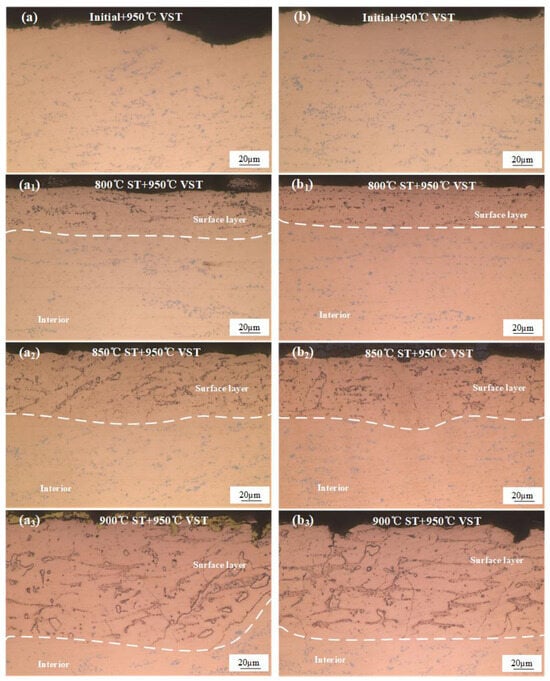
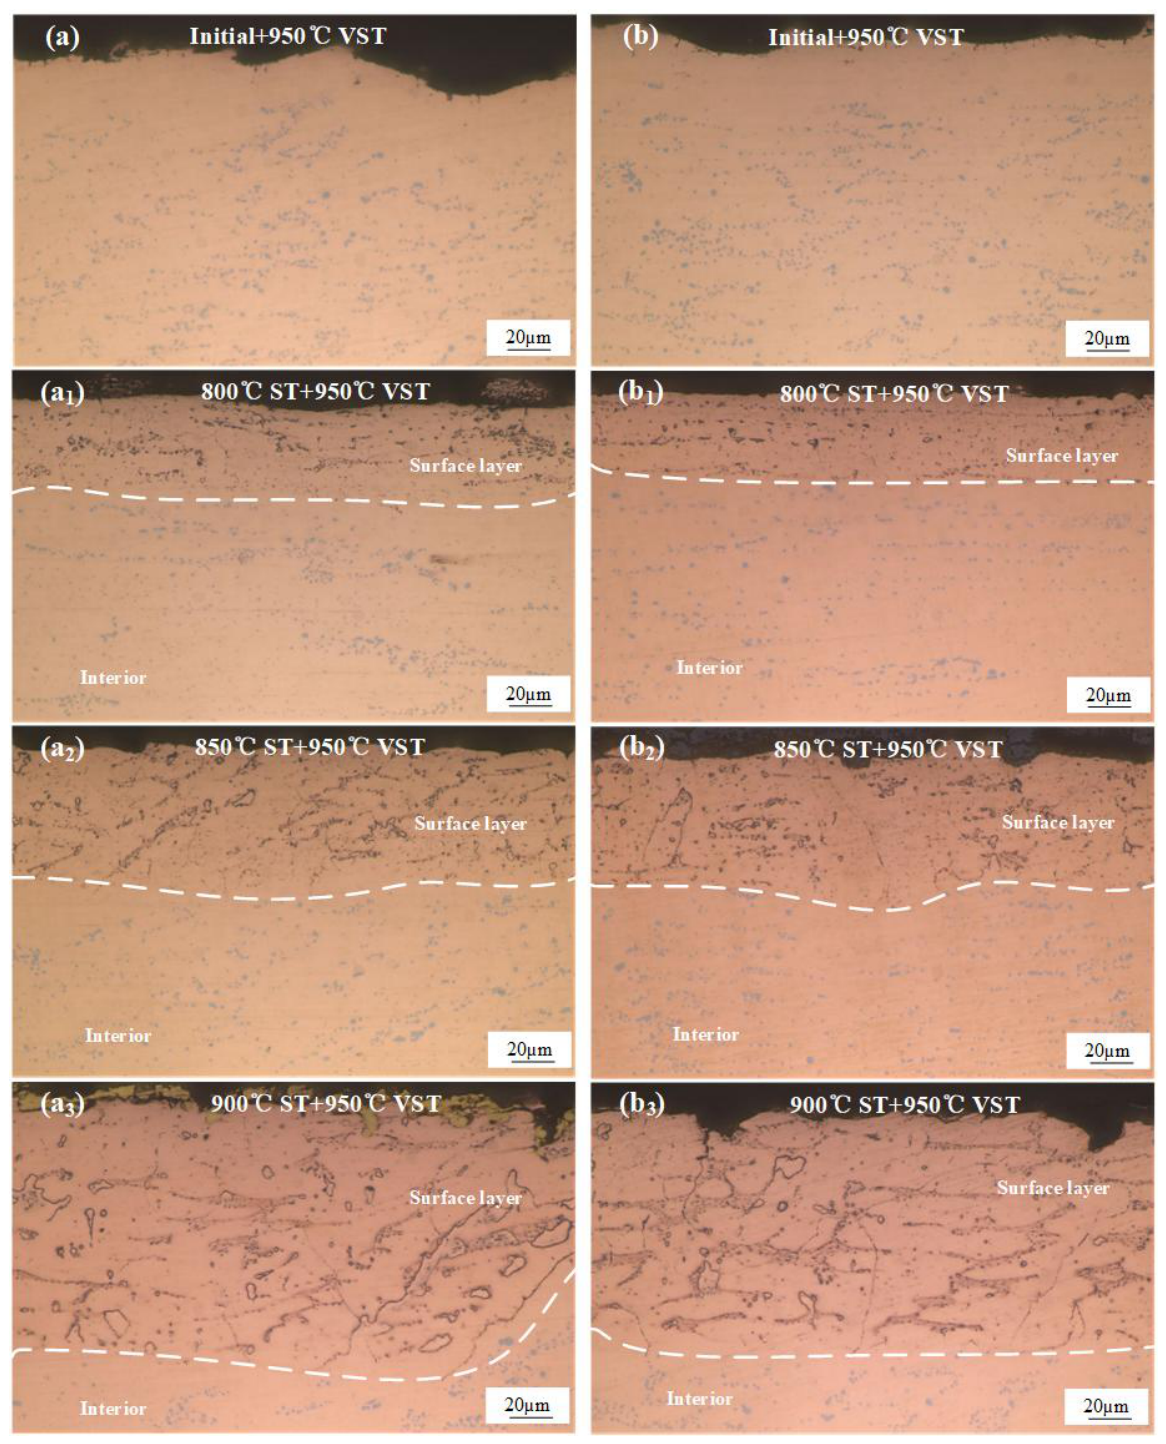
After the non-vacuum solution treatment, the Cr dissolved into the matrix and precipitated as nanoscale Cr2O3 phases in the surface layer of the sample, which led to a relative increase in the solid solubility of Cr in the matrix. Moreover, as observed from Figure 4, granular primary Cr phases could still be observed in the surface layer after the non-vacuum solution treatment. To convert more coarse primary Cr phases into nanoscale phases, the samples were further subjected to a vacuum solution treatment to achieve sufficient dissolution of primary Cr and microstructural optimization. Figure 7 shows the metallographic microstructures of the alloy further solution-treated in a vacuum environment at 950 °C for 1 h after the non-vacuum solution treatment. It was found that after the 950 °C vacuum solution treatment, the previously generated Cr-O compound network in the surface layer exhibited high thermodynamic stability, maintaining an intact skeleton without redissolution even at such an extremely high temperature. Meanwhile, the residual primary Cr phases in both the surface layer and the core region further dissolved into the matrix. Particularly for the sample previously non-vacuum solution-treated at 900 °C, a large number of solute atoms in the core dissolved into the Cu lattice, forming a supersaturated solid solution. In addition, the incompletely dissolved granular phases originally located in the internal oxidation layer, as indicated by the black box and green arrows in Figure 4b, were almost completely dissolved into the Cu lattice after the vacuum solution treatment.
Figure 7.
Unetched optical micrographs of the alloy after vacuum solution treatment at 950 °C for 1 h: (a) initial state; (b) 800 °C non-vacuum solution treatment; (c) 850 °C non-vacuum solution treatment; (d) 900 °C non-vacuum solution treatment.
Based on the analysis in Section 3.1, it can be deduced that the formation of the ring-like structures is related to O. To further verify this hypothesis, the initial alloy sheet was directly subjected to vacuum solution treatment and subsequently analyzed via SEM elemental mapping, as illustrated in Figure 8. It can be seen that the alloy after the direct vacuum solution treatment contained abundant Cr-rich granular phases with a size of approximately 1–3 μm. No obvious enrichment of O was detected, and neither grain boundaries nor ring-like structures were observed. Combined with the analyses of the variations in electrical conductivity and hardness, this indicates that oxygen is closely related to the changes in the microstructure and properties of the alloy during the solution process.
Figure 8.
SEM backscattered electron (BSE) images and corresponding EDS elemental maps of the initial alloy subjected to direct vacuum solution treatment (without non-vacuum solution treatment).
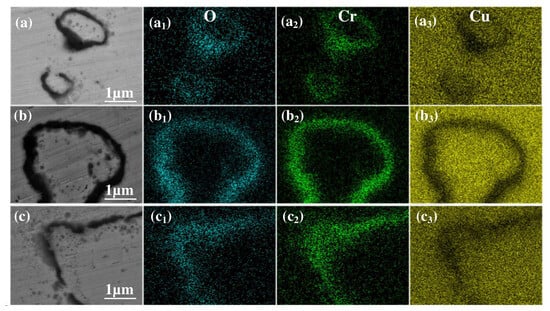
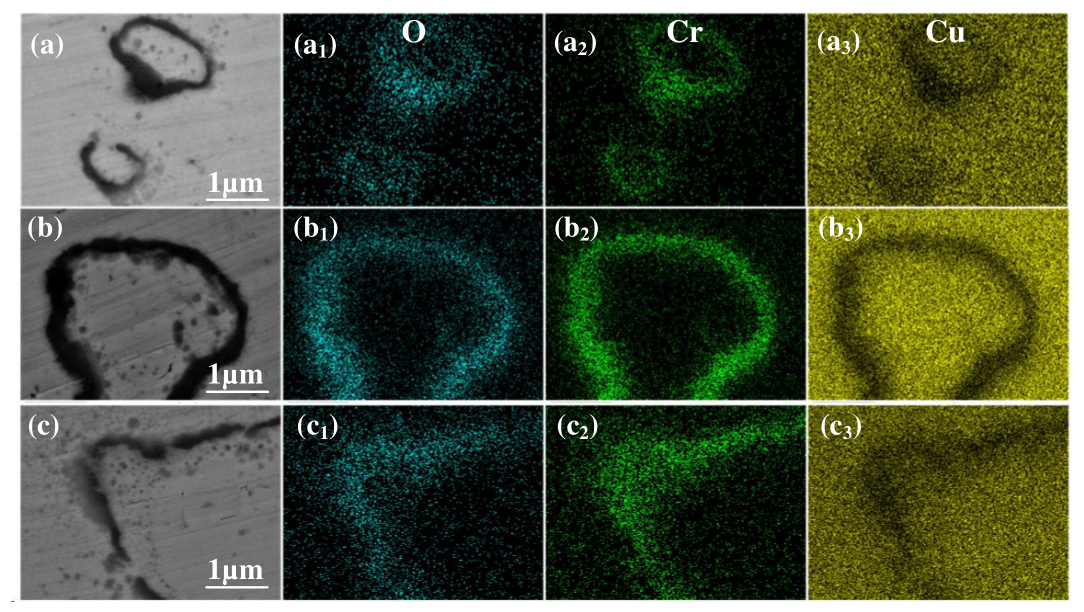
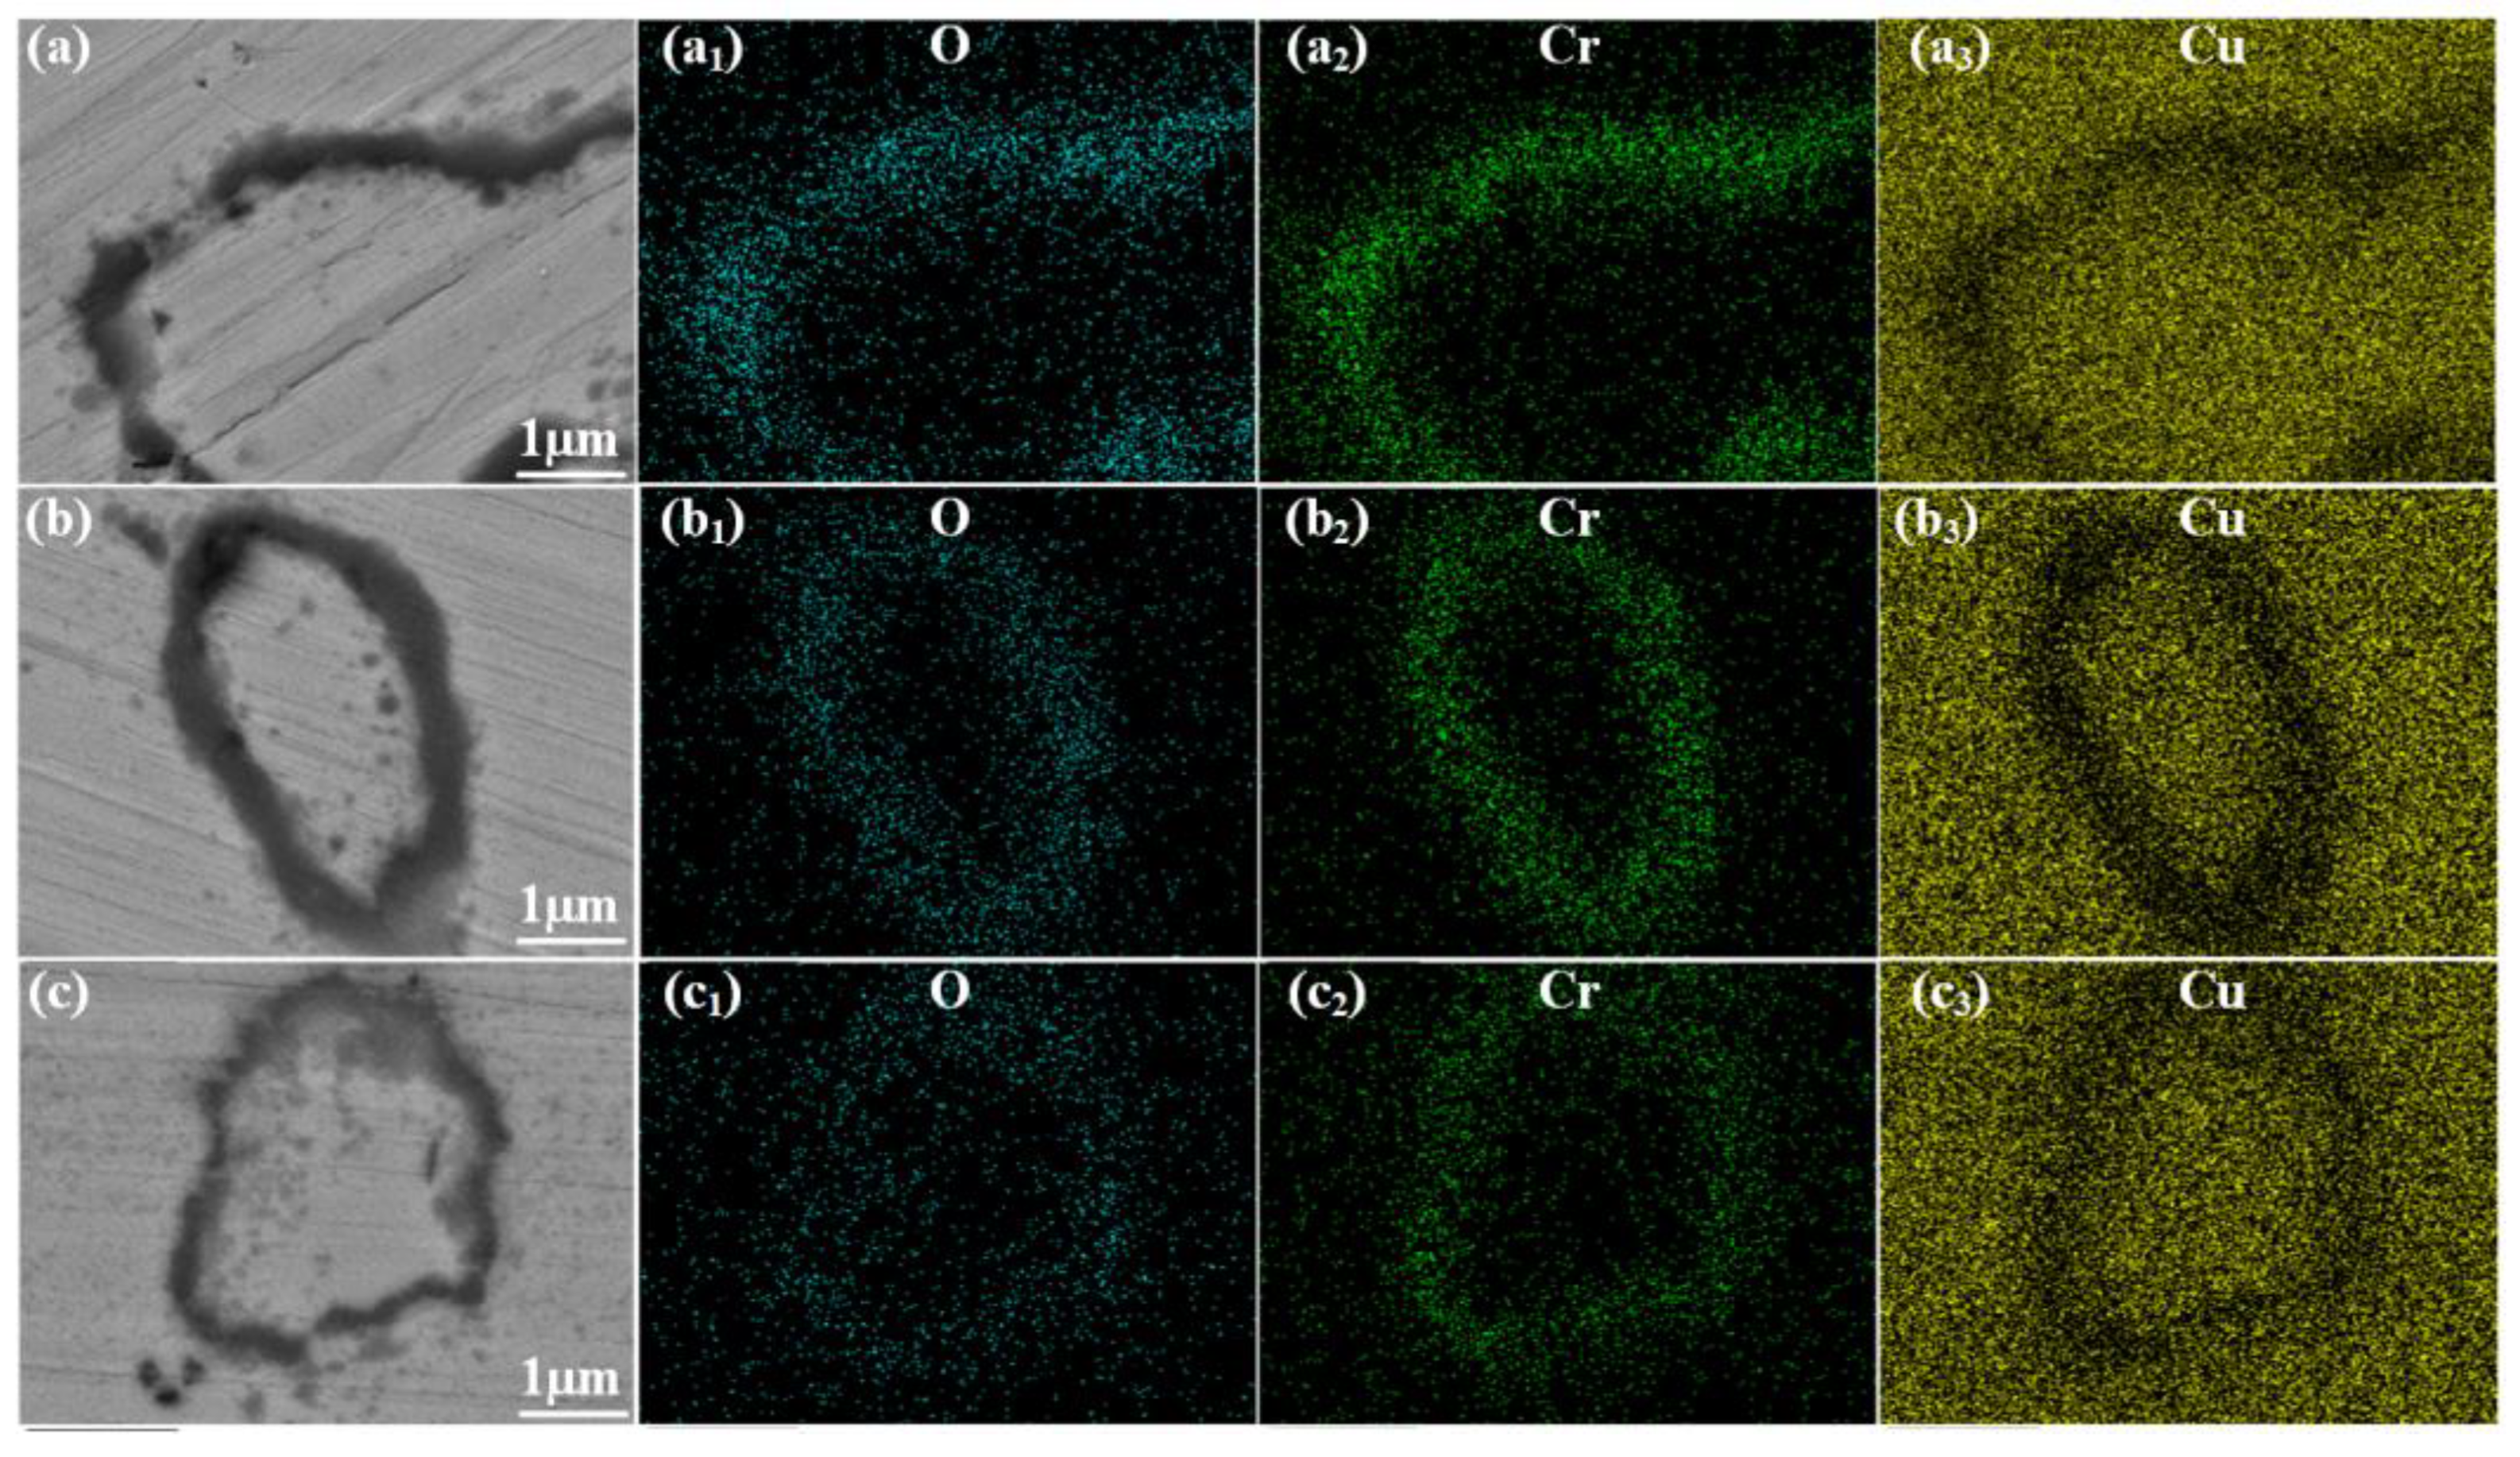
Figure 9 displays the SEM elemental mapping images of the surface oxide layer after the combined non-vacuum and vacuum solution treatments (950 °C for 1 h). Compared to the single non-vacuum process, the additional vacuum step caused the interior Cr phases to completely dissolve into the Cu matrix. This dissolution mechanism left behind clear micrometer-scale hollow oxide rings. Moreover, as the temperature of the preceding non-vacuum treatment increased, the ring-like structures enlarged and eventually merged into a dense, continuous oxide network.
Figure 9.
SEM backscattered electron (BSE) images and elemental mapping images of the oxide layer after vacuum solution treatment at 950 °C: (a–a3) 800 °C non-vacuum solution treatment; (b–b3) 850 °C non-vacuum solution treatment; (c–c3) 900 °C non-vacuum solution treatment.
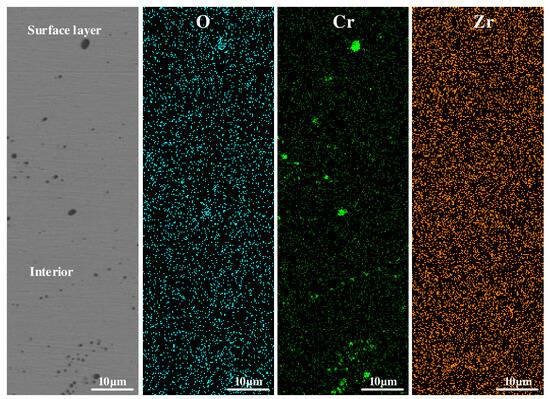
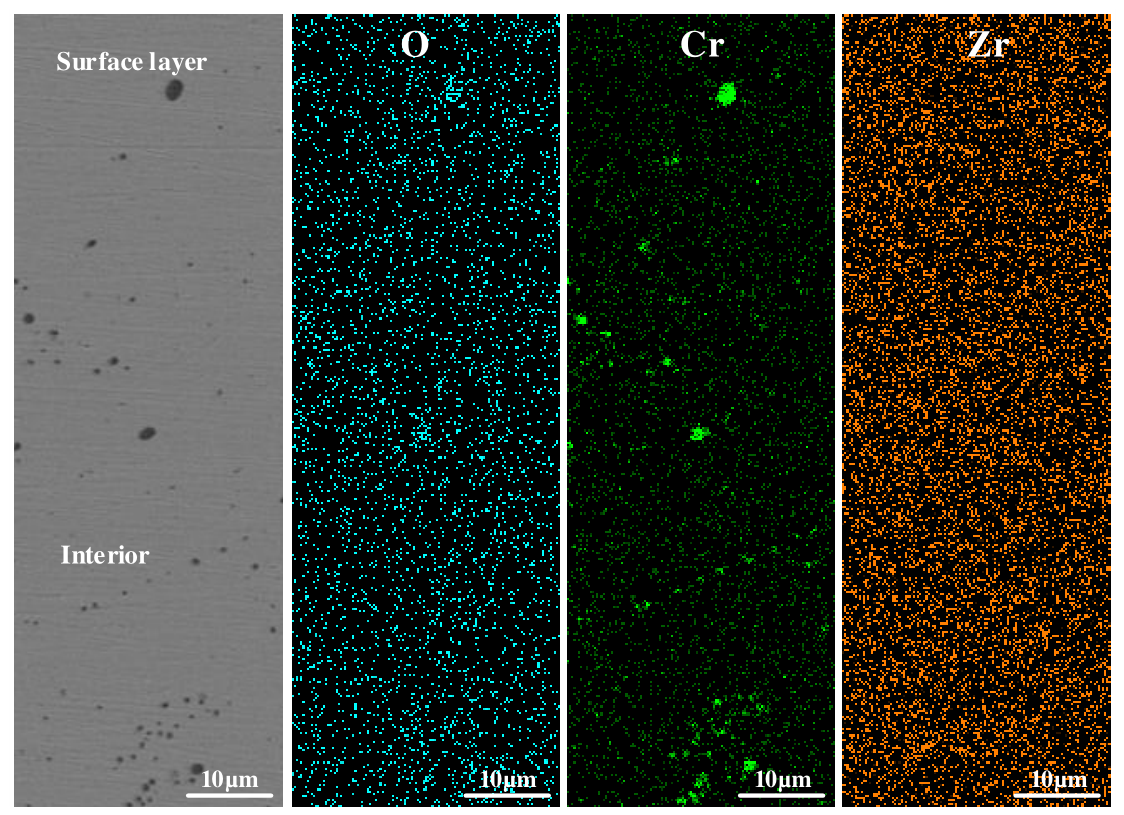
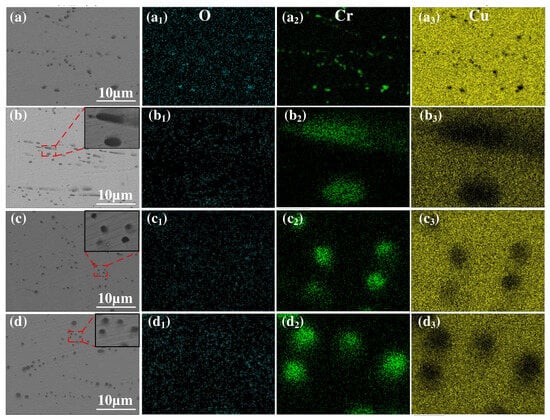
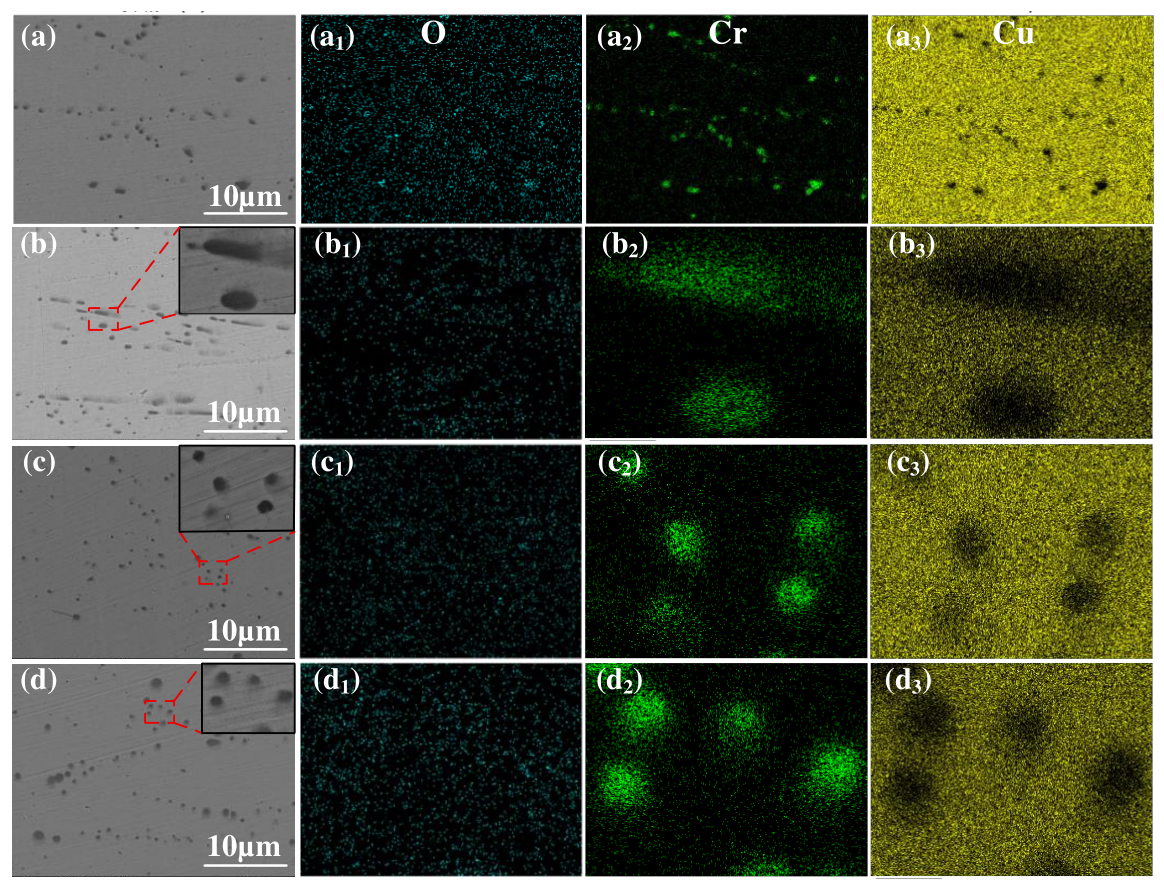
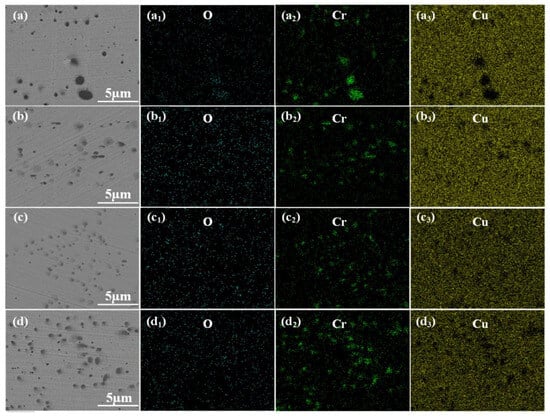
Figure 10 shows the SEM elemental mapping images of the core region under the same two-step treatment. The elemental maps reveal granular primary Cr phases without oxygen enrichment. This confirms that the core effectively blocked the inward diffusion of O during the initial non-vacuum stage. Furthermore, after the 950 °C vacuum treatment, the initial banded segregation disappeared. The residual coarse Cr phases significantly decreased and were distributed uniformly. These microstructural changes indicate a deep dissolution of Cr within the core region.
Figure 10.
SEM backscattered electron (BSE) images and elemental mapping images of the core region after vacuum solution treatment at 950 °C: (a–a3) initial state; (b–b3) 800 °C non-vacuum solution treatment; (c–c3) 850 °C non-vacuum solution treatment; (d–d3) 900 °C non-vacuum solution treatment.
3.2.2. Effect of Vacuum Solution Treatment on the Properties of Layered Composite Cu-Cr-Zr Alloys
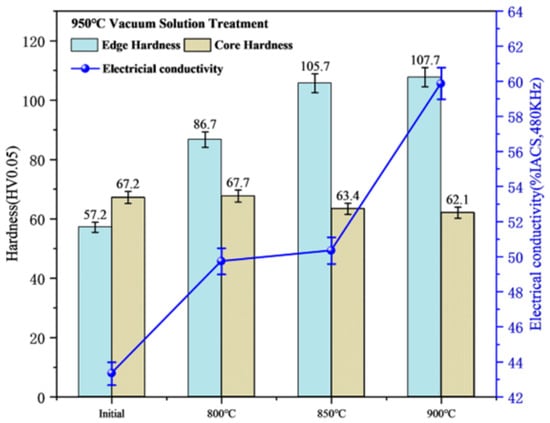
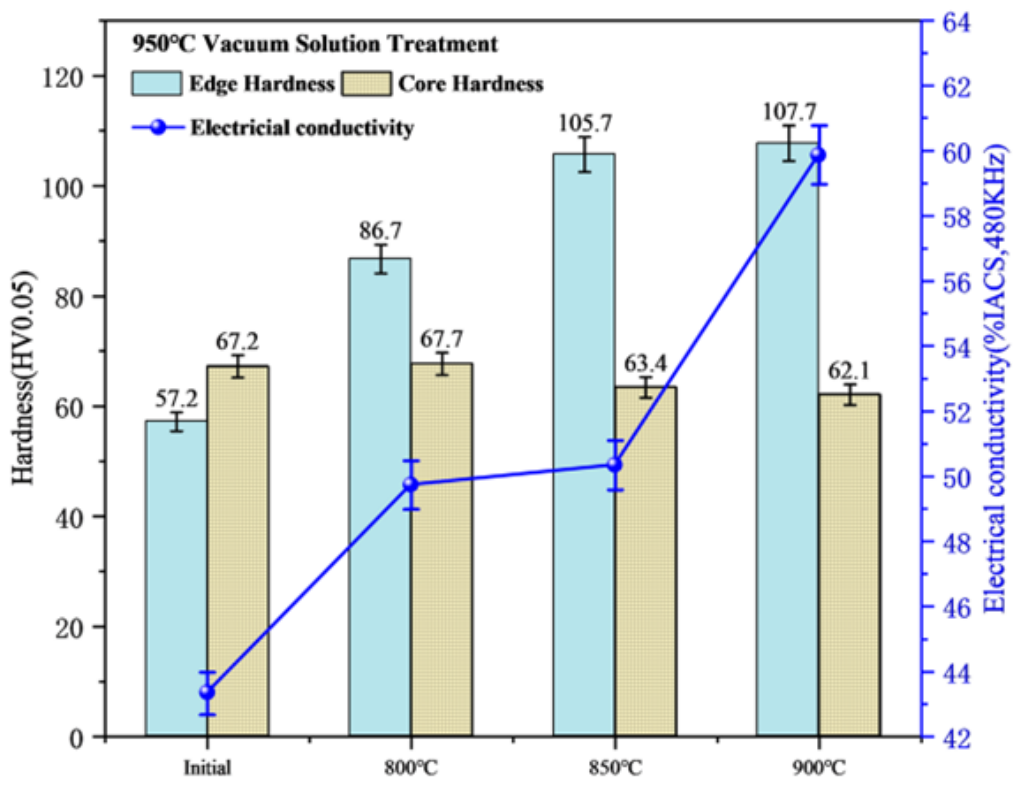
Figure 11 shows the variations in electrical conductivity and hardness of the alloy after the vacuum solution treatment at 950 °C. It can be seen that although the electrical conductivity overall still presents an upward trend, the values are much lower than those of the alloy treated in the non-vacuum environment. This is because the high temperature of 950 °C causes a massive dissolution of Cr, which induces severe lattice distortion and leads to a decrease in conductivity. Consequently, the conductivity of the initial state sample dropped to 43.33% IACS. In contrast, a higher non-vacuum solution temperature implies that more Cr is locked by oxidation; thus, the lattice distortion caused by the subsequent vacuum solution treatment is smaller, and the electrical conductivity is better retained, maintaining a maximum of 59.87% IACS. As for hardness, the dense oxide network formed in the near-surface region provides a dispersion strengthening effect, increasing the edge hardness to approximately 107 HV. In the core region, due to the lack of oxygen intervention, the extremely high temperature triggered more sufficient solid dissolution and the abnormal coarsening of matrix grains, causing the hardness to further decrease to around 62 HV.
Figure 11.
Variations in electrical conductivity and hardness of the alloy after vacuum solution treatment.
3.3. Effect of Aging Treatment on the Microstructure and Properties of Layered Composite Cu-Cr-Zr Alloys
3.3.1. Effect of Aging Treatment on the Microstructure of Layered Composite Cu-Cr-Zr Alloys
As described in Section 3.1 and Section 3.2, following the sequential non-vacuum and vacuum solution treatments, a highly stable oxide strengthening network was generated in the surface layer of the alloy, while the core region evolved into a pure supersaturated solid solution. At this stage, the alloy was in a state characterized by a “relatively soft core and lower surface electrical conductivity”. To further improve the mechanical and electrical properties of the alloy, aging treatments at different temperatures were conducted on the alloy in this section, and the effects of the aging treatment on the microstructure and properties of the alloy were analyzed.
Figure 12 displays the unetched microstructures of the alloy subjected to non-vacuum solution treatments at different temperatures and a vacuum solution treatment at 950 °C, followed by aging treatments at 400 °C (Figure 12(a–a3)) and 450 °C (Figure 12(b–b3)). Comparing the specimens with the same solution temperature but different aging temperatures (e.g., Figure 12(a1,b1)), it can be observed that there are no obvious differences in the thickness, morphology, and distribution density of the black internal oxide layer in the surface region. This indicates that the in situ formed Cr-O compounds possess strong thermal stability and did not undergo coarsening at 400–450 °C. Furthermore, comparing the specimens with different prior solution temperatures, the surface oxides gradually evolved from a sporadic distribution into a coarse and continuous network structure, which is similar to the phenomena observed in Section 3.1 and Section 3.2. Meanwhile, the core matrix background remained pure, leaving only a small amount of micrometer-scale insoluble primary phases.
Figure 12.
Unetched optical micrographs of the alloy after aging treatment: (a–a3) 400 °C solution treatment; (b–b3) 450 °C solution treatment.
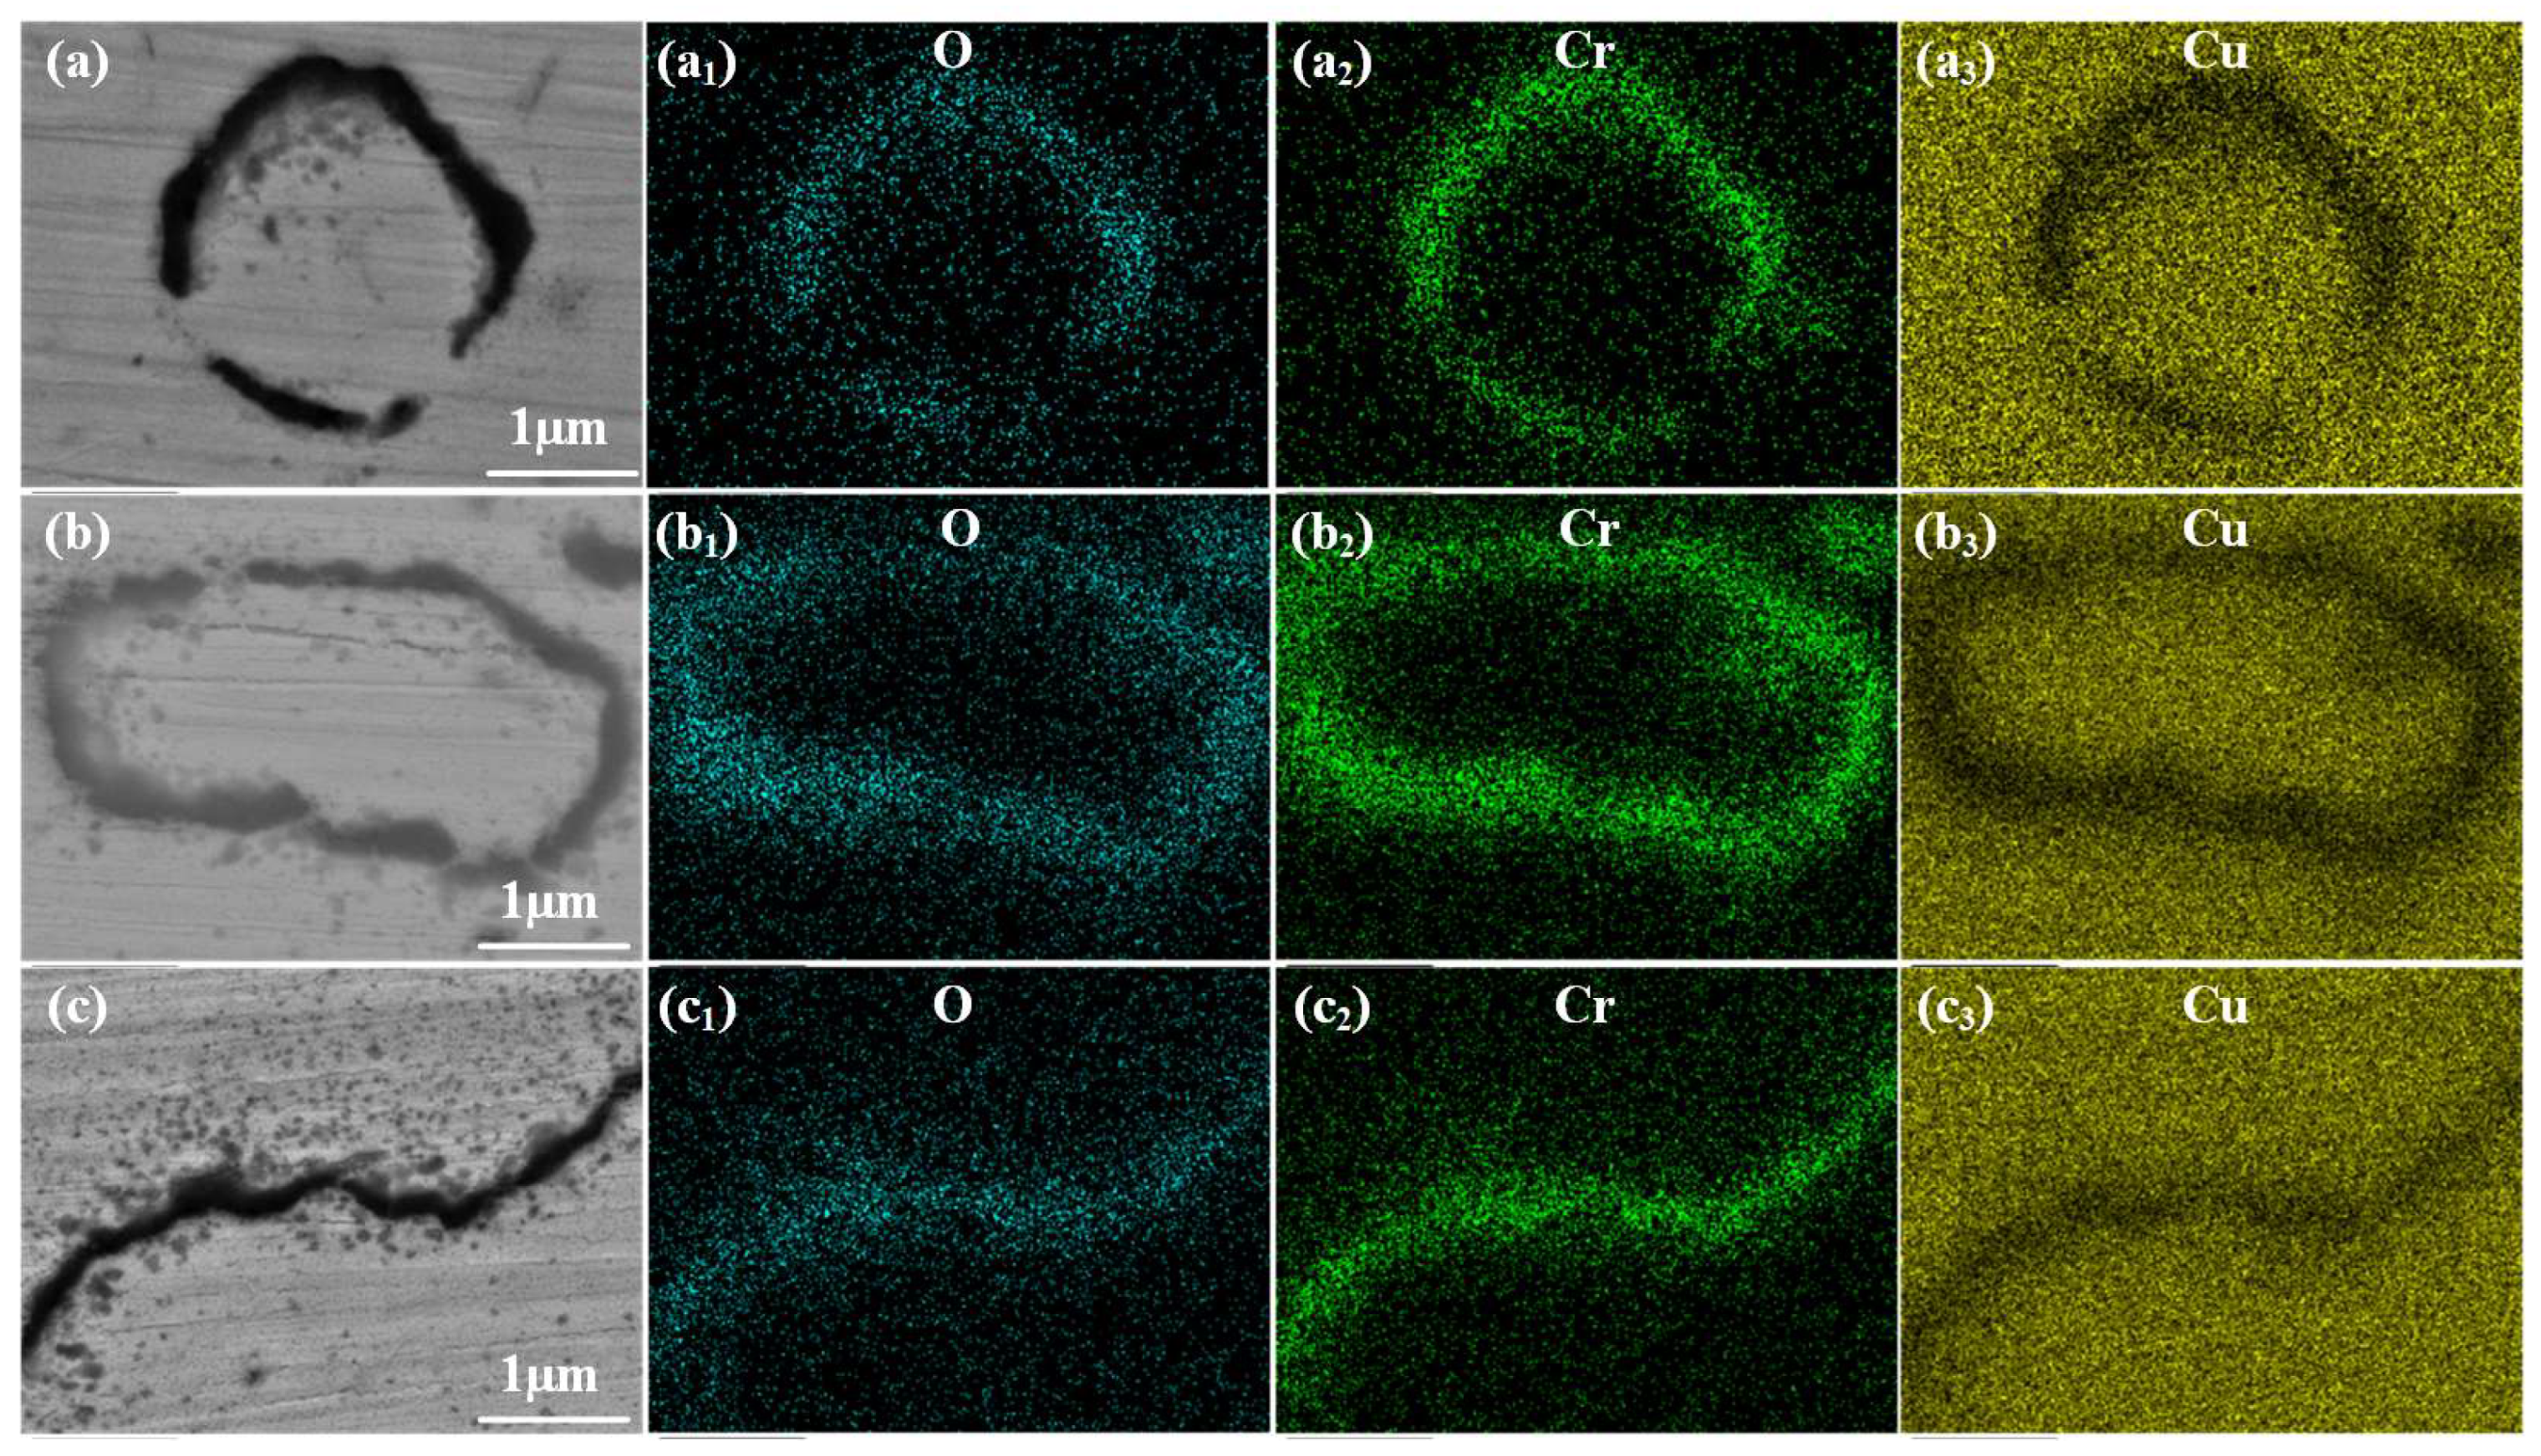
Figure 13 and Figure 14 present the SEM elemental mapping images of the near-surface oxide layer of the alloy after aging at 400 °C and 450 °C, respectively. Experimentally, the O and Cr signals highly overlap at the dark phase boundaries. Furthermore, as the prior non-vacuum solution temperature increased from 800 °C to 900 °C, these ring-like oxide boundaries visually evolved from a relatively discontinuous state to a dense, continuous network. Concurrently, a large number of nanoscale oxide precipitates dispersed around the phase boundaries, which is particularly evident in Figure 15c. Mechanistically, these overlapping signals confirm the formation of an in situ Cr-O compound network. It is precisely the strong dispersion strengthening effect of these highly stable oxide networks that enhances the edge hardness. Simultaneously, the oxidation process consumes solute atoms, thereby purifying the matrix and improving the electrical conductivity of the alloy.
Figure 13.
SEM backscattered electron (BSE) images and elemental mapping images of the oxide layer after aging treatment at 400 °C: (a–a3) 800 °C non-vacuum solution treatment; (b–b3) 850 °C non-vacuum solution treatment; (c–c3) 900 °C non-vacuum solution treatment.
Figure 14.
SEM backscattered electron (BSE) images and elemental mapping images of the oxide layer after aging treatment at 450 °C: (a–a3) 800 °C non-vacuum solution treatment; (b–b3) 850 °C non-vacuum solution treatment; (c–c3) 900 °C non-vacuum solution treatment.
Figure 15.
SEM backscattered electron (BSE) images and elemental mapping images of the core region after aging treatment at 400 °C: (a–a3) initial state; (b–b3) 800 °C non-vacuum solution treatment; (c–c3) 850 °C non-vacuum solution treatment; (d–d3) 900 °C non-vacuum solution treatment.
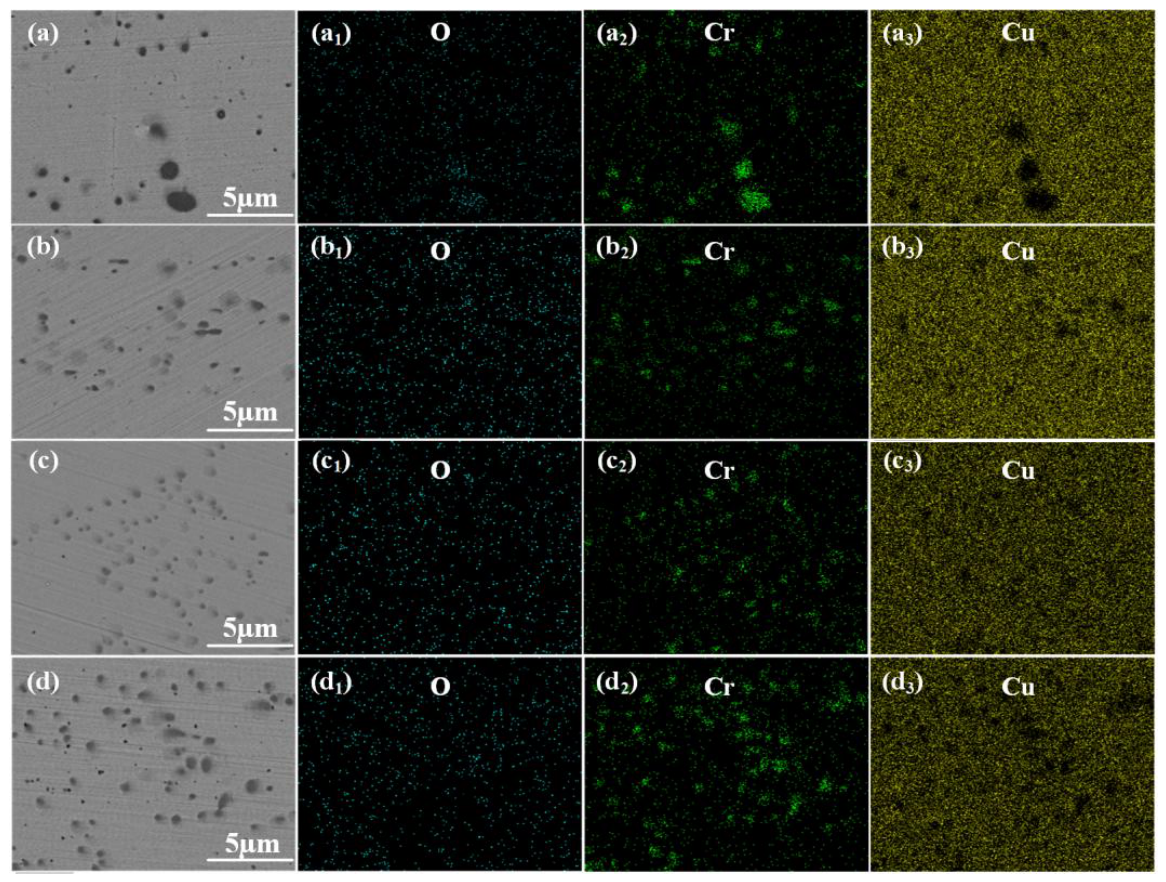
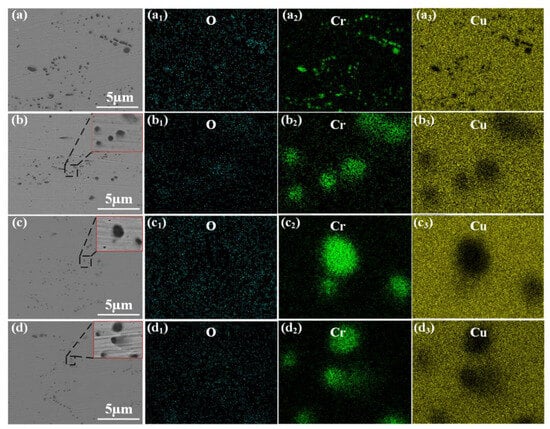
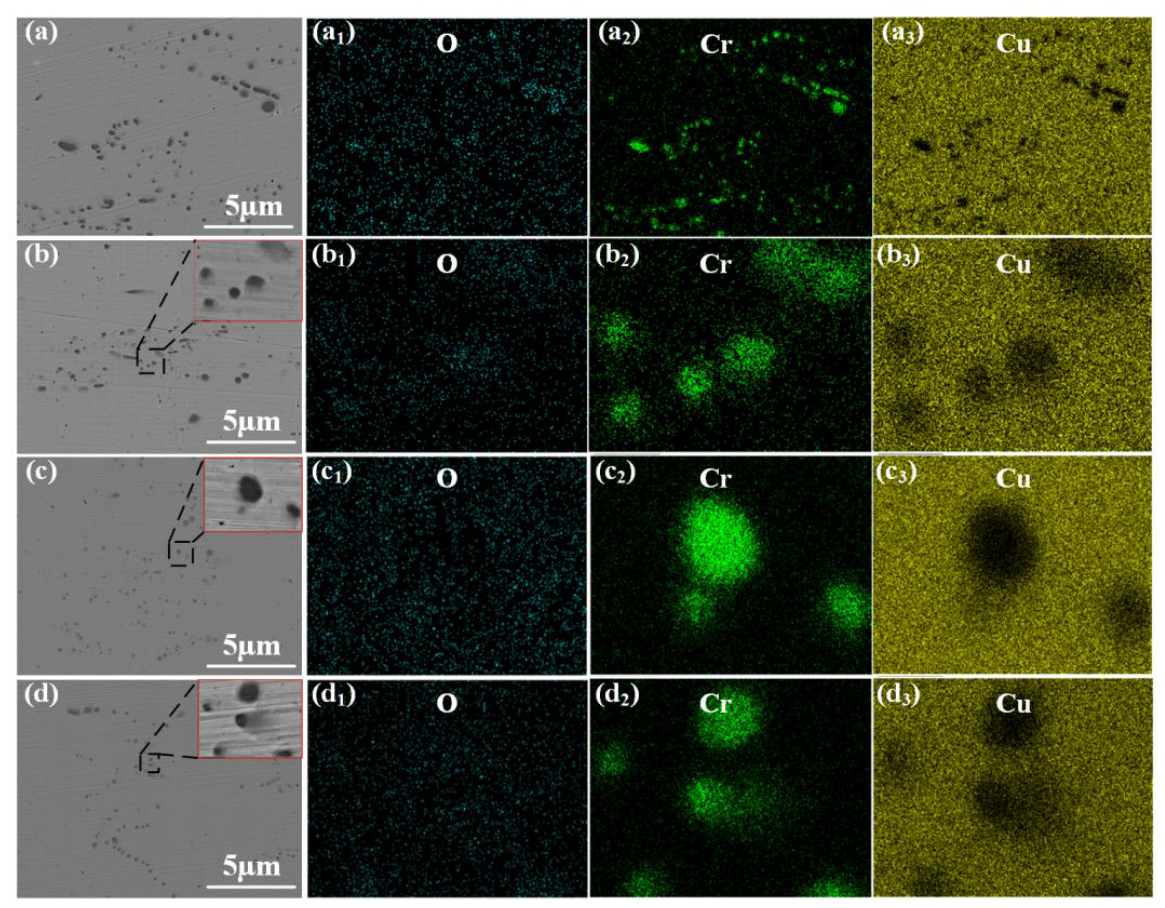
Figure 15 and Figure 16 present the SEM elemental mapping results of the core region of the alloy aged at 400 °C and 450 °C, respectively. In terms of elemental distribution, the O signals in all fields of view remain extremely weak, and the observed dark particles are exclusively Cr-rich phases with sizes ranging from 100 nm to 3 μm. Moreover, aging at 450 °C resulted in a significantly more abundant precipitation of nanoscale Cr phases. These phenomena confirm that the core region effectively blocked the inward diffusion of oxygen. Thus, the microscopic particles are purely residual primary Cr phases and subsequent aging precipitates. The 450 °C aging temperature provided sufficient driving force for this extensive Cr precipitation. Consequently, this deep precipitation strengthening pushed the core hardness to a peak of approximately 120 HV, successfully endowing the alloy with a layered composite structure featuring high surface electrical conductivity and high core hardness.
Figure 16.
SEM backscattered electron (BSE) images and elemental mapping images of the core region after aging treatment at 450 °C: (a–a3) initial state; (b–b3) 800 °C non-vacuum solution treatment; (c–c3) 850 °C non-vacuum solution treatment; (d–d3) 900 °C non-vacuum solution treatment.
3.3.2. Effect of Aging Treatment on the Properties of Layered Composite Cu-Cr-Zr Alloys
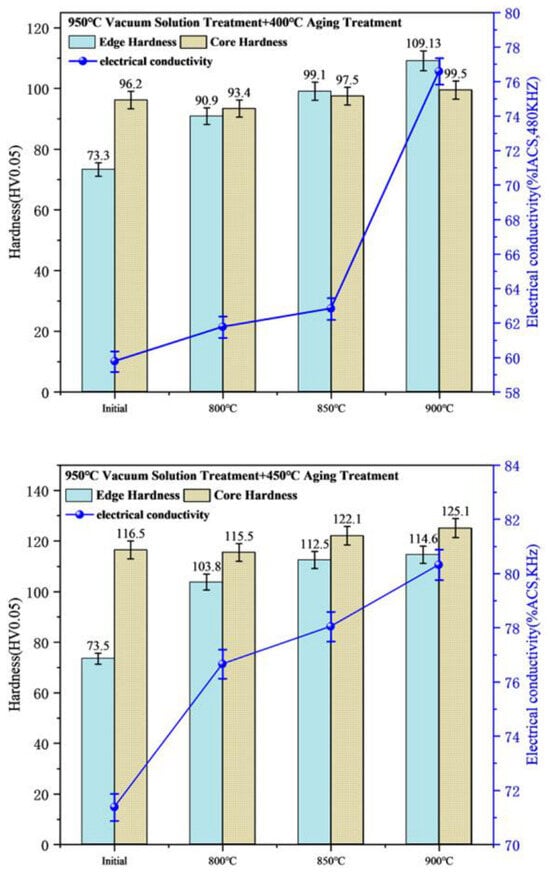
Figure 17 shows the variations in hardness and electrical conductivity of the alloy after aging treatments at different temperatures. As shown in the figure, the properties of the alloy samples were further improved after the aging treatment. The aging treatment caused the precipitation of Cr in the core region, leading to a significant increase in hardness, and the edge hardness increased with the elevation of the non-vacuum solution temperature. At the same time, the aging treatment reversed the downward trend of electrical conductivity caused by the vacuum solution treatment, and the electrical conductivity of all samples was improved. The results indicate that the alloy achieved the optimal performance of “high surface conductivity and high core hardness” under the combined process of 900 °C × 1 h (non-vacuum solution treatment) + 950 °C × 1 h (vacuum solution treatment) + 450 °C × 1 h (aging treatment). Specifically, the optimal condition resulted in an overall electrical conductivity of 80.32% IACS, a surface hardness of 114.6 HV, and a core hardness of 125.1 HV.
Figure 17.
Variations in electrical conductivity and hardness of the alloy after aging treatment.
It should be noted that the current study primarily focused on the influence of treatment temperatures at a fixed time. A more systematic investigation focusing on the oxidation and precipitation kinetics under varying treatment times will be carried out in our future work.
4. Conclusions
- (1)
- During the non-vacuum solution treatment, oxygen atoms diffused into the alloy and reacted in situ with solute Cr. With the increase in temperature, the depth of the oxide layer increased from 23.2 μm to 77.8 μm, forming a ring-like oxide structure. Concurrently, Cr2O3 nanoscale phases with an average size of 17.24 nm precipitated, which purified the matrix. As a result, the hardness increased from 87.3 HV to 101.8 HV, and the electrical conductivity improved from 68.75% IACS to 78.85% IACS.
- (2)
- After the non-vacuum and vacuum solution treatments of the sample, the undissolved Cr phases inside the ring-like structure of the edge oxide layer completely dissolved into the Cu matrix.
- (3)
- The layered composite structure featuring “high surface electrical conductivity and high core hardness” achieved optimal properties under the combined process of 900 °C × 1 h (non-vacuum solution treatment) + 950 °C × 1 h (vacuum solution treatment) + 450 °C × 1 h (aging treatment). Specifically, the edge hardness reached 114.6 HV, the core hardness reached 125.1 HV, and the electrical conductivity was 80.32% IACS.
Author Contributions
Conceptualization, Z.L. and Y.X.; methodology, S.W.; validation, F.Y. and H.S.; investigation, S.W. and H.S.; resources, F.Y.; data curation, Z.L.; writing—original draft preparation, Z.L.; writing—review and editing, Y.X. and S.W. All authors have read and agreed to the published version of the manuscript.
Funding
This work was supported by the Basic Research Project of the Department of Education of Liaoning Province (LJ212610144004).
Data Availability Statement
The original contributions presented in this study are included in the article. Further inquiries can be directed to the corresponding authors.
Conflicts of Interest
The authors declare no conflicts of interest.
Abbreviations
The following abbreviations are used in this manuscript:
| ITOX | internal oxidation layer |
| ST | solution treatment |
| VST | vacuum solution treatment |
References
- Niu, M.; Qu, J.; Zeng, Y.; Luo, F. Microstructure and Properties of Cu-Cr-Zr Alloy for Wire Contacting. Spec. Cast. Nonferr. Alloys 2021, 41, 1124–1128. [Google Scholar]
- Xuepeng, B.; Pingdong, X.; Pengbo, Y.; Zhengsuo, L.I.; Dong, Z.; Qingguo, L.I. Application and Research Progress of High Strength and High Conductivity Copper Alloys. Mech. Res. Appl. 2024, 37, 178–181. [Google Scholar]
- Zheng, Y. Research on high-voltage wire harness design and connector selection for new energy vehicles. Auto. Knowl. 2024, 24, 81–83. [Google Scholar]
- Jun, C.; Chenghao, S. Research status and development trend of Cu-Zr alloy. Trans. Mater. Heat Treat. 2023, 44, 16–24. [Google Scholar]
- Jiang, Y.; Lou, H.; Xie, H.; Li, T.; Song, K.; Liu, X.; Yun, X.; Wang, H.; Xiao, Z.; Li, Z. Development status and prospects of advanced copper alloy. Chin. J. Eng. Sci. 2020, 22, 84. [Google Scholar] [CrossRef] [Scilit]
- Jiang, X.; Xiao, Z.; Li, Z.; Liang, X. Effect of trace silver addition on microstructure and properties of Cu-0.45Cr-0.1Zr alloy. J. Mater. Res. Technol. 2024, 33, 5364–5374. [Google Scholar] [CrossRef] [Scilit]
- Li, J.; Ding, H.; Li, B.; Wang, L. Microstructure evolution and properties of a Cu–Cr–Zr alloy with high strength and high conductivity. Mater. Sci. Eng. A 2021, 819, 141464. [Google Scholar] [CrossRef] [Scilit]
- Li, L.; Kang, H.; Zhang, S.; Li, R.; Yang, X.; Chen, Z.; Guo, E.; Wang, T. Microstructure and properties of Cu-Cr-Zr (Mg) alloys subjected to cryorolling and aging treatment. J. Alloys Compd. 2023, 938, 168656. [Google Scholar] [CrossRef] [Scilit]
- Ma, W.; Cao, F.; Gao, L.; Jiang, Y.; Chen, Z.; Shi, H.; Wang, Y.; Liang, S. Strength-ductility synergy in a hierarchical Cu-Cr-Zr alloy processed via laser powder bed fusion. J. Mater. Sci. Technol. 2024, 191, 122–133. [Google Scholar] [CrossRef] [Scilit]
- Bodyakova, A.; Mishnev, R.; Belyakov, A.; Kaibyshev, R. Effect of chromium content on precipitation in Cu–Cr–Zr alloys. J. Mater. Sci. 2022, 57, 13043–13059. [Google Scholar] [CrossRef] [Scilit]
- Jha, K.; Neogy, S.; Kumar, S.; Singh, R.N.; Dey, G.K. Correlation between microstructure and mechanical properties in the age-hardenable Cu-Cr-Zr alloy. J. Nucl. Mater. 2021, 546, 152775. [Google Scholar] [CrossRef] [Scilit]
- Schenck, H.; Schmidtmann, E.; Müller, H. Der Einfluß der Glühbedingungen und der Legierungszusammensetzung auf die innere Oxydation von Eisenlegierungen. Arch. Eisenhüttenwes. 1960, 31, 121–128. [Google Scholar] [CrossRef] [Scilit]
- Xiao, Y.; Wang, S.W.; Song, H.W.; Chen, S.-F.; Zhang, S.-H. Abnormally increased electrical conductivity in solid solution-treated Cu-1Cr-0.1 Zr alloy via oxygen-driven Cr2O3 precipitation. J. Alloys Compd. 2025, 1050, 185742. [Google Scholar] [CrossRef] [Scilit]
- Li, H.; Zhou, M.; Tian, B.; Zhang, Y.; Ma, Z.; Li, X.; Zou, J.; Hu, H.; Jing, K.; Liu, Y.; et al. Microstructure and electrical contact properties of Al2O3-Cu/(Cr, Zr) composites. Mater. Today Commun. 2024, 38, 107747. [Google Scholar] [CrossRef] [Scilit]
- Chen, F.; Yan, Z.Q.; Wang, T. Effects of internal oxidation methods on microstructures and properties of Al2O3 dispersionstrengthened copper alloys. High Perform. Structl Mater. 2018, 1–8. [Google Scholar] [CrossRef] [Scilit]
- Guo, X.H.; Zhou, Y.J.; Song, K.X.; Ang, X.; Liang, S.H. Microstructure andproperties of Cu–Mg alloy treated by internal oxidation. Mater. Sci. Tech. 2018, 34, 648–653. [Google Scholar] [CrossRef] [Scilit]
- Pan, T.; He, Y.; Li, J.; Zhang, B. Oxidation Behavior of Binary Cu-Cr Alloys in Air at 700 and 800 °C. Acta Metall. Sin. 2014, 50, 337–344. [Google Scholar]
- Zhou, Q.; Wu, H.; Zhao, Q.; Liu, Y. Research on the Microstructure and Mechanical Properties of Cr2O3/Cu Composites Prepared by Internal Oxidation and HP Method. Metals 2025, 15, 585. [Google Scholar] [CrossRef] [Scilit]
- Dong, R.; Zhou, H.; Chen, X. Microstructure and Properties of Internal Oxidation Treated Cu-Cr Alloy. Guangzhou Chem. 2022, 15, 585. [Google Scholar]
- Zhang, H.; Zhang, S.; Li, G.; Zang, G.; Zhang, X.; Li, B.; Wang, Y. The Effect of the Aging Process on the Microstructure and Wear Properties of Cu-Cr-Zr Alloys. Metals 2026, 16, 29. [Google Scholar] [CrossRef] [Scilit]
- Fanfan, S.; Dongmei, Z.; Fengzhang, R.; Shuguo, J. Study on Preparation of Al2O3 Diffusion-Strengthened Copper-Based Composites by Internal Oxidation Method. Hot Process. Technol. 2008, 37, 99–102. [Google Scholar]
- Yifan, Z.; Zhen, J.; Guimin, L.; Chengchang, J.; Yi, T. Study on Oxidative Thermodynamics and Kinetics in Cu-Al Composite Powder Based on Numerical Simulation. Powder Metall. Technol. 2016, 34, 21–25. [Google Scholar]
- Fu, S.; Chen, X.; Liu, P.; Zhou, H.; Ma, F.; Li, W. Preparation of layered gradient Cu–Cr–Ti alloy with excellent mechanical properties, thermal stability, and electrical conductivity. Nanotechnol. Rev. 2022, 11, 3207–3217. [Google Scholar] [CrossRef] [Scilit]
- Hu, J.; Tian, Y.; Yu, H.; Ling, G.; Li, S.; Jiang, M.; Li, H.; Qin, G. Optimizing strength and electrical conductivity of Cu-Cr-Zr alloy by two-stage aging treatment. Mater. Lett. 2022, 315, 131937. [Google Scholar] [CrossRef] [Scilit]
- Sun, W.; Li, S.; Song, K.; Wang, Q.; Zhu, Y. Effects of cold rolling reduction rate on the microstructure and properties of Cu-1.16 Ni-0.36 Cr alloy after thermo-mechanical treatment. Materials 2023, 16, 6508. [Google Scholar] [CrossRef] [Scilit] [PubMed]
- Li, S.; Li, S.; Sun, W.; Wang, Q.; Song, K. Precipitation Behavior and Properties Evolution of Cu-1.16 Ni-0.36 Cr Alloy During Heat Treatment. Materials 2025, 18, 3885. [Google Scholar] [CrossRef] [Scilit] [PubMed]
Disclaimer/Publisher’s Note: The statements, opinions and data contained in all publications are solely those of the individual author(s) and contributor(s) and not of MDPI and/or the editor(s). MDPI and/or the editor(s) disclaim responsibility for any injury to people or property resulting from any ideas, methods, instructions or products referred to in the content. |
© 2026 by the authors. Licensee MDPI, Basel, Switzerland. This article is an open access article distributed under the terms and conditions of the Creative Commons Attribution (CC BY) license.