


Abstract
Aluminum volatilization during electron beam cold hearth melting (EBCHM) makes precise composition control of titanium alloys difficult. In this study, a thermodynamic–kinetic framework was established to describe Al evaporation, and a Global Prediction Model (GPM) and Stage-Dependent Prediction Model (SPM) were developed for composition prediction and process analysis. Under the reported comparison basis, the GPM predicted final Al content with a mean absolute percentage error (MAPE) of 4.51% and a maximum error of 8.47%; a first-order normalization of the 4.5 wt.% theoretical predictions to the 4.4 wt.% industrial charging basis reduced the concentration MAPE to approximately 2.10%, showing that part of the original offset arose from the charge-basis mismatch. The SPM showed a MAPE of 8.33% for final Al concentration. Both models systematically underestimated the measured Al loss, indicating a directional bias that remains to be resolved. The SPM predicted that the refining and melting hearths contributed approximately 44.4% and 32.5%, respectively, or 76.9% in total; these percentages are model-derived stage attributions and were not independently validated by stage-resolved measurements. The GPM is therefore most suitable for rapid overall composition prediction, whereas the SPM provides physically interpretable, stage-specific guidance for identifying candidate critical volatilization regions and optimizing EBCHM operating conditions.
1. Introduction
Titanium alloys are widely used in aerospace, marine, and other high-performance applications because of their high specific strength, excellent corrosion resistance, and favorable mechanical properties [1,2,3]. As requirements for high-quality titanium products increase, precise chemical composition control and compositional uniformity have become increasingly important in industrial melting processes.
Electron beam cold hearth melting (EBCHM) is an advanced technology for producing premium titanium alloy ingots. By combining high-energy-density electron beam heating with water-cooled copper hearth refining under high-vacuum conditions, EBCHM provides excellent refining capability and effective inclusion removal [4,5,6]. TA18 alloy (Ti–3Al–2.5V), a near-α titanium alloy widely used in aerospace tubing and pressure-bearing components, was selected as the representative material in this study [1,3].
However, aluminum volatilization under high-temperature and high-vacuum conditions remains a major challenge for composition control during EBCHM. Due to its higher equilibrium vapor pressure, aluminum evaporates preferentially compared with titanium and vanadium, resulting in deviation between the final ingot composition and the target specification [7,8,9,10]. Therefore, accurate prediction of aluminum loss and appropriate aluminum compensation are essential for industrial production.
Previous studies have investigated aluminum evaporation during electron beam melting through experimental analysis, thermodynamic modeling, and numerical simulation. The effects of melting temperature, electron-beam power, molten-pool conditions, and residence time on aluminum loss have been extensively examined [7,8,9,10]. Thermodynamic approaches based on equilibrium vapor pressure, activity correction, and Langmuir evaporation theory have been developed to describe evaporation kinetics under vacuum conditions [11,12,13,14,15,16,17,18]. Thermodynamic assessments of Ti–Al–V systems and numerical simulations incorporating heat transfer, fluid flow, species transport, solidification, and beam-energy distribution have further improved understanding of aluminum evaporation and compositional evolution during EBCHM [19,20,21,22,23,24,25,26,27,28,29,30,31].
Recent studies have strengthened this multiphysics perspective. Three-dimensional cold-hearth and crystallizer models have resolved the coupled evolution of melt-pool shape, flow, heat transfer, solidification, and Al transport [25,27,28,29,30]. A recent CALPHAD reassessment provides an updated thermodynamic description of the Ti–Al–V system over a wide composition and temperature range [26]. More recent EBCHM studies have examined process optimization using CFD-assisted machine learning, melting of Al-containing heat-resistant titanium alloys, electron-beam power distribution, and inclusion dissolution, while electron-beam vacuum-melting work has further emphasized the coupling among thermodynamics, interfacial evaporation, local overheating, and mass transport [31,32,33,34,35]. These developments reinforce the need to distinguish equilibrium volatility from process-scale transport and to account explicitly for spatially non-uniform thermal and flow conditions.
Despite these advances, most existing prediction approaches treat the melting process as a uniform evaporation system or focus on detailed physical simulation. The stage-dependent characteristics of industrial EBCHM, including variations in temperature, residence time, molten metal quantity, and evaporation conditions among different processing regions, have rarely been incorporated into engineering-oriented composition prediction models. Moreover, high-fidelity numerical simulations generally require complex calibration and considerable computational resources, limiting their application for rapid industrial process control.
To address these limitations, this study develops an industrial aluminum composition prediction methodology based on a Stage-Dependent Thermodynamic–Kinetic Prediction Framework for EBCHM of TA18 titanium alloy. A Global Prediction Model (GPM) is established for rapid prediction of overall aluminum loss, while a Stage-Dependent Prediction Model (SPM) is developed to evaluate aluminum volatilization contributions from individual melting stages. The proposed framework combines thermodynamic analysis with industrial process characteristics, providing a practical approach for aluminum compensation, composition control, and process optimization.
2. Experimental Procedures
2.1. Electron Beam Cold Hearth Melting Process
The TA18 titanium alloy ingots were produced by industrial electron beam cold hearth melting (EBCHM) using an EBCHR-6/200/3600 furnace (ALD, Hanau, Germany) equipped with six KSR600 electron guns. The maximum power of each electron gun was 600 kW, with a total beam power of 3600 kW.
The alloy was prepared using sponge titanium-based consumable electrodes. For the baseline production trial used to characterize the industrial melting conditions, the charge composition was Al = 3.6 wt.%, V = 2.3 wt.%, and O = 0.095 wt.%, with a nominal target Al concentration of 3.0 wt.% after compensation. The separate GPM and SPM validation heats described in Section 4.3 and Section 4.4 were deliberately high-Al experimental validation heats used to challenge the volatilization model and were not released as specification-conforming production ingots. Consequently, their measured final Al contents may exceed the TA18 standard upper limit and should not be interpreted as accepted production chemistry.
The melting process was conducted under a vacuum pressure of approximately 0.2 Pa. The feeding rate was controlled according to industrial operating conditions, and the overall melting rate was maintained within 600–800 kg·h−1. The main process parameters used for the thermodynamic–kinetic model are summarized in Table 1.
Table 1.
Main parameters of the industrial EBCHM process.
2.2. Materials and Chemical Composition Analysis
TA18 titanium alloy (Ti–3Al–2.5V) was selected as the research material. During EBCHM, online samples were collected from representative positions of the ingot and analyzed to evaluate the composition stability and aluminum volatilization behavior.
The chemical compositions were measured using standard analytical methods. Aluminum and vanadium concentrations were determined by inductively coupled plasma optical emission spectrometry (ICP-OES, Agilent 5110 SVDV, Agilent Technologies, Santa Clara, CA, USA). Oxygen, nitrogen, and hydrogen contents were analyzed using an ONH836 gas analyzer, LECO Corporation, St. Joseph, MI, USA, while carbon and sulfur were measured using a CS800 carbon–sulfur analyzer, LECO Corporation, St. Joseph, MI, USA. The analyses were performed according to ASTM E1447-2009 (R2016) [36], ASTM E1409-2013 [37], ASTM E2371-2013 [38], and ASTM E1941-2010 (R2016) [39].
The target composition and internal control ranges of the TA18 alloy are listed in Table 2. The measured compositions obtained from online sampling were used for validating the aluminum volatilization prediction models.
Table 2.
Target composition and internal control ranges of TA18 titanium alloy ingots (mass fraction, %).
2.3. Determination of Stage-Dependent Process Parameters
To account for the non-uniform evaporation conditions during industrial EBCHM, the melting process was divided into four representative regions: the melting hearth, refining hearth, overflow hearth, and crystallizer. Effective surface dimensions and melt depths were obtained from the furnace geometry and stable molten-pool observations/records, while representative stage temperatures and melting rates were taken from industrial operating records. These quantities are engineering-scale effective inputs rather than fully time-resolved local fields. Because the archived industrial dataset does not contain repeated, synchronized uncertainty measurements for every local parameter, instrument-specific repeatability and confidence intervals cannot be reconstructed retrospectively; this is an acknowledged limitation of the present study.
The effective evaporation areas of the melting hearth, refining hearth, overflow hearth, and crystallizer were 0.7176, 0.8510, 0.1740, and 0.2972 m2, respectively. The overall melting rate was maintained at 600–800 kg·h−1, and the furnace pressure was approximately 0.2 Pa. These parameters were used as the basic inputs for the stage-dependent thermodynamic–kinetic calculations.
For each region, molten metal inventory was estimated from the measured/recorded molten-pool geometry and melt depth, and the effective residence time was calculated from the corresponding inventory and instantaneous melting rate. The stage-specific temperature, effective evaporation area, molten metal inventory, and residence time were subsequently introduced into the SPM. The use of a single inventory-based residence time implicitly assumes an effectively well-mixed regional pool; recirculation, bypass flow, and stagnant zones are not resolved and may bias stage-specific loss estimates.
3. Stage-Dependent Thermodynamic–Kinetic Prediction Framework
A thermodynamic–kinetic prediction framework was developed to describe aluminum volatilization during industrial electron beam cold hearth melting (EBCHM) of TA18 titanium alloy. The framework consists of four parts: thermodynamic analysis of elemental evaporation, determination of the aluminum activity coefficient, development of the Global Prediction Model (GPM), and development of the Stage-Dependent Prediction Model (SPM).
3.1. Thermodynamic Analysis of Elemental Evaporation Behavior During EBCHM
Under the high-temperature and high-vacuum conditions of EBCHM, the evaporation tendency of an alloying element is mainly governed by its equilibrium partial pressure above the molten alloy. According to the Hertz–Knudsen–Langmuir relationship, the evaporation rate of element i can be expressed as:
where Ji is the evaporation rate of element i (kg·s−1), αi is the evaporation coefficient, pi is the equilibrium partial pressure of element i above the alloy melt (Pa), S is the effective evaporation area (m2), Mi is the molar mass (kg·mol−1), R is the gas constant, 8.314 J·mol−1·K−1, and T is the melt temperature (K).
For a non-ideal alloy melt, the equilibrium partial pressure is:
where is the saturated vapor pressure of pure element i, xi is the mole fraction, and γi is the activity coefficient.
Substituting Equation (2) into Equation (1) gives:
In this formulation, the mole fraction and activity coefficient are each introduced once through the equilibrium partial pressure.
The saturated vapor pressure of pure element i is calculated using:
where Ai, Bi, and Ci are vapor-pressure constants for the corresponding element.
The mole fraction of element i is calculated from its mass fraction according to:
where xi is the mole fraction of element i, wi is its mass fraction, Mi is its molar mass (kg·mol−1), and the summation over j includes all major alloy components considered in the calculation.
For TA18 alloy, the major components Ti, Al, and V are included in the mole-fraction calculation.
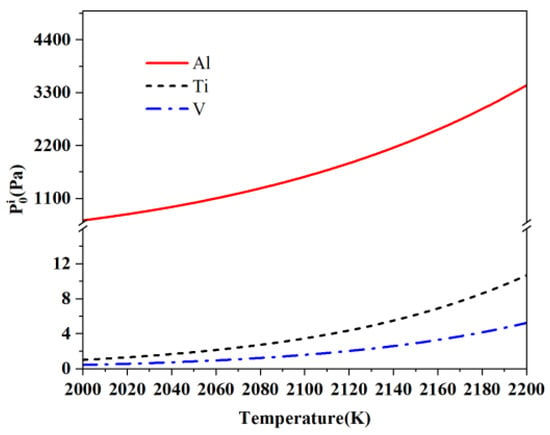
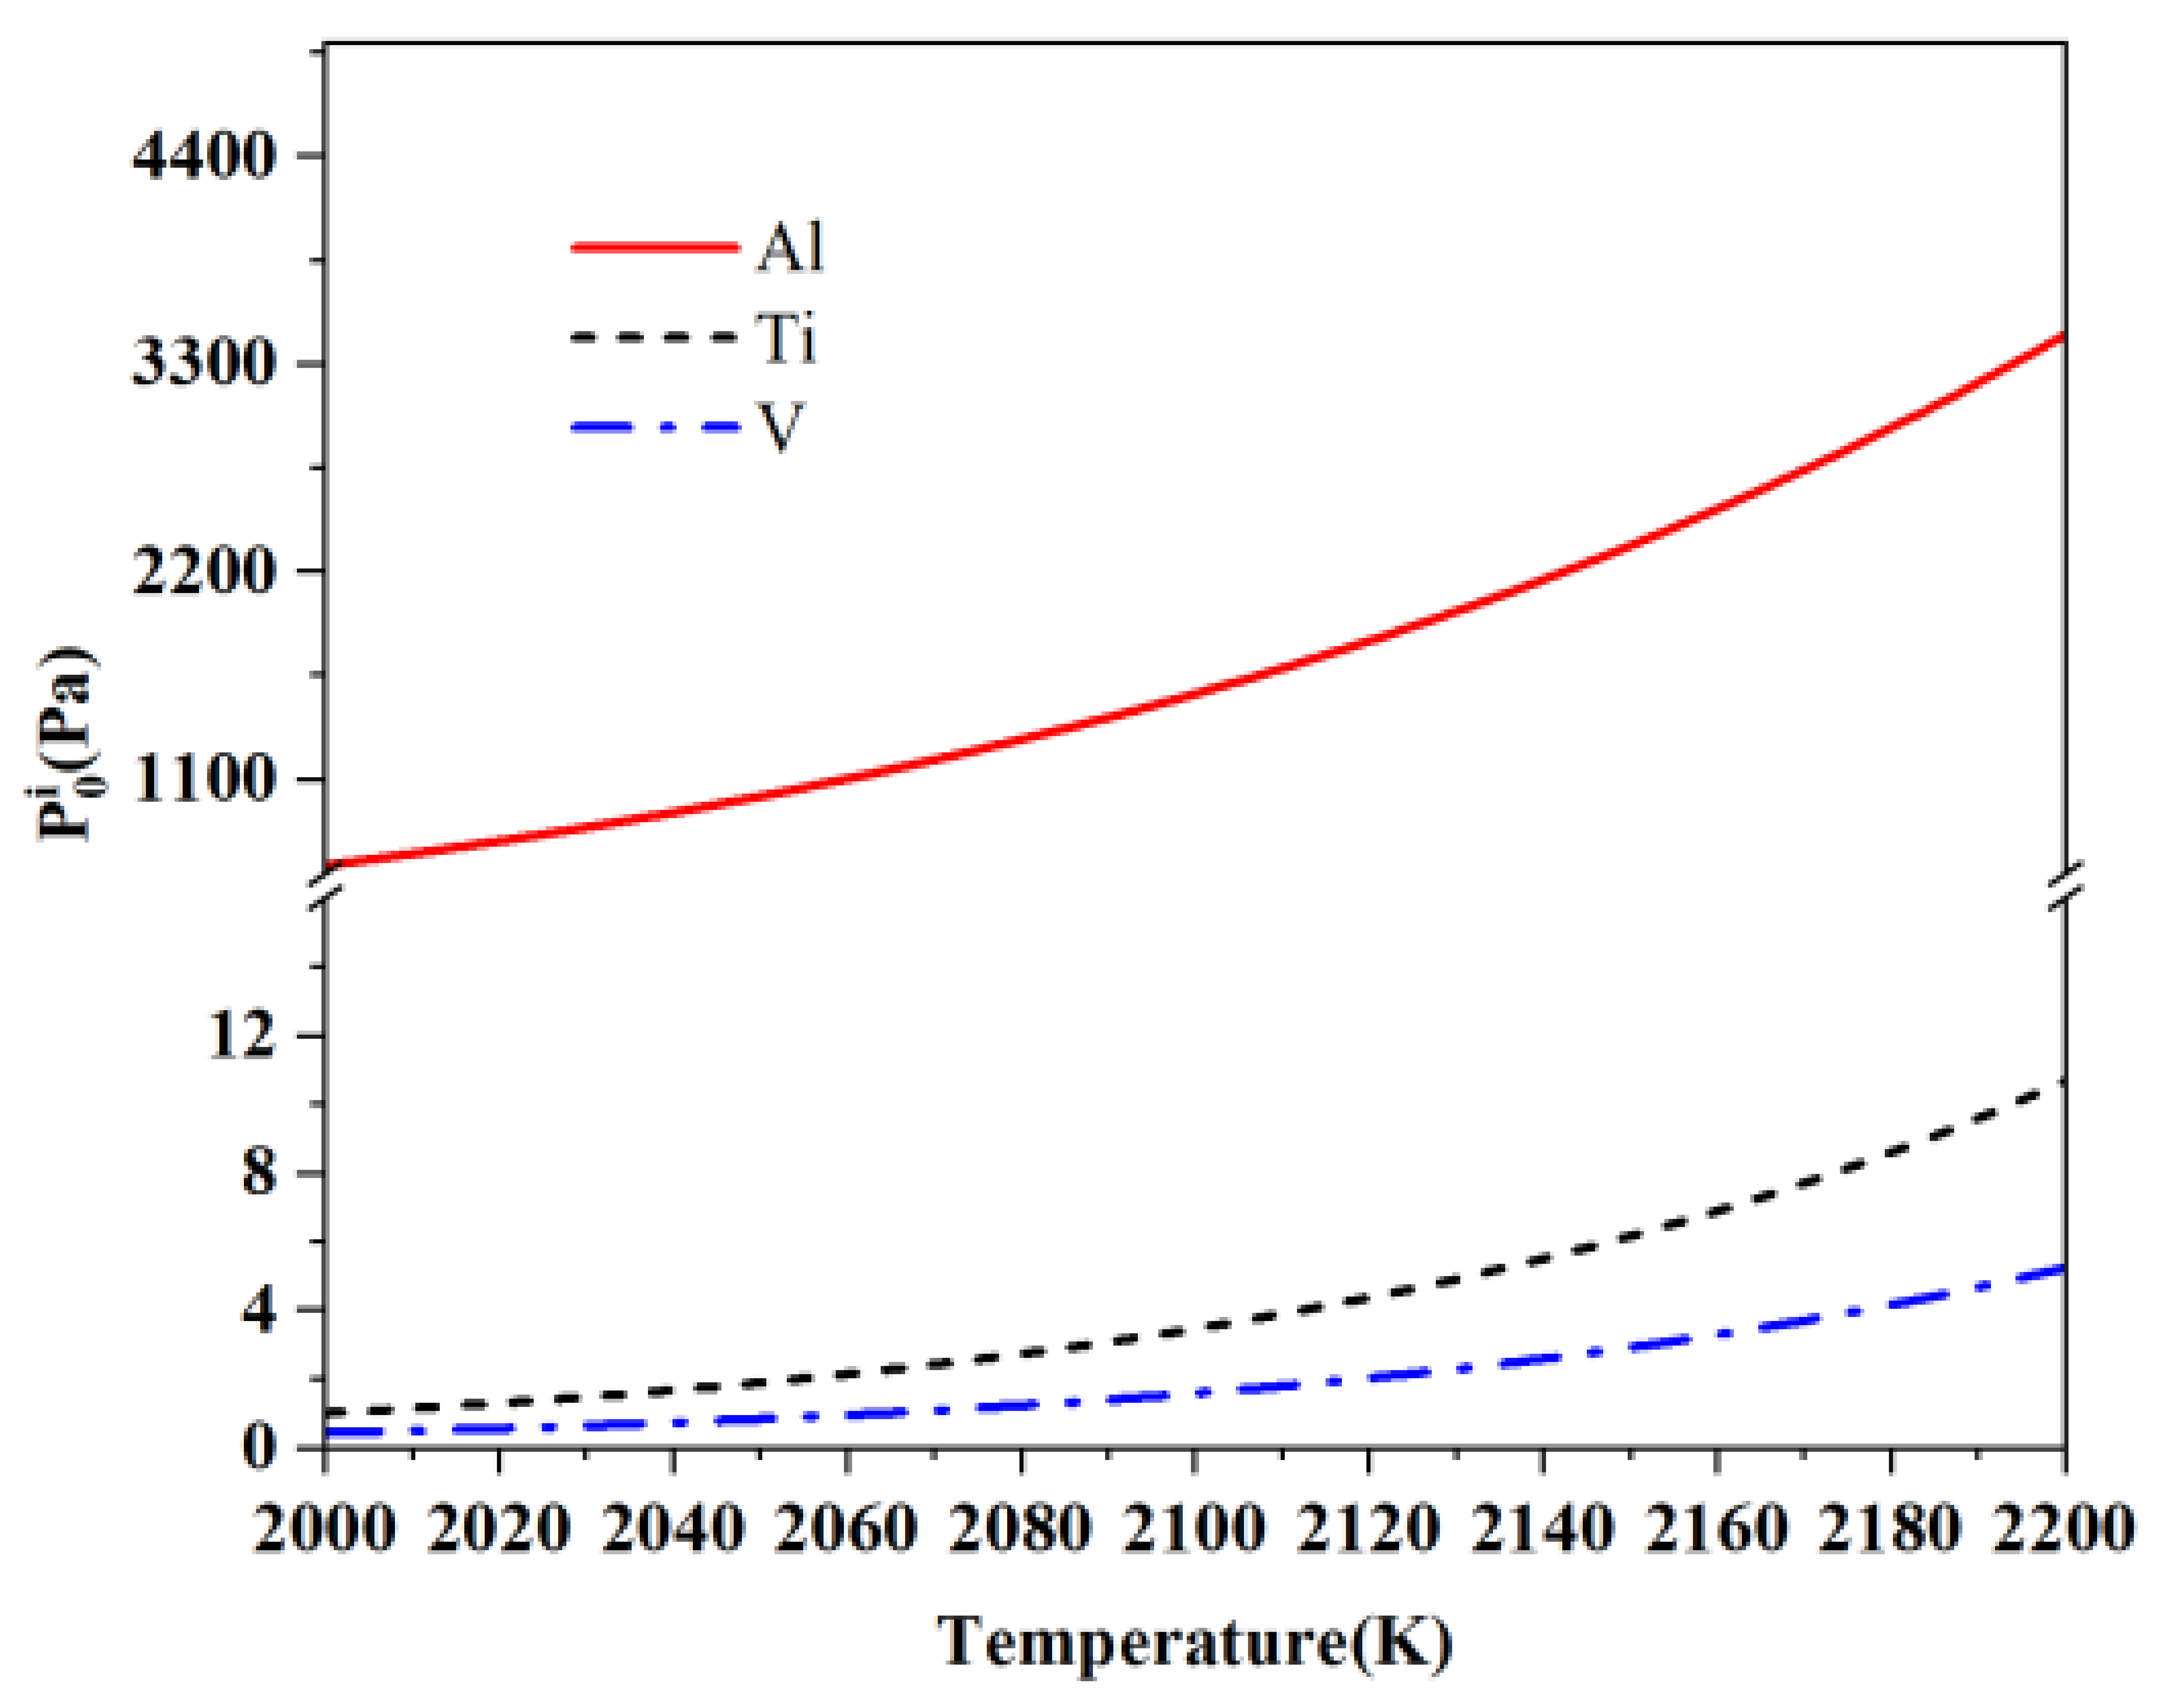
The saturated vapor pressures of Al, Ti, and V were calculated over the EBCHM temperature range to compare their evaporation tendencies.
The calculated saturated vapor pressures of Al, Ti, and V over 2000–2200 K are shown in Figure 1. Their quantitative implications for preferential Al evaporation are discussed in Section 4.1.
Figure 1.
Calculated saturated vapor pressures of Al, Ti, and V as a function of temperature under EBCHM conditions.
3.2. Determination of Aluminum Activity Coefficient
An effective aluminum activity coefficient is required to close the equilibrium-partial-pressure term used in the present engineering model. It was calibrated from industrial aluminum-loss data rather than taken as an independently measured thermodynamic activity coefficient. Because the calibration assumes αAl = 1 and a fixed effective evaporation area, the fitted parameter can absorb thermodynamic non-ideality together with uncertainties in mass accommodation, effective area, temperature, interfacial mass transfer, and molten-pool dynamics. It is therefore referred to throughout this work as an experimentally calibrated effective activity coefficient, and values below unity should not by themselves be interpreted as a direct measurement of thermodynamic non-ideality.
Four melting datasets with different initial aluminum charging fractions were selected exclusively for parameter calibration. These four calibration heats are independent of the industrial heats used for the GPM and SPM validation in Section 4.3 and Section 4.4; in particular, calibration dataset #4 (4.5 wt.% Al) is not one of the validation heats. The initial Al content, measured Al concentration after melting, and corresponding Al loss are summarized in Table 3.
Table 3.
Aluminum charging conditions and measured volatilization losses used for model calibration.
The experimentally determined aluminum loss was converted into an equivalent evaporation rate according to:
where JAl is the aluminum evaporation rate (kg·s−1), is the melting rate (kg·h−1), and ΔwAl is the aluminum loss expressed as a mass fraction.
The effective aluminum activity coefficient can then be obtained by rearranging Equation (3):
For dimensional consistency, the molar mass of aluminum is taken as:
MAl = 0.02698 kg·mol−1
The effective evaporation area used for the global calibration was 2.0397 m2, corresponding to the combined exposed areas considered in the industrial calibration. The saturated vapor pressures used were 792.988 Pa at 2023 K and 1881.589 Pa at 2123 K.
The composition parameters and experimentally derived evaporation rates are summarized in Table 4.
Table 4.
Composition parameters and aluminum evaporation rates used for activity-coefficient determination.
Using the recalculated aluminum mole fractions and experimentally derived evaporation rates listed in Table 4, the effective aluminum activity coefficient was recalculated according to Equation (7). The total effective evaporation area was S = 2.0397 m2, the evaporation coefficient was assumed to be αAl = 1, and the aluminum molar mass was expressed in SI units as MAl = 0.02698 kg·mol−1. Thus, the fitted γAl should be interpreted as a lumped effective parameter for this model/calibration configuration rather than as a stand-alone CALPHAD thermodynamic activity coefficient.
The recalculated mean activity coefficients are therefore:
γAl = 0.0271 at 2023 K and γAl = 0.0117 at 2123 K
The relatively similar coefficients of variation at the two temperatures indicate that the scatter mainly originates from the experimental relationship between aluminum loss and initial aluminum concentration rather than from the temperature conversion itself.
To further evaluate the consistency of the four calibration datasets, the experimentally derived aluminum evaporation rate was fitted against the recalculated aluminum mole fraction using a linear regression constrained through the origin. The fit gave R2 ≈ 0.90. From the four reported data points, the relative standard error of the fitted slope is approximately 5.0%; using a t distribution with three residual degrees of freedom gives an approximate 95% confidence interval of ±16% for the slope. Because γAl is proportional to this slope in Equation (7), the corresponding regression-based effective activity coefficients are γAl = 0.0279 (approximate 95% CI: 0.0234–0.0324) at 2023 K and γAl = 0.0120 (approximate 95% CI: 0.0101–0.0139) at 2123 K. This uncertainty propagates approximately linearly to evaporation rate when the other model inputs are held fixed. The interval should be regarded as an indicative regression uncertainty only, because it does not include uncertainty in temperature, effective area, evaporation coefficient, or flow conditions.
R2 ≈ 0.90
The corresponding regression-based effective activity coefficients were approximately:
γAl = 0.0279 at 2023 K and γAl = 0.0120 at 2123 K
These values are close to the arithmetic means obtained from the four individual datasets. Therefore, the regression-derived values are recommended for subsequent model calculations because they represent the overall relationship between aluminum concentration and experimentally derived evaporation rate.
3.3. Development of Global Prediction Model (GPM)
The Global Prediction Model (GPM) was developed to provide a rapid engineering method for estimating the overall aluminum volatilization during industrial EBCHM and, inversely, determining the initial aluminum addition required to achieve a specified final composition.
In the GPM, the complete EBCHM process is treated as an equivalent evaporation system. The spatial differences among the melting hearth, refining hearth, overflow hearth, and crystallizer are represented by equivalent global process parameters. A fixed aluminum evaporation rate is not assumed; instead, the evaporation rate is recalculated from the aluminum composition and thermodynamic state according to the Hertz–Knudsen–Langmuir relationship.
For a given initial aluminum concentration, the global aluminum evaporation rate is expressed as:
where JAl,G is the global aluminum evaporation rate (kg·s−1), TG is the equivalent melt temperature, SG is the effective evaporation area, and γAl,G is the effective aluminum activity coefficient under the global melting condition.
The effective melting duration for an ingot of mass Mingot is calculated from the industrial melting mass flow rate:
where is expressed in kg·h−1 and tG in s.
The corresponding total aluminum evaporation mass is:
and the aluminum loss relative to the initial ingot mass is:
Because JAl,G depends on the aluminum mole fraction xAl, which itself depends on the initial aluminum charging fraction, the required aluminum addition is determined iteratively rather than by adding a constant volatilization correction.
For a specified target aluminum concentration wAl,target, mass conservation gives:
where wAl,0 is the initial aluminum charging fraction, M0 is the initial alloy mass, and Mf is the final ingot mass after volatilization.
If aluminum evaporation is considered the dominant mass loss,
and therefore:
For the relatively small evaporation losses encountered during EBCHM, Equation (14) approaches the commonly used engineering approximation:
However, Equation (14) is retained in the present model for mass-balance consistency.
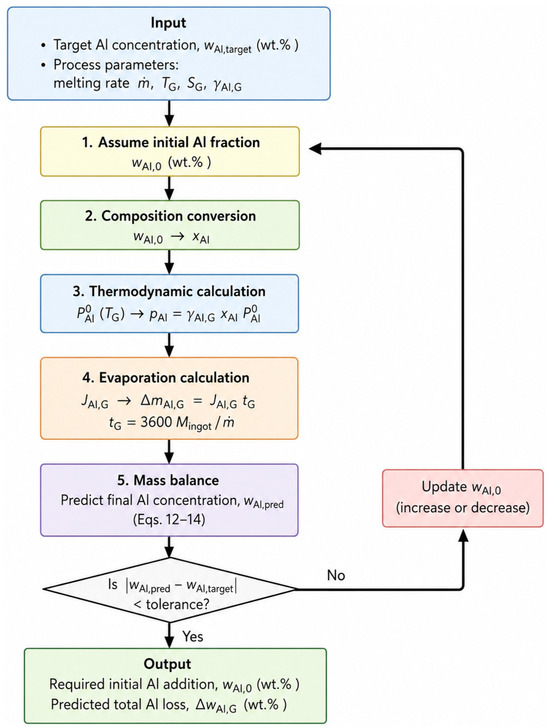
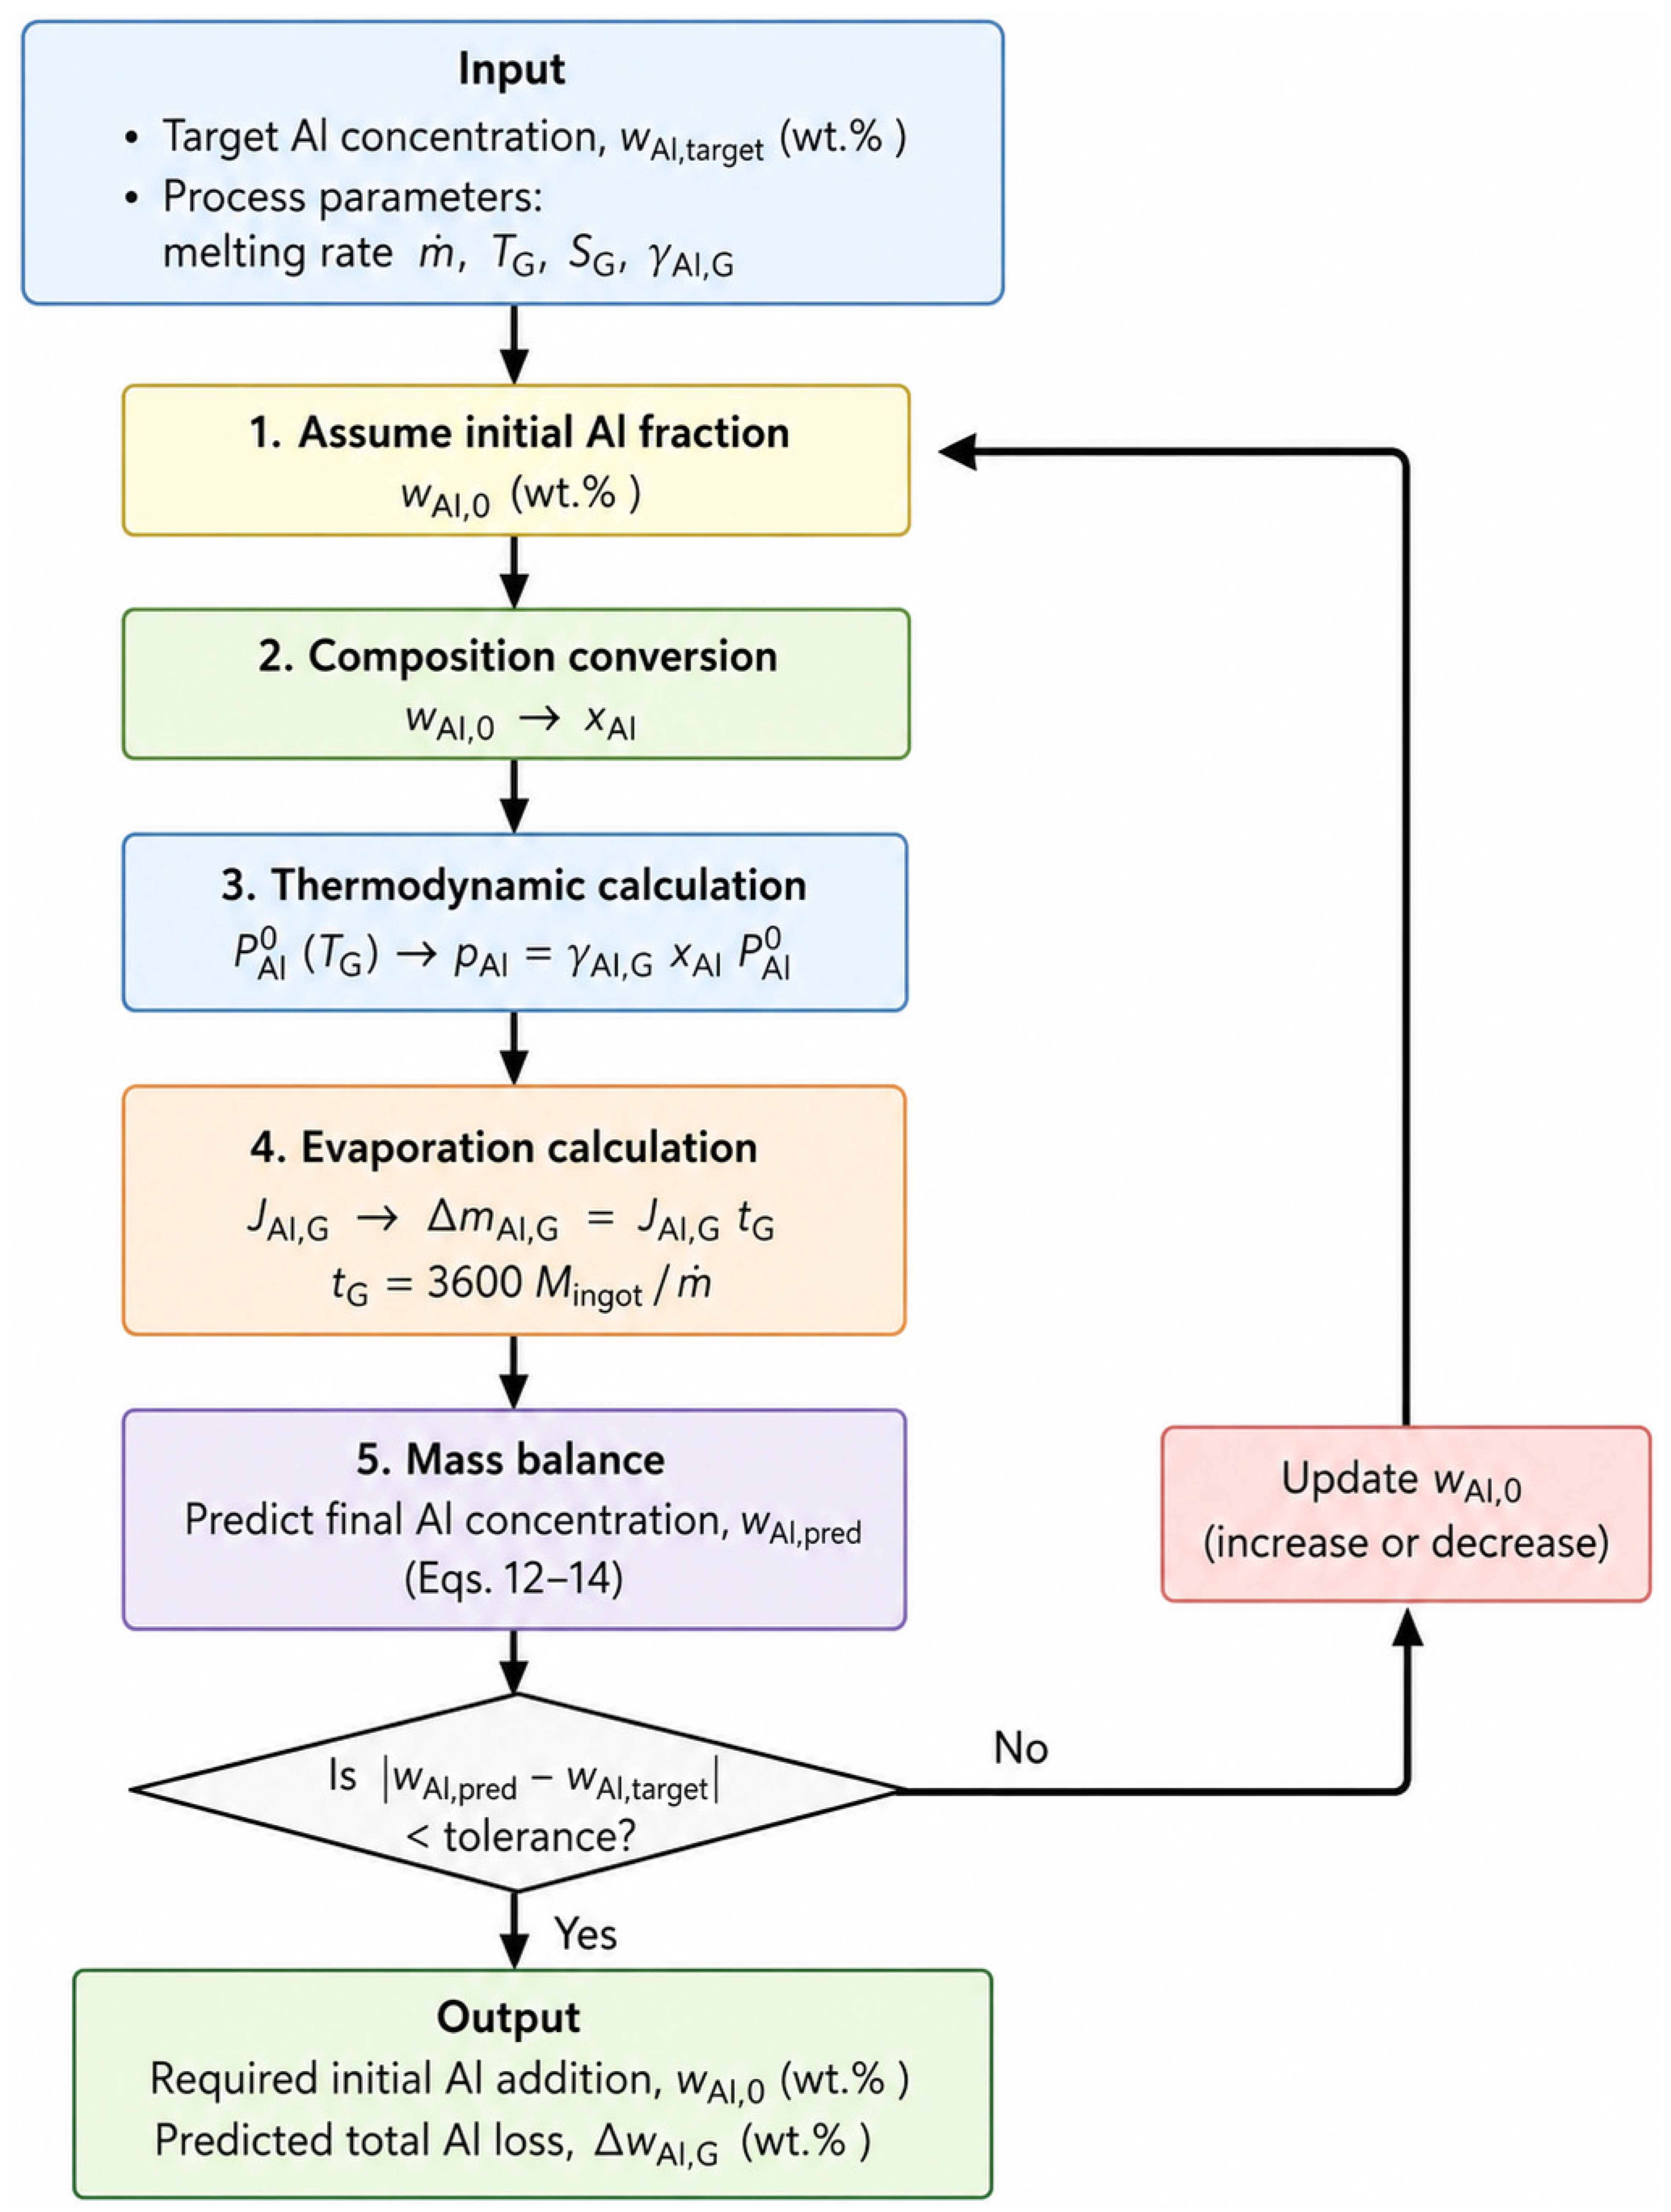
The calculation procedure of the GPM is illustrated in Figure 2. Starting from the target aluminum concentration and industrial process parameters, an initial aluminum charging fraction is assumed. The corresponding mole fraction, equilibrium vapor pressure, evaporation rate, and total aluminum loss are then calculated. The predicted final aluminum concentration is compared with the target value, and the initial aluminum fraction is iteratively adjusted until the prescribed convergence criterion is satisfied.
Figure 2.
Flow chart of the Global Prediction Model (GPM) for determining the initial aluminum charging fraction during EBCHM.
3.4. Development of the Stage-Dependent Prediction Model (SPM)
The Global Prediction Model treats the entire EBCHM process as an equivalent evaporation system. However, the temperature, molten metal inventory, evaporation area, and residence time vary substantially among different regions of the industrial EBCHM furnace. To account for these spatial differences, a Stage-Dependent Prediction Model (SPM) was developed by dividing the melting process into four representative regions: the melting hearth, refining hearth, overflow hearth, and crystallizer.
The stage-dependent parameters were determined from industrial furnace geometry, molten-pool observations/records, and operating records. During stable melting, the total molten metal inventory in the three cold-hearth regions was approximately 150 kg. Based on the recorded molten-pool geometry and melt depths, the molten metal fractions in the melting, refining, and overflow hearths were estimated to be 66.4%, 29.5%, and 4.1%, corresponding to inventories of 99.6, 44.3, and 6.1 kg, respectively. The crystallizer inventory was estimated independently as 31.2 kg from its own molten-pool geometry and therefore is not included in the 100% cold-hearth melt-fraction normalization. The representative average temperatures were 2153, 2068, 2043, and 1993 K. These values are effective engineering inputs; synchronized local uncertainty measurements were not available in the archived dataset, which limits formal uncertainty propagation for all SPM inputs.
For each region, the effective residence time was calculated from the molten metal inventory and the instantaneous melting rate:
where ti is the effective residence time in region i (s), Mi is the molten metal inventory (kg), and is the industrial melting rate (kg·h−1).
For example, at a representative melting rate of 700 kg·h−1, the inventory-based residence times in the melting hearth, refining hearth, overflow hearth, and crystallizer were approximately 512, 228, 31, and 160 s, respectively. Equation (16) represents a mean residence time and implicitly assumes an effectively well-mixed regional pool. Real EBCHM flow can contain recirculation, preferential flow paths, and stagnant zones, producing a residence-time distribution rather than a single value. Such hydrodynamic heterogeneity is not resolved by the present SPM and may shift both absolute loss and the apparent regional contribution.
For each region, the saturated vapor pressure of aluminum is calculated at the corresponding temperature:
The effective aluminum activity coefficient is subsequently assigned according to the local temperature. Within the experimentally calibrated temperature interval, γAl,i is obtained from the temperature dependence established in Section 3.2.
The aluminum evaporation rate in region i is then calculated as:
where xAl,i represents the aluminum mole fraction entering the corresponding region.
The aluminum mass loss in each region is:
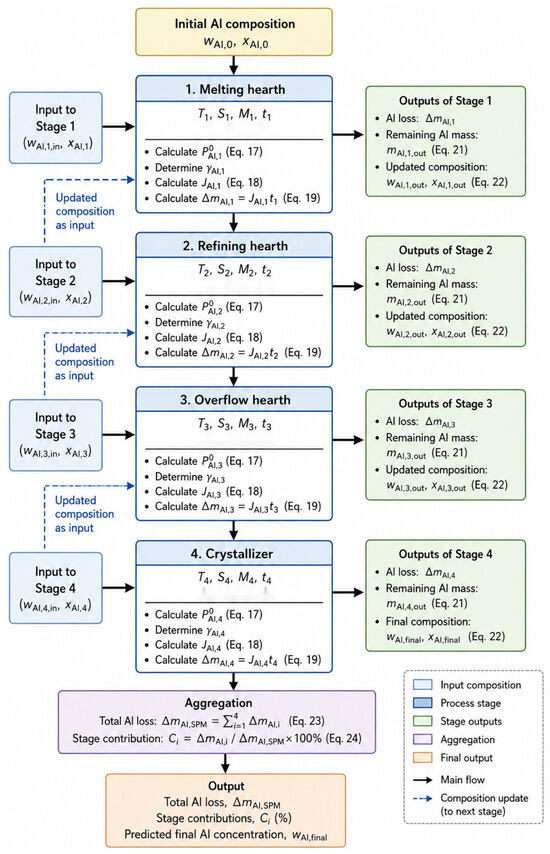
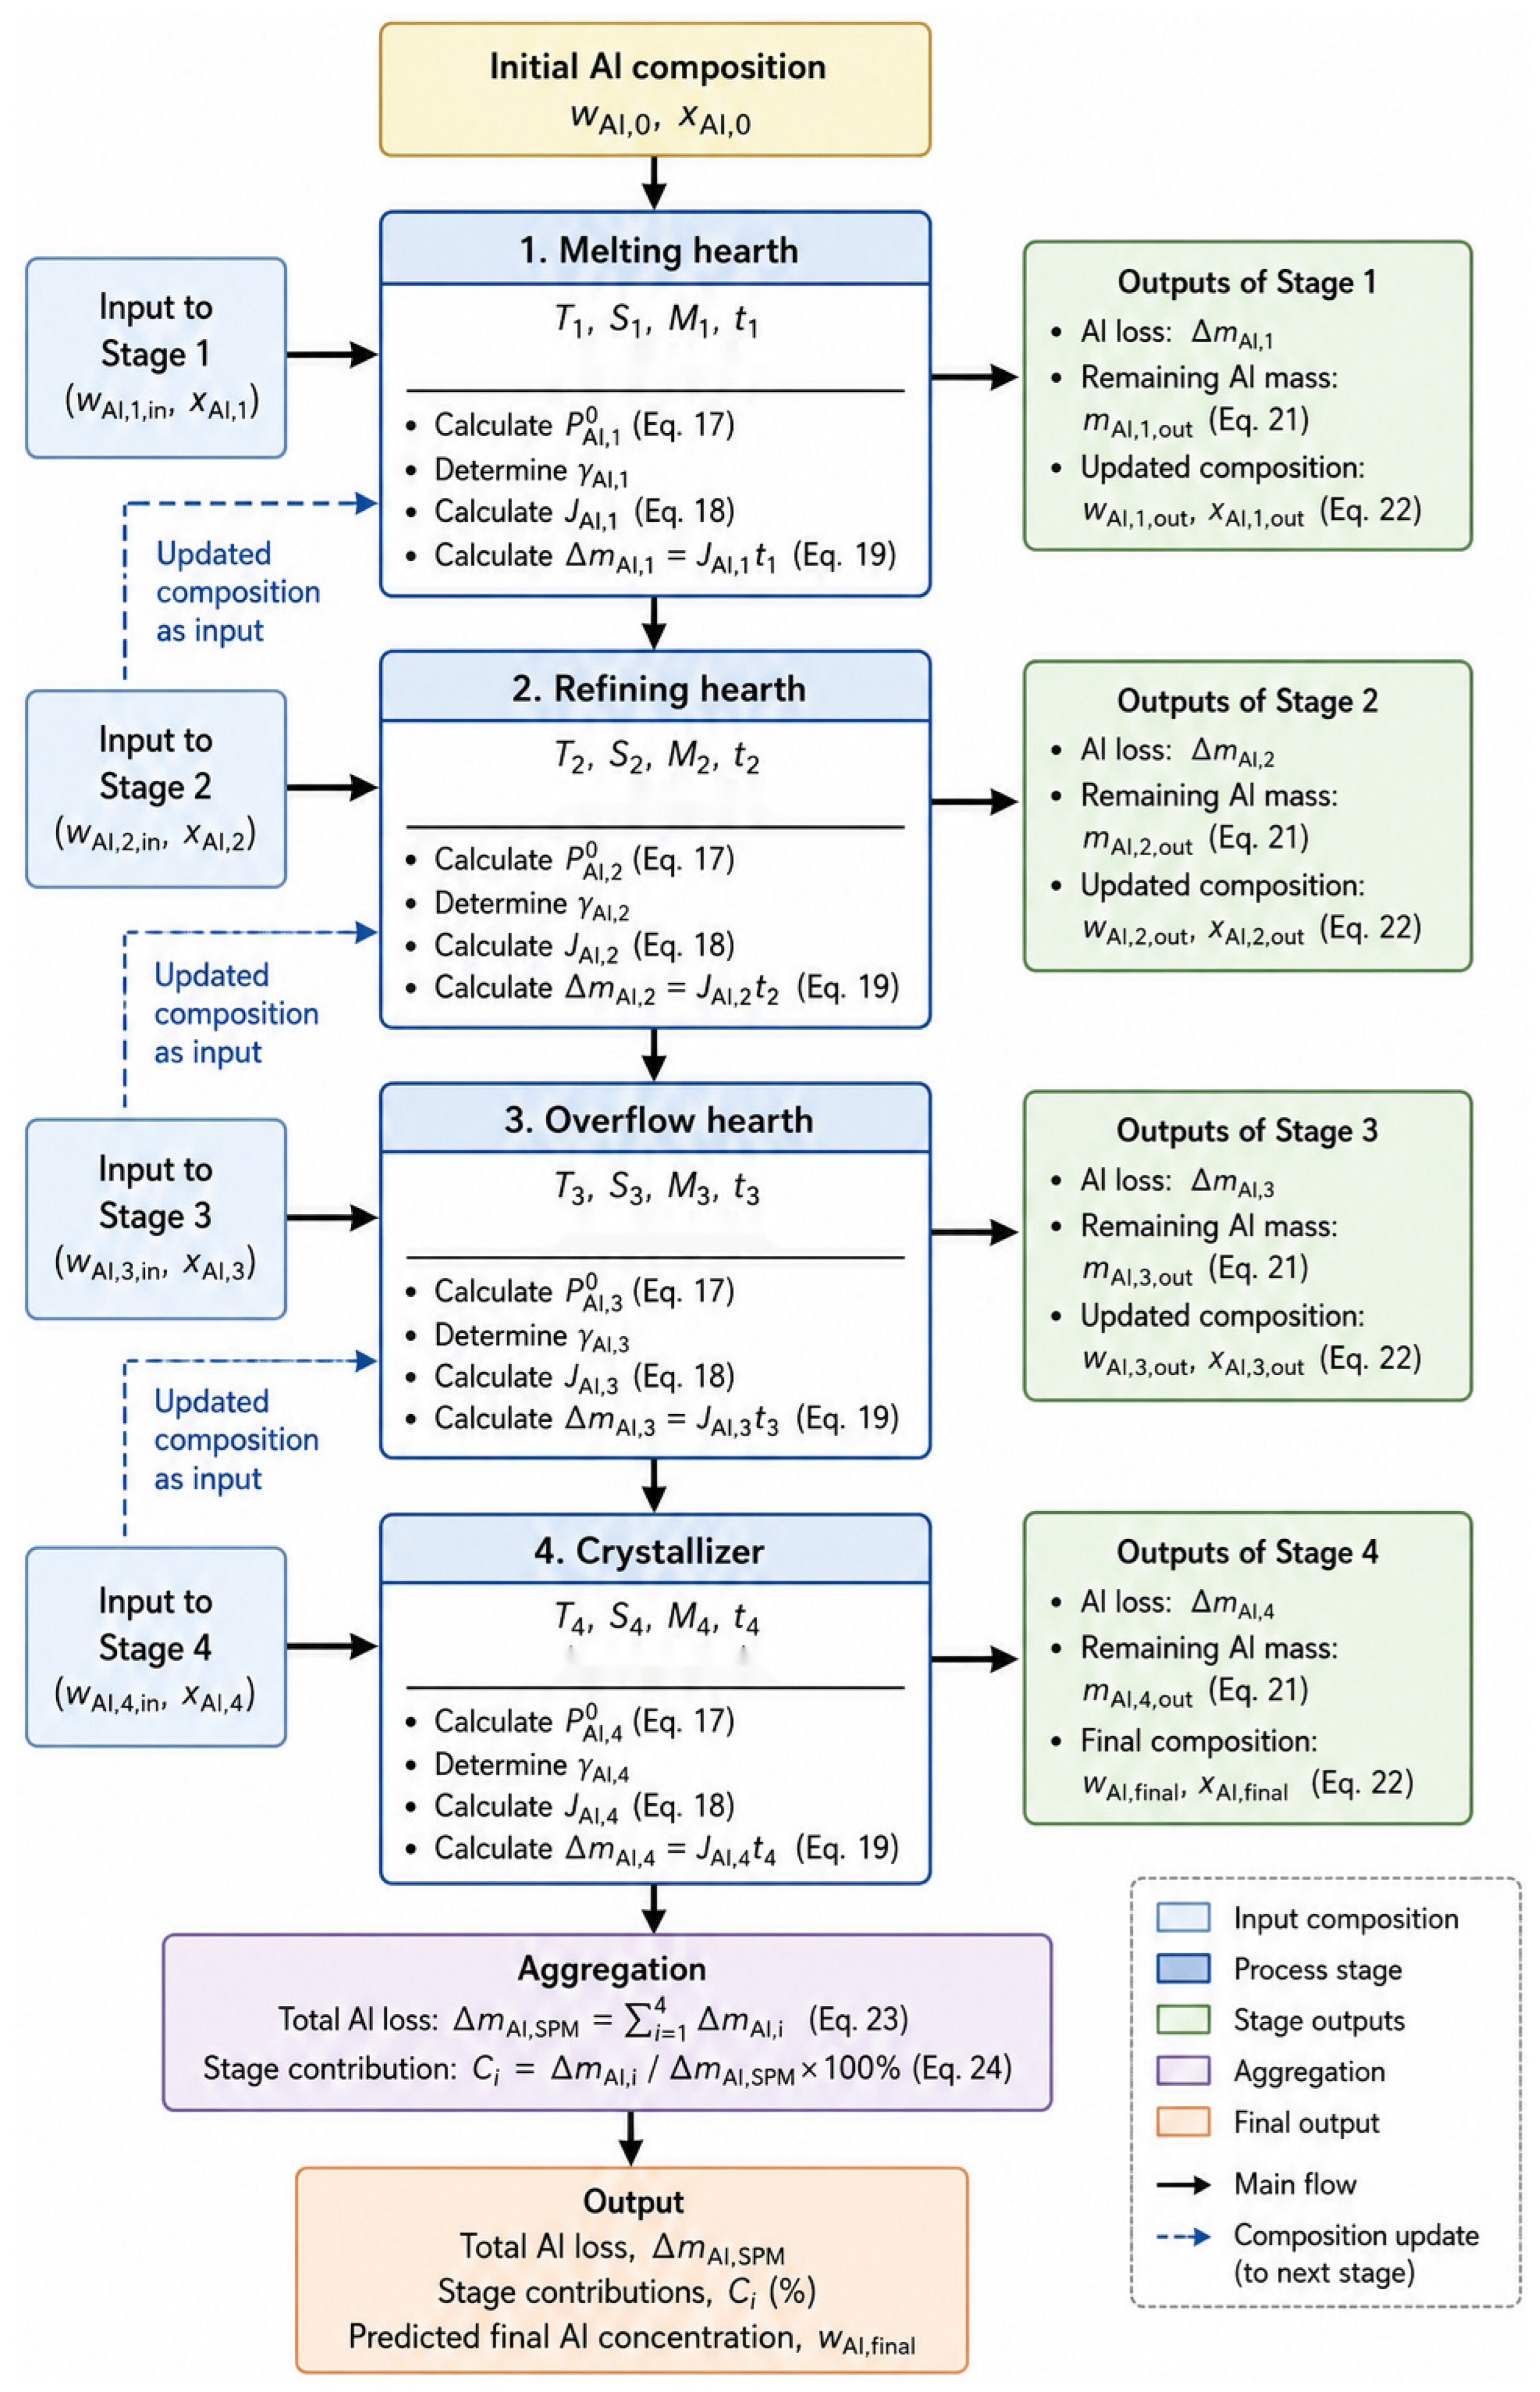
Unlike a simple weighted decomposition, the SPM updates the aluminum concentration sequentially after each evaporation stage. For an initial molten metal mass Mi, in and aluminum mass fraction wAl,i,in, the aluminum mass entering stage i is:
After evaporation, the remaining aluminum mass becomes:
The outlet Al mass fraction is obtained from the remaining Al mass and the outlet molten metal mass, and the resulting composition is transferred to the next stage:
Accordingly, the aluminum mole fraction used in Equation (18) is recalculated before evaluating the subsequent region. This sequential treatment allows changes in aluminum concentration during melting to influence the evaporation rate of the following stage.
The total aluminum evaporation loss predicted by the SPM is obtained by summing the individual stage losses:
and the contribution of each region is defined as:
The complete calculation procedure is illustrated in Figure 3.
Figure 3.
Calculation procedure of the Stage-Dependent Prediction Model (SPM) for aluminum volatilization during EBCHM.
4. Results and Discussion
4.1. Thermodynamic Characteristics of Aluminum Volatilization
Figure 1 compares the saturated vapor pressures of Al, Ti, and V over the EBCHM temperature range. Al exhibits a substantially higher vapor pressure than Ti and V throughout the investigated range, confirming that Al is the dominant volatile alloying element in TA18 under high-temperature, high-vacuum conditions.
At 2023 and 2123 K, the saturated vapor pressure of Al is approximately 793 and 1882 Pa, respectively. A temperature increase of 100 K therefore raises the Al vapor pressure by about 137% (approximately 2.37 times), demonstrating the strong temperature sensitivity of Al evaporation.
These results justify focusing the subsequent modeling on Al volatilization. They also indicate that a single uniform temperature cannot fully represent the industrial EBCHM process, providing the thermodynamic basis for the stage-dependent treatment adopted in the SPM.
4.2. Effective Activity Coefficient of Aluminum
The effective activity coefficient of Al was determined using the four industrial melting datasets summarized in Table 3 and Table 4. As the initial Al charging fraction decreased from 8.2 to 4.5 wt.%, the measured Al loss decreased from 1.76 to 0.74 wt.%, and the experimentally derived evaporation rate decreased from approximately 0.00330 to 0.00139 kg·s−1. This trend is consistent with the dependence of equilibrium Al partial pressure on its mole fraction.
Over the same composition range, the recalculated Al mole fraction decreased from 0.1370 for sample #1 to 0.0773 for sample #4, while the evaporation rate decreased by approximately 58%. Although the relationship is not perfectly linear because the industrial datasets include variations in actual melting conditions, the overall trend confirms that Al concentration is an important factor controlling its evaporation rate.
Using the corrected thermodynamic–kinetic formulation in Equation (7), the effective activity coefficients were recalculated for each calibration dataset; the results are summarized in Table 5. The stage-dependent process parameters used for the SPM are summarized in Table 6.
Table 5.
Recalculated effective aluminum activity coefficients under representative EBCHM temperatures.
Table 6.
Stage-dependent process parameters determined from industrial furnace geometry, molten-pool observations/records, and operating records for the SPM. * The crystallizer inventory is estimated independently from its own molten pool and is not included in the 100% melt-fraction normalization of the three cold-hearth regions.
At 2023 K, the calculated γAl values ranged from 0.0220 to 0.0299, with a mean value of 0.0271. At 2123 K, γAl ranged from 0.0095 to 0.0129, with a mean value of 0.0117. The coefficients of variation were approximately 13.3% at both temperatures, indicating moderate scatter among the four industrial datasets.
The calibrated effective coefficients are substantially lower than unity. However, because αAl was fixed at unity and the effective area and local transport processes were not independently identified, these fitted values cannot be attributed uniquely to thermodynamic non-ideality. They represent a lumped thermodynamic–kinetic correction under the present industrial calibration. Thermodynamic assessments of Ti–Al–V systems [19,20,26] support non-ideal Al behavior, including the recent CALPHAD reassessment covering the ternary system over a wide composition and temperature range [26], but a direct numerical comparison is not one-to-one because the present fitted parameter also contains kinetic and process-scale effects. Future work should separate thermodynamic activity from mass-accommodation and transport effects using independent activity data and/or dedicated evaporation experiments.
A regression of the experimentally derived Al evaporation rate against the recalculated Al mole fraction gave an approximate coefficient of determination of R2 ≈ 0.90. The regression-derived effective activity coefficients were approximately 0.0279 at 2023 K and 0.0120 at 2123 K, close to the corresponding arithmetic means in Table 5. Therefore, these regression-derived values were adopted as the reference activity coefficients for subsequent prediction calculations.
For temperatures between 2023 and 2123 K, the effective activity coefficient was obtained by interpolation between the two calibrated values. For stage temperatures outside this interval, the calculated values were treated as extrapolated effective parameters rather than independently validated thermodynamic data. A bounding sensitivity test was therefore performed for the two extrapolated stages by fixing γAl at the nearest calibration-limit value while holding all other inputs constant. Replacing γAl = 0.0072 at 2153 K by the 2123 K limit of 0.0120 increases the melting-hearth evaporation term by about 66.7%, whereas replacing γAl = 0.0327 at 1993 K by the 2023 K limit of 0.0279 decreases the crystallizer term by about 14.7%. Applied to the baseline regional contributions, this conservative bound increases the total stage-summed loss by approximately 19.6% and changes the normalized melting/refining/crystallizer/overflow contributions from about 32.5/44.4/14.1/9.0% to approximately 45.3/37.1/10.1/7.5%. Thus, the conclusion that the two cold-hearth regions dominate remains, but the precise regional percentages are sensitive to extrapolation and should not be interpreted as experimentally established constants.
Overall, the calibrated activity coefficients provide a consistent link between the experimentally measured Al loss and the thermodynamic evaporation model. The regression-derived reference values are subsequently used in both the GPM and SPM, while independent industrial melting datasets are reserved for model validation.
4.3. GPM Prediction and Industrial Validation
The inverse GPM calculation yielded a theoretical initial Al charging requirement of approximately 4.5 wt.% for the specified target and equivalent process parameters. The subsequent industrial validation heat was actually charged at 4.4 wt.% Al. The composition bases used to distinguish the inverse GPM design calculation from the industrial validation heat are summarized in Table 7. These two tasks are therefore separated here: 4.5 wt.% is an inverse-design result, whereas 4.4 wt.% is theexperimental starting composition. Because the archived calculation table contains the 4.5 wt.% forward predictions, Table 8 retains those original values but no longer treats their direct comparison with the 4.4 wt.% heat as a charge-basis-matched validation. A first-order charge-basis normalization is additionally reported below to quantify the magnitude of this offset; a full forward rerun at 4.4 wt.% is reserved for implementation with the original process-calculation code.
Table 7.
Composition basis used to distinguish the inverse GPM design calculation from the industrial validation heat (mass fraction, %).
Table 8.
Comparison between GPM-predicted and experimentally measured Al concentrations.
The 4.5 wt.% value represents the inverse-calculated theoretical charging basis, whereas 4.4 wt.% represents the actual industrial batching condition. The predicted values in Table 8 were generated on the 4.5 wt.% basis and are retained for transparency. For a diagnostic separation of the 0.1 wt.% charge-basis mismatch from model residual error, the predicted final Al contents were also normalized by −0.1 wt.% as a first-order mass-fraction correction. This normalization is not presented as a substitute for a complete nonlinear forward recalculation, but it directly quantifies how much of the reported offset can arise from the different initial basis.
The industrial validation covered ingot pulling lengths from 3302 to 4601 mm, with melting rates ranging from 615.67 to 783.20 kg·h−1. The GPM predictions and corresponding experimental measurements are compared in Table 8.
As shown in Table 8, the original 4.5 wt.%-basis GPM predictions range from 3.858 to 3.995 wt.%, while the 4.4 wt.%-basis industrial measurements range from 3.64 to 3.84 wt.%. On this unmatched basis, the mean predicted-minus-measured concentration bias is +0.168 wt.%, MAE = 0.168 wt.%, RMSE = 0.182 wt.%, and MAPE ≈ 4.51%. After the first-order −0.1 wt.% charge-basis normalization, the mean bias decreases to approximately +0.068 wt.%, MAE to 0.078 wt.%, RMSE to 0.098 wt.%, and MAPE to approximately 2.10%. Thus, a substantial fraction of the original concentration error is attributable to the different initial charging basis, although a residual positive bias remains.
On the original 4.5 wt.% calculation basis, predicted Al loss varied from 0.505 to 0.642 wt.% (mean 0.578 wt.%), compared with measured losses of 0.66–0.86 wt.% (mean approximately 0.746 wt.%). The loss bias (predicted − measured) is −0.168 wt.%, with MAE = 0.168 wt.% and RMSE = 0.182 wt.%. The consistently negative loss residuals show that the model underestimates volatilization. Candidate mechanisms include localized electron-beam hot spots that raise instantaneous surface temperature above the representative value, evaporation from feed droplets or partially melted material before it enters the modeled equivalent pool, and non-evaporative Al-bearing droplet/spatter ejection. These effects are not represented explicitly by the current global formulation and can contribute to the directional bias.
The influence of melting rate can be clearly identified from the predicted results. When the melting rate increased to 783.20 kg·h−1, the predicted Al loss decreased to 0.505 wt.%. In contrast, at a melting rate of 615.67 kg·h−1, the predicted loss increased to 0.642 wt.%. Thus, a decrease of approximately 21% in melting rate resulted in an approximately 27% increase in predicted Al loss. This trend is consistent with the longer effective residence time of molten metal at lower melting rates.
However, the measured Al loss did not exhibit a strictly monotonic dependence on melting rate. For example, measured losses of 0.83 and 0.86 wt.% occurred at melting rates of 761.28 and 682.14 kg·h−1, respectively, whereas the loss was only 0.66 wt.% at 628.89 kg·h−1. Therefore, melting rate alone cannot explain the observed variation in industrial Al volatilization.
This discrepancy indicates that local melting conditions also play an important role. During EBCHM, the melting hearth, refining hearth, overflow hearth, and crystallizer differ in temperature, exposed melt area, molten metal inventory, and residence time. In addition, variations in electron-beam energy distribution can modify local thermal conditions and consequently the Al evaporation rate. Recent multiphysics EBCHM simulations likewise show that melt flow, temperature distribution, casting conditions, overflow configuration, and beam-energy distribution can alter Al transport, segregation, and melt-pool behavior [25,27,28,29,30,31,34]. These spatial effects are averaged in the GPM and cannot be resolved explicitly.
Overall, the GPM reproduced the industrial Al concentration with a MAPE of approximately 4.51% and a maximum relative error of 8.473%, demonstrating its usefulness for rapid overall composition estimation. It also yielded a theoretical initial Al charging fraction of approximately 4.5 wt.%, close to the 4.4 wt.% adopted in the industrial trial. However, the non-monotonic measured Al loss and the systematic differences between predicted and measured compositions show that a single set of global process parameters cannot fully represent spatially heterogeneous evaporation during EBCHM. The stage-dependent effects are therefore evaluated using the SPM in Section 4.4.
4.4. Stage-Dependent Aluminum Volatilization and SPM Validation
The Stage-Dependent Prediction Model (SPM) was applied to quantify aluminum volatilization in the melting hearth, refining hearth, overflow hearth, and crystallizer. In contrast to the GPM, which treats the complete EBCHM process as an equivalent evaporation system, the SPM explicitly considers the differences in temperature, effective evaporation area, molten metal inventory, and residence time among individual processing regions.
The stage-dependent parameters and calculated Al evaporation rates are summarized in Table 9. The molten metal inventories were determined from the measured molten-pool geometry under stable industrial melting conditions. The melting hearth exhibited the highest temperature, whereas the refining hearth had the largest effective evaporation area. Therefore, the local evaporation behavior was controlled by the combined effects of thermodynamic driving force, exposed melt area, molten metal inventory, and residence time rather than by temperature alone.
Table 9.
Stage-dependent parameters and calculated Al evaporation rates used in the SPM.
The stage-resolved Al volatilization amounts predicted for the independent sampling/operating conditions associated with different ingot pulling positions are listed in Table 10. These columns should not be interpreted as a cumulative integral along one continuously increasing ingot length; the local melting rate and operating condition differ among positions, so the predicted total is not required to increase monotonically with pulling length. The term ‘cumulative’ is therefore avoided here and in the table caption.
Table 10.
Stage-resolved Al volatilization predicted by the SPM for independent operating/sampling conditions associated with different ingot pulling positions (kg).
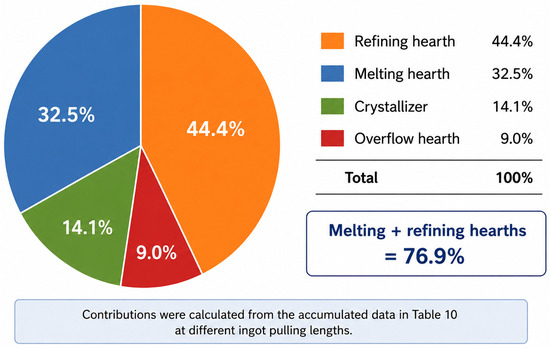
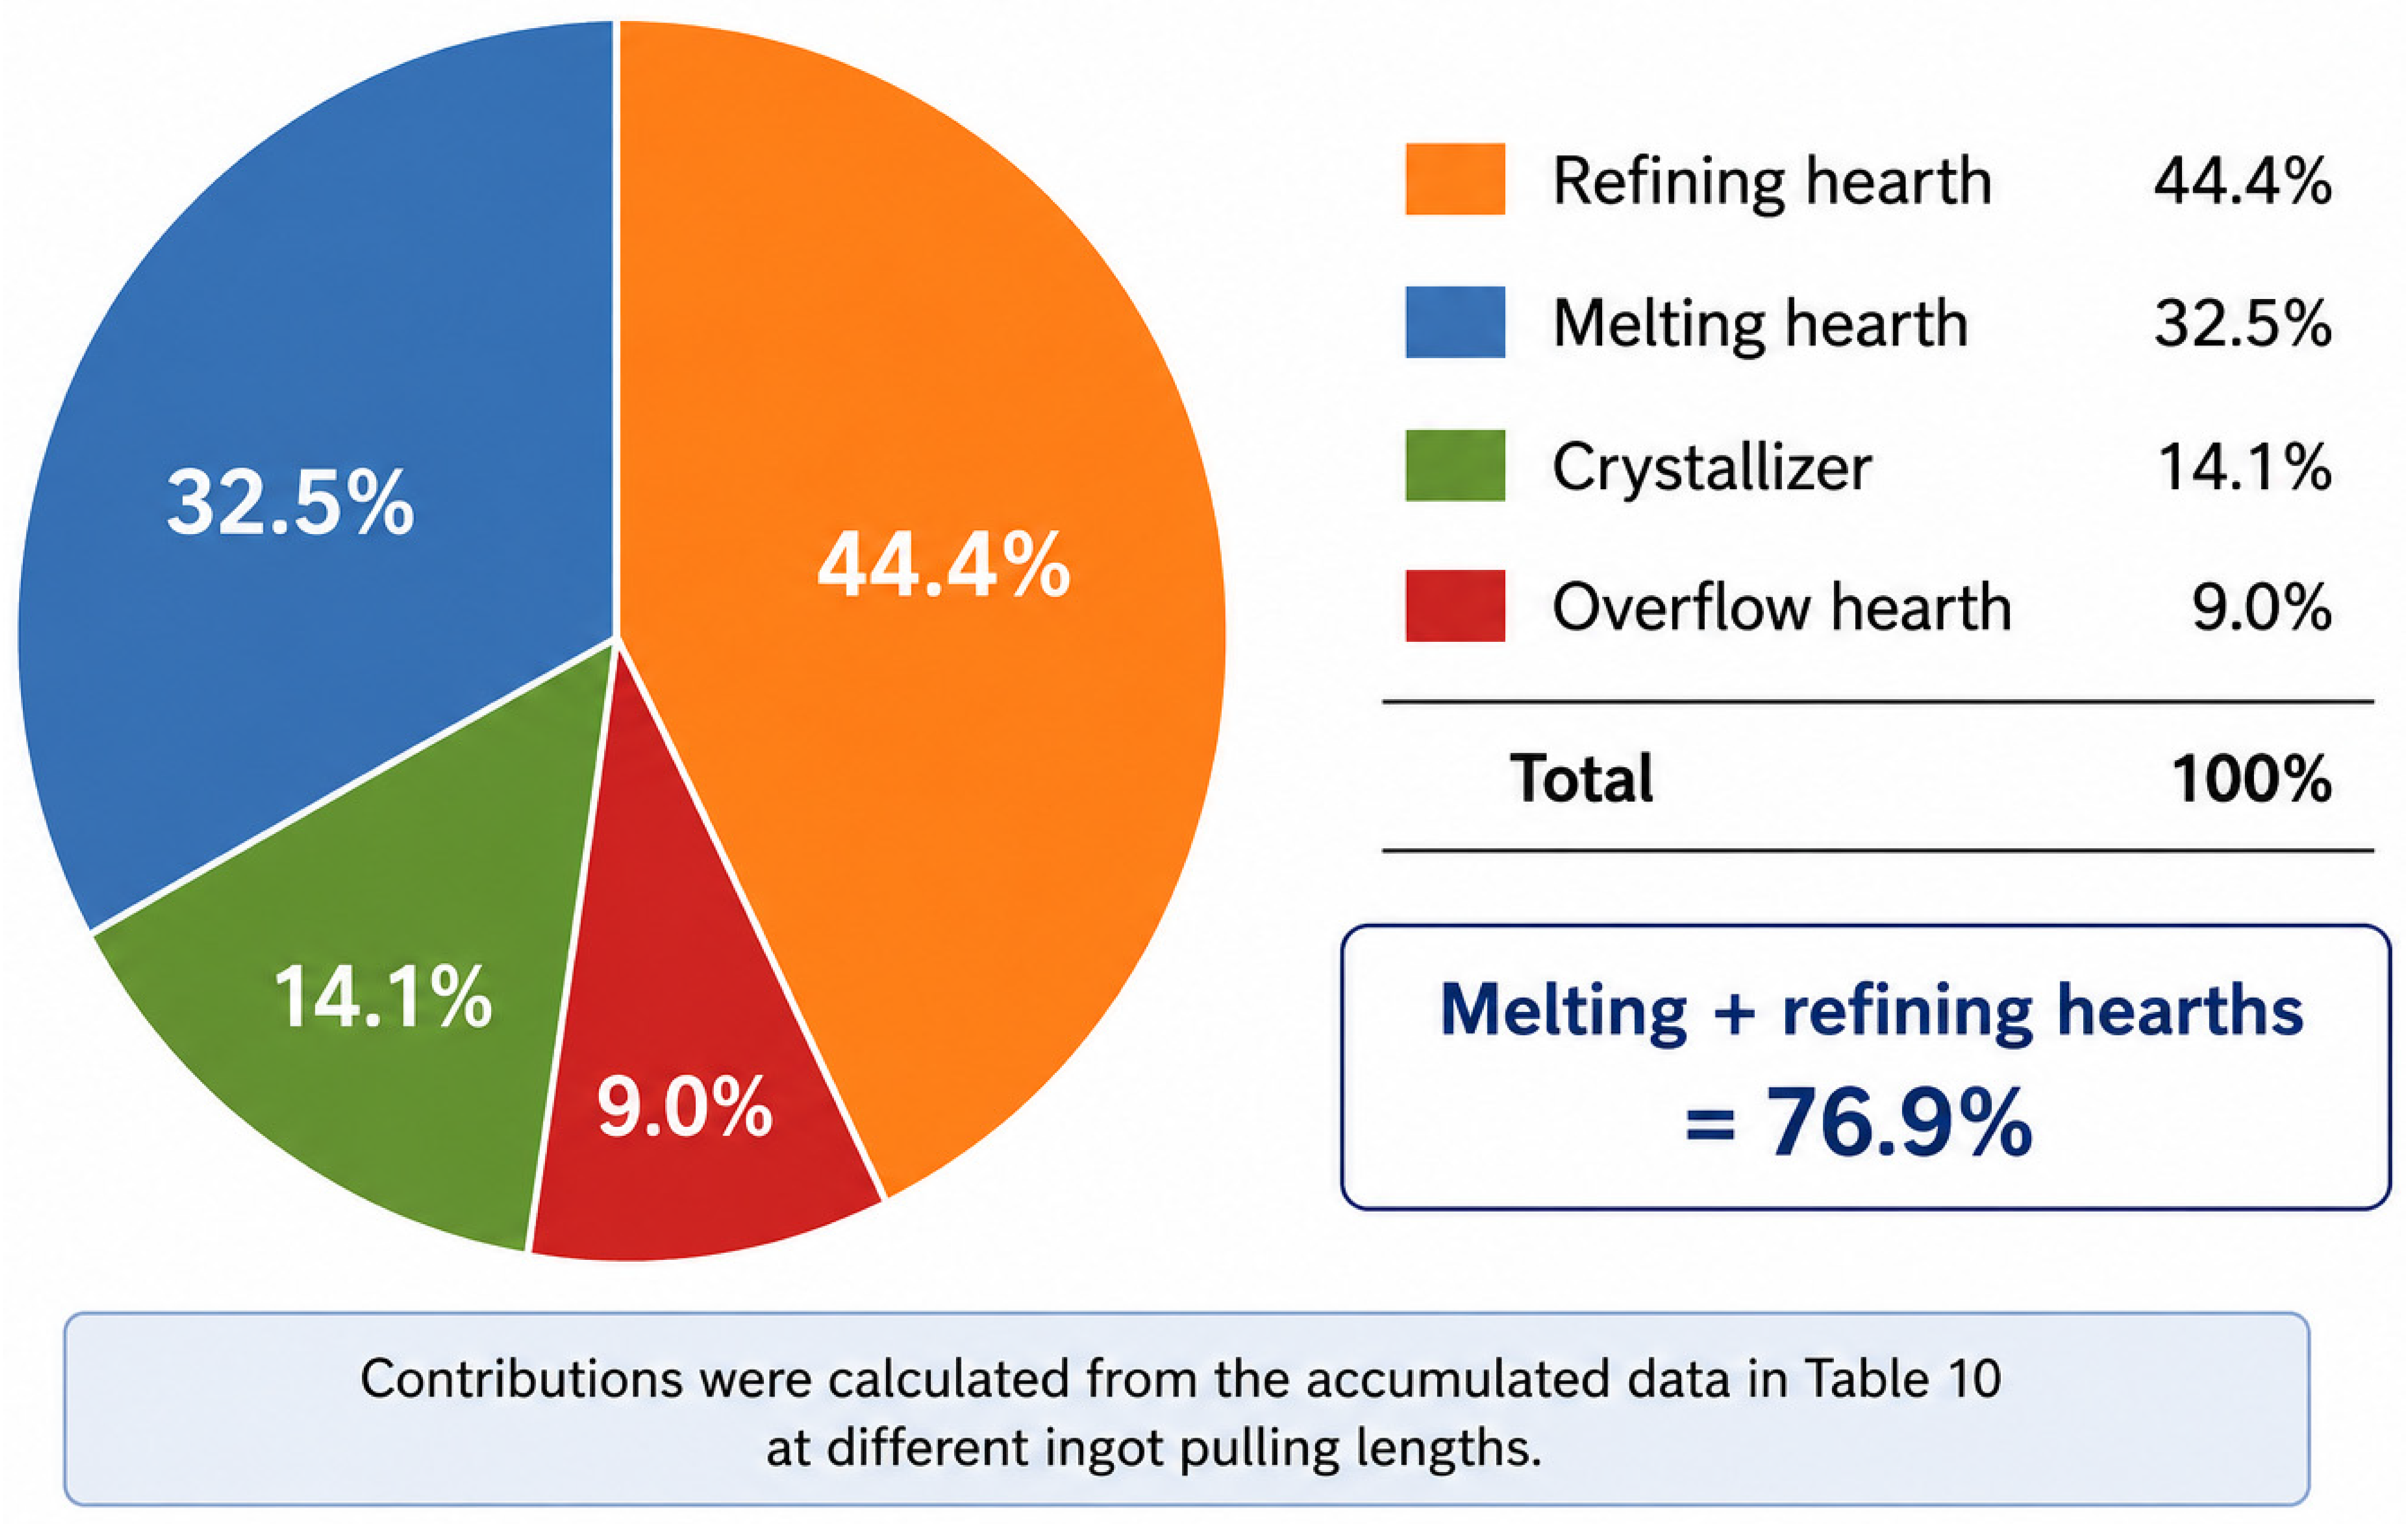
Based on the stage-summed values in Table 10, the model attributes approximately 44.4% of the predicted Al volatilization to the refining hearth, 32.5% to the melting hearth, 14.1% to the crystallizer, and 9.0% to the overflow hearth. These percentages are outputs of the SPM, not stage-resolved experimental measurements. No in-process composition samples were available from the individual hearths in the present industrial dataset, so only aggregate final composition can be used for validation. The regional percentages should therefore be interpreted as model-based hypotheses for process prioritization, with uncertainty arising from local temperature, area, residence time, hydrodynamics, and the effective activity coefficient.
As shown in Figure 4, the SPM predicts that the melting and refining hearths together account for approximately 76.9% of total Al loss. This result supports prioritizing the two cold-hearth regions for process investigation, but the 76.9% value has not been independently verified by stage-resolved sampling. The extrapolation-bounding test described in Section 4.2 shifts the combined contribution to approximately 82.4%, while preserving the qualitative conclusion that these two regions dominate the modeled loss.
Figure 4.
Predicted contribution of individual EBCHM regions to the total aluminum volatilization obtained using the SPM.
The refining hearth gives the largest cumulative contribution despite its lower temperature compared with the melting hearth. This behavior is attributed to its larger effective evaporation area and sustained molten metal exposure. In contrast, the overflow hearth contributes only about 9.0% because of its relatively small exposed surface and short residence time. The crystallizer still contributes approximately 14.1%, indicating that Al evaporation continues during the final molten stage before complete solidification.
These results demonstrate the principal advantage of the SPM. The stage contribution cannot be inferred from temperature alone; it is determined by the combined influence of temperature, evaporation area, molten metal inventory, activity, and residence time. The SPM therefore provides a quantitative basis for identifying the process regions responsible for the majority of Al loss.
The model was further evaluated using industrial measurements obtained with an initial Al charging fraction of 4.4 wt.%. The predicted and measured Al concentrations are compared in Table 11.
Table 11.
Comparison between SPM-predicted and measured Al concentrations at an initial Al charging fraction of 4.4 wt.%.
The predicted Al concentrations range from 3.934 to 4.029 wt.%, compared with measured values of 3.605–3.805 wt.%. The mean predicted and measured Al concentrations are approximately 3.978 and 3.672 wt.%, respectively, corresponding to a mean absolute deviation of approximately 0.305 wt.%.
For final Al concentration, the SPM relative errors range from 5.88% to 9.12%, with MAPE ≈ 8.33%. The mean predicted-minus-measured concentration bias is +0.305 wt.%, MAE = 0.305 wt.%, and RMSE = 0.307 wt.%. For Al loss, the mean predicted value is approximately 0.422 wt.% versus a measured mean of approximately 0.728 wt.%; the loss bias is −0.305 wt.%, MAE = 0.305 wt.%, and RMSE = 0.307 wt.%. Thus, the SPM systematically underestimates absolute Al volatilization under the investigated conditions.
The directional underprediction is consistent with omitted physical processes. In addition to transient temperature fluctuations and non-uniform electron-beam energy distribution, candidate mechanisms include localized beam hot spots, evaporation from droplets or partially melted feed before the material reaches the modeled hearth sequence, Al-bearing mechanical spatter or droplet ejection, and hydrodynamic residence-time distributions caused by recirculation or stagnant zones. Recent EBCHM and electron-beam vacuum-melting studies similarly emphasize the importance of local heat-source distribution, melt flow, free-surface transport, and pre-pool or interfacial evaporation [25,29,30,31,32,33,34,35]. The present SPM uses representative stage temperatures and a single inventory-based residence time, so these mechanisms are not resolved explicitly.
The SPM is therefore not intended to outperform the GPM in overall composition accuracy. Its value is the stage-resolved physical interpretation, but that interpretation carries greater parameter uncertainty and presently lacks stage-resolved experimental validation. The GPM and SPM should be regarded as complementary: the GPM supports rapid overall composition/batching calculations, whereas the SPM identifies candidate regions and parameters for targeted process optimization and future measurement.
From an engineering perspective, this result indicates that process optimization should preferentially focus on the two cold-hearth regions. Stabilizing electron-beam energy input, avoiding excessive local overheating, controlling exposed molten metal area, and maintaining stable residence time in these regions are expected to have a greater effect on reducing Al loss than equivalent adjustments in the overflow hearth.
Overall, the SPM demonstrates that aluminum volatilization during industrial EBCHM is strongly stage dependent. The GPM and SPM should therefore be regarded as complementary tools: the GPM is more suitable for rapid composition prediction and batching design, whereas the SPM provides stage-resolved physical interpretation and guidance for regional process optimization.
5. Conclusions
Aluminum volatilization during industrial electron beam cold hearth melting of TA18 titanium alloy was investigated using thermodynamic analysis and two engineering prediction approaches, the Global Prediction Model (GPM) and Stage-Dependent Prediction Model (SPM). The experimentally fitted Al coefficient is explicitly interpreted as an effective thermodynamic–kinetic parameter rather than an independently measured thermodynamic activity coefficient. The main conclusions are as follows:
- Al exhibits a substantially stronger volatilization tendency than Ti and V under EBCHM conditions. The saturated vapor pressure of Al increased from approximately 793 Pa at 2023 K to 1882 Pa at 2123 K, an increase of about 137%, confirming the strong temperature sensitivity of Al evaporation. The experimentally calibrated effective Al activity coefficients were approximately 0.0279 at 2023 K and 0.0120 at 2123 K.
- The GPM provides a practical approach for overall Al composition prediction and batching design. For the industrial comparison, the predicted Al concentration ranged from 3.858 to 3.995 wt.%, compared with measured values of 3.64–3.84 wt.%. The MAPE of approximately 4.51% and maximum relative error of 8.473% refer to the unmatched 4.5 wt.% theoretical prediction basis versus the 4.4 wt.% experimental charging basis. A first-order −0.1 wt.% normalization to the 4.4 wt.% charging basis reduced the concentration MAPE to approximately 2.10%; this value is used only as a diagnostic normalization and does not represent a full nonlinear forward recalculation. The theoretical initial Al charging fraction was approximately 4.5 wt.%, close to the 4.4 wt.% adopted in the industrial trial.
- The SPM predicts a strongly non-uniform spatial distribution of Al volatilization. The model attributes approximately 44.4%, 32.5%, 14.1%, and 9.0% of the predicted Al loss to the refining hearth, melting hearth, crystallizer, and overflow hearth, respectively. The SPM therefore attributes approximately 76.9% of the total predicted Al loss to the refining and melting hearths together. These percentages are model-derived stage attributions and have not been independently validated by stage-resolved measurements; they should therefore be interpreted as model-based guidance for identifying candidate priority regions for Al-volatilization control.
- The GPM and SPM provide complementary functions rather than a simple hierarchy of prediction accuracy. The SPM produced prediction errors of 5.88–9.12%, with a MAPE of approximately 8.33%, compared with 4.51% for the original-basis GPM comparison. Thus, the GPM is more suitable for rapid overall composition prediction and batching design, whereas the SPM provides stage-resolved information for optimizing electron-beam energy input, molten-pool exposure, and residence time. Consistent with recent multiphysics and beam-power studies, further improvement should incorporate transient temperature fields, spatial electron-beam power distributions, and molten metal flow/residence-time distributions to reduce the systematic underestimation of Al loss by the SPM.
Author Contributions
Conceptualization, B.L. and J.F.; methodology, P.L., Z.L., X.H., T.P., H.T., Y.L., P.J., J.L. and B.Y.; validation, P.J., J.L. and J.F.; formal analysis, Z.W., Z.L. and X.H.; investigation, P.L., Z.L., X.H., T.P., H.T., Y.L., Z.W., P.J., J.L. and B.Y.; resources, Z.L., X.H., T.P., H.T., Y.L., P.J. and J.L.; data curation, Z.L., X.H., T.P., H.T., Z.W., Y.L., P.J. and J.L.; writing—original draft preparation, B.L.; writing—review and editing, P.L.; supervision, J.F.; project administration, B.L.; funding acquisition, J.F. All authors have read and agreed to the published version of the manuscript.
Funding
This research was funded by the National Natural Science Foundation of China, grant numbers 52074231 and 52274396; Research Fund of the State Key Laboratory of Solidification Processing (NPU) No. 2024-ZD-03.
Data Availability Statement
The data presented in this study are available from the corresponding author upon reasonable request.
Conflicts of Interest
Author Bobo Li, Zhe Wang, Zhenghong Liu, Xiaobo Hao, Teng Pei, Huifa Tao, Yang Li and Peng Jiang were employed by Luoyang Sunrui Titanium Precision Casting Co., Ltd. The remaining authors declare that the research was conducted in the absence of any commercial or financial relationships that could be construed as a potential conflict of interest.
References
- Leyens, C.; Peters, M. (Eds.) Titanium and Titanium Alloys: Fundamentals and Applications; Wiley-VCH: Weinheim, Germany, 2003. [Google Scholar]
- Lütjering, G.; Williams, J.C. Titanium, 2nd ed.; Springer: Berlin/Heidelberg, Germany, 2007. [Google Scholar]
- Banerjee, D.; Williams, J.C. Perspectives on titanium science and technology. Acta Mater. 2013, 61, 844–879. [Google Scholar] [CrossRef] [Scilit]
- Mitchell, A. Melting and refining of superalloys and titanium alloys. ISIJ Int. 1992, 32, 557–562. [Google Scholar] [CrossRef] [Scilit]
- Mitchell, A. The electron beam melting and refining of titanium alloys. Mater. Sci. Eng. A 1999, 263, 217–223. [Google Scholar] [CrossRef] [Scilit]
- Wood, J.R. Producing Ti–6Al–4V plate from single-melt EBCHM ingot. JOM 2002, 54, 56–58. [Google Scholar] [CrossRef] [Scilit]
- Nakamura, H.; Mitchell, A. The effect of beam oscillation rate on Al evaporation from a Ti–6Al–4V alloy in the electron beam melting process. ISIJ Int. 1992, 32, 583–592. [Google Scholar] [CrossRef] [Scilit]
- Isawa, T.; Nakamura, H.; Murakami, K. Aluminum evaporation from titanium alloys in EB hearth melting process. ISIJ Int. 1992, 32, 607–615. [Google Scholar] [CrossRef] [Scilit]
- Watakabe, S.; Suzuki, K.; Nishikawa, K. Control of chemical compositions of Ti–6Al–4V alloy during melting by electron beam furnace. ISIJ Int. 1992, 32, 625–629. [Google Scholar] [CrossRef] [Scilit]
- Fukumoto, S.; Nakao, R.; Fuji, M.; Minamino, S.; Yoshimura, H.; Takeuchi, H. Composition control of refractory and reactive metals in electron beam melting. ISIJ Int. 1992, 32, 664–672. [Google Scholar] [CrossRef] [Scilit]
- Powell, A.; Pal, U.; van den Avyle, J.; Damkroger, B.; Szekely, J. Analysis of multicomponent evaporation in electron beam melting and refining of titanium alloys. Metall. Mater. Trans. B 1997, 28, 1227–1239. [Google Scholar] [CrossRef] [Scilit]
- Bellot, J.-P.; Ablitzer, D.; Hess, E. Aluminum volatilization and inclusion removal in the electron beam cold hearth melting of Ti alloys. Metall. Mater. Trans. B 2000, 31, 845–854. [Google Scholar] [CrossRef] [Scilit]
- Akhonin, S.V.; Trigub, N.P.; Zamkov, V.N.; Semiatin, S.L. Mathematical modeling of aluminum evaporation during electron-beam cold-hearth melting of Ti–6Al–4V ingots. Metall. Mater. Trans. B 2003, 34, 447–454. [Google Scholar] [CrossRef] [Scilit]
- Ivanchenko, V.G.; Ivasishin, O.M.; Semiatin, S.L. Communication: Evaluation of evaporation losses during electron-beam melting of Ti–Al–V alloys. Metall. Mater. Trans. B 2003, 34, 911–915. [Google Scholar] [CrossRef] [Scilit]
- Semiatin, S.L.; Ivanchenko, V.G.; Ivasishin, O.M. Diffusion models for evaporation losses during electron-beam melting of alpha/beta-titanium alloys. Metall. Mater. Trans. B 2004, 35, 235–245. [Google Scholar] [CrossRef] [Scilit]
- Siwiec, G. The kinetics of aluminium evaporation from the Ti–6Al–4V alloy. Arch. Metall. Mater. 2013, 58, 1155–1160. [Google Scholar] [CrossRef] [Scilit][Green Version]
- Knudsen, M. Die maximale Verdampfungsgeschwindigkeit des Quecksilbers. Ann. Phys. 1915, 352, 697–708. [Google Scholar] [CrossRef] [Scilit]
- Langmuir, I. The evaporation, condensation and reflection of molecules and the mechanism of adsorption. Phys. Rev. 1916, 8, 149–176. [Google Scholar] [CrossRef] [Scilit]
- Kostov, A.; Živković, D. Thermodynamic analysis of alloys Ti–Al, Ti–V, Al–V and Ti–Al–V. J. Alloys Compd. 2008, 460, 164–171. [Google Scholar] [CrossRef] [Scilit]
- Lu, X.; Gui, N.; Qiu, A.; Wu, G.; Li, C. Thermodynamic modeling of the Al–Ti–V ternary system. Metall. Mater. Trans. A 2014, 45, 4155–4164. [Google Scholar] [CrossRef] [Scilit]
- Truong, V.-D.; Hyun, Y.-T.; Won, J.W.; Lee, W.; Yoon, J. Numerical simulation of the effects of scanning strategies on the aluminum evaporation of titanium alloy in the electron beam cold hearth melting process. Materials 2022, 15, 820. [Google Scholar] [CrossRef] [Scilit] [PubMed]
- Gao, L.; Huang, H.; Zhang, Y.; Zhang, H.; Shi, Z.; Jiang, Y.; Zhou, R. Numerical modeling of EBCHM for large-scale TC4 alloy round ingots. JOM 2018, 70, 2934–2942. [Google Scholar] [CrossRef] [Scilit]
- Gao, L.; Huang, H.; Kratzsch, C.; Zhang, H.; Chattopadhyay, K.; Jiang, Y.; Zhou, R. Numerical study of aluminum segregation during electron beam cold hearth melting for large-scale Ti–6 wt.%Al–4 wt.%V alloy slab ingots. Int. J. Heat Mass Transf. 2020, 147, 118976. [Google Scholar] [CrossRef] [Scilit]
- Wang, Y.; Xin, Y.; Gao, L.; Cao, W.; Ma, C.; Guo, S.; Chen, G. The analysis of the compositional uniformity of a Ti–Al alloy during electron beam cold hearth melting: A numerical study. Metals 2024, 14, 884. [Google Scholar] [CrossRef] [Scilit]
- Wang, Y.; Gao, L.; Xin, Y.; Guo, S.; Yang, L.; Ji, H.; Chen, G. Numerical modeling of electron beam cold hearth melting for the cold hearth. Minerals 2024, 14, 601. [Google Scholar] [CrossRef] [Scilit]
- Li, K.; Fan, G.; Zheng, W.; Wang, J. Thermodynamic modeling of the Ti–Al–V system over the entire composition and a wide temperature range. Calphad 2024, 85, 102683. [Google Scholar] [CrossRef] [Scilit]
- Cao, W.; Ma, C.; Li, Y.; Gao, L.; Chen, G.; Omran, M. Numerical simulation study on solidification process of titanium slab ingot by electron beam cold hearth melting. Mater. Res. Express 2024, 11, 086514. [Google Scholar] [CrossRef] [Scilit]
- Ma, C.; Cao, W.; Liu, B.; Li, Y.; Gao, L.; Shao, J.; Chen, G. Simulation prediction of CP-Ti slab ingot solidification structure based on the CAFE method. Int. Commun. Heat Mass Transf. 2024, 159, 108155. [Google Scholar] [CrossRef] [Scilit]
- Xin, Y.; Liu, Y.; Gao, L.; Fang, H.; Chai, Z.; Shao, J.; Guo, S.; Yang, L.; Lu, D.; Li, X. The numerical simulation of element segregation control during the electron beam cold hearth melting process of large-sized Ti-6wt%Al-4wt%V titanium alloy slab. J. Mater. Res. Technol. 2025, 36, 8671–8687. [Google Scholar] [CrossRef] [Scilit]
- Lee, W.; Hyun, Y.-T.; Won, J.W.; Lee, H.; Kang, S.-H.; Yoon, J. Numerical simulation using a coupled lattice Boltzmann–cellular automata method to predict the microstructure of Ti–6Al–4V after electron beam cold hearth melting. J. Mater. Res. Technol. 2025, 36, 3796–3806. [Google Scholar] [CrossRef] [Scilit]
- Xin, Y.; Liu, J.; Shi, Y.; Cheng, Z.; Liu, Y.; Gao, L.; Zhang, H.; Ji, H.; Han, T.; Guo, S.; et al. Optimization of process parameters in electron beam cold hearth melting and casting of Ti-6wt%Al-4wt%V via CFD-ML approach. Metals 2025, 15, 897. [Google Scholar] [CrossRef] [Scilit]
- Akhonin, S.V.; Berezos, V.O.; Severyn, A.Y.; Yerokhin, O.H.; Pashynskyi, V.V. Features of smelting of heat-resistant titanium alloy of the Ti–Nb–Al–Mo–Zr alloying system by electron beam melting with a cold hearth. Electrometall. Today 2025, 2, 7–11. [Google Scholar] [CrossRef] [Scilit]
- Yiliti, Y.; Zhou, Y.; Han, W.; Dong, G.; Wang, Y. Thermodynamic and kinetic insights into impurity removal during electron beam drip melting of titanium scrap: Toward sustainable high-purity recycling. Sep. Purif. Technol. 2025, 377, 134204. [Google Scholar] [CrossRef] [Scilit]
- Berezos, V.O.; Akhonin, S.V.; Yerokhin, O.H.; Lipchanchuk, Y.I.; Ishchuk, Y.T. Power distribution of electron beam heating in the mold during EBCHM ingot-slab melting. Electrometall. Today 2026, 3, 3–10. [Google Scholar] [CrossRef] [Scilit]
- Liu, R.; Li, Y.; Jiang, D.; Bai, Y.; Luo, X.; Sun, Y. Investigation of inclusions in CP-Ti ingots melted by electron beam cold hearth melting and vacuum arc remelting with electrolytic extraction method. Vacuum 2026, 247, 115096. [Google Scholar] [CrossRef] [Scilit]
- ASTM E1447-09(2016); Standard Test Method for Determination of Hydrogen in Titanium and Titanium Alloys by Inert Gas Fusion Thermal Conductivity/Infrared Detection Method. ASTM International: West Conshohocken, PA, USA, 2016. [CrossRef] [Scilit]
- ASTM E1409-13; Standard Test Method for Determination of Oxygen and Nitrogen in Titanium and Titanium Alloys by Inert Gas Fusion. ASTM International: West Conshohocken, PA, USA, 2013. [CrossRef] [Scilit]
- ASTM E2371-13; Standard Test Method for Analysis of Titanium and Titanium Alloys by Direct Current Plasma and Inductively Coupled Plasma Atomic Emission Spectrometry (Performance-Based Test Methodology). ASTM International: West Conshohocken, PA, USA, 2013. [CrossRef] [Scilit]
- ASTM E1941-10(2016); Standard Test Method for Determination of Carbon in Refractory and Reactive Metals and Their Alloys by Combustion Analysis. ASTM International: West Conshohocken, PA, USA, 2016. [CrossRef] [Scilit]

Disclaimer/Publisher’s Note: The statements, opinions and data contained in all publications are solely those of the individual author(s) and contributor(s) and not of MDPI and/or the editor(s). MDPI and/or the editor(s) disclaim responsibility for any injury to people or property resulting from any ideas, methods, instructions or products referred to in the content. |
© 2026 by the authors. Licensee MDPI, Basel, Switzerland. This article is an open access article distributed under the terms and conditions of the Creative Commons Attribution (CC BY) license.