


Abstract
Laser beam welding (LBW) offers low thermal distortion for thin austenitic stainless steel sheets but is sensitive to butt-joint fit-up and edge quality. This study compared machined and sheared joint edges under selected autogenous and ER308L filler-wire LBW conditions. Bead geometry, defects, microstructure, microhardness, tensile properties, and fracture behavior were characterized using conventional microscopy, EBSD-KAM, and three-dimensional digital image correlation (3D-DIC). The machined-edge autogenous condition (LBW-A-M) produced a stable bead with 0.04 mm top underfill and only a small number of internal discontinuities, while its tensile properties remained close to those of the base metal and fracture occurred in the base metal. In contrast, the sheared-edge autogenous condition (LBW-A-S) exhibited 0.24 mm top underfill, 0.18 mm misalignment, multiple pores, and localized strain near the weld, with tensile strength and elongation of 682.31 MPa and 44.04%, respectively. Under the selected filler-wire conditions, no measurable top underfill was observed, although pores remained. Because the autogenous and filler-wire modes used different process parameters and heat inputs, cross-mode differences are condition-specific rather than isolated filler-wire effects. Overall, joint-edge preparation and fit-up control remained important for thin-sheet LBW.
1. Introduction
AISI 304 stainless steel is widely used in chemical plants, food and medical equipment, transportation systems, energy facilities, and shipbuilding and offshore structures due to its good corrosion resistance, formability, weldability, and low-temperature toughness [1,2,3]. In particular, thin 304 stainless steel sheets are well-suited for structural members and storage tank components that require both lightweight and corrosion resistance. In such thin-sheet structures, dimensional accuracy, welding distortion, and the mechanical reliability of the joints are important.
Welding is one of the primary joining processes used in the fabrication of 304 stainless steel sheet structures. However, conventional arc welding involves a relatively high heat input, which can produce a wide heat-affected zone (HAZ) and may cause residual stresses or angular distortion [4,5]. For these reasons, laser beam welding (LBW), which uses a high-energy-density and localized heat source, has been widely applied to the joining of thin stainless steel sheets [6,7]. LBW can produce a narrow fusion zone (FZ) and heat-affected zone, with relatively low heat input, and is suitable for automation and high-speed welding [6,7,8,9].
However, LBW is sensitive to the initial butt-joint fit-up and faying surface condition because the laser beam has a small diameter and the heat source is concentrated in a narrow region. Therefore, even minor differences, such as root gap, edge mismatch, surface oxides, and cut-surface geometry, can affect the melting behavior at the joint interface [6,10]. In thin-sheet butt welding, these differences can lead to underfill, undercut, porosity, lack of fusion, and misalignment [10,11,12]. Recent work on 2.0 mm butt joints has further shown that variable joint gaps can markedly affect weld-seam geometry and that adaptive process control may be required to maintain acceptable weld quality [13]. These defects can affect not only the surface quality but also the effective load-bearing cross-sectional area and local stress concentration.
In industrial settings, mechanical cutting processes such as shearing, blanking, and slitting are widely used for high-productivity sheet preparation and can reduce the need for additional edge-machining operations such as precision milling [14,15]. However, sheared surfaces typically exhibit roll-over, burnished zones, fracture zones, and burrs. In some cases, micro-cracks and localized work-hardened layers may also remain [14,15,16]. These surface features can affect the actual contact condition and lead to localized gap formation during LBW. Furthermore, discontinuities and micro-cracks within the sheared surface can create trapped-air pockets, which may destabilize the keyhole and molten pool flow during LBW [10,17]. From an industrial perspective, the direct use of as-sheared edges can therefore simplify joint preparation by eliminating an additional edge-machining step. However, this process simplification is beneficial only if the resulting edge irregularities do not cause unacceptable deterioration in weld quality and mechanical performance.
One method to reduce the sensitivity to the faying surface condition is to use filler metal. Filler wire helps reduce underfill or root defects by filling small gaps and increasing the volume of the weld pool [11,12,18]. ER308L wire is widely used for welding 304-series stainless steels because of its chemical compatibility [2,3]. However, the use of filler metal does not always lead to improved weld performance. Filler wire feeding can alter molten pool flow, local heat input, solidification behavior, and keyhole stability. If the welding conditions are not appropriate, pores or non-uniform solidification structures may form, which can result in reduced mechanical properties [17,18].
Previous studies have primarily investigated the effects of laser power, welding speed, focal position, shielding gas, heat input, and wire feed conditions on the morphology, microstructure, and mechanical properties of laser-welded stainless steel joints [6,7,8,9,10,11,12,17]. The effects of intentionally imposed joint gaps and fit-up variations on weld-seam geometry and process stability have also been investigated [13]. In parallel, the effects of edge quality produced by shearing or blanking have mainly been studied in relation to formability, fatigue behavior, and edge cracking [14,15,16]. Recent work on laser-welded AISI 304 has examined 2.0 mm sheets under autogenous, root-gap, and filler-metal conditions [19], while another study linked weld microstructure to tensile deformation and phase-transformation behavior [20]. In contrast to studies focused primarily on imposed joint gaps or individual welding parameters, the present study compares complete edge states produced by two practical preparation routes—milling and mechanical shearing. The machined and sheared edges were compared under identical parameters within each welding mode, namely LBW-A-M versus LBW-A-S and LBW-F-M versus LBW-F-S. Thus, the present comparison addresses the combined manufacturing-induced edge characteristics, including local step formation, micro-cracks, burr-related features, deformation, and resulting fit-up irregularities, rather than an intentionally imposed joint gap or an isolated surface-roughness parameter. However, the specific influence of machined versus sheared joint edges under otherwise identical conditions within each welding mode remains insufficiently clarified, particularly within both autogenous and filler-wire welding modes. Furthermore, when filler-wire welding reduces visible underfill but pores remain in the weld cross-section, bead geometry and average tensile properties alone may not adequately explain local deformation and fracture behavior. Recent investigations have demonstrated that digital image correlation can resolve spatially heterogeneous strain in austenitic weld metals [21], and DIC combined with X-ray computed tomography has been used to relate local deformation to weld geometry and porosity in 304L laser welds [22]. Therefore, this study compared machined and sheared joint edges under selected autogenous and ER308L filler-wire LBW conditions for 2.0 mm-thick AISI 304 stainless steel sheets. The primary objective was to evaluate the influence of the manufacturing-induced edge condition by comparing machined and sheared edges within each welding mode. Bead geometry, underfill, internal discontinuities, microstructure, microhardness, and tensile properties were evaluated. EBSD-based kernel average misorientation (KAM) analysis and three-dimensional digital image correlation (3D-DIC) were additionally employed to relate the initial edge condition to local crystallographic misorientation, strain localization, and fracture behavior. The distinct contribution of this study is therefore the combined assessment of weld quality, local deformation, and fracture behavior for practical machined and as-sheared joint-edge conditions, rather than the evaluation of an intentionally imposed joint gap alone.
2. Materials and Experimental Procedures
2.1. Materials and Faying Surface Preparation
In this study, commercially available 2.0 mm-thick AISI 304 stainless steel sheets were used as the base material. For laser beam welding, two sheets with dimensions of 75 mm × 105 mm were prepared and butt welded to produce a welded sheet with an overall size of approximately 150 mm × 105 mm. The weld line was positioned at the center of the sheet, and tensile specimens were subsequently machined so that the weld was located at the center of the gauge section.
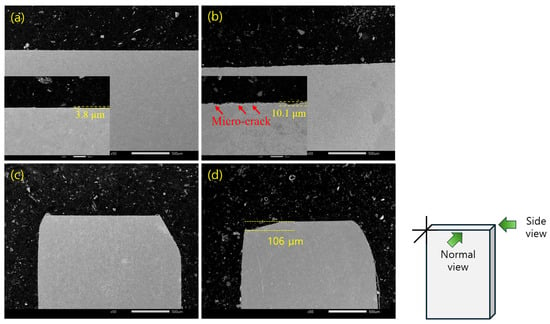
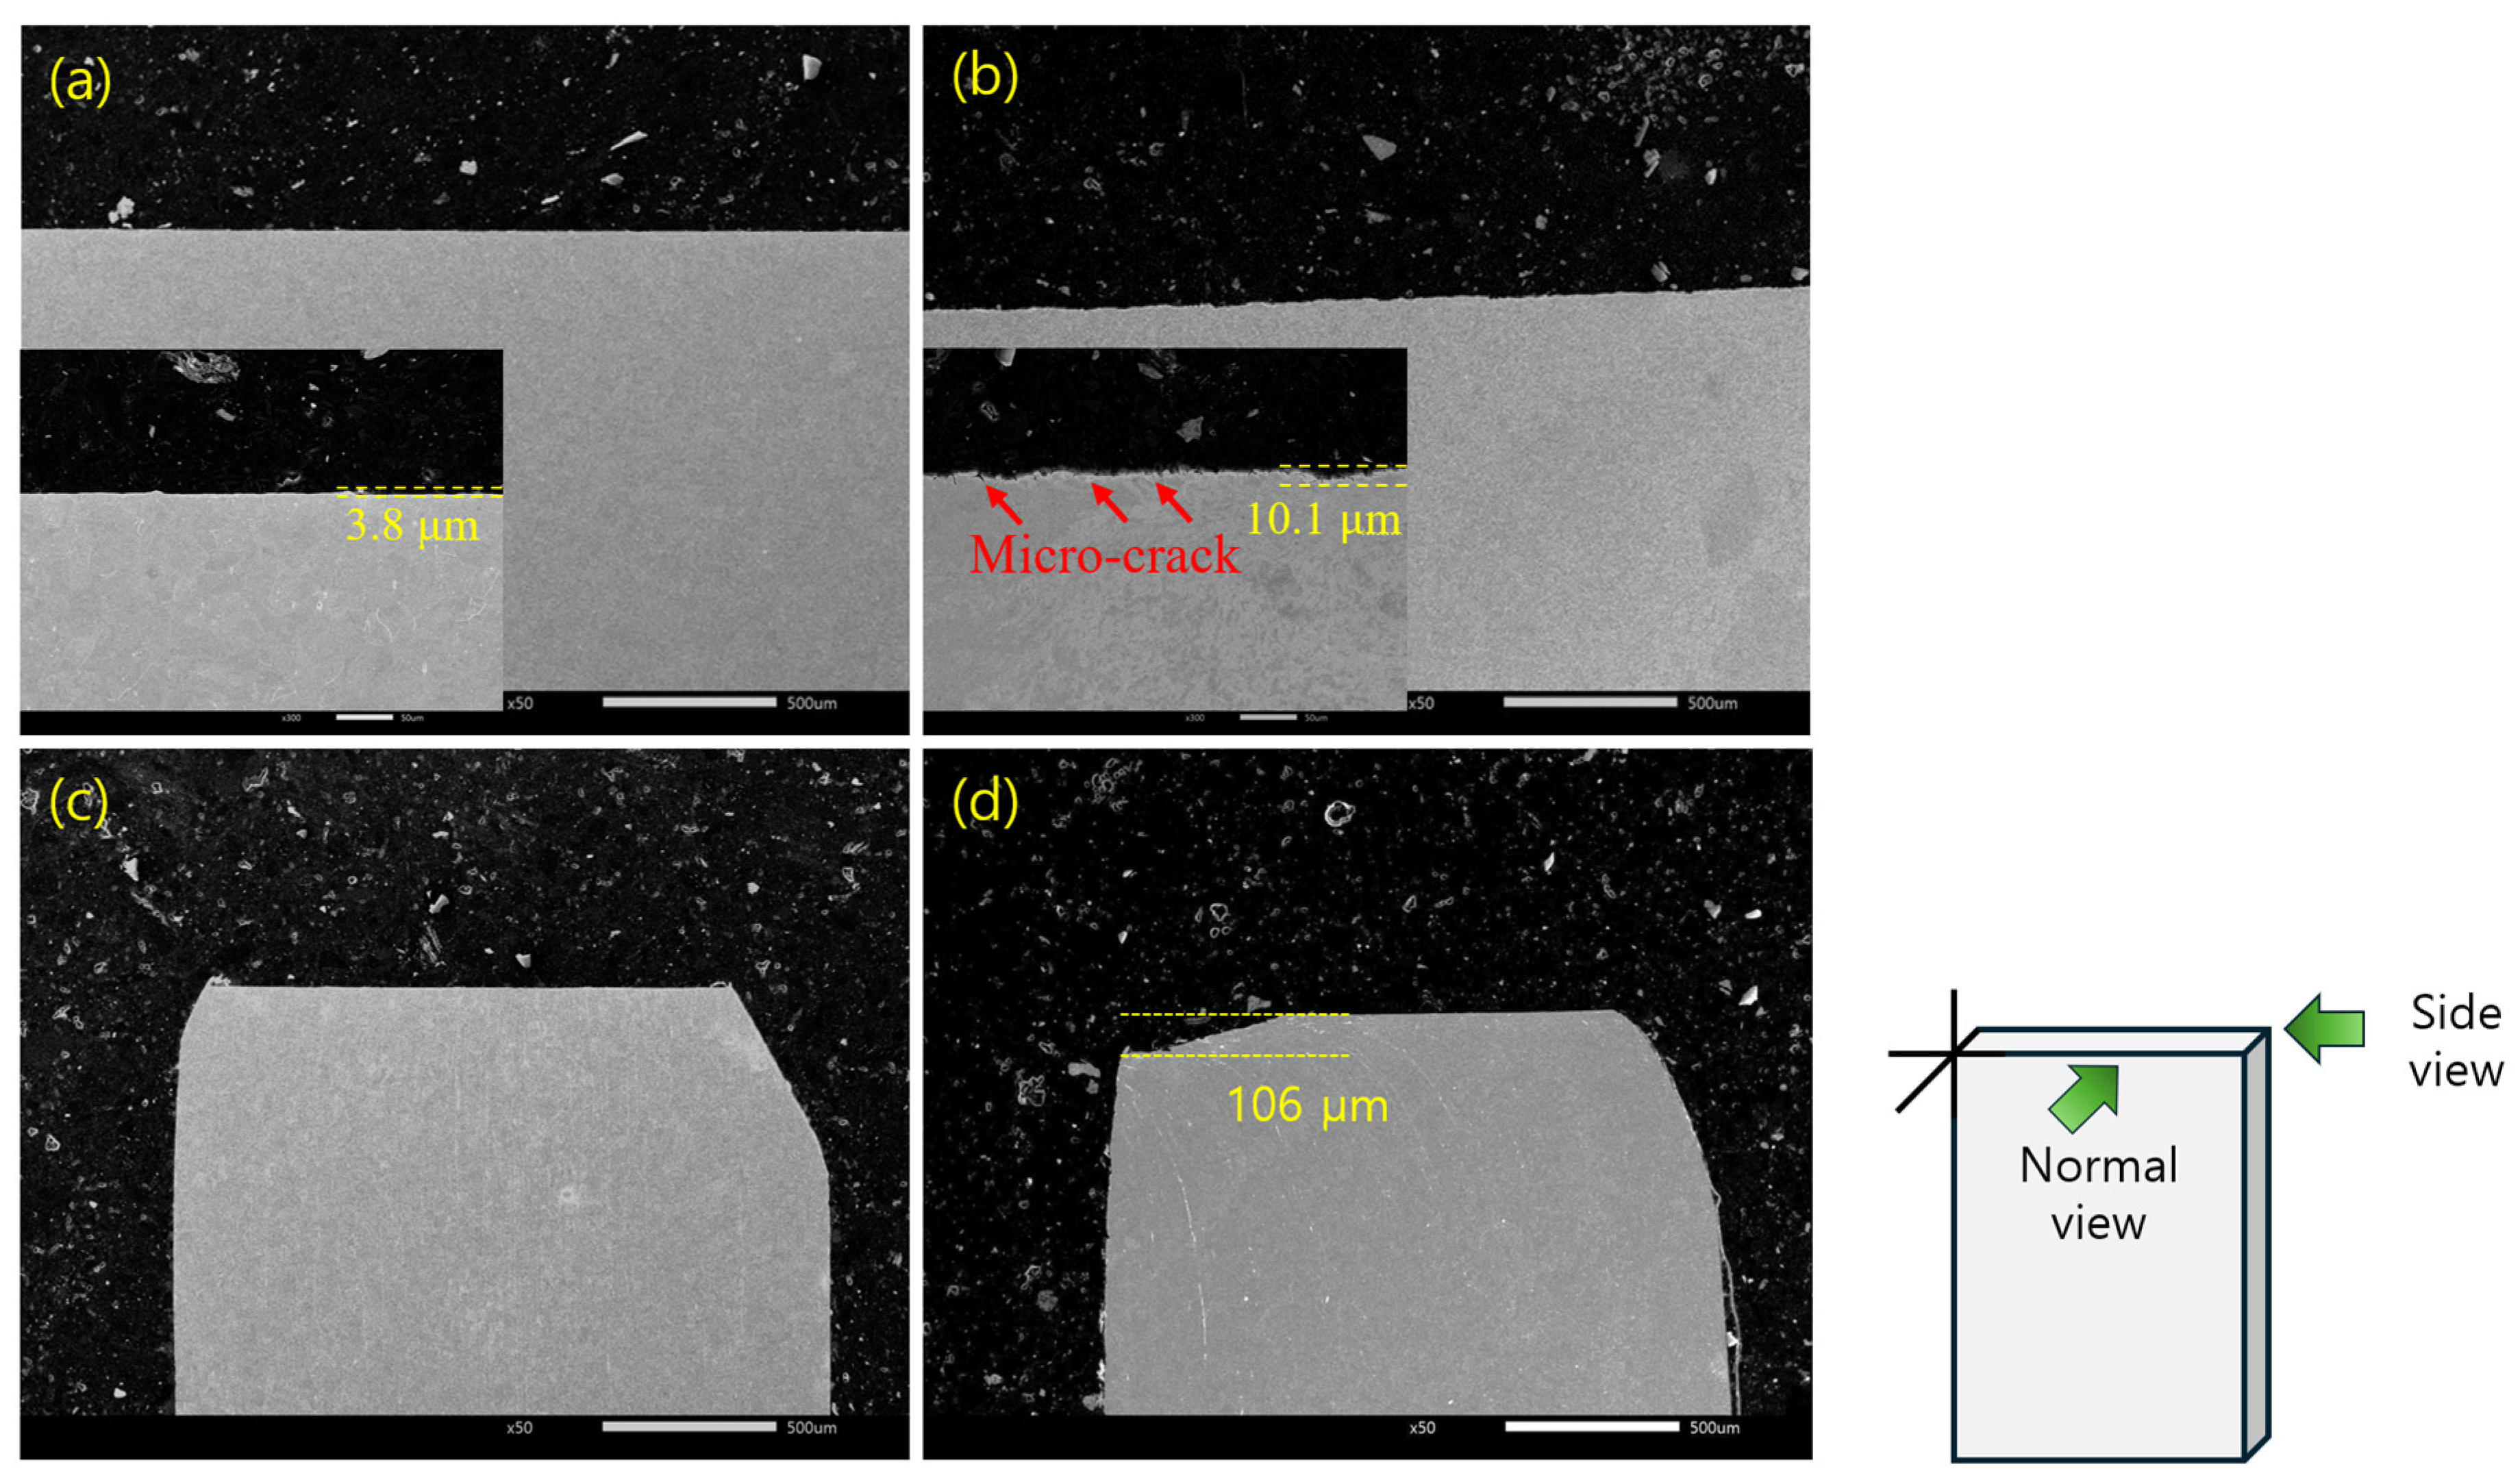
To introduce differences in faying surface quality, two edge preparation conditions were applied. The first condition was a machined surface prepared by precision milling, denoted as machined (M) in this paper. This process produced a relatively flat and continuous faying surface. The second condition was a sheared surface prepared by mechanical shearing, denoted as sheared (S). The sheared surface was used for welding as received, without any additional post-processing. Therefore, the differences between the two conditions include not only surface roughness but also surface steps, micro-cracks, burrs, a shear-deformed layer, and localized fit-up irregularities. Representative normal view and side view of the two faying-surface conditions are shown in Figure 1. For the filler-wire welding condition, ER308L welding wire was used. The chemical compositions of the 304 stainless steel base metal (BM) and ER308L wire are shown in Table 1.
Figure 1.
SEM micrographs of machined and sheared joint edges: (a) normal view of machined edge, (b) normal view of sheared edges, (c) side view of machined edge and (d) side view of sheared edge. The sheared edge showed a more irregular profile, localized micro-cracks, and a larger surface step than the machined edge.
Table 1.
Chemical compositions of the base metal (BM) and ER308L filler wire (wt.%).
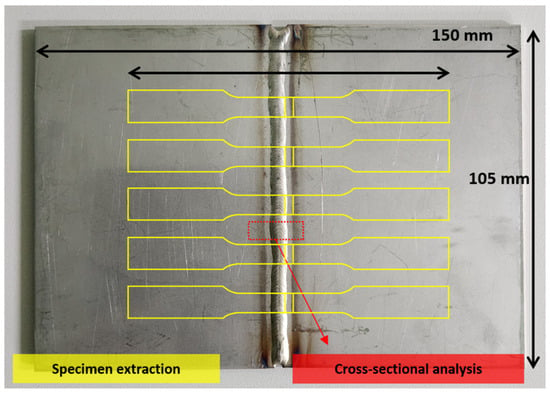
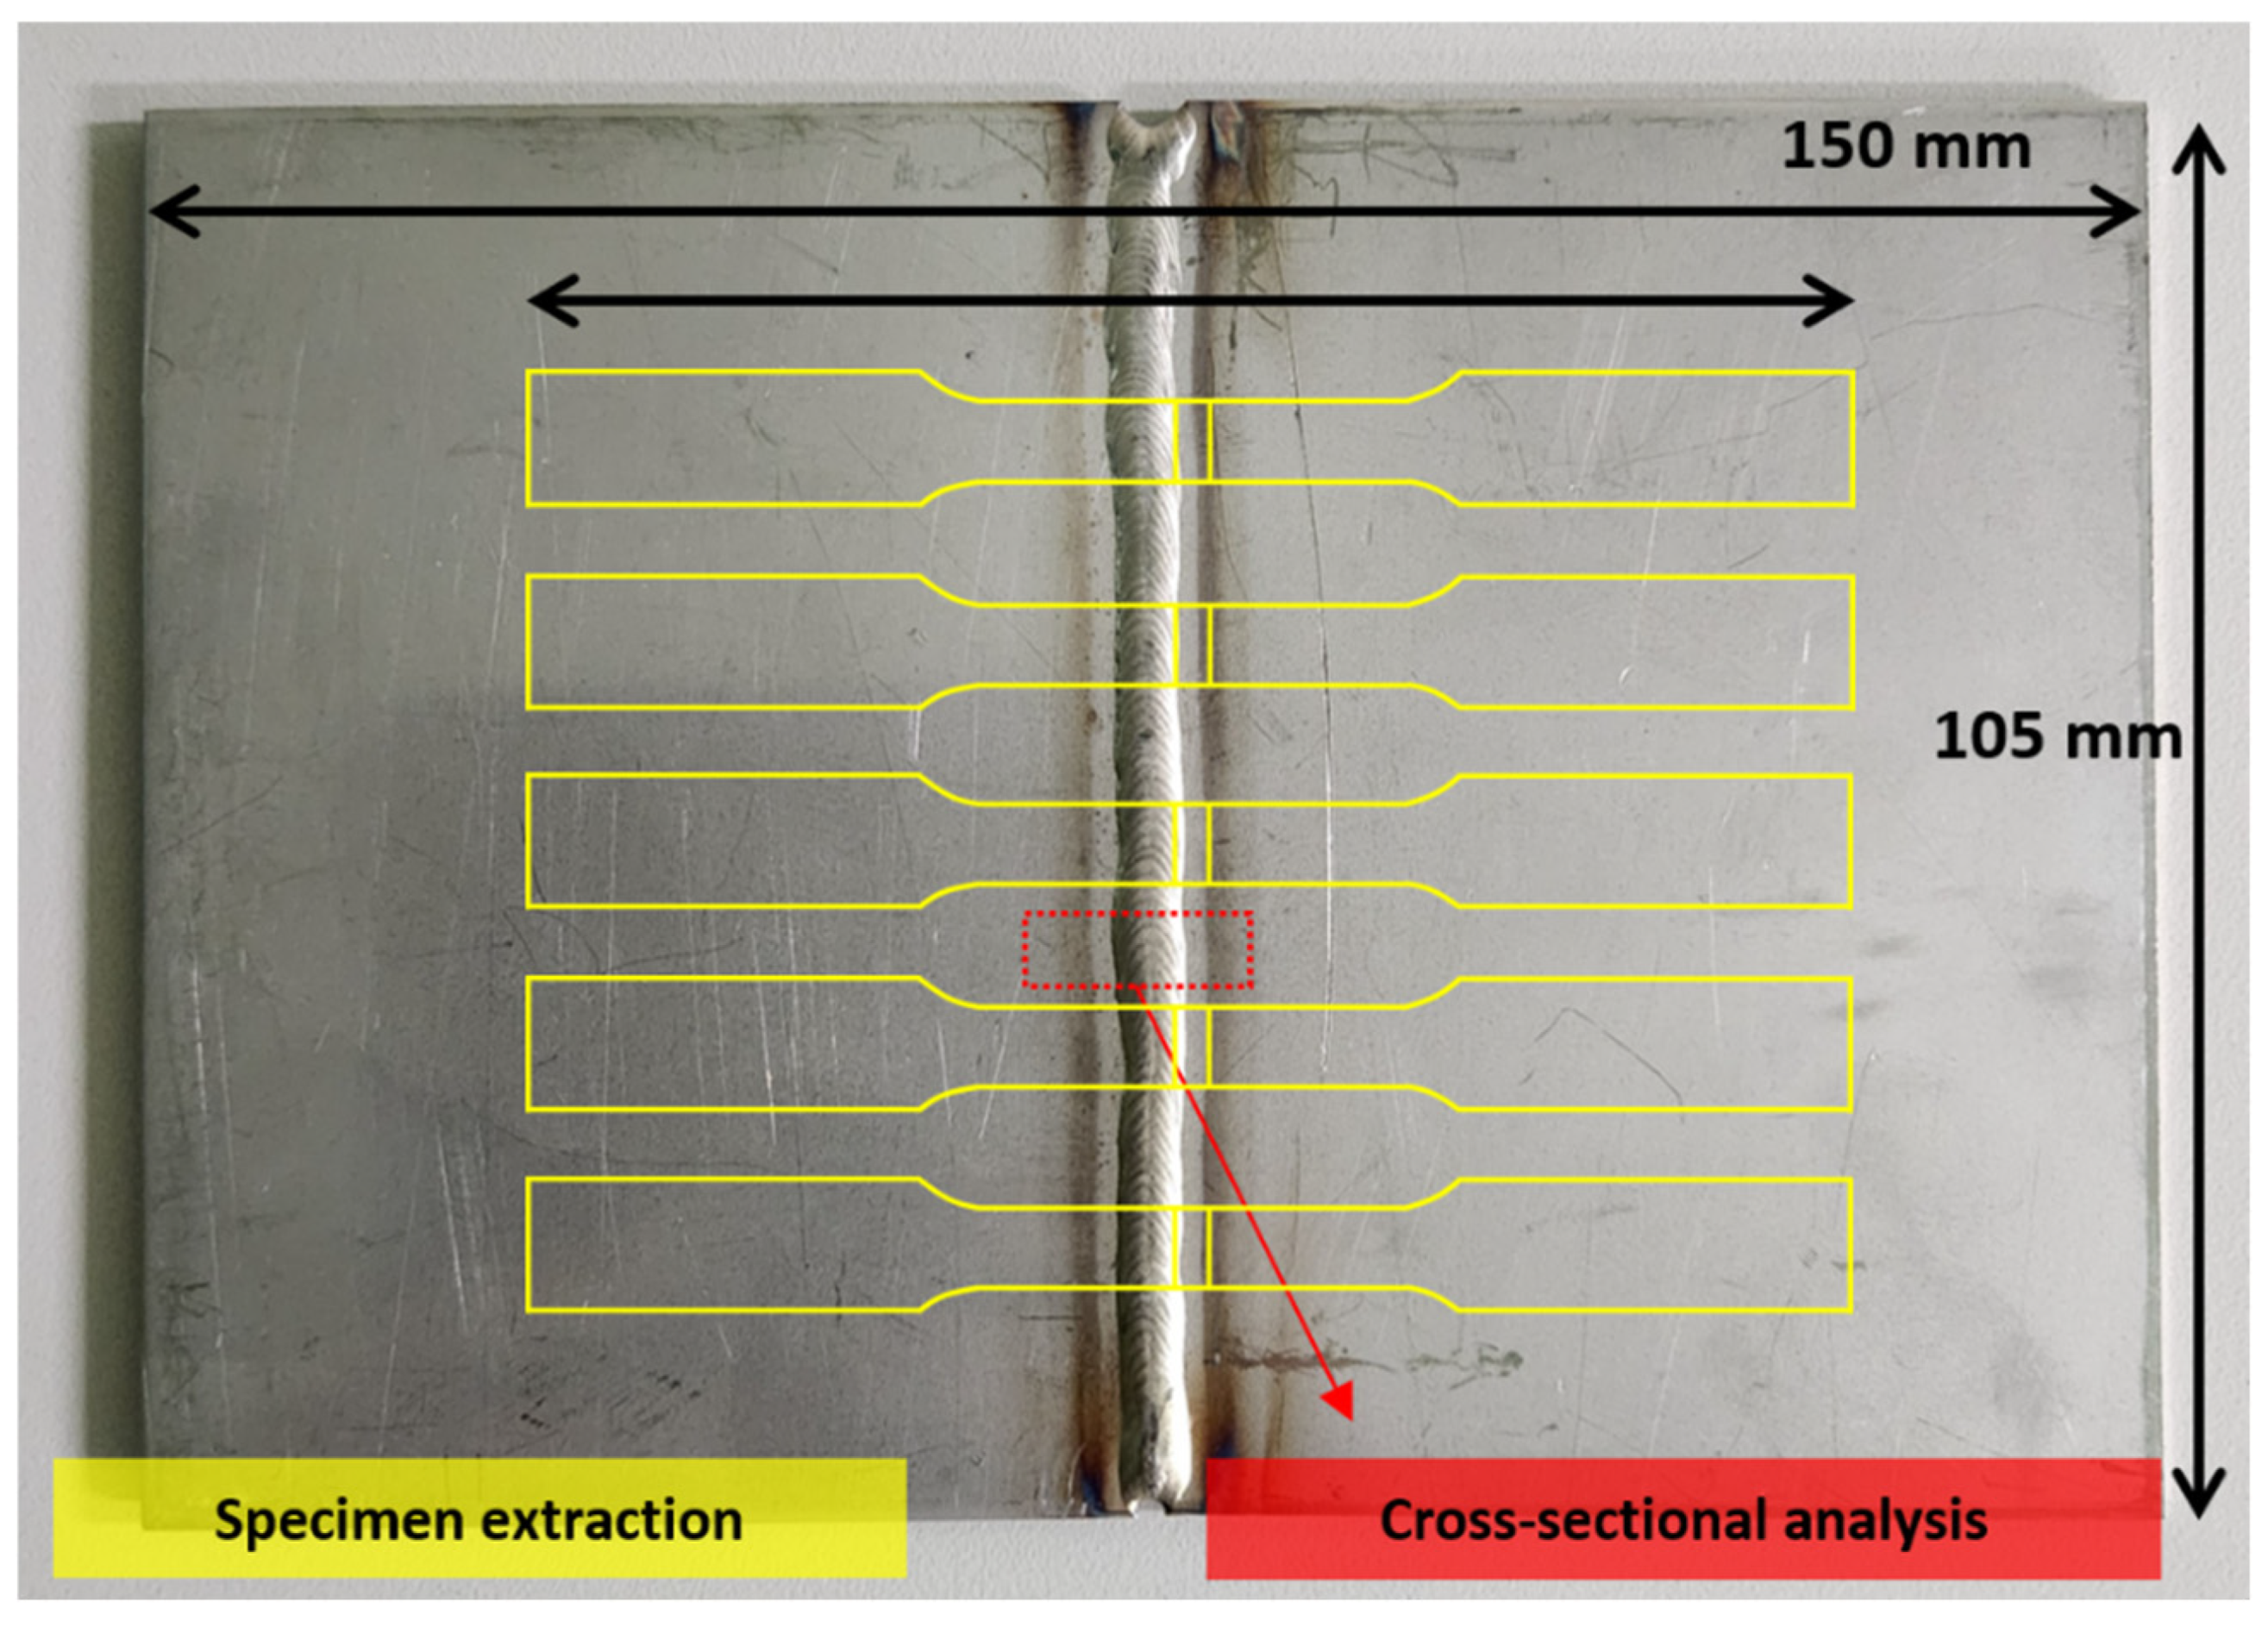
The test specimens for welding were prepared by machining 2.0 mm-thick AISI 304 stainless steel sheets into 75 mm × 105 mm, which were then joined to form a welded panel measuring 150 mm × 105 mm. The sheets were aligned so that the weld line was positioned at the center of the panel. Because transient thermal conditions can occur near the start and stop points during laser welding, tensile specimens were taken only from the central region along the weld direction, where the heat input was relatively stable. As shown in Figure 2, flat tensile specimens for evaluating tensile properties were first machined from the central region, and specimens for cross-sectional analysis were obtained from the adjacent remaining material. By taking these specimens from nearby locations, the defects and microstructural features observed in the cross-section could be interpreted together with the tensile test results.
Figure 2.
Specimen extraction layout from the laser-welded 304 stainless steel panel. Tensile specimens were machined from the central steady-state weld region, and adjacent sections were used for cross-sectional analysis.
2.2. Laser Welding Procedures
The welding experiments were designed to compare machined and sheared joint edges under selected autogenous and filler-wire welding conditions. The BM was tested in two directions to examine the effect of rolling direction. Specimens parallel to the rolling direction were designated as BM-L, and those perpendicular to the rolling direction were designated as BM-T.
The welded specimens were designated as LBW-A-M, LBW-A-S, LBW-F-M, and LBW-F-S according to the combination of faying surface condition, machined (M) or sheared (S), and welding mode, autogenous welding (A) or filler-wire welding (F). The welding conditions were selected to obtain stable full penetration. The welding parameters and corresponding net heat input for each condition are summarized in Table 2. The net heat input was calculated as ηP/v, where P is the laser power, v is the travel speed, and the heat transfer efficiency η was assumed to be 0.8 [6].
Table 2.
Specimen designations and applied laser welding parameters.
The parameters listed in Table 2 were not selected as a heat-input-matched pair intended to isolate the effect of filler-wire addition. Rather, the parameter set for each welding mode was selected to obtain a stable, fully penetrated weld under the respective process conditions. The welding parameters were established in collaboration with an industrial partner based on practical welding experience. Accordingly, the autogenous and filler-wire conditions in this study should be regarded as two selected, mode-specific welding conditions rather than as a single-variable comparison of filler-wire addition.
The primary comparisons in this study were between the machined and sheared joint edges within each welding mode, namely LBW-A-M versus LBW-A-S and LBW-F-M versus LBW-F-S. Identical laser power and travel speed were applied within each respective pair. Because the autogenous and filler-wire welding modes employed different laser powers, travel speeds, net heat inputs, and wire-feeding conditions, differences between the two modes reflect the combined effects of filler-wire feeding and the associated process and thermal conditions and cannot be attributed to filler-wire addition alone.
2.3. Weld Quality Evaluation and Microstructural Characterization
To investigate the effects of faying surface condition under the selected autogenous and filler-wire welding conditions on weld defects and microstructure, macro- and micro-scale analyses were conducted in stages. First, the initial faying surfaces were examined from surface views. SEM was used to compare the morphologies of the machined and sheared surfaces, and the surface step was also measured.
After welding, cross-sectional specimens were prepared from a location adjacent to the tensile specimen. This location was selected to compare the defects and microstructural features observed in the cross-section with the tensile test results. Internal discontinuities were evaluated qualitatively in the examined two-dimensional cross-sections, and volumetric defect characterization over the entire weld was not performed. Isolated, approximately rounded features fully enclosed within the weld metal were classified as pores based on their cross-sectional morphology. However, boundary-adjacent features could not be conclusively distinguished from local lack of fusion using a single cross-section and were therefore described as boundary-adjacent discontinuities. Serial sectioning and volumetric porosity measurements were not performed.
In the cross-section, bead shape, penetration shape, reinforcement height, underfill, misalignment, and internal discontinuities were examined. The surface and cross-sectional defects of the welds were evaluated with reference to the laser weld quality criteria specified in ISO 13919-1 [23]. In particular, top underfill and misalignment, which showed clear differences among the welding conditions, were used as the main comparison parameters. The quality level of each welding condition was then classified based on the measured values.
Subsequently, the weld metal (WM), HAZ, and regions near the fusion line were observed at higher magnifications. SEM was used to examine the solidification microstructure of the WM and the grain morphology near the fusion boundary. EBSD analysis was performed to evaluate the local misorientation induced by the faying surface condition and welding heat cycle. Specimens were mechanically polished to a 1 μm finish, followed by final polishing with a colloidal silica solution. EBSD data were acquired using a Field-Emission SEM (JSM-7001F, JEOL, Akishima, Japan) equipped with an EBSD detector, under an acceleration voltage of 20 kV and a specimen tilt of 70°. Each scan covered an area of 242 μm × 182 μm with a step size of 0.45 μm. KAM maps were calculated from the EBSD data using the same acquisition, cleaning, and calculation conditions for all specimens. The obtained KAM values were used to compare relative local orientation gradients in the WM and HAZ regions rather than to directly quantify absolute plastic strain [24].
2.4. Vickers Microhardness Measurement
Vickers microhardness measurements were performed to evaluate the effects of edge preparation and the welding heat cycle on the local mechanical properties of the welded joints. The measurements were conducted on polished cross-sectional specimens taken from locations adjacent to the tensile specimens, as described in Section 2.3. A micro-Vickers hardness tester (Dura Scan, EMCO Test, Kuchl, Austria) was used, with a test load of 500 gf and a dwell time of 10 s. Vickers microhardness measurements were conducted from the weld center toward both BM sides, with indentation positions locally adjusted based on the corresponding etched cross-sectional micrographs to ensure that the BM, HAZ, and WM regions were each adequately represented.
2.5. Tensile Testing and 3D-DIC Analysis
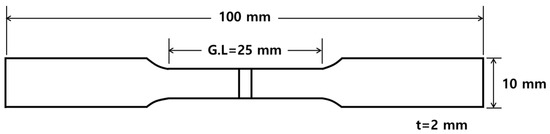
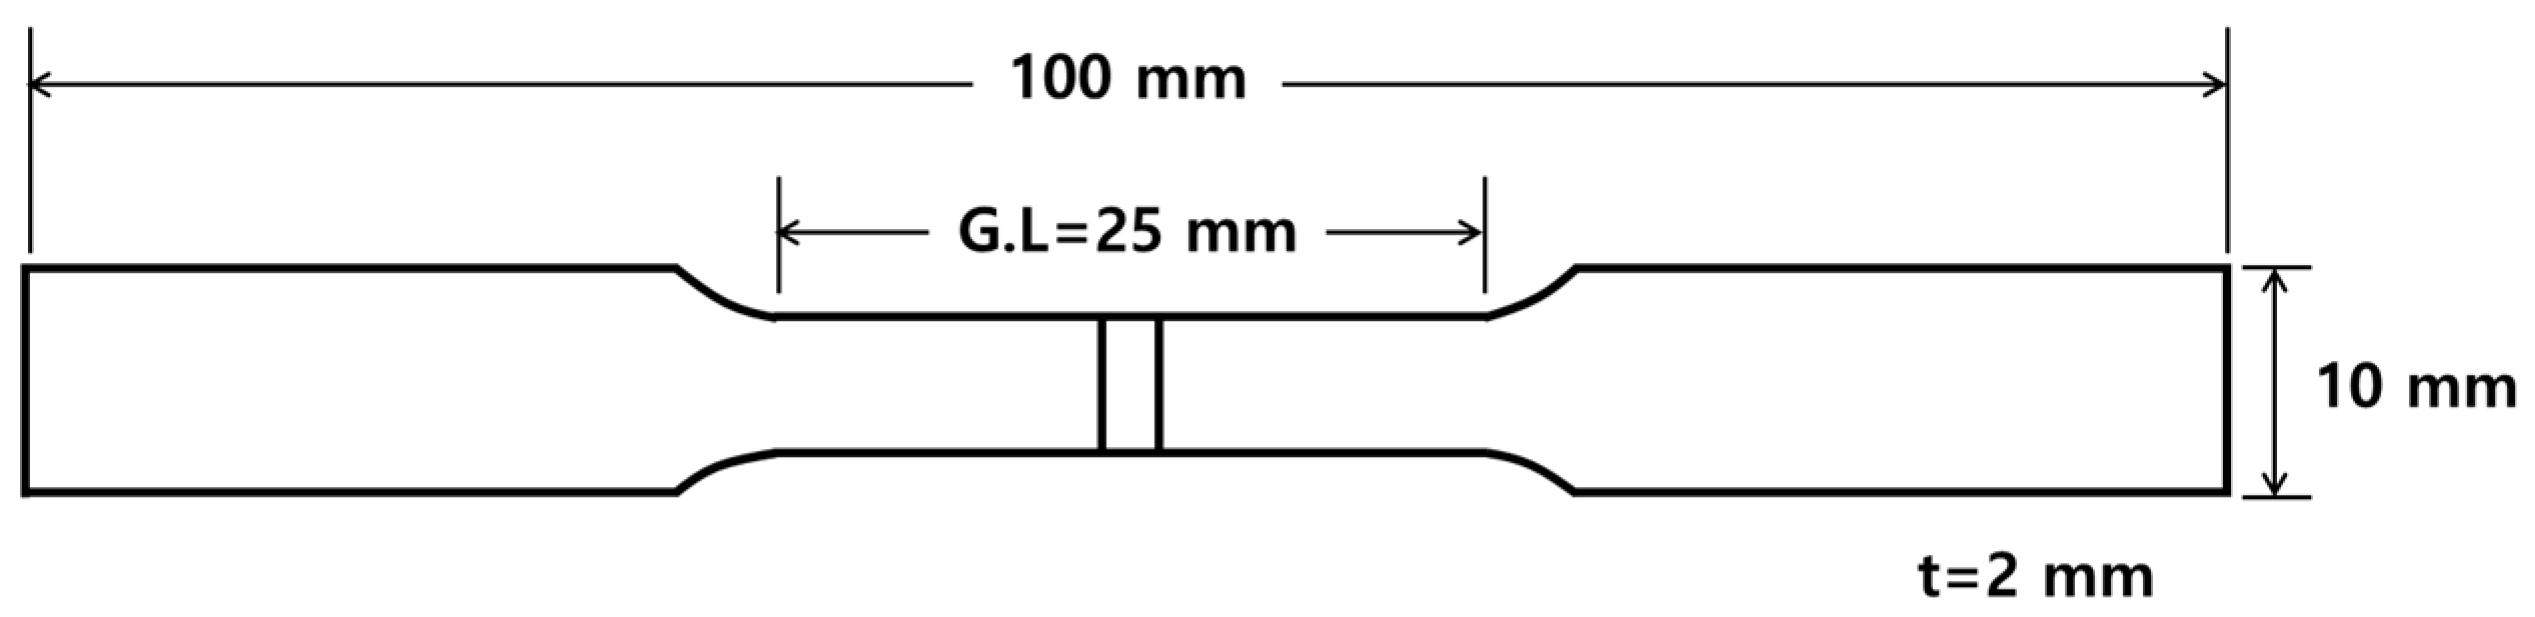
Room-temperature uniaxial tensile tests were conducted to evaluate the mechanical properties of the BM and the welded specimens. The tensile specimens were machined according to the ASTM E8/E8M-25 sub-size geometry [25], with the weld bead positioned at the center of the gauge section (Figure 3). The tests were conducted using an MTS Landmark 100 kN testing machine (MTS, Eden Prairie, MN, USA). The displacement control rate was set to 1.5 mm/min, and the tests were continued until fracture. Three replicate tests were performed for each condition, and the yield strength, ultimate tensile strength, and elongation were calculated.
Figure 3.
Schematic illustration of the tensile specimen, with the weld located at the center of the gauge section.
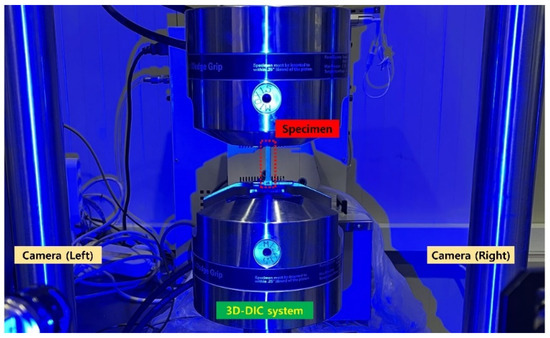
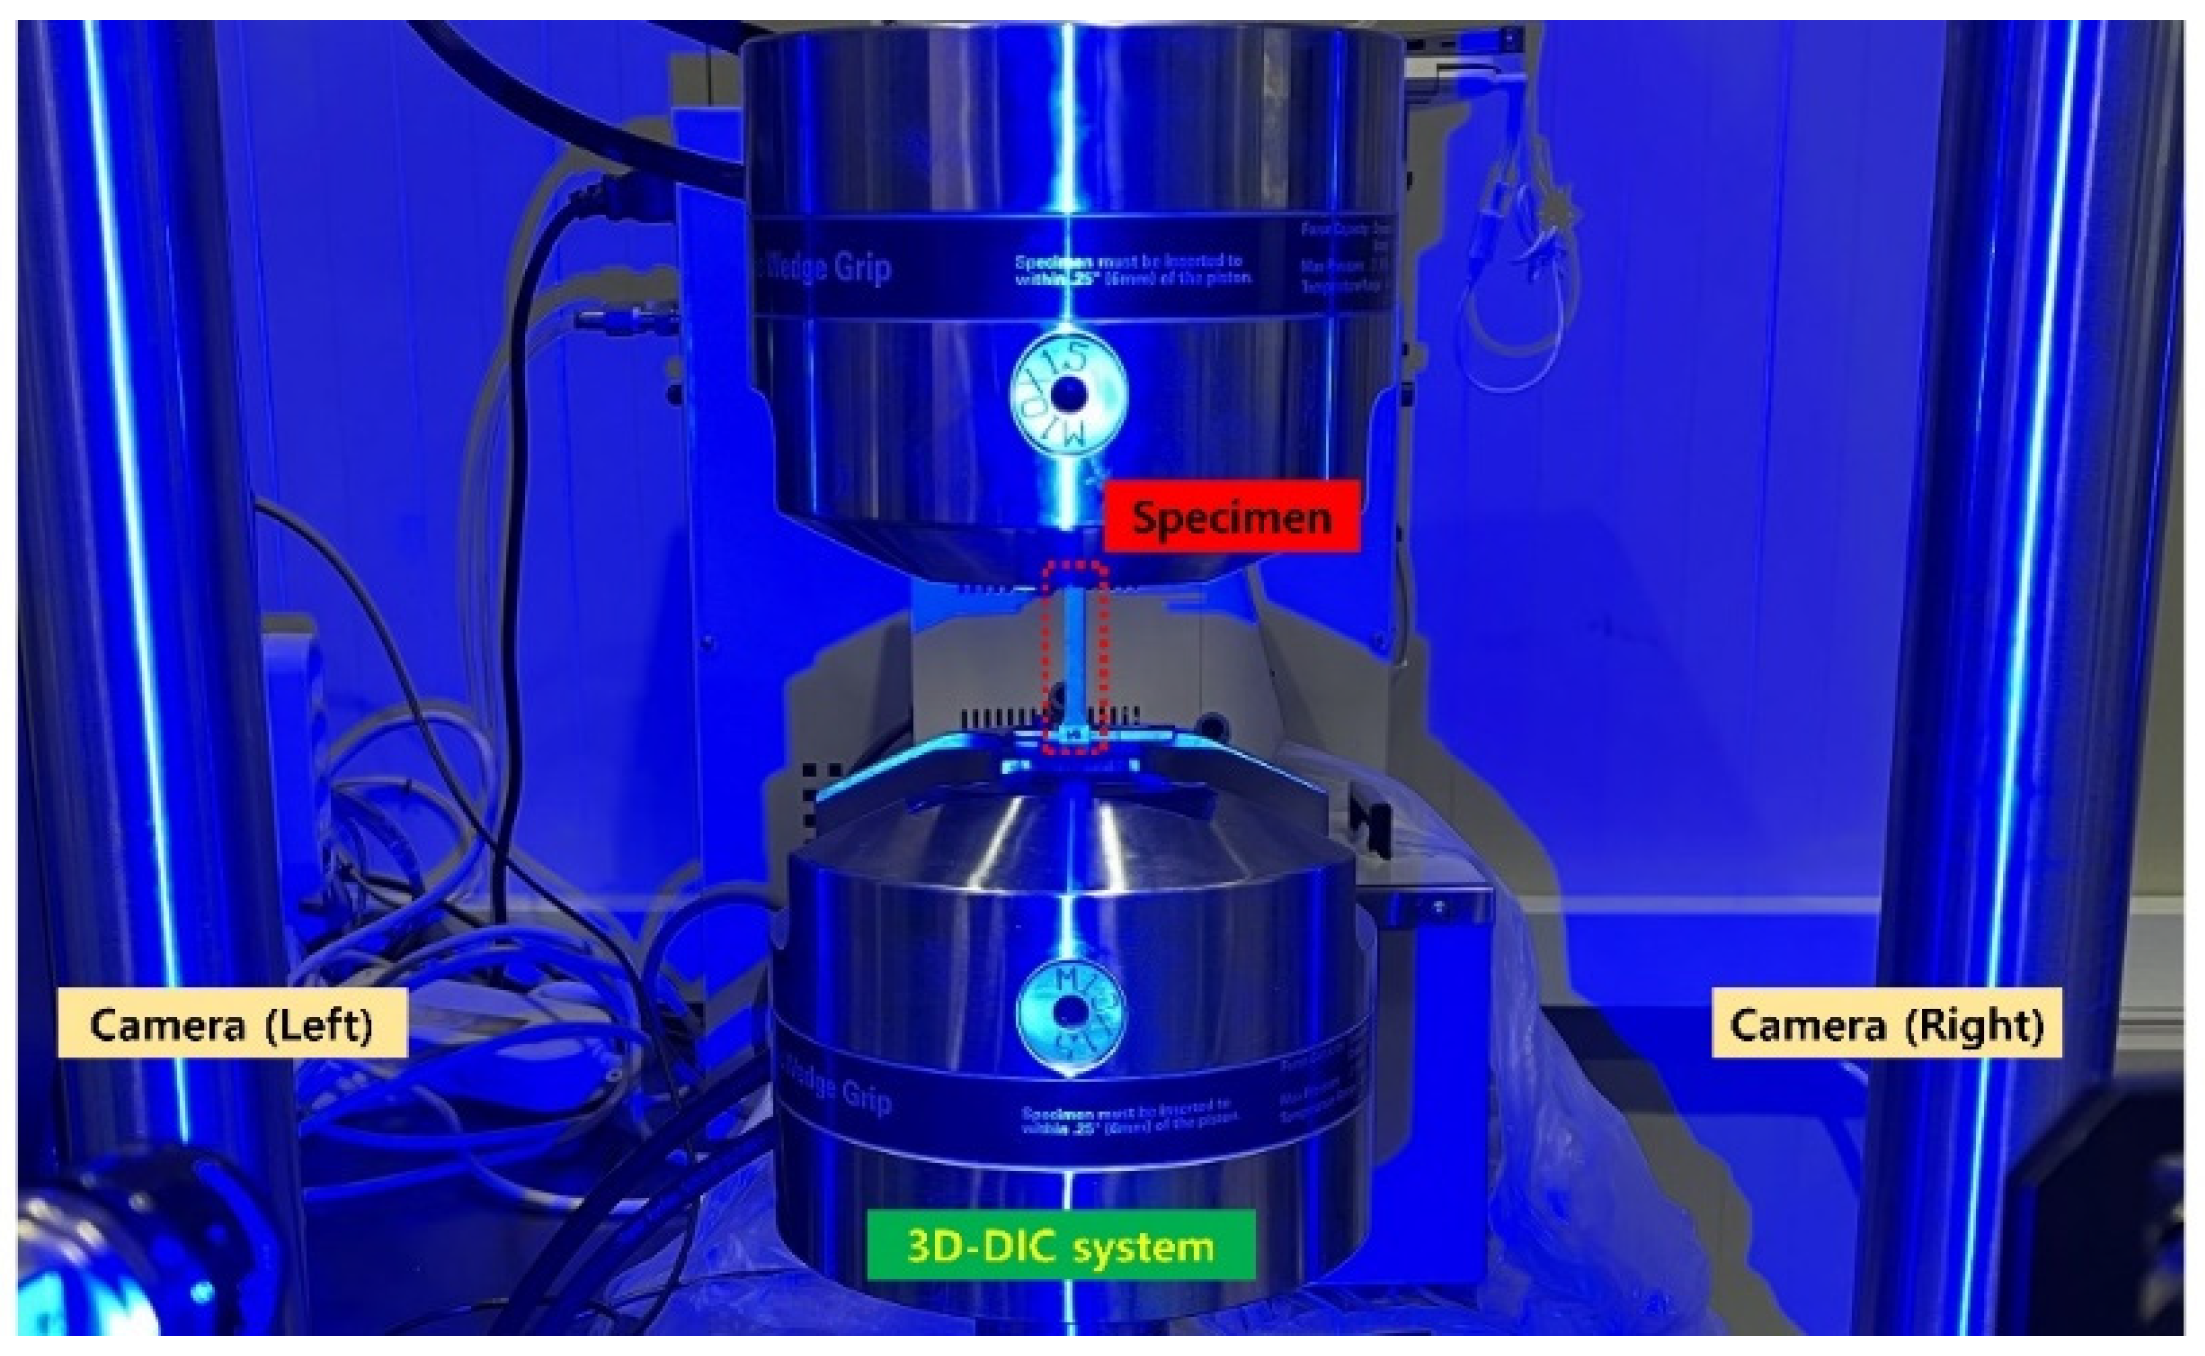
The 3D-DIC was used to examine the full-field strain distribution on the specimen surface during tensile loading [21,22,26,27] (Figure 4). Prior to testing, a thin layer of white paint was applied to the specimen surface, and a random black speckle pattern was created. Prior to tensile testing, the stereo camera system was calibrated using a calibration target according to the stereo-calibration procedure implemented in Vic-3D 9. During the tensile test, images were captured at a rate of 4 frames per second using two cameras with a resolution of 2464 × 2056 pixels. The captured images were analyzed using Vic-3D software (version 9.4.26, Correlated Solutions, Inc., Irmo, SC, USA) with a subset size of 23 × 23 pixels and a step size of 7 pixels. These data were used to track changes in the maximum principal strain distribution with increasing load and to identify the final fracture location. The 3D-DIC analysis was applied to all three tensile-test replicates for each welding condition. The three replicate measurements within each condition showed comparable strain-localization evolution and final fracture behavior. Therefore, one dataset was randomly selected from the three replicates for presentation in the corresponding full-field strain maps, to avoid repetitive presentation of nearly identical data. The selection was not based on the magnitude of the measured strain or fracture location.
Figure 4.
Experimental setup for three-dimensional digital image correlation (3D-DIC) assisted tensile testing. The specimen was installed in the grips, and the camera system was arranged under blue light illumination to measure the full-field strain distribution during loading.
Because the welded tensile specimens were loaded parallel to the rolling direction, BM-L was used as the reference for calculating the retention of yield strength, ultimate tensile strength, and elongation.
3. Results and Discussion
3.1. Faying-Surface Morphology and Edge Step Height
SEM observations of the faying surfaces revealed distinct differences between the machined and sheared surfaces, as shown in Figure 1. The machined surface exhibited a relatively continuous surface profile, with a small surface step of approximately 3.8 μm. Under this condition, a relatively flat butt-joint contact condition could be obtained during welding.
The sheared surface exhibited a rougher and more discontinuous topography than the machined surface. Localized tearing and micro-cracks were observed on the cut surface. The measured step height was approximately 10.1 μm, which was about 2.6 times larger than that of the machined surface. When observed from the side across the entire thickness of the sheet, the sheared surface exhibited a significant variation in edge-to-face height of approximately 106 μm, as shown in Figure 1d. This is the result of the combined effects of rollover, burnishing, and fracture zones characteristic of shearing. Such a surface profile can reduce the actual contact area at the butt joint and cause localized gaps. Furthermore, it can make it difficult for trapped gas to escape during welding, potentially leading to the formation of internal pores.
3.2. Weld Bead Morphology and Weld Quality
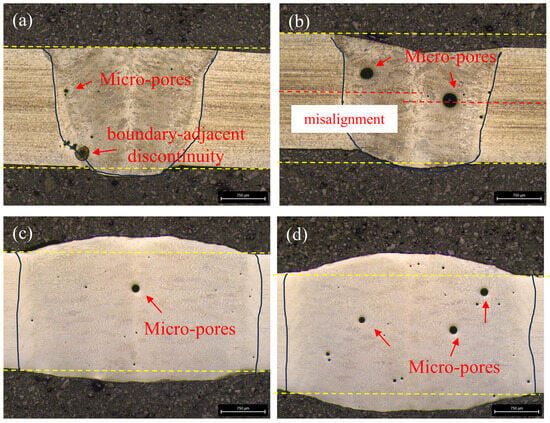
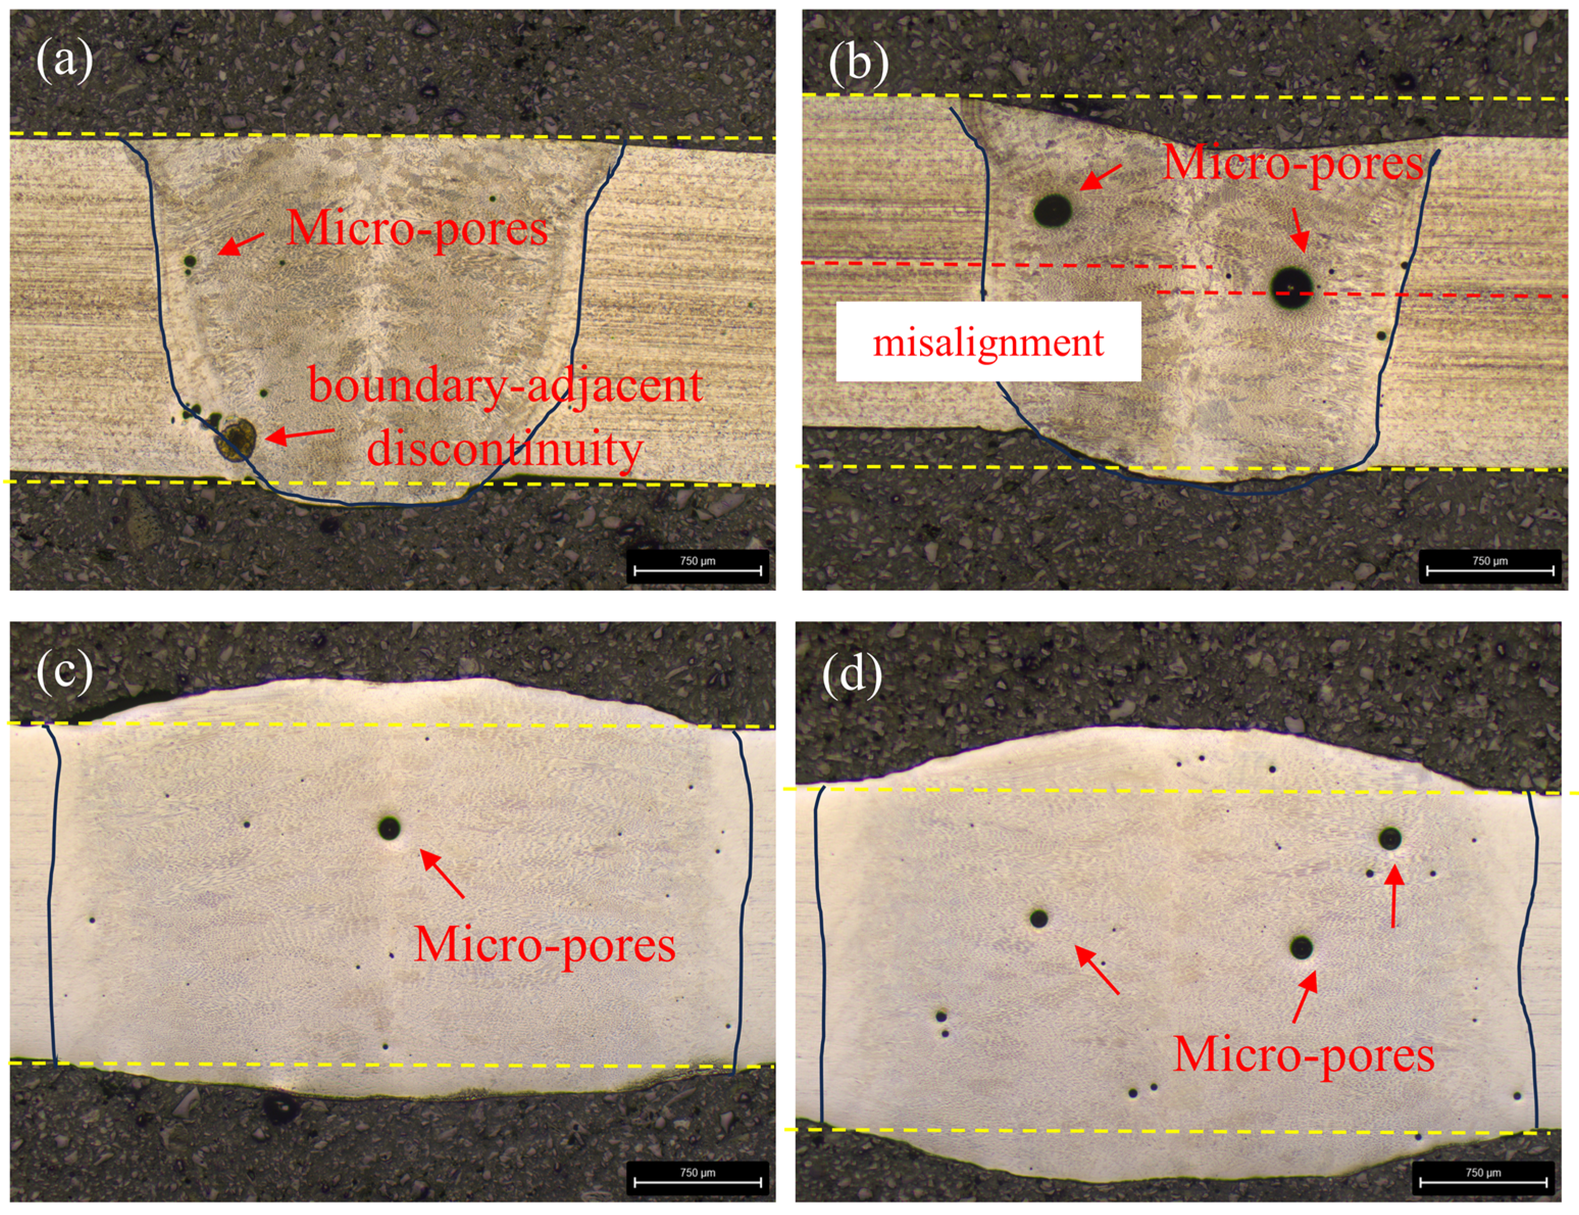
As shown in Figure 5, the cross-sections of the welded joints were examined to compare bead shape and defect characteristics among the selected faying surfaces and welding conditions. Top underfill and linear misalignment were evaluated in accordance with ISO 13919-1, the quality evaluation standard for laser and electron beam welded joints, and the results are summarized in Table 3. Full penetration was achieved under all four conditions; however, the bead shape, underfill, misalignment, and characteristics of the observed internal discontinuities varied depending on the condition.
Figure 5.
Cross-sectional macrographs of 304 stainless steel laser-welded joints fabricated under different faying surface and filler-wire conditions: (a) LBW-A-M, (b) LBW-A-S, (c) LBW-F-M, and (d) LBW-F-S. The yellow dashed lines indicate the original sheet surfaces, while the arrows indicate representative internal discontinuities observed in the examined cross-sections. In Figure 5a, the feature adjacent to the lower fusion boundary is identified as a boundary-adjacent discontinuity because it could not be conclusively distinguished from local lack of fusion based on the two-dimensional cross-section.
Table 3.
Imperfection-specific assessment of top underfill and linear misalignment according to ISO 13919-1:2019.
The LBW-A-M condition (Figure 5a) produced a relatively stable weld bead profile. The top underfill was approximately 0.04 mm, satisfying the quality level B limit of 0.20 mm. Linear misalignment was negligible and remained within the level B limit of 0.22 mm. A small number of internal discontinuities were observed in the examined cross-section. Isolated rounded features fully enclosed within the weld metal were interpreted as pores; however, one discontinuity located adjacent to the lower fusion boundary could not be conclusively distinguished from local lack of fusion based on the present two-dimensional cross-section. Therefore, this feature was described as a boundary-adjacent discontinuity rather than being definitively classified as a pore. Because only individual two-dimensional cross-sections were examined, the observed positions of the discontinuities should not be interpreted as preferential defect locations within the weld volume.
The most pronounced geometric irregularities were observed under the LBW-A-S condition (Figure 5b). The top underfill increased to approximately 0.24 mm, exceeding the level B limit but satisfying the quality level C limit of 0.40 mm. Linear misalignment of approximately 0.18 mm was also measured; however, this value remained within the level B limit of 0.22 mm. In addition, several relatively large pores with apparent diameters of approximately 0.20–0.24 mm, together with multiple smaller pores, were observed in the examined cross-section. These features were likely associated with the irregular cross-sectional geometry and localized gaps of the sheared faying surface, which may have disturbed molten-pool formation and hindered gas escape.
The LBW-F-M condition (Figure 5c) exhibited a uniform external bead profile. Filler-wire condition sufficiently compensated for the joint volume, resulting in no measurable top underfill. Linear misalignment was also negligible, and both geometric imperfections satisfied the corresponding quality level B limits. No significant geometric defect was observed on the root side. Nevertheless, several pores were present in the central region of the examined cross-section. Their formation may have been associated with gas entrapment during wire feeding and molten-pool flow.
Under the LBW-F-S condition (Figure 5d), no measurable top underfill was observed, and linear misalignment was limited to approximately 0.02–0.03 mm. Both values satisfied the corresponding quality level B limits. Compared with LBW-A-S, LBW-F-S exhibited substantially smaller geometric irregularities. However, multiple pores, including several relatively large pores, remained in the examined cross-section. Thus, the selected LBW-F-S process condition improved the external bead geometry but did not eliminate the pores observed in the weld cross-section.
In summary, under the machined faying surface conditions, both the autogenous and filler-wire welding conditions showed stable bead shapes with limited internal defects. In contrast, under the sheared surface conditions, top underfill, misalignment, and internal pores increased. In particular, the LBW-A-S condition showed both geometric defects and internal pores, whereas the LBW-F-S condition showed reduced top underfill but residual internal pores. These cross-sectional observations suggest that the initial joint-edge quality influenced both bead geometry and susceptibility to pore formation in laser beam welding of thin AISI 304 stainless steel sheets.
3.3. Local Misorientation Evaluated by EBSD-KAM
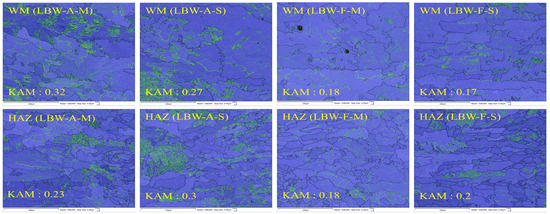
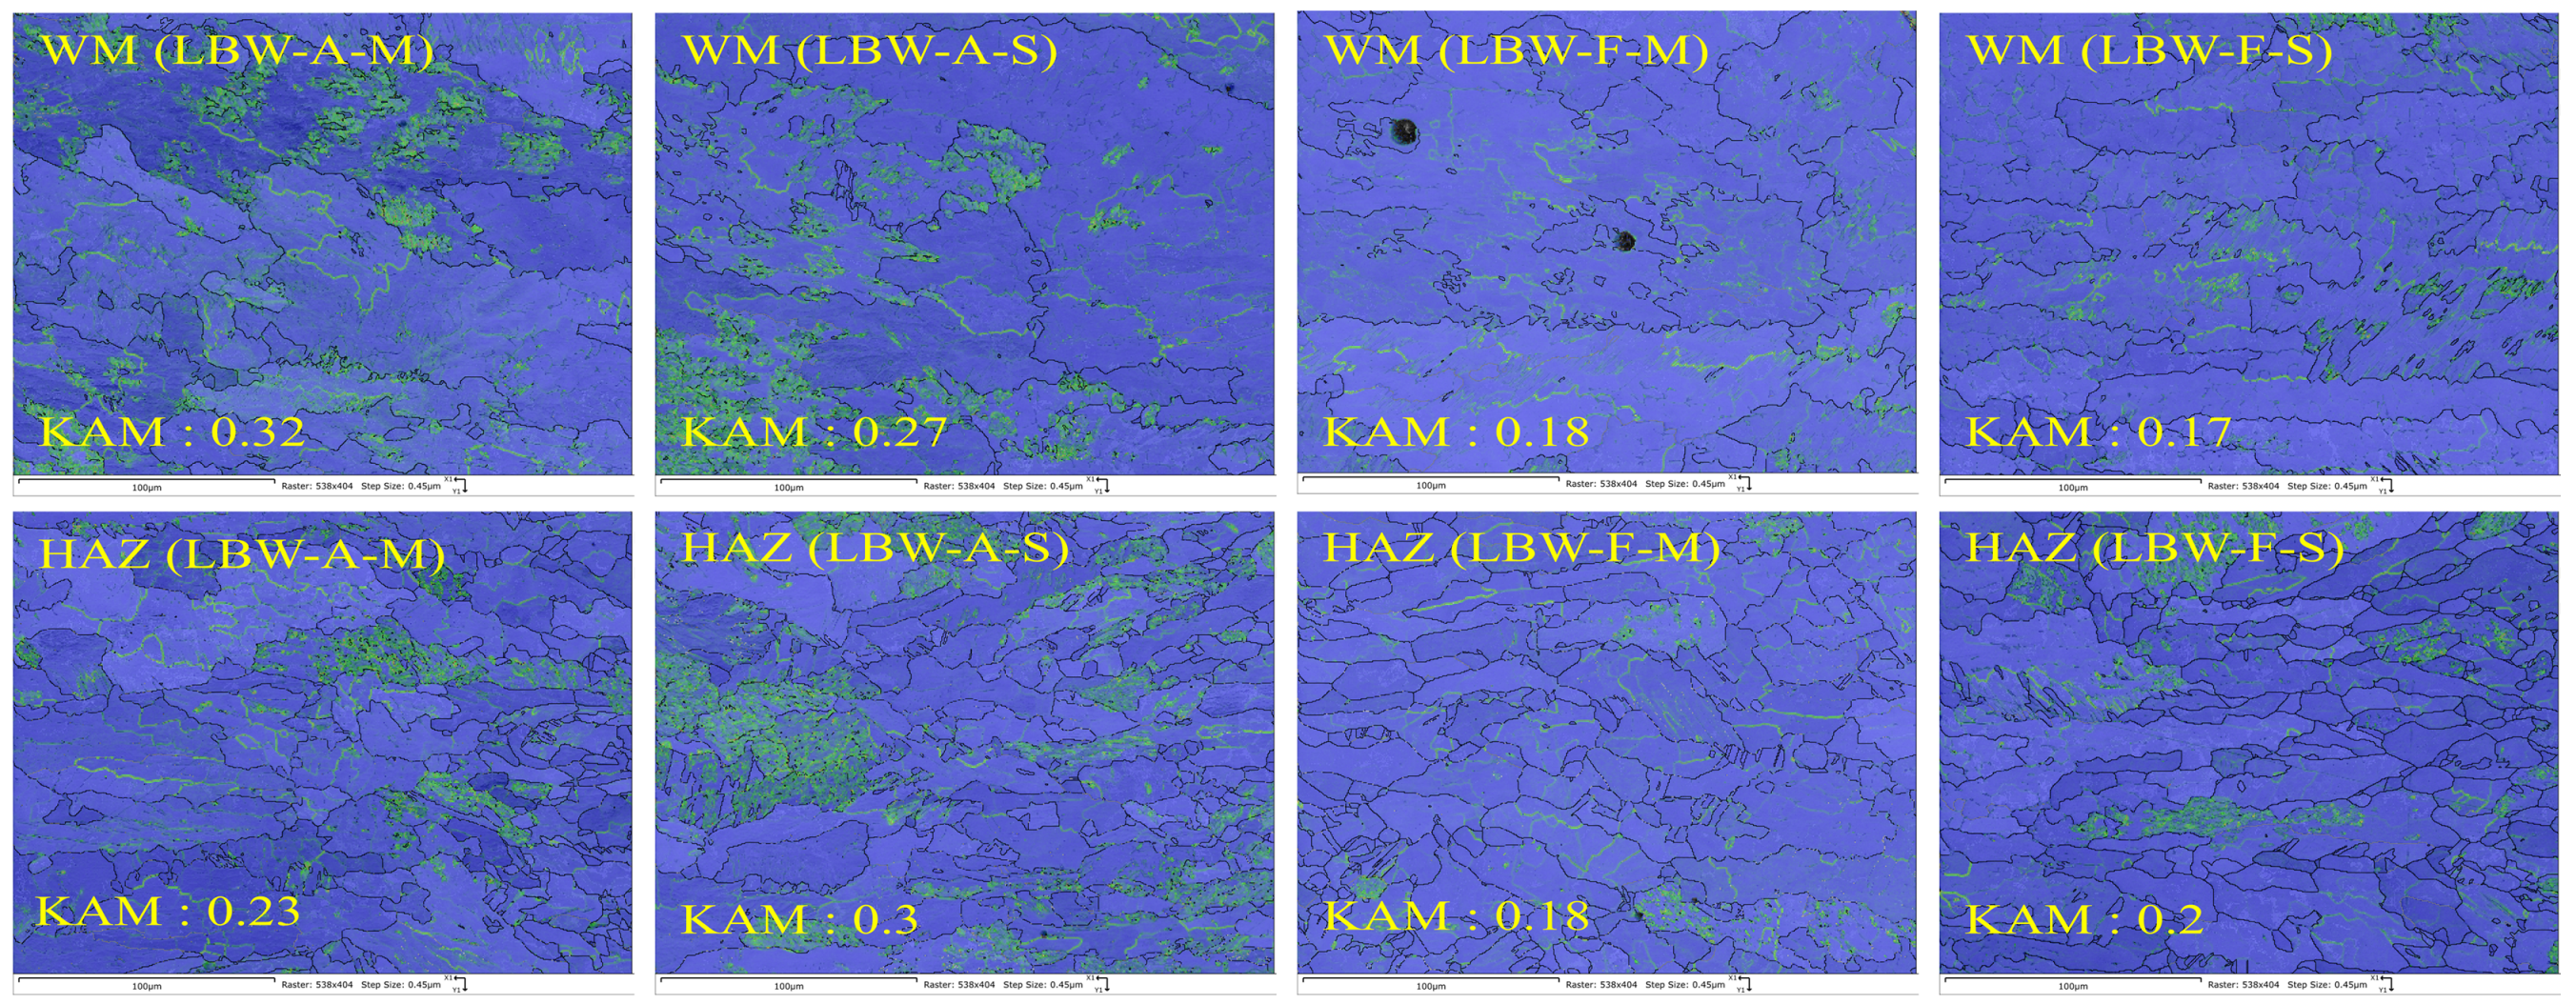
Figure 6 shows the EBSD-KAM analysis results for the WM and HAZ regions under each welding condition. In the WM region, LBW-A-M and LBW-A-S exhibited KAM values of 0.32 and 0.27, respectively, whereas LBW-F-M and LBW-F-S showed lower values of 0.18 and 0.17, respectively.
Figure 6.
EBSD-derived kernel average misorientation (KAM) maps of the weld metal (WM) and heat-affected zone (HAZ) for LBW-A-M, LBW-A-S, LBW-F-M, and LBW-F-S specimens.
The higher KAM values indicate greater local orientation gradients under the employed acquisition and calculation conditions. These results indicate that the autogenous LBW conditions produced greater local orientation gradients in the WM region than the filler-wire LBW conditions. This difference is interpreted as reflecting the combined effects of the welding process conditions, thermal cycle, and solidification behavior, rather than the faying-surface condition.
The effect of the faying surface condition was more evident in the HAZ region than in the WM. Under the autogenous welding conditions, the KAM value in the HAZ increased from 0.23 for LBW-A-M to 0.30 for LBW-A-S. Under the filler-wire welding conditions, the KAM value in the HAZ also increased slightly from 0.18 for LBW-F-M to 0.20 for LBW-F-S. The higher KAM values observed under the sheared-surface condition in the HAZ region may be related to the localized plastic deformation layer, micro-cracks, and geometric irregularities introduced during shearing, interacting with the subsequent laser welding thermal cycle.
The highest HAZ KAM value was observed in the LBW-A-S condition, suggesting that the influence of the sheared surface was not sufficiently compensated for under the autogenous welding condition. It should be noted, however, that this HAZ trend does not fully parallel the tensile ranking discussed in Section 3.5. Although LBW-A-S showed an intermediate WM KAM and hardness among the welded conditions, it exhibited the lowest tensile strength and elongation overall. This suggests that the bulk tensile and fracture behavior were governed less by the intrinsic microstructural state reflected in the WM KAM and hardness, and more by the defect population namely misalignment and porosity associated with the sheared faying surface. In other words, the initial edge irregularities appear to have influenced both the HAZ misorientation and the extent of defect formation, and it is this combined effect, rather than the WM microstructural state alone, that is consistent with the tensile and 3D-DIC results discussed later.
3.4. Microhardness Distribution
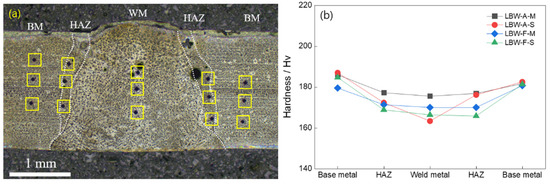
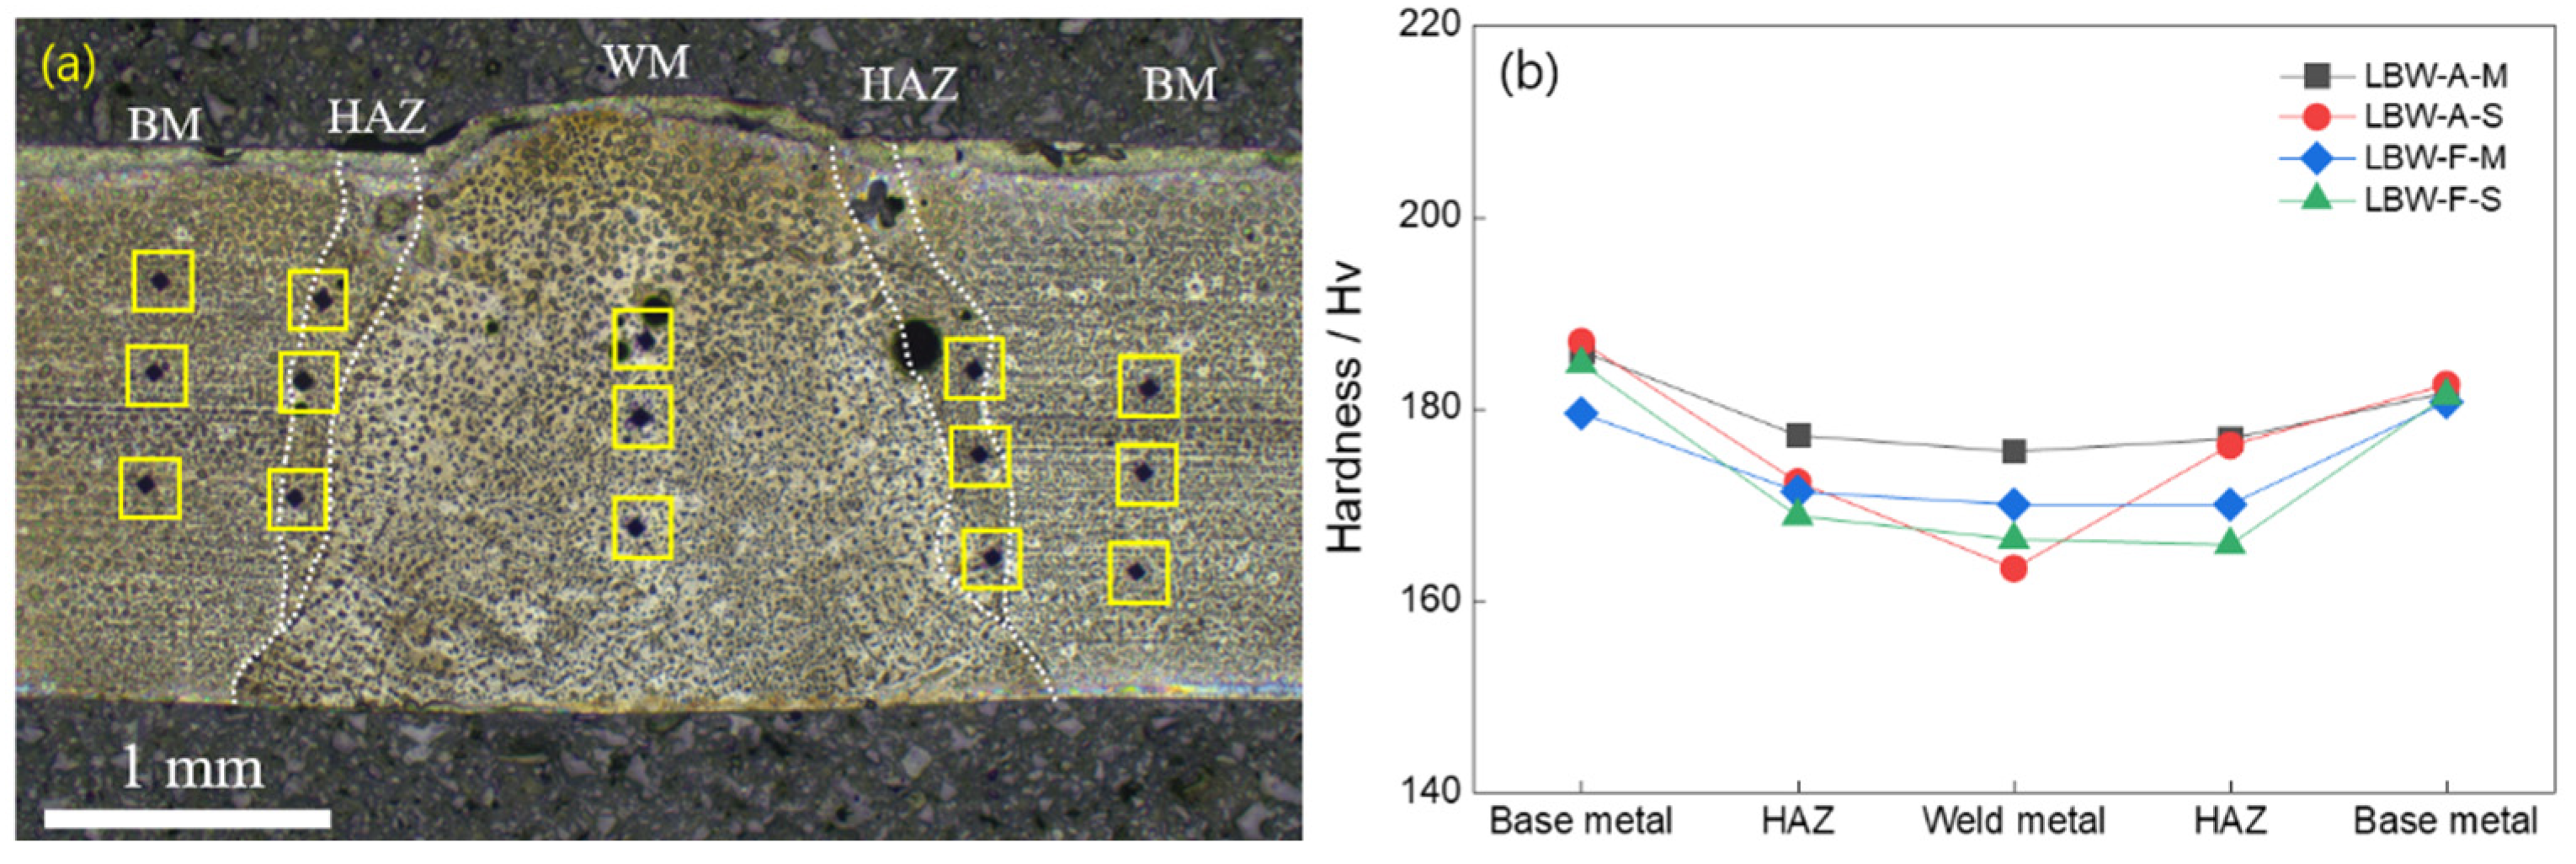
As shown in Figure 7, the microhardness distribution was measured to evaluate the local mechanical properties of the welded joints. Because the widths of the WM and HAZ differed among the welding conditions, indentation positions were determined based on the microstructural regions identified in the corresponding etched cross-sectional micrographs, rather than at fixed distance intervals, as described in Section 2.4. Accordingly, the horizontal axis in Figure 7 represents metallographically identified microstructural regions rather than identical physical distances from the weld centerline. The presented values should therefore be interpreted as regional hardness values rather than as continuous transverse hardness profiles.
Figure 7.
(a) Representative optical micrograph (LBW-A-M) showing indentation locations determined based on the microstructural regions (BM, HAZ, WM). (b) Regional microhardness values in the BM, HAZ, and WM of laser-welded 304 stainless steel joints fabricated under different faying surface and filler-wire conditions.
Under all welding conditions, the hardness values in the HAZ and WM were lower than those of the BM. This indicates that the welding heat cycle affected the local mechanical response of the welded region. Because no direct evidence was obtained showing that the hardness indentations were located adjacent to pores or other internal discontinuities, the measured hardness variations were not attributed directly to porosity.
The LBW-A-M condition maintained relatively high hardness levels in both the HAZ and WM compared with the other welded conditions. This result is consistent with the stable bead shape and limited internal defects observed in the cross-sectional analysis. In contrast, the sheared-surface conditions showed lower hardness values and a more uneven distribution in the WM and HAZ regions. This behavior is presumably related to the irregular faying-surface condition of the sheared specimens, which resulted in non-uniform heat transfer and local variations in cooling rate.
Under the LBW-F-M and LBW-F-S conditions, although the bead appearance was improved, the WM hardness was lower than that of LBW-A-M. This is presumably because the net heat input under the filler-wire conditions was approximately 1.8 times higher than that under the autogenous conditions (Table 2), resulting in a slower cooling rate that contributed to the coarsening of the solidification substructure [4]. These results suggest that the regional hardness distribution was governed primarily by the welding thermal cycle and the resulting solidification microstructure.
3.5. Tensile Properties and 3D-DIC Strain Behavior
As noted in Section 2.2, because the autogenous and filler-wire conditions were produced using different mode-specific process parameters, comparisons between these conditions are descriptive and condition-specific and should not be interpreted as isolating the independent effect of filler-wire addition.
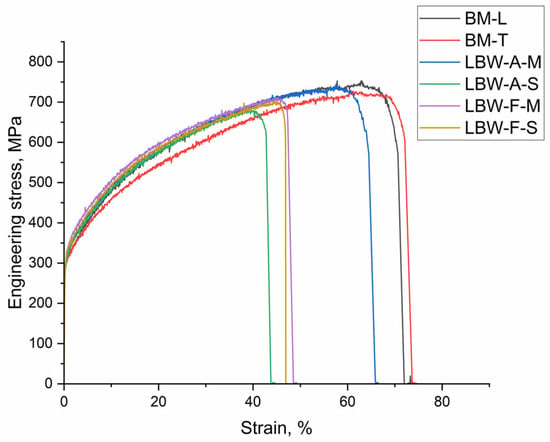
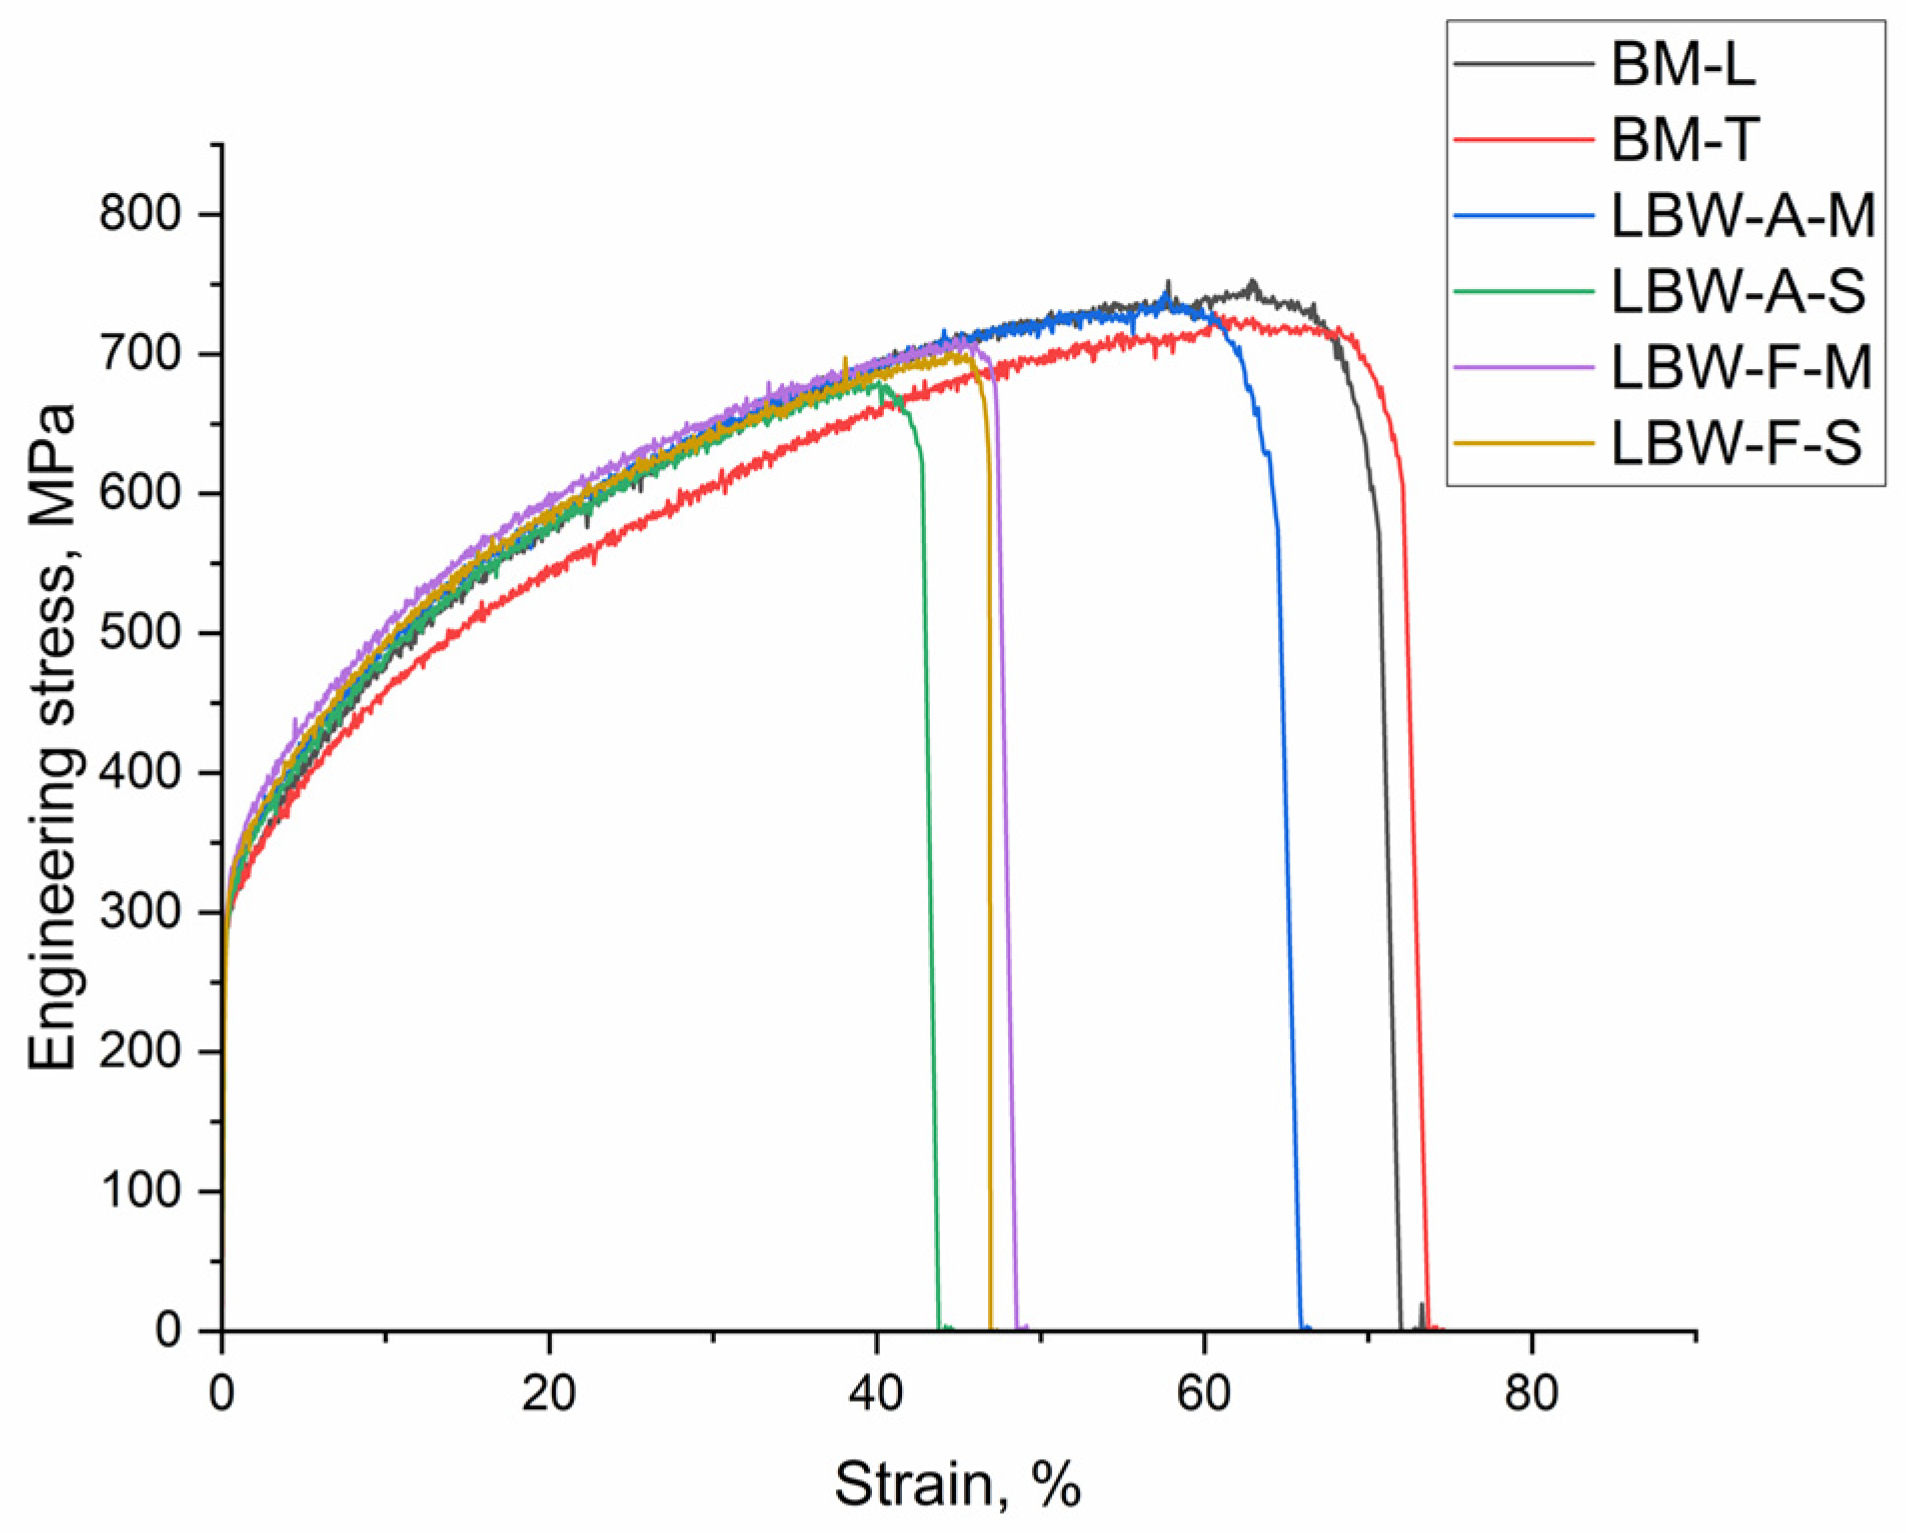
This section presents the tensile properties of the BM and laser-welded specimens, together with the local deformation behavior observed during tensile testing. Three tests were conducted for each condition, and the results are summarized in Table 4 as mean values and standard deviations. Representative engineering stress-strain curves are presented in Figure 8. One BM-T specimen was excluded from the statistical analysis because it showed an invalid fracture.
Table 4.
Tensile properties of the base metal (BM) and laser beam welded specimens.
Figure 8.
Representative engineering stress–strain curves of the base metal (BM) and laser beam welded specimens fabricated under different welding methods and faying surface conditions.
For the BM, the yield strengths of BM-L and BM-T were 292.64 MPa and 292.26 MPa, respectively, and were nearly identical. The tensile strength of BM-L was 750.43 MPa, which was slightly higher than that of BM-T (726.97 MPa); however, the elongation was slightly higher for BM-T (73.97%) than for BM-L (70.94%). Therefore, the 304 stainless steel sheet used in this study showed some mechanical anisotropy depending on the rolling direction, but the differences were relatively small. These results indicate a modest directional dependence in the tensile response of the sheet. Because the welded tensile specimens were loaded parallel to the rolling direction, BM-L was used as the reference for the subsequent retention analysis.
For the welded specimens, the yield strength was similar to or slightly higher than that of the BM under all conditions. However, the tensile strength and elongation showed clear differences depending on the faying surface condition and filler-wire condition. The LBW-A-M condition, in which autogenous laser welding was performed on the machined faying surface, showed the best combination of strength and ductility among the welded conditions, with a tensile strength of 742.36 MPa and an elongation of 64.64%.
In contrast, the LBW-A-S condition, in which autogenous laser welding was performed on the sheared surface, showed the lowest values, with a tensile strength of 682.31 MPa and an elongation of 44.04%. This suggests that the irregular geometry and micro-gaps of the sheared surface contributed to the deterioration of the mechanical properties of the welded joint.
The relative tensile response of the autogenous and filler-wire process conditions depended on the faying-surface condition. On the machined surface, the LBW-F-M condition showed lower tensile strength and elongation than the LBW-A-M condition. In contrast, on the sheared surface, the LBW-F-S condition showed higher tensile strength and elongation than the LBW-A-S condition. Therefore, under the selected parameter sets, LBW-F-S exhibited numerically higher tensile strength and elongation than LBW-A-S. However, this comparison reflects the combined effects of filler-wire feeding and the different thermal cycles.
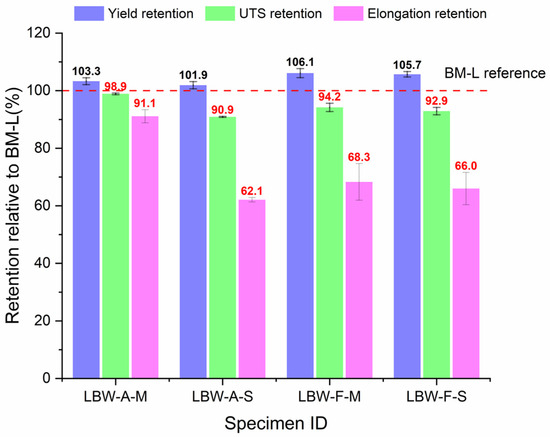
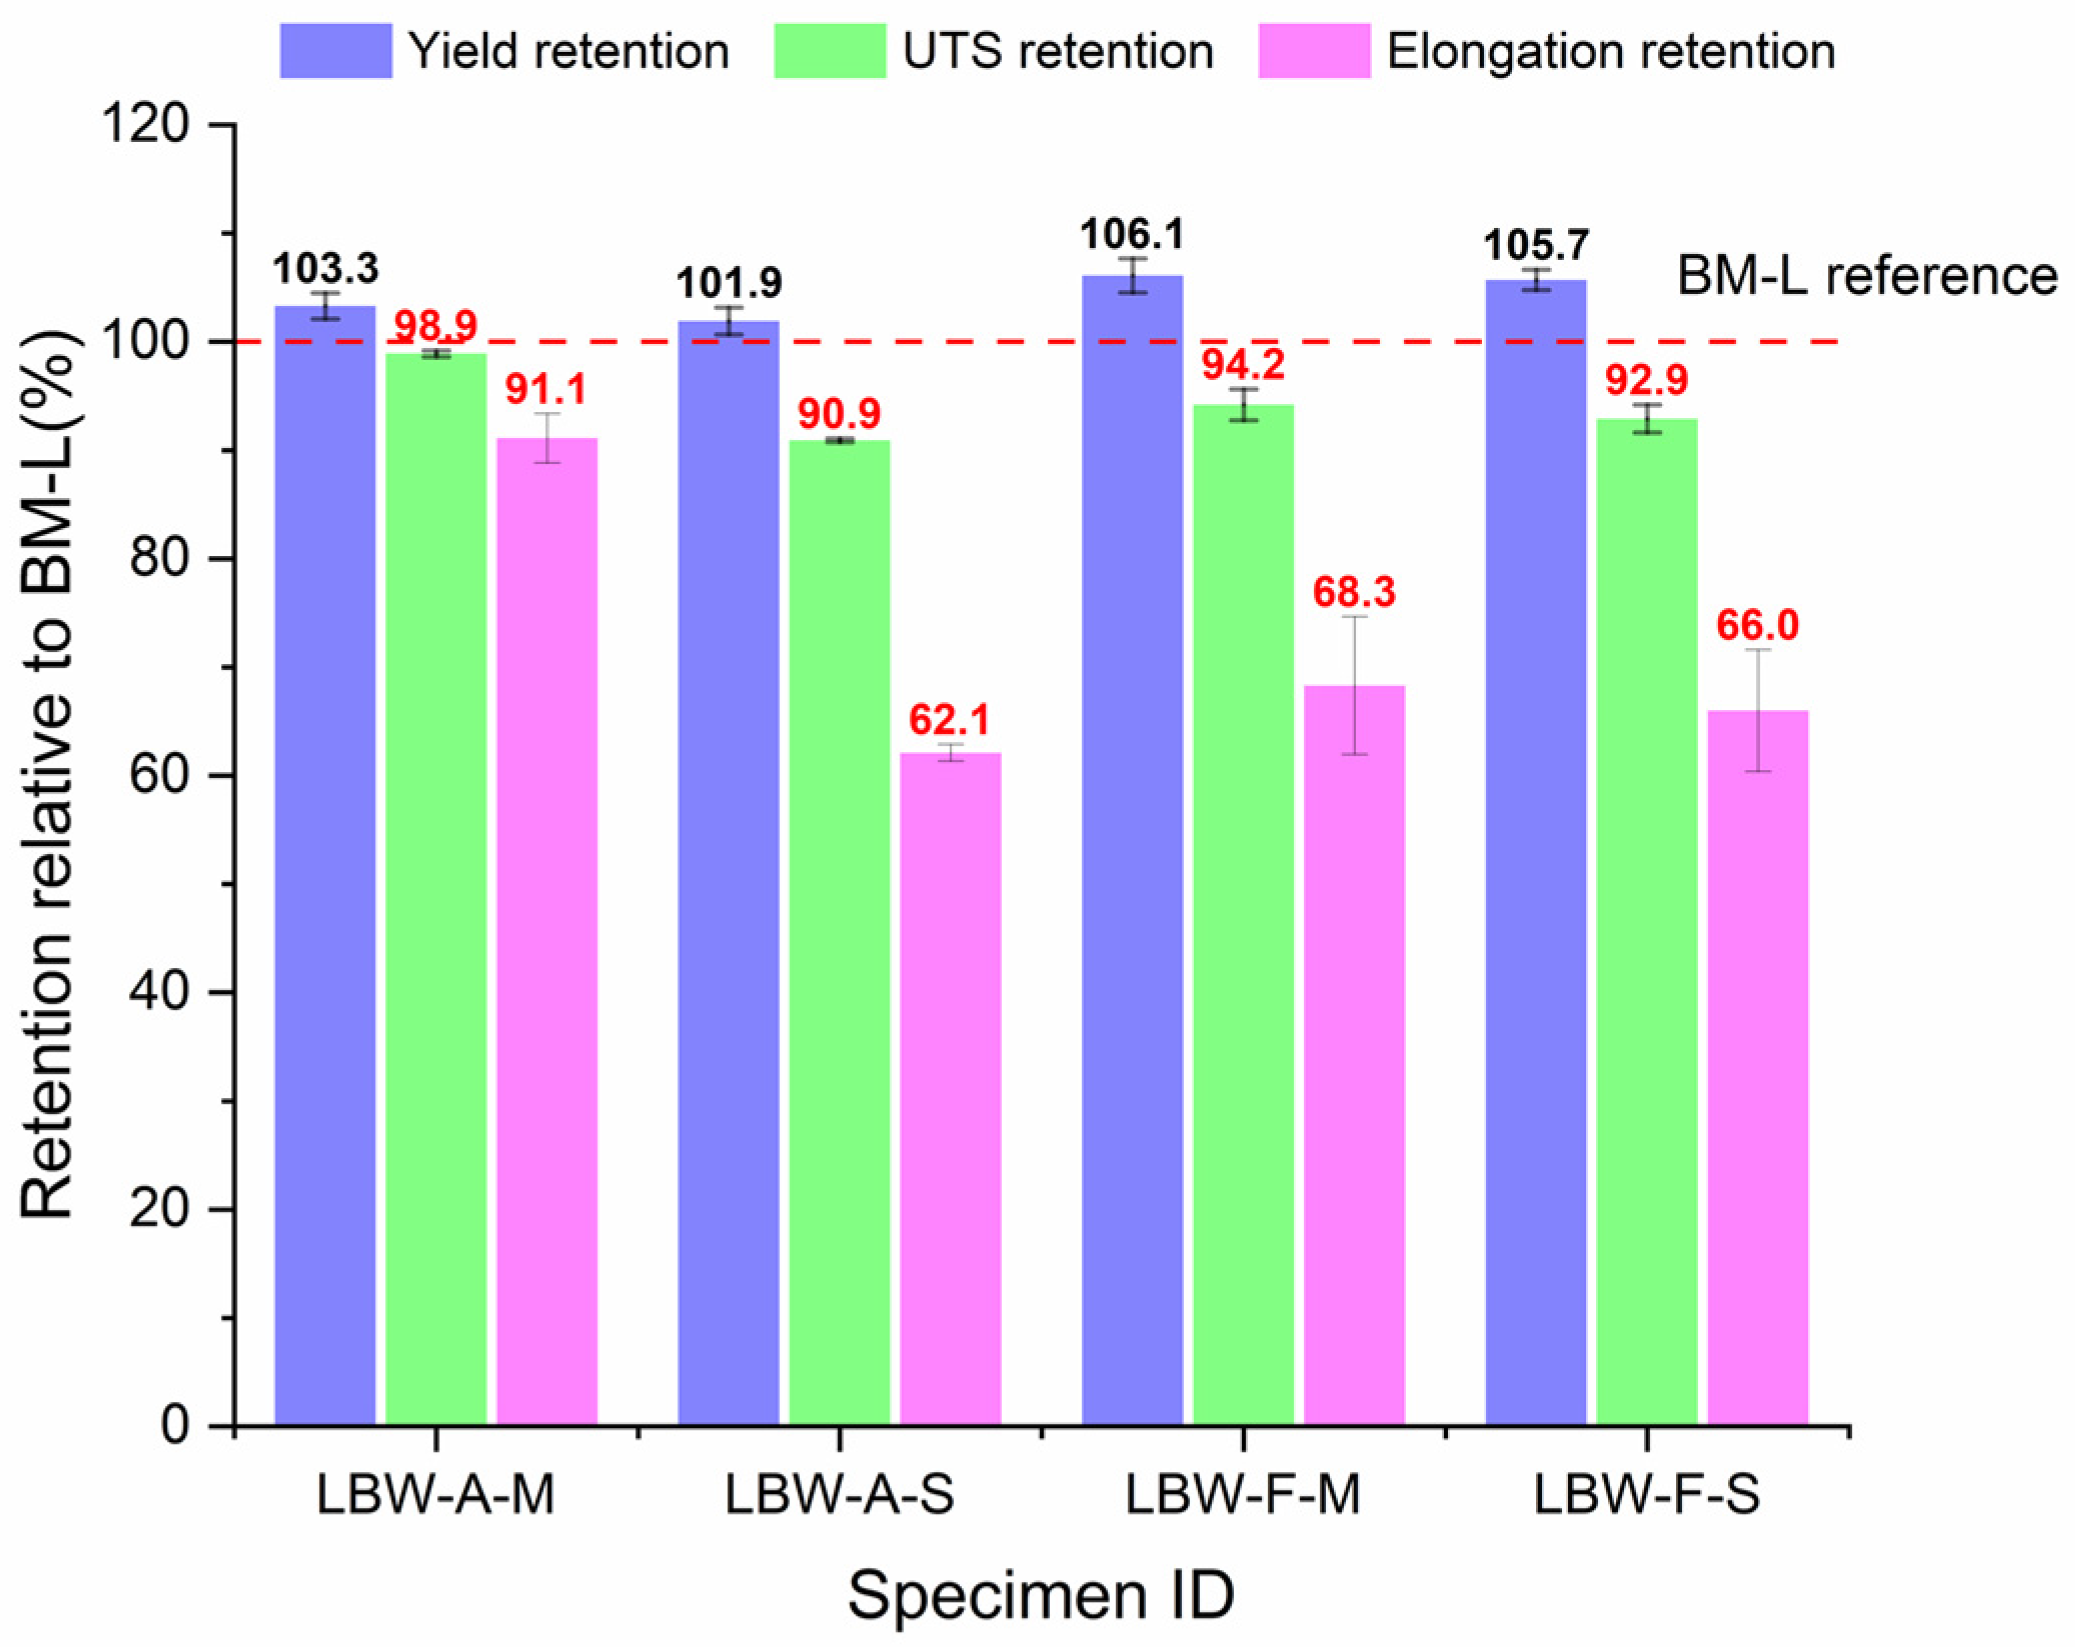
Because the welded tensile specimens were loaded parallel to the rolling direction, BM-L was used as the reference for evaluating the retention of mechanical properties, as shown in Figure 9. The yield-strength retention exceeded 100% for all welded conditions, ranging from 101.9% to 106.1%. In contrast, the ultimate tensile strength and elongation were reduced to different degrees depending on the welding condition. LBW-A-M retained 98.9% of the BM-L tensile strength and 91.1% of its elongation, demonstrating that the machined-edge autogenous joint maintained mechanical performance close to that of the directionally corresponding base metal. LBW-A-S showed the lowest tensile-strength and elongation retentions, at 90.9% and 62.1%, respectively. The corresponding values were 94.2% and 68.3% for LBW-F-M and 92.9% and 66.0% for LBW-F-S.
Figure 9.
Retention of yield strength, ultimate tensile strength, and elongation of the laser-welded specimens relative to BM-L. BM-L was selected as the reference because its orientation corresponded to the loading direction of the welded tensile specimens. The dashed line denotes 100% retention.
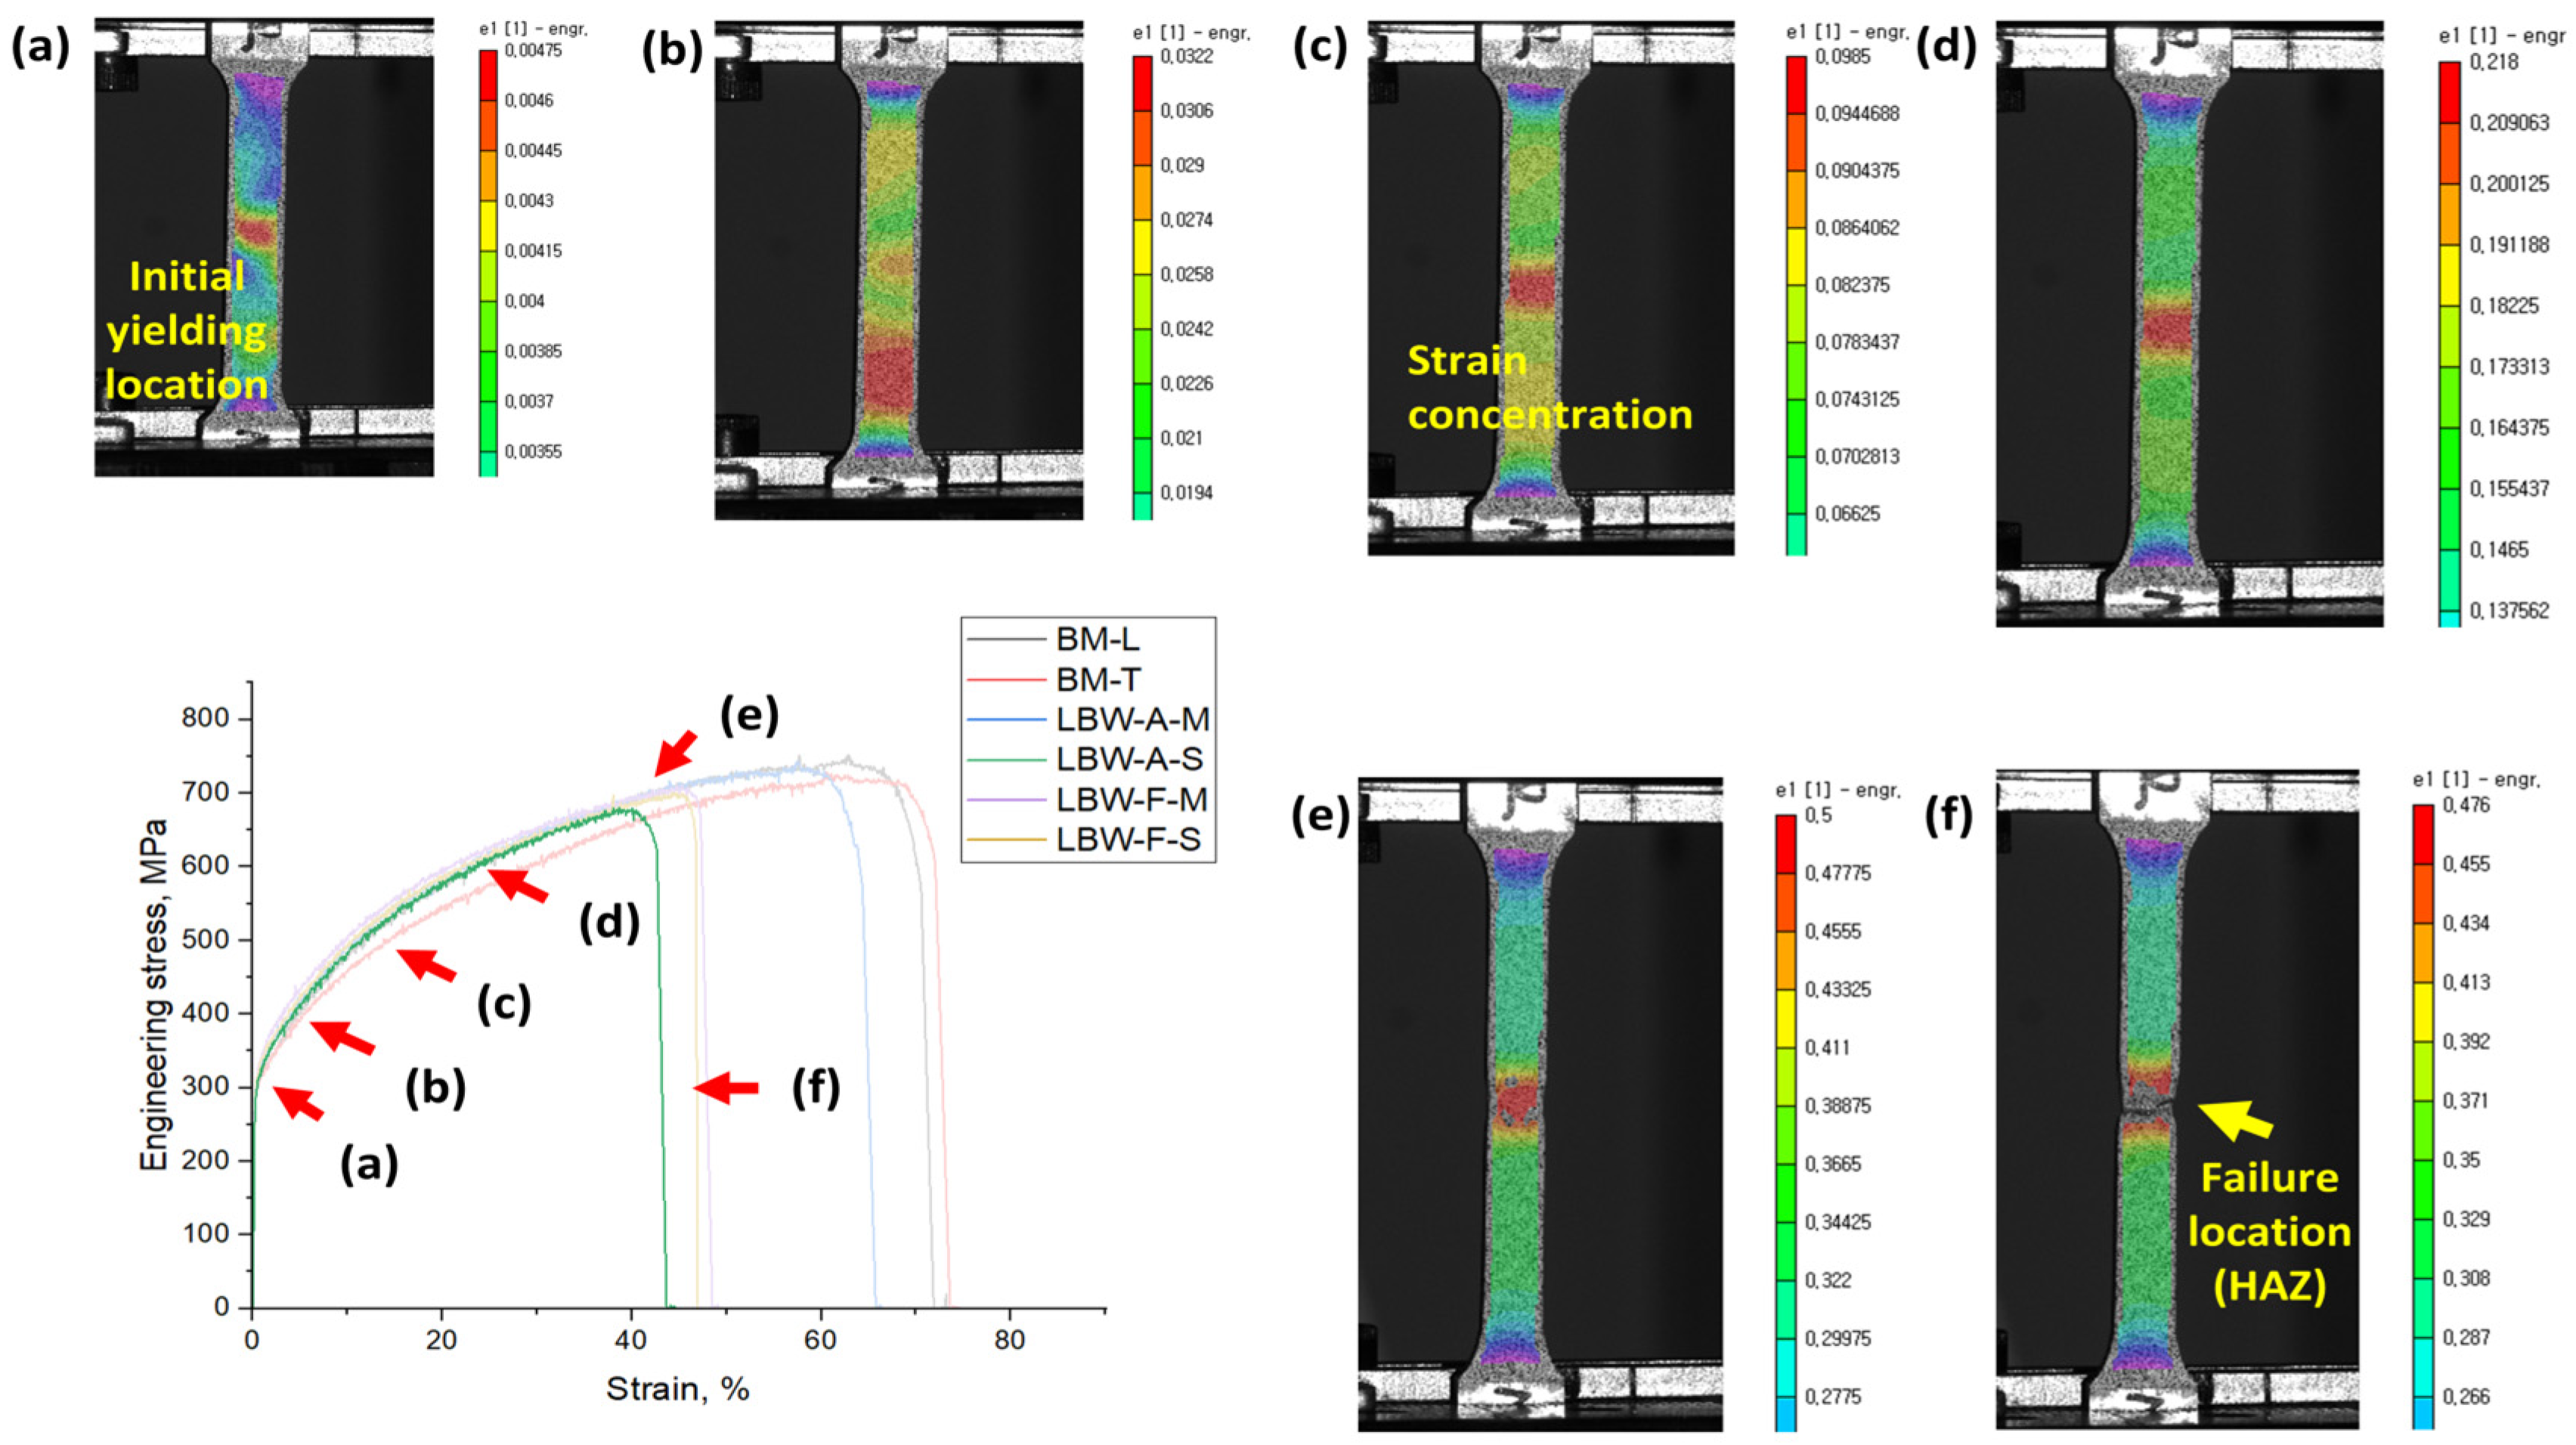
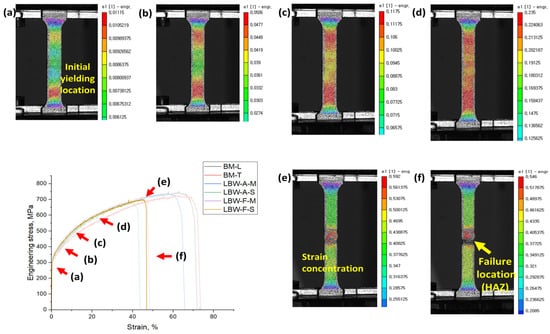
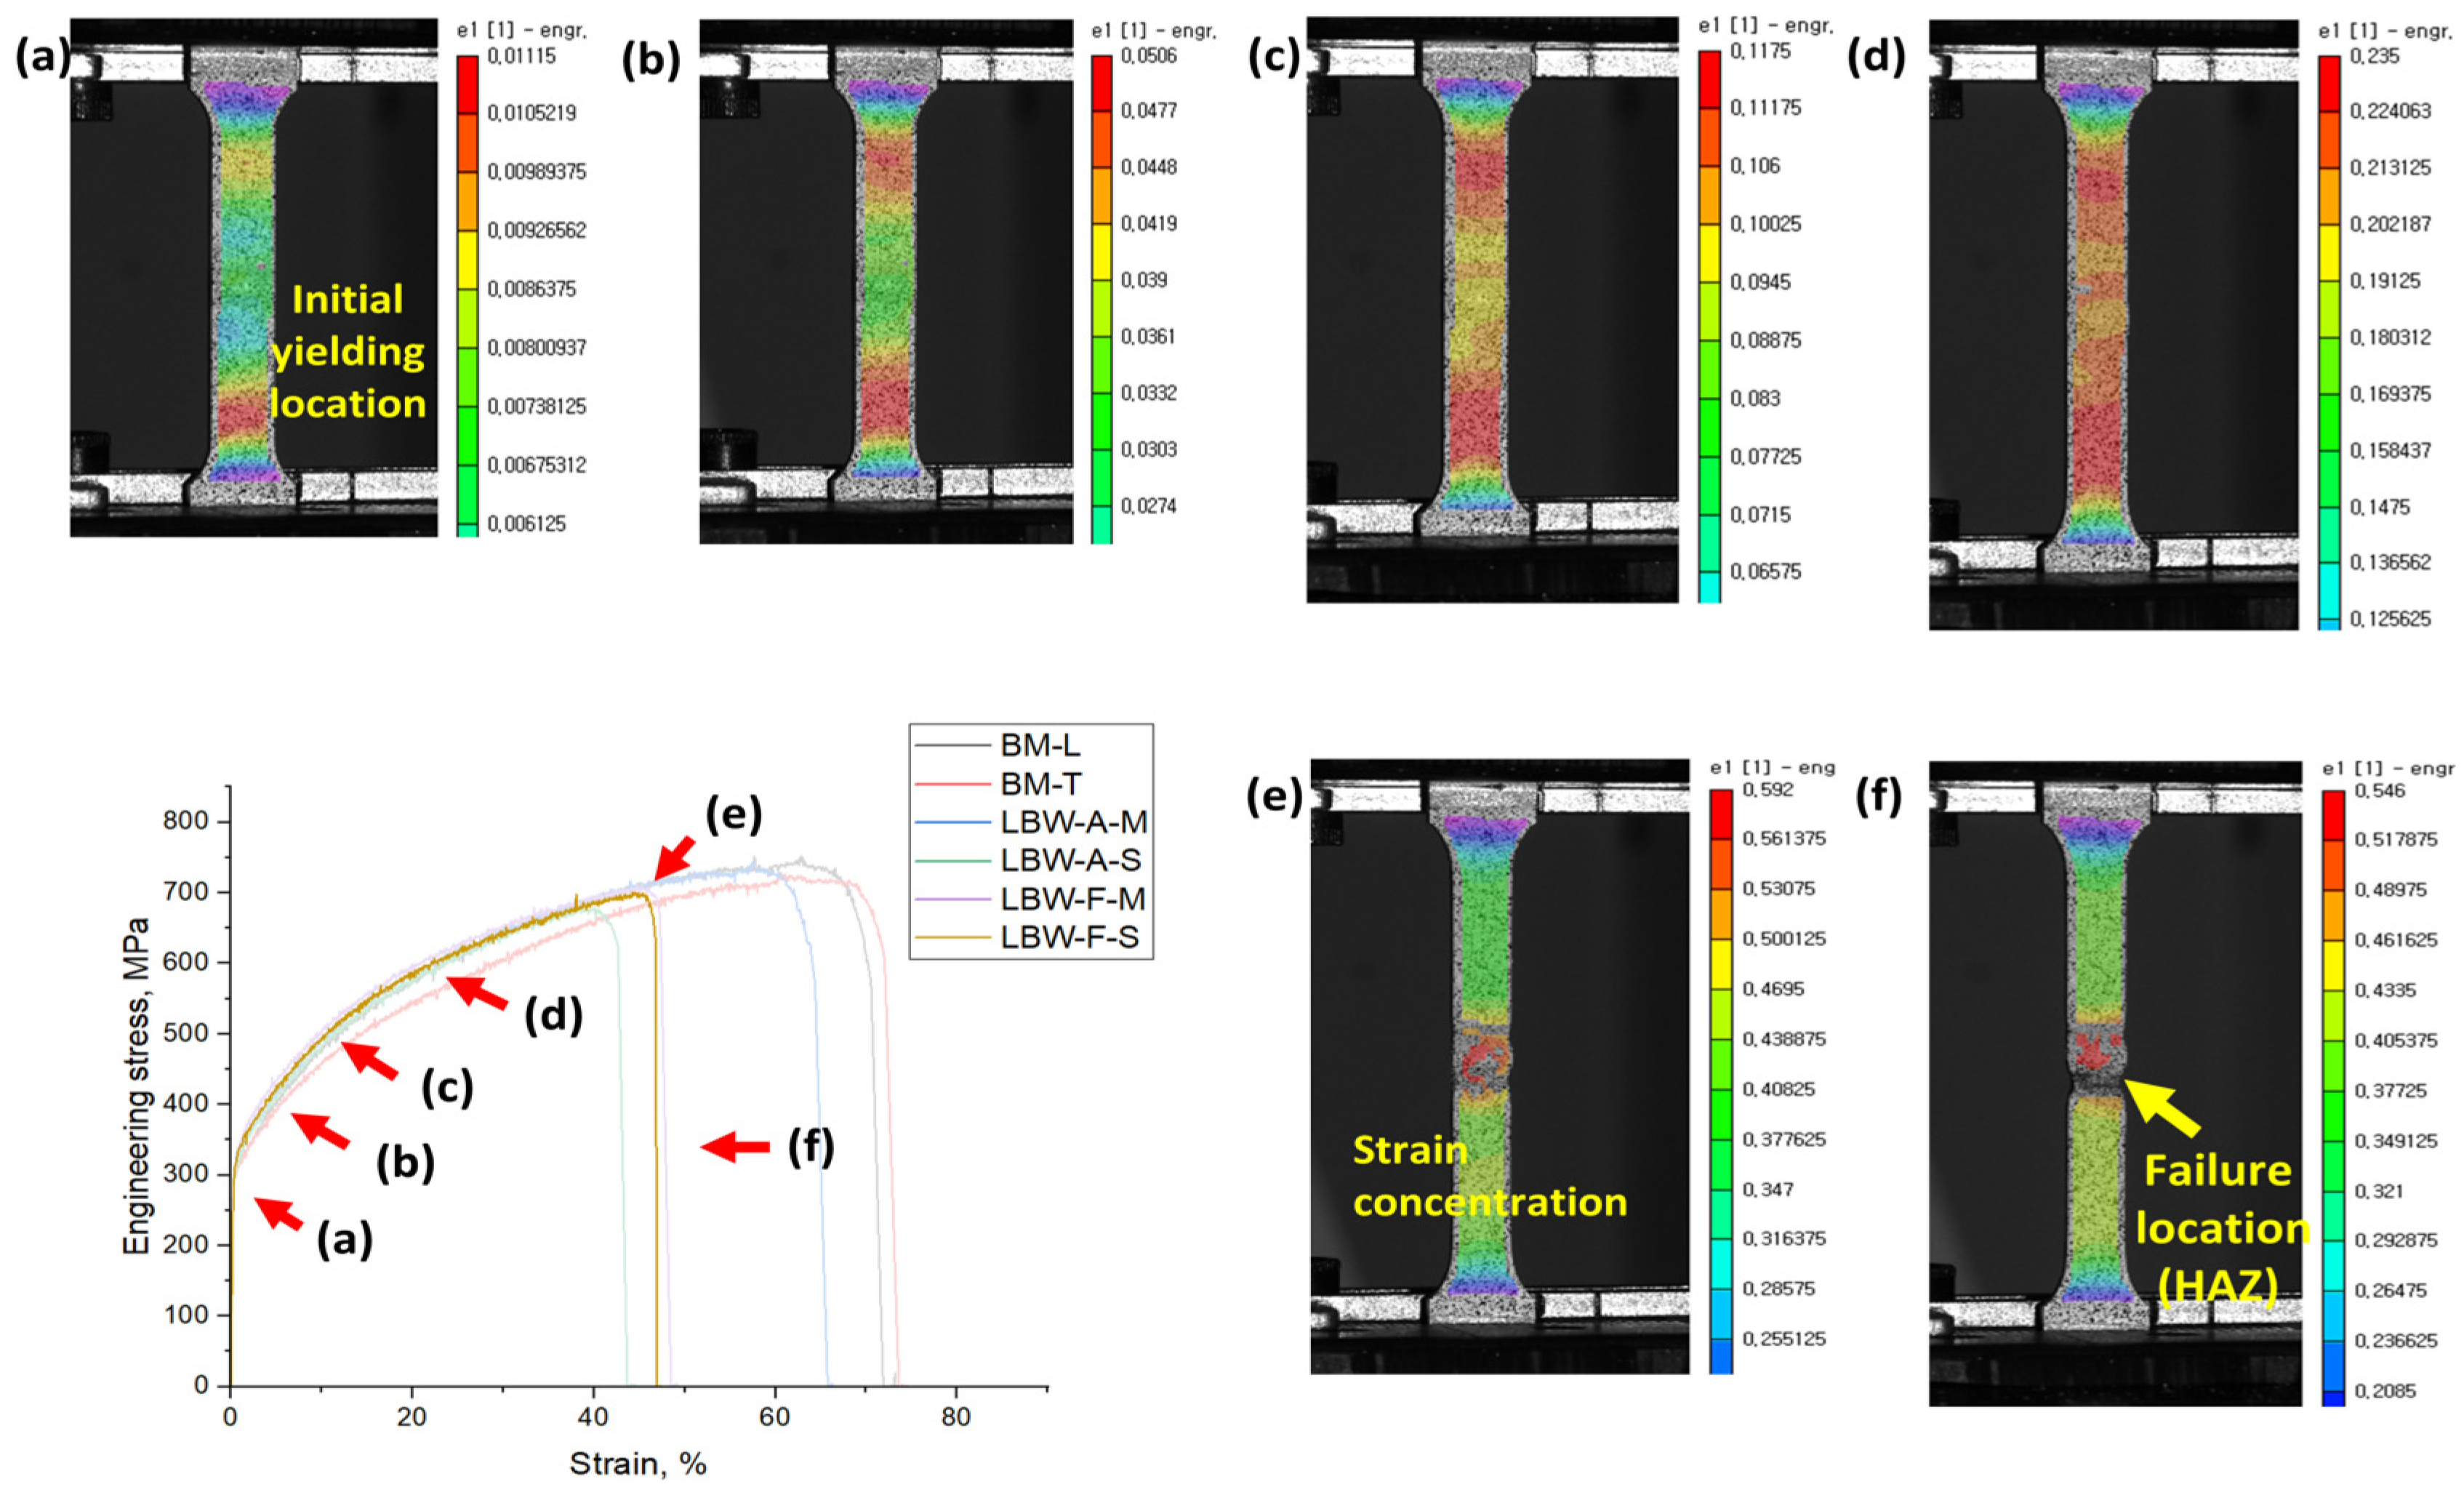
To better understand the differences in tensile properties, the full-field strain distribution on the specimen surface during tensile loading was analyzed using 3D-DIC. In particular, the location of strain concentration in the weld, HAZ, or BM was compared for each condition to relate the local deformation behavior to the final fracture location.
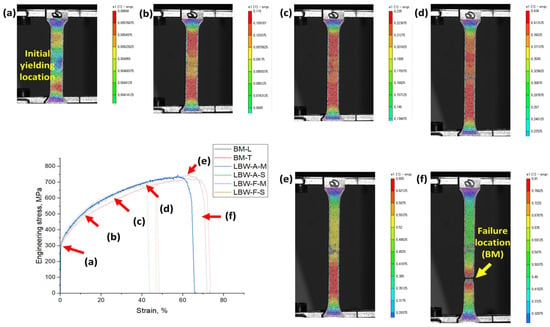
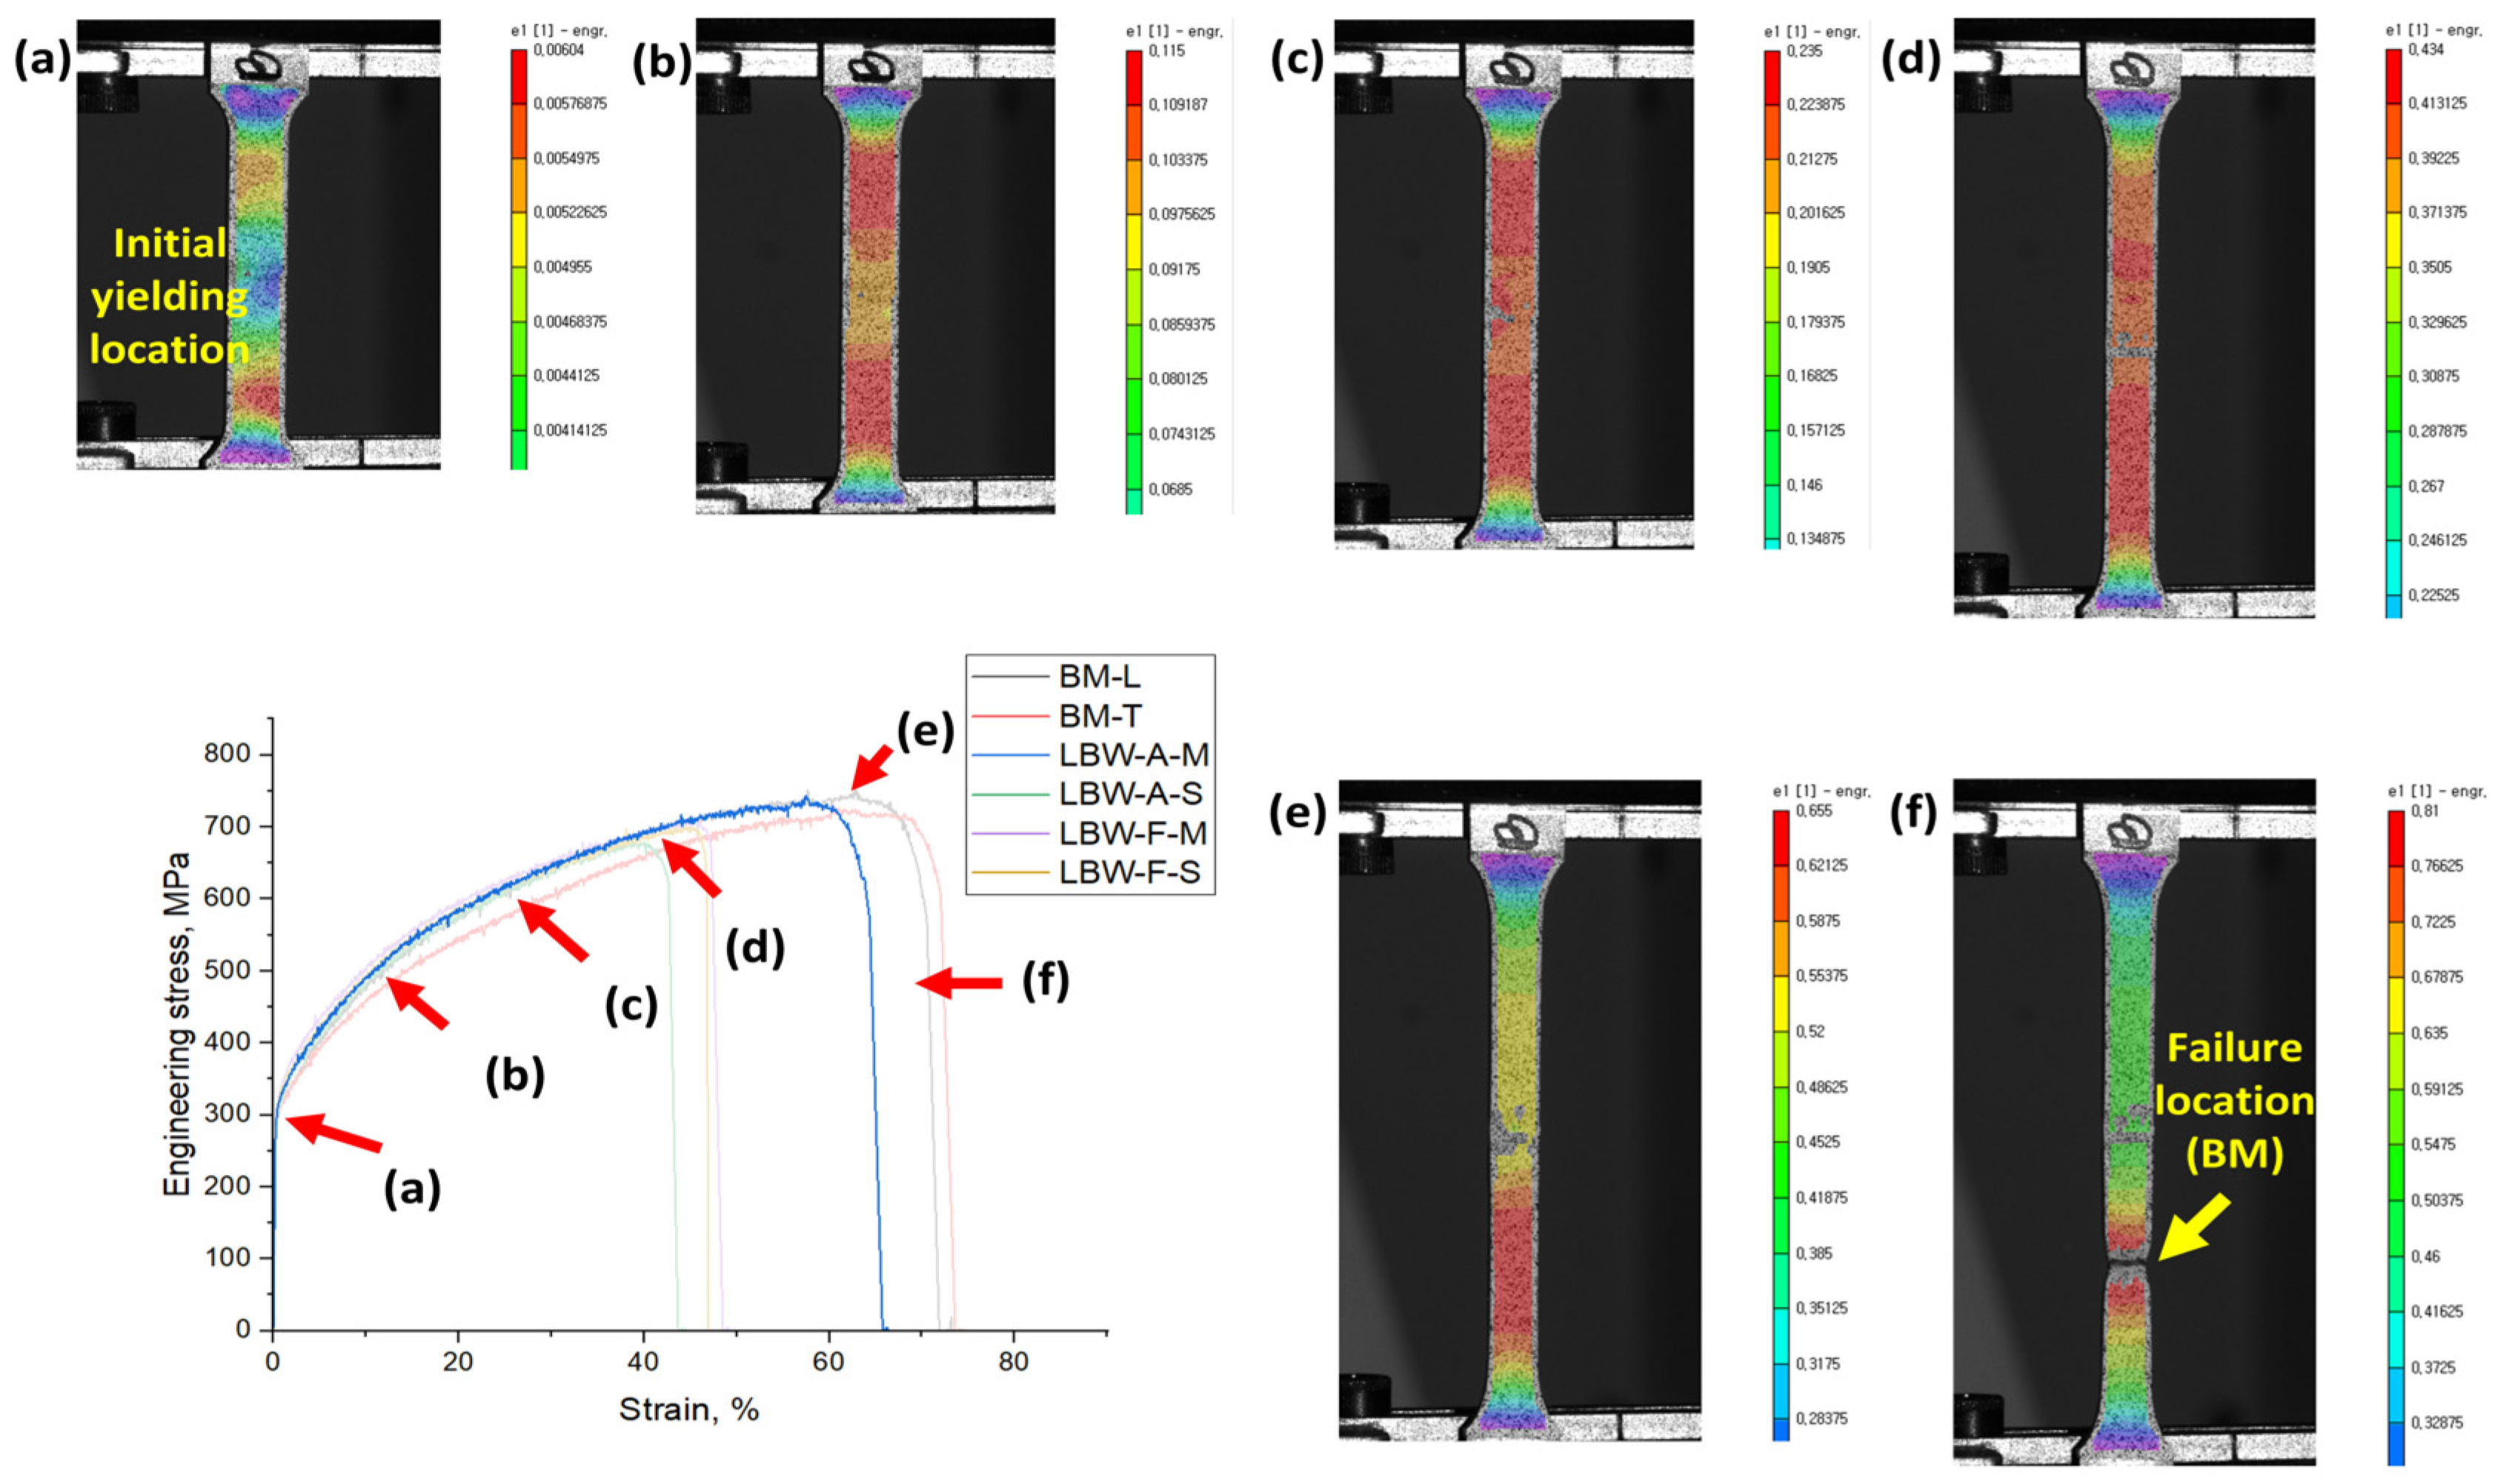
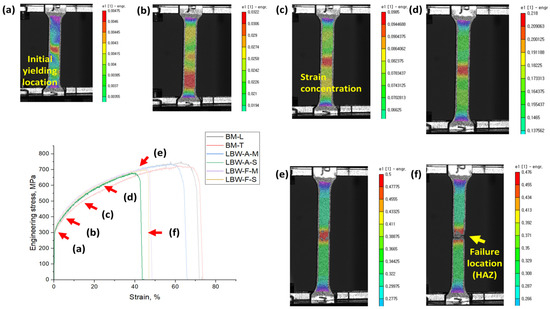
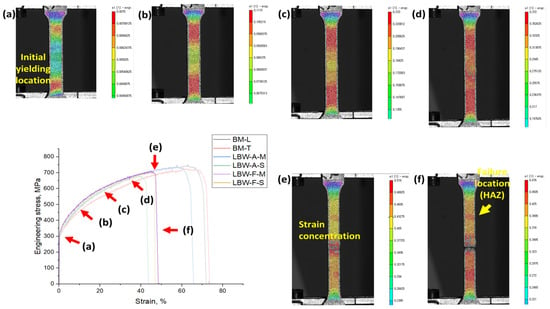
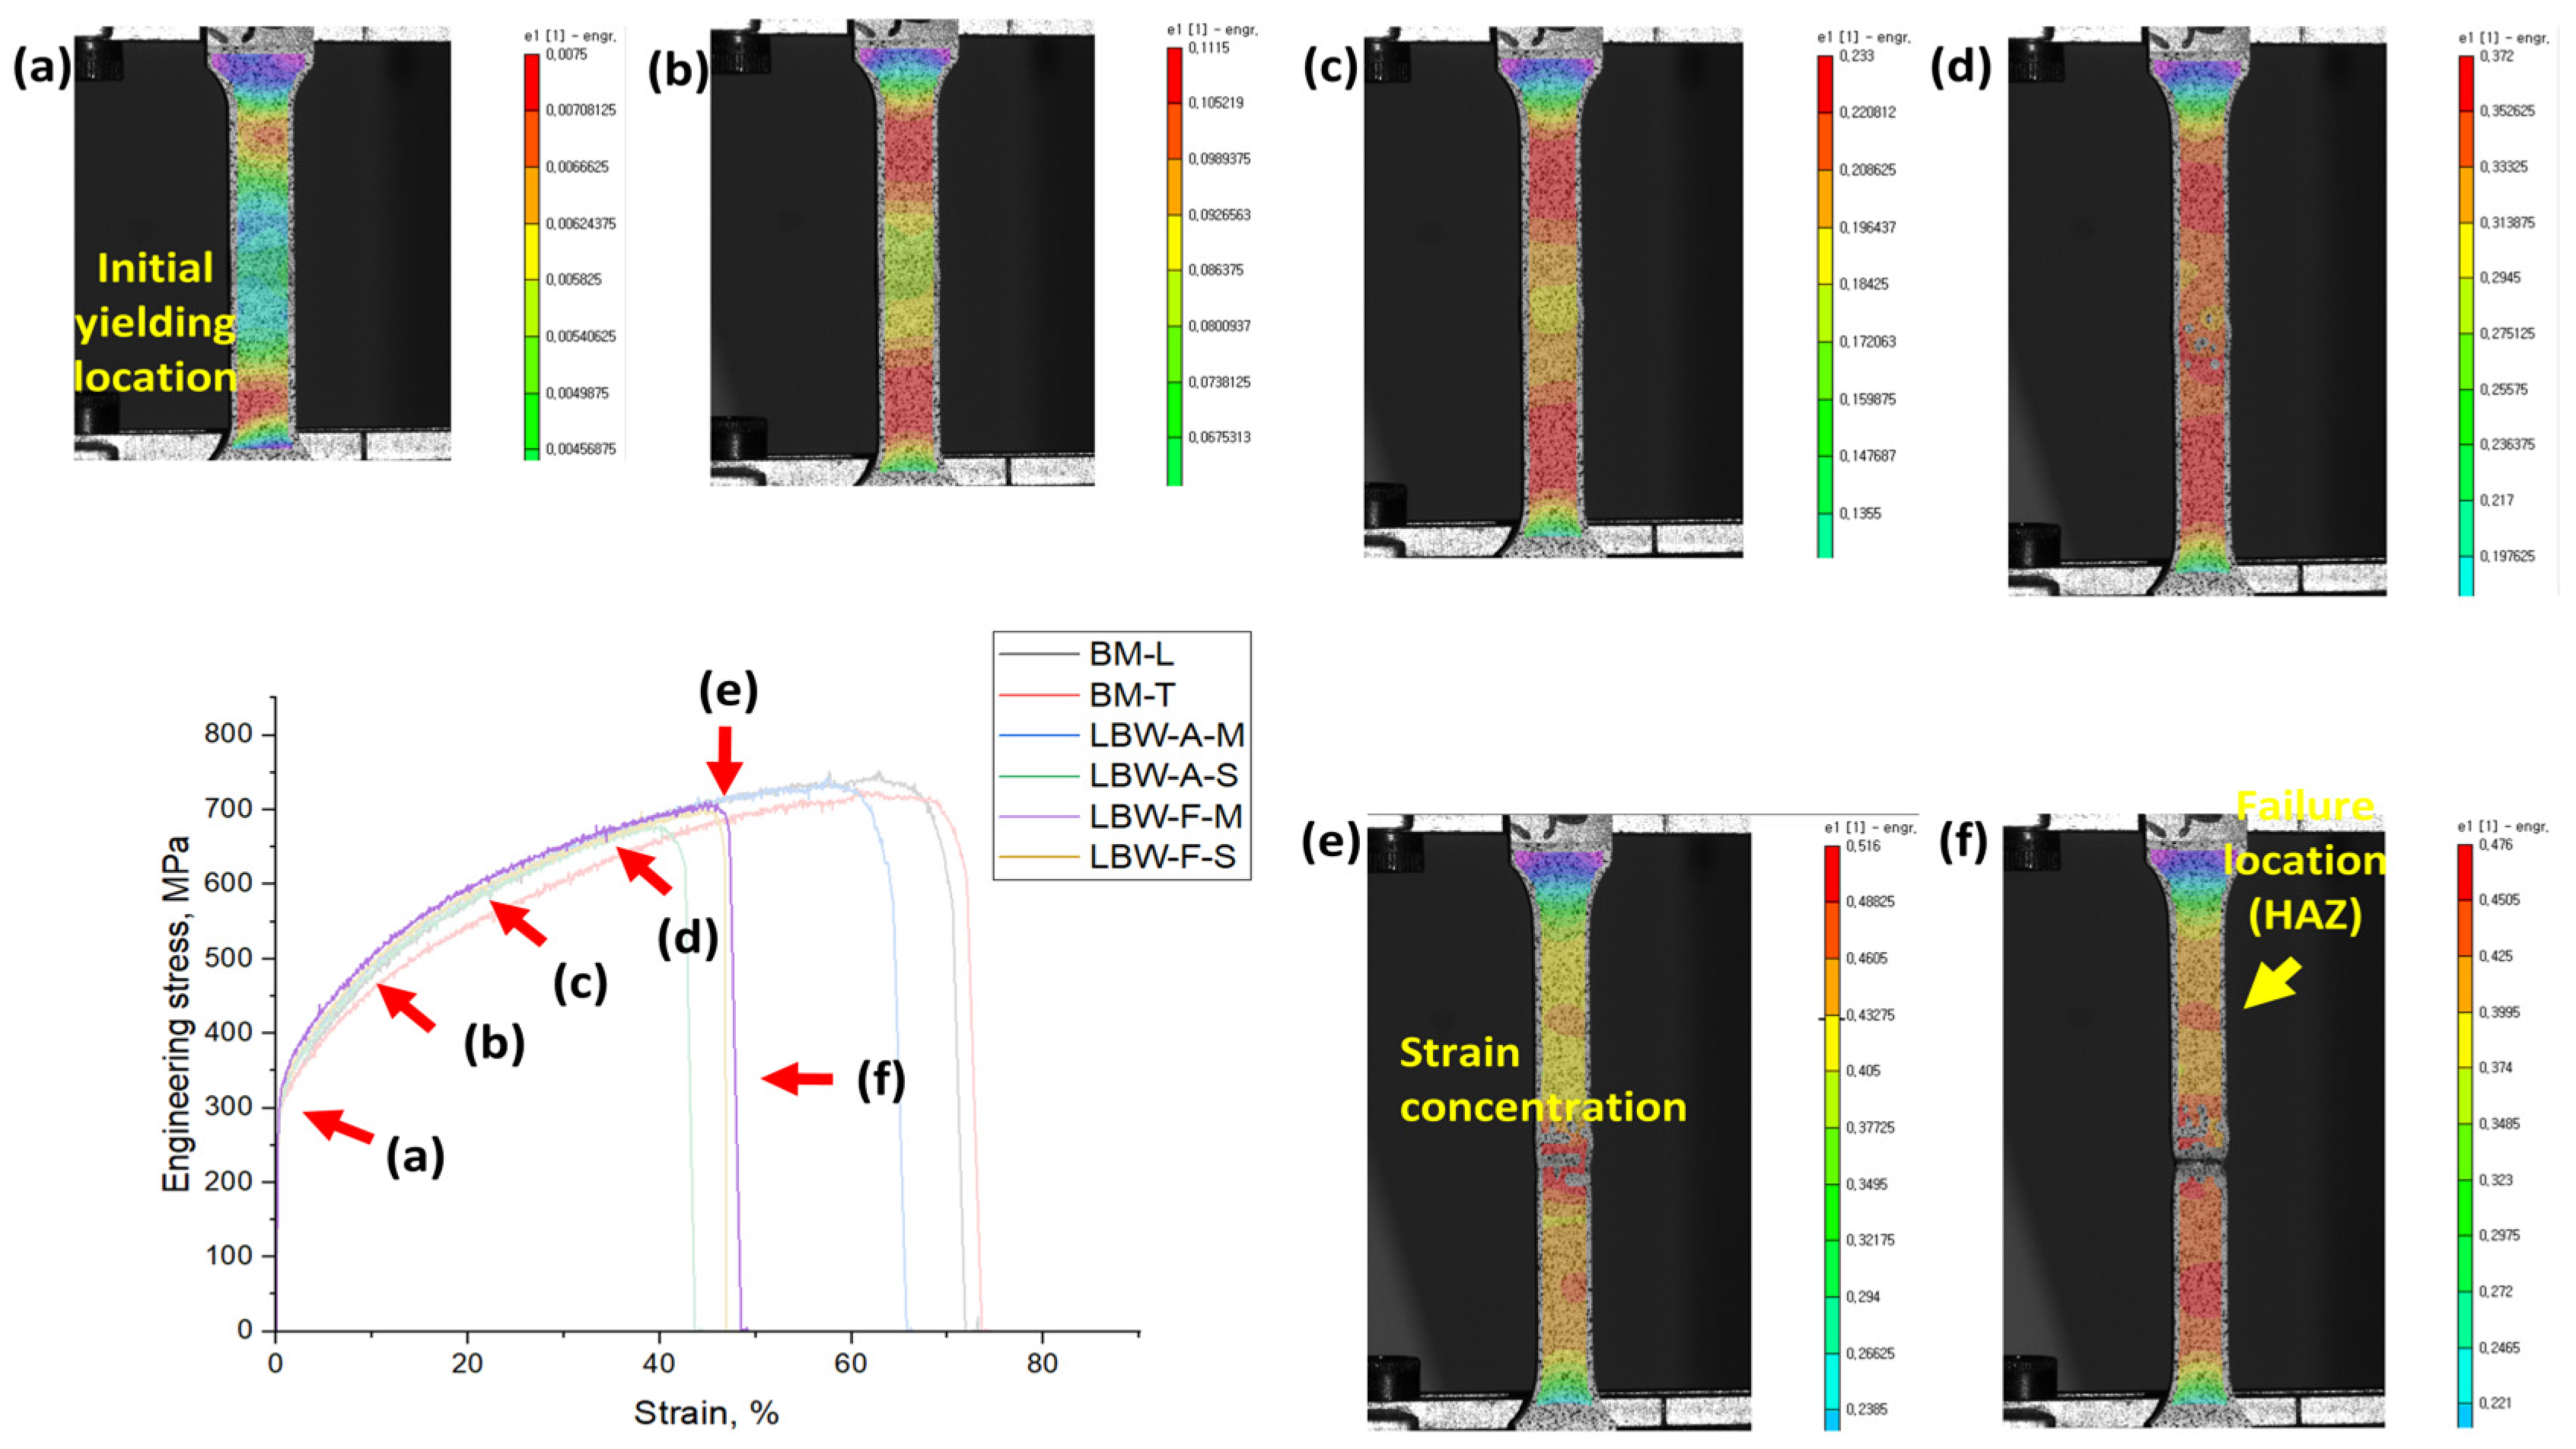
The three DIC measurements obtained for each condition showed comparable strain-localization and fracture behavior; therefore, Figure 10, Figure 11, Figure 12 and Figure 13 present one randomly selected dataset for each welding condition. Figure 10, Figure 11, Figure 12 and Figure 13 show the strain field corresponding to the loading stages labeled (a) through (f) on the representative stress–strain curves for each condition. The strain concentration behavior and final failure locations for each condition were compared based on the local strain distribution.
Figure 10.
Full-field maximum principal strain evolution of the LBW-A-M specimen measured by 3D-DIC during tensile loading. The stages (a–f) correspond to the points marked on the engineering stress–strain curve.
Figure 11.
Full-field maximum principal strain evolution of the LBW-A-S specimen measured by 3D-DIC during tensile loading. The stages (a–f) correspond to the points marked on the engineering stress–strain curve.
Figure 12.
Full-field maximum principal strain evolution of the LBW-F-M specimen measured by 3D-DIC during tensile loading. The stages (a–f) correspond to the points marked on the engineering stress–strain curve.
Figure 13.
Full-field maximum principal strain evolution of the LBW-F-S specimen measured by 3D-DIC during tensile loading. The stages (a–f) correspond to the points marked on the engineering stress–strain curve.
As shown in Figure 10, in the LBW-A-M specimen, strain was distributed relatively uniformly over the gauge section from the early stage of tensile loading. Even as the load increased, no distinct local strain concentration was observed in the weld or HAZ, and final fracture occurred in the BM rather than in the welded region. This indicates that the weld in the LBW-A-M condition did not act as the preferential fracture site and had mechanical integrity comparable to that of the BM. This behavior is consistent with the fact that LBW-A-M showed the highest tensile strength and elongation among the welded conditions.
As shown in Figure 11, the strain distribution of the LBW-A-S specimen was different from that of LBW-A-M. In the early stage of tensile loading, relatively high strain appeared near the center of the gauge section, corresponding to the weld or HAZ region. Immediately before final fracture, high strain was concentrated near the HAZ, where fracture actually occurred. This behavior may be associated with the combined effects of misalignment, underfill, local weld geometry, and the pores observed in the adjacent cross-sectional specimen.
In the LBW-F-M and LBW-F-S specimens shown in Figure 12 and Figure 13, strain was relatively widely distributed within the gauge section during the early stage of tensile loading. However, as the load increased, localized strain concentration developed near the weld or HAZ in both conditions, and final fracture also occurred near the HAZ. This suggests that the different thermal cycles, weld geometry, and pores observed in adjacent cross-sections may have contributed to the final deformation and fracture behavior.
In summary, the 3D-DIC results correspond well with the tensile test results. The LBW-A-M condition showed the most stable tensile behavior, with strain distributed throughout the gauge section and final fracture occurring in the BM. In contrast, in the LBW-A-S, LBW-F-M, and LBW-F-S conditions, localized strain concentration commonly occurred near the weld or HAZ, and final fracture also occurred near the HAZ. In particular, under the sheared-surface condition, strain concentration was more pronounced and may be associated with faying-surface non-uniformity and the defects observed in adjacent weld cross-sections. Therefore, the initial faying surface quality and internal defects are considered important factors affecting the tensile strain behavior and final fracture location of thin AISI 304 stainless steel laser-welded joints.
3.6. Failure Mechanism and Fractography
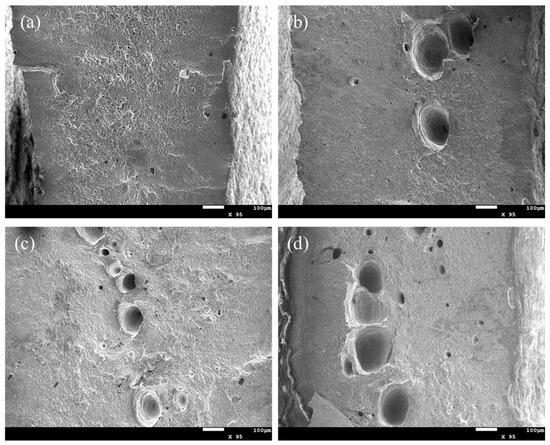
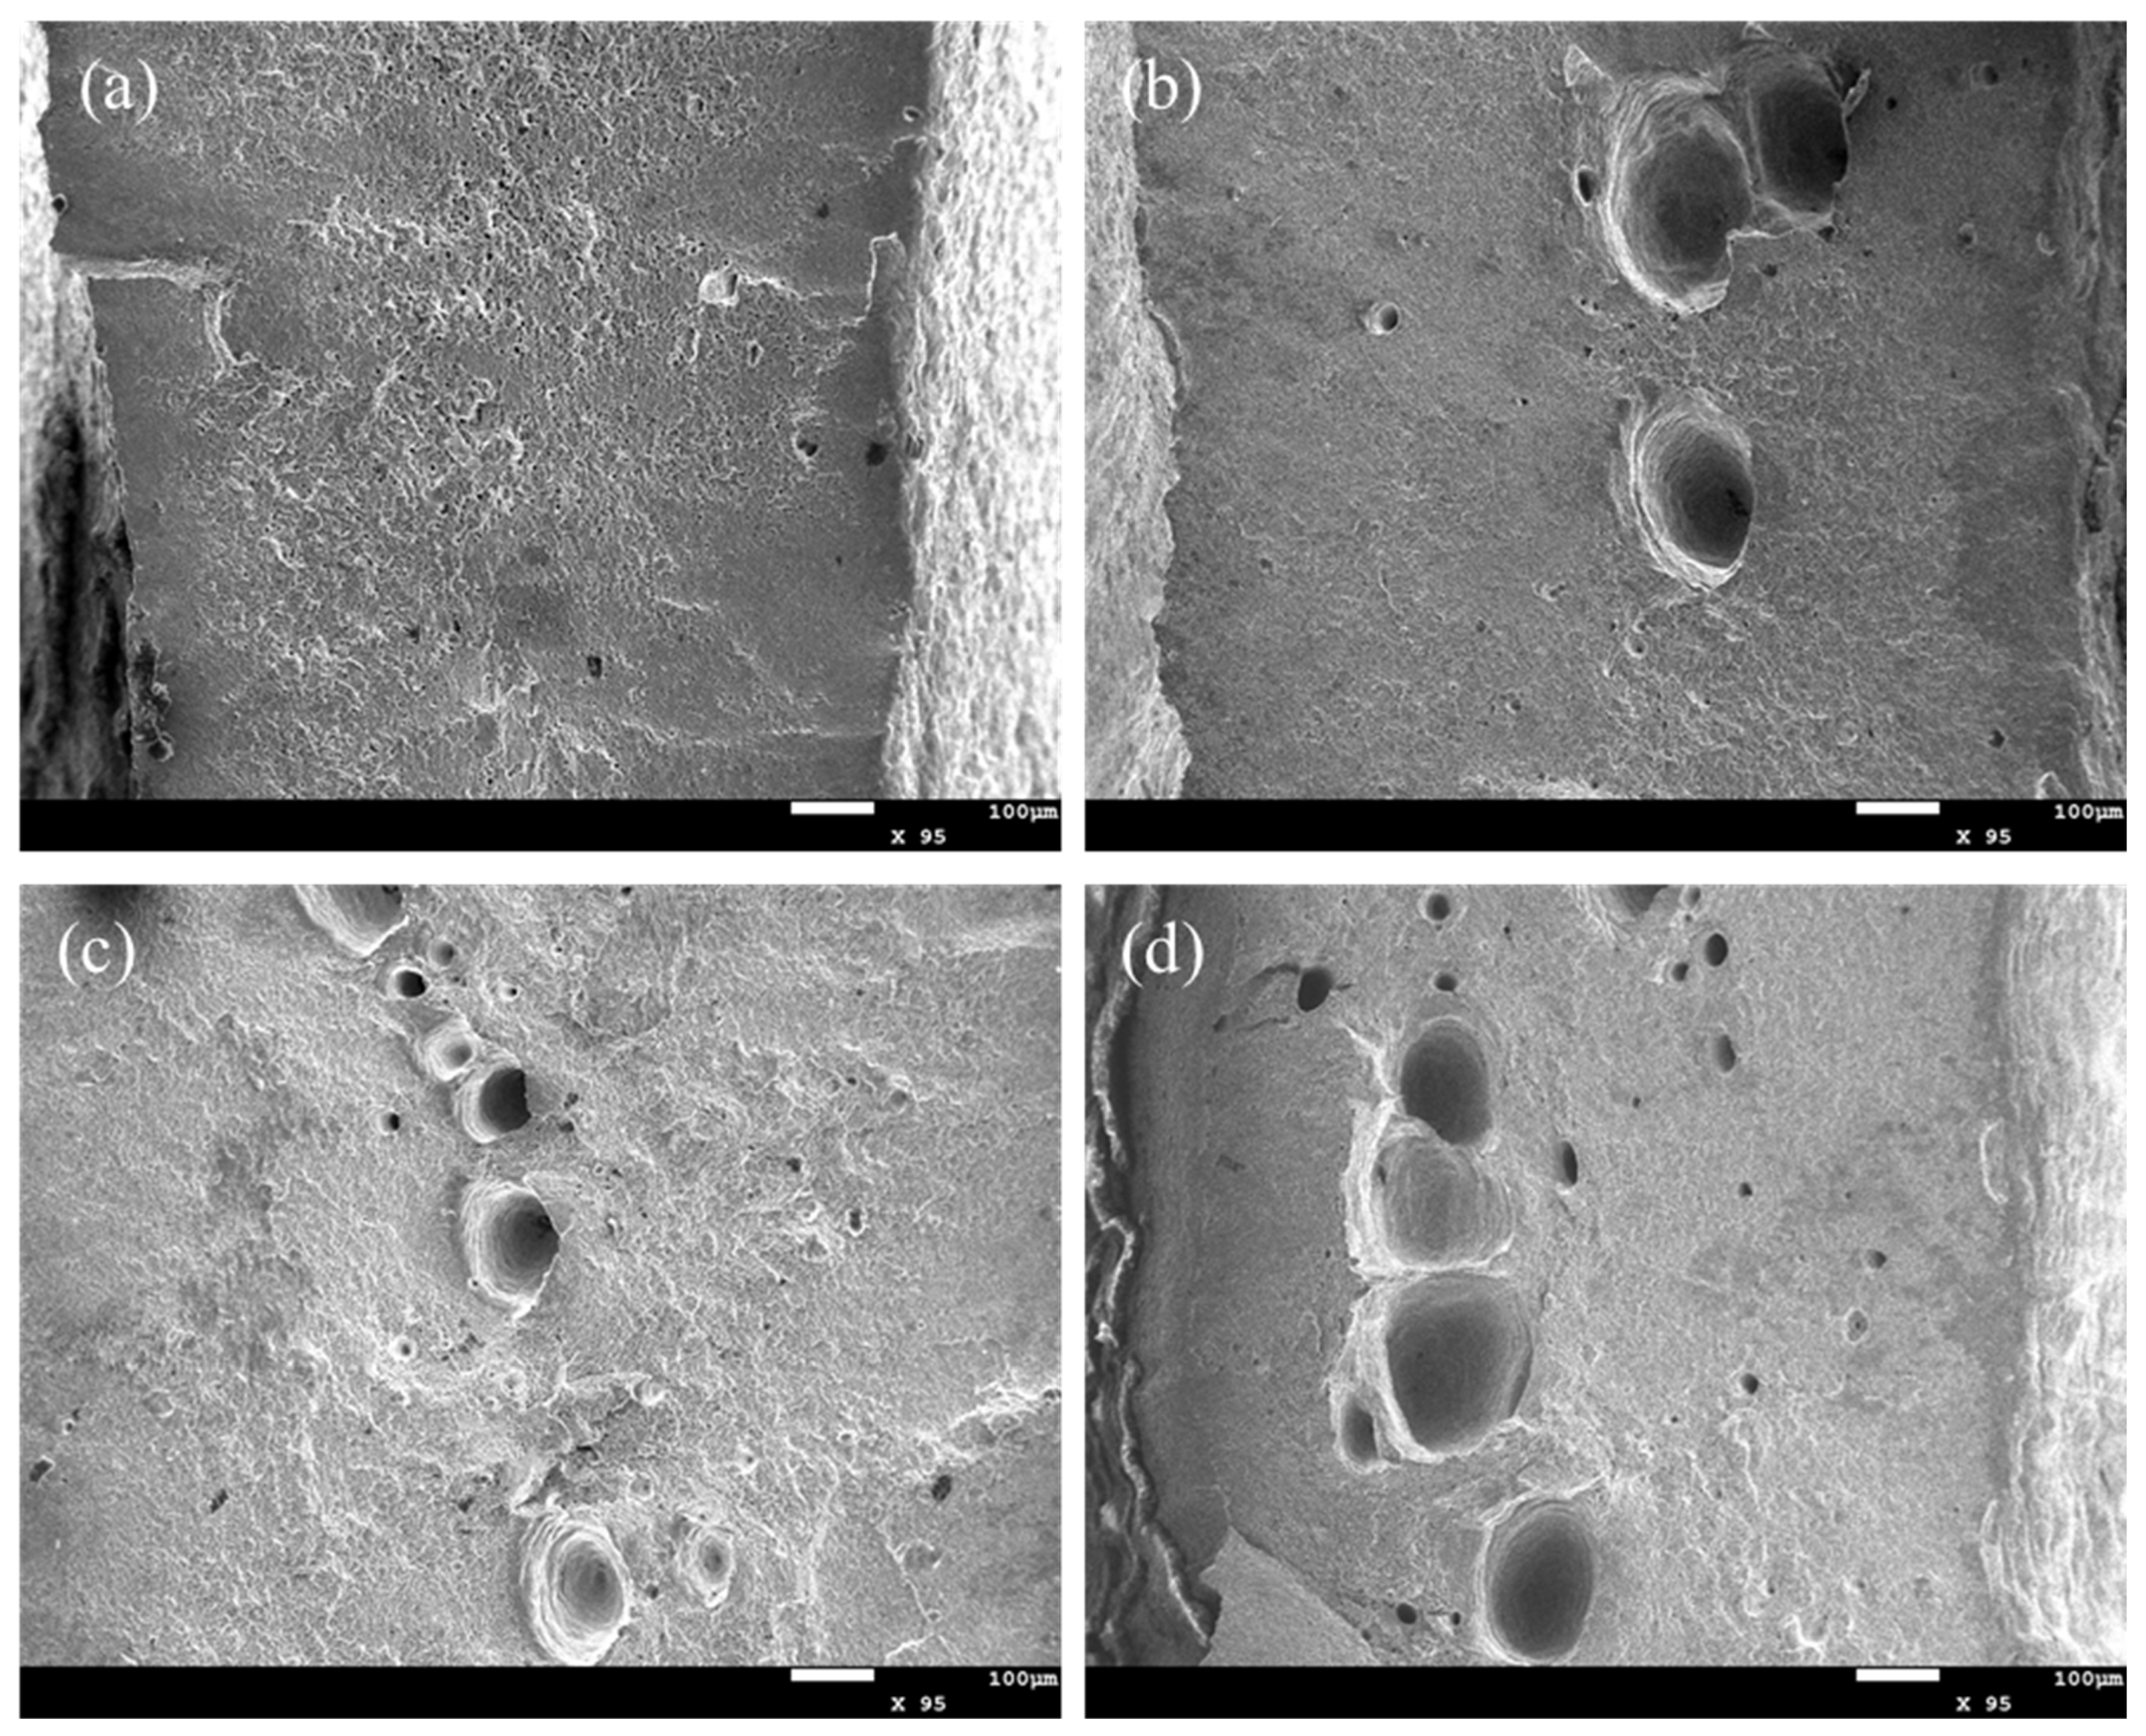
As shown in Figure 14, the fracture surfaces were examined by SEM after tensile testing to compare the fracture characteristics under different welding conditions. Dimple-like features associated with ductile fracture were observed in all conditions, while the size and distribution of pores on the fracture surfaces varied depending on the welding mode and faying surface condition. Because the LBW-A-M specimen fractured in the BM, pores observed on its fracture surface were not interpreted as weld porosity. In the specimens that fractured near the FZ–HAZ transition, relatively smooth pores may correspond to pre-existing weld pores.
Figure 14.
Representative SEM fractographs of tensile fracture surfaces of laser-welded 304 stainless steel specimens: (a) LBW-A-M, (b) LBW-A-S, (c) LBW-F-M, and (d) LBW-F-S. The fracture surfaces show ductile fracture features with pores of different sizes and distributions depending on the faying surface condition and filler-wire condition.
In the LBW-A-M and LBW-A-S specimens, fine pores were observed in some areas of the fracture surface; however, their size and frequency were relatively low compared with those in the filler-wire welding conditions. In contrast, in the LBW-F-M and LBW-F-S specimens, more pores were observed in the representative fractographs. This may reflect the combined effects of wire feeding and the different process and thermal conditions on weld-pool flow and gas-escape behavior.
The effect of the faying surface condition was also observed. Relatively large pores were found in the LBW-A-S and LBW-F-S specimens, which were prepared using sheared surfaces. The sheared surfaces had a more irregular surface morphology and larger surface steps and may have contained micro-cracks or irregular interface features. These initial faying surface irregularities could promote micro-gap formation and gas entrapment during welding, thereby affecting pore formation.
In particular, relatively large pores were distributed on the fracture surface of the LBW-F-S specimen. This can be interpreted as the combined effect of the irregular faying surface condition of the sheared edge and the change in weld pool behavior caused by filler metal feeding. These pores can act as local stress concentration sites under tensile loading and may reduce the effective load-bearing area, contributing to the decrease in elongation.
Therefore, the fracture surface observations are consistent with the cross-sectional defect observations and tensile test results. Under the selected filler-wire conditions, these defects were not completely suppressed. These results indicate that initial faying surface quality is an important factor affecting the fracture behavior of thin 304 stainless steel sheet with laser beam welded joints.
4. Conclusions
In this study, the effects of initial faying surface condition and filler-wire condition on the geometry, microstructure, hardness distribution, and tensile fracture behavior of laser-beam-welded joints in 2.0 mm-thick AISI 304 stainless steel sheet were analyzed. Because the autogenous and filler-wire welds were produced using different laser powers, travel speeds, net heat inputs, and wire-feeding conditions, the independent effect of filler-wire addition could not be separated from the effects of the associated process and thermal conditions. Therefore, the present results should be interpreted as comparisons between the selected, mode-specific welding conditions rather than as an isolated effect of filler-wire addition. The main conclusions are as follows.
(1) The machined surface exhibited a small surface step of approximately 3.8 μm and a continuous surface profile. In contrast, the sheared surface showed a larger step of approximately 10.1 μm and contained micro-cracks. These irregular features reduced the uniformity of the joint contact and increased the susceptibility to localized gap formation and defect formation during laser beam welding.
(2) The LBW-A-M condition provided the most favorable combination of weld geometry and tensile performance. It exhibited a top underfill of only 0.04 mm, negligible misalignment, and only a small number of internal discontinuities in the examined cross-section. The ultimate tensile strength and elongation were 742.36 MPa and 64.64%, corresponding to retentions of 98.9% and 91.1%, respectively, relative to BM-L. The strain remained broadly distributed throughout the gauge section, and fracture occurred in the base metal, demonstrating that a sound autogenous laser weld can be produced when the joint edges are flat and properly aligned.
(3) The LBW-A-S condition exhibited the greatest geometric and mechanical degradation. A top underfill of 0.24 mm, linear misalignment of 0.18 mm, and multiple internal pores were observed. The ultimate tensile strength and elongation decreased to 682.31 MPa and 44.04%, corresponding to retentions of 90.9% and 62.1%, respectively. These results indicate that irregularly sheared edges adversely affect weld geometry, internal integrity, and local load transfer.
(4) Under the selected filler-wire welding conditions, no measurable top underfill was observed, and the joint geometry was improved, particularly for the sheared-edge condition. However, multiple internal discontinuities, including locally grouped pores, remained in the examined cross-sections and fracture surfaces. The LBW-F-S condition showed slightly higher tensile strength and elongation than the LBW-A-S condition; however, this difference reflects the combined effects of wire feeding and the different process and thermal conditions and should not be attributed to filler-wire addition alone. Moreover, its mechanical performance did not recover to the level of LBW-A-M. These results indicate that, under the investigated parameter sets, the selected filler-wire welding condition did not fully compensate for inadequate joint-edge preparation. Therefore, joint-edge conditioning and fit-up control remain important, together with further optimization of wire-feeding and laser parameters. From an industrial perspective, these results indicate that the use of as-sheared edges can simplify joint preparation by avoiding additional edge machining, but adequate control of the resulting edge geometry and fit-up remains necessary to maintain weld integrity.
Author Contributions
Conceptualization, Y.H. and J.K.S.; methodology, Y.H., S.Y.L., S.H.K. and B.C.P.; investigation, Y.H., S.Y.L. and B.C.P.; formal analysis, Y.H., S.Y.L., S.H.K. and B.C.P.; resources, Y.H.; data curation, Y.H., S.Y.L., S.H.K. and B.C.P.; visualization, Y.H.; writing—original draft preparation, Y.H.; writing—review and editing, J.K.S.; supervision, J.K.S.; project administration, J.K.S. All authors have read and agreed to the published version of the manuscript.
Funding
This study was funded by the Fundamental R&D Program of the Korea Institute of Materials Science (KIMS) under Grant No. PNKB170. This study was also supported by the Nuclear Power Plant Decommissioning Competitiveness Enhancement Technology Development Project (RS-2023-00234190) funded by the Ministry of Trade, Industry & Energy (MOTIE, Sejong, Republic of Korea).
Data Availability Statement
The data presented in this study are available from the corresponding author upon reasonable request. The data are not publicly available because the complete raw datasets form part of an ongoing research project and include additional unpublished results that are currently being analyzed for subsequent studies.
Conflicts of Interest
The authors declare no conflicts of interest.
References
- Lo, K.H.; Shek, C.H.; Lai, J.K.L. Recent developments in stainless steels. Mater. Sci. Eng. R Rep. 2009, 65, 39–104. [Google Scholar] [CrossRef] [Scilit]
- Davis, J.R. (Ed.) ASM Specialty Handbook: Stainless Steels; ASM International: Materials Park, OH, USA, 1994. [Google Scholar]
- Lippold, J.C.; Kotecki, D.J. Welding Metallurgy and Weldability of Stainless Steels; John Wiley & Sons: Hoboken, NJ, USA, 2005. [Google Scholar]
- Kou, S. Welding Metallurgy, 2nd ed.; John Wiley & Sons: Hoboken, NJ, USA, 2003. [Google Scholar]
- Lancaster, J.F. Metallurgy of Welding, 6th ed.; Woodhead Publishing: Cambridge, UK, 1999. [Google Scholar]
- Steen, W.M.; Mazumder, J. Laser Material Processing, 4th ed.; Springer: London, UK, 2010. [Google Scholar] [CrossRef] [Scilit]
- Katayama, S. (Ed.) Handbook of Laser Welding Technologies; Woodhead Publishing: Cambridge, UK, 2013. [Google Scholar]
- Dawes, C. Laser Welding: A Practical Guide; Abington Publishing: Cambridge, UK, 1992. [Google Scholar]
- Lee, J.Y.; Ko, S.H.; Farson, D.F.; Yoo, C.D. Mechanism of keyhole formation and stability in stationary laser welding. J. Phys. D Appl. Phys. 2002, 35, 1570–1576. [Google Scholar] [CrossRef] [Scilit]
- Matsunawa, A.; Kim, J.D.; Seto, N.; Mizutani, M.; Katayama, S. Dynamics of keyhole and molten pool in laser welding. J. Laser Appl. 1998, 10, 247–254. [Google Scholar] [CrossRef] [Scilit]
- Ribic, B.; Palmer, T.A.; DebRoy, T. Problems and issues in laser–arc hybrid welding. Int. Mater. Rev. 2009, 54, 223–244. [Google Scholar] [CrossRef] [Scilit]
- Assuncao, E.; Williams, S.; Yapp, D. Interaction time and beam diameter effects on the conduction mode limit. Opt. Lasers Eng. 2012, 50, 823–828. [Google Scholar] [CrossRef] [Scilit]
- Mi, Y.; Sikström, F.; Nilsen, M.; Choquet, I.; Ancona, A. Adaptive laser beam shaping with a deformable mirror for gap bridging in autogenous butt joint welding. J. Manuf. Process. 2025, 152, 762–774. [Google Scholar] [CrossRef] [Scilit]
- Levy, B.S.; Van Tyne, C.J. Review of the shearing process for sheet steels and its effect on sheared-edge stretching. J. Mater. Eng. Perform. 2012, 21, 1205–1213. [Google Scholar] [CrossRef] [Scilit]
- Tekiner, Z.; Nalbant, M.; Gürün, H. An experimental study for the effect of different clearances on burr, smooth-sheared and blanking force on aluminium sheet metal. Mater. Des. 2006, 27, 1134–1138. [Google Scholar] [CrossRef] [Scilit]
- Hambli, R. Design of experiment based analysis for sheet metal blanking processes optimisation. Int. J. Adv. Manuf. Technol. 2002, 19, 403–410. [Google Scholar] [CrossRef] [Scilit]
- Kaplan, A.F.H. A model of deep penetration laser welding based on calculation of the keyhole profile. J. Phys. D Appl. Phys. 1994, 27, 1805–1814. [Google Scholar] [CrossRef] [Scilit]
- Fabbro, R. Melt pool and keyhole behaviour analysis for deep penetration laser welding. J. Phys. D Appl. Phys. 2010, 43, 445501. [Google Scholar] [CrossRef] [Scilit]
- Haupt, W.; Borges, L.G.; Israel, C.L.; Riffel, K.C. Effects of laser welding on the mechanical properties and microstructure of AISI 304 stainless steel. Lasers Manuf. Mater. Process. 2024, 11, 887–904. [Google Scholar] [CrossRef] [Scilit]
- Tilton, T.; Delenin, L.; Getto, E.; Swenson, M.J. Laser welding effects on microstructure and mechanical properties in AISI 304 stainless steel. Metall. Mater. Trans. A 2025, 56, 4068–4081. [Google Scholar] [CrossRef] [Scilit]
- Lescur, A.; Stergar, E.; Lim, J.; Hertelé, S.; Petrov, R.H. Investigation of the dynamic strain aging effect in austenitic weld metals by 3D-DIC. Metals 2023, 13, 311. [Google Scholar] [CrossRef] [Scilit]
- Jin, H.; Madison, J.D.; Foulk, J.W.; Nelson, K.; Murawski, S.G. Characterization of 304L laser welds using digital image correlation and X-ray computed tomography. Meas. Sci. Technol. 2021, 32, 104010. [Google Scholar] [CrossRef] [Scilit]
- ISO 13919-1:2019; Electron and Laser-Beam Welded Joints—Requirements and Recommendations on Quality Levels for Imperfections—Part 1: Steel, Nickel, Titanium and Their Alloys. International Organization for Standardization: Geneva, Switzerland, 2019.
- Kamaya, M. Assessment of local deformation using electron backscatter diffraction: Quantification of accuracy of measurement and definition of local gradient. Ultramicroscopy 2011, 111, 1189–1199. [Google Scholar] [CrossRef] [Scilit] [PubMed]
- ASTM E8/E8M-25; Standard Test Methods for Tension Testing of Metallic Materials. ASTM International: West Conshohocken, PA, USA, 2025. [CrossRef] [Scilit]
- Pan, B.; Qian, K.; Xie, H.; Asundi, A. Two-dimensional digital image correlation for in-plane displacement and strain measurement: A review. Meas. Sci. Technol. 2009, 20, 062001. [Google Scholar] [CrossRef] [Scilit]
- Hild, F.; Roux, S. Digital image correlation: From displacement measurement to identification of elastic properties—A review. Strain 2006, 42, 69–80. [Google Scholar] [CrossRef] [Scilit]

Disclaimer/Publisher’s Note: The statements, opinions and data contained in all publications are solely those of the individual author(s) and contributor(s) and not of MDPI and/or the editor(s). MDPI and/or the editor(s) disclaim responsibility for any injury to people or property resulting from any ideas, methods, instructions or products referred to in the content. |
© 2026 by the authors. Licensee MDPI, Basel, Switzerland. This article is an open access article distributed under the terms and conditions of the Creative Commons Attribution (CC BY) license.