


Abstract
This study presents a traceable global–local finite element (FE) framework for assessing stern-boss structural integrity under operationally derived loading. Two production-scale MSC Nastran models—a shell-dominant model and an otherwise equivalent global model with a locally solid stern-boss region—were compared under five vessel-specific states generated from trim-and-stability weight, buoyancy, hydrostatic, ballast, and machinery-load distributions. Baseline-to-fine mesh changes were limited to 0.68% for the shell model and 1.07% for the solid model. Both models reproduced the same global deformation mode, while the solid model predicted 5.9–6.3% greater maximum vertical deflection. Within a common stern-boss assessment region, the shell and solid peak von Mises stresses were 42.1–70.9 MPa and 41.5–72.4 MPa, respectively, with differences confined to −1.4% to +2.3%. By contrast, stresses extracted at the stern-tube interface were 17.2–26.8 MPa in the shell model and 29.7–46.6 MPa in the solid model, demonstrating the importance of three-dimensional constraint, transverse shear, and through-thickness response at the local interface. The governing design-draught/APT-full condition produced a solid-model deflection of 46.8 mm and a regional stress of 72.4 MPa. Its nominal SS400 yield-utilization ratio was 0.308, whereas the LR rule-based inverse safety-factor index ranged from 1.3 to 2.1 and identified surrounding panel buckling as the more restrictive limit state. The shell model reduced wall-clock time by 38.6% and is therefore appropriate for global screening, while the solid representation is required for interface-level assessment. The framework constitutes a numerically verified, digital-twin-compatible baseline; independent validation against measured structural or shaft-line data remains necessary.
1. Introduction
The structural integrity of stern arrangements is governed by the interaction among hull-girder deformation, local stiffness of the stern frame and bossing, and the propulsion-shaft support system. The stern boss is particularly important because it transfers bearing and shaft-system actions into a geometrically discontinuous aft-hull region. Excessive local deformation or stress can alter bearing alignment, reduce shafting margins, and accelerate fatigue damage. Accordingly, a credible assessment must reproduce both the vessel-scale deformation field and the three-dimensional response at the stern-boss–stern-tube interface.
Finite element analysis is routinely used for ship structural assessment because hydrostatic loading, cargo and ballast distributions, global bending, and structural discontinuities cannot be represented adequately by elementary beam calculations alone. Previous studies have addressed hydrodynamic stability and load generation [1], ship-hull FE analysis under combined operational loads [2], and rule-constrained structural optimization of cargo ships [3]. Classical studies and design texts have also established the governing mechanisms of hull-girder strength, buckling, and progressive collapse [4,5]. Recent global–local approaches seek to retain vessel-scale efficiency while recovering local response. Cai and Jelovica [6], for example, coupled an Equivalent Single Layer (ESL) global representation with a Hierarchical Graph Transformer (HGT) surrogate for local stress prediction. Population-based structural-health-monitoring methods have further shown how numerical models can be embedded in uncertainty-aware inference frameworks [7]. These developments demonstrate the value of hierarchical modeling, but they do not directly resolve how stern-boss idealization affects the transfer of realistic operational loads.
The aft-hull deformation field is also a principal input to elastic shaft alignment. Variable-mass and global-deformation effects have been examined for special-purpose vessels [8], while Murawski [9], Shi et al. [10], and Lee et al. [11] demonstrated that hull flexibility and stern-tube bearing representation materially influence shaft-alignment predictions. More recently, Du et al. [12] combined finite element simulations with a fine-tuned pre-trained model to improve the alignment of propulsion systems equipped with a single stern-tube bearing, whereas Lee and Kim [13] quantified the redistribution of bearing reactions caused by hull deformation over six tanker loading conditions and optimized the bearing offsets accordingly. These studies confirm that operationally dependent hull deformation must be propagated into shaft-line assessment; however, their principal outputs are alignment parameters and bearing reactions rather than a controlled shell-versus-solid evaluation of the hull-side stern-boss structure. Bureau Veritas (BV) Rule Note NR592 [14] accordingly requires a refined aft-hull model and recommends solid-element representation of cast bossing and stern-tube bush steelwork.
Despite this established background, three gaps remain relevant to design practice. First, the stern boss has received less explicit attention than midship hull-girder sections, cargo holds, or isolated stiffened panels. Second, published comparisons usually adopt either a shell or a solid idealization without quantifying the model-form effect under the same vessel-specific load set. Third, many numerical studies refer to “realistic” loading without documenting the transfer from trim-and-stability (T&S) data to nodal forces, pressures, and constraints. The present work addresses these gaps through four engineering contributions. It (i) maps vessel-specific T&S data for five operational states into a common global FE model; (ii) compares shell-dominant and locally solid representations of the stern boss while preserving the same global geometry and load path; (iii) provides mesh-convergence, boundary-condition sensitivity, equilibrium, stress, utilization, and computational-cost evidence; and (iv) separates numerical verification from physical validation so that the evidential status of the results is unambiguous.
The novelty therefore does not reside in the existence of shell or solid elements. It resides in the controlled, like-for-like quantification of their engineering consequences for a critical shaft–hull interface under operationally derived loading. The study further evaluates when the shell model is adequate for global deformation compatibility and when a solid submodel is required to recover through-thickness and shear-dominated local response. The analysis is linear elastic and static. It does not constitute a complete digital twin, nor does agreement between two FE formulations constitute experimental validation. Instead, the resulting model is described as a digital-twin-compatible numerical baseline that can subsequently be calibrated using strain, displacement, bearing-load, or sea-trial measurements. Section 2 defines the numerical model, mesh, material assumptions, and constraints; Section 3 presents loading, deformation, stress, computational cost, and verification results; and Section 4 summarizes the supported conclusions and remaining limitations. A controlled comparison is essential because identical global deformation trends can coexist with materially different local stress states. Shell kinematics efficiently reproduce membrane and bending action in thin-walled hull plating, whereas three-dimensional continuum elements can recover transverse normal stress, local shear transfer, sectional warping, and stiffness gradients at cast or thickened interfaces. These effects are directly relevant to the stern boss even when the global deflection difference is modest.
Accordingly, the acceptance of the shell model is evaluated only for global deformation compatibility and preliminary load-path assessment; it is not presented as a substitute for the solid model when peak interface stresses or through-thickness response govern. This distinction aligns the numerical evidence with the intended engineering decision. The resulting framework is intended for reproducible design-stage assessment: each operational load case is traceable to T&S data, each numerical conclusion is supported by a mesh-independent response quantity, and the absence of independent full-scale measurements is reported as a limitation rather than obscured by model-to-model agreement.
2. Shaft Alignment Context and Numerical Methodology
This section establishes the shaft-alignment context and the numerical methodology used to assess the stern boss. elastic shaft alignment (ESA) couples the stiffness and deformation of the aft hull with the bearing-supported shaft line. The present study does not solve the complete elasto-hydrodynamic bearing problem; rather, it evaluates the hull-side structural component that supplies bearing-support displacement and local interface stiffness to such an analysis. The model architecture follows the aft-hull refinement philosophy of BV NR592 [14] while introducing a controlled comparison between shell and solid stern-boss idealizations.
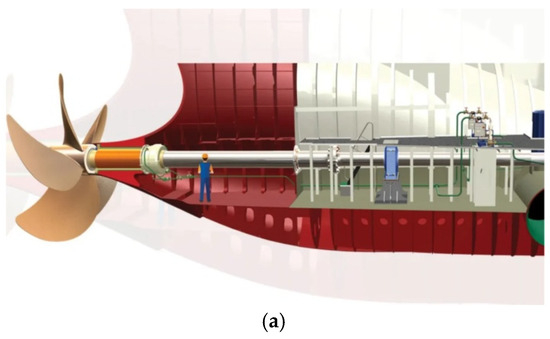
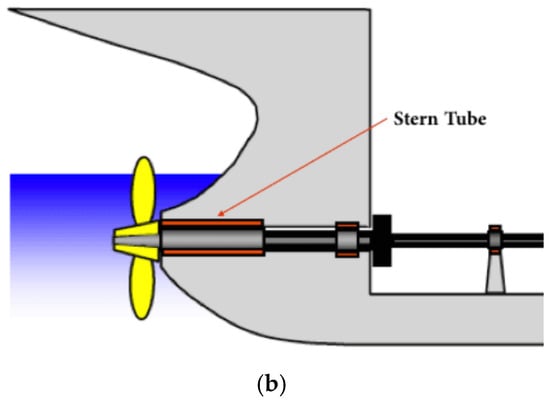
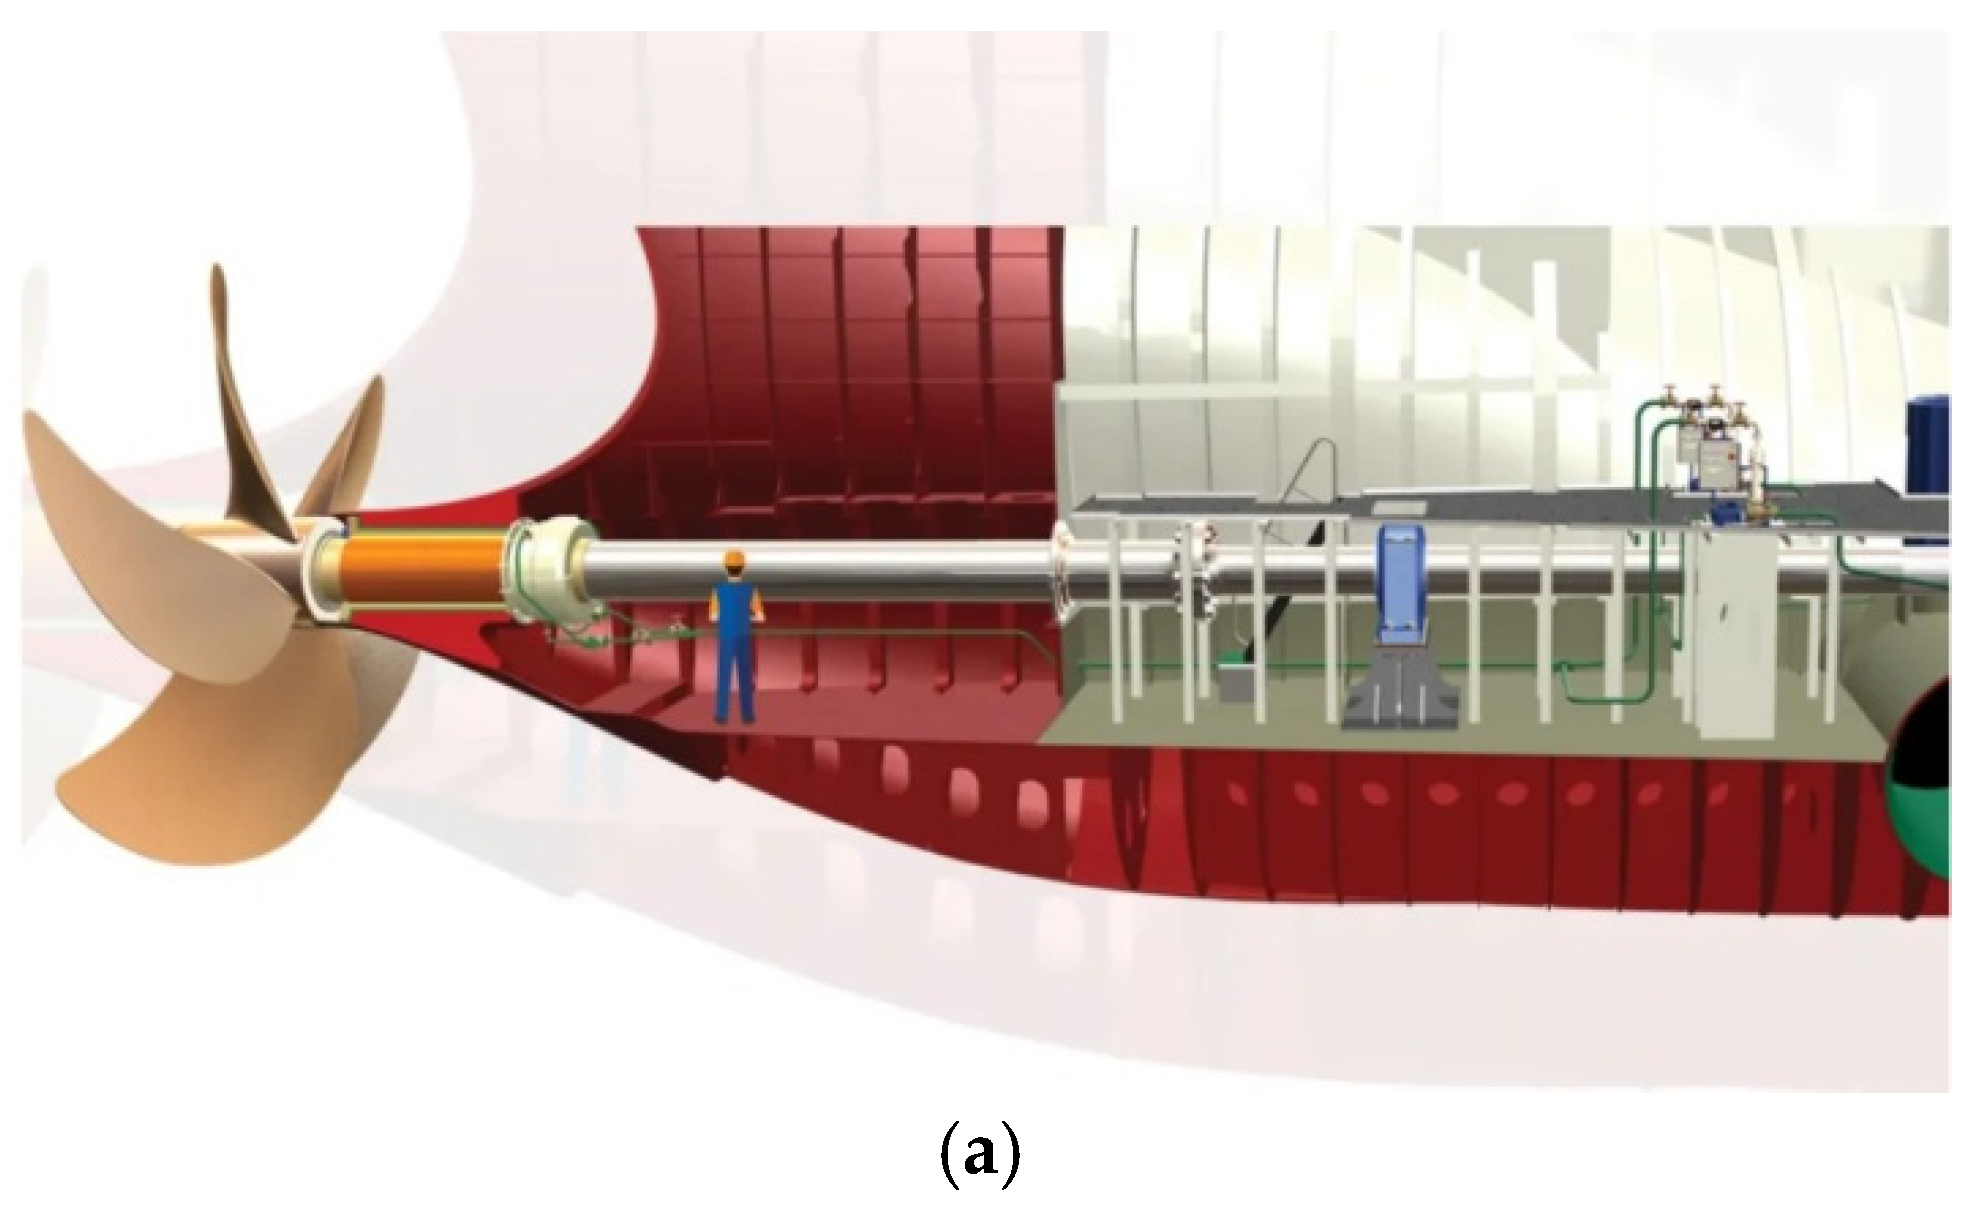
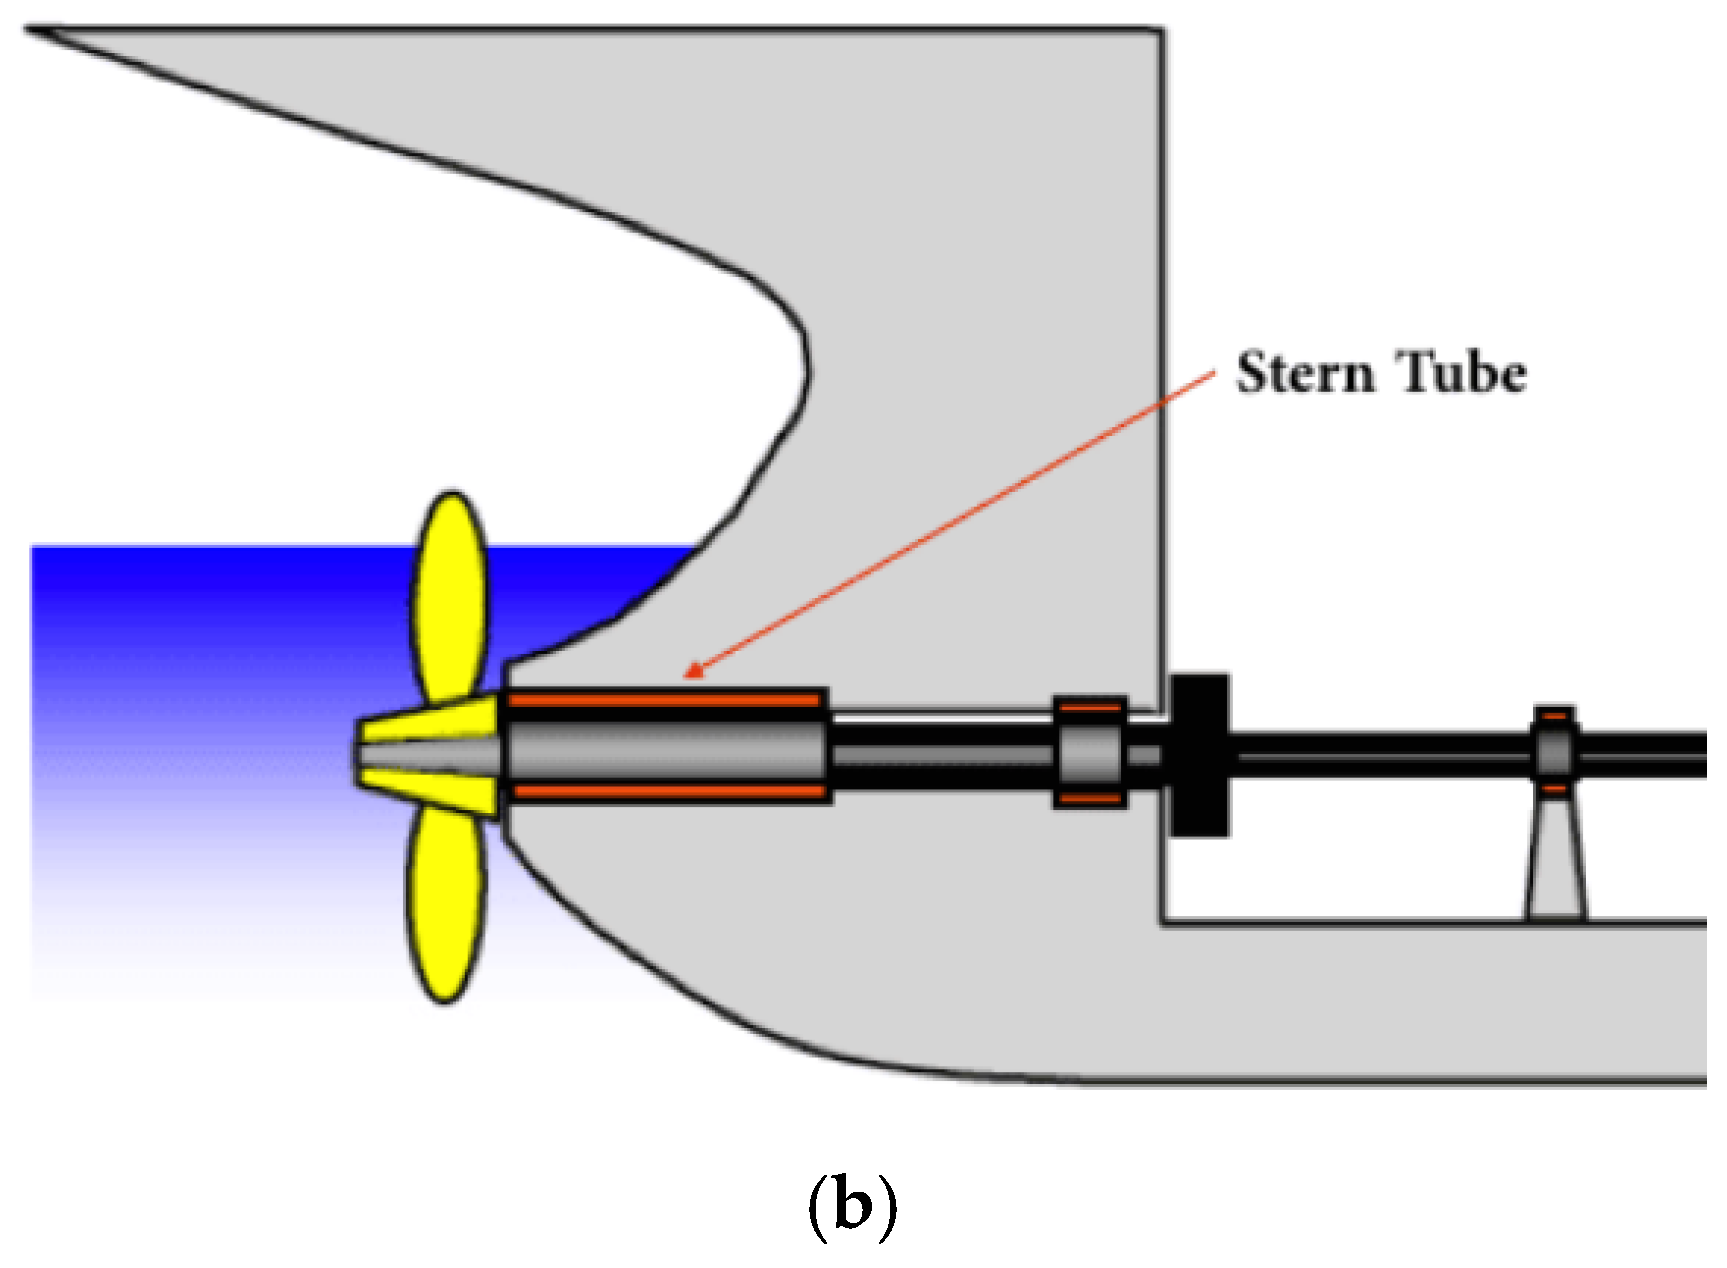
Figure 1 identifies the stern tube within the propulsion arrangement. The assembly supports the propeller shaft through forward and aft bearings, transfers radial and thrust-related actions into the stern structure, and maintains a watertight boundary through its sealing system. Its structural performance therefore depends not only on the shaft-line components but also on the compliance of the stern boss, adjacent plating, floors, girders, and engine-room structure.
Figure 1.
Stern tube components and functions in the engine room: (a) stern system arrangement (https://inspenet.com; accessed on 18 June 2026); (b) stern tube.
BV NR592 [14] treats the stern-tube bearing as part of a coupled shaft–hull system. The rule note requires an aft-hull FE model extending to the forward engine-room bulkhead, adequate refinement with respect to secondary stiffener spacing, and detailed representation of the cast bossing and forward stern-tube bush steelwork. Hull deformations obtained for representative loading states are then transferred to the shaft-alignment model as support offsets or flexibility information. For the aft bush bearing, distributed support points are required to resolve the bearing-reaction profile rather than reducing the bearing to a single point. In the hull model, this requirement motivates an explicit stern-tube interface and a mechanically compatible load-transfer connection. In the present models, rigid-body element type 2 (RBE2) connections and multi-point constraints (MPCs) are used only to distribute interface actions and impose the defined support conditions; their locations and sensitivity are documented below.
The present paper is limited to the structural response of the hull-side bossing. Bearing contact pressure, oil-film thickness, thermal distortion, shaft rotation, and propeller-induced dynamic loading are outside the current scope. This boundary is important: the calculated hull displacement and local stiffness are necessary inputs to ESA, but they are not by themselves a complete shaft-alignment acceptance assessment.
2.1. Finite Element Model Architecture
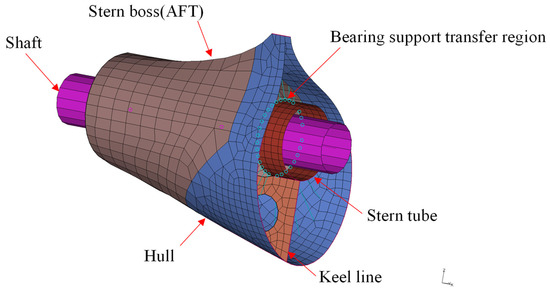
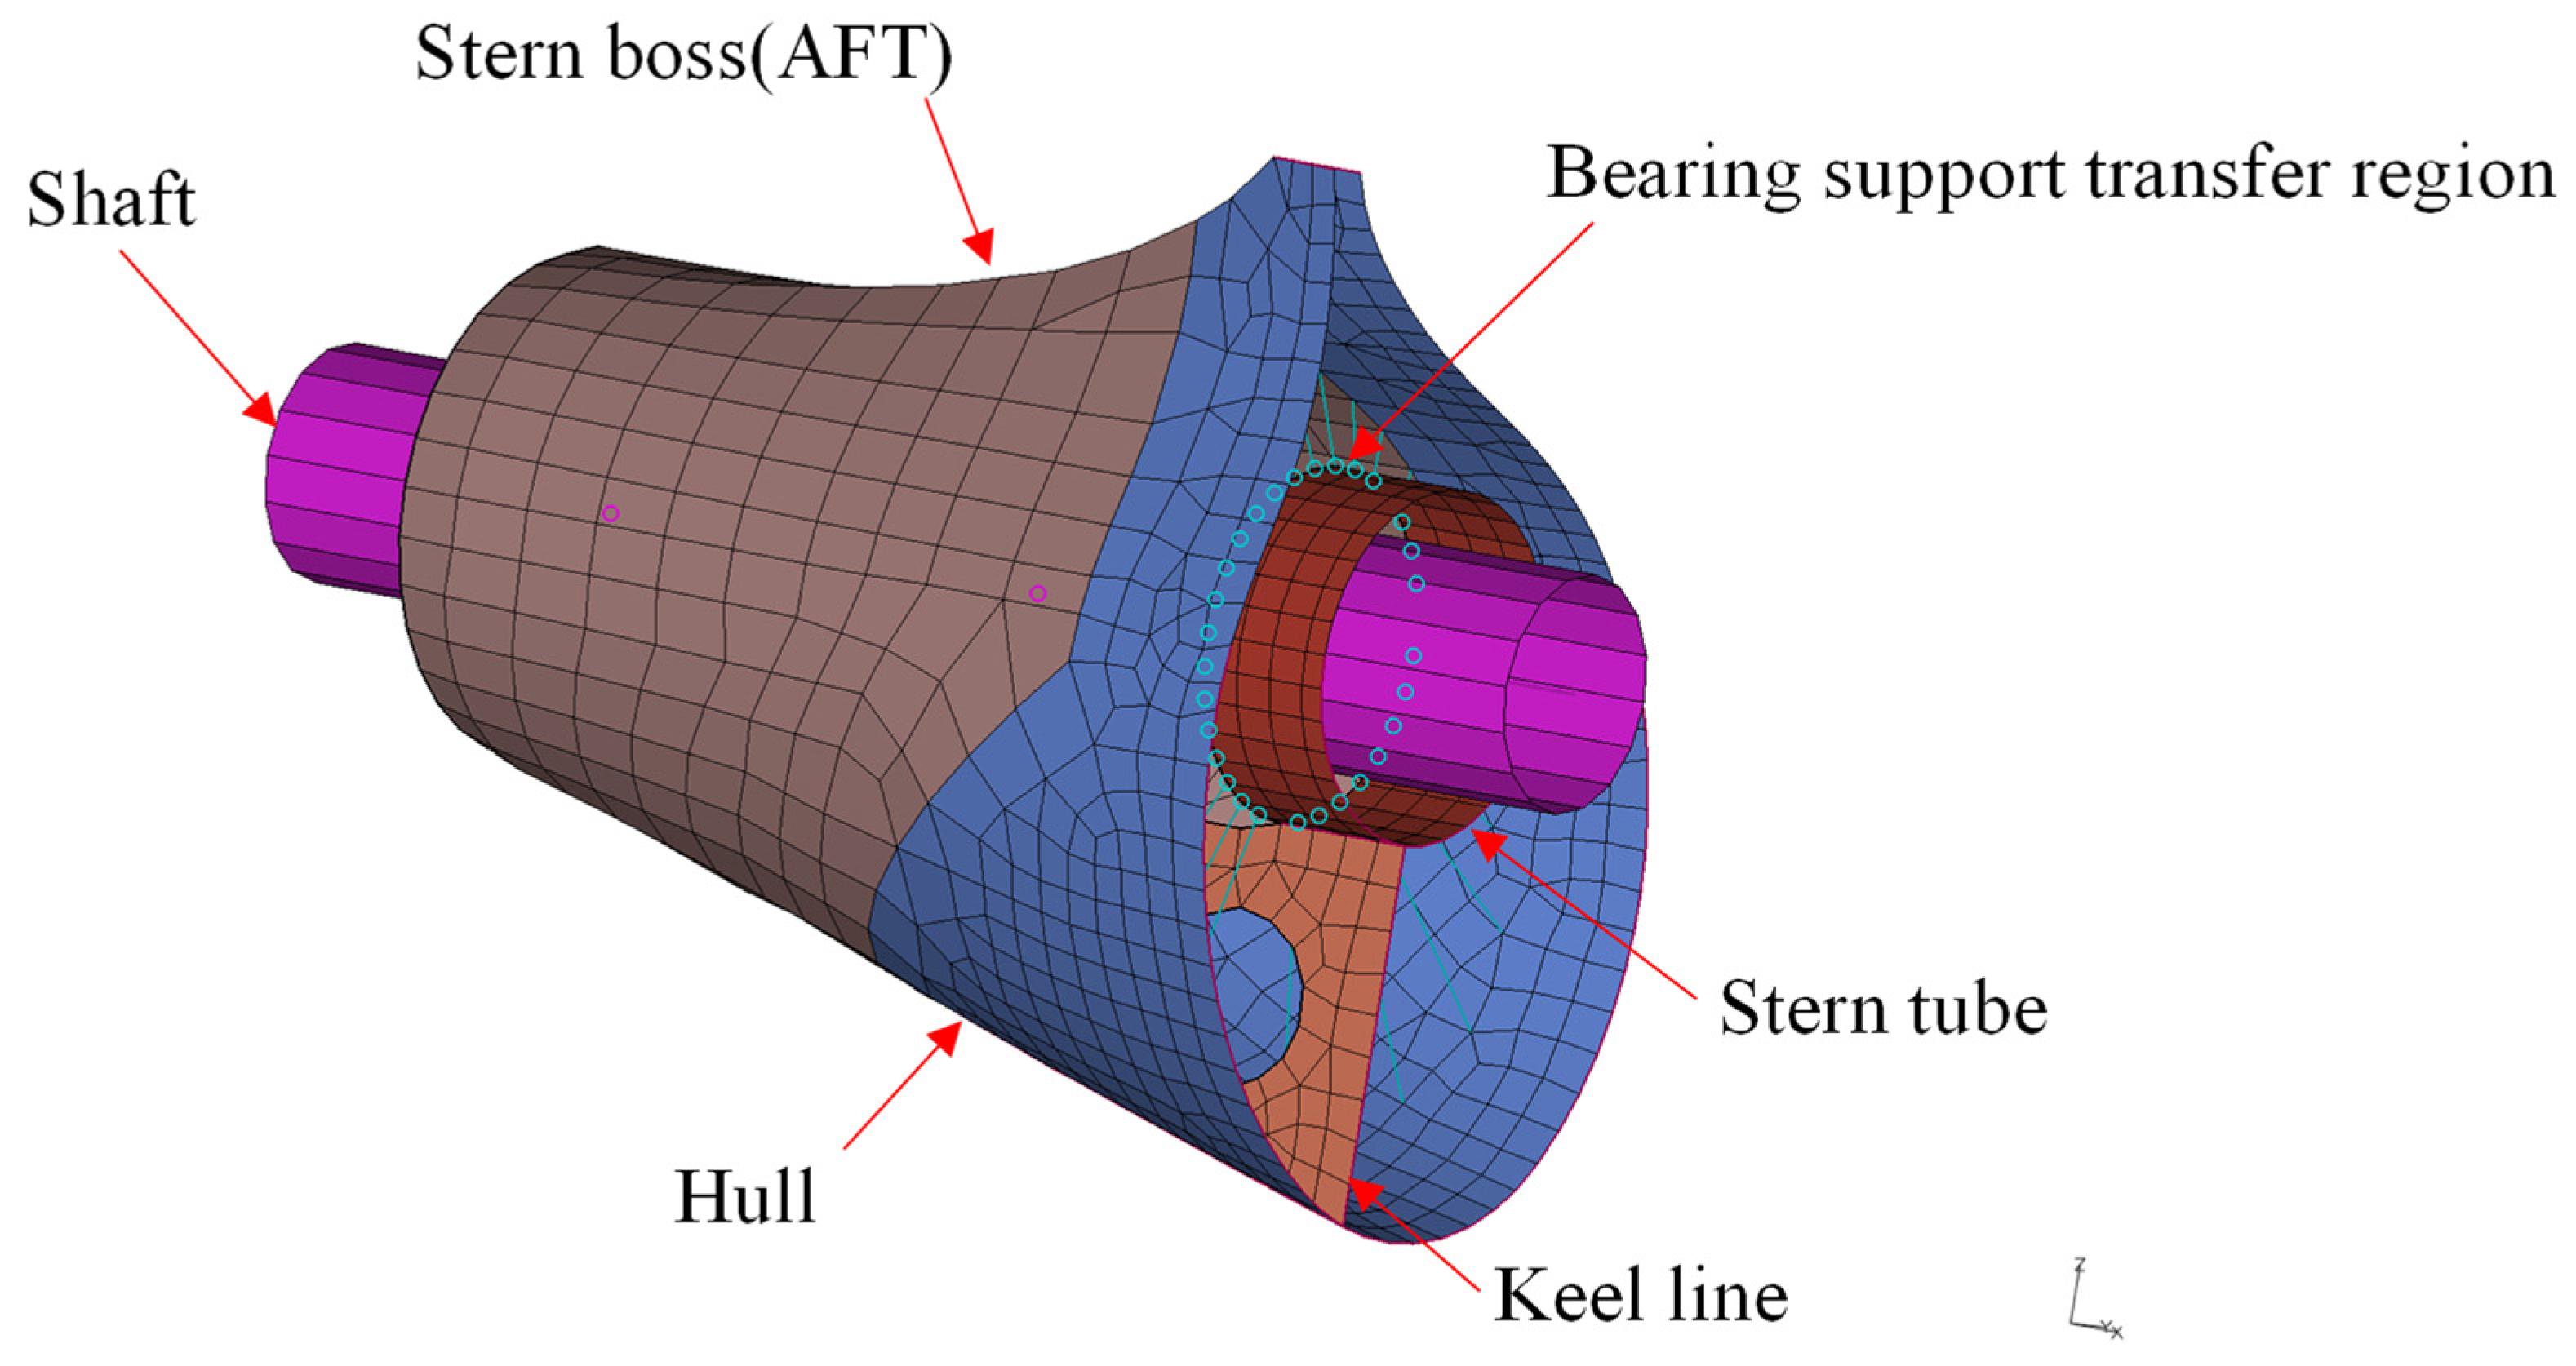
Two FE models were generated from the same production-scale aft-hull geometry. In the shell-dominant model, the stern boss is represented by shell elements positioned at the structural mid-surface. In the solid-region model, the stern boss and stern-tube interface are represented by three-dimensional continuum elements, while the remainder of the hull retains the same shell-and-beam idealization. The models therefore differ locally rather than constituting unrelated global meshes. The shell-dominant model contains 290,604 nodes, 251,510 beam elements, 3,260,875 shell elements, and 763 solid elements used only for isolated geometric features outside the stern-boss idealization. The solid-region model contains 292,894 nodes, 251,510 beam elements, 3,254,492 shell elements, and 230 solid elements concentrated in the stern boss and stern-tube interface. The distinction is consequently defined by the location and mechanical role of the solid elements, not by their total count.
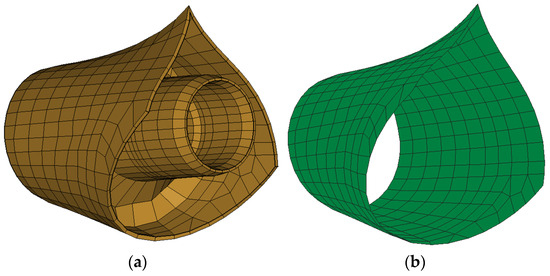
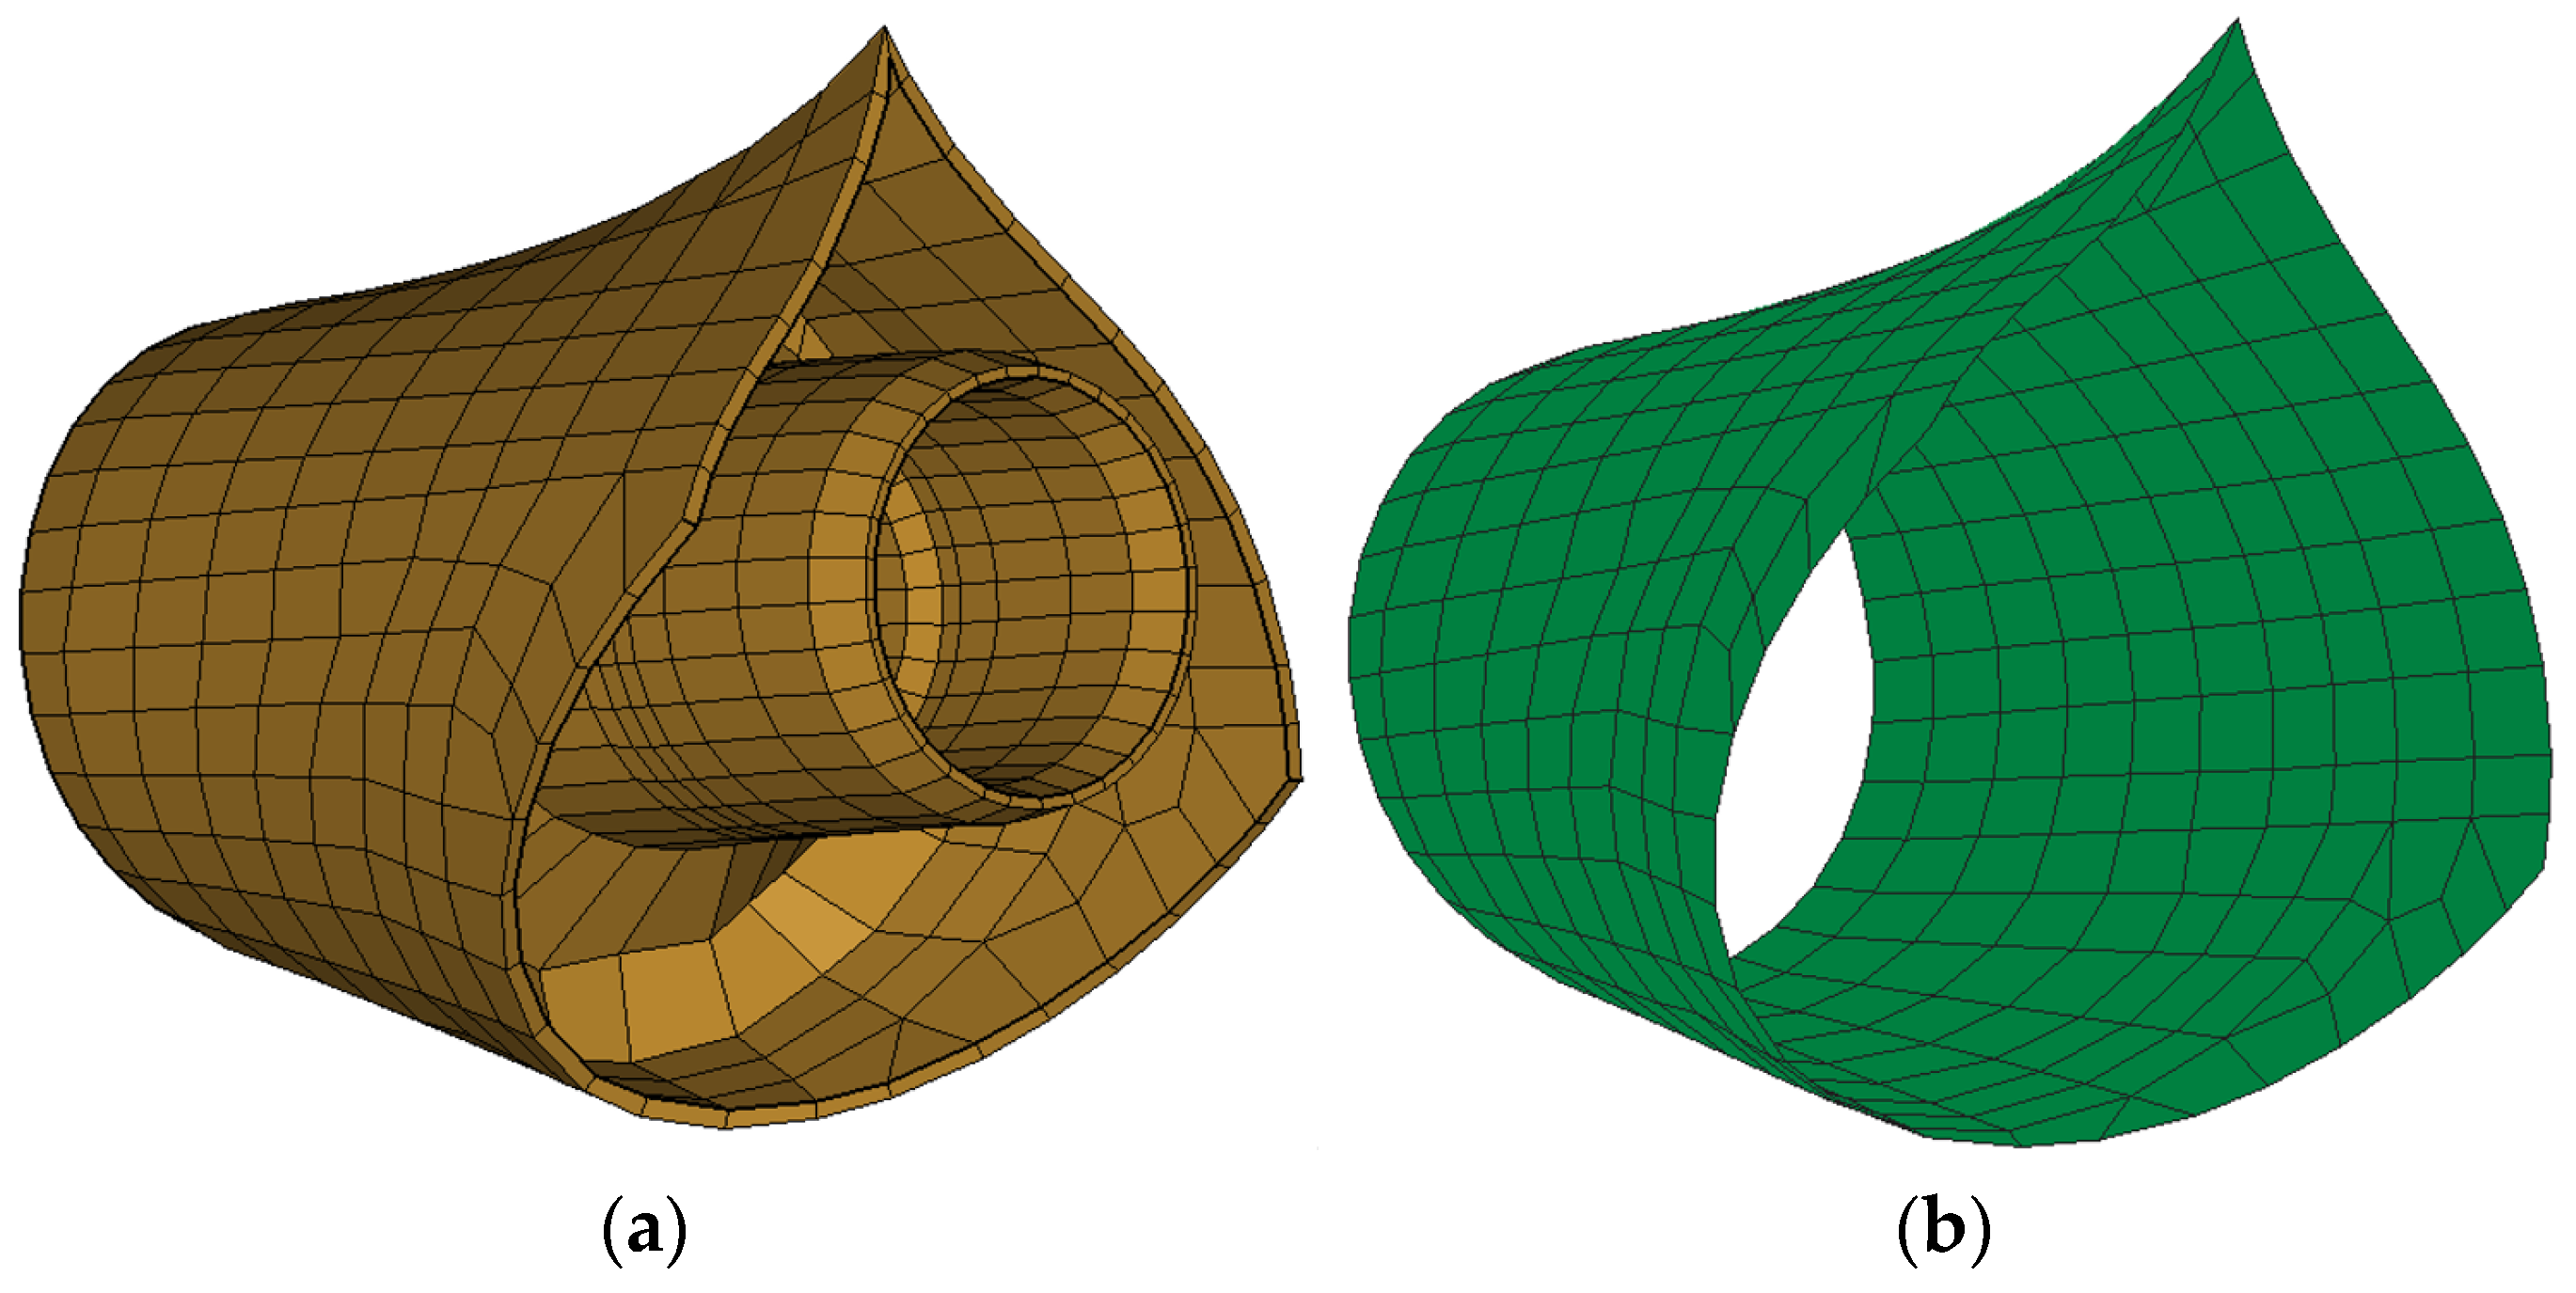
Figure 2 compares the local idealizations. The solid-region model retains the volume, curvature, and thickness of the bossing and allows three-dimensional stress transfer into the stern tube. The shell-dominant model replaces the bossing by mid-surface elements with assigned thickness, providing a less expensive representation for global deformation and load-path studies. The interface reference point and surrounding hull connectivity are kept consistent so that differences can be attributed primarily to element kinematics and local stiffness representation.
Figure 2.
Stern-boss modeling: (a) Solid modeling; (b) Shell modeling.
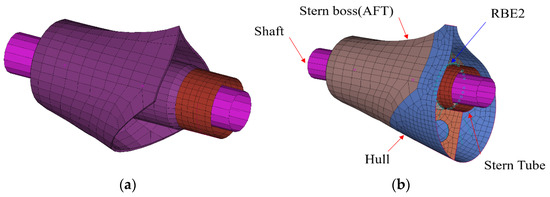
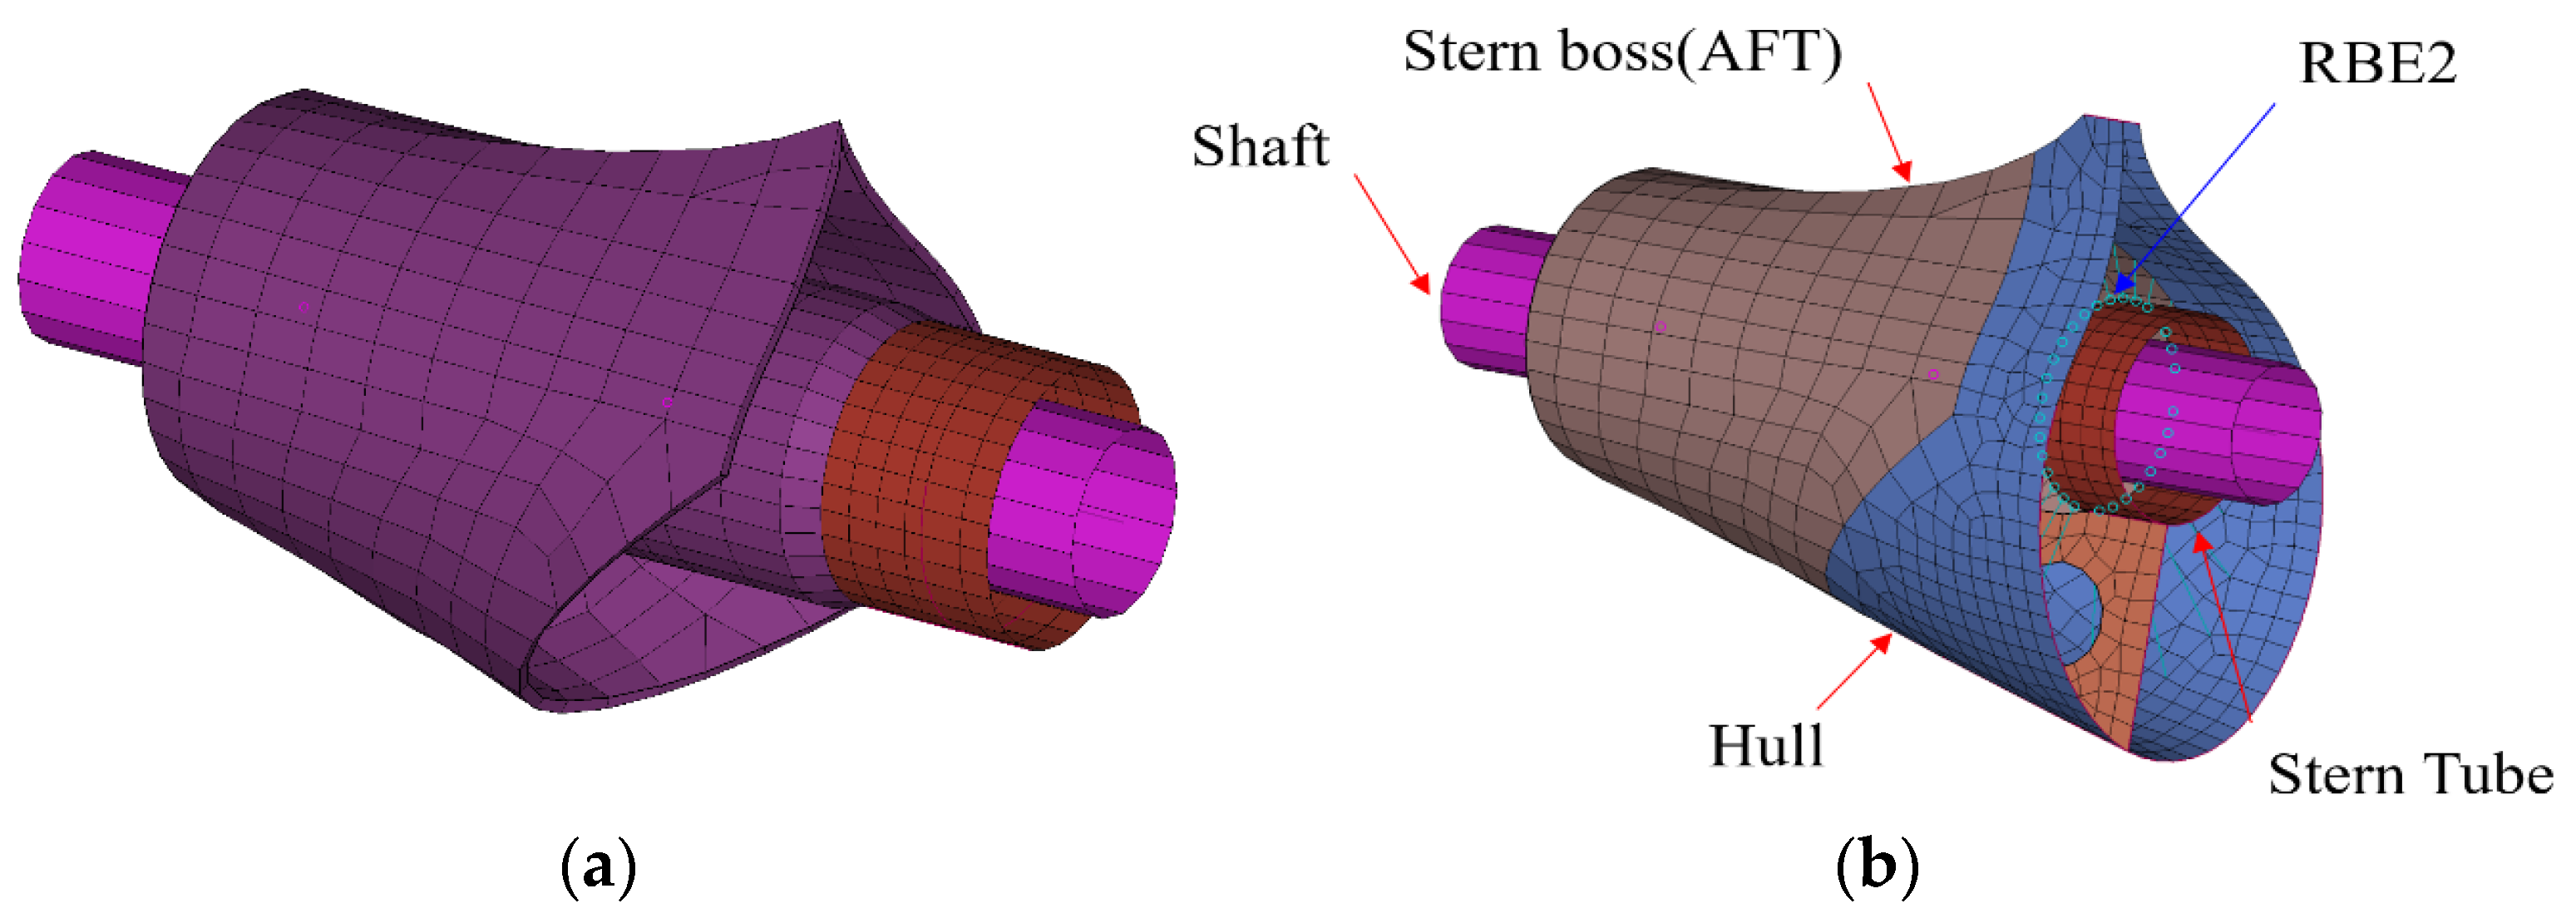
Figure 3 shows the integration of the local stern-boss representation with the global hull model. Shell elements reproduce plating and primary structural surfaces, beam elements represent longitudinal and transverse stiffeners, and RBE2 elements distribute the stern-tube interface actions without introducing an additional flexible component. The solid–shell transition is positioned away from the principal interface stress concentration and is graded to avoid an abrupt change in numerical stiffness. Detailed information is shown in Table 1.
Figure 3.
Detailed FE-modeling using both shell and solid elements: (a) Solid modeling; (b) Shell modeling.
Table 1.
Composition of the two global–local finite element models.
2.1.1. Element Formulations, Mesh Resolution, and Solver
All load cases were solved with MSC Nastran 2022 using the SOL 101 linear-static solution sequence. Four-node CQUAD4 elements were used in regular shell regions, CTRIA3 elements were used only where geometric closure required triangular topology, CHEXA eight-node elements represented the solid stern-boss and stern-tube interface, CBEAM elements represented stiffeners and framing, and RBE2/MPC definitions provided action distribution and compatibility constraints (Table 2). The production input deck did not specify user-defined reduced integration, selective reduced integration, or hourglass-control parameters. Element integration, stabilization, stress recovery, and convergence treatment therefore followed the standard MSC Nastran formulations and solver defaults associated with the specified entries. The same solver settings and convergence controls were retained for the shell-dominant and solid-region models.
Table 2.
Element technology and numerical role.
The mesh is graded from the global hull discretization to the local bossing region. Approximately three to four shell elements are retained between secondary-stiffener lines, and the transition from the 80–120 mm shell region to the 200–400 mm global mesh is gradual. In the solid model, the 40–60 mm interface mesh and the minimum two-element through-thickness requirement were selected to resolve bending and transverse-shear gradients without an unnecessary global increase in degrees of freedom (DOF). Detailed information is shown in Table 3.
Table 3.
Mesh-convergence results for the governing design-draught/full after-peak tank condition.
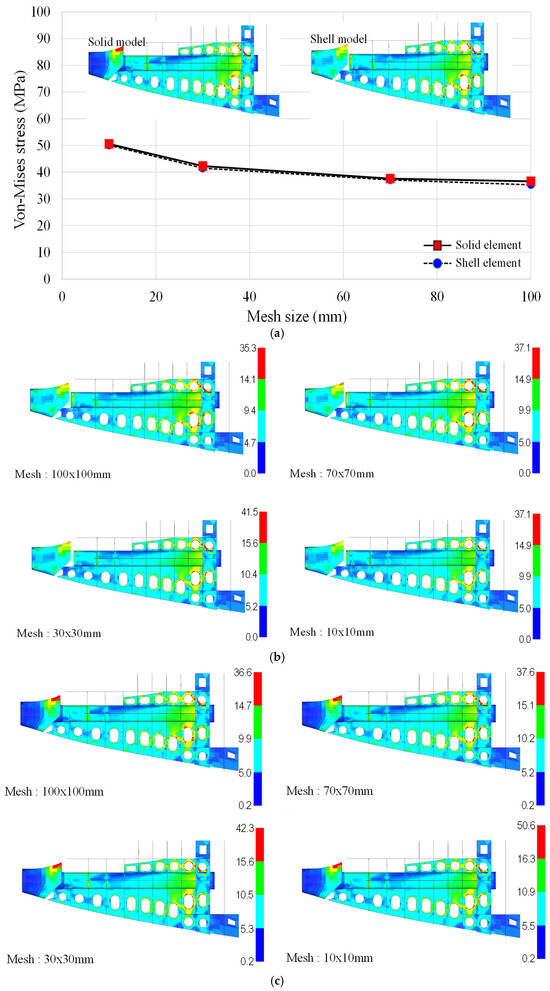
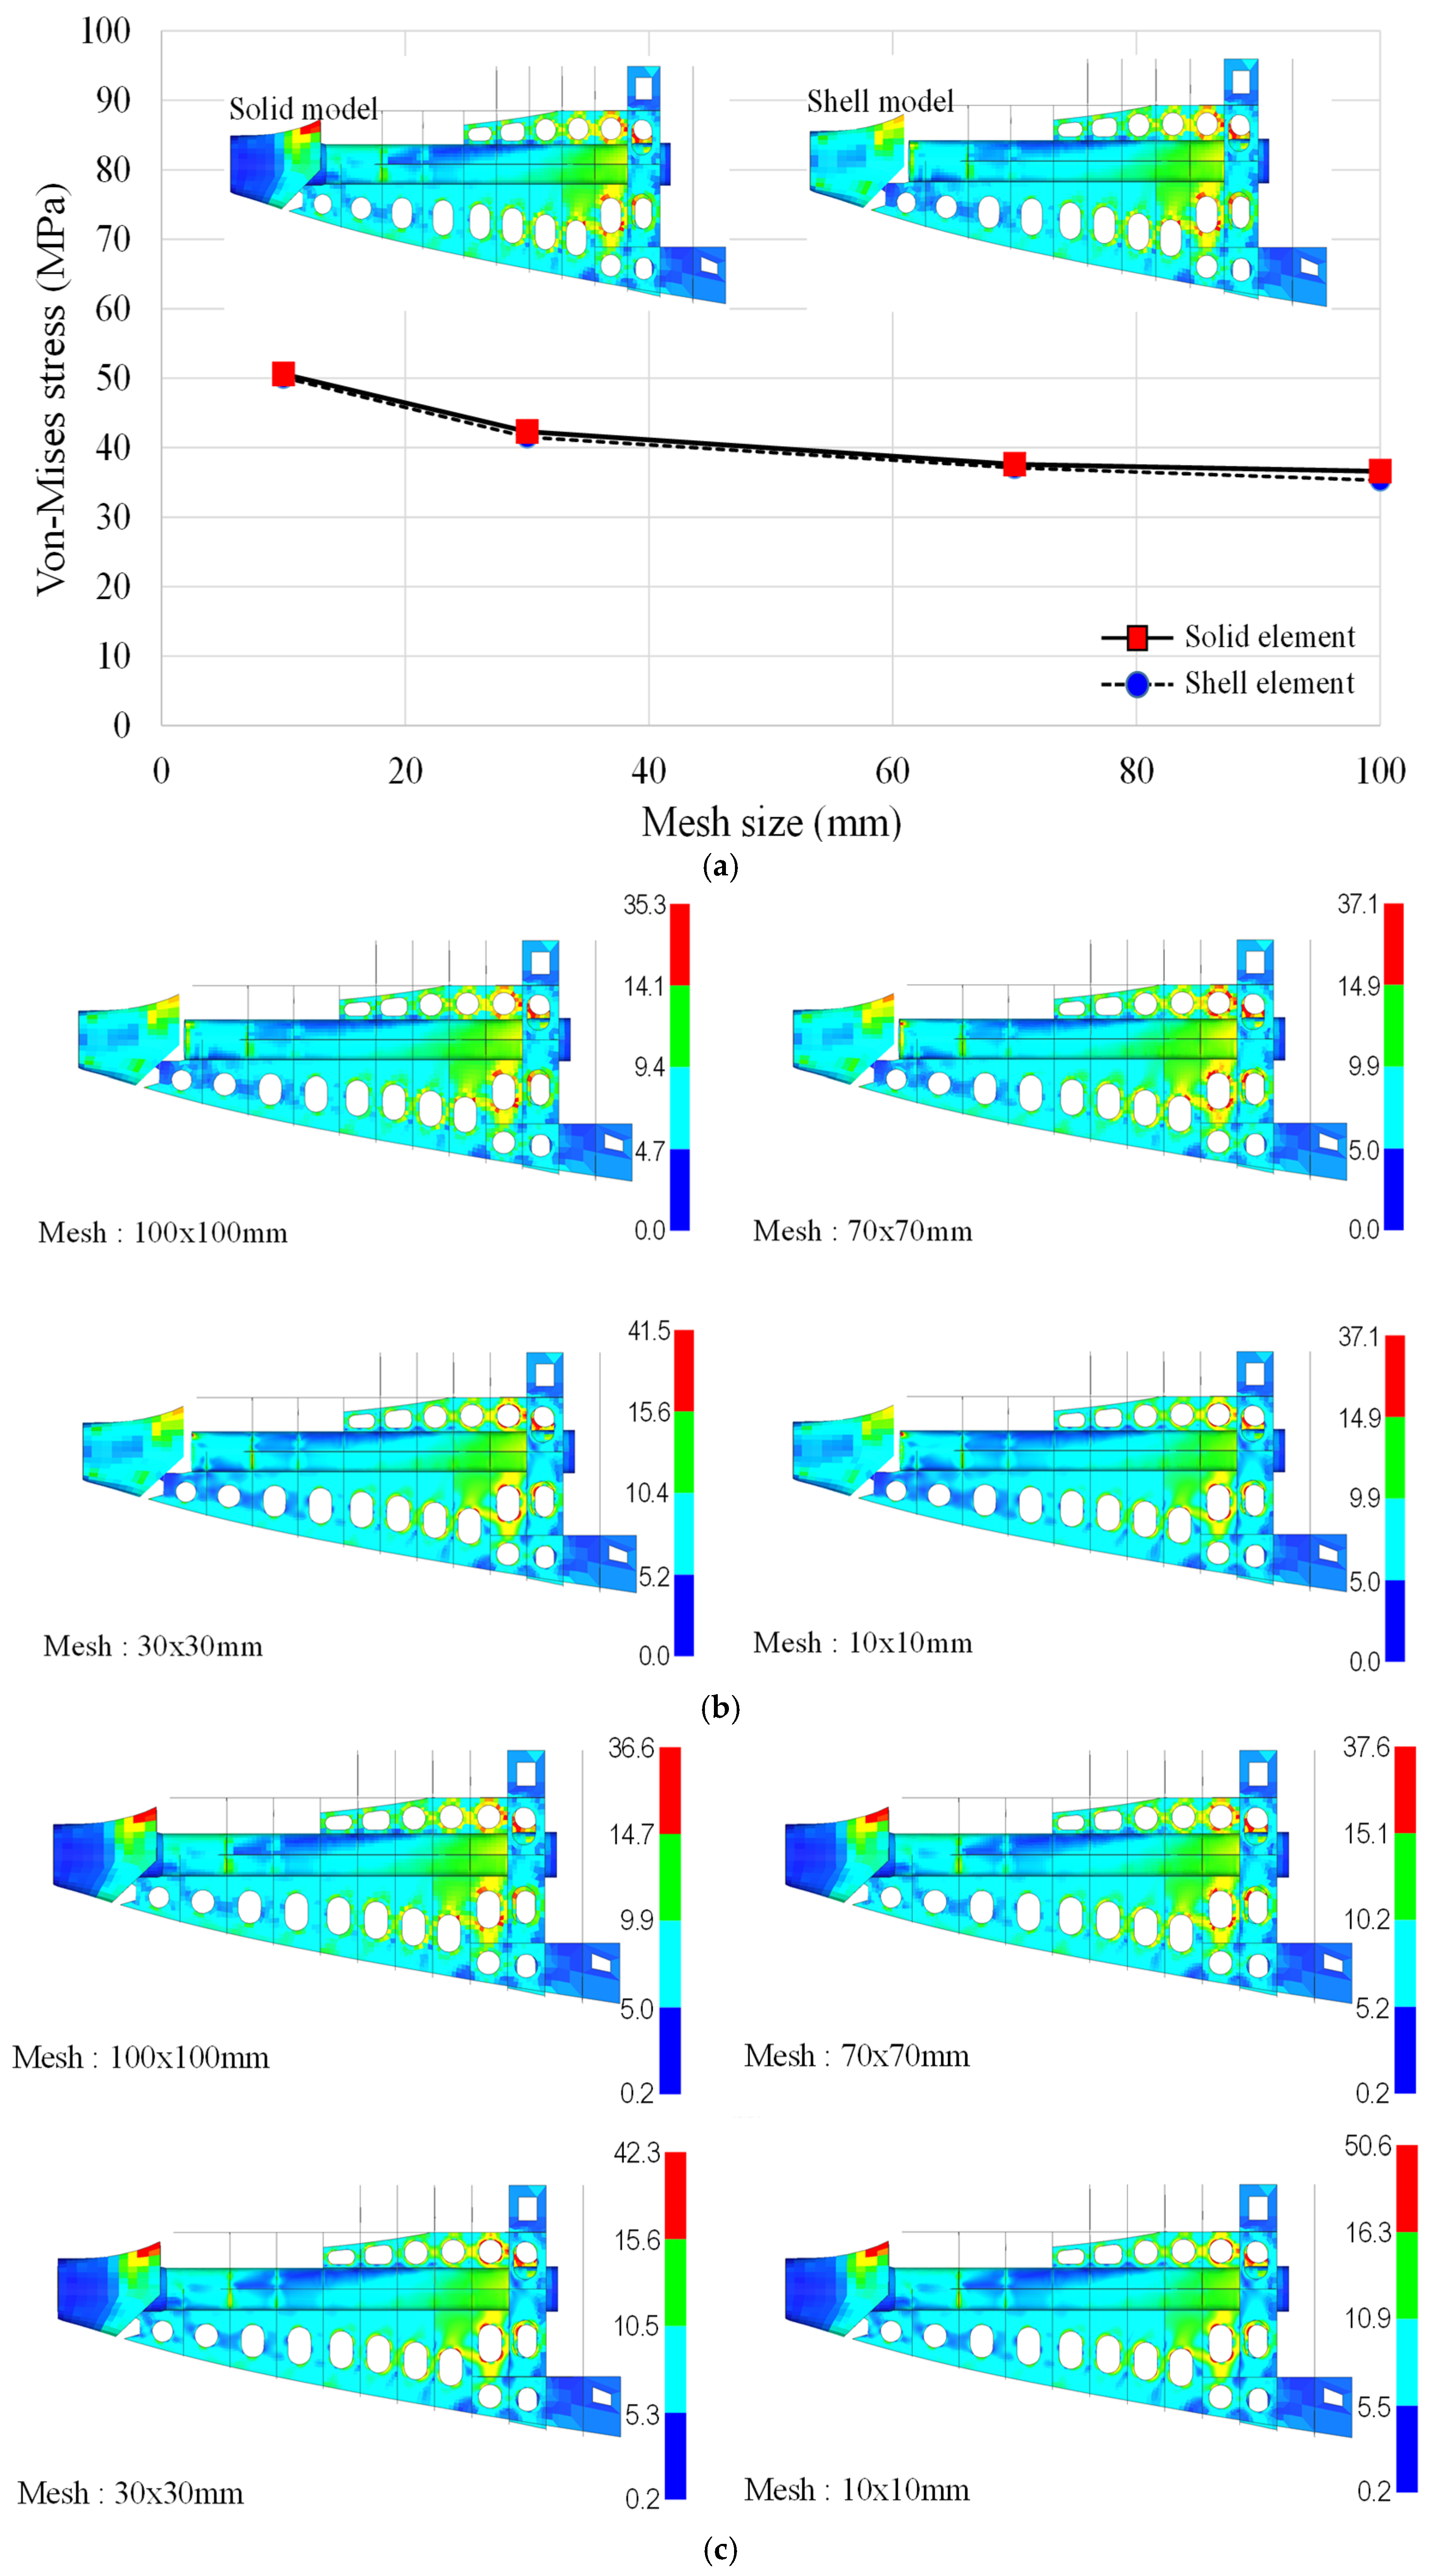
The monitored quantity was the maximum vertical displacement at the stern-boss keel-line extraction point. The baseline-to-fine changes are below 1.1% for both formulations. In addition, the shell–solid difference remains essentially unchanged between the baseline and fine meshes (2.6 and 2.8 mm, respectively). The reported model-form difference is therefore not a discretization artifact within the evaluated mesh range. Because displacement convergence alone does not establish the stability of a local stress measure, an additional mesh-sensitivity check was performed for the launching pre-condition at the aft stern-boss RBE region. Four nominal in-plane mesh sizes (100, 70, 30, and 10 mm) were examined using geometrically consistent shell and solid idealizations. The resulting stress fields and the corresponding peak von Mises values are summarized in Figure 4.
Figure 4.
Mesh-size sensitivity of the stern-boss stress response under the launching pre-condition: (a) peak von Mises stress versus nominal mesh size for the shell and solid idealizations; (b) shell-model stress contours for 100, 70, 30, and 10 mm meshes; and (c) solid-model stress contours for the same mesh sequence. Stress is reported in MPa.
The two formulations exhibit the same spatial stress pattern and nearly coincident mesh-sensitivity trends. As the nominal mesh size is reduced from 100 to 10 mm, the reported peak stress rises from 35.3 to 50.1 MPa for the shell model and from 36.6 to 50.6 MPa for the solid model. At corresponding mesh sizes, the shell–solid difference remains small and decreases from approximately 3.7% at 100 mm to about 1.0% at 10 mm. Thus, refinement does not alter the identified load path or the relative behavior of the two idealizations. The monotonic increase in the pointwise maximum, however, also shows that this raw hotspot quantity is more mesh-sensitive than the displacement response in Table 3. This behavior is expected near an RBE termination and adjacent geometric discontinuities, where a progressively smaller element samples a steeper local stress gradient. Accordingly, the present study distinguishes response convergence from pointwise peak-stress convergence: the baseline mesh is accepted on the basis of the converged displacement and stable structural stress pattern, whereas an isolated elemental maximum at the RBE edge is not treated as a mesh-objective design stress. Stress comparisons and utilization screening are therefore made at common mesh resolution and interpreted together with the surrounding stress field. A fatigue assessment or a classification check governed by a local notch would require a separately defined structural-stress or hotspot-stress extrapolation procedure.
2.1.2. Boundary Conditions and Sensitivity
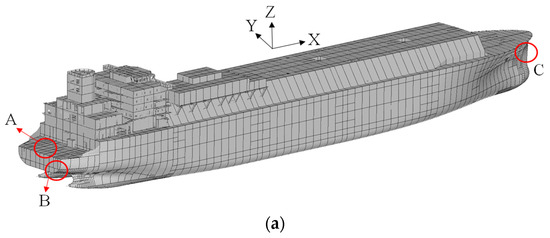
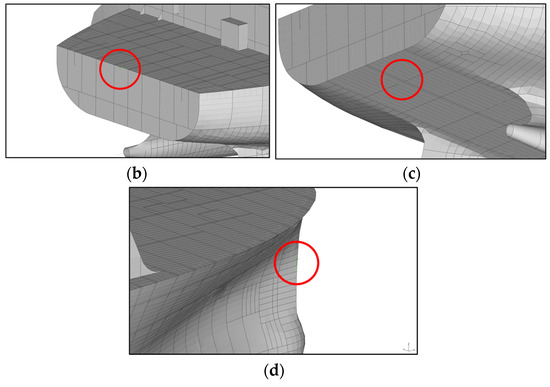
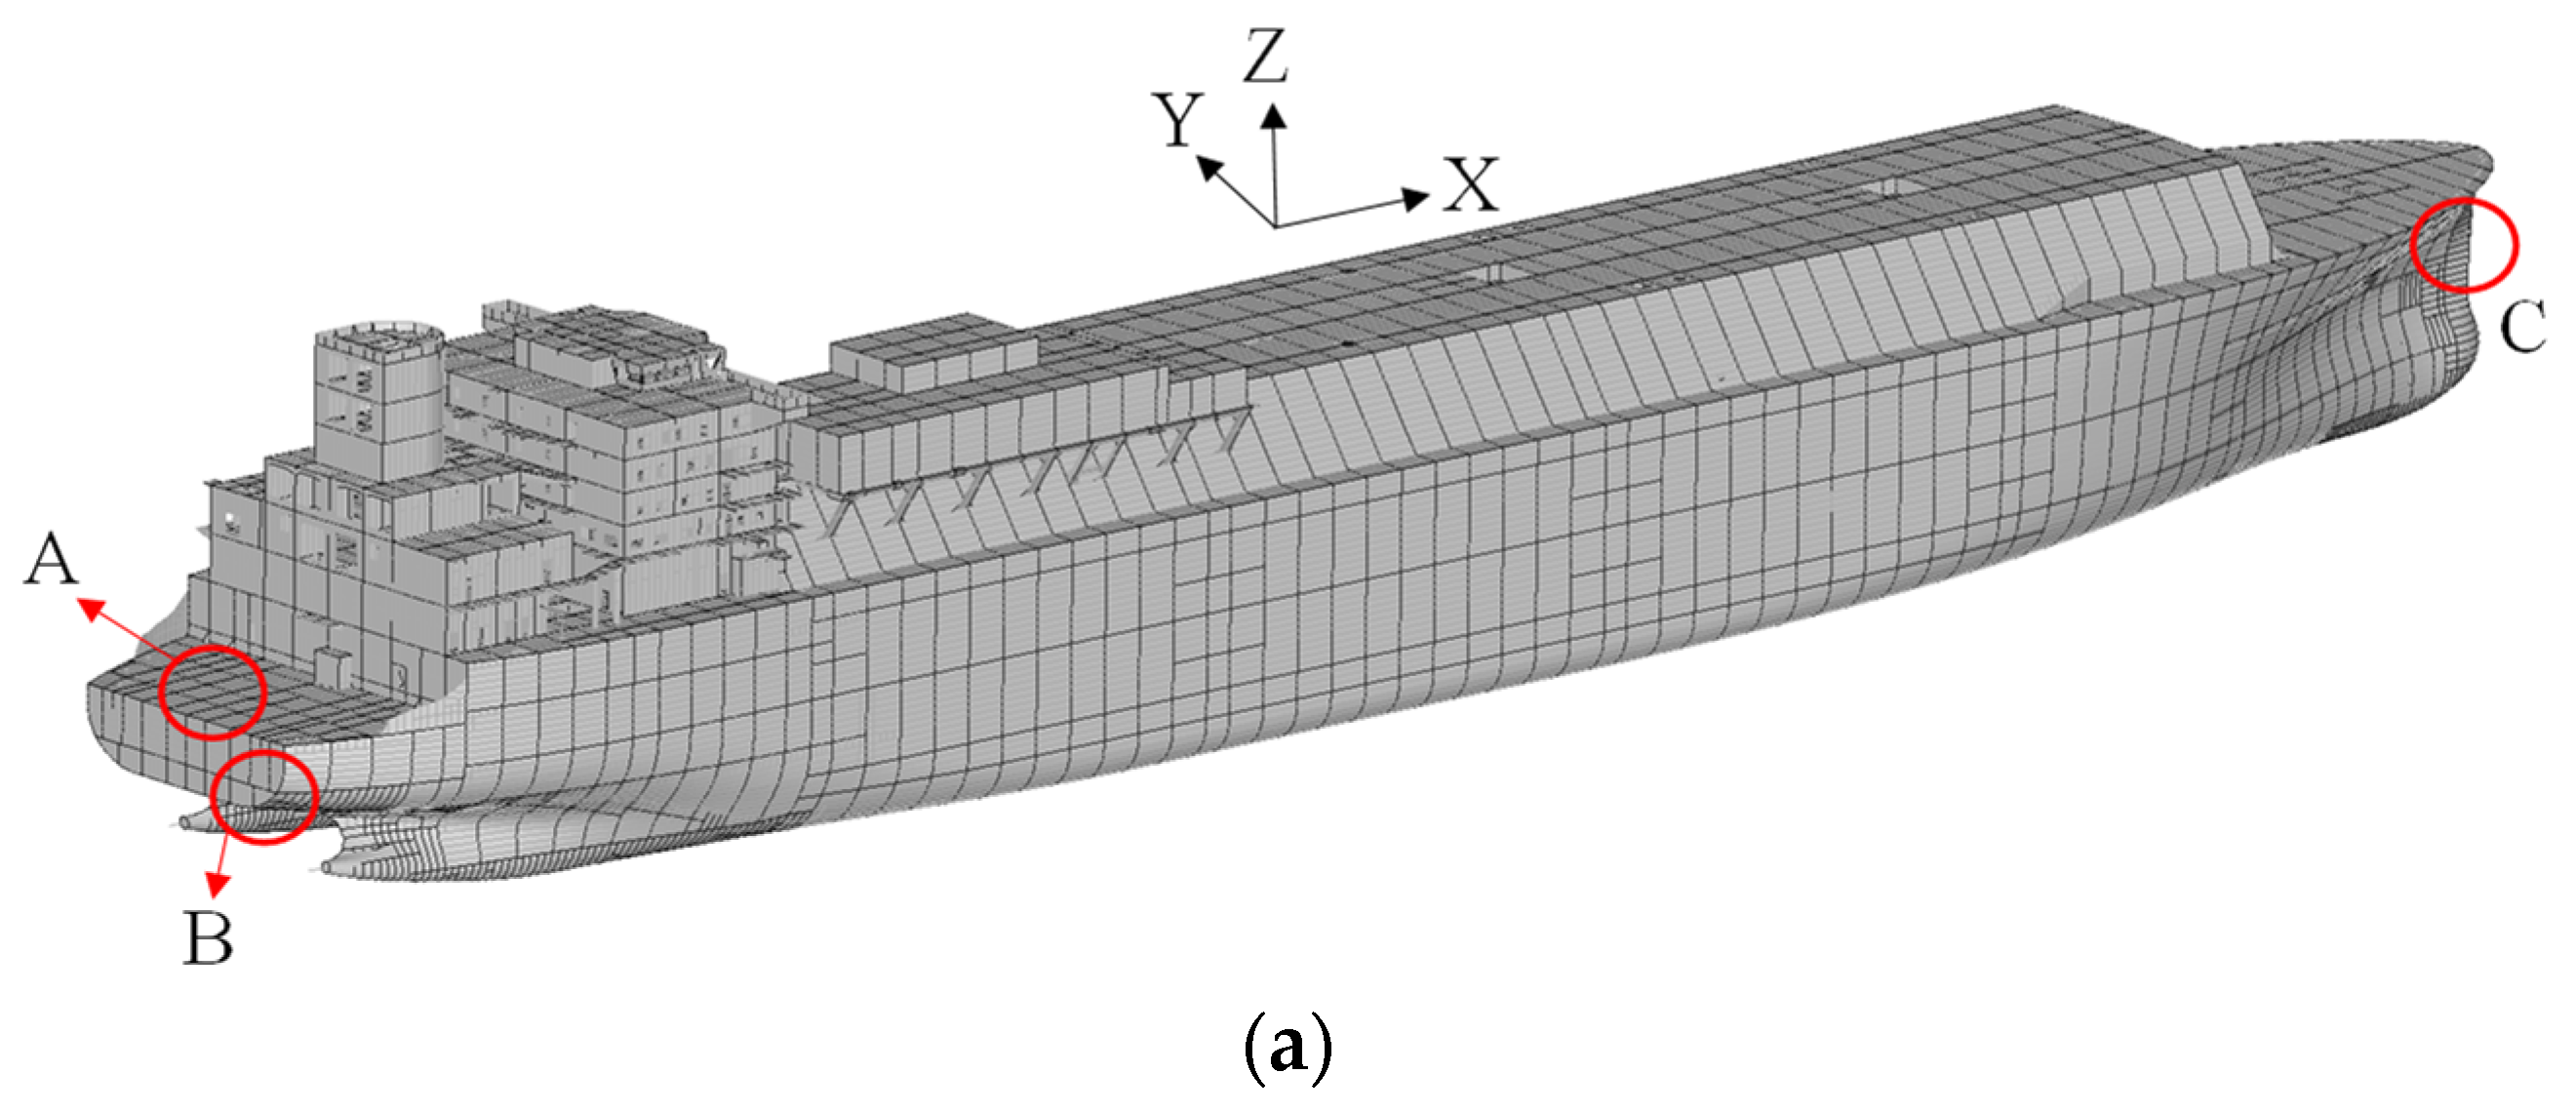
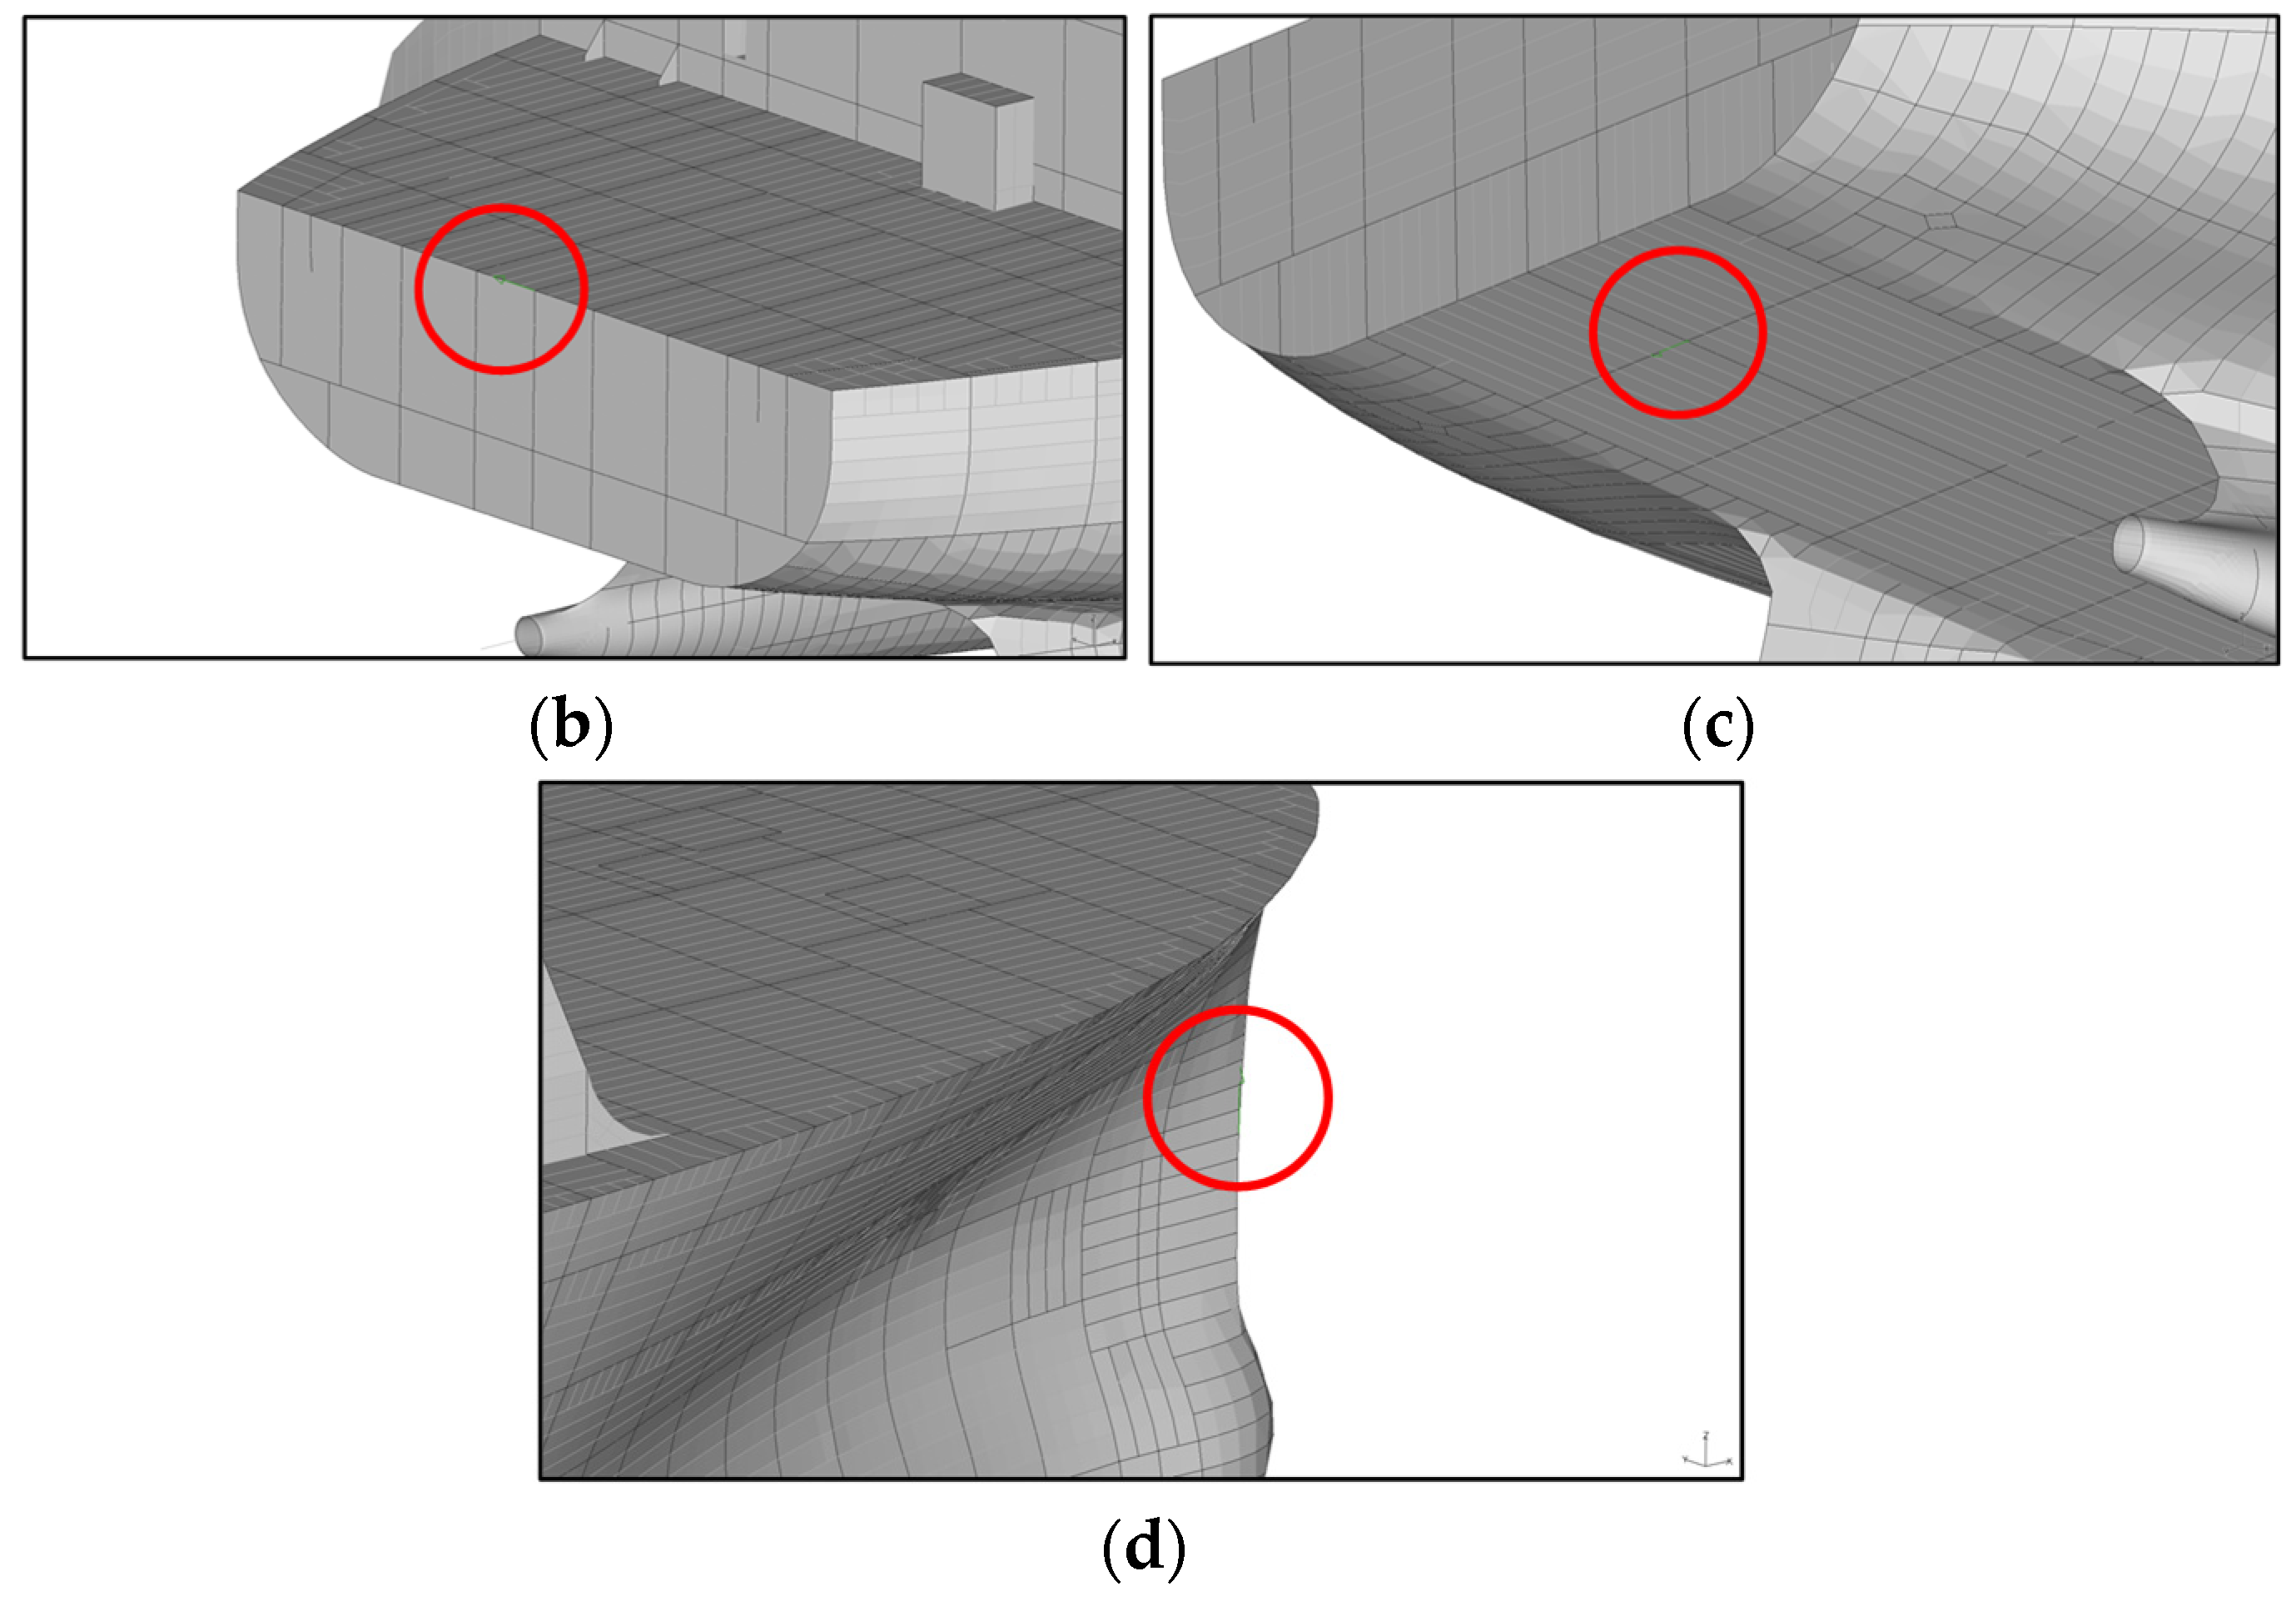
The constraints remove rigid-body motion while retaining the longitudinal hull-girder deformation mode. At the aft perpendicular (AP), Ux, Uy, and Uz are restrained; at the forward perpendicular (FP), Uy and Uz are restrained while Ux remains free; and at the aftermost engine-seating/transom reference (AE), the vertical degree of freedom is restrained to represent the high vertical stiffness of the foundation region (refer to Figure 5). These reference regions correspond to physical structural locations rather than arbitrary nodes. They are approximately 15–20 m, about 200 m, and 10–15 m, respectively, from the principal stern-boss evaluation region. Consequently, local perturbations decay before reaching the interface of interest. A boundary-sensitivity study in which the effective restraint stiffness was varied by ±20% changed the stern-boss maximum deflection by less than 2%, indicating that the reported shell–solid comparison is not governed by a single idealized fixity. The constraints nevertheless remain a modeling approximation, and this limitation is retained in the validation discussion.
Figure 5.
Global boundary-condition definition: (a) locations of the constrained reference regions; (b) A: vertical restraint at the aftermost engine-seating/transom reference (AE); (c) B: translational restraints Ux, Uy, and Uz at the aft perpendicular (AP); and (d) C: transverse and vertical restraints Uy and Uz at the forward perpendicular (FP).
2.1.3. Response-Extraction Definitions and Reporting Conventions
Three response levels are retained to prevent model-wide numerical hotspots from being confused with the stresses used for structural assessment. The local stern-tube coordinate system has x along the tube centerline and positive forward, z vertically upward, and y completing the right-handed transverse system. Unless otherwise stated, stresses are read at element integration points and extrapolated to the element centroid without nodal averaging across shell–solid, RBE, thickness, or material boundaries. Table 4 defines the element sets, reference quantities, extraction conventions, and engineering use of every primary and secondary response reported in this study.
Table 4.
Traceable response-extraction definitions and engineering purpose.
2.2. Material Properties and Constitutive Assumptions
The analyses use linear-elastic, isotropic material models with nominal minimum properties for the shipbuilding grades assigned in the production model in Table 5. These values are design-stage properties used in classification-based structural assessment; they are not measurements from coupons removed from the subject vessel. Actual mill-certified properties may exceed the nominal minima, but that variability is not credited. The material set is not intended to represent cryogenic cargo-containment materials.
Table 5.
Nominal material properties used in the finite element assessment.
Because the governing traceable regional stress of 72.4 MPa remains well below the SS400 nominal yield strength of 235 MPa, the result is reported as a nominal elastic yield-utilization screening value rather than a complete classification acceptance statement. Nonlinear plastic redistribution, weld residual stress, casting variability, local geometric imperfections, fatigue, and rule-based panel buckling are outside this regional yield ratio and are assessed separately or retained as limitations.
3. Results and Discussion
This section presents the operational load transfer, global deformation, local stress response, computational cost, and verification evidence. Results are reported for both model formulations using identical load vectors and global constraints. The comparison is therefore intended to isolate the influence of the stern-boss idealization. The stress results are interpreted in accordance with the mesh-objectivity distinction established in Figure 4.
3.1. Operational Loading Conditions
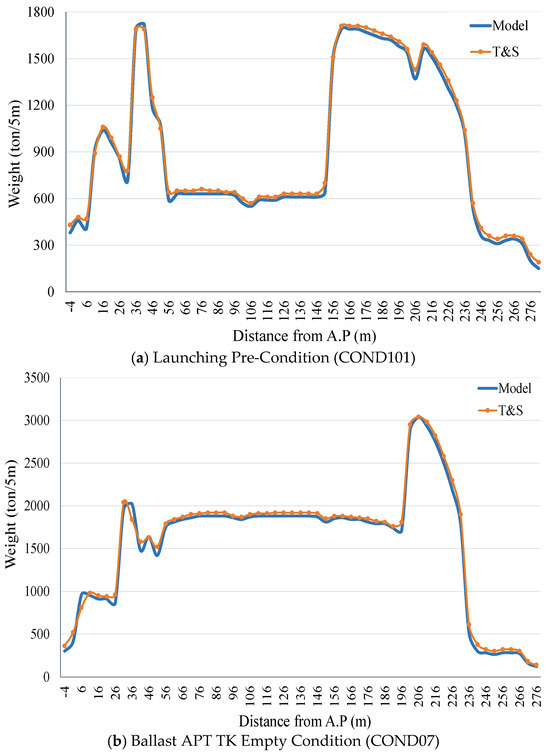
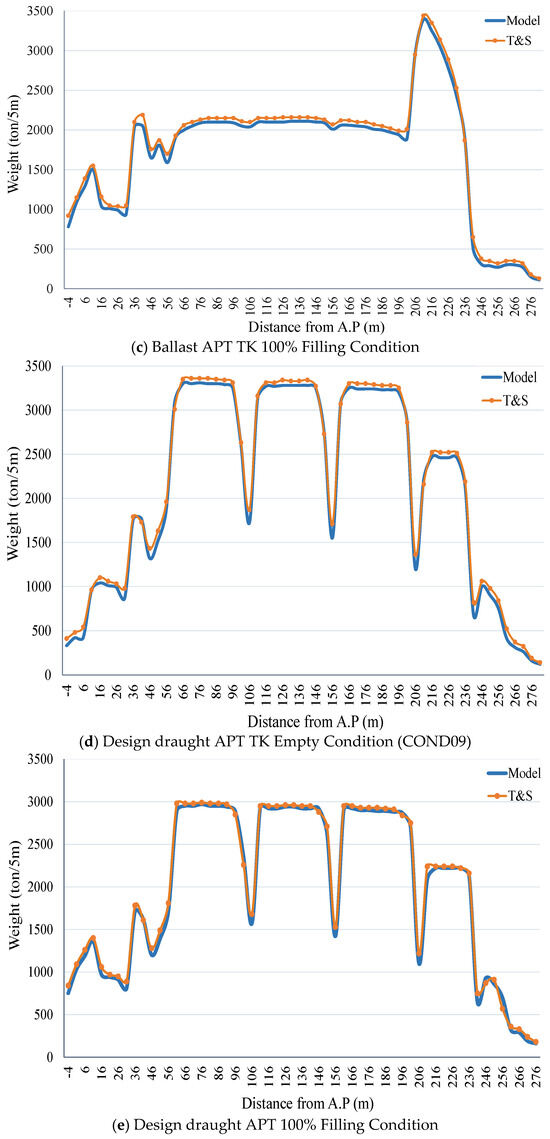
Five states were selected from the vessel trim-and-stability database: launching pre-condition; ballast with the after-peak tank (APT) empty; ballast with the APT 100% full; design draught with the APT empty; and design draught with the APT 100% full. For each state, longitudinal weight, buoyancy, hydrostatic pressure, ballast content, and machinery contributions were transferred to the FE model. These cases span construction, light/ballast operation, and service-draught operation and therefore exercise distinct aft-hull bending and local load-transfer conditions.
Transfer of Trim-and-Stability Data to the FE Model
The T&S database supplies weight and buoyancy distributions at longitudinal stations. Distributed structural and outfit weights were converted to nodal forces using the tributary length represented by each station. Machinery and other discrete masses were introduced at their physical foundation regions. External hydrostatic pressure was applied to wetted shell elements as a depth-dependent surface pressure, and internal ballast pressure was applied to the corresponding tank boundaries. Launching support reactions were assigned to the launching-way support regions rather than to the stern boss. In the MSC Nastran input, surface pressures were represented by PLOAD2/PLOAD4-type definitions, discrete forces by FORCE entries, and gravitational body effects by GRAV where appropriate. The same assembled load vector was used for the shell-dominant and solid-region models. For every case, the sum of applied vertical actions and the sum of support reactions agreed within 1%, and the resulting longitudinal bending trend was checked against the T&S still-water bending-moment distribution. These checks verify the load-transfer implementation but do not replace comparison with measured full-scale response.
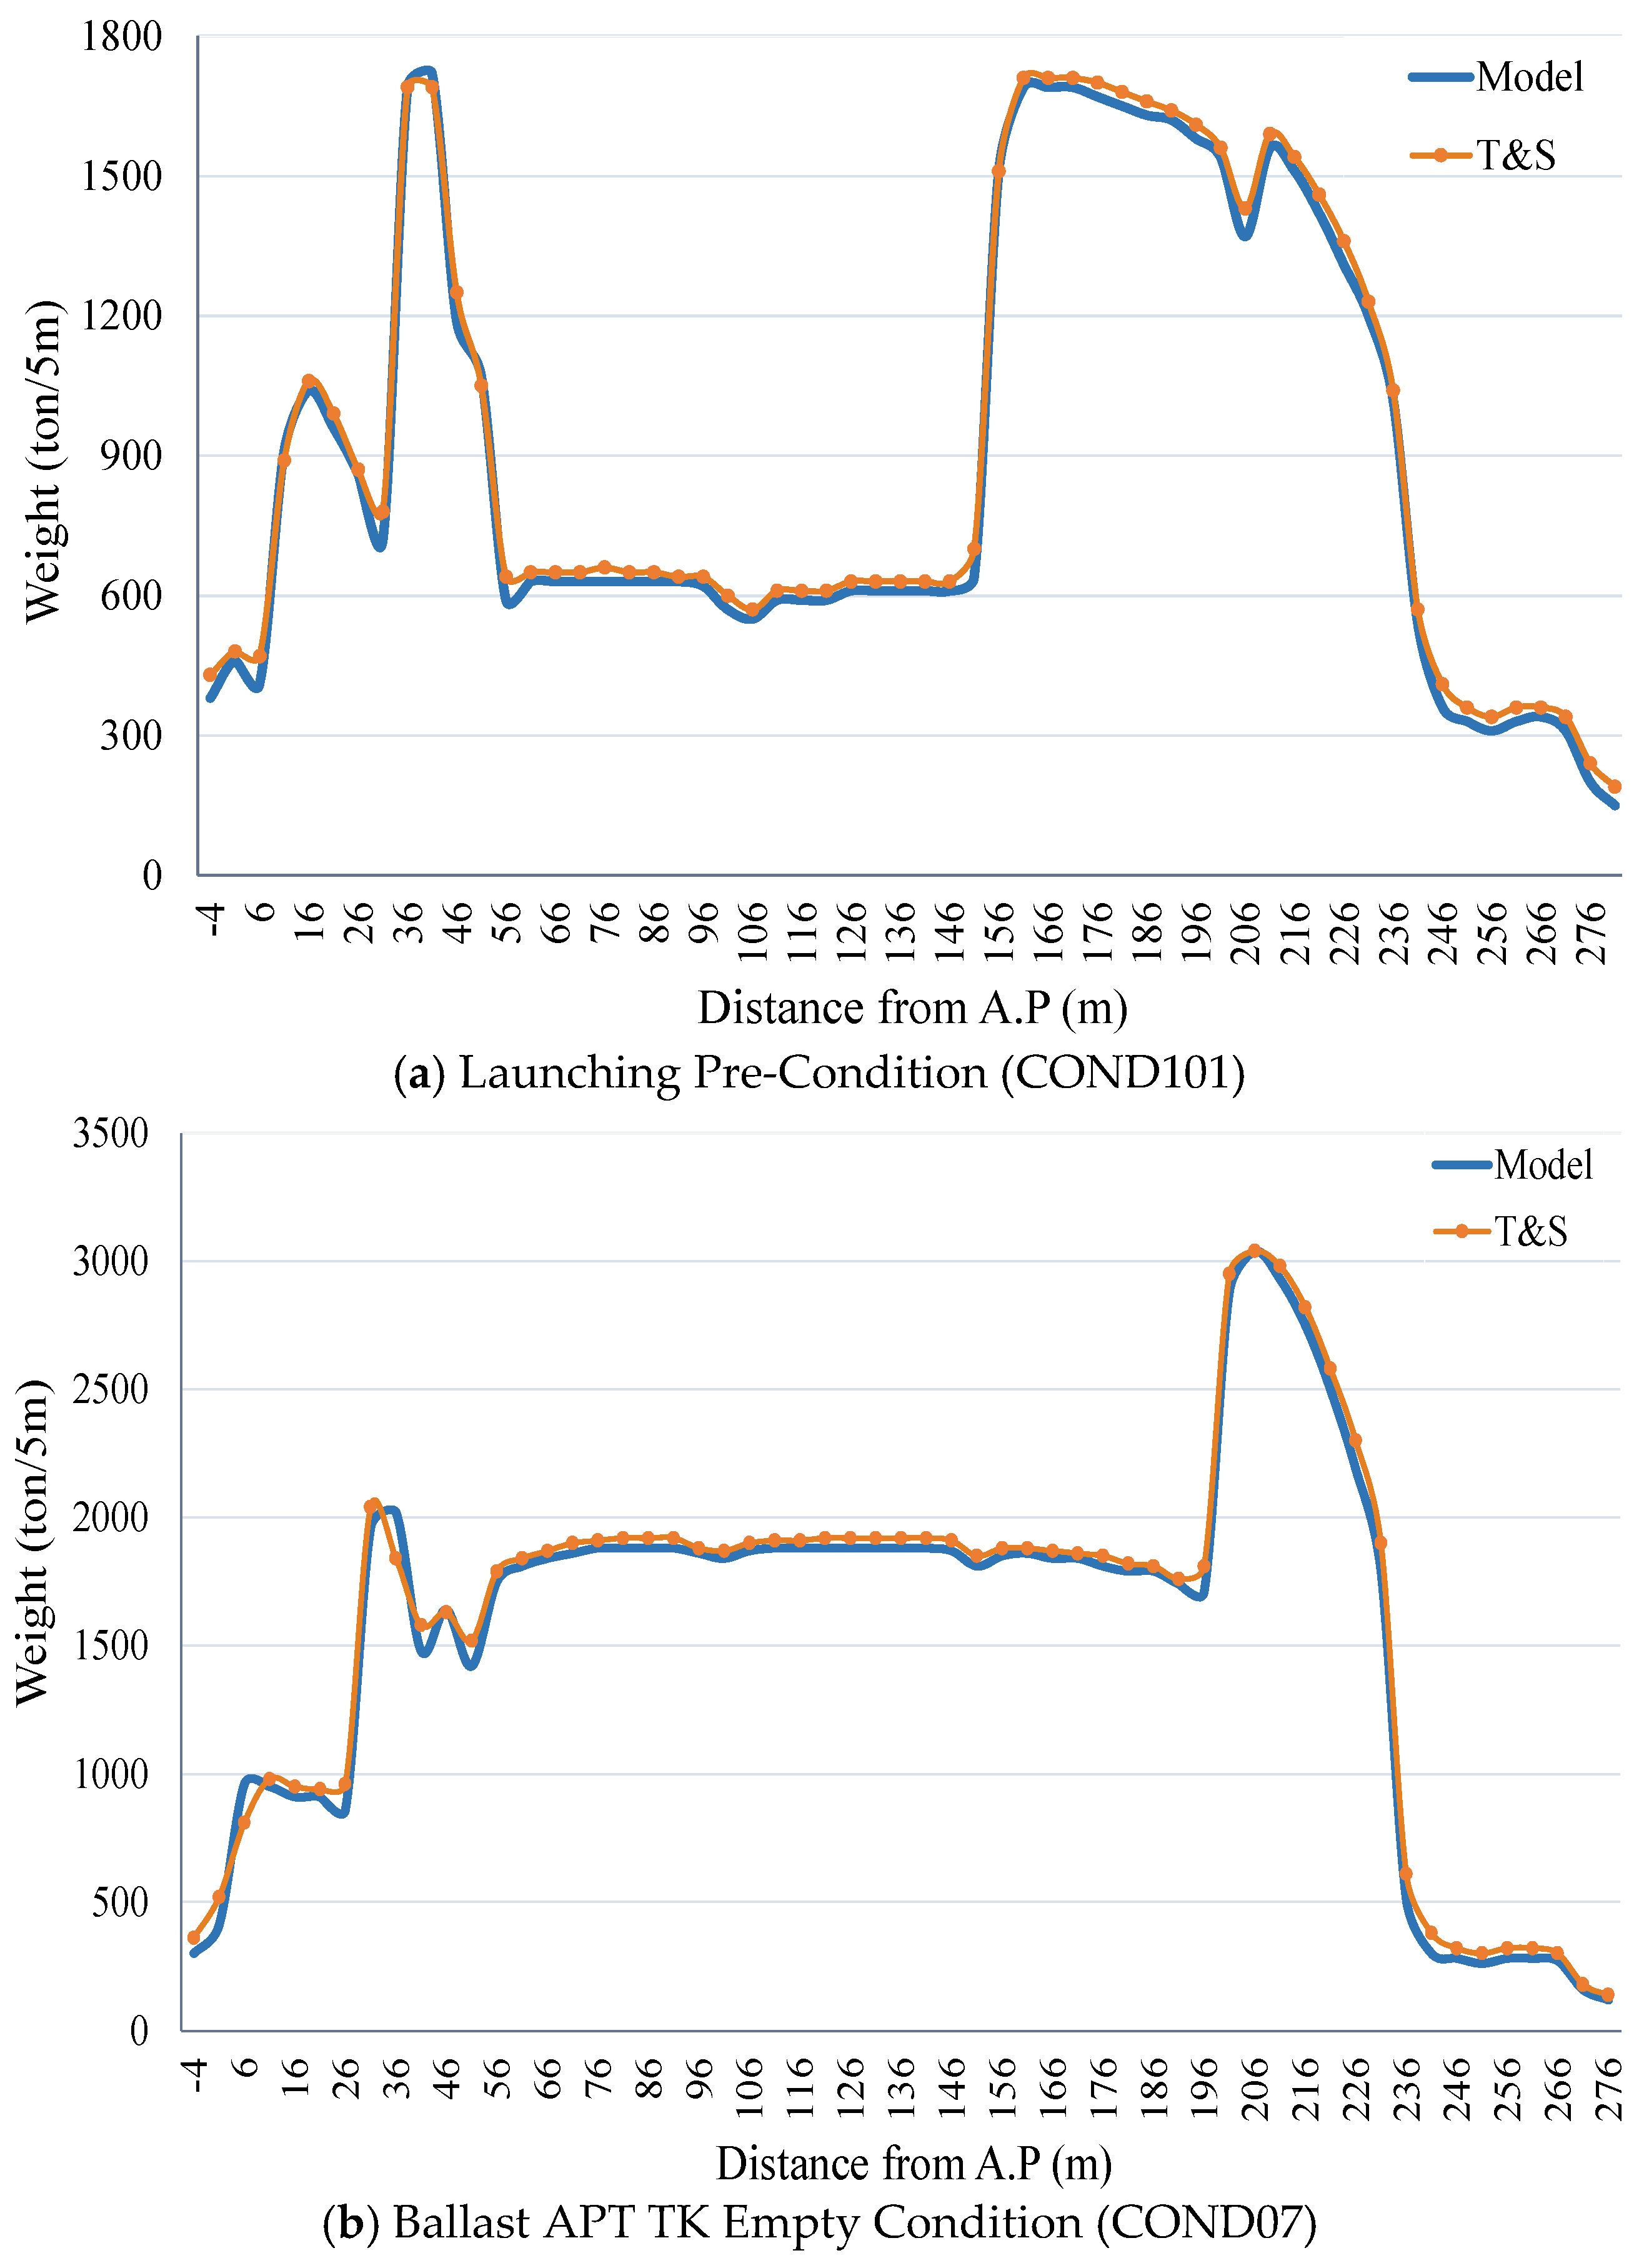
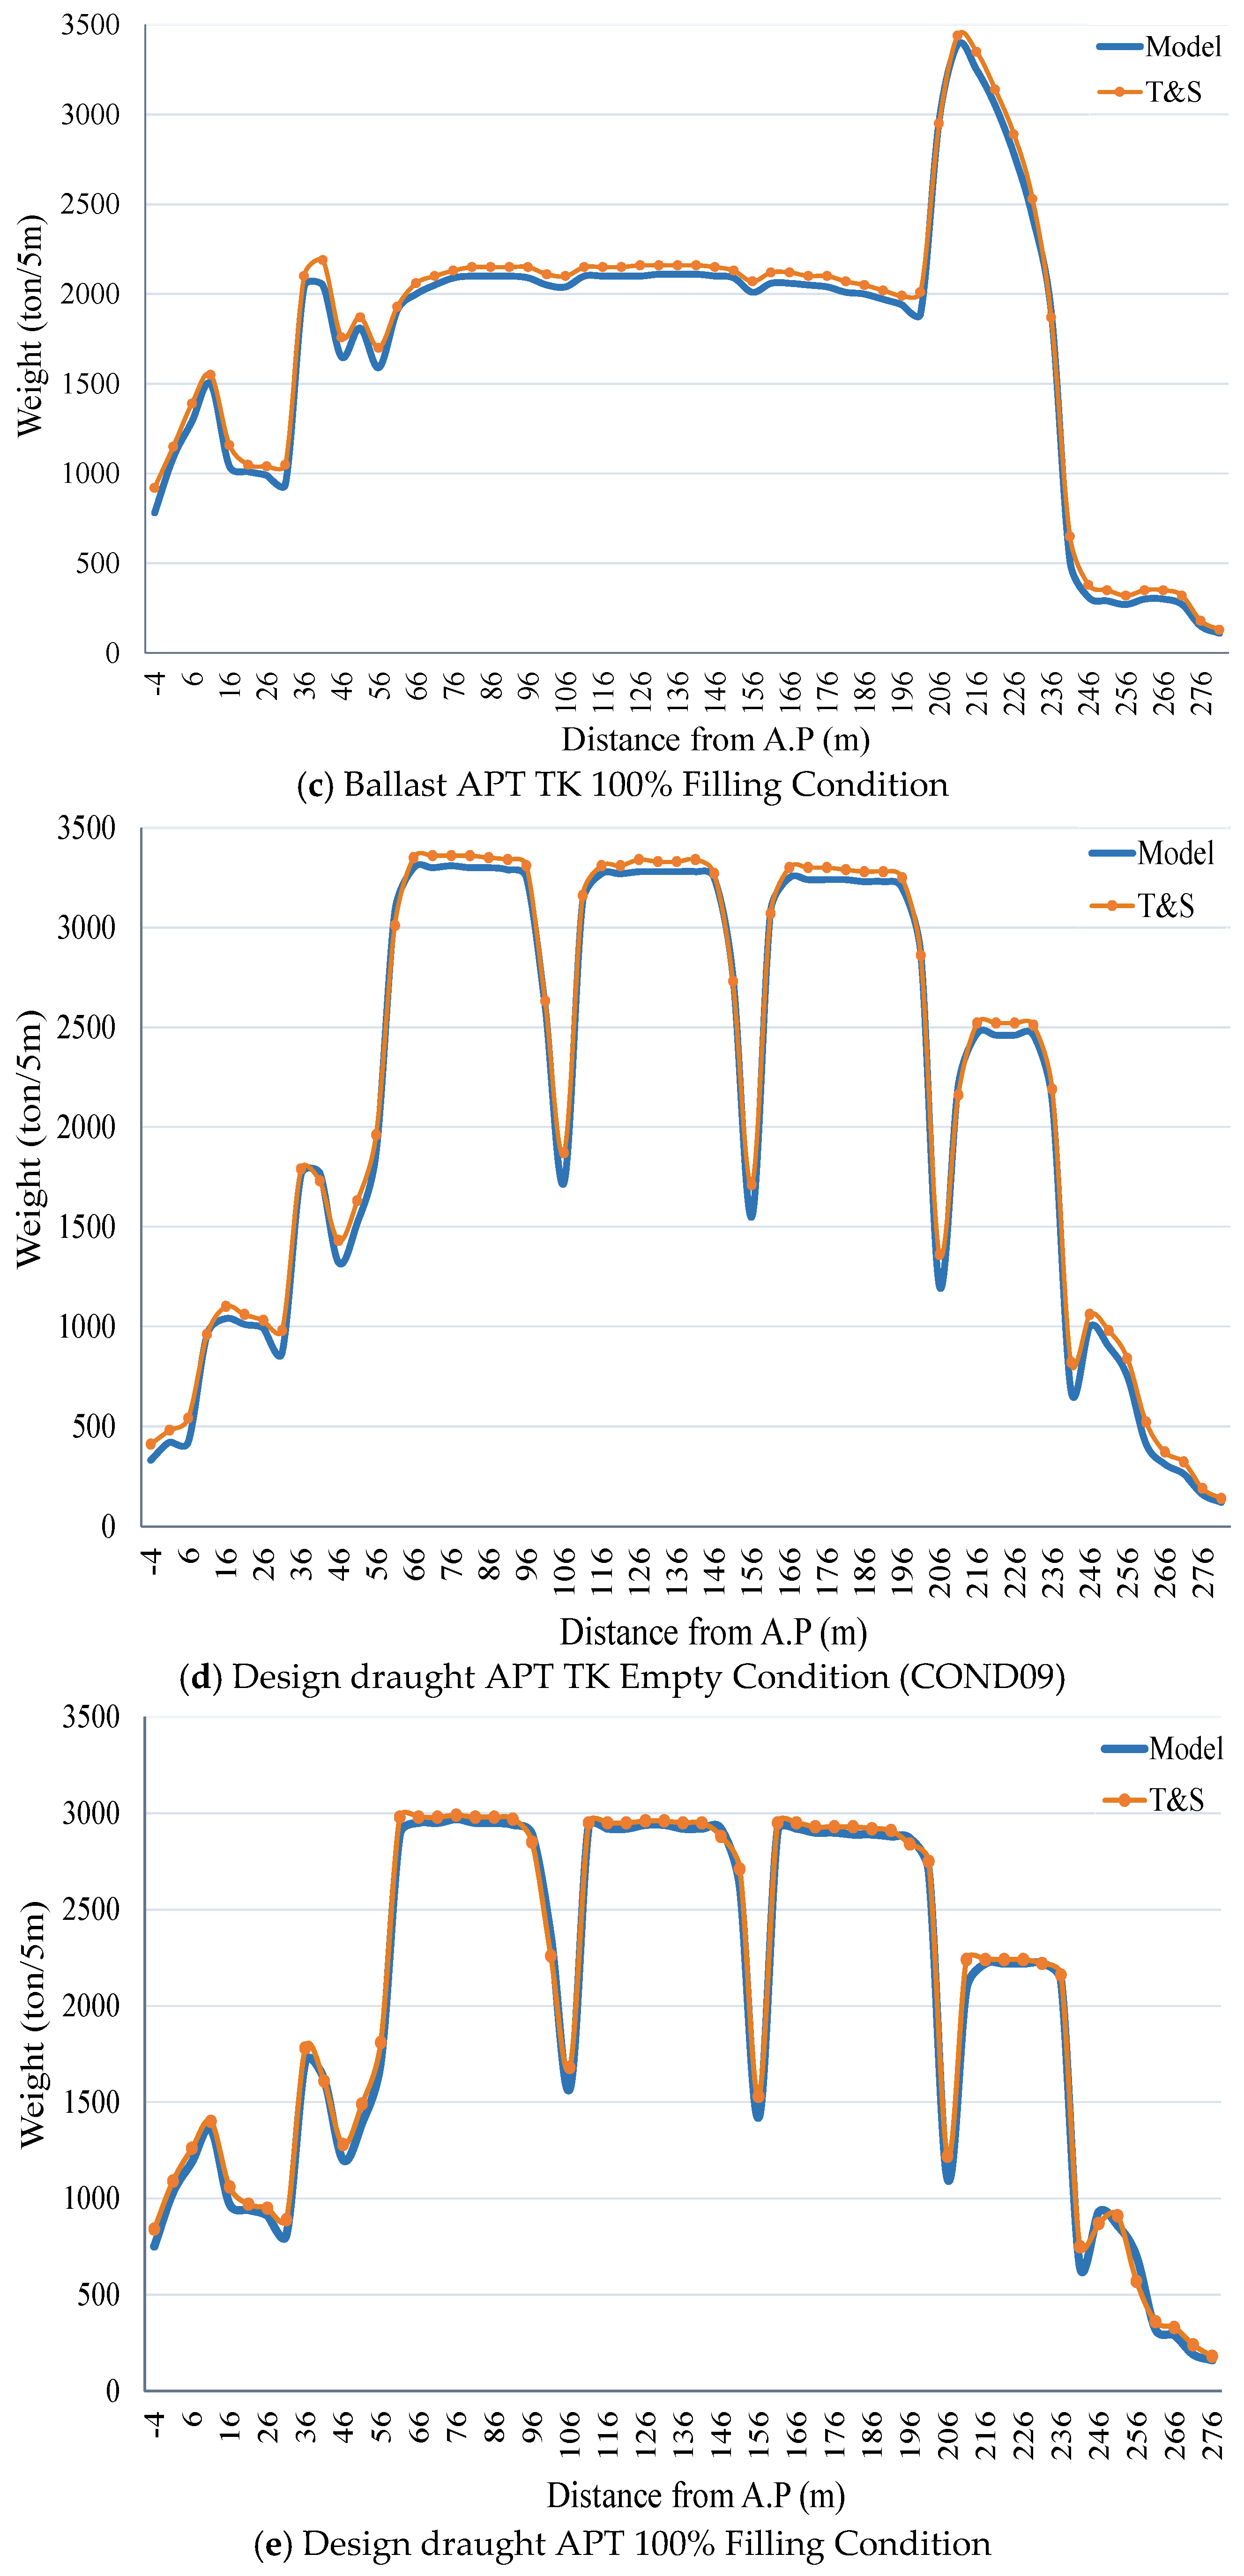
Figure 6 presents the applied longitudinal load distributions, not displacement contours. The differences among the five states modify the still-water bending field and the relative demand at the aft structure. The deformation responses generated from these loads are presented separately in Figures 8, 10, 12, 14 and 15.
Figure 6.
Trim-and-stability load distributions for the five operational conditions: (a) launching pre-condition; (b) ballast, APT empty; (c) ballast, APT 100% full; (d) design draught, APT empty; and (e) design draught, APT 100% full. The abscissa is longitudinal position measured from the aft perpendicular (AP), and the ordinate is weight or buoyancy per unit length (ton/5 m).
3.2. Global Deformation and Shell–Solid Comparison
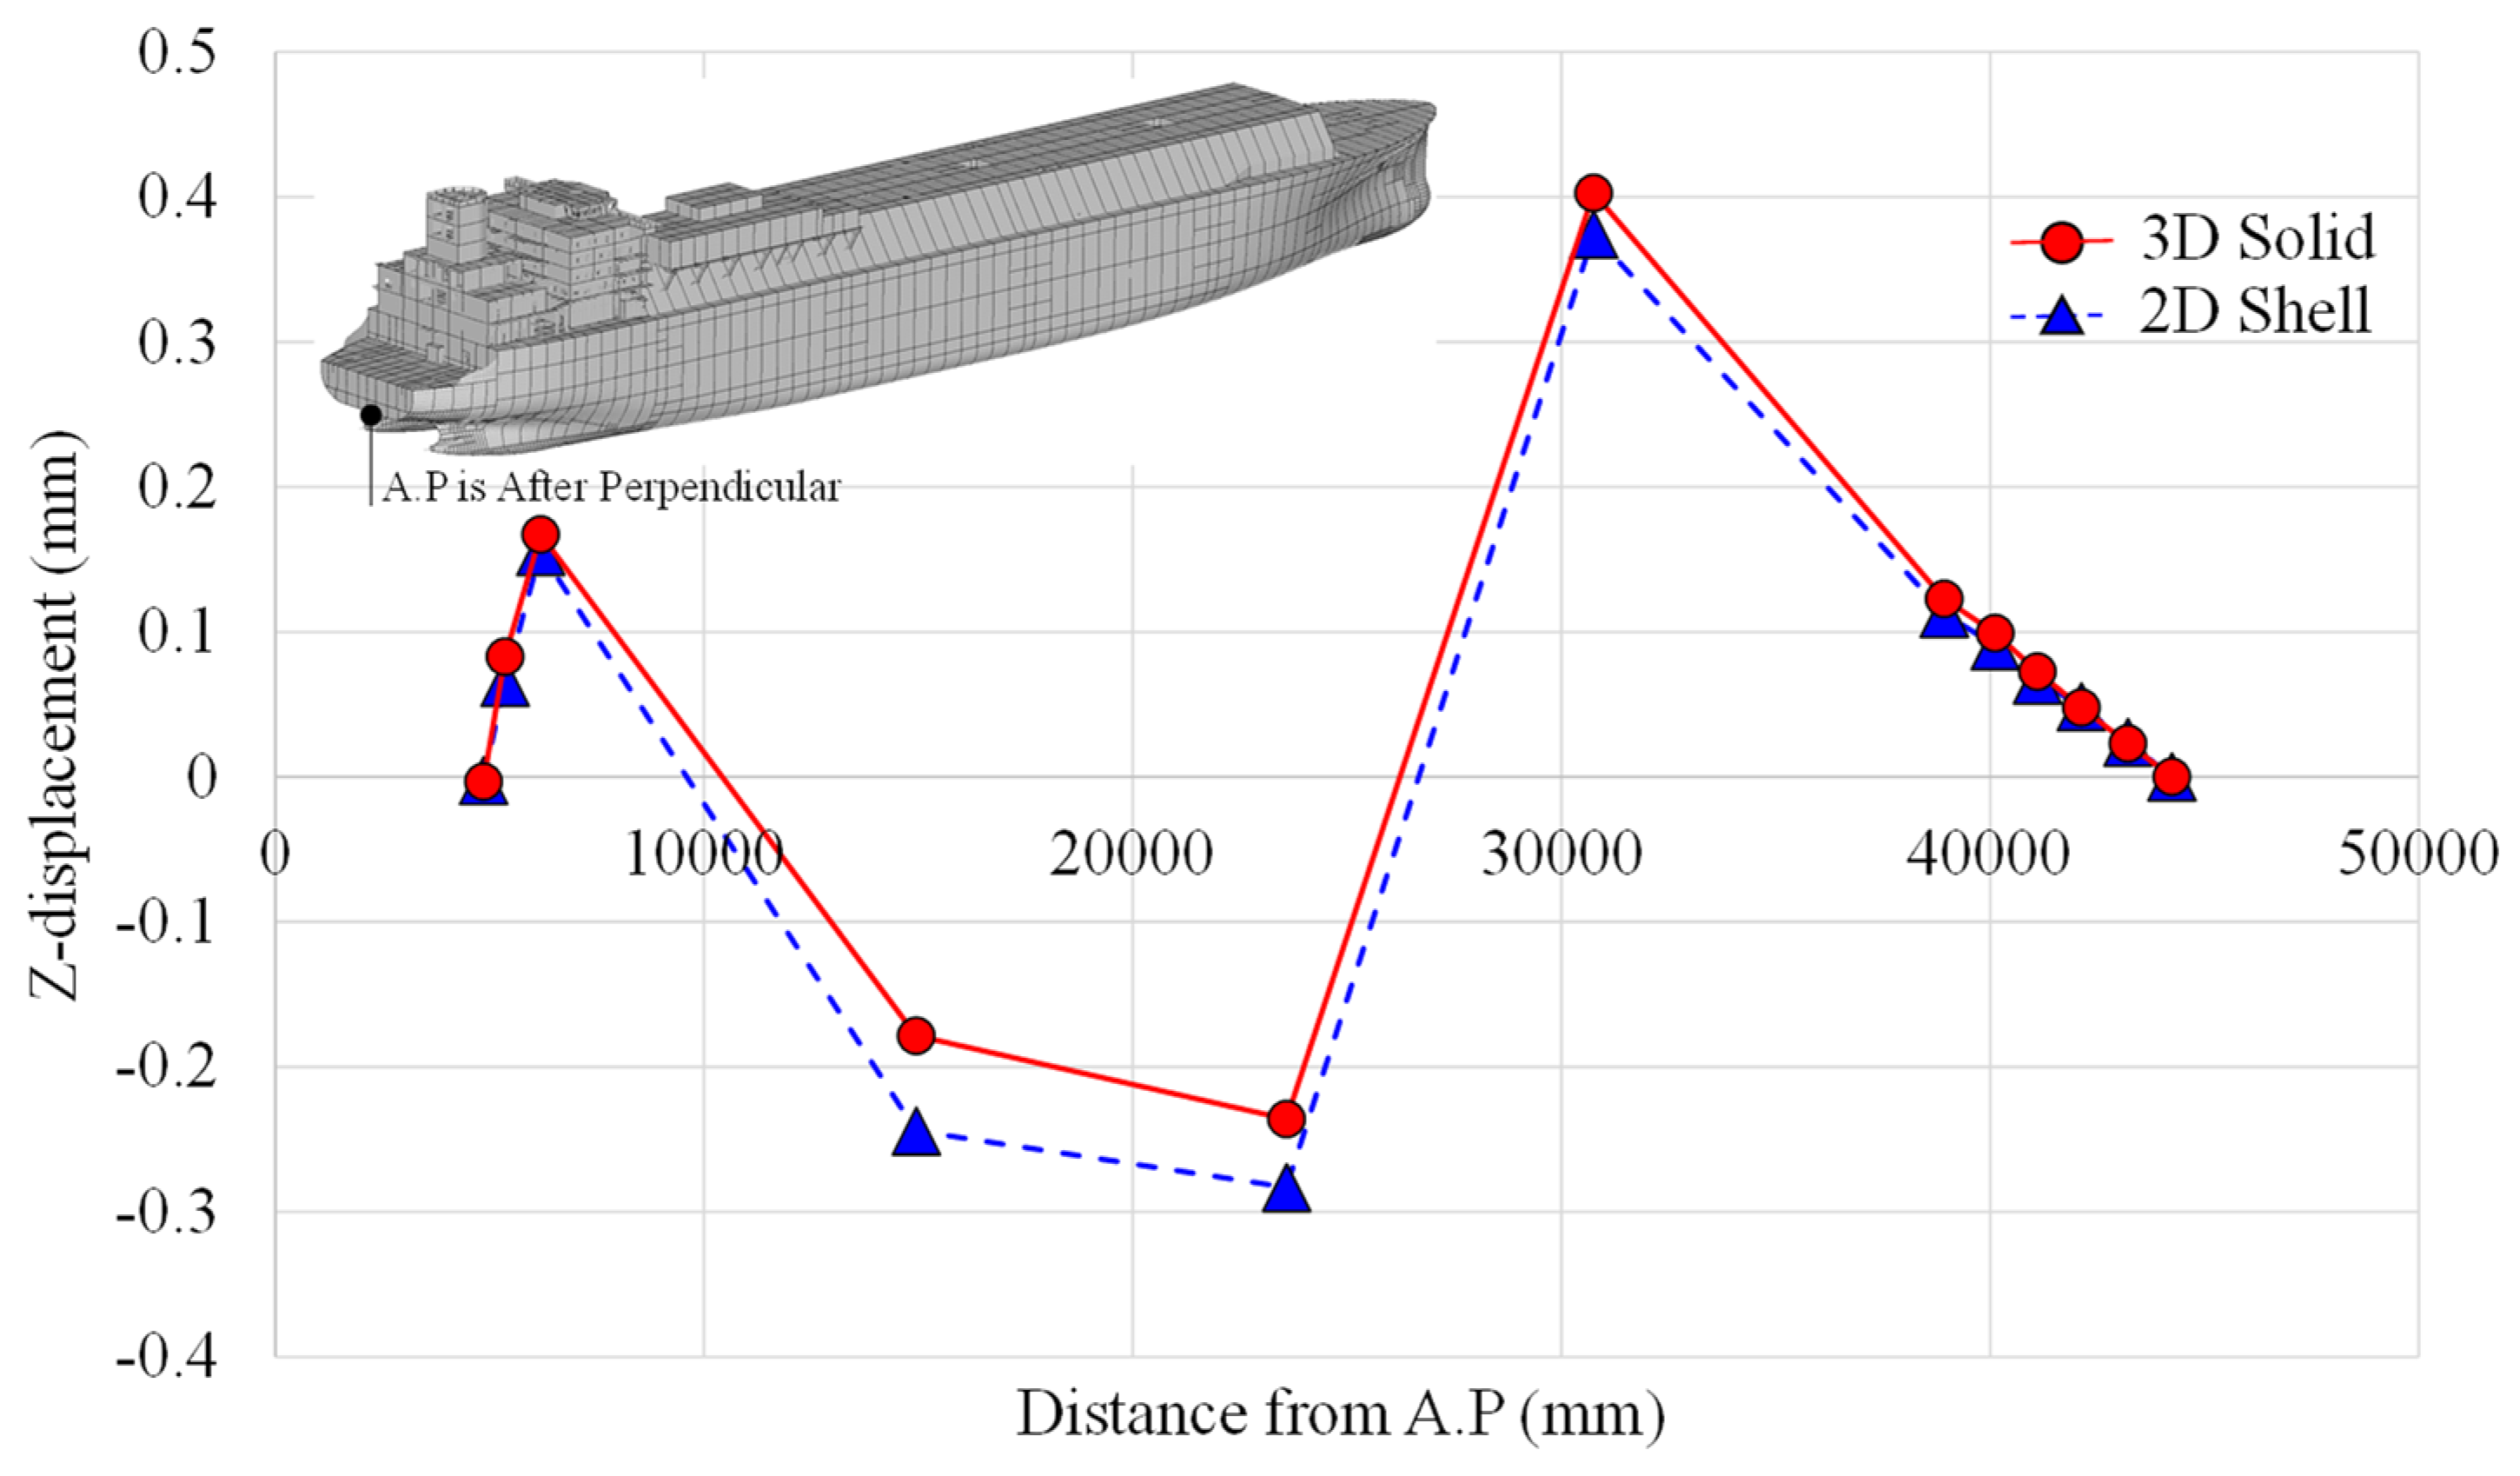
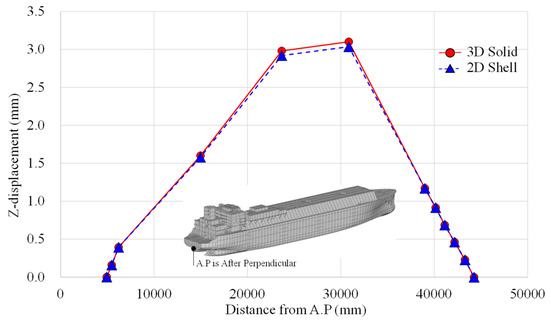
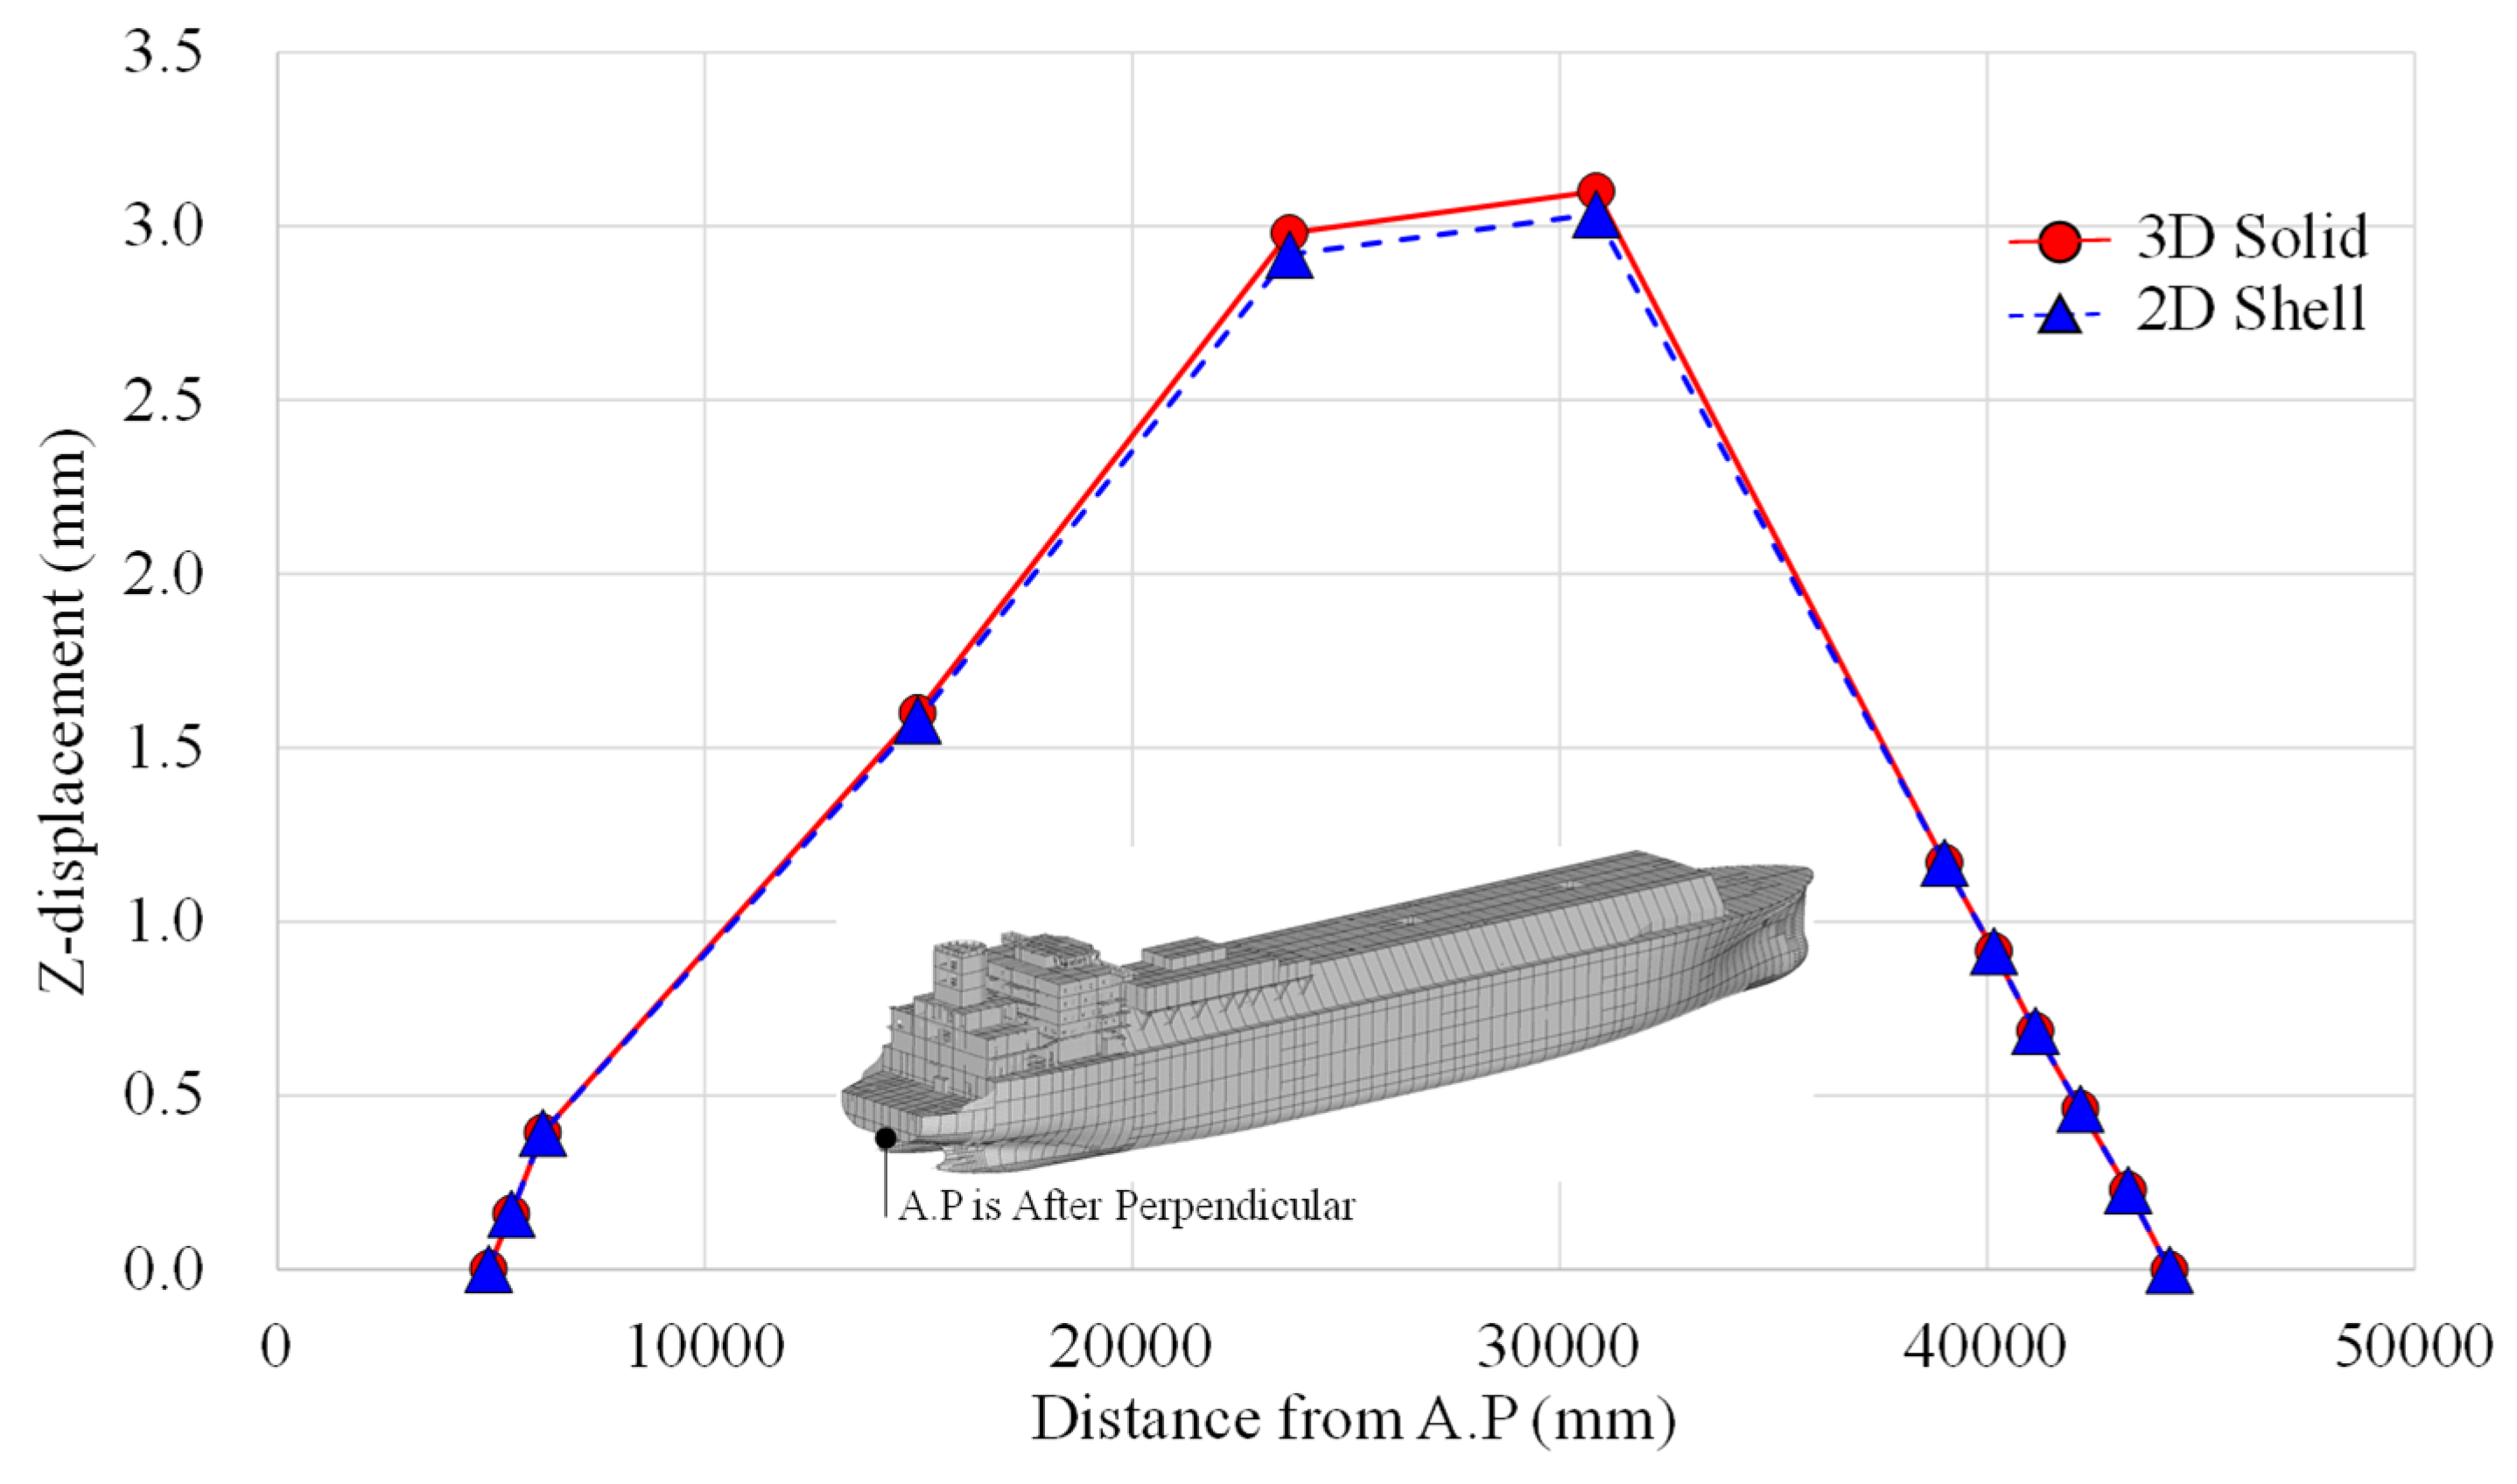
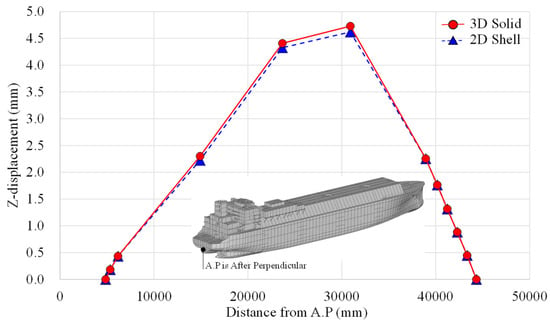
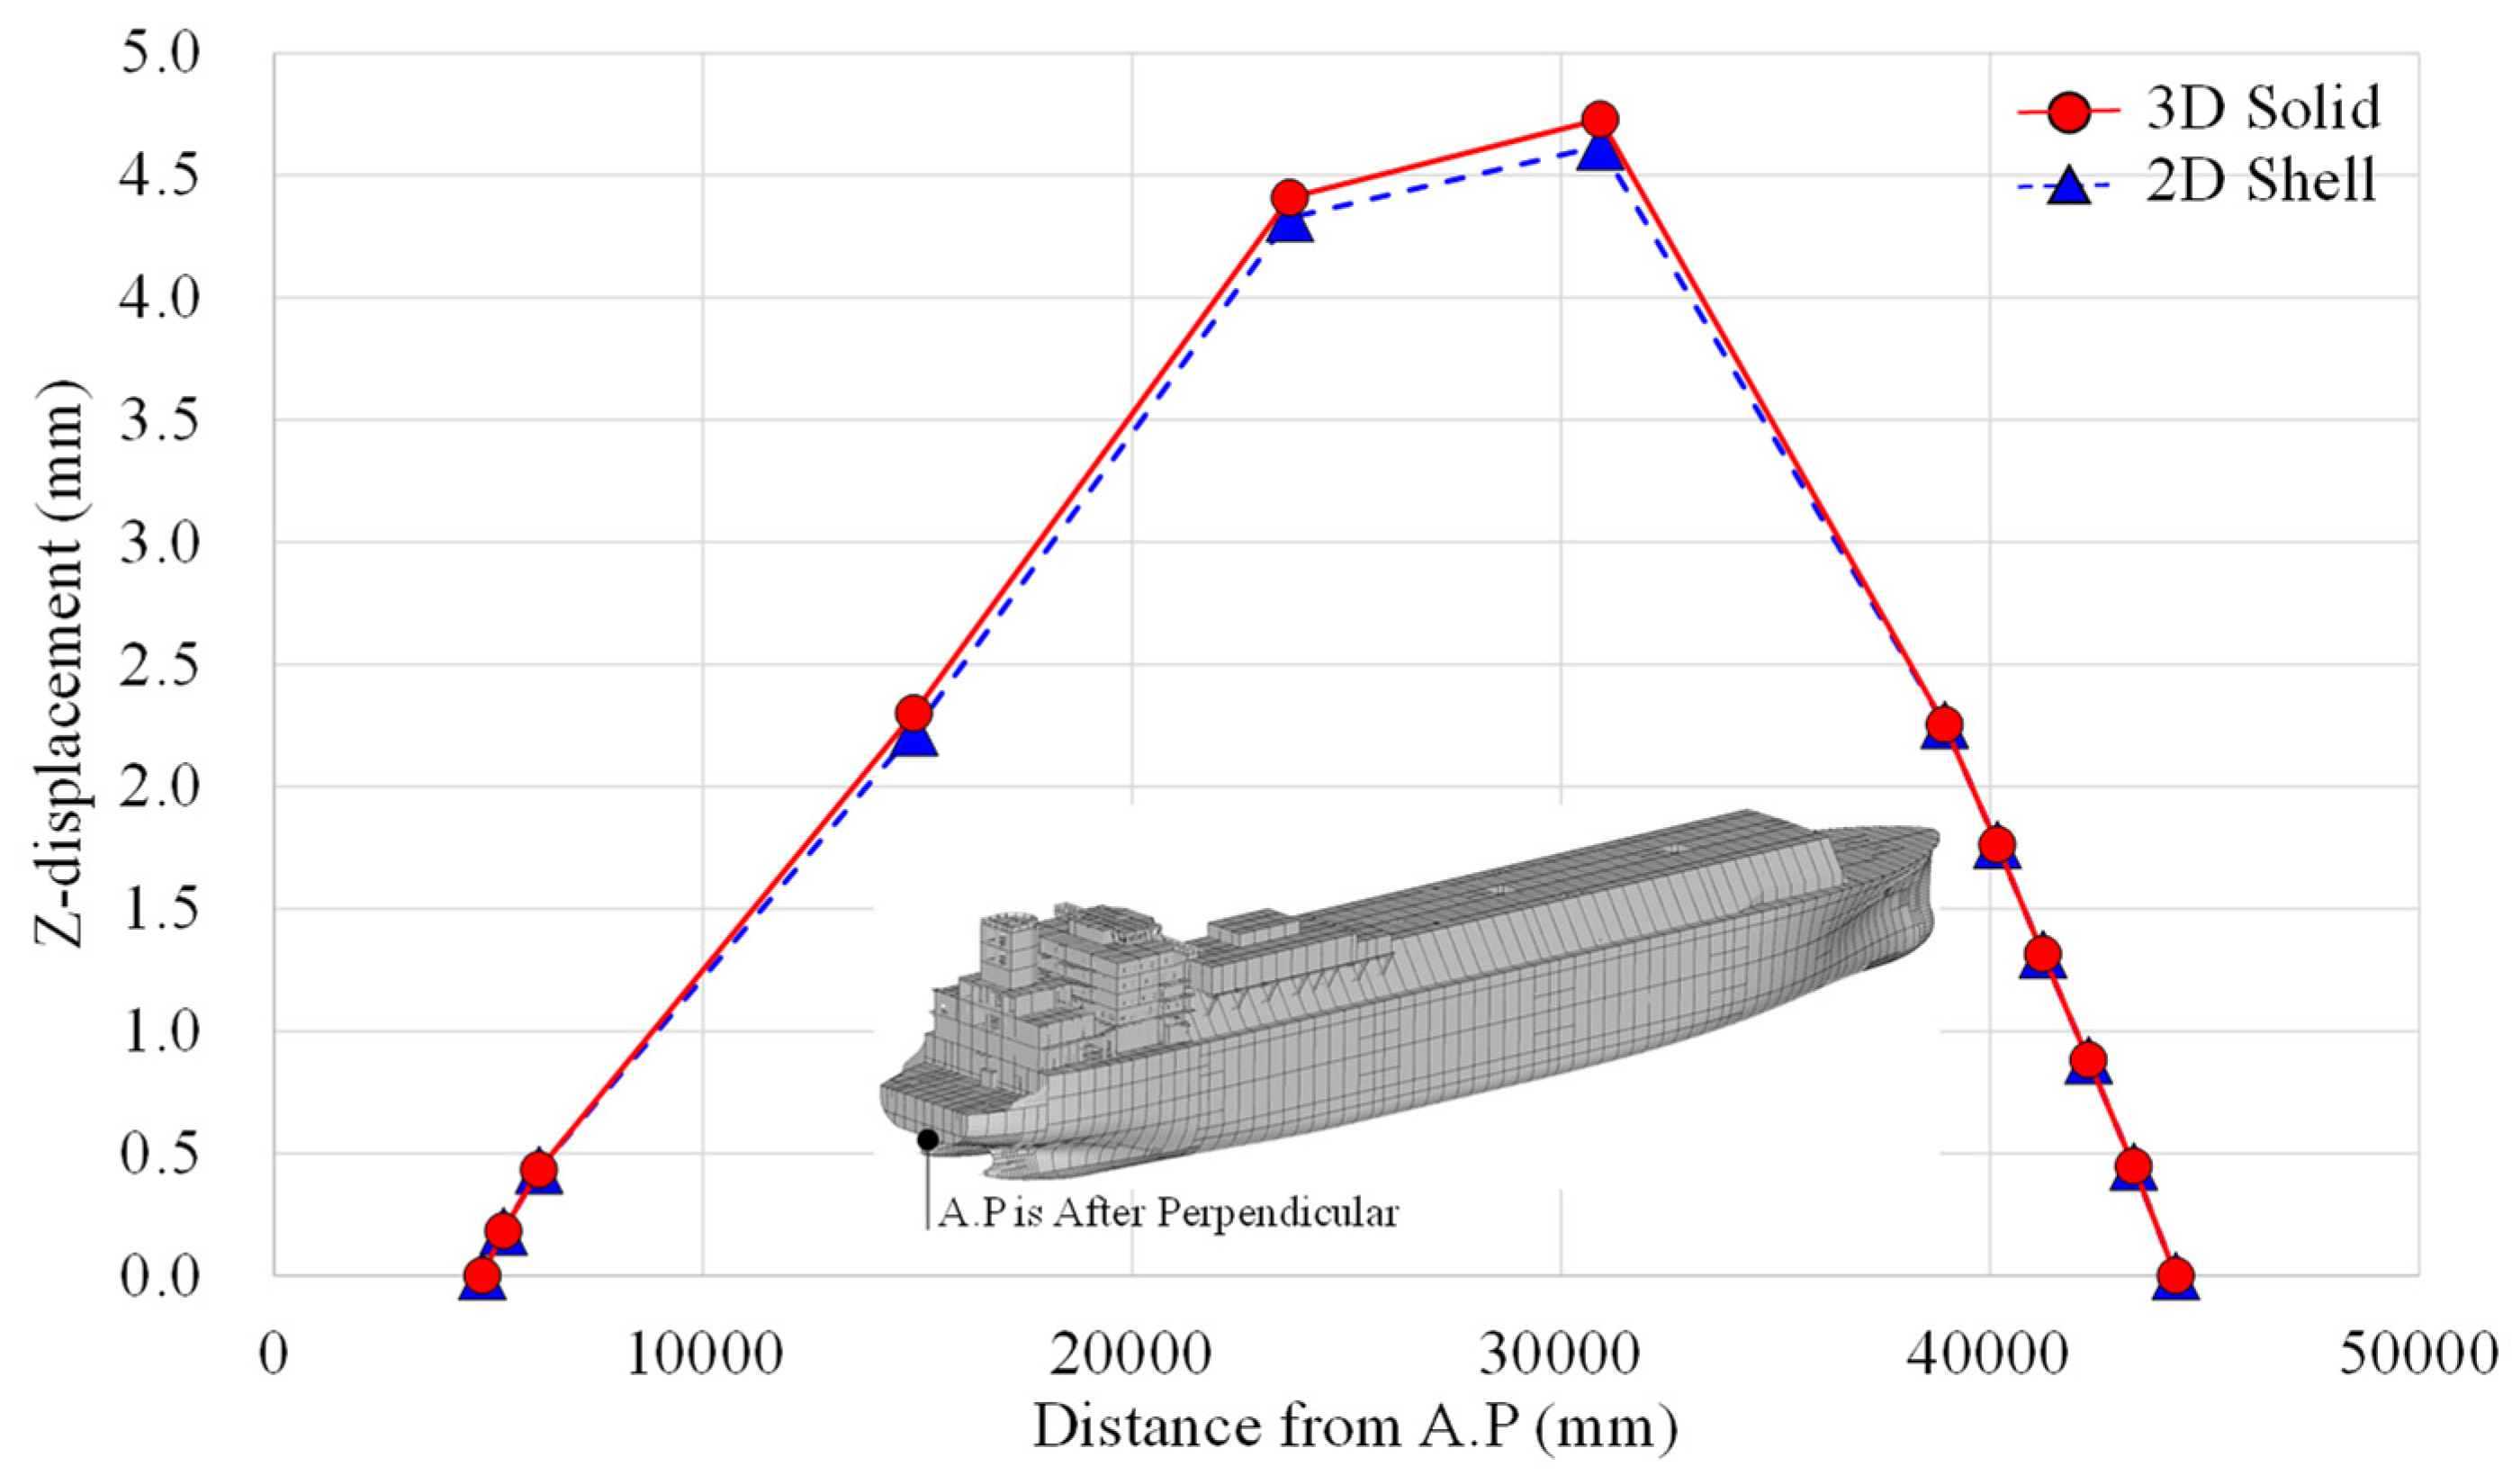
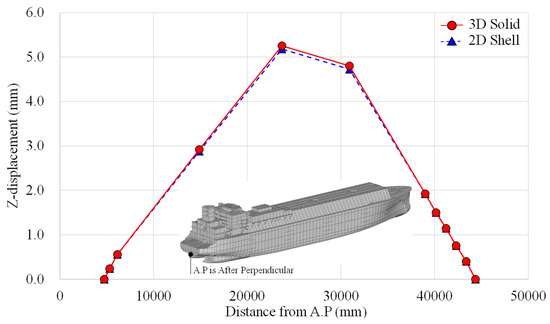
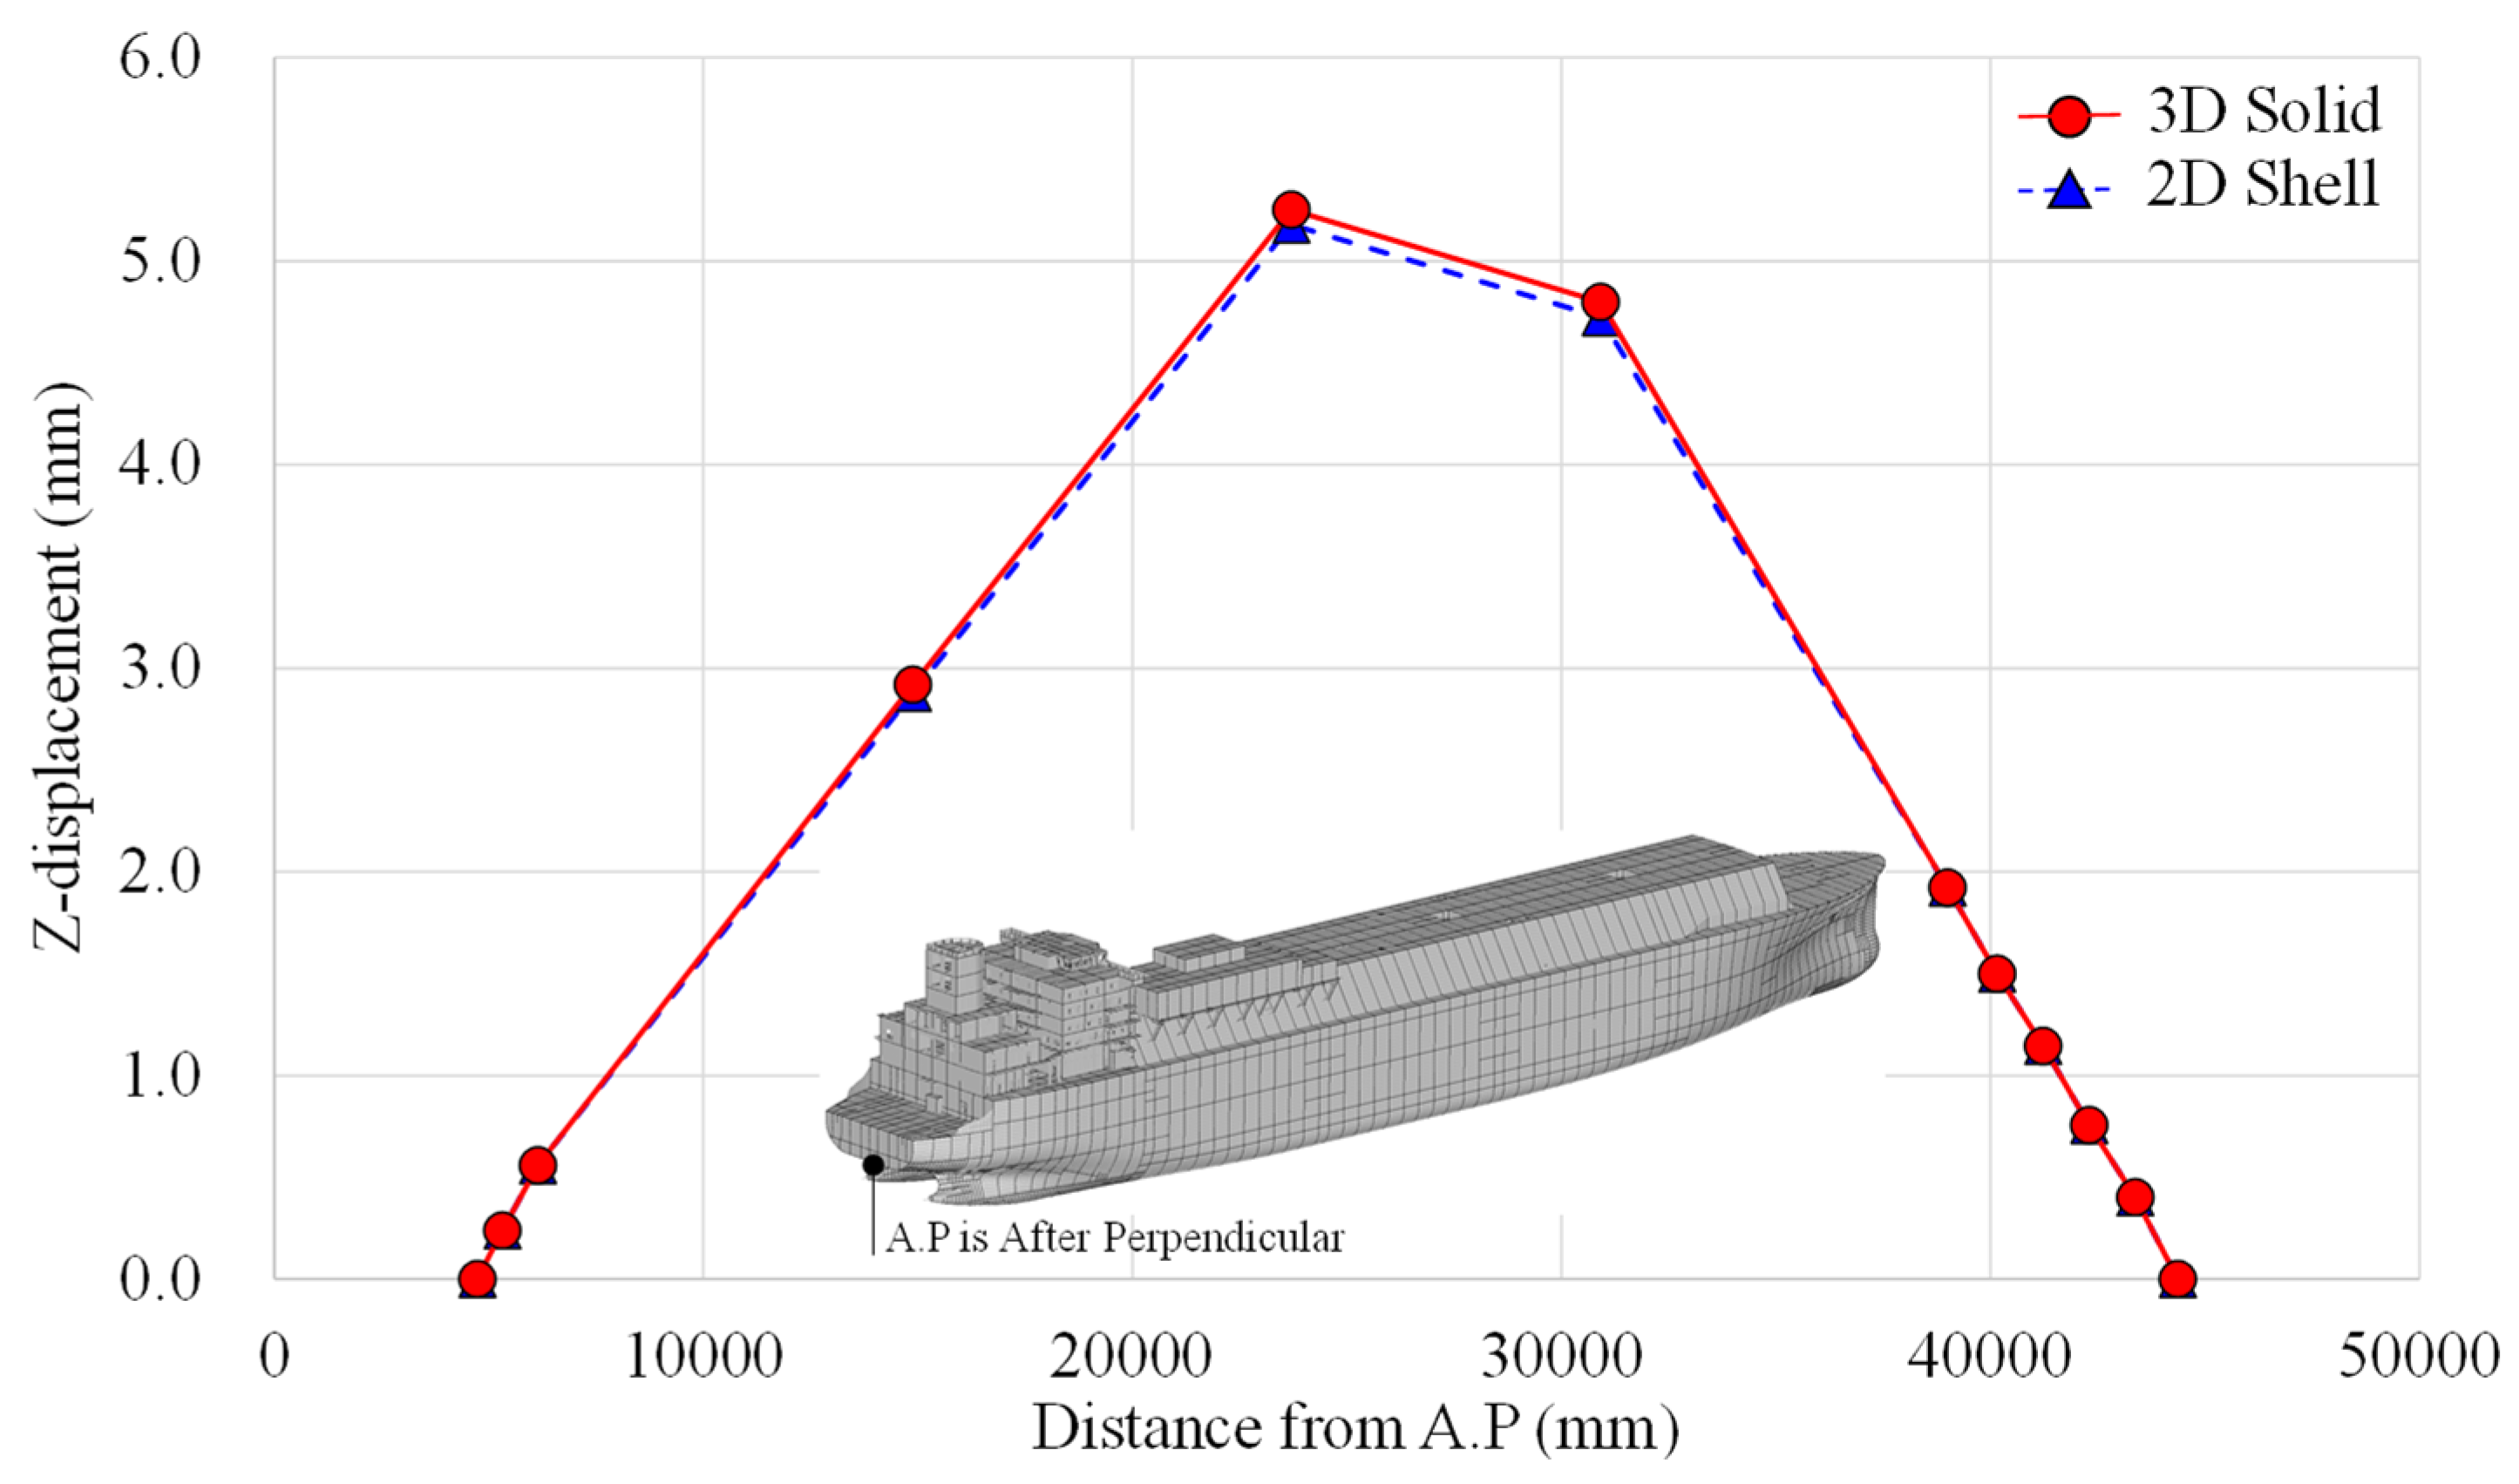
The comparison curves in Figure 7 and Figures 9, 11, 13 and 14 use vertical displacement Uz extracted from a common path along the centerline bottom-shell plating (keel reference line) through the stern-boss longitudinal region. The extraction nodes are therefore located at the hull bottom rather than on an arbitrary upper surface. Global contour plots use millimeters as the displacement unit.
Figure 7.
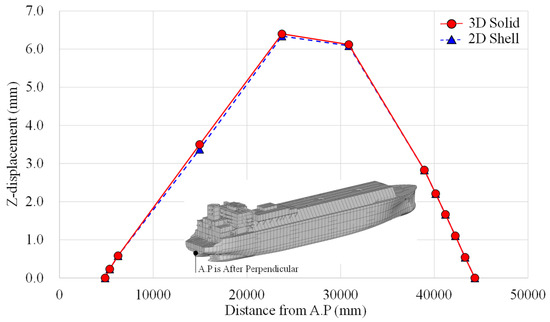
Vertical-deflection comparison along the keel-line extraction path for the launching pre-condition (displacement in mm).
Figure 7 compares the vertical deflection (Z-displacement) profiles along the keel-line extraction path for the launching pre-condition, demonstrating that both the shell-dominant and solid-region finite element models reproduce nearly identical global deformation modes, as evidenced by the closely overlapping curve shapes across the entire longitudinal distance from the aft perpendicular (A.P). The maximum downward deflection occurs in the stern-boss bottom region near the end of the extraction path, where the solid model predicts a peak value of 40.5 mm, while the shell model yields 38.2 mm, representing a +6.0% increase. This systematic difference is fundamentally attributable to the distinct kinematic capabilities of the two element formulations: the shell idealization, based on Reissner–Mindlin theory with averaged transverse-shear recovery, enforces a plane-section assumption that inherently suppresses through-thickness deformation and sectional warping, whereas the three-dimensional solid continuum elements explicitly resolve transverse normal strain, full shear transfer, and local Poisson-induced distortion within the thick cast bossing. Under the launching pre-condition, the vessel is supported along discrete launching ways, generating concentrated reaction forces and a pronounced negative bending moment in the overhanging aft-body, which locally amplifies shear deformation and sectional distortion in the bulky stern-boss region. The solid model captures this added local compliance—approximately 2.3 mm of additional deflection—that the shell model effectively averages out due to its mid-surface representation. Critically, the fact that both curves maintain an identical longitudinal gradient and zero-crossing points confirms that the shell model reliably reproduces the global hull-girder bending behavior, making it a computationally efficient screening tool even for transient construction-stage loads. However, the solid model’s larger deflection provides a more physically representative baseline for any subsequent local interface assessment, such as stern-tube bearing alignment or launch-way clearance verification, where the absolute displacement magnitude governs engineering decisions. Thus, for the launching pre-condition, the shell model is adequate for global deformation compatibility, whereas the solid model remains necessary when local compliance and three-dimensional response at the stern-boss–stern-tube interface are of design concern.
Figure 8 confirms a smooth vessel-scale bending mode without an isolated numerical discontinuity at the stern boss. The maximum response remains at the stern-boss bottom/keel-line region identified in the extraction path.
Figure 8.
Global vertical-deformation contour under the launching pre-condition (mm).
Figure 9 presents the vertical deflection profiles along the keel-line extraction path for the ballast operational state with the after-peak tank (APT) empty, revealing that both the shell-dominant and solid-region models maintain an almost perfectly coincident longitudinal deformation mode, with the solid model consistently yielding a larger downward displacement. The maximum deflection recorded at the stern-boss bottom region is 41.8 mm for the shell model and 44.3 mm for the solid model, corresponding to a +6.0% increase—a percentage difference that is virtually identical to that observed under the launching pre-condition (Figure 7). This persistent ratio, despite a substantially altered loading environment (reduced aft ballast weight and a different still-water bending moment distribution), provides compelling evidence that the shell–solid discrepancy is fundamentally a model-form effect governed by local stiffness representation rather than a load-specific artifact. Theoretically, the shell idealization operates under Reissner–Mindlin kinematics with an averaged transverse-shear recovery, which enforces a constrained through-thickness strain field and suppresses sectional warping at the thick cast bossing. In contrast, the three-dimensional continuum elements explicitly resolve transverse normal strain, full shear transfer, and Poisson-induced local distortion, thereby introducing additional local compliance that manifests as the 2.5 mm absolute increase in peak deflection. Under the ballast/APT-empty condition, the vessel operates with a relatively light aft load, which reduces the overall hogging moment compared to full-ballast states; however, the local shear demand at the stern-boss transition remains sufficient to activate the three-dimensional deformation modes that the shell formulation cannot capture. From an engineering decision-making perspective, this figure confirms that the shell model is fully adequate for tracking global deflection trends and relative changes between operational states since the curve shapes and gradients are essentially identical—but the solid model provides the more conservative and physically representative absolute displacement (44.3 mm) required for precise shaft-alignment input, bearing-offset calculations, and clearance verification under light-ballast operating conditions. Thus, for the APT-empty ballast case, the shell model serves as an efficient global screening tool, while the solid representation remains indispensable whenever local three-dimensional compliance at the stern-boss–stern-tube interface influences design acceptance.
Figure 9.
Vertical-deflection comparison along the keel-line extraction path for the ballast/APT-empty condition (mm).
Figure 10 shows continuous deformation through the aft-hull transition. No localized displacement jump is introduced by the RBE2 interface or the solid–shell transition, which supports the numerical compatibility of the assembled model.
Figure 10.
Global vertical-deformation contour for the ballast/APT-empty condition (mm).
Figure 11 illustrates the vertical deflection profiles along the keel-line extraction path for the ballast operational state with the after-peak tank (APT) completely filled to 100% capacity, demonstrating that both the shell-dominant and solid-region models preserve nearly identical global deformation patterns, as indicated by the closely superimposed curve shapes across the entire longitudinal domain. Under this increased aft-loading condition, the maximum downward deflection at the stern-boss bottom region reaches 43.5 mm in the shell model and 46.1 mm in the solid model, corresponding to a +6.0% increase (an absolute difference of 2.6 mm). This percentage deviation remains remarkably consistent with the launching pre-condition (Figure 7) and the ballast/APT-empty case (Figure 9), reinforcing the interpretation that the shell–solid discrepancy is a load-independent, model-form effect rooted in the fundamental representation of local structural compliance rather than a response to variations in hydrostatic pressure or ballast weight. Theoretically, the shell idealization, which represents the stern boss as a mid-surface with an assigned thickness, imposes kinematic constraints that prevent localized warping, non-uniform sectional distortion, and the full three-dimensional rigidity distribution of the cast volume. In contrast, the solid continuum formulation explicitly resolves the full volumetric response of the bossing, capturing the rotational freedom and local distortion that naturally occur under the elevated bending moment and concentrated shear forces generated by the fully ballasted APT. The 100% filled condition substantially increases the overall hogging moment and intensifies the local load-transfer demand at the stern-boss transition; nevertheless, the solid model’s enhanced flexibility, manifesting as the additional 2.6 mm of displacement, remains bounded within the same 6% range observed across lighter load cases, confirming that the effect is intrinsic to the local geometry and element kinematics rather than being amplified by the heavier loading. From an engineering decision-making standpoint, the shell model serves as an efficient and reliable tool for tracking global bending trends and evaluating the relative change in deflection between ballast conditions (empty versus full). However, the solid model provides the more conservative and physically representative absolute deflection value (46.1 mm), which is essential for precise shaft-alignment calculations, stern-tube bearing offset determinations, and clearance assessments under the fully ballasted operational state—where accurate local compliance data at the interface region directly influence propulsion-system reliability and design acceptance.
Figure 11.
Vertical-deflection comparison along the keel-line extraction path for the ballast/APT-100–full condition (mm).
Figure 12 demonstrates that the aft-hull response remains smooth under the full-ballast condition. The local solid region follows the surrounding shell-hull curvature without a spurious stiffness discontinuity.
Figure 12.
Global vertical-deformation contour for the ballast/APT-100–full condition (mm).
Figure 13 compares the vertical deflection profiles along the keel-line extraction path for the design-draught operational state with the after-peak tank (APT) empty, revealing that both the shell-dominant and solid-region models generate almost perfectly overlapping longitudinal deformation curves, thereby confirming identical global hull-girder bending behavior. Under this deep-draught condition, the maximum downward displacement at the stern-boss bottom region reaches 42.9 mm for the shell model and 45.6 mm for the solid model, yielding an absolute difference of 2.7 mm and a percentage increase of +6.3%—which is the largest shell–solid deviation observed among all five operational cases. This marginally elevated ratio, when compared to the consistent 6.0% observed in the launching and ballast cases, suggests that the combination of a deep design draught and an empty APT produces a steeper longitudinal bending gradient and a more pronounced localized shear demand at the stern-boss transition, thereby slightly amplifying the compliance difference inherent to the two modeling approaches. Theoretically, the shell idealization represents the thick cast bossing as a mid-surface with homogenized stiffness properties, which inherently constrains sectional warping, local rotational flexibility, and the non-uniform distortion of the cross-section that naturally occurs under the combination of high hydrostatic pressure and reduced aft-ballast counter-moment. In contrast, the three-dimensional solid continuum formulation explicitly resolves the full volumetric rigidity distribution, permitting localized deformation modes that contribute to additional compliance at the interface region—manifesting here as the 2.7 mm increment. Despite this being the largest relative difference, the fact that the percentage remains tightly bounded within the narrow 5.9–6.3% range across all five load cases confirms that the model-form effect is fundamentally a local stiffness artifact rather than a loading-induced amplification. From an engineering decision perspective, the shell model remains a computationally efficient and fully adequate tool for global deflection screening, trend analysis, and load-path verification under service-draught conditions. However, the solid model’s more conservative absolute deflection (45.6 mm) becomes critically important when precise stern-tube bearing alignment, shafting offset calculations, or clearance verification are required for design-draught operations—particularly given that this case exhibits the largest discrepancy, underscoring the necessity of a solid submodel when interface-level displacement fidelity governs the acceptance criteria.
Figure 13.
Vertical-deflection comparison along the keel-line extraction path for the design-draught/APT-empty condition (mm).
Figure 14 confirms that the design-draught/APT-empty response is controlled by global hull bending with a localized stiffness transition at the stern boss. The corrected caption distinguishes this case from the ballast/full-tank case.
Figure 14.
Global vertical-deformation contour for the design-draught/APT-empty condition (mm).
Figure 15 presents the deflection profiles for the governing design-draught/APT-full condition, where the shell model records a peak absolute deflection of 44.2 mm and the solid model records 46.8 mm—an absolute difference of 2.6 mm. To quantify the systematic bias introduced by the modeling approach, this absolute delta translates to a relative increase of +5.9% for the solid idealization. Critically, these two metrics serve distinct purposes: the absolute values (44.2 and 46.8 mm) define the actual structural demand under the heaviest operational load and form the direct input for shaft-alignment and clearance checks; the relative percentage (+5.9%) functions solely as a diagnostic metric that confirms the consistency of the model-form effect, as it remains tightly bounded between 5.9% and 6.3% across all five operational states. This stability demonstrates that the shell–solid discrepancy is a persistent, load-independent stiffness artifact rather than a load-specific anomaly. From an engineering decision standpoint, the shell model provides a reliable absolute trend for global screening, while the solid model’s larger absolute value (46.8 mm) supplies the conservative, physically representative deflection required for interface-sensitive design evaluations such as stern-tube bearing offset calculations where the actual displacement magnitude, rather than the percentage difference, governs acceptance.
Figure 15.
Vertical-deflection comparison along the keel-line extraction path for the design-draught/APT-100–full condition (mm).
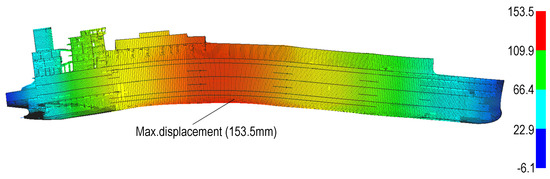
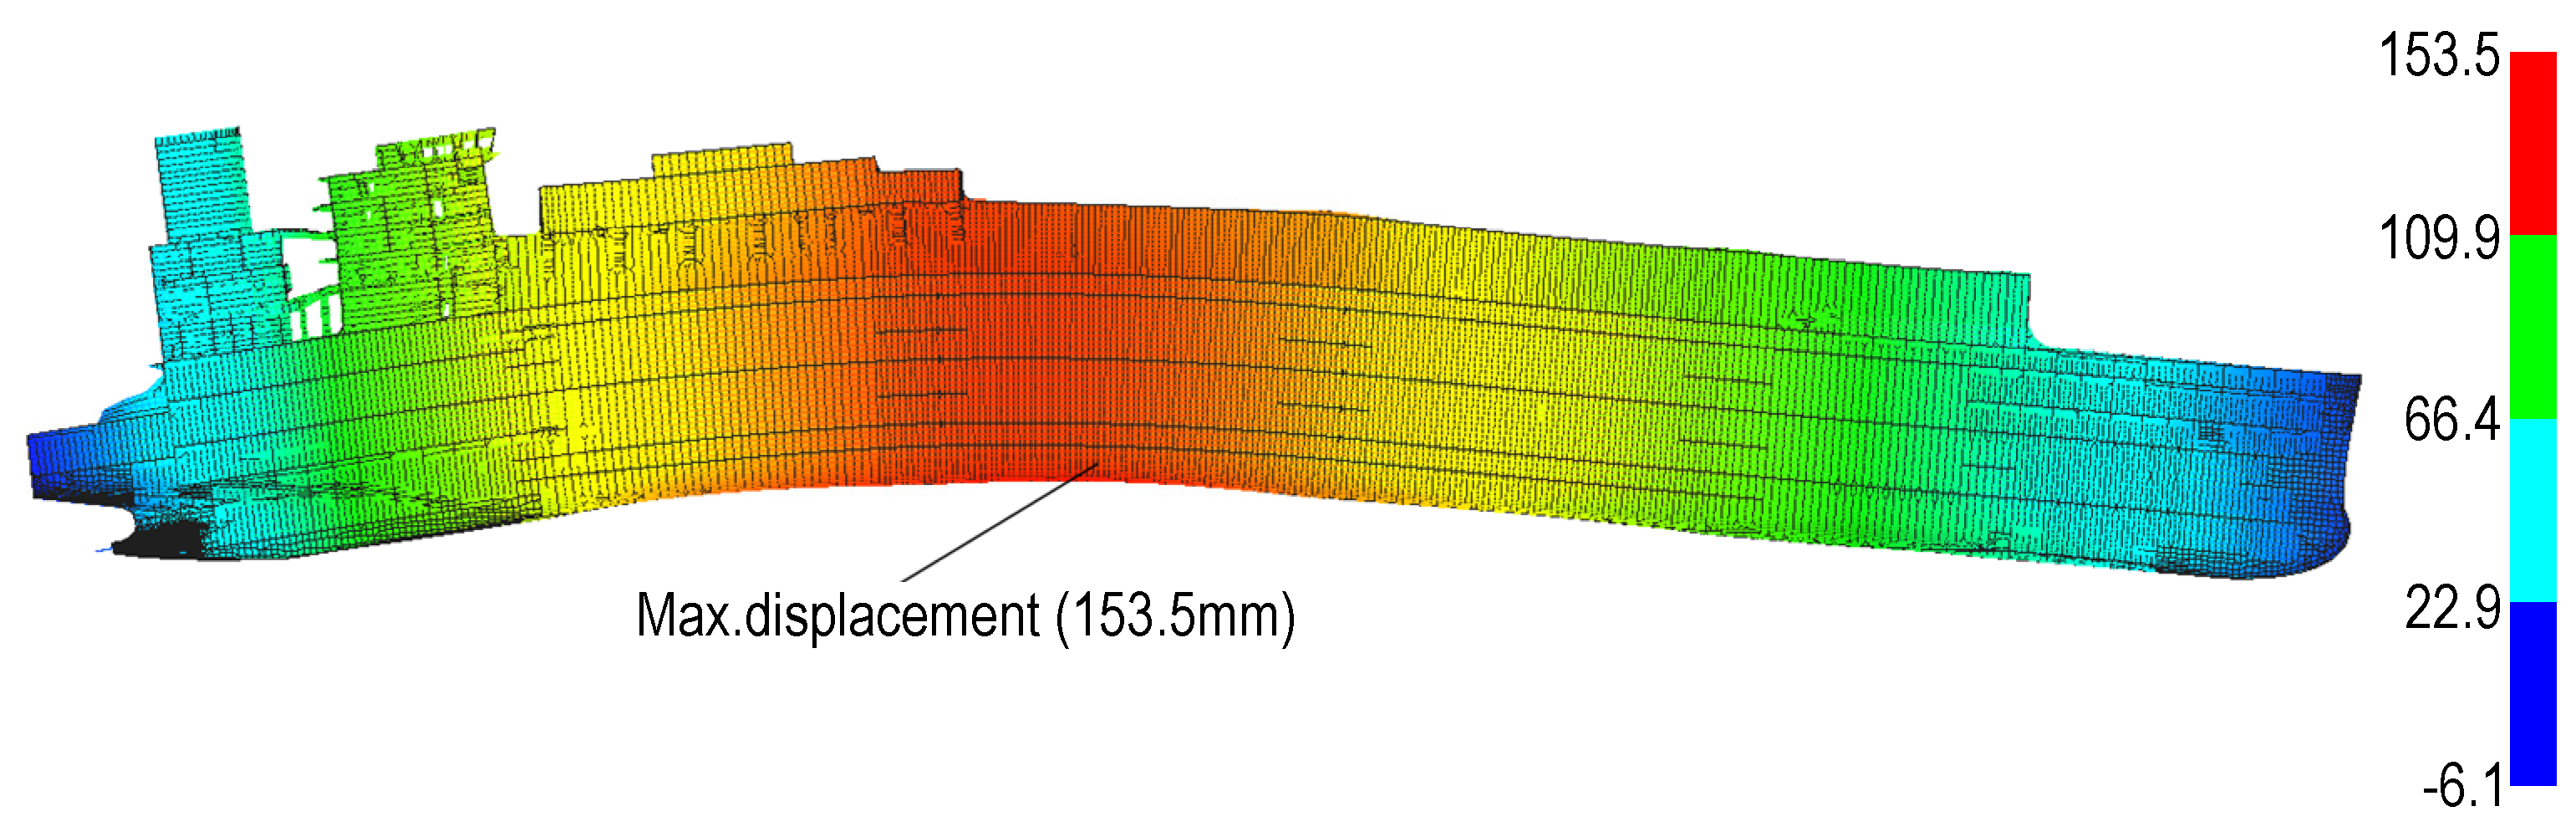
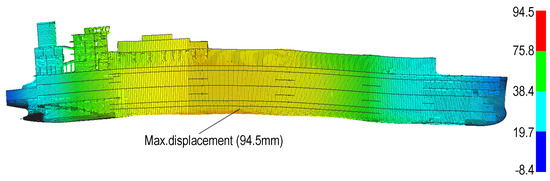
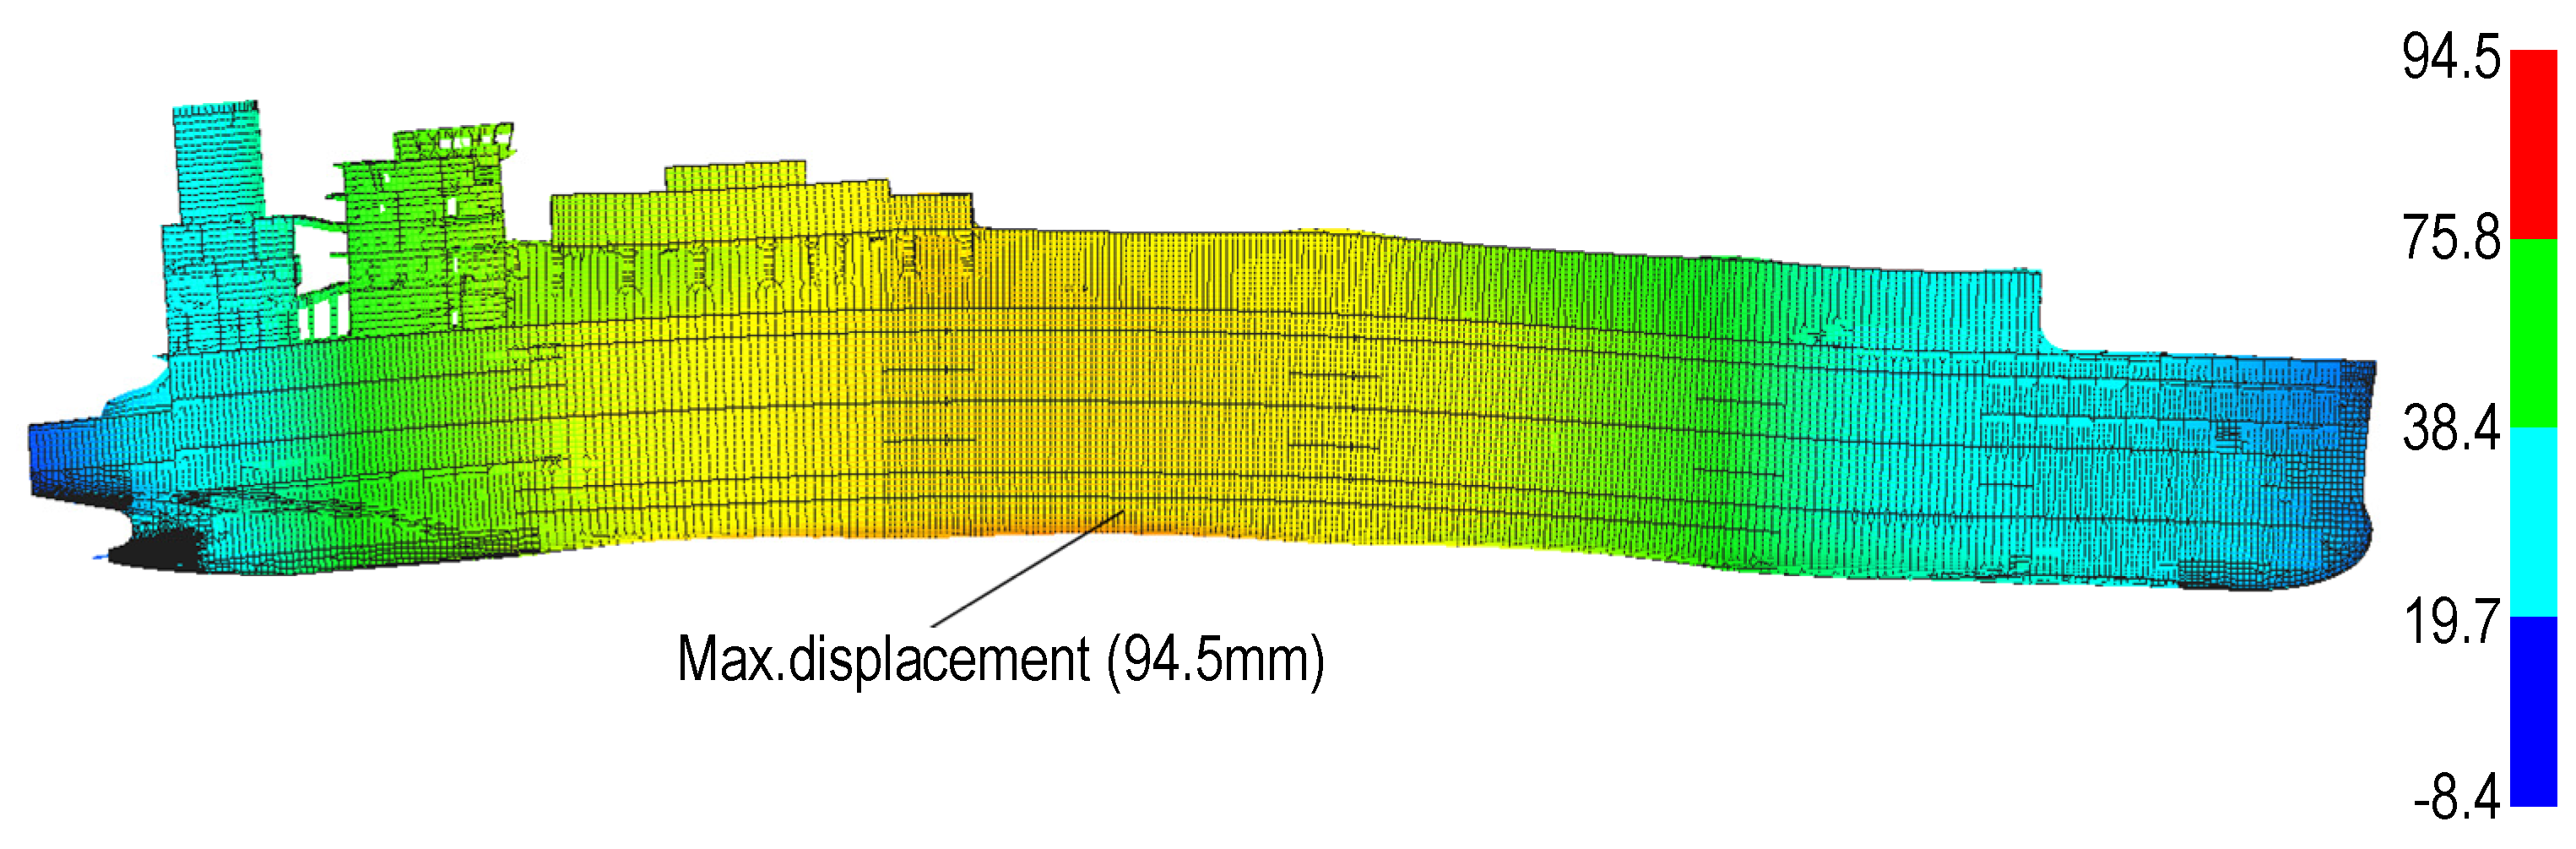
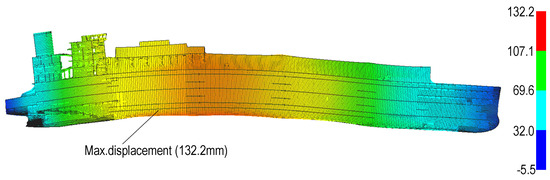
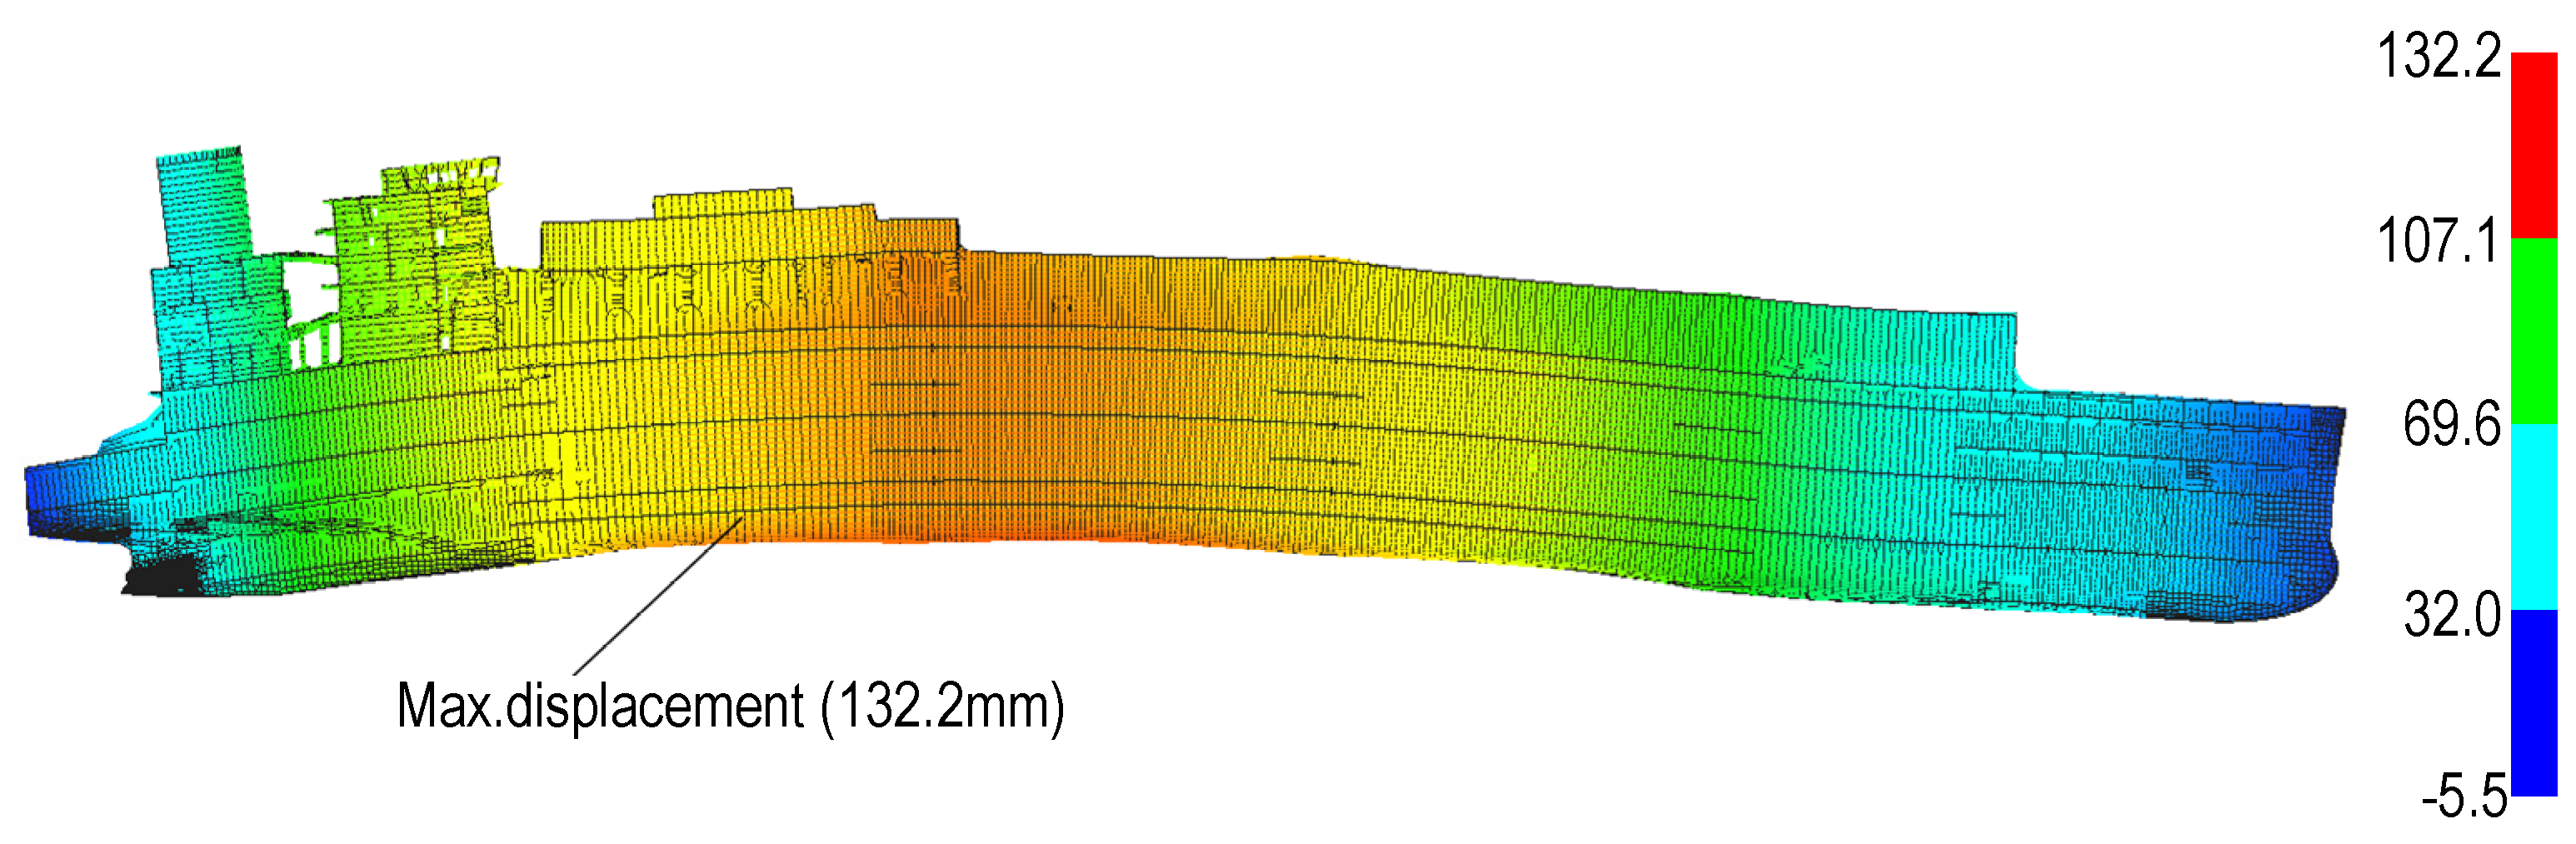
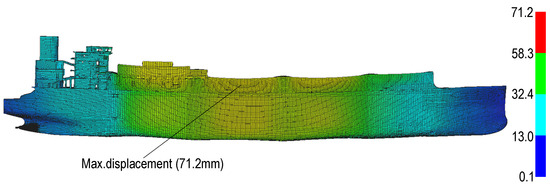
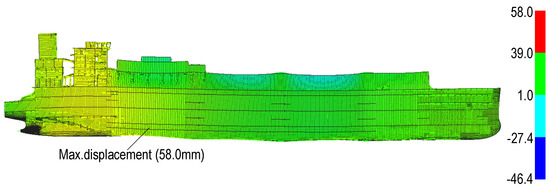
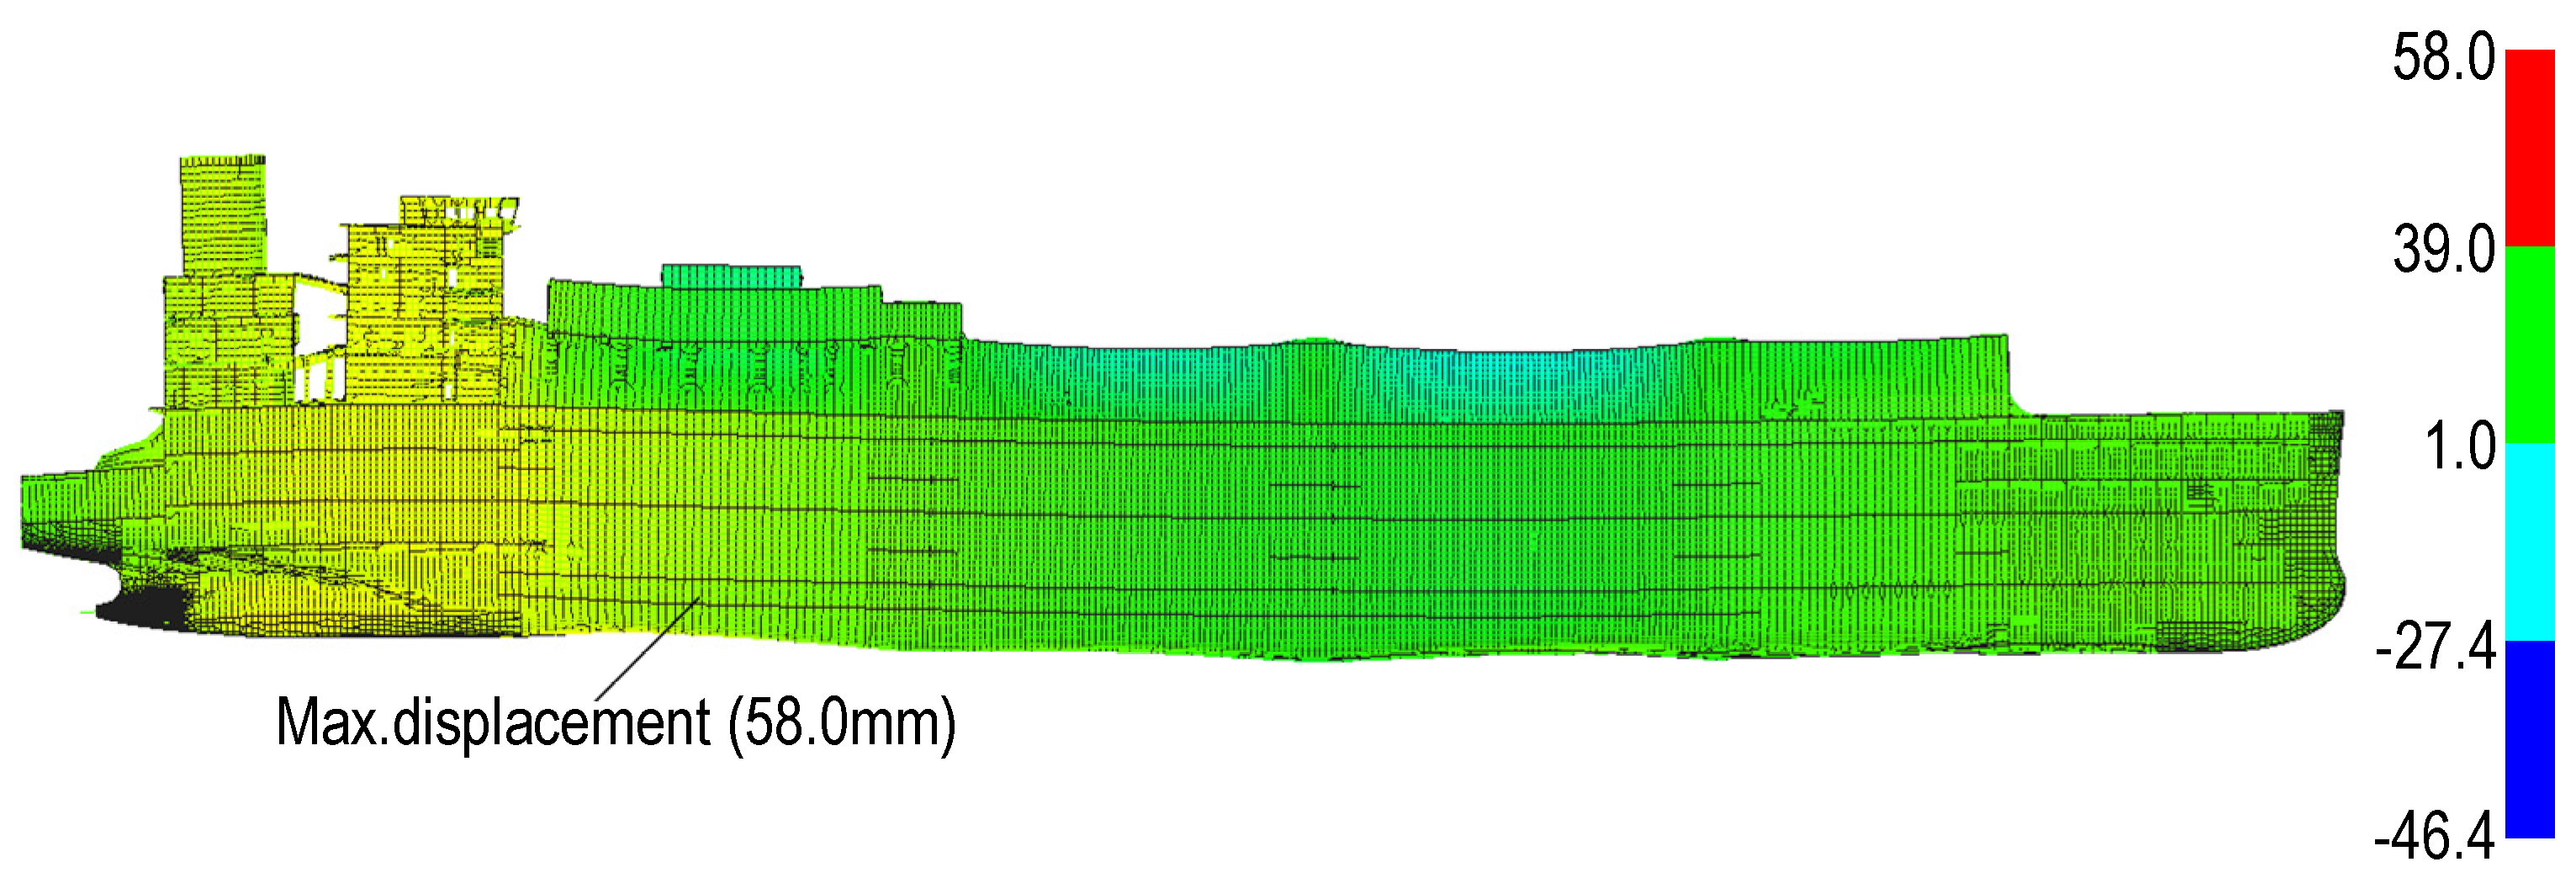
Figure 16 displays the governing vessel-scale deformation pattern. The maximum vertical displacement remains at the stern-boss bottom/keel-line region, whereas the traceable regional stress maximum occurs at the boss-to-supporting-frame transition; the stern-tube interface is assessed separately as a shell–solid comparison region. Across the five operational states, the shell model predicts maximum deflections of 38.2–44.2 mm and the solid model 40.5–46.8 mm. The solid-to-shell increase remains narrowly bounded between 5.9% and 6.3%. This stable ratio, together with the mesh-convergence results, demonstrates a repeatable model-form effect but not physical validation, because both formulations share the same loading assumptions and global constraints. Consistent with BV NR592 [14], the shell-dominant model is used for global deformation compatibility and load-path screening, while the locally solid representation is retained when interface stress, transverse shear, through-thickness response, or sectional warping is required.
Figure 16.
Global vertical-deformation contour for the design-draught/APT-100–full condition (mm).
All runs were performed on a workstation equipped with dual Intel Xeon Gold 6248 processors (40 cores total) and 128 GB RAM using MSC Nastran 2022 (refer to Table 6). Although the global element counts are similar, the solid-region model requires approximately 63% more wall-clock time and 20% more peak memory because the three-dimensional interface formulation increases matrix assembly and local solution cost.
Table 6.
Direct computational-cost comparison per load case.
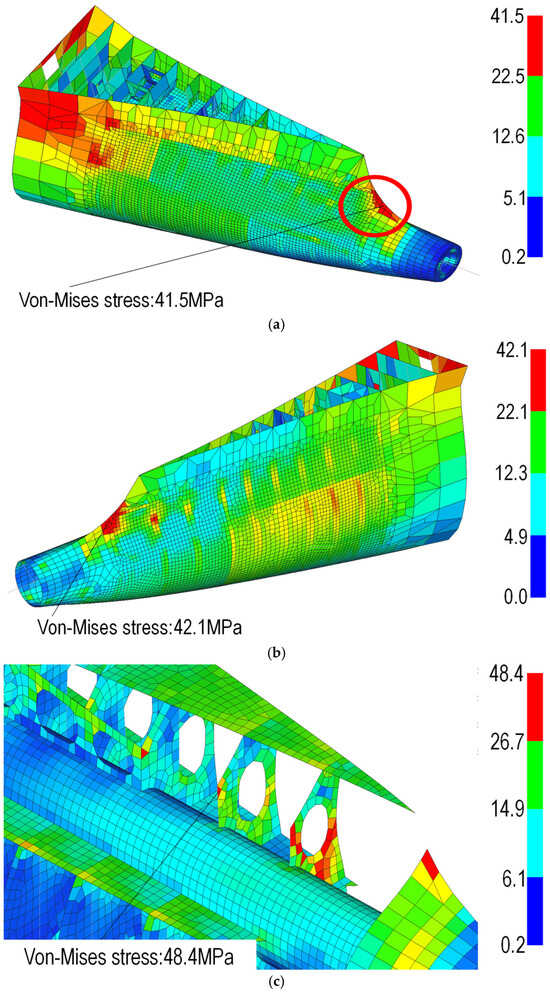
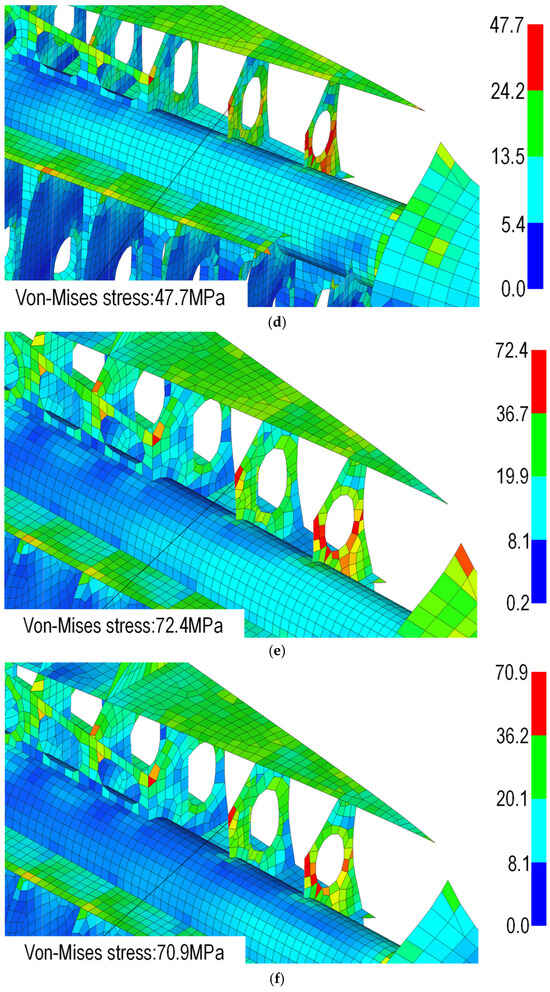
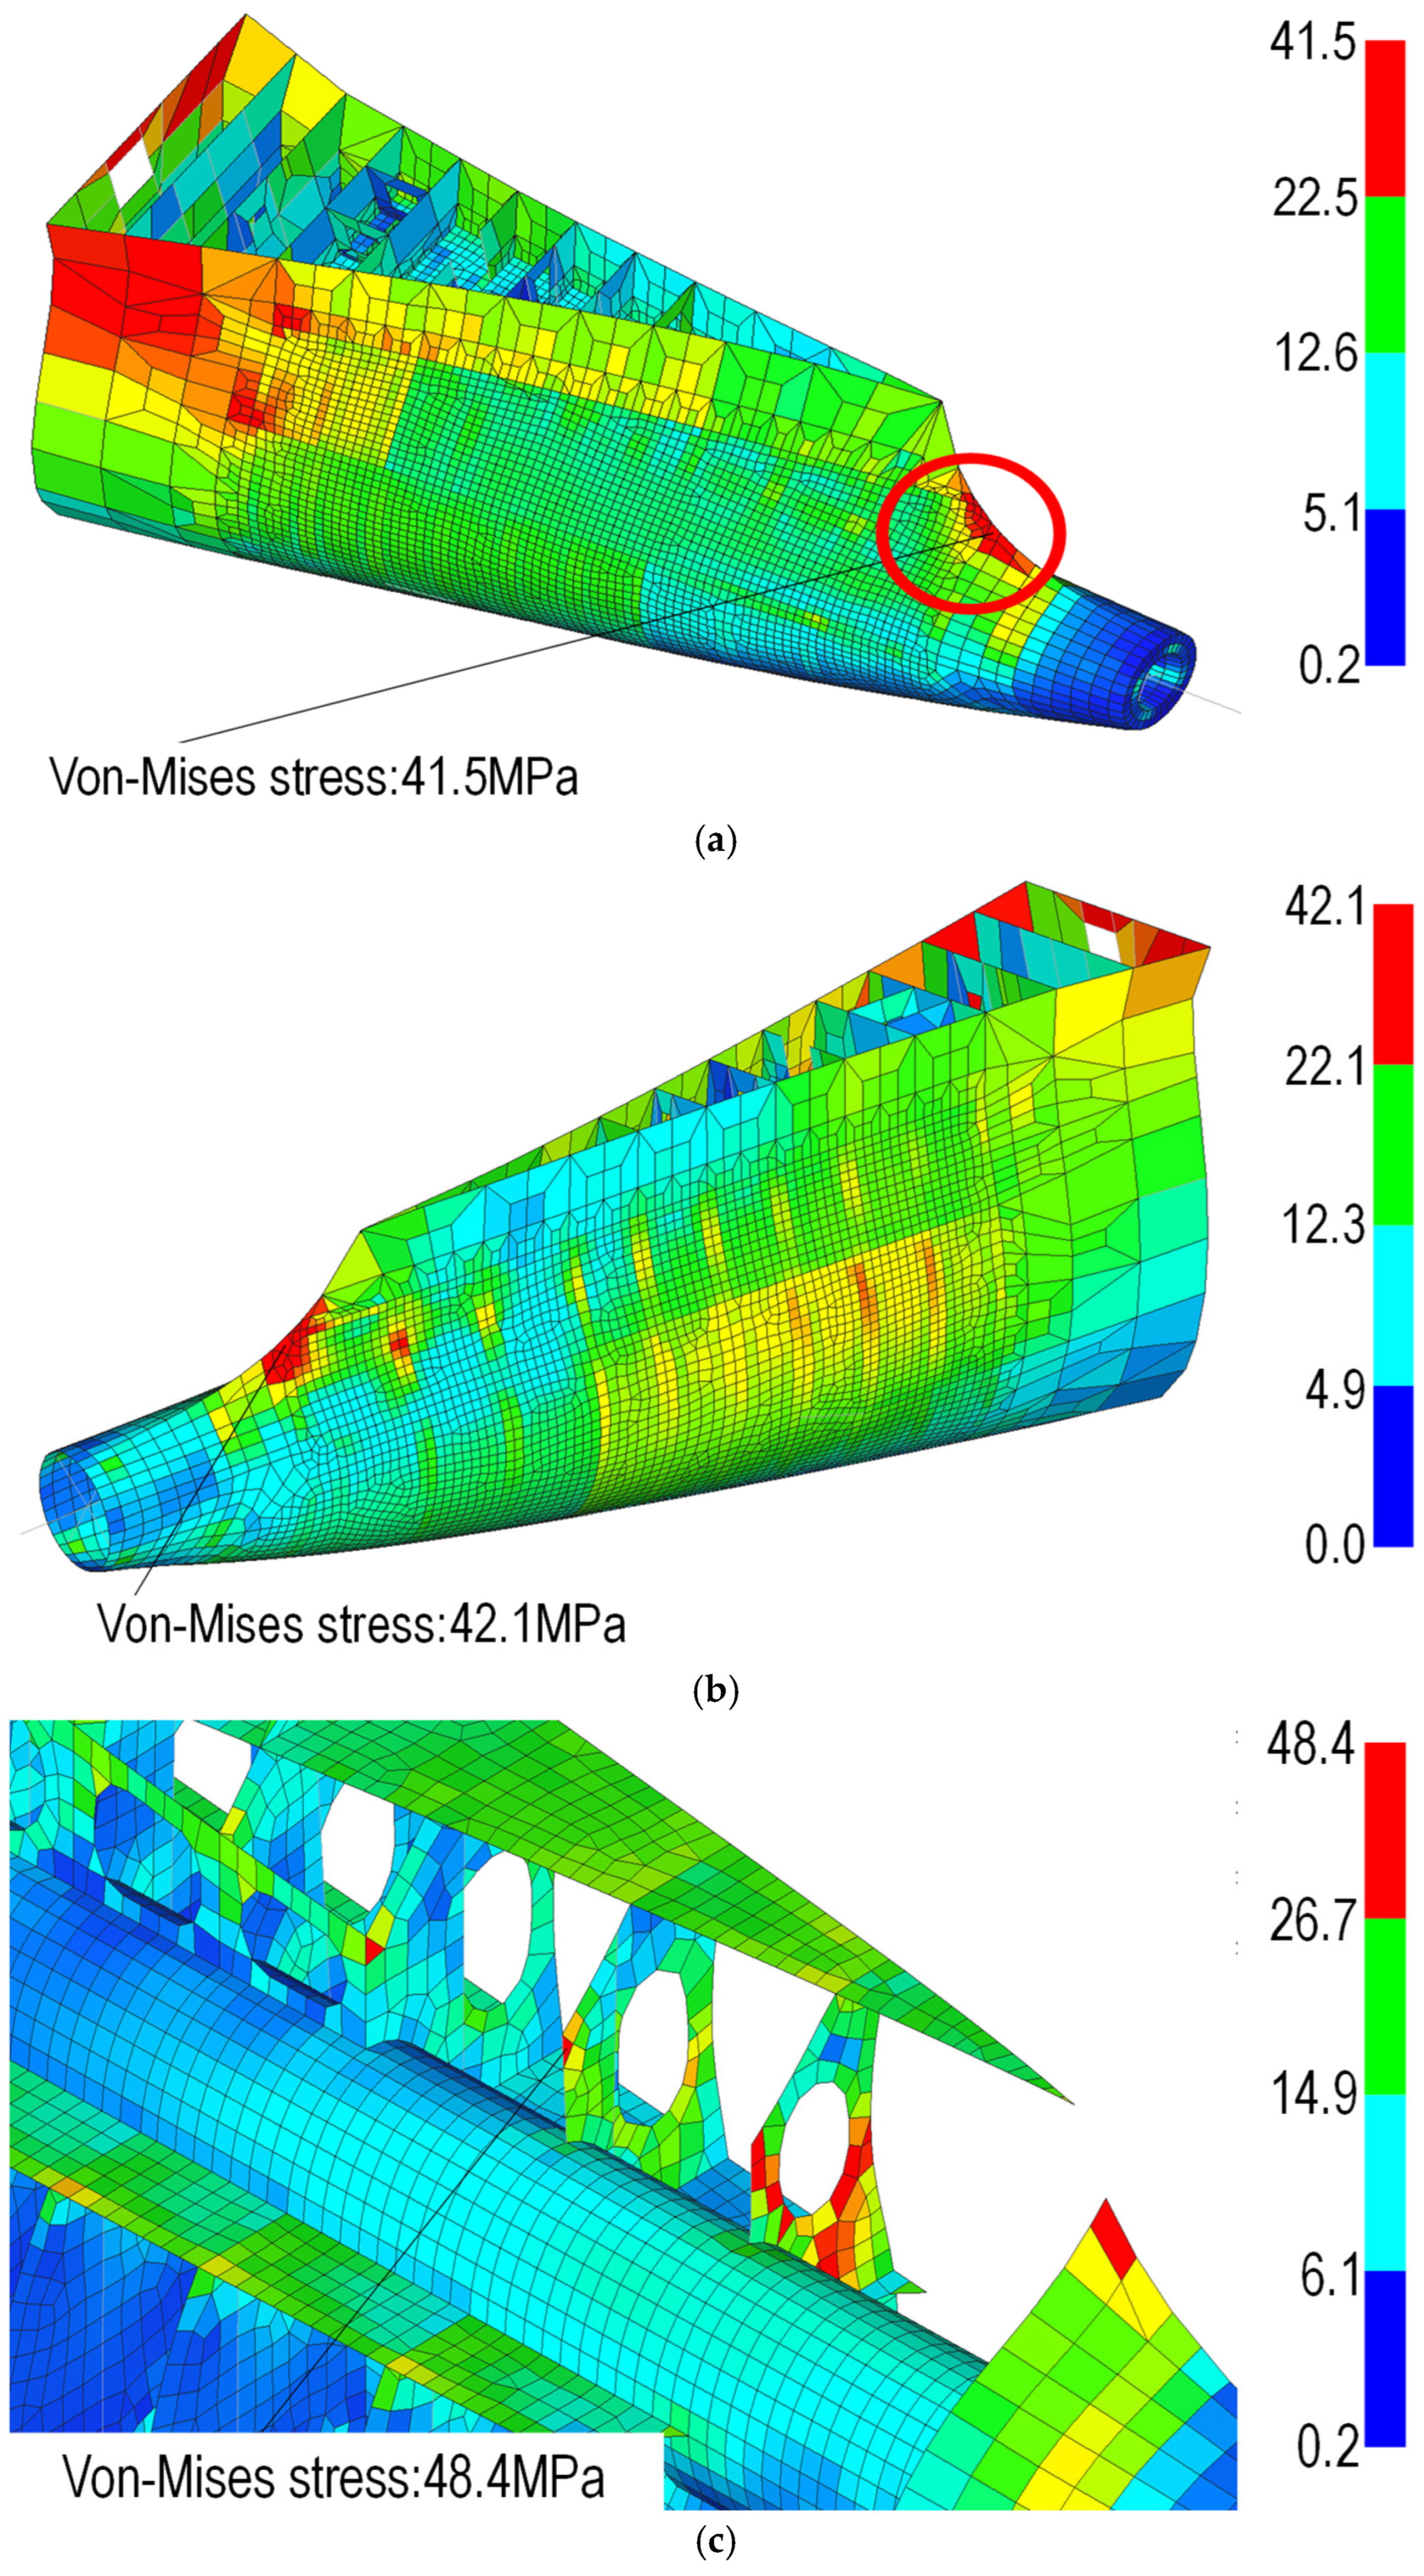
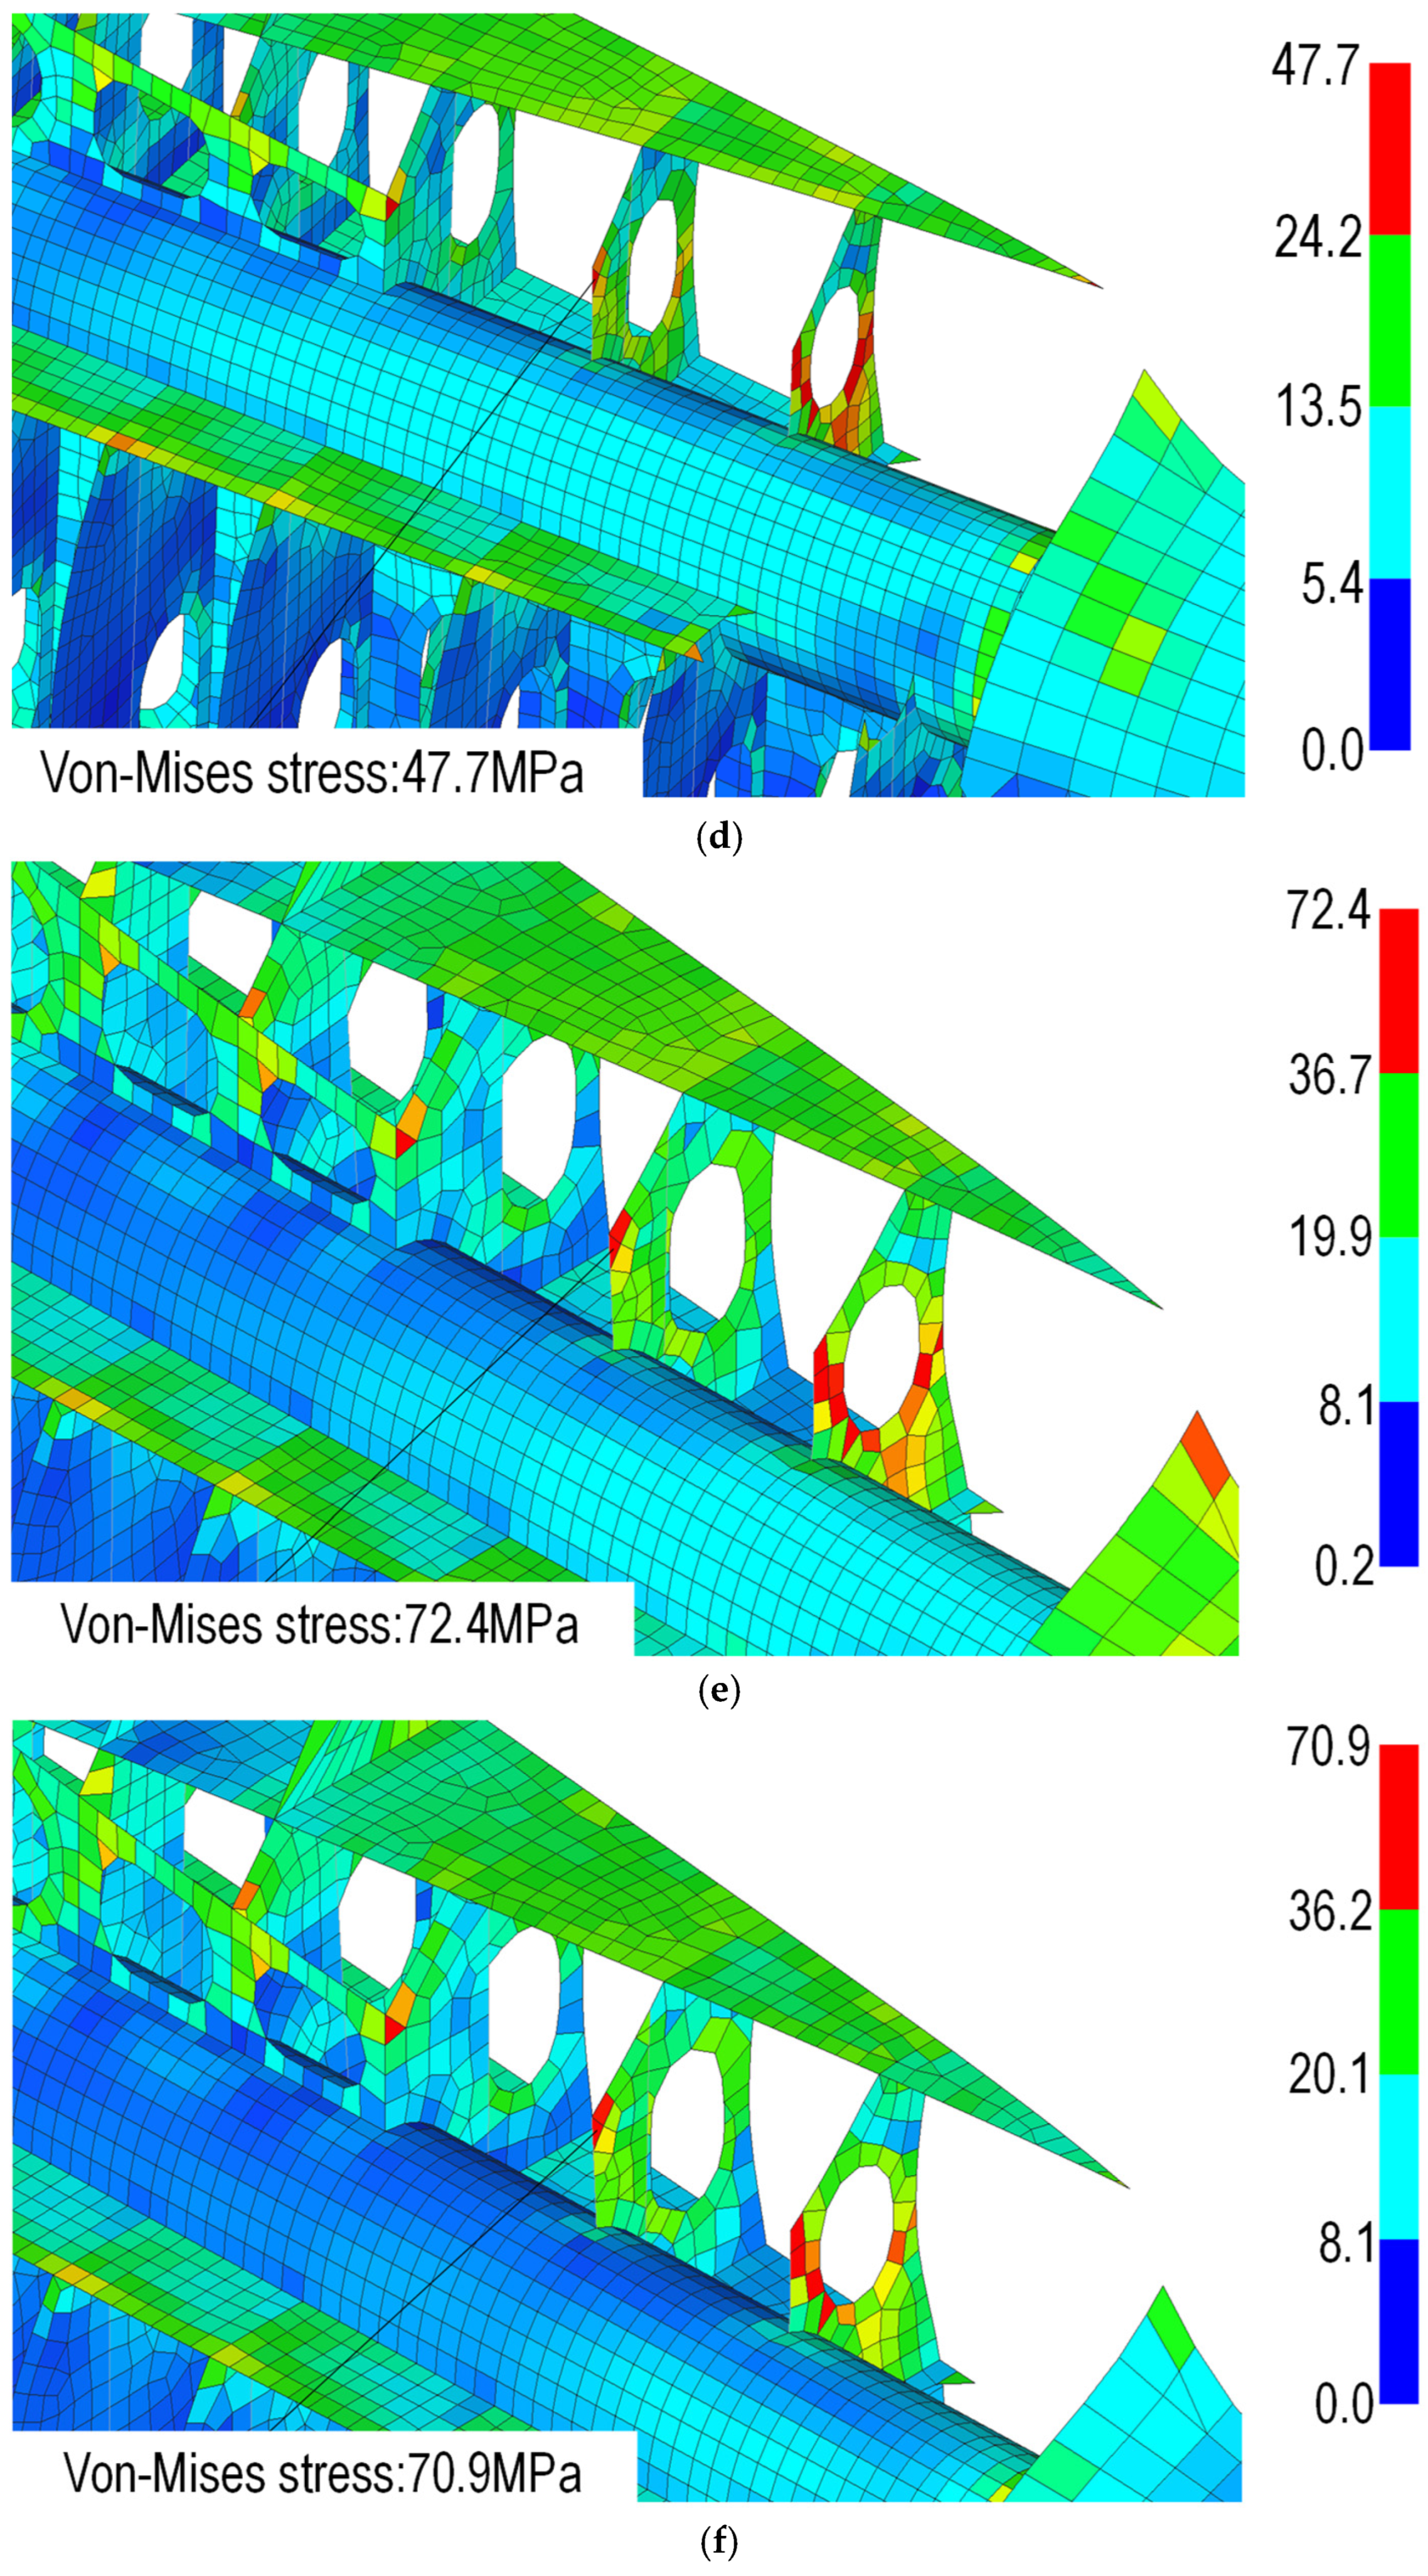
Figure 17 presents paired solid- and shell-model contours for three representative loading states spanning the lower, intermediate, and upper portions of the traceable regional stress range. In each pair, the dominant regional response remains concentrated at the boss-to-supporting-frame transition. Increasing hydrostatic demand intensifies this load path without relocating the regional maximum. The similar contour topology supports the shell model for global response screening, while the separate stern-tube interface set is used only to quantify three-dimensional constraint, transverse shear, and through-thickness transfer in the locally solid representation.
Figure 17.
Representative von-Mises stress distributions for the solid and shell idealizations: (a) von-Mises stress (solid)_launching pre-condition; (b) von-Mises stress (shell)_launching pre-condition; (c) von-Mises stress (solid)_ballast APT TK empty condition; (d) von-Mises stress (shell)_ballast APT TK empty condition; (e) von-Mises stress (solid)_APT TK 100% filling condition; (f) von-Mises stress (shell)_APT TK 100% filling condition.
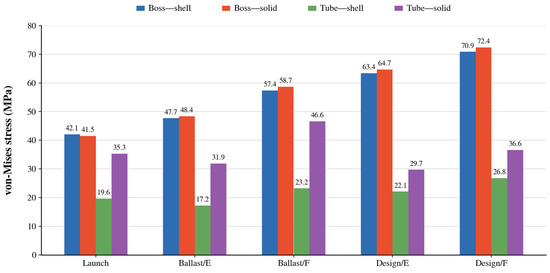
The maximum-deflection location is the stern-boss bottom/keel-line region for all cases. The regional peak stress reported in Table 7 occurs at the boss-to-supporting-frame transition. These values are centroidal von Mises stresses extracted from the same predefined physical element set at common mesh resolution and are therefore used for the controlled shell–solid comparison and nominal yield screening. Larger model-wide raw elemental maxima occur at isolated geometric discontinuities and RBE terminations outside this set; because they are non-averaged and mesh-sensitive, they are retained only as diagnostic hotspot indicators and are not used to calculate the stern-boss yield-utilization ratios. Figure 18 shows quantitative comparison of condition-specific von-Mises stress in the stern-boss regional extraction and the stern-tube/interface extraction.
Table 7.
Maximum displacement and traceable stern-boss regional stress for the five operational conditions.
Figure 18.
Quantitative comparison of condition-specific von-Mises stress in the stern-boss regional extraction and the stern-tube/interface extraction. E = APT empty; F = APT 100% full.
3.3. Stress-Based Structural Integrity Assessment
Within the consistently extracted stern-boss region, peak von Mises stress increases from 41.5 MPa in the launching case to 72.4 MPa in the design-draught/APT-full case for the solid model; the corresponding shell values are 42.1 and 70.9 MPa. Across all five conditions, the difference between the two idealizations remains between −1.4% and +2.3%. The separate stern-tube interface set produces 17.2–26.8 MPa for the shell model and 29.7–46.6 MPa for the solid model and is not substituted for the regional yield-screening stress. For the governing design-draught/APT-full case, the solid-interface set gives approximate spatial envelopes of 15–25 MPa for σzz and 20–35 MPa for τxz and τyz in the local coordinate system defined in Section 2.1.3; the corresponding shell transverse-shear recovery is approximately 10–15 MPa. At the aft boss section adjacent to the tube interface, the best-fit sectional rotation is 8–12% greater in the solid representation and the residual local-x warping after removal of rigid sectional motion is approximately 0.5–1.0 mm. Regional strain-energy decomposition gives membrane, bending, and transverse-shear fractions of 38%, 42%, and 20% for the solid model and 45%, 48%, and 7% for the shell model. These approximate secondary quantities are supporting mechanical evidence from the bounded comparison region; the principal conclusions remain based on the directly traceable displacement, regional stress, interface stress, utilization, and buckling results.
The utilization ratios are calculated as regional elastic von Mises stress divided by nominal yield strength in Table 8. The governing SS400 ratio is 0.308, while the AH32 and AH36 ratios are 0.230 and 0.204, respectively. These values show adequate nominal elastic margin in the assessed stern-boss region; they do not cover a weld-notch fatigue check, a casting-detail assessment, or the independent rule-based buckling criterion.
Table 8.
Nominal yield-utilization screening based on the traceable solid-model stern-boss regional stress.
Figure 19 separates the engineering locations used in the assessment: (1) the boss-to-supporting-frame transition, which contains the regional maximum used for nominal yield screening; (2) the stern-boss–stern-tube interface, which is a distinct shell–solid comparison set for three-dimensional stress transfer; (3) the connection fillet, where bending transfer creates a secondary concentration; (4) the bearing-support region, which transmits shaft-system reactions; and (5) the keel-line reference used for global vertical displacement. The interface stress is not the model-wide or regional maximum, and the lower interface values in Table 9 are therefore consistent with the extraction definitions in Table 4.
Figure 19.
Defined stern-boss response regions: boss-to-supporting-frame regional-stress set, stern-tube interface set, connection fillet, bearing-support region, and keel-line displacement-extraction point.
Table 9.
Traceable regional stress, interface stress, and LR rule-based buckling-utilization results for all operational conditions.
3.4. Rule-Based Buckling Screening
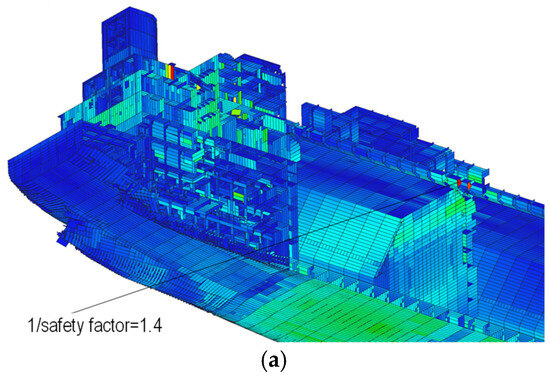
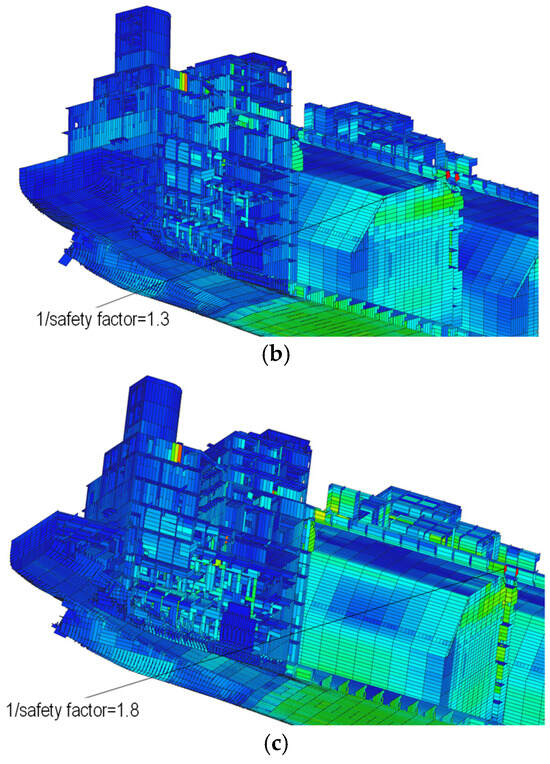
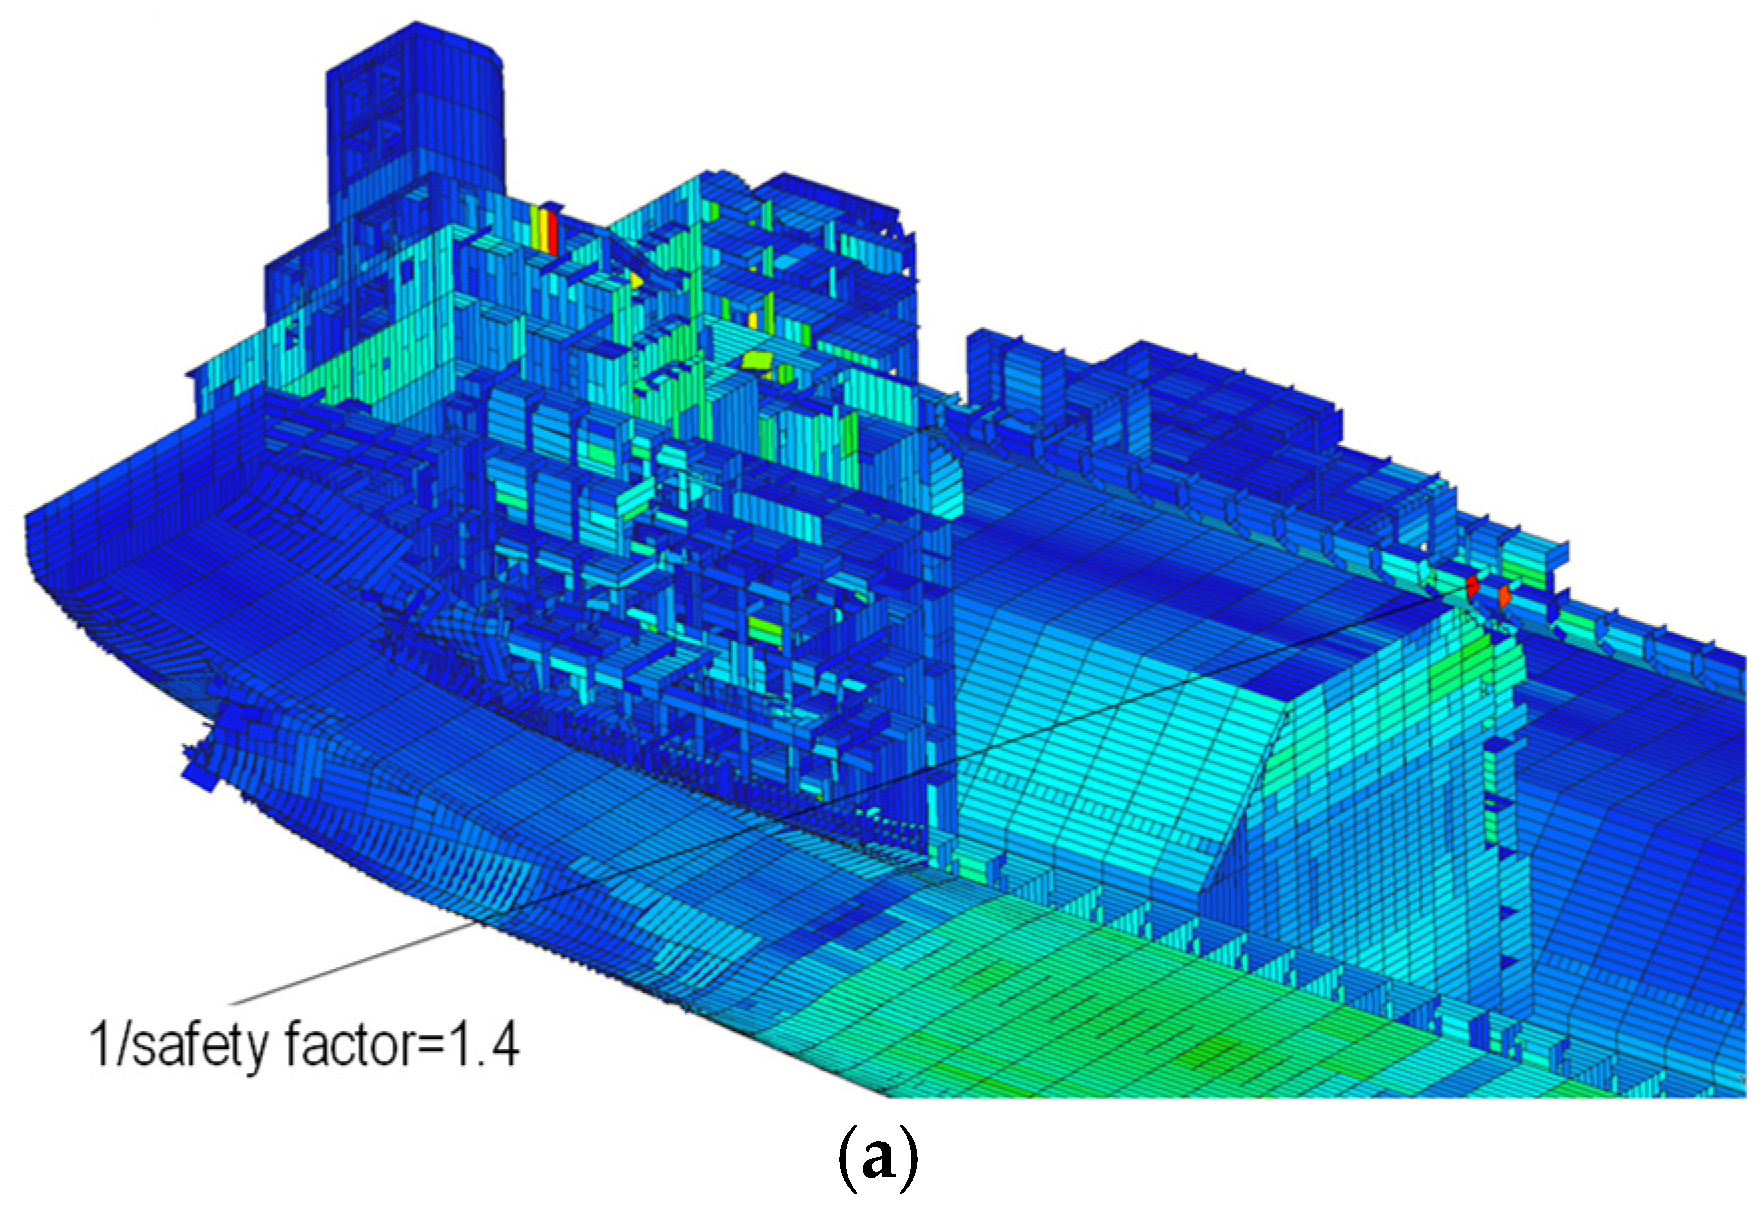
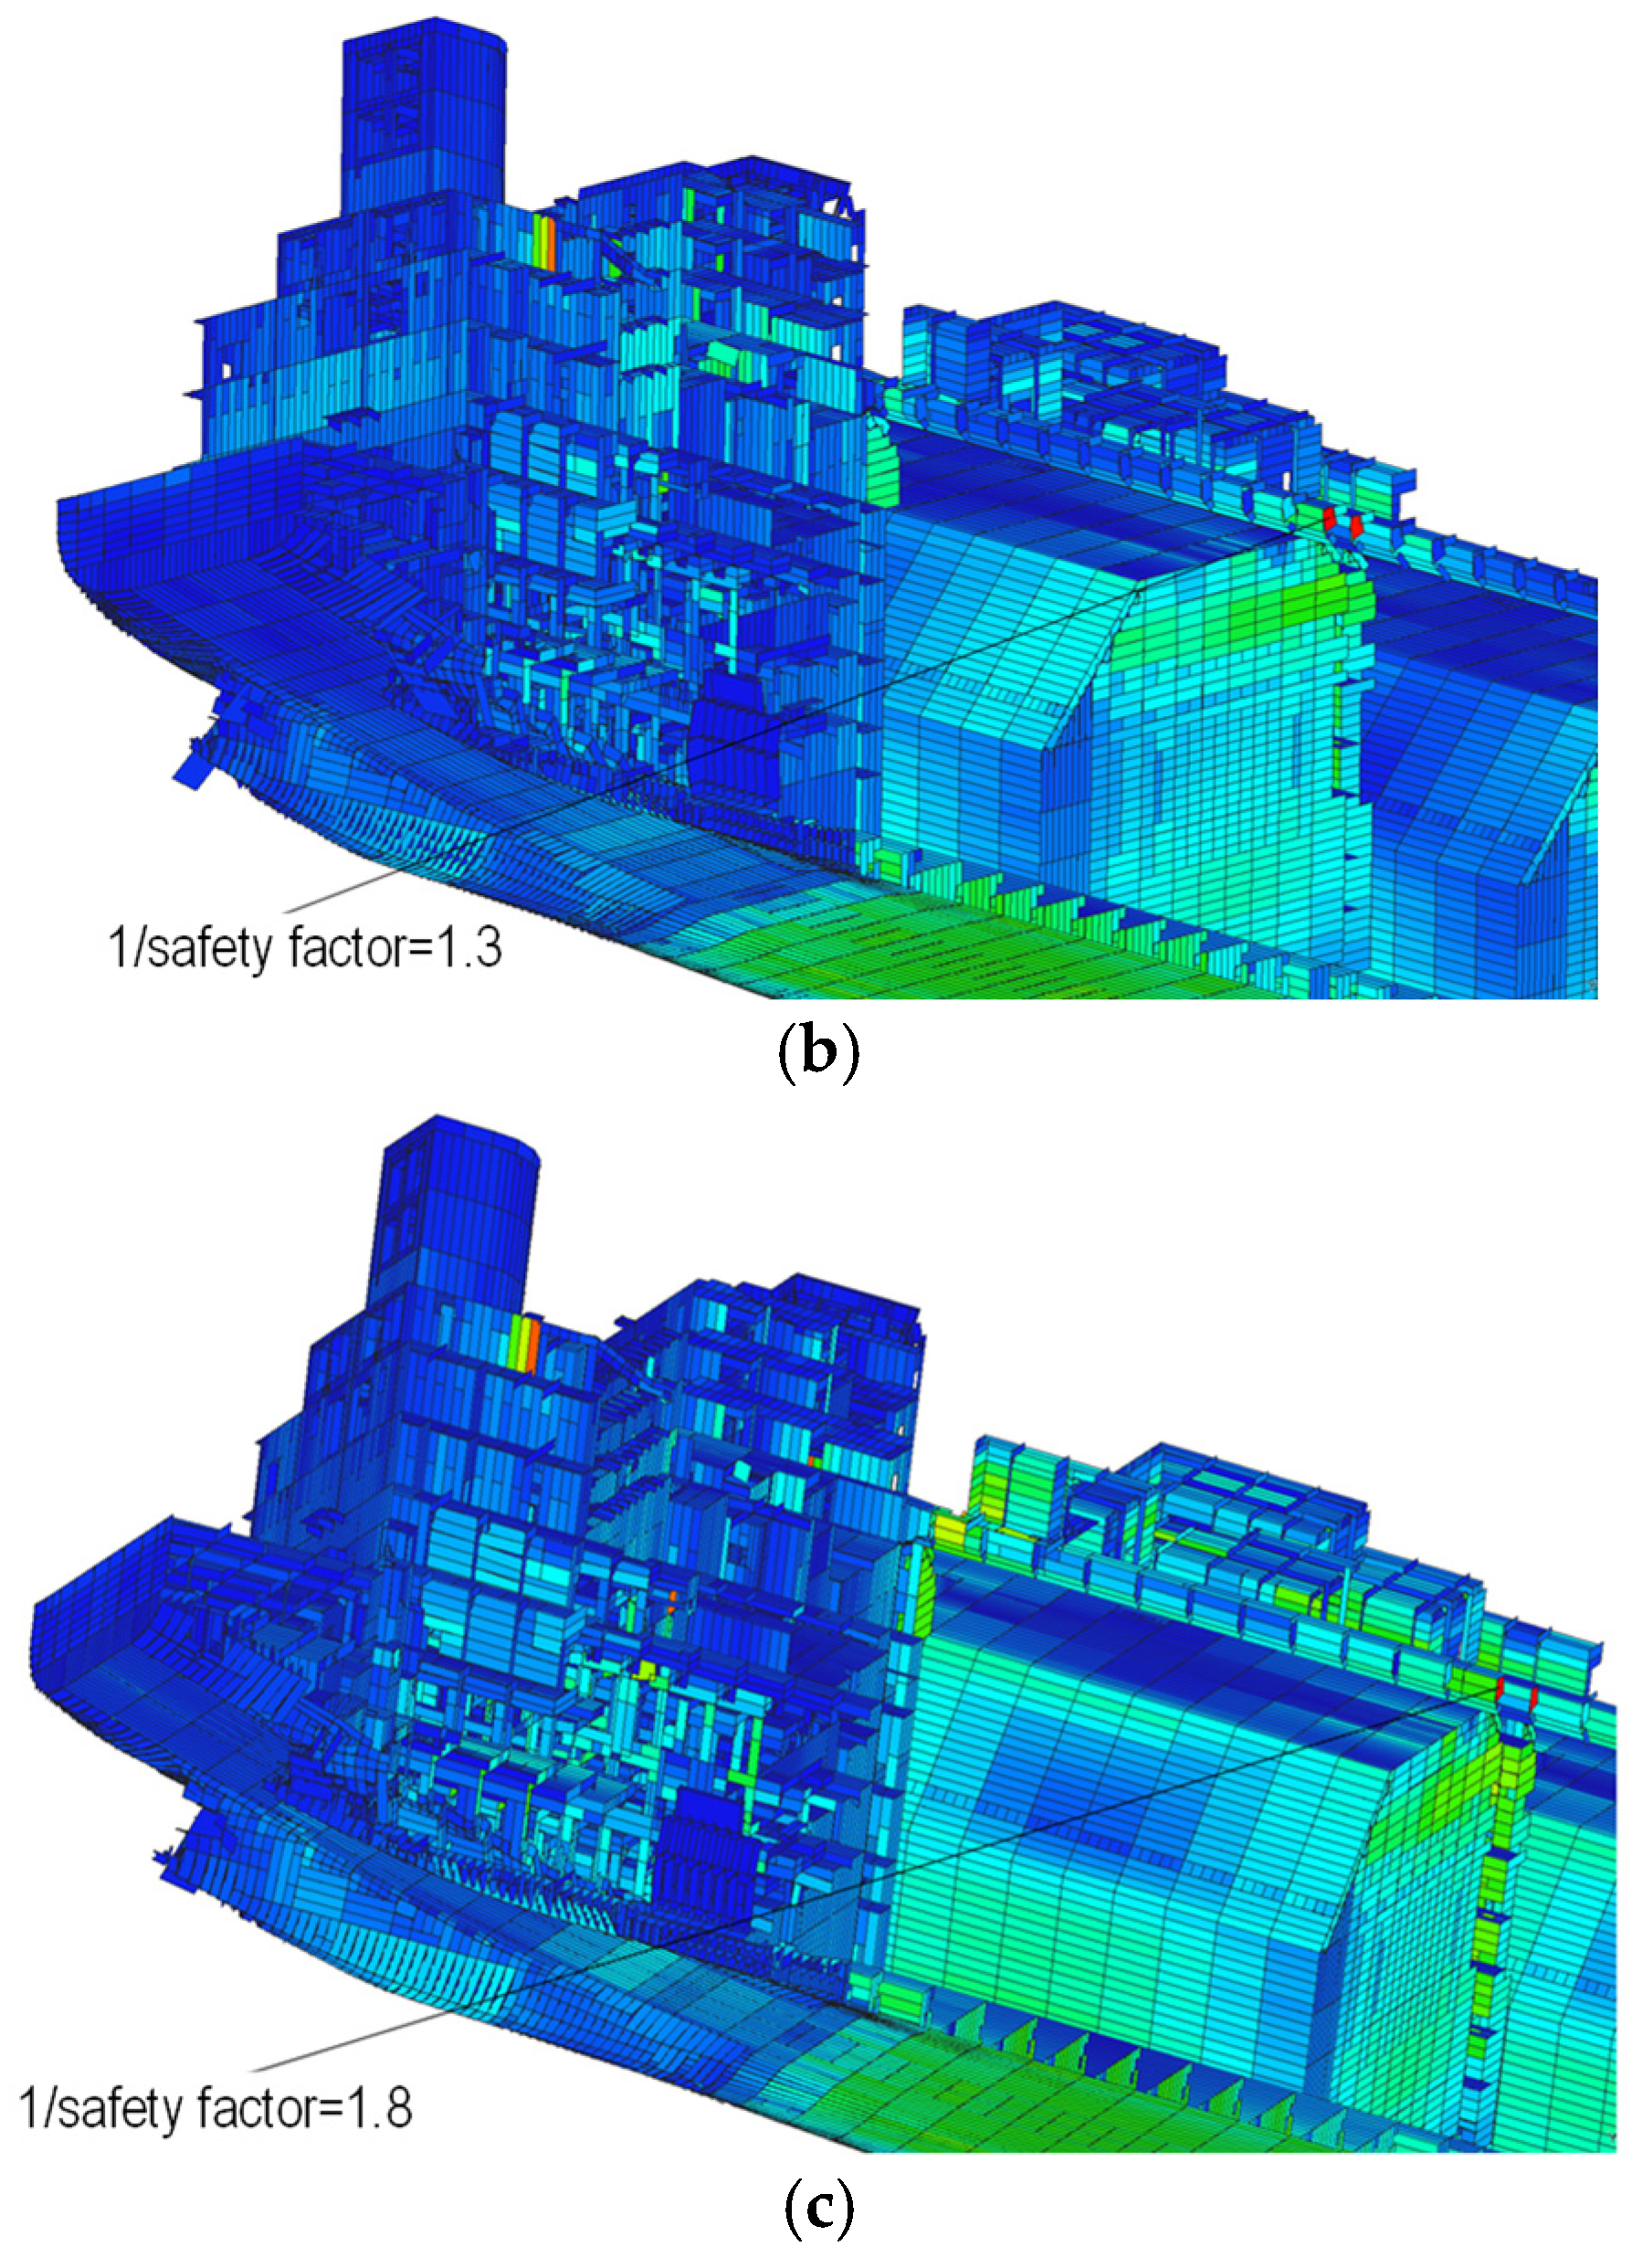
Buckling was evaluated for all five operational conditions using FE-GATE for Ship, which imports the MSC Nastran membrane normal and in-plane shear stresses and combines them with the identified panel geometry, net plate thickness, effective breadth, stiffener section properties, material yield strength, and panel boundary definition [15]. The implemented equations follow the Lloyd’s Register adoption of the IACS Common Structural Rules for Bulk Carriers and Oil Tankers, 1 January 2024 version with Rule Change Notice 1 effective 1 July 2024, Part 1, Chapter 8, Section 4, Buckling Requirements for Direct Strength Analysis [16]. FE-GATE returns the governing rule-utilization index U_b = 1/SF, where SF is the rule-based safety margin for the governing plate–stiffener interaction. Thus, U_b ≤ 1.0 satisfies the adopted project criterion, whereas U_b > 1.0 requires design review. This index is not obtained from an eigenvalue solution and must not be interpreted as an elastic critical-load multiplier. Complete results are given in Table 9.
The shell and solid models identify the same governing panel and return practically identical U_b indices because the check is controlled by the surrounding plate-and-stiffener system, whose idealization is common to both global models (refer to Figure 20). The index is 1.3 for ballast/APT empty, 1.4 for launching, 1.7 for design draught/APT empty, 1.8 for design draught/APT full, and 2.1 for ballast/APT full. Because every value exceeds 1.0, all five investigated conditions require design review under the adopted criterion, and ballast/APT full governs. Similar indices from the shell and solid models demonstrate common panel control; they do not demonstrate buckling adequacy. The buckling utilization is also independent of the von Mises yield-utilization ratio and must not be combined with it as a single safety measure.
Figure 20.
Representative LR rule-based buckling-utilization contours. The plotted quantity is the FE-GATE inverse safety-factor index U_b = 1/SF; all five operational conditions are reported in Table 9: (a) U_b = 1.4, launching pre-condition; (b) U_b = 1.3, ballast/APT-empty condition; and (c) U_b = 1.8, design-draught/APT-full condition. Values above 1.0 require design review under the adopted criterion.
3.5. Verification, Validation Status, and Limitations
Numerical verification is supported by four independent checks: (i) baseline-to-fine mesh changes below 1.1%; (ii) stable shell–solid deflection differences across all operational states; (iii) global force and reaction equilibrium within 1%; and (iv) continuous deformation through the RBE2 and solid–shell transition regions. A ±20% boundary-stiffness sensitivity also changes the stern-boss maximum deflection by less than 2%. Together, these checks demonstrate that the reported trends are not dominated by mesh density, solver imbalance, or one arbitrary support assumption. These checks do not constitute independent validation against physical reality. The two numerical models share the same geometry, material assumptions, T&S inputs, and boundary idealizations. No public full-scale strain, displacement, bearing-load, or sea-trial dataset was available for the proprietary stern structure. Compliance with BV modeling guidance and consistency with established hull-girder behavior provide an engineering benchmark, but they do not replace measured correlation. The manuscript therefore uses “verified numerical model” for the demonstrated numerical checks and reserves “validated model” for comparison with independent observations.
The principal limitations are the linear-elastic static formulation, nominal material properties, idealized RBE2/MPC interfaces, omission of weld residual stress and fabrication imperfection, and absence of propeller-induced dynamic, thermal, contact, fatigue, and hydrodynamic-bearing effects. A complete digital twin would additionally require sensors, synchronized operational data, state estimation, uncertainty quantification, and recurring model updating. The present model is therefore a digital-twin-compatible baseline rather than a deployed digital twin.
4. Conclusions and Scientific Limitations
This study established a controlled global–local finite element assessment in which shell-dominant and locally solid stern-boss idealizations were subjected to the same five vessel-specific load states derived from trim-and-stability data. Numerical credibility was supported by baseline-to-fine mesh changes of 0.68% and 1.07% for the shell and solid models, respectively, force and reaction equilibrium within 1%, continuous deformation across the coupling regions, and less than 2% variation in maximum deflection under a ±20% boundary-stiffness perturbation. These results demonstrate that the observed shell–solid differences are numerically stable within the adopted model architecture. They represent verification of the numerical solution rather than validation against the physical ship, because both models retain common geometry, loading assumptions, material properties, and boundary idealizations.
Both formulations reproduced the same vessel-scale deformation mode, while the solid model consistently predicted 5.9–6.3% greater maximum vertical deflection. Regional stern-boss stresses remained closely matched, with solid-minus-shell differences between −1.4% and +2.3%; the governing design-draught/APT-full condition produced a solid-model maximum deflection of 46.8 mm and a regional stress of 72.4 MPa. At the stern-tube interface, however, the solid solution predicted 29.7–46.6 MPa compared with 17.2–26.8 MPa from the shell extraction and additionally resolved transverse shear, through-thickness stress, and local warping. The work therefore provides a rational model-selection basis for design-stage assessment: the shell model serves as an efficient screening tool for global deformation compatibility, load-path review, and comparison of operating states, whereas the solid representation serves as the required local model when stern-tube interface stress and three-dimensional load transfer govern. This hierarchical use of the two formulations avoids both unnecessary global solid-model cost and unsupported reliance on shell-averaged interface stresses.
The assessment also demonstrates that regional yielding and panel buckling must remain separate design decisions. The maximum traceable regional stress gives an SS400 yield-utilization ratio of 0.308, indicating nominal elastic margin in the predefined stern-boss region. In contrast, the LR rule-based inverse safety-factor index U_b ranges from 1.3 to 2.1. Under the adopted U_b ≤ 1.0 criterion, all five conditions require design review and the ballast/APT-full condition governs the surrounding plate–stiffener system. The nearly identical shell and solid U_b values identify the common surrounding panel as the controlling buckling system; they do not establish buckling adequacy. Accordingly, the study provides a traceable basis for selecting the appropriate FE idealization and assessment measure, but it does not demonstrate complete structural integrity for every failure mode.
The scientific interpretation of these conclusions is bounded by several limitations. The analysis is linear elastic and static; it uses nominal material properties and idealized RBE2/MPC connections and does not represent fabrication imperfections, weld residual stress, fatigue accumulation, thermal distortion, propeller-induced dynamics, bearing contact, or hydrodynamic lubrication. In addition, no independent full-scale strain, hull-deflection, or bearing-reaction measurements were available for the proprietary stern structure. Consequently, the absolute accuracy of the predicted interface response, the sensitivity of the shell–solid difference to actual fabrication and contact conditions, and the transferability of the reported model-selection thresholds to other stern geometries remain unresolved scientific questions. The present conclusions are therefore restricted to the evaluated vessel, operational load set, and modeling assumptions. Within those boundaries, the study supplies a verified and traceable numerical baseline for global–local stern-boss assessment, but it does not claim universal applicability or independent physical validation.
Author Contributions
Conceptualization, J.-S.P.; methodology, J.-S.P. and M.-S.Y.; finite element modeling and formal analysis, M.-S.Y., D.-B.J., T.-G.K. and J.-G.P.; data curation, M.-S.Y. and D.-B.J.; writing—original draft preparation, J.-S.P. and D.-B.J.; writing—review and editing, J.-S.P., M.-S.Y., T.-G.K. and J.-G.P.; supervision, J.-S.P. All authors have read and agreed to the published version of the manuscript.
Funding
This study was supported by the research fund of Chosun University, 2026.
Data Availability Statement
The vessel geometry, trim-and-stability data, and production FE input files are subject to industrial confidentiality restrictions. Derived tabular results supporting the conclusions are provided in the manuscript; additional non-confidential information may be made available by the corresponding author upon reasonable request and subject to approval by the data owner.
Conflicts of Interest
Tae-Gu Kang was employed by the Samsung Heavy Industries Co., Ltd. Joo-Goo Park and Joo-Shin Park were employed by the Samsung Heavy Industries Co., Ltd. The remaining authors declare that the research was conducted in the absence of any commercial or financial relationships that could be construed as a potential conflict of interest.
Abbreviations
AE, aftermost engine-seating/transom reference; AH32/AH36, higher-strength shipbuilding steel grades; AP, aft perpendicular; APT, after-peak tank; BV, Bureau Veritas; DOF, degrees of freedom; ESA, elastic shaft alignment; ESL, Equivalent Single Layer; FE, finite element; FP, forward perpendicular; HGT, Hierarchical Graph Transformer; MPC, multi-point constraint; RBE2, rigid-body element type 2; SHM, structural health monitoring; T&S, trim and stability.
References
- Qu, F.; Chen, S.; Zhang, K. The Numerical Analysis of Hydrodynamic Response and Structural Stability of an Eccentric Conical Floating Structure. J. Mar. Sci. Eng. 2025, 13, 1032. [Google Scholar] [CrossRef] [Scilit]
- Sarkar, R. Structural Analysis of Ship Hulls Using Finite Element Methods. Preprints 2024, 2024101479. [Google Scholar] [CrossRef] [Scilit]
- Abedin, J. Structural Optimisation of Ship Hull Using Finite Element Method. Ph.D. Thesis, Newcastle University, Newcastle upon Tyne, UK, 2025. [Google Scholar]
- Yao, T. Hull girder strength. Mar. Struct. 2003, 16, 1–13. [Google Scholar] [CrossRef] [Scilit]
- Hughes, O.F.; Paik, J.K. Ship Structural Analysis and Design; Society of Naval Architects and Marine Engineers: Alexandria, VA, USA, 2010; ISBN 978-0-939773-78-3. [Google Scholar]
- Cai, Y.; Jelovica, J. A Hybrid Global–Local Computational Framework for Ship Hull Structural Analysis Using Homogenized Model and Graph Neural Network. arXiv 2025, arXiv:2512.20020. [Google Scholar]
- Aravanis, G.; Silionis, N.; Bardiani, J.; Giglio, M.; Anyfantis, K.; Sbarufatti, C. A Hierarchical Bayesian Approach for Population-Based SHM in Ship Hull Structures. In Proceedings of the 6th International Conference on Uncertainty Quantification in Computational Sciences and Engineering (UNCECOMP 2025), Rhodes Island, Greece, 15–18 June 2025; pp. 584–596. [Google Scholar] [CrossRef] [Scilit]
- Zhang, Y. Structural Dynamic Response Analysis on Marine Vessels with Time-Varying Mass Property and Large-Scale Discontinuous Hull Structures. Ph.D. Thesis, Newcastle University, Newcastle upon Tyne, UK, 2024. [Google Scholar]
- Murawski, L. Shaft line alignment analysis taking ship construction flexibility and deformations into consideration. Mar. Struct. 2005, 18, 62–84. [Google Scholar] [CrossRef] [Scilit]
- Shi, L.; Xue, D.; Song, X. Research on shafting alignment considering ship hull deformations. Mar. Struct. 2010, 23, 103–114. [Google Scholar] [CrossRef] [Scilit]
- Lee, J.-U.; Jeong, B.; An, T.-H. Investigation on effective support point of single stern tube bearing for marine propulsion shaft alignment. Mar. Struct. 2019, 64, 1–17. [Google Scholar] [CrossRef] [Scilit]
- Du, J.; Deng, Y.; Xu, D. Alignment Method for Marine Propulsion Systems with Single Stern Tube Bearing Based on Fine-Tuning a Pre-Trained Model. J. Mar. Sci. Eng. 2025, 13, 209. [Google Scholar] [CrossRef] [Scilit]
- Lee, J.; Kim, Y. Study on Optimal Shaft Alignment of Propulsion Shafting System for Large Crude Oil Tanker Considering Ship Operating Conditions. J. Mar. Sci. Eng. 2026, 14, 42. [Google Scholar] [CrossRef] [Scilit]
- Bureau Veritas. NR 592; Elastic Shaft Alignment; Bureau Veritas: Paris, France, 2025. [Google Scholar]
- R AONX Solutions. FEGate for Ship: Technical Manual for API Module of Shipbuilding Tools; Buckling Analysis and LR Rule-Utilization Post-Processing; RAONX Solutions: Seongnam, Republic of Korea, 2025; Section 3. [Google Scholar]
- Lloyd’s Register. CSR-001; Common Structural Rules for Bulk Carriers and Oil Tankers; 1 January 2024 Version, Rule Change Notice 1 Effective 1 July 2024; Buckling Requirements for Direct Strength Analysis; Lloyd’s Register: London, UK, 2024; Part 1, Chapter 8, Section 4. [Google Scholar]

Disclaimer/Publisher’s Note: The statements, opinions and data contained in all publications are solely those of the individual author(s) and contributor(s) and not of MDPI and/or the editor(s). MDPI and/or the editor(s) disclaim responsibility for any injury to people or property resulting from any ideas, methods, instructions or products referred to in the content. |
© 2026 by the authors. Licensee MDPI, Basel, Switzerland. This article is an open access article distributed under the terms and conditions of the Creative Commons Attribution (CC BY) license.