Article

Heat Treatment Strengthening Process and Mechanism for 20SA Aluminum-Clad Steel Wire

1
School of Materials Science and Engineering, Hefei University of Technology, No. 193, Tunxi Road, Hefei 230009, China
2
Anhui Simulation Design and Modern Manufacture Engineering Technology Research Center, Huangshan University, No. 39, Xihai Road, Huangshan 245041, China
3
Huangshan Chuangxiang Technology Co., Ltd., No. 19 North Ring Road, Circular Economy Park, Shexian County, Huangshan 245200, China
*
Authors to whom correspondence should be addressed.
Metals 2026, 16(8), 855; https://doi.org/10.3390/met16080855
Submission received: 31 May 2026 / Revised: 22 July 2026 / Accepted: 29 July 2026 / Published: 4 August 2026
(This article belongs to the Special Issue Rolling and Forming of Alloys and Steels)

Abstract

Aluminum-clad steel wires are widely used in ultra-high-voltage (UHV) transmission lines due to their excellent beneficial properties. To address the inadequate strength–ductility balance of aluminum-clad steel wires for UHV applications, this study investigates the effects of cold drawing and low-temperature annealing (200~330 °C) on the microstructure, aluminum/steel interface, and mechanical properties of 20SA (20.3% IACS) aluminum-clad steel wires. The results indicate that the cold-drawn steel core exhibits high strength due to its high dislocation density and strong <110> fiber texture. Low-temperature annealing promotes overall recovery and partial recrystallization of the microstructure. Specifically, annealing at 240~280 °C significantly enhances ductility while maintaining high strength, achieving optimal strength–ductility synergy; however, higher annealing temperatures result in an unacceptably low ultimate strength, rendering them impractical for application. Interfacial characterization reveals that the as-clad and cold-drawn processes, as well as annealing below 250 °C for 10 min, maintain stable metallurgical bonding at the aluminum/steel interface, whereas annealing at 300 °C for 10 min induces the formation of brittle Fe-Al intermetallic compounds, thereby compromising service reliability. Furthermore, the precipitation of cementite (Fe3C) with increasing temperature partially compensates for the strength loss caused by overall recovery. This study identifies the optimal heat treatment window, providing a theoretical basis for the strength–ductility design and reliable service of UHV transmission lines.

1. Introduction

As wires and cables form the physical foundation for constructing modern power systems, their performance—including line losses and transmission efficiency—directly impacts national energy security and carbon reduction targets [1,2]. With the large-scale deployment of 1000 kV/±1100 kV ultra-high-voltage (UHV) projects, transmission lines operate continuously under extreme conditions of long spans, high loads, and complex weather environments, imposing stringent demands on cable materials regarding conductive strength synergy, fatigue resistance, and long-term weather durability [3]. Among existing UHV transmission lines, galvanized steel wires remain the predominant material [4,5]; however, aluminum-clad steel wires—a bimetallic composite wire where thin pure aluminum layers are concentrically wrapped around a high-strength steel core—are gaining prominence due to their superior performance: high strength, low losses, minimal sag, corrosion resistance, absence of contact potential with hard aluminum conductors [6,7], and extended service life. These properties make them a promising choice for UHV transmission applications.
The mechanical performance characteristics critical for the engineering application of aluminum-clad steel wires primarily include ultimate strength, elongation at break, and torsional performance. Among these, ultimate strength and elongation at break determine the wire’s resistance to mechanical loading conditions such as sagging and wind-induced deflection during service, while also dictating whether elevated installation heights are required for overhead conductors. Torsional performance directly characterizes the structural integrity of the wire under strand twisting during stranded formation and fretting stress conditions. It directly reflects the bonding quality between the aluminum cladding and the steel core, as well as the material’s plastic coordination capability, serving as a key indicator for evaluating long-term service reliability. Current international standards specify minimum torsion turns (e.g., ASTM B415-16 (2021) [8] requires ≥20 turns with a gauge length of 300 mm). If the torsional performance is substandard, delamination at the aluminum/steel interface or cracking in the cladding can readily occur during the stranding process, subsequently leading to reduced conductivity, gap discharge, and rapid corrosion, thereby significantly shortening the wire’s service life.
However, under current international standards, the overall mechanical properties of aluminum-clad steel wire are significantly inferior to those of galvanized steel wire of equivalent specifications, failing to meet the demands of the high-end global market. According to IEC 63248-2022 [9], 20SA aluminum-clad steel wire (2.66 mm < d ≤ 3.25 mm) requires an ultimate strength of ≥1340 MPa and an elongation at break of ≥1.0%, whereas the closely comparable S3A galvanized steel wire (3.00 mm < d ≤ 3.50 mm) achieves an ultimate strength of ≥1550 MPa and an elongation at break of ≥3.5%, indicating substantial room for optimizing the mechanical performance of aluminum-clad steel wire. Although ultimate strength and elongation have been incorporated into standard quality control systems for such products, further detailed research is warranted—particularly regarding microstructural evolution, precipitation of strengthening phases, work hardening mechanisms, dislocation density, and aluminum/steel interface bonding characteristics.
This study conducted systematic mechanical property characterization and torsional performance testing on industrial-grade 20SA aluminum-clad steel wire samples, followed by optimized post-heat-treatment processing experiments with a focus on microstructural evolution and the combined properties of ultimate strength versus elongation at break. It proposes reliable optimization protocols, providing a theoretical foundation for strengthening and toughening treatments for aluminum-clad steel wires.

2. Materials and Methods

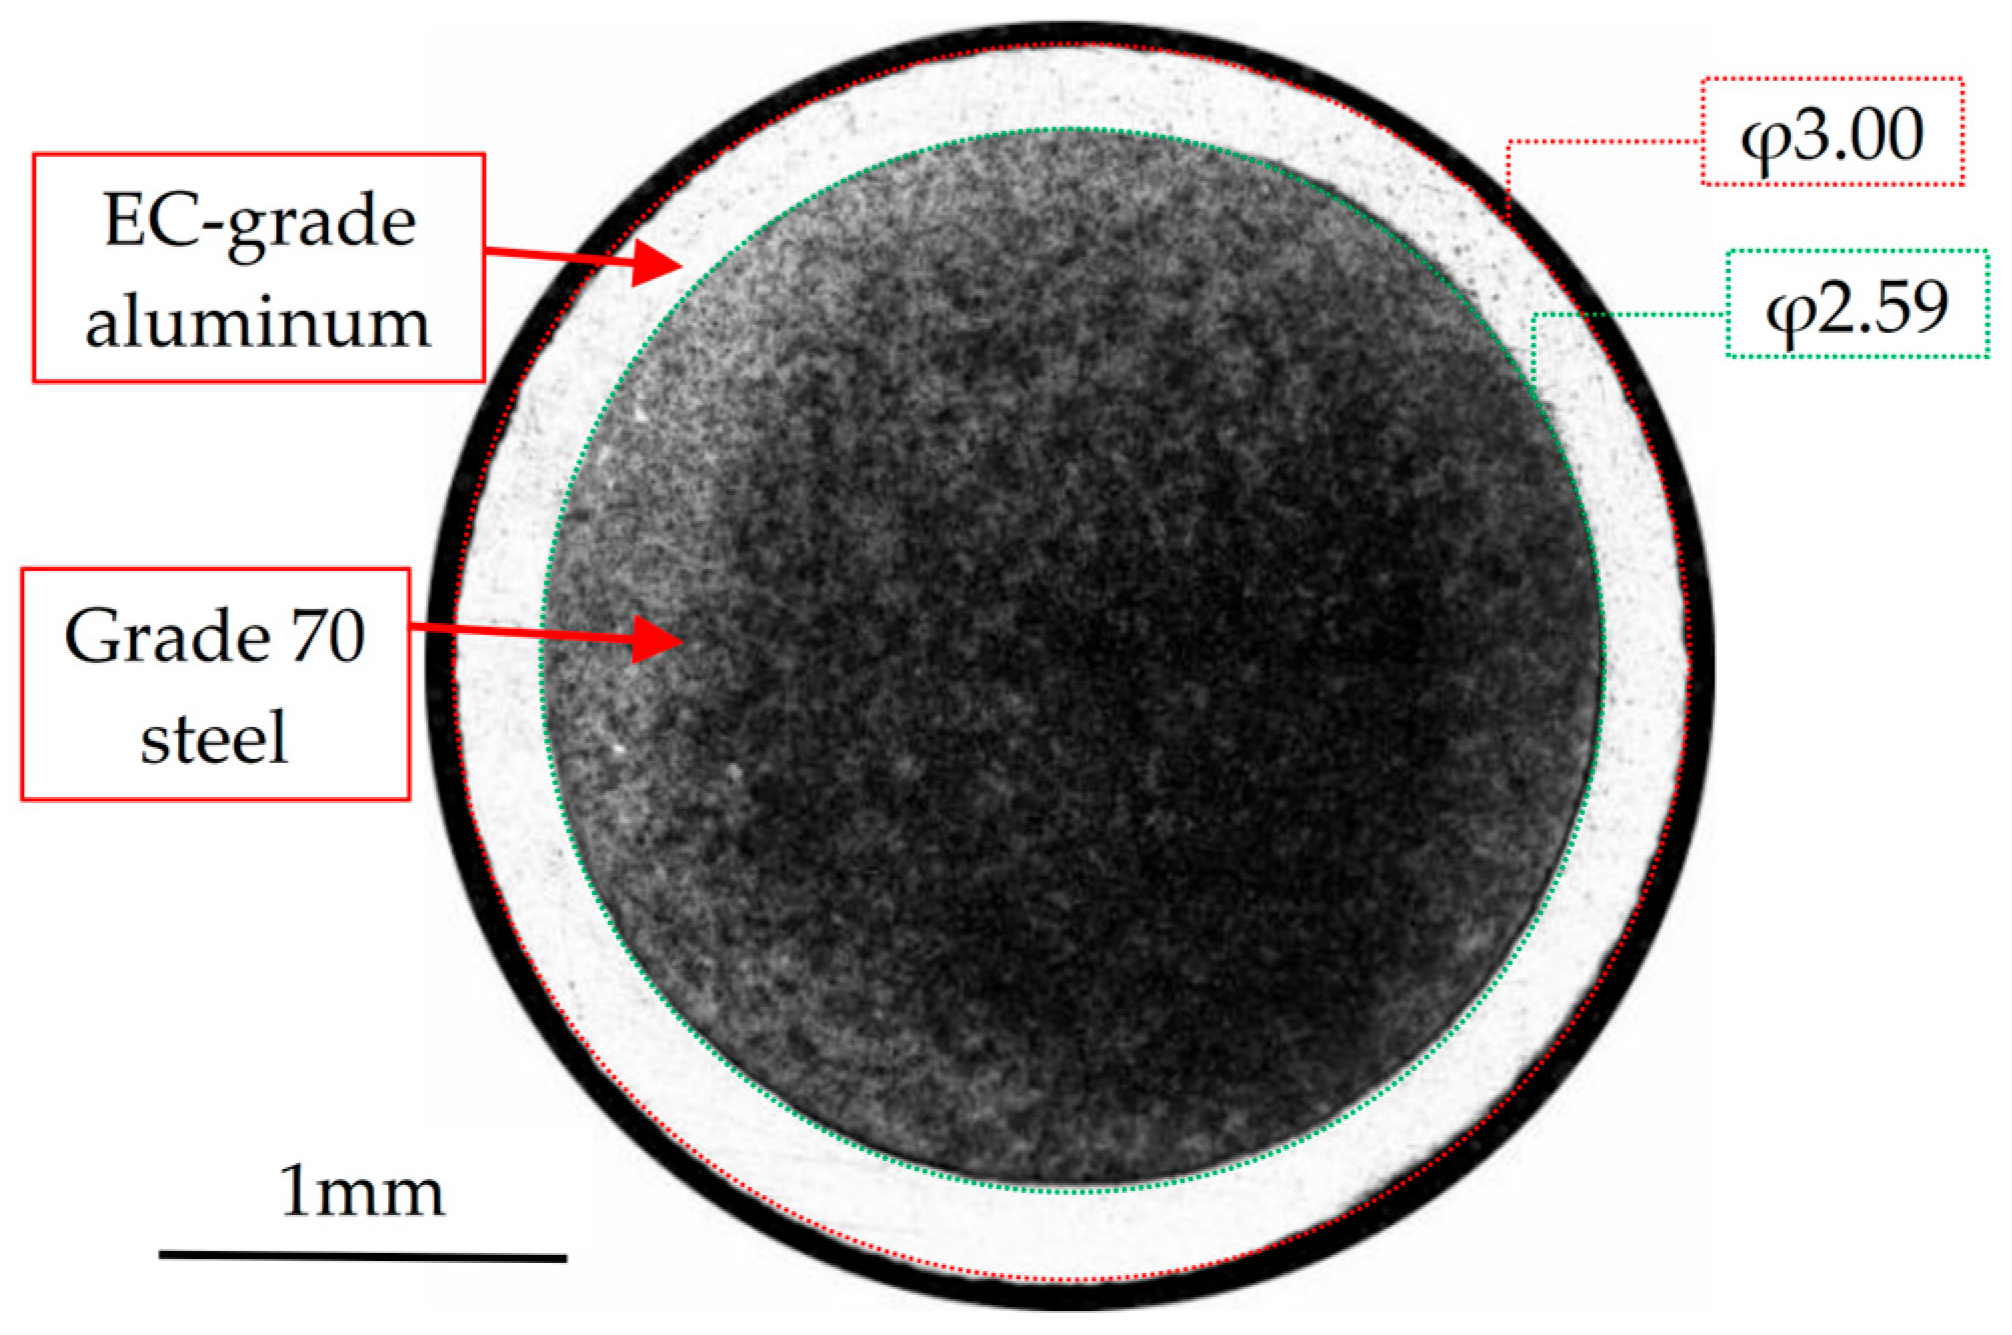
The material used in this study was commercial 20SA aluminum-clad steel wire manufactured using the continuous extrusion forming process. The nominal diameter of this aluminum-clad steel wire specification is 3.00 mm, and the actual average diameter of the product, as measured by a vernier caliper, is 3.00 ± 0.02 mm. Its outer layer consists of commercial-purity electrical aluminum with Al content ≥ 99.7% and conductivity ≥ 61.0% IACS; the inner layer comprises a high-carbon steel core (carbon content 0.70~0.72 wt%) with conductivity ≥ 9.0% IACS. The aluminum–steel composite wire was first fabricated as a blank with a diameter of φ6.66 mm via mechanical hot cladding, then drawn through multiple passes to achieve the target size of φ3.00 mm at a drawing compression ratio of 79.7%, before being wound into coils for storage. The macroscopic cross-sectional morphology is shown in Figure 1. Measured using a vernier caliper, the outer diameter of the aluminum-clad steel wire was 3.00 mm, yielding a calculated outer diameter of 2.59 mm for the grade 70 steel wire; the wire’s conductivity was calculated as follows:
R 2 r 2 R 2 × 61 % IACS + r 2 R 2 × 9 % IACS = 22.24 % IACS
where R denotes the diameter of the aluminum-clad steel wire, and r denotes the diameter of the grade 70 steel core. After accounting for loss factors, the minimum conductivity of this aluminum-clad steel wire is specified as 20.3% IACS (with a maximum resistivity of 84.8 nΩ·m at 20 °C).
Samples with a length of 400 mm were cut from the wire rod for heat treatment, mechanical property testing, and microstructural characterization. The heat treatment was conducted at temperatures ranging from 200 °C to 330 °C for holding times of 10 to 240 min, followed by air cooling. A conventional low-temperature drying oven was employed for the heat treatment, enabling a rapid heating rate of 10 °C/min and precise temperature control with an accuracy of 0.1 °C within the 100~500 °C range. For brevity, subsequent annealing treatments are designated in the format of “annealing temperature–holding time”.
20SA samples underwent tensile and torsional tests in accordance with ASTM B415-16 (2021) [8], with both tests employing a gauge length of 300 mm, a tensile rate of 1.0 mm/min, and a torsional rate of 15 rev/min. The elongation at break for tensile tests was measured using the gauge-length marking method, while torsional performance was characterized by the torsion turns (N) before fracture. At least three samples were tested under each heat treatment condition to ensure statistical significance of the results.
All samples were tested under room-temperature conditions. The processed samples were subjected to wire-cutting sampling followed by analysis using metallographic microscopy (OM, Sunny Optical Technology (Group) Co., Ltd., Ningbo, China), residual stress analysis, scanning electron microscopy (SEM), electron backscatter diffraction (EBSD), Transmission Kikuchi diffraction (TKD), and transmission electron microscopy (TEM). Samples for metallographic and SEM analysis were progressively ground with water sandpaper grades ranging from 60-grit to 2000-grit, mechanically polished, and then etched with nital solution (4 vol% HNO3 in ethanol) for 10~15 s. EBSD samples were argon-ion polished to obtain high-quality Kikuchi patterns; TEM samples were prepared as thin sections using a focused ion beam (FIB) dual-beam system with an acceleration voltage of 30 kV and an ion current of 50 pA, followed by high-resolution imaging and selected-area electron diffraction (SAED) analysis under transmission electron microscopy at an acceleration voltage of 200 kV, focusing on characterizing the dislocation microstructure of the steel core, the precipitation morphology of steel core carbides, and the atomic-level bonding state at the aluminum/steel interface. Electron backscatter diffraction and X-ray energy-dispersive spectroscopy (EDS) measurements were performed using a Hitachi SU8600 scanning electron microscope (Hitachi High-Tech Corporation, Tokyo, Japan) equipped with an Oxford Instruments C-Nano EBSD detector and an Oxford Ultim Max 100 energy analyzer (Oxford Instruments plc, Abingdon, Oxfordshire, UK), with the EBSD step size set to 120 nm and TKD step sizes of 12 nm and 7 nm, respectively. TEM samples were prepared by cutting on a Thermo Fisher Apreo 2 scanning electron microscope fitted with a focused ion beam (FIB) system (Thermo Fisher Scientific Inc., Waltham, MA, USA). The TEM measurements were performed using a Thermo Fisher Talos F200X electron microscope (Thermo Fisher Scientific Inc., Waltham, MA, USA). Residual stress analysis was conducted with an LXRD-type X-ray residual stress analyzer manufactured by Proto (Proto Manufacturing Ltd., Oldcastle, ON, Canada).

3. Results

3.1. Analysis of Microstructure Evolution

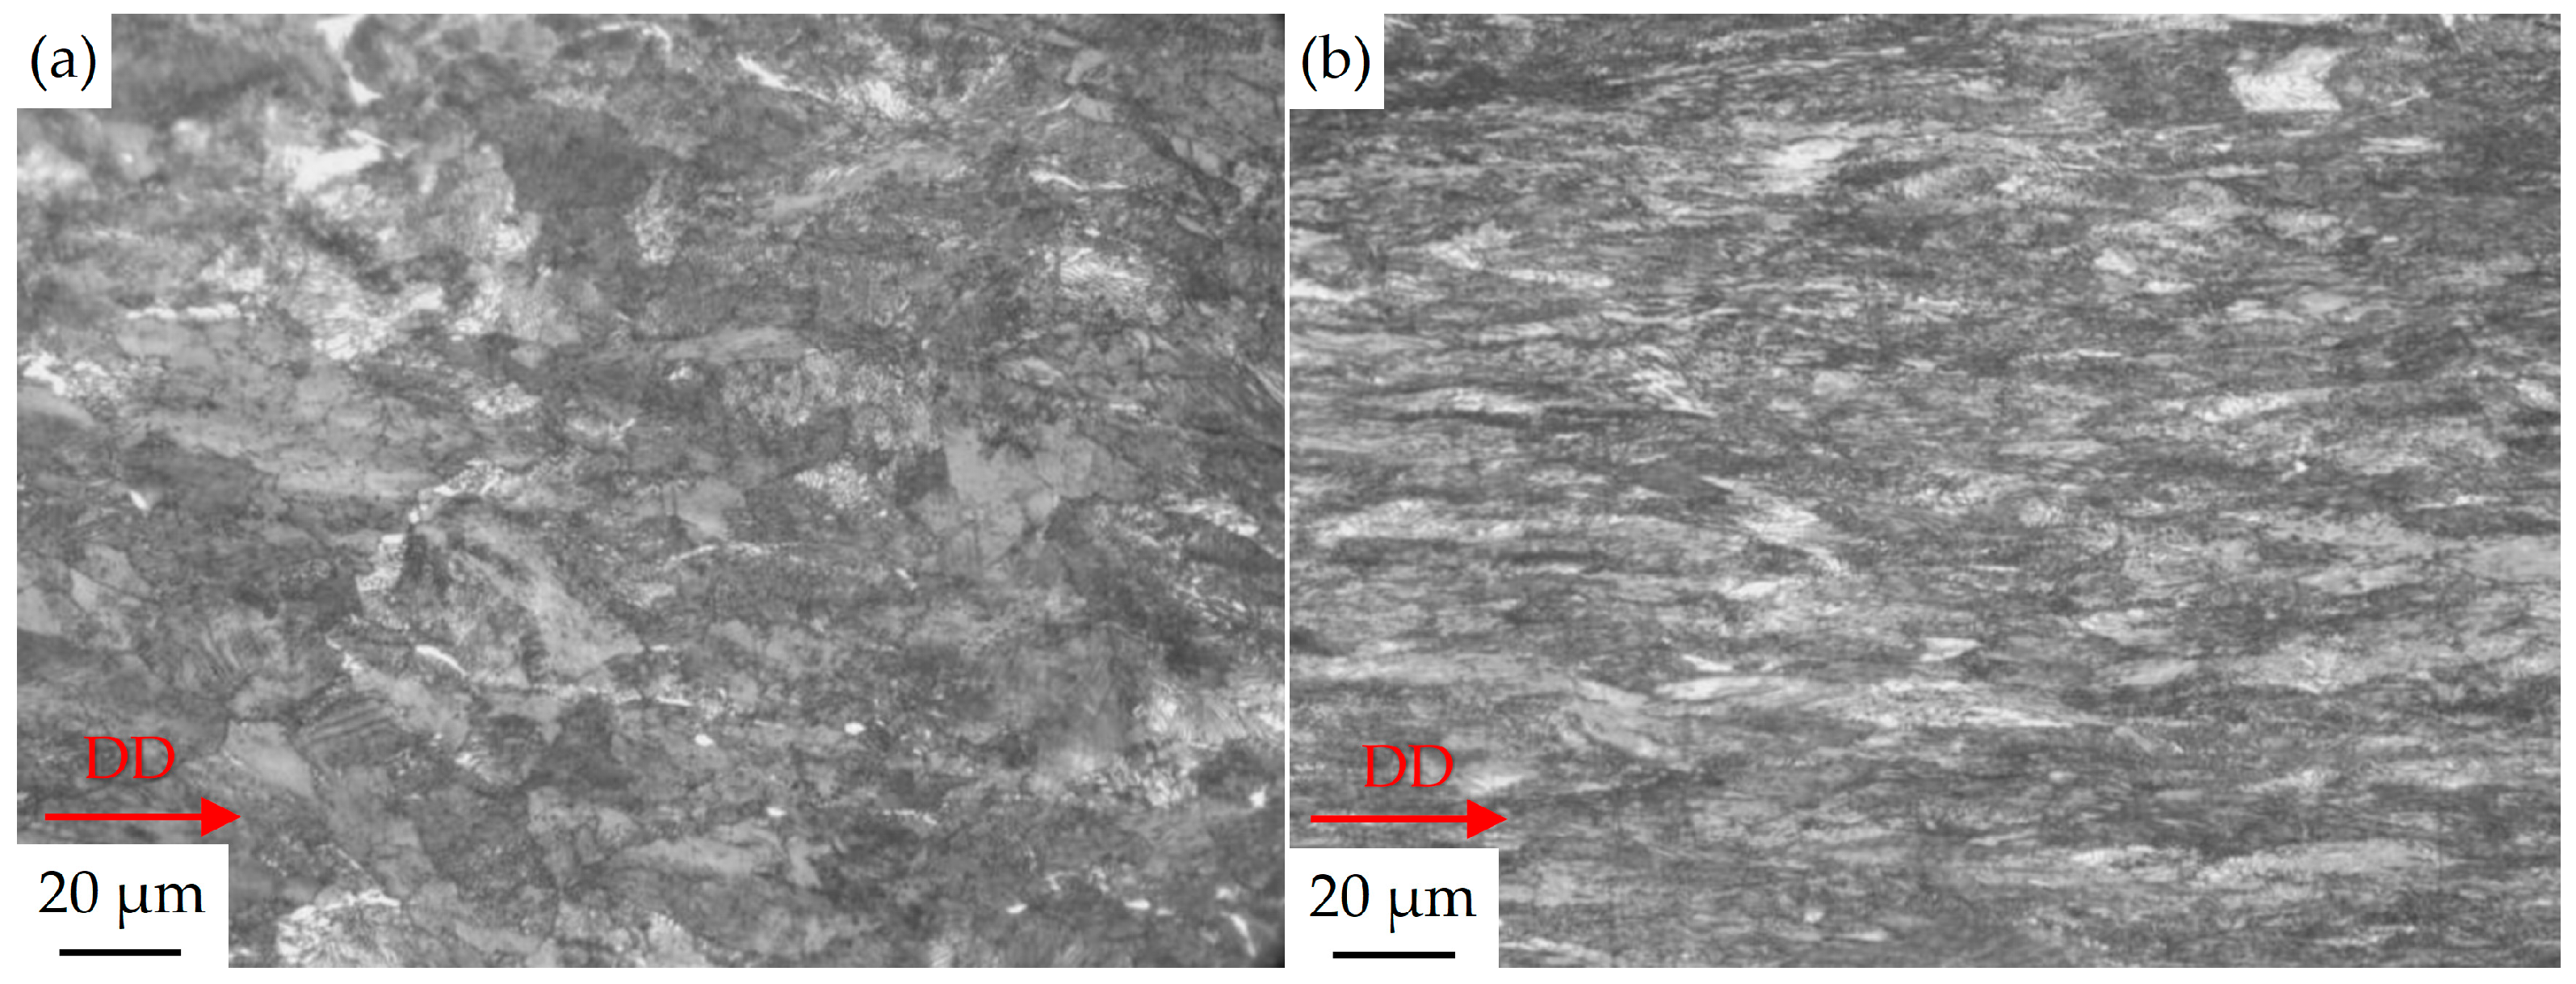
In aluminum-clad steel products, the steel core and aluminum cladding serve distinct functions. The steel core primarily enhances the wire’s mechanical properties—including its ultimate strength, elastic modulus, and elongation at break—while the aluminum cladding ensures electrical conductivity and corrosion resistance. Consequently, both the wire diameter and the aluminum-to-steel ratio at the interface are meticulously designed. This study focuses on the mechanical properties of aluminum-clad steel, emphasizing the microstructure and mechanical characteristics of the steel core. Figure 2 shows the OM microstructures of steel cores produced by both the as-clad and cold drawing processes. It is evident that even under high magnification, typical core microstructural features—including the grain size, grain boundary morphology, and morphology of Fe3C strengthening phases—are not clearly observable. The only distinct feature is that the grade 70 steel core exhibits a pearlitic microstructure; after the cold drawing process, its grain morphology along the drawing direction (DD) progressively transitions from equiaxed grains (Figure 2a) to elongated grains aligned along the axial direction (Figure 2b).
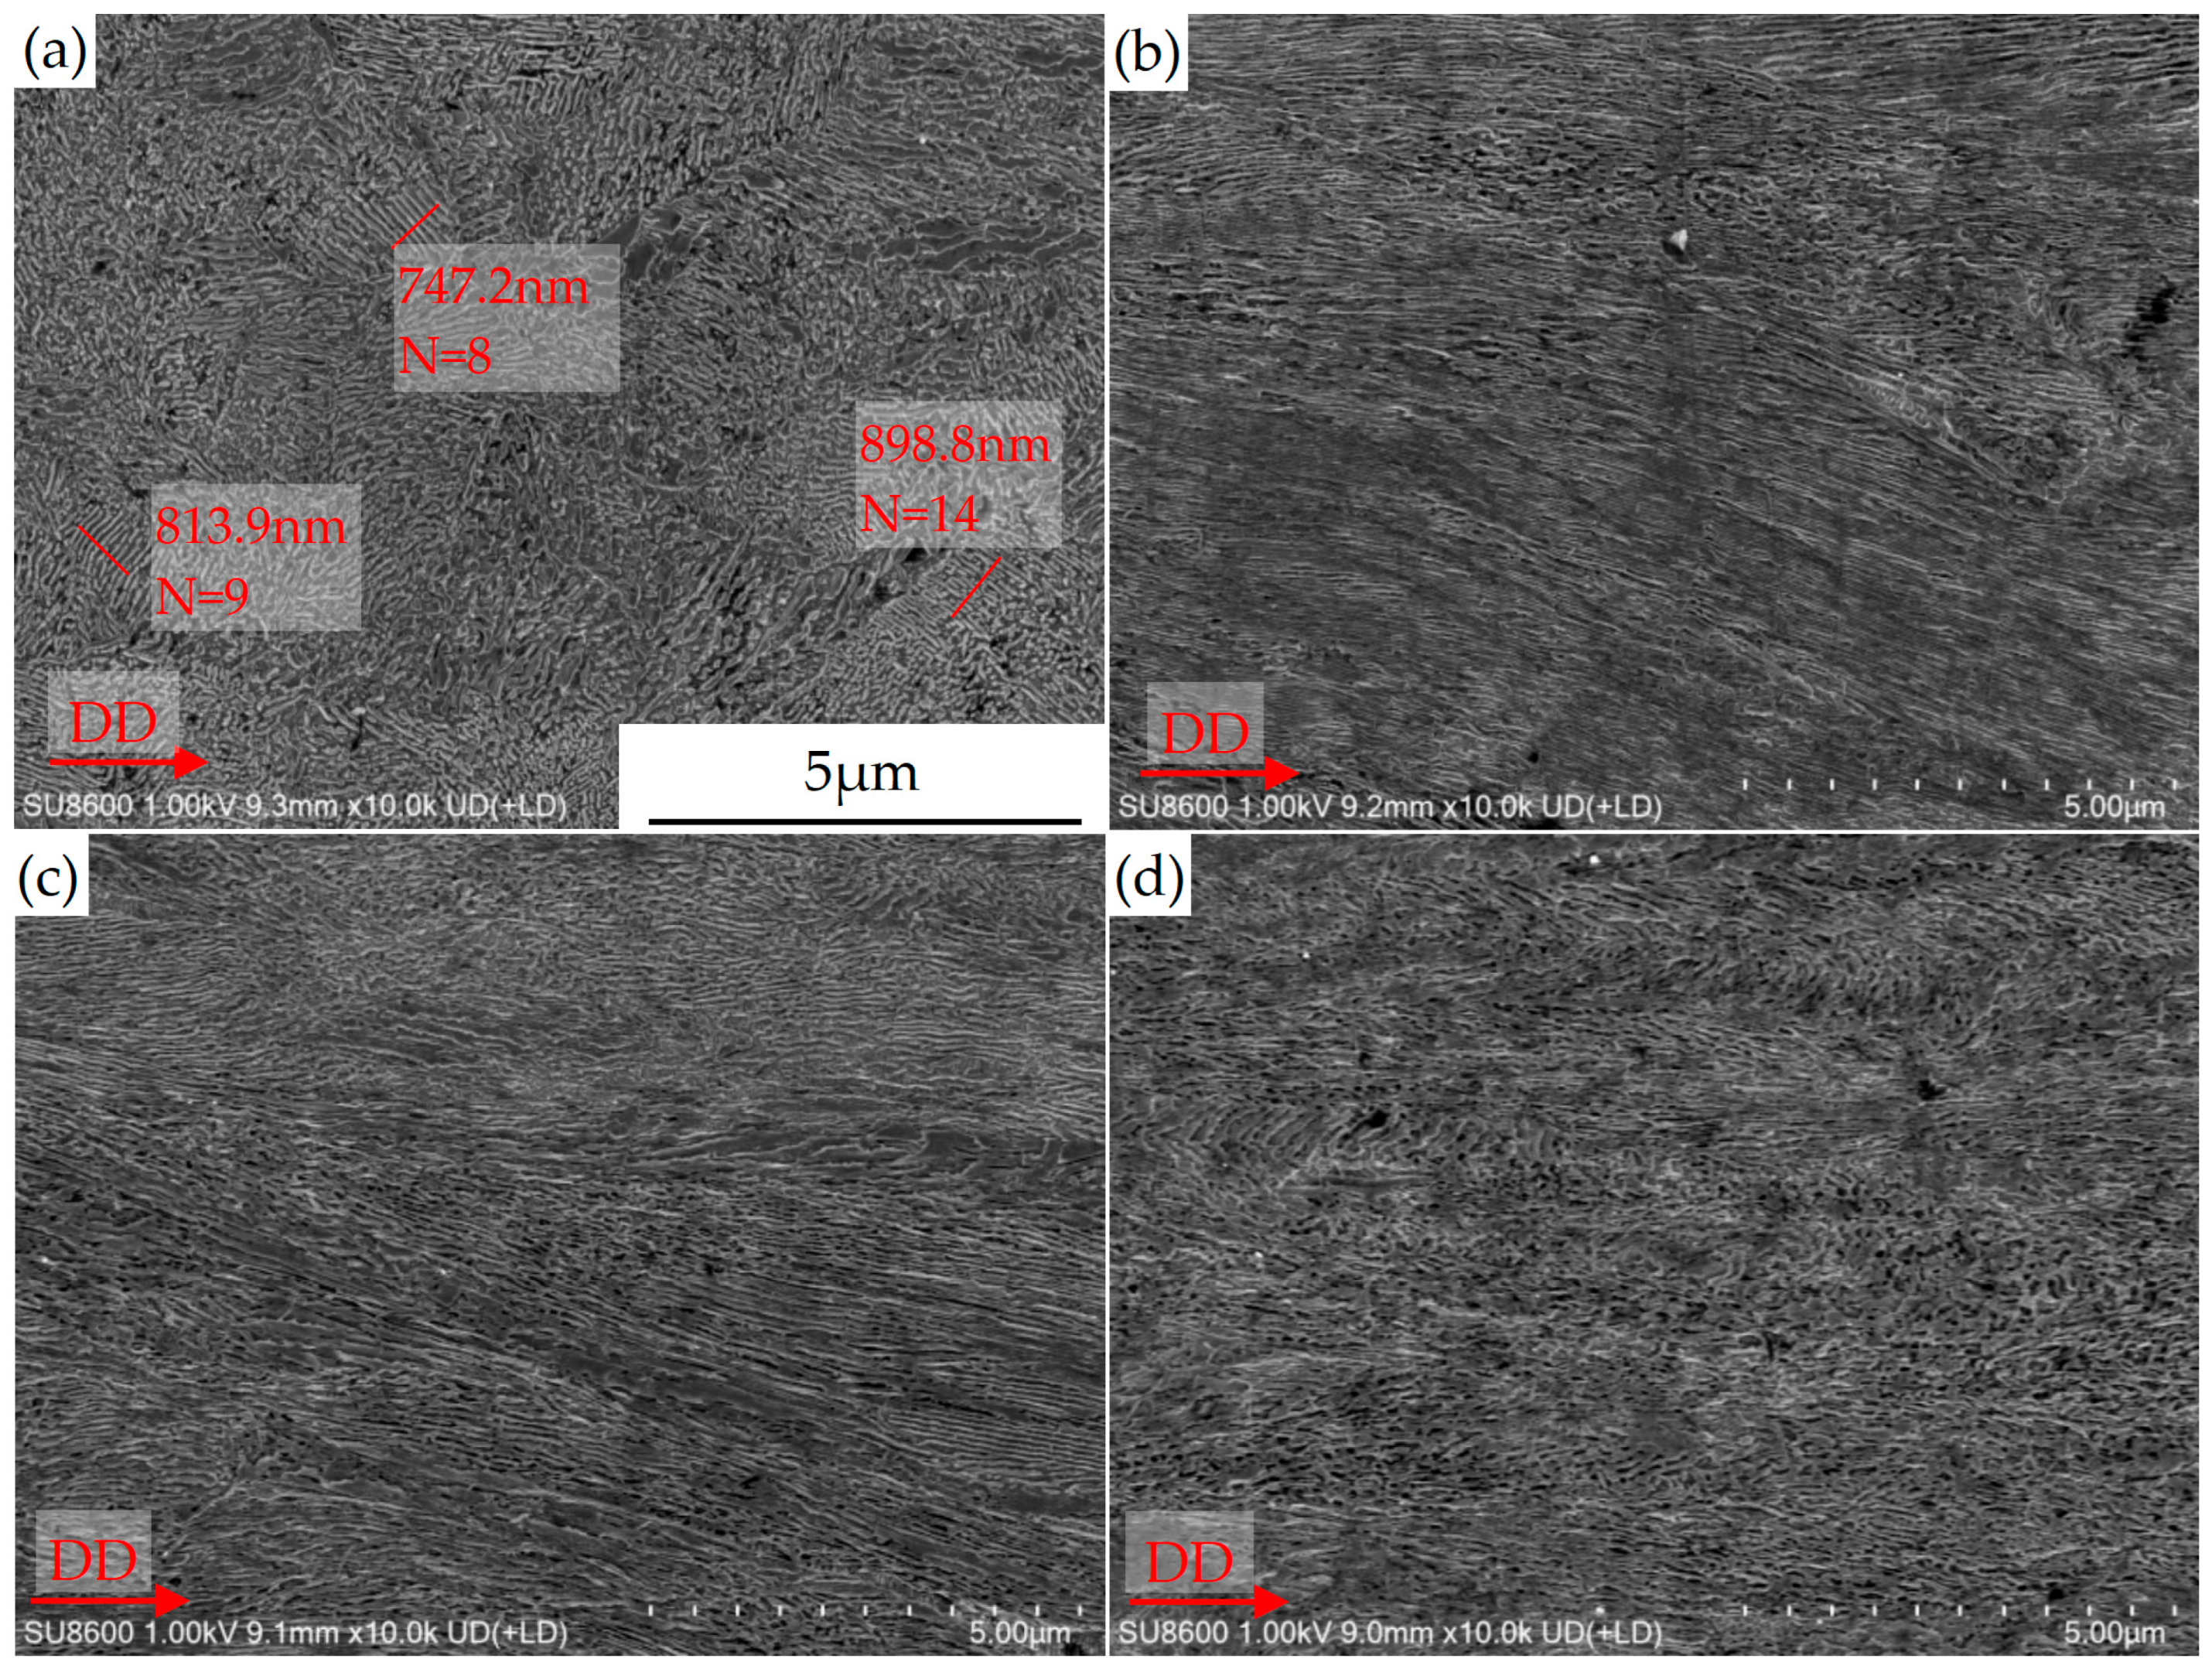
Due to the insufficient magnification of the metallographic microscope, the sample was also examined using a scanning electron microscope (SEM), with results shown in Figure 3. At this magnification, the pearlite lamellae are clearly visible. It can be inferred that after the sequential processes of sorbite transformation, aluminum cladding, cold drawing of the aluminum-clad steel wire, and annealing treatment, the average of three repeated measurements of the interlamellar spacing of ferrite in the steel core specimen shown in Figure 3a is approximately 82.68 nm, and the standard deviation is 11.2 nm, consistent with the microstructural characteristics of sorbite (interlamellar spacing of 80–150 nm) [10,11]. Moreover, following cold drawing and annealing processes, the interlamellar spacing remains roughly unchanged, confirming a sorbite microstructure.
During cold drawing at a compression ratio of 79.7%, the equiaxed grains in the cladded steel core undergo significant elongation due to macroscopic deformation caused by core thinning and stretching (Figure 2b and Figure 3b), which enhances the mechanical properties of the aluminum-clad steel wire after cold drawing strengthening. After various annealing treatments, the microstructure remains largely unchanged, primarily because the annealing temperatures are far below the critical heat treatment temperature (Ac1 = 727 °C) [12] of grade 70 steel. After annealing at 300 °C for 10 min (Figure 3d), the alloy microstructure shows a marked increase in dispersed fine, equiaxed, and darker contrast regions—clearly indicating that these fine grains are low-temperature recrystallization products, significantly different from those obtained by cold drawing or by annealing at 200 °C for 10 min.
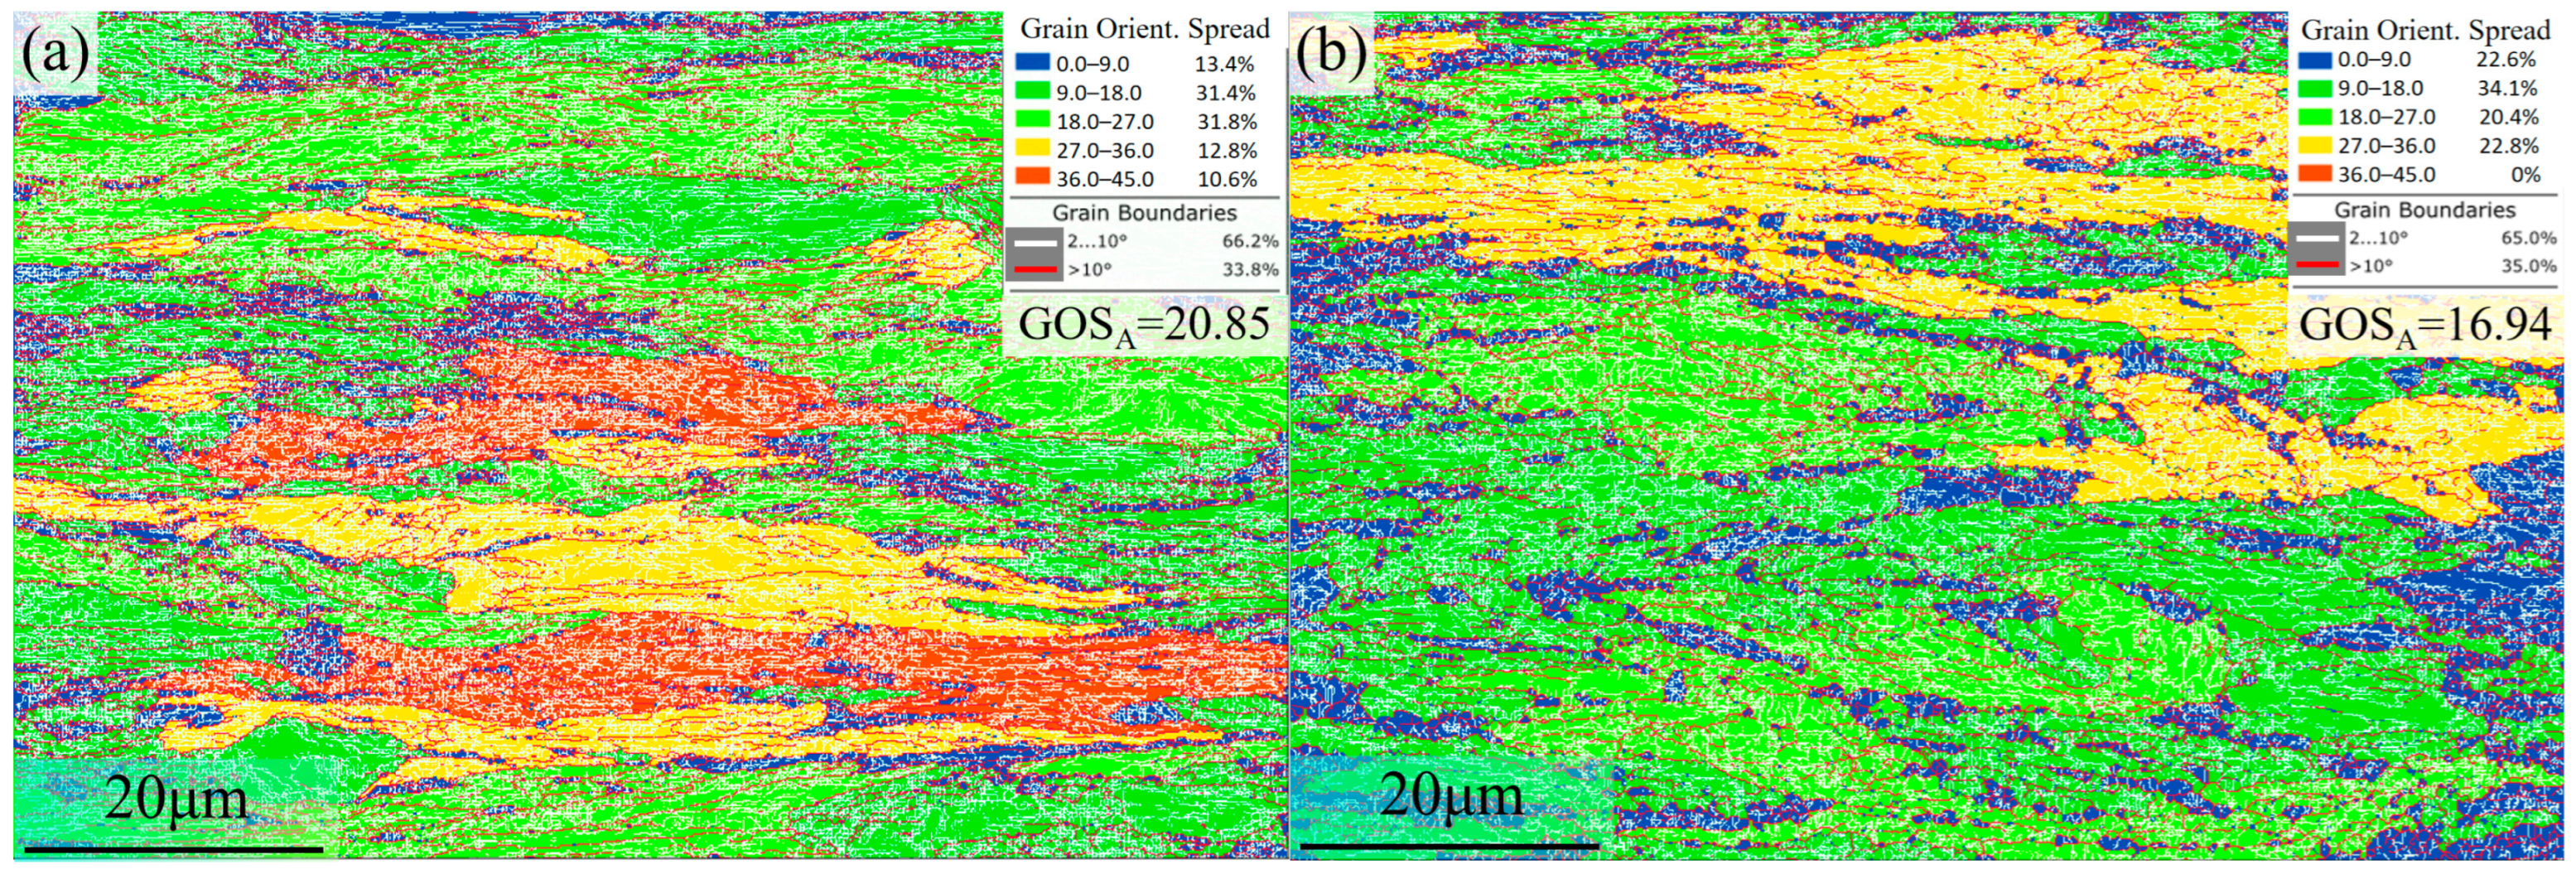
The grain orientation spread (GOS) analysis from EBSD data in Figure 4 further quantitatively confirms this observation. GOS measures the deviation between each measurement point within a grain and its average orientation, with grain colors assigned based on the mean deviation values across all pixels. Strain values are determined by lattice rotation measurements, where higher values indicate greater residual internal strain [13,14]. The comparison of GOS profiles from both processes in Figure 4 and the evolution of α-Fe high-angle and low-angle grain boundaries (HAGBs and LAGBs) and average grain sizes (AGSs) in Table 1 demonstrate that no significant phase transformation occurs in the α-Fe phase of grade 70 steel cores post-annealing treatment; neither the proportion of HAGBs and LAGBs nor the maximum grain size exhibits notable changes, remaining within reasonable ranges. However, the intracrystalline GOS values reveal significant differences in microstructure between cold-drawn specimens and annealed specimens. After annealing, within the distribution range of GOS values of 0–9 (blue region), the proportion of microstructures produced by the 300 °C–10 min annealing process (Figure 4b) increases significantly to 22.6%, compared to 13.4% for the cold drawing process (Figure 4a). Notably, distinct HAGBs (marked by red curves) are observed in the blue region, indicating localized recrystallization within the grade 70 steel core, primarily occurring at areas with high grain boundary distortion. Table 1 presents statistical analyses of average grain orientation spread (GOSA) across different processing methods for the grade 70 steel core: except for the 250 °C–10 min process, which shows an anomalous value, all other processes exhibit patterns consistent with cold drawing strengthening and annealing softening, providing a more compelling explanation for the microstructural evolution than AGSs or HAGB and LAGB ratios alone. The GOSA value after cold drawing is 20.85, whereas that after annealing is 16.94, suggesting that monolithic microstructural recovery occurs during different annealing processes, and the key factor is the annealing temperature.
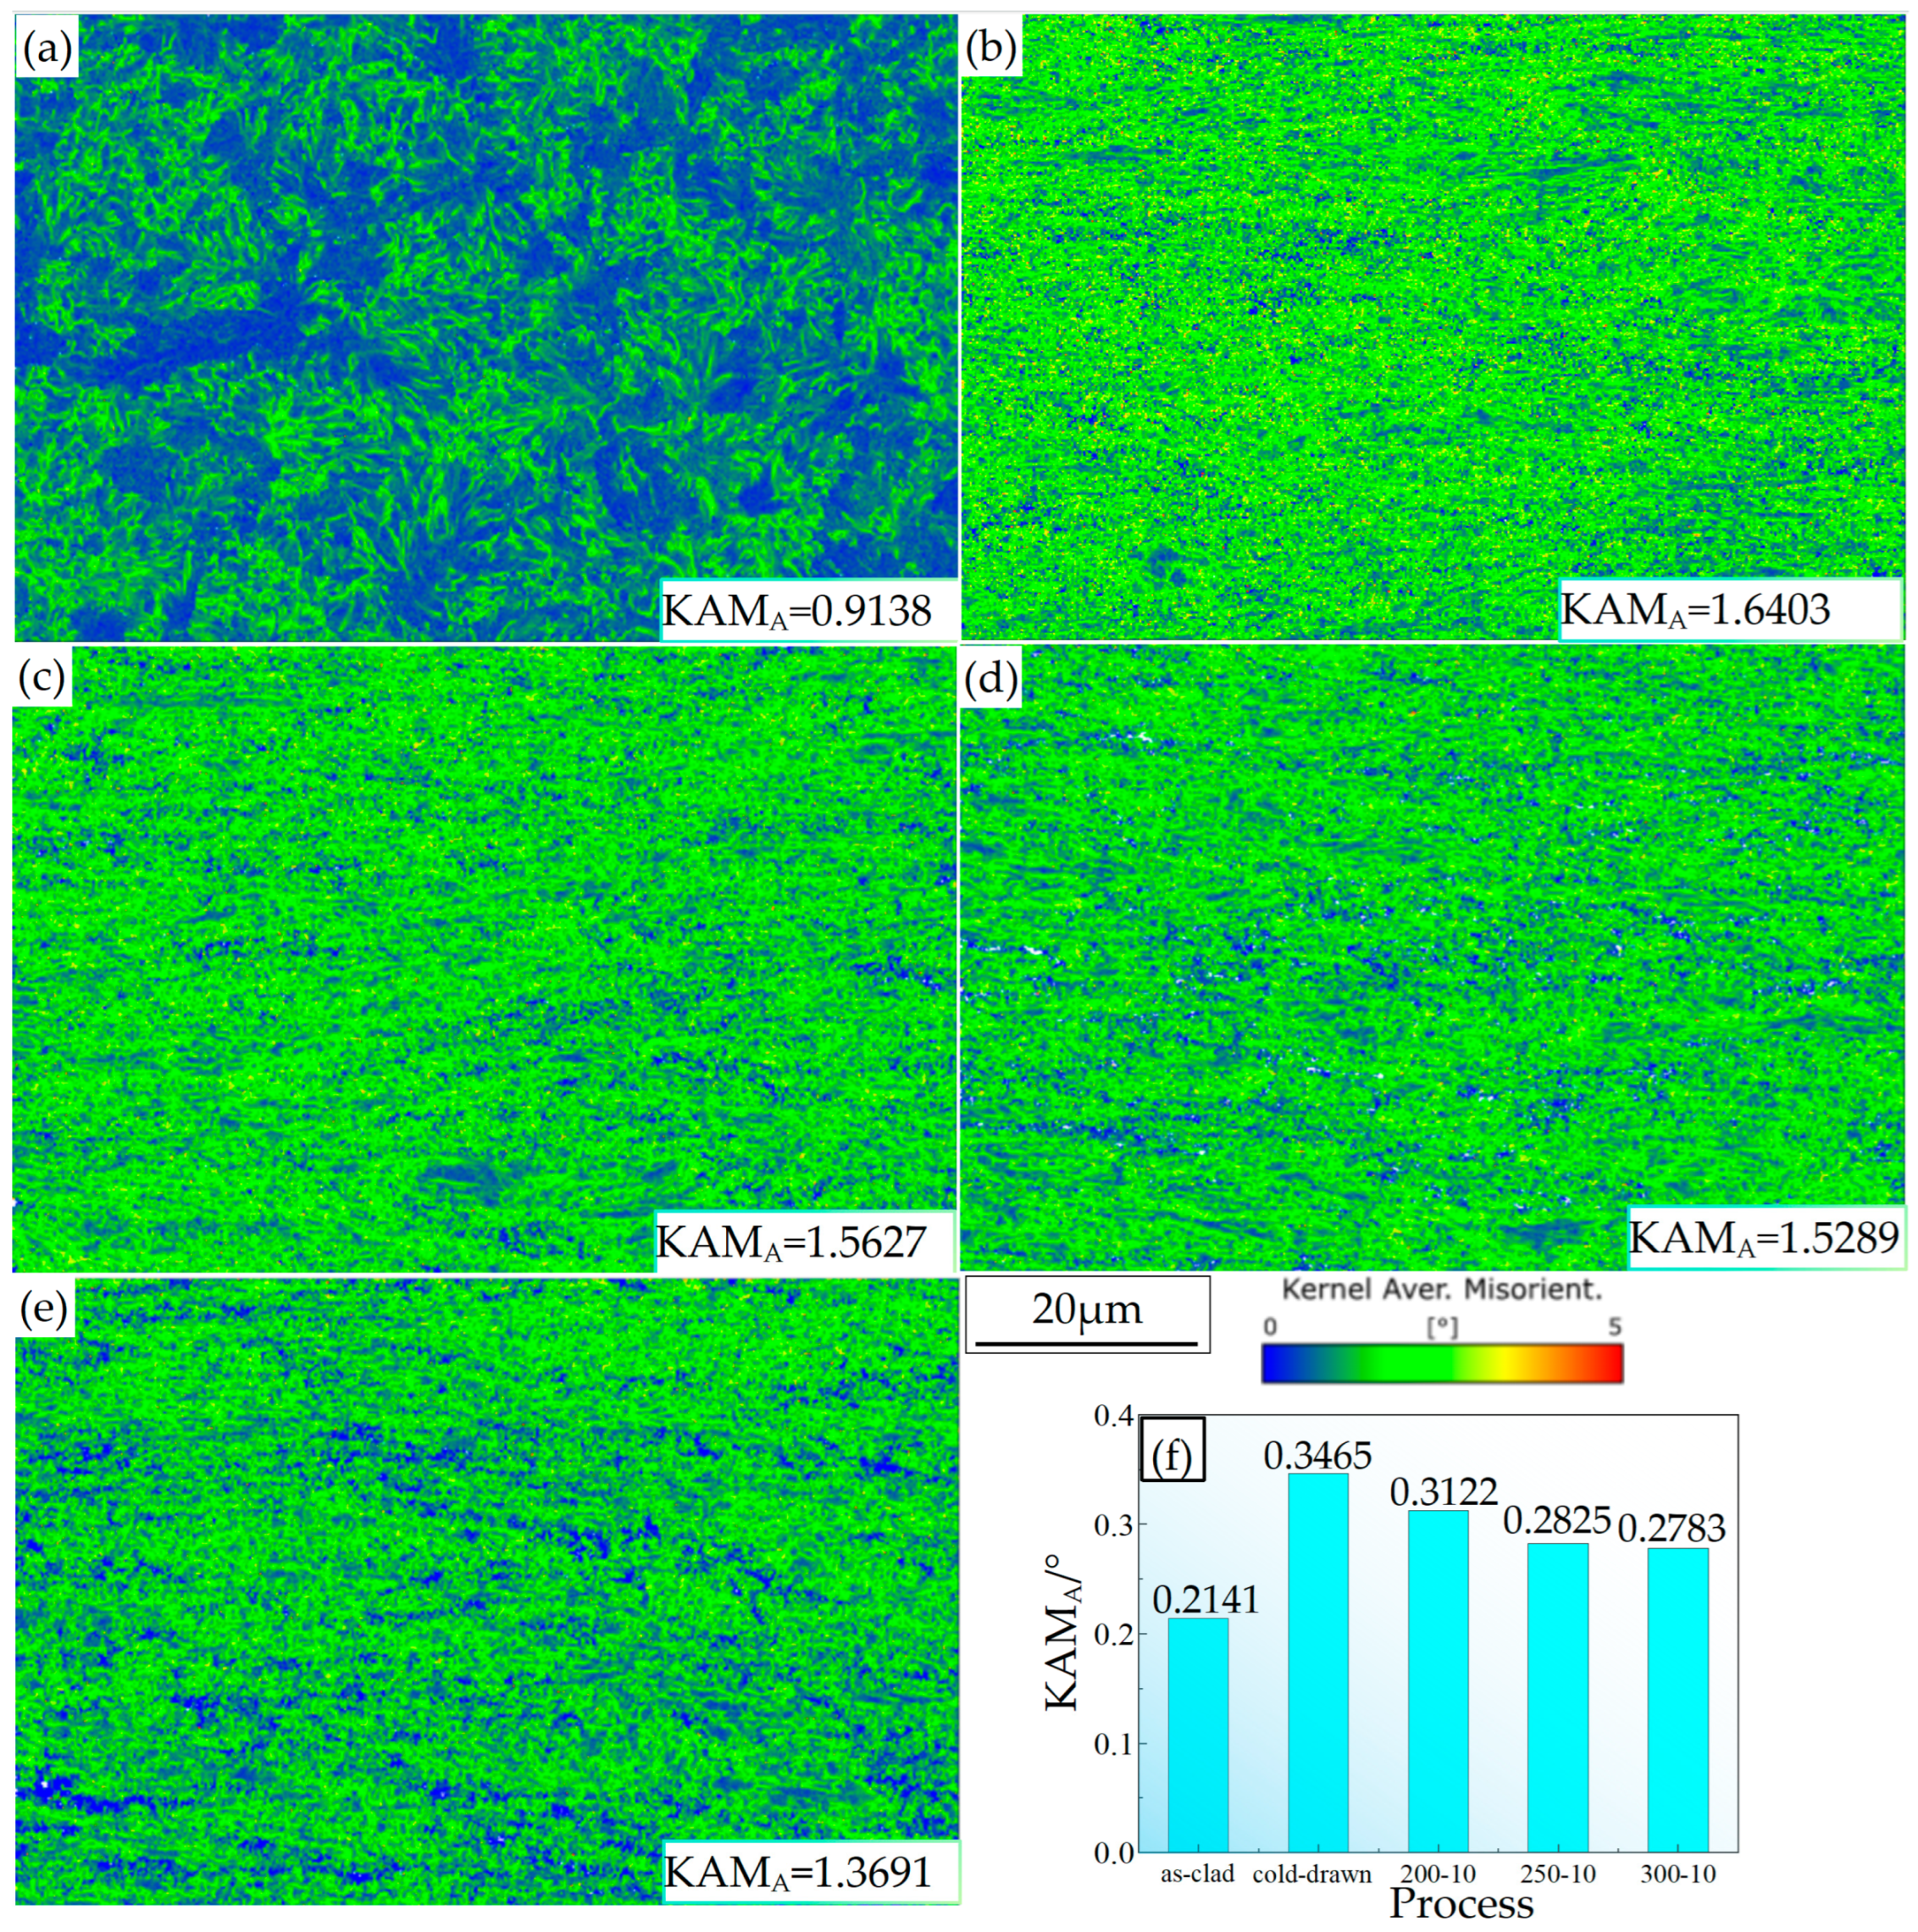
The kernel average misorientation (KAM) map derived from EBSD data quantifies local orientation deviations within the microstructure [14,15]. The KAM value qualitatively reflects the degree of plastic deformation homogenization, with higher values indicating greater plastic deformation or higher defect density. According to Equation (1), the KAM value can be converted into the geometrically necessary dislocation (GND) density:
ρ GND = 2 KAM A / μ b
Here, μ denotes the step size, and b represents the length of the Burgers vector; KAMA stands for the average KAM value of the selected region, which can be calculated using the following formula:
KAM A = exp 1 N 1 i ln KAM L , i
Figure 5a–e show the EBSD-KAM maps obtained with a measurement step size of 120 nm and their corresponding KAMA values, while Figure 5f displays the TKD-KAMA values acquired at a step size of 7 nm. Analysis reveals that although differences in step size result in significant variations between the KAMA values measured by EBSD and TKD, both datasets exhibit the same evolutionary trend: cold drawing causes a marked increase in the GND density, whereas elevated annealing temperatures lead to a slight decrease. Annealing within the temperature range of 200 °C to 300 °C ensures only a minor reduction in steel core strength; whether elongation improves requires precise mechanical property testing.
In tests for work hardening and annealing softening, X-ray-based residual stress measurement is a common analytical method; Table 2 presents residual stress data under various processing conditions. Compared to the variation trends in GOSA and KAMA values determined by EBSD/TKD, the fluctuations in residual stress shown in Table 2 lack regularity. Several factors contribute to this discrepancy: (1) GOSA values are influenced by grain size, while KAMA measurements and residual stress analyses do not account for this parameter; additionally, KAMA values are subject to interface density (grain boundaries or phase boundaries). (2) The presence of Fe3C phases and pronounced preferred orientation (Figure 6) can lead to inaccurate stress assessments. Therefore, it can be concluded that X-ray-based residual stress measurement is not suitable for quantitative or qualitative evaluation of work hardening or heat treatment softening in aluminum-clad steel wires.
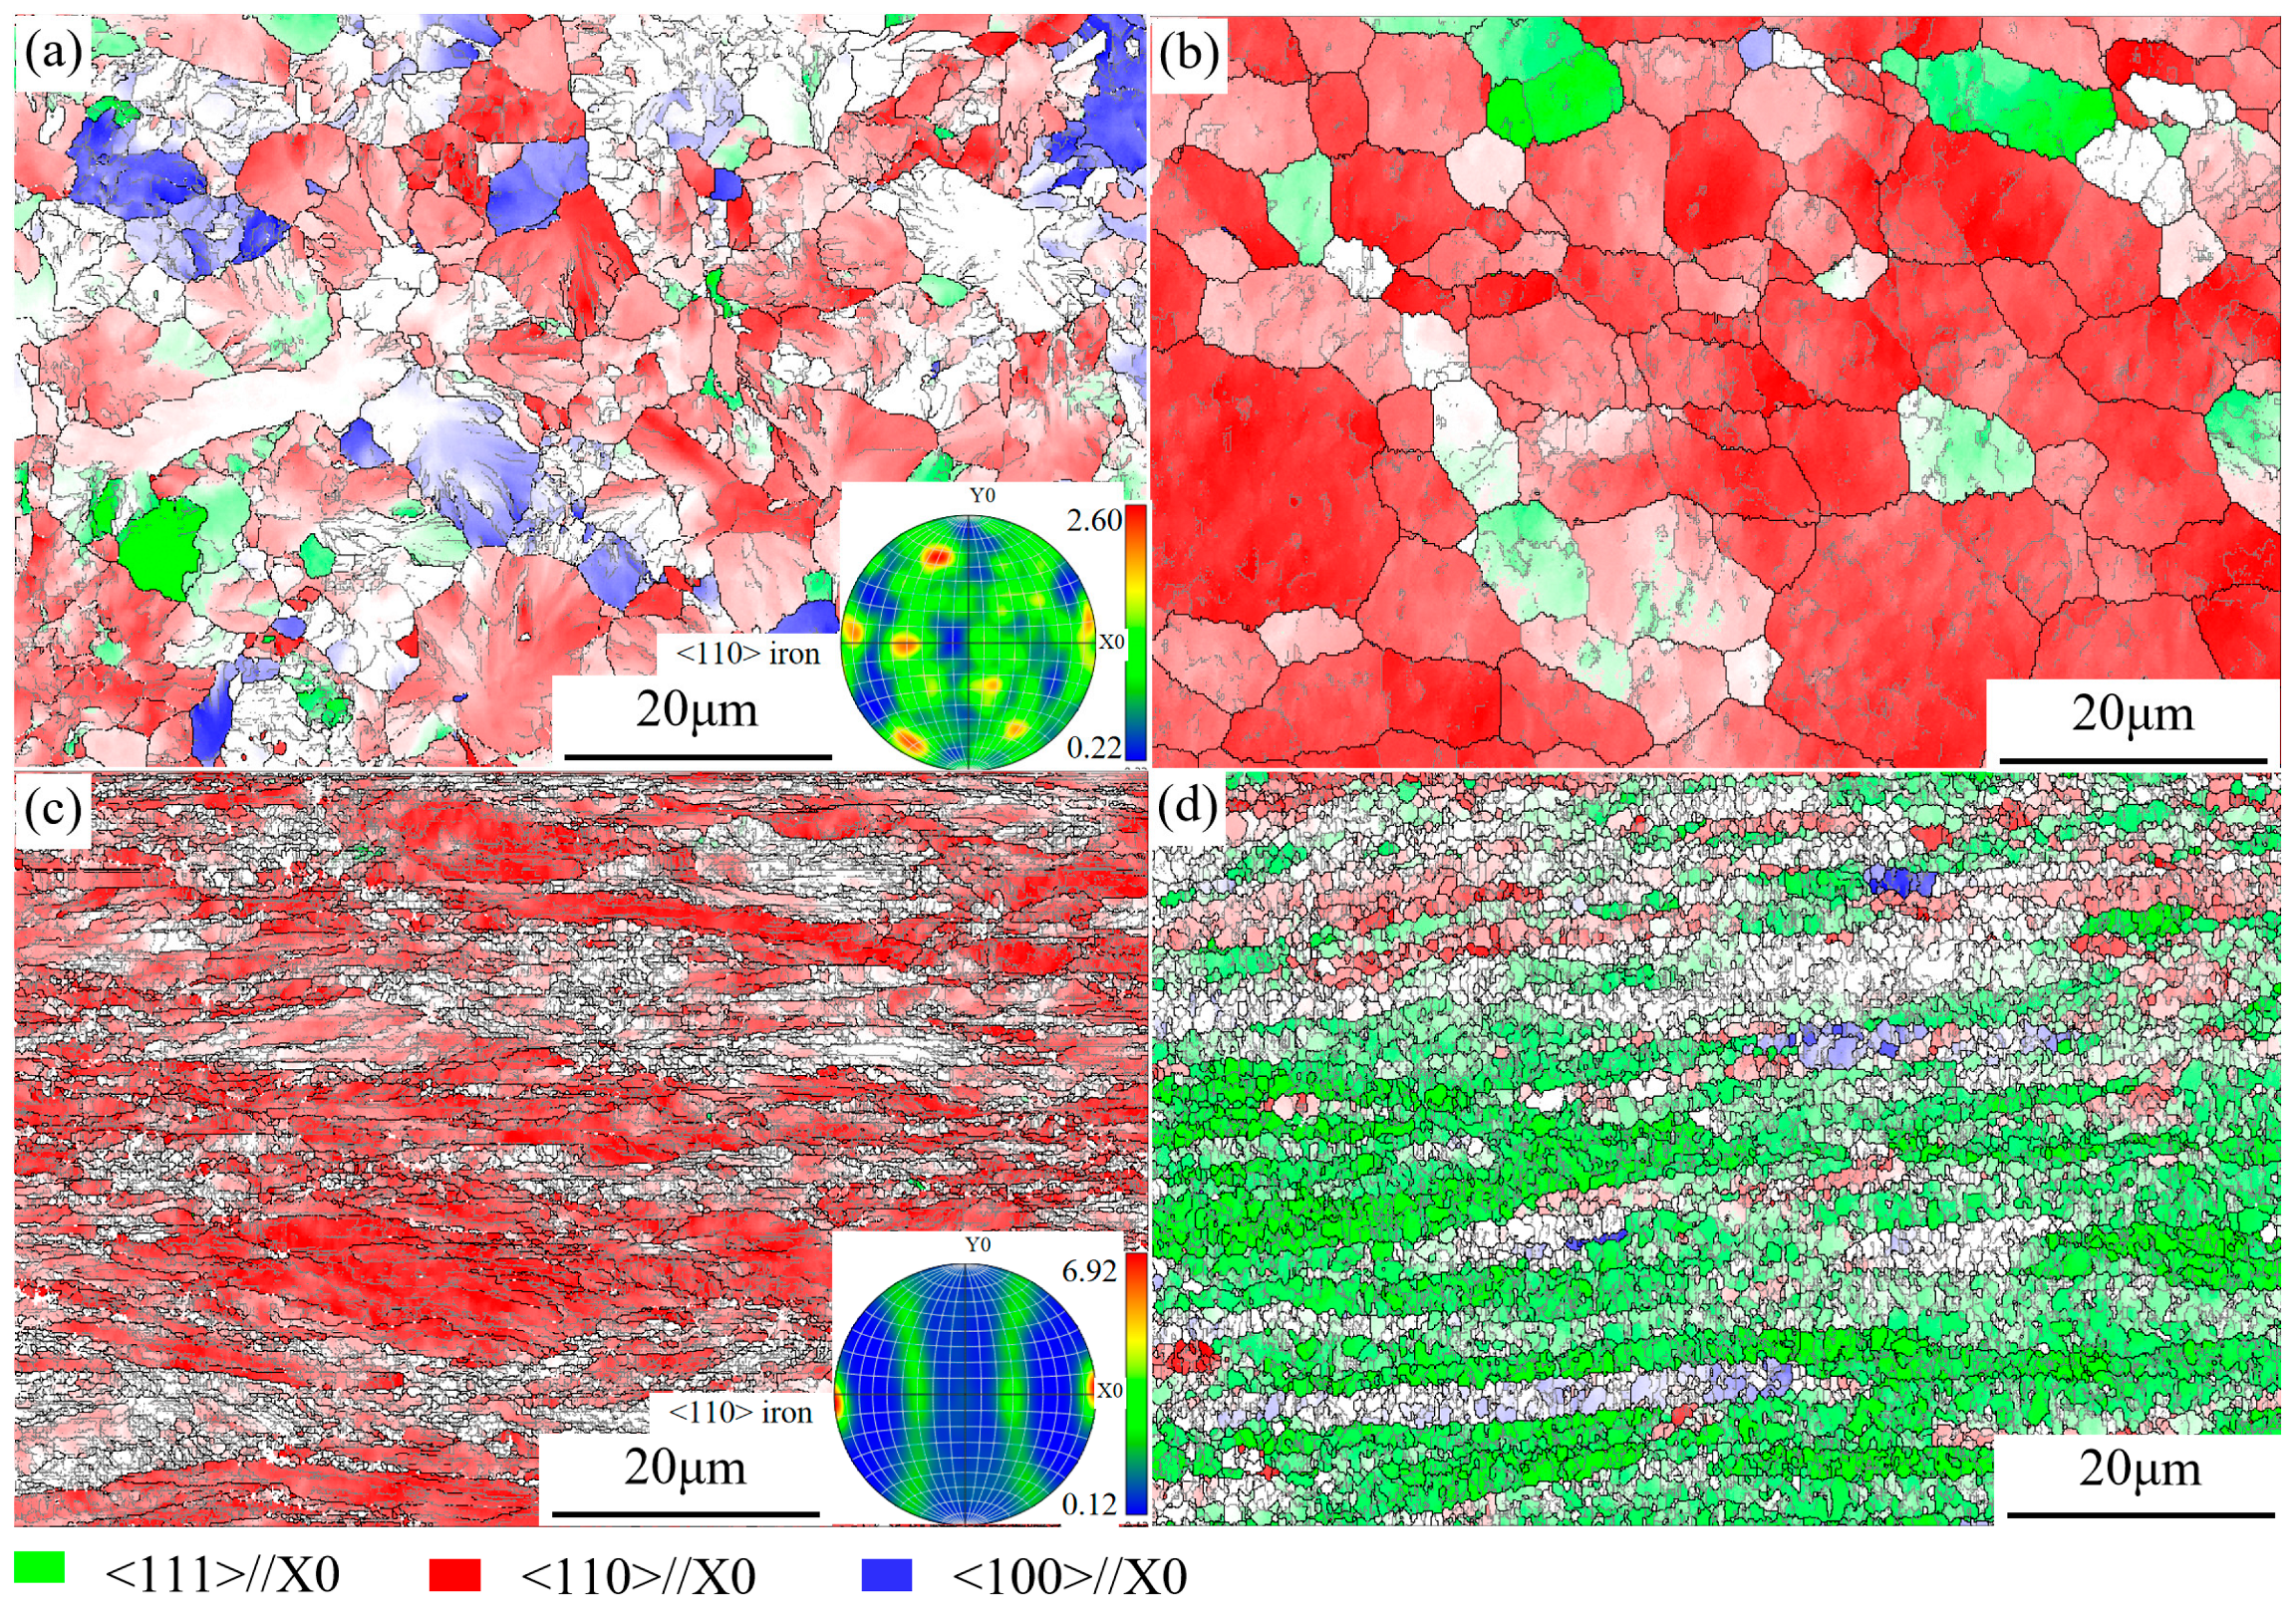
Texture significantly influences the mechanical properties of grade 70 steel core materials, inducing anisotropy and enhancing axial ultimate strength. Figure 6 presents EBSD texture and pole figures of aluminum-clad steel wire cores under different processing conditions, and Table 3 lists the detailed proportion and evolution data of various fiber textures. The results demonstrate that cold drawing not only induces strain hardening and strengthening but also causes significant fiber-textured strengthening. In the as-clad grade 70 steel core, which exhibits a sorbite-dominated microstructure, the <110> texture accounts for 56.6% of the total. After cold drawing, the <110> texture proportion increases markedly to 83.4%, while the <111> texture decreases from 8.73% to 0.54%. Comparison of the pole figures reveals that the <110> poles of the as-clad steel core evolve from a scattered distribution into an arc-shaped distribution, which is characteristic of a typical fiber texture. Following annealing at 200~300 °C, the texture of the grade 70 steel core shows no significant change compared with that of the cold-drawn condition. Table 1 and Table 3 provide statistical comparative analyses of grain size, HAGBs and LAGBs, and texture evolution in the conductive aluminum claddings; however, since these aluminum claddings do not contribute structural strength in aluminum-clad steel wires, they are not discussed in detail.

3.2. Evolution of Mechanical Properties

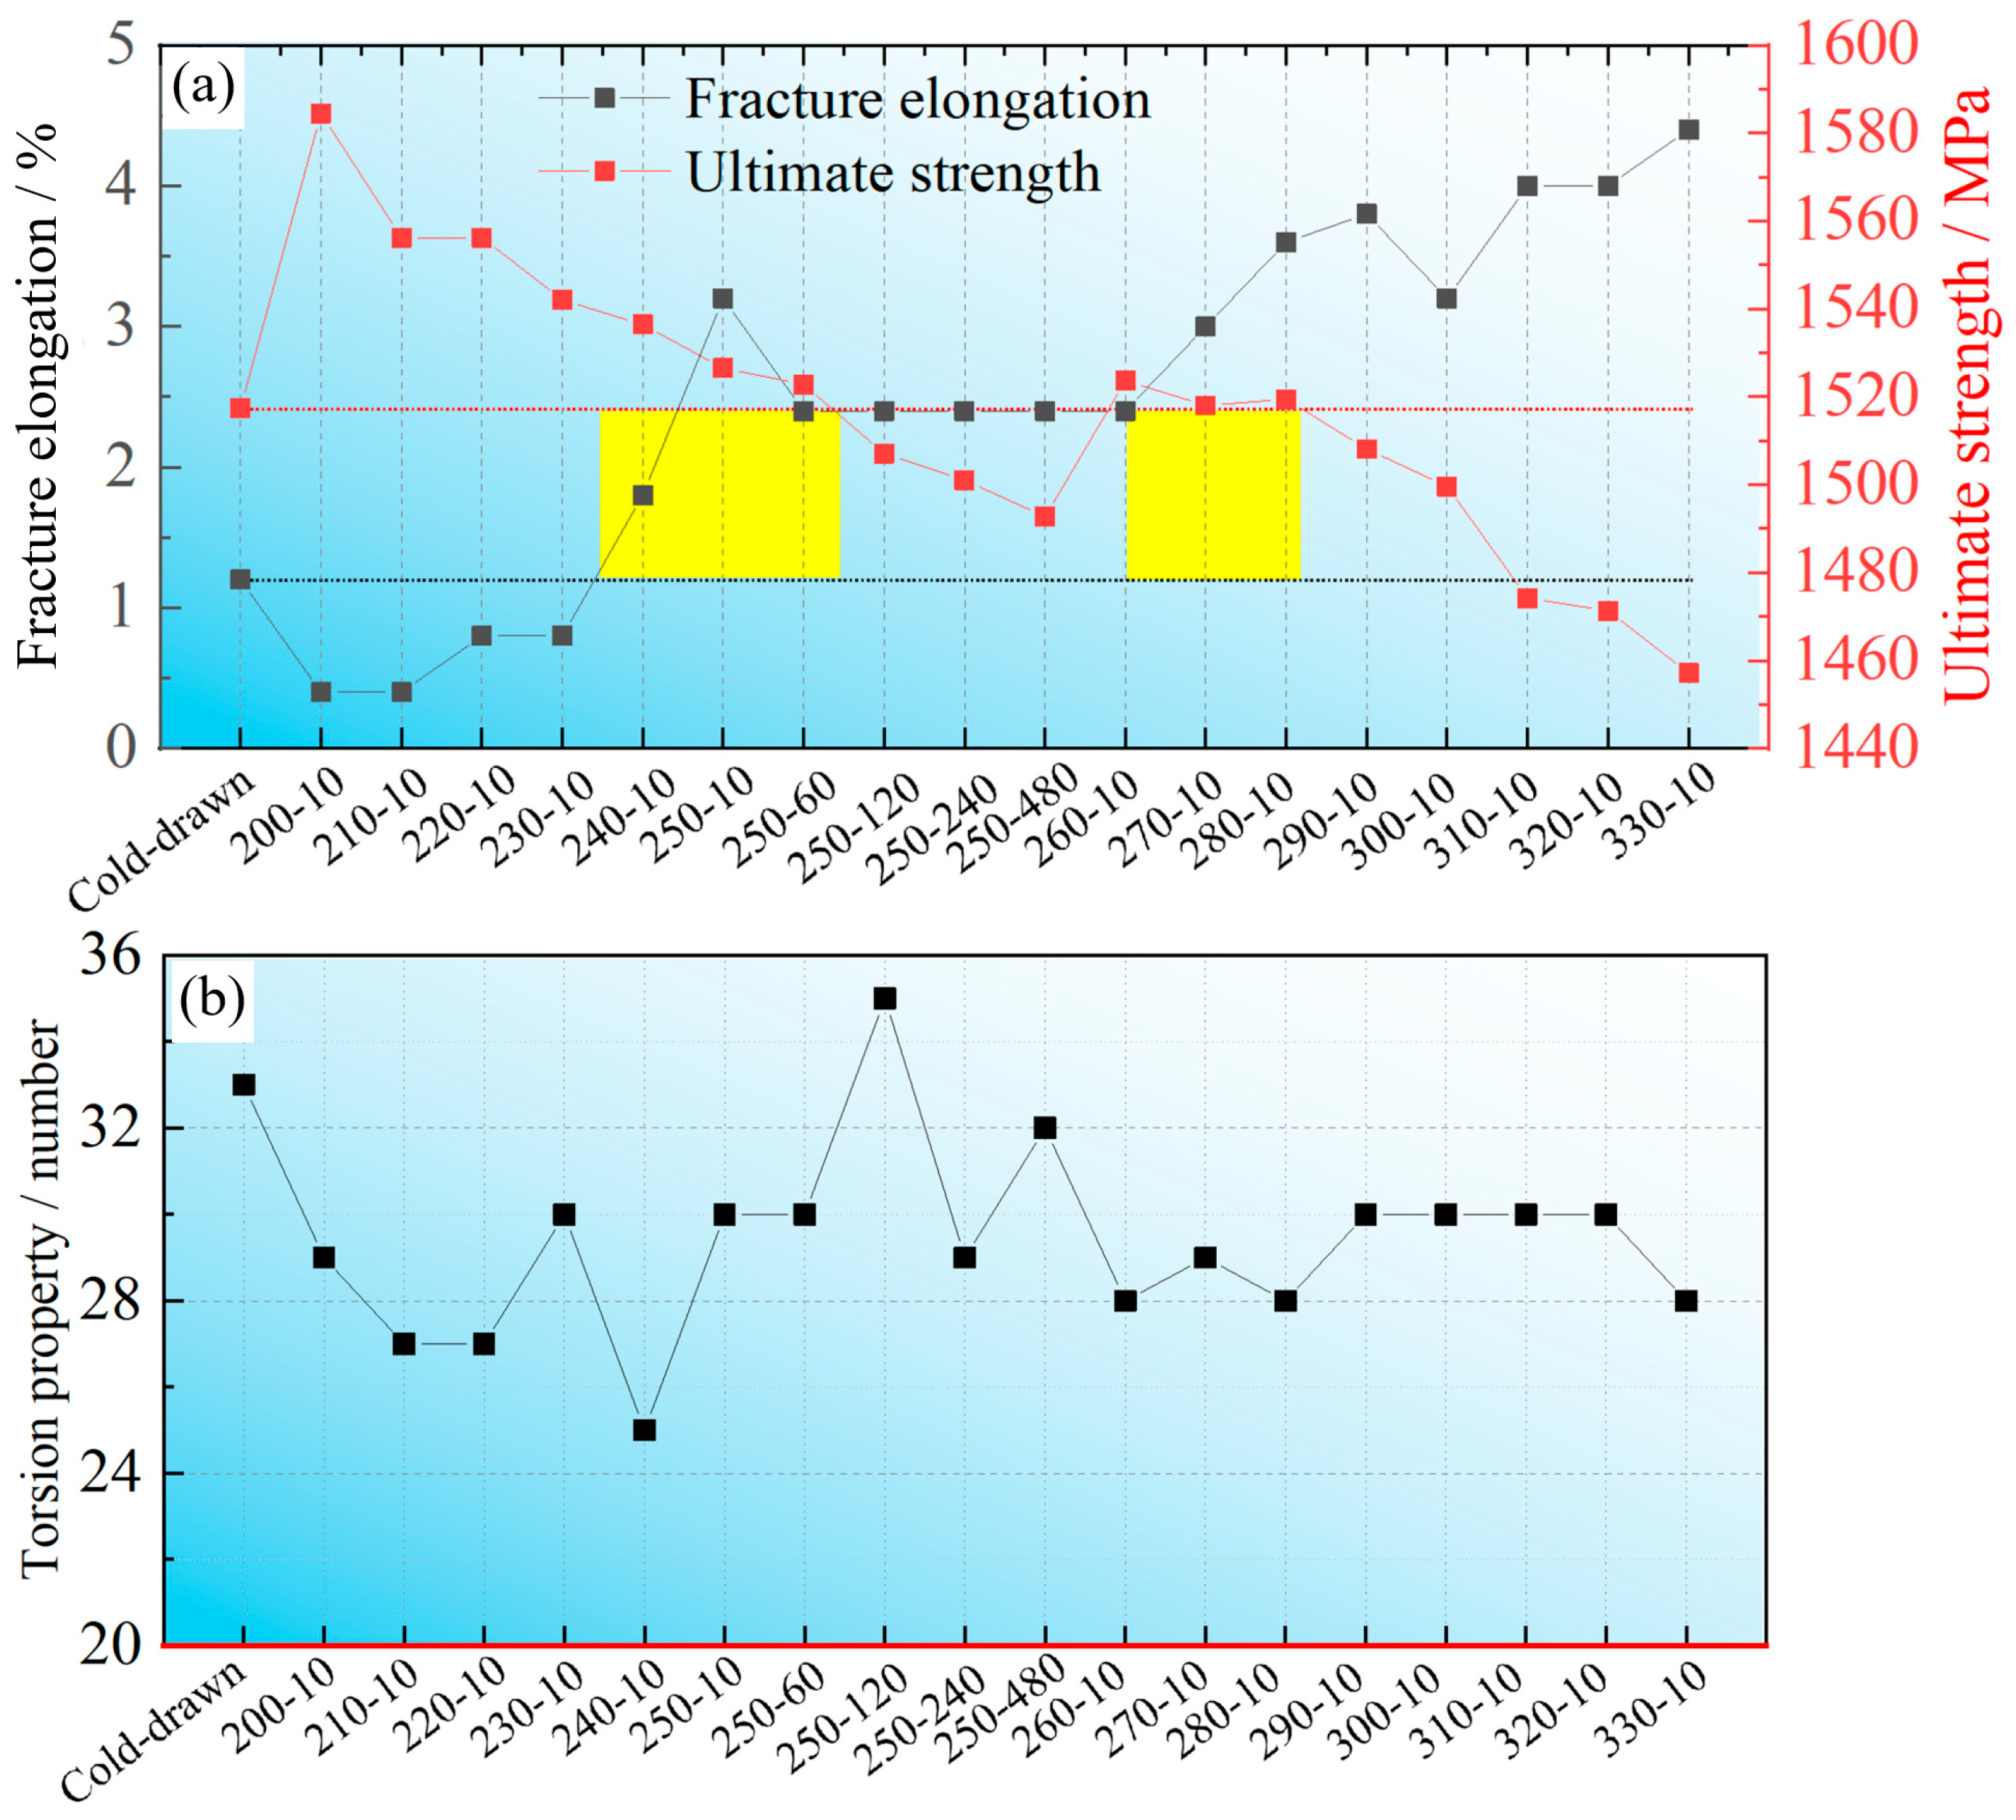
All aluminum-clad steel wires subjected to various heat treatment processes underwent at least three repeatability tensile tests and one torsional test. Given that the mechanical properties of aluminum-clad steel wires significantly impact the service performance of UHV transmission lines, stringent requirements are imposed on these properties. This study therefore analyzed the worst tensile and torsional performance data from each sample group, as shown in Figure 7. According to ASTM B415-16 (2021), aluminum-clad steel wires must achieve a minimum torsion resistance of ≥20 turns to meet service requirements; although variations exist, all samples in Figure 7b demonstrate compliance with this criterion. Consequently, the analysis focuses primarily on tensile performance (Figure 7a). The tensile data reveal three influencing factors: work hardening effects, annealing temperature, and annealing duration. Analysis shows that increased annealing temperatures reduce the ultimate strength of grade 70 steel cores, while prolonged annealing times also decrease strength—both trends being highly significant. However, regarding elongation at break, elevated annealing temperatures do not consistently improve elongation values but exhibit variability. Under annealing conditions below 240 °C, elongation values are lower than those of cold-drawn samples. Extending annealing at 250 °C results in a gradual strength decline without a significant change in elongation, providing critical insights for engineering applications: extended heat treatment durations may not only increase energy consumption but also compromise mechanical performance. Meanwhile, the region highlighted by the yellow box in Figure 7a demonstrates significantly superior performance in both ultimate strength and elongation at break compared to cold-drawn samples, providing crucial engineering evidence for process optimization of aluminum-clad steel wires.

3.3. Analysis of the Aluminum/Steel Interface and Fe3C Precipitation Characteristics

In understanding the evolution of mechanical properties in aluminum-clad steel wires, research on the aluminum/steel composite interface is equally crucial alongside the development of the steel core’s intrinsic mechanical characteristics. The primary reasons for this are as follows: (1) The fully cladded aluminum/steel interface must achieve complete bonding with sufficient strength to prevent peeling or wrinkling during subsequent cold drawing, heat treatment, and wire forming processes. Local failure at this interface can accelerate high-voltage gap discharge and localized corrosion, causing catastrophic damage to UHV transmission lines. Furthermore, theoretical studies on layered metal composites indicate that the ideal aluminum/steel interface represents a metallurgical bond intermediate between mechanical bonding and intermetallic compound bonding [16,17,18]. Mechanical bonding often leads to wrinkling and detachment during cold drawing and forming, while intermetallic compound bonding significantly compromises bonding performance, potentially inducing brittle cracking that develops into external crack sources along the grade 70 steel core, resulting in substantial declines in wire load-bearing capacity and fatigue resistance.
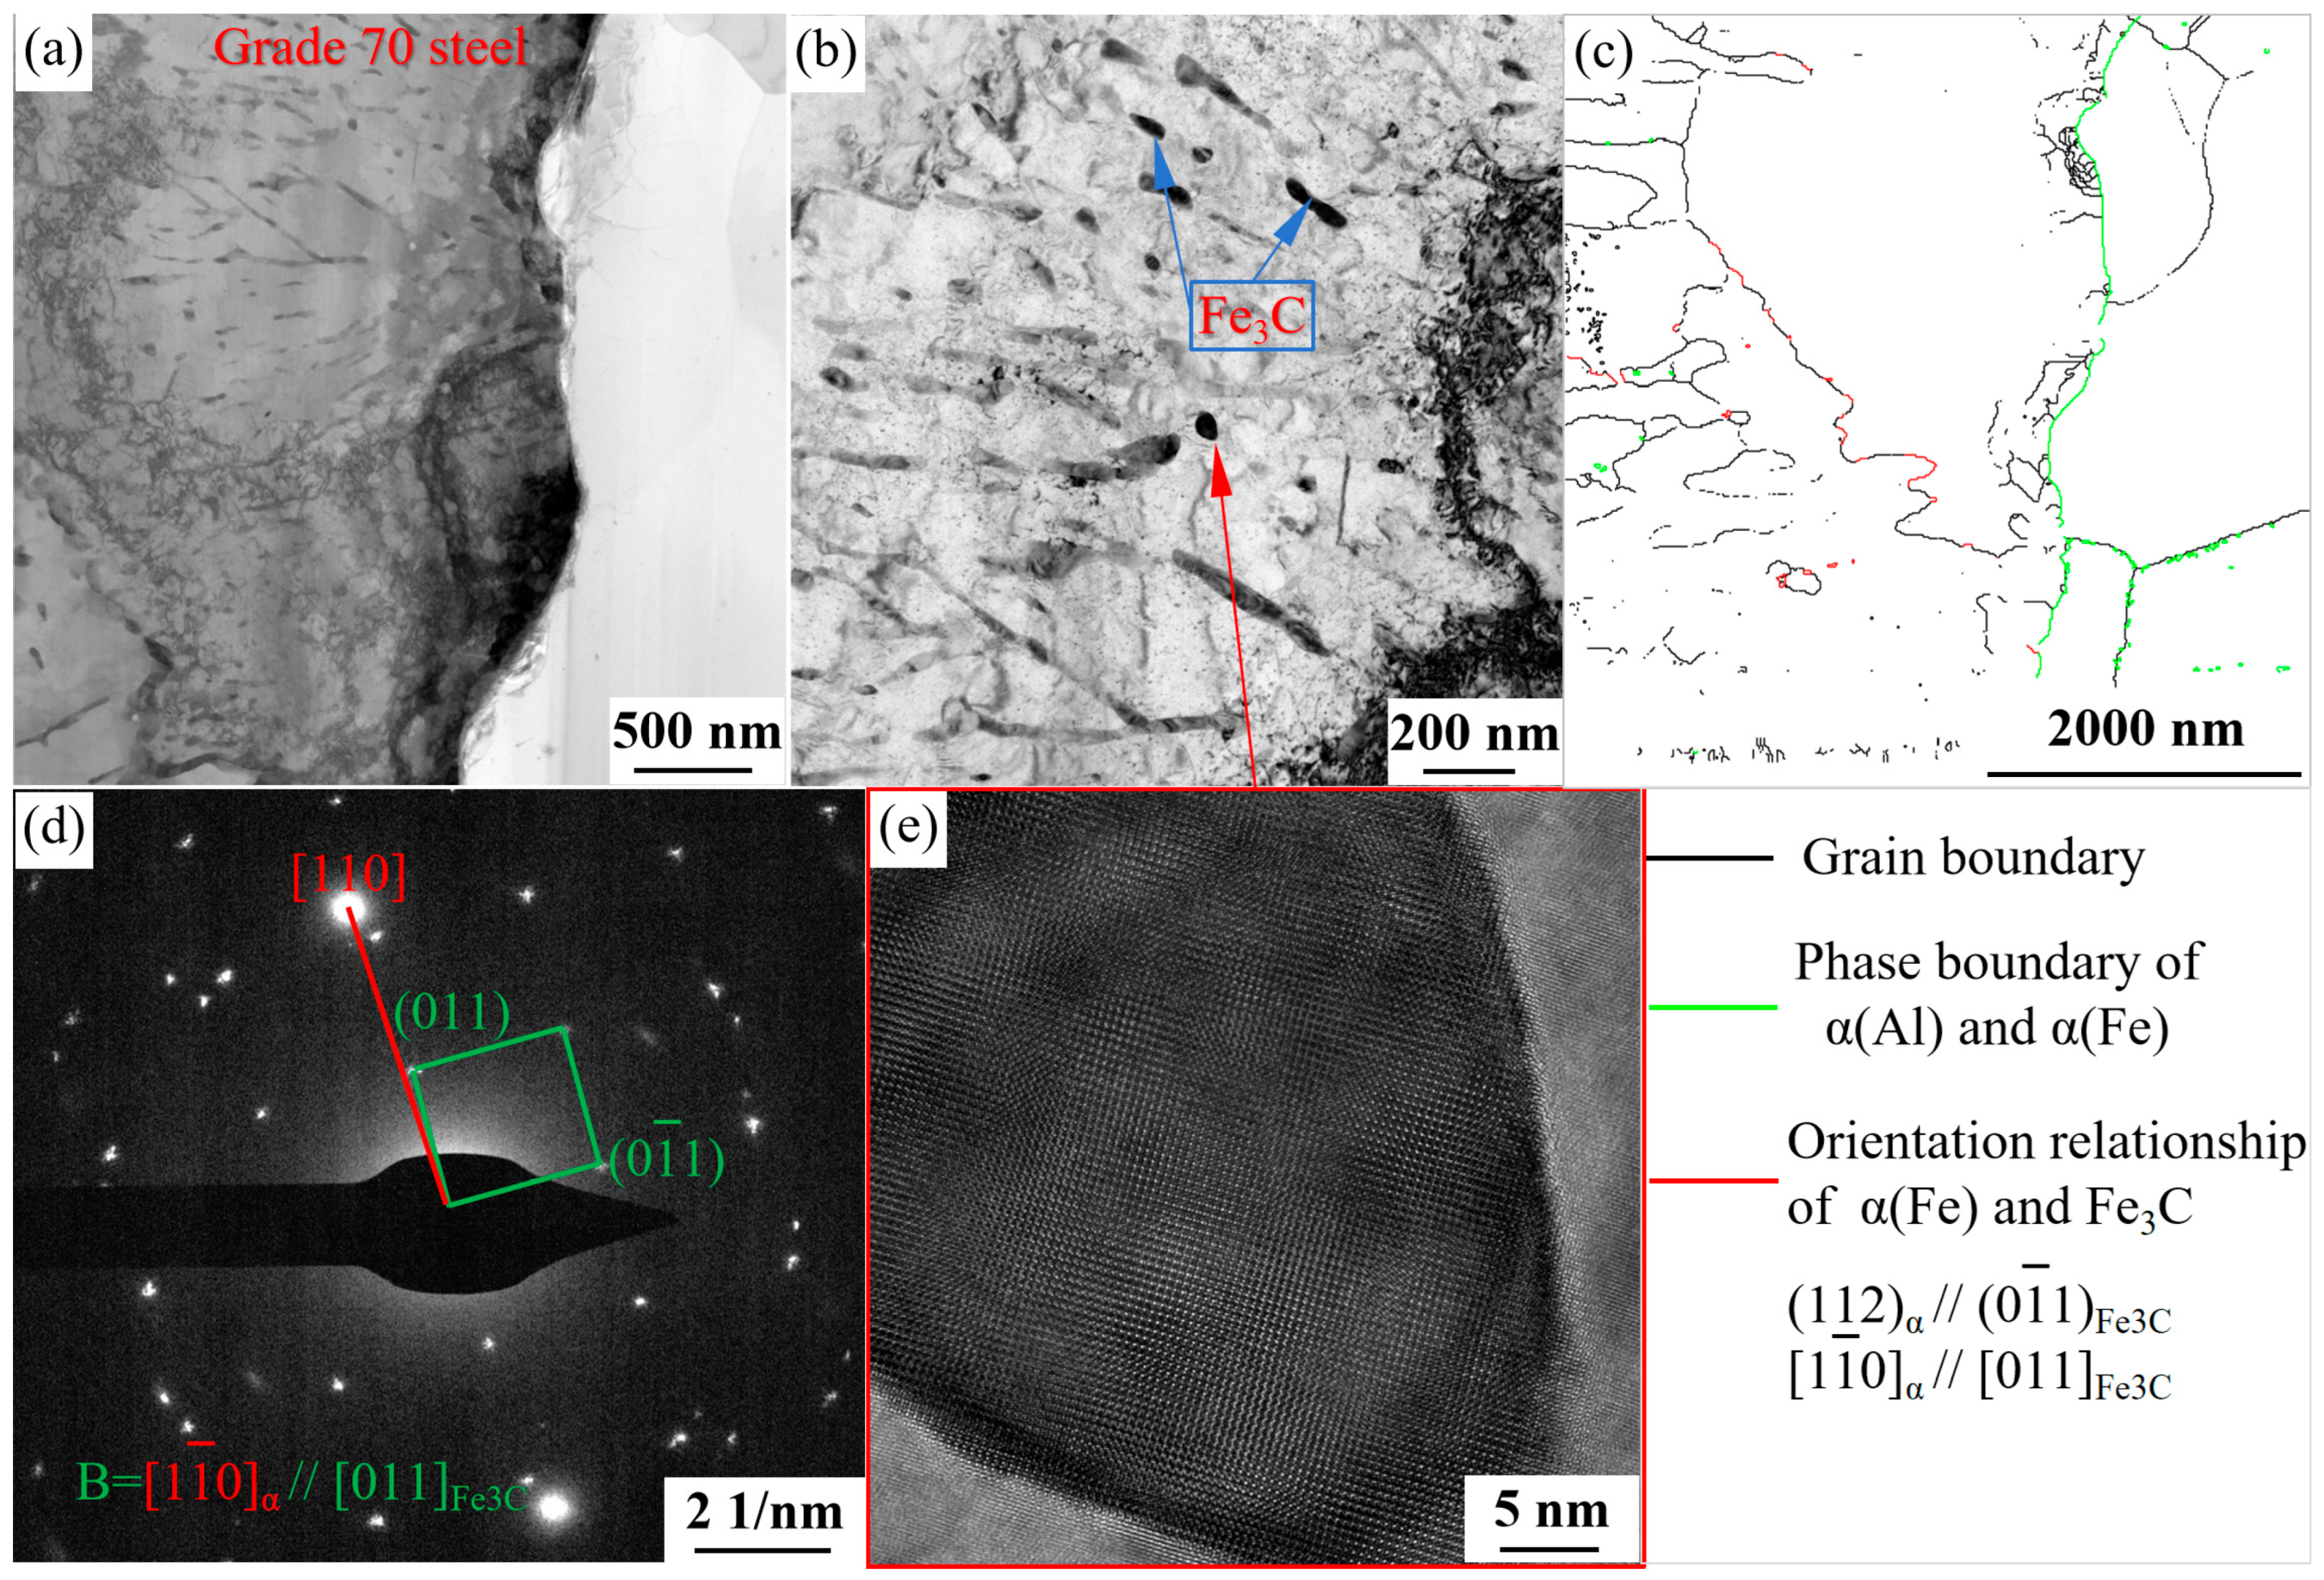
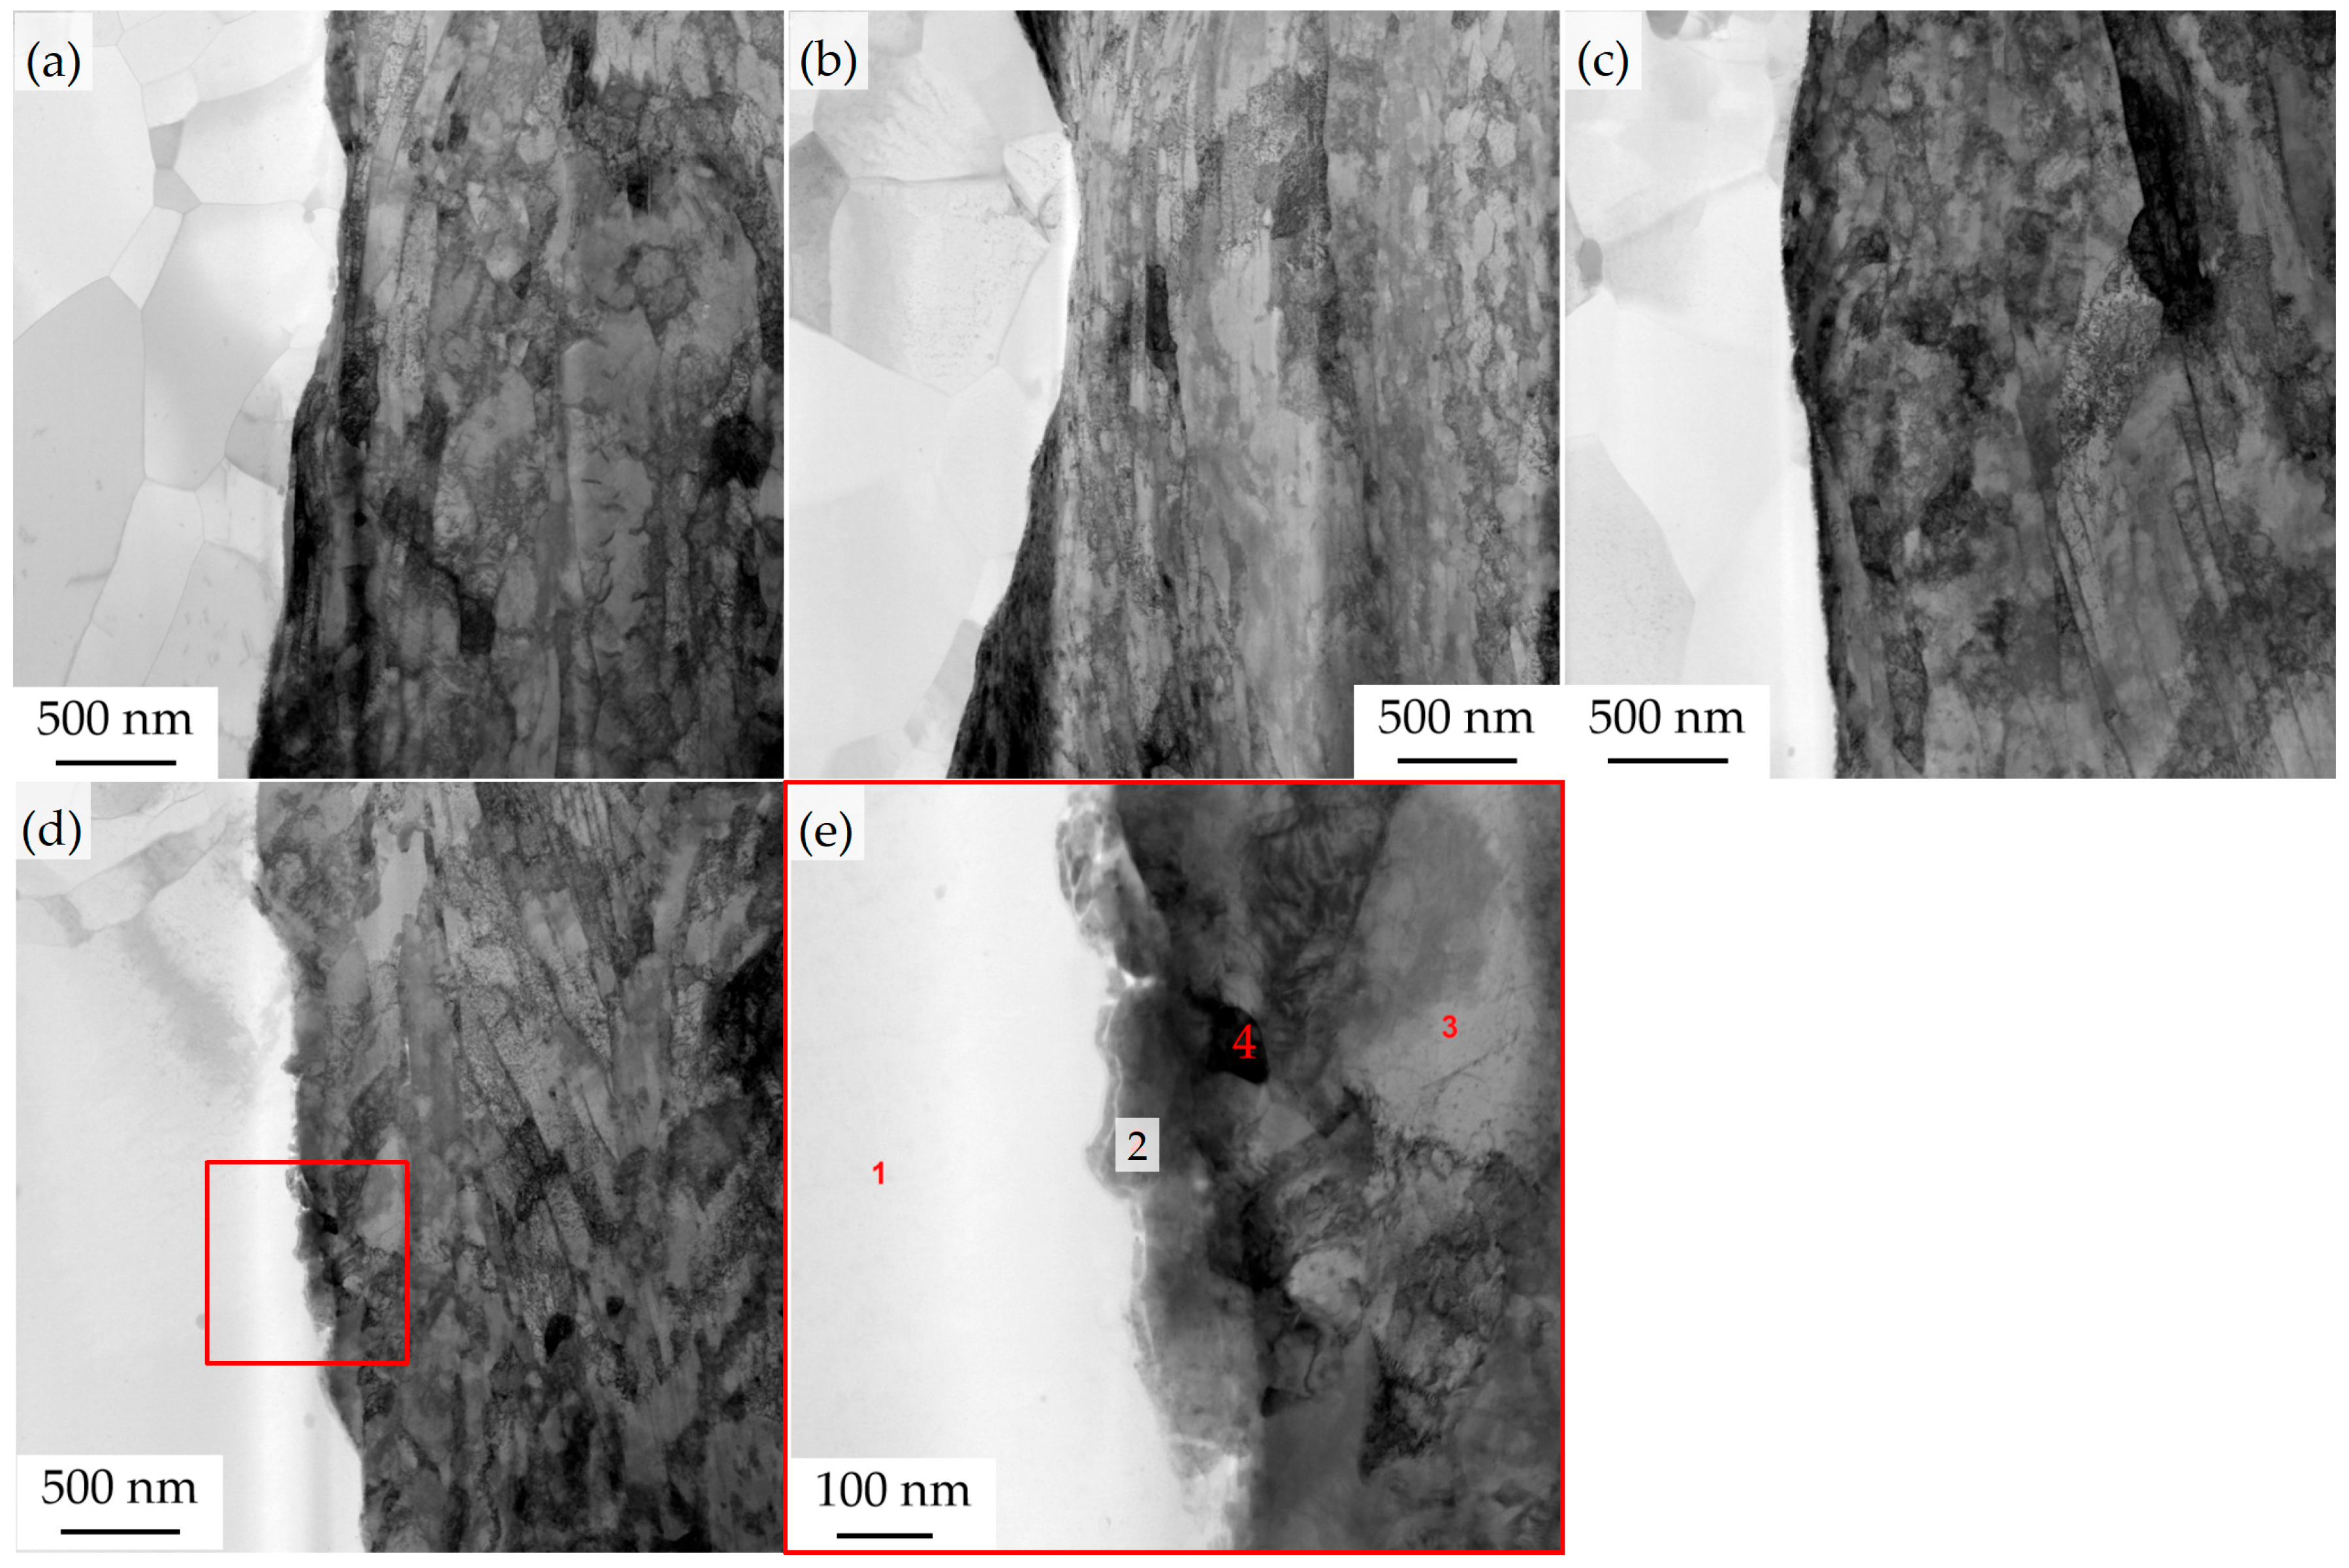
Figure 8 displays the FIB-TEM microstructure near the aluminum/steel composite interface of the cladding process, while Figure 9 shows FIB-TEM microstructures at interface locations from other processing steps. Beyond the typical microstructures of aluminum alloys and grade 70 steel cores, as well as the orientation relationship between Fe3C and α-Fe phases (Figure 8d) and their interface characteristics (Figure 9e), particular attention should be paid to the features and continuity of the interface layer at the aluminum/steel composite interface. Combining TEM data with process characteristics reveals that the interface in coated aluminum-clad steel wires exhibits a typical metallurgical bonding interface, with its strength primarily enhanced by mutual diffusion of elements at the interface. After cold drawing and treatment at 200 °C–10 min or 250 °C–10 min, the aluminum/steel composite interfaces maintain metallurgical bonding characteristics. However, samples processed at 300 °C–10 min show distinct reaction layers—intermetallic compounds—in both low-magnification (Figure 9d) and high-magnification (Figure 9e) views. Extensive studies confirm that Fe-Al reactions can form brittle intermetallic phases characterized by high hardness and brittleness [19,20], which are prone to cracking under external stress, significantly compromising long-term service performance. The morphological contrast at the interface location in Figure 9e combined with STEM-EDS data at corresponding points (Table 4) confirms the presence of intermetallic compounds; notably, Al element at 7.78 at% was detected at point ② approximately 50 nm from the Al/Fe interface. This indicates that, for the purpose of suppressing brittle layers, annealing aluminum-clad steel wire at temperatures above 300 °C should be avoided.
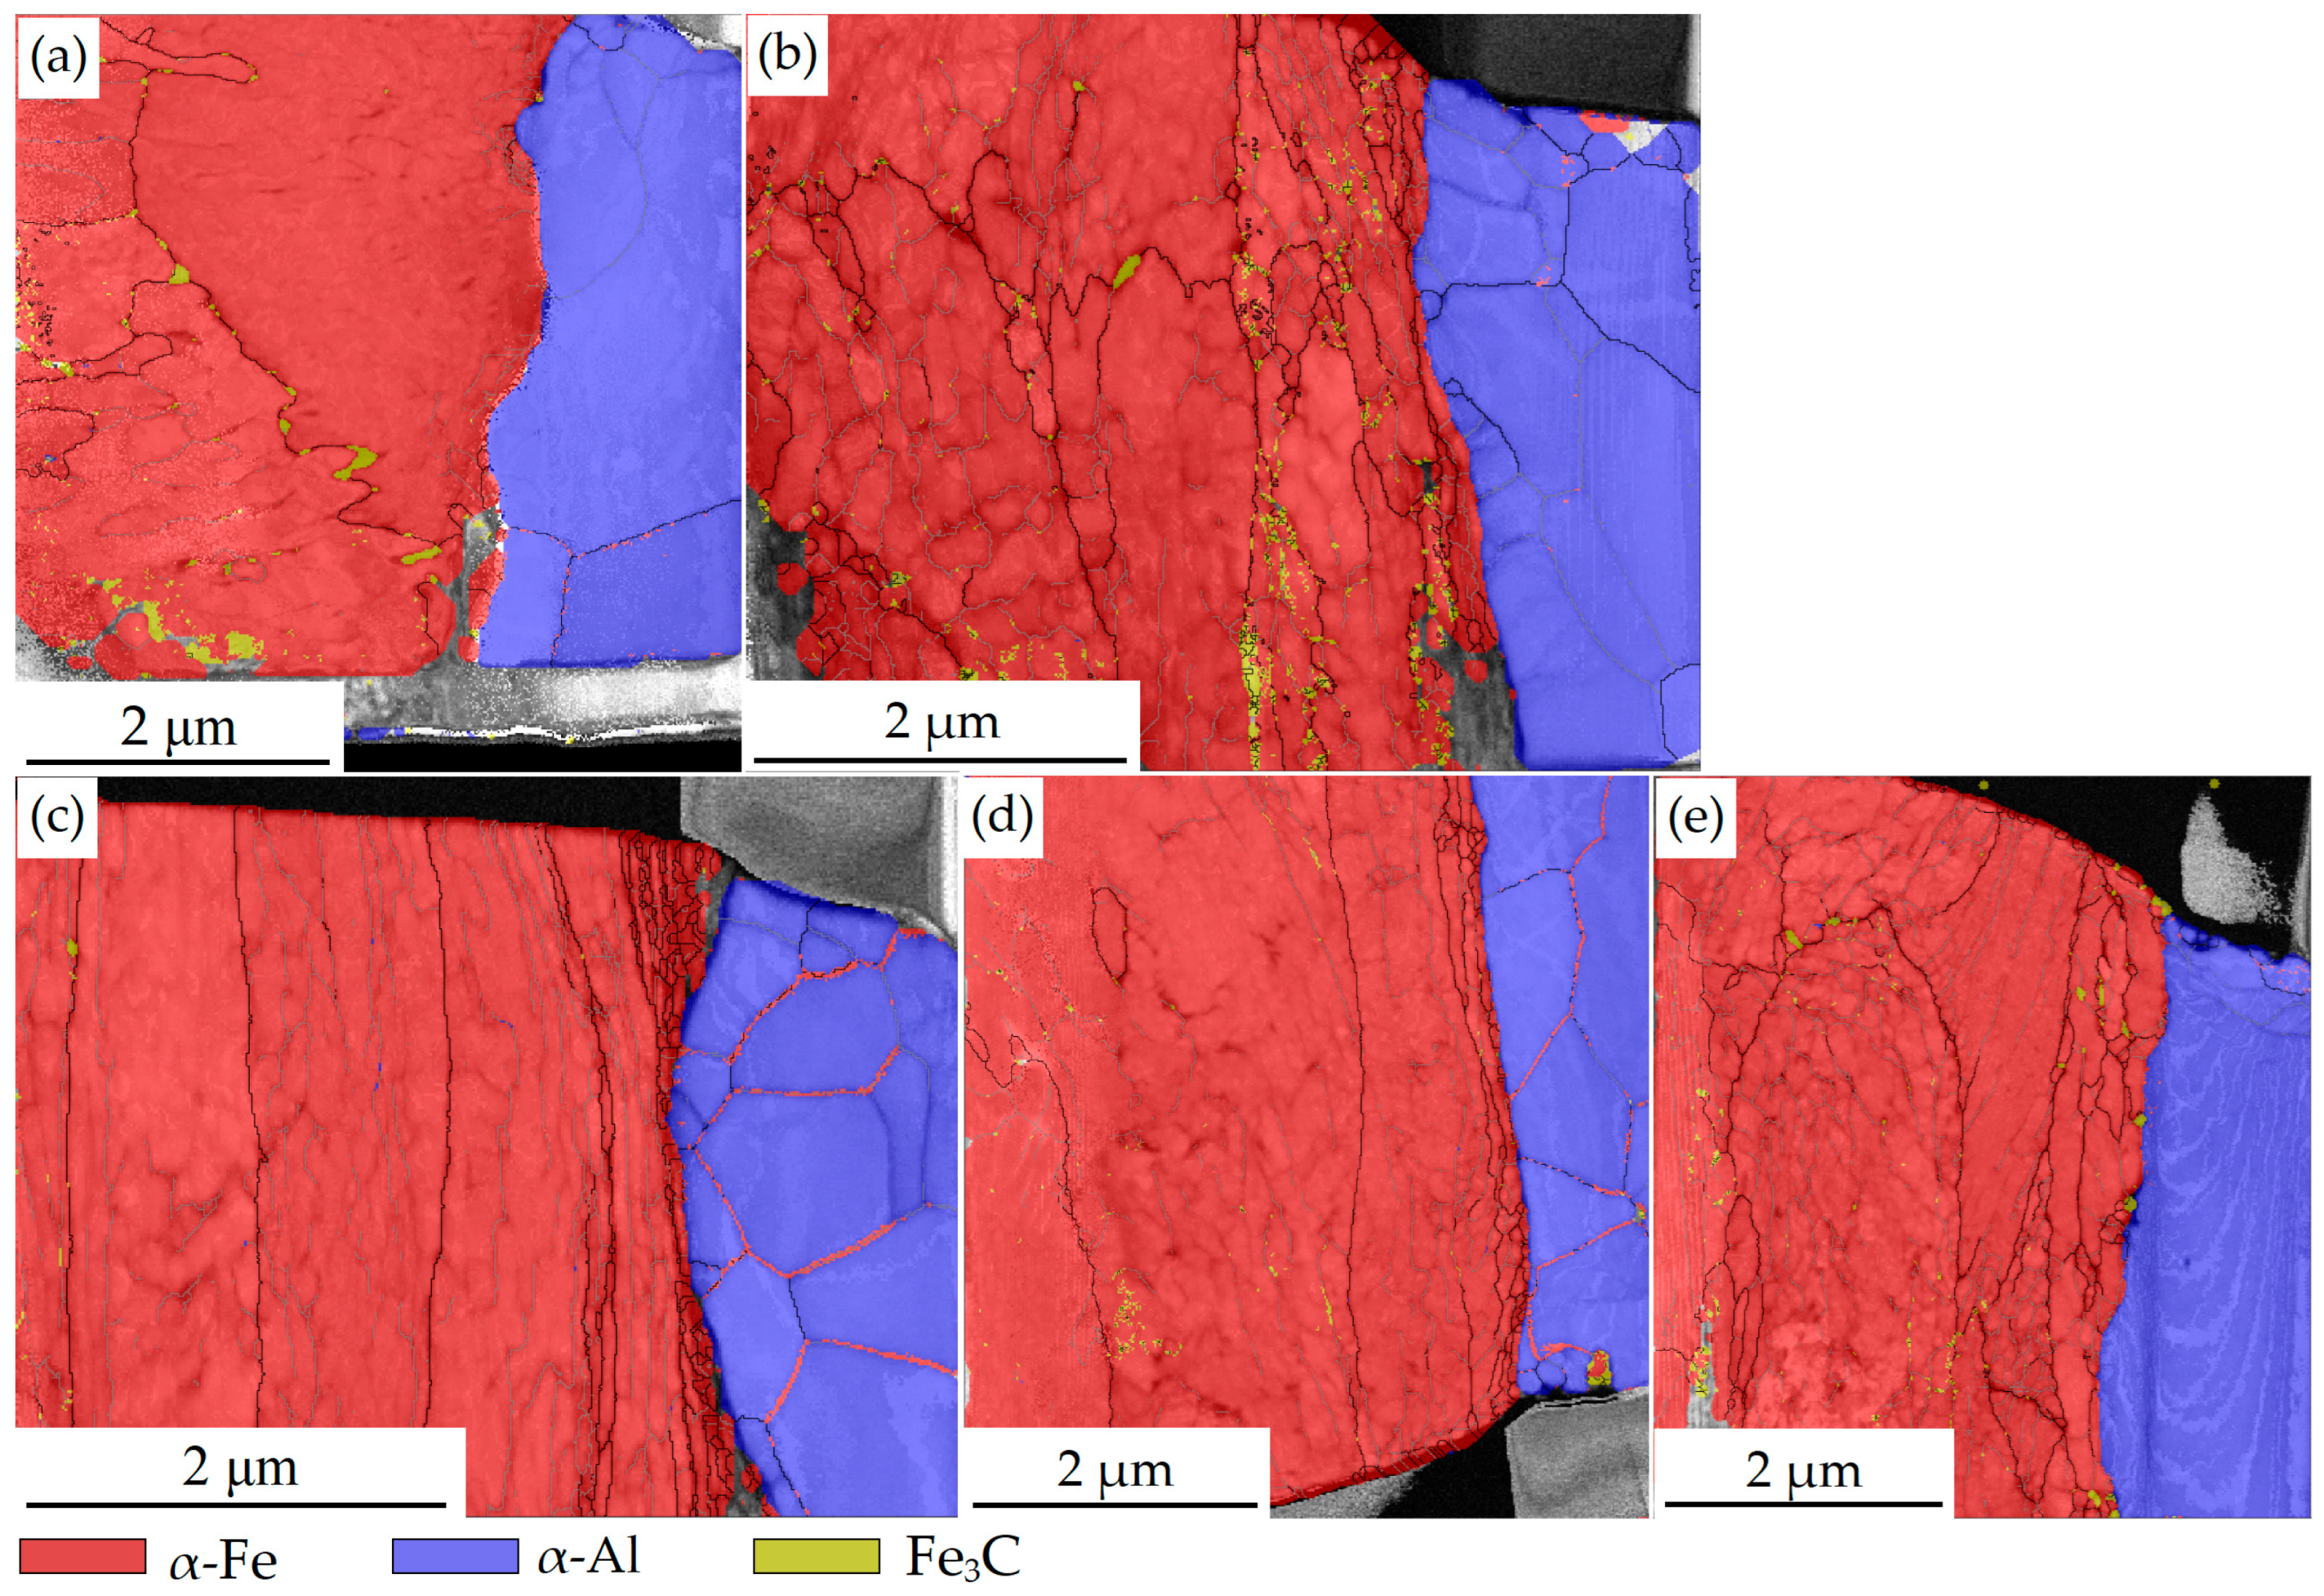
Another critical factor influencing the mechanical properties of aluminum-clad steel wire is the morphological characteristics, volume fraction, and distribution profile of Fe3C; its impact on the mechanical properties of carbon steel is well documented in the literature [21,22]. Figure 10 and Table 5 display the TKD phase maps and the corresponding volume fractions of Fe3C. It should be noted that the depicted area is relatively small, and the identification of Fe3C as a reinforcing phase by TKD may contain certain inaccuracies. Nevertheless, a clear trend is evident in both the TKD phase maps and the corresponding data: the annealing process at 200 °C–10 min leads to a decrease in the volume fraction of the Fe3C phase, while increasing annealing temperature results in a gradual rise in its content. This mechanism partially compensates for the reduction in strength of aluminum-clad steel wire caused by decreased GOSA and KAMA values due to the monolithic recovery of the α-Fe phase with rising annealing temperatures.
This study demonstrates that among the numerous quantifiable microstructural features of aluminum-clad steel wires, grain size, grain boundary characteristics, and X-ray residual stress values show only weak correlations with mechanical property evolution; the texture characteristics of the steel core exhibit some correlation; while KAMA and GOSA values demonstrate strong correlations. A distinct intermetallic compound layer forms at the aluminum/steel interface exclusively during annealing at 300 °C and above, underscoring the necessity of avoiding annealing temperatures exceeding 300 °C.

4. Conclusions

This study systematically evaluated the effects of cold drawing and various low-temperature annealing processes on the mechanical properties, microstructure, texture evolution, and interface characteristics of 20SA aluminum-clad steel wire, yielding the following key conclusions:
  • After cold drawing, the grade 70 steel core develops an axially elongated sorbite microstructure accompanied by significant <110> fiber texture strengthening. Low-temperature annealing (200–250 °C) primarily induces overall recovery (with reduced GOSA and KAMA values), while grain size and the ratio of HAGBs and LAGBs show no significant changes; at 300 °C, local recrystallization occurs at highly distorted grain boundaries, leading to weakening of the <110> texture. Furthermore, due to interference from the Fe3C phase and strong texture features, residual stress measurements via X-ray diffraction are unsuitable for quantitative evaluation of work hardening and annealing softening in such materials.
  • The torsional performance of all samples in various states meets international standard requirements (≥20 turns), demonstrating excellent resistance to engineering strand damage and good plasticity coordination. Tensile properties are governed by a competition mechanism involving processing hardening, Fe3C phase precipitation, and annealing softening: increased annealing temperature and time lead to a monotonic decrease in ultimate strength. The elongation at break of the annealed state below 240 °C is lower than that of the cold-drawn state, whereas optimizing the annealing process within the range of 240~280 °C (e.g., 240 °C/10 min or 250 °C/10 min) achieves optimal synergy between ultimate strength and elongation at break, avoiding mechanical property degradation and increased energy consumption caused by excessive annealing.
  • Under cold drawing and annealing processes at 200~250 °C, the aluminum/steel interface maintains an ideal metallurgical bond with a continuous and stable element diffusion layer, effectively resisting interfacial delamination during wire drawing and service operation. However, at annealing temperatures of 300 °C, significant reactions occur at the interface, forming a high-hardness, highly brittle Fe-Al intermetallic compound layer (with 7.78 at% Al diffusion detected at approximately 50 nm thickness) that readily becomes a microcrack source and can induce gap discharge or low-stress fracture. Therefore, heat treatment processes exceeding 300 °C should be strictly avoided in engineering applications.
  • Phase analysis of the microstructure revealed that the volume fraction of the Fe3C phase slightly decreases during annealing at 200 °C but gradually increases as the annealing temperature rises further (to 250~300 °C). This precipitation strengthening mechanism partially compensates for the strength loss caused by the overall recovery of α-Fe (leading to reduced dislocation density), serving as a critical microscopic mechanism for maintaining the mechanical properties of aluminum-clad steel wires after high-temperature annealing.
  • Considering both mechanical performance and interfacial stability, this study establishes that the optimal heat treatment window for 20SA aluminum-clad steel wire is 240~280 °C/10 min. This process not only optimizes mechanical properties but also ensures high-quality metallurgical bonding at interfaces, providing solid theoretical support for the industrial production and long service life of high-performance aluminum-clad steel wires used in UHV transmission lines.

Author Contributions

Conceptualization, S.C., G.X., H.W. and F.W.; methodology, S.C. and G.X.; software, Y.J. and Y.W.; validation, H.W. and S.C.; formal analysis, S.C. and Y.J.; investigation, Y.W.; resources, F.W.; data curation, S.C.; writing—original draft preparation, S.C. and Y.J.; writing—review and editing, S.C.; visualization, Y.W.; supervision, G.X. and H.W.; project administration, F.W.; funding acquisition, S.C. and H.W. All authors have read and agreed to the published version of the manuscript.

Funding

The National Natural Science Foundation of China (grant nos. 52575498) project of Anhui Simulation Design and Modern Manufacture Engineering Technology Research Center (grant nos. SGCZXZD2301, SGCZXZD2401), the Science and Technology Planning Project of Huangshan City (grant nos. 2025Z-01, 2025Z-03), the Project for the Cultivation of Young and Middle-aged Teachers in Higher Education Institutions (grant nos. YQYB2024065), the Key Natural Science Project of Anhui Provincial Department of Education (grant no. 2025AHGXZK30525), and the Postdoctoral Research Project of Anhui Province (grant nos. 2025B1089).

Data Availability Statement

The data presented in this study are available on request from the corresponding author. The data are not publicly available due to restrictions of privacy.

Acknowledgments

The authors gratefully acknowledge Huang Xiaomao, Wang Deren, and Zhou Peiying of Huangshan Chuangxiang Technology Group Co., Ltd., for their invaluable support and expert guidance during the implementation of this research. The authors also wish to thank Jing Yueru and Chen Xiang of Huangshan University for their dedicated assistance with material characterization and data analysis.

Conflicts of Interest

Shouzhen Cao and Fuqiang Wang were employed by Huangshan Chuangxiang Technology Co., Ltd, Huangshan City, 245200, China. The remaining authors declare that the research was conducted in the absence of any commercial or financial relationships that could be construed as a potential conflict of interest.

Abbreviations

The following abbreviations are used in this manuscript:
20SAconductivity of approximately 20.3% IACS; S stands for steel; A denotes Grade A.
IACSInternational Annealed Copper Standard
UHVultra-high voltage
OMmetallographic microscopy
SEMscanning electron microscopy
EBSDelectron backscatter diffraction
TKDTransmission Kikuchi diffraction
TEMtransmission electron microscopy
STEMscanning transmission electron microscopy
HRTEMhigh-resolution transmission electron microscope
FIBfocused ion beam
SAEDselected-area electron diffraction
EDSX-ray energy-dispersive spectroscopy
DDdrawing direction
GOSgrain orientation spread
GNDgeometrically necessary dislocation
HAGBhigh-angle grain boundary
LAGBlow-angle grain boundary
AGSaverage grain size
KAMkernel average misorientation
KAMAaverage kernel average misorientation
GOSAaverage grain orientation spread
ASTMAmerican Society for Testing and Materials
IECInternational Electrotechnical Commission

References

  1. Wei, W.; Li, J.; Chen, B.; Wang, M.; Zhang, P.; Guan, D.; Meng, J.; Qian, H.; Cheng, Y.; Kang, C.; et al. Embodied greenhouse gas emissions from building China’s large-scale power transmission infrastructure. Nat. Sustain. 2021, 4, 739–747. [Google Scholar] [CrossRef]
  2. Bauen, A. Future energy sources and systems—Acting on climate change and energy security. J. Power Sources 2006, 157, 893–901. [Google Scholar] [CrossRef]
  3. Liu, Z.; Zhang, F.; Yu, J.; Gao, K.; Ma, W. Research on key technologies in ±1100 kV ultra-high voltage DC transmission. High Volt. 2018, 3, 279–288. [Google Scholar] [CrossRef]
  4. Chen, J.; Qiu, W.; Pan, F.; Song, G. Design of ultra-high-voltage alternating current (UHVAC) power transmission lines. In Ultra-High Voltage AC/DC Power Transmission; Springer: Berlin/Heidelberg, Germany, 2017; pp. 1361–1427. [Google Scholar] [CrossRef]
  5. Khan, A.A.; Liang, D.B.B.; Rigit, A.R.H.; Fong, L.S.; Othman, A.-K. Corrosion study of galvanized ultra high strength steel reinforced overhead transmission conductors. Int. J. Eng. Technol. 2018, 7, 83–86. [Google Scholar] [CrossRef]
  6. Jalilian, M.; Riba, J.R.; Parvizi, P. Aluminum conductor steel-supported conductors for the sustainable growth of power line capacity: A review and discussion. Materials 2024, 17, 4536. [Google Scholar] [CrossRef] [PubMed]
  7. Håkansson, E.; Predecki, P.; Kumosa, M.S. Galvanic corrosion of high temperature low sag aluminum conductor composite core and conventional aluminum conductor steel reinforced overhead high voltage conductors. IEEE Trans. Reliab. 2015, 64, 928–934. [Google Scholar] [CrossRef]
  8. ASTM B415-16 (2021); Standard Specification for Cold-Rolled and Hard-Drawn Aluminum Wire for Manufacturing and Drawing Purposes. ASTM International: West Conshohocken, PA, USA, 2021.
  9. International Electrotechnical Commission. Conductors for Overhead Lines—Aluminium Alloy Stranded Conductors; International Electrotechnical Commission: Geneva, Switzerland, 2022. [Google Scholar]
  10. Ai, J.H.; Zhao, T.C.; Gao, H.J.; Hu, Y.; Xie, X. Effect of controlled rolling and cooling on the microstructure and mechanical properties of 60Si2MnA spring steel rod. J. Mater. Process. Technol. 2005, 160, 390–395. [Google Scholar] [CrossRef]
  11. Li, J.; Wang, L.; Wang, R.; Zhang, Y.; Wang, B.; Zhang, J. Controlling the optimal phase transition temperature of wires during quenching in salt bath through process parameters. Mater. Today Commun. 2024, 40, 109379. [Google Scholar] [CrossRef]
  12. Davydov, S.V. Phase equilibria in the carbide region of iron–carbon phase diagram. Steel Transl. 2020, 50, 888–896. [Google Scholar] [CrossRef]
  13. Qiao, S.; Yuan, C.; Hou, Z.; Wang, T.; Li, N.; Gao, X.; Wen, X.; Wang, F.; Xia, Z.; Wang, Y.; et al. Abnormal grain growth mechanisms in wrought nickel-based superalloy via semi-in situ EBSD: New perspectives. Scr. Mater. 2025, 267, 116829. [Google Scholar] [CrossRef]
  14. Cruz-Gandarilla, F.; Bolmaro, R.E.; Mendoza-León, H.F.; Salcedo-Garrido, A.M.; Cabañas-Moreno, J.G. Study of recovery and first recrystallisation kinetics in CGO Fe3% si steels using misorientation-derived parameters (EBSD). J. Microsc. 2019, 275, 133–148. [Google Scholar] [CrossRef] [PubMed]
  15. Gamanov, Š.; Poczklán, L.; Dlouhý, A.; Kruml, T. A step size dependence of KAM, GROD and GND parameters calculated from EBSD. Mater. Charact. 2025, 232, 115952. [Google Scholar] [CrossRef]
  16. Shangguan, J.; Zhao, J.; Xu, B.; Gu, C.; Wang, Y. The role of TiAlSi intermetallic compounds in metallurgical bonding mechanism of Ti/Mg bimetal composite. Mater. Sci. Eng. A 2022, 846, 143295. [Google Scholar] [CrossRef]
  17. Ma, X.; Cao, R.; Xu, H.; Chang, J. Modulating interfacial intermetallic compounds and strengthening mechanisms of titanium and aluminum dissimilar joints via silver interlayer diffusion bonding. J. Alloys Compd. 2026, 1065, 187701. [Google Scholar] [CrossRef]
  18. Liu, Q.; Huang, Y.; Fan, P.; Wang, J.; Ma, Y.; Liu, W. Microstructure and properties of intermetallic compounds in Ni-Ti/Ta couple by Vacuum diffusion bonding. Vacuum 2026, 249, 115301. [Google Scholar] [CrossRef]
  19. Wang, X.; Wood, J.V.; Sui, Y.; Lu, H. Formation of intermetallic compound in iron-aluminum alloys. J. Shanghai Univ. (Engl. Ed.) 1998, 2, 305–310. [Google Scholar] [CrossRef]
  20. Chen, S.; Yang, D.; Zhang, M.; Huang, J.; Zhao, X. Interaction between the growth and dissolution of intermetallic compounds in the interfacial reaction between solid iron and liquid aluminum. Metall. Mater. Trans. A 2016, 47, 5088–5100. [Google Scholar] [CrossRef]
  21. Hui, W.; Borysenko, A.; Klemeshov, Y.; Yan, G.; Ambrazhey, M.; Malysh, O. High-temperature strength and plasticity of medium- and high-carbon steels. Mater. Sci. 2025, 61, 80–85. [Google Scholar] [CrossRef]
  22. Shang, Y.; Fan, M.; Jiang, S.; Zhang, Z. Effects of carbon content on the microstructure and tensile properties of a low-density steel. Int. J. Miner. Metall. Mater. 2024, 32, 391–401. [Google Scholar] [CrossRef]
Figure 1. Cross-sectional macrograph of the 20SA aluminum-clad steel wire.
Metals 16 00855 g001
Figure 2. OM microstructures of aluminum-clad steel wires under different conditions: (a) as-clad; (b) cold-drawn.
Metals 16 00855 g002
Figure 3. SEM micrographs of aluminum-clad steel wire cores under different conditions: (a) as-clad; (b) cold-drawn; (c) 200 °C–10 min; (d) 300 °C–10 min.
Metals 16 00855 g003
Figure 4. EBSD-GOS maps of aluminum-clad steel wire cores under different processing conditions: (a) α-Fe phase of the cold-drawn process; (b) α-Fe phase of the 300 °C–10 min annealing treatment process.
Metals 16 00855 g004
Figure 5. EBSD-KAM maps and KAMA values of the α-Fe phase in aluminum-clad steel wire cores under various conditions, determined by EBSD and TKD: (a) EBSD-KAM of the as-clad sample; (b) EBSD-KAM of the cold-drawn sample; (c) EBSD-KAM of the 200 °C–10 min sample; (d) EBSD-KAM of the 250 °C–10 min sample; (e) EBSD-KAM of the 300 °C–10 min sample; (f) TKD-KAMA data for different processing conditions.
Metals 16 00855 g005
Figure 6. EBSD texture and pole figures of aluminum-clad steel wires under different processing conditions: (a) as-clad state α-Fe phase; (b) as-clad state α-Al phase; (c) cold-drawn state α-Fe phase; (d) cold-drawn state α-Al phase.
Metals 16 00855 g006
Figure 7. Mechanical properties of aluminum-clad steel wires under different processing conditions: (a) tensile properties; (b) torsional properties. In this figure, the notation for the annealing process parameters is further simplified.
Metals 16 00855 g007
Figure 8. TEM and TKD microstructures and corresponding calibration data of the FIB-prepared sample: (a) TEM bright-field image; (b) 2.5× higher magnification TEM bright-field image of (a); (c) TKD map and identified specific boundaries for the region in (a); (d) SAED pattern of the region marked by the red arrow in (b); (e) HRTEM image of the region marked by the red box in (b).
Metals 16 00855 g008
Figure 9. Microstructures of the aluminum/steel interface obtained by TEM under different conditions, along with STEM-EDS data: (a) cold-drawn; (b) 200 °C–10 min; (c) 250 °C–10 min; (d) 300 °C–10 min; (e) high-magnification image of the aluminum/steel interface annealed at 300 °C for 10 min, showing point locations and corresponding STEM-EDS data (values expressed in at.%).
Metals 16 00855 g009
Figure 10. TKD phase maps of aluminum-clad steel wires under different conditions: (a) as-clad; (b) cold-drawn; (c) 200 °C–10 min; (d) 250 °C–10 min; (e) 300 °C–10 min.
Metals 16 00855 g010
Table 1. Characteristics of high-angle and low-angle grain boundaries (HAGBs and LAGBs), average grain sizes (AGSs) and average grain orientation spread (GOSA) values of the α-Fe phase and α-Al phase in aluminum-clad steel wire under different conditions, based on EBSD data.
ProcessEC-Grade Aluminum (α-Al)Grade 70 Steel (α-Fe)
HAGBs/°LAGBs/°AGSs/μmHAGBs/°LAGBs/°AGSs/μmGOSA
as-clad32.567.513.536.363.79.967.02
cold-drawn47.652.49.7933.866.213.3220.85
200 °C–10 min40.759.323.5434.066.013.4918.08
250 °C–10 min38.761.315.3436.263.810.3415.97
300 °C–10 min49.850.213.8634.965.113.0116.94
Table 2. Measurements of residual stress values in the α-Fe phase of aluminum-clad steel core samples under different conditions.
ProcessStress Data
Stress/MPaShear Stress/MPa
as-clad−321.1 ± 6.623.1 ± 3.0
cold-drawn−372.6 ± 6.115.2 ± 2.8
200 °C–10 min−383.4 ± 9.415.6 ± 4.3
250 °C–10 min−397.1 ± 31.9−2.1 ± 14.5
300 °C–10 min−371.9 ± 42.622.8 ± 19.4
Table 3. Texture characteristics of the α-Fe and α-Al phases in aluminum-clad steel wire under different conditions based on EBSD measurements.
ProcessGrade 70 Steel (α-Fe)EC-Grade Aluminum (α-Al)
<111>/%<110>/%<100>/%<111>/%<110>/%<100>/%
as-clad8.7356.613.09.3589.80.25
cold-drawn0.5483.43.4965.915.83.08
200 °C–10 min0.4278.84.3882.47.42.01
250 °C–10 min5.2284.05.9951.116.67.01
300 °C–10 min1.1184.02.3759.714.29.33
Table 4. EDS compositions (at.%) corresponding to the four test points in Figure 9e.
NO.FeAlC
11.5784.4513.97
275.507.7816.73
387.220.9311.85
489.340.6310.03
Table 5. Volume fractions of Fe3C under different process conditions determined by TKD.
ProcessFraction of Fe3C
as-clad1.1%
cold-drawn2.0%
200 °C–10 min0.1%
250 °C–10 min0.4%
300 °C–10 min1.0%
Disclaimer/Publisher’s Note: The statements, opinions and data contained in all publications are solely those of the individual author(s) and contributor(s) and not of MDPI and/or the editor(s). MDPI and/or the editor(s) disclaim responsibility for any injury to people or property resulting from any ideas, methods, instructions or products referred to in the content.