


Abstract
Slag splashing protection is the dominant technology for extending refractory lining service life and enhancing production efficiency in basic oxygen furnace (BOF) steelmaking. However, the intrinsic mechanism of gas-slag-steel multiphase coupled splashing remains poorly understood, and existing numerical methods suffer from prohibitive computational costs and inaccurate characterization of interfacial momentum transfer and multiphase interactions. This study establishes a fully coupled three-dimensional numerical model integrating Volume of Fluid (VOF)–Discrete Particle Method (DPM) bidirectional phase transition, adaptive mesh refinement (AMR), and Eulerian Wall Film Model (EWFM), and the multiphase flow simulation in this study adopts constant thermophysical parameters of molten steel and slag at the industrial splashing temperature of 1650 °C. Taking the Blowing Number (NB) as the core similarity criterion, a 1:10 scaled geometric model of a 50-ton industrial BOF is employed to systematically investigate the regulatory effects of top-blowing flow rate, lance height, and NB on droplet splashing behavior and wall liquid film evolution. The model is validated against mercury-glycerol cold model experimental data, with a relative error of less than 3% in total splashing mass prediction. Results demonstrate that increasing NB significantly enhances splashing intensity. Under optimal conditions (200 mm lance height, 11.76 Nm3/h flow rate, NB = 9.30), the wall liquid film fully covers the middle-upper furnace wall with a uniform thickness of 0.8–1.2 mm. NB dominates jet momentum distribution: high NB forms a deep-penetrating four-lobed impact cavity, remarkably improving droplet axial momentum and residence time. Molten steel droplets concentrate at 3–4 mm, while slag droplets shift to 2–4 mm at high flow rates of 11.76 Nm3/h, with maximum slag droplet production at NB = 6.99. This work provides reliable theoretical support for industrial BOF slag-splashing process optimization.
1. Introduction
In converter steelmaking, furnace lining service life is a core factor restricting production efficiency and economic benefits. Long-term smelting subjects the lining to severe mechanical scouring and chemical erosion from high-temperature melts, causing refractory damage and reduced converter service life [1,2,3]. As the most widely used lining maintenance technology, slag splashing protection utilizes high-speed top-blowing jets to splash modified final slag onto the inner lining. The splashed slag rapidly solidifies to form a dense protective coating, isolating refractories from molten melts in subsequent heats, thus reducing refractory consumption, shortening downtime, and improving production efficiency with low investment and simple operation [4,5].
Extensive studies have explored the slag splashing process via industrial tests, scaled physical models, and experiments. Koria et al. [6] investigated jet impact on molten steel and droplet size distribution through small-scale experiments, confirming the results conform to the Rosin-Rammler-Sperling (RRS) distribution. Standish et al. [7] established a 3D two-phase model to calculate the residence time of jet-induced metal droplets in the slag phase. Luomala et al. [8] evaluated the effects of operational parameters (lance height, nozzle blockage, bottom-blowing configuration, slag viscosity) on splashing patterns via a physical simulation platform. Tago et al. [9] analyzed the flow characteristics of single/multi-nozzle jets in top-blowing splashing, validated by cold model data. Subagyo et al. [10] measured splashing rate and droplet size distribution via high-pressure nitrogen tests, revealing their dependence on the Blowing Number (NB). Zhang et al. [11] numerically assessed the dynamic feasibility of slag splashing in a 100-ton converter, and further explored the application of CO2 injection and nozzle-twisted lances in slag splashing operations [12].
However, limited by measurement techniques and high industrial test costs, experimental studies on droplet dispersion and jet–molten pool interactions under extreme high-temperature conditions in converters remain insufficient, which restricts the clarification of the intrinsic splashing mechanism. Numerical simulation provides an efficient, low-cost alternative to reveal such complex multiphase phenomena. Li et al. [13,14] adopted the Volume of Fluid (VOF) method to simulate gas-slag-steel multiphase interactions and the dynamic kinetics of jet-induced droplet splashing and coalescence in converter steelmaking. Cao et al. [15] analyzed the disturbance effect of supersonic oxygen jets on the gas–liquid interface via the VOF model. He et al. [16] established a similarity-compliant physical model for a 120-ton converter, and further used a VOF-based model to calculate splashing volume, optimize lance position, and quantitatively evaluate jet effects on molten pool cavity geometry and splashing morphology.
To date, the standalone VOF method is mostly applied to jet atomization and mixing characteristics analysis in metallurgical reactors [17,18,19,20,21,22], while its application in converter slag splashing is still limited. The Euler–Euler framework, more widely used in splashing dynamics studies [23], has inherent limitations: capturing fine droplet structures requires extremely dense grids, leading to prohibitive computational cost and inaccurate characterization of droplet trajectories and interfacial momentum transfer. Although Qi et al. [24] coupled VOF-DPM bidirectional conversion to quantitatively investigate converter splashing behavior, their model only considered molten steel splashing, neglecting the dynamic evolution of the slag layer and its coupling with molten steel, thus failing to accurately describe the complex gas-slag-steel multiphase interaction in top-blowing processes. Bridging this gap is critical for establishing accurate splashing prediction methods and developing efficient slag-splashing protection strategies.
The Blowing Number (NB), defined as the ratio of inertial force to the combined effect of buoyancy and surface tension, is the core criterion to characterize gas–liquid interface instability and splashing critical conditions, and is adopted as the key similarity criterion in this work. Subagyo et al. [10] and Hwang et al. [25] confirmed that NB can effectively interpret molten pool surface instability and splashing behavior. However, Alam et al. [26] pointed out that the constant η value in traditional NB calculation is inapplicable to variable lance height conditions, and NB cannot predict droplet generation rate under penetrating crater morphology. In contrast, Sun et al. [27] used NB as the benchmark to validate their VOF-to-DPM model, achieving a 14.09% relative error in splashing rate prediction and successfully characterizing gas–liquid interface instability.
To address the challenges in quantitative prediction of converter droplet splashing and the unclear regulation mechanism of slag splashing protection, a fully coupled 3D gas-slag–steel three-phase numerical model operating at the representative industrial slag splashing temperature of 1650 °C is established in this work, integrating VOF-DPM bidirectional phase transition, adaptive mesh refinement (AMR), and the Eulerian Wall Film Model (EWFM). This model enables simultaneous capture of multiphase free interface evolution, splash droplet generation and transport, and wall film formation, with full consideration of multiphase interactions and dynamic coupling between slag and steel phases. The regulation effects of NB, top-blowing flow rate, and lance height on splashing behavior are systematically analyzed, and the optimal conditions for uniform droplet dispersion, maximized droplet residence time, and optimized wall film distribution are identified. This work achieves efficient and high-precision quantitative prediction of slag–steel splashing behavior, and provides reliable theoretical support for process optimization of industrial converter slag splashing protection and splashing behavior regulation.
2. Numerical Simulations
2.1. Basic Assumptions
To guarantee computational feasibility, numerical stability, and high efficiency for the coupled multiphase flow simulation of the converter steelmaking process, the following core assumptions and simplifications are adopted in this study:
(1) In the Volume of Fluid (VOF) multiphase flow model, the gas phase is defined as the primary phase and governed by the ideal gas law. Although the energy conservation equation is activated to mathematically close the compressible flow solver, this study remains strictly focused on the multiphase flow dynamics rather than the analysis of thermal fields. Molten steel and slag are set as two immiscible, incompressible Newtonian secondary liquid phases. Although a significant temperature difference exists between the high-velocity cold jet and the hot molten bath, its impact on the splashing flow dynamics is neglected because the jet impingement process is heavily momentum-dominated, where the massive inertial forces completely overshadow any temperature-induced buoyancy effects. To quantitatively justify this, the fluid flow in this high-velocity jet impingement system is highly momentum-dominated rather than buoyancy-driven. The dominance of inertial forces over thermal buoyancy forces can be characterized by the Richardson number (Ri), which is defined as:
where Gr is the Grashof number, Re is the Reynolds number, g is gravity, β is the thermal expansion coefficient, ΔT is the temperature difference, L is the characteristic length, and U is the jet velocity. Because the jet velocity (U) is high, the Reynolds number is exceptionally large, resulting in: .
This mathematically proves that natural convection and buoyancy effects induced by the temperature difference are completely overshadowed by the massive forced convection. Therefore, the thermal shock has a negligible impact on the macro-cavity profile, velocity fields, and the spatial-temporal distribution of discrete droplets.
Additionally, the instantaneous chemical reactions and their associated reaction heats at the gas–liquid interface are ignored. The entire process of droplet generation, evolution, and spatial dispersion is characterized via two-way mass and momentum coupling between the continuous phase (VOF framework, covering gas, molten steel, and slag phases) and the discrete phase (DPM framework, discrete molten steel and slag droplets).
(2) All liquid elements stripped from the continuous molten steel and slag phases in the VOF framework and converted into DPM discrete particles are assumed to be spherical to facilitate trajectory tracking, dynamic calculation, and characteristic statistical analysis. The VOF-to-DPM conversion is triggered only when two criteria are satisfied simultaneously: the equivalent diameter of the stripped liquid element (molten steel or slag) is ≤5 mm, and its centroid is located above the molten bath free surface. Liquid structures with an equivalent diameter >5 mm remain tracked and solved within the VOF continuous phase framework. Secondary fragmentation of DPM discrete particles is not considered herein to control computational complexity. The intricate mechanical behaviors of droplets returning to the liquid phase, such as bouncing or surface-hanging driven by high surface tension, are neglected, and immediate coalescence upon interface contact is assumed.
(3) For the Eulerian Wall Film Model (EWFM), the dynamic evolution of wall-attached liquid films is modeled separately for the molten steel and slag phases. The viscous shear stresses at the gas–liquid film and liquid film–wall interfaces are calculated based on the quadratic velocity profile inside the liquid film. Separate mass and momentum conservation equations are established and solved for molten steel and slag liquid films (two-dimensional structures distributed in the three-dimensional computational domain) to achieve accurate simulation of the dynamic distribution and evolution of the two-phase wall films.
2.2. VOF-DPM Bidirectional Coupling Model
In this work, a two-way coupling mathematical framework integrating the Volume of Fluid (VOF) method and Discrete Particle Method (DPM) is established and adopted, which realizes seamless full-process tracking of bidirectional phase state transition, including the conversion from the VOF-characterized continuous liquid phase to the DPM-described discrete droplet and particle regime, as well as the corresponding reverse transformation process.
2.2.1. VOF to DPM Model
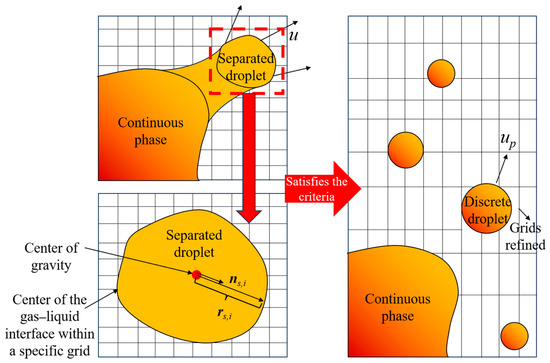
The Volume of Fluid (VOF) method is utilized to capture the free surface of molten slag and its interactive behavior with the impacting oxygen jet, drawing on mature numerical practices. To accurately capture the gas–liquid interface and the generation of fine slag droplets, an adaptive mesh refinement scheme is implemented to densify grids dynamically near the interface. The mesh refinement procedure is activated automatically at intervals of 2 time steps. Such a high-resolution mesh enables a reliable description of surface tension effects in the continuous slag phase, as well as its coupling with newly separated droplets. Once a separated droplet is identified in the VOF model, its volume, position, and non-sphericity are computed to support its subsequent conversion into the discrete particle phase (DPM).
The droplet diameter is determined on the basis of the volume (Vs) of the separated droplet, using the relation presented below:
where α denotes the phase volume fraction, and the integration volume corresponds to the spatial volume occupied by the detached droplet. With all droplets assumed to be spherical, the equivalent diameter can be expressed as:
In this simulation, the conversion from VOF-resolved droplets to the discrete phase model is only enabled for droplets with an equivalent spherical diameter ds,d no greater than 5 mm. Furthermore, such phase conversion is initiated exclusively when the droplet centroid is positioned above the free surface of the molten slag. Due to their greater inertial force, droplets exceeding 5 mm are considered to have considerably shorter flight durations in the gas phase. The highest resolution tier of the adaptive mesh refinement yields a minimum cell volume of 0.5 mm3, which allows for robust identification of droplets smaller than 1 mm in diameter.
Two independent criteria are adopted to evaluate the sphericity of splashed droplets. The main criterion measures the geometric deviation of the actual droplet surface from an ideal sphere by computing the radial distance from each surface node to the droplet centroid, then determining the standard deviation of these distances relative to their average value. Its mathematical expression is given as follows:
of which
where Si refers to the gas–liquid interfacial area contained in the computational cell enclosing the detached droplet, and S stands for the total surface area of the droplet. Meanwhile, rs,i represents the distance from the geometric center of each local interface segment to the droplet’s center of mass, and rs,p represents the statistically averaged mean distance from the center of the gas–liquid interface to the center of gravity across the converted phase. This parameter takes a value of 0 for an ideally spherical droplet and is adopted as the main sphericity evaluation index in the present work.
The second criterion for sphericity is defined based on the orthogonal radii of the droplet, and its mathematical expression is given below:
where ns,i denotes the position vector extending from the droplet’s center of mass to a point on the gas–liquid interface situated at the boundary of the computational cell, and ni represents the unit outward normal vector at that interface point. The coefficient ki ranges between 0 and 1. The orthogonal sphericity σ2, which quantifies the shape deviation from a perfect sphere by means of principal directions, is formulated as follows:
where σ2 = 0 denotes an ideally spherical droplet. This parameter is therefore employed as the second sphericity evaluation criterion in this work.
To summarize, a detached droplet is converted to the discrete phase model only if it satisfies all three specified criteria simultaneously: its centroid is located above the molten slag free surface, its equivalent diameter is ≤5 mm, and it possesses a sufficient detachment velocity. During the conversion process, the center of mass of the VOF-resolved droplet is first computed and designated as the initial position of the new discrete particle (xp). Subsequently, a Lagrangian parcel with the same volume Vs as the detached droplet is injected at this position, thereby ensuring mass conservation. The void formed after the droplet detaches is immediately filled with gas, while the initial velocity of the discrete droplet is determined by performing a volume-weighted average of the velocity field within the original detached droplet region.
Regarding the gas phase that occupies the region left by the detached droplet, the velocity field within the newly defined gas cells is acquired by outward extrapolation based on the velocity distribution of the surrounding gas phase. After all physical quantity transfers are finished, the adaptive mesh zones that were highly refined near the droplet interface are coarsened accordingly, which significantly enhances the overall computational efficiency, as illustrated in Figure 1.
Figure 1.
Schematic diagram of the conversion of separated droplets to discrete droplet.
The Discrete Particle Method (DPM) captures the position, velocity, and diameter of each discrete droplet at the end of each time step, which allows complete trajectory tracking and statistical characterization of the overall droplet group. To reduce grid sensitivity, flow-field parameters are spatially averaged across the cell nodes adjacent to each Lagrangian parcel.
2.2.2. DPM to VOF Model
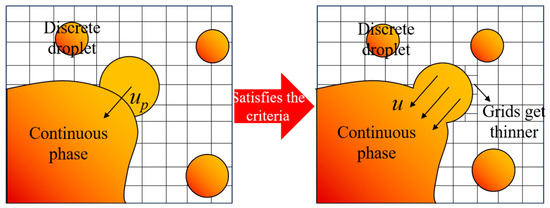
The reversion of discrete particles into the continuous phase, i.e., the conversion from DPM to VOF, is governed solely by a geometric constraint: the droplet must come into contact with, or penetrate, the phase interface. When this criterion is fulfilled, the corresponding Lagrangian parcel is eliminated from the discrete phase system, and a hemispherical void with a volume equivalent to Vs is introduced into the VOF computational domain, with its center positioned at the final coordinate xp of the droplet.
During the momentum exchange procedure, the velocity of the re-integrated discrete droplet is uniformly distributed to the grid nodes within the newly formed hemispherical liquid zone. After the completion of volume and velocity transformations, local adaptive mesh refinement is activated at the newly formed gas–liquid interface to accurately capture the modified free surface profile. The entire conversion process from DPM back to VOF is schematically illustrated in Figure 2.
Figure 2.
Schematic diagram of the transfer of discrete droplets to continuous phases.
2.2.3. Euler Wall Film Model
Within the slag splashing procedure employed for converter lining protection, discrete droplets ejected into the furnace chamber strike the refractory lining and coalesce to form a thin liquid layer. In this study, the Eulerian Wall Film Model (EWFM) is adopted to reproduce the deposition characteristics and the dynamic evolution of the resulting liquid film.
The mass conservation equation governing the two-dimensional wall film within a three-dimensional flow field is presented below:
where ρl represents the liquid density, h the local film thickness, ∇s the surface-gradient operator, Vl the depth-averaged film velocity vector, and ms the mass source per unit wall area, which originates from droplet impingement, film breakup, shear-induced stripping by the gas phase, and phase-change phenomena.
where
and
Equation (11) describes the momentum conservation of the wall liquid film, where the time-dependent and convective terms are included on the left-hand side. The right-hand side comprises several contributing terms: the first term accounts for the gas dynamic pressure, the gravitational acceleration component normal to the wall that drives film spreading, and the surface tension effect induced by interfacial curvature; the second term represents the tangential gravitational component; the following two terms characterize the viscous shear stresses imposed by the gas flow on the film surface and by the wall on the liquid film, respectively, under the assumption of a quadratic velocity distribution across the film thickness; the penultimate term corresponds to the momentum exchange associated with mass transfer during droplet deposition and film separation; and the final term stands for the interfacial tension force determined by the local wall contact angle, where the contact angles for the molten steel and liquid slag on the refractory wall are explicitly prescribed as 115° and 45°, respectively, to reflect their representative wetting characteristics under converter temperatures.
2.3. Main Governing Equations
Consistent with the foregoing exposition, the proposed numerical framework integrates a continuum-phase representation with a discrete-phase model, with its core governing equations compiled in Table 1.
Table 1.
Governing equations in the model.
- (1)
- The continuum phase is modeled via the Volume of Fluid (VOF) multiphase methodology, wherein the gas phase is designated as the primary phase, and the molten slag along with liquid metal is defined as the secondary phase.
- (2)
- Upon satisfaction of the pre-specified VOF-to-DPM conversion criteria, segments of the liquid phase resolved within the continuum domain are converted into discrete Lagrangian droplets.
2.4. Geometric Model Setting
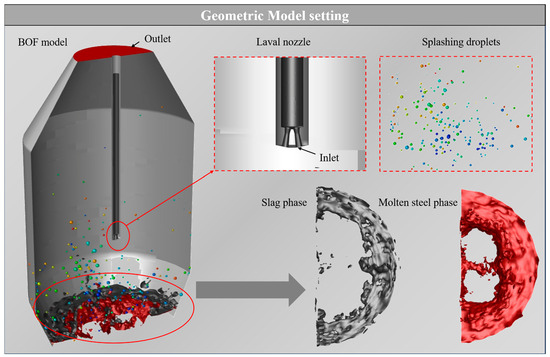
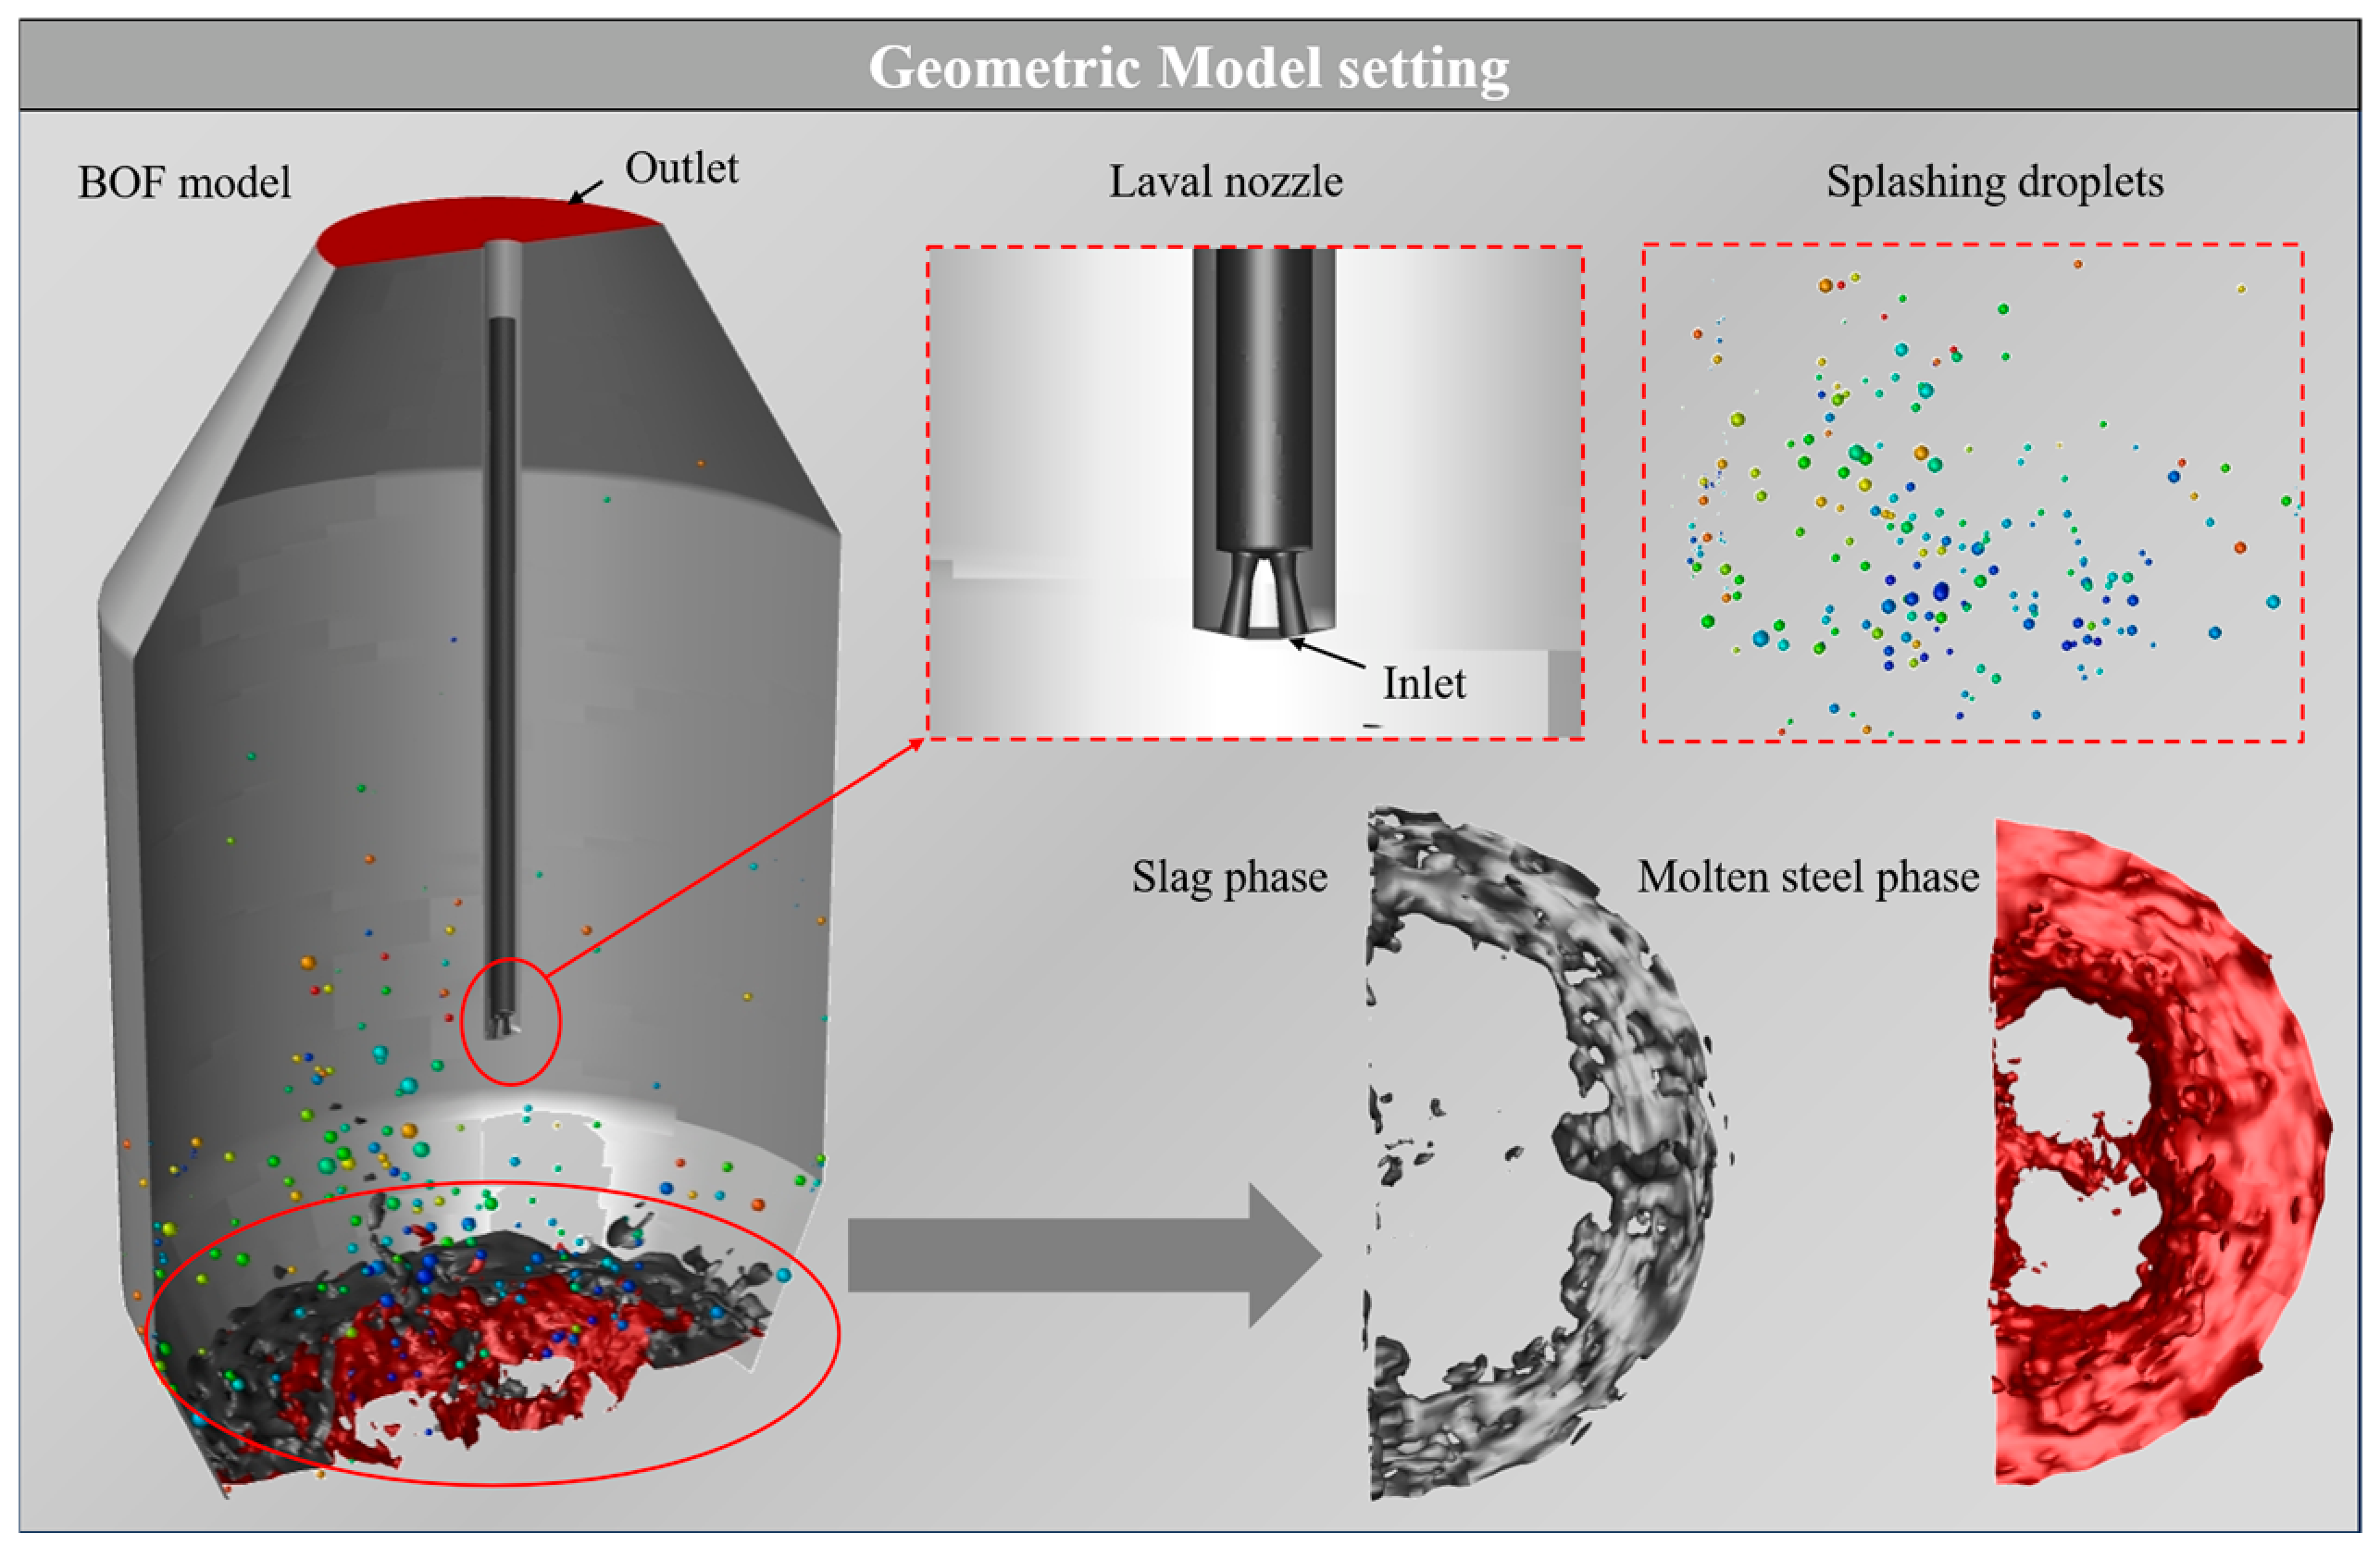
A two-way coupled VOF-DPM transition scheme was developed in this research to explore the slag splashing mechanism. The numerical geometry was built as a 1:10 downscaled model, corresponding to an actual 50-ton basic oxygen furnace operated in a domestic steel enterprise, and nitrogen consistent with the actual gas used for industrial slag splashing protection is adopted as the top-blowing medium. Key geometric parameters of the constructed model are listed in Table 2. To better coordinate computational accuracy and efficiency, the analysis only incorporates droplets within the diameter range of 2–8 mm. Particles smaller than 2 mm are neglected, since their influence on global splashing dynamics is insignificant while drastically increasing computing load. Meanwhile, droplets larger than 8 mm are also excluded, as their severe deformation under inertial effects would complicate phase recognition and interface conversion procedures. Given the considerable computational resources required, a half-symmetrical computational domain was adopted with symmetric boundary conditions imposed on the symmetry plane, as shown in Figure 3. To balance computational fidelity and efficiency, splashing droplets are statistically analyzed over the diameter range of 2–8 mm, with the selection rationale covering numerical resolution, phase transition rules, and physical splashing characteristics. The adaptive mesh refinement employed in the simulation delivers a minimum grid resolution of 1 mm, which is theoretically sufficient to capture droplets down to 1 mm. However, under the specific top-blowing conditions of BOF steelmaking, droplets smaller than 2 mm are physically negligible in quantity and contribute little to overall splashing behavior; including such fine droplets would also incur prohibitive computational overhead. For this reason, 2 mm is set as the lower bound of the statistical range. A diameter of 5 mm is specified as the threshold for the bidirectional VOF-to-DPM transition: droplets with an equivalent diameter of 5 mm or less are converted to Lagrangian DPM particles for efficient trajectory tracking, whereas liquid fragments larger than 5 mm remain resolved as continuous phases within the VOF framework. The 2–8 mm statistical range thus encompasses both DPM-tracked fine droplets typically in the 2–5 mm range and VOF-resolved large droplets typically in the 5–8 mm range. As for the upper bound, droplets larger than 8 mm are excluded from quantitative analysis. Such large droplets undergo severe deformation under jet impact and gravity, which introduces substantial challenges to phase interface identification and VOF-to-DPM transition judgment.
Table 2.
Main geometric parameters of prototype and model.
Figure 3.
Geometric model used in simulation.
2.5. Grid Setting and AMR Method
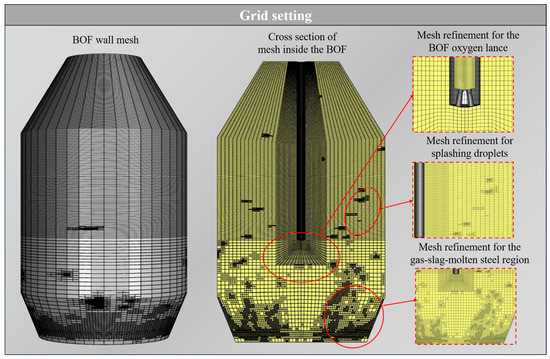
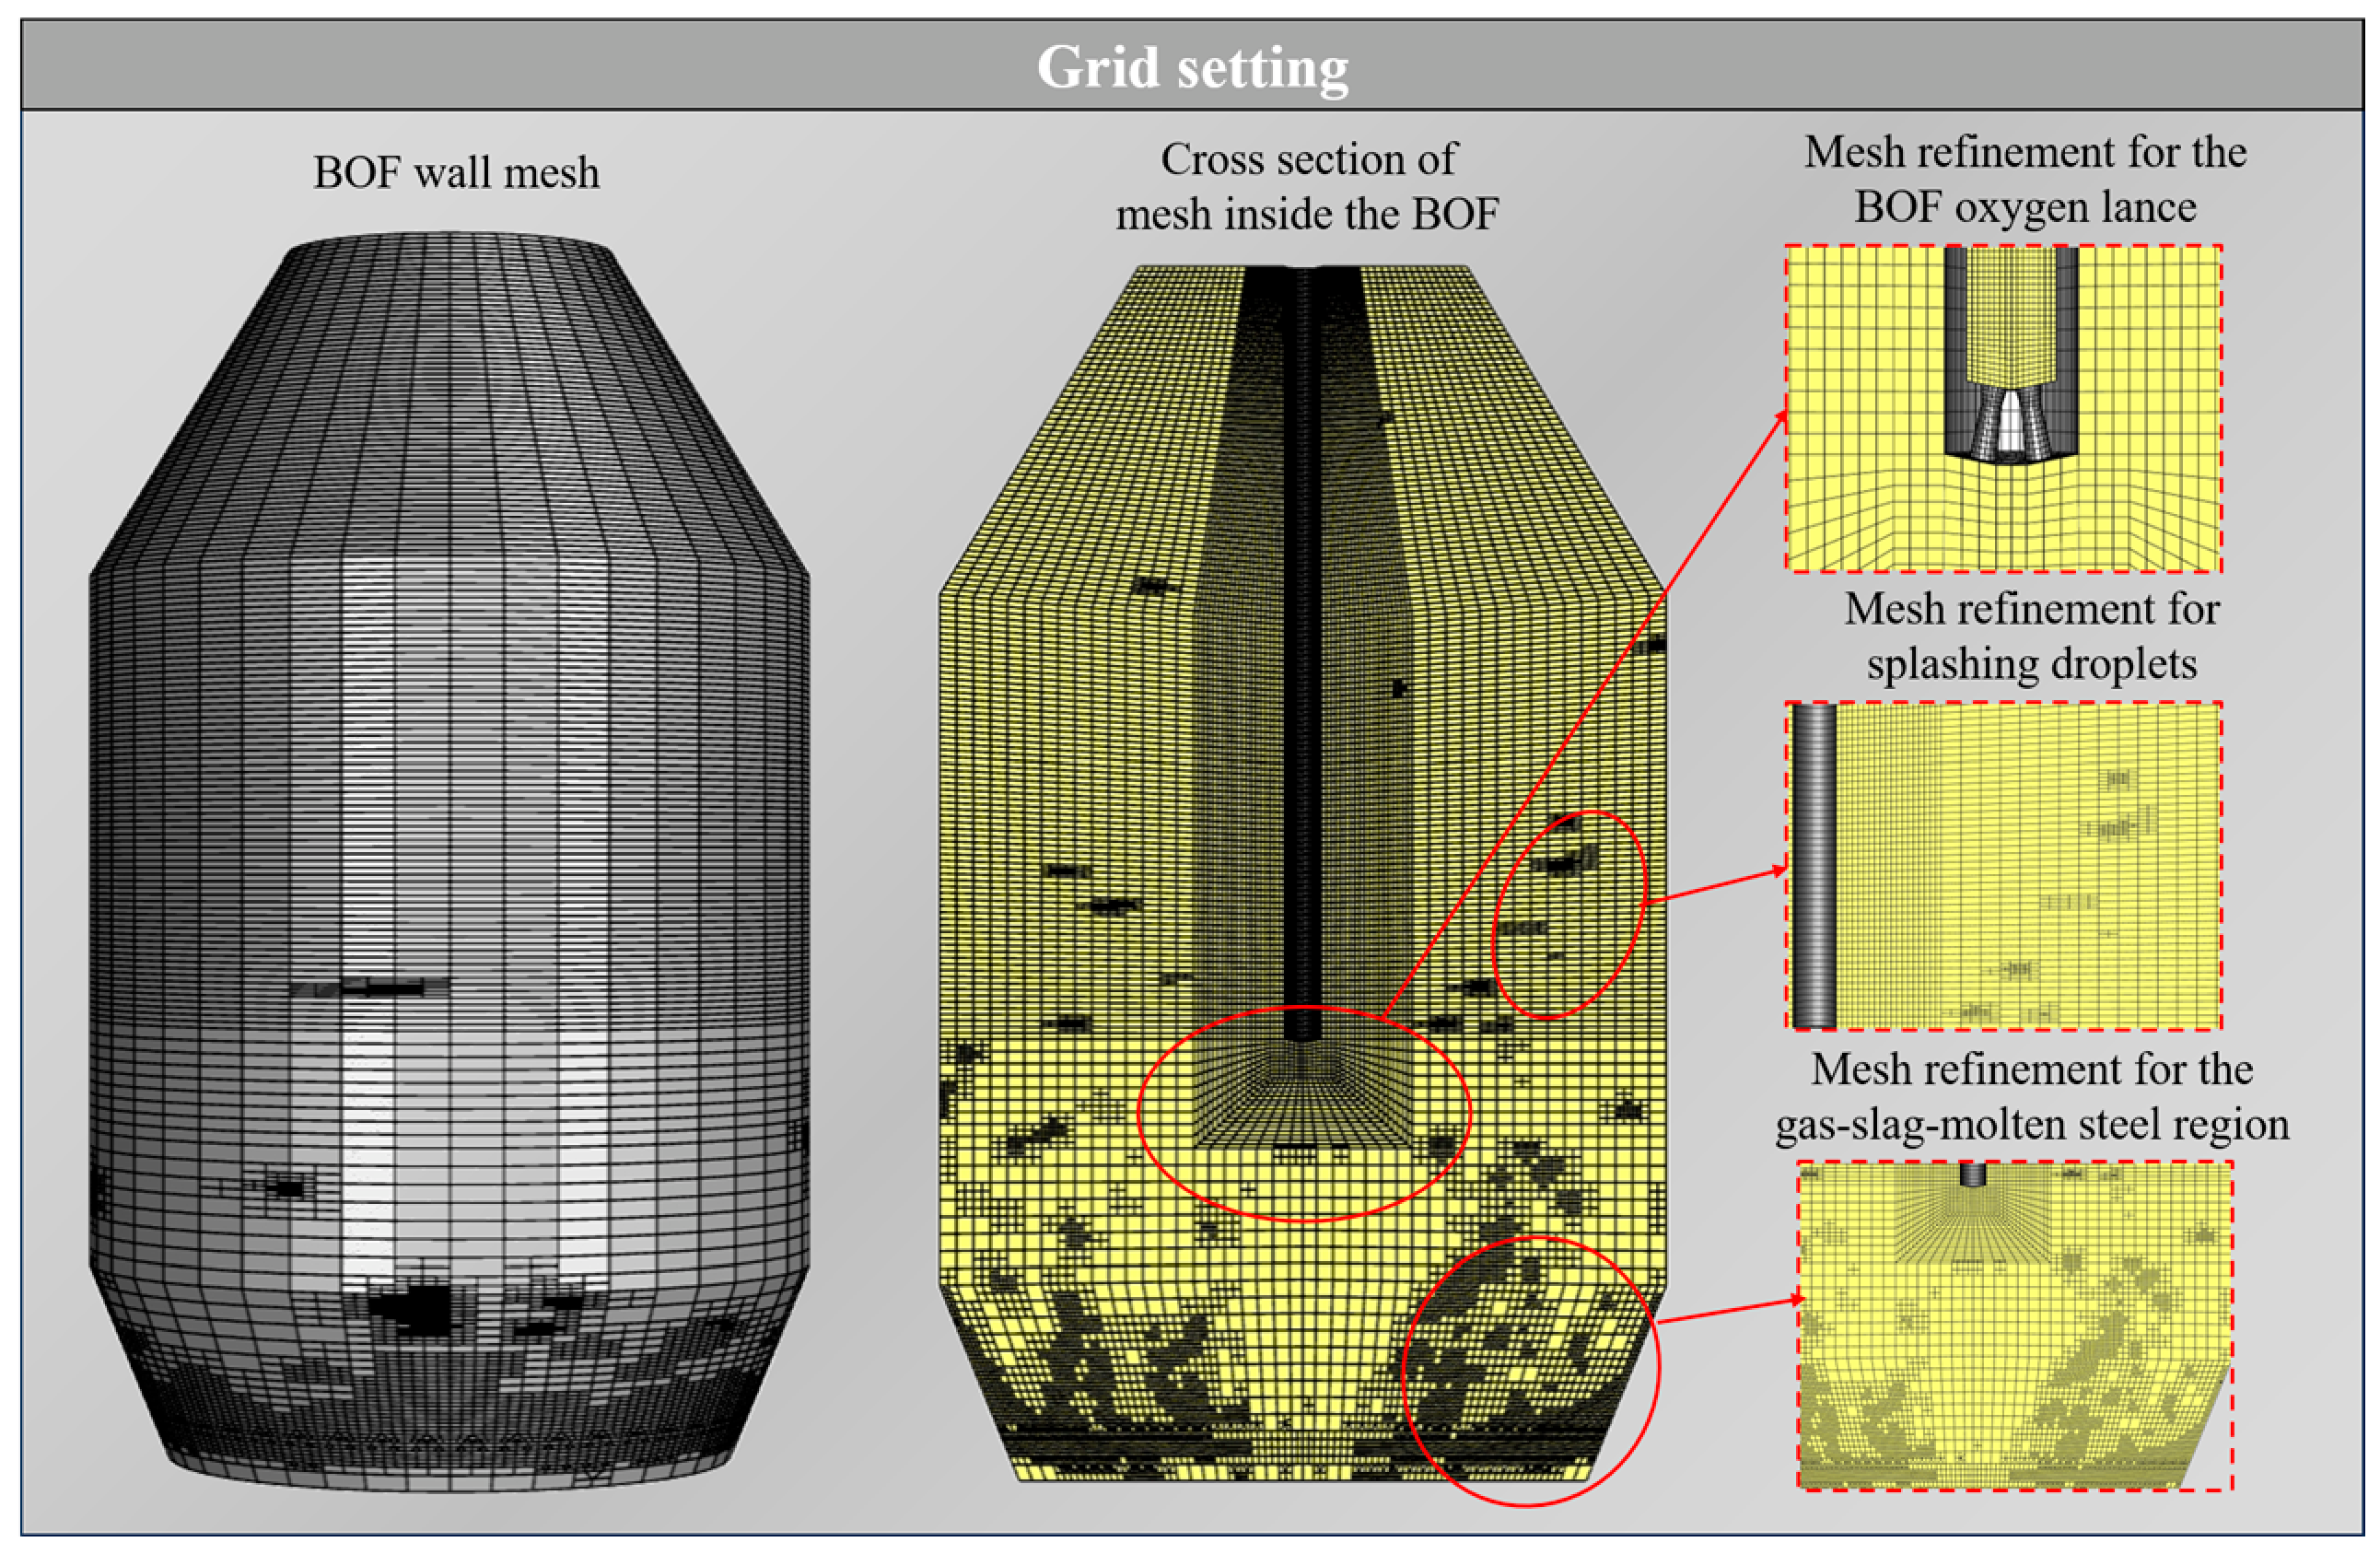
Within the two-way coupled VOF-DPM framework, the accuracy of discrete droplet trajectory tracking is highly dependent on mesh resolution, which must be sufficiently fine to capture the discrete droplets effectively. As the VOF solver is prone to numerical deviations triggered by grid non-orthogonality and skewness, high-precision simulations usually call for dense spatial discretization and small time increments. To mitigate the prohibitive computational cost associated with full-domain mesh refinement, adaptive mesh refinement (AMR) is adopted in this study as shown in Figure 4.
Figure 4.
Grid division used in simulation.
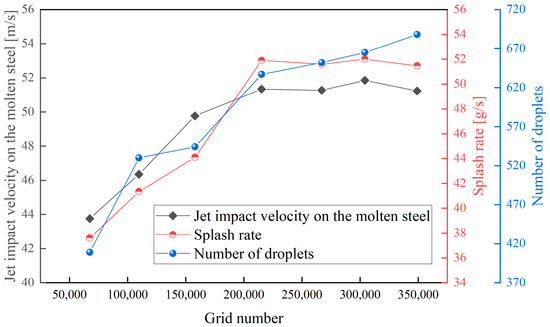
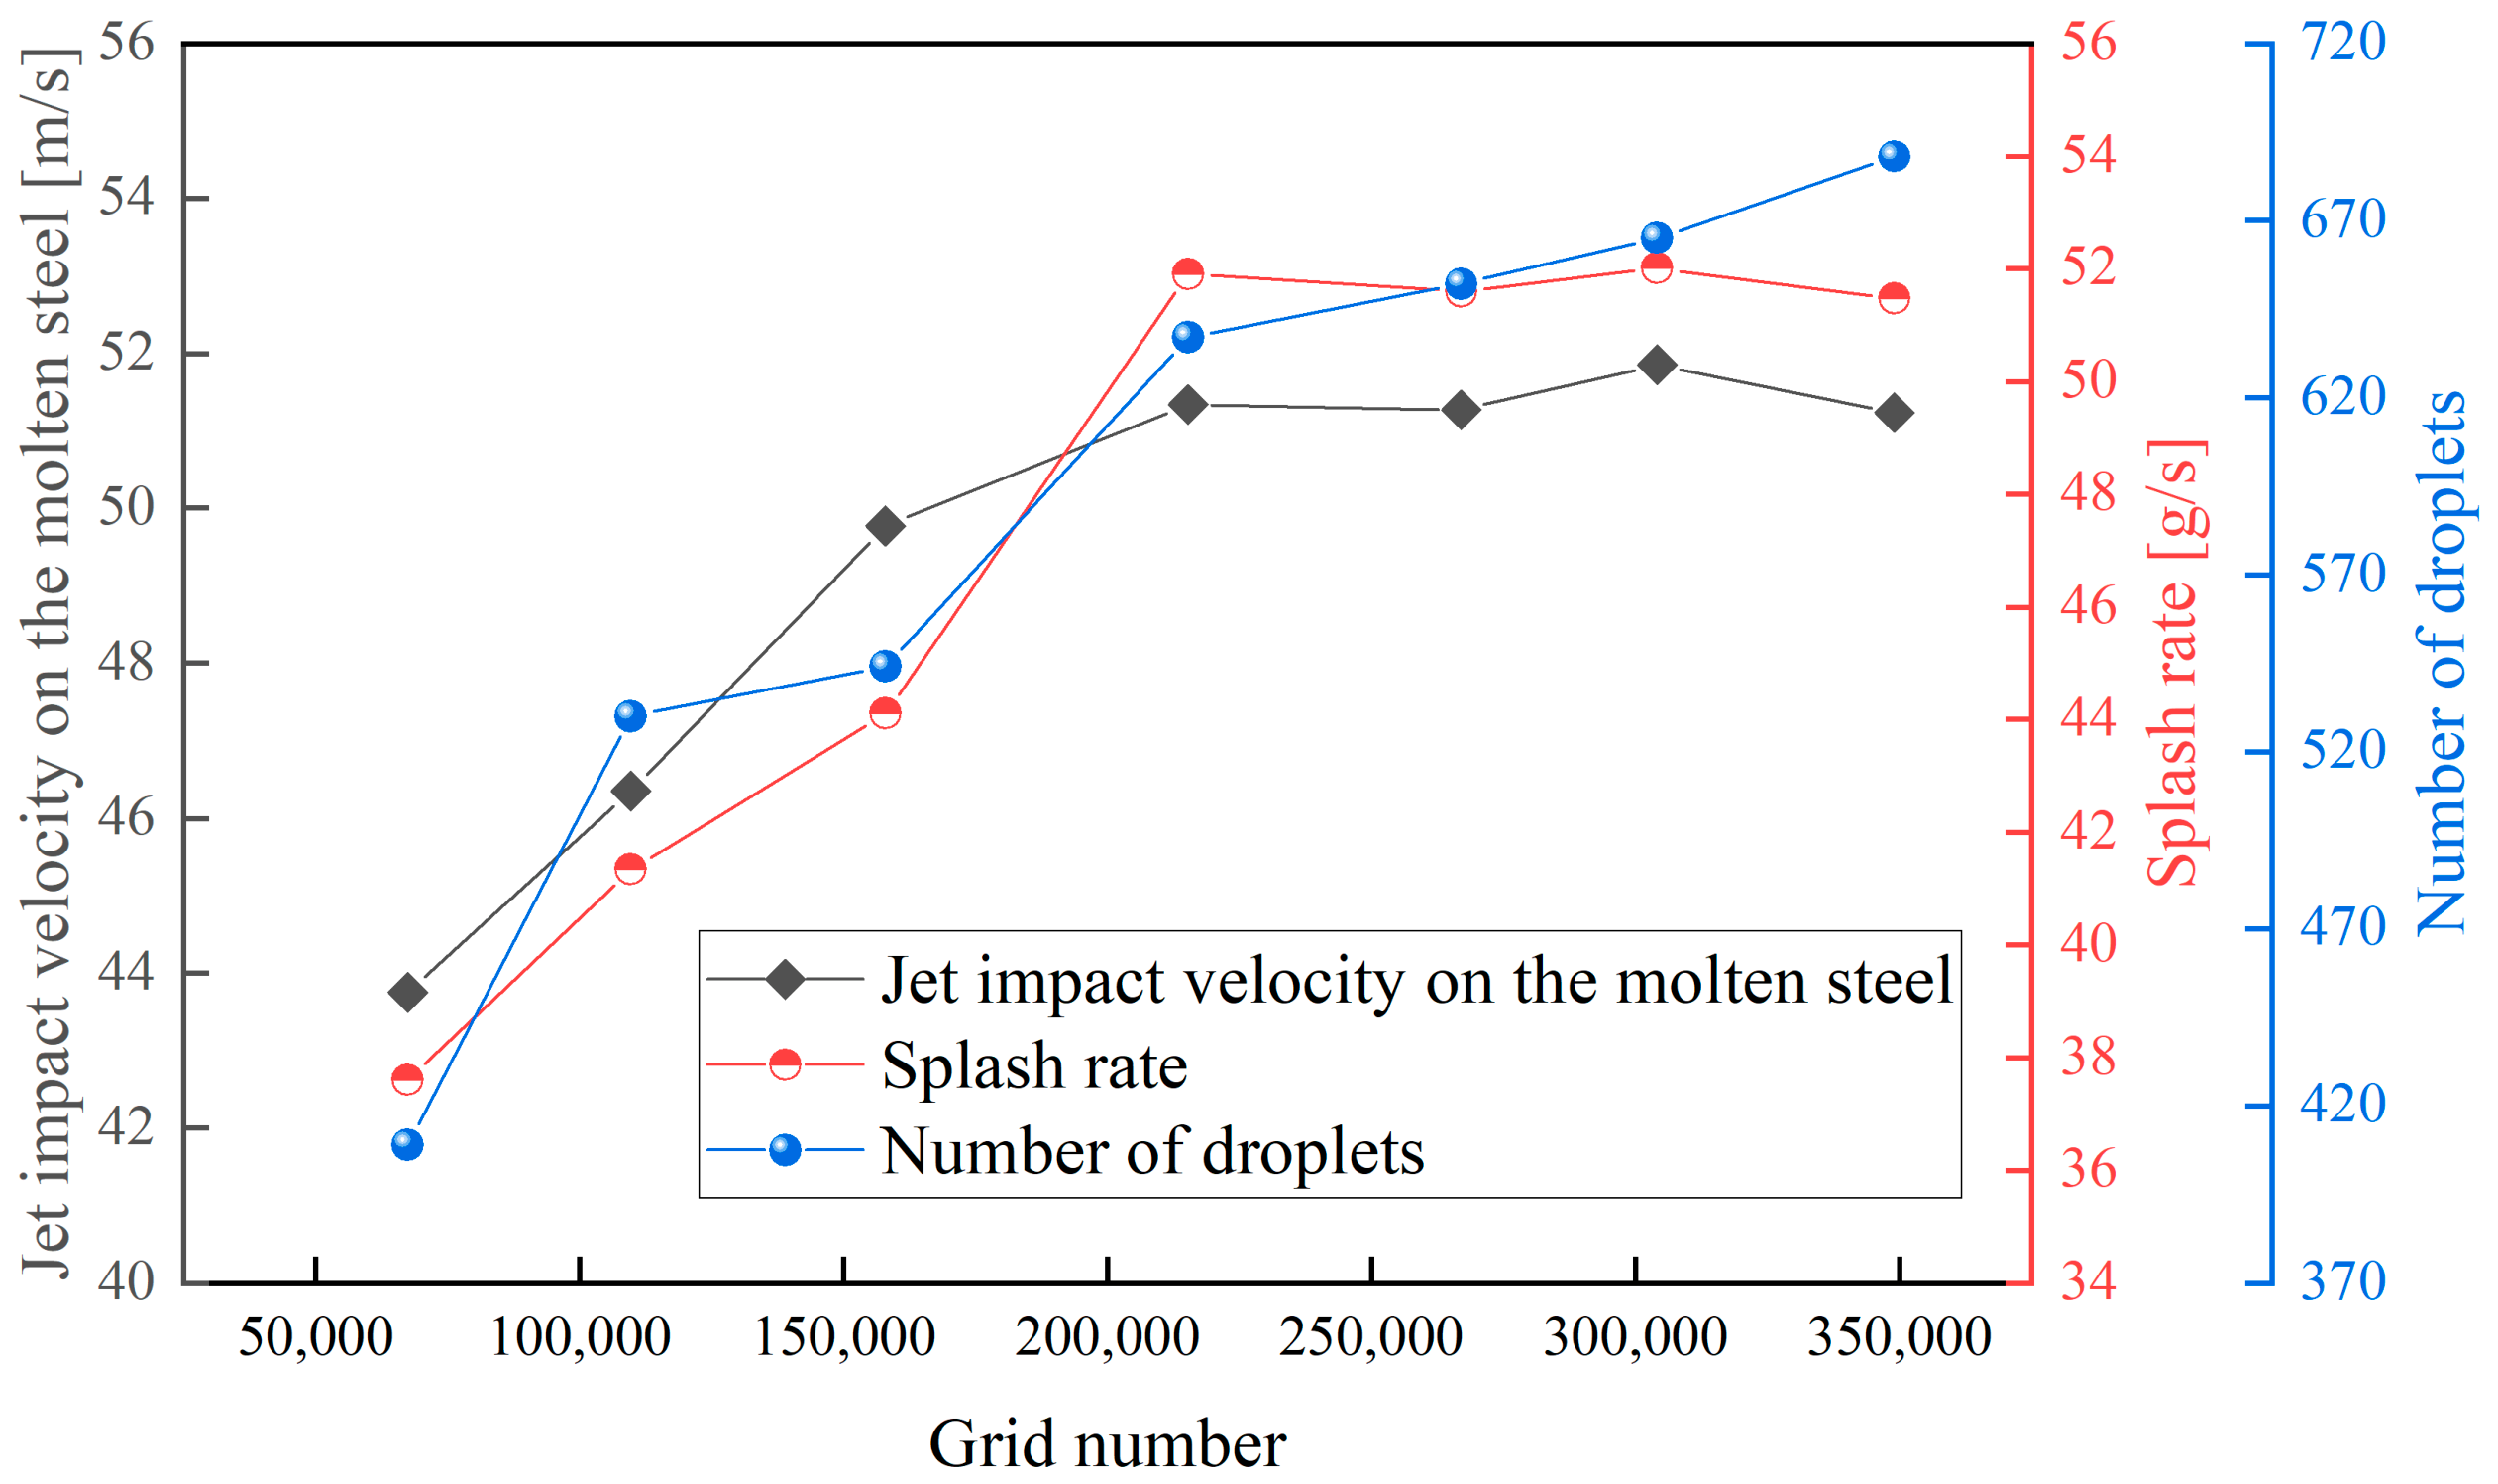
To verify the reliability and convergence of the numerical results, numerical convergence tests were carried out using seven distinct base grid densities, namely 67 k, 109 k, 157 k, 214 k, 266 k, 304 k, and 348 k initial cells, with adaptive mesh refinement (AMR), adopted to maintain a minimum cell volume of 0.5 mm3 in the splashing zone for all cases. Figure 5 demonstrates the convergence behaviors of the jet impact velocity, the macroscopic splash rate, and the cumulative count of transition droplets extracted at 1.0 s after the onset of splashing across these seven mesh configurations. While the macroscopic splash rate and jet impact velocity converge rapidly starting from the 214 k base mesh, showing a relative change in less than 3% upon further refinement to 348 k, the resolved droplet count exhibits a continuous yet marginal upward trend from 648 at 214 k to 683 at 348 k. This slight increase is physically reasonable, as a higher grid density enhances the interfacial resolution, enabling the Volume of Fluid method to resolve finer surface instabilities and primary ligaments before converting them into Discrete Phase Model particles. However, this micro-resolution improvement comes at a prohibitive computational penalty under the dynamic AMR scheme. Refining the base mesh from 266 k to 348 k escalates the peak active grid count under AMR from 1.10 million to 1.51 million cells, representing a 37% expansion that leads to an exponential surge in computational cost for a negligible 2.7% increase in droplet count. Consequently, considering the diminishing returns in physical accuracy and the massive computational overhead, the mesh configuration combining a 266 k base grid, which reaches a peak of 1.10 million cells under AMR, with adaptive refinement was selected as the optimal scheme that balances numerical precision and computational efficiency.
Figure 5.
Verification of grid independence.
2.6. Boundary Conditions and Numerical Details
Numerical simulations were conducted using a pressure-based solver, with the computational domain defined by a pressure outlet and an oxygen velocity inlet. The simulations encompassed gas flow rates of 6.35, 8.91, and 11.76 Nm3/h, as well as lance heights of 200, 220, and 240 mm. All solid boundaries were designated as no-slip walls to fulfill boundary layer requirements. Turbulence closure was accomplished using the SST k-ω model integrated with compressibility corrections and standard wall functions for near-wall flow resolution. The PISO algorithm was employed for pressure–velocity coupling, while spatial accuracy was preserved through the PRESTO! scheme for pressure discretization and the Geometric Reconstruction scheme for phase interface interpolation. Concurrently, the convective terms in the energy and turbulence equations were discretized using a second-order upwind scheme. Convergence was determined when the residuals of all transport variables fell below 10−3 within a single time step. To ensure the stability of the transient VOF-DPM solver, the global Courant number was restricted to 2.5, and the temporal discretization was switched from an initial time step of 10−5 s to an adaptive algorithm. This adaptive temporal scheme ensured that the phase interface migration remained within two mesh cells per time step, thereby maintaining the robust operation of the pressure–velocity coupling mechanism.
2.7. Impact Weber Number-Based Splashing Criterion
To quantitatively justify the physical validity of the VOF-to-DPM transition and the splashing onset induced by the impinging jet, the impact Weber number (Weimpact) is evaluated as follows:
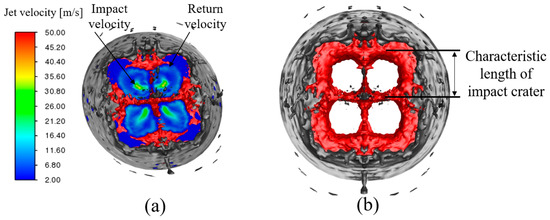
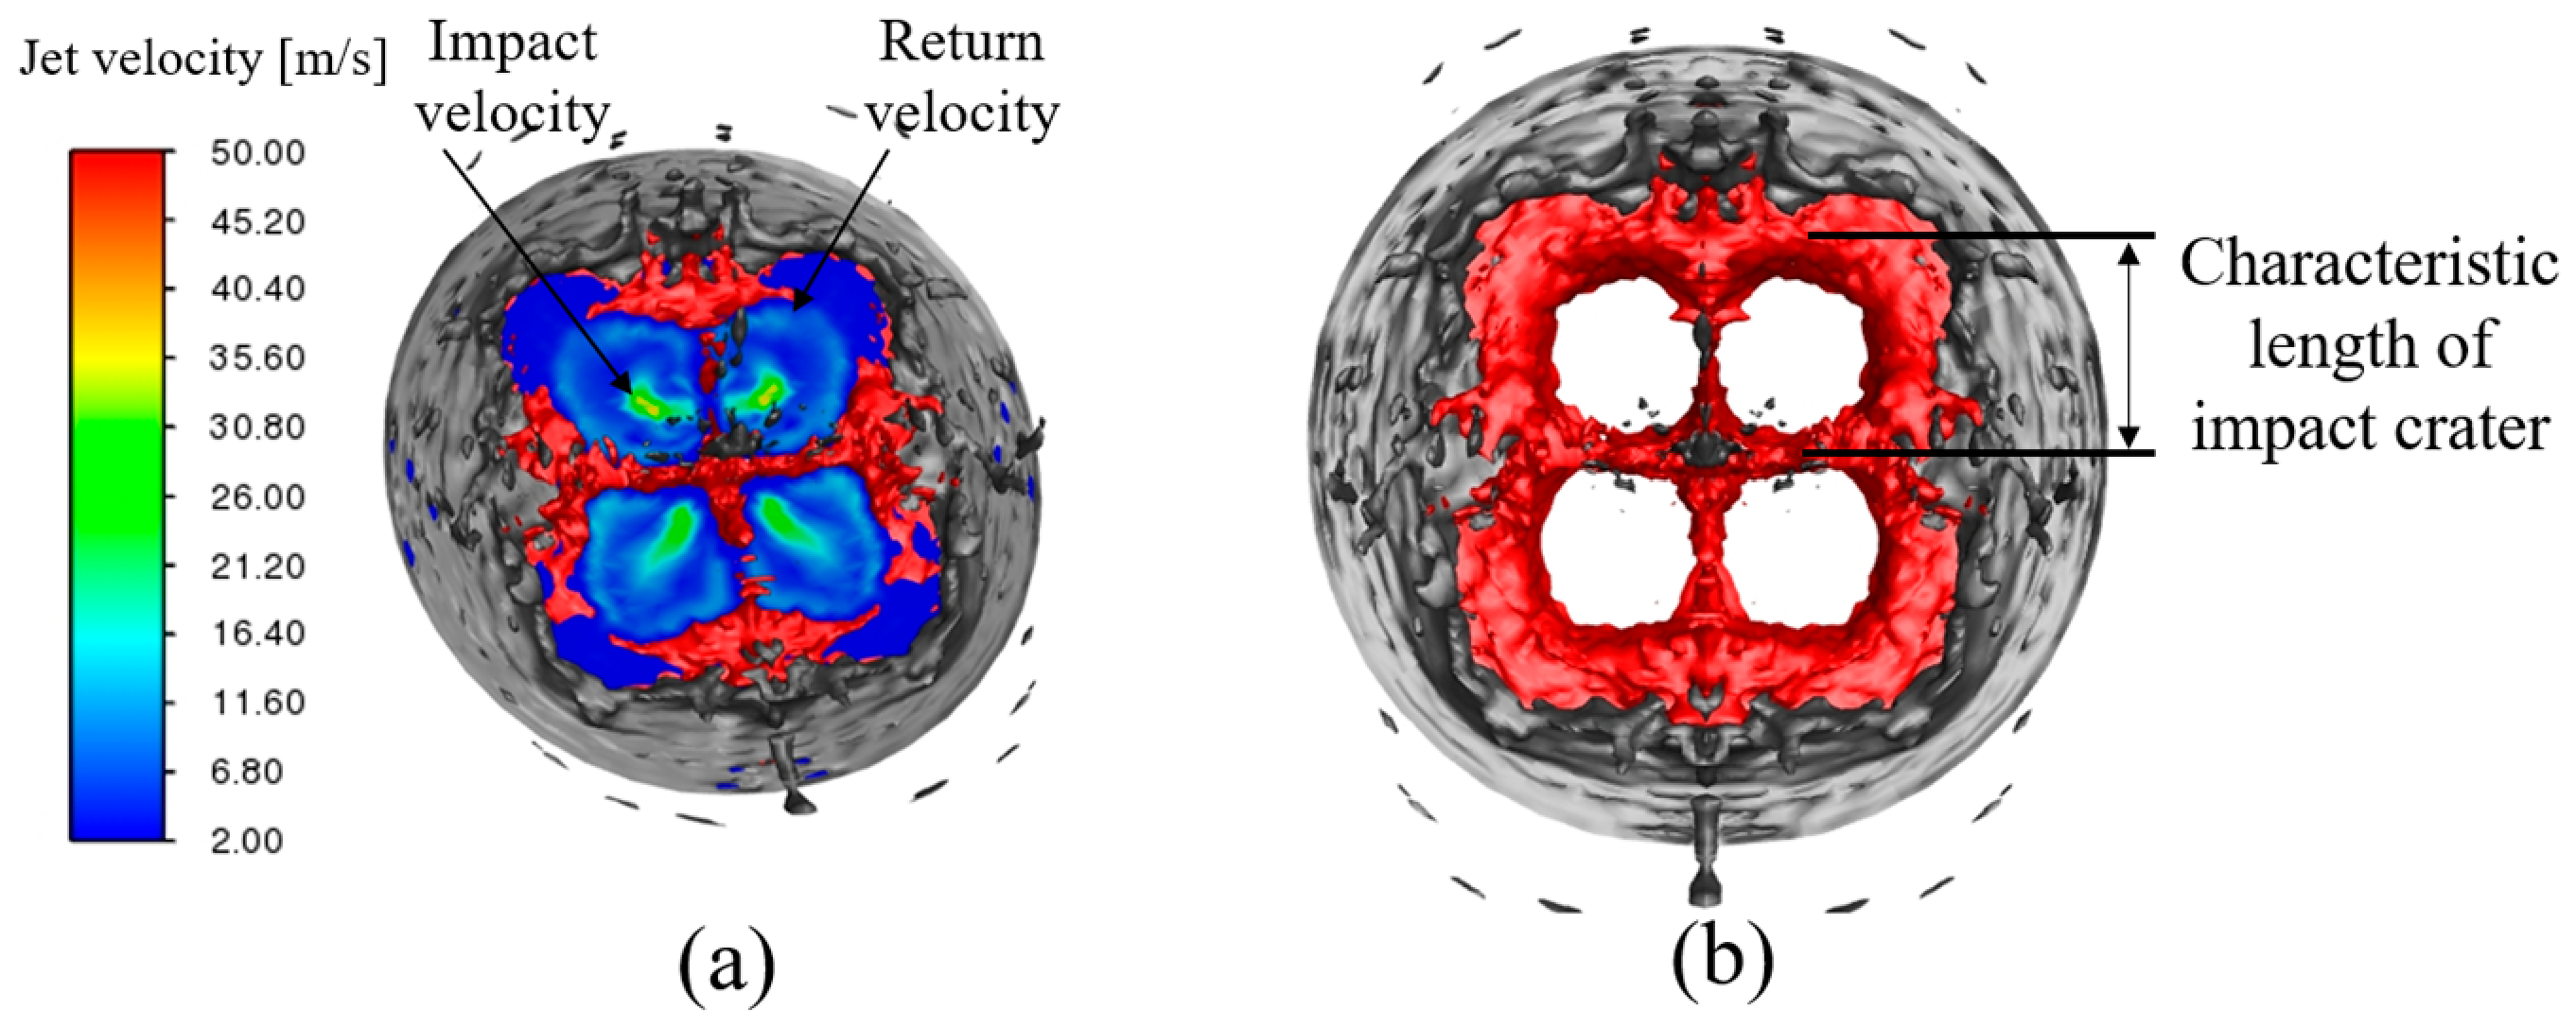
where ρ is the density of the gas phase, vjet is the characteristic velocity of the impinging jet at the impact interface, d is the characteristic length of the maximum cavity diameter extracted from the VOF phase, and σ is the surface tension. Both the determination of characteristic velocity and characteristic length is shown in Figure 6.
Figure 6.
Determination of parameters of the Weimpact: (a) characteristic velocity; (b) characteristic length.
The Weimpact was subsequently calculated for this set of operating conditions, as shown in Table 3. It indicates that the calculated Weimpact is physically realistic and highly reasonable for blowing studies in metallurgical reactors, which is well supported by the findings of Zhong et al. [28]. The corresponding Weimpact values for all cases within our 3 × 3 experimental matrix are fully presented in Table 1. According to Varga [29], the liquid surface becomes unstable and undergoes membrane breakup when Weimpact reaches approximately 12 (Weimpact ≈ 12). Under such Weimpact, the splashing process induced by the impinging jet on the bath physically satisfies the criteria for transitioning from a continuous phase to a discrete phase.
Table 3.
Weimpact under different operating conditions.
A critical question may arise regarding whether the resolved gas velocity and the generated droplet sizes satisfy the physical criteria for boundary layer tearing. At the cavity rim during jet impingement, the liquid film is already pre-sheared and stretched into highly unstable, slender ligaments (characteristic thickness h). Here, the droplet initiation is governed by localized primary stripping rather than macroscopic droplet deformation:
where h is the characteristic thickness of the localized liquid ligament resolved at the grid scale, rather than the finalized macroscale droplet diameter dp.
To break a highly stable spherical droplet in a free stream, the aerodynamic drag must flatten the entire sphere and blow it into a bag, which requires a high energy barrier (Weimpact > 12). In contrast, at the cavity rim under refined grids, the liquid has already been pre-sheared into highly unstable, slender ligaments (thickness h). At this stage, the breakup is dominated by local capillary instability rather than macroscopic deformation. To tear the ligament, the local gas dynamic pressure (ρgvg2) only needs to overcome the local Laplace pressure (σ/h) at the bending interface:
For a finalized droplet of dp = 5 mm, the localized ligament scale is h ≈ 4.23 mm, yielding Welocal ≈ 1.076, meeting the requirements of liquid sheet shear tearing, Welocal~O(1).
2.8. Blowing Number Theory
Acquiring droplet splash rate through both experimental and numerical methods remains a challenging task. Subagyo et al. [10] proposed a dimensionless NB to characterize the splashing phenomenon. This parameter represents the ratio of inertial force to the combined effect of gravitational force and surface tension force, as shown in Equation (18).
where ρg and ρl are the densities of the gas and liquid, respectively; σ is the surface tension; and Ug is the critical gas velocity.
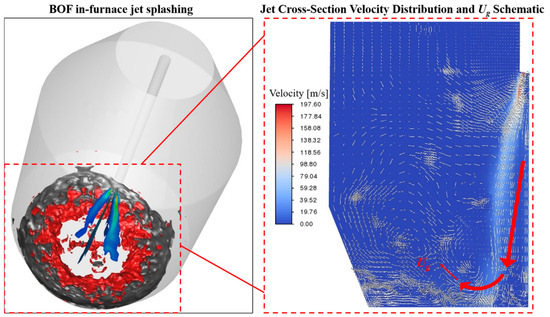
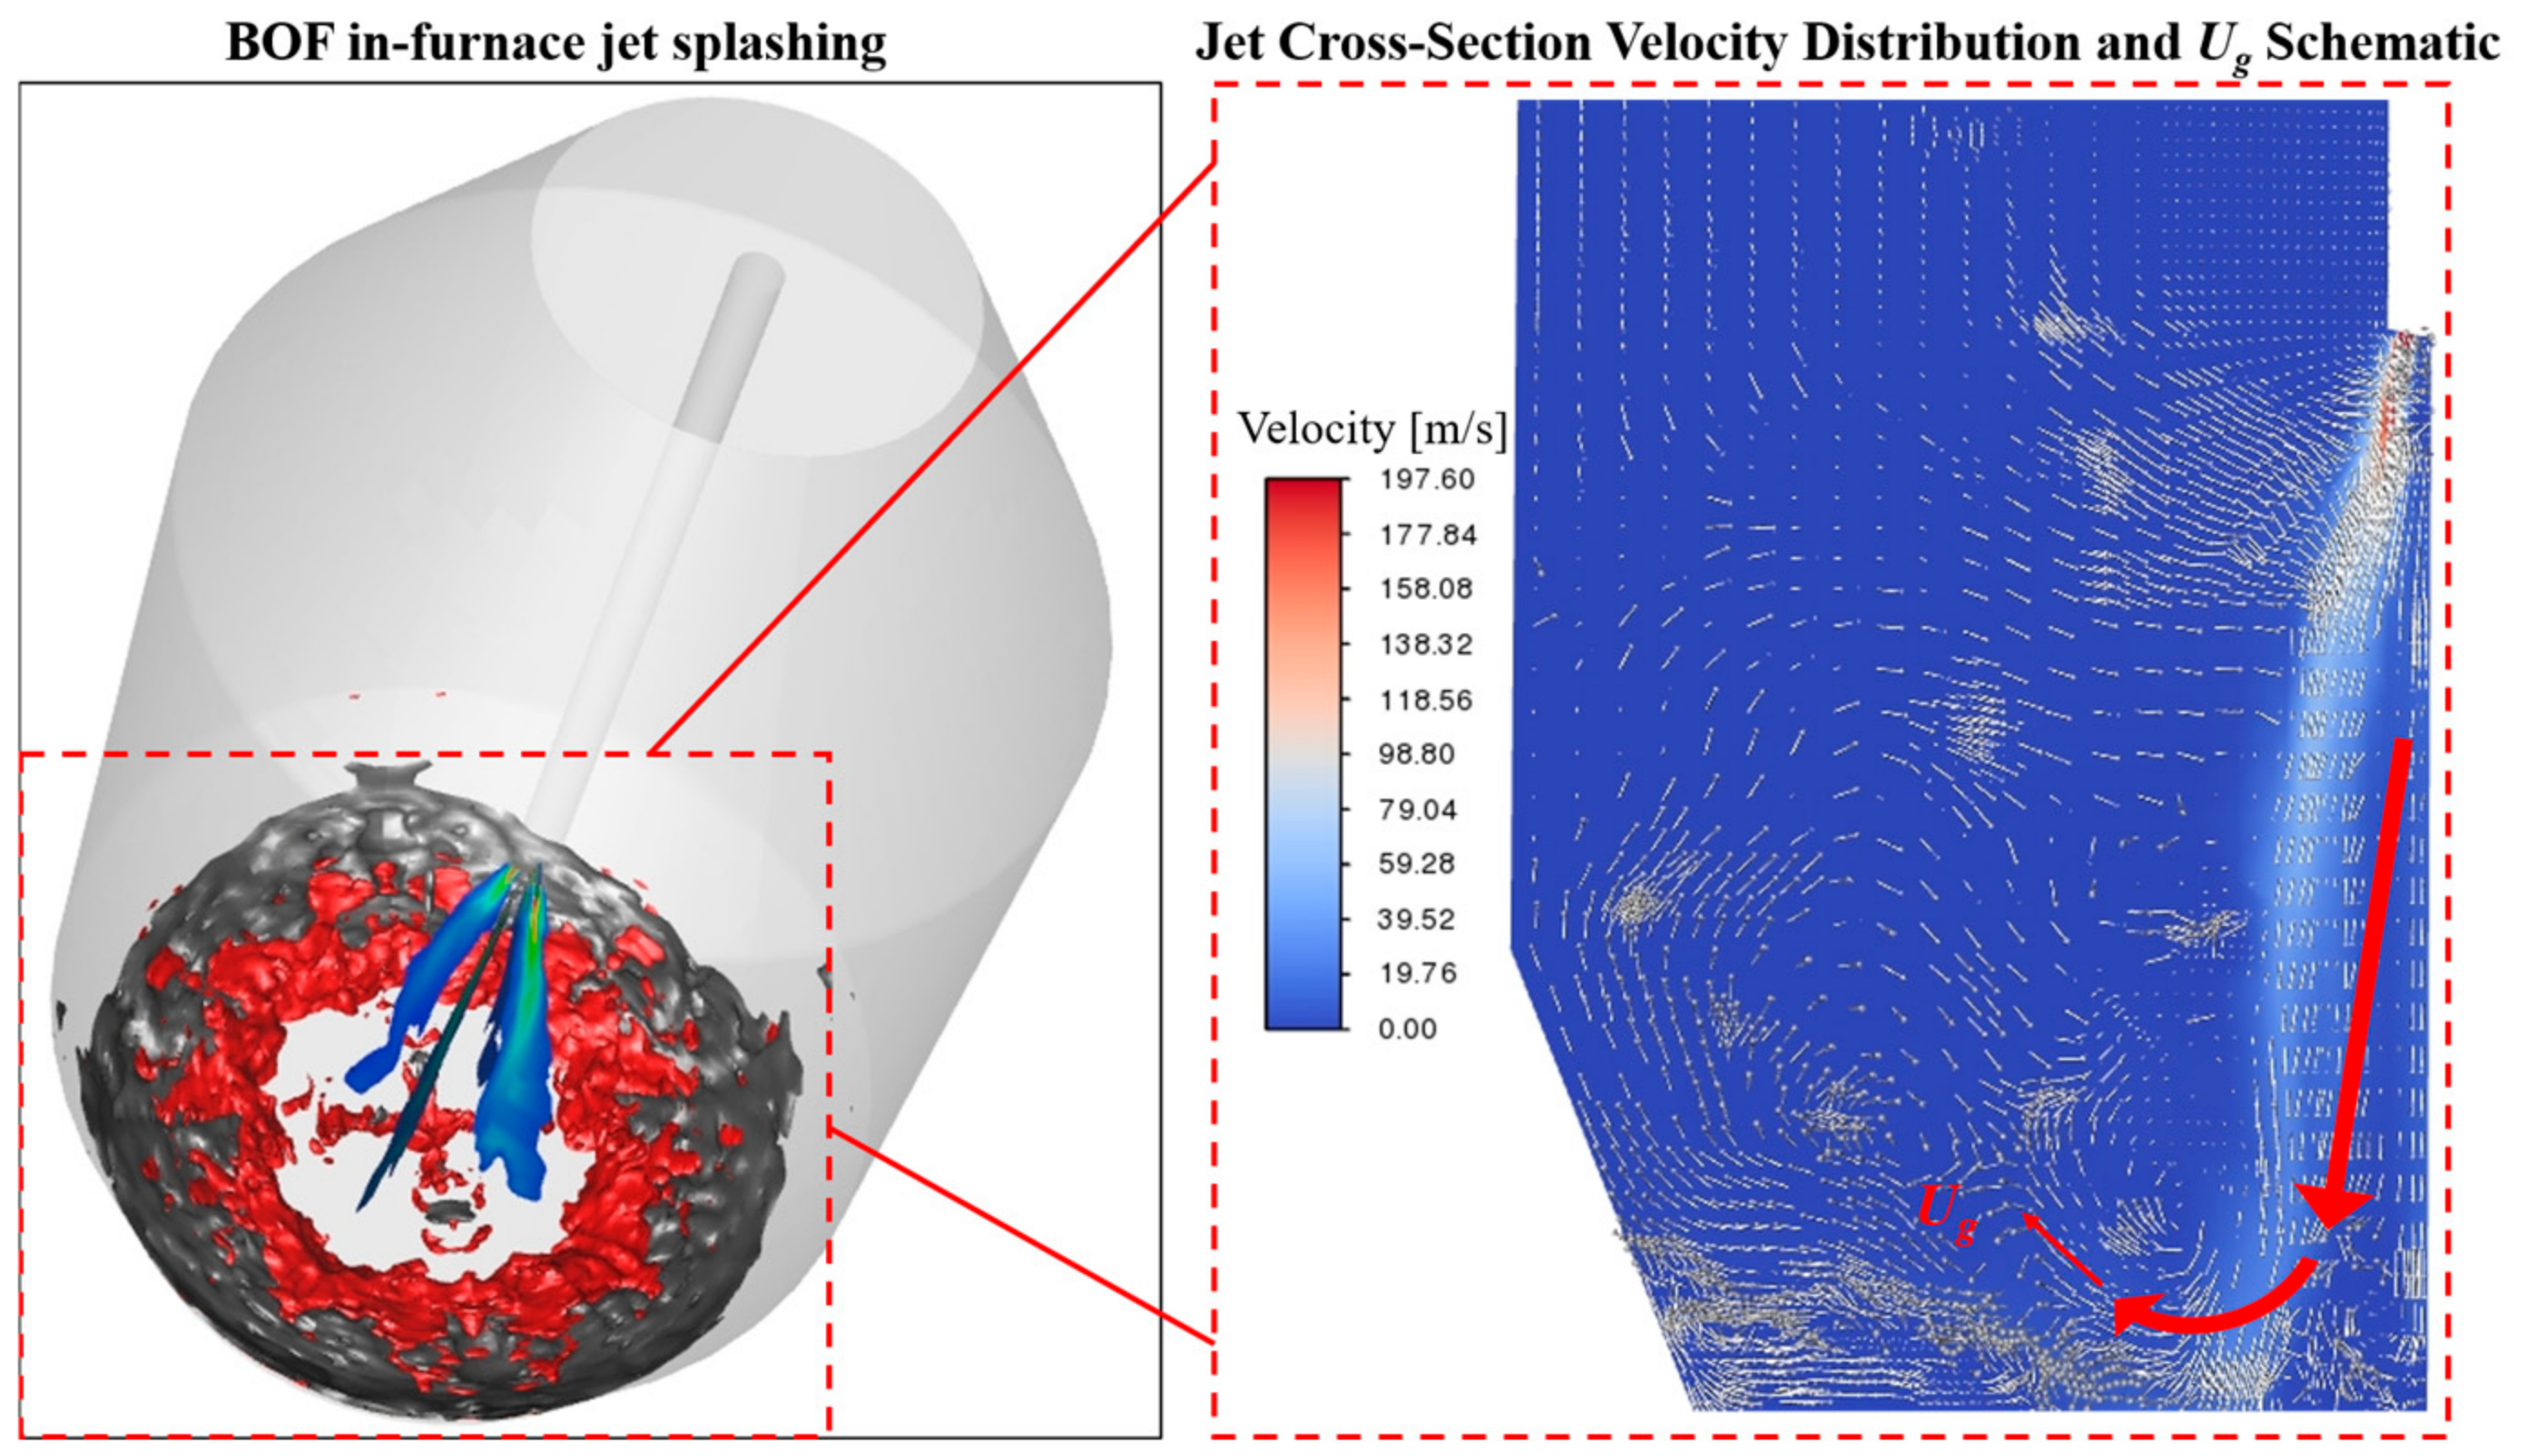
The critical gas velocity (Ug) was determined via numerical simulation. Figure 7 presents a schematic diagram illustrating the extraction of the critical gas velocity from the CFD simulation results. To quantify the critical gas velocity (Ug) at the onset of splashing, a reproducible and mathematically validated extraction algorithm based on physical field features is implemented in this study. First, the transient gas–liquid interface is identified using the volume fraction isosurface in the VOF model, defined where the liquid volume fraction αl equals 0.5. The critical spatial coordinate (rc, zc) at the cavity rim—where droplet splashing occurs as aerodynamic shear stress overcomes surface tension—is then determined objectively by locating the peak wall shear stress along this interface. Finally, at this identified location, Ug is extracted as the absolute magnitude of the gas-phase velocity vector immediately above the liquid boundary layer, ensuring an objective and reproducible determination across different lance heights and jet velocities:
Figure 7.
Extraction of critical gas velocity Ug.
The NB was subsequently calculated for this set of operating conditions, as shown in Table 4.
Table 4.
Blowing Number (NB) under different operating conditions.
3. Results and Discussion
3.1. Verification of Mass Balance for VOF and DPM Phases
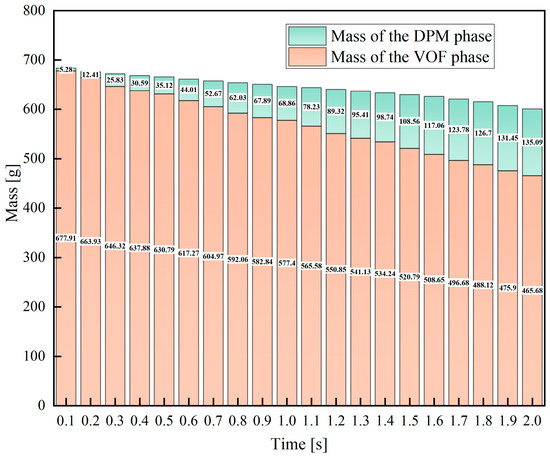
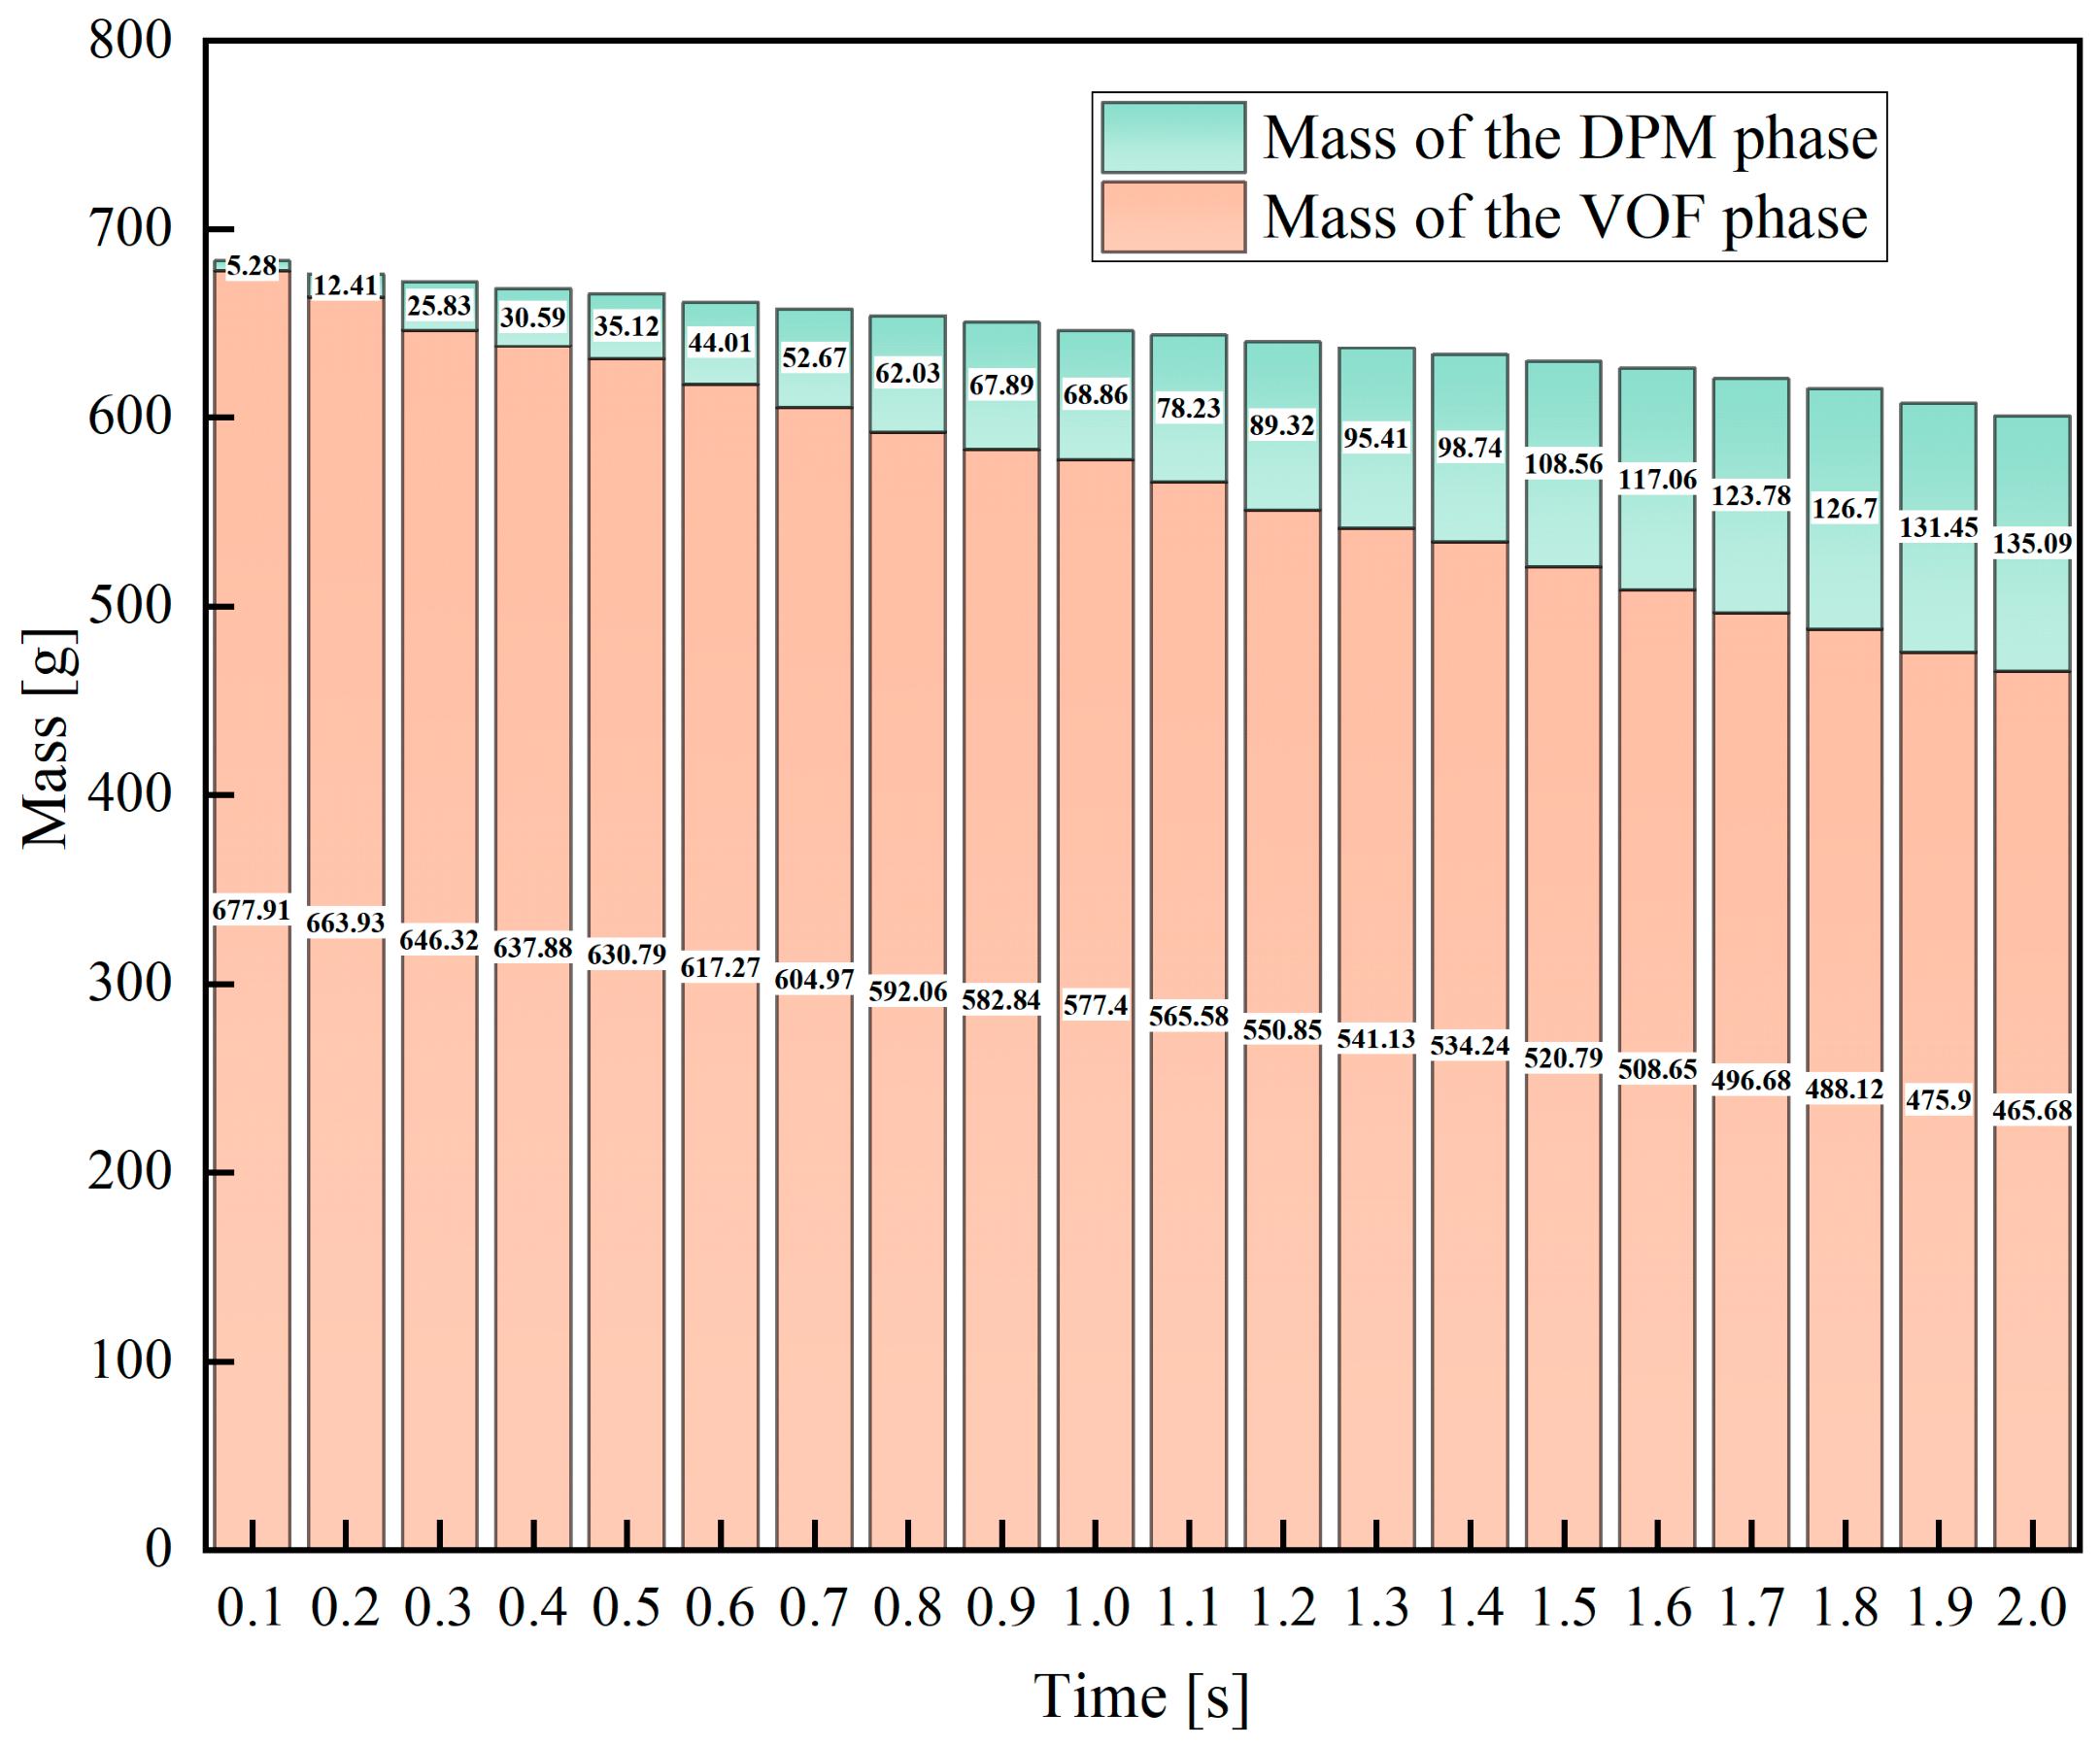
To verify the numerical mass conservation performance of the coupled VOF-DPM model, a mass balance calculation for the slag phase was conducted, with the results presented in Figure 8. The initial total mass of slag within the computational domain is set at 684.71. After 2 s of splashing simulation, the mass of the continuous slag phase captured by the VOF framework reaches 514.68, while the mass of the discrete splashing droplets tracked by the DPM module amounts to 135.09, giving a combined total mass of 649.77. Accordingly, the relative mass deviation is calculated as 5.10%. This small discrepancy primarily arises from numerical diffusion, as well as minor mass loss at boundaries during the transient multiphase flow driven by jets. This level of deviation falls within the acceptable range for industrial-scale converter numerical simulations, which confirms the favorable mass conservation capability of the proposed coupled model.
Figure 8.
Verification of mass balance for VOF and DPM phases.
3.2. Validation Against Experimental Measurements
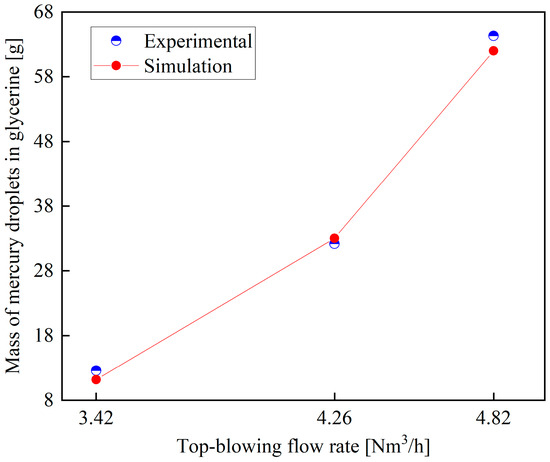
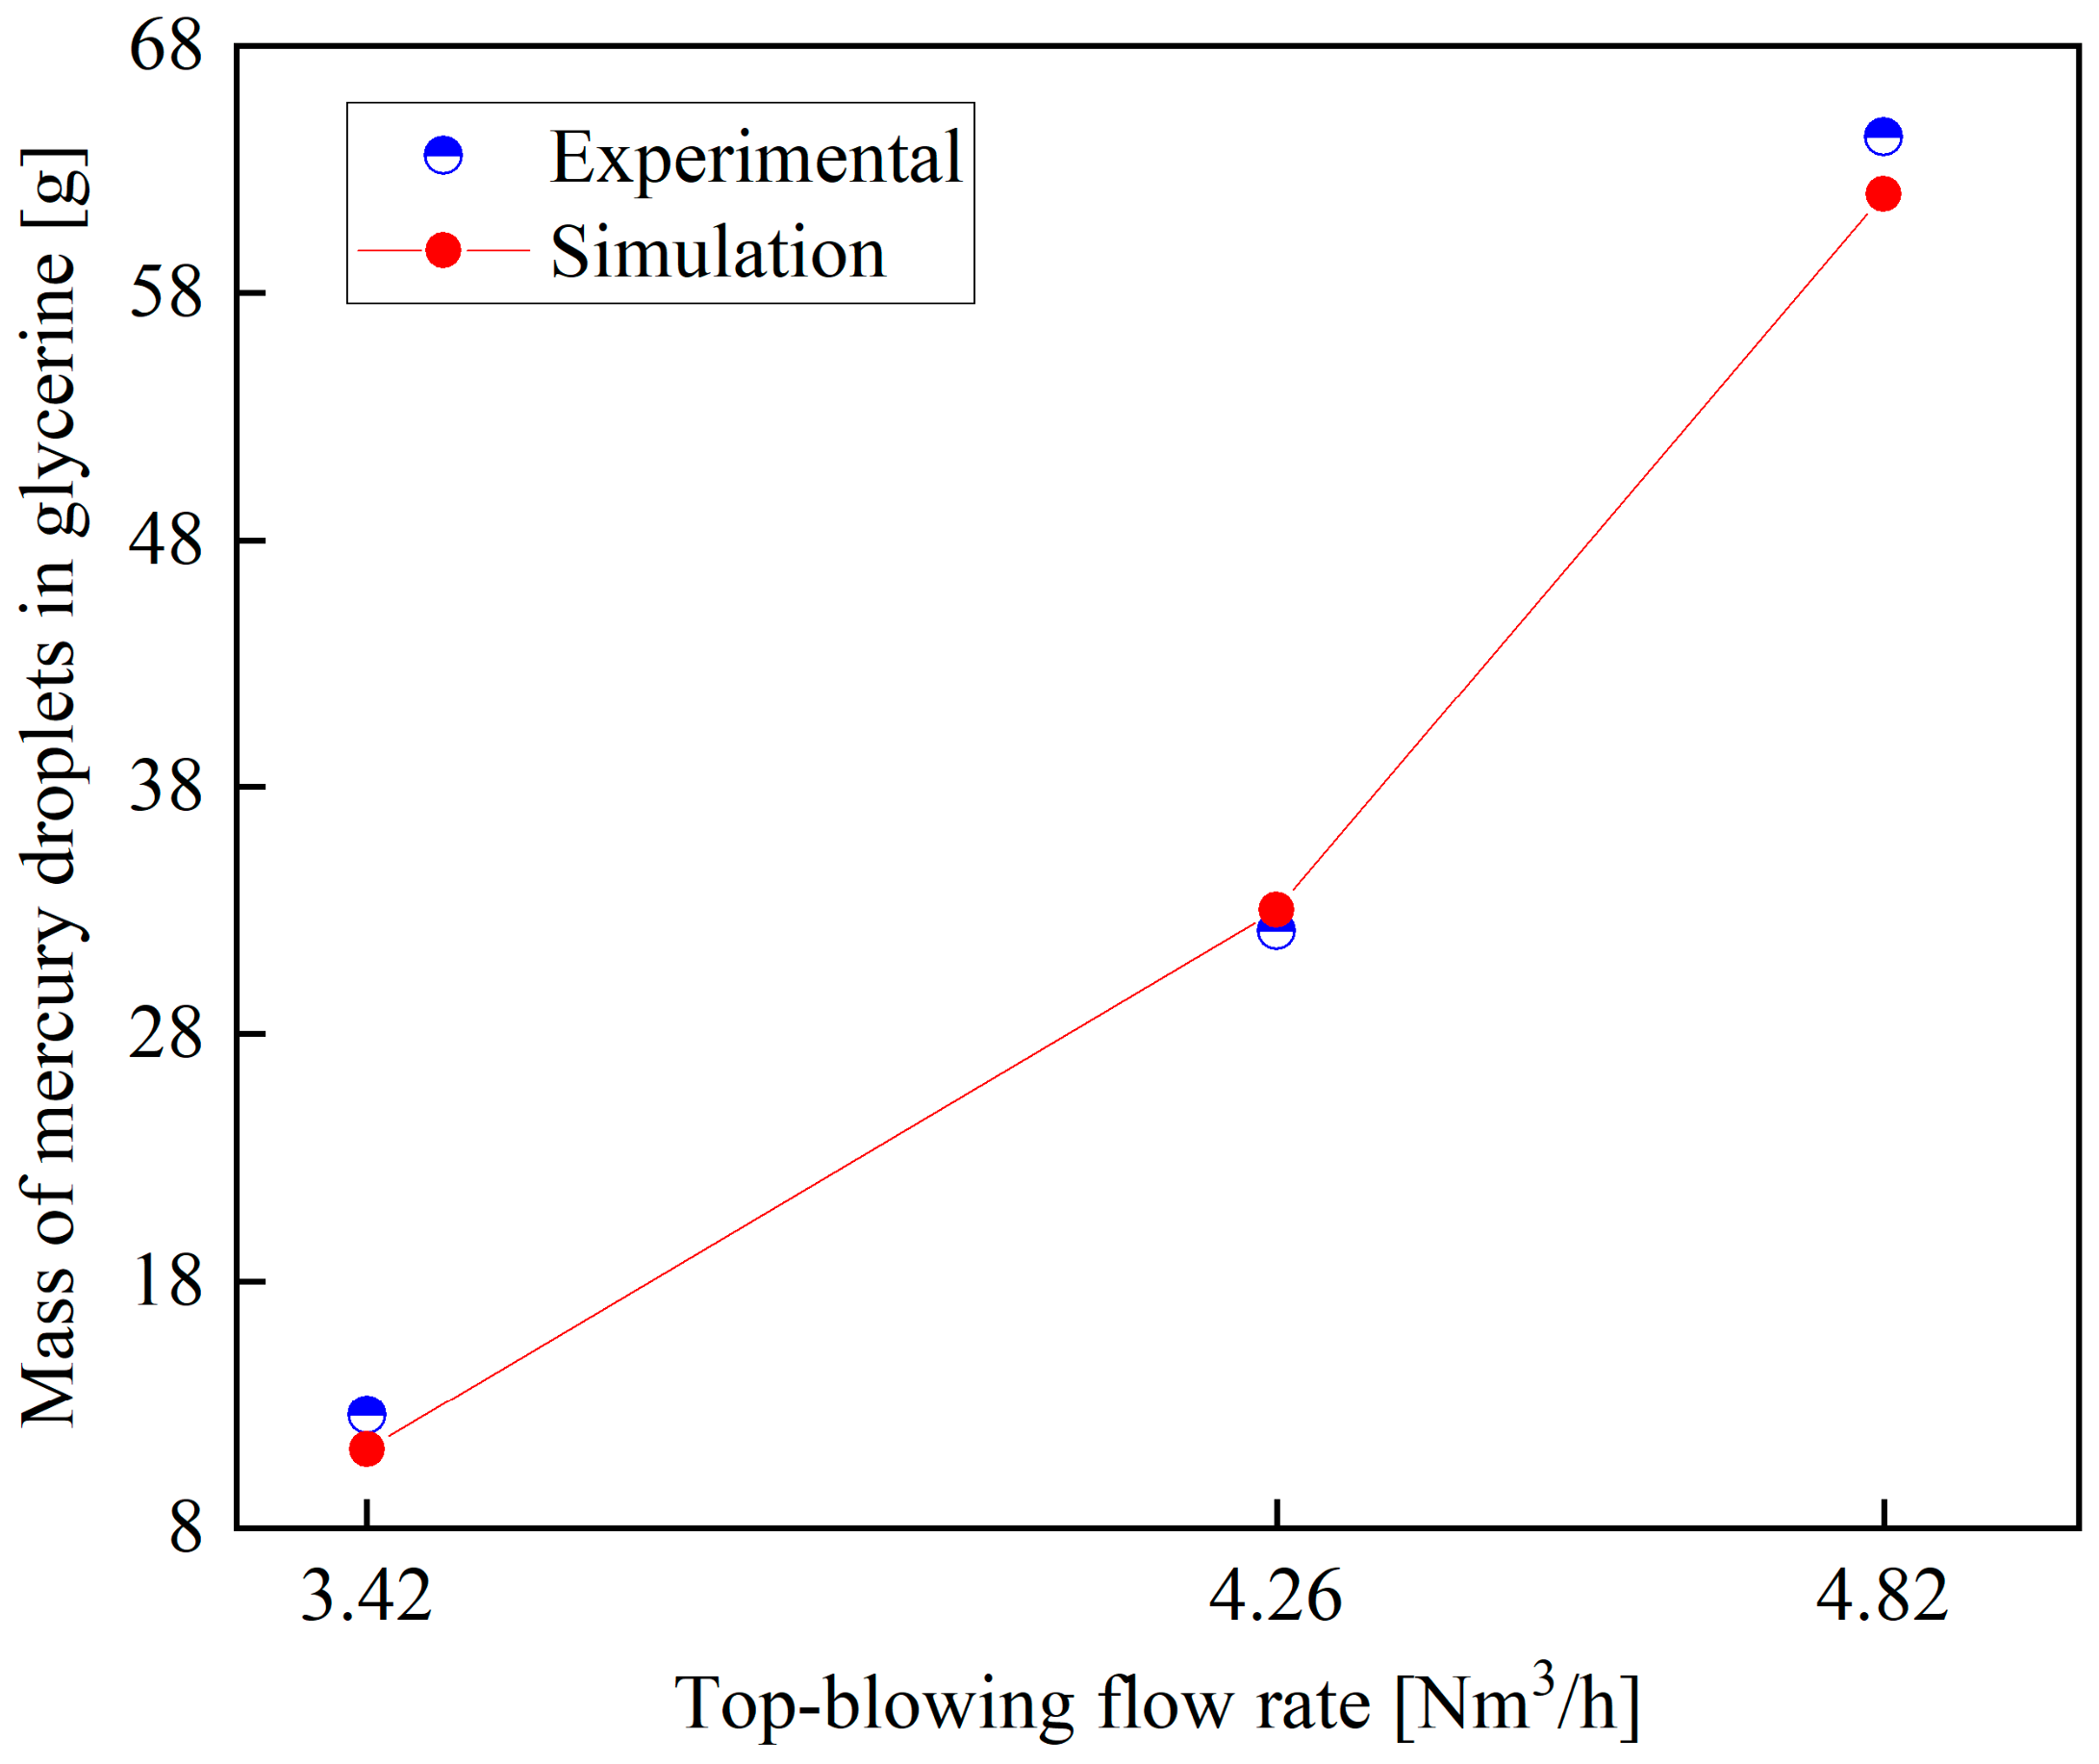
Splash mass constitutes the primary quantitative metric for characterizing splashing dynamics in both contemporary experimental investigations and numerical simulations [6,10,14]. Accordingly, the reliability of the proposed bidirectional VOF-DPM coupling framework was comprehensively benchmarked against the experimental data reported by He [21]. This experimental dataset was selected for validation due to its complete documentation of boundary conditions and the use of mercury, which closely mimics the high-density characteristics of industrial molten steel. Specifically, the experimental setup consisted of a three-dimensional Plexiglas container with internal dimensions of 195 mm × 270 mm, which housed a 75-mm-deep mercury bath overlaid with a 25-mm-thick glycerol layer to replicate the steel–slag two-phase interface. Nitrogen gas was injected through a top-mounted lance with a 2 mm nozzle diameter at controlled flow rates to generate intense splashing. Upon termination of gas injection, the separation behavior and distribution characteristics of mercury droplets dispersed within the glycerol phase were measured to establish the validation dataset.
For the numerical validation, a computational domain identical in geometry to the experimental apparatus was constructed. In all validation cases, the lance height was fixed at 50 mm, while the top-blowing gas flow rate was differed systematically to investigate its influence on the total splashing mass. Figure 9 presents the comparison between the numerical predictions obtained in this study and the corresponding experimental measurements. The results show excellent agreement across the entire range of flow rates investigated for the stationary lance configuration, which confirms the predictive accuracy and reliability of the developed numerical model.
Figure 9.
Mass of mercury droplets in glycerol at different top-blowing flow rates.
Nevertheless, the physical constraints of this validation framework must be explicitly addressed. Although the mercury-glycerol system effectively replicates the immense density disparities and multiphase momentum transport under ambient conditions, its capacity to represent the strong localized thermal gradients of a 50-ton industrial converter, as well as the reactive phase transitions at the slag–metal interface, is inherently limited. In an actual high-temperature operation, these thermal–chemical couplings can actively modulate localized fluid viscosities and transient interfacial properties. However, by isolating the pure fluid dynamics from these complex multi-physics interferences, this cold model validation serves as a necessary and robust baseline step, establishing uncorrupted proof of the model’s accuracy in capturing macroscale physical splashing trajectories.
3.3. Liquid Film Properties During Slag-Splashing Furnace Protection
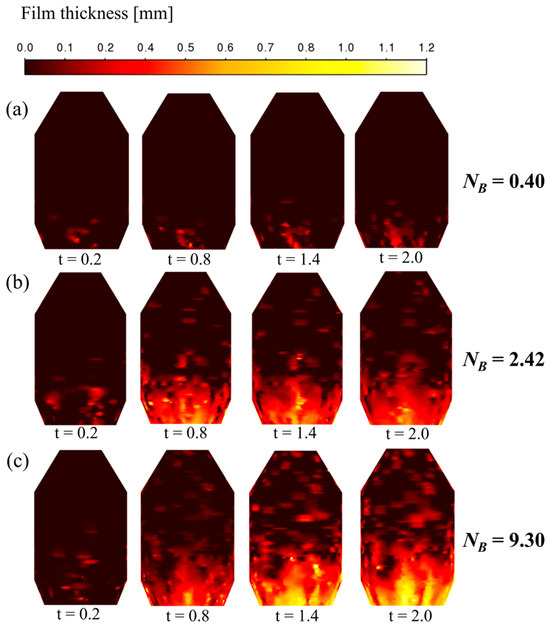
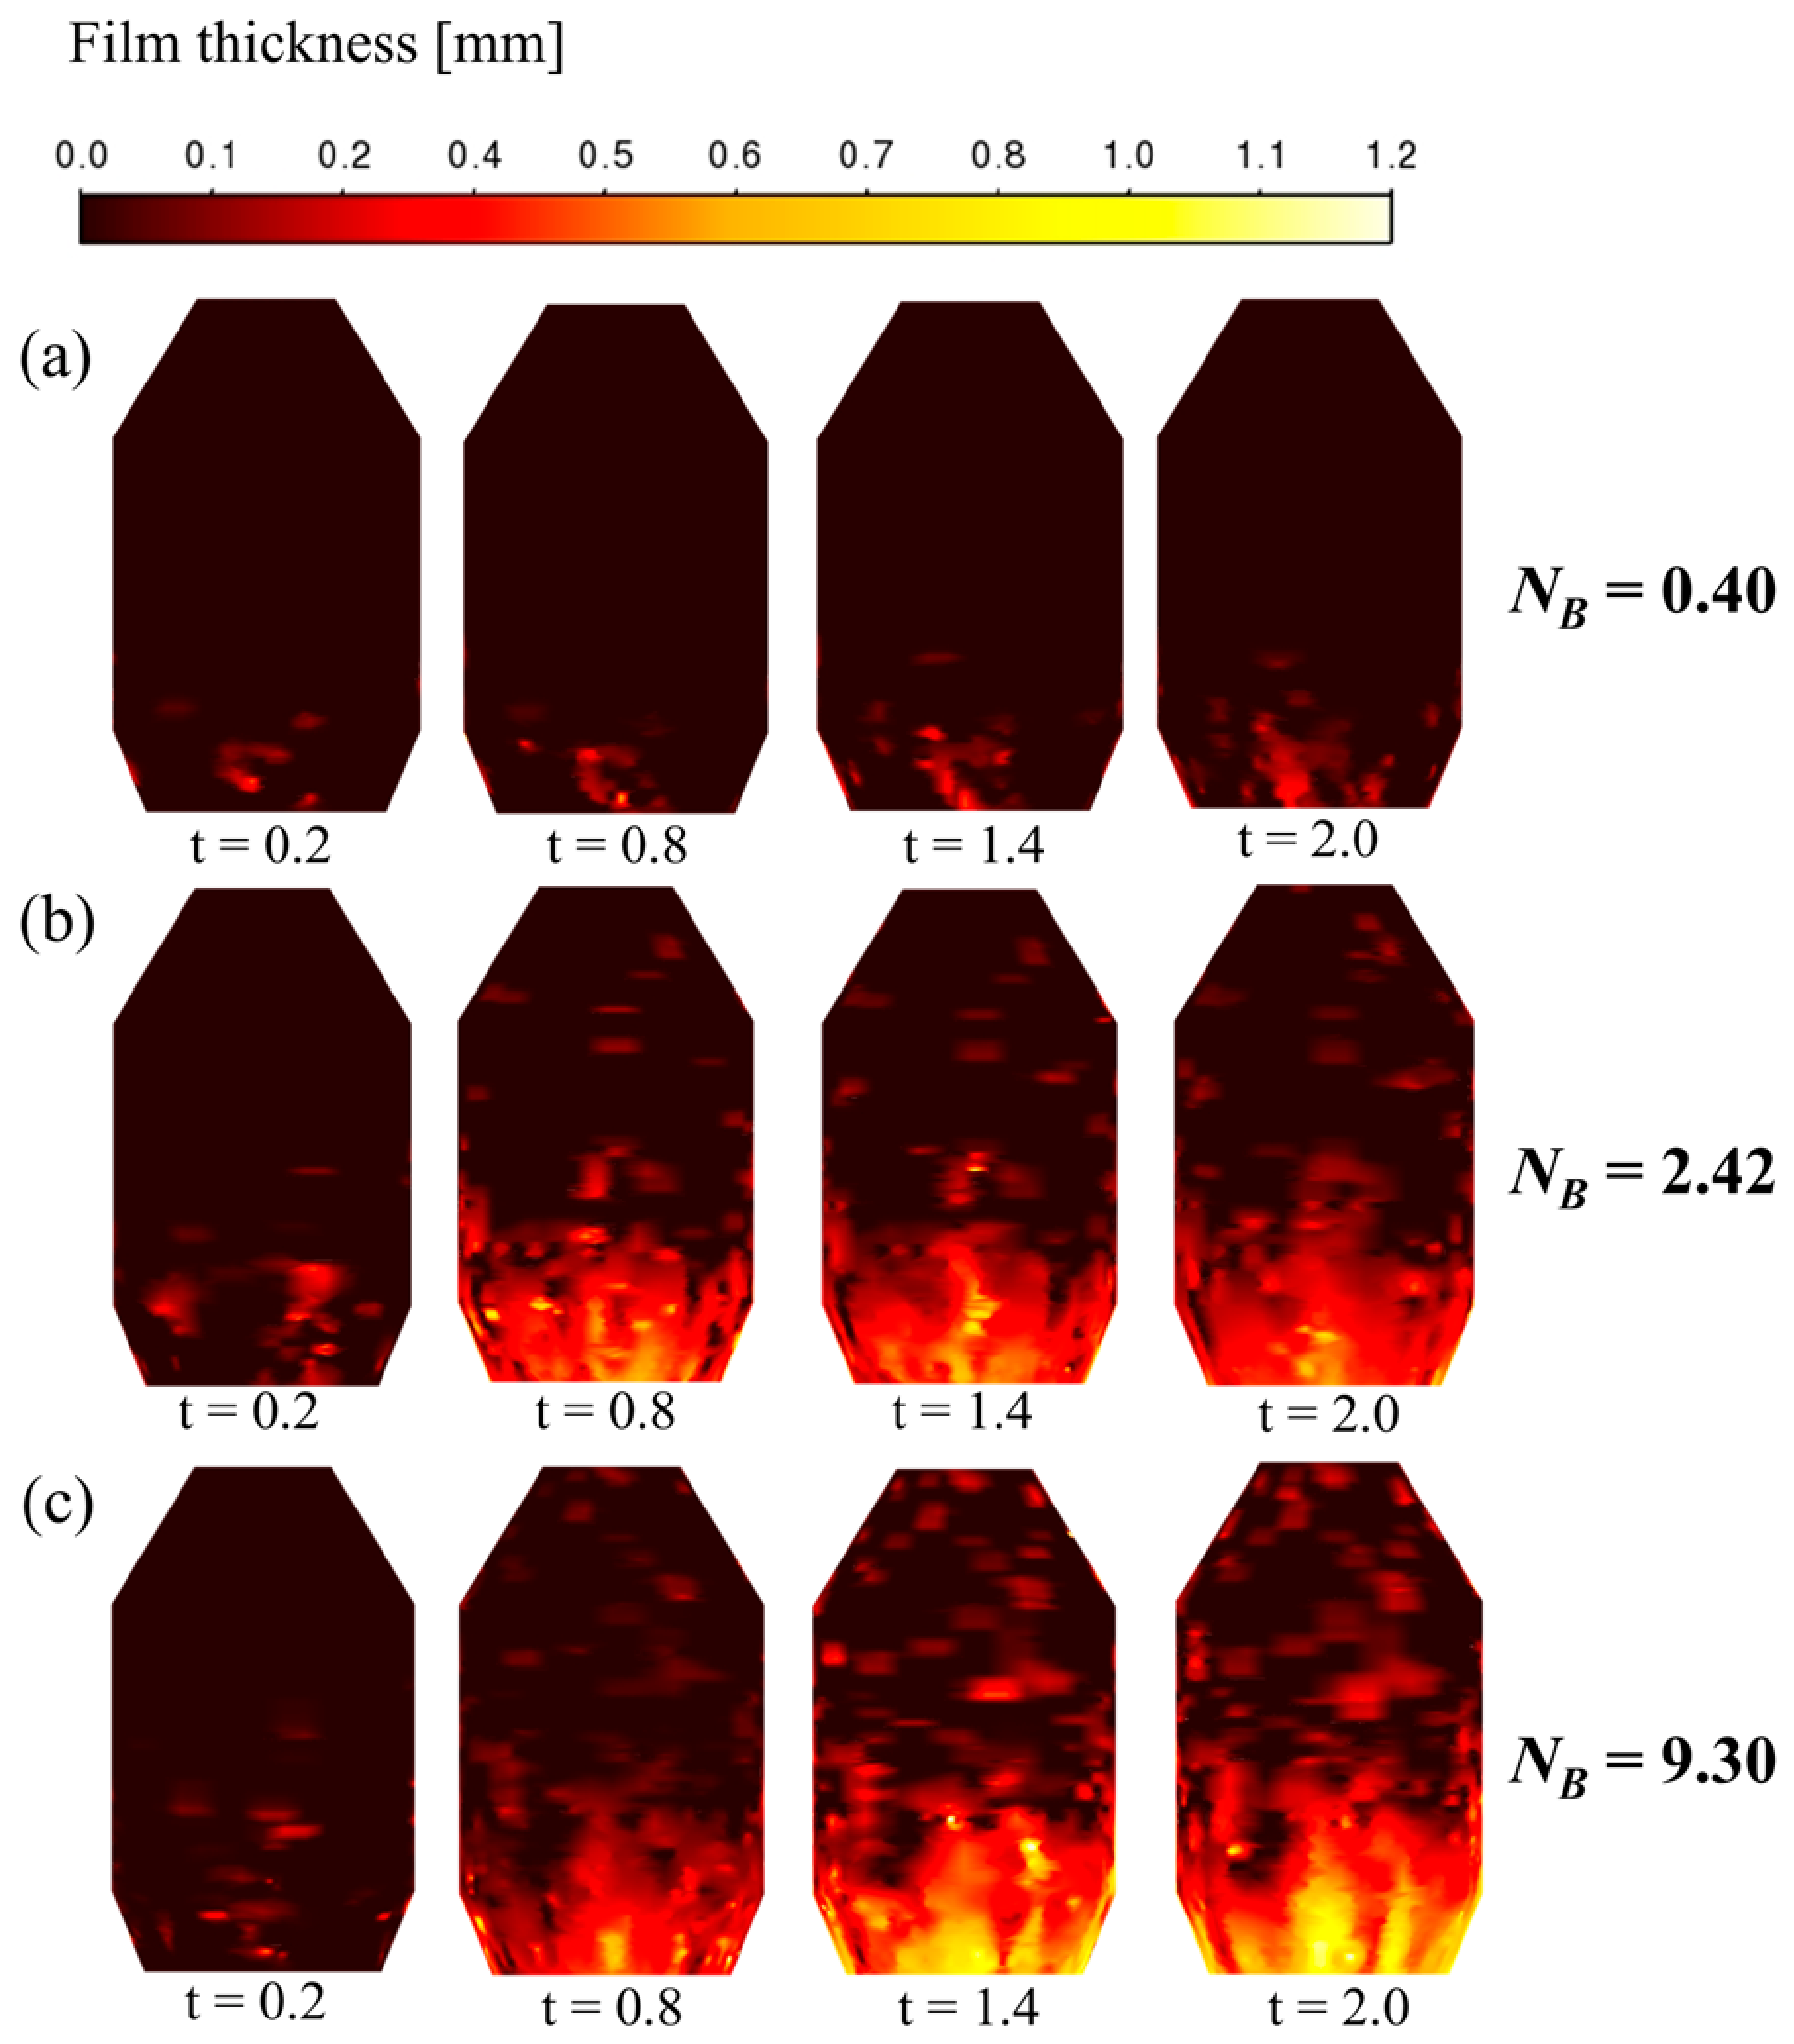
Figure 10 depicts the temporal evolution of splashing-induced slag liquid film on the converter inner wall over 0.2 s to 2.0 s at a fixed low lance height of 200 mm, with three operating conditions corresponding to NB of 0.40, 2.42, and 9.30 at top-blowing flow rates of 6.35, 8.91, and 11.76 Nm3/h, respectively. Overall, the coverage range and thickness of the wall liquid film increase significantly with the extension of splashing time and the rise in NB. At NB = 0.40, the low-momentum jet only generates weak splashing; almost no liquid film is observed at t = 0.2 s, and the film is confined to the furnace bottom with a thickness below 0.2 mm even at t = 2.0 s, failing to form effective protective coverage on the sidewall. At NB = 2.42, the enhanced jet momentum drives droplets to spread to the middle-lower wall, forming a 0.4–0.8-mm-thick uniform liquid film at t = 2.0 s. At the maximum NB = 9.30 with the highest top-blowing flow rate, the low lance height and large flow rate endow the jet with strong axial momentum, which greatly intensifies the splashing intensity; the liquid film rapidly expands upward with time, and fully covers the middle-upper area of the furnace wall at t = 2.0 s with a sufficient thickness of 0.8–1.2 mm, achieving the widest coverage and the most complete protective effect. These results confirm that increasing the top-blowing flow rate at a low lance height can effectively improve the axial momentum of splashing droplets, expand the liquid film coverage, and obtain the optimal slag splashing protection effect.
Figure 10.
Liquid film formation on the converter inner wall by splashing droplets under different top-blowing flow rates at various splashing times: (a) 6.35 Nm3/h; (b) 8.91 Nm3/h; (c) 11.76 Nm3/h.
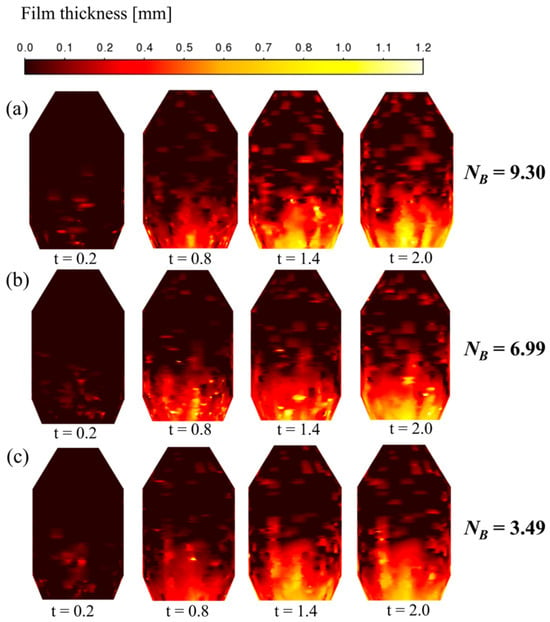
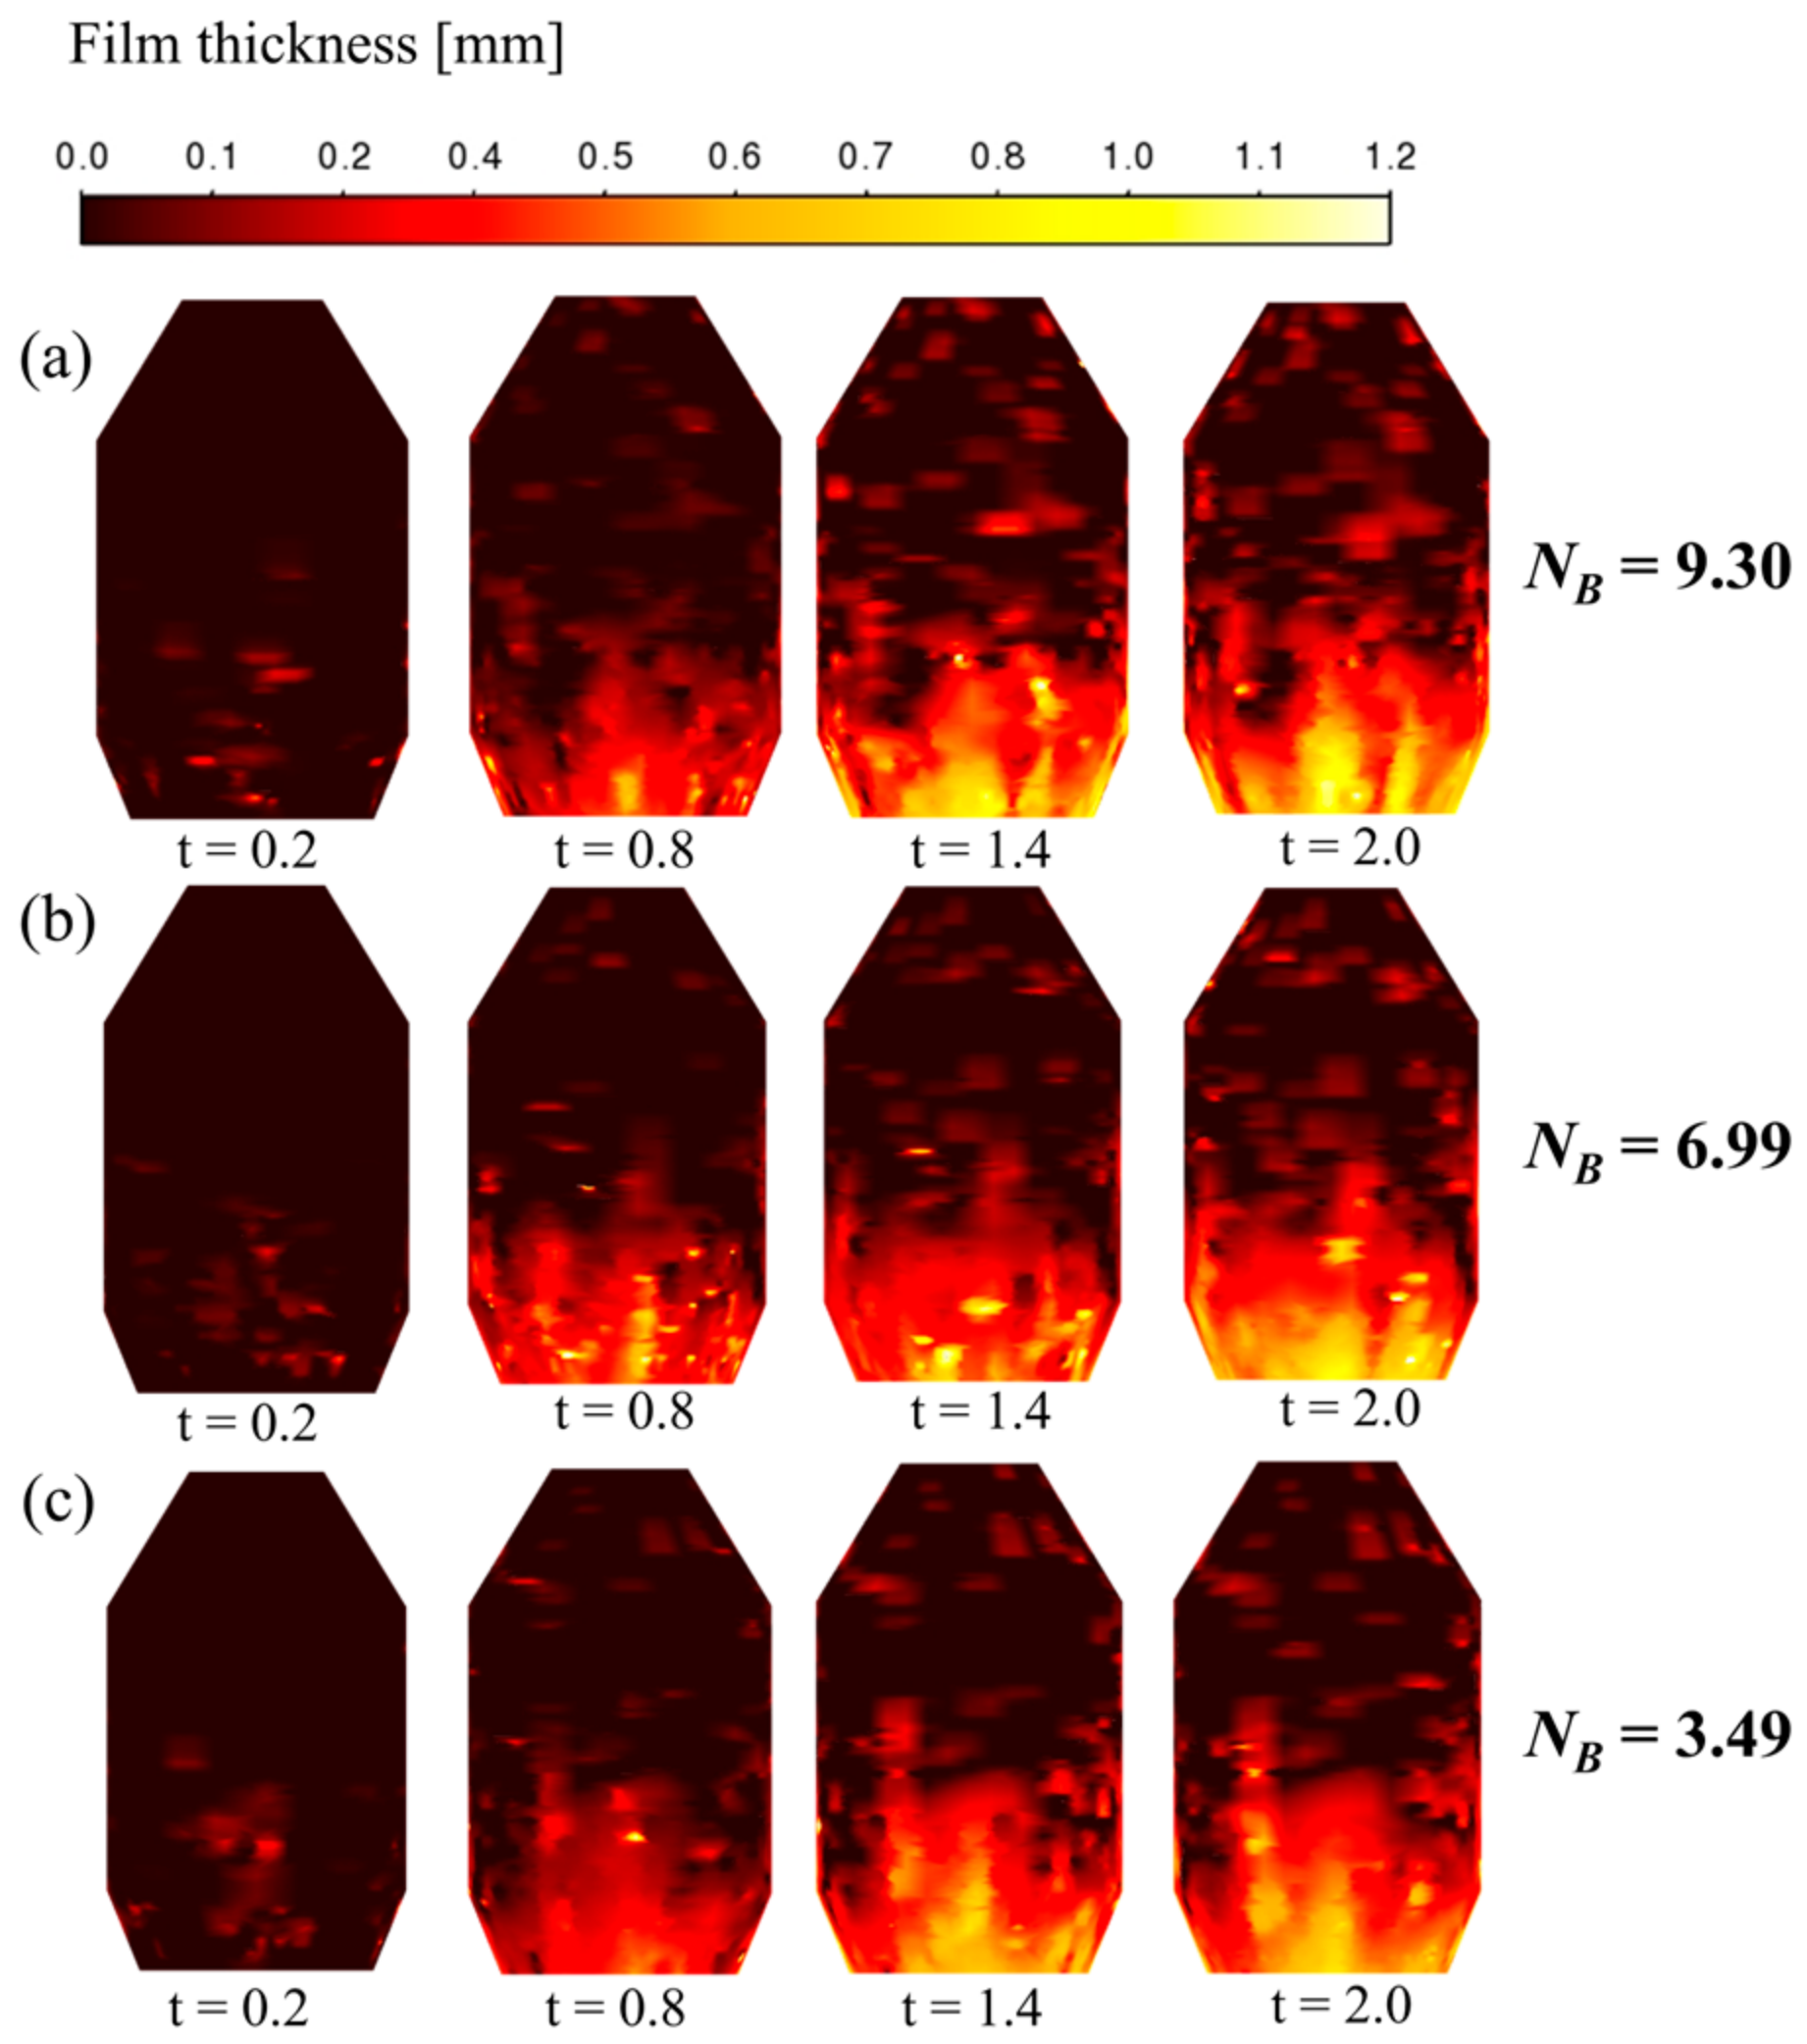
Figure 11 illustrates the temporal evolution of splashing-induced slag liquid film on the converter inner wall over 0.2 s to 2.0 s at a fixed top-blowing flow rate of 11.76 Nm3/h, with three lance heights of 200 mm, 220 mm, and 240 mm corresponding to NB values of 9.30, 6.99, and 3.49, respectively. Overall, as the lance height decreases, the NB rises significantly, and the liquid film coverage range and overall thickness increase continuously with extended splashing time, while the spatial distribution is regulated by the axial and radial momentum of splashing droplets. At the lowest lance height of 200 mm with the highest NB = 9.30, the jet impinges on the molten bath with strong axial momentum, driving droplets to splash upward along the axial direction; the liquid film rapidly expands upward with time, and fully covers the upper area of the furnace wall at t = 2.0 s with a maximum thickness of 1.0–1.2 mm, achieving the widest full-wall coverage. At the medium lance height of 220 mm and NB = 6.99, the jet momentum shifts to the radial direction, so splashed droplets are mainly concentrated in the middle section of the furnace wall, forming a uniform 0.6–1.0-mm-thick liquid film in the middle area at t = 2.0 s. At the highest lance height of 240 mm with the lowest NB = 3.49, jet momentum attenuates significantly after long-distance transmission, resulting in the weakest splashing intensity, with the liquid film confined to the middle-lower wall and the smallest coverage, even at t = 2.0 s. These results confirm that reducing lance height effectively enhances the axial momentum of droplets to expand upper wall coverage, which is conducive to achieving full-range slag splashing protection for the converter lining.
Figure 11.
Liquid film formation on the converter inner wall by splashing droplets under different lance heights at various splashing times: (a) 200 mm; (b) 220 mm; (c) 240 mm.
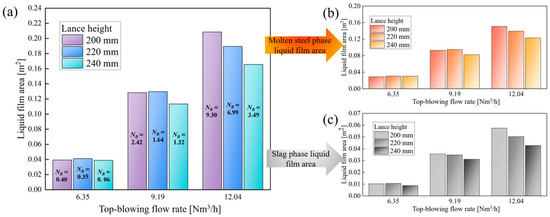
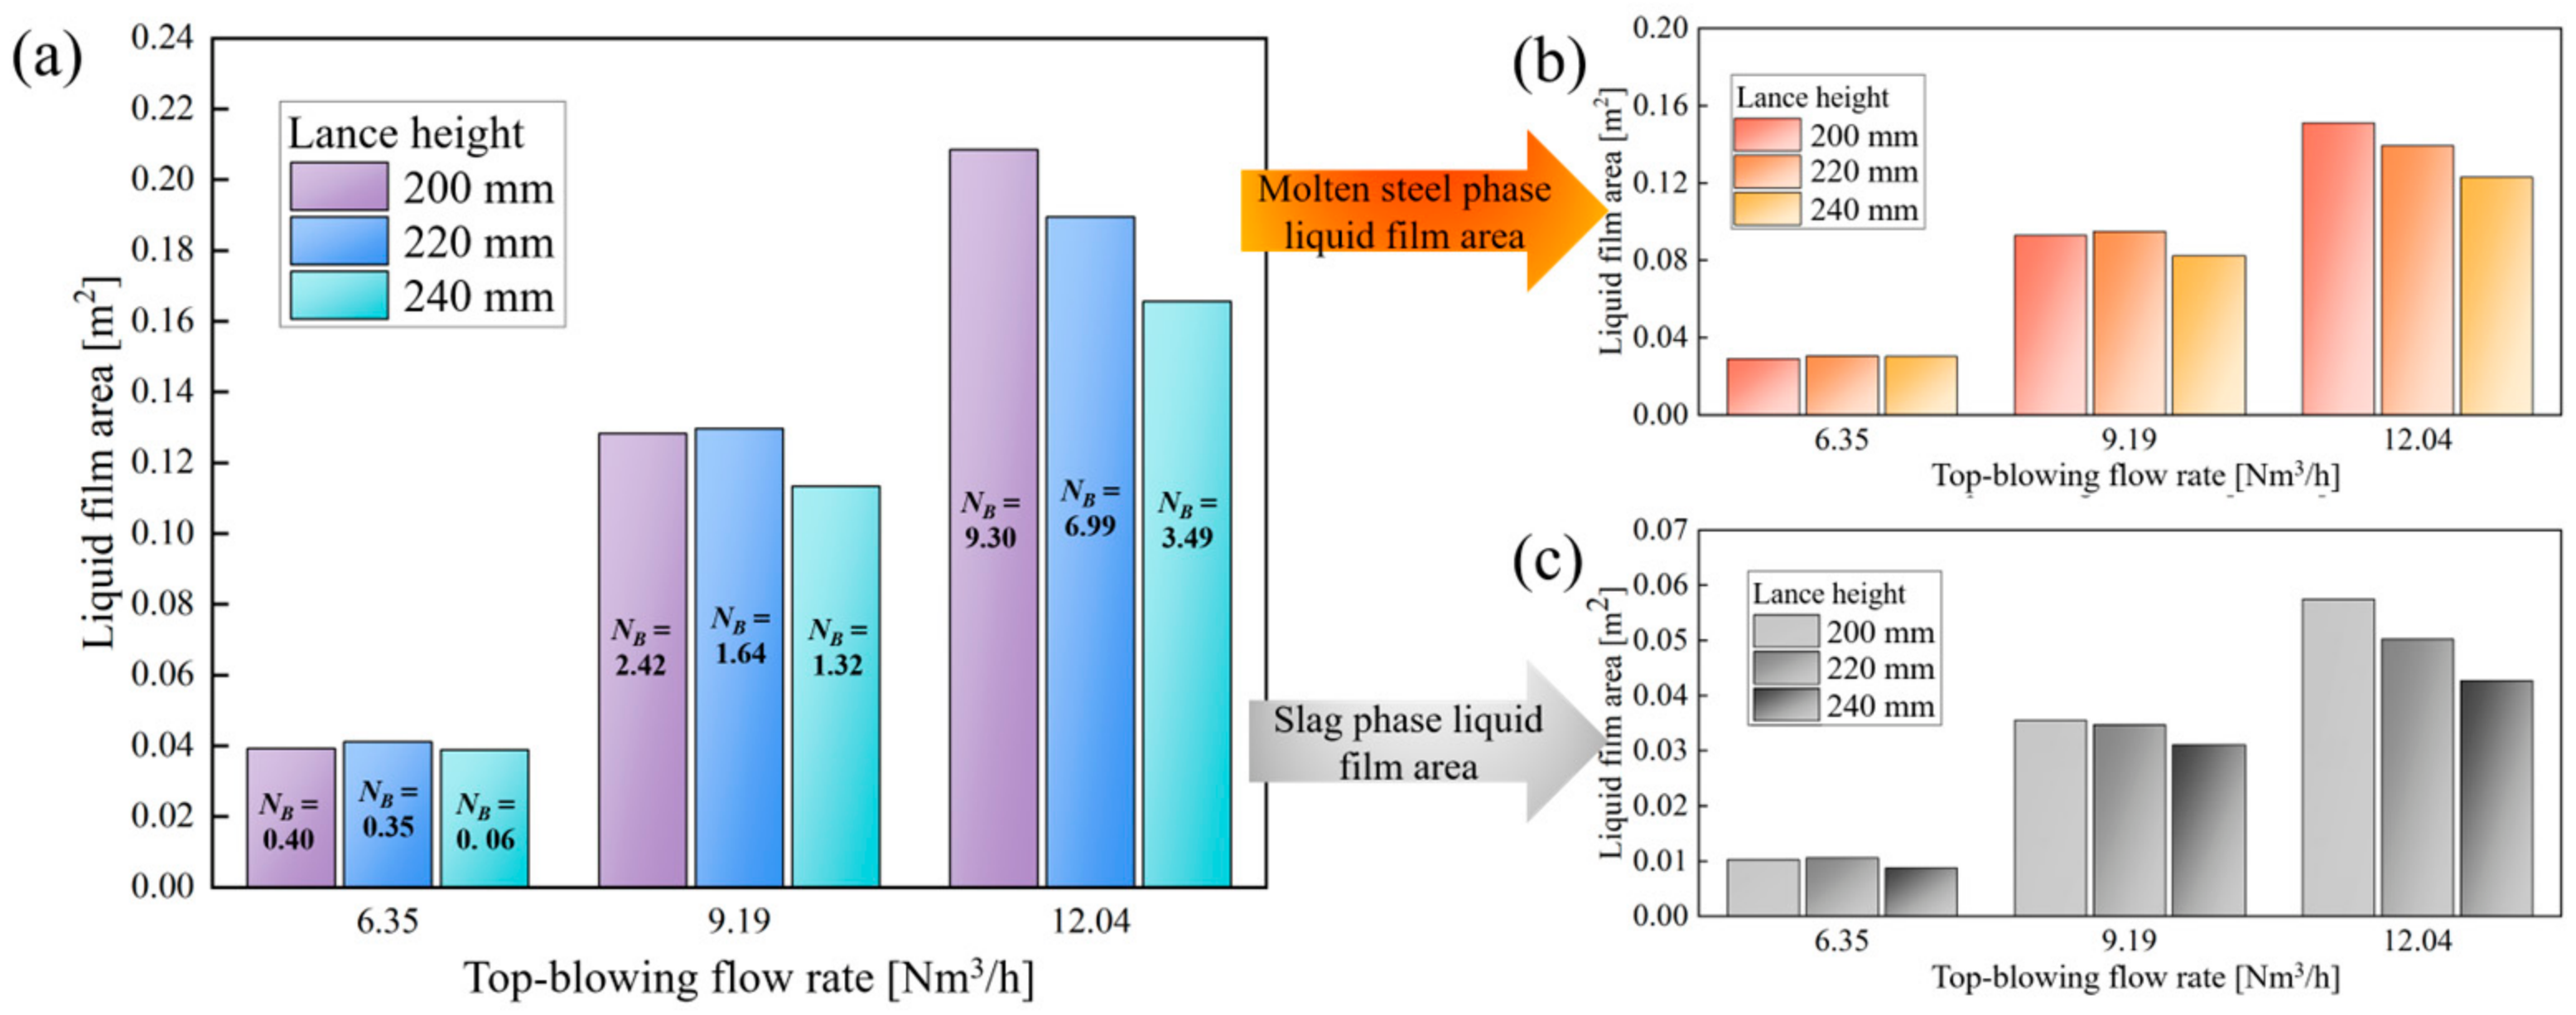
Figure 12 presents the total wall liquid film area as well as the separate areas of the molten steel phase and slag phase under different top-blowing flow rates and lance heights, with the corresponding NB marked for each operating condition to quantitatively reveal the correlation between dimensionless splashing intensity and wall film formation. The area of the wall-attached liquid film directly reflects the overall splashing intensity and the phase distribution of droplets deposited on the furnace wall, which is the core index evaluating the effectiveness of slag splashing protection for the converter lining. At the low top-blowing flow rate of 6.35 Nm3/h, the NB values of all three lance heights are extremely low (0.40, 0.35, and 0.06, respectively), resulting in very limited splashing intensity; correspondingly, the total liquid film area, molten steel film area, and slag film area all remain below 0.05 m2, and the influence of lance height on film formation is negligible, as the variation in NB caused by lance height adjustment is insufficient to change the overall weak splashing state. As the flow rate increases to 8.91 Nm3/h, the NB values rise to 2.42, 1.64, and 1.32, respectively, entering the stable splashing interval, and all liquid film areas increase by 2–3 times compared with the low flow rate condition; the total liquid film area reaches its peak at a lance height of 220 mm with NB = 1.64, as the moderate NB under this condition endows droplets with balanced radial momentum, achieving the most uniform coverage on the middle section of the furnace wall. At the high flow rate of 11.76 Nm3/h, the NB further increases to 9.30, 6.99, and 3.49, and all liquid film areas reach their maximum values; the total liquid film area increases monotonically with the rise in NB, peaking at 0.208 m2 at 200 mm lance height with the highest NB = 9.30, since the enhanced axial momentum of droplets under a high NB enables droplets to splash to the upper furnace wall, realizing full-range coverage of the lining. Across all operating conditions, the molten steel liquid film always dominates the total area, which is consistent with the higher generation rate of molten steel droplets during the splashing process.
Figure 12.
Liquid film area under different lance heights and top-blowing flow rates (a) total liquid film area (b) slag phase area (c) molten steel phase area.
3.4. Impact Cavity Geometry and Splashing Spatial Features
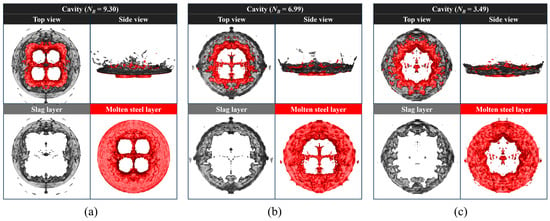
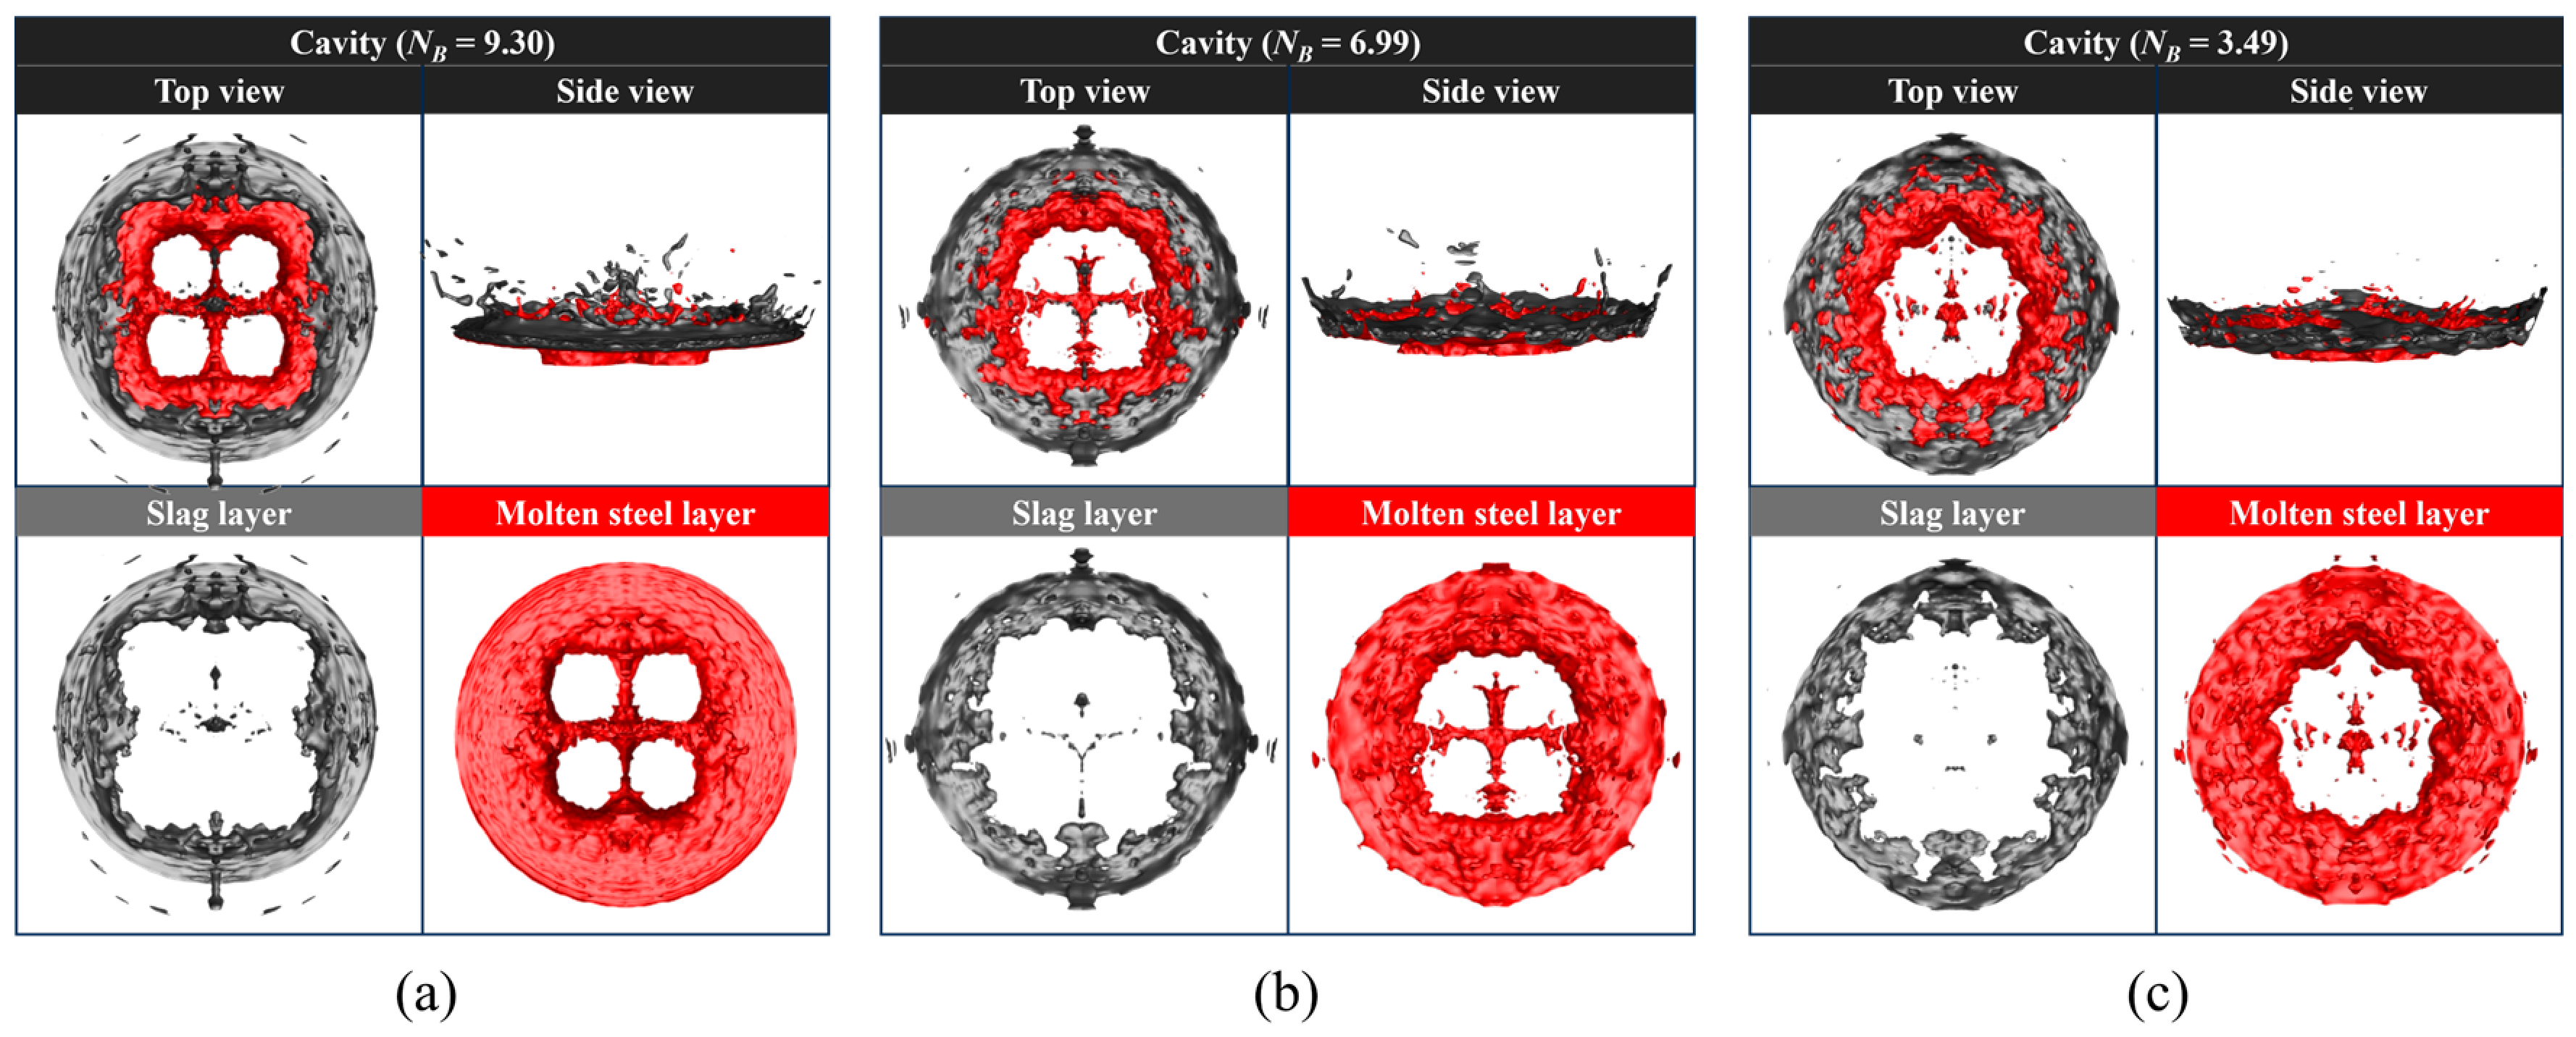
Figure 13 presents the geometric morphology of slag–steel interfacial impact cavities under three NB values of 9.30, 6.99, and 3.49, which correspond to lance heights of 200 mm, 220 mm, and 240 mm at a fixed top-blowing flow rate of 11.76 Nm3/h, where black and red contours separately denote the slag layer and molten steel layer. Variation in NB directly alters jet momentum distribution between axial and radial directions, resulting in obvious discrepancies in cavity geometry and phase disturbance. At the maximum NB of 9.30 and lance height of 200 mm, the high NB corresponds to intensive axial jet momentum, which penetrates deeply into the molten bath and severely fractures the surrounding slag layer with substantial slag entrainment; the underlying molten steel forms a regular four-lobed cavity profile constrained by concentrated axial impact, driving directional droplet ejection along cavity boundaries. As the NB decreases to 6.99 at a lance height of 220 mm, jet energy shifts toward the radial direction, producing a wider and shallower impact cavity; the slag layer is disturbed over a broader interfacial area with intensified slag–steel mixing, and molten steel evolves into an irregular cross-shaped configuration due to enhanced lateral spreading. When the NB falls to 3.49 at a lance height of 240 mm, insufficient jet momentum leads to a shallow, scattered cavity, the slag layer remains largely intact with marginal entrainment, and the molten steel cavity becomes fragmented and diffuse alongside suppressed splashing intensity. With the gradual reduction in NB induced by rising lance height, jet kinetic energy progressively transfers from concentrated axial impact to dispersed radial diffusion, continuously reducing the penetration depth of the jet into the molten bath while expanding the lateral disturbance range of the slag–steel interface.
Figure 13.
Geometric morphology of impact cavity under different lance heights: (a) 200 mm; (b) 220 mm; (c) 240 mm.
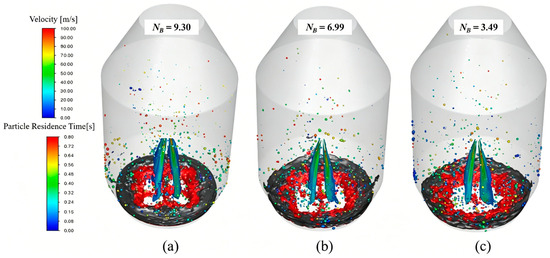
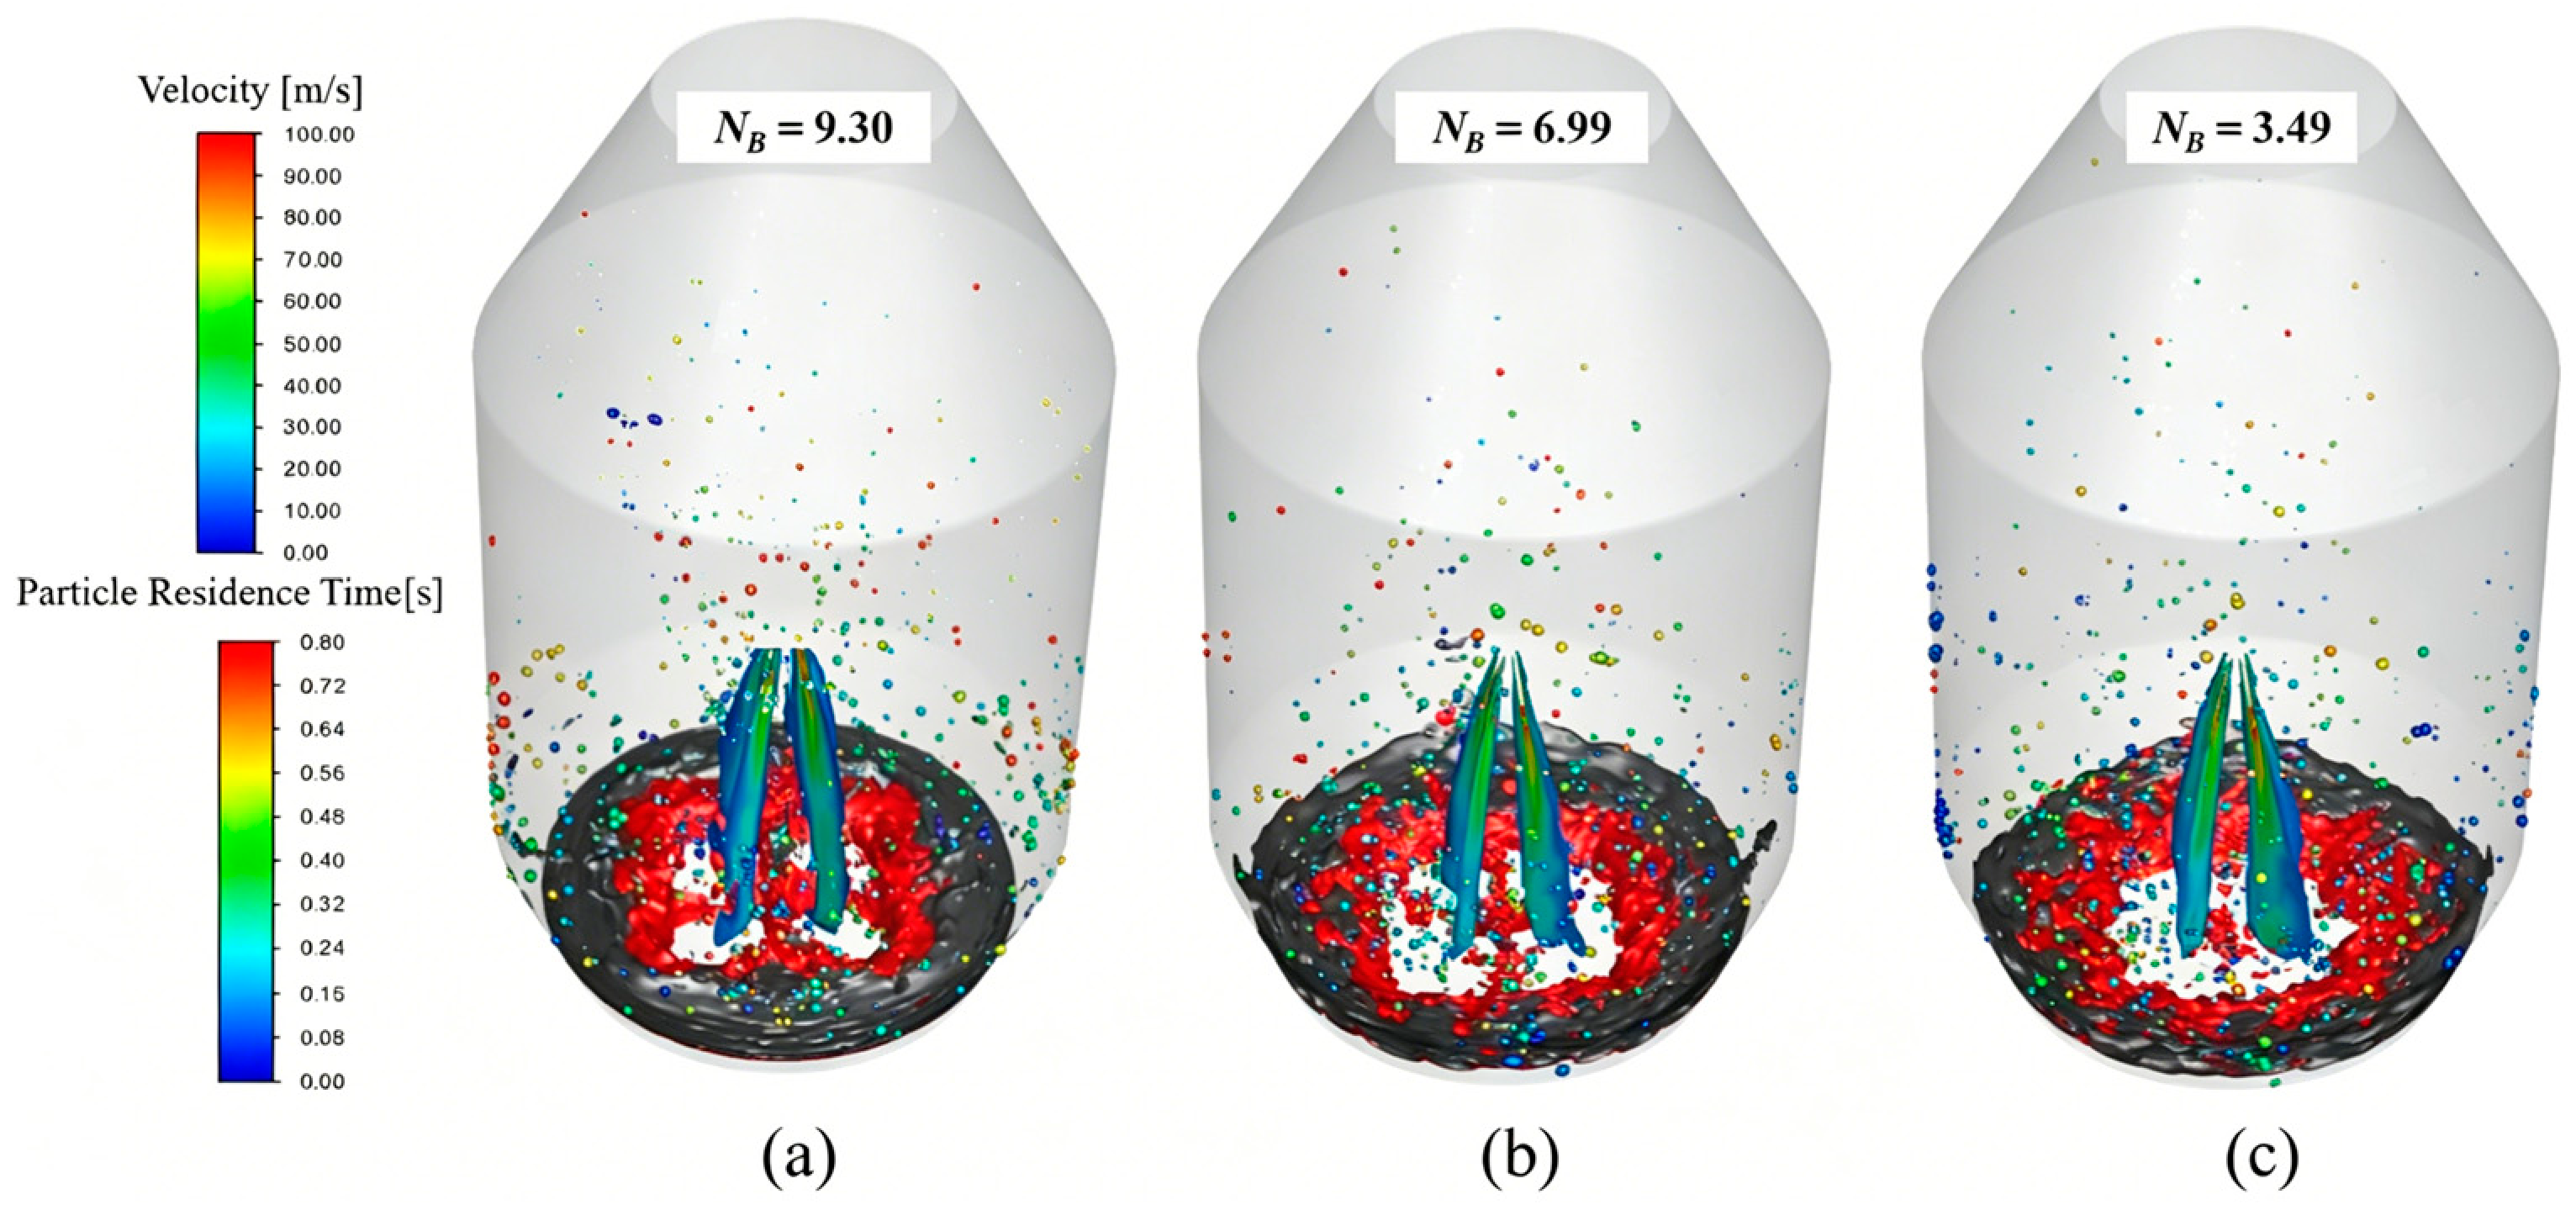
Figure 14 illustrates the spatial distribution of the top-blowing jet and splashed droplets inside the converter, together reflecting overall jet velocity and residence time trend features under three NB values of 9.30, 6.99, and 3.49 at a fixed top-blowing flow rate of 11.76 Nm3/h. A variation in NB changes jet kinetic energy allocation between axial and radial directions and further controls the motion behavior of splashing droplets. At a NB value of 9.30, concentrated axial jet energy generates deep penetration into the slag–steel interface and severe slag entrainment; abundant high-speed droplets with long residence times are ejected upward to the upper furnace space, which is conducive to the formation of a complete protective liquid film on upper wall areas. As the NB drops to 6.99, jet kinetic energy gradually shifts toward the radial direction, the impact range on the molten bath expands, and the formed droplets mainly accumulate at the middle-lower region of the converter with moderate velocity and residence time. When the NB further decreases to 3.49, weakened overall jet momentum limits the disturbance of slag and molten steel: most generated droplets own low flow velocity and short residence time and can only splash near the furnace bottom. With the continuous reduction in NB, the dominant movement direction of splashed droplets shifts from vertical axial rising to horizontal radial diffusion, accompanied by a gradual decline in droplet average velocity and effective flying height inside the converter.
Figure 14.
Jet and droplet distribution under different lance heights: (a) 200 mm; (b) 220 mm; (c) 240 mm.
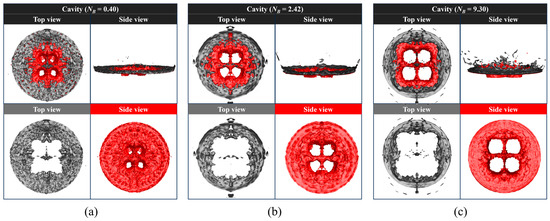
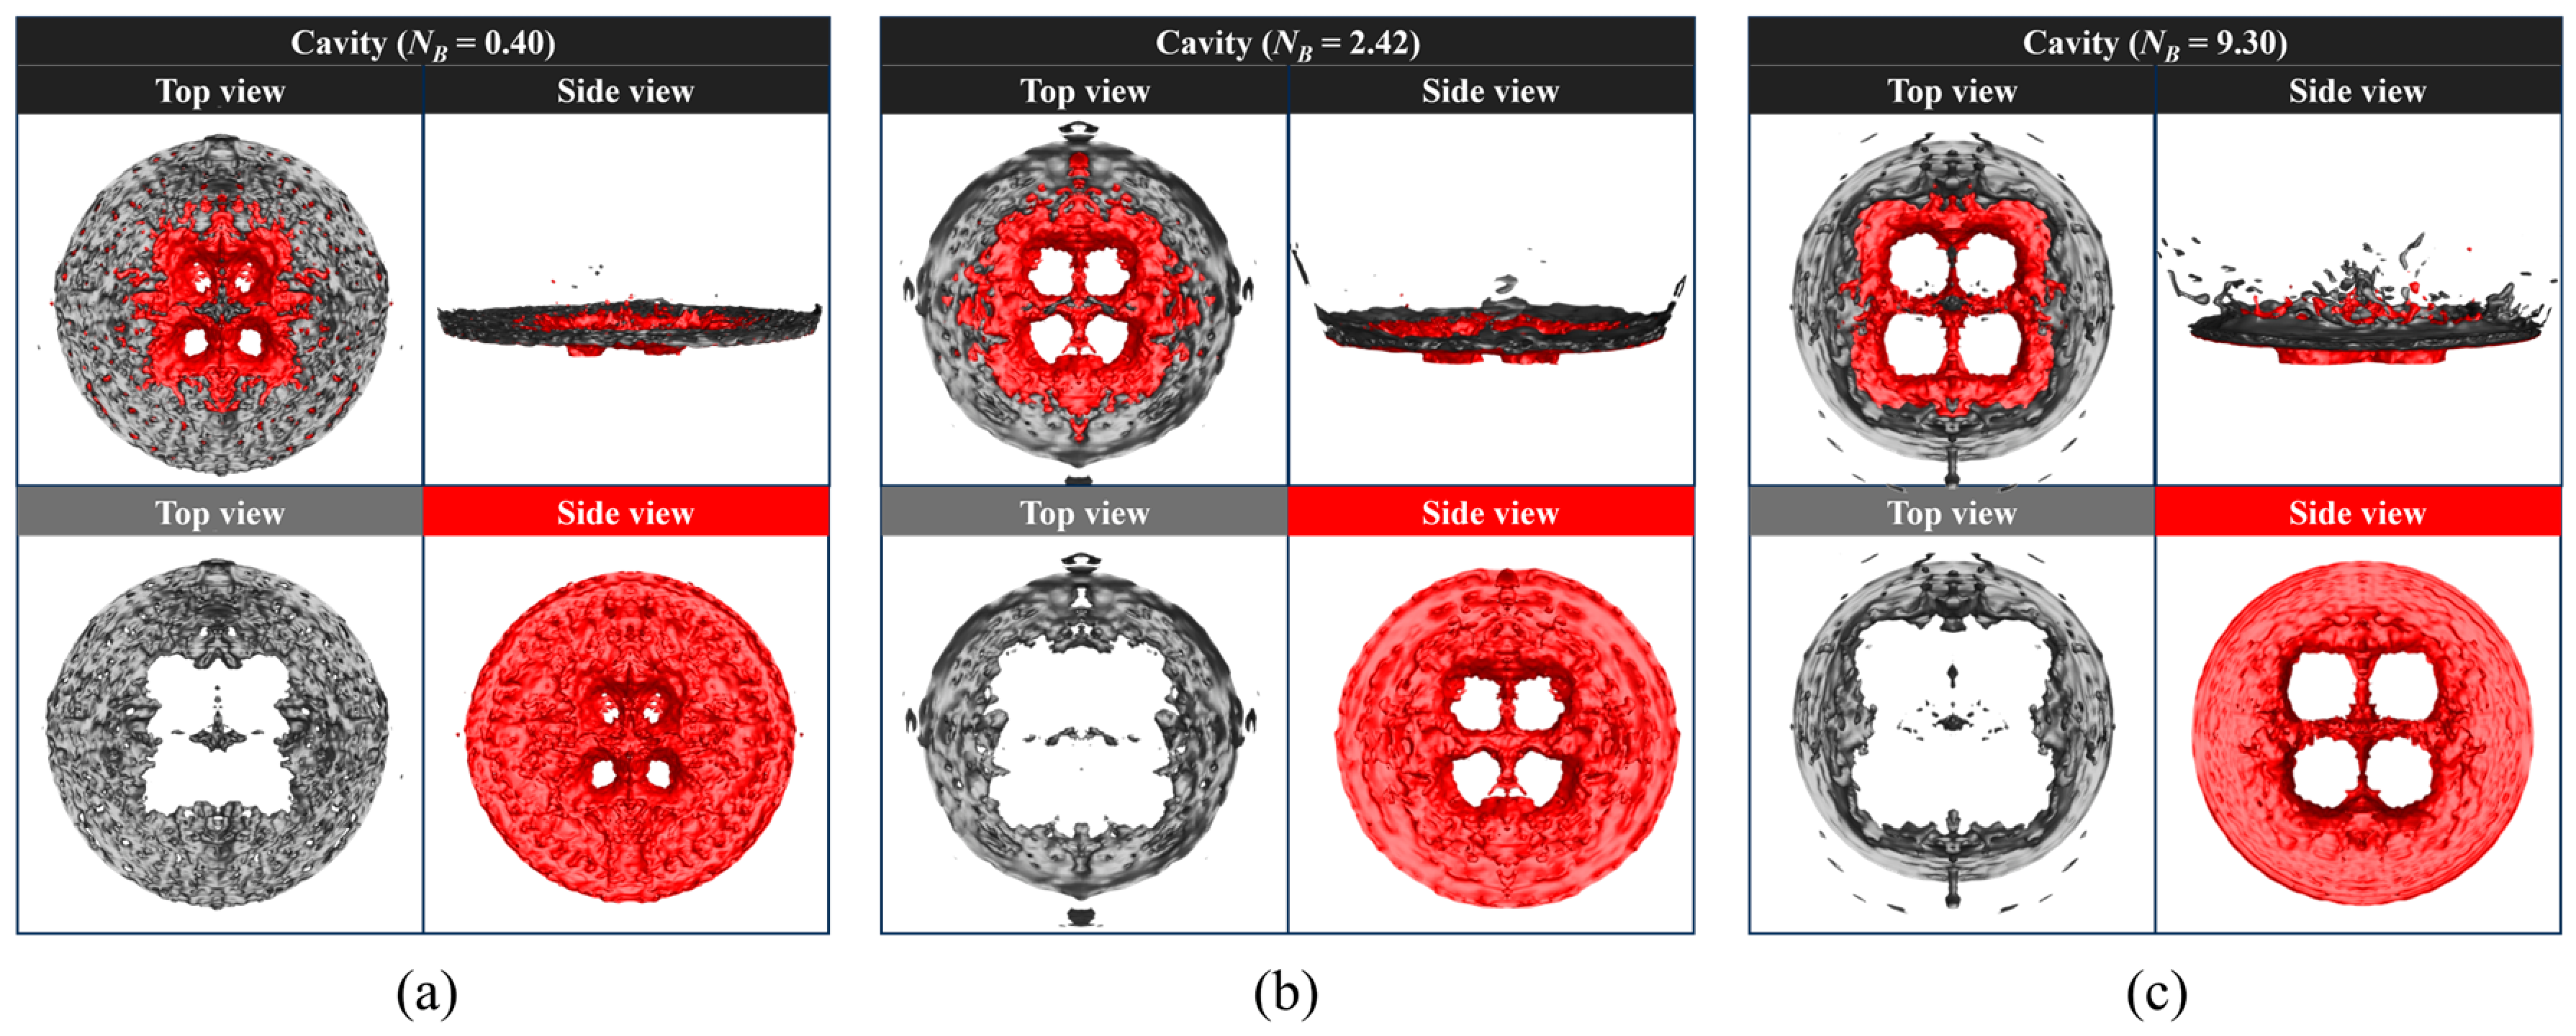
Figure 15 presents the geometric characteristics of slag–steel interfacial impact cavities obtained under three different top-blowing flow rates, which correspond to NB values of 0.40, 2.42, and 9.30, respectively. Distinct discrepancies in cavity penetration depth and inner contour structure can be clearly observed as the NB increases along with the rising top-blowing flow rate. At the minimum flow rate of NB = 0.40, limited jet energy leads to an extremely weak disturbance on the molten bath surface, and the resultant impact cavity is shallow in overall depth with a fragmented and irregular internal outline; the central hollow structure of molten steel appears scattered and incomplete, which restricts the stripping of bulk liquid from the bath surface and yields fewer splashing droplets. As the top-blowing flow rate increases to produce a NB of 2.42, enhanced jet impact deepens the penetration depth of the cavity effectively, the internal hollow structure gradually tends to be complete and regular, and the horizontal coverage range of the interfacial disturbance expands remarkably, facilitating the continuous separation of liquid droplets from the slag–steel layer and improving the total amount of splashed liquid. When flow rate reaches the maximum value and the NB rises to 9.30, the impact cavity develops the largest penetration depth and a complete four-lobed inner structure, and the disturbance range over the molten bath achieves the maximum level among all working conditions. The gradual improvement in cavity integrity and disturbance range following increased NB continuously promotes the generation efficiency of splashing droplets, which directly provides a sufficient liquid source for the formation and thickening of a protective liquid film adhering to the converter inner wall during the slag splashing process.
Figure 15.
Geometric morphology of impact cavity under different top-blowing flow rates: (a) 6.35 Nm3/h; (b) 8.91 Nm3/h; (c) 11.76 Nm3/h.
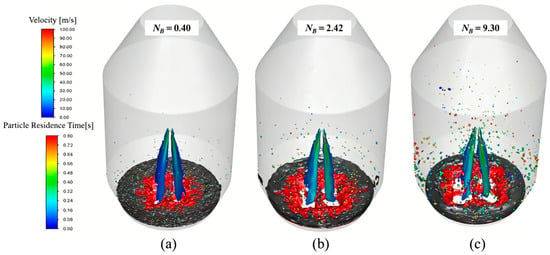
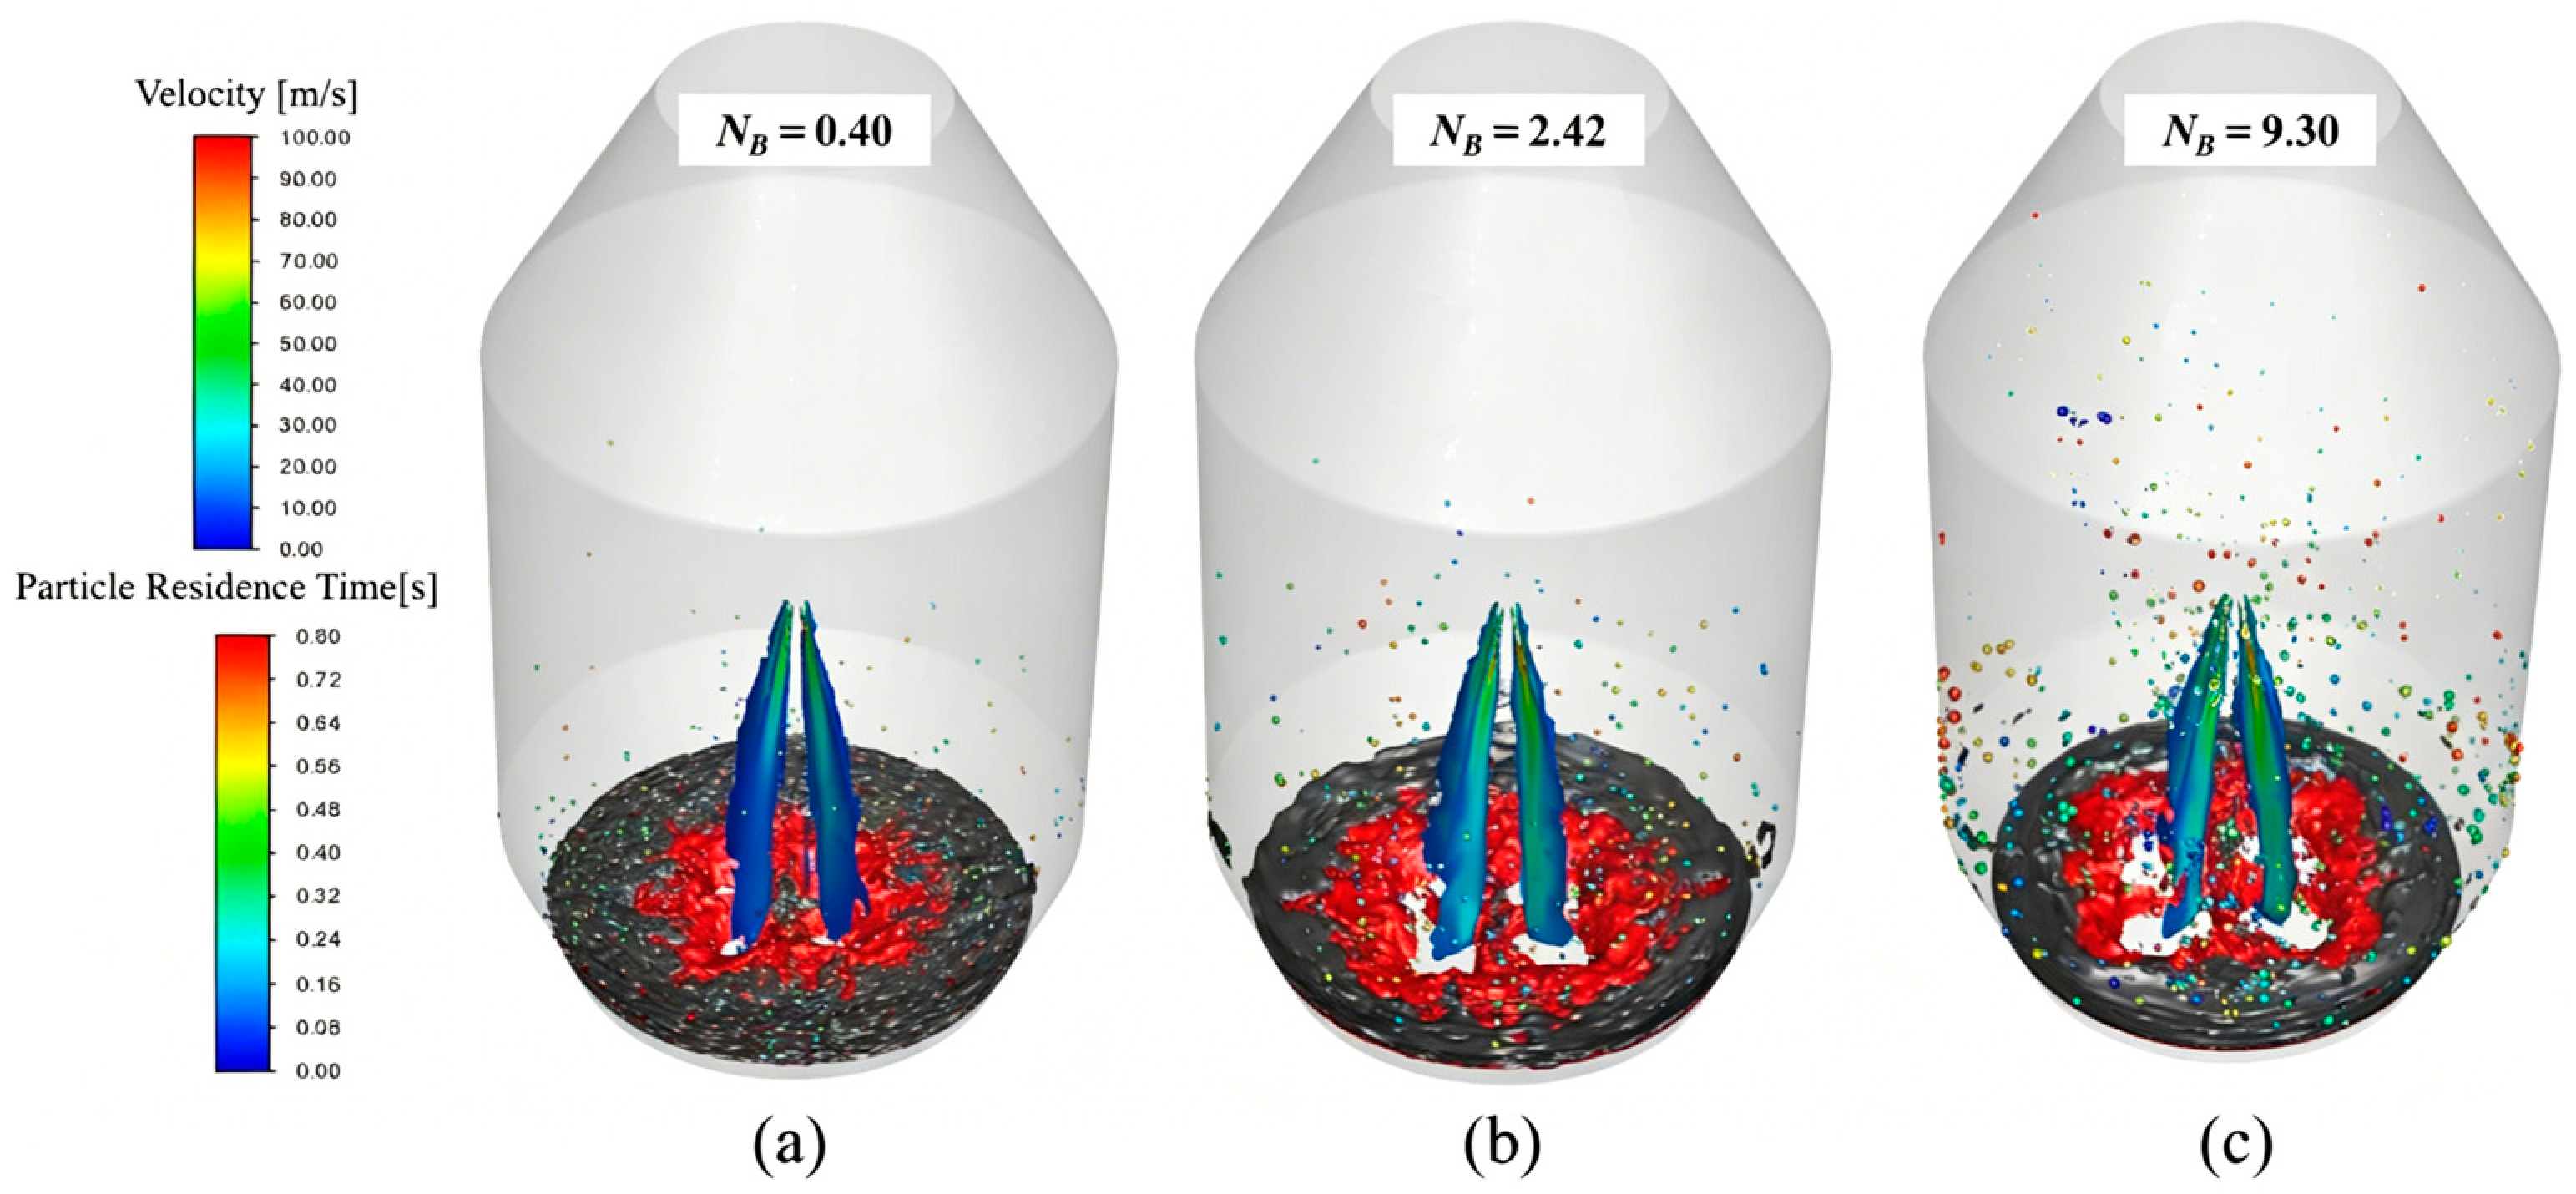
Figure 16 shows the spatial distribution of the top-blowing jet and splashing droplets inside the converter under three NB values of 0.40, 2.42, and 9.30 corresponding to different top-blowing flow rates, with jet velocity and residence time characterized by the side color bar. When the NB is controlled at 0.40 under the minimum blowing flow rate, the overall quantity of splashed droplets remains at a low level: most droplets only suspend in the narrow space directly above the molten bath, with relatively low movement velocity and short residence duration inside the furnace, and few droplets can migrate to the upper area of furnace wall. As the top-blowing flow rate rises to raise the NB up to 2.42, the total amount of generated droplets increases remarkably: droplets expand their distribution range toward the middle section of the converter, accompanied by moderate improvements in average velocity and residence time, which promote more droplets to deposit on the middle-lower furnace wall for liquid film accumulation. At the maximum flow rate with a NB reaching 9.30, droplet generation volume increases sharply: numerous high-speed droplets fly upward to the upper inner space of the converter and stay for a much longer residence time, realizing full vertical distribution from the molten bath surface to the upper furnace wall. With the continuous increase in NB induced by the elevated top-blowing flow rate, the total number, flying height, average velocity, and residence time of splashing droplets show a consistent rising tendency, which continuously supplements liquid raw materials for wall-attached liquid film and effectively expands the coverage range of protective slag film in actual slag splashing operation.
Figure 16.
Jet and droplet distribution under different top-blowing flow rates: (a) 6.35 Nm3/h; (b) 8.91 Nm3/h; (c) 11.76 Nm3/h.
3.5. Droplet Size Distribution and Spatiotemporal Dispersion Features
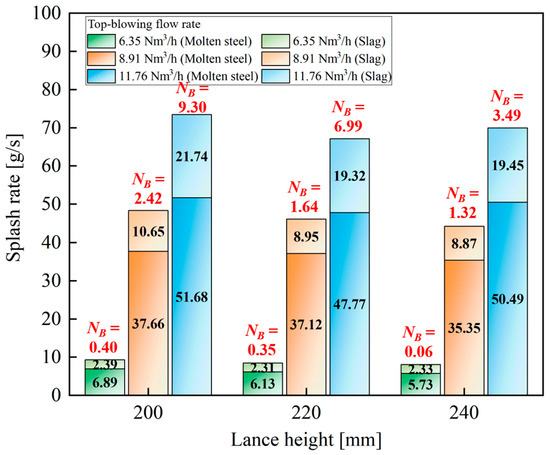
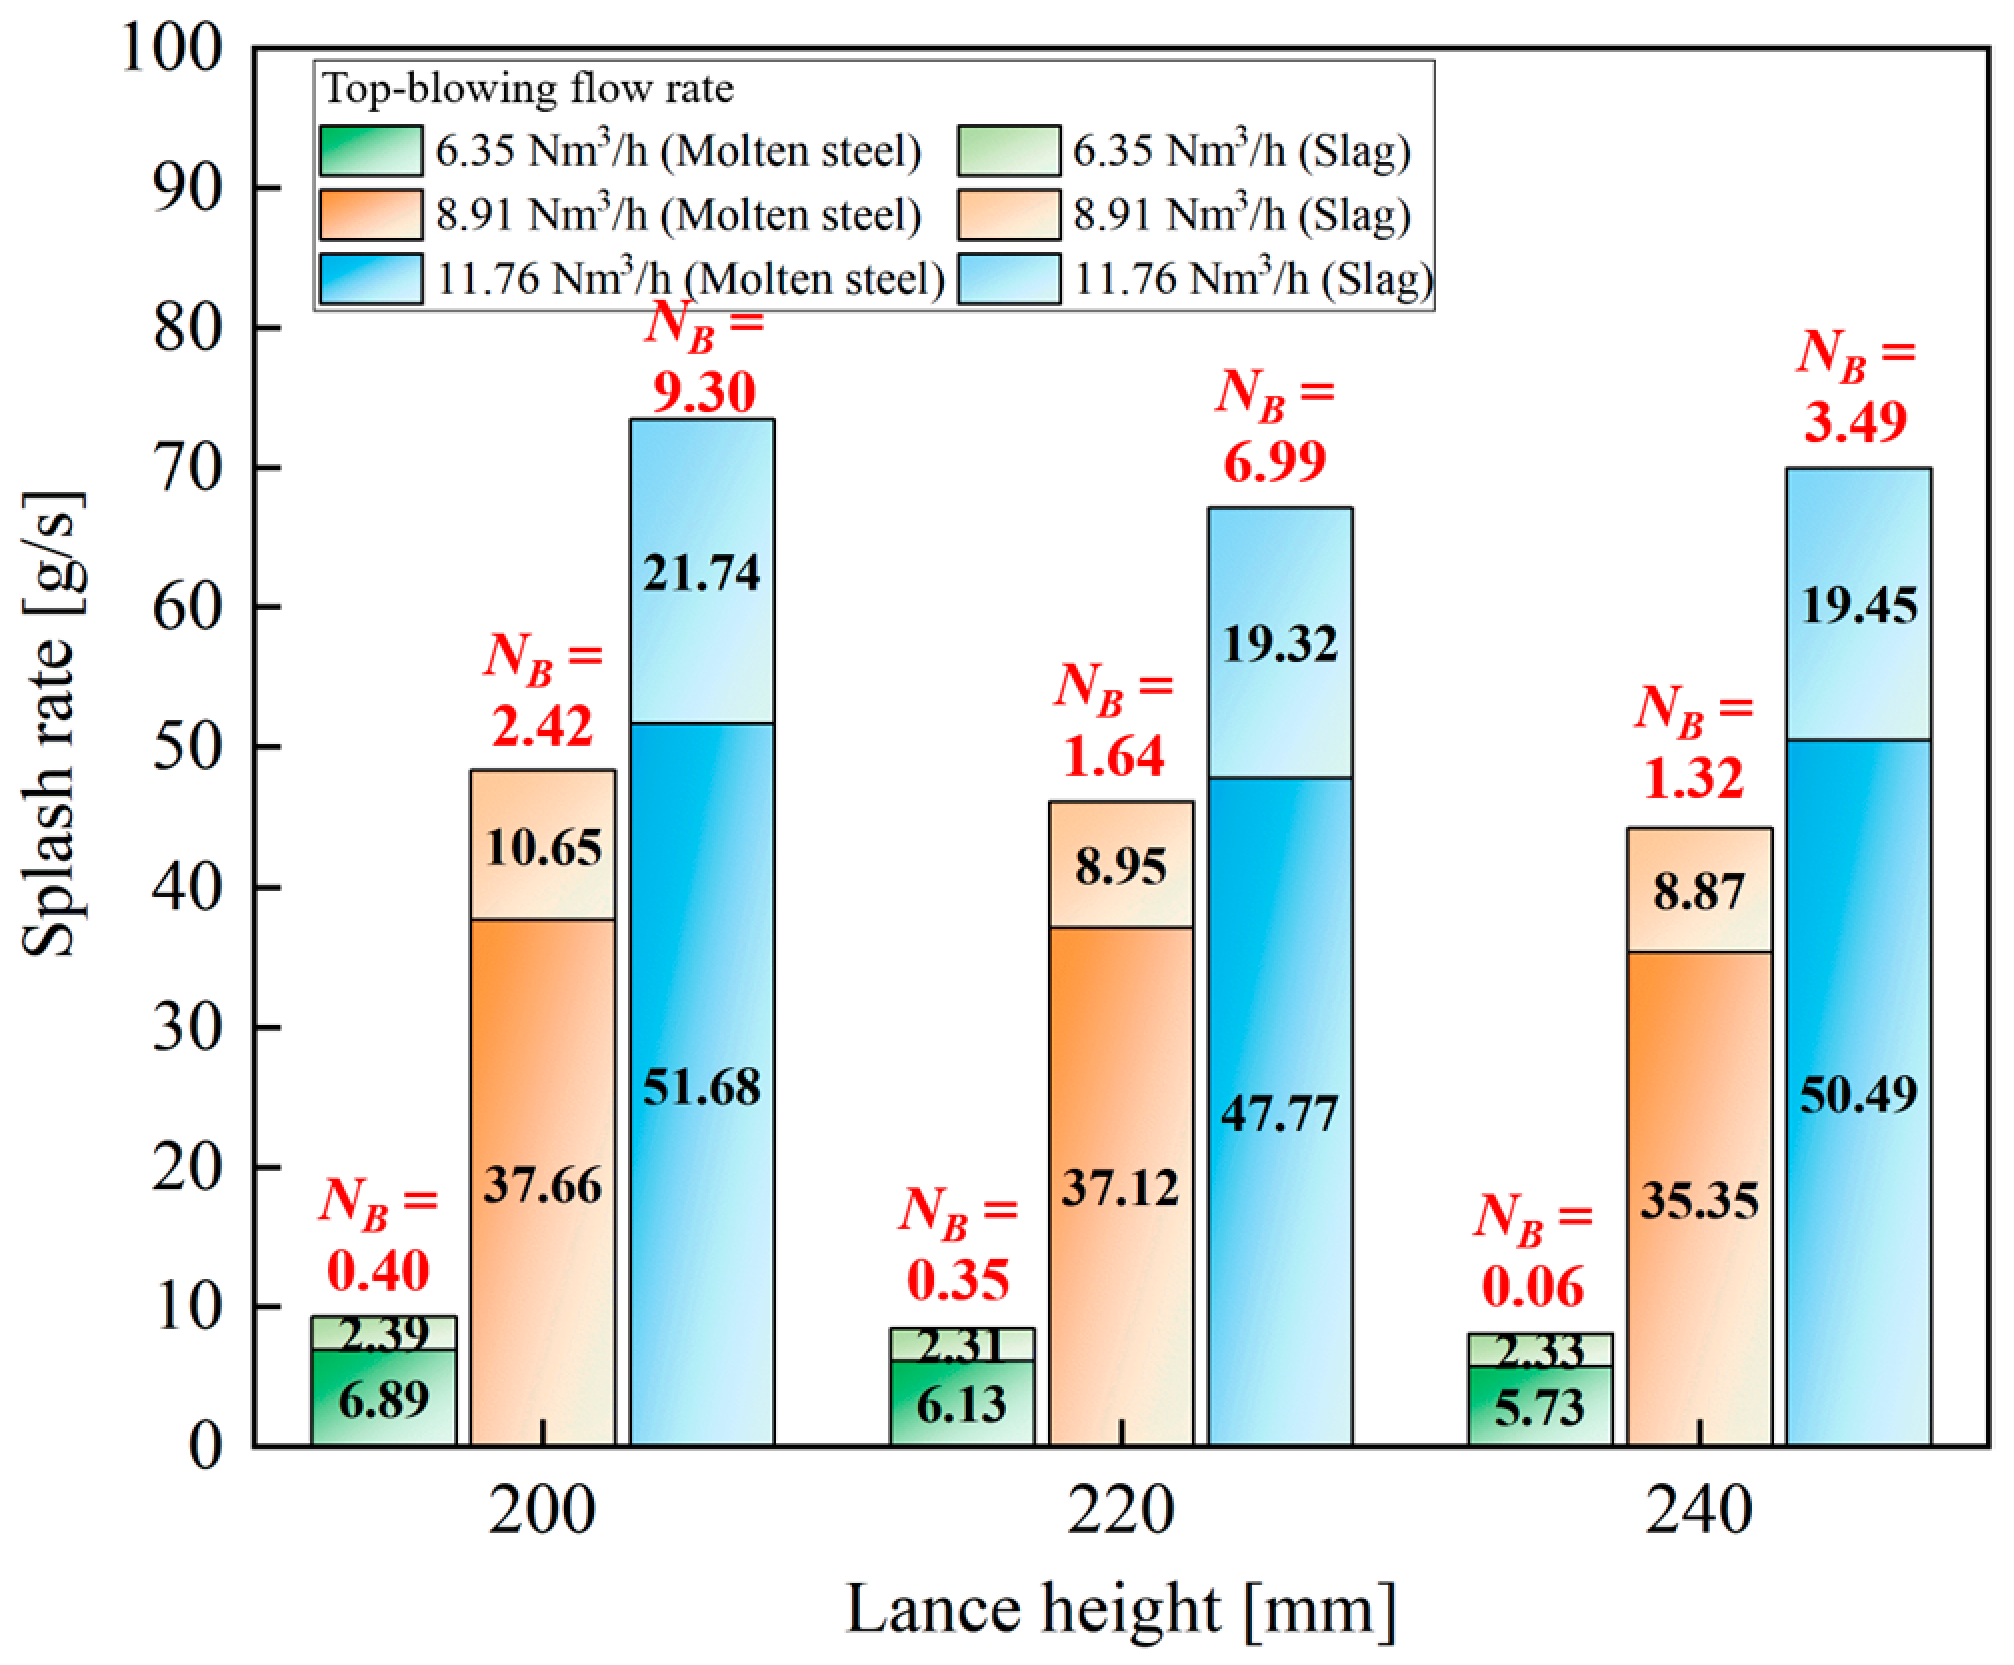
Figure 17 quantifies the splashing rates of molten steel and slag under different lance heights and top-blowing flow rates, with matched NB labeled for each operating condition to link dimensionless splashing intensity to the practical performance of slag splashing protection. Within every fixed top-blowing flow condition, NB decreases progressively as lance height rises, and the total splash production presents a synchronous declining trend. At the flow rate of 6.35 Nm3/h, the NB drops from 0.40 to 0.06 with increasing lance height from 200 mm to 240 mm, and the shrinking splash yield cannot provide sufficient slag droplets to form a complete and uniform protective coating on the converter refractory lining, resulting in an unsatisfactory slag splashing effect. When the flow rate is fixed at 8.91 Nm3/h, the NB reduces from 2.42 to 1.32 alongside a higher lance height: the gradual drop of splash output slows down the accumulation rate of wall-attached liquid film and narrows the effective coverage area of protective slag layer. Under the flow rate of 11.76 Nm3/h, the NB falls from 9.30 to 3.49 as the lance height increases: the continuous reduction in splash quantity hinders further improvement of lining protection even with the existing high droplet baseline. For all working conditions, raising NB by properly reducing lance height can effectively increase splash output and guarantee stable slag supply for on-wall protective film formation. This quantified dependency between NB and splash rate offers reliable data reference for precise parameter adjustment during industrial slag splashing.
Figure 17.
Splashing rate of slag and molten steel with different lance heights and top-blowing flow rates.
To quantitatively evaluate the parameter sensitivity of the operating factors on splashing behavior, a two-way ANOVA without replication was carried out in Table 5. The statistical analysis indicates that the top-blowing flow rate is the primary governing factor (p < 0.001). This dominance is physically rooted in the fact that the jet volumetric flow rate directly scales the primary kinetic energy input delivered to the molten bath. However, this localized statistical output requires careful physical interpretation. Given the deterministic nature of numerical simulations and the compact sample boundary of the 3×3 matrix, the colossal variance generated by the flow rate introduces a mathematical masking effect that eclipses the secondary-order effects. In practical steelmaking operations, lance height remains a critical regulatory parameter for controlling jet penetration depth and slag splashing dynamics. Thus, the statistical non-significance here merely implies that the secondary impact of lance height is heavily outweighed by the first-order flow rate variation within this specific localized grid, rather than suggesting that lance height regulation can be neglected in on-site scenarios.
Table 5.
Two-way analysis of variance for the splash rate outputs.
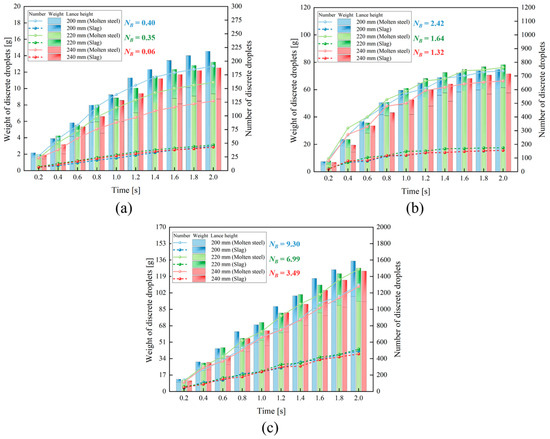
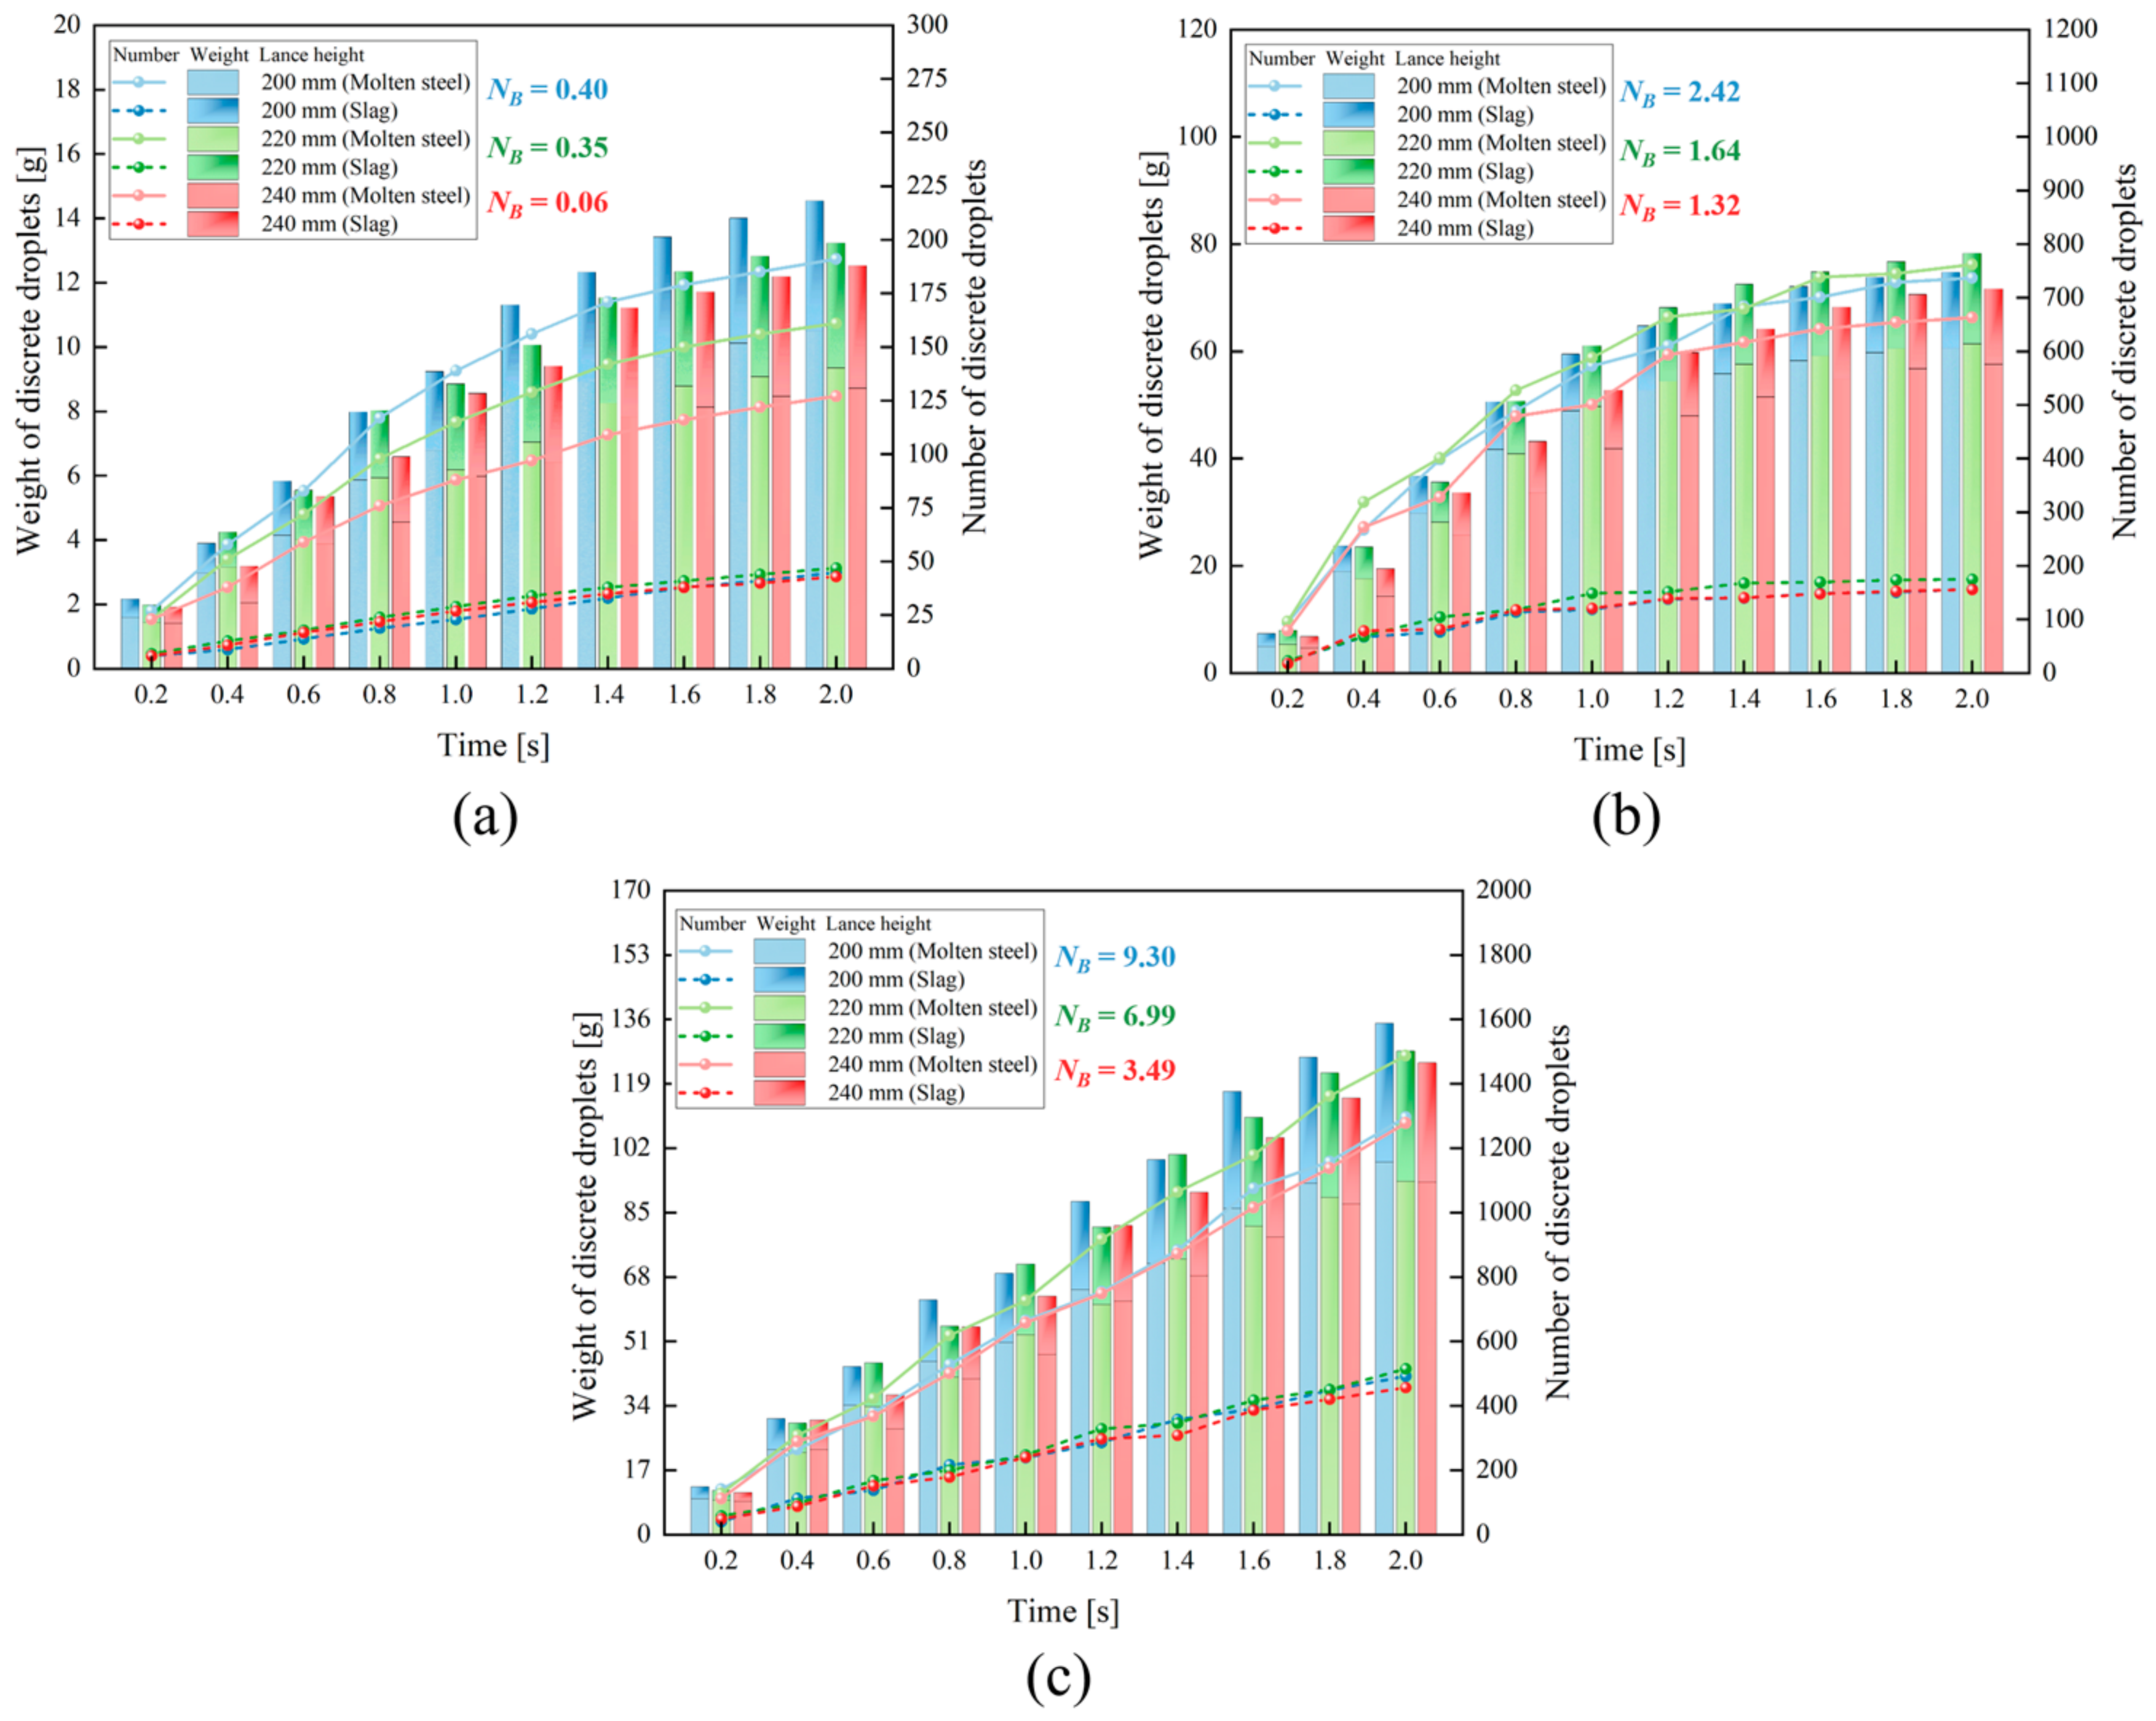
Figure 18 illustrates the temporal accumulation trend of cumulative mass and population for molten steel and slag droplets under three sets of NB gradients corresponding to three fixed top-blowing flow rates. All tested cases feature a continuous ascending growth of droplet mass and count throughout the 0–2.0 s splashing duration, and the shift in NB originating from different lance heights directly modulates the real-time accumulation rate of splashing droplets. At the flow rate of 6.35 Nm3/h with NB values of 0.40, 0.35, and 0.06, the droplet accumulation curves climb slowly at a consistent low gradient; cumulative splashing output decreases sequentially as the NB drops with elevated lance height, and the limited increment of slag droplets fails to deliver stable raw material for continuous slag film deposition on converter lining. When the flow rate increases to 8.91 Nm3/h and the NB shifts to 2.42, 1.64, and 1.32, the rising gradient of the accumulation curves becomes markedly steeper; the intermediate NB of 1.64 matches the maximum cumulative mass and quantity of both slag and molten steel droplets, sustaining stable liquid replenishment for the progressive buildup of furnace wall protective coating. At the maximum blowing flow rate associated with NB values of 9.30, 6.99, and 3.49, droplets exhibit the fastest real-time accumulation speed across all test groups. The highest NB of 9.30 brings about the peak cumulative molten steel mass; meanwhile, a NB value of 6.99 yields the largest slag droplet population to support abundant slag supply for lining protection.
Figure 18.
Time-dependent variation in cumulative droplet mass and count at different top-blowing flow rates and lance heights: (a) 6.35 Nm3/h; (b) 8.91 Nm3/h; (c) 11.76 Nm3/h.
Similarly, to quantitatively evaluate the parameter sensitivity of the operating factors on the number of discrete droplets, a corresponding two-way ANOVA without replication was performed, as tabulated in Table 6. The statistical analysis reveals a consistent trend where the top-blowing flow rate acts as the absolute dominant factor (p < 0.001), explaining 98.799% of the total variance due to its overriding role in kinetic energy delivery. In contrast, the secondary impact of the lance height is rendered statistically non-significant. As analyzed previously, this statistical insignificance stems from the mathematical masking effect within the localized 3×3 grid, and does not diminish the practical engineering importance of lance height regulation in controlling droplet generation and on-site slag splashing dynamics.
Table 6.
Two-way analysis of variance for the number of discrete droplet outputs.
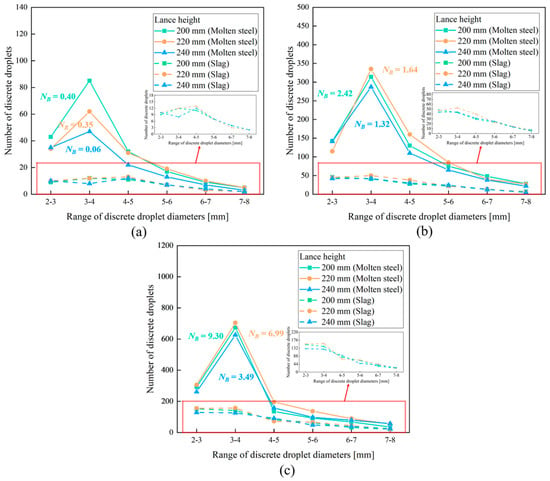
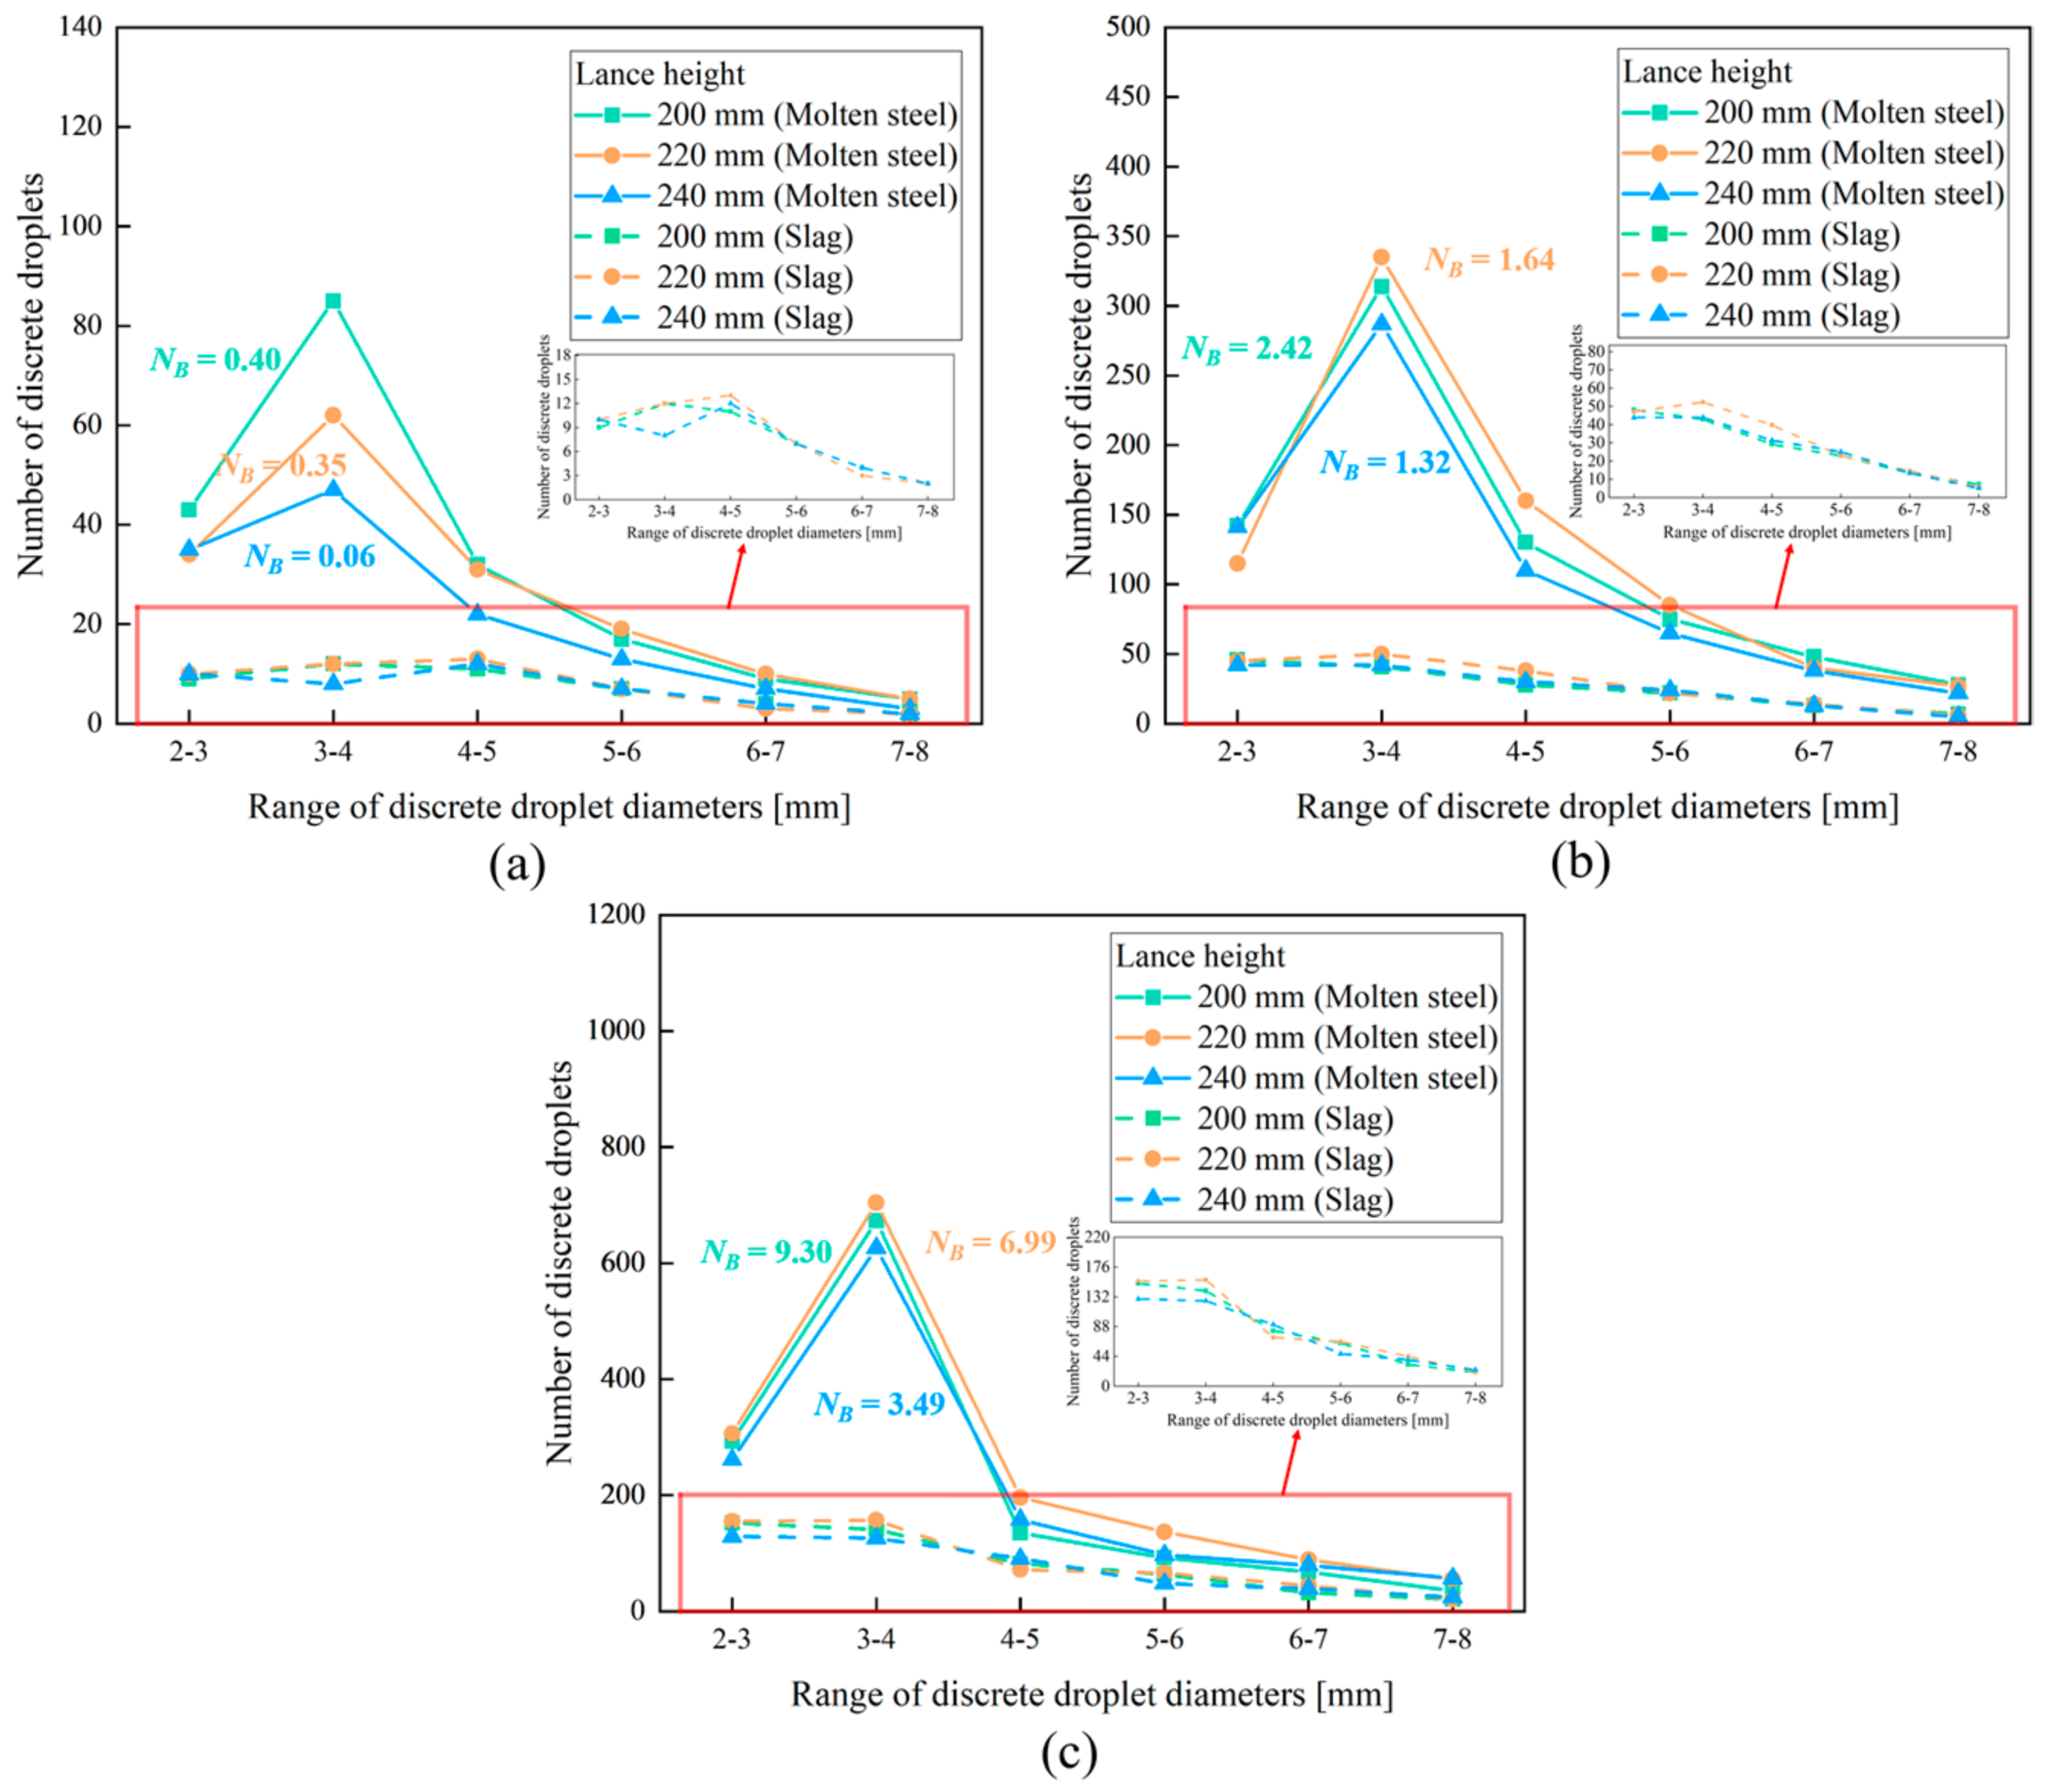
Figure 19 shows the diameter distribution of discrete molten steel and slag droplets under different NB values, which are modulated by adjusting lance height at three fixed top-blowing flow rates. At a flow rate of 6.35 Nm3/h paired with NB values of 0.40, 0.35, and 0.06, molten steel droplets predominantly gather within the 3–4 mm diameter range, and the working condition at a NB of 0.40 produces the largest quantity of droplets in this dominant size interval. Slag droplets exhibit flat distribution across the 2–6 mm range without prominent concentration peaks, and the fluctuation in the NB brings limited change to the population of slag droplets at each particle size. When the blowing flow rate is set to 8.91 Nm3/h with corresponding NB values of 2.42, 1.64, and 1.32, molten steel droplets still feature a prominent peak at 3–4 mm diameter, and the maximum droplet yield occurs at a value NB of 1.64. For the slag phase, droplet quantity within the 3–5 mm size range rises remarkably under a NB of 1.64 compared with the other two numerical levels, supplying abundant medium-sized slag particles to build up the protective coating of the wall. Under the highest flow rate matched with NB values of 9.30, 6.99, and 3.49, molten steel droplets keep their main size concentrated at 3–4 mm, and a NB of 6.99 corresponds to the peak amount of generated steel droplets. Meanwhile, slag droplets shift toward finer sizes and mostly concentrate within 2–4 mm; such fine granularity of slag droplets facilitates uniform spreading and continuous attachment on the converter refractory during slag splashing operation.
Figure 19.
Size distribution of discrete splashing droplets under different top-blowing flow rates with different NB values: (a) 6.35 Nm3/h; (b) 8.91 Nm3/h; (c) 11.76 Nm3/h.
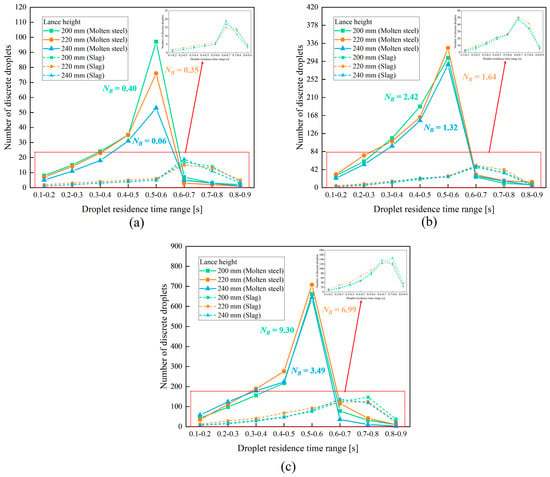
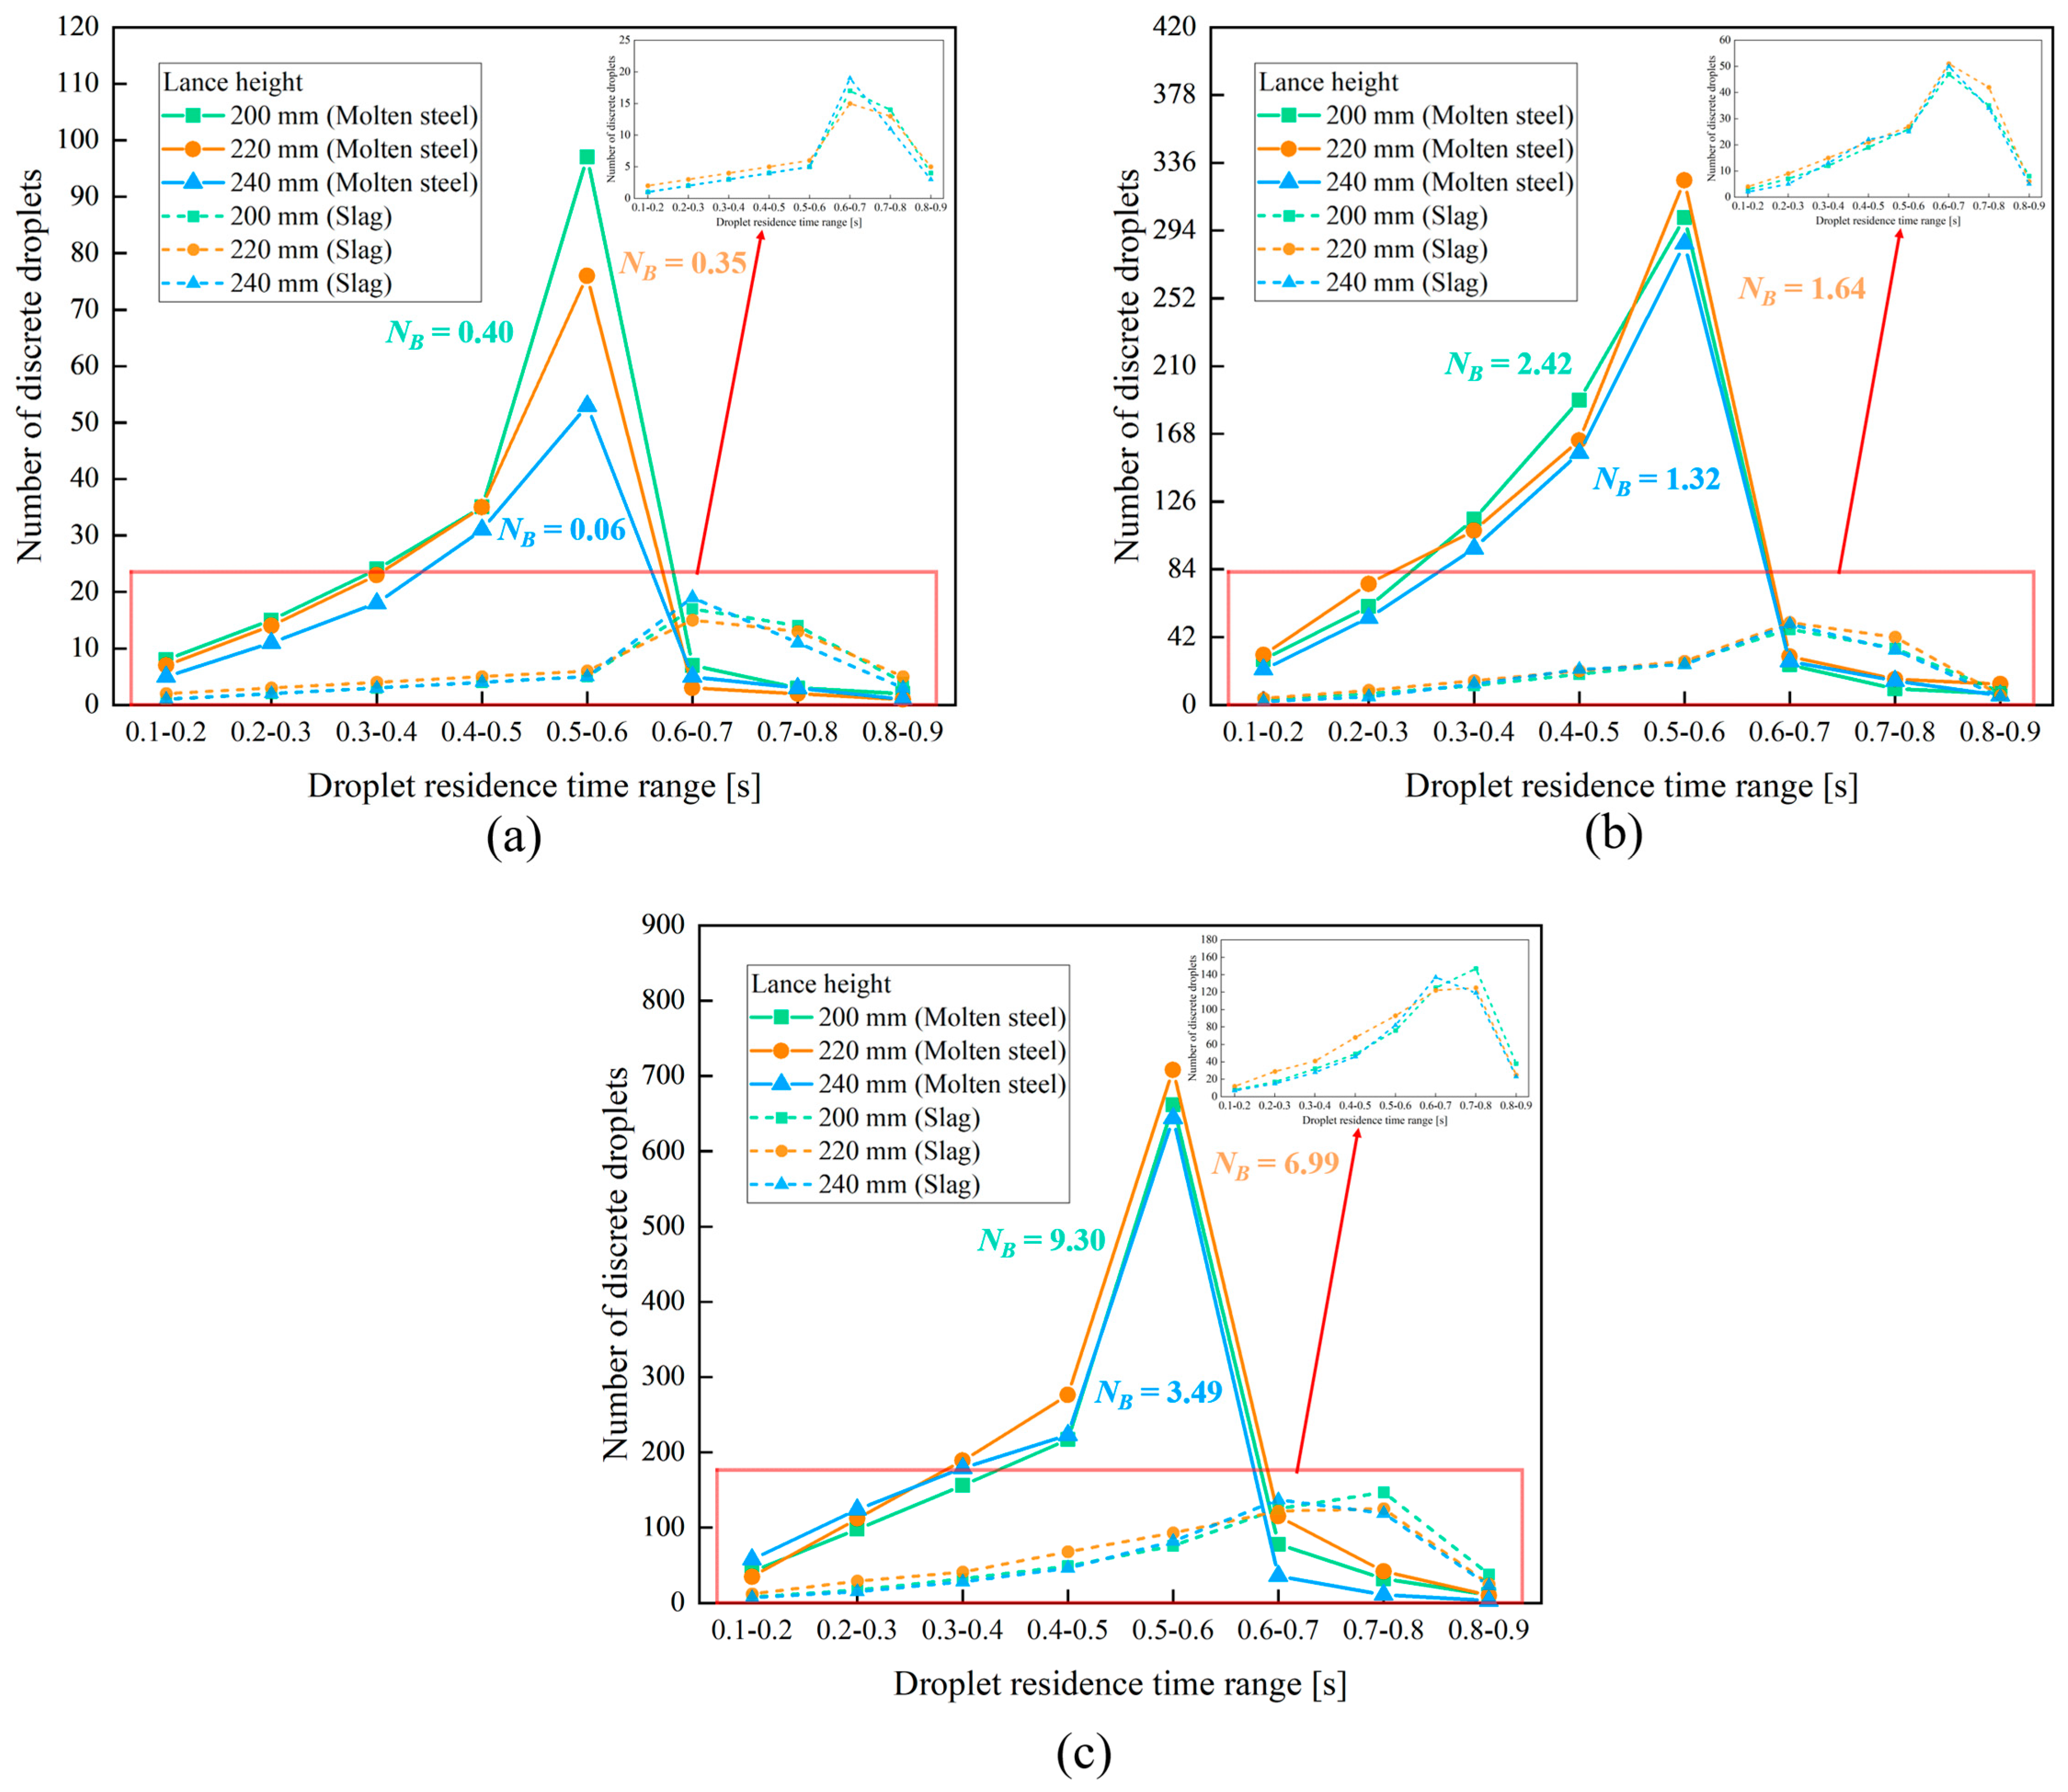
Figure 20 presents the residence time distribution of discrete splashing droplets under different top-blowing flow rates and lance heights, with corresponding NB values labeled for each operating condition. Droplet residence time is defined as the duration from jet-induced detachment from the bath surface to wall impact or re-entry into the molten pool, which directly influences the deposition behavior of splashed droplets on the converter lining. At a flow rate of 6.35 Nm3/h, NB values of 0.40, 0.35, and 0.06 correspond to lance heights of 200 mm, 220 mm, and 240 mm, respectively. Under these conditions, the total number of generated droplets remains low across all residence time intervals. The distribution of molten steel droplets follows a unimodal pattern, with the peak count falling in the 0.5–0.6 s range; the highest droplet yield occurs at the highest NB of 0.40, while the other two conditions produce far fewer droplets. Slag droplets are scarce, with their distribution weakly spread across the 0.6–0.8 s range, and almost no droplets have residence times below 0.5 s. When the flow rate increases to 8.91 Nm3/h, the NB shifts to 2.42, 1.64, and 1.32 with the corresponding lance heights. The total number of droplets rises significantly compared to the low flow rate case. Molten steel droplets still concentrate in the 0.5–0.6 s interval, and the peak count appears at the intermediate NB value of 1.64. Slag droplet quantity increases notably, with the highest yield observed at a NB of 1.64, peaking in the 0.6–0.7 s range, alongside considerable counts in the adjacent 0.5–0.6 s and 0.7–0.8 s intervals. At the maximum flow rate of 11.76 Nm3/h, the NB reaches 9.30, 6.99, and 3.49 for the three lance heights. The total droplet count peaks under this condition, and the residence time distribution becomes more concentrated. Molten steel droplets show a sharp peak in the 0.5–0.6 s range, with the maximum count occurring at a NB value of 6.99. Slag droplets also reach their highest yield here, with their distribution peaking in the 0.6–0.8 s range, and a small portion of droplets exhibiting residence times exceeding 0.8 s.
Figure 20.
Residence time range distribution of splashing droplets at different top-blowing flow rates with different NB values: (a) 6.35 Nm3/h; (b) 8.91 Nm3/h; (c) 11.76 Nm3/h.
It is necessary to acknowledge that defining the slag and molten steel phases as incompressible, immiscible Newtonian fluids introduces certain localized evaluation limitations by excluding complex high-temperature metallurgical phenomena. Because the intense top-blowing jet induces an extremely high-shear-rate regime (102–104 s−1), the apparent viscosity of pseudoplastic slags asymptotically approaches a stable Newtonian plateau, which restricts the estimated dynamic viscosity deviation to within 7%. However, ignoring transient interfacial chemical reactions leads to a relatively conservative baseline for the splashing outputs; active interfacial mass transfer can lower dynamic interfacial tension by up to 50%, which potentially underestimates the actual cumulative droplet volume by approximately 15–25%. Nevertheless, the current momentum-dominated model rigorously captures the first-order operational mechanics of the splashing process.
4. Conclusions
This work establishes a three-dimensional gas-slag-molten steel three-phase model based on VOF-DPM bidirectional coupling and the Eulerian Wall Film Model. The dimensionless NB is used as the core indicator to characterize splashing behaviors, and the effects of top-blowing flow rate and lance height are systematically investigated. Main conclusions are drawn as follows:
- (1)
- The established numerical model is verified by experimental data and shows good prediction accuracy. Determined jointly by top-blowing flow rate and lance height, the NB dominates the geometry of impact cavity and jet momentum distribution. A higher NB strengthens axial jet impact, while a moderate NB facilitates mixing between slag and molten steel. A low NB leads to shallow and fragmented impact cavities.
- (2)
- Both droplet generation rate and cumulative output increase with a rise in the NB. At any fixed flow rate within the tested range of 6.35–11.76 Nm3/h under 1650 °C, increasing the lance height reduces the NB and weakens splashing intensity. For medium and high flow rates, the lowest lance height with the maximum NB achieves the best performance in droplet generation and slag entrainment.
- (3)
- Molten steel droplets are mainly distributed in the diameter range of 3–4 mm. As the NB increases, slag droplets gradually turn finer. The peak value of droplet residence time remains within 0.5–0.6 s, and the lance height of 220 mm produces the optimal residence time distribution under medium and high flow rates.
- (4)
- The coverage area of wall-attached liquid film rises significantly with increasing NB. Under low and medium flow rates, the maximum film area appears at a moderate NB; under high flow rates, the film area declines steadily as the NB decreases. The obtained results provide theoretical guidance for the optimization of practical slag splashing protection.
- (5)
- Among all tested conditions, the combination of a 11.76 Nm3/h flow rate and a 200 mm lance height (NB = 9.30) is the comprehensive optimal scheme, which forms a uniform and durable protective layer over the whole furnace wall. For targeted protection of the middle and lower furnace sections, the operating condition of 11.76 Nm3/h and a 220 mm lance height (NB = 6.99) is more applicable.
Author Contributions
Conceptualization, F.Q., S.C.P.C. and B.L.; methodology, F.Q., L.Z., S.C.P.C. and B.L.; validation, F.Q. and L.Z.; formal analysis, F.Q., L.Z., S.C.P.C., B.L. and Z.L.; investigation, S.C.P.C. and L.Z.; resources, F.Q., B.L. and Z.L.; data curation, L.Z.; writing—original draft preparation, L.Z.; writing—review and editing, S.C.P.C., F.Q., B.L. and Z.L.; visualization, L.Z. and Z.L.; supervision, F.Q., S.C.P.C. and B.L.; project administration, F.Q.; funding acquisition, F.Q. All authors have read and agreed to the published version of the manuscript.
Funding
This research was funded by The National Science Foundation of China, grant number 52174305.
Data Availability Statement
The original contributions presented in this study are included in the article. Further inquiries can be directed to the corresponding author.
Conflicts of Interest
The authors declare no conflicts of interest The funders had no role in the design of the study; in the collection, analyses, or in-terpretation of data; in the writing of the manuscript; or in the decision to publish the results.
References
- Yang, G.; Li, B.; Sun, M.; Qin, D.; Zhong, L. Numerical Simulation of the Slag Splashing Process in a 120 Ton Top-Blown Converter. Metals 2023, 13, 940. [Google Scholar] [CrossRef] [Scilit]
- Roth, C.; Peter, M.; Schindler, M.; Koch, K. Cold Model Investigations into the Effects of Bottom Blowing in Metallurgical Reactors. Steel Res. 1995, 66, 325–330. [Google Scholar] [CrossRef] [Scilit]
- Rout, B.K.; Brooks, G.; Subagyo; Rhamdhani, M.A.; Li, Z. Modeling of Droplet Generation in a Top Blowing Steelmaking Process. Metall. Mater. Trans. B 2016, 47, 3350–3361. [Google Scholar] [CrossRef] [Scilit]
- Sinelnikov, V.; Szucki, M.; Merder, T.; Pieprzyca, J.; Kalisz, D. Physical and Numerical Modeling of the Slag Splashing Process. Materials 2021, 14, 2289. [Google Scholar] [CrossRef] [Scilit] [PubMed]
- Dai, Y.; Li, J.; Yan, W.; Shi, C. Corrosion Mechanism and Protection of BOF Refractory for High Silicon Hot Metal Steelmaking Process. J. Mater. Res. Technol. 2020, 9, 4292–4308. [Google Scholar] [CrossRef] [Scilit]
- Koria, S.C.; Lange, K.W. Breakup of Iron-Carbon Drops by a High Velocity Oxygen Gas Jet. Can. Metall. Q. 1979, 18, 131–143. [Google Scholar] [CrossRef] [Scilit]
- Standish, N.; He, Q.L. Drop Generation Due to an Impinging Jet and the Effect of Bottom Blowing in the Steelmaking Vessel. ISIJ Int. 1989, 29, 455–461. [Google Scholar] [CrossRef] [Scilit]
- Fabritius, T.M.J.; Luomala, M.J.; Virtanen, E.O.; Tenkku, H.; Fabritius, T.L.J.; Siivola, T.P.; Härkki, J.J. Effect of Bottom Nozzle Arrangement on Splashing and Spitting in Combined Blowing Converter. ISIJ Int. 2002, 42, 861–867. [Google Scholar] [CrossRef] [Scilit]
- Tago, Y.; Higuchi, Y. Fluid Flow Analysis of Jets from Nozzles in Top Blown Process. ISIJ Int. 2003, 43, 209–215. [Google Scholar] [CrossRef] [Scilit]
- Subagyo, G.A.B.; Coley, K.S.; Irons, G.A. Generation of Droplets in Slag-Metal Emulsions Through Top Gas Blowing. ISIJ Int. 2003, 43, 983–989. [Google Scholar] [CrossRef] [Scilit]
- Zhang, H.; Yuan, Z.; Zhao, H.; Xu, B.-S.; Liu, K.; Mei, L.; Ma, B.-W. Numerical Simulation of CO2 Used for Slag Splashing Process in Converter. Steel Res. Int. 2023, 94, 2300025. [Google Scholar] [CrossRef] [Scilit]
- Zhang, H.; Liu, K.; Zhao, H.; Tian, Y.; Liang, J.; Yuan, Z. Numerical Simulation of Innovative Slag Splashing Process in a Converter Using a Nozzle-Twisted Oxygen Lance. J. Sustain. Metall. 2024, 10, 864–879. [Google Scholar] [CrossRef] [Scilit]
- Li, Q.; Li, M.; Kuang, S.B.; Zou, Z. Computational Study on the Behaviours of Supersonic Jets and Their Impingement onto Molten Liquid Free Surface in BOF Steelmaking. Can. Metall. Q. 2014, 53, 340–351. [Google Scholar] [CrossRef] [Scilit]
- Li, M.; Li, Q.; Kuang, S.; Zou, Z. Computational Investigation of the Splashing Phenomenon Induced by the Impingement of Multiple Supersonic Jets onto a Molten Slag–Metal Bath. Ind. Eng. Chem. Res. 2016, 55, 3630–3640. [Google Scholar] [CrossRef] [Scilit]
- Cao, L.; Liu, Q.; Sun, J.; Lin, W.; Feng, X. Effect of Slag Layer on the Multiphase Interaction in a Converter: Cao, Liu, Sun, Lin, and Feng. JOM 2019, 71, 754–763. [Google Scholar]
- Chen, J.; Zhu, H.; Wang, L.; Zhao, J.; Guo, S. Effect of Yttrium Addition on Nonmetallic Inclusions in FeCrAl Alloys. Steel Res. Int. 2023, 94, 2300212. [Google Scholar] [CrossRef] [Scilit]
- Ou, H.; Su, L.; Shi, Y.; Ruan, S. Investigation on High-Viscosity Chemical Waste Liquid Atomizer Based on VOF-DPM. Energies 2023, 16, 3109. [Google Scholar] [CrossRef] [Scilit]
- Jin, W.; Xiao, J.; Ren, H.; Li, C.; Zheng, Q.; Tong, Z. Three-Dimensional Simulation of Impinging Jet Atomization of Soft Mist Inhalers Using the Hybrid VOF-DPM Model. Powder Technol. 2022, 407, 117622. [Google Scholar] [CrossRef] [Scilit]
- Jiang, B.; He, D.; Zhang, L.; Kang, Q.; Xiao, X.; Jiang, J. VOF-DPM Simulations of Gas-Liquid-Solid Scrubbing Chambers with Two Gas Intake Modes. J. Eng. Thermophys. 2019, 28, 345–358. [Google Scholar] [CrossRef] [Scilit]
- Liu, P.; Yang, S.; Hu, J.; Wang, H. Gas–Liquid Two-Phase Stirring Dynamics and Droplet Splashing Characteristics in Top-Blown Process. Metall. Mater. Trans. B 2024, 55, 4858–4875. [Google Scholar] [CrossRef] [Scilit]
- He, S.; Chen, G.; Guo, C. Investigation of Mixing and Slag Layer Behaviours in the RH Degasser with Bottom Gas Injection by Using the VOF–DPM Coupled Model. Ironmak. Steelmak. 2019, 46, 771–776. [Google Scholar]
- Chen, G.; He, S.; Li, Y. Investigation of the Air-Argon-Steel-Slag Flow in an Industrial RH Reactor with VOF–DPM Coupled Model. Metall. Mater. Trans. B 2017, 48, 2176–2186. [Google Scholar] [CrossRef] [Scilit]
- Chen, J.; Li, C.; Su, X.; Zhang, H.; An, X. Determination of Optimal Bottom Blowing Angle for Improving Mixing Efficiency and Wall Erosion in Steel-Making Converter: Numerical Modeling and Engineering Application. Metall. Mater. Trans. B 2024, 55, 4956–4969. [Google Scholar] [CrossRef] [Scilit]
- Qi, F.; Zhou, S.; Zhang, L.; Huo, H.; Liu, Z.; Cheung, S.C.; Li, B. Numerical Study on Droplet Splashing Behavior of Slag-Splashing for Converter Protection Using Volume of Fluid-Discrete Phase Model Two-Way Conversion Model. Steel Res. Int. 2025, 96, 2400289. [Google Scholar]
- Alam, M.; Naser, J.; Brooks, G.; Fontana, A. A Computational Fluid Dynamics Model of Shrouded Supersonic Jet Impingement on a Water Surface. ISIJ Int. 2012, 52, 1026–1035. [Google Scholar] [CrossRef] [Scilit]
- Hwang, H.Y.; Irons, G.A. A Water Model Study of Impinging Gas Jets on Liquid Surfaces. Metall. Mater. Trans. B 2012, 43, 302–315. [Google Scholar]
- Sun, J.; Zhang, J.; Jiang, R.; Feng, X.; Liu, Q. Numerical Simulation of Droplet Splashing Behavior in Steelmaking Converter Based on VOF-to-DPM Hybrid Model and AMR Technique. Metall. Mater. Trans. B 2024, 55, 1098–1116. [Google Scholar] [CrossRef] [Scilit]
- Zhong, L.; Zhu, Y.; Jiang, M.; Qu, Z.; Za, Y.; Bao, X. Cold Modelling of Slag Splashing in LD Furnace by Oxygen Lance with Twisted Nozzle Tip. Steel Res. Int. 2005, 76, 611–615. [Google Scholar] [CrossRef] [Scilit]
- Varga, C.M.; Lasheras, J.C.; Hopfinger, E.J. Initial Breakup of a Small-Diameter Liquid Jet by a High-Speed Gas Stream. J. Fluid Mech. 2003, 497, 405–434. [Google Scholar] [CrossRef] [Scilit]

Disclaimer/Publisher’s Note: The statements, opinions and data contained in all publications are solely those of the individual author(s) and contributor(s) and not of MDPI and/or the editor(s). MDPI and/or the editor(s) disclaim responsibility for any injury to people or property resulting from any ideas, methods, instructions or products referred to in the content. |
© 2026 by the authors. Licensee MDPI, Basel, Switzerland. This article is an open access article distributed under the terms and conditions of the Creative Commons Attribution (CC BY) license.