


Abstract
Heat treatment significantly improves the ductility of additively manufactured Zr–2.5Nb alloy, but the mechanisms responsible for this improvement remain poorly understood. In this study, the effects of heat treatment on the microstructure and room-temperature tensile behavior of Zr–2.5Nb fabricated by laser powder bed fusion (LPBF) were investigated by comparing as-built (AB) and heat-treated (HT) specimens. The HT specimens were held at 800 °C for 2 h and subsequently air-cooled. A microstructure-based crystal plasticity fast Fourier transform (CPFFT) model was constructed directly from two-dimensional electron backscatter diffraction (EBSD) orientation and phase maps to quantify the local stress, strain, and slip responses of the α and β phases in the HT microstructure. Heat treatment caused the acicular α′ martensite to decompose, producing a coarser lamellar α + β microstructure. In a representative EBSD field of the HT specimen, β-Zr accounted for 6.0% of the analyzed area and was distributed predominantly between the α lamellae. Compared with the AB condition, heat treatment reduced the mean 0.2% proof stress and ultimate tensile strength from 840 and 1033 MPa to 792 and 881 MPa, respectively, while increasing the mean uniform strain from 4.02% to 6.94%. At an applied axial strain of 3.2%, the β/α ratios of phase-averaged equivalent strain and accumulated absolute slip were 1.59 and 2.51, respectively, whereas the corresponding ratios for von Mises stress and axial stress were 0.57 and 0.81. These results reveal pronounced stress–strain partitioning between the phases: β-Zr accommodated greater equivalent strain and more extensive slip, whereas α-Zr carried higher stresses. This interphase partitioning helps explain the increased uniform strain of the HT specimens, while the reduction in strength is primarily associated with α′-martensite decomposition and α-lamella coarsening.
1. Introduction
The microstructure and mechanical properties of Zr–2.5Nb alloys are sensitive to phase-transformation pathways and the state of the second phase [1,2]. Laser powder bed fusion (LPBF) enables near-net-shape fabrication of complex components through layer-wise melting and rapid solidification. However, steep thermal gradients and cyclic heating generate nonequilibrium microstructures that differ from those of conventionally processed materials [3,4]. Harooni et al. [5] and Yue et al. [6] observed fine acicular microstructures in laser-additively manufactured pure Zr. Huang et al. [7] reported predominantly acicular α’ martensite in as-built LPBF Zr–2.5Nb, accompanied by high strength and limited tensile ductility. Post-build heat treatment can reduce residual stress and adjust the strength–ductility balance by promoting α’ decomposition, changing phase constitution, and modifying α-lath morphology and dimensions.
Previous studies have examined how heat-treatment schedules affect the microstructure and properties of conventionally processed Zr–2.5Nb. Kulkarni et al. [8] investigated microstructures and mechanical properties after heat treatment in the α + β phase field. Zhang et al. [9] and Yang et al. [10] analyzed the effects of annealing schedules on α/β phase fractions, morphology, and tensile properties. Wang et al. [11] showed that cooling rates from the β phase field alter transformation morphology and hardness. Daymond et al. [12] and Daniel et al. [13,14] examined orientation inheritance and variant selection during the β→α transformation, showing that both affect the resulting texture. These studies establish that annealing temperature, cooling path, and transformation orientation relationships govern the microstructure and mechanical properties of conventionally processed Zr–2.5Nb. Whether these relationships transfer directly to LPBF material remains uncertain because its starting microstructure forms by rapid solidification.
Our previous study by Li et al. [15] systematically compared the effects of annealing LPBF Zr–2.5Nb at 600–900 °C followed by furnace cooling, air cooling, or water quenching. That work examined phase transformations, microstructures, and tensile properties. Comparison of α’ decomposition, lamellar α + β formation, and the strength–ductility balance identified air cooling after holding at 800 °C for 2 h as the preferred condition for subsequent study. Lei et al. [16] compared phase constitution, tensile properties, and corrosion behavior after annealing at 550–950 °C. They found that α + β microstructures formed at 650–750 °C increased tensile elongation while retaining appreciable strength. Existing studies therefore establish the effects of annealing temperature and cooling route on the phase constitution and tensile properties of LPBF Zr–2.5Nb. They also support the present selection of air cooling after holding at 800 °C for 2 h. However, quantitative analyses remain scarce for the stress, plastic strain, and slip activity of β-Zr between α laths during loading and for α/β load partitioning.
Phase fractions and macroscopic tensile curves cannot resolve local deformation differences associated with crystal orientation and phase identity. Gong et al. [17] measured the relative strengths of different slip systems in Zr. Li et al. [18] analyzed the conditions governing the transition from prismatic to basal slip. Thool et al. [19] demonstrated the effect of crystal orientation on local deformation through experiments and simulations. In two-phase Zr–2.5Nb, Cai et al. [20] used in situ diffraction to track interphase and intergranular stress evolution. Sahoo et al. [21] examined how second-phase hardness affects deformation, and Muránsky et al. [22] observed load transfer between the α and β phases. These results show that the local β response depends on its intrinsic mechanical properties and its strength relative to α. Macroscopic tensile tests and phase-averaged diffraction cannot directly resolve local fields at the measured α and β locations. Homogenized models also cannot retain the measured orientations and phase distribution of heat-treated LPBF microstructures. A full-field crystal-plasticity method that preserves the EBSD microstructure is therefore required.
Crystal-plasticity models describe slip-system activation and hardening, enabling calculation of stress, strain, and slip activity within individual grains and phases under prescribed loading [23]. Zan et al. [24] used crystal plasticity to investigate anisotropic deformation in rolled Zircaloy-4. Cai et al. [25] and Christodoulou and Tomé [26] modeled the room-temperature deformation of two-phase Zr alloys. Ardeljan et al. [27] used a microstructure-explicit, full-field crystal-plasticity finite-element model to study local strain localization in an HCP/BCC Zr/Nb composite. Taherijam et al. [28] applied a crystal-plasticity finite-element model to assess how β-Zr affects deformation and stress partitioning in Zr–2.5Nb pressure tubes. These studies demonstrate the utility of full-field crystal plasticity for local-response analysis in two-phase Zr/Nb materials. Their material systems and microstructural states, however, differ from heat-treated LPBF Zr–2.5Nb.
The crystal plasticity fast Fourier transform (CPFFT) method can combine EBSD-derived crystal orientations and phase distributions to calculate grain- and phase-scale stress, strain, and slip activity [29,30,31]. Gui et al. [32] used this approach to analyze grain-scale cyclic deformation in TRIP steel. EBSD-informed CPFFT studies of the fine lamellar microstructure in heat-treated LPBF Zr–2.5Nb remain scarce. In particular, quantitative data are lacking on load partitioning, plastic strain, and accumulated absolute slip in β-Zr between α laths.
This study compares LPBF Zr–2.5Nb in the as-built (AB) condition and after holding at 800 °C for 2 h followed by air cooling (HT). Microstructural characterization and EBSD were used to assess phase constitution, crystal orientation, and morphology before and after heat treatment. Room-temperature tensile testing and fractography were used to compare tensile properties and fracture characteristics. Representative two-dimensional EBSD orientation and phase maps for AB and HT were mapped onto single-layer regular grids. Crystal-plasticity constitutive laws were then coupled with an FFT spectral solver in DAMASK. The simulations quantified local von Mises stress, axial stress, equivalent strain, and accumulated absolute slip. The analysis focused on load partitioning and plastic deformation in the α and β phases of HT. The results quantify the load-bearing and plastic response of β-Zr between α laths and relate the phase-level responses to the macroscopic tensile behavior of HT.
2. Materials and Methods
2.1. Powder, LPBF Fabrication, and Heat Treatment
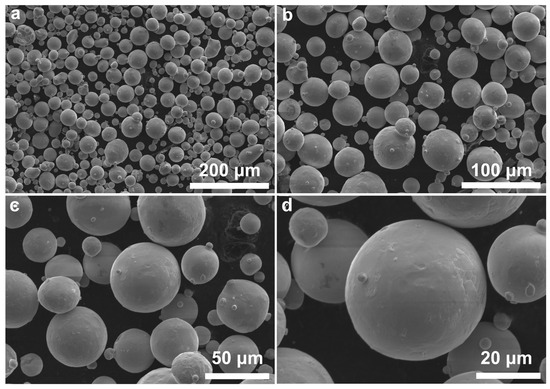
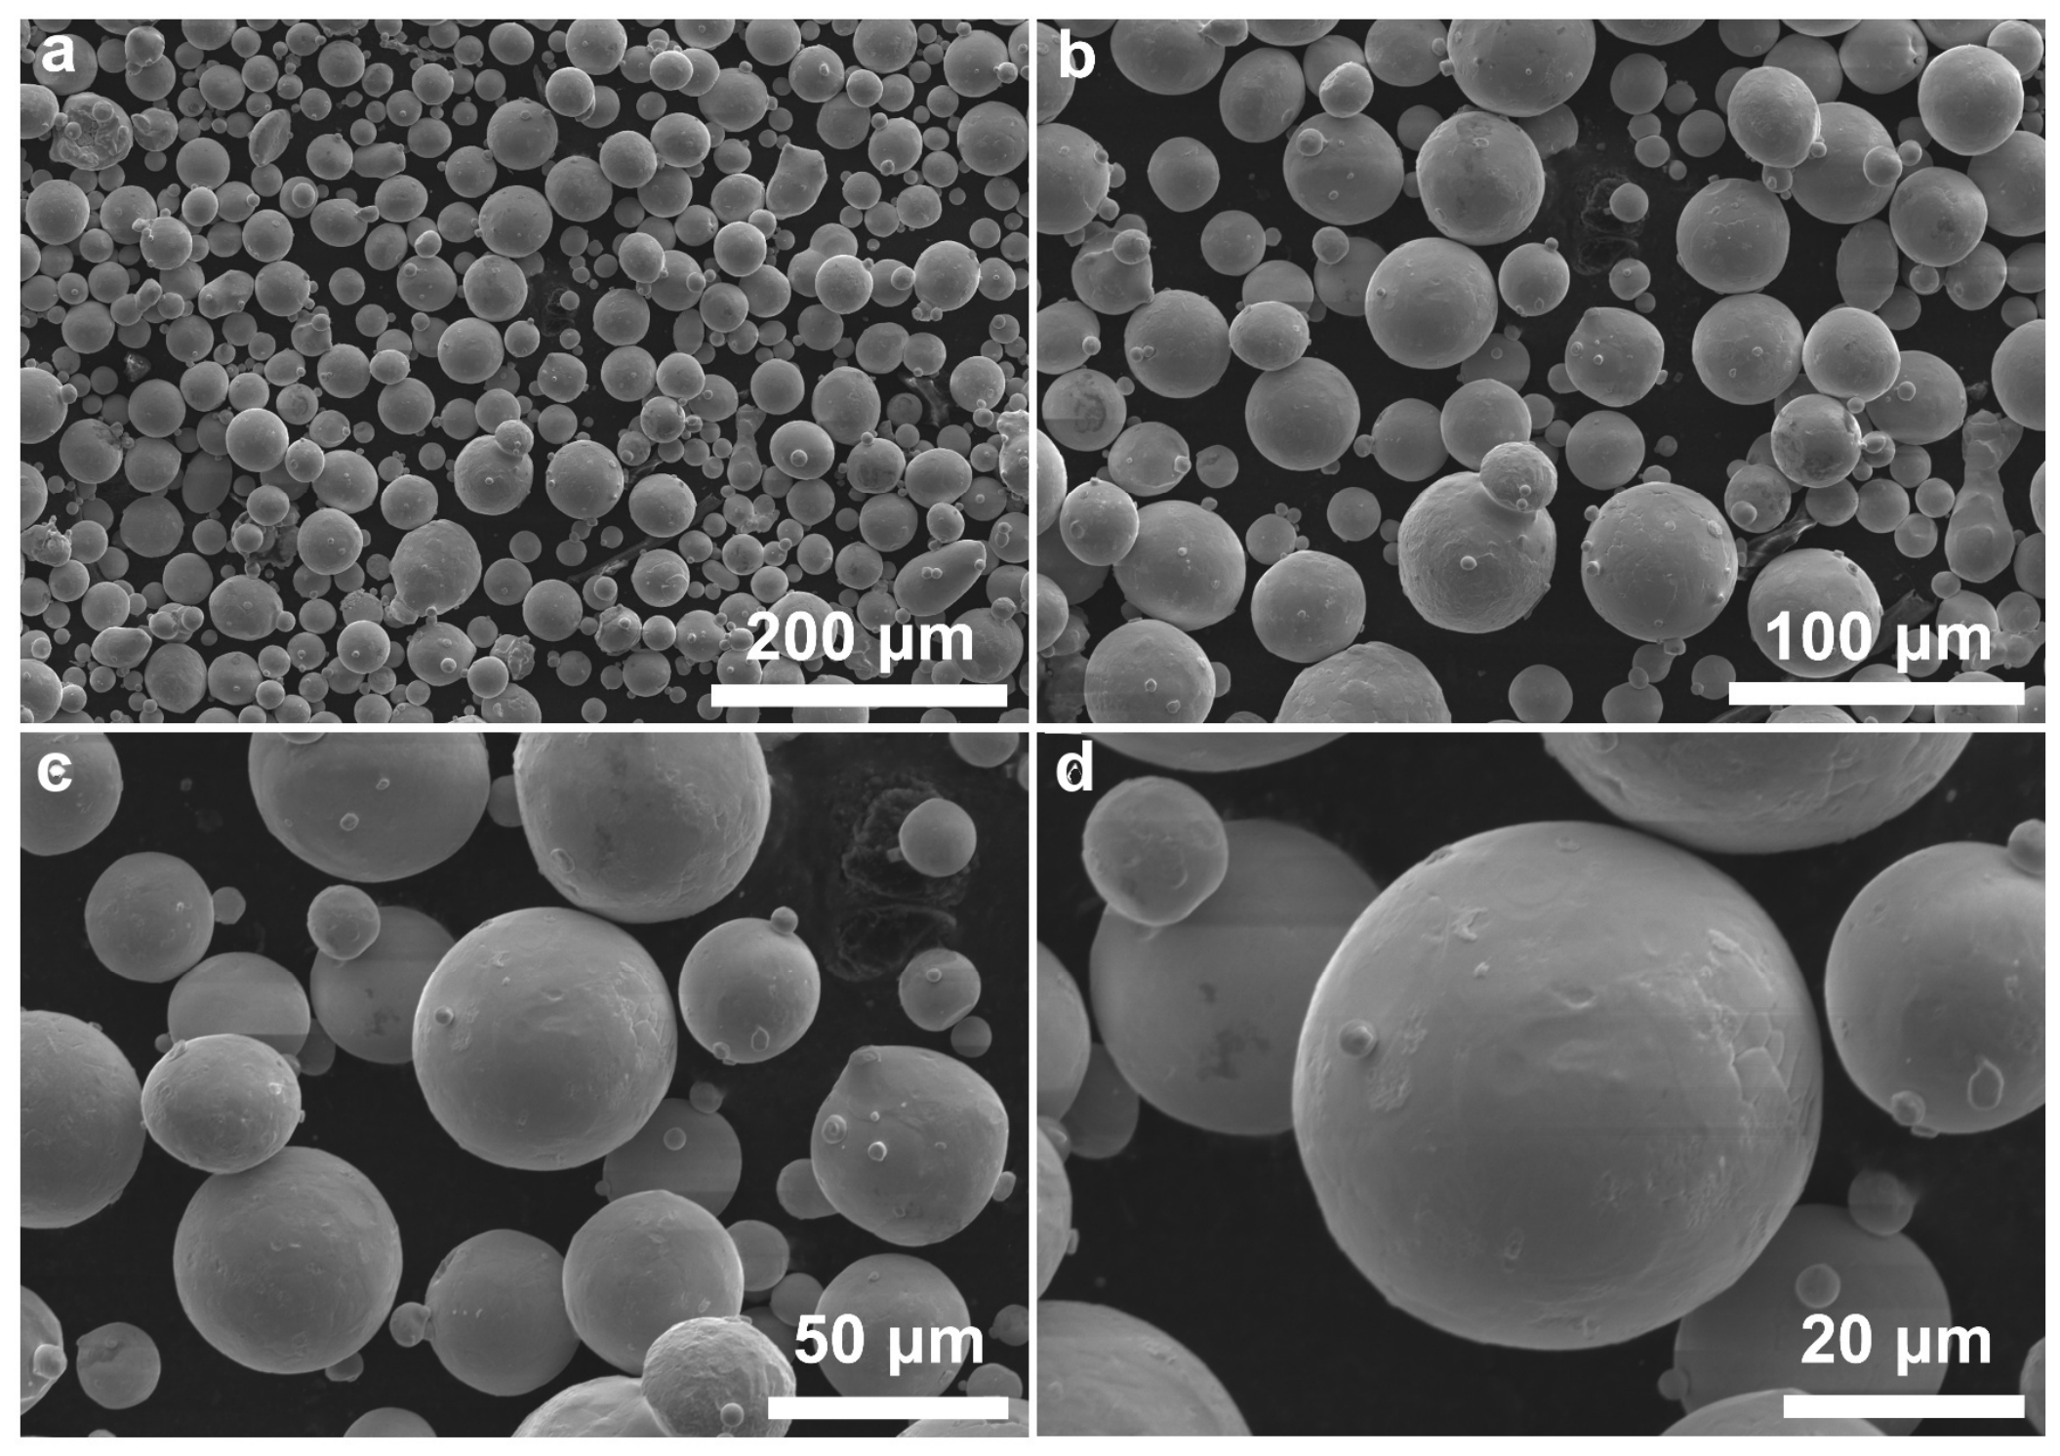
Gas-atomized Zr–2.5Nb alloy powder was used as the feedstock. The particles were predominantly spherical, with a broad size distribution and occasional satellite particles attached to larger particles (Figure 1). This morphology is generally conducive to powder spreading, although satellites and fine particles may locally alter packing density and layer uniformity.
Figure 1.
SEM morphology of the gas-atomized Zr–2.5Nb powder used for LPBF. (a–d) Powder morphology at progressively higher magnifications, showing predominantly spherical particles, a broad particle-size distribution, and occasional satellite particles attached to larger particles. Original scale bars are retained.
Cuboidal specimens measuring 25 × 25 × 8 mm3 were fabricated by LPBF under high-purity argon to limit oxygen and nitrogen uptake by the reactive zirconium alloy. The laser power, nominal scan speed, hatch spacing, and layer thickness were 160 W, 1400 mm s−1, 120 μm, and 30 μm, respectively. The nominal volumetric energy density was 31.7 J mm−3, calculated as E = P/(vht). Here, P, v, h, and t denote laser power, scan speed, hatch spacing, and layer thickness, respectively. A bidirectional stripe scanning strategy with a 67° rotation between successive layers was used to limit directional heat accumulation, texture bias, and residual-stress buildup [3,4].
Specimens were sectioned from the central region of the build plate to reduce position-dependent process variation. The as-built condition is denoted AB. A second specimen set was held at 800 °C for 2 h and then air-cooled to room temperature; this condition is denoted HT. This schedule was selected from the heat-treatment matrix evaluated in our previous study because it produced a coarsened lamellar α + β microstructure with greater tensile ductility than AB [15].
2.2. Microstructural Characterization
Lamellar morphology was examined by an Apreo S LoVac field-emission scanning electron microscope (SEM; Thermo Fisher Scientific Brno s.r.o., Brno, Czech Republic). at magnifications from 2000× to 15,000×. The original scale bars and acquisition metadata were retained in the image plates. Images were not adjusted locally or selectively for brightness, contrast, or individual features. Thus, neither lath morphology nor fracture features were artificially enhanced.
EBSD orientation, phase, boundary, kernel average misorientation (KAM), and pole-figure data were acquired for both conditions. The AB and HT maps were collected at step sizes of approximately 0.15 and 1.4286 μm, respectively. Because the spatial resolutions and fields of view differed, grain or lath size and boundary density were not compared quantitatively between the maps. KAM was likewise used to visualize spatial variations within each field rather than to compare mean KAM or fixed-threshold area fractions between AB and HT. Phase fractions, spatial phase distributions, and pole-figure maxima were reported as map-level EBSD outputs. Indexing quality, cleanup procedures, and reference-frame consistency were controlled because they directly affect EBSD-based microstructure reconstruction and the resulting RVE [33,34].
Fracture surfaces from the room-temperature tensile tests were examined by SEM at low and high magnifications. Low-magnification images were used to assess overall fracture relief and large cavities. High-magnification images were used to compare dimple morphology and tearing ridges. Interpretation was limited to fracture-surface morphology because the initial three-dimensional pore population was not quantified by X-ray computed tomography.
2.3. Room-Temperature Tensile Testing and Curve Processing
Room-temperature tensile tests were performed using a universal testing machine (AGS-X, 10 kN; Shimadzu Corporation, Kyoto, Japan) at a crosshead speed of 0.48 mm/min. The dog-bone specimens had a gauge length of 6 mm and a gauge cross-section of 2 × 1 mm2. Before mechanical testing, all specimen surfaces were ground with abrasive paper to remove surface irregularities arising from electrical discharge machining and oxide scales formed during heat treatment. At least two replicate tensile tests were performed for each condition. Vickers hardness was measured using an HV-1000STA hardness tester (Veiyee, Laizhou, China) under a load of 200 N and a dwell time of 5 s. A total of 10 indentations were made on each specimen, and the mean value was reported.
2.4. EBSD-Informed CPFFT Simulation
The EBSD orientation and phase data were preprocessed in DREAM.3D 7.0.1 and subsequently imported into DAMASK 3.0. The workflow maintained internally consistent orientation, phase, and reference-frame information in the EBSD/HDF5 data [33,34]. Oxford CTF files were imported into DREAM.3D, and invalid pixels were masked using the EBSD error array. Euler angles were converted to quaternions, and bad points were evaluated using a neighbor-orientation criterion. Features were segmented using a 5° misorientation tolerance. Cleanup included feature-phase assignment, average-orientation calculation, and neighbor and size filtering. Features smaller than 10 cells were removed. Bad data were filled, and two erode/dilate cleanup iterations were applied before export.
The resulting FeatureIds, Phases, and EulerAngles arrays were loaded with DAMASK utilities to construct the grid and material configuration using one direct-homogenization constituent. The cleaned EBSD-derived orientation fields were discretized as two-dimensional periodic representative volume elements (RVEs). They were solved using DAMASK Grid v3.0.0-alpha6 with the spectral_basic mechanical solver [23,29]. The spectral formulation follows FFT-based homogenization methods for periodic boundary-value problems and provides cell-resolved micromechanical fields in heterogeneous polycrystals [30,31]. The AB grid contained 344 × 236 × 1 cells (81,184 cells), whereas the HT grid contained 825 × 567 × 1 cells (467,775 cells). The AB solver phase map contained only hexagonal α-Zr. The reconstructed HT phase mask preserved the DREAM.3D cell-level phase fraction, comprising 442,623 α-Zr cells (94.623%) and 25,152 bcc β-Zr cells (5.377%).
Finite-strain uniaxial deformation was imposed along the x direction. Macroscopic shear deformation was prescribed as zero, and the lateral normal directions were traction-free. The AB calculation was used for macroscopic comparison and local-field analysis up to 12.5% axial strain. The HT calculation was continued to 20.0% axial strain to resolve phase and interface-region partitioning. Output fields were saved at regular solver increments.
A phenomenological crystal-plasticity law with phase-specific parameters was used (Table 1). For α-Zr, basal <a>, prismatic <a>, and pyramidal <c + a> slip families were included with Nsl = [3, 3, 0, 12]. These families are consistent with the established slip hierarchy and orientation-dependent plasticity of hcp Zr [17,18,35]. For β-Zr, two bcc slip-family groups were included with Nsl = [12, 12]. Their lower slip resistances represented the compliant response expected for retained β-Zr in a heat-treated α + β morphology [25,26]. The field analysis considered local total strain, von Mises Cauchy stress, axial Cauchy stress, hydrostatic Cauchy stress, accumulated absolute slip, and slip resistance.
Table 1.
Crystal-plasticity parameters used in the DAMASK material files. Slip resistances are listed in the same family order as Nsl.
Macroscopic engineering stress was calculated from the volume-averaged first Piola–Kirchhoff stress component P11. The volume-averaged Cauchy stress
11 was retained for local-field interpretation, whereas macroscopic comparisons used volume-averaged P11. Local-field distributions were summarized by their mean, standard deviation, coefficient of variation, and upper-percentile values. The HT state at 3.2% axial strain was used for phase-resolved maps, phase statistics, and β/α ratios because it lies within the experimentally relevant uniform-deformation regime.
3. Results
3.1. Microstructures Before and After Heat Treatment
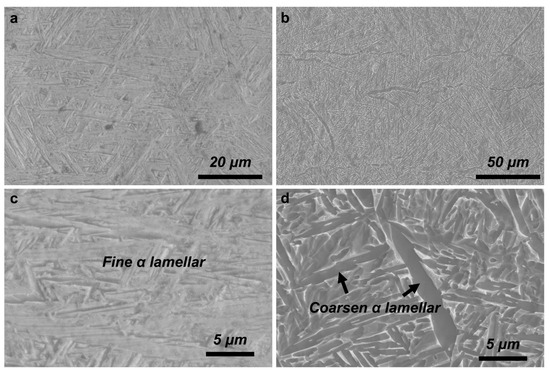
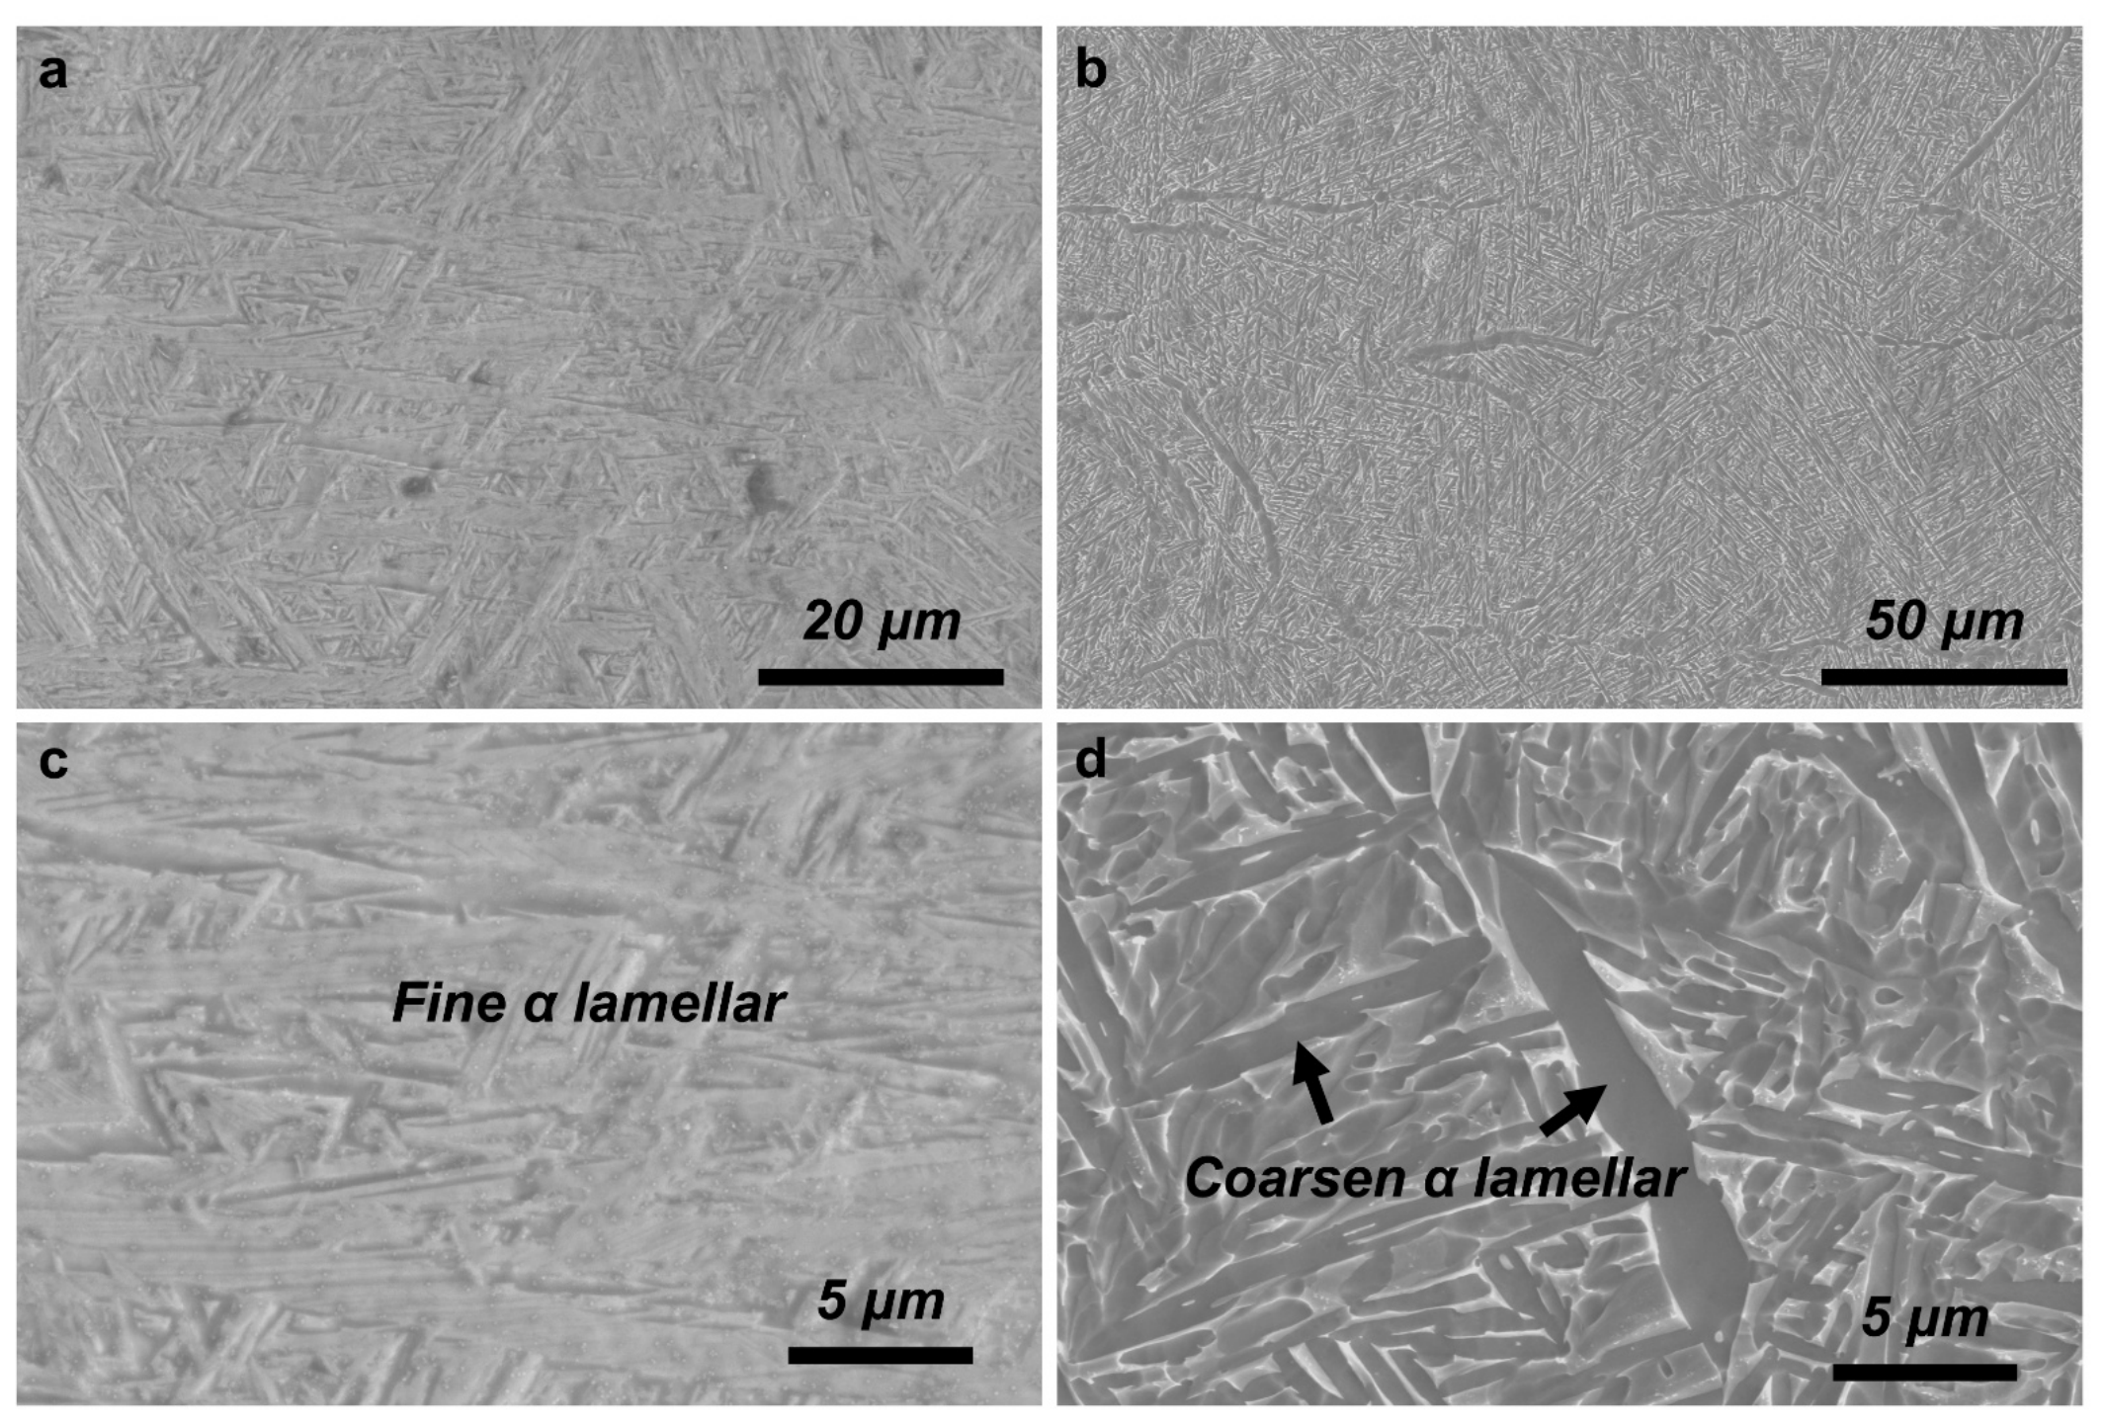
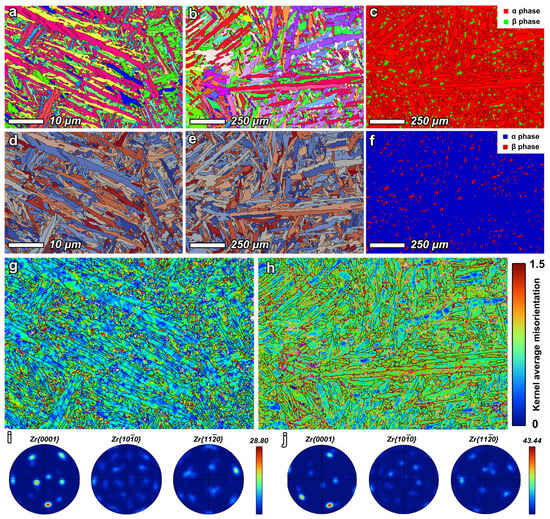
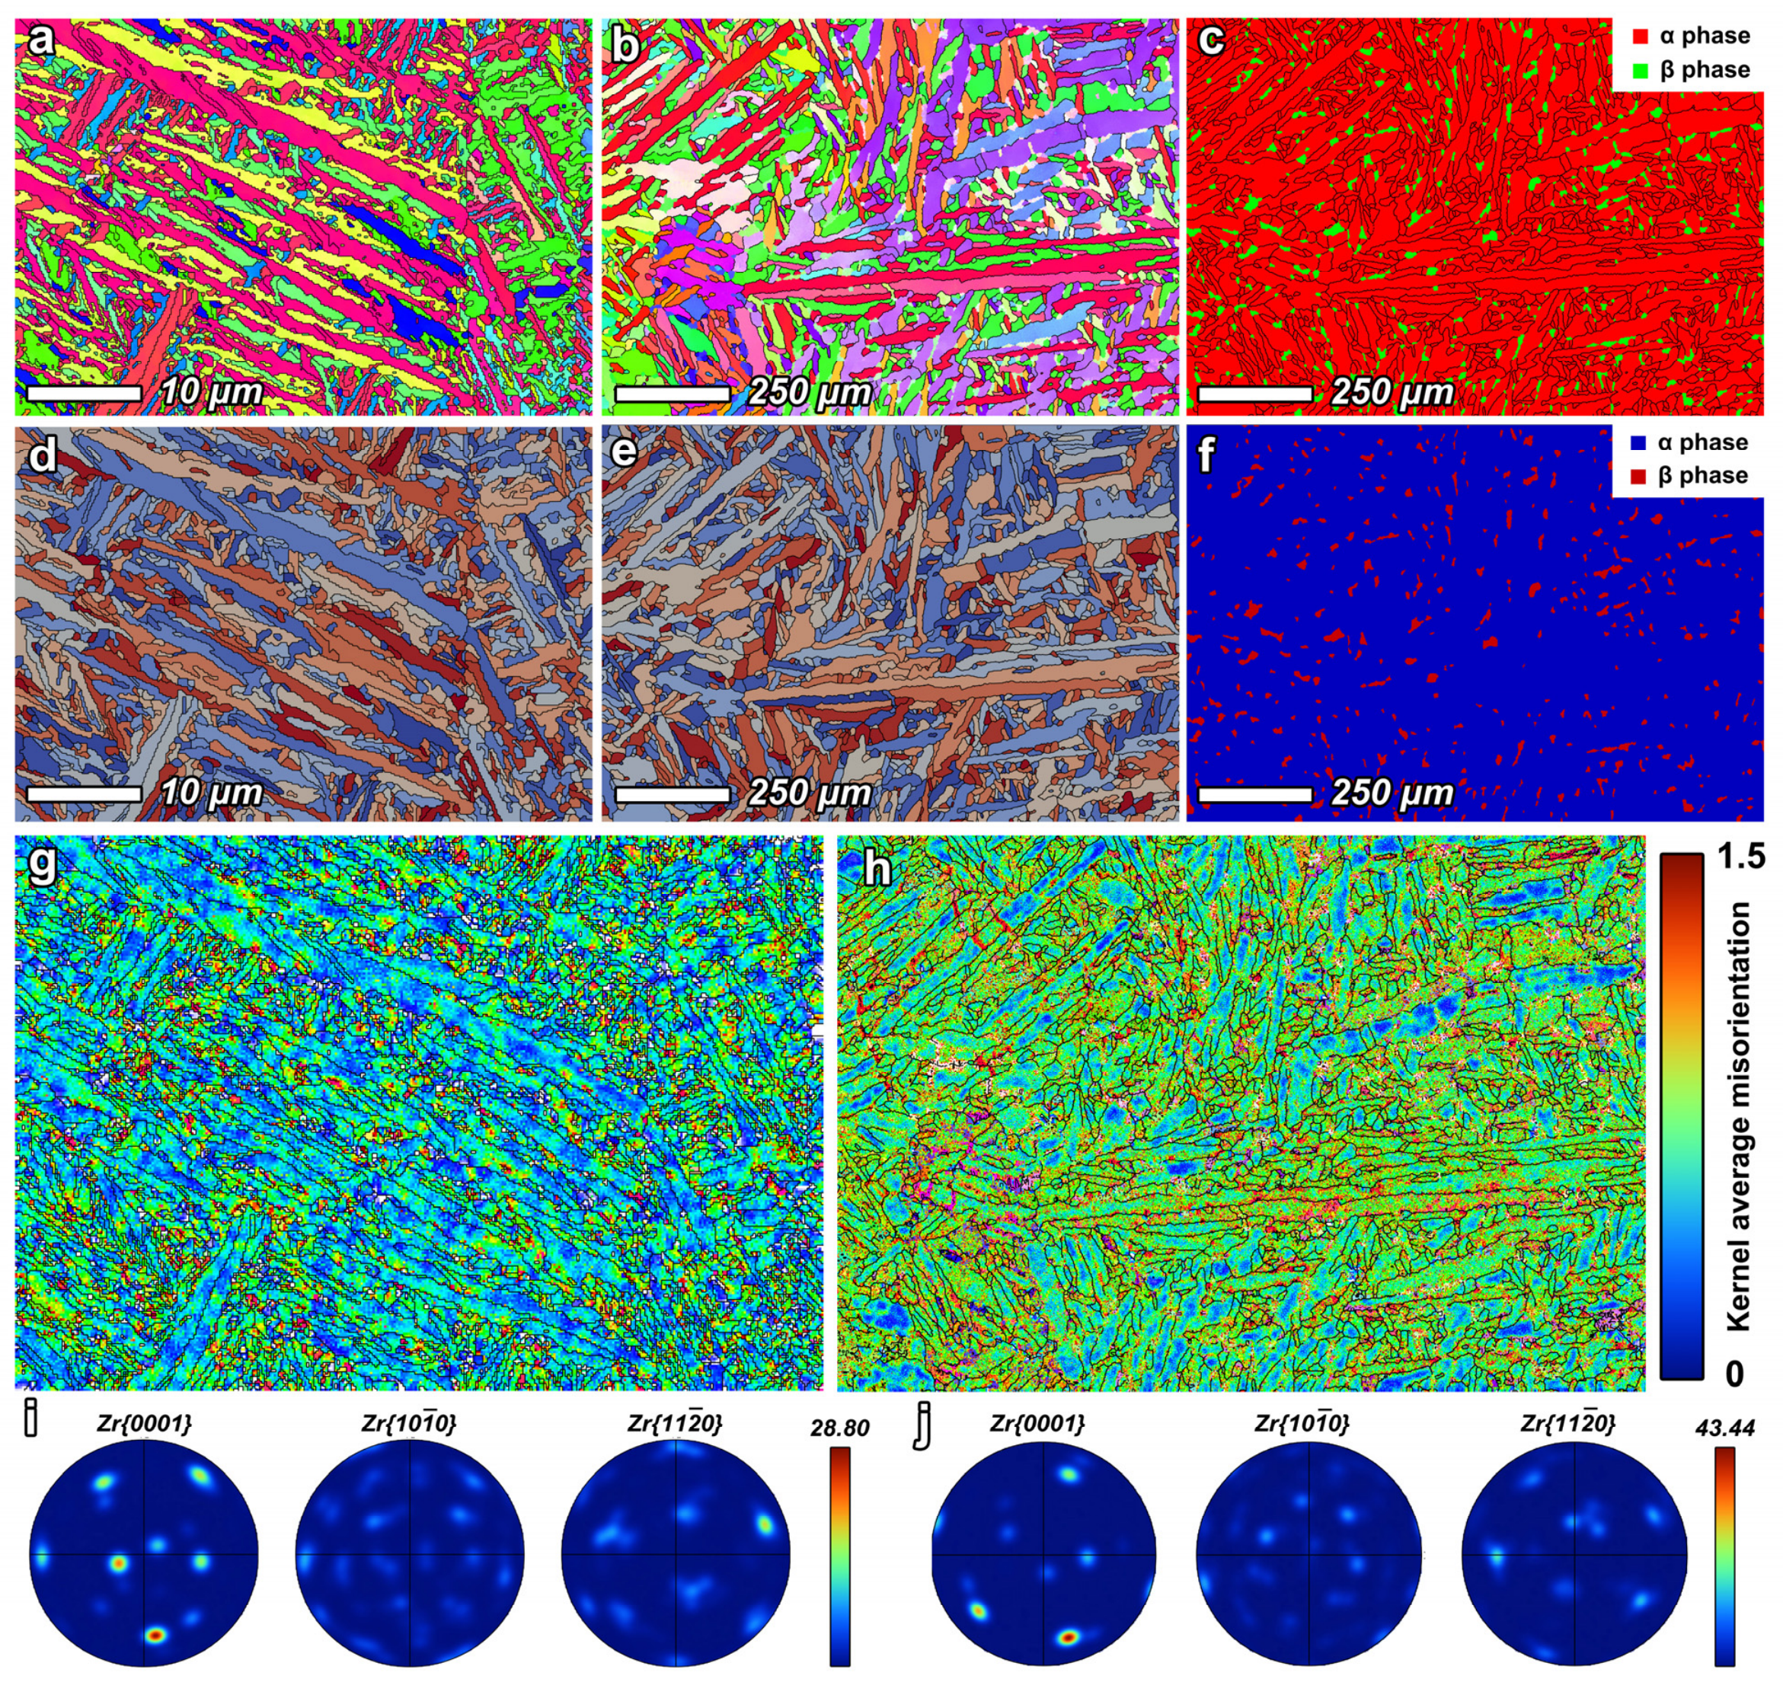
Figure 2 compares the microstructures of the as-built (AB) specimen and the air-cooled specimen annealed in the α + β phase field. The AB specimen consisted primarily of fine, interwoven α′ martensite laths with an average width of approximately 0.40 μm (Figure 2a,c), characteristic of the fine-scale microstructure generated by rapid solidification during LPBF [4,7]. After holding at 800 °C for 2 h followed by air cooling, the heat-treated (HT) specimen retained a lath framework, but the α′ martensite decomposed into an α + β microstructure, with β-Zr distributed mainly between α laths. The mean α-lath width increased to approximately 0.66 μm (Figure 2b,d), about 65% above that in the AB condition. In the EBSD phase maps, no β-Zr was indexed in AB, whereas the measured β-Zr area fraction in the raw HT map was approximately 6.0%. After data cleaning and regular-grid reconstruction, β-Zr accounted for 5.377% of the cells in the HT computational domain (Figure 3d–f). Its spatial distribution between the α laths was retained, providing orientation and phase information corresponding to the measured microstructure for subsequent CPFFT simulations. These observations show that heat treatment promoted α′ martensite decomposition, α-lath coarsening, and β-phase formation, transforming the rapidly solidified structure into a coarsened α + β lath microstructure [11,16].
Figure 2.
SEM microstructures of the AB and HT specimens. (a) Low-magnification image of AB; (b) low-magnification image of HT; (c) high-magnification image of AB, showing fine laths; and (d) high-magnification image of HT, showing widened and locally coarsened α laths. Original scale bars are retained.
Figure 3.
EBSD results for the AB and HT specimens and microstructures used as CPFFT inputs. (a,b) EBSD orientation maps of AB and HT, respectively; (c) EBSD phase map of HT, showing β-Zr distributed mainly between α laths; (d,e) cleaned EBSD/DREAM.3D orientation maps used to construct the representative volume elements for AB and HT, respectively; (f) reconstructed α/β phase map of HT used for CPFFT simulations; (g,h) KAM maps of AB and HT, respectively, both plotted over 0–1.5°; and (i,j) α-Zr pole figures of AB and HT, respectively, with displayed maximum intensities of 28.80 and 43.44.
Kernel average misorientation (KAM) was spatially heterogeneous in both conditions (Figure 3g,h). In AB, local misorientation occurred as bands and discrete spots along the fine laths, indicating pronounced local orientation gradients within the interwoven lath structure formed by rapid solidification. In HT, regions with relatively high KAM were located mainly along some coarsened laths and their neighboring areas. This redistribution indicates that α′ martensite decomposition and lath coarsening altered the local orientation gradients without eliminating intramicrostructural orientation heterogeneity. Meanwhile, the maximum α-Zr pole-figure intensity increased from 28.80 in AB to 43.44 in HT (Figure 3i,j), indicating a higher degree of α-Zr orientation concentration and stronger preferred orientation after heat treatment. Together with α-lath coarsening and formation of the α + β microstructure, the heat treatment was accompanied by selective retention or growth of α orientation variants [12,13,14], which can affect the slip response of individual α laths during subsequent deformation [19,24].
3.2. Room-Temperature Mechanical Properties
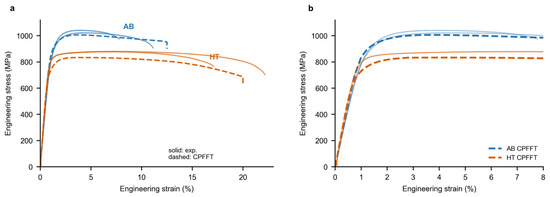
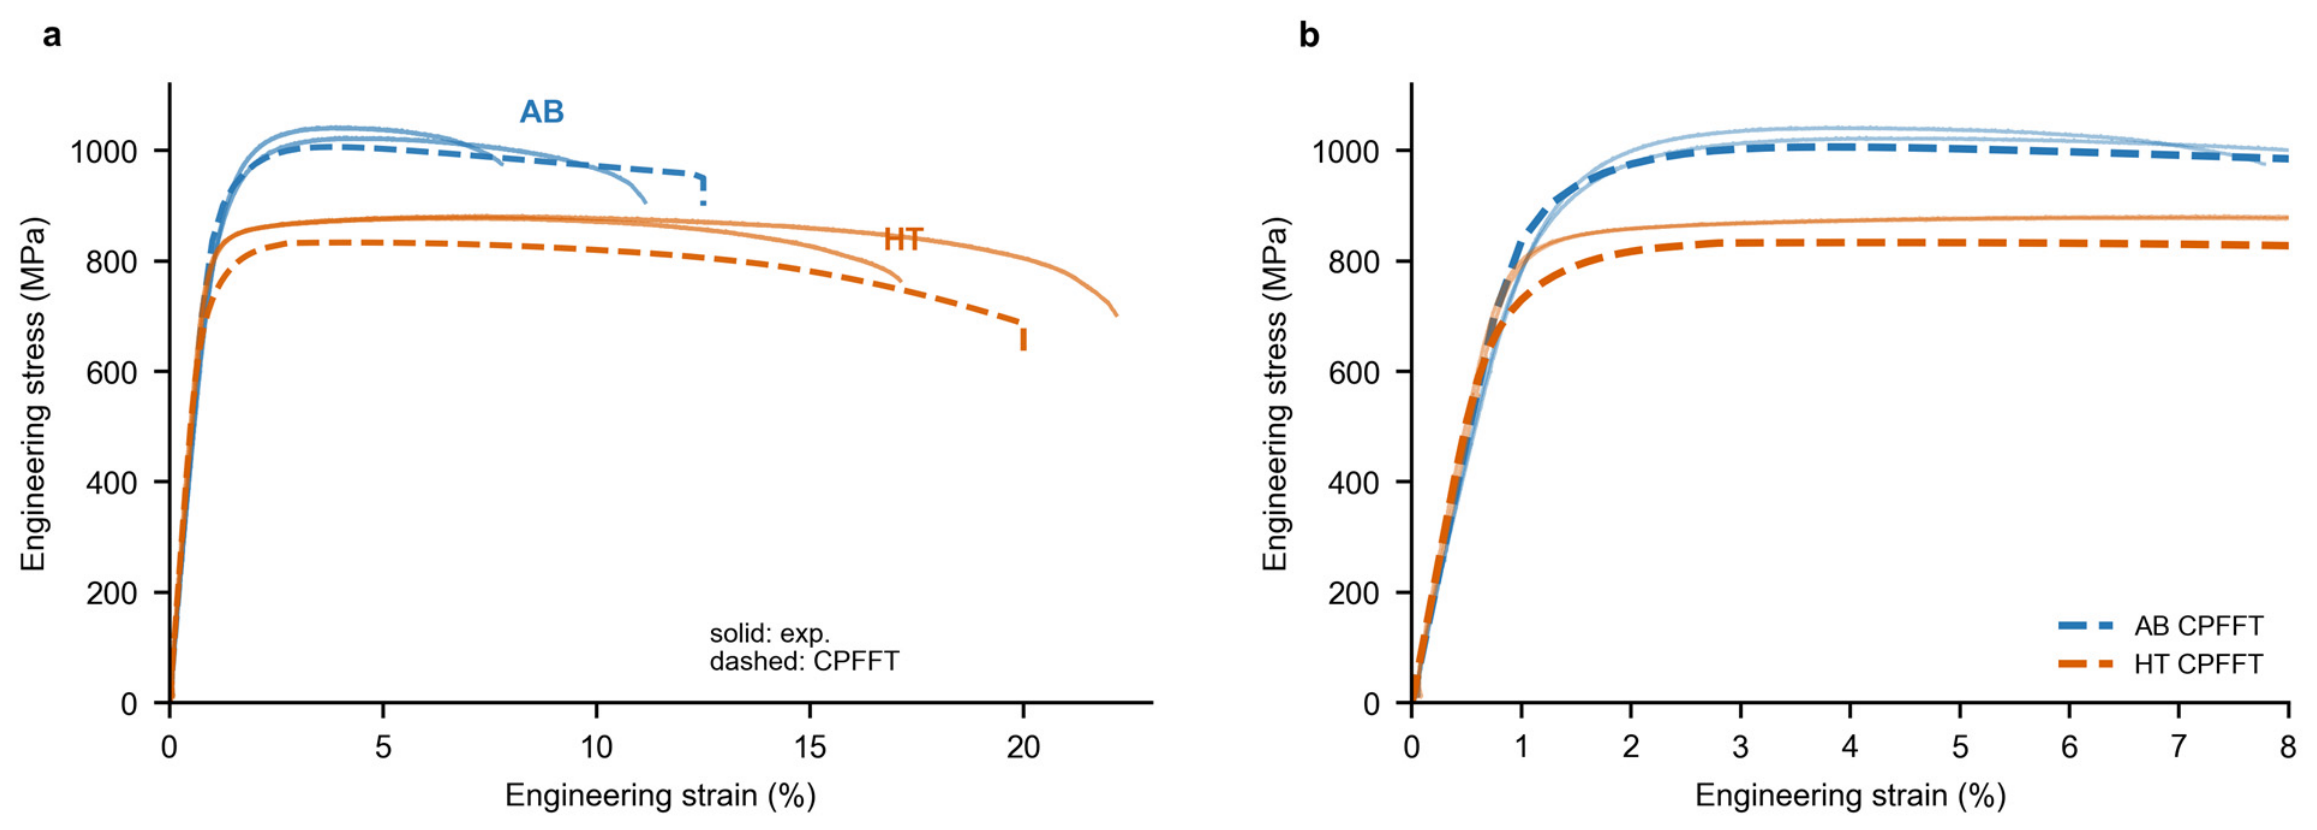
Figure 4 and Table 2 summarize the room-temperature tensile properties of the as-built (AB) and heat-treated (HT) Zr–2.5Nb alloy. The AB specimens exhibited a 0.2% proof stress of 840 ± 10 MPa, an ultimate tensile strength of 1033 ± 13 MPa, a uniform strain of 4.02 ± 0.18%, and a strain before the final load drop of 9.46 ± 2.38%. After holding at 800 °C for 2 h followed by air cooling, the 0.2% proof stress and ultimate tensile strength of HT decreased to 792 ± 9 and 881 ± 2 MPa, respectively, corresponding to reductions of 5.7% and 14.8% relative to AB. The uniform strain and strain before the final load drop increased to 6.94 ± 0.30% and 19.64 ± 3.58%, respectively, corresponding to increases of 72.6% and 107.6%. Heat treatment also reduced the hardness from 288 ± 9.2 to 210 ± 10.5 HV. Overall, air cooling after holding at 800 °C for 2 h reduced strength and hardness while increasing the capacity for plastic deformation.
Figure 4.
Experimental tensile response and macroscopic CPFFT response. (a) Complete experimental engineering stress–strain curves; dashed lines denote the volume-averaged first Piola–Kirchhoff stress P11 from CPFFT. (b) Comparison between experiments and CPFFT simulations in the low-strain regime, used to examine the macroscopic response before necking. In both panels, solid lines represent the experimental measurements, and dashed lines represent the CPFFT simulations.
Table 2.
The room-temperature mechanical properties of AB and HT specimens.
Figure 4 further compares the experimental engineering stress–strain curves with the CPFFT predictions. Stress increased rapidly at the onset of deformation in both AB and HT, after which the rate of increase progressively declined. After plastic deformation began, dislocation multiplication and accumulation dominated the initial work-hardening response. With increasing strain, stress continued to rise, while the work-hardening rate gradually decreased [24,35]. Within the uniform-deformation range examined in Figure 4b, the CPFFT curves showed good overall agreement with the experimental curves. They reproduced the initial stress rise, elastic-to-plastic transition, post-yield work hardening, and corresponding flow-stress levels in both conditions. They also captured the higher flow stress of AB and lower strength of HT. This agreement indicates that the constitutive parameters describe the pre-necking macroscopic tensile responses of both microstructures, supporting subsequent analyses of local stress, strain, and slip.
3.3. Fracture Morphology
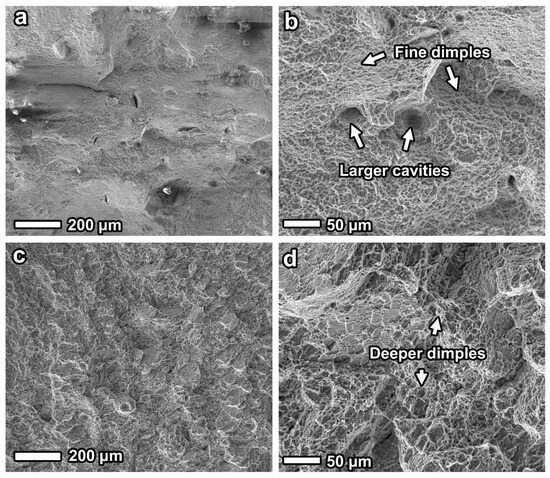
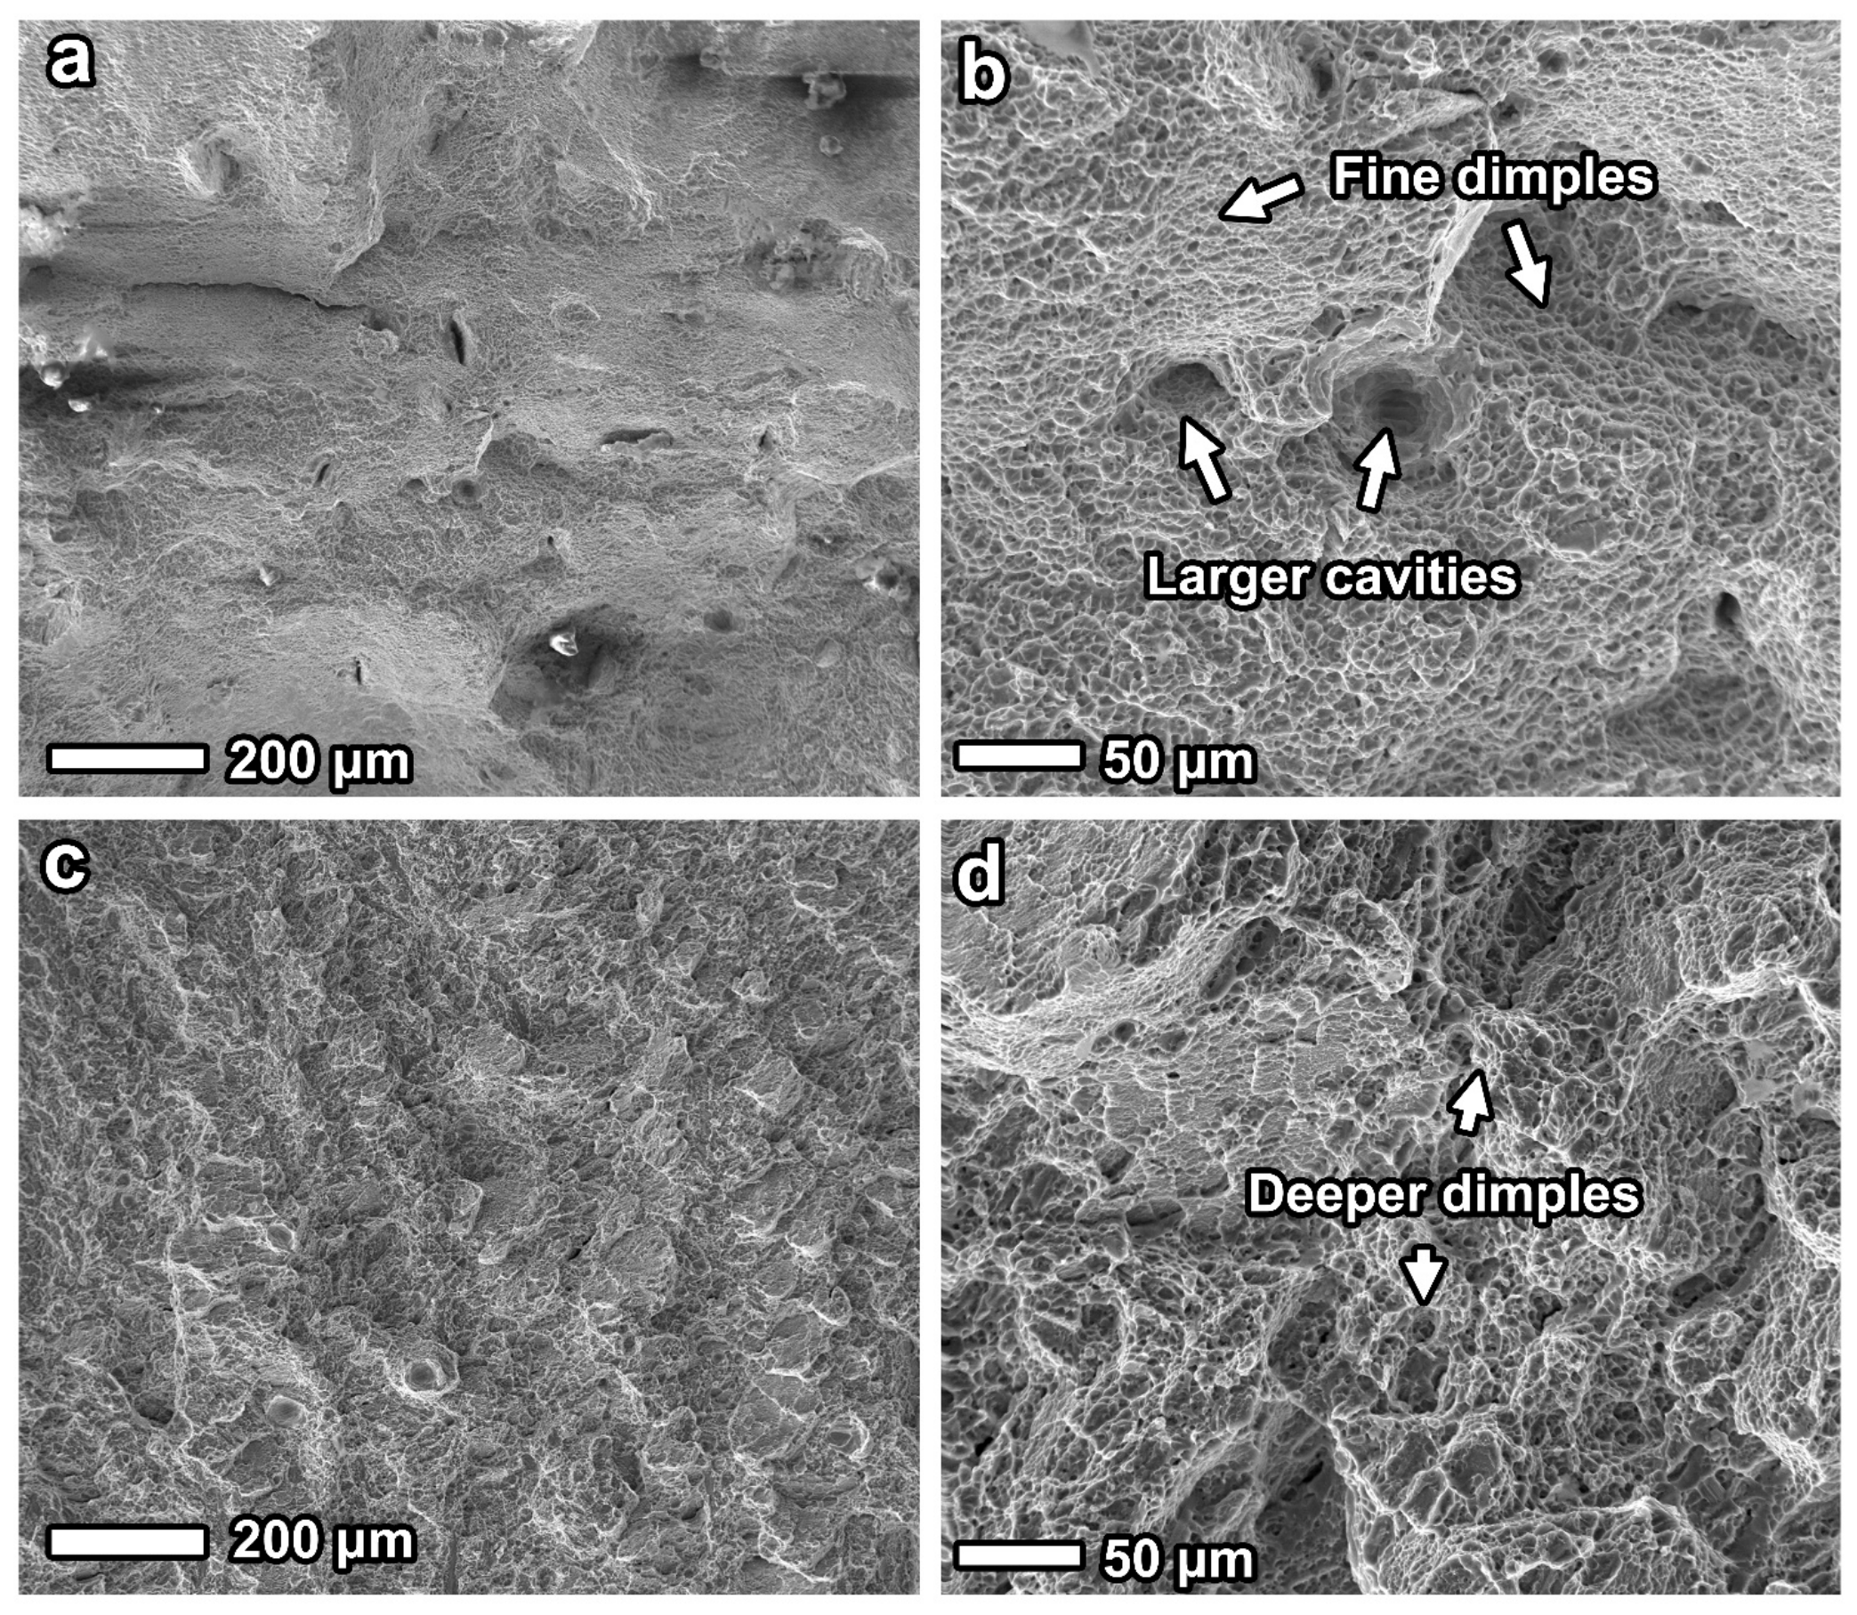
Figure 5 shows the fracture surfaces of the AB and HT specimens. Dimples, large pores, and tearing ridges were observed in both conditions, indicating ductile fracture governed mainly by microvoid nucleation, growth, and coalescence. The AB fracture surface contained numerous small, shallow dimples, together with large pores and locally flat regions. By contrast, HT showed deeper dimples and more pronounced tearing ridges, indicating more extensive plastic deformation before fracture. This morphology is consistent with the higher uniform strain and strain before the final load drop of HT.
Figure 5.
SEM fracture morphology after room-temperature tensile testing. (a,b) Low- and high-magnification fracture surfaces of AB, showing small dimples, large pores, and locally flat regions; (c,d) low- and high-magnification fracture surfaces of HT, showing deeper dimples and more pronounced tearing ridges. Original scale bars are retained.
The fine, interwoven α’ martensite laths in AB created a high density of lath interfaces. By impeding dislocation slip, these interfaces promoted dislocation pile-up during plastic deformation and generated local stress concentrations [19,24,26,35]. The fine laths also restricted the space available for dislocation motion and storage, limiting the ability of sustained plastic flow to relax stress concentrations near crack tips. Once microvoids nucleated at local stress concentrations, neighboring voids readily coalesced along localized deformation bands, producing fracture surfaces with small, shallow dimples and locally flat regions. Thus, although AB exhibited higher strength, it accommodated comparatively little plastic deformation before fracture.
After holding at 800 °C for 2 h, α’ martensite decomposed, α laths coarsened, and the β phase formed between α laths. The coarser α laths provided more space for dislocation glide and storage, allowing plastic deformation to spread over a larger region [9,16,36]. Subsequent CPFFT results (Figure 6, Figure 7 and Figure 8 and Table 3) further show that for the present HT microstructure and constitutive parameters, β exhibited higher phase-average equivalent strain and accumulated slip. This response allowed β to accommodate more local plastic deformation and mitigate deformation incompatibility between adjacent α laths and stress concentrations near microcrack tips. Consequently, microvoids in HT could grow more extensively after nucleation, delaying void coalescence and crack propagation and producing deeper dimples and more pronounced tearing ridges. Together, the fractography and tensile results show that the 800 °C heat treatment increased the capacity of LPBF Zr–2.5Nb to accommodate plastic deformation before fracture by modifying the lath dimensions and phase distribution.
Figure 6.
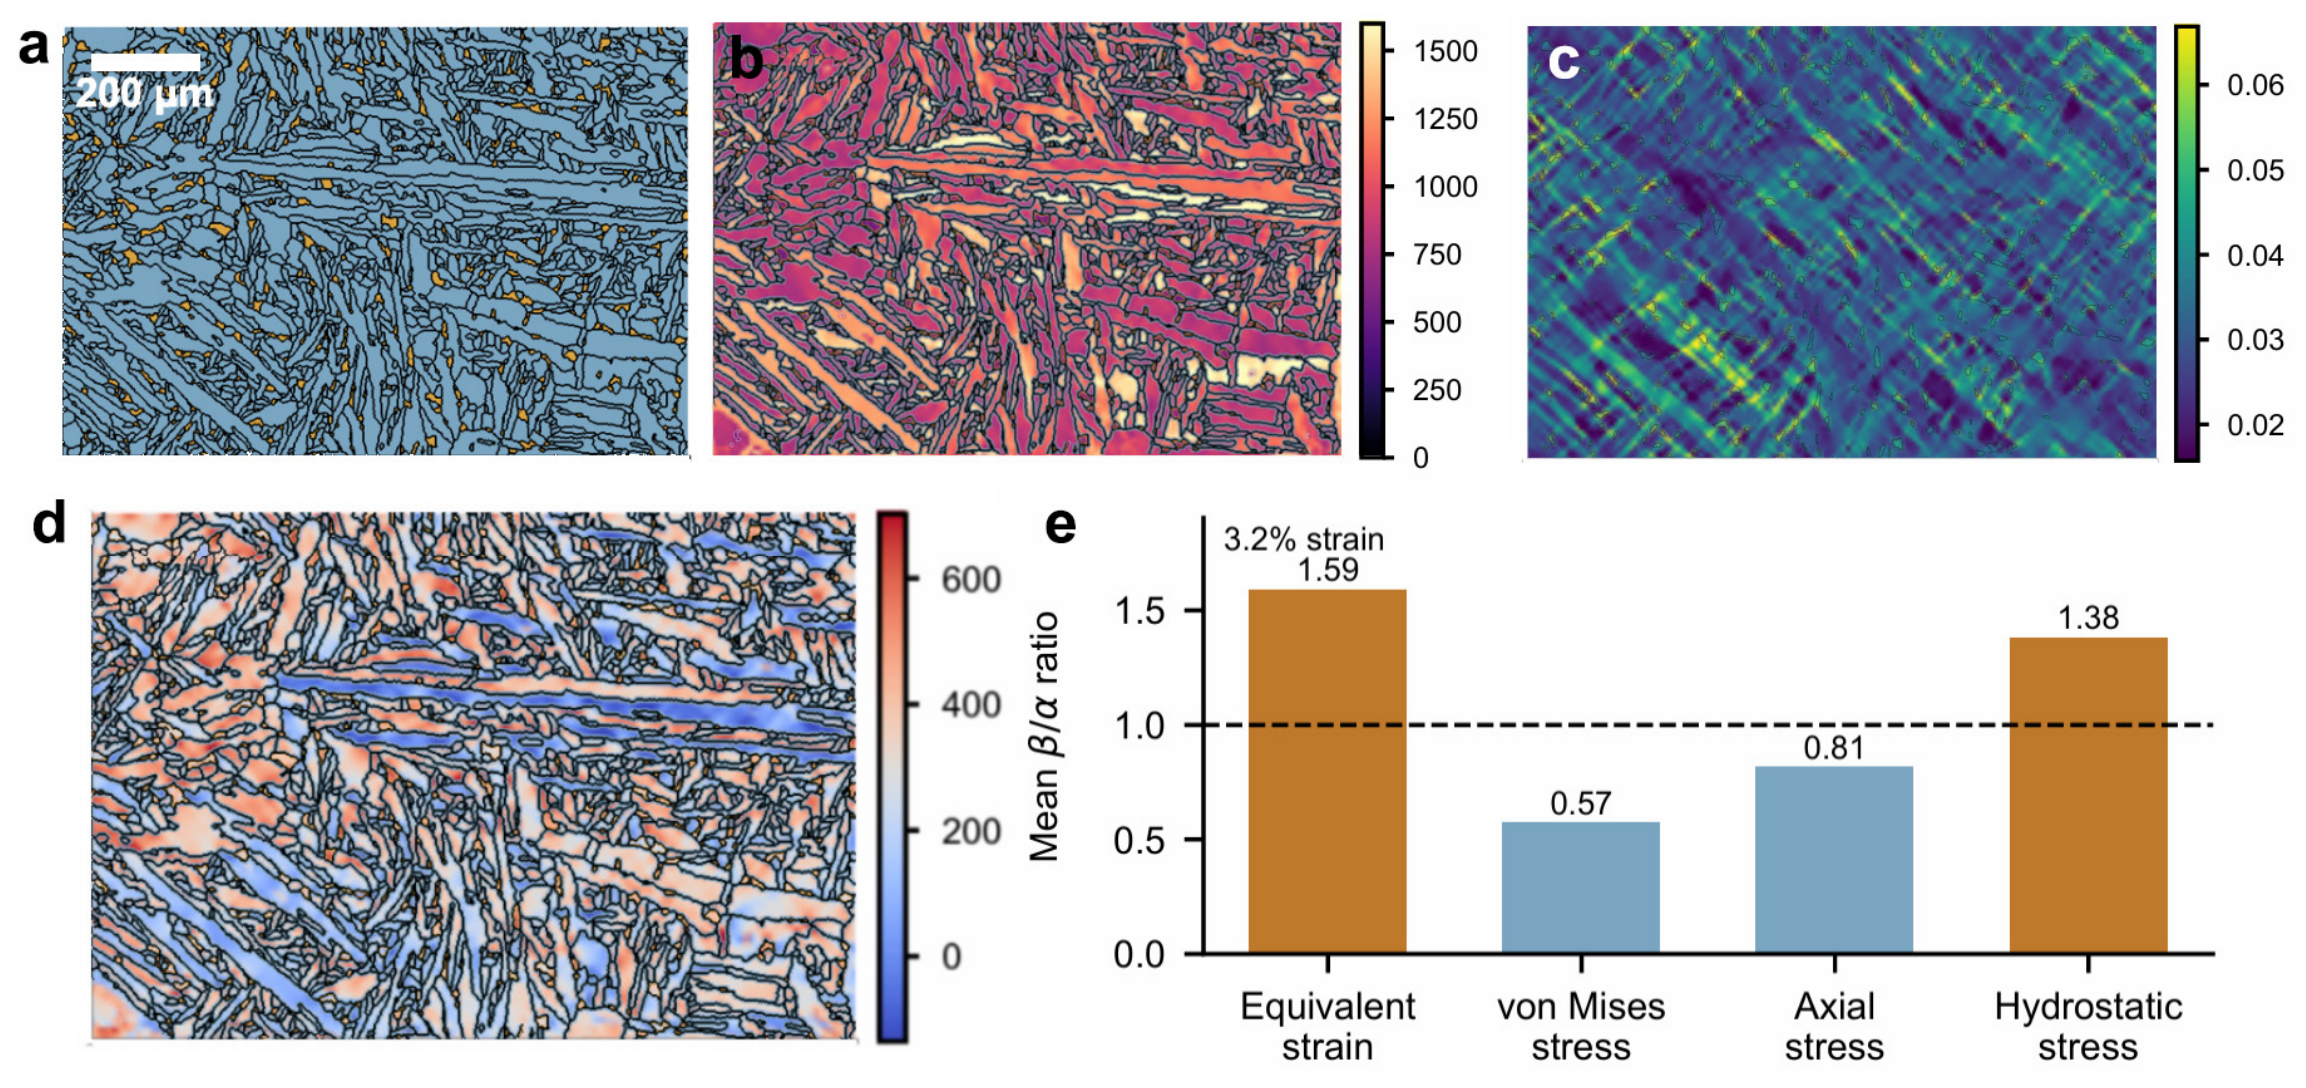
Phase distribution and local fields in the representative HT volume element at 3.2% axial strain. (a) HT α/β phase map, with β-Zr distributed between α laths; (b) von Mises Cauchy stress field; (c) equivalent total strain field; (d) hydrostatic Cauchy stress field; and (e) mean β/α ratios of equivalent strain, von Mises stress, axial stress, and hydrostatic stress.
Figure 7.
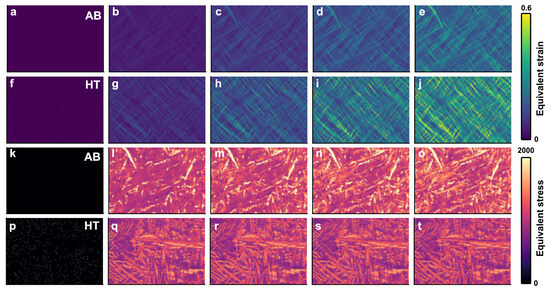
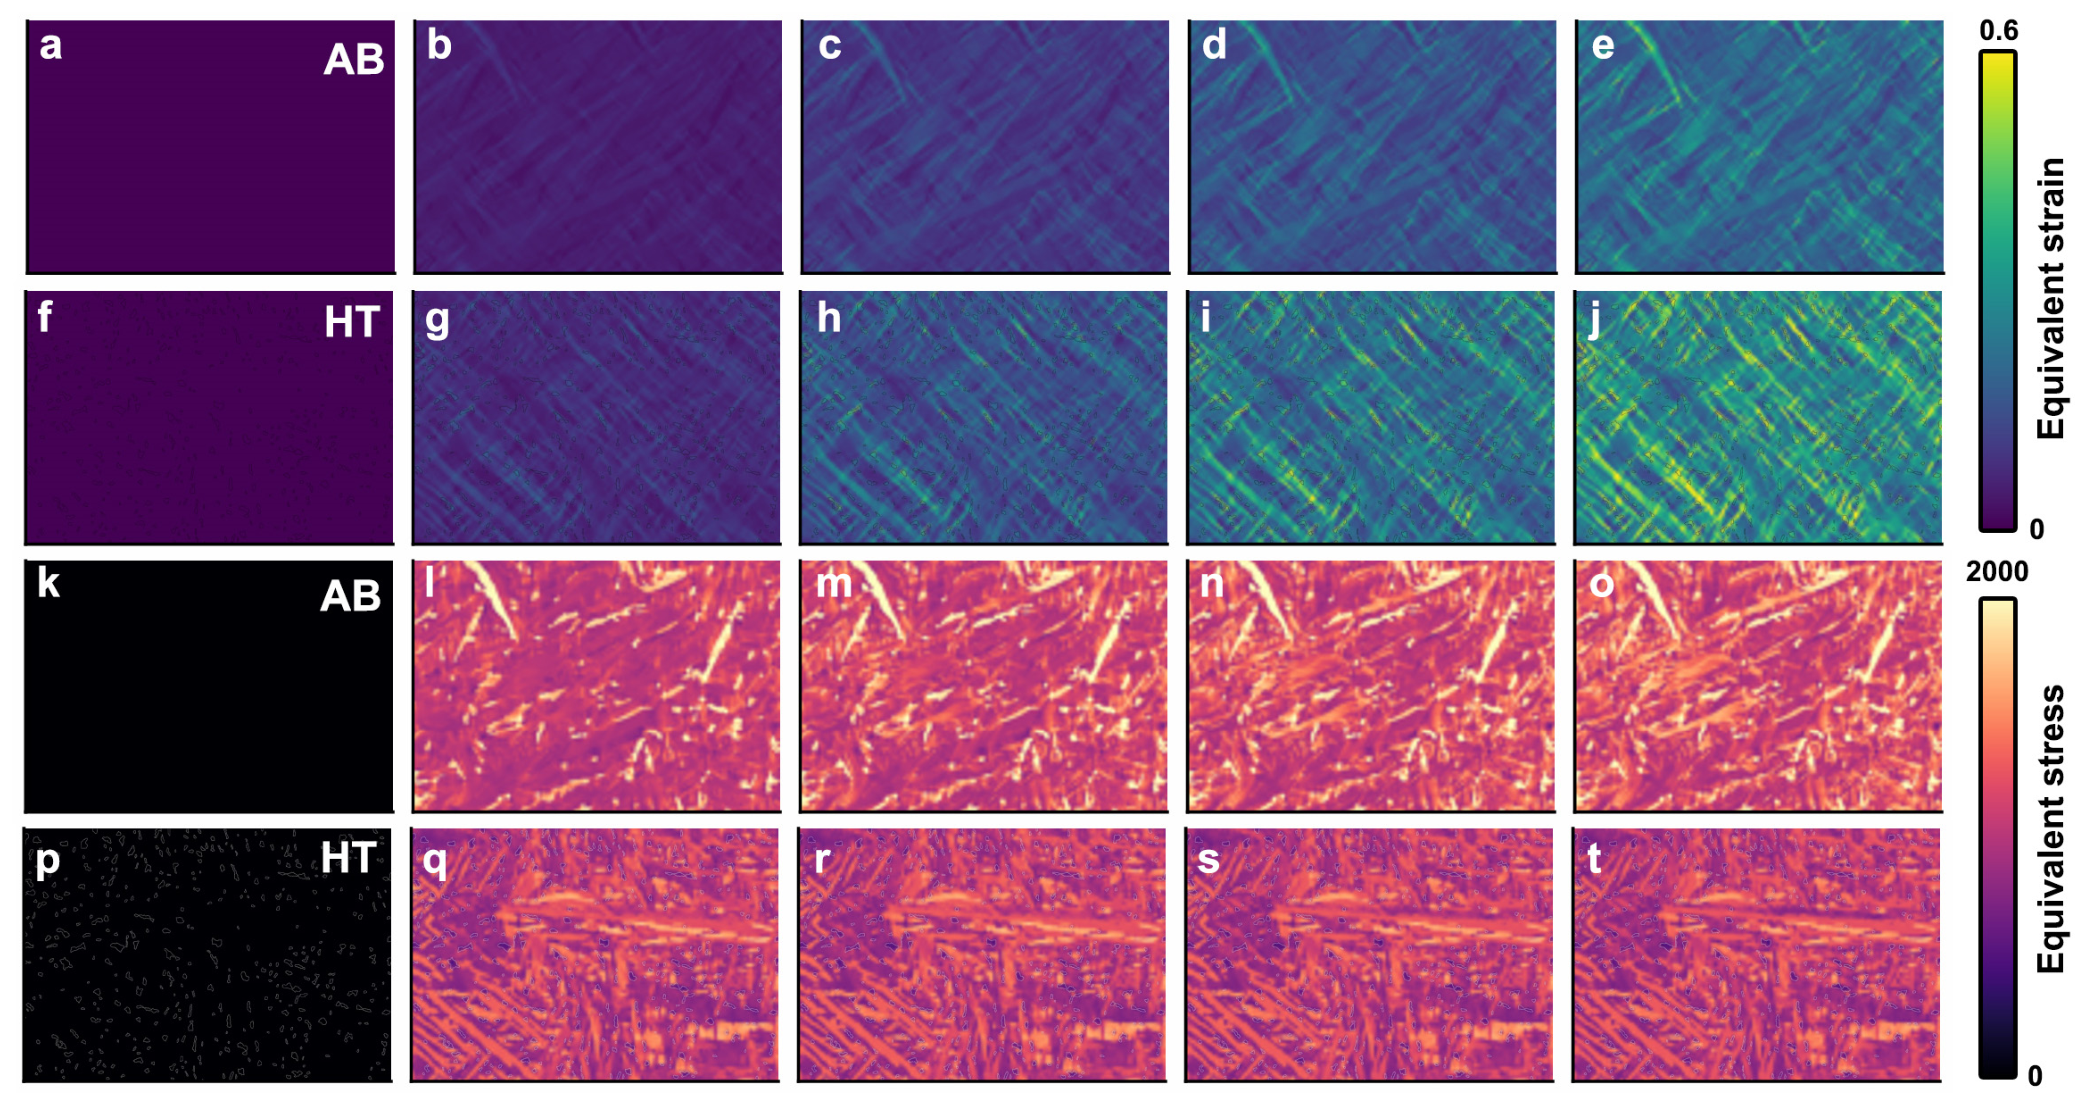
Evolution of the CPFFT local fields in the AB and HT states. (a–e) Equivalent strain in AB at axial strains of 0%, 3.2%, 6.2%, 9.5%, and 12.5%; (f–j) equivalent strain in HT at axial strains of 0%, 5.0%, 10.0%, 15.0%, and 20.0%; (k–o) von Mises stress in AB at the same five AB strain states; and (p–t) von Mises stress in HT at the same five HT strain states. Each group uses a fixed absolute color scale: 0–0.60 for AB equivalent strain, 0–0.48 for HT equivalent strain, 0–1600 MPa for AB von Mises stress, and 0–1280 MPa for HT von Mises stress.
Figure 8.
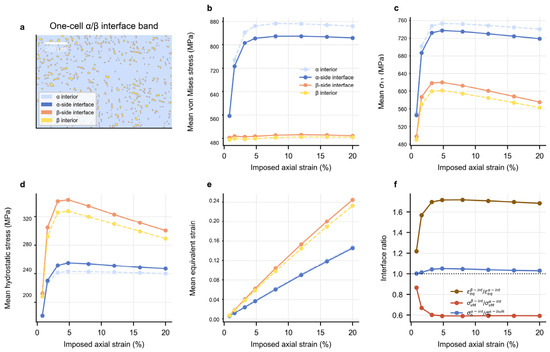
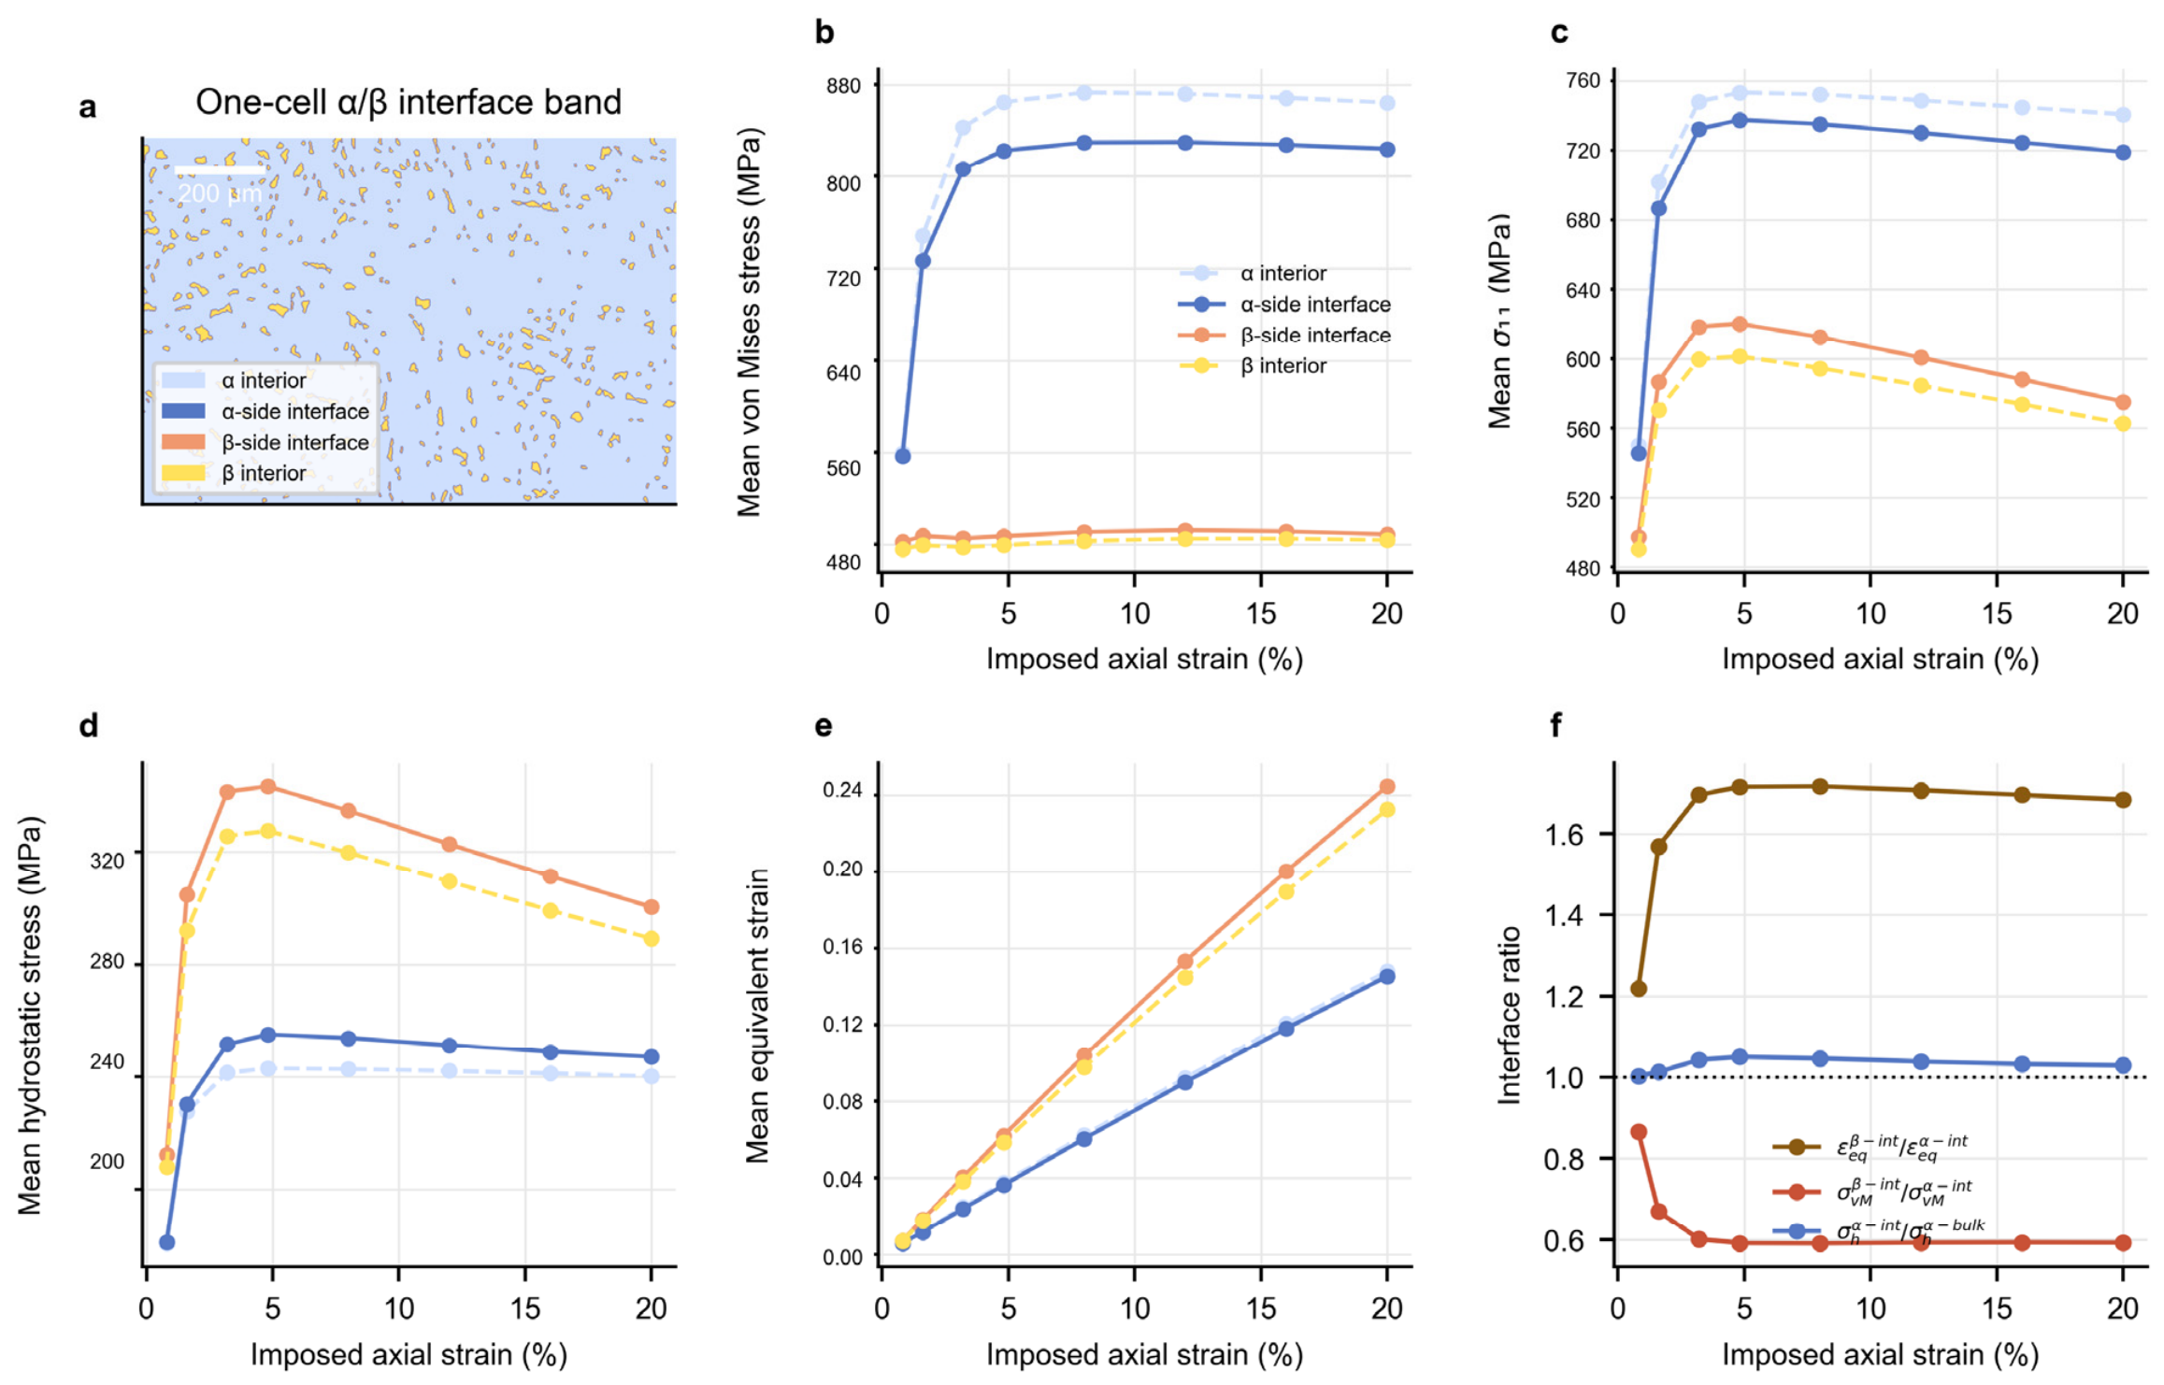
Stress and strain responses on both sides of α/β interfaces in the representative HT volume element. (a) One-cell-thick α/β interfacial band and the α interior, α-side interface, β-side interface, and β interior regions; (b) mean von Mises stress of the four regions versus axial strain; (c) mean axial Cauchy stress σ11; (d) mean hydrostatic Cauchy stress; (e) mean equivalent total strain; and (f) β-side/α-side ratios of equivalent strain, von Mises stress, and hydrostatic stress, together with the α-side/α-interior ratio of hydrostatic stress.
Table 3.
Phase-resolved statistics of the local fields in the representative HT volume element at 3.2% axial strain.
4. Discussion
4.1. Microstructural Evolution During Heat Treatment and Its Relation to Mechanical Properties
The microstructural changes in Figure 2 and Figure 3 reflect the transformation from fine α’ martensite to a coarsened α + β lamellar structure. Li et al. [15] showed that annealing temperature and cooling route jointly affect the phase fractions, dimensions, and elemental distributions in LPBF Zr–2.5Nb. Studies of conventionally processed and additively manufactured Zr–2.5Nb likewise reported strong effects of the α + β phase-field temperature and cooling conditions on phase constitution, lath size, and mechanical properties [8,9,10,36]. After holding at 800 °C for 2 h, the metastable α’ martensite in the AB microstructure decomposed. Thermodynamic driving forces promoted the outward diffusion of supersaturated Nb from α’ martensite and its segregation between α laths, thereby facilitating β-phase formation [1,2].
Decomposition of α’ martensite and Nb redistribution were accompanied by α-phase coarsening. The raw HT EBSD phase map gave a β-Zr area fraction of approximately 6.0%. After data cleaning and regular-grid reconstruction, β-Zr cells accounted for 5.377% of the computational domain. The reconstructed fraction remained close to the EBSD value, and the distribution of β-Zr between α laths was preserved (Figure 3c,f). Thermodynamically, increasing temperature stabilizes the high-temperature β phase and increases its equilibrium fraction, although it is not fully retained during subsequent cooling [1,2,11,15,36]. As the principal β stabilizer, Nb allows Nb-rich β to persist after air cooling, whereas less stable β retransforms to α or α’ [15]. The microstructure obtained after holding at 800 °C for 2 h and air cooling therefore reflects α’ decomposition, Nb redistribution, and cooling-induced transformation. It ultimately comprises coarsened α laths with a mean width of approximately 0.66 μm and retained β phase between α laths. Heat treatment also strengthened the preferred orientation of the α phase. Orientation inheritance, variant selection, and α/β co-deformation during transformation can modify the final α-phase orientation distribution [12,13,14]. Because basal, prismatic, and pyramidal slip in hexagonal α-Zr have different critical resolved shear stresses [17,18], their activation depends on crystal orientation and constraints from neighboring laths [27,28]. The mechanical changes induced by heat treatment therefore reflect not only phase constitution and lath size, but also the altered α-phase orientation distribution.
The microstructural evolution described above accounts for the concurrent changes in strength and ductility. In the AB specimen, fine interlocking α’ martensite laths and pronounced local orientation gradients strongly impeded dislocation slip, increasing resistance to deformation. Decomposition of α’ martensite, dislocation recovery, and α-lath coarsening during heat treatment reduced these constraints. Accordingly, the 0.2% proof stress and ultimate tensile strength decreased from 840 and 1033 MPa to 792 and 881 MPa, respectively. Hardness decreased from 288 to 210 HV. Meanwhile, coarsened α laths provided more space for dislocation glide, while the β phase between α laths accommodated local plastic deformation. Uniform strain consequently increased from 4.02% to 6.94%, and strain before the final load drop increased from 9.46% to 19.64%. The strength reduction is primarily associated with lower slip resistance after α’ decomposition, recovery, and lath coarsening. The improved ductility reflects the coordinated accommodation of deformation by coarsened α laths and the β phase between α laths [37].
4.2. Local Responses of the α and β Phases in the HT Microstructure
Figure 6 aligns the phase distribution in the HT microstructure with the local mechanical fields at 3.2% axial strain. β-Zr occurs primarily between α laths (Figure 6a). High von Mises stresses are concentrated mainly within α laths (Figure 6b), whereas equivalent-strain hotspots occur more often in some β regions and neighboring α laths (Figure 6c). Hydrostatic-stress hotspots do not fully overlap either distribution (Figure 6d). Pronounced stress and strain gradients also remain within each phase. Not every β region exhibits high strain, and local strain bands can develop within the α phase. Phase identity therefore governs the average contrast between the two phases. The precise hotspot locations additionally reflect crystal orientation, α-lath arrangement, and constraints from neighboring regions [19,24,26]. Diffraction studies of Zr–2.5Nb similarly show that intergranular stress varies substantially with crystallographic orientation and processing condition [38,39].
Phase-specific statistics in Figure 6e and Table 3 quantify these differences. At 3.2% axial strain, the mean equivalent strains of α and β were 0.030768 and 0.048936, respectively, giving a β/α ratio of 1.59. The respective mean accumulated absolute slips were 0.056160 and 0.141120, with β reaching 2.51 times the α value. Under the present HT microstructure and strain state, β therefore exhibited 59% more mean deformation and 151% more accumulated slip than α. Accumulated absolute slip sums the absolute shear increments over all slip systems and is more sensitive to multislip activity than equivalent total strain [29,31]. Its larger phase ratio, 2.51 versus 1.59, therefore indicates more extensive slip activity in β.
The phase ordering of deviatoric and axial stresses was opposite to that of equivalent strain. The mean von Mises and axial stresses were 841.6 and 747.5 MPa in α, compared with 480.6 and 608.0 MPa in β. These values give β/α ratios of 0.57 and 0.81, respectively. Conversely, the mean von Mises and axial stresses in α were approximately 1.75 and 1.23 times those in β. Under the same macroscopic deformation, β accumulated more plastic strain through greater slip activity. The α laths, however, maintained higher deviatoric and axial tensile stresses. The mean axial stress in β still reached 608.0 MPa. Thus, β accommodated more plastic deformation while continuing to carry a substantial axial load.
Both initial and saturation slip resistances assigned to the two β slip-system families were lower than their α-phase counterparts. Rate-dependent crystal plasticity describes plastic flow through shear rates on individual slip systems [23,29,31]. With the parameters in Table 1, lower slip resistance enables β to develop greater plastic shear at lower resolved shear stress. The additional slip accommodates local deformation and limits further accumulation of deviatoric stress. By contrast, α has higher slip resistance, and its basal, prismatic, and pyramidal slip systems respond strongly to orientation. It consequently retains higher von Mises and axial stresses [24,37]. The resulting local response combines greater mean deformation and slip in β with higher deviatoric and axial stresses in α. Previous studies show that β-Zr elastoplasticity and relative phase hardness alter stress and strain partitioning in two-phase Zr–2.5Nb [21,40]. The phase ordering reported here remains specific to the parameters in Table 1 and the present HT field of view.
Hydrostatic stress displayed a different phase relationship. The mean hydrostatic stresses were 332.8 MPa in β and 241.9 MPa in α, giving a β/α ratio of 1.38. This ordering is opposite to those of the von Mises and axial stresses. Von Mises stress measures the deviatoric stress level, whereas hydrostatic stress is the mean of the three normal stress components. The β phase between α laths can relax deviatoric-stress accumulation through plastic shear, while the surrounding α laths constrain its transverse deformation. This combination permits a higher mean normal stress in β despite its lower von Mises stress. Phase compatibility therefore does not require every stress measure to rise or fall synchronously. Instead, different combinations of deviatoric, axial, and hydrostatic stress maintain local deformation continuity [38,39].
Figure 7 extends the single strain state in Figure 6 across the simulated loading sequence. In the AB microstructure, equivalent strain progressively localizes within a limited number of lath bands (Figure 7a–e). Adjacent regions continue to exhibit high von Mises stress (Figure 7k–o). In HT, strain hotspots occur across more lath regions and spread along the β phase between α laths and into neighboring regions (Figure 7f–j). High von Mises stress remains concentrated mainly in α laths (Figure 7p–t). The spatial separation between strain and stress hotspots therefore persists throughout loading rather than appearing only at 3.2% strain. Broader participation in plastic deformation is consistent with the increase in uniform strain from 4.02% to 6.94% (Figure 4). The deeper dimples and more pronounced tear ridges on the HT fracture surface also indicate more extensive plastic flow before fracture (Figure 5c,d).
4.3. Local Responses in Regions Adjacent to α/β Interfaces
To determine whether the phase-averaged differences persist in directly adjacent α and β regions, Figure 8a partitions the HT domain into four cell categories: α interior, α-side interface, β-side interface, and β interior. The α-side and β-side interfaces each comprise one grid-cell layer directly adjacent to the α/β interface. Together, these layers occupy 5.30% of the computational domain. The remaining α and β cells are assigned to their respective interiors. This partition resolves whole-phase statistics on each side of the interface, enabling comparison of phase contrast and interface-neighborhood effects.
Throughout loading, the mean von Mises and axial stresses in the α interior and α-side interface remain above those in both β regions. Conversely, the β interior and β-side interface exhibit higher mean equivalent strains (Figure 8b–e). The β-side interface shows slightly higher equivalent strain and stress measures than the β interior. β cells directly constrained by α laths therefore accumulate more plastic deformation while carrying higher stresses than β-interior cells. The α-side interface displays a different combination. Its mean von Mises and axial stresses are slightly lower than those in the α interior, whereas its hydrostatic stress is slightly higher. Direct α/β adjacency therefore changes the balance among deviatoric, axial, and mean normal stresses rather than shifting all components in parallel.
At 3.2% axial strain, the equivalent-strain ratio between the β-side and α-side interfaces is 1.70. Thus, mean deformation on the β side is 70% greater than on the α side. The corresponding von Mises stress ratio is 0.60, indicating a markedly higher deviatoric stress on the α side (Figure 8e,f). From the mean hydrostatic stresses in Figure 8d, the β-side/α-side ratio is 1.36. The β side therefore experiences a stronger mean normal-stress constraint while undergoing greater plastic deformation. The α-side/α-interior hydrostatic-stress ratio is 1.04 (Figure 8f), corresponding to an average difference of only about 4%. Thus, the principal interface-neighborhood contrast occurs across the β and α sides. Position within the α phase has comparatively little effect on its mean hydrostatic stress.
The interfacial statistics preserve the same phase ordering as the whole-phase averages. The whole-phase β/α ratios of equivalent strain, von Mises stress, and hydrostatic stress are 1.59, 0.57, and 1.38. The corresponding ratios across the two interfacial sides are 1.70, 0.60, and 1.36. These averages cover different domains and are therefore not identical statistics. Their similar ordering and magnitude nevertheless show that the higher β deformation and higher α deviatoric stress also occur in directly adjacent cells. They are not produced solely by a few phase-interior regions remote from the interface. Displacement continuity across the interface does not require equal equivalent strains or intraphase stresses on both sides. Greater β-side plastic deformation and higher α-side deviatoric stress jointly maintain local deformation compatibility [20,25,30,31,37].
The stresses in Figure 8b–d rise rapidly during early loading, then plateau or decrease gradually after approximately 3–5% axial strain. Equivalent strain continues to increase with applied strain (Figure 8e). Accordingly, the β-side/α-side equivalent-strain ratio rapidly approaches approximately 1.70, while the von Mises stress ratio declines to approximately 0.60 (Figure 8f). Both ratios remain comparatively stable thereafter. Under the present microstructure and loading conditions, the phase contrast in stress and deformation is established mainly during early plastic flow. Subsequent deformation continues to partition between the phases in nearly constant proportions. β-side cells accumulate greater plastic strain, whereas α laths maintain higher von Mises and axial stresses. This response allows more regions between α laths to participate in plastic deformation. It corresponds to the spreading HT strain hotspots in Figure 7, the longer uniform-deformation regime in Figure 4, and the deeper dimples in Figure 5. The interface-neighborhood response is therefore not characterized by a single stress-concentration mode. Instead, higher α-side deviatoric stress coexists with greater β-side plastic strain, and this differentiated response maintains local deformation continuity.
These local responses link the heat-treatment-induced microstructural evolution to the macroscopic strength–ductility changes. A’ decomposition, dislocation recovery, and lath coarsening reduce barriers to dislocation motion, consistent with the lower proof stress, ultimate tensile strength, and hardness [8,9,10,11,15,16,36]. The local fields further show that β regions between α laths and their surroundings accommodate more plastic deformation (Figure 6, Figure 7 and Figure 8 and Table 3). This distribution reduces the tendency for strain to localize prematurely within only a few lath bands. The more dispersed plastic flow is consistent with the higher uniform strain, greater strain before the final load drop, and deeper dimples in HT (Figure 4 and Figure 5). The tensile response therefore reflects the combined effects of α’ decomposition, Nb redistribution, α-lath coarsening, β-phase formation, and changes in α-Zr orientation distribution. It cannot be attributed solely to the change in β-Zr fraction. Previous studies of two-phase Zr–2.5Nb likewise show that interphase constraint, load partitioning, and local orientation jointly shape the overall response [37,38,39].
5. Conclusions
Combined SEM, EBSD, tensile testing, fractography, and EBSD-informed CPFFT simulations show that heat treatment alters both the phase constitution and local deformation pattern of LPBF Zr–2.5Nb. The treatment comprised holding at 800 °C for 2 h followed by air cooling. The principal conclusions are as follows:
- Heat treatment produced a coarsened lamellar α + β microstructure. The analyzed two-dimensional HT EBSD map contained a β-indexed area fraction of approximately 6.0%, distributed mainly between α laths. KAM remained spatially heterogeneous in both sampled fields. The maximum α-Zr pole-figure intensity increased from 28.80 in AB to 43.44 in HT, indicating a stronger preferred orientation after heat treatment.
- Mean uniform strain increased from 4.02% to 6.94%, and strain before the final load drop increased from 9.46% to 19.64%. Meanwhile, the mean 0.2% proof stress and ultimate tensile strength decreased from 840 and 1033 MPa in AB to 792 and 881 MPa in HT, respectively.
- At 3.2% axial strain in the modeled HT field, the β/α ratios of mean equivalent strain and accumulated absolute slip were 1.59 and 2.51. The corresponding ratios of mean von Mises stress and mean axial stress were 0.57 and 0.81. β-Zr accumulated greater deformation and slip activity, whereas α-Zr sustained higher von Mises and axial stresses.
- Directly adjacent α-side and β-side interface cells retained the phase-level contrast in equivalent strain and von Mises stress. The β-side/α-side hydrostatic-stress ratio was 1.36, whereas the α-side/α-interior ratio was 1.04; these ratios describe different averaging domains. The more spatially distributed simulated deformation is qualitatively consistent with the deeper dimples and more pronounced tearing ridges observed after heat treatment, although the model does not resolve damage initiation.
Author Contributions
Conceptualization, H.D., A.L., C.Z. and X.C.; Methodology, H.D., A.L., L.C., J.D. and X.C.; Software, H.D. and A.L.; Validation, H.D., A.L., C.Z. and X.C.; Formal analysis, H.D., A.L., L.C., J.D. and X.C.; Investigation, H.D., A.L., C.Z. and X.C.; Resources, H.D., A.L., L.C., J.D. and X.C.; Data curation, H.D. and A.L.; Writing—original draft preparation, H.D., A.L., J.D. and X.C.; Writing—review and editing, H.D., A.L., J.D. and X.C.; Visualization, H.D., A.L., J.D. and X.C.; Supervision, H.D., A.L., J.D. and X.C.; Project administration, J.D. and X.C.; Funding acquisition, J.D. and X.C. All authors have read and agreed to the published version of the manuscript.
Funding
This work was supported by the National Key Research and Development Program of China (Grant No. 2024YFB3814700).
Data Availability Statement
The original contributions presented in this study are included in the article. Further inquiries can be directed to the corresponding author.
Conflicts of Interest
The authors declare that they have no known competing financial interests or personal relationships that could have appeared to influence the work reported in this paper.
References
- Griffiths, M.; Winegar, J.E.; Buyers, A. The transformation behaviour of the β-phase in Zr–2.5Nb pressure tubes. J. Nucl. Mater. 2008, 383, 28–33. [Google Scholar] [CrossRef] [Scilit]
- Harte, A.; Griffiths, M.; Preuss, M. The characterisation of second phases in the Zr–Nb and Zr–Nb–Sn–Fe alloys: A critical review. J. Nucl. Mater. 2018, 505, 227–239. [Google Scholar] [CrossRef] [Scilit]
- Herzog, D.; Seyda, V.; Wycisk, E.; Emmelmann, C. Additive manufacturing of metals. Acta Mater. 2016, 117, 371–392. [Google Scholar] [CrossRef] [Scilit]
- DebRoy, T.; Wei, H.L.; Zuback, J.S.; Mukherjee, T.; Elmer, J.W.; Milewski, J.O.; Beese, A.M.; Wilson-Heid, A.; De, A.; Zhang, W. Additive manufacturing of metallic components–process, structure and properties. Prog. Mater. Sci. 2018, 92, 112–224. [Google Scholar] [CrossRef] [Scilit]
- Harooni, A.; Iravani, M.; Khajepour, A.; King, J.M.; Khalifa, A.; Gerlich, A.P. Mechanical properties and microstructures in zirconium deposited by injected powder laser additive manufacturing. Addit. Manuf. 2018, 22, 537–547. [Google Scholar] [CrossRef] [Scilit]
- Yue, M.; Liu, Y.; He, G.; Lian, L. Microstructure and mechanical performance of zirconium, manufactured by selective laser melting. Mater. Sci. Eng. A 2022, 840, 142900. [Google Scholar] [CrossRef] [Scilit]
- Huang, Y.-L.; Trofimov, V.; Liu, F.; Yan, M.; Zhan, J.; Li, H.-X.; Zeng, D.; Yang, Y.-Q.; Song, C.-H. Microstructure, mechanical properties and corrosion behavior of Zr–2.5Nb alloy prepared by laser powder bed fusion. Trans. Nonferrous Met. Soc. China 2024, 34, 3383–3401. [Google Scholar] [CrossRef] [Scilit]
- Kulkarni, R.V.; Krishna, K.V.M.; Neogy, S.; Srivastava, D.; Ramadasan, E.; Shriwastaw, R.S.; Rath, B.N.; Saibaba, N.; Jha, S.K.; Dey, G.K. Mechanical properties of Zr–2.5%Nb pressure tube material subjected to heat treatments in the α+β phase field. J. Nucl. Mater. 2014, 451, 300–312. [Google Scholar] [CrossRef] [Scilit]
- Zhang, M.; Li, Y.N.; Zhang, F.C.; Wang, X.B.; Chen, L.Y.; Yang, Z.N. Effect of annealing treatment on the microstructure and mechanical properties of a duplex Zr–2.5Nb alloy. Mater. Sci. Eng. A 2017, 706, 236–241. [Google Scholar] [CrossRef] [Scilit]
- Yang, Z.N.; Wang, X.B.; Liu, F.; Zhang, F.C.; Chai, L.J.; Qiu, R.S.; Chen, L.Y. Effect of intercritical annealing temperature on microstructure and mechanical properties of duplex Zr–2.5Nb alloy. J. Alloys Compd. 2019, 776, 242–249. [Google Scholar] [CrossRef] [Scilit]
- Wang, Y.; Chai, L.; Zhang, F.; Chen, K.; Guan, H.; Luo, J.; Li, Y. Effects of β-cooling rates on microstructural characteristics and hardness variation of a dual-phase Zr alloy. Int. J. Refract. Met. Hard Mater. 2021, 100, 105619. [Google Scholar] [CrossRef] [Scilit]
- Daymond, M.R.; Holt, R.A.; Cai, S.; Mosbrucker, P.; Vogel, S.C. Texture inheritance and variant selection through an hcp–bcc–hcp phase transformation. Acta Mater. 2010, 58, 4053–4066. [Google Scholar] [CrossRef] [Scilit]
- Daniel, C.S.; Honniball, P.D.; Bradley, L.; Preuss, M.; da Fonseca, J.Q. A detailed study of texture changes during alpha–beta processing of a zirconium alloy. J. Alloys Compd. 2019, 804, 65–83. [Google Scholar] [CrossRef] [Scilit]
- Daniel, C.S.; Garner, A.; Honniball, P.D.; Bradley, L.; Preuss, M.; Prangnell, P.B.; Quinta da Fonseca, J. Co-deformation and dynamic annealing effects on the texture development during alpha–beta processing of a model Zr–Nb alloy. Acta Mater. 2021, 205, 116538. [Google Scholar] [CrossRef] [Scilit]
- Li, A.; Lei, H.; Chen, L.; Song, C.; Du, J. Heat treatment of laser powder bed fusion additively manufactured Zr–2.5Nb alloy: Phase transformation mechanisms, microstructural characteristics, and mechanical performance. J. Alloys Compd. 2026, 1050, 185793. [Google Scholar] [CrossRef] [Scilit]
- Lei, H.; Huang, Y.; Xiao, Y.; Liu, F.; Zhan, J.; Li, H.; Zeng, J.; Yang, Y.; Song, C. Enhancing comprehensive properties of Zr–2.5Nb fabricated via laser powder bed fusion through post-processing for medical implants. Addit. Manuf. Front. 2026, 5, 200291. [Google Scholar] [CrossRef] [Scilit]
- Gong, J.; Britton, T.B.; Cuddihy, M.A.; Dunne, F.P.E.; Wilkinson, A.J. ⟨a⟩ prismatic, ⟨a⟩ basal, and ⟨c+a⟩ slip strengths of commercially pure Zr by micro-cantilever tests. Acta Mater. 2015, 96, 249–257. [Google Scholar] [CrossRef] [Scilit]
- Li, Y.; Po, G.; Cui, Y.; Ghoniem, N. Prismatic-to-basal plastic slip transition in zirconium. Acta Mater. 2023, 242, 118451. [Google Scholar] [CrossRef] [Scilit]
- Thool, K.; Patra, A.; Fullwood, D.; Krishna, K.V.M.; Srivastava, D.; Samajdar, I. The role of crystallographic orientations on heterogeneous deformation in a zirconium alloy: A combined experimental and modeling study. Int. J. Plast. 2020, 133, 102785. [Google Scholar] [CrossRef] [Scilit]
- Cai, S.; Daymond, M.R.; Holt, R.A.; Gharghouri, M.A.; Oliver, E.C. Evolution of interphase and intergranular stresses in Zr–2.5Nb during room temperature deformation. Mater. Sci. Eng. A 2009, 501, 166–181. [Google Scholar] [CrossRef] [Scilit]
- Sahoo, S.K.; Hiwarkar, V.D.; Jain, L.; Samajdar, I.; Pant, P.; Dey, G.K.; Srivastava, D.; Tewari, R.; Banerjee, S. Deformed microstructures of two-phase Zr–2.5Nb alloy: Effects of the second phase hardness. J. Nucl. Mater. 2010, 404, 222–230. [Google Scholar] [CrossRef] [Scilit]
- Muránsky, O.; Daymond, M.R.; Bhattacharyya, D.; Zanellato, O.; Vogel, S.C.; Edwards, L. Load partitioning and evidence of deformation twinning in dual-phase fine-grained Zr–2.5%Nb alloy. Mater. Sci. Eng. A 2013, 564, 548–558. [Google Scholar] [CrossRef] [Scilit]
- Roters, F.; Eisenlohr, P.; Hantcherli, L.; Tjahjanto, D.D.; Bieler, T.R.; Raabe, D. Overview of constitutive laws, kinematics, homogenization and multiscale methods in crystal plasticity finite-element modeling: Theory, experiments, applications. Acta Mater. 2010, 58, 1152–1211. [Google Scholar] [CrossRef] [Scilit]
- Zan, X.D.; Guo, X.; Xia, X.D.; Weng, G.J.; Chen, G.; Han, F.Z. Anisotropic deformation mechanisms of rolling-textured Zircaloy-4 alloy by a crystal plasticity model. Comput. Mater. Sci. 2023, 229, 112424. [Google Scholar] [CrossRef] [Scilit]
- Cai, S.; Daymond, M.R.; Holt, R.A. Modeling the room temperature deformation of a two-phase zirconium alloy. Acta Mater. 2009, 57, 407–419. [Google Scholar] [CrossRef] [Scilit]
- Christodoulou, N.; Tomé, C.N. Anisotropy of plastic flow in Zr–2.5Nb pressure tube material analysed using a viscoplastic self-consistent approach. Acta Mater. 2025, 283, 120503. [Google Scholar] [CrossRef] [Scilit]
- Ardeljan, M.; Knezevic, M.; Nizolek, T.; Beyerlein, I.J.; Mara, N.A.; Pollock, T.M. A study of microstructure-driven strain localizations in two-phase polycrystalline HCP/BCC composites using a multi-scale model. Int. J. Plast. 2015, 74, 35–57. [Google Scholar] [CrossRef] [Scilit]
- Taherijam, M.; Ilgert, D.; Abdolvand, H. Effect of β-phase on deformation and stress partitioning in Zr–2.5Nb pressure tubes. In Proceedings of the ASME 2025 Pressure Vessels and Piping Conference, Montreal, QC, Canada, 20–25 July 2025; p. PVP2025-152353. [Google Scholar] [CrossRef] [Scilit]
- Roters, F.; Diehl, M.; Shanthraj, P.; Eisenlohr, P.; Reuber, C.; Wong, S.L.; Maiti, T.; Ebrahimi, A.; Hochrainer, T.; Fabritius, H.-O.; et al. DAMASK–the Düsseldorf Advanced Material Simulation Kit for modeling multi-physics crystal plasticity, thermal, and damage phenomena from the single crystal up to the component scale. Comput. Mater. Sci. 2019, 158, 420–478. [Google Scholar] [CrossRef] [Scilit]
- Moulinec, H.; Suquet, P. A numerical method for computing the overall response of nonlinear composites with complex microstructure. Comput. Methods Appl. Mech. Eng. 1998, 157, 69–94. [Google Scholar] [CrossRef] [Scilit]
- Lebensohn, R.A.; Kanjarla, A.K.; Eisenlohr, P. An elasto-viscoplastic formulation based on fast Fourier transforms for the prediction of micromechanical fields in polycrystalline materials. Int. J. Plast. 2012, 32–33, 59–69. [Google Scholar] [CrossRef] [Scilit]
- Gui, Y.; An, D.; Han, F.; Lu, X.; Kang, G.; Zhang, X. Multiple-mechanism and microstructure-based crystal plasticity modeling for cyclic shear deformation of TRIP steel. Int. J. Mech. Sci. 2022, 222, 107269. [Google Scholar] [CrossRef] [Scilit]
- Groeber, M.A.; Jackson, M.A. DREAM.3D: A digital representation environment for the analysis of microstructure in 3D. Integr. Mater. Manuf. Innov. 2014, 3, 56–72. [Google Scholar] [CrossRef] [Scilit]
- Jackson, M.A.; Groeber, M.A.; Uchic, M.D.; Rowenhorst, D.J.; De Graef, M. h5ebsd: An archival data format for electron back-scatter diffraction data sets. Integr. Mater. Manuf. Innov. 2014, 3, 44–55. [Google Scholar] [CrossRef] [Scilit]
- Britton, T.B.; Dunne, F.P.E.; Wilkinson, A.J. On the mechanistic basis of deformation at the microscale in hexagonal close-packed metals. Proc. R. Soc. A 2015, 471, 20140881. [Google Scholar] [CrossRef] [Scilit]
- Devi, Y.P.; Donthula, H.; Keskar, N.; Sarkar, A.; Vaibhaw, K.; Krishna, K.V.M. Microstructural evolution in the (α+βZr) region of Zr–2.5 wt.% Nb annealed at different temperatures: Effect on mechanical properties. J. Nucl. Mater. 2020, 530, 151978. [Google Scholar] [CrossRef] [Scilit]
- Du, Q.; Sun, H.; Cui, C.; Liu, Y.; Sun, S.; Sun, R.; Wang, H.; Feng, Z.; Liu, W.; Zhang, W.; et al. Revealing the deformation behavior among grains and phases of dual-phase Zr-2.5Nb alloy via quasi-in situ SEM-EBSD. J. Mater. Res. Technol. 2026, 43, 79–94. [Google Scholar] [CrossRef] [Scilit]
- Alvarez, M.A.V.; Buioli, C.; Santisteban, J.; Vizcaino, P. Evolution of texture and intergranular stresses of αZr and minority phases in Zr-2.5Nb pressure tube through synchrotron X-ray diffraction. Acta Mater. 2024, 271, 119802. [Google Scholar] [CrossRef] [Scilit]
- Buioli, C.P.; Alvarez, M.A.V.; Vizcaino, P.; Chen, Y. Study of crystal deformation and inter-granular stress in cold rolled pressure tube material using neutron diffraction. J. Nucl. Mater. 2025, 605, 155595. [Google Scholar] [CrossRef] [Scilit]
- Cai, S.; Daymond, M.R.; Khan, A.K.; Holt, R.A.; Oliver, E.C. Elastic and plastic properties of βZr at room temperature. J. Nucl. Mater. 2009, 393, 67–76. [Google Scholar] [CrossRef] [Scilit]

Disclaimer/Publisher’s Note: The statements, opinions and data contained in all publications are solely those of the individual author(s) and contributor(s) and not of MDPI and/or the editor(s). MDPI and/or the editor(s) disclaim responsibility for any injury to people or property resulting from any ideas, methods, instructions or products referred to in the content. |
© 2026 by the authors. Licensee MDPI, Basel, Switzerland. This article is an open access article distributed under the terms and conditions of the Creative Commons Attribution (CC BY) license.