


Abstract
The use of hydrogen for smelting reduction ironmaking can effectively reduce the consumption of coke, as well as the CO2 emission. However, the dynamic mechanism of this process is not clear. In this paper, isothermal thermogravimetric analysis (TGA) was used to study the reduction process of wustite by hydrogen at 1673–1773 K. Results show that wustite can be entirely reduced, and with the increase in temperature, the reduction reaction becomes more intense, and the time required for the entire reduction decreases. The hydrogen reduction of wustite at 1673–1773 K fits the Mampel power model: f(α) = 2α1/2. When the reactants are molten and the products are solid, the apparent activation energy of the reduction process calculated by the iso-conversional method is 9.15 kJ·mol−1. Molecular dynamics simulation results show that the adsorption of hydrogen molecule on FeO surface is spontaneous. With the increase in temperature, FeO substrate becomes more active, and hydrogen molecules move more violently. The average distance between a certain hydrogen atom and its neighboring atom was analyzed statistically. The increase in temperature will increase the average bond length of hydrogen molecules, reduce their bond energy, and facilitate the adsorption of hydrogen molecules on the FeO surface.
1. Introduction
In regard to the goal of achieving carbon neutrality for the whole world, the traditional iron and steel metallurgy process based on carbon reducing agents poses a challenge to the iron and steel industry to achieve the “carbon peaking and carbon neutrality goals” because of its high carbon emissions [1,2,3,4]. Hydrogen metallurgy technology is a clean, efficient, and pollution-free green ironmaking technology [5,6,7,8,9,10]. Many studies have been carried out on the behavior of hydrogen reduction of iron oxides. These studies mostly focus on the reaction process of hydrogen reduction of solid iron oxides [11,12,13]. With the rapid development of smelting reduction iron-making process and clean production of hydrogen, the application of hydrogen in smelting reduction provides a new idea for the iron and steel industry to achieve the “carbon peaking and carbon neutrality goals” [14,15,16].
The hydrogen reduction of molten iron oxides has been studied from different perspectives. Katayama et al. [17] studied the reduction of FeO in molten blast-furnace-type slag by using a mixture of hydrogen and water vapor at 1450 °C. The experimental results showed that the diffusion rate of FeO in the slag was 3 × 10⁻⁴ cm2/s, but the study did not indicate whether the MgO crucible selected in the experiment had some effects on the reduction process. Ban-Ya et al. [18] studied the reduction of molten iron oxide by using a mixture of hydrogen and inert gas at 1400 and 1450 °C, using an iron crucible. The experimental results showed that when the reduction rate was controlled by both mass transfer in the gas phase and chemical reaction, the apparent chemical reaction rate constant was estimated to be 1.6 × 10⁻² (g-oxygen/cm2·s·atm), and the chemical reaction rate of hydrogen reduction of molten FeO was about 20 times larger than that of solid FeO. Hayashi et al. [19] studied the reduction of molten FeO by N2-H2 mixture in the temperature range of 1450–1550 °C, utilizing a particle–gas-conveyed system, and the ratio of hydrogen was selected as 5–30%. The experimental results showed that chemical reaction was the restrictive factor in the reduction process, and the activation energy was evaluated to be 110 kJ/mol.
However, compared with the hydrogen reduction of solid iron oxide, the research on hydrogen reduction of molten iron oxides is not sufficient. In previous studies on hydrogen reduction of molten iron oxides, the selected temperature range is mostly for molten wustite and solid iron, and the ratio of hydrogen used is up to 30%. On the basis of previous studies and combined with the previous studies on hydrogen reduction of solid and molten wustite [20], the thermogravimetric experiments on the reduction of molten wustite to solid iron by pure hydrogen are supplemented. The kinetic process of hydrogen reduction of wustite was analyzed by the model fitting method and iso-conversional method, and the adsorption behavior of H2 on FeO surfaces was further analyzed by molecular dynamics simulation.
2. Materials and Methods
The FeO reagent used in this work was prepared from reduced iron powder and analytical-grade Fe3O4 reagent, following the method reported in previous studies [18,21]. The raw materials were mixed uniformly at a molar ratio of 1.5:1 (Fe:Fe3O4) to promote the complete formation of FeO. The blended mixture was then transferred into a sealed tubular furnace, heated to 850 °C, and held for 2 h before cooling naturally to room temperature. During the entire preparation process, argon gas was continuously supplied at a flow rate of 3 L/min to maintain an inert atmosphere. Previous investigations confirmed that the synthesized FeO powder remained stable at room temperature for at least 90 days. To minimize possible oxidation and ensure experimental reliability, the prepared FeO powder was finally stored in a sealed container under a nitrogen atmosphere [20].
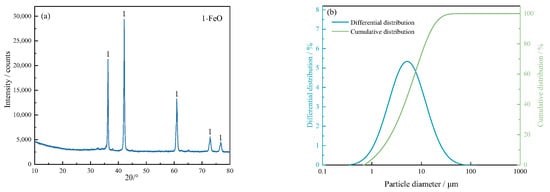
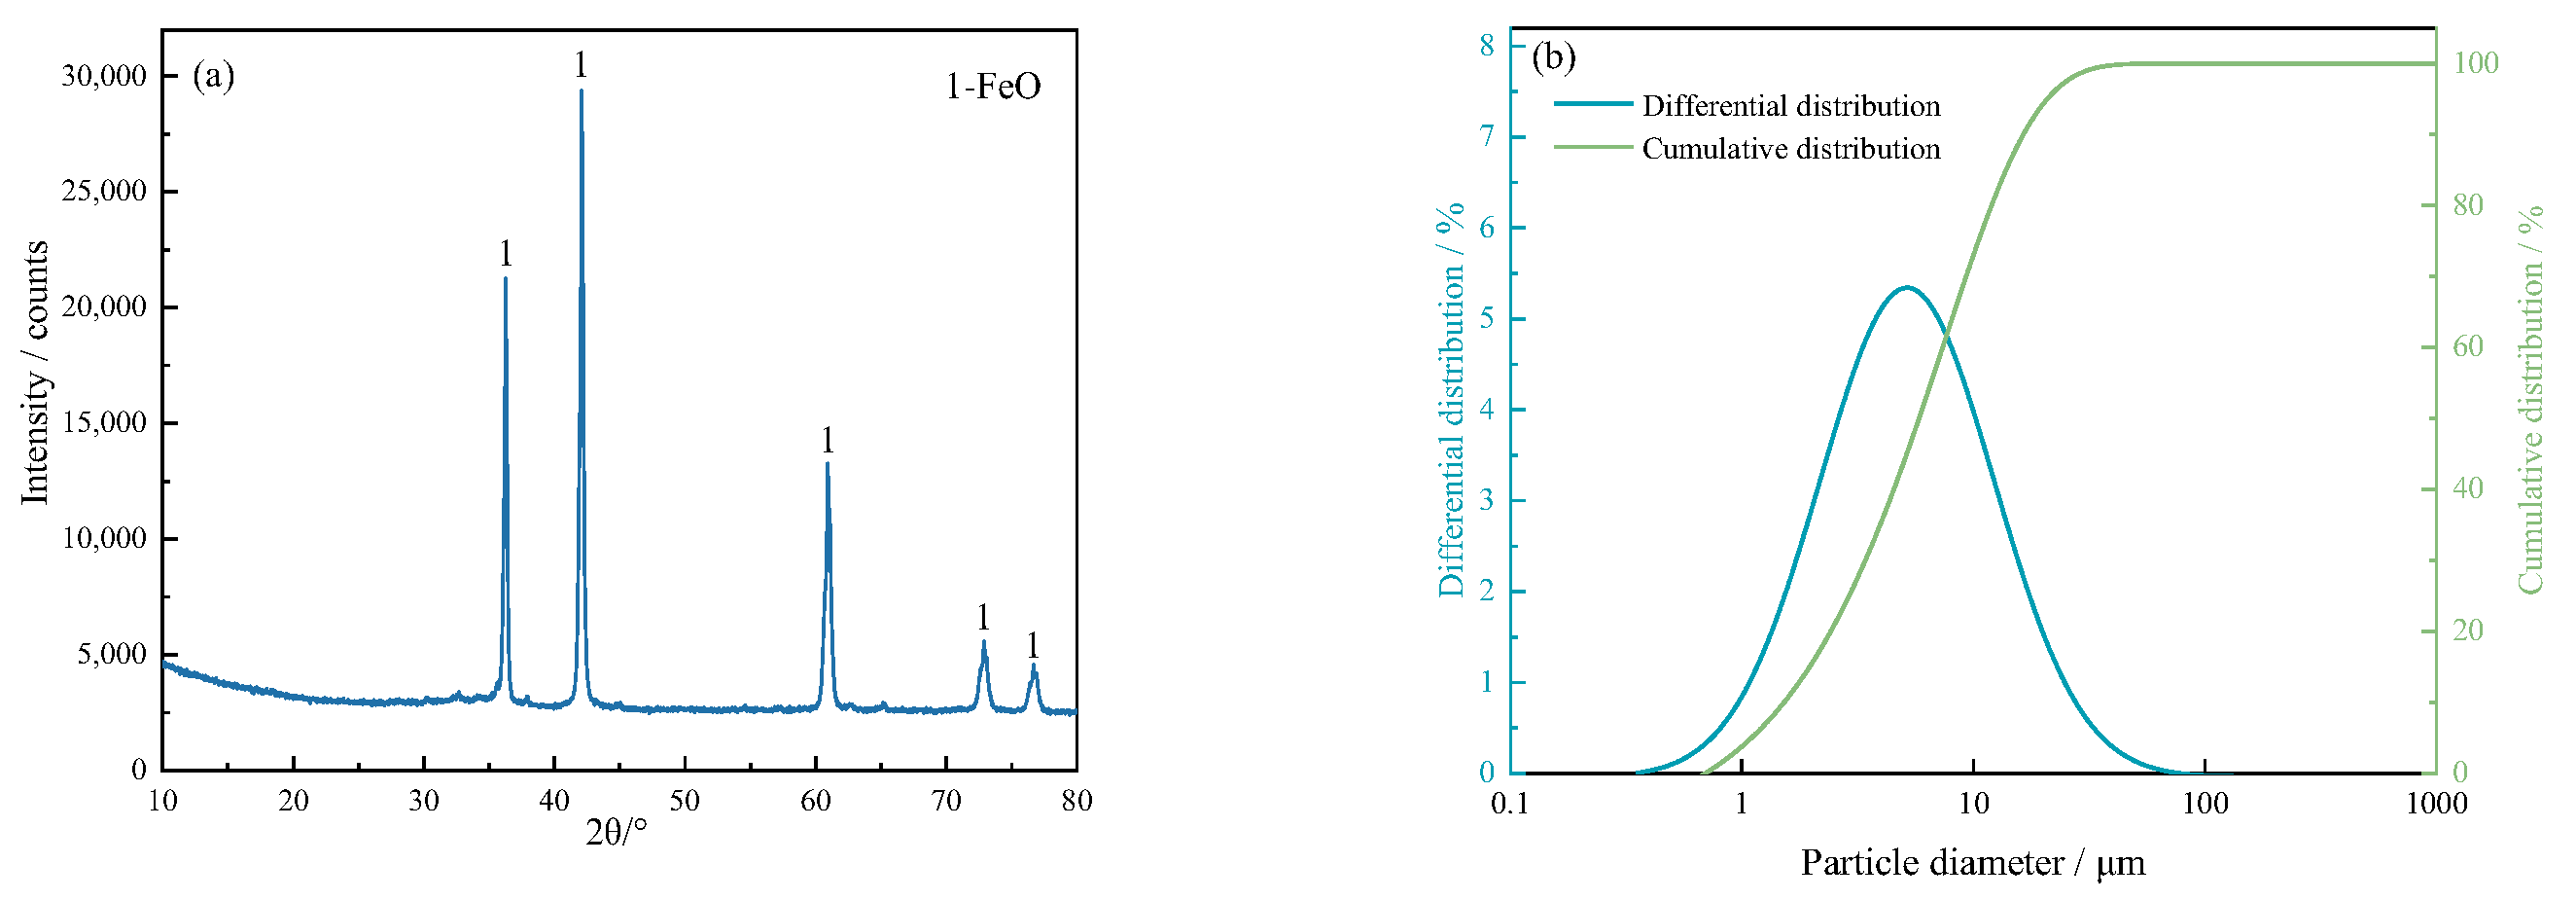
The phase composition of the prepared FeO powder was analyzed by X-ray diffraction (XRD, D8 Advance, Bruker, Karlsruhe, Germany, Cu-Kα radiation, 40 kV/40 mA). As illustrated in Figure 1a, the XRD pattern exhibited only the characteristic diffraction peaks of FeO, indicating the successful synthesis of the target phase. Chemical composition analysis showed that the obtained product contained 90.37 wt% FeO, while the remaining fraction consisted of metallic iron. Therefore, the kinetic analysis and mechanism discussion in the present study were conducted based on the synthesized FeO sample containing initial metallic Fe, rather than an ideal pure FeO system. Furthermore, the particle size distribution of the synthesized FeO powder was determined using a laser particle size analyzer (Mastersizer 3000, Malvern Instruments Ltd., Malvern, UK). The results in Figure 1b demonstrate that the particle size of the FeO particles was less than 74 μm.
Figure 1.
X-ray diffraction patterns (a) and particle size distribution (b) of the FeO sample.
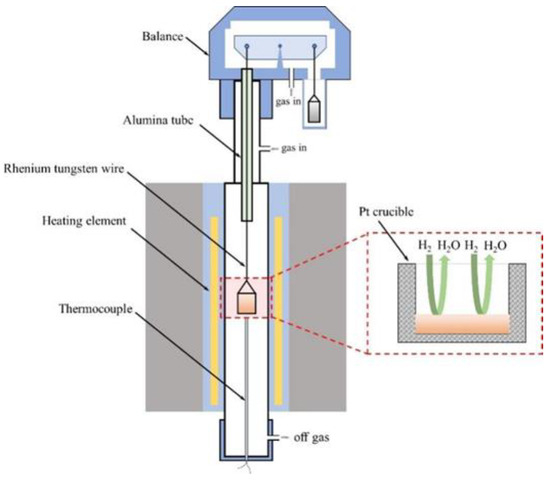
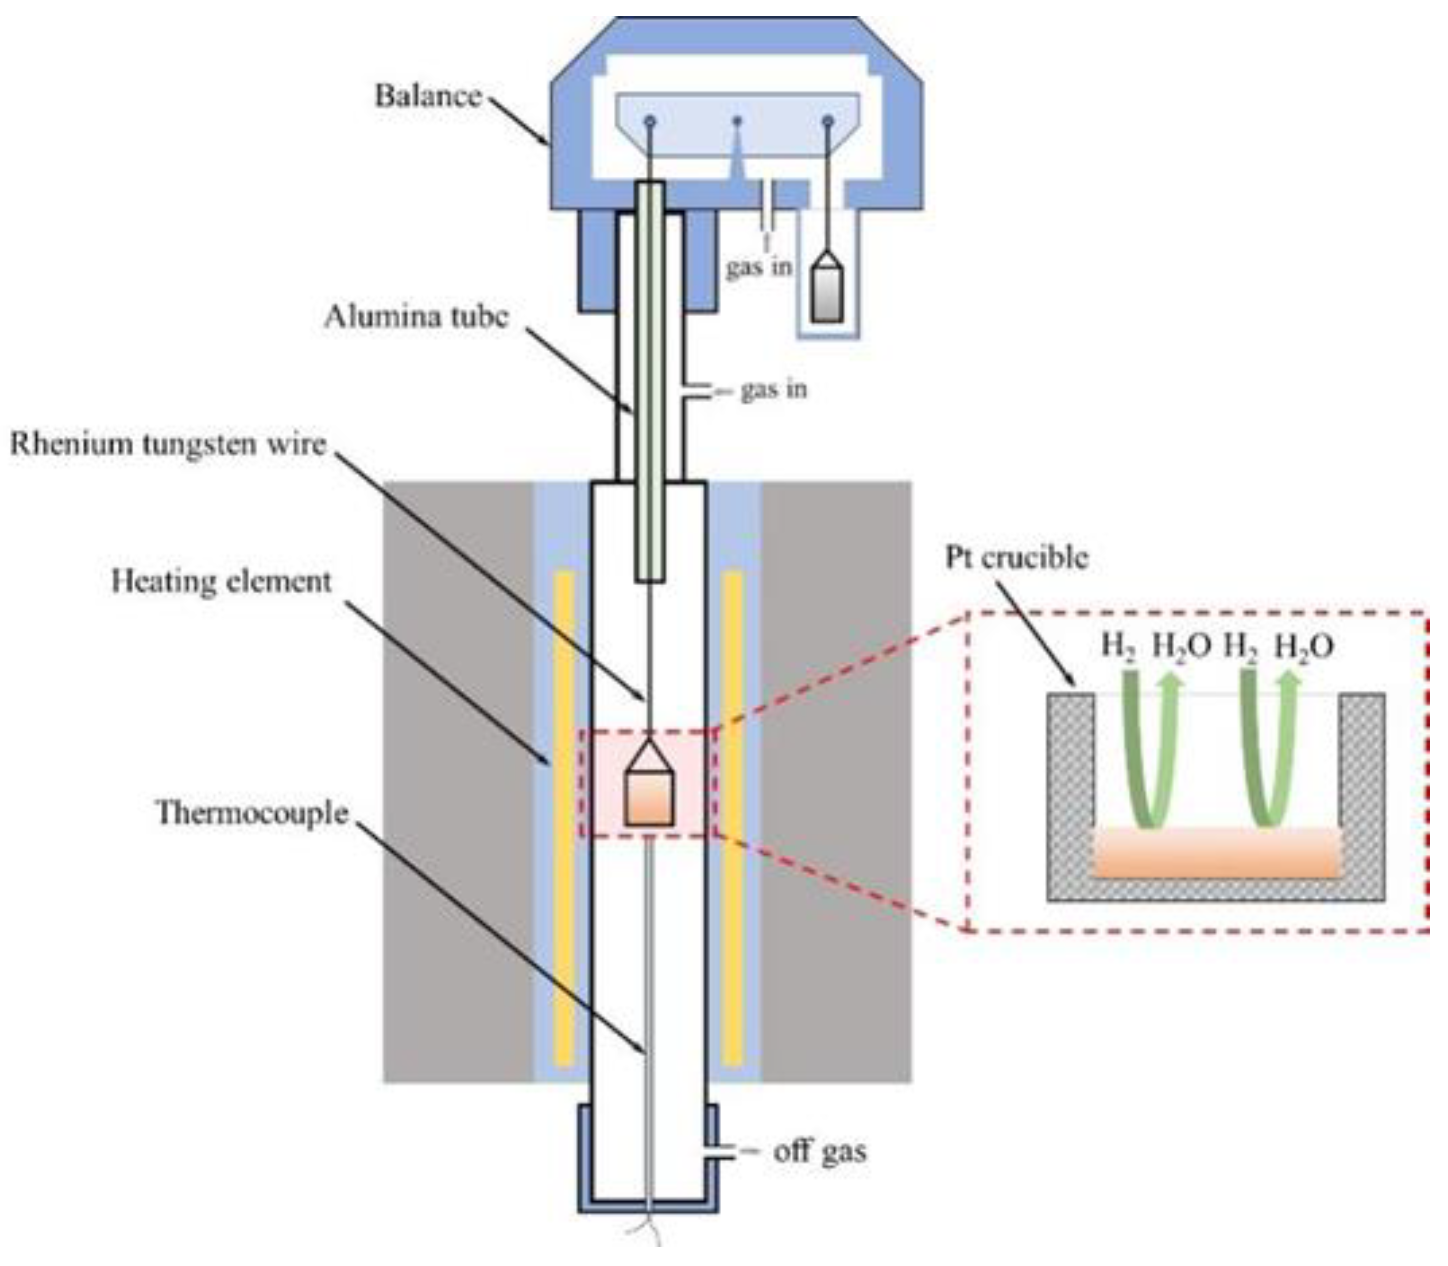
A Setaram ultra-high temperature thermal analyzer (Setsys EVO TG-DTA 1750, Setaram Instrumentation, Caluire, France) was employed to investigate the reduction behavior of FeO at different temperatures, and a schematic illustration of the apparatus is presented in Figure 2. The instrument has a maximum sample capacity of 100 g, with a weighing accuracy of 0.3 μg, and it can operate at temperatures up to 1750 °C. Approximately 20 mg of FeO sample was placed in a platinum crucible (Beijing Zhongnuo Advanced Materials Technology Co., Ltd., Beijing, China) and loaded into the TG analyzer, followed by heating to the target temperature at a rate of 30 °C/min under a nitrogen atmosphere [20]. After holding at the set temperature for 30 min, the reaction gas was switched to hydrogen.
Figure 2.
Schematic illustration of the TG analyzer.
To eliminate the influence of systematic errors in the thermal analyzer, as well as the buoyancy effect of the reaction gas, a blank experiment was conducted under identical conditions using an empty platinum crucible. The weight loss curves were obtained during the isothermal reduction stage, and the corresponding thermal analysis data from the blank experiment were subtracted accordingly.
To compare the differences in hydrogen reduction behavior of FeO in different phases, supplementary experiments were designed based on the author’s previous work [20] and with reference to the melting points of FeO (1369 °C) and Fe (1538 °C). The experiments were conducted under temperature conditions corresponding to molten FeO and solid Fe. The detailed experimental conditions are listed in Table 1.
Table 1.
Experimental conditions on isothermal reduction of FeO.
The reduction conversion (α) is calculated by Equation (1):
where α represents the reduction conversion of the sample at a given time, t; m0 denotes the initial mass of the sample (g); mt is the mass of the sample at time, t (s); and m∞ corresponds to the mass of the sample at the end of the experiment (g).
3. Results
3.1. Reduction Conversion and Rate
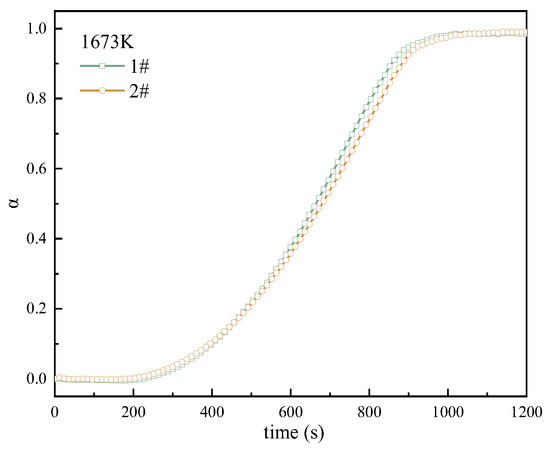
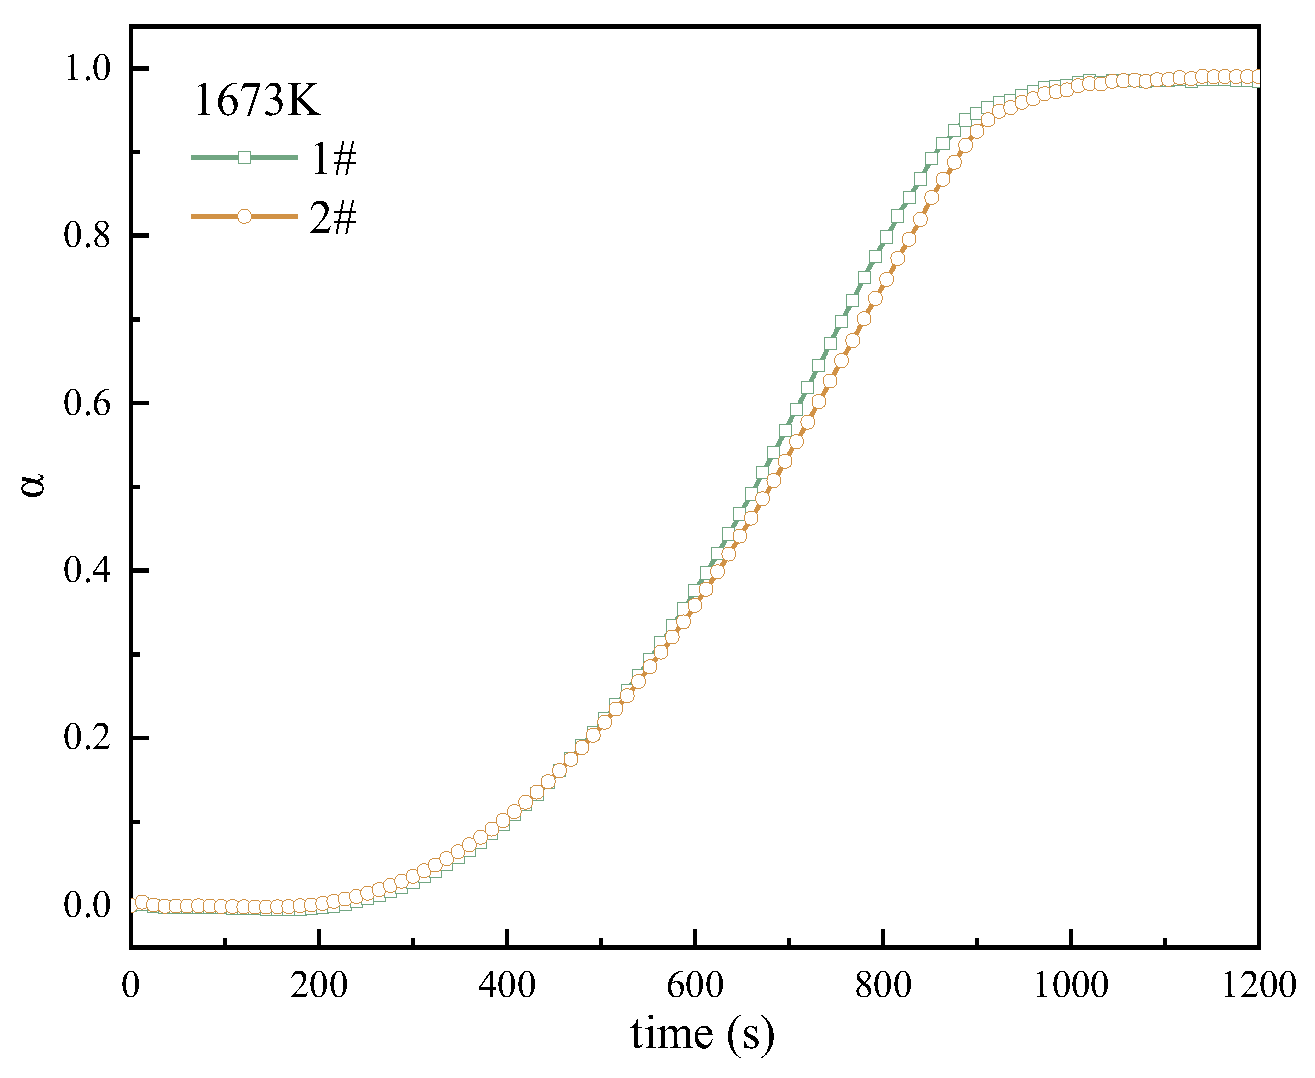
In order to verify the repeatability of the experimental results, two groups of reduction experiments under the same conditions were carried out at 1673 K, and the results are shown in Figure 3. The two reduction conversion curves overlap well, indicating that the data obtained from the experiment are reliable.
Figure 3.
Repeatability of the experiment results.
At the same time, the experimental team used an identical empty platinum crucible to perform a baseline scan under exactly the same temperature profile (heating and isothermal) and gas-switching parameters (switching to 20 mL/min hydrogen). All spurious mass fluctuations recorded by the microbalance during this blank test were directly treated as background noise and mathematically subtracted from the raw weight loss curves of the subsequent actual FeO reduction tests. This calibration procedure ensured the absolute authenticity of the weight loss data. In order to eliminate the influence of the gas flow rate of hydrogen on the reduction process, the gas flow rate was selected as 20 mL/min, the same as in a previous study [20].
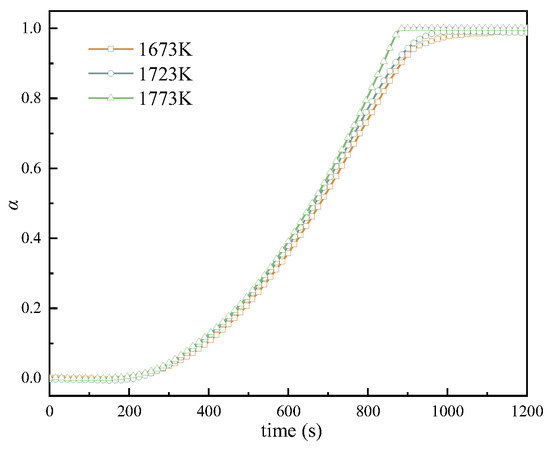
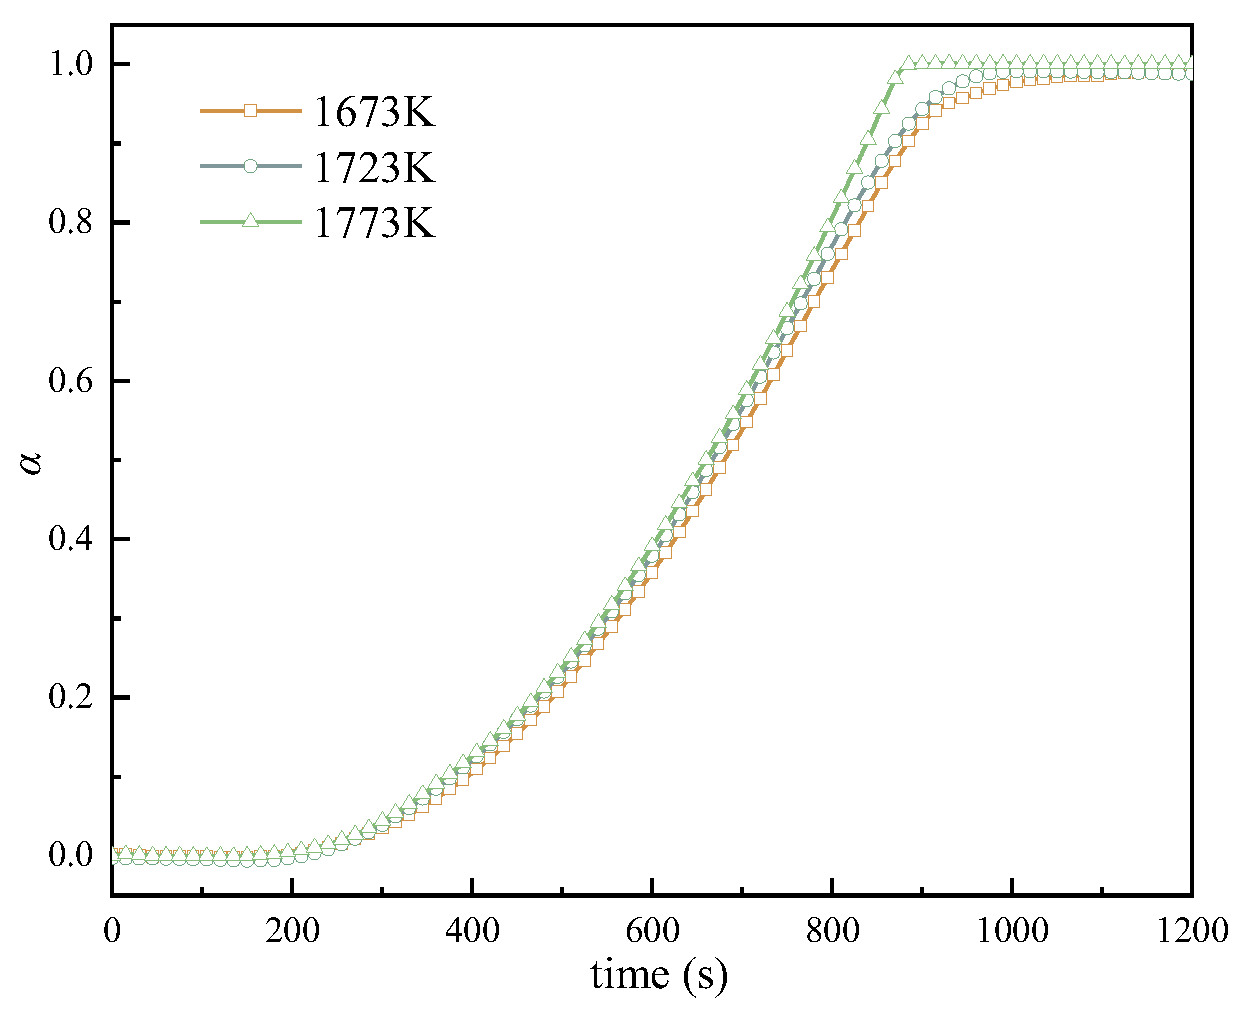
Figure 4 shows the curve of reduction conversion (α) over time in the process of hydrogen reducing molten FeO to solid Fe at different temperatures. In this temperature range, wustite was completely reduced. At 1673 K, 1723 K, and 1773 K, the reduction degree at 600 s was 0.358, 0.379, and 0.391, respectively. With the increase in reduction temperature, the reduction conversion rate of the same reduction time increases.
Figure 4.
Reduction conversion curves with time at different temperatures.
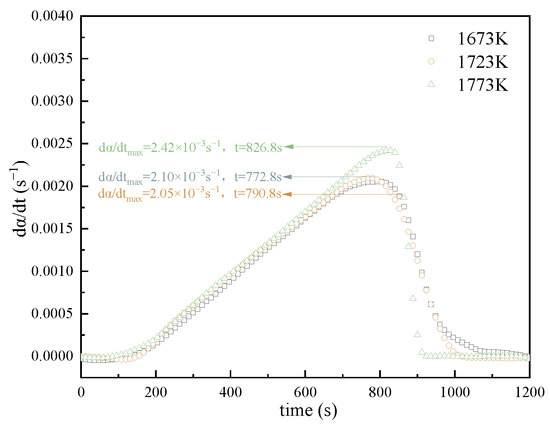
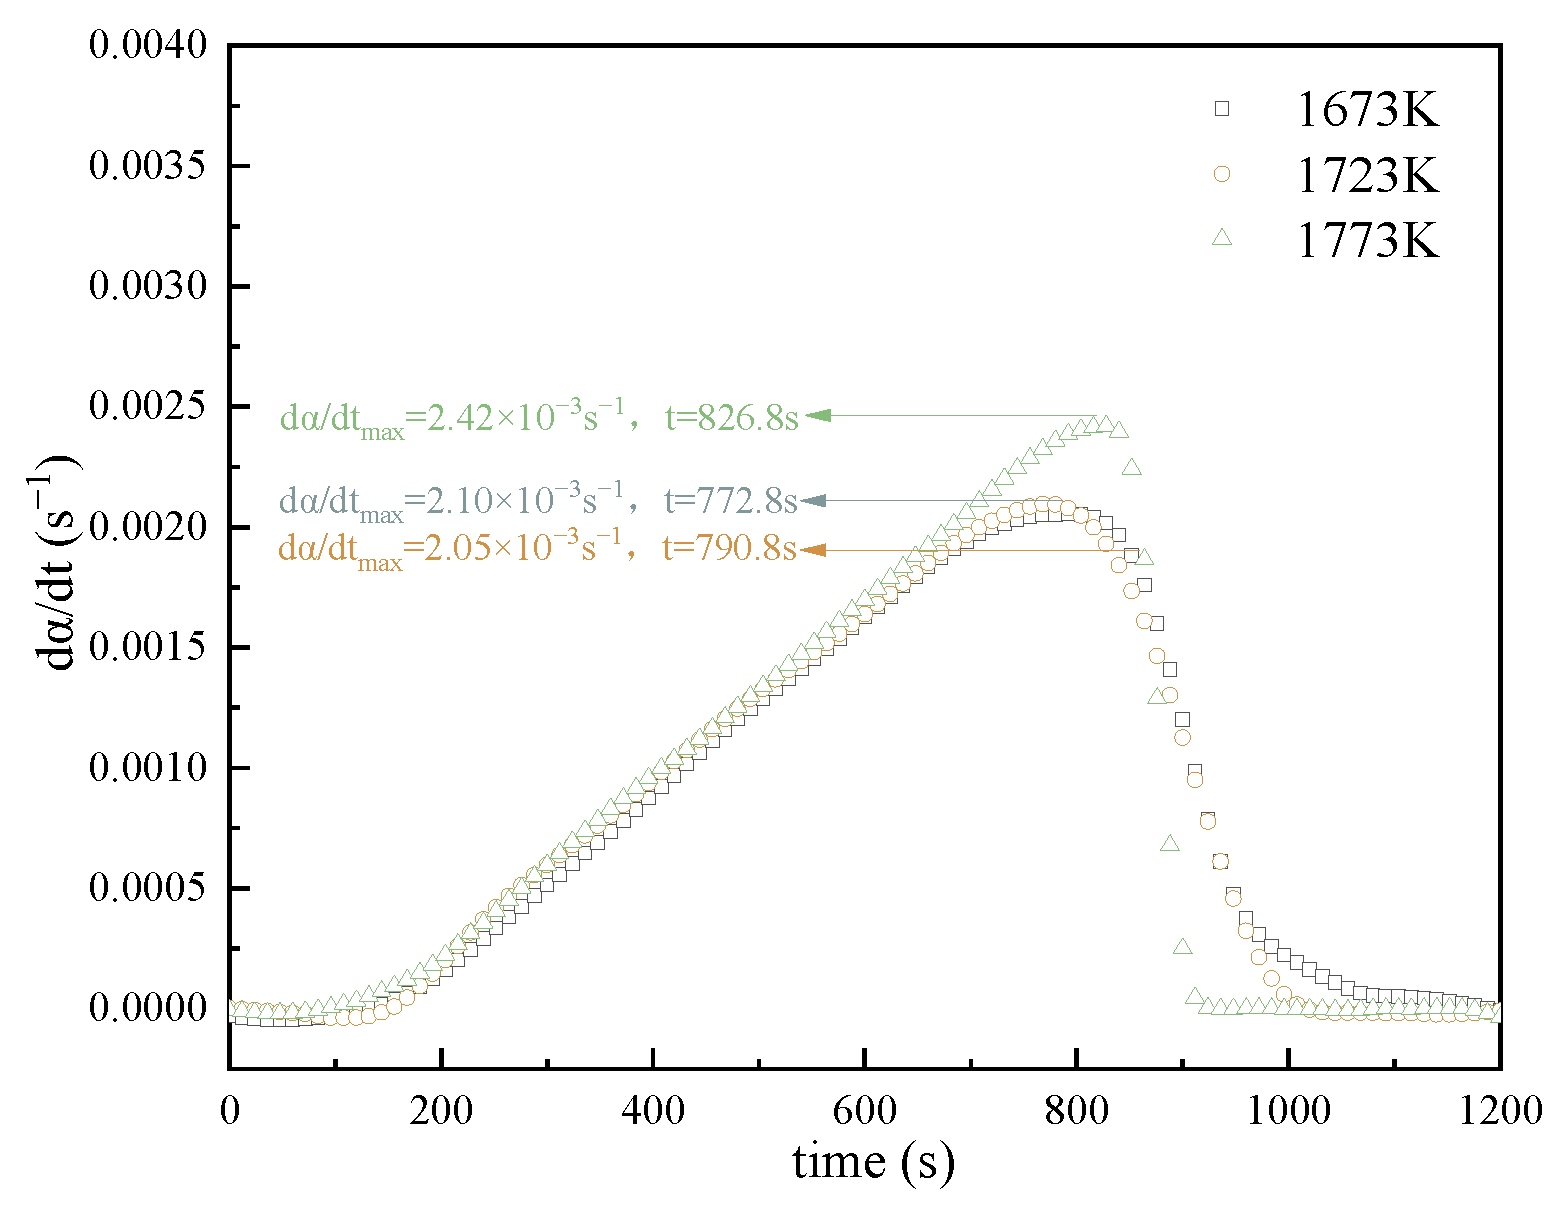
Figure 5 shows the curve of reduction conversion rate (dα/dt) for the reduction of molten FeO to solid Fe at different temperatures. At 1673 K, 1723 K, and 1773 K, the curves of reduction conversion rate with time are single-peaked, and the peaks of reduction conversion rate was 2.05 × 10⁻³ s−1, 2.10 × 10⁻³ s−1, and 2.42 × 10⁻³ s−1, respectively. The corresponding reduction time to reach the peak value was 790.8 s, 772.8 s, and 826.8 s, respectively, and the time of reduction conversion rate to zero was 1188 s, 1032 s, and 936 s, respectively. With the increase in the reduction temperature, the peak value of the curve increased, and the peak time of the reduction conversion rate curve had no obvious change, but the reduction conversion rate decreased to zero earlier. With the increase in temperature, the reduction reaction became more intense and the time required for complete reduction decreased.
Figure 5.
Reduction conversion rate curves with time at different temperatures.
3.2. Kinetic Analysis
3.2.1. Model Fitting Method
In this study, the reduction of molten FeO to solid Fe was analyzed. The macroscopic kinetic model was established to further analyze the reduction mechanism. In the isothermal reduction process, the reduction weight loss rate of iron oxide is a function of temperature and time, and its kinetic equation can be described as follows:
where dα/dt is the reduction conversion rate; k(T) is the reduction rate constant; T is the function of reduction temperature, K; f(α) is the differential form of the reduction macroscopic fitting model; t is reduction time, s; and α is the reduction conversion.
Treat time, t, and conversion rate, α, as independent variables, integrating both sides, and the left-hand side of the equation is defined as the integral form of the dynamical function. Equation (3) can be derived from Equation (2):
where is the integral form of the macroscopic fitting model.
G(α) is linearly related to the reduction time, the slope is the reduction rate constant, k(T), of the reaction at the corresponding temperature, and f(α) is the most suitable macroscopic fitting model for the reduction process. The mechanistic functions commonly used for chemical reactions are shown is Table 2.
Table 2.
The mechanistic function models commonly used for chemical reactions.
K(T) can be determined by the Arrhenius equation:
where A is the pre-exponential factor, s−1; E is the activation energy, kJ/mol; and R is the standard molar gas constant, kJ/(mol·K).
Equation (5) can be expressed as Equation (4):
The pre-exponential factor, A, and the activation energy, E, can be determined by the slope and intercept of the line fitted by 1/T and lnk(T).
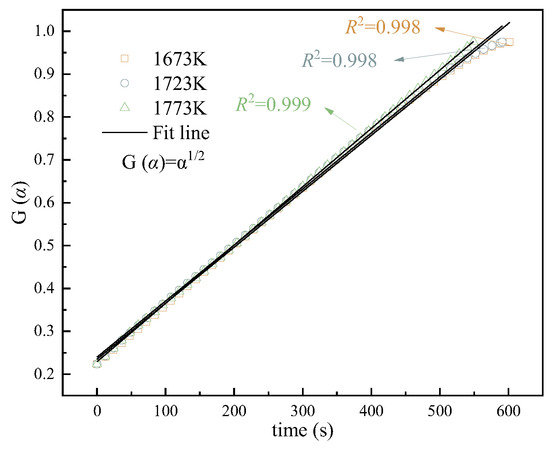
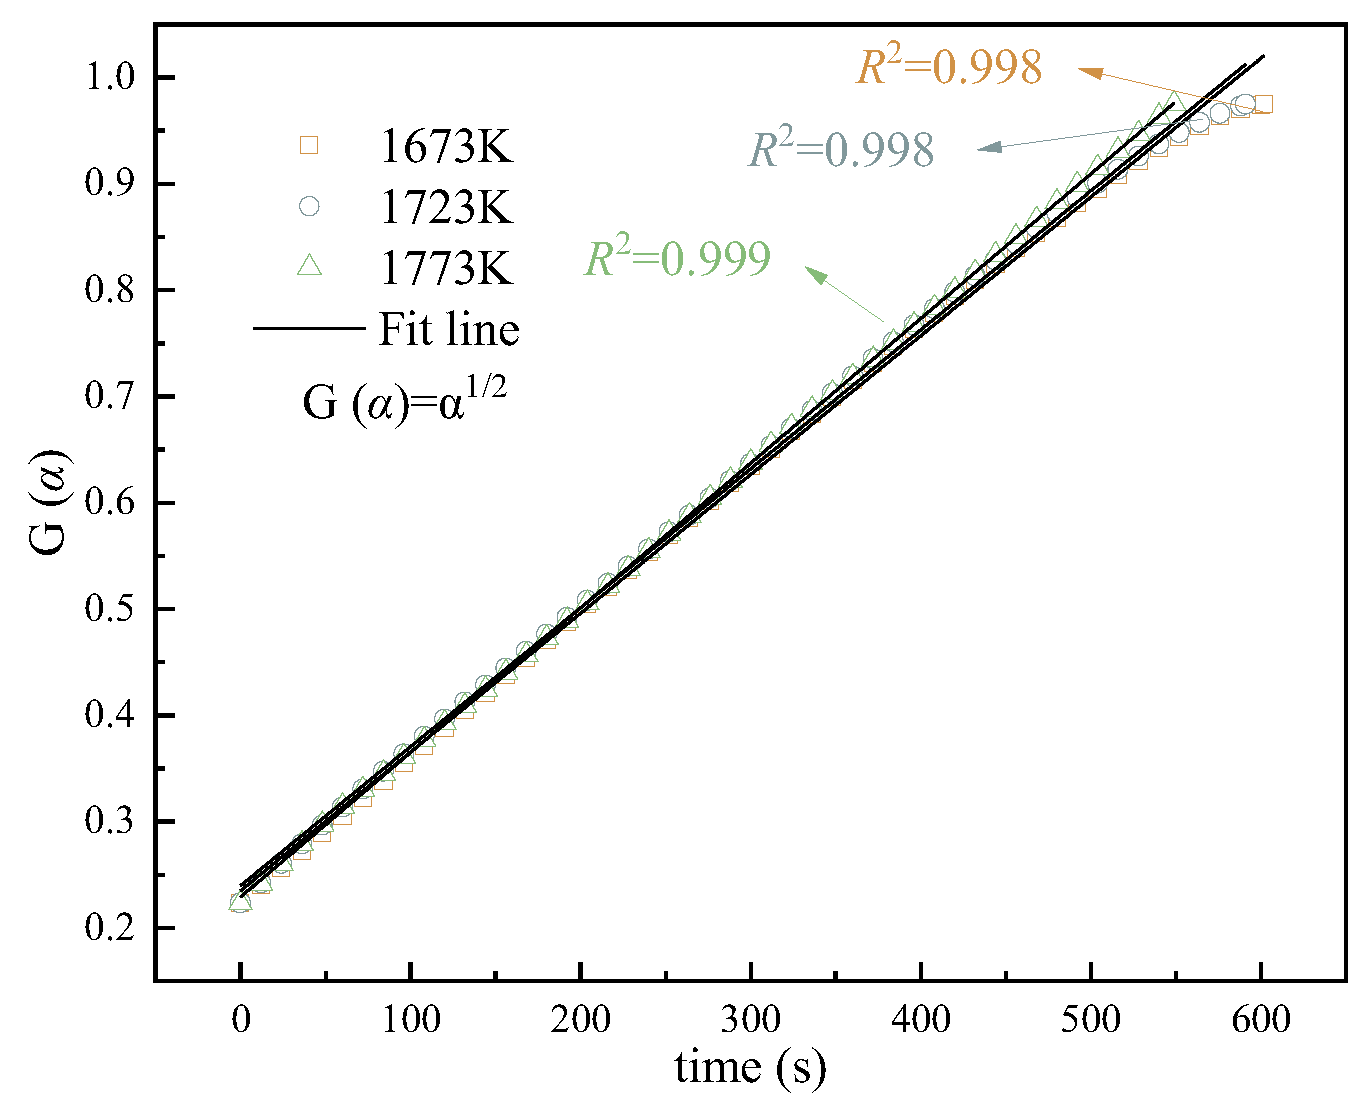
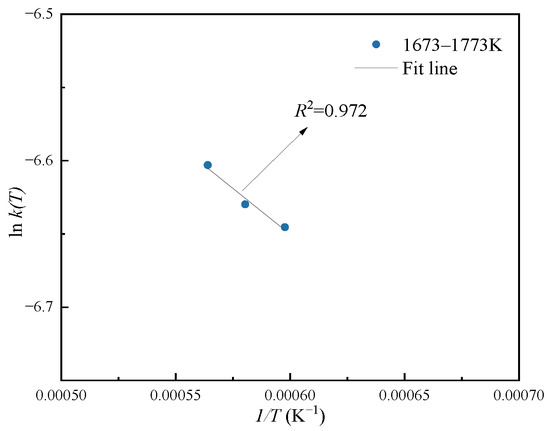
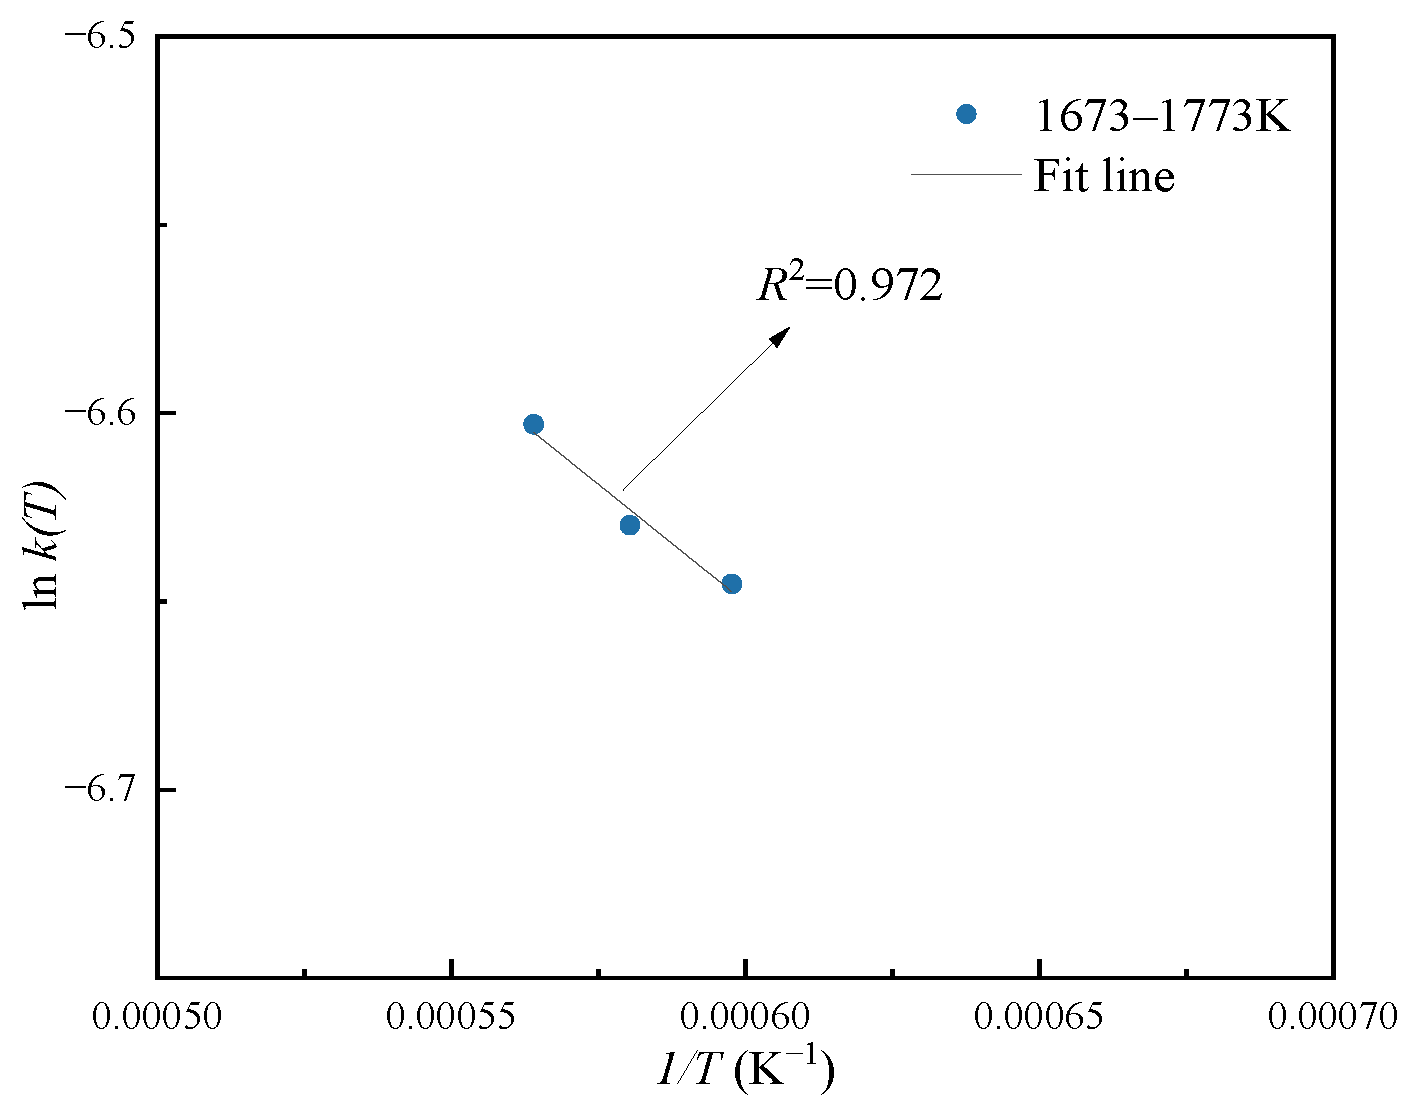
The reduction rate constants, k(T), was calculated by linear fitting based on different G(α) values in Table 2 and reaction time [22]; the corresponding correlation coefficients are shown in Table 3. For the chemical reactions mentioned in this paper, the correlation coefficients with P2 (Mampel power, n = 1/2) are more than 0.997; at the same time, under the specific physical conditions of this experiment, the reactant is a liquid FeO melt pool. After being reduced by hydrogen molecules, the resulting product is solid metallic iron (since the temperature range of 1673–1773 K is well below the melting point of pure iron, which is 1811 K). More critically, as demonstrated by previous metrology studies, the initial liquid melt already contains approximately 9.63 wt% of solid metallic iron seed crystals dispersed throughout. These inherent iron seed crystals overcome the extremely high surface energy barrier required for homogeneous nucleation. Therefore, in this system, newly produced iron atoms do not need to undergo random collisions to form new nuclei, but instead undergo continuous crystallization and epitaxial growth directly at the extensive phase interface between liquid FeO and pre-existing solid Fe. This physical picture of “growth driven directly by stabilization at the phase interface without nucleation” aligns perfectly with the mathematical framework expressed by the Mampel P2 model. In contrast, the complex Avrami–Erofeev model is typically used to describe complex solid-state systems in which nucleation and growth occur simultaneously, and individual crystal nuclei merge and overlap as they grow. Since the pre-existence of iron seeds in this study effectively eliminates the “random nucleation” stage, the random nucleation assumption of the Avrami model is no longer applicable here, and the Mampel P2 model is used in this study. Figure 6 shows the linear fitting results of G(α) of the P2 model with reaction time. According to the fitting results of the P2 model, the reduction reaction rate constant, k(T), can be obtained. By linear fitting of 1/T and lnk(T), the pre-exponential factor, A, and the activation energy of reduction reaction, E, can be obtained, and the fitting results are shown in Figure 7. As can be seen in Figure 6, the curve deviates from linearity at 1723 K. This is because, during the initial and intermediate stages of the reaction, hydrogen gas flows over the relatively smooth surface of liquid FeO, and iron atoms at the interface continuously deposit onto suspended iron nuclei; during this stage, the activation energy remains at a low level (primarily controlled by gas-phase diffusion). As the conversion rate, α, reaches 0.6 and the minimum activation energy is reached, the macroscopic topological structure of the system undergoes a dramatic change. A large number of solid iron particles begin to come into contact with one another and coalesce in the liquid phase, gradually forming a solid porous iron framework (solid iron sponge/dendritic network) spanning the entire crucible [23]. The formation of this solid-state iron framework causes the remaining liquid FeO to be encapsulated or segregated within narrow pores. The macroscopic fluidity of the liquid phase decreased significantly; hydrogen gas had to penetrate deep into the increasingly constricted pores of the iron framework to reach the liquid FeO, and subsequently, water vapor needed to overcome relatively high capillary resistance to diffuse outward. This pore collapse and the drastic deterioration of diffusion pathways caused the reaction to enter a late-stage deep diffusion-limited regime, thereby forcing the apparent activation energy to rise sharply again. The slight linear deviations observed in Figure 6 and Figure 7 during the late stages of the reaction are precisely due to a minor shift in the kinetic constant caused by the transition of the hydrodynamic boundary conditions from “diffusion at a flat liquid surface” to “diffusion within a porous framework.”
Table 3.
Correlation coefficients calculated using common reaction mechanism functions.
Figure 6.
Linear fitting of G(α) versus time of the reaction model (P2): 1673 K–1773 K.
Figure 7.
Linear fitting result of 1/T and lnk(T).
Table 4 shows the relevant parameters of the linear fitting of the above-selected macroscopic fitting models and the pre-exponential factors and activation energies obtained. When the reduced FeO is molten and the product, Fe, is solid, the apparent activation energy, E, is 10.43 kJ/mol and the pre-exponential factor, A, is 2.75 × 10⁻³ s−1. Substituting the macroscopic fitting model, f(α) = 2α1/2, of E, A, and P2 models into Equation (6), the kinetic equation of hydrogen reduction of FeO in the temperature range of 1673–1773 K can be written as follows:
Table 4.
Results of the calculation of kinetic parameters based on the Mampel power-law model.
3.2.2. Iso-Conversional Method
The iso-conversional method is another method used to calculate the activation energy in thermal analysis kinetics. Equation (7) can be obtained from Equations (2) and (4):
Equation (8) can be obtained by integrating Equation (7):
Equation (8) can be further expressed as follows:
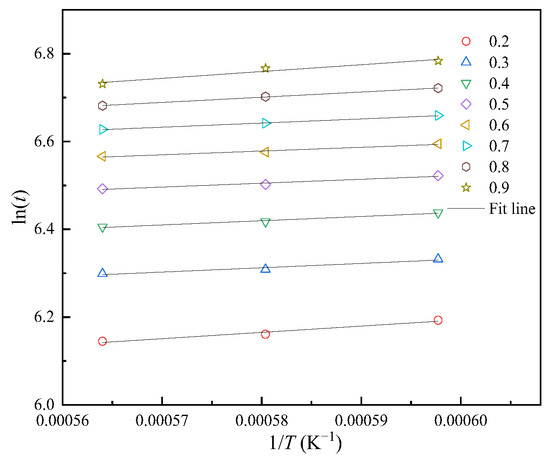
When the reduction conversion, α, is a constant, then lnG(α)-lnA is also constant, so the slop of the plot ln(t) vs. 1/T can be used to calculate activation energy, E. The iso-conversional method has the advantage that it can calculate the activation energy without determining the mechanism, and it can reflect the change in the activation energy at different reduction conversions [24].
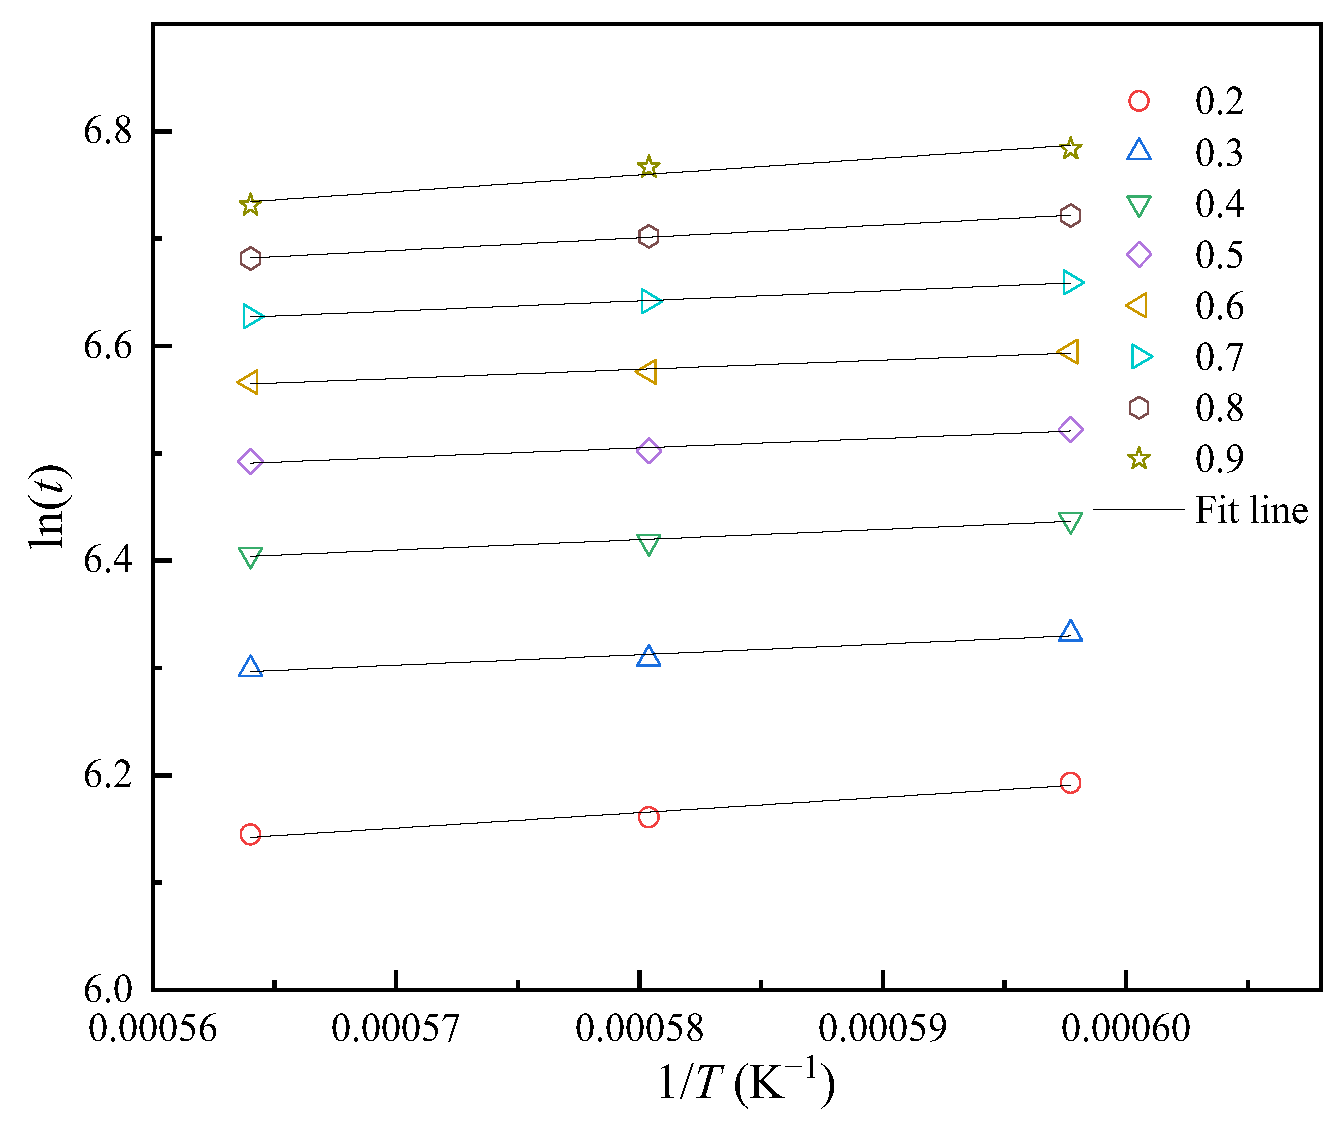
Because inert gas was used as protective gas in the heating stage, the composition of reducing gas did not reach the required gas composition immediately when the reduction experiment began. Therefore, the activation energy, E, of the reaction is calculated with the selected reduction conversion range of 0.2 to 0.9, with the step set as 0.1. The reaction time to reach each conversion ratio at different temperatures comes from Figure 5 and is used to further calculate the corresponding ln(t). Figure 8 shows the linear relation between ln(t) and 1/T, where the colored hollow symbols are calculated from experiment data, and the straight line is linear-fitted.
Figure 8.
Linear relation between ln(t) and 1/T with the reduction conversion range of 0.2–0.9: 1673–1773 K.
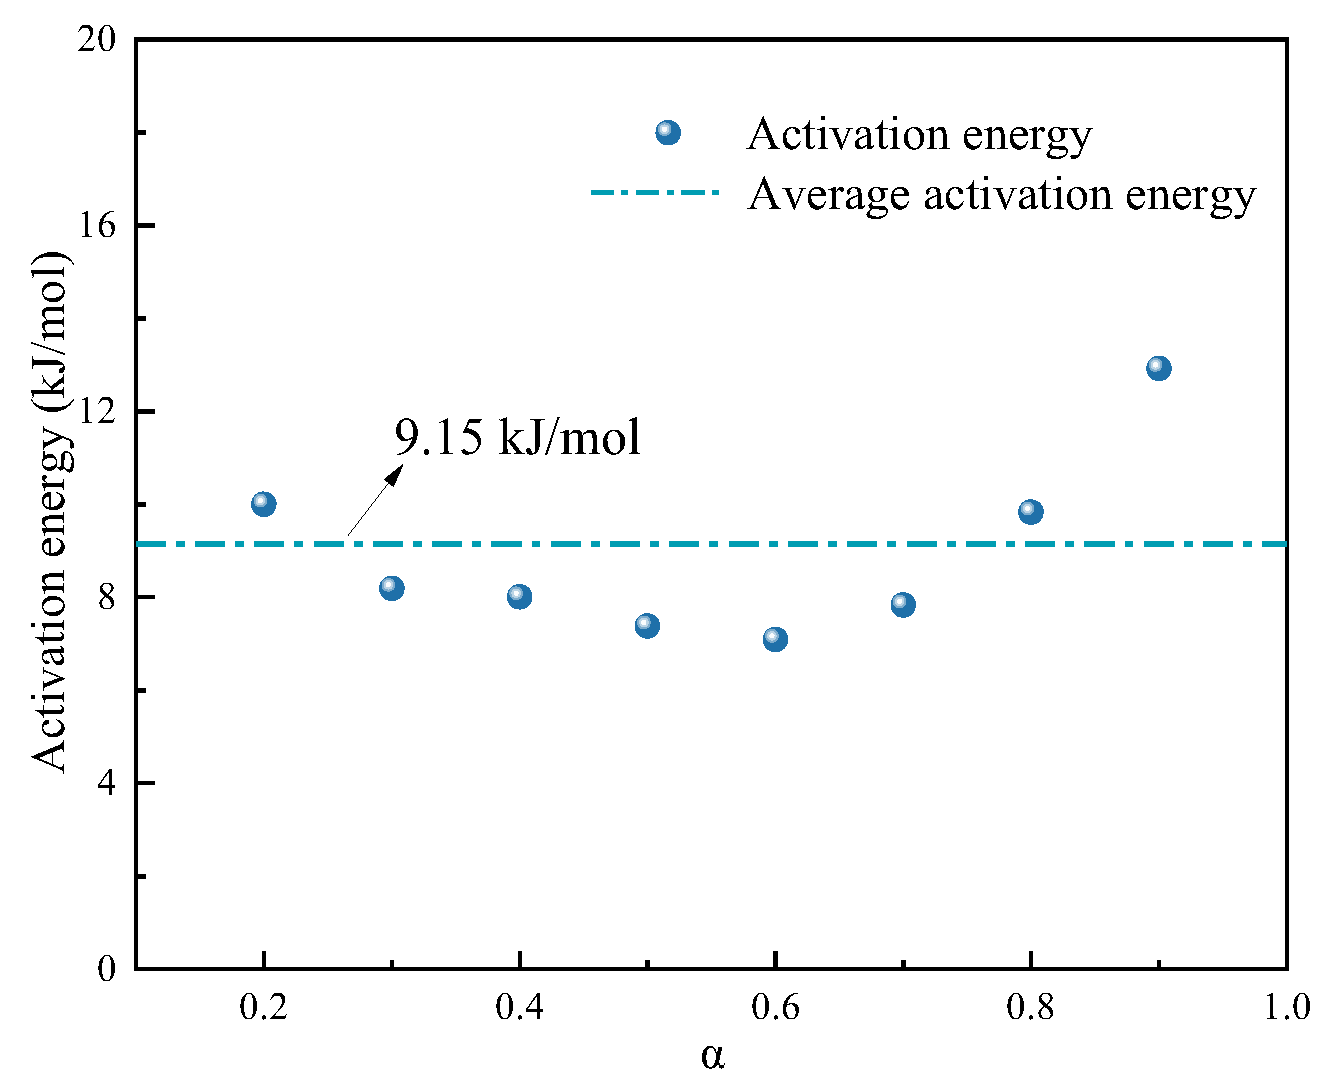
Activation energy, E, at different reduction conversions and the average activation energy during the whole reduction process are shown in Table 5. The correlation coefficients (R2) for activation energy calculation at all reductions are more than 0.91. When the reactants are molten and the products are solid, the average activation energy is 9.15 kJ/mol. The average activation energy calculated by the iso-conversional method is in general agreement with the activation energy calculated by the Mampel power model, indicating that the macroscopic fitting model selected by the model fitting method is accurate. Compared to the high activation energy of approximately 110 kJ/mol obtained by Hayashi et al. under suspended microdroplet conditions, the apparent activation energy obtained in this study is significantly lower. Hayashi et al.’s study utilized a microdroplet system under high-velocity gas flow, where the reaction interface is rapidly renewed and external mass transfer resistance is low; consequently, the kinetics primarily reflect the intrinsic chemical reaction characteristics at the interface, resulting in a higher activation energy [19]. In contrast, this study employed a static molten pool system, with reduction carried out under lower gas flow rates, making gas transport to the molten FeO surface more likely to become the rate-limiting step. According to physical–chemical kinetic theory, reactions controlled by gas-phase diffusion or external mass transfer typically have apparent activation energies in the range of 5–20 kJ/mol; thus, the low activation energy obtained in this study exhibits typical characteristics of diffusion-controlled reactions. This suggests that the differences between the two studies may arise from variations in reactor structure, sample morphology, and flow field conditions, which could lead to changes in the rate-controlling step. Therefore, the results obtained in the present study may provide a reasonable representation of the kinetic behavior of hydrogen reduction of FeO in a static molten system.
Table 5.
Activation energy at different α values in different temperature ranges.
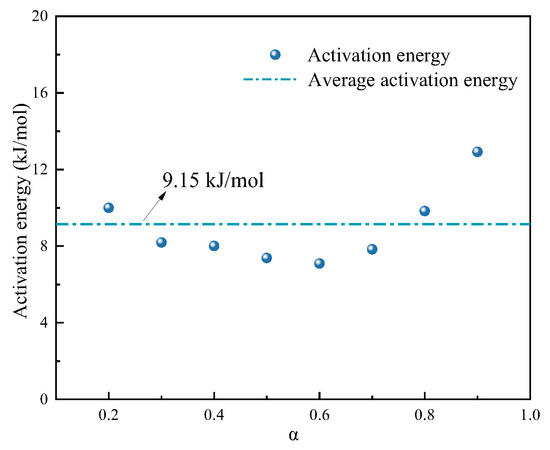
Figure 9 shows the relationship between the activation energy and the conversion rate when the reactants are molten and the products are solid. With the increase in reduction conversion, the activation energy varies between 7.09 and 12.92 kJ/mol. It shows a trend of decreasing first and then increasing, and when the reduction conversion is 0.6, the minimum activation energy is reached. When the reactant, FeO, is molten and the product, Fe, is solid, the reaction mechanism is relatively complex due to the simultaneous existence of molten FeO and solid Fe, resulting in a large difference in activation energy at different conversion rates. In the early stage of reaction, the energy required for the generation of active sites is high, while in the early stage of active site growth, the energy required is low. With the accumulation and growth of the product, Fe, the energy required is gradually increased.
Figure 9.
The relationship between activation energy and conversion: 1673–1773 K.
3.3. Molecular Dynamics Simulation Results
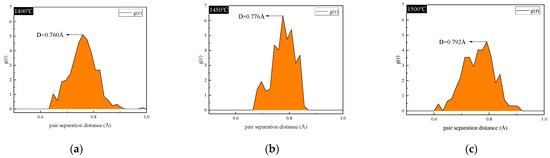
Isothermal kinetic calculation results show that the suitable macroscopic fitting model of FeO reduction of pure hydrogen is P2 (Mampel power, n = 1/2). The main restrictive factor of this reaction is adsorption and nucleation of H2 and O2−. The adsorption process of hydrogen on the FeO surface was analyzed by molecular dynamics simulation. Therefore, in this subsection, we use MD analysis to extract the radial distribution function after the system has stabilized, thereby demonstrating the spatial distribution of H–H bonds within the hydrogen molecule at high temperatures from a statistical perspective. As the simulation temperature increases, the peak corresponding to the H–H bond length in the RDF curve shifts significantly outward and broadens. This directly demonstrates, at the microscopic level, that the highly active atomic thermal motion on the surface of liquid fusite at high temperatures actively promotes the stretching and weakening of the hydrogen molecular bond. This reduction in bond energy serves as the microscopic prerequisite for the subsequent dissociative adsorption and oxygen-atom stripping. The computational validation of this mechanism not only provides a profound atomic-level explanation for the entire study but also aligns with the literature regarding the high-temperature reactivity of intrinsic chemical reactions.
First, the model was constructed using Material Studio 2020 (BIOVIA, Dassault Systèmes, Vélizy-Villacoublay, France), and the subsequent molecular dynamics simulations were carried out using the corresponding simulation module. The underlying trajectory integration and force field calculations were performed using the open-source Large-scale Atomic/Molecular Massively Parallel Simulator (LAMMPS) developed by Sandia National Laboratories, Albuquerque, NM, USA. To eliminate edge effects and realistically simulate an infinitely extending macroscopic liquid surface, strict periodic boundary conditions were applied in all three dimensions of the simulation domain, the FeO substrate was established, and the surface was created along the (100) direction (6 layers of atoms; 50 Å × 50 Å; 3584 atoms). Then, hydrogen molecules were established in the Z direction of the FeO substrate, and the H2 molecules with the lowest energy were selected to create a vacuum layer of 4 Å between the gas layer and the substrate at a gas concentration of 0.02 g/cm3. The adsorption process of H2 was simulated using the open-source LAMMPS program (version 29 Oct 2020, Sandia National Laboratories, Albuquerque, NM, USA). Canonical ensemble (NVT, with particle number, volume, and temperature held constant) was used to simulate the adsorption process, and the temperatures were chosen to be 1400 °C, 1450 °C, and 1500 °C, respectively. The interatomic interactions among Fe, O, and H are described by a well-established Fe-O-H three-body empirical potential function, which accurately captures the coordination distortion of transition metal oxides at high temperatures and the physicochemical adsorption of gas atoms. The cutoff radius was conservatively set to 10 Å. Given the extremely small mass and high vibrational frequency of hydrogen atoms, the time integration step size was set to an extremely fine 0.25 fs. The system was allowed to run for at least 50 ps of equilibrium relaxation prior to data acquisition, with a root-mean-square fluctuation in total energy and temperature of less than 5% serving as the criterion for the system to reach thermodynamic equilibrium.
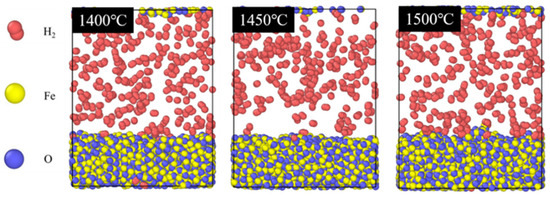
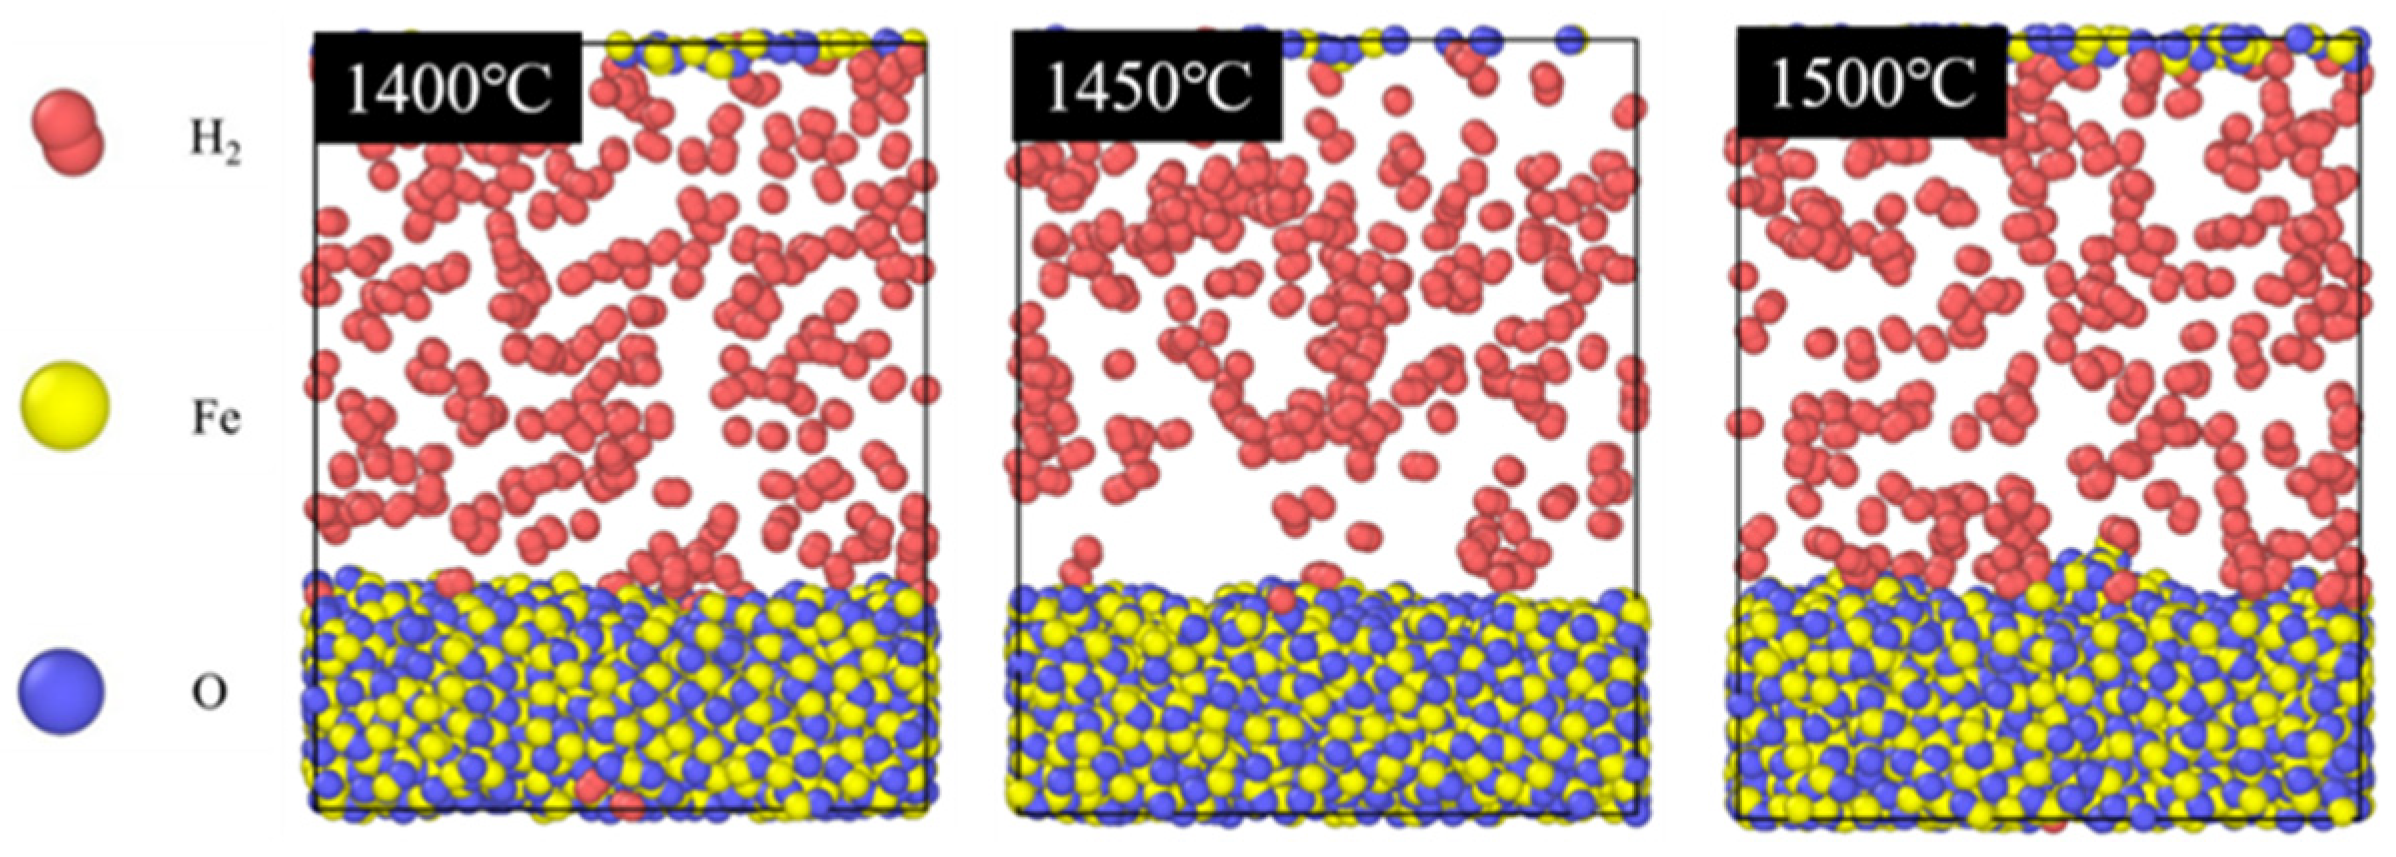
The adsorption process at 1400 °C, 1450 °C, and 1500 °C is shown in Figure 10. It can be found that within this temperature range, FeO base has melted into liquid, and with the increase in temperature, the FeO substrate becomes more active and hydrogen molecules move more violently.
Figure 10.
Molecular dynamics simulation of H2 and FeO adsorption results.
In order to further study the influence mechanism of temperature on hydrogen reduction of FeO, the radial distribution function of the stabilized system was extracted to study the spatial distribution of hydrogen molecules from a statistical perspective. The change curve of g(r) with pair separation distance (D) at three temperatures is shown in Figure 11. The pair separation distance value corresponding to the peak value of g(r) can be regarded as the average separation distance between all hydrogen atoms and their neighboring atoms, that is, the bond length of H-H chemical bond. With the increase in temperature, the bond length of the H-H chemical bond becomes longer, and the bond energy decreases when the system is stable, which is conducive to the adsorption and reduction reaction of H2 molecules on the FeO surface, as is consistent with the experimental results.
Figure 11.
The relation between g(r) and pair separation distance: (a) 1400 °C, (b) 1450 °C, and (c) 1500 °C.
4. Conclusions
By means of isothermal thermogravimetric experiment and molecular dynamics simulation, the reaction process of pure hydrogen in the temperature range of 1673–1773 K was studied, and the following conclusions were obtained:
(1) With the increase in the reduction temperature, the peak value of the reduction conversion rate curve shows an increasing trend, and the peak time of the reduction conversion rate curve does not change significantly, but the reduction conversion rate decreases to zero earlier. With the increase in temperature, the more severe the reduction reaction, the shorter the time required for complete reduction. At 1673 K, 1723 K, and 1773 K, the curves of reduction conversion rate with time are single-peaked, and the peaks of reduction conversion rate are 2.05 × 10⁻³ s−1, 2.10 × 10⁻³ s−1, and 2.42 × 10⁻³ s−1, respectively. The corresponding reduction time to reach the peak value was 790.8 s, 772.8 s, and 826.8 s, respectively, and the time of reduction conversion rate to zero was 1188 s, 1032 s, and 936 s, respectively.
(2) According to the linear fitting results of the integral method, the correlation coefficient of the P2 model is high, so f(α) = 2α1/2 is an appropriate macroscopic fitting model for hydrogen reduction of wustite. When the reduced product, FeO, is in a molten state and the product, Fe, is in a solid state, the apparent activation energy (E) is 10.43 kJ/mol, and the pre-exponential factor (A) is 2.75 × 10⁻³ s−1. In the temperature range of 1673–1773 K, the kinetic equation of hydrogen reduction of FeO is as follows:
(3) The apparent activation energy of reduction reaction was calculated by the equal conversion method: when the reactant, FeO, was molten and the product, Fe, was solid, the average activation energy was 9.15 kJ·mol−1. It is consistent with the activation energy calculated by the P2 model, which indicates that the macroscopic fitting model selected by the integration method has certain accuracy. With the increase in the reduction conversion rate, the activation energy varies from 7.09 to 12.92 kJ·mol−1, and it firstly decreases and then increases, reaching the minimum value when the conversion rate is 0.6. This may be because the energy required to generate reaction sites in the system at the initial stage of reaction is relatively high, while the energy required at the initial stage of reaction site growth is relatively low. With the accumulation and growth of the product, Fe, the energy required gradually increases.
(4) Molecular dynamics simulation results show that H2 can spontaneously adsorb on FeO surface in the temperature range of 1673–1773 K. With the increase in temperature, FeO substrate becomes more active, and hydrogen molecules move more violently. The average distance between a hydrogen atom and its neighboring atom was analyzed statistically. It was found that the average bond length and bond energy of hydrogen molecules were increased by the temperature increase, which was favorable for the adsorption and reduction of hydrogen molecules on the FeO surface, as was consistent with experimental results.
Author Contributions
Conceptualization, F.L. and Z.L.; Methodology, F.L., Y.L., T.W., B.F., Y.W., C.Y. and Z.L.; Validation, F.L.; Formal analysis, F.L.; Investigation, F.L. and Z.L.; Resources, F.L., C.Y. and Z.L.; Data curation, F.L.; Writing—original draft, F.L.; Writing—review & editing, F.L., J.Z., Y.L., T.W., B.F., Y.W. and Z.L.; Supervision, J.Z., Y.L., T.W., B.F., Y.W. and Z.L.; Project administration, Y.W. and Z.L.; Funding acquisition, J.Z., Y.W. and Z.L. All authors have read and agreed to the published version of the manuscript.
Funding
This work was supported by the National Natural Science Foundation of China (Grant No. 52374319), the Young Elite Scientists Sponsorship Program by CAST (Grant No. YESS20230029), the The National Youth Talent Support Program (Grant No. GJRC2023008), and the National Natural Science Foundation of China (Grant No. 52574368).
Data Availability Statement
The data presented in this study are contained within the article. Further inquiries can be directed to the corresponding authors.
Conflicts of Interest
Author Yang Li was employed by the Ironmaking Division, Beijing Shougang Co., Ltd. Author Tengfei Wang was employed by the Sinosteel Equipment & Engineering Co., Ltd. The remaining authors declare that the research was conducted in the absence of any commercial or financial relationships that could be construed as a potential conflict of interest.
References
- Wang, X.; Li, B.; Lv, C.; Guan, Z.; Cai, B.; Lei, Y.; Yan, G. China’s iron and steel industry carbon emissions peak pathways. Res. Environ. Sci. 2022, 35, 339–346. [Google Scholar]
- Shao, Y.; Xu, L.; Liu, X.; Chen, H. Discussion on solution of “carbon neutrality” in China’s steel production. China Metall. 2022, 32, 1–8. [Google Scholar]
- Xing, Y.; Cui, Y.; Tian, J.; Su, W.; Wang, W.; Zhang, X.; Liu, Y.; Zhao, X. Application status and prospect of low carbon technology in iron and steel industry. Chin. J. Eng. 2022, 44, 801–811. [Google Scholar]
- Gu, Y.; Pan, C.; Liu, W.; Jiang, Z.; Huang, M. Pathway to carbon neutrality in the iron and steel industry of China: A LEAP-China-IS model assessment. Environ. Pollut. 2025, 383, 126834. [Google Scholar] [CrossRef] [Scilit] [PubMed]
- Wang, D. Development status and future prospect of “hydrogen metallurgy”. China Steel Focus 2021, 14, 47–49. [Google Scholar]
- Su, Y. Development status and Suggestions of hydrogen metallurgy in Chinese iron and steel industry. China Metallurgical News, 15 September 2021; p. 001.
- Spreitzer, D.; Schenk, J. Reduction of iron oxides with hydrogen—A review. Steel Res. Int. 2019, 90, 1900108. [Google Scholar] [CrossRef] [Scilit]
- Tang, J.; Chu, M.; Li, F.; Feng, C.; Liu, Z.; Zhou, Y. Development and progress on hydrogen metallurgy. Int. J. Miner. Metall. Mater. 2020, 27, 713–723. [Google Scholar] [CrossRef] [Scilit]
- Cavaliere, P. Clean ironmaking and Steelmaking Processes: Efficient Technologies for Greenhouse Emissions Abatement; Springer International Publishing: Cham, Switzerland, 2019; pp. 1–37. [Google Scholar]
- Zhang, X.; Jiao, K.; Zhang, J.; Guo, Z. A review on low carbon emissions projects of steel industry in the World. J. Clean. Prod. 2021, 306, 127259. [Google Scholar] [CrossRef] [Scilit]
- Tahari, M.N.A.; Salleh, F.; Saharuddin, T.S.T.; Samsuri, A.; Samidin, S.; Yarmo, M.A. Influence of hydrogen and carbon monoxide on reduction behavior of iron oxide at high temperature: Effect on reduction gas concentrations. Int. J. Hydrogen Energy 2021, 46, 24791–24805. [Google Scholar] [CrossRef] [Scilit]
- Chen, Z.; Dang, J.; Hu, X.; Yan, H. Reduction kinetics of hematite powder in hydrogen atmosphere at moderate temperatures. Metals 2018, 8, 751. [Google Scholar] [CrossRef] [Scilit]
- Dang, J.; Chou, K.; Hu, X.; Zhang, G. Reduction kinetics of metal oxides by hydrogen. Steel Res. Int. 2013, 84, 526–533. [Google Scholar] [CrossRef] [Scilit]
- Zhang, J.; Zhang, G.; Liu, Z.; Wang, Z.; Zhang, X. Production overview and main characteristics of HIsmelt process in Shandong Molong. China Metall. 2018, 28, 37–41. [Google Scholar]
- Ye, H.; Zheng, F.; Hu, B.; Li, W.; Liu, C. Status and development trend of hydrogen-based fuel non-blast furnace iron-making technology. Sinter. Pelletizing 2022, 47, 10–17. [Google Scholar]
- Zheng, S.; Sun, K.; Hao, X.; Yang, S.; Wang, D. Kinetics test of hydrogen-carbon smelting reduction. China Metall. 2013, 23, 15–19. [Google Scholar]
- Katayama, H.; Taguchi, S.; Tsuchiya, N. Reduction of Iron Oxide in Molten Slag with H2 Gas. Tetsu-to-Hagané 1982, 68, 2279–2286. [Google Scholar] [CrossRef] [Scilit]
- Ban-ya, S.; Iguchi, Y.; Nagasaka, T. Rate of reduction of liquid wustite with hydrogen. Tetsu-to-Hagané 1984, 70, 1689–1696. [Google Scholar] [CrossRef] [Scilit] [PubMed]
- Hayashi, S.; Iguchi, Y. Hydrogen reduction of liquid iron oxide fines in gas-conveyed systems. ISIJ Int. 1994, 34, 555–561. [Google Scholar] [CrossRef] [Scilit]
- Zhang, J.; Li, Y.; Liu, Z.; Wang, T.; Wang, Y.; Li, K.; Wang, G.; Xu, T.; Zhang, Y. Isothermal kinetic analysis on reduction of solid/liquid wustite by hydrogen. Int. J. Miner. Metall. Mater. 2022, 29, 1830–1838. [Google Scholar] [CrossRef] [Scilit]
- Yang, X.; Hu, X.; Chen, Z.; Zhou, G. Effect of hydrogen content on reduction kinetics of FeO powder. J. Mater. Metall. 2016, 15, 107–111. [Google Scholar]
- Salucci, E.; D’Angelo, A.; Russo, V.; Grénman, H.; Saxén, H. Review on the reduction kinetics of iron oxides with hydrogen-rich gas: Experimental investigation and modeling approaches. Ind. Eng. Chem. Res. 2024, 64, 1–35. [Google Scholar] [CrossRef] [Scilit]
- Mohanta, R.K.; Fisher, D.; Korobeinikov, Y.; Hong, Q.; Muhich, C.; Sridhar, S.; Leick, N. Bridging the Gap in Carbon Free Iron Making: How Hydrogen Affects the Reduction of Iron Ore between 900 and 1590 °C. ACS Sustain. Chem. Eng. 2025, 13, 17726–17732. [Google Scholar] [CrossRef] [Scilit] [PubMed]
- Xu, R.; Zhang, J.; Wang, G.; Zuo, H.; Li, P.; Wang, H.; Lin, H.; Liu, S. Isothermal kinetic analysis on fast pyrolysis of lump coal used in COREX process. J. Therm. Anal. Calorim. 2016, 123, 773–783. [Google Scholar] [CrossRef] [Scilit]

Disclaimer/Publisher’s Note: The statements, opinions and data contained in all publications are solely those of the individual author(s) and contributor(s) and not of MDPI and/or the editor(s). MDPI and/or the editor(s) disclaim responsibility for any injury to people or property resulting from any ideas, methods, instructions or products referred to in the content. |
© 2026 by the authors. Licensee MDPI, Basel, Switzerland. This article is an open access article distributed under the terms and conditions of the Creative Commons Attribution (CC BY) license.