


Abstract
In this study, the effects of cadmium (Cd) on 4 different alloys developed by casting the Mg-Al-Mn ternary composition, in which the second element is aluminum (Al), and the third element is manganese (Mn), based on magnesium (Mg) metal, which is known as the lightest of the metallic materials in the field of engineering, were investigated. The base alloy Mg-Al-Mn (AM60) (Q1) and the Q2, Q3, and Q4 alloys were produced by adding Cd to the base alloy at rates of 0.2%, 0.5%, and 1.0%, respectively. The effects of element addition were determined by conducting Optical Microscopy (OM), X-Ray Diffraction (XRD), X-Ray Fluorescence (XRF), Scanning Electron Microscopy (SEM), Energy-Dispersive X-Ray Spectroscopy (EDX), hardness tests, potentiodynamic polarization corrosion tests in a 3.5% NaCl environment, and wear tests under 20 N and 40 N loads. The effect of 3.5% NaCl on the alloys in corrosion and wear tests was tested. In the Mg-Al-Mn ternary alloy, the expected α-Mg, β-Mg17Al12, Al8Mn5 and AlMn phases were observed, and Cd was found to be predominantly dissolved in the matrix at the micro-level. Cd showed a fine, uniform distribution in the structure. In the hardness tests, the hardness of the alloy containing 1.0% Cd increased by approximately 16%. According to the potentiodynamic polarization corrosion test values, the corrosion potentials of the alloys were negative, but the corrosion rate (CR) increased with increasing Cd content of the alloys. In corrosive wear tests, based on the aggressive corrosive wear mechanism in a 3.5% NaCl environment, an increase in wear of approximately 25% was observed at the end of 400 m as the load increased from 20 N to 40 N. The effect of hardness on corrosive wear was found to be limited. However, it can be stated that the Cd content of the Q2 alloy, being insufficient in accelerating galvanically induced wear, may reduce friction. In the Q3 and Q4 alloys, the increasingly discontinuous β-phase morphology altered the galvanic coupling geometry, contributing to accelerated abrasive wear. In corrosive wear, only the Q2 samples performed well under both 20 N and 40 N loads in a NaCl environment.
1. Introduction
Magnesium (Mg) alloys are widely used worldwide. Considering their production and market presence, there are very few materials that can compete with Mg and its alloys. Therefore, there is high demand for Mg products in high value-added aerospace, defense, automotive, and electronics sectors. The preference for Mg due to its lightness and strength in many sectors increases the importance of Mg research. In recent years, many industries have prioritized reducing carbon dioxide (CO2) emissions to prevent our world from facing environmental crises. Furthermore, recent energy crises have encouraged these industries to use lightweight engineering materials that will both reduce CO2 emissions and save energy. Mg metal is lightweight and has a high hydrogen storage capacity of 7.6%, meeting the target of the US Department of Energy (DOE). Moreover, its high abundance in the Earth’s crust (Clarke number) makes it one of the most promising hydrogen storage candidate materials [1,2,3]. In September 2020, China attracted worldwide attention with its proposal for carbon neutrality and emissions strategies. In this context, the widespread use of Mg and its alloys appears as one of the best solutions [4].
In particular, the aerospace, space, and automotive sectors show great interest in Mg, which has a density of 1.74 g/cm3 and is the lightest of light metallic materials. However, the mechanical and corrosion resistance properties of Mg alloys limit their usage areas, and studies to improve the mechanical, corrosion, and other characteristics of Mg alloys continue [5].
AZ91 and AM60 Mg alloys, two of the most important Mg alloys, are widely preferred in industrial applications. These alloys constitute 90% of the Mg alloys used in the production of automotive parts. However, compared to AZ series Mg alloys, AM series alloys are being developed more prevalently due to their higher ductility [6,7].
In the literature, the corrosion behaviors of rolled (AZ31, AZ91, AM60, and ZK60) Mg alloys were examined in 1 mol/L sodium chloride (NaCl) solution. According to the results of EIS and potentiodynamic polarization corrosion tests, corrosion resistance was ranked as ZK60 > AM60 > AZ31 > AZ91. Corrosion observations were made with SEM and EDX. In the results, it was reported that local corrosion developed as the corrosion type in all alloys, and the galvanic couples formed by the particles of secondary phases and the matrix were the main reason for local corrosion in Mg alloys.
Corrosion resistance in Mg alloys is directly related to alloying elements and the microstructure of the alloy. There are many examples showing that the quantity of intermetallic phases formed in alloys increases with increasing proportion of alloying elements. For example, there is more β phase in AZ91 than in AZ31, and the β phase is likely to form a micro-galvanic cell with the matrix of the alloy. As a result, AZ31 is expected to be more resistant to corrosion than AZ91 [8].
In the AM60 Mg alloy, manganese (Mn) can form the AlMnFe secondary phase particle. Thus, the iron (Fe) content in the matrix of the Mg alloy can decrease, the microstructure can purify, and as a result of this event, the corrosion resistance of AM60 increases. It was also reported that the more noble galvanic couples of AlMnFe and the matrix caused the microscopic corrosion morphology on AM60 to remain more local. For example, the zirconium (Zr) in the ZK60 Mg alloy acts as a grain refiner, and it was stated that the purification of the alloy composition increased corrosion resistance [8]. In the literature, 0.5% cadmium (Cd), bismuth (Bi), and tin (Sn) were added to AM60 alloys to improve their microstructure and mechanical properties, and it was shown that the mechanical properties of the alloys improved, which was attributed to microstructure modification [9].
In a previous study, the corrosion-related weight loss behavior of AM60 Mg alloy containing 1.88% Cd by weight in 0.1 mol NaCl solution was investigated. It was determined that Cd had an equal distribution in the microstructure, and no new phase formed. It was reported that corrosion resistance increased with Cd addition. The corrosion rate decreased by 1.5 times compared to the AM60 alloy. It was stated that the presence of defects in the alloys initiated corrosion, and the microstructure was important [10].
Mg alloys exhibit many unique properties, including excellent lightness, damping ability, and mechanical strength. However, the poor corrosion resistance of Mg alloys limits and complicates their application areas. The mechanical and corrosion properties of the coated AM60 alloy were investigated in the literature. According to the potentiodynamic polarization curves obtained, the coated samples experienced a significant 99.9% decrease in corrosion rate compared to the base metal. The PEO coating also led to a 114% improvement in hardness values compared to the base AM60 alloys [11].
It was reported that Mg alloys can exhibit different corrosion mechanisms in different environments, and the corrosion resistance of the alloys can vary with different preparation techniques [12].
Therefore, it was stated that understanding the types of corrosion mechanisms that develop in Mg alloys and knowing the effects of compositions in the alloys will contribute to the development of alloys with optimum properties. In the examinations of the corrosion behavior of Mg alloys in corrosive environments in different solutions, the microstructure image in the AM60 alloy was more homogeneous than that in the AZ91D alloy, which showed that AM60 was a more suitable alloy for the production of large-scale components [13]. The phase analyses of the original sample reveal that the microstructure of AM60B alloys mainly contains α-Mg (α-phase) and eutectic β-Mg17Al12 (β-phase), which is consistent with previous reports [14,15,16].
Several studies exist in the literature regarding the AM60 alloy, and one of them identified the presence of an α-Mg main matrix, a β(Mg17Al12) phase, and Al8Mn5 intermetallic phases in the AM60 alloy. In the same alloy, during corrosion tests, the potential of the AM60 alloy rose to approximately −1.48 V (against Ag/AgCl) as soon as the immersion process began. It is believed that the increase in the potential of Mg alloys in aqueous solutions is due to the formation and adhesion of corrosion products on the surface of Mg alloys, and the first corrosion products in the early stage of the immersion process of Mg alloys are metastable hydroxide Mg(OH)2 [17,18].
The α-Mg main matrix formed in the AM60 alloy and the β-Mg17Al12 intermetallic phase formed at grain boundaries were reported in a previous study. It was also stated that these phases were modified with varying cooling rates, and as the cooling rate increased, the size of the α-Mg main matrix decreased, the β-Mg17Al12 phase became thinner, and its continuity decreased. XRD diffractograms of AM60 materials revealed the Al6Mn and Mg17Al12 intermetallic phases in addition to Mg in the alloy [9].
There are few studies on the corrosion resistance of AM series medium-strength magnesium alloys used in the automotive industry, which have high ductility but lower corrosion resistance, with different methods [19]. In particular, the number of corrosion studies with Cd addition is low, and to the best of our knowledge, there is no study on the corrosive wear effects of Cd addition in different ratios in a NaCl environment.
In this study, in addition to the base alloy Mg-Al-Mn (AM60) (Q1), the Q2, Q3, and Q4 alloys were obtained by adding Cd to the base alloy at rates of 0.2%, 0.5%, and 1.0%, respectively. The developments in the microstructures of these alloys were examined using different observation methods, hardness tests were performed, potentiodynamic polarization corrosion tests in a 3.5% NaCl environment were carried out, and wear behaviors under 20 N and 40 N loads were investigated. Going beyond some standard processes in the field of manufacturing and implementing new approaches will contribute greatly to the improvement of Mg alloys.
2. Materials and Methods
For the preparation of the AM60 alloys used in the tests, (~99.9% wt.) pure Mg, (~99.9% wt.) pure Al, (~99.9% wt.) pure Cd, and (~99.9% wt.) Mg (~10% wt.)−Mn master alloy were used. The weights of the elements required for casting the alloys were calculated and carefully weighed. First, 99.9% pure Mg was loaded into the crucible, the temperature of the Mg was raised to 750 °C, and then the other elements were added. To prevent the liquid metal from contacting the atmosphere, it was melted at 750 °C in an induction furnace with a controlled protective atmosphere (argon) and kept at this temperature for 30 min. Then, under gas protection (99% CO2 by volume + 1% SF6 by volume), the alloy was poured into permanent molds preheated to 250 °C. After casting, the alloys were removed from the metal mold and quenched with air.
Then, samples were prepared from suitable regions for metallographic processes, microstructure imaging (Optical Microscopy), SEM, EDX, Mapping, SEM-Line, XRD diffractogram acquisition, XRF analysis, micro-hardness distribution (Vickers) tests, Integrated Potentiodynamic Scanning, and reciprocating friction and wear experiments. The processing and testing steps were carried out in the Karabük University Iron-Steel Institute (MARGEM) laboratory.
For the preparation of metallographic samples for microstructural analyses of the materials, the ASTM standard E407-07 for metal micro-etching and the ASTM standard E3-11 for metallographic sample preparation were used. In the metallography procedure, STRUERS brand equipment, Ballerup, Denmark was used in the hot mounting, cutting, and grinding processes of the samples. The prepared samples were ground using 200, 400, 600, 800, 1000, and 1200 mesh sandpaper and then polished using 1 μ alumina. The samples were then washed with pure water and alcohol, followed by etching for 3 s with a mixture of 6 g picric acid, 5 mL acetic acid, 10 mL distilled water, and 100 mL ethanol to obtain the best results.
Microstructure imaging was performed on the samples obtained by successfully carrying out metallographic analyses using a Nikon optical microscope (OM), Tokyo, Japan. The SEM, EDX, Mapping and SEM-Line processes of the alloys were performed with a Carl Zeiss Ultra Plus Gemini FESEM device, Jena, Germany.
The chemical compositions of the cast alloys were determined using a Rigaku ZSX Primus II brand XRF (X-ray fluorescence) device.
The XRD diffractograms of the cast alloy was determined with a Rigaku Ultima IV device, Tokyo, Japan while scanning at a speed of 3°/min between 10° and 90° and at a 2θ angle.
The hardness tests of the samples were performed using a Q10Q + QNESS brand Vickers micro-hardness device with a load of 0.3 kg using the Vickers hardness test. Hardness measurements were taken from 5 different regions for the evaluations.
Potentiodynamic polarization tests were carried out at room temperature and in 3.5% NaCl solution using a computer-controlled DC105 Gamry model PC4/300 mA potentiostat/galvanostat equipped, Warminster, PA, USA, ABD for corrosion analysis. A classical three-electrode cell was used. Here, the counter electrode was a graphite rod, the reference electrode was a saturated calomel electrode (SCE), and the working electrode was the sample surface. Polarization curves were generated by scanning between −0.25 V (relative to open circuit potential, Eoc) and +0.25 V (relative to Eoc) at a scanning speed of 1 mV·s−1. In the potentiodynamic polarization test, pre-cleaning was performed on the samples to reduce the Open Circuit Potential (OCP) stabilization time, a 30-min waiting period was observed before the test to ensure stabilization, and the test was performed after equilibrium was reached.
The wear tests of the cast and rolled samples were carried out in 3.5% NaCl solution using a reciprocating wear test device. The tests were performed under a load of 20 N, at a sliding speed of 0.1 m/s, and at a total sliding distance of 400 m. After each 100 m wear process in salt water, the sample was dried, and the 3.5% NaCl solution in the wear container was replaced. This process was repeated 4 times. The mass losses of the samples were calculated according to their initial and final weights. The specific wear rate coefficient was calculated using the loss value per one hundred meters in the equation (g/(m·N))·(10−5). In this equation, g: gram, m: meter, and N: Newton. Equation (1) was used to determine friction ratios.
where F: maximum static friction of a mass, m: static friction coefficient, and µ: normal reaction force on the object. With this equation, the amount and coefficient of friction were calculated [20].
F = µ·N
3. Results
3.1. XRF Results
To determine the chemical compositions of the samples obtained from the cast alloys, a Rigaku ZSX Primus II, Tokyo, Japan, brand XRF device was used. The chemical compositions of the alloys are shown in Table 1.
Table 1.
Composition of alloys.
3.2. XRD Diffractogram Results
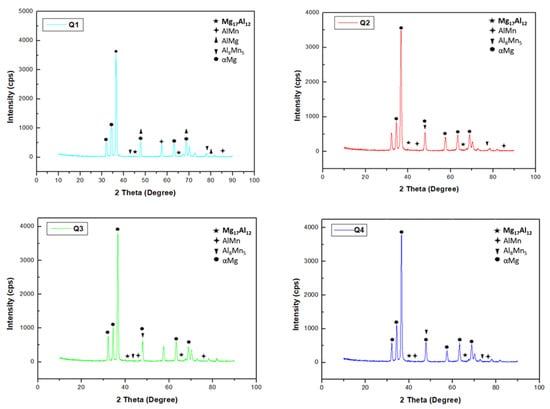
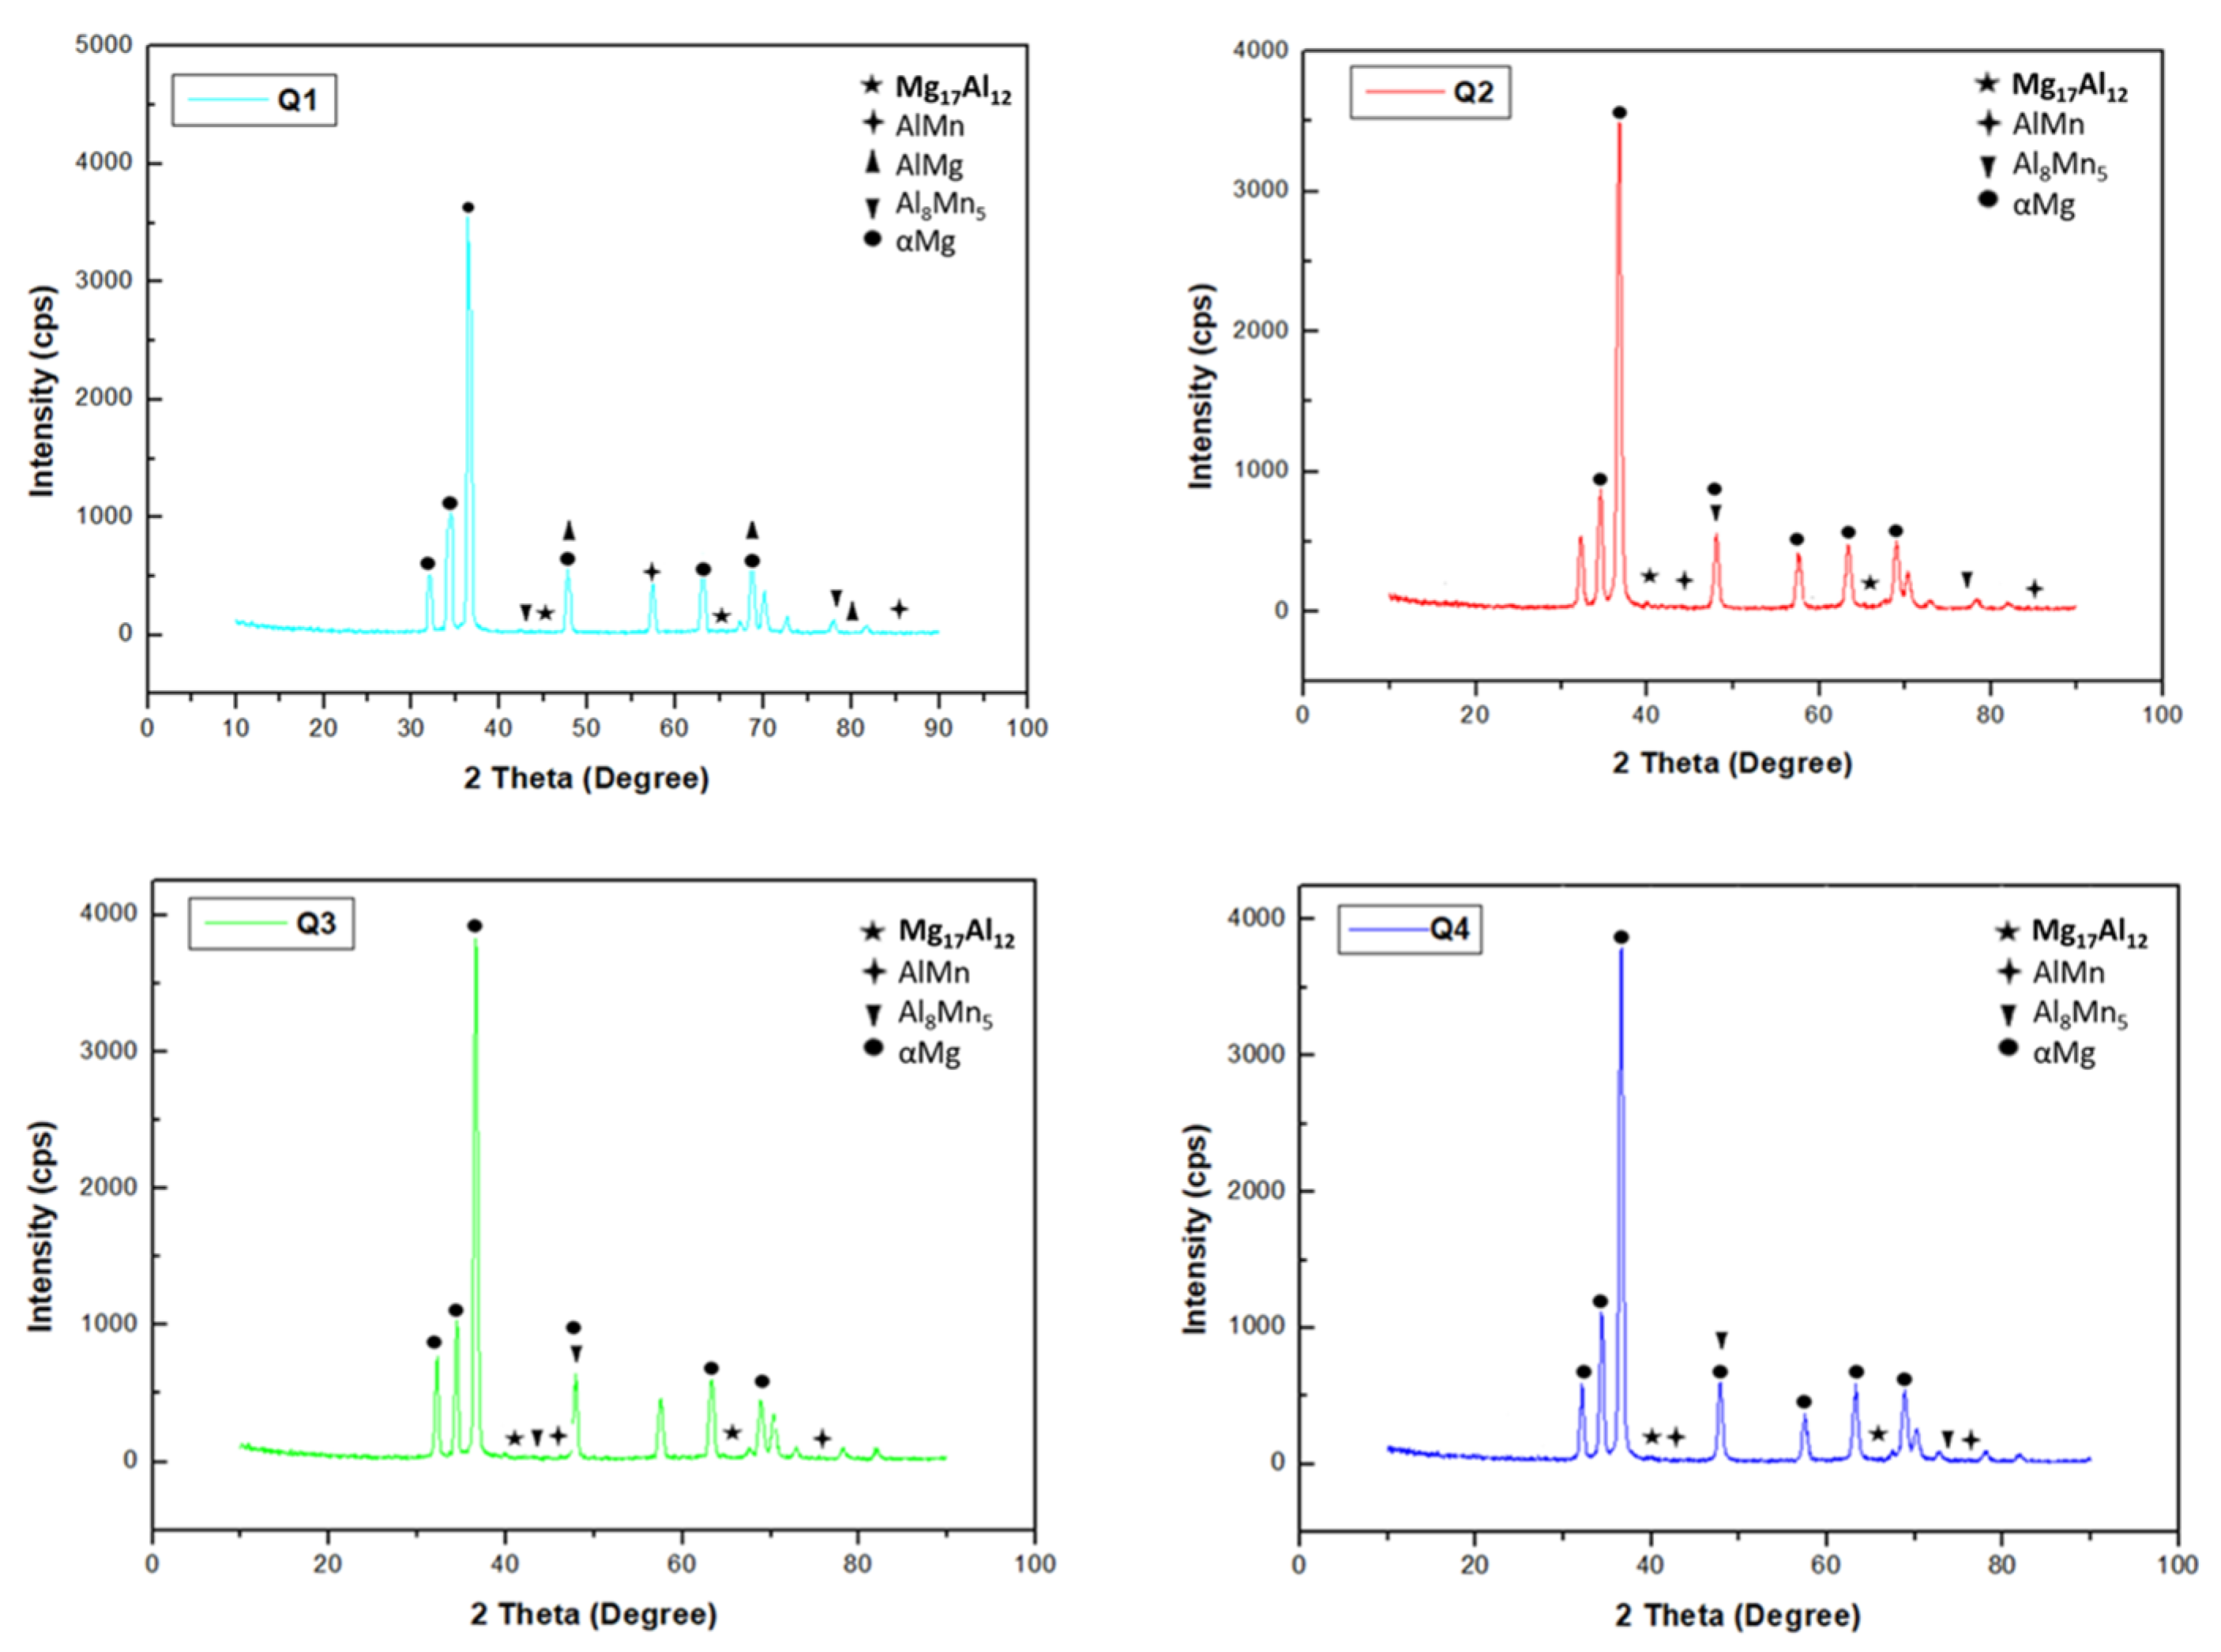
As seen in the XRD diffractograms of the alloys presented in Figure 1, the Q1 alloy profile consisted of the α-Mg, AlMn, AlMg, Mg17Al12, and Al8Mn5 phases. The secondary phase developing between the α-Mg phases, β-Mg17Al12, extended along the grain boundaries, was the most dominant second phase, and had a significant effect on the mechanical and corrosion properties of the material. Much harder than the α-Mg phase, the β-Mg17Al12 phase was brittle due to its hardness and increased the resistance of the material by acting as a barrier against dislocations that could occur.
Figure 1.
XRD Diffractograms of alloys.
3.3. Microstructure Results
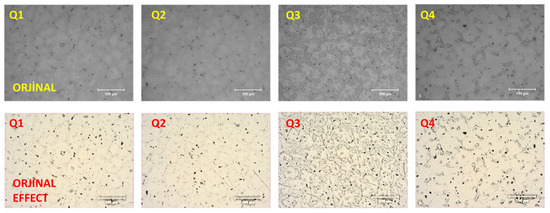
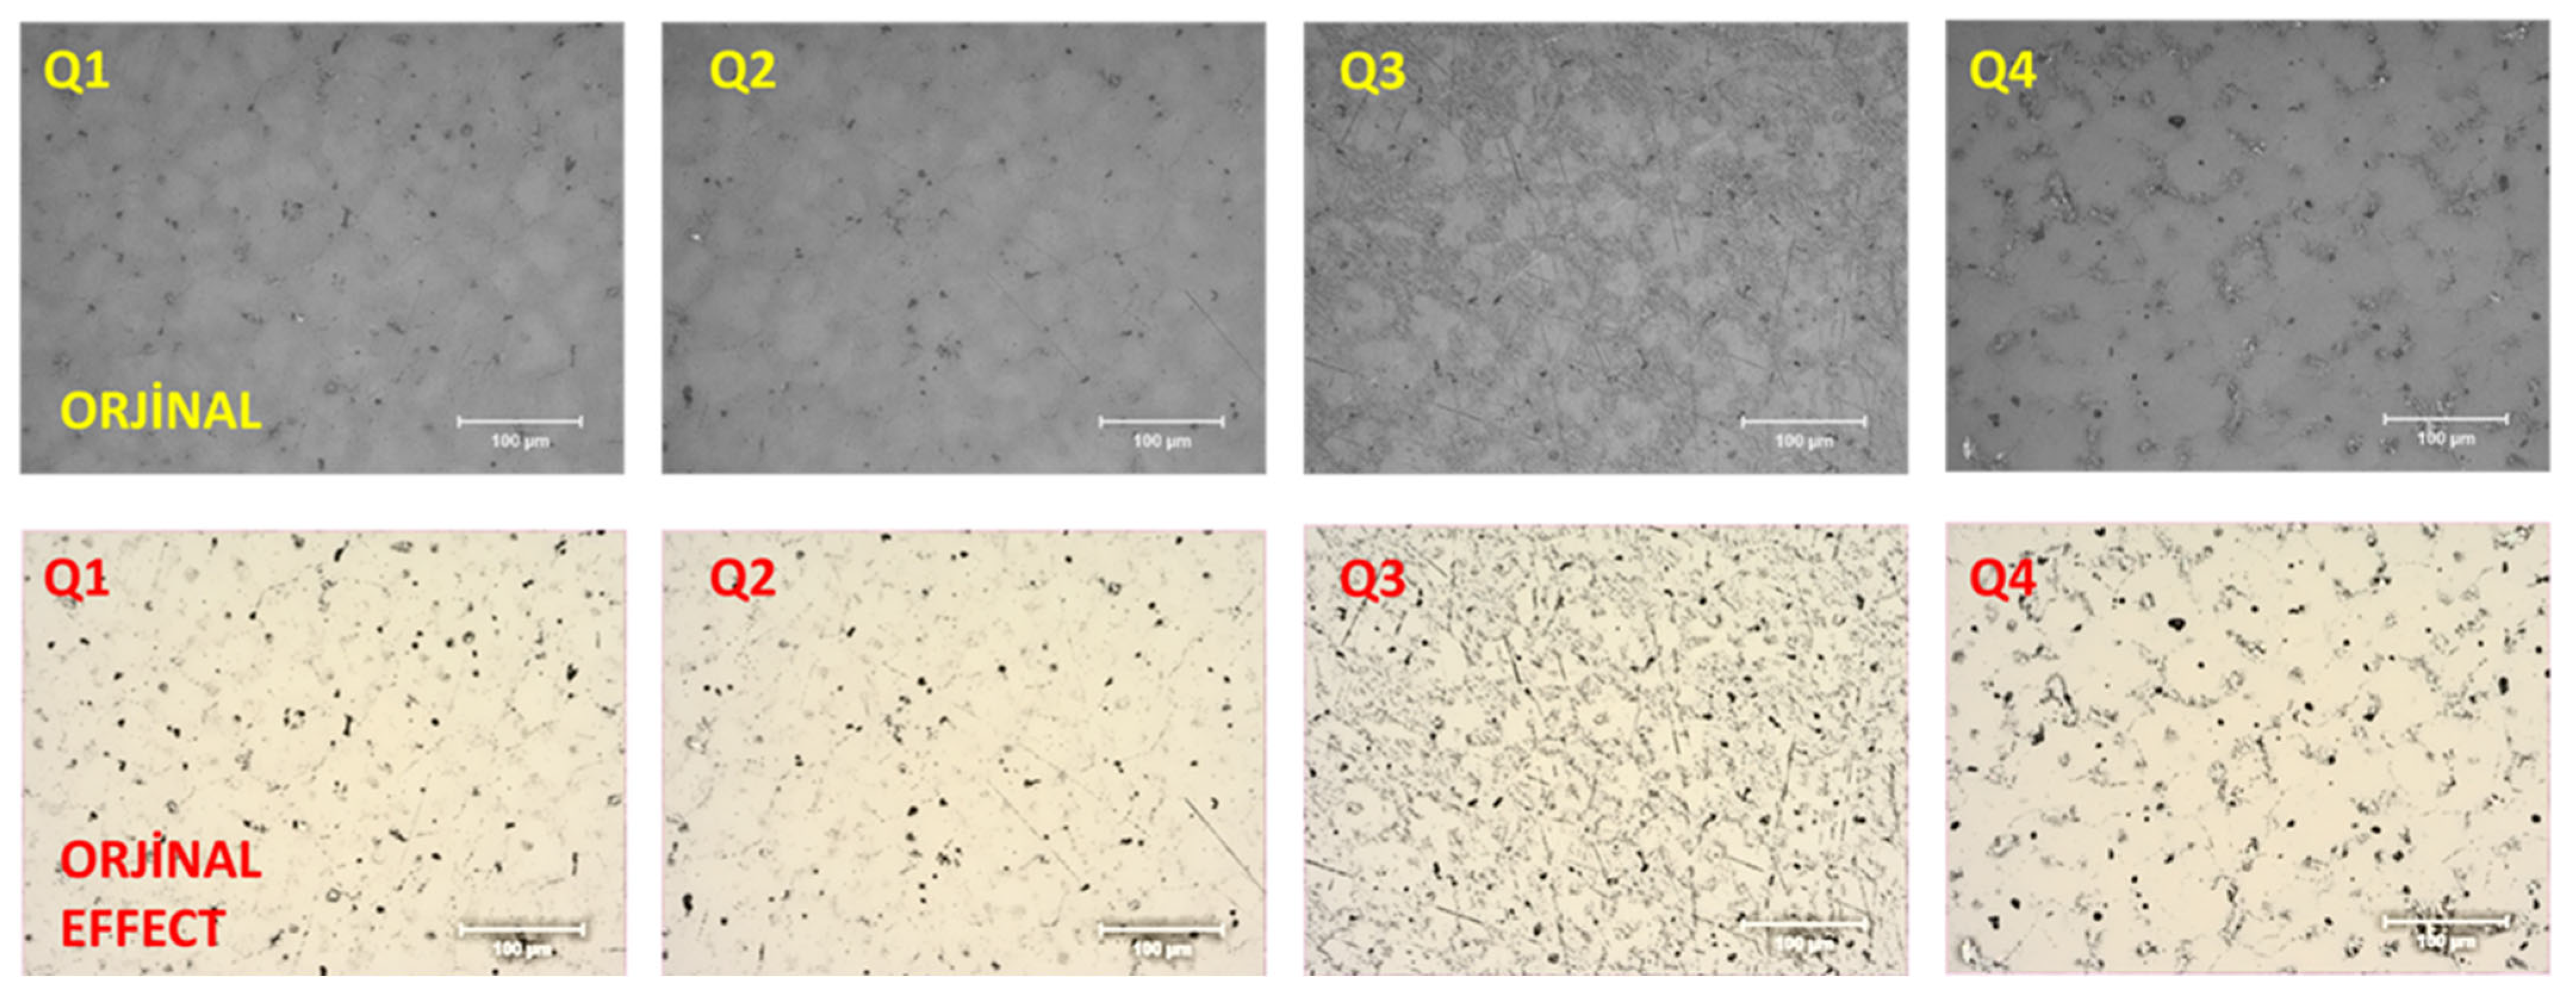
Figure 2 displays the original microstructure images of the alloys obtained using an optical microscope, and the versions with color modification applied for clearer visibility. As the Cd content of the alloys increased, it was observed that the α-Mg grains began to coarsen. In the microstructure images of the alloys, it is seen that as Cd addition increased, the β phase deteriorated and became more discontinuous, as in previous studies. Although the change in phase distribution was not very evident in the Q2 alloy, it became clear that the discontinuities in the phase distribution increased more in the Q3 and Q4 alloys.
Figure 2.
Microstructure images of the alloys.
3.4. SEM Results
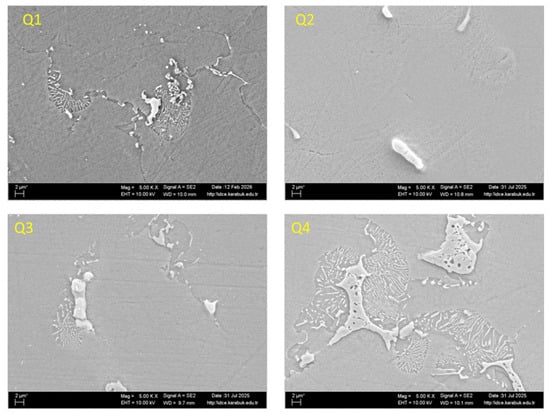
The 5kx magnified SEM images of the alloys are shown in Figure 3. In the SEM images, it is observed that phases similar to the intermetallic αMg, AlMn, Mg17Al12, and Al8Mn5 phases formed by Mg and aluminum (Al) formed. Mg, Al, and Mn can form intermetallic phases with a larger appearance. Elements with low percentages in the matrix have a smaller appearance. Its morphology could be dense or sparse circular lamellar, as seen in the Q4 alloy.
Figure 3.
SEM images of the alloys.
3.5. Mapping Results
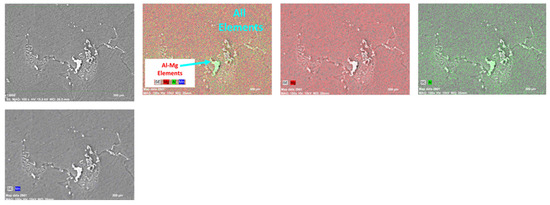
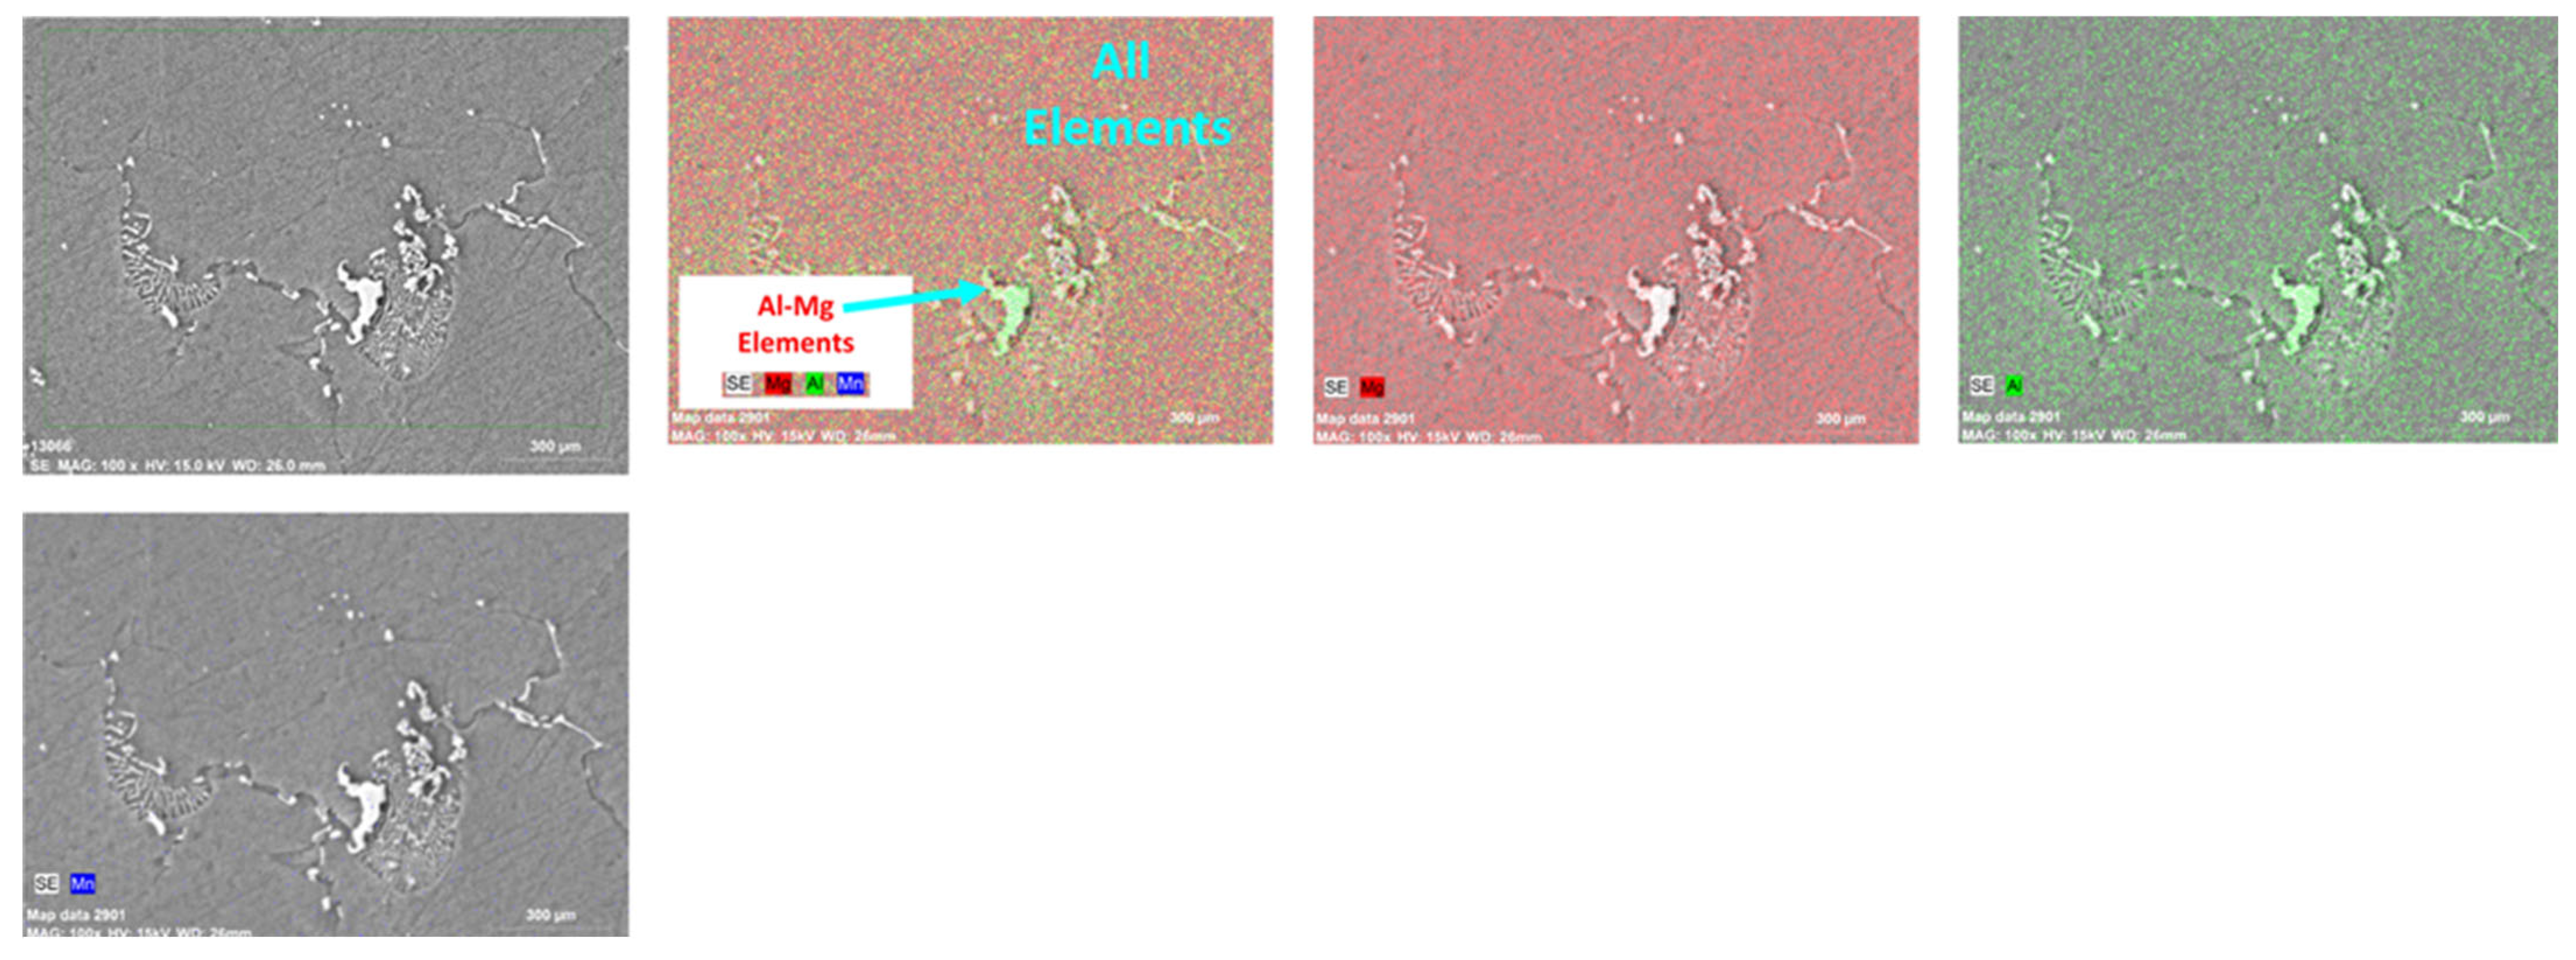
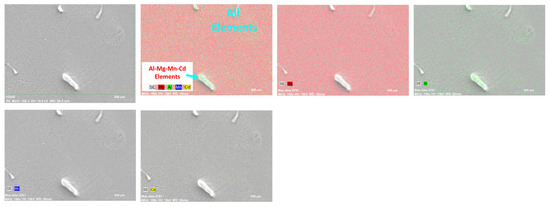
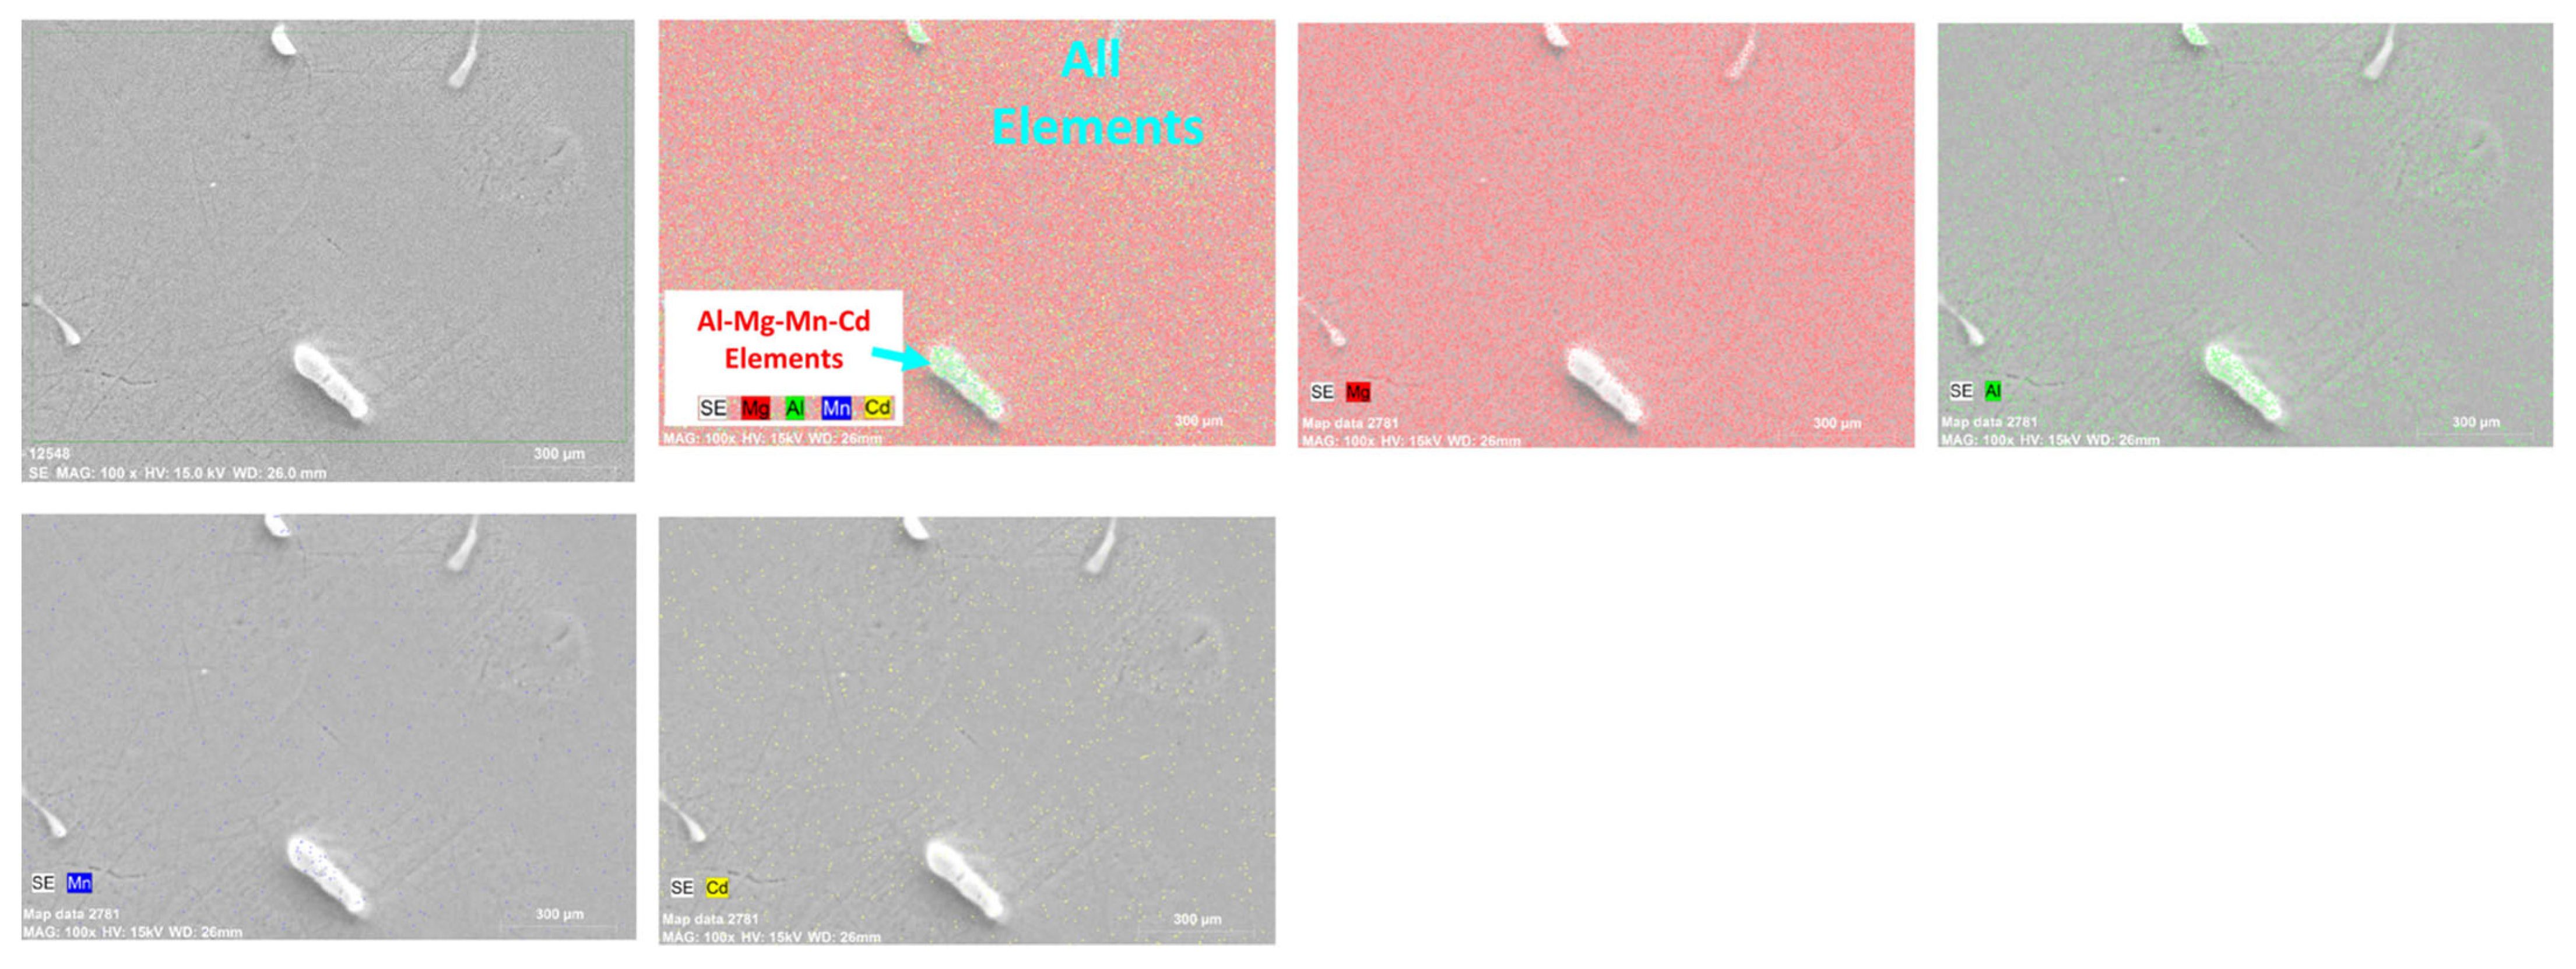
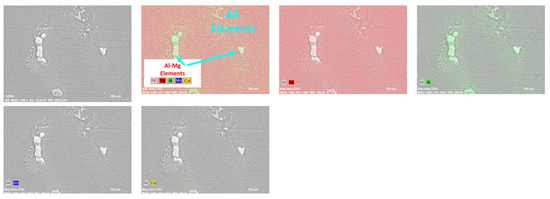
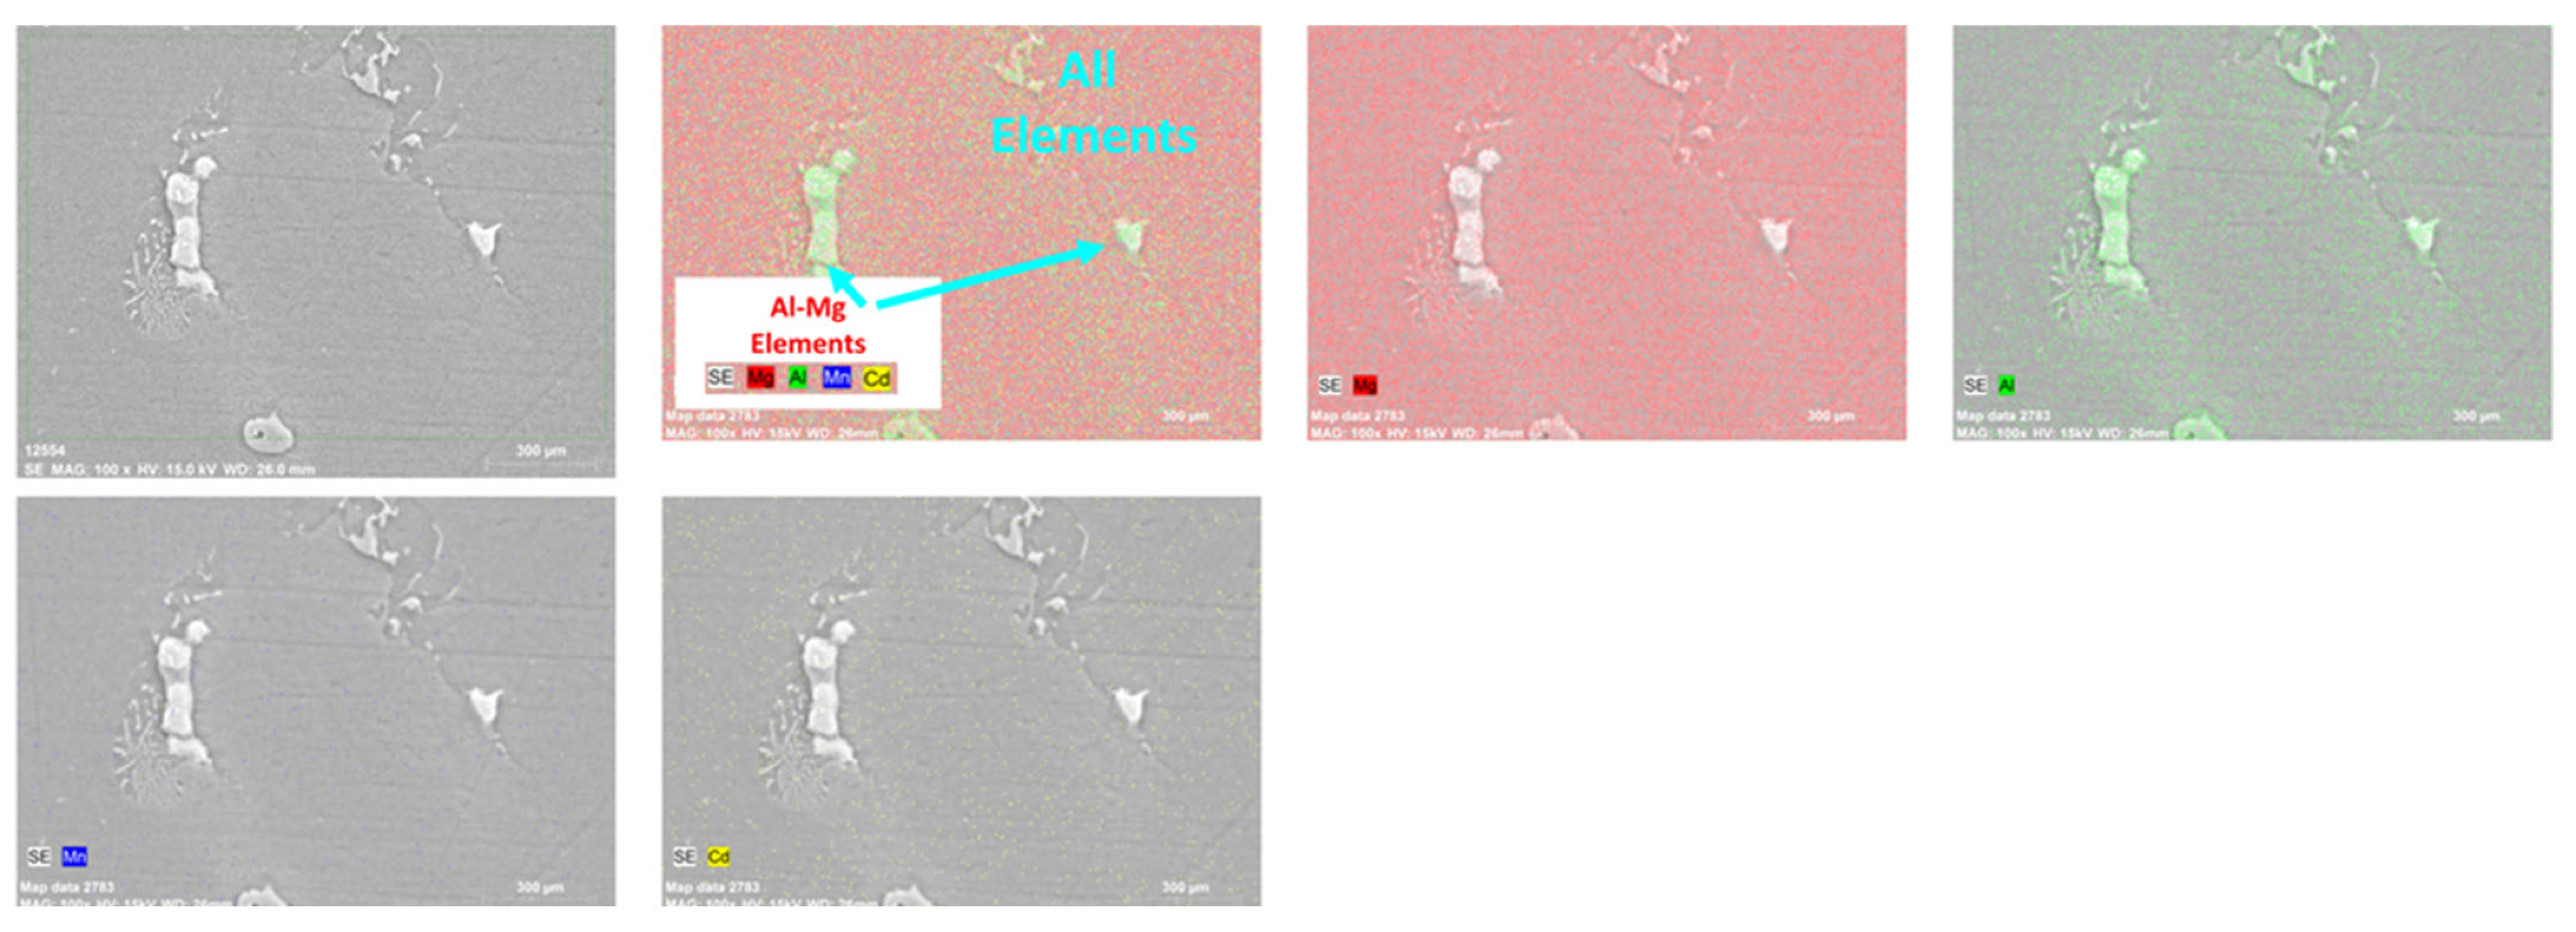
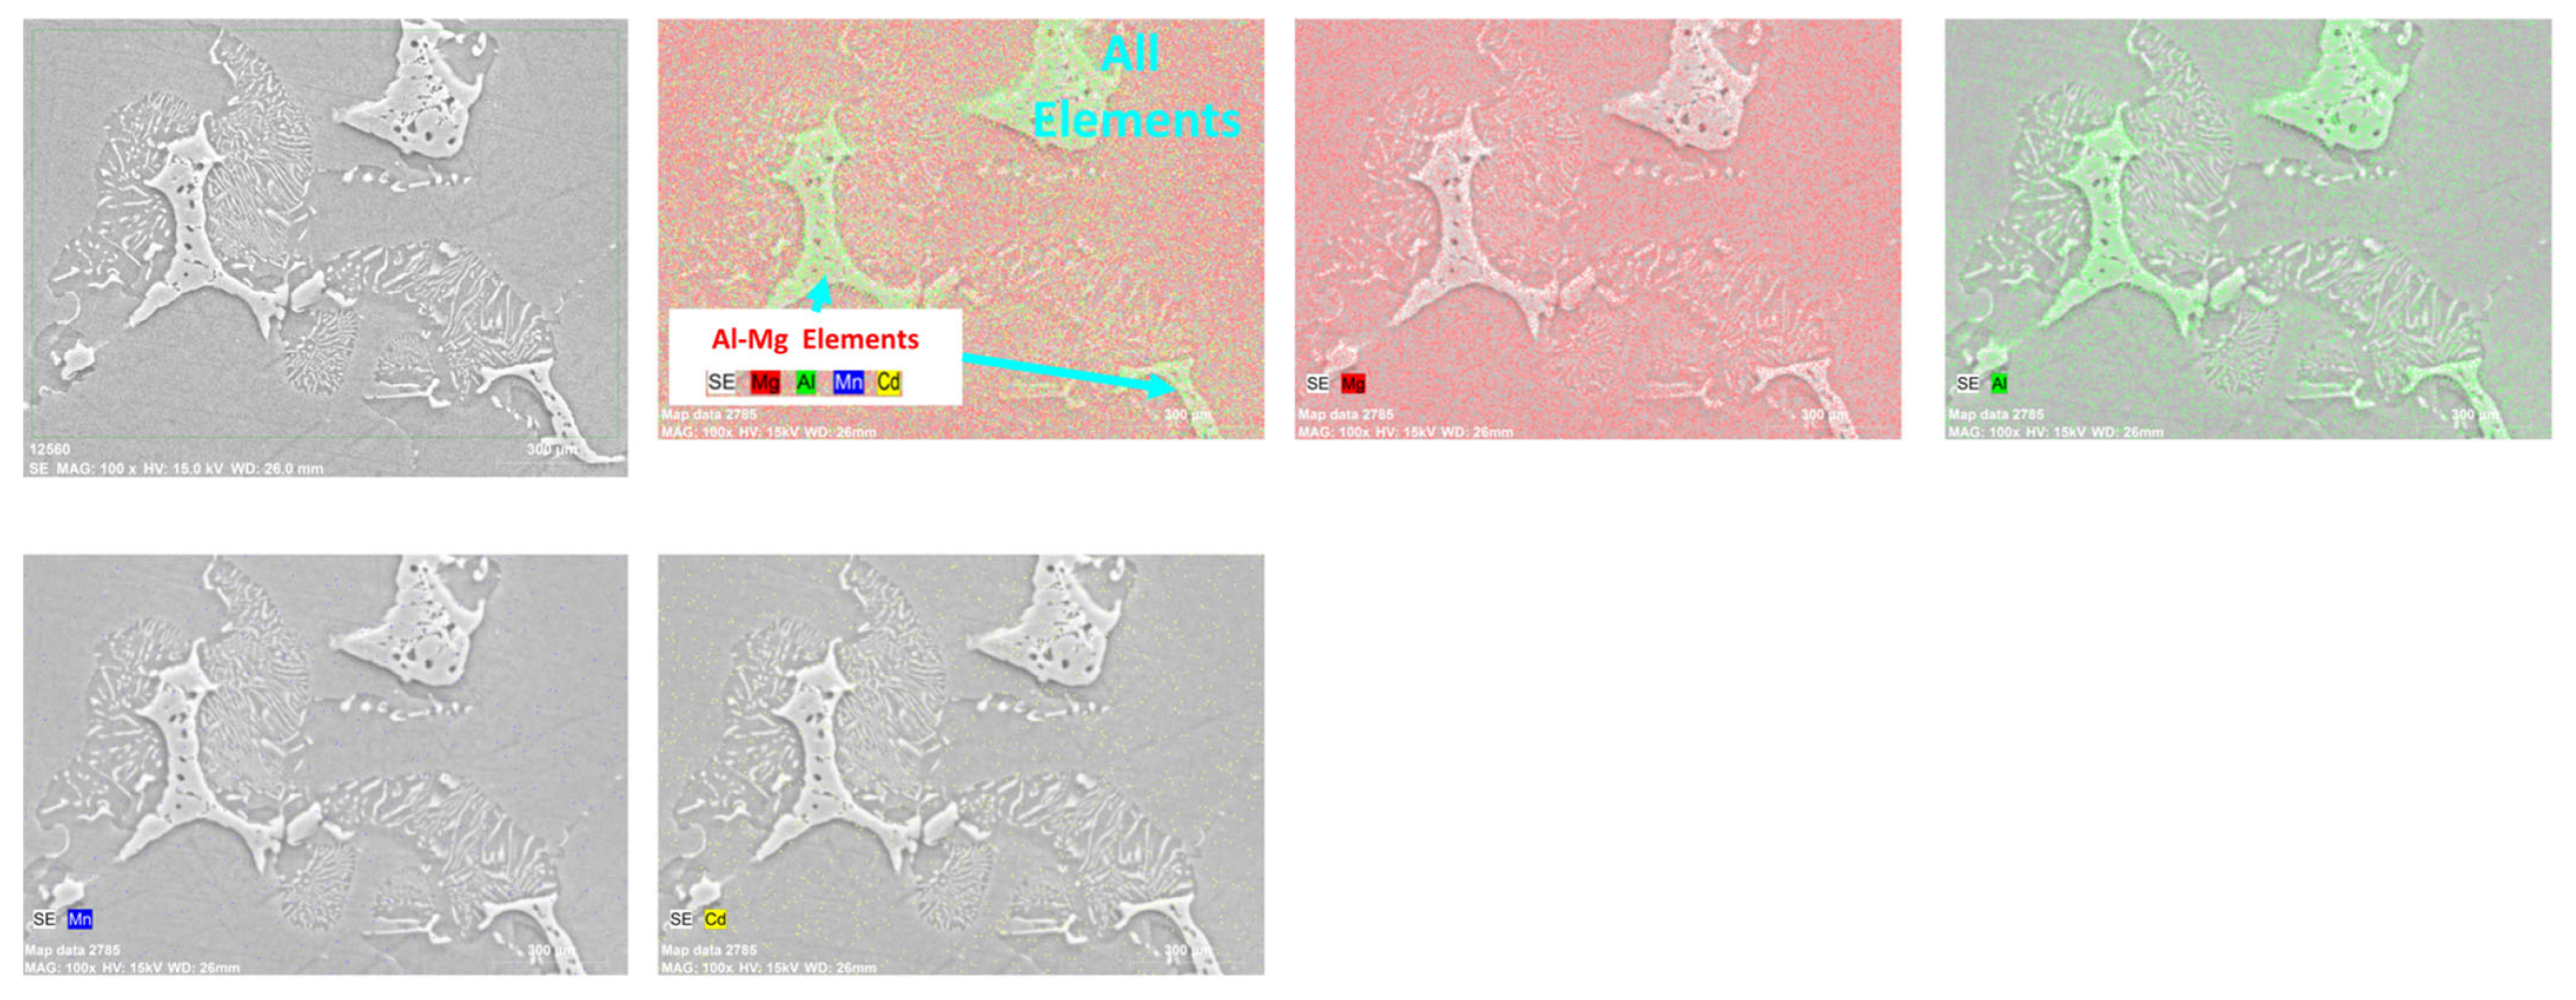
According to the Mapping results in Figure 4, Figure 5, Figure 6 and Figure 7, the main matrix consisted of Mg, while Al showed a regular distribution within the matrix and partially concentrated in the regions where the AlMg and Mg17Al12 intermetallic compounds detected in the XRD diffractograms were located [21,22]. Mn showed a distribution in the matrix, and the presence of the AlMn and Al8Mn5 phases in the XRD diffractograms was detected. Mn was also consumed in the formation of these intermetallic phases. In the SEM-MAP images, it is seen that Cd showed uniform distribution in the alloy matrix. The Cd was mostly dispersed and resolved within the matrix. This distribution is shown in the map images.
Figure 4.
SEM-Mapping results of Q1 alloy.
Figure 5.
SEM-Mapping results of Q2 alloy.
Figure 6.
SEM-Mapping results of Q3 alloy.
Figure 7.
SEM-Mapping results of Q4 alloy.
3.6. SEM-EDX Results
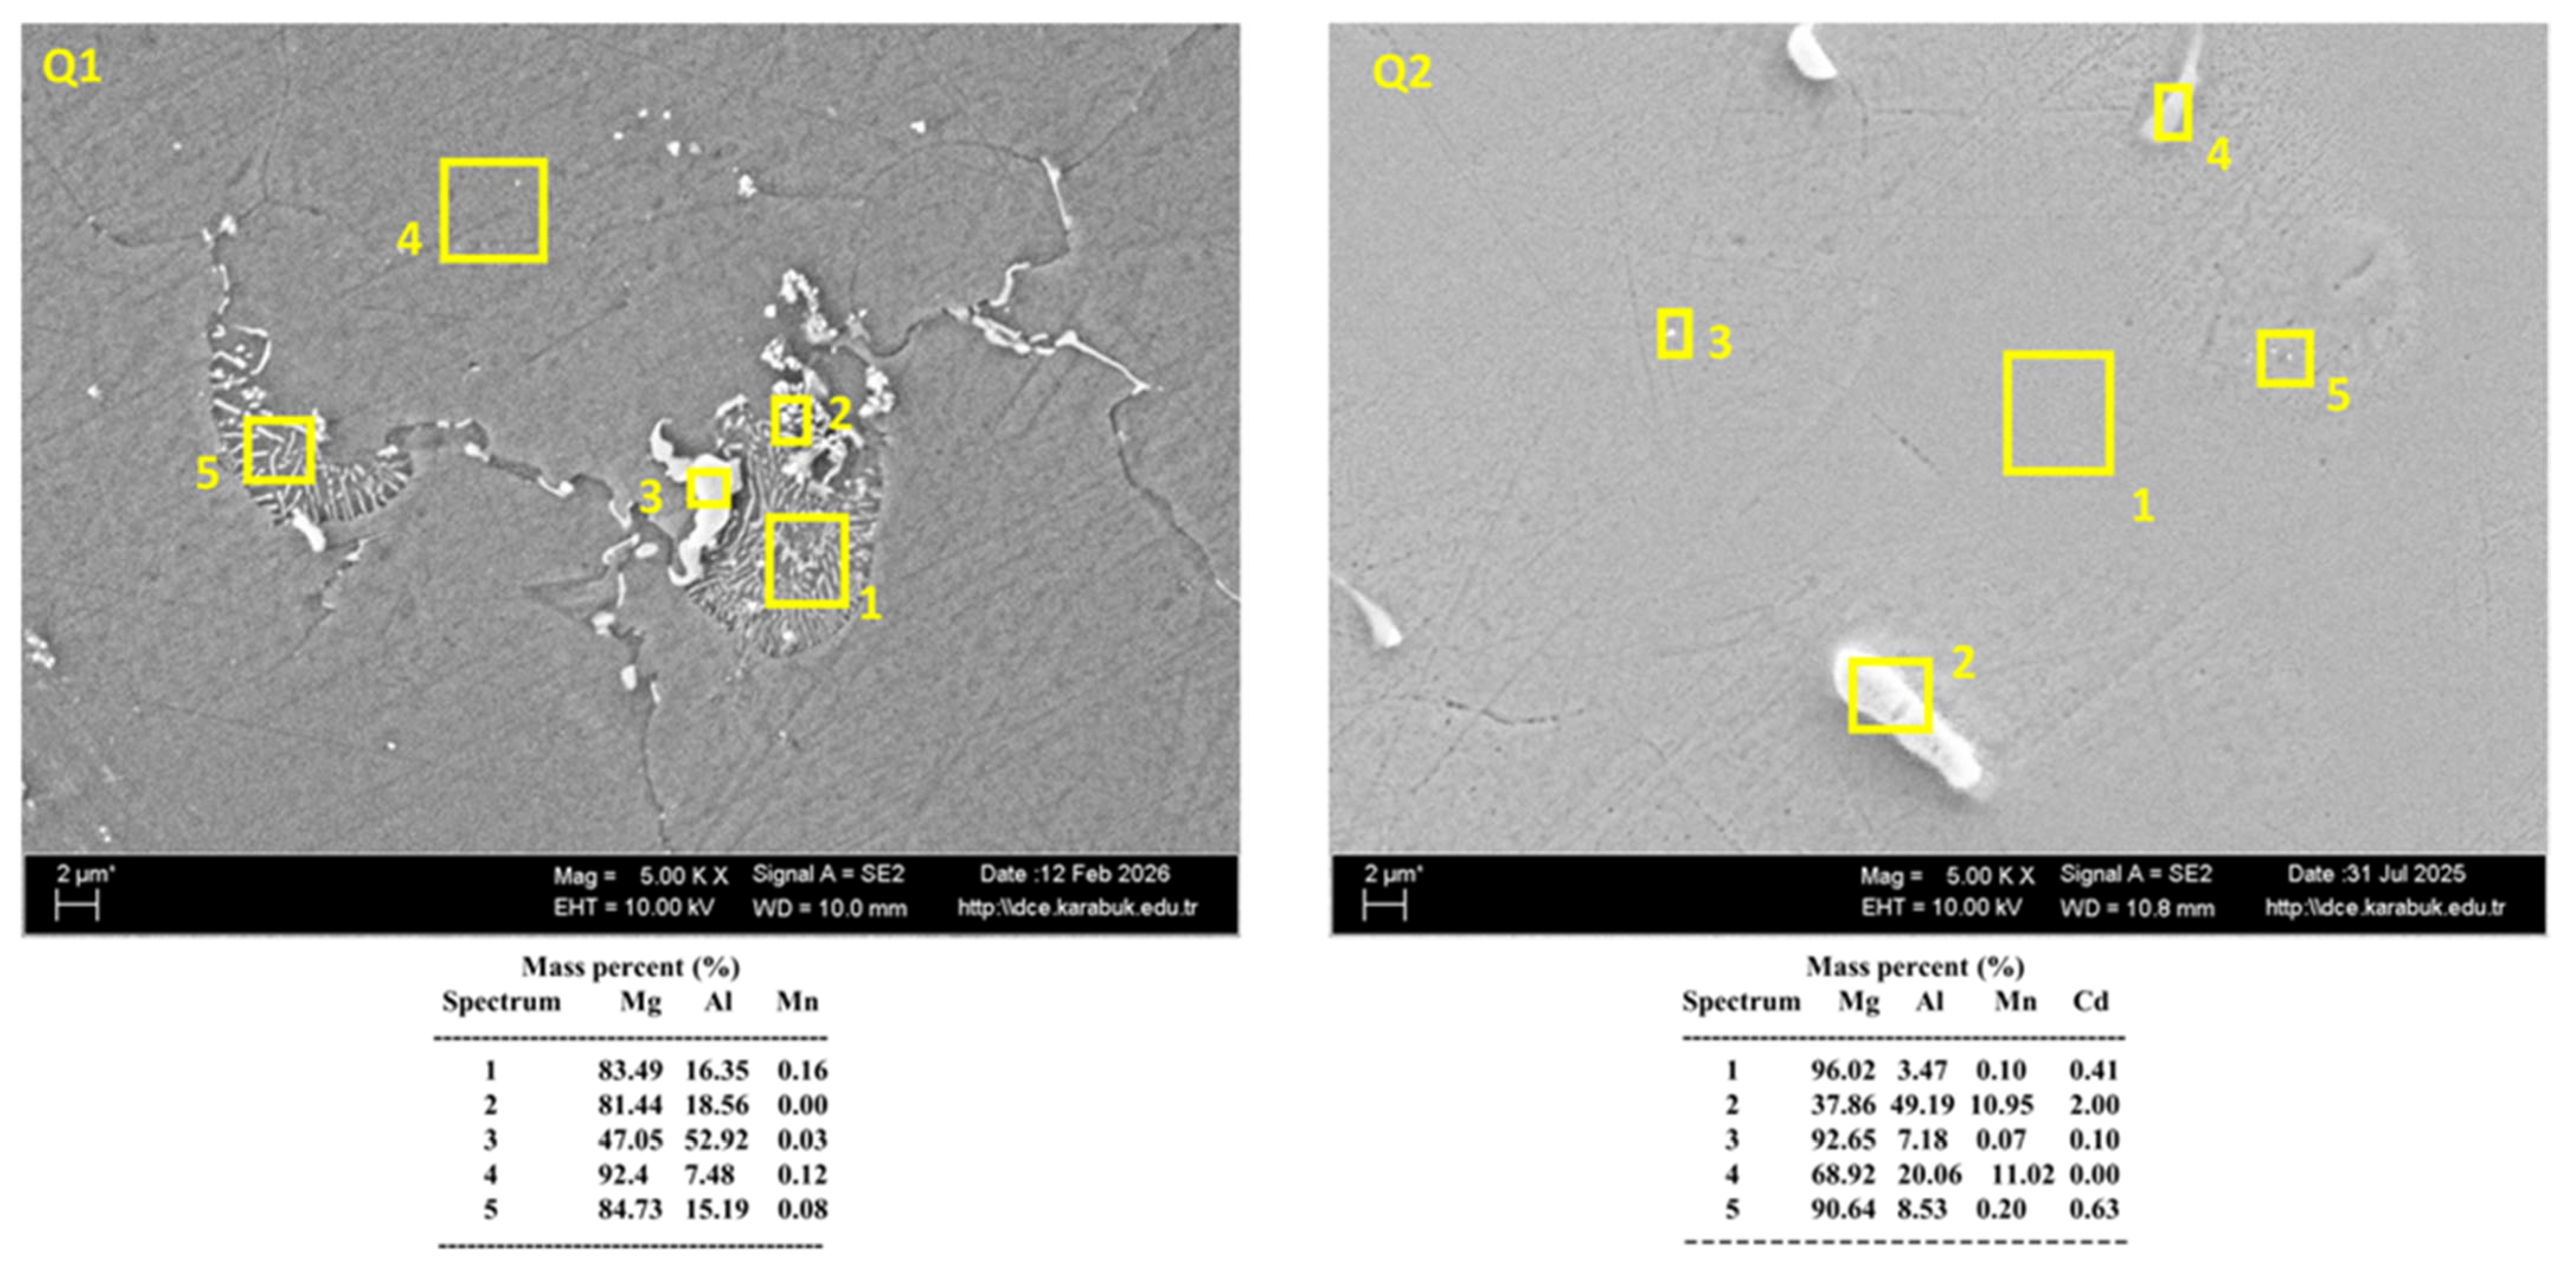
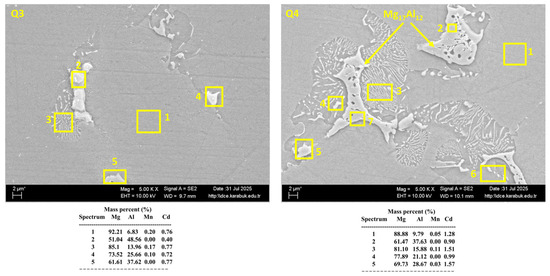
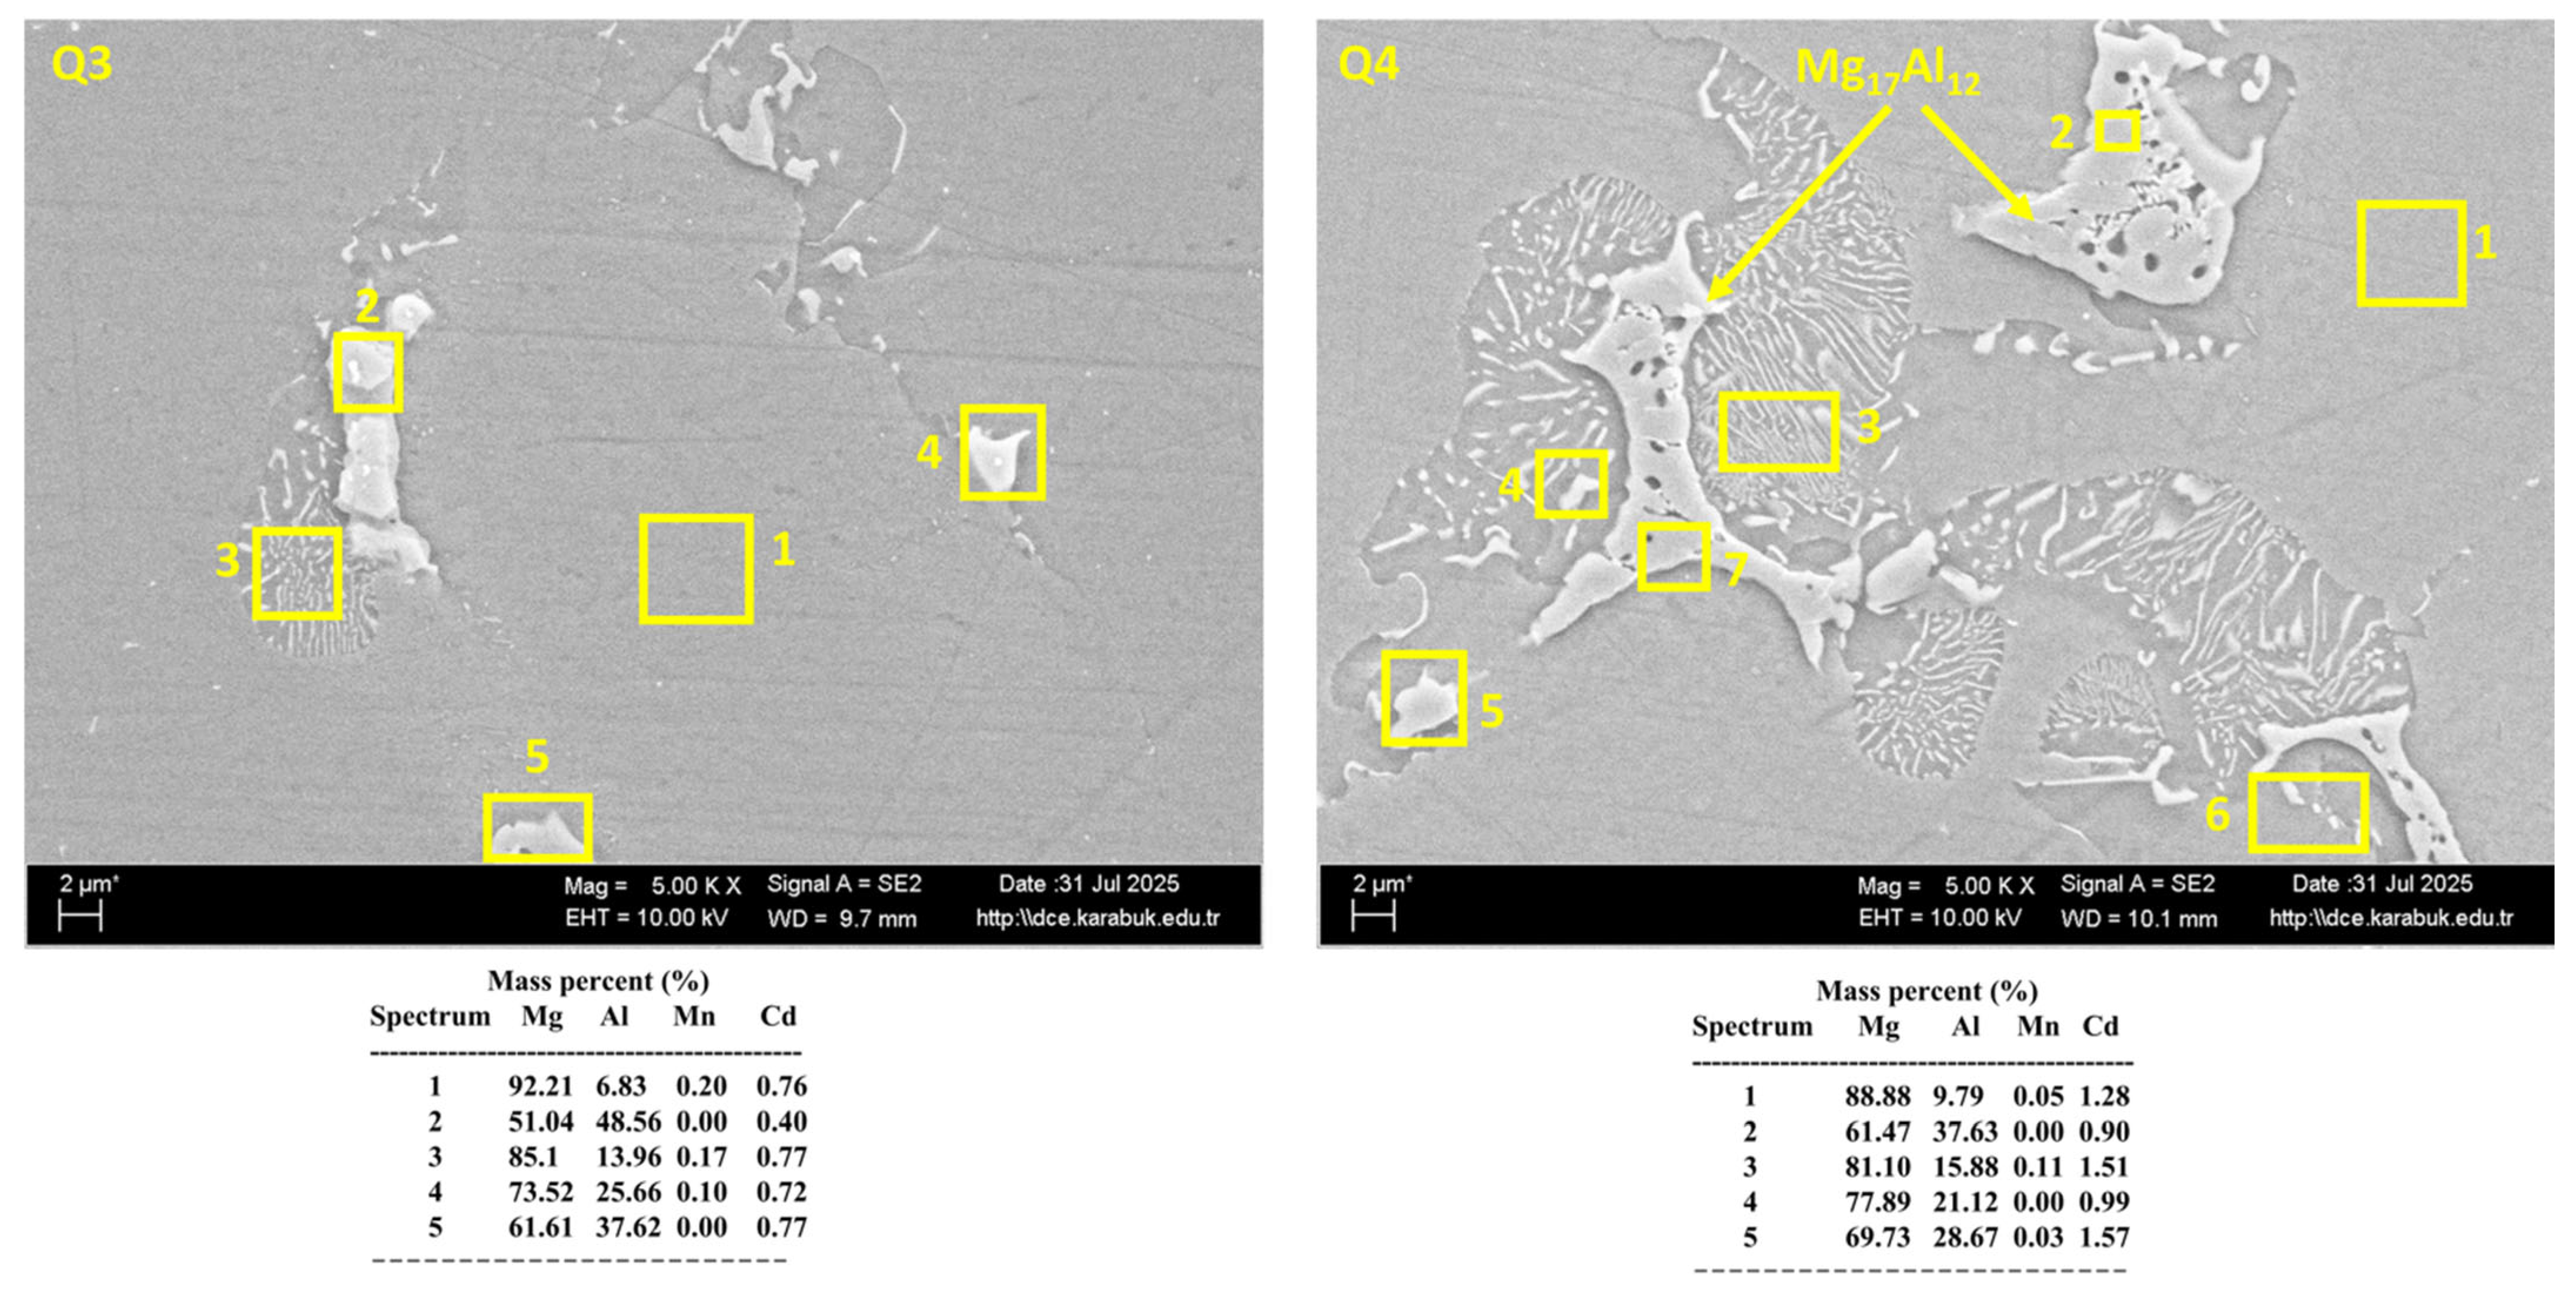
The SEM-EDX results in Figure 8 and Figure 9 show the composition of the 5 regions marked in yellow on each image. Although specific regions were examined, there were cases in which the elements in the alloy composition could form phases with each other. The intermetallic compounds formed by Mg and Al are clearly visible in these images.
Figure 8.
SEM-EDX images of alloys Q1 and Q2.
Figure 9.
SEM-EDX images of Q3 and Q4 alloys.
3.7. SEM-Line Results
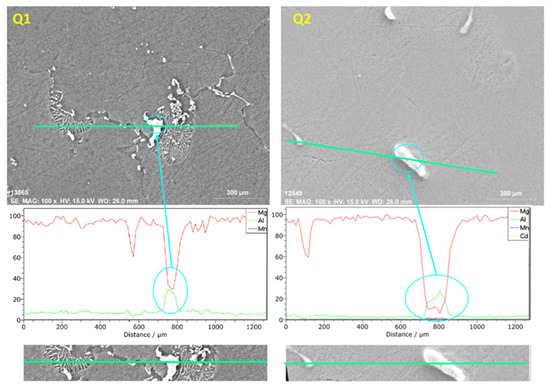
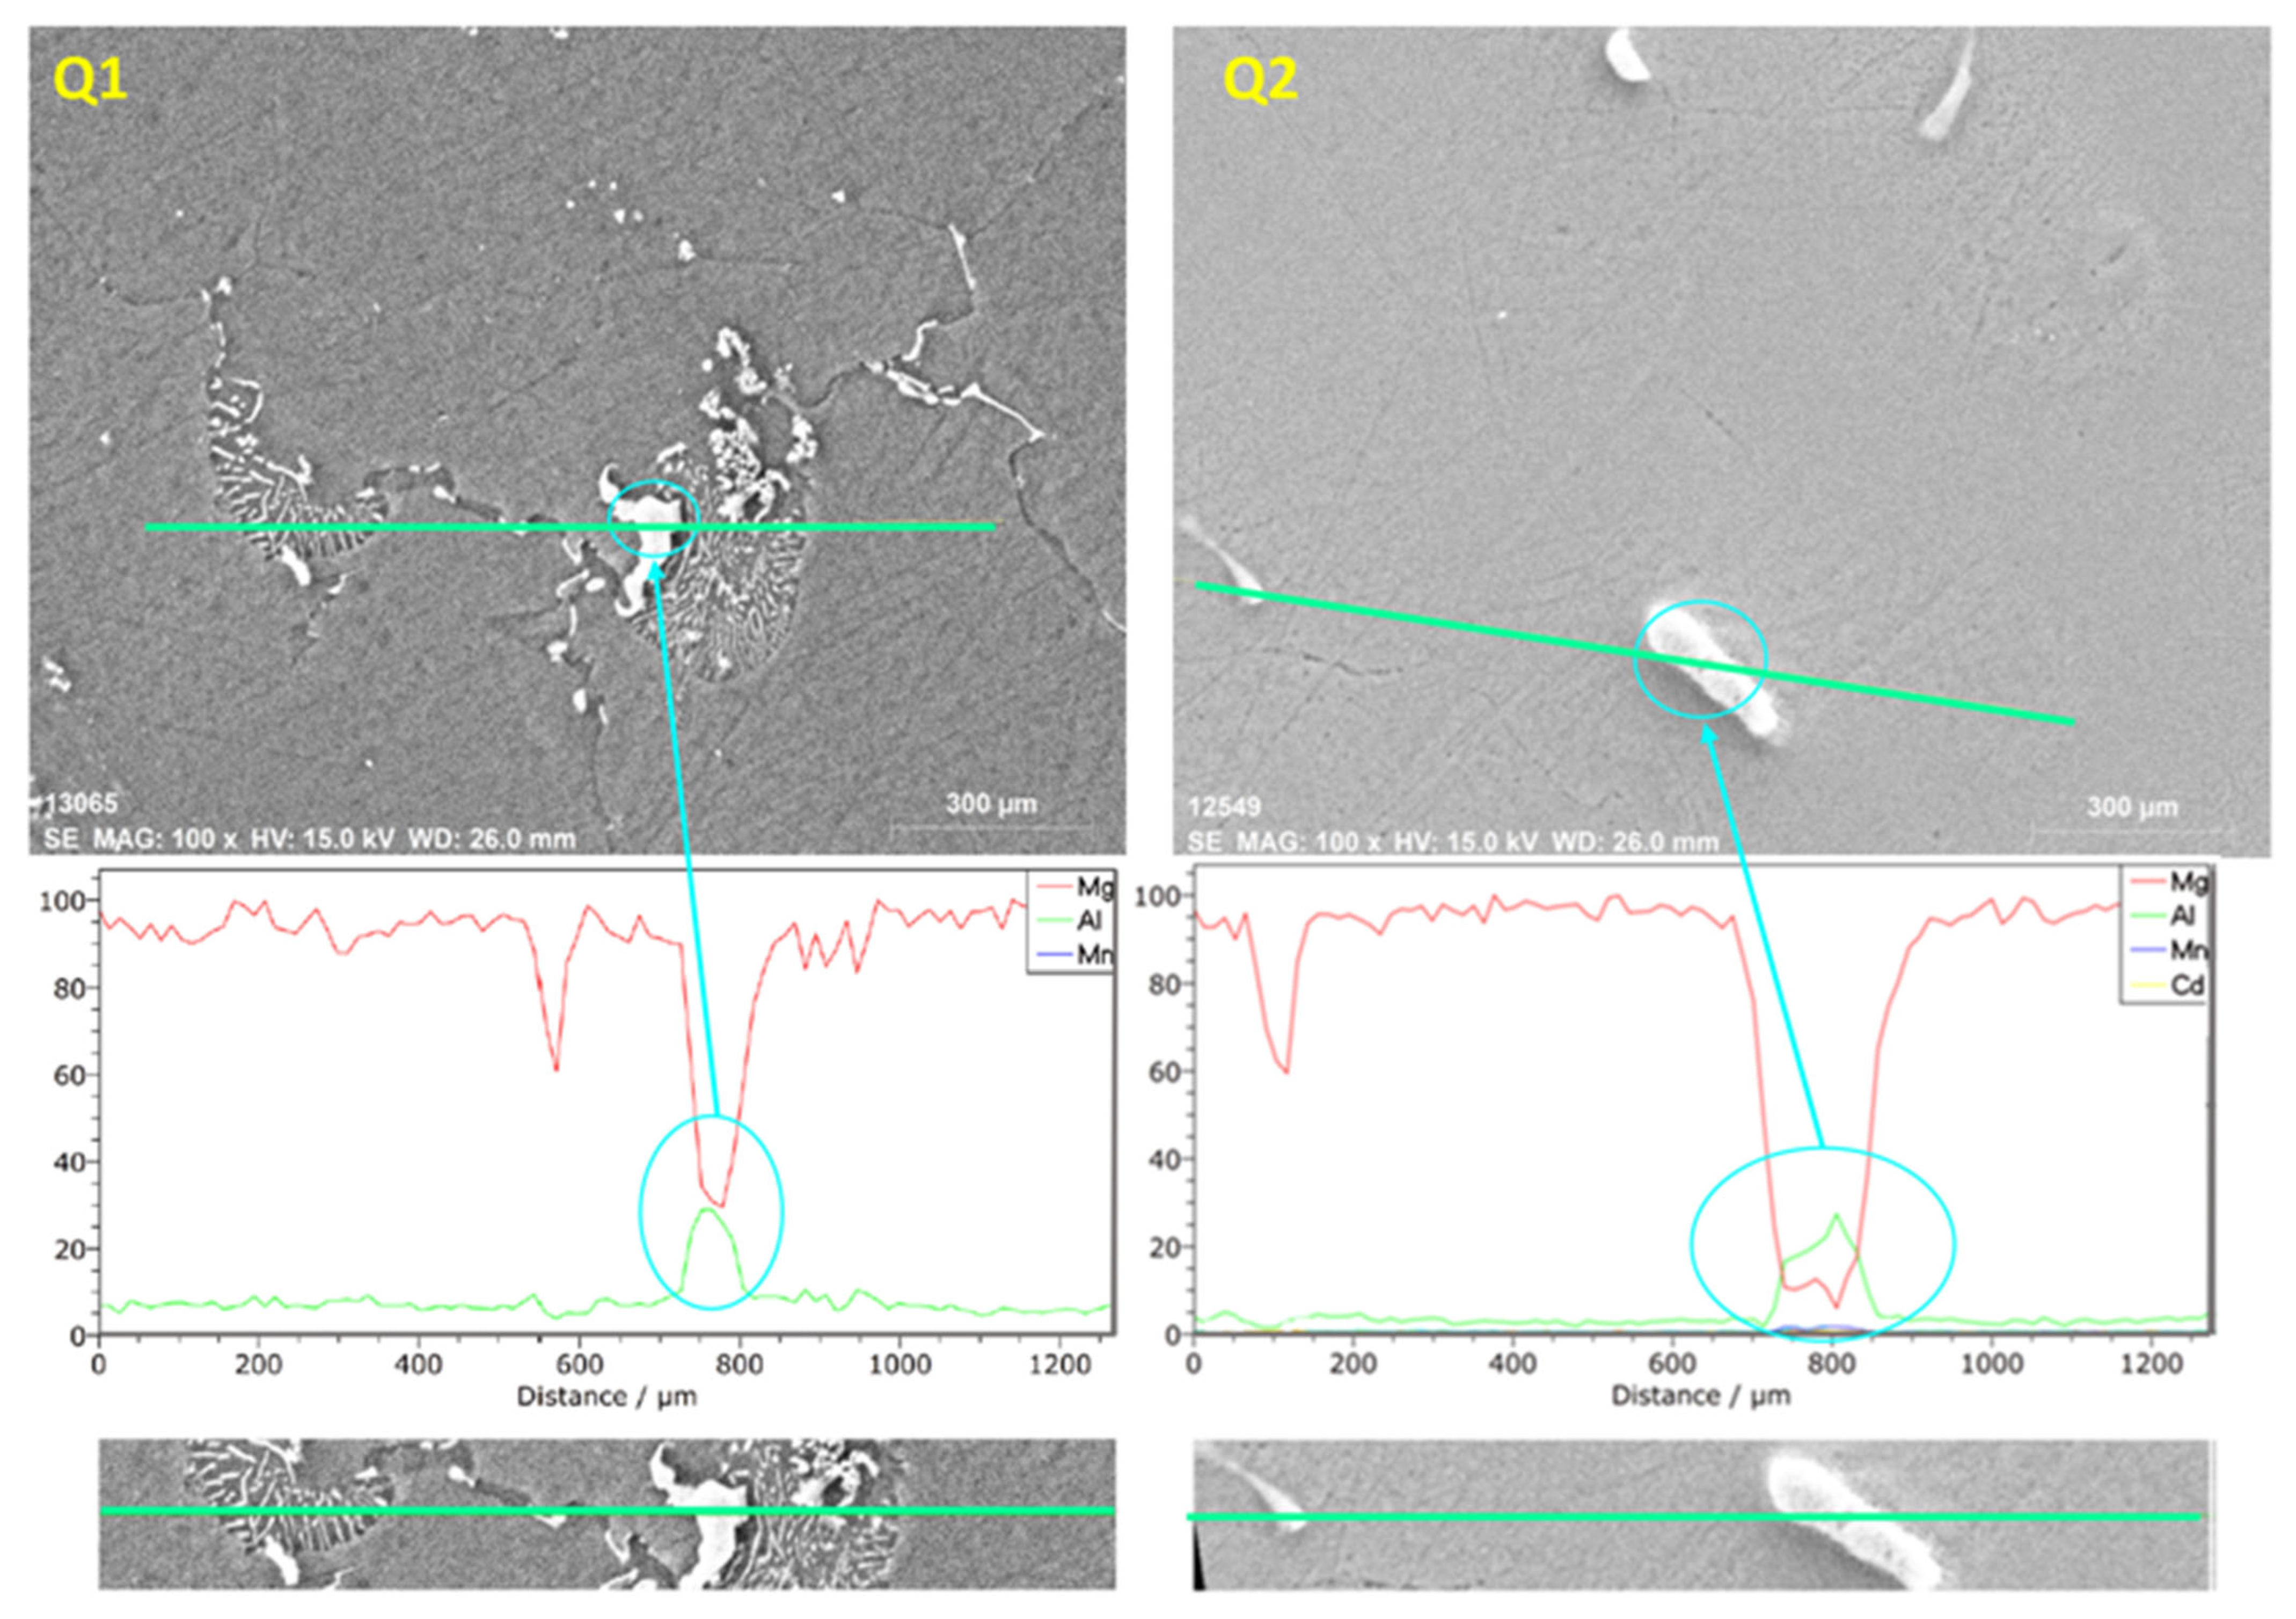
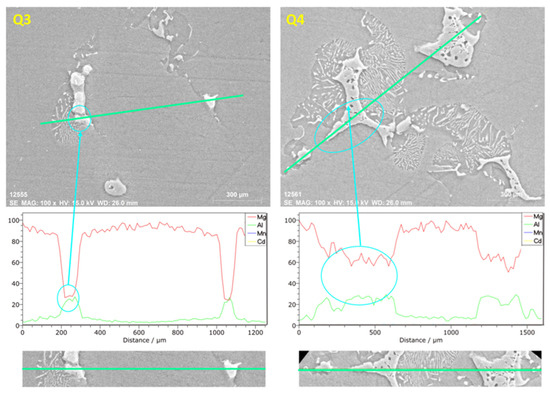
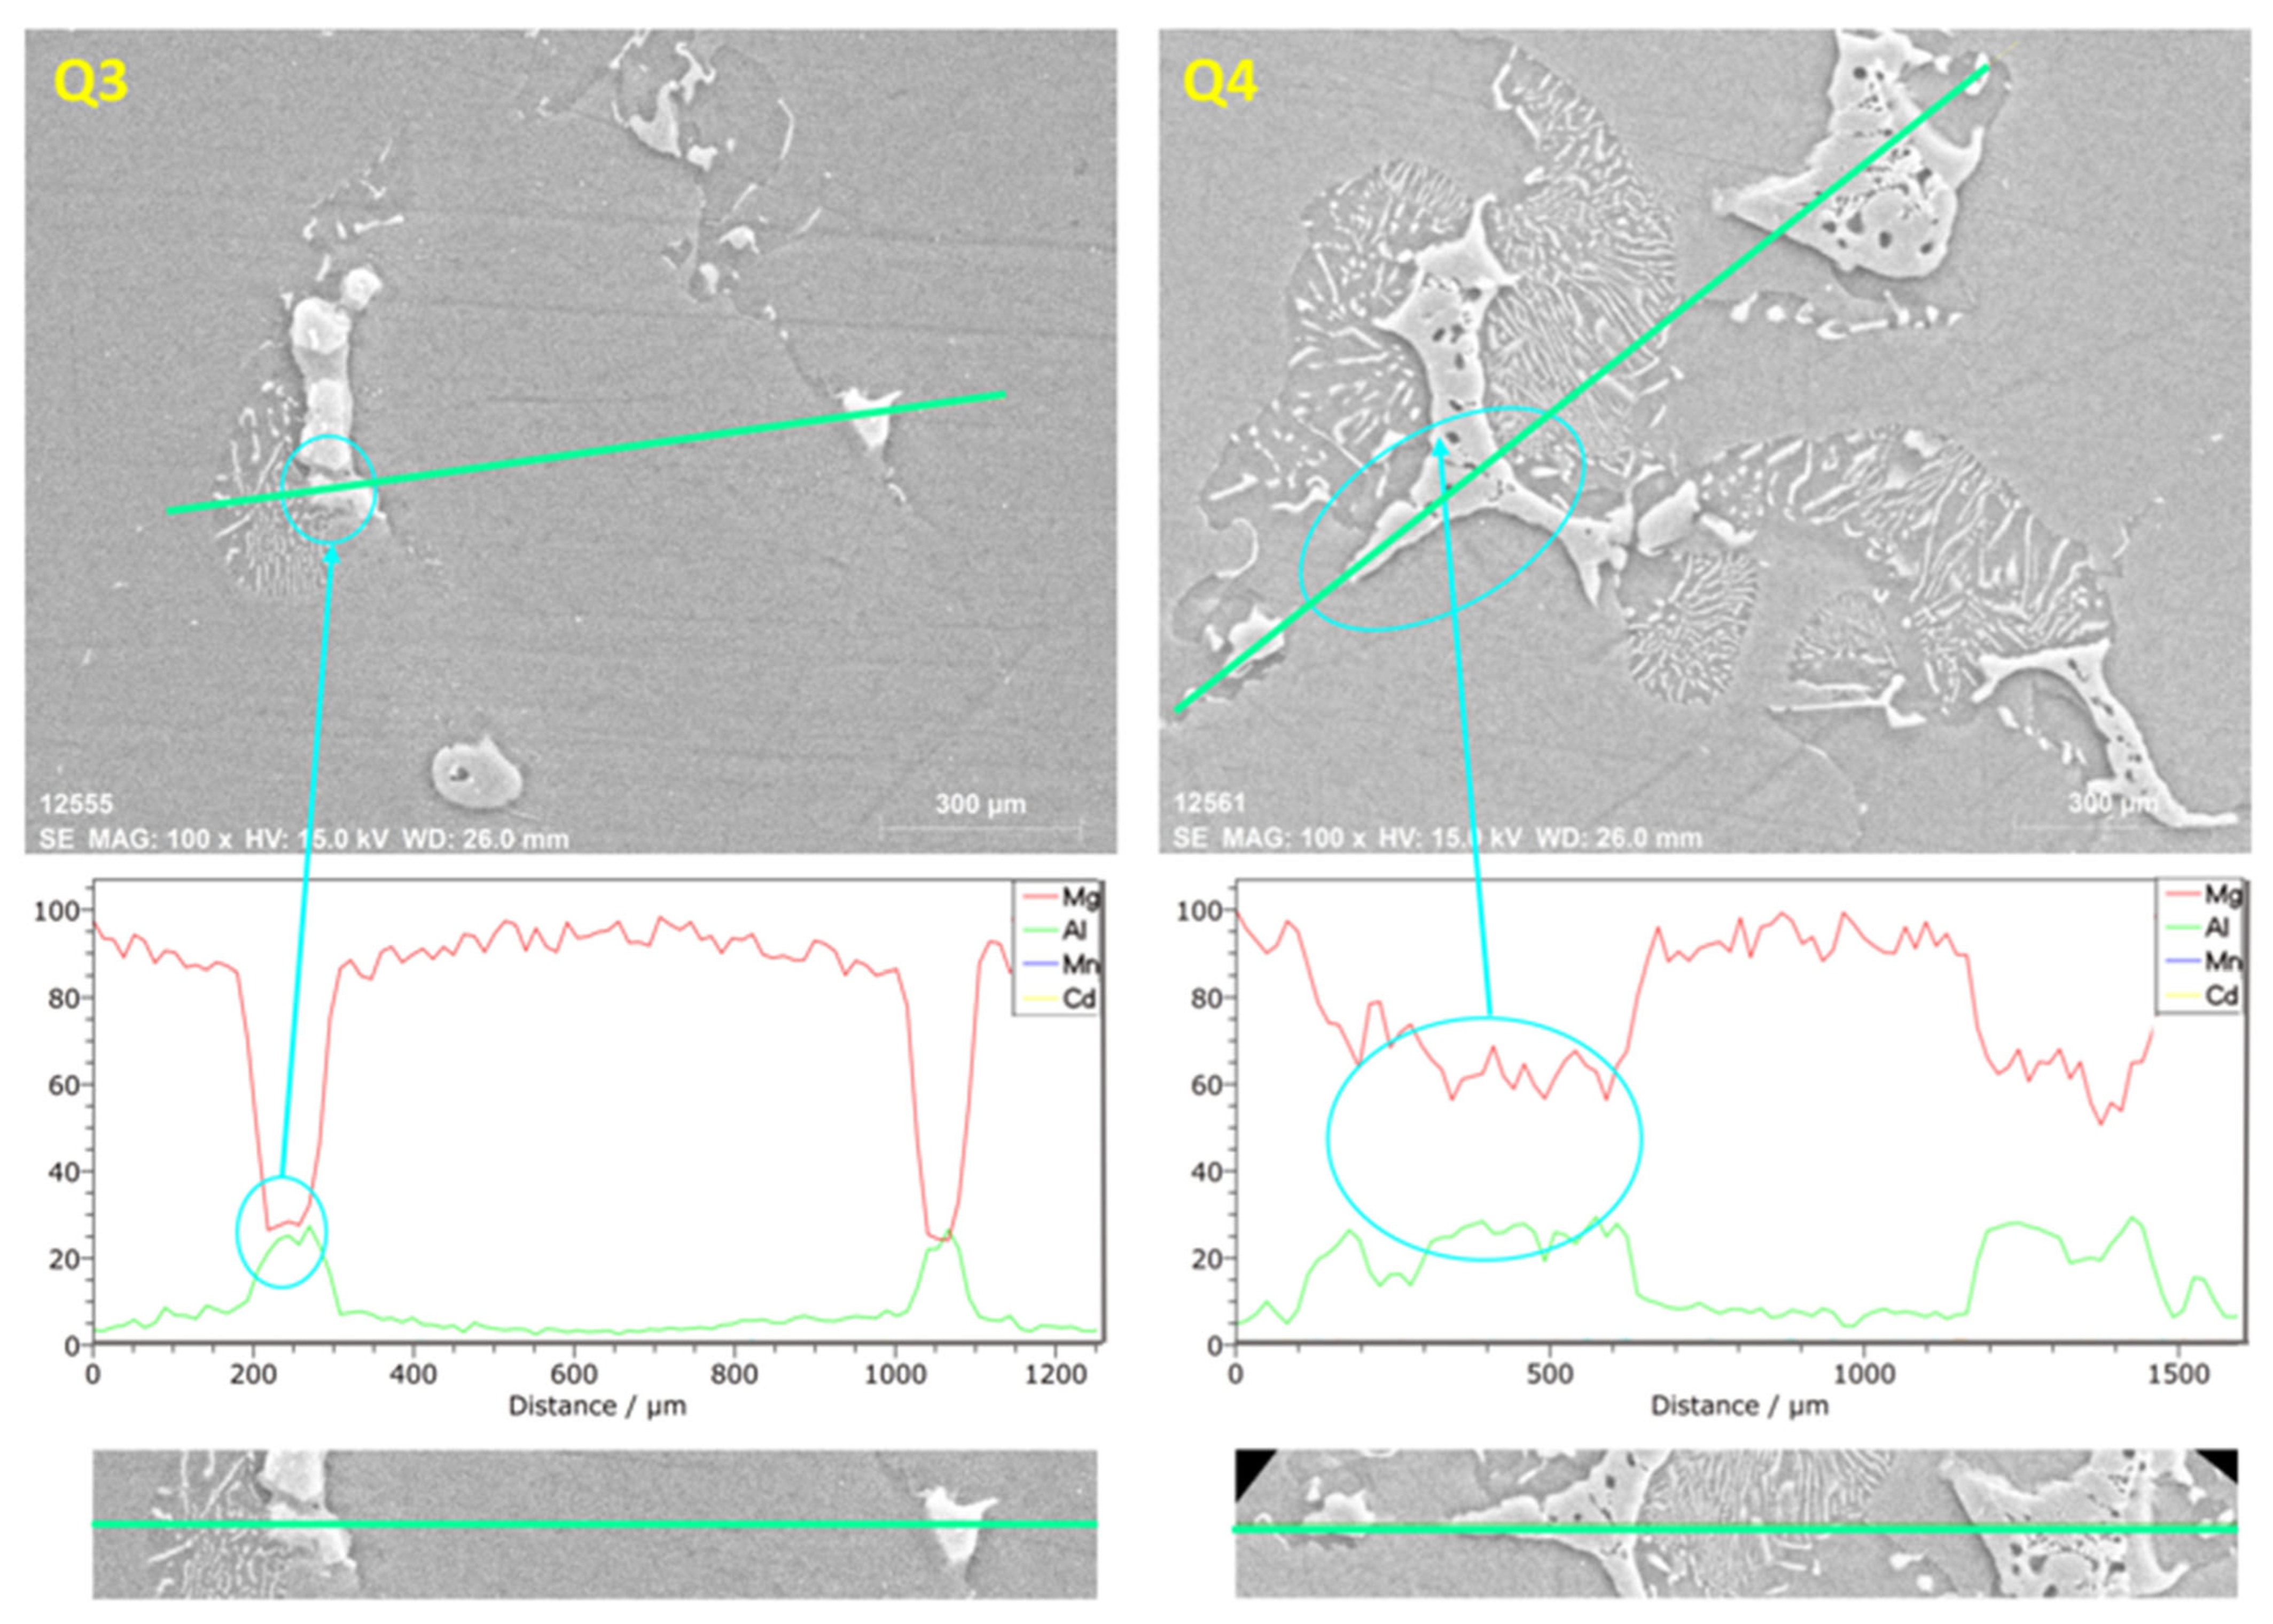
In the SEM Line map images in Figure 10 and Figure 11, the presence of Mg and Al at high ratios and the compounds they form can be seen. Another element, Mn, although in small amounts, shows presence because it is harder. Finally, since Cd shows a regular distribution in the matrix, it shows presence in small amounts in the peaks. Elements with low percentage values do not appear on the cut line, but they show fine distribution in the Map images.
Figure 10.
SEM line map images of alloys Q1 and Q2.
Figure 11.
SEM line map images of Q3 and Q4 alloys.
3.8. Potentiodynamic Polarization Corrosion Results
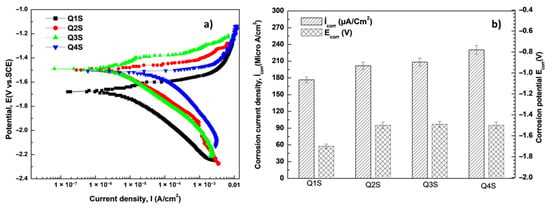
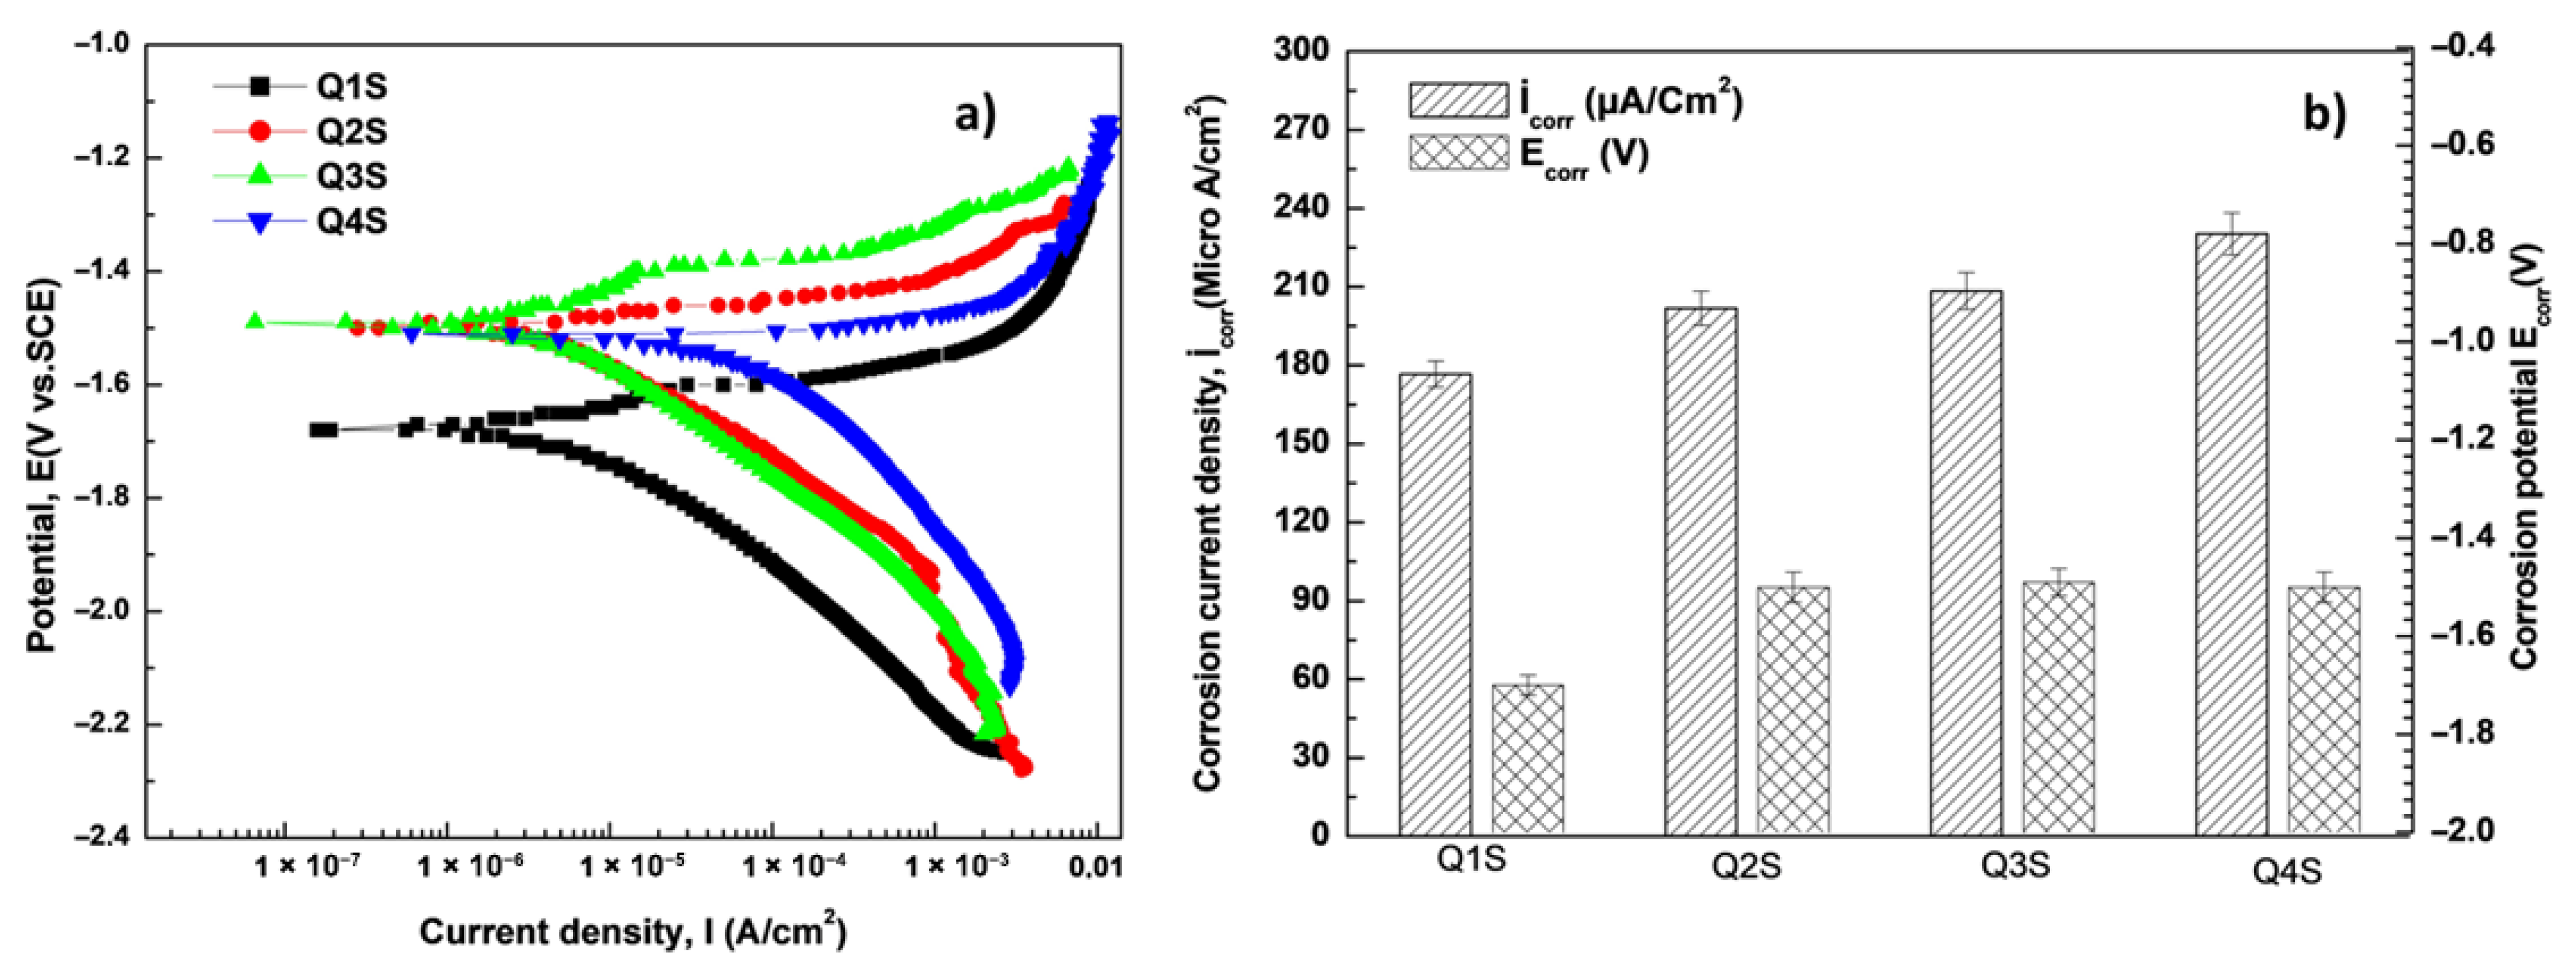
As a result of the potentiodynamic polarization corrosion experiments, Tafel curves were obtained. Then, these curves were analyzed to obtain potential values and corrosion current density results. As seen in Figure 12, the corrosion potentials of the alloys examined in the corrosion results were negative [23]. The potentials of samples Q2, Q3, and Q4 containing Cd were less negative than the potential of sample Q1 without Cd. However, according to the potentiodynamic polarization corrosion test values shown in Table 2, the corrosion rate increased as the Cd content of the alloys increased [24].
Figure 12.
Tafel curves (a) and Icorr and Ecorr (b) results of alloys in NaCl environment.
Table 2.
Potentiodynamic polarization corrosion test values of alloys.
3.9. Hardness (HV) Results
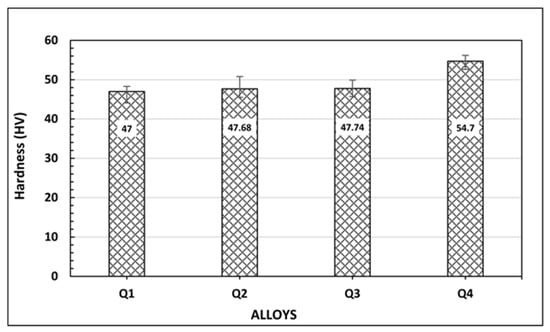
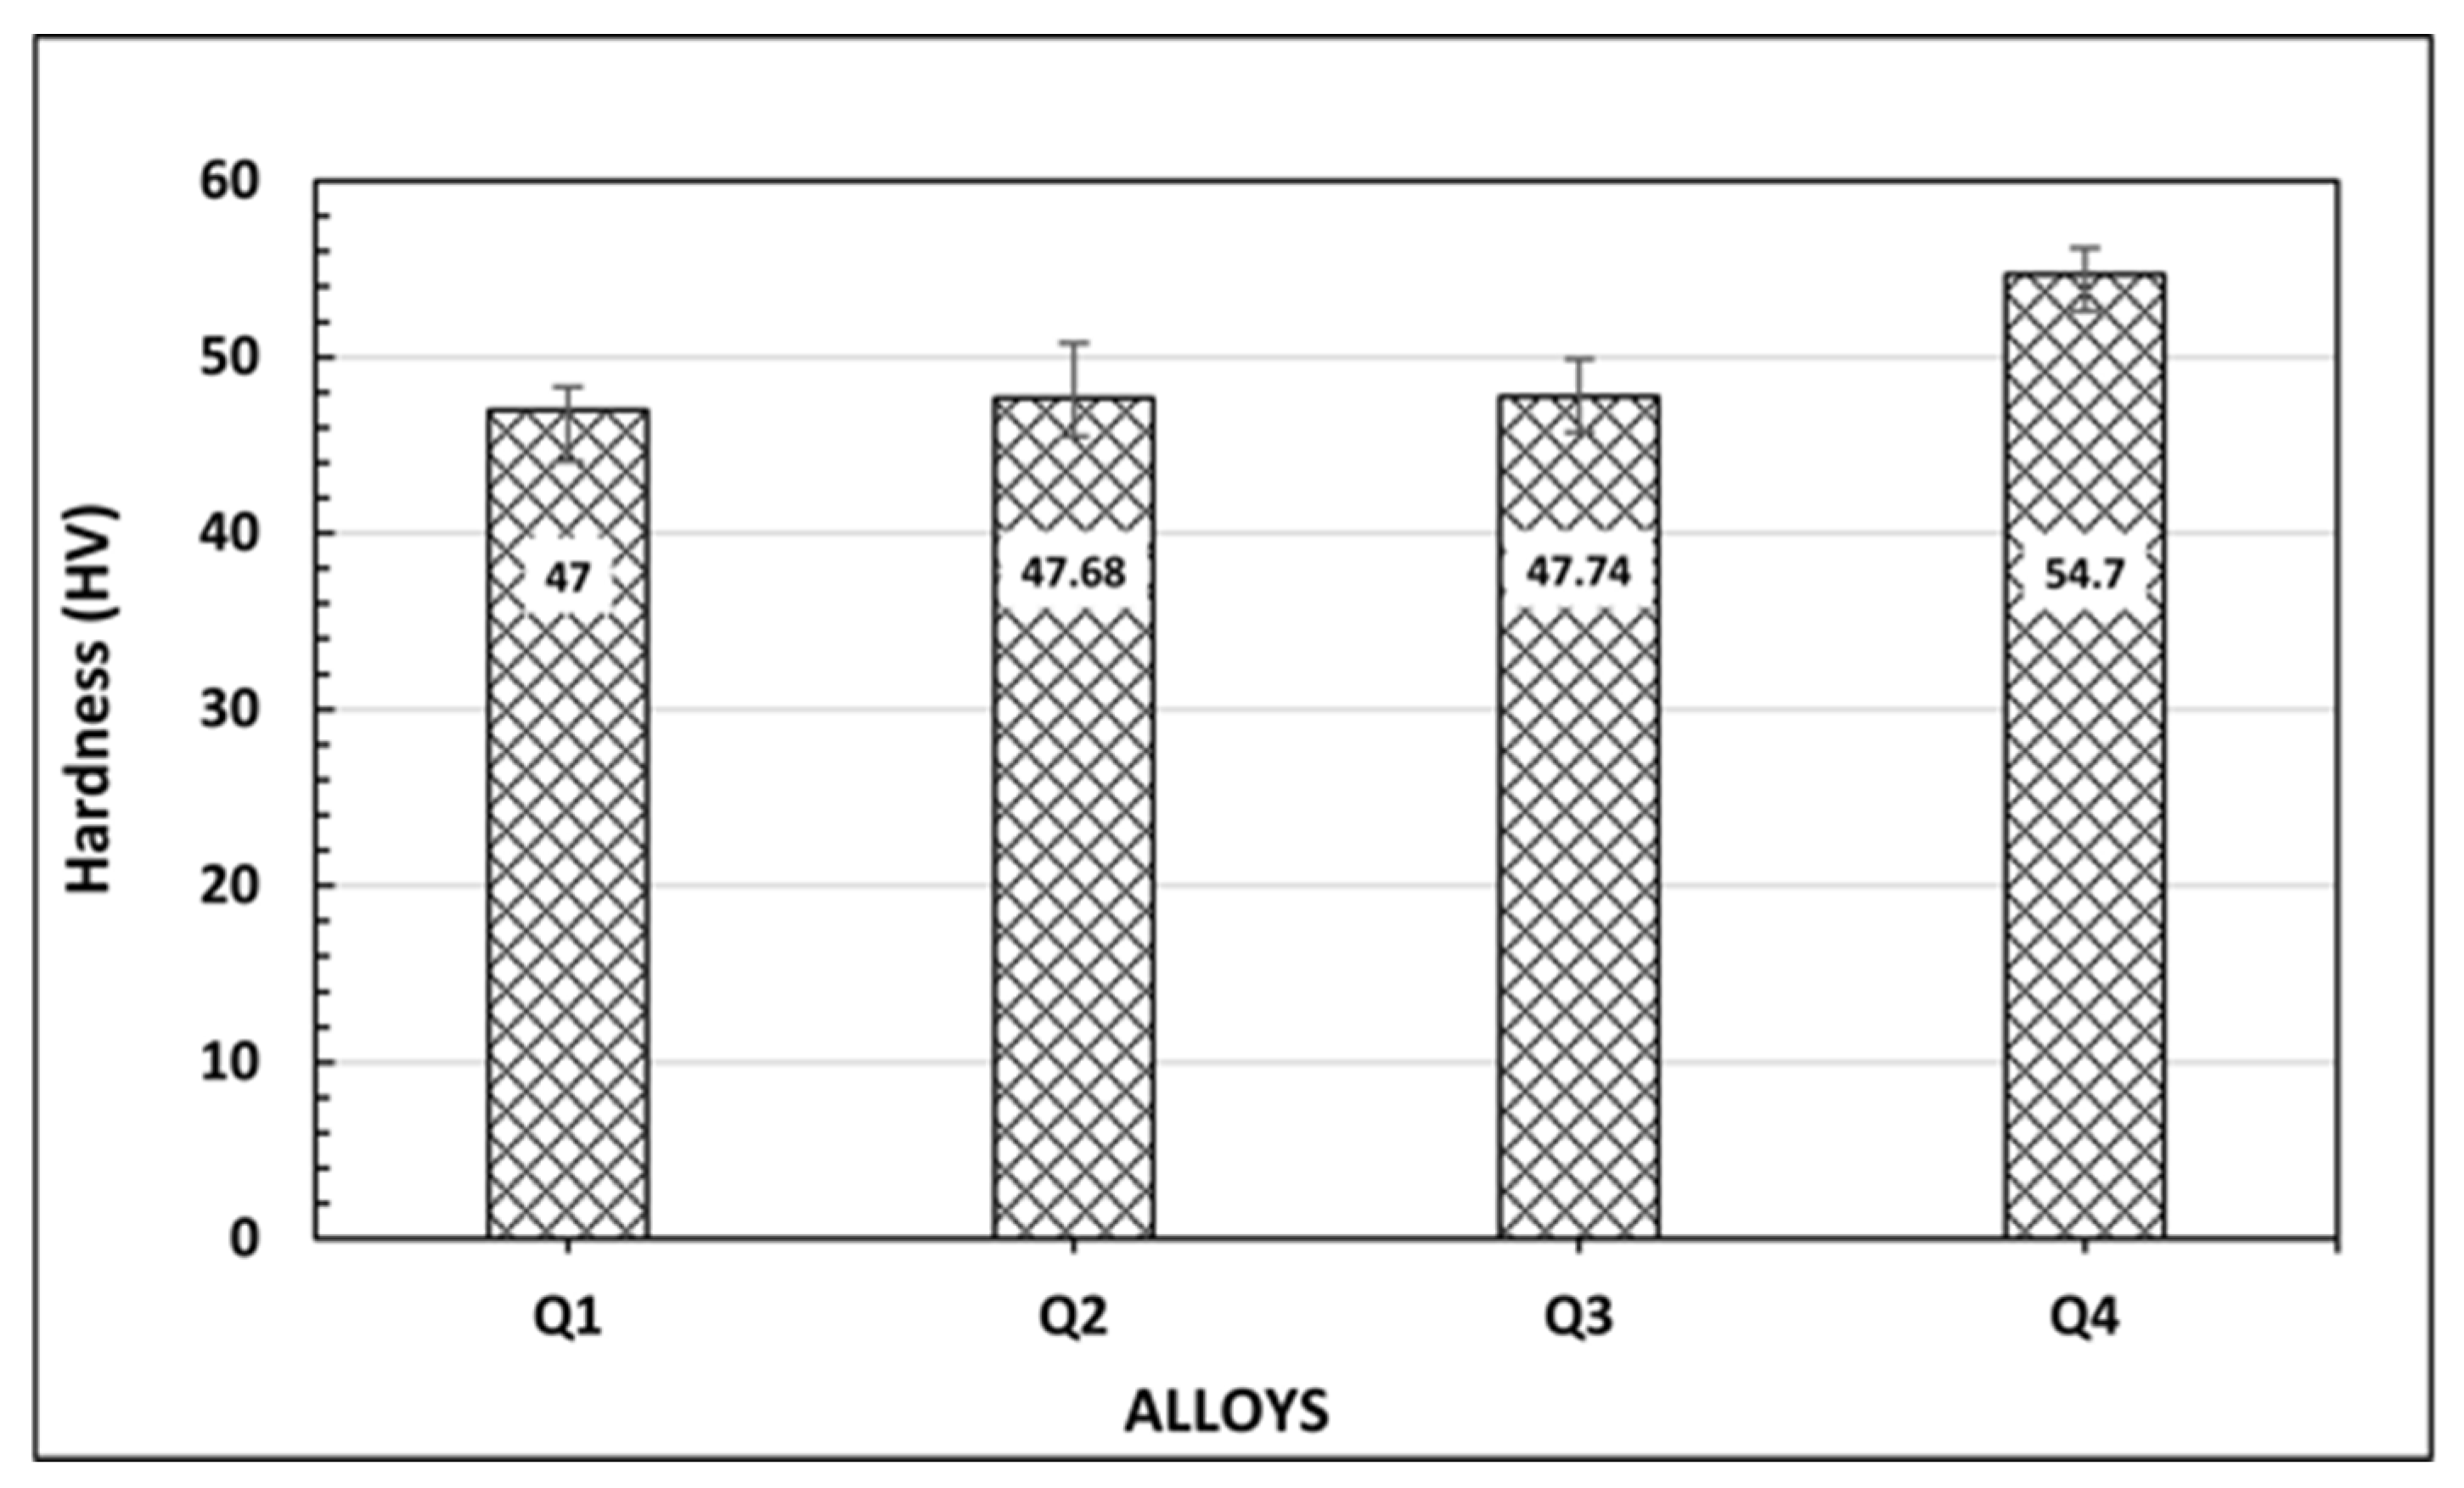
The hardness values of the alloys are presented in Figure 13, and the addition of 1% Cd increased the hardness by approximately 16%. The differences in hardness values between alloys Q1, Q2, and Q3 were less than 2%. Therefore, when examining the difference in hardness, the statistical reflection on the average values of hardness measurements taken from 5 different points is important. Thus, considering the negative (−) and positive (+) values reflected on the error bars, it is seen that the positive error data of sample Q2 was the highest, and this situation could affect the corrosive wear results.
Figure 13.
Hardness (HV) values of alloys.
3.10. Corrosive Wear Results
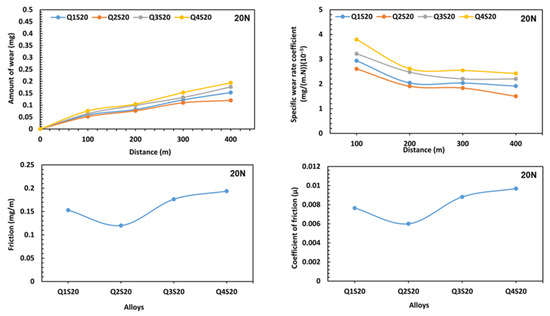
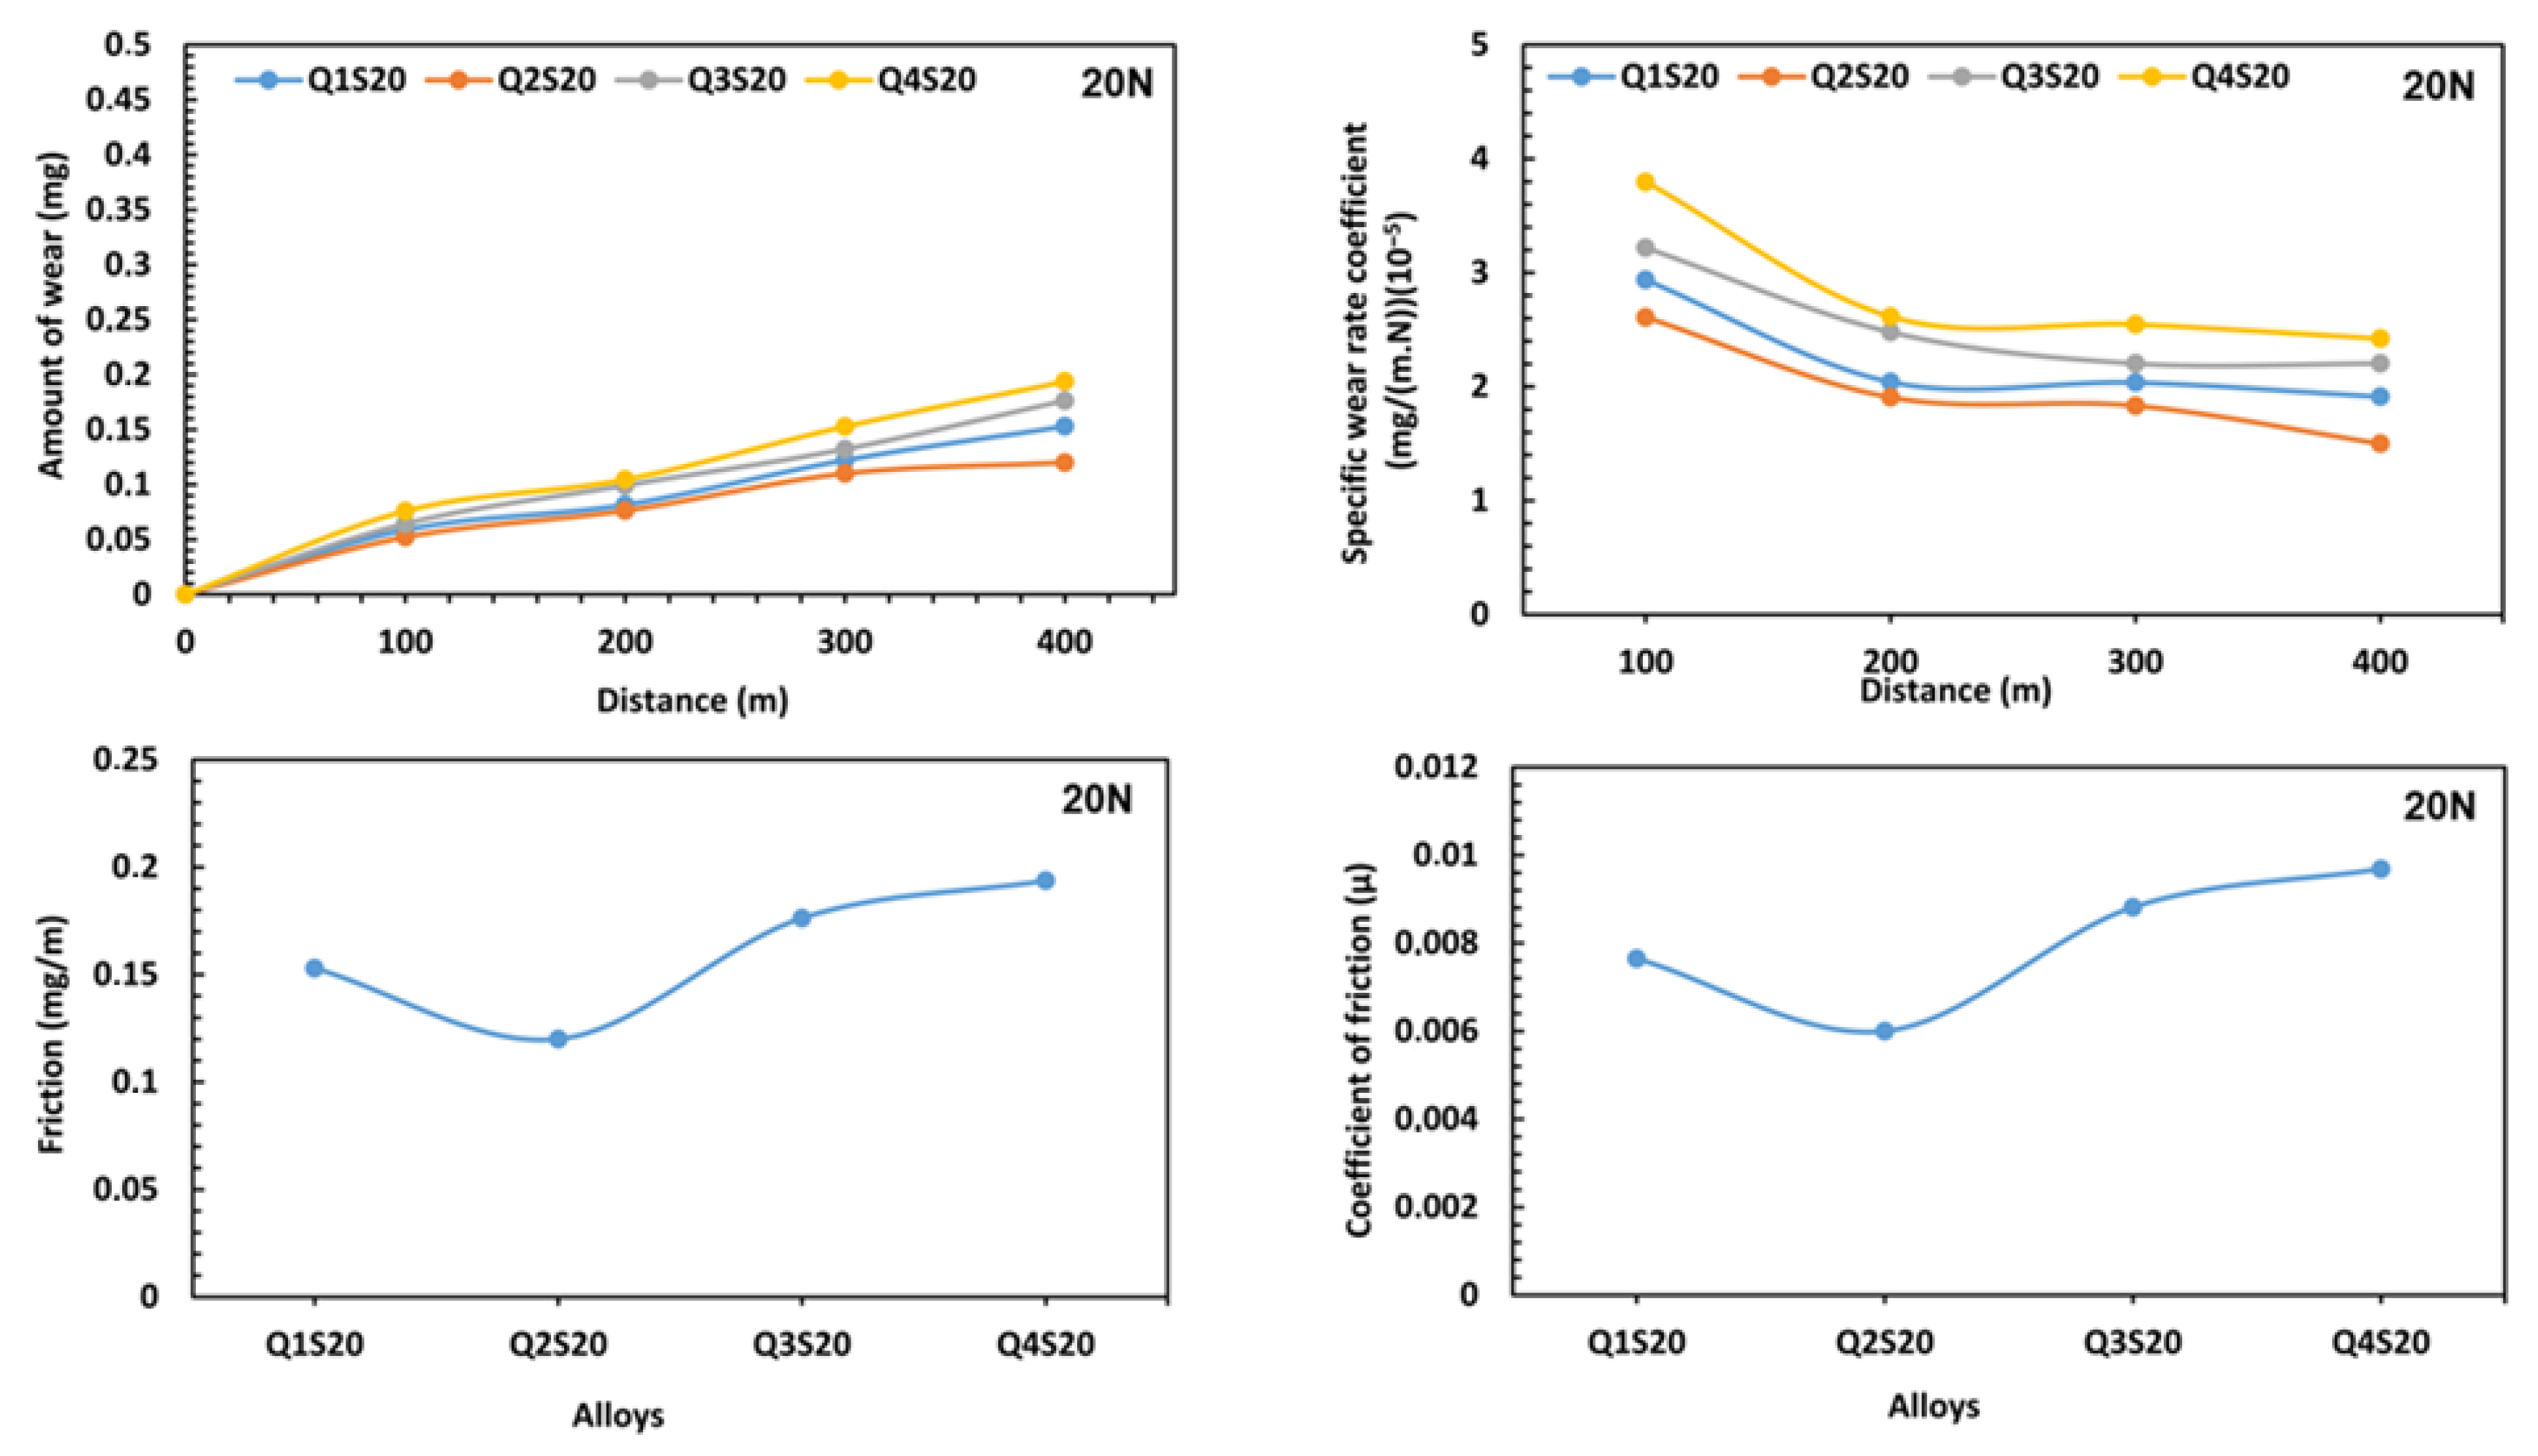
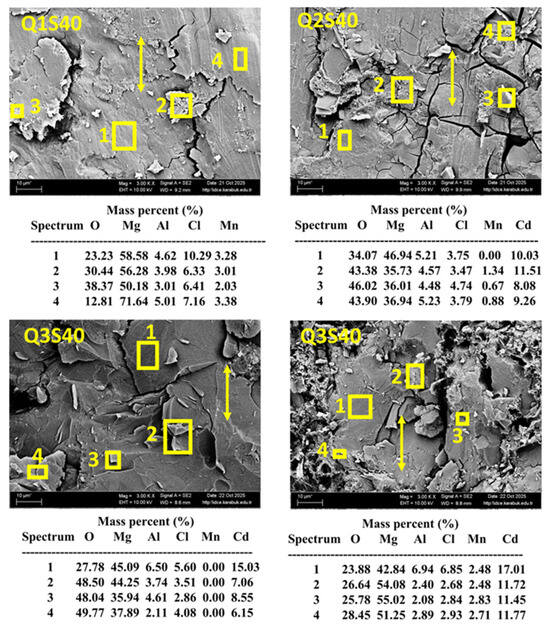
As seen in Figure 14, under a load of 20 N, at a distance of 400 m, and in a 3.5% NaCl environment, the Q2 alloy showed the least wear. With the addition of Cd, the wear amounts increased. Under 40 N load, the Q4 alloy exhibited approximately 25% more wear. In the corrosive environment, the surface in contact with the salt solution showed a galvanic effect, exhibited more wear, and experienced fragmentation. The oxide level increased up to 50%.
Figure 14.
Corrosive wear results of the alloy in NaCl environment under a 20 Newton load.
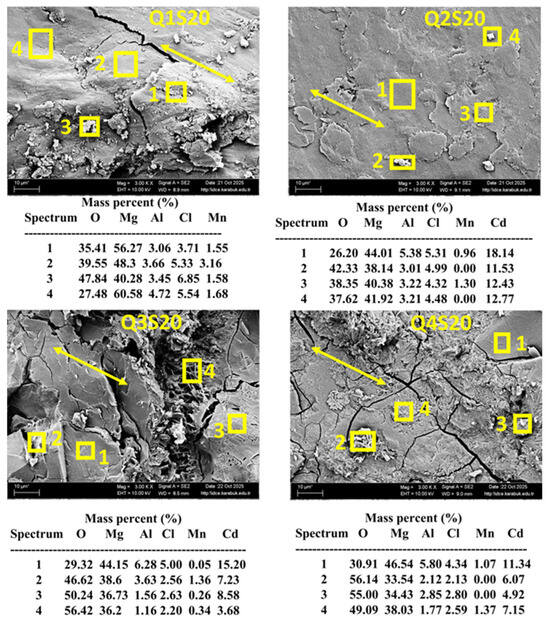
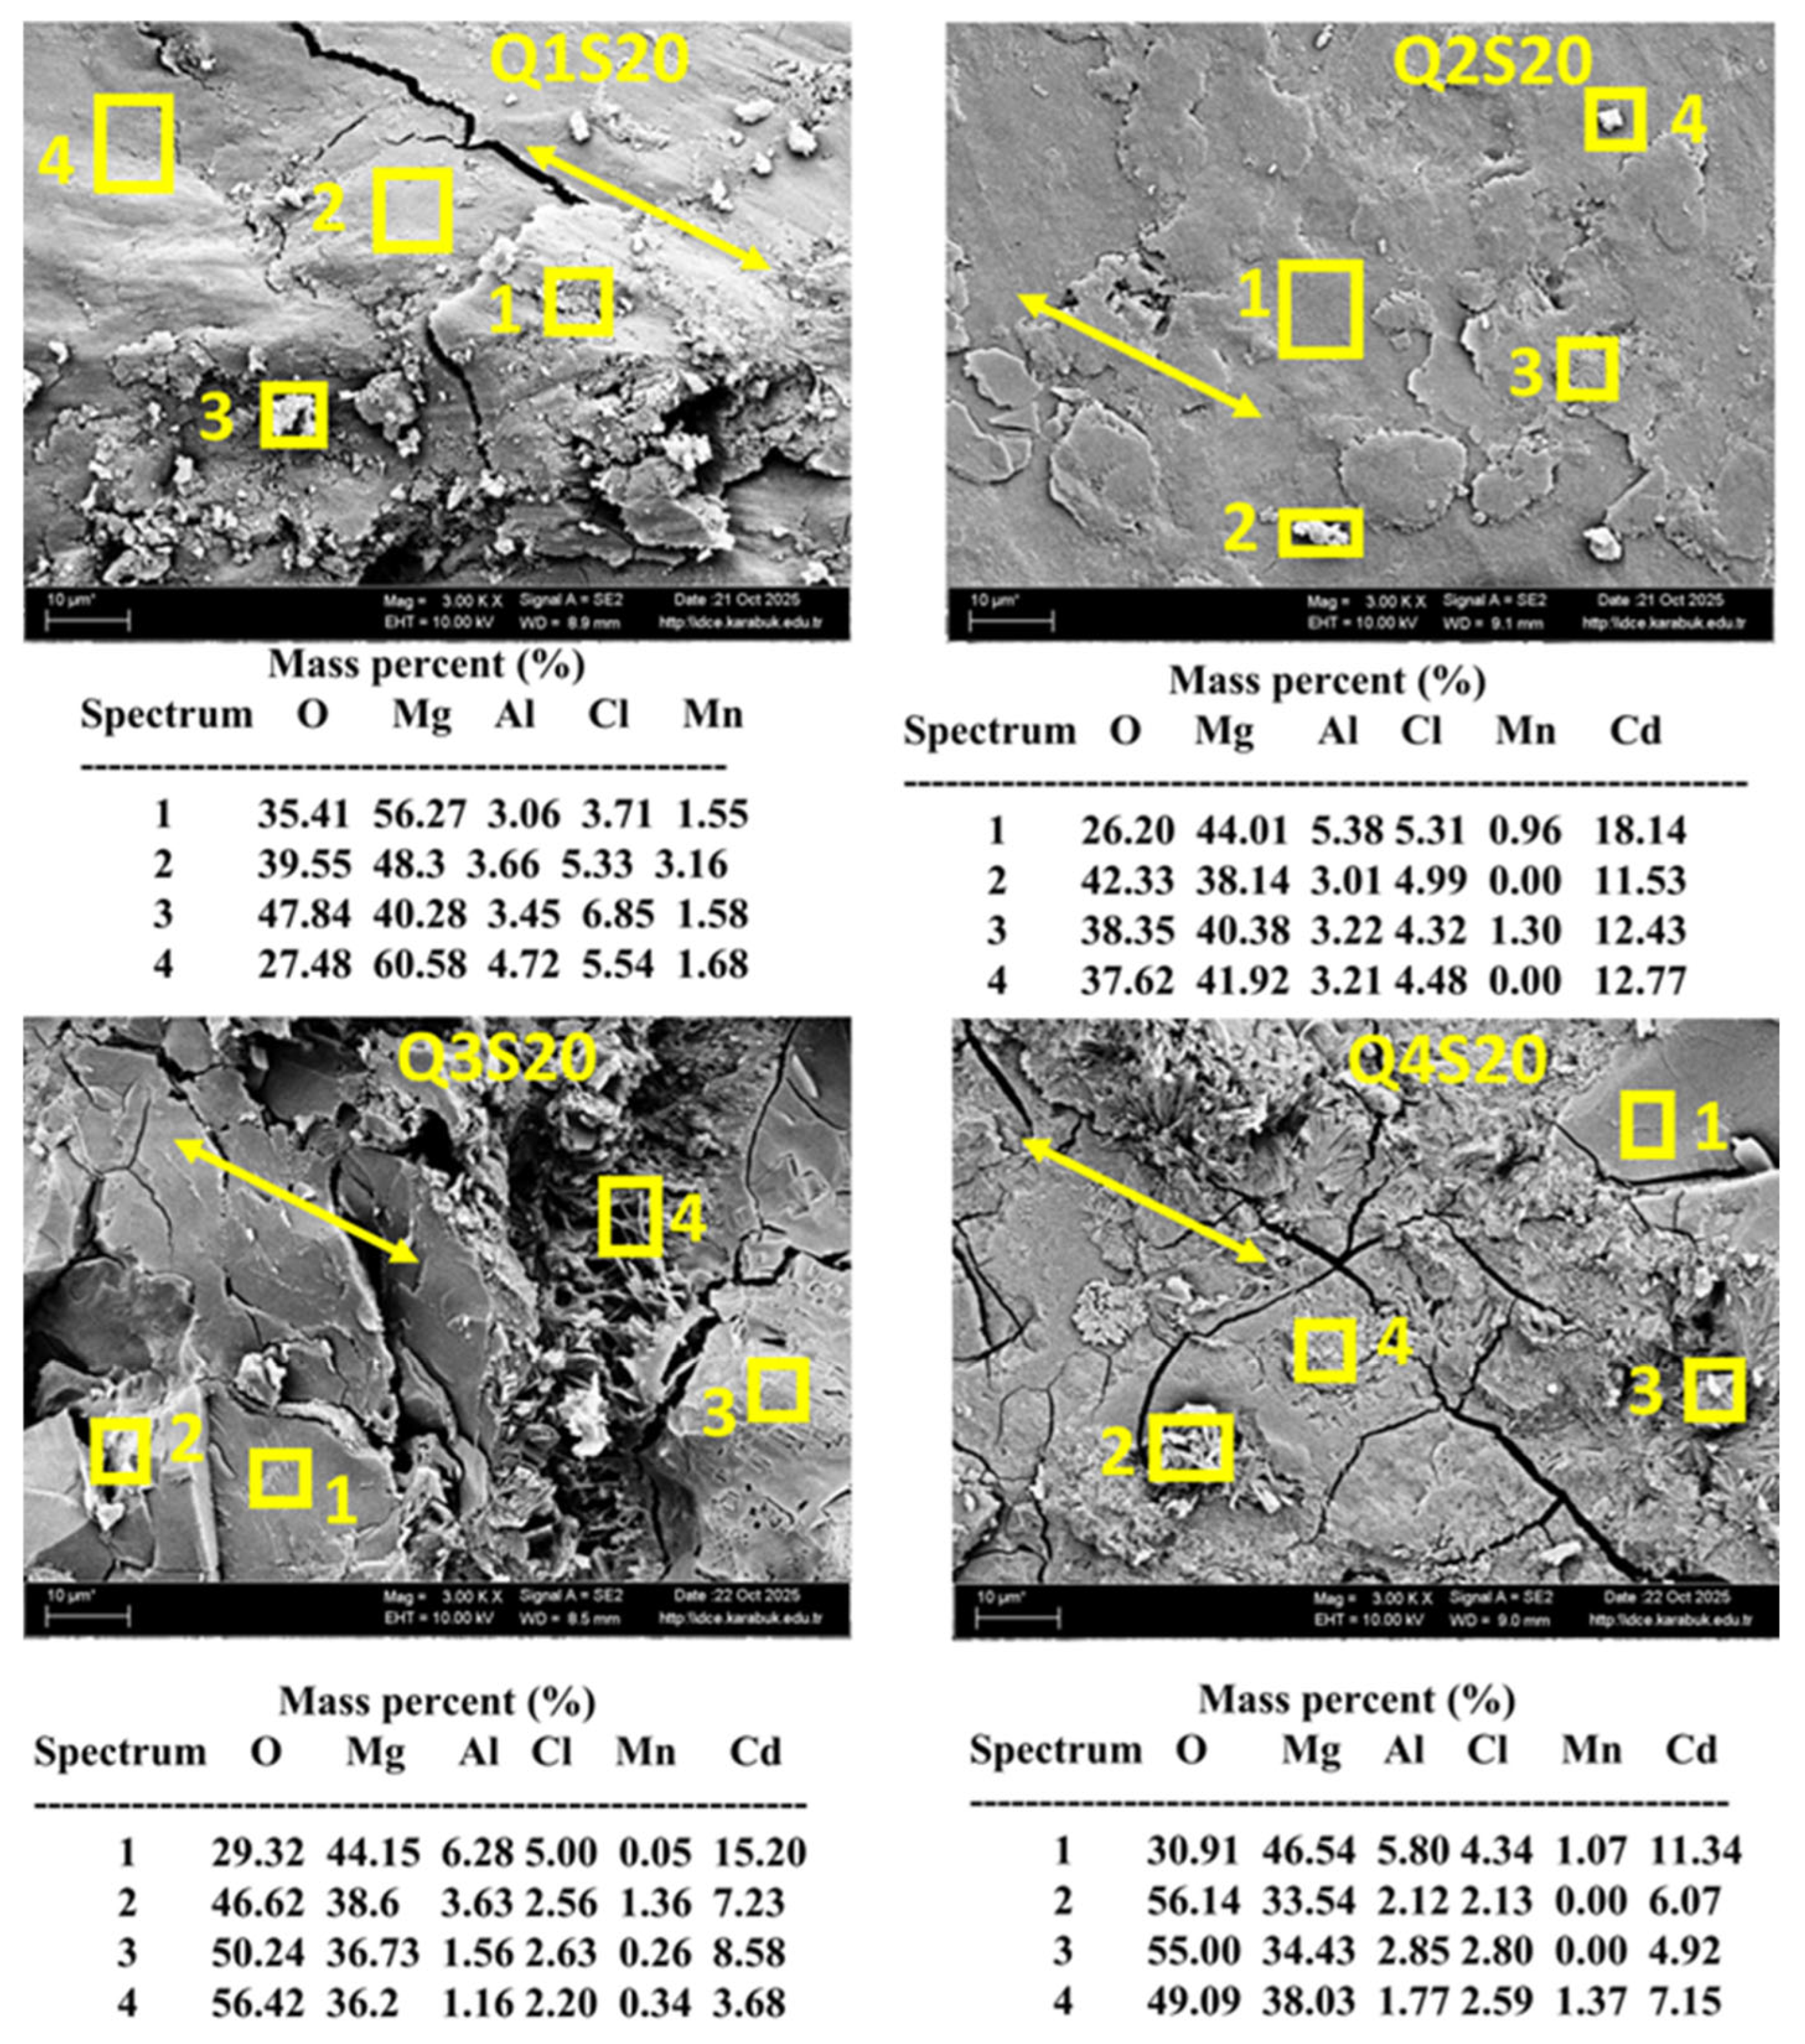
Figure 15 display the EDS spectra proving the presence of oxygen (O) and chlorine (Cl) on the corroded surface of the AM60 (Q1-Q2-Q3-Q4) alloys. In the SEM micrograph showing the surface morphology of the alloys after the corrosion test, an oxidized fragmented surface appearance is visible. Large and deep corrosion attack can be clearly observed in all samples.
Figure 15.
SEM-EDX images of the alloy after corrosive wear in NaCl medium under a 20 Newton load.
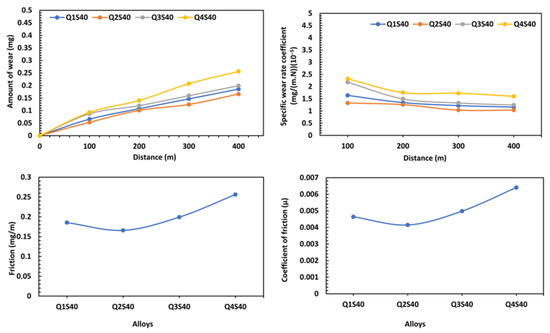
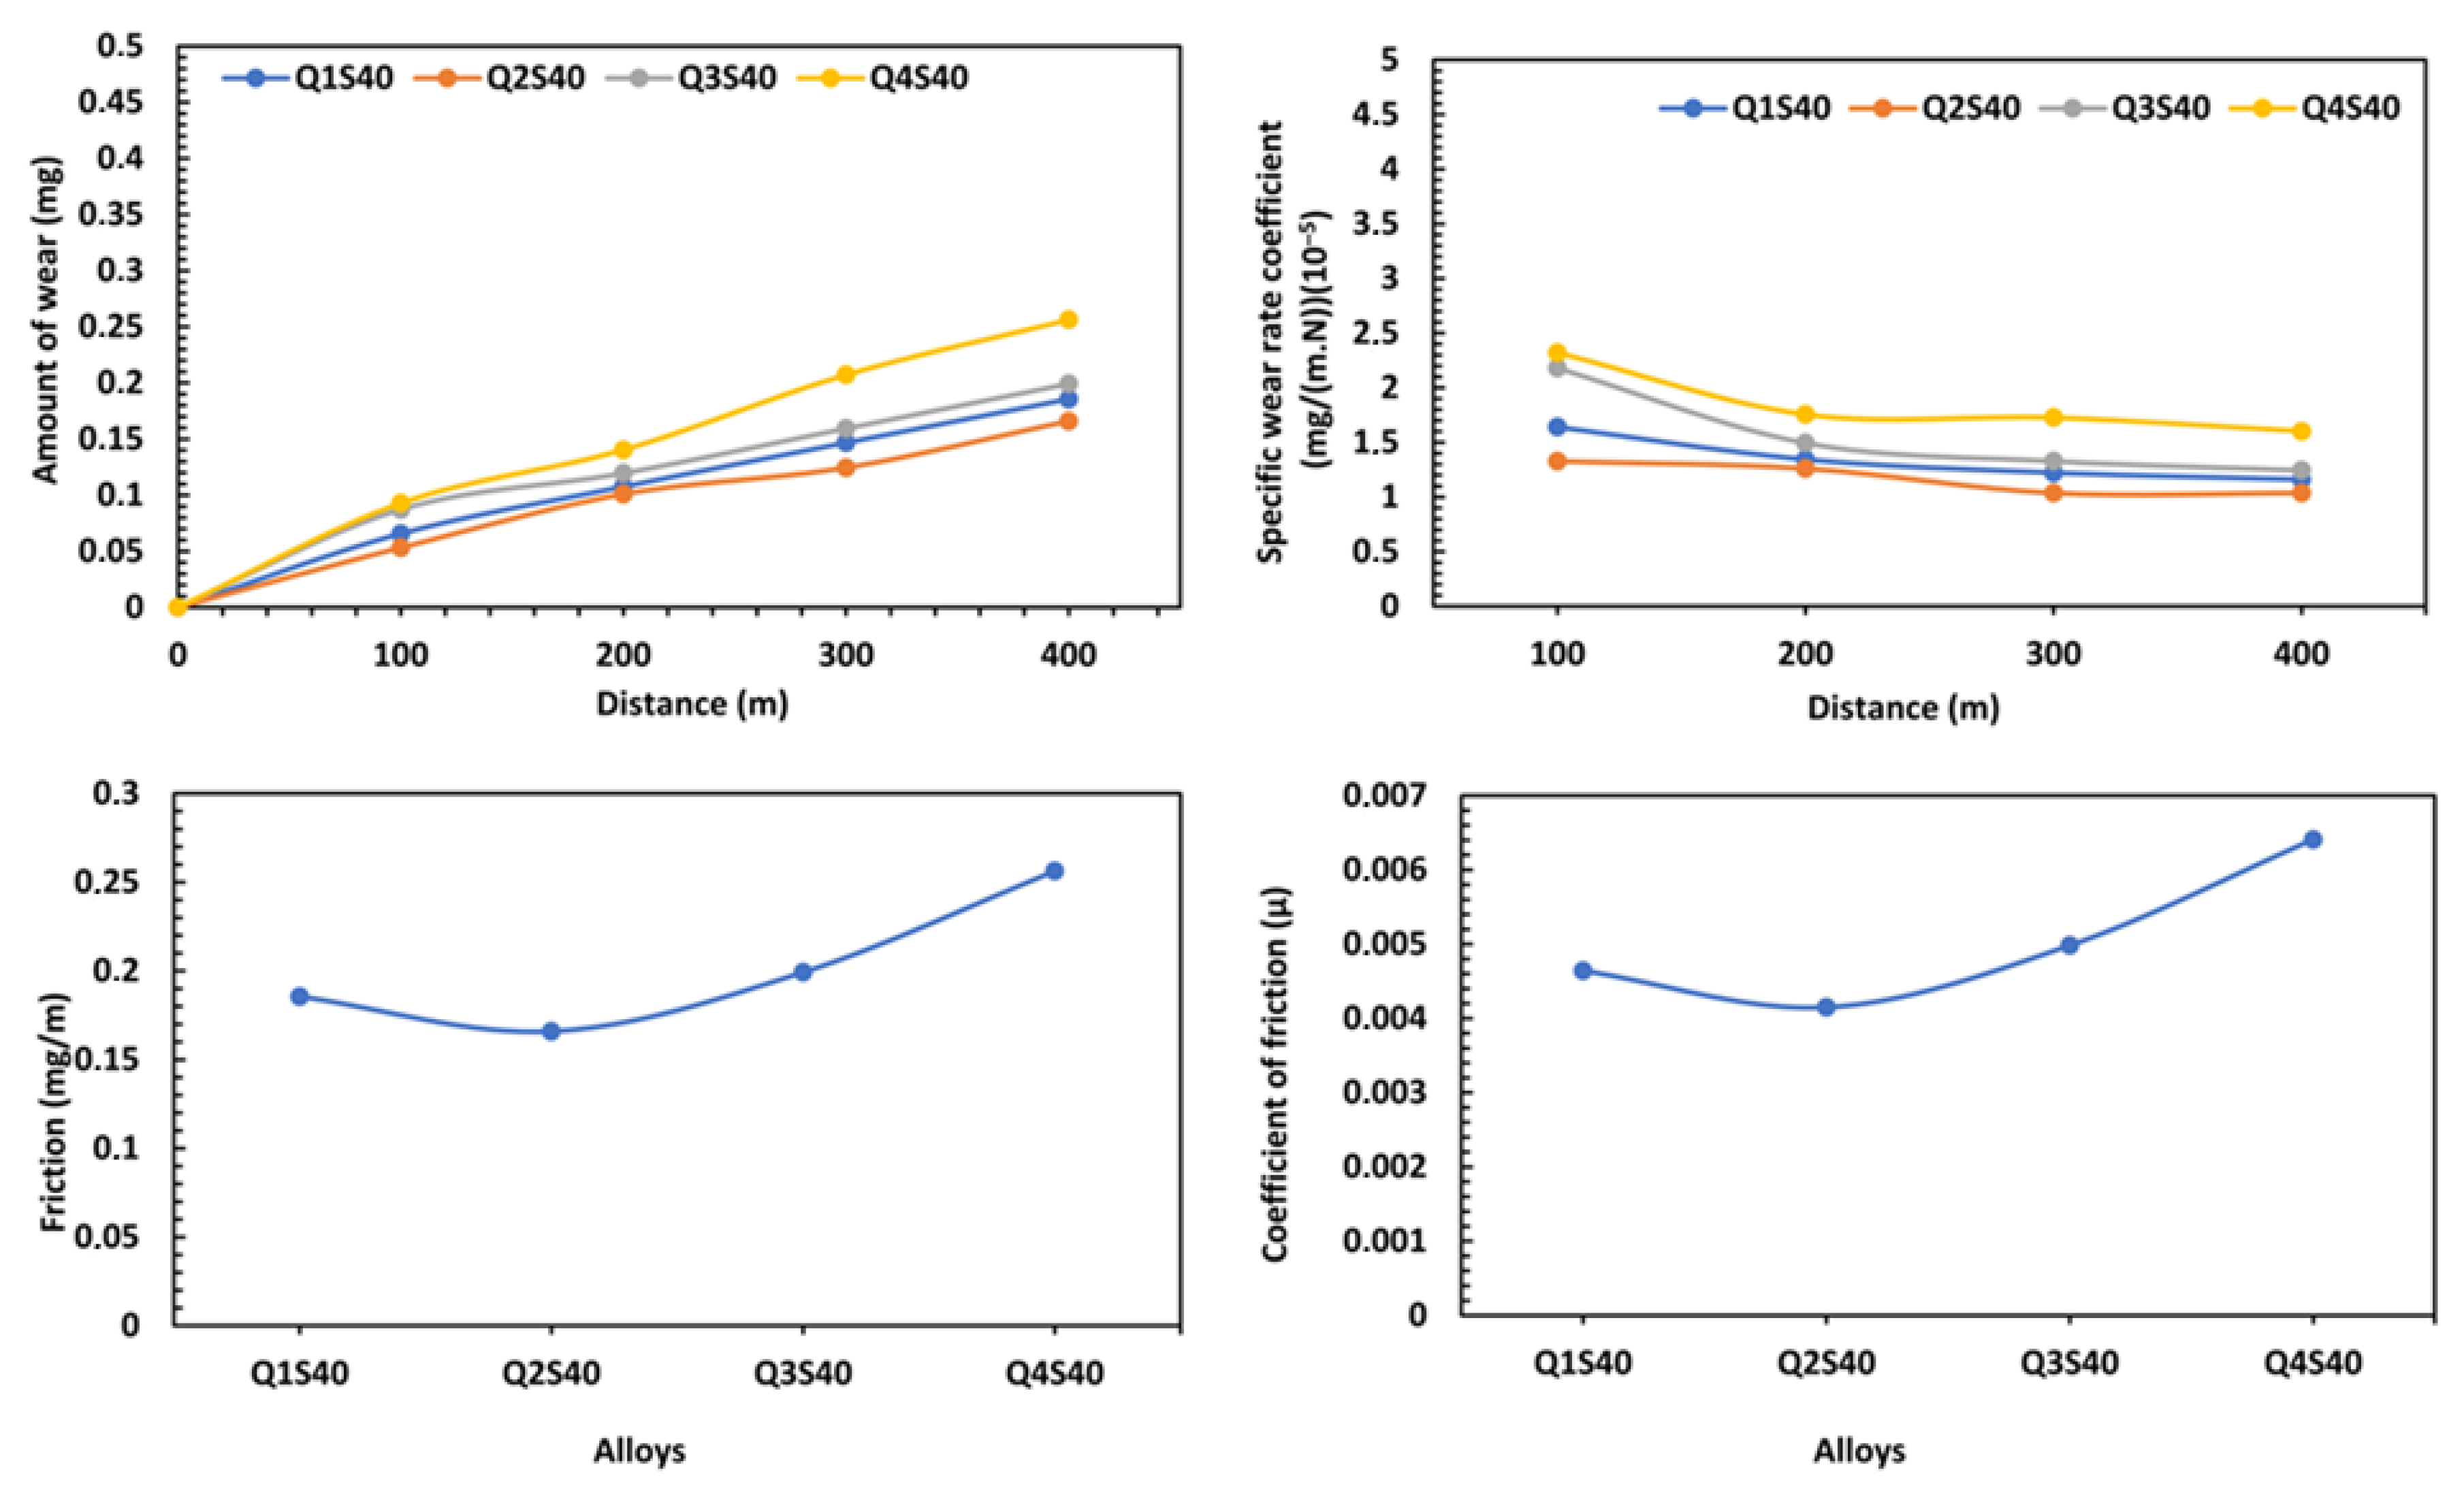
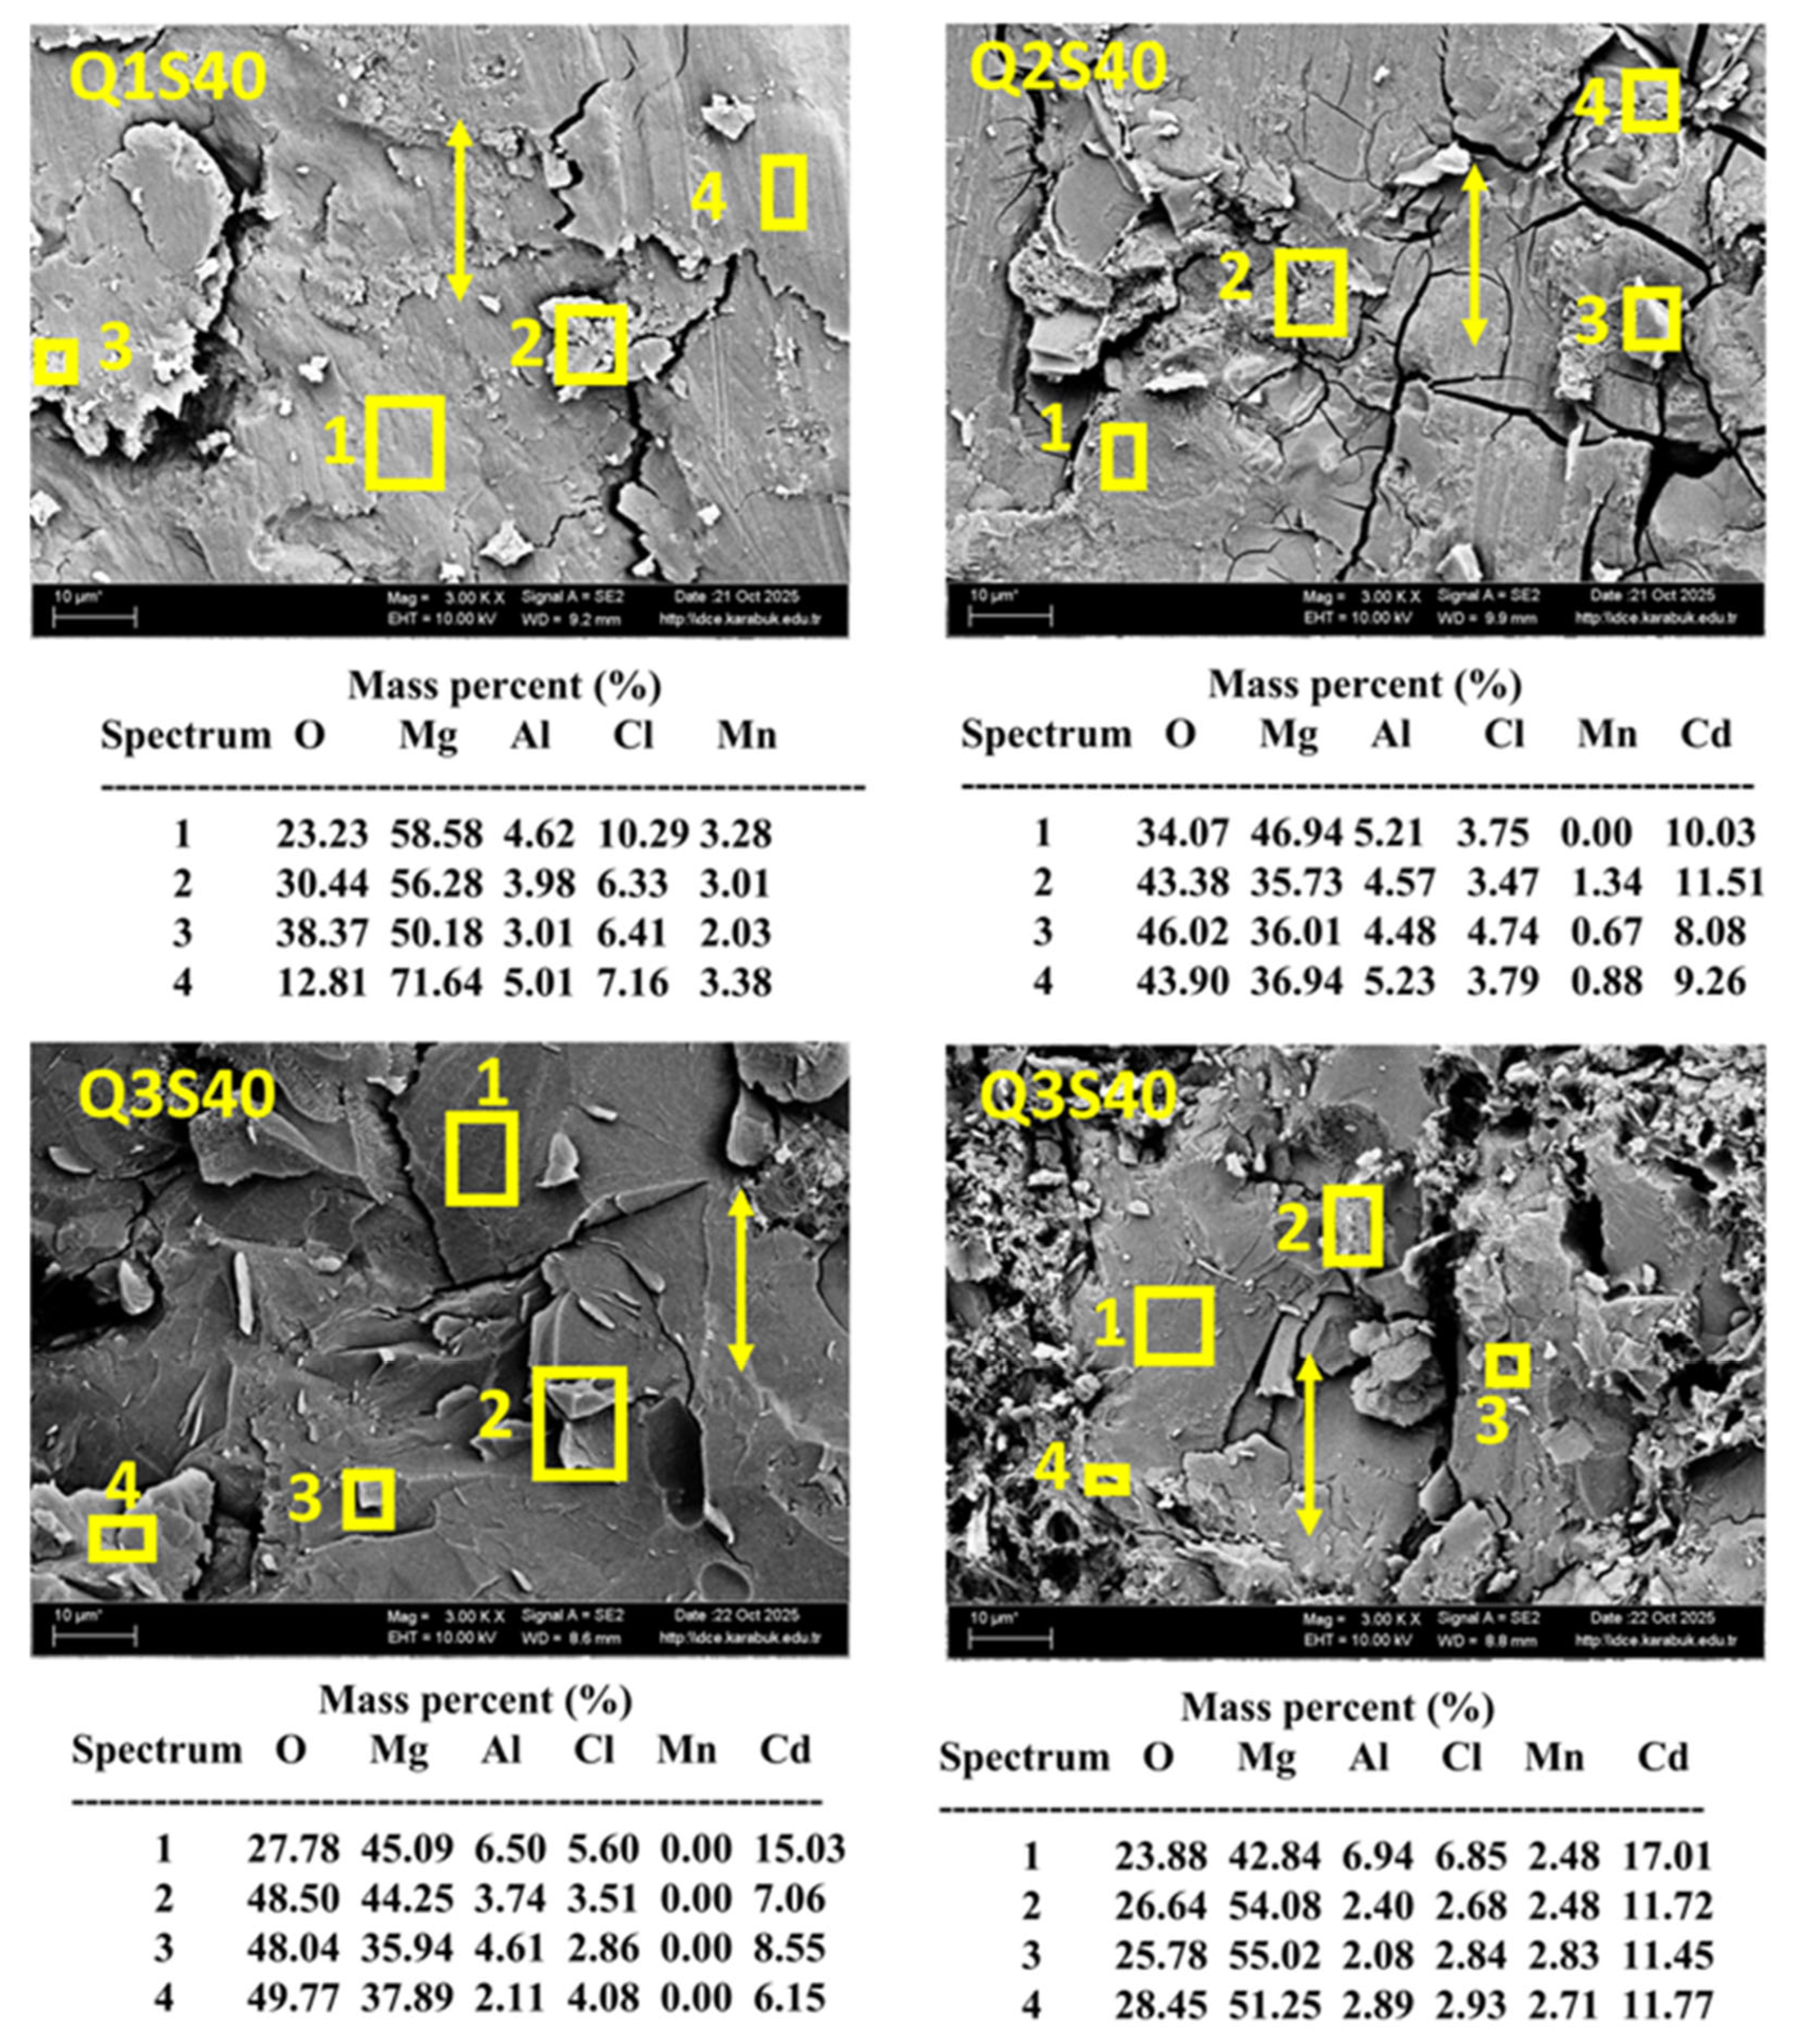
As shown in Figure 16, under a load of 40 N, at a distance of 400 m, and in a 3.5% NaCl en-vironment, the wear amounts of Q2 alloys were the lowest. Figure 17 shows the EDS spectra that prove the presence of oxygen (O) and chlorine (Cl) on the corroded surface of the alloys.
Figure 16.
Corrosive wear test results of the alloy in NaCl environment under a 40 Newton load.
Figure 17.
SEM-EDX images of the alloy after corrosive wear in NaCl environment under a 40 Newton load.
4. Discussion
In the study conducted by Ünal, it was shown that the α-Mg and β-Mg17Al12 intermetallic compounds were the only components of the AM60 alloy in the cast state [6]. Comba et al. detected the α-Mg, AlMn, Mg17Al12, and Al8Mn5 intermetallic phases in their studies on the AM60 alloy [25].
Similar microstructure imaging results were found in the microstructure examinations of AM60 alloys performed by Ünal [6]. It was explained in previous studies that thicker sections of cast parts contain more thermal energy, the time required for this thermal energy to dissipate differs from that in thinner sections, this affects grain size, and long solidification times result in coarser grain size [6,26]. Thus, to ensure equivalent observation, samples from the alloys in this study were collected from the same regions.
In the microstructure analyses of AM60 alloys conducted by Ünal, similar phase results were found [6]. Previous studies have presented phases between the Al cluster and Mg-Al [27,28,29]. Additionally, according to the EDX results, Mg-Al intermetallic phases were present at the grain boundaries between the α-Mg microstructure and the β-intermetallic phase extending along the grain boundaries [9,30].
Phases formed in similar alloys were reported in the literature [31]. In a study on hydrogenation in Mg alloys, Mg3Cd and MgCd3 alloys were produced. The interface parts between the irregular Mg3Cd phases must be present in large quantities in the alloy. The parts where these interface segments form on the surface were seen as suitable places for the dissociation of hydrogen molecules and hydride nucleation. It was reported that a Cd-rich whisker-like phase formed in the SEM images. In the XRD stage of the study, Mg3Cd peaks were demonstrated [32].
In the thesis study conducted by Geng X., potentiodynamic polarization tests of the AS41 Mg alloy in 0.1%, 0.3%, 1%, and 3% NaCl solutions were performed, and according to the Tafel curves of the samples, as the NaCl percentage increased, the corrosion potential took more negative values and progressed from the −1.4 band to the −1.6 band [33]. It was reported that the reason for the deterioration in the corrosion resistance of rolled ZM21 + 0.5La + 0.5Ca + 0.5Nd alloys could be the cathodic effect of the multiple Ca2Mg5Zn3, Ca5Zn3, Mg41Nd5, and Mg12Nd intermetallic phases in the structure, and many experiments similar to those here have been conducted [34,35,36].
In some experiments conducted in past years, it was stated that Fe, nickel (Ni), copper (Cu), and cobalt (Co) at concentrations below 0.2% accelerated the saltwater corrosion rate very significantly, alloys containing silver (Ag), calcium (Ca), and zinc (Zn) at concentrations between 0.5% and 5% had modest effects on corrosion resistance, and Al, Sn, Cd, Mn, silicon (Si), and sodium (Na) had very little or no effect at concentrations up to 5% [37].
It was observed that Cd addition generally increased the hardness of the AZ91 alloy by approximately 5–10%. As the Cd addition rate increased, there was no significant change in the yield strength of the AZ91 alloy, and the yield decreased only when Cd was added at a rate of 0.8%. It was stated that the addition of Cd as an alloy element had no significant effect on the yield strength of the AZ91 alloy, and similarly, the fact that Cd and Zn are in the same group may increase the possibility of showing similar properties, such as Zn increasing the hardness of Mg [38].
It was reported that the corrosion behavior of the AM60 alloy was affected by Al and Mn, and the corrosion morphology of the AM60 alloy involved galvanic and pitting corrosion. The intermetallic phases in the microstructure of the AM60 alloy develop galvanic and pitting corrosion mechanisms. The eutectic β-Mg17Al12 and Al-Mn intermetallic phases in the Mg-Al alloy act as cathodic regions, while the primary α-Mg matrix acts as the anodic region [33].
In a study on the corrosion behaviors of the AM60 alloy produced by the ingot and extrusion methods in the urban atmosphere, it was found that the extrusion sample corroded less because it contained fewer secondary phases, and the corrosion products on the surface were MgSO4-6H2O and MgSO3-6H2O [13].
In the study by Geng X., it was emphasized that the corrosion depth of the AM60 alloy was 10–20 µm, and 10–35 µm with the addition of composite-forming particles [33].
On the worn surface, the sample exhibited an abrasive appearance. Regions with intermetallic phases showed a galvanic effect when in contact with the salt solution, resulting in more wear and fragmentation. The fragmented hard structures caused further wear of the matrix phase. In the EDX analysis results in the literature, secondary phases were observed. Due to the aggressive liquid environment, the oxide level reached 21% [38]. In this study, significant results were obtained by developing alloys by adding 0.2%, 0.5%, and 1% Cd to the AM60 alloy and performing corrosion and wear tests on these alloys in a NaCl environment. The results obtained here will shed light on scientific studies and the metal industry in managing the corrosion and wear properties of alloys.
5. Conclusions
In this study, the Mg-Al-Mn base alloy Q1, the Q2 alloy with 0.2% Cd addition to the base alloy, the Q3 alloy with 0.5% Cd addition, and the Q4 alloy with 1.0% Cd addition were produced. The alloys were subjected to detailed microstructure examinations. Potentiodynamic polarization corrosion tests in 3.5% NaCl and abrasive wear tests were also applied.
In general, the following results were obtained: In the Mg-Al-Mn ternary alloy, the expected α-Mg, β-Mg17Al12, Al8Mn5, and AlMn phases were observed, and Cd was found to be predominantly dissolved in the matrix at the micro-level. Cd showed a fine, uniform distribution in the structure. In the hardness tests, the Q4 alloy showed an increase of approximately 16%. Among alloys Q1, Q2, and Q3, Q2 exhibited a higher hardness value based on statistically significant peak defects.
The corrosion potentials of the alloys studied were negative. Nevertheless, based on the potentiodynamic polarization corrosion test values, the corrosion rate increased as the Cd content of the alloys increased.
In the corrosive wear test of the alloys in a 3.5% NaCl environment, sample Q2 performed better under both 20 N and 40 N loads. In abrasive wear tests, when the applied load increased from 20 N to 40 N, the amount of wear increased by approximately 25% by weight after 400 m.
An important point to note is that cadmium, used in alloys, is a toxic metal. In some forms, it has harmful effects on human health and the environment. It is crucial for those who will be using this element to use ventilation and personal respiratory protective equipment to protect themselves from fumes during heating or welding processes.
Funding
This research was funded by [Sinop University Scientific Research Projects Coordination Unit.] project number [MYO-1901-25-002] And The APC was funded by [Assistant Professor Dr. Halil Ahmet Gören].
Data Availability Statement
The data presented in this study are available on request from the corresponding author due to privacy.
Acknowledgments
This study was supported by the Sinop University Scientific Research Projects Coordination Unit. Project Number: MYO-1901-25-002, Year: 2026.
Conflicts of Interest
The author declare no conflict of interest.
Abbreviations
The following abbreviations are used in this manuscript:
| OM | Optical Microscopy |
| XRD | X-Ray Diffraction |
| XRF | X-Ray Fluorescence |
| EDX | Energy-Dispersive X-Ray Spectroscopy |
| Mg | Magnesium |
| Mn | Manganese |
| Al | Aluminum |
| Cd | Cadmium |
| AM60 | Mg-Al-Mn |
| NaCl | Sodium Chloride |
| DOE | US Department of Energy |
References
- Li, Q.; Lu, Y.; Luo, Q.; Yang, X.; Yang, Y.; Tan, J.; Dong, Z.; Dang, J.; Li, J.; Chen, Y.; et al. Thermodynamics and kinetics of hydriding and dehydriding reactions in Mg-based hydrogen storage materials. J. Magnes. Alloys 2021, 9, 1922–1941. [Google Scholar] [CrossRef] [Scilit]
- Song, J.; She, J.; Chen, D.; Pan, F. Latest research advances on magnesium and magnesium alloys worldwide. J. Magnes. Alloys 2020, 8, 1–41. [Google Scholar] [CrossRef] [Scilit]
- Yang, Y.; Xiong, X.; Chen, J.; Peng, X.; Chen, D.; Pan, F. Research advances in magnesium and magnesium alloys worldwide in 2020. J. Magnes. Alloys 2021, 9, 705–747. [Google Scholar] [CrossRef] [Scilit]
- Kaplan, M.; Yildiz, A. The effects of production methods on the microstructures and mechanical properties of an aluminum bronze. Mater. Lett. 2003, 57, 4402–4411. [Google Scholar] [CrossRef] [Scilit]
- Esnaola, J.A.; Torca, I.; Galdos, L.; Garcia, C. Determination of the optimum forming conditions for warm tube hydroforming of ZM21 magnesium alloy. J. Achiev. Mater. Manuf. Eng. 2009, 32, 188–195. [Google Scholar]
- Ünal, M. Effects of solidification rate and Sb additions on microstructure and mechanical properties of as cast AM60 magnesium alloys. Int. J. Cast Met. Res. 2014, 27, 80–86. [Google Scholar] [CrossRef] [Scilit]
- Mordike, B.L.; Ebert, T. Magnesium. Mater. Sci. Eng. A 2001, 302, 37–45. [Google Scholar] [CrossRef] [Scilit]
- Cheng, Y.; Qin, T.; Wang, H.; Zhang, Z. Comparison of corrosion behaviors of AZ31, AZ91, AM60 and ZK60 magnesium alloys. Trans. Nonferrous Met. Soc. China 2009, 19, 517–524. [Google Scholar] [CrossRef] [Scilit]
- Elen, L.; Cicek, B.; Koc, E.; Turen, Y.; Sun, Y.; Ahlatci, H. Effects of alloying element and cooling rate on properties of AM60 Mg alloy. Mater. Res. Express 2019, 6, 096511. [Google Scholar] [CrossRef] [Scilit]
- Ikpi, M.E.; Dong, J.; Ke, W. Effect of Cadmium Addition on the Galvanic Corrosion of AM60 Magnesium Alloy in 0.1 M Sodium Chloride Solution. Solid State Phenom. 2015, 227, 71–74. [Google Scholar] [CrossRef] [Scilit]
- Alateyah, A.I.; Aljohani, T.A.; Alawad, M.O.; Elkatatny, S.; El-Garaihy, W.H. Improving the Corrosion Behavior of Biodegradable AM60 Alloy through Plasma Electrolytic Oxidation. Metals 2021, 11, 953. [Google Scholar] [CrossRef] [Scilit]
- Zhou, W.; Shen, T.; Aung, N.N. Effect of heat treatment on corrosion behaviour of magnesium alloy AZ91D in simulated body fluid. Corros. Sci. 2010, 52, 1035–1041. [Google Scholar] [CrossRef] [Scilit]
- Li, Y.; Wei, Y.; Hou, L.; Han, P. Atmospheric corrosion of AM60 Mg alloys in an industrial city environment. Corros. Sci. 2013, 69, 67–76. [Google Scholar] [CrossRef] [Scilit]
- Wen, W.; Luo, A.A.; Zhai, T.; Jin, Y.; Cheng, Y.-T.; Hoffmann, I. Improved bending fatigue and corrosion properties of a Mg–Al–Mn alloy by super vacuum die casting. Scr. Mater. 2012, 67, 879–882. [Google Scholar] [CrossRef] [Scilit]
- Zhao, Z.; Chen, Q.; Tang, Z.; Hu, C. Microstructural evolution and tensile mechanical properties of AM60B magnesium alloy prepared by the SIMA route. J. Alloys Compd. 2010, 497, 402–411. [Google Scholar] [CrossRef] [Scilit]
- Liu, Y.; Yang, W.; Qin, Q.; Wu, Y.; Wen, W.; Zhai, T.; Yu, B.; Li, D.; Luo, A.; Song, G.-L. Microstructure and corrosion behavior of die-cast AM60B magnesium alloys in a complex salt solution: A slow positron beam study. Corros. Sci. 2014, 81, 65–74. [Google Scholar] [CrossRef] [Scilit]
- Liao, J.; Hotta, M.; Yamamoto, N. Corrosion behavior of fine-grained AZ31B magnesium alloy. Corros. Sci. 2012, 61, 208–214. [Google Scholar] [CrossRef] [Scilit]
- Liao, J.; Miyawaki, Y. Atmospheric Corrosion Resistance of a Diecast Mg-Al-Ca-Si Magnesium Alloy with Continuous Intermetallic Phases. J. Mater. Eng. Perform. 2023, 32, 2813–2823. [Google Scholar] [CrossRef] [Scilit]
- Akimov, K.O.; Ivanov, K.V.; Figurko, M.G. Influence of Low-Energy High-Current Electron Beam Exposure on the Phase Composition and Corrosion Resistance of the AM60 Magnesium Alloy. Phys. Met. Metallogr. 2024, 125, 324–331. [Google Scholar] [CrossRef] [Scilit]
- Bird, J.O.; Chivers, P.J. Friction. In Newnes Engineering and Physical Science Pocket Book; Elsevier: Amsterdam, The Netherlands, 1993; pp. 235–237. [Google Scholar] [CrossRef] [Scilit]
- Gören, H.A.; Ünal, M. NTE katkılı Mg-2Zn Alaşımının Yük Altında Aşınma Davranışı ve Bazı Özelliklerinin İncelenmesi. Sinop Üniversitesi Fen Bilim. Derg. 2025, 10, 549–561. [Google Scholar] [CrossRef] [Scilit]
- Gören, H.A.; Ünal, M.; Türen, Y.; Ahlatci, H. ZM21 Magnezyum Alaşımına Lantan ve Kalsiyum İlavesinin Mikroyapı, Mekanik ve Hadde Özelliklerine Etkisi. Bilecik Şeyh Edebali Üniversitesi Fen Bilim. Derg. 2021, 8, 1024–1031. [Google Scholar] [CrossRef] [Scilit]
- Rokkala, U.; Bontha, S.; Ramesh, M.R.; Balla, V.K.; Srinivasan, A.; Kailas, S.V. Tailoring surface characteristics of bioabsorbable Mg-Zn-Dy alloy using friction stir processing for improved wettability and degradation behavior. J. Mater. Res. Technol. 2021, 12, 1530–1542. [Google Scholar] [CrossRef] [Scilit]
- Mohammad, F.K.; Rokkala, U.; Mohammed, S.M.A.K.; Altammar, H.; Moinuddin, S.Q.; Mohammed, R. Strength–Ductility Synergy in Biodegradable Mg-Rare Earth Alloy Processed via Multi-Directional Forging. J. Funct. Biomater. 2025, 16, 391. [Google Scholar] [CrossRef] [Scilit] [PubMed]
- Comba, A.; Cicek, B.; Comba, B.; Sancak, T.; Akveran, G.A.; Sun, Y.; Elen, L.; Afshar, M.T. Investigation of in-vitro biocompatibility and in-vivo biodegradability of AM series Mg alloys. Mater. Technol. 2022, 37, 2819–2831. [Google Scholar] [CrossRef] [Scilit]
- Laukli, H.I.; Lohne, O.; Sannes, S.; Gjestland, H.; Arnberg, L. Grain size distribution in a complex AM60 magnesium alloy die casting. Int. J. Cast Met. Res. 2003, 16, 515–521. [Google Scholar] [CrossRef] [Scilit]
- Çiçek, B.; Ahlatçı, H.; Sun, Y. Wear behaviours of Pb added Mg–Al–Si composites reinforced with in situ Mg2Si particles. Mater. Des. 2013, 50, 929–935. [Google Scholar] [CrossRef] [Scilit]
- Çiçek, B.; Sun, Y. A study on the mechanical and corrosion properties of lead added magnesium alloys. Mater. Des. 2012, 37, 369–372. [Google Scholar] [CrossRef] [Scilit]
- Ding, Y.; Ju, D. Finite Element Analysis of Residual Stress in the Diffusion Zone of Mg/Al Alloys. Adv. Mater. Sci. Eng. 2018, 2018, 1209849. [Google Scholar] [CrossRef] [Scilit]
- Jiang, J.; Wang, Y.; Qu, J.; Du, Z.; Sun, Y.; Luo, S. Microstructure evolution of AM60 magnesium alloy semisolid slurry prepared by new SIMA. J. Alloys Compd. 2010, 497, 62–67. [Google Scholar] [CrossRef] [Scilit]
- Moser, Z.; Gasior, W.; Wypartowicz, J.; Zabdyr, L. The Cd-Mg (Cadmium-Magnesium) System. Bull. Alloy Phase Diagr. 1984, 5, 23–30. [Google Scholar] [CrossRef] [Scilit]
- Skripnyuk, V.M.; Rabkin, E. Mg3Cd: A model alloy for studying the destabilization of magnesium hydride. Int. J. Hydrogen Energy 2012, 37, 10724–10732. [Google Scholar] [CrossRef] [Scilit]
- Geng, X. Corrosion Behavior of AM60 Magnesium Alloy Based Composites with and Without Plasma Electrolytic Oxidation Coating. Master’s Dissertation, University of Windsor, Windsor, ON, Canada, 2019. [Google Scholar]
- Gören, H.A.; Ünal, M.; Türen, Y.; Ahlatçi, H.; Sun, Y. A Comparative Study on the Mechanical and Corrosion Properties of the Zm20 and Zm21 Alloys After Casting and Rolling. Arch. Metall. Mater. 2022, 67, 1387–1394. [Google Scholar] [CrossRef] [Scilit]
- Ünal, M.; Gören, H.A. The effects of Nd, La, and Ca addition on the corrosion properties of as-cast and as-rolled ZM21 Mg alloys. Metall. Res. Technol. 2024, 121, 207. [Google Scholar] [CrossRef] [Scilit]
- Metin, M.; Ünal, M.; Gören, H.A. %3,5 NaCl Ortamında C95200 ve C95300 Alüminyum Bronzlarının Korozyon Davranışları. Bilecik Şeyh Edebali Üniversitesi Fen Bilim. Derg. 2022, 9, 939–966. [Google Scholar] [CrossRef] [Scilit]
- Song, G.L.; Atrens, A. Corrosion Mechanisms of Magnesium Alloys. Adv. Eng. Mater. 1999, 1, 11–33. [Google Scholar] [CrossRef]
- Erçayhan, Y. Alaşım Elementlerinin Magnezyumun Mikroyapı ve Mekanik Özelliklerine Etkilerinin İncelenmesi Yüksek Lisans Tezi. Master’s Thesis, Celal Bayar Üniversitesi, Manisa, Türkiye, 2010. [Google Scholar]

Disclaimer/Publisher’s Note: The statements, opinions and data contained in all publications are solely those of the individual author(s) and contributor(s) and not of MDPI and/or the editor(s). MDPI and/or the editor(s) disclaim responsibility for any injury to people or property resulting from any ideas, methods, instructions or products referred to in the content. |
© 2026 by the author. Licensee MDPI, Basel, Switzerland. This article is an open access article distributed under the terms and conditions of the Creative Commons Attribution (CC BY) license.