


Abstract
The phase transformation characteristics of Sn-Pb-Bi ternary alloys with four representative Bi/Pb mass fraction ratios (0, 0.14, 0.33, and 0.60) were systematically investigated using the deep potential molecular dynamics (DeePMD) method over a temperature range of 300–600 K. A high-precision machine-learned interatomic potential was achieved using large-scale ab initio molecular dynamics (AIMD) datasets, reaching chemical accuracy (energy error <5 meV/atom, force error <100 meV/Å). Complete solid–liquid–solid heating–cooling cycle simulations were performed to accurately determine the melting temperature , solidification temperature , and undercooling . The microscopic mechanisms through which Bi regulates phase transitions were revealed through radial distribution function (RDF), mean square displacement (MSD), self-diffusion coefficient, and viscosity analyses. Our results show that increasing the Bi/Pb ratio monotonically lowers from 475 K to 450 K, while reaches a maximum of ~48 K at Bi/Pb = 0.14. Bi addition disrupts short-range order, enhances chemical homogeneity, suppresses atomic diffusion, and optimizes liquid viscosity, with the optimal composition found to be Bi/Pb ≈ 0.14, balancing a low melting point, controlled undercooling, and improved flowability. This study provides an atomic-scale theoretical foundation for the precise composition design of low-melting-point Sn-Pb-Bi solders for photovoltaic and electronic packaging applications.
1. Introduction
With the rapid advancement of photovoltaic modules and high-density electronic packaging, there is an urgent demand for low-melting-point solders capable of reducing soldering temperatures, protecting heat-sensitive components, and improving the wettability, electrical conductivity, and mechanical reliability of solder joints. Traditional Sn-Pb solders perform excellently overall but are increasingly constrained by strict environmental regulations (e.g., RoHS) on lead content and the growing need for low-temperature soldering processes. Advanced low-temperature solder design strategies based on microstructural and processability optimization have been attracting increasing attention. It has been demonstrated that compositional regulation and hierarchical structural design can effectively improve solder processability, wettability, and compatibility with existing electronic packaging technologies [1]. Consequently, the addition of bismuth (Bi) to form Sn-Pb-Bi ternary alloys has emerged as a key strategy for developing advanced low-melting-point solders. Subtle variations in the Bi/Pb mass fraction ratio significantly influence the alloy’s microstructural evolution, phase transformation behavior, melting/solidification temperature range, liquid flowability, atomic diffusion, and final solder joint microstructure and interfacial strength.
However, current research on Sn-Pb-Bi ternary alloys still shows significant limitations, primarily focusing on two main types of method: experimental characterization and classical molecular dynamics simulations. In terms of experimental studies, real-time synchrotron X-ray scattering techniques have been successfully applied for in situ observation of the phase transformation behavior of Sn-Pb-Bi photovoltaic solder strips during heating [2]. Combined with relevant characterization methods, these techniques can provide key information such as macroscopic melting temperatures, solidification paths, and the microstructural morphology of solder joints. However, these methods are limited by their spatial and temporal resolution, making it difficult to capture the atomic-scale dynamic evolution during liquid and solid–liquid phase transitions in real time. For example, we still lack an in-depth understanding of the rearrangement of short-range ordered structures, the details of atomic diffusion paths, and local chemical segregation phenomena, as well as the microscopic mechanisms underlying undercooling, liquid flow behavior, and phase-transition hysteresis effects in complex ternary systems [3,4,5].
In the field of classical molecular dynamics simulations, although a Modified Embedded Atom Model (MEAM) has been developed for the Sn-Pb binary system and successfully predicted the thermodynamic properties of solid Sn, the enthalpy of liquid Pb-Sn mixtures, and phase diagram characteristics, to date, no high-precision potential functions for Sn-Pb-Bi ternary alloys have been reported. Existing embedded atomic potentials (EAMs) or MEAMs are significantly inadequate when it comes to capturing the Sn-Pb-Bi system, including its complex many-body interactions, Bi-induced lattice distortions, electron transfer effects, the stability of Sn allotropic phases, and short-range ordered structures [6,7]. This leads to systematic errors in the prediction of key phase-transition parameters such as the melting point, undercooling, self-diffusion coefficient, viscosity, and grain boundary segregation and fails to provide reliable atomic-scale theoretical guidance for the optimization of the Bi/Pb mass fraction ratio.
Although preliminary studies based on ab initio molecular dynamics and machine learning potentials have been conducted in recent years, significant research gaps remain regarding the Sn-Pb-Bi ternary low-melting-point system [8]. In particular, we lack computational tools combining the chemical accuracy of density functional theory (DFT) with the large-scale, long-time-scale simulation capabilities of molecular dynamics (MD) to systematically elucidate the precise regulatory mechanisms through which the Bi element governs short-range ordered structures, diffusion behavior, and phase-transition hysteresis phenomena.
To overcome the aforementioned technical challenges, in this work, we innovatively employed the deep learning-based DeePMD (deep potential molecular dynamics) method to achieve a high-precision machine learning-based interatomic potential (deep potential) [9,10,11,12,13]. For four typical compositions with Bi/Pb mass fractions of 0, 0.14, 0.33, and 0.60, we designed a comprehensive heating–cooling cycle molecular dynamics simulation scheme to systematically investigate the entire melting and solidification process of the alloys. By precisely tracking the evolution curves of potential energy, volume, and density with temperature and combining these with thermodynamic analysis, we could accurately determine the melting temperature Tm and solidification temperature Ts for each composition. At the same time, by comprehensively analyzing microstructural and kinetic parameters such as the radial distribution function (RDF), mean square displacement (MSD), self-diffusion coefficient, viscosity, and coordination number, we revealed the atomic-scale regulatory mechanisms of Bi content on short-range order, atomic diffusion behavior, liquid viscosity characteristics, and phase-transition hysteresis in the alloy. Through this study, we not only systematically elucidate the intrinsic microscopic mechanisms through which Bi alters local atomic arrangements, lowers the melting point, optimizes undercooling, and enhances liquid flowability, we also provide a solid atomic-scale theoretical basis for the precise composition design of Sn-Pb-Bi photovoltaic solder alloys, the optimization of low-temperature soldering processes, and the prediction of thermal properties. This work lays an important foundation for promoting the application of a new generation of lead-free, low-melting-point solders in engineering.
2. Modeling and Computational Methods
To systematically elucidate the intrinsic atomic-scale mechanisms through which the Bi/Pb mass fraction ratio governs the melting and solidification phase transitions, as well as the microstructural evolution of Sn-Pb-Bi ternary alloys, in this study, we employed the deep learning-based DeePMD (deep potential molecular dynamics) method to perform large-scale molecular dynamics simulations. At its core, DeePMD leverages deep neural networks for high-precision fitting of atomic environment descriptors, enabling an accurate representation of multi-body potential energy surfaces with near-first-principles (DFT) accuracy while preserving the exceptional computational efficiency and scalability of classical molecular dynamics.
In contrast to traditional Embedded Atom Method (EAM) or Modified Embedded Atom Method (MEAM) potentials, DeePMD offers substantial advantages. When applied to Sn-Pb-Bi ternary alloys, conventional EAM/MEAM potentials struggle to capture the system’s complex many-body interactions, Bi-induced local compositional segregation, and pronounced electron transfer effects. These shortcomings result in systematic inaccuracies when modeling the dynamic evolution of phase interfaces, atomic diffusion pathways, microstructural transformations, and short-range order rearrangement during melting and solidification—often manifesting as melting-point deviations, underestimated undercooling, or distorted viscosity predictions. DeePMD overcomes these limitations through an end-to-end machine learning framework that directly learns high-precision potential energy surface data from extensive first-principles (DFT) calculations. Adaptive neural network fitting endows the potential with superior generalization and transferability. This innovation not only markedly enhances the reliability and physical fidelity of simulation results but also provides deeper insights into the thermodynamic and kinetic mechanisms underlying Bi/Pb ratio-regulated phase transitions.
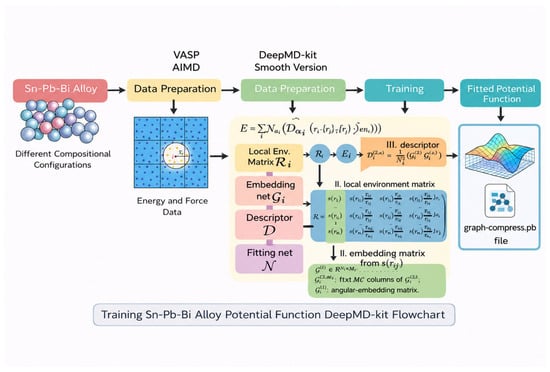
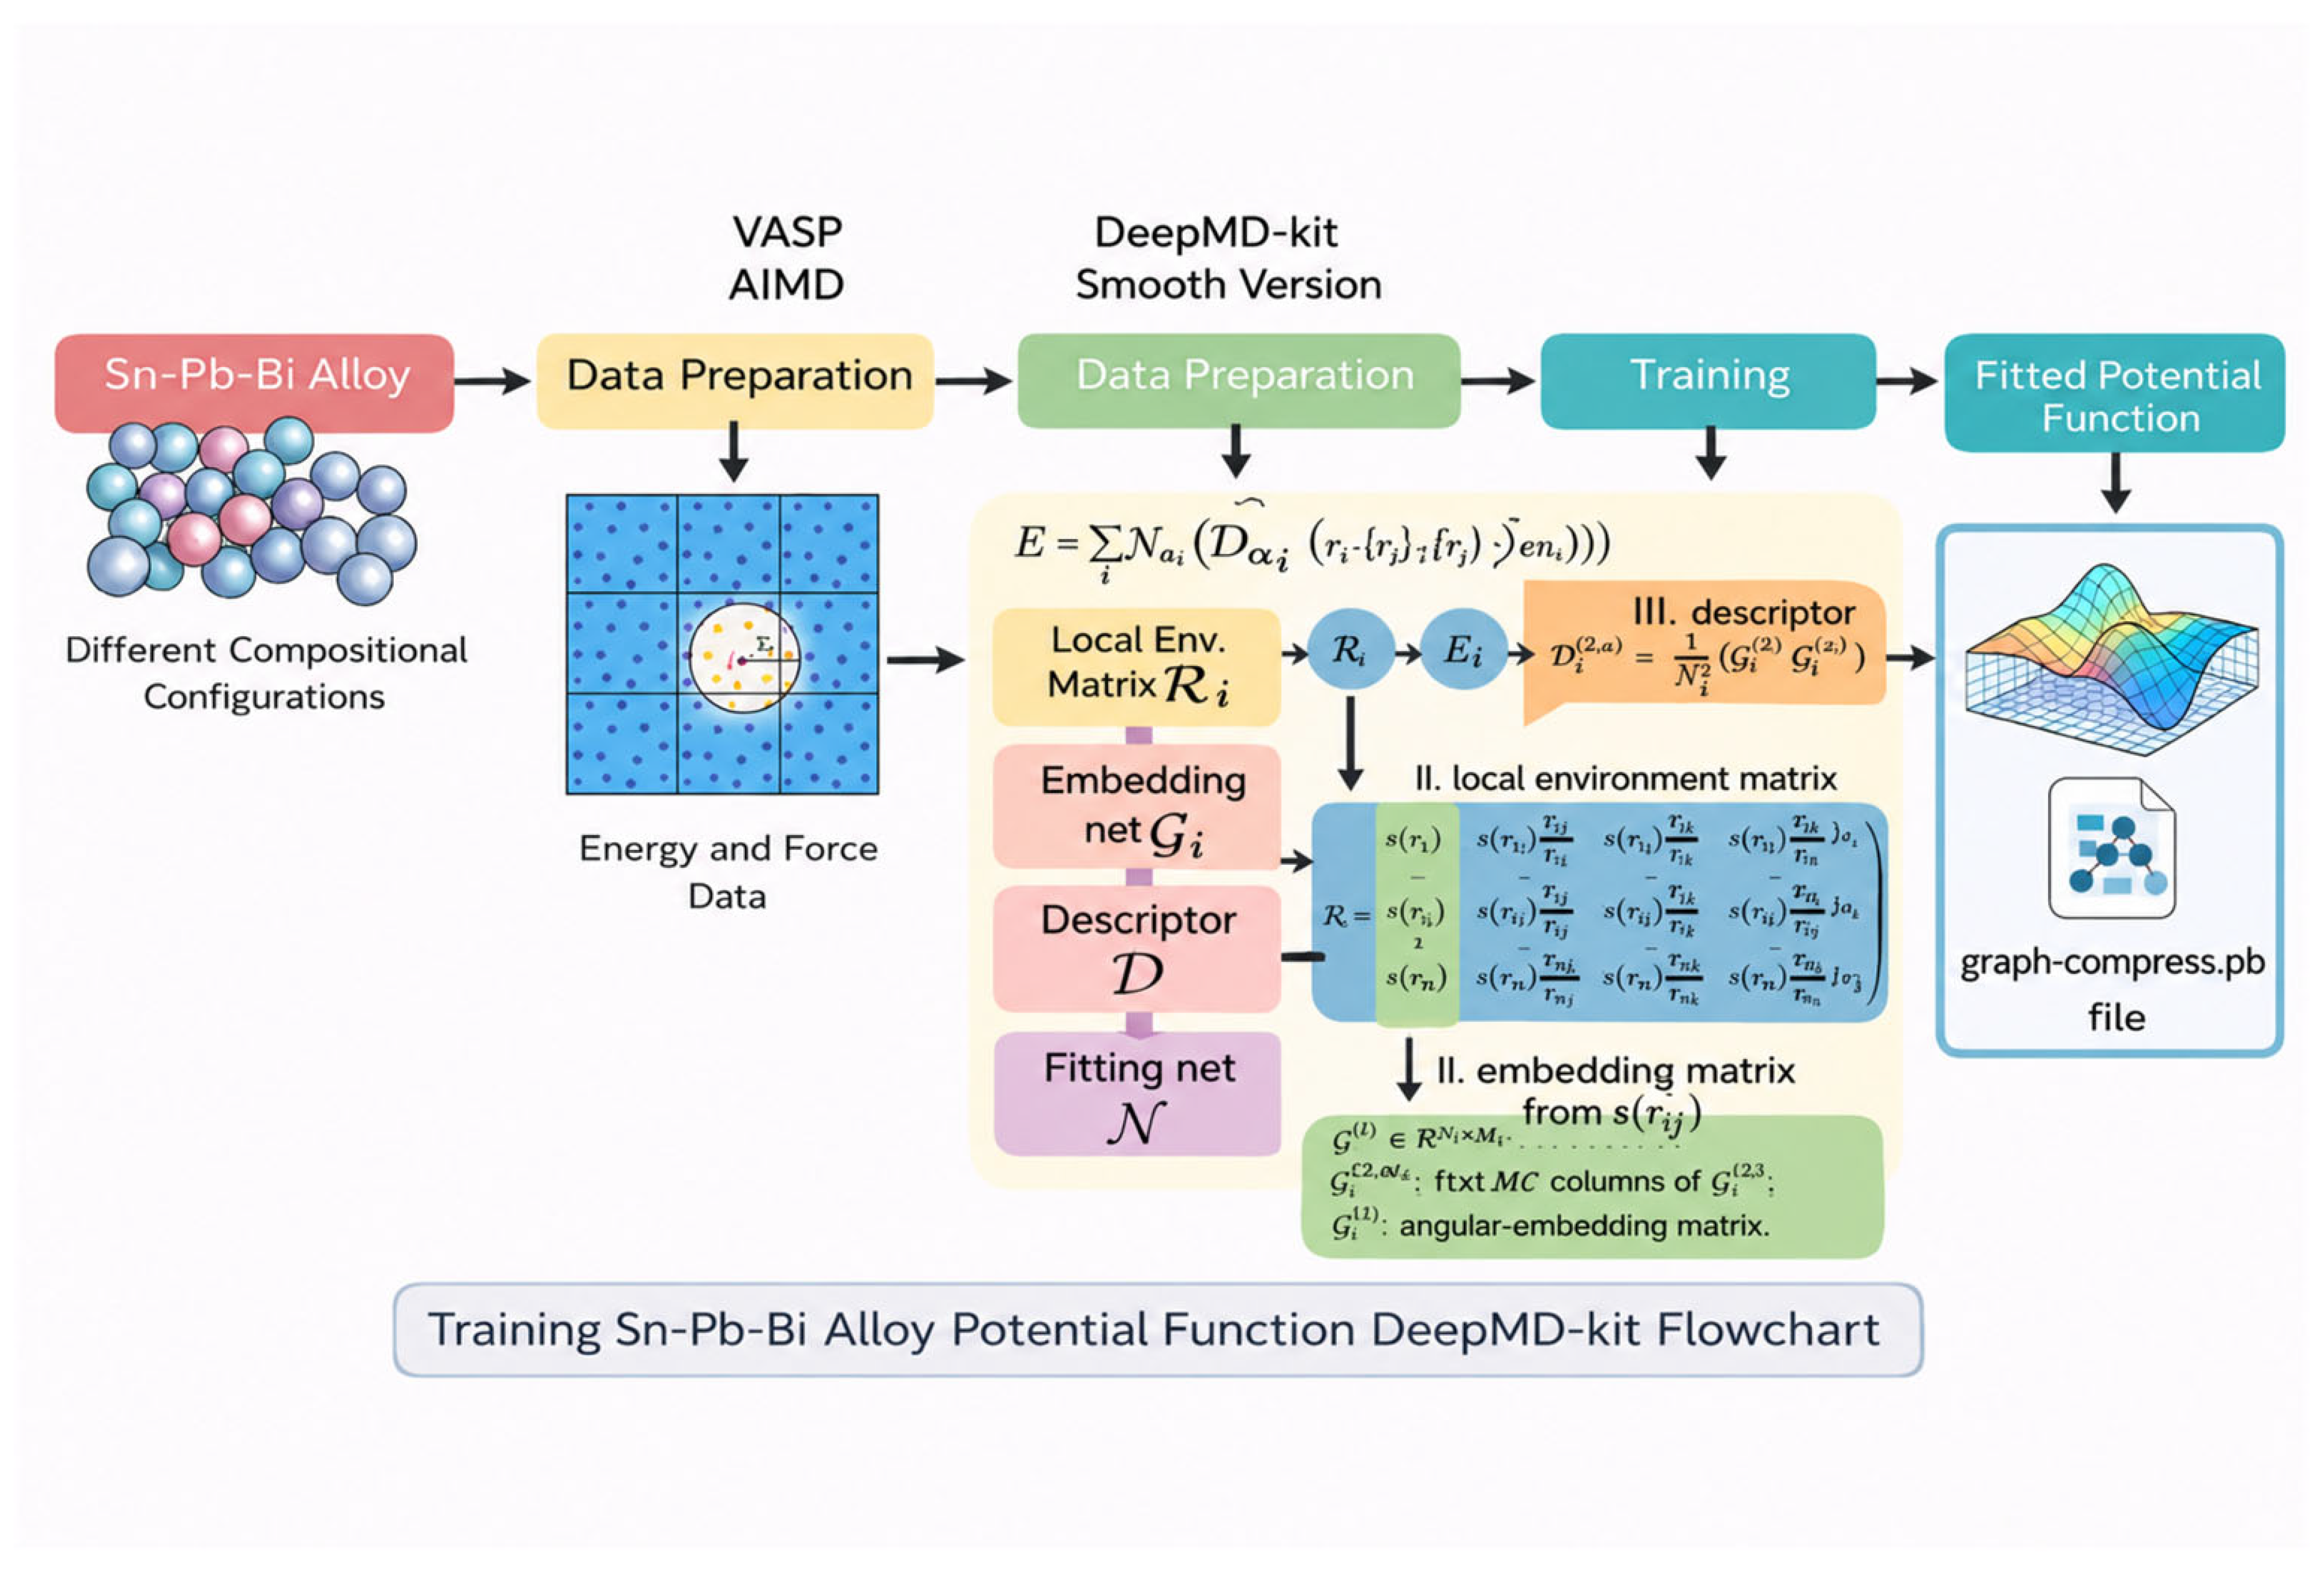
Figure 1 illustrates the fundamental principle and complete workflow for constructing machine-learned interatomic potentials using deep neural networks. The process begins with the generation of a diverse training dataset comprising a wide range of atomic configurations derived from density functional theory (DFT) calculations, followed by the precise extraction of total energies, atomic forces, and stress tensors for each configuration. Local atomic environments are then encoded as descriptors and fed into a deep neural network for end-to-end training, enabling efficient fitting of the potential energy surface. Upon training convergence, the resulting DeePMD potential can be seamlessly integrated into molecular dynamics software such as LAMMPS (2 August 2023), thereby facilitating efficient, long-duration, large-scale phase-transition simulations.
Figure 1.
Principle and Flowchart of Using Deep Neural Networks to Construct Atomic Potentials in Machine Learning.
2.1. Dataset Generation
The core of the deep potential (DP) model lies in employing machine learning techniques to accurately fit high-precision interatomic potentials. By utilizing deep neural networks to perform end-to-end mapping of the intricate local atomic environment descriptors, the model achieves high-fidelity reconstruction of the many-body potential energy surface. The quality and diversity of the training data directly govern the model’s reliability and generalization capability. Consequently, the construction of high-quality, high-coverage datasets derived from ab initio molecular dynamics (AIMD) constitutes the most critical step in developing robust DeePMD potentials, significantly influencing the physical accuracy and predictive power of subsequent molecular dynamics simulations.
In this study, to ensure that the DP model comprehensively captured the atomic-scale behavior of Sn-Pb-Bi ternary alloys across the entire melting–solidification process, we systematically constructed an AIMD-based training dataset spanning a broad range of compositional systems. Specifically, we considered the three pure elements (Sn, Pb, and Bi), the three binary alloys (Sn-Pb, Sn-Bi, and Pb-Bi), and four representative Sn-Pb-Bi ternary alloys with Bi/Pb mass fraction ratios of 0, 0.14, 0.33, and 0.60. For each system, a diverse set of initial configurations was prepared, including solid-solution structures, liquid-phase configurations, point defects, and solid–liquid interfaces. These structures collectively encompass the full evolutionary pathway from ordered crystalline phases to disordered liquids and the intervening phase-transition states.
All AIMD simulations were performed using the NVT ensemble across a wide temperature range of 300–600 K, fully covering the solid-state stability region, the melting transition zone, and the high-temperature liquid region. This temperature window enables the model to systematically assess key structural changes during melting. The computational setup employed well-validated PAW pseudopotentials (Sn_d, Pb_d, and Bi_d) to describe the valence electron configurations [14,15,16]. The exchange-correlation functional was treated within the Perdew–Burke–Ernzerhof (PBE) formulation of the Generalized Gradient Approximation (GGA) to accurately account for electronic correlation effects. The core–valence electron interactions were handled using the Projector Augmented-Wave (PAW) method, ensuring both transferability and computational efficiency [17,18,19,20]. A uniform time step of 1 fs was adopted. Each system was independently simulated for sufficiently long AIMD trajectories, yielding a total of 10,000 structural frames. These configurations provide dense, highly diverse sampling across solid, melting transition, and liquid thermodynamic states, effectively mitigating the insufficient sampling of critical phase-transition regions that often plagues conventional datasets.
To objectively assess the model’s generalization performance and mitigate overfitting risks, the entire dataset was randomly partitioned into an 80% training set for neural network parameter optimization and a 20% independent test set for validation. Model performance was further evaluated by monitoring the evolution of training and validation loss curves, comparing energy and force prediction errors on both sets, and confirming the absence of significant divergence or late-stage oscillations throughout 600,000 training iterations. This rigorous splitting strategy guarantees that the resulting DeePMD potential not only exhibits high accuracy within the training domain (energy error < 5 meV/atom, force error < 100 meV/Å) but also demonstrates excellent extrapolation capability to unseen configurations when predicting energies, forces, and stresses.
2.2. Training Deep Potential Models
The DeePMD method is used to construct a deep neural network (DNN) potential function, the core principle of which is to accurately represent the total energy of the system as the sum of the local energies of all atoms:
For any atom i, we first construct an environment matrix describing its local atomic environment, then map it to a high-dimensional feature matrix via an embedding network, and finally perform a further nonlinear mapping through a fitting network to obtain the local energy Ei of that atom:
This end-to-end neural network architecture is capable of adaptively capturing the complex many-body interactions, electron transfer effects, and composition-dependent short-range order in Sn-Pb-Bi ternary alloys, outperforming traditional empirical potential functions by a significant margin [21,22].
During model training, both the embedding network and the fitting network adopted a three-layer fully connected architecture, with the embedding network configured as [25, 50, 100] and the fitting network as [240, 240, 240]. To balance computational efficiency with a comprehensive description of nearest-neighbor atomic interactions, the smoothing cutoff radius and cutoff radius were set to 6.8 Å and 7 Å, respectively, ensuring precise handling of all atomic pairs within 7 Å while maintaining high accuracy. Training was conducted over a total of 600,000 iterations, with the learning rate starting at 0.001 and following an exponential decay strategy, gradually decreasing to the order of 10−8. This approach ensures that the model converges sufficiently at an acceptable computational cost while effectively preventing oscillations and overfitting during the later stages of training. The loss function is defined as the sum of the weighted root-mean-square errors (RMSE) of the energy, force, and virial tensor:
Here, Δe, ΔFi, and Δξ represent the root-mean-square errors (RMSEs) for energy, force, and the virial tensor, respectively. The training data are derived entirely from energy, force, and virial tensor labels obtained via DFT calculations, and the model parameters are iteratively optimized using the Adam optimizer with a learning-rate decay strategy. Concurrently, the weights of the three loss terms—energy, force, and virial—were dynamically adjusted in stages to achieve a balanced fit for different physical quantities until the model’s prediction error converged to a preset threshold. The final DeePMD potential function obtained in this study exhibited typical errors, i.e., energy error < 3–5 meV/atom and force error < 50–100 meV/Å, thereby meeting the chemical accuracy requirements for subsequent phase-transition simulations.
The deep potential (DP) model in this study uniformly employed the se_e2_a atomic environment descriptor [21,23,24]. Systematic hyperparameter optimization was performed, including exhaustive searches and multiple rounds of iterative training on the number of layers and nodes in both the embedding and fitting networks. This process ensured robust generalization across solid-state, liquid-state, and solid–liquid interface configurations in the Sn-Pb-Bi system. Upon convergence, the trained DP model was frozen and compressed to produce an efficient potential file directly compatible with LAMMPS [25].
To rigorously validate the accuracy and reliability of the DeePMD machine-learned interatomic potentials developed herein, a systematic quantitative analysis of prediction errors was conducted on both the training and validation sets for energy and force. Through simultaneous tracking of the loss curves of the training and validation sets, the model’s convergence, stability, and generalization performance were intuitively assessed, confirming that its predictive accuracy satisfied the stringent requirements for subsequent molecular dynamics simulations of the complex phase transformations in Sn-Pb-Bi ternary alloys.
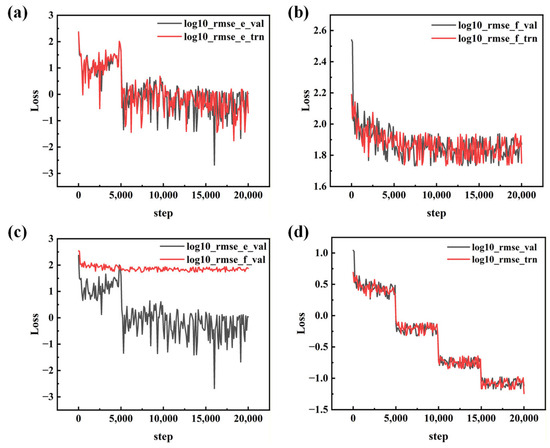
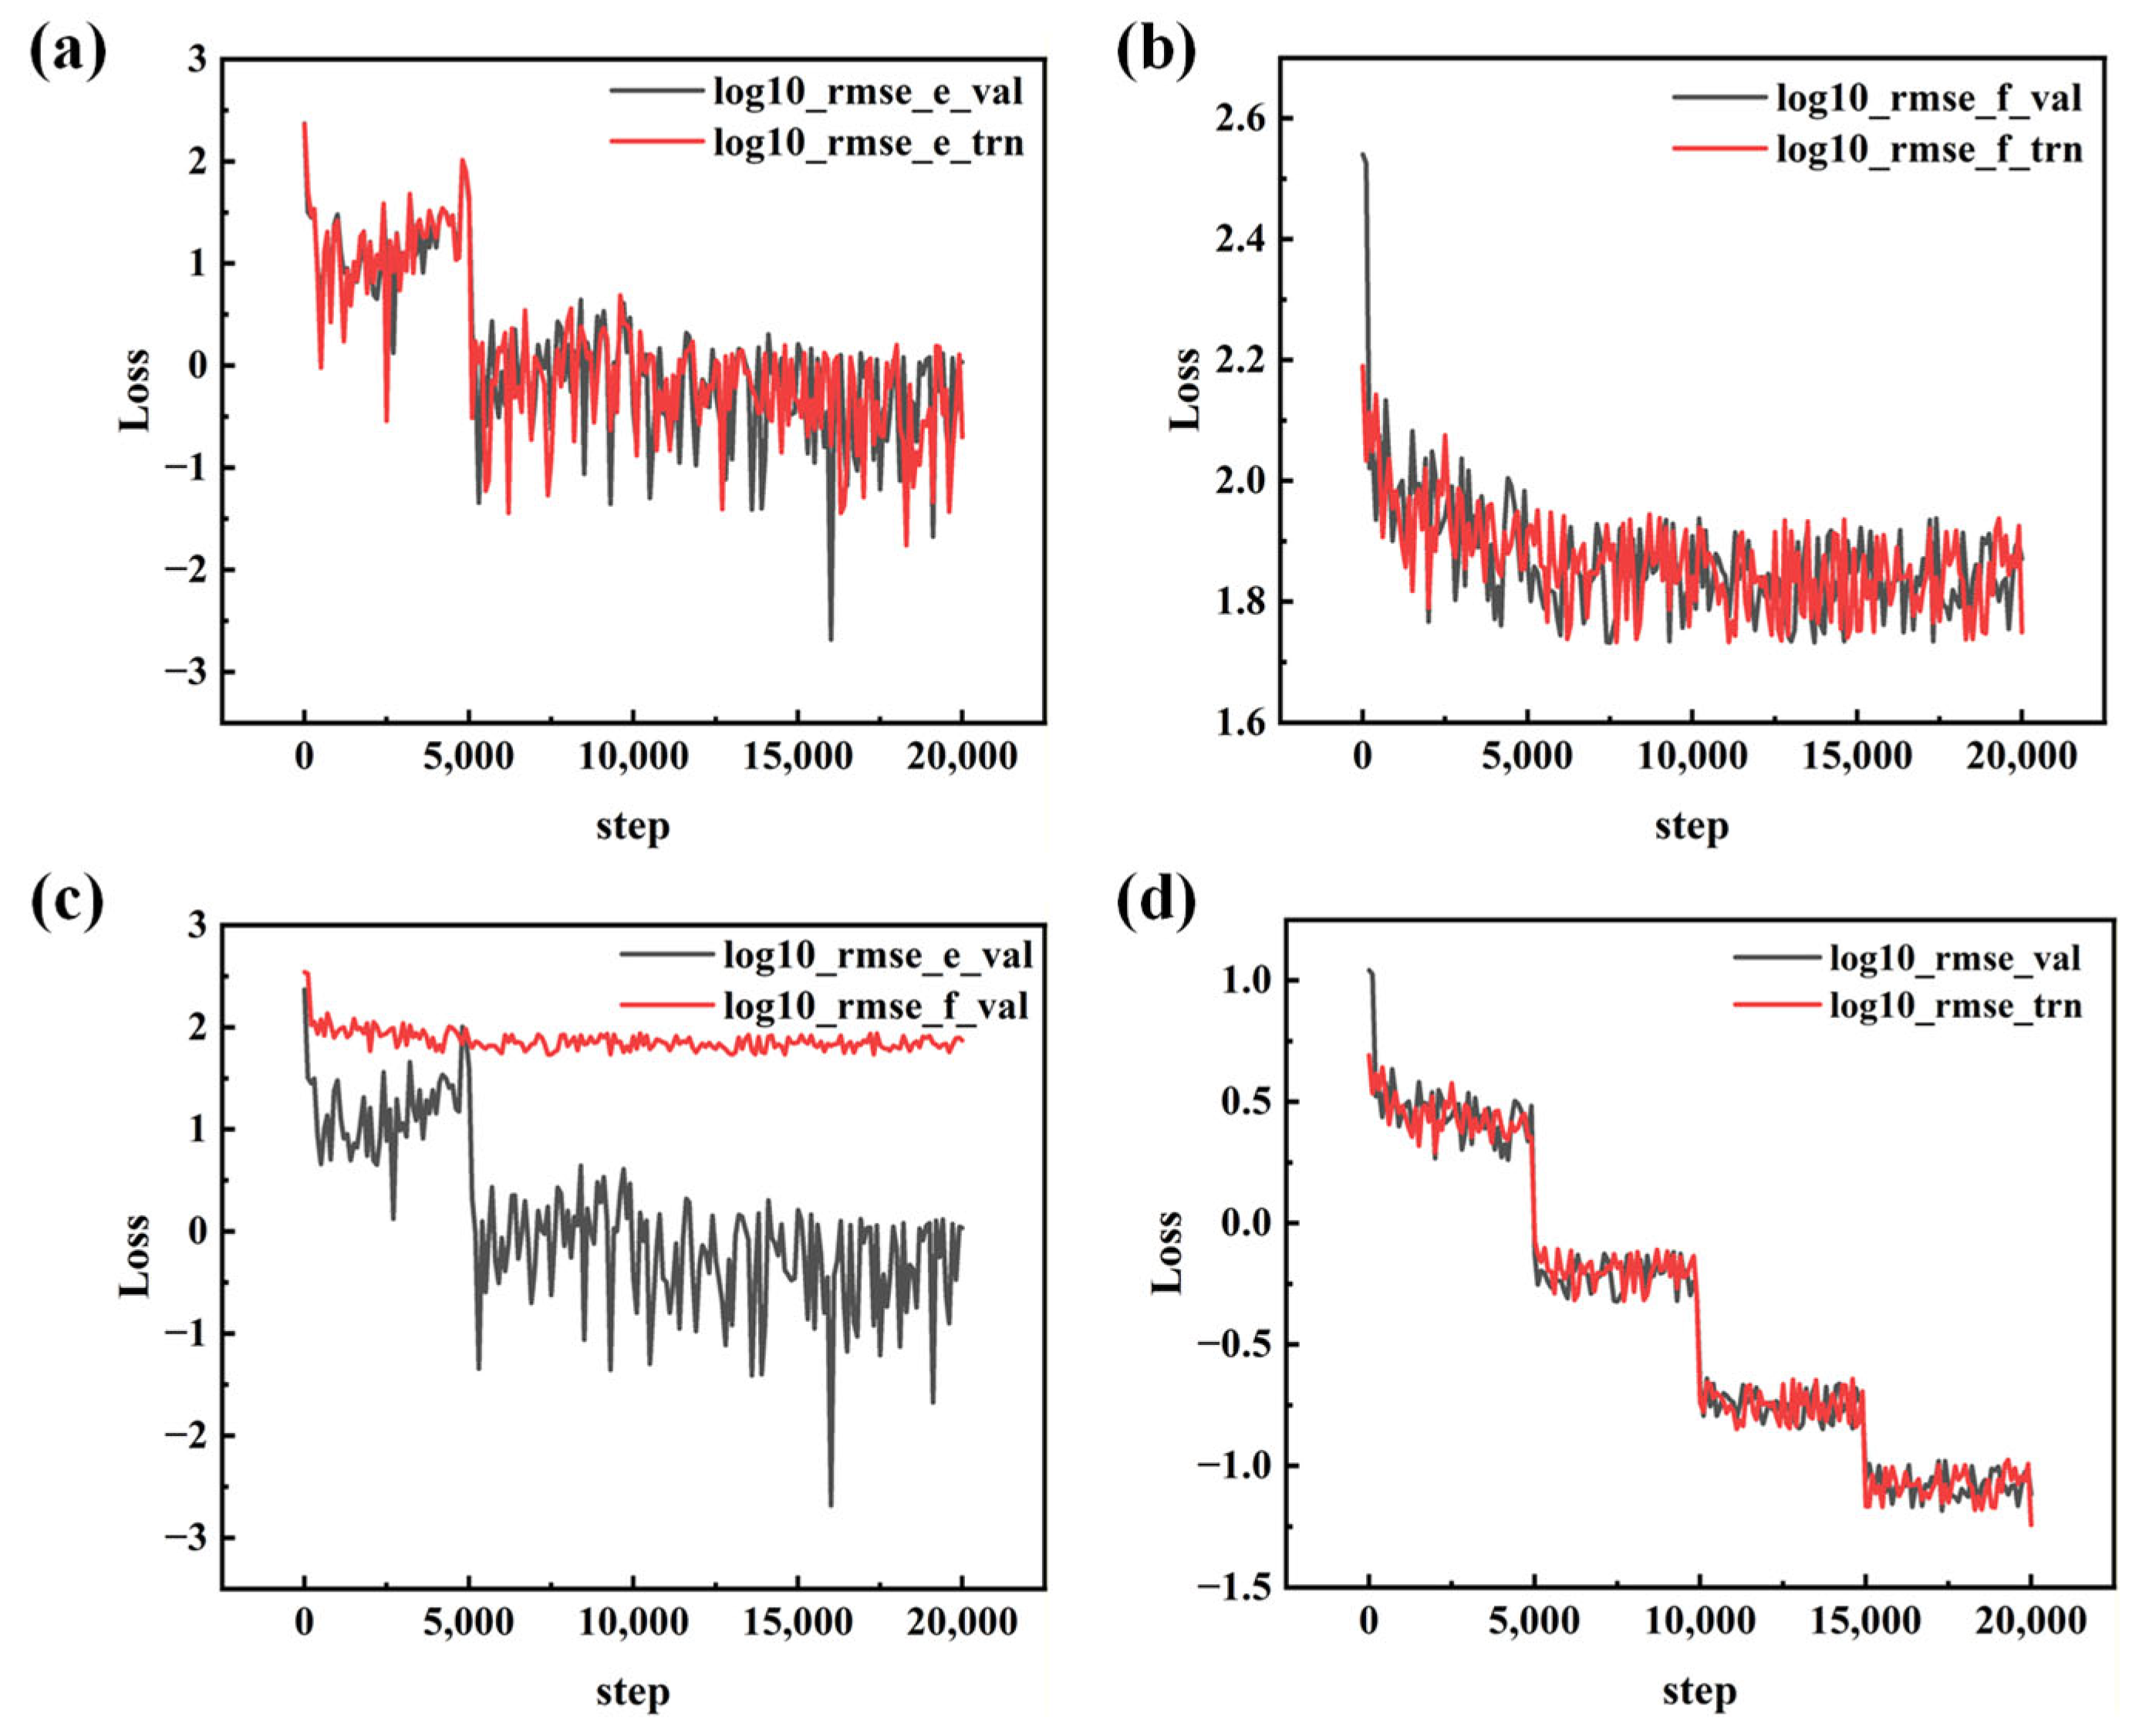
Figure 2a shows the evolution of the root-mean-square error (RMSE) for energy. In the early training stages, the energy RMSE decreases rapidly. After approximately 5000 steps, the training and validation curves converge closely and stabilize within the range of −1.0 to 0.0, ultimately reaching chemical precision on the order of 0.1–1 meV/atom. This accuracy level fully meets the standards of first-principles (DFT) calculations and is sufficient for detailed characterization of the potential energy surface during alloy melting and solidification [26,27]. It reliably captures Bi-induced local chemical environment variations and subtle differences in phase-transition enthalpies.
Figure 2.
Error analysis of machine learning-based atomic potential models: (a) energy error learning curve; (b) force error learning curve; (c) energy–force Pareto plot; (d) overall error learning curve.
Figure 2b presents the convergence of the force RMSE, which exhibits a steady decline and ultimately stabilizes in the range of 1.8–1.9 (corresponding to an atomic force prediction error of approximately 63–79 meV/Å). This error magnitude is well within the highly reliable range for multi-component metal alloys such as Sn-Pb-Bi. The model is therefore fully capable of accurately describing local compositional segregation, solid-solution strengthening effects, and atomic interactions at solid–liquid interfaces, thereby providing a solid mechanical foundation for simulating phase-interface dynamics, atomic diffusion pathways, and short-range order rearrangements.
A critical indicator of model quality is the consistently high agreement between the training and validation loss curves throughout the entire training process: the validation loss never significantly exceeded the training loss, with no evidence of divergence, oscillation, or overfitting. This behavior demonstrates that the constructed DeePMD model offers excellent generalization to unseen configurations, effectively eliminating the overfitting risks typical of conventional empirical potentials and ensuring stable predictive performance across diverse thermodynamic conditions, including solid, liquid, and solid–liquid coexistence states.
Figure 2c further confirms the steady downward trend and close alignment of the energy and force validation losses with the training-set curves, validating the effectiveness of the parameter optimization strategy. Figure 2d provides an overview of the total loss evolution during training: the total loss decreases smoothly and continuously from an initial value of approximately 1.0 to below −1.0, remaining stable with no significant fluctuations. This smooth convergence indicates that the combined use of the Adam optimizer and the learning-rate decay strategy is both efficient and robust.
After approximately 20,000 training steps, all key error metrics of the DeePMD model converged within the preset thresholds (energy error < 5 meV/atom, force error < 100 meV/Å), fully satisfying the high-precision requirements established for this study. The comprehensive error validation analysis presented above demonstrates that the developed DeePMD potential is not only highly accurate within the training domain but also exhibits excellent transferability and physical fidelity. This provides a robust and reliable force-field foundation for subsequent heating–cooling cycle simulations across varying Bi/Pb mass fraction ratios, as well as for the calculation of diffusion coefficients and viscosities and detailed analysis of microstructural evolution.
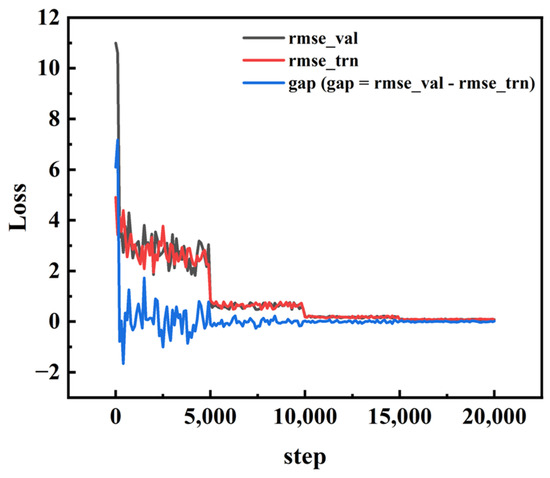
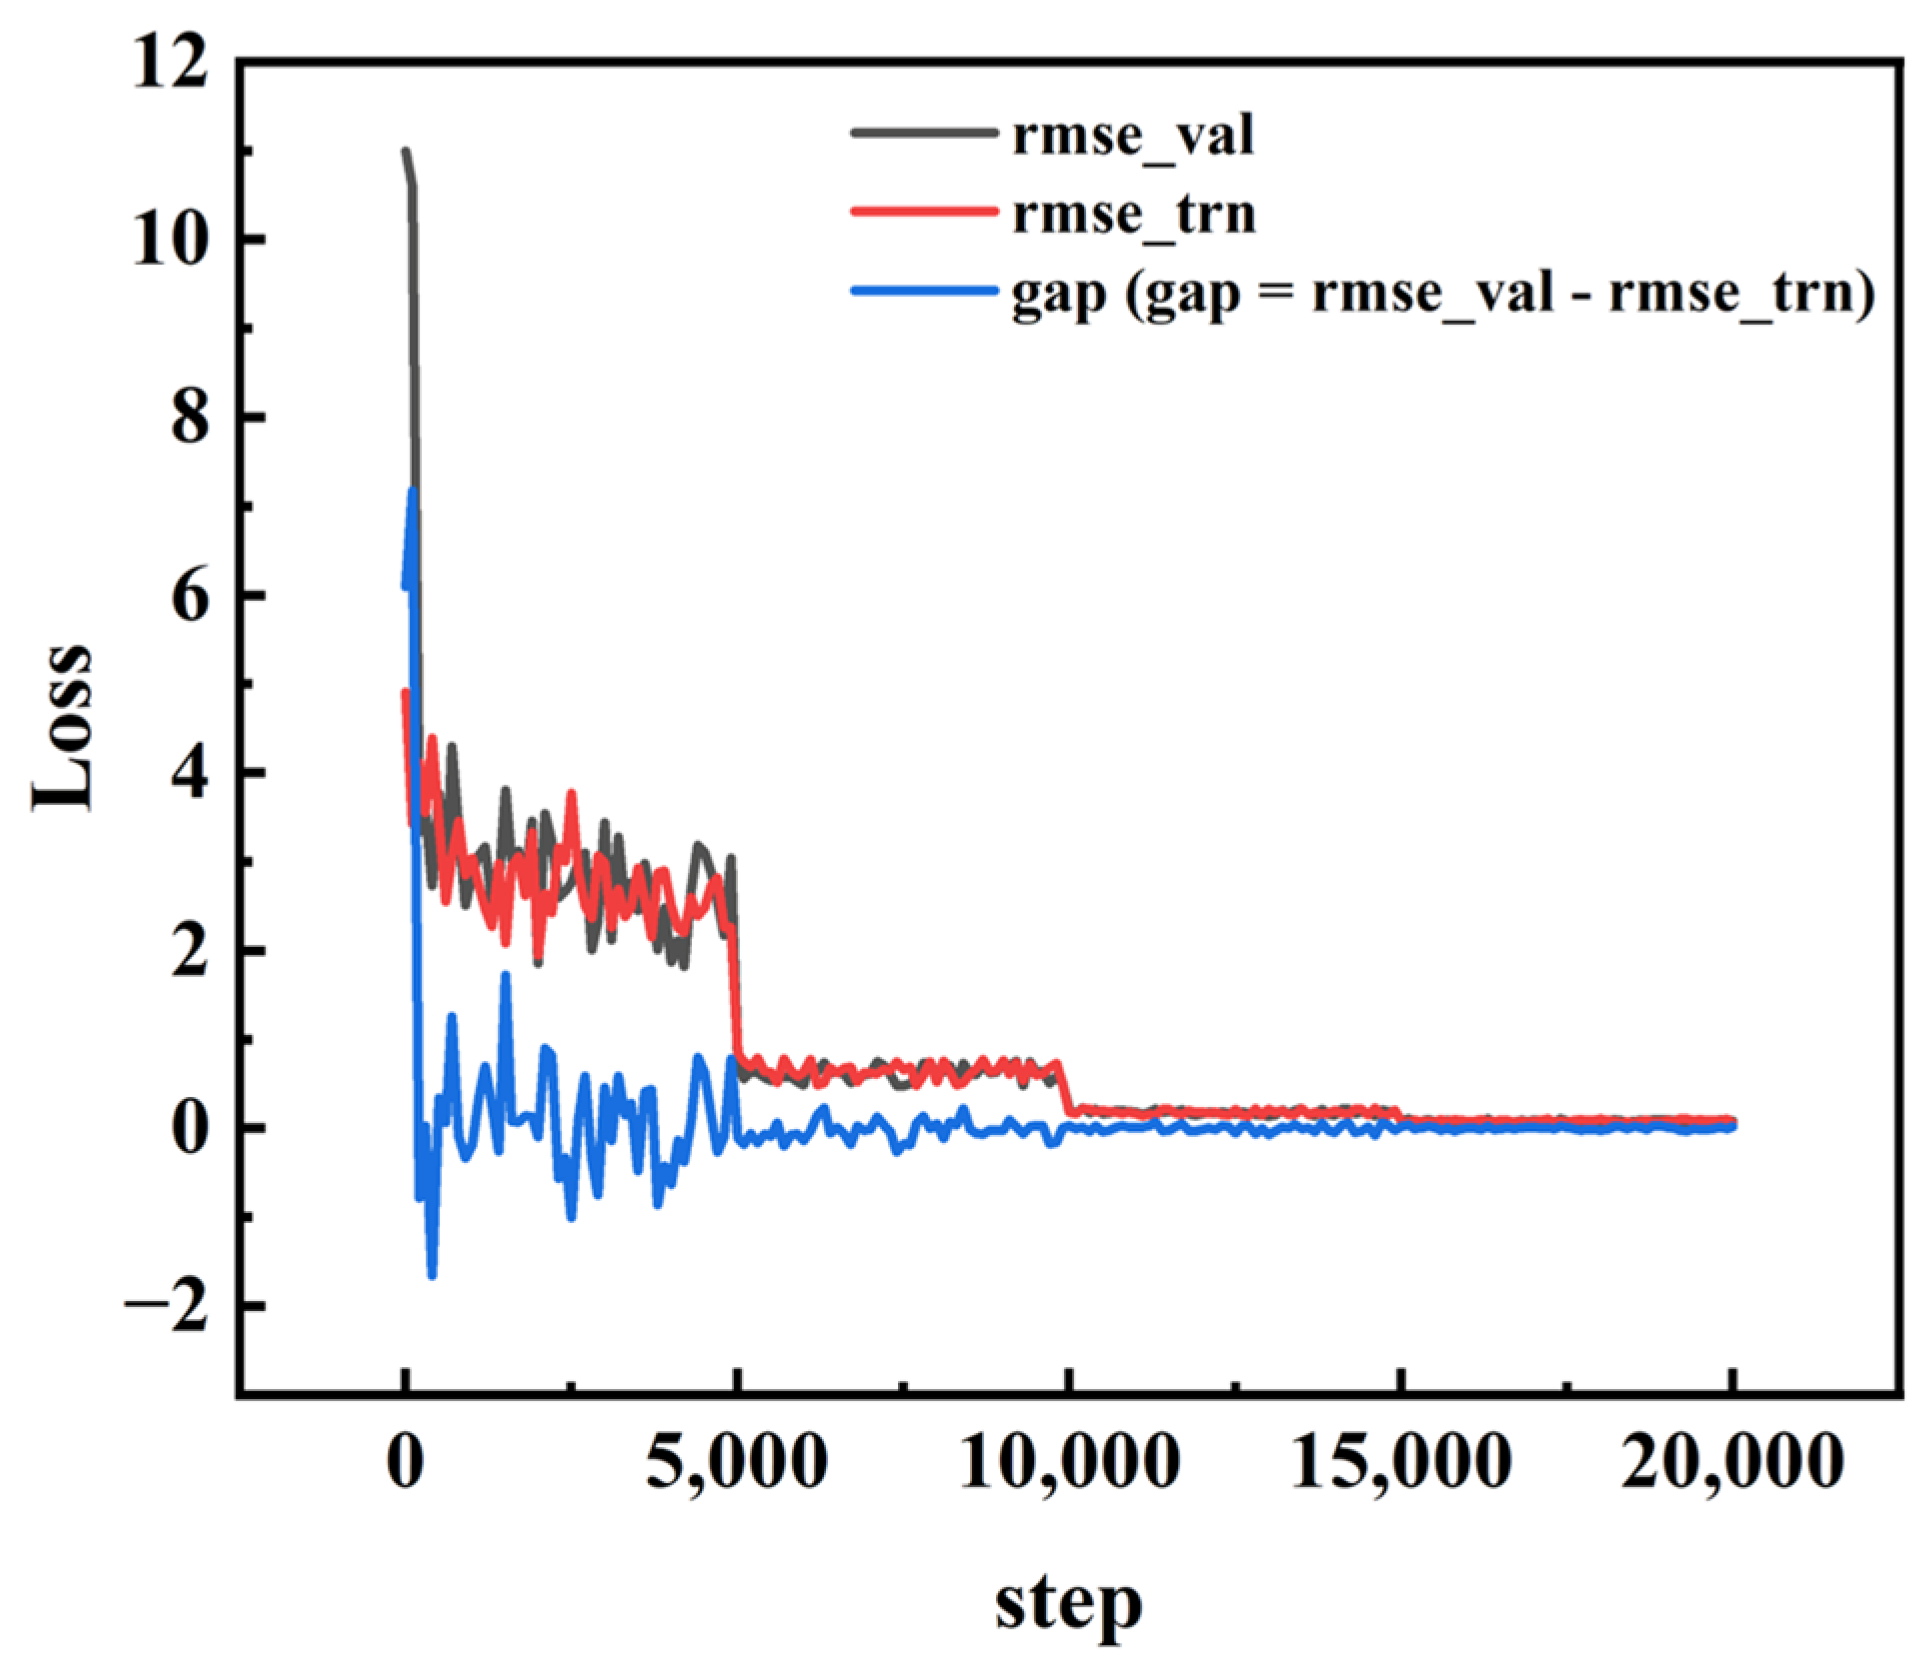
To comprehensively assess the overfitting risk and generalization performance of the DeePMD machine-learned interatomic potential, a multi-dimensional overfitting evaluation plot was generated, as shown in Figure 3. This figure systematically tracks the model’s dynamic behavior over a complete training cycle of 600,000 steps, analyzing training loss, validation loss, the difference (gap) between training and validation losses, and the root-mean-square errors (RMSEs) for both sets.
Figure 3.
Overfitting metrics for machine learning atomic potential models.
Overall, both the training and validation loss curves exhibit a rapid initial decline from extremely high starting values—far above the subsequent plateau levels. This behavior indicates that, beginning with random weight initialization, the model quickly learns the effective mapping between atomic environment descriptors and the corresponding energies/forces in the Sn-Pb-Bi ternary alloy system. At this early stage, the gap value shows a pronounced positive peak, a well-known phenomenon in deep learning referred to as “early generalization delay”. This peak arises primarily from temporarily higher prediction errors on the validation configurations before the model fully captures the complex many-body interactions, rather than from actual overfitting. As training advances, both loss curves display distinct step-like decreases, followed by a smooth transition into a stable plateau phase. Concurrently, the gap value decreases rapidly and fluctuates only slightly around zero. This convergence pattern clearly confirms that the errors for the training and validation sets decrease synchronously, establishing and stabilizing the model’s strong generalization capability.
As training entered its final stages, the training RMSE (rmse_trn) and validation RMSE (rmse_val) curves converged and nearly overlapped completely, with the gap value stabilizing within an extremely narrow range around zero (typical fluctuation amplitude < 0.01). The final loss reached a remarkably low level, and, across the entire process, we observed no abnormal increases in validation loss, significant divergence from the training loss, or late-stage oscillations. This ideal loss evolution pattern demonstrates that the developed DeePMD potential achieves efficient and stable convergence in the complex Sn-Pb-Bi alloy system while eliminating the risk of overfitting. The model exhibits excellent transferability and strong generalization to unseen configurations, thereby providing a highly reliable description of interatomic interactions for subsequent large-scale molecular dynamics simulations. This ensures the physical authenticity and scientific credibility of results in relation to melting and solidification phase transitions, diffusion behavior, and microstructural evolution.
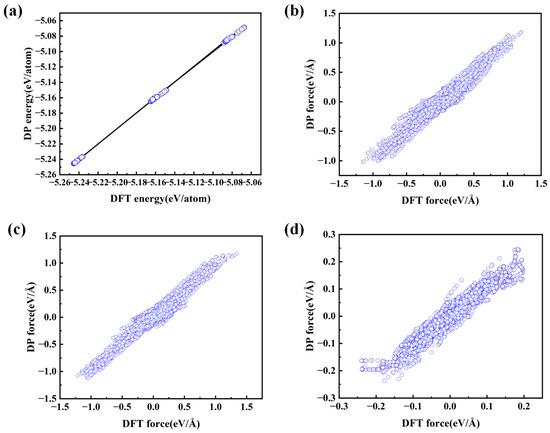
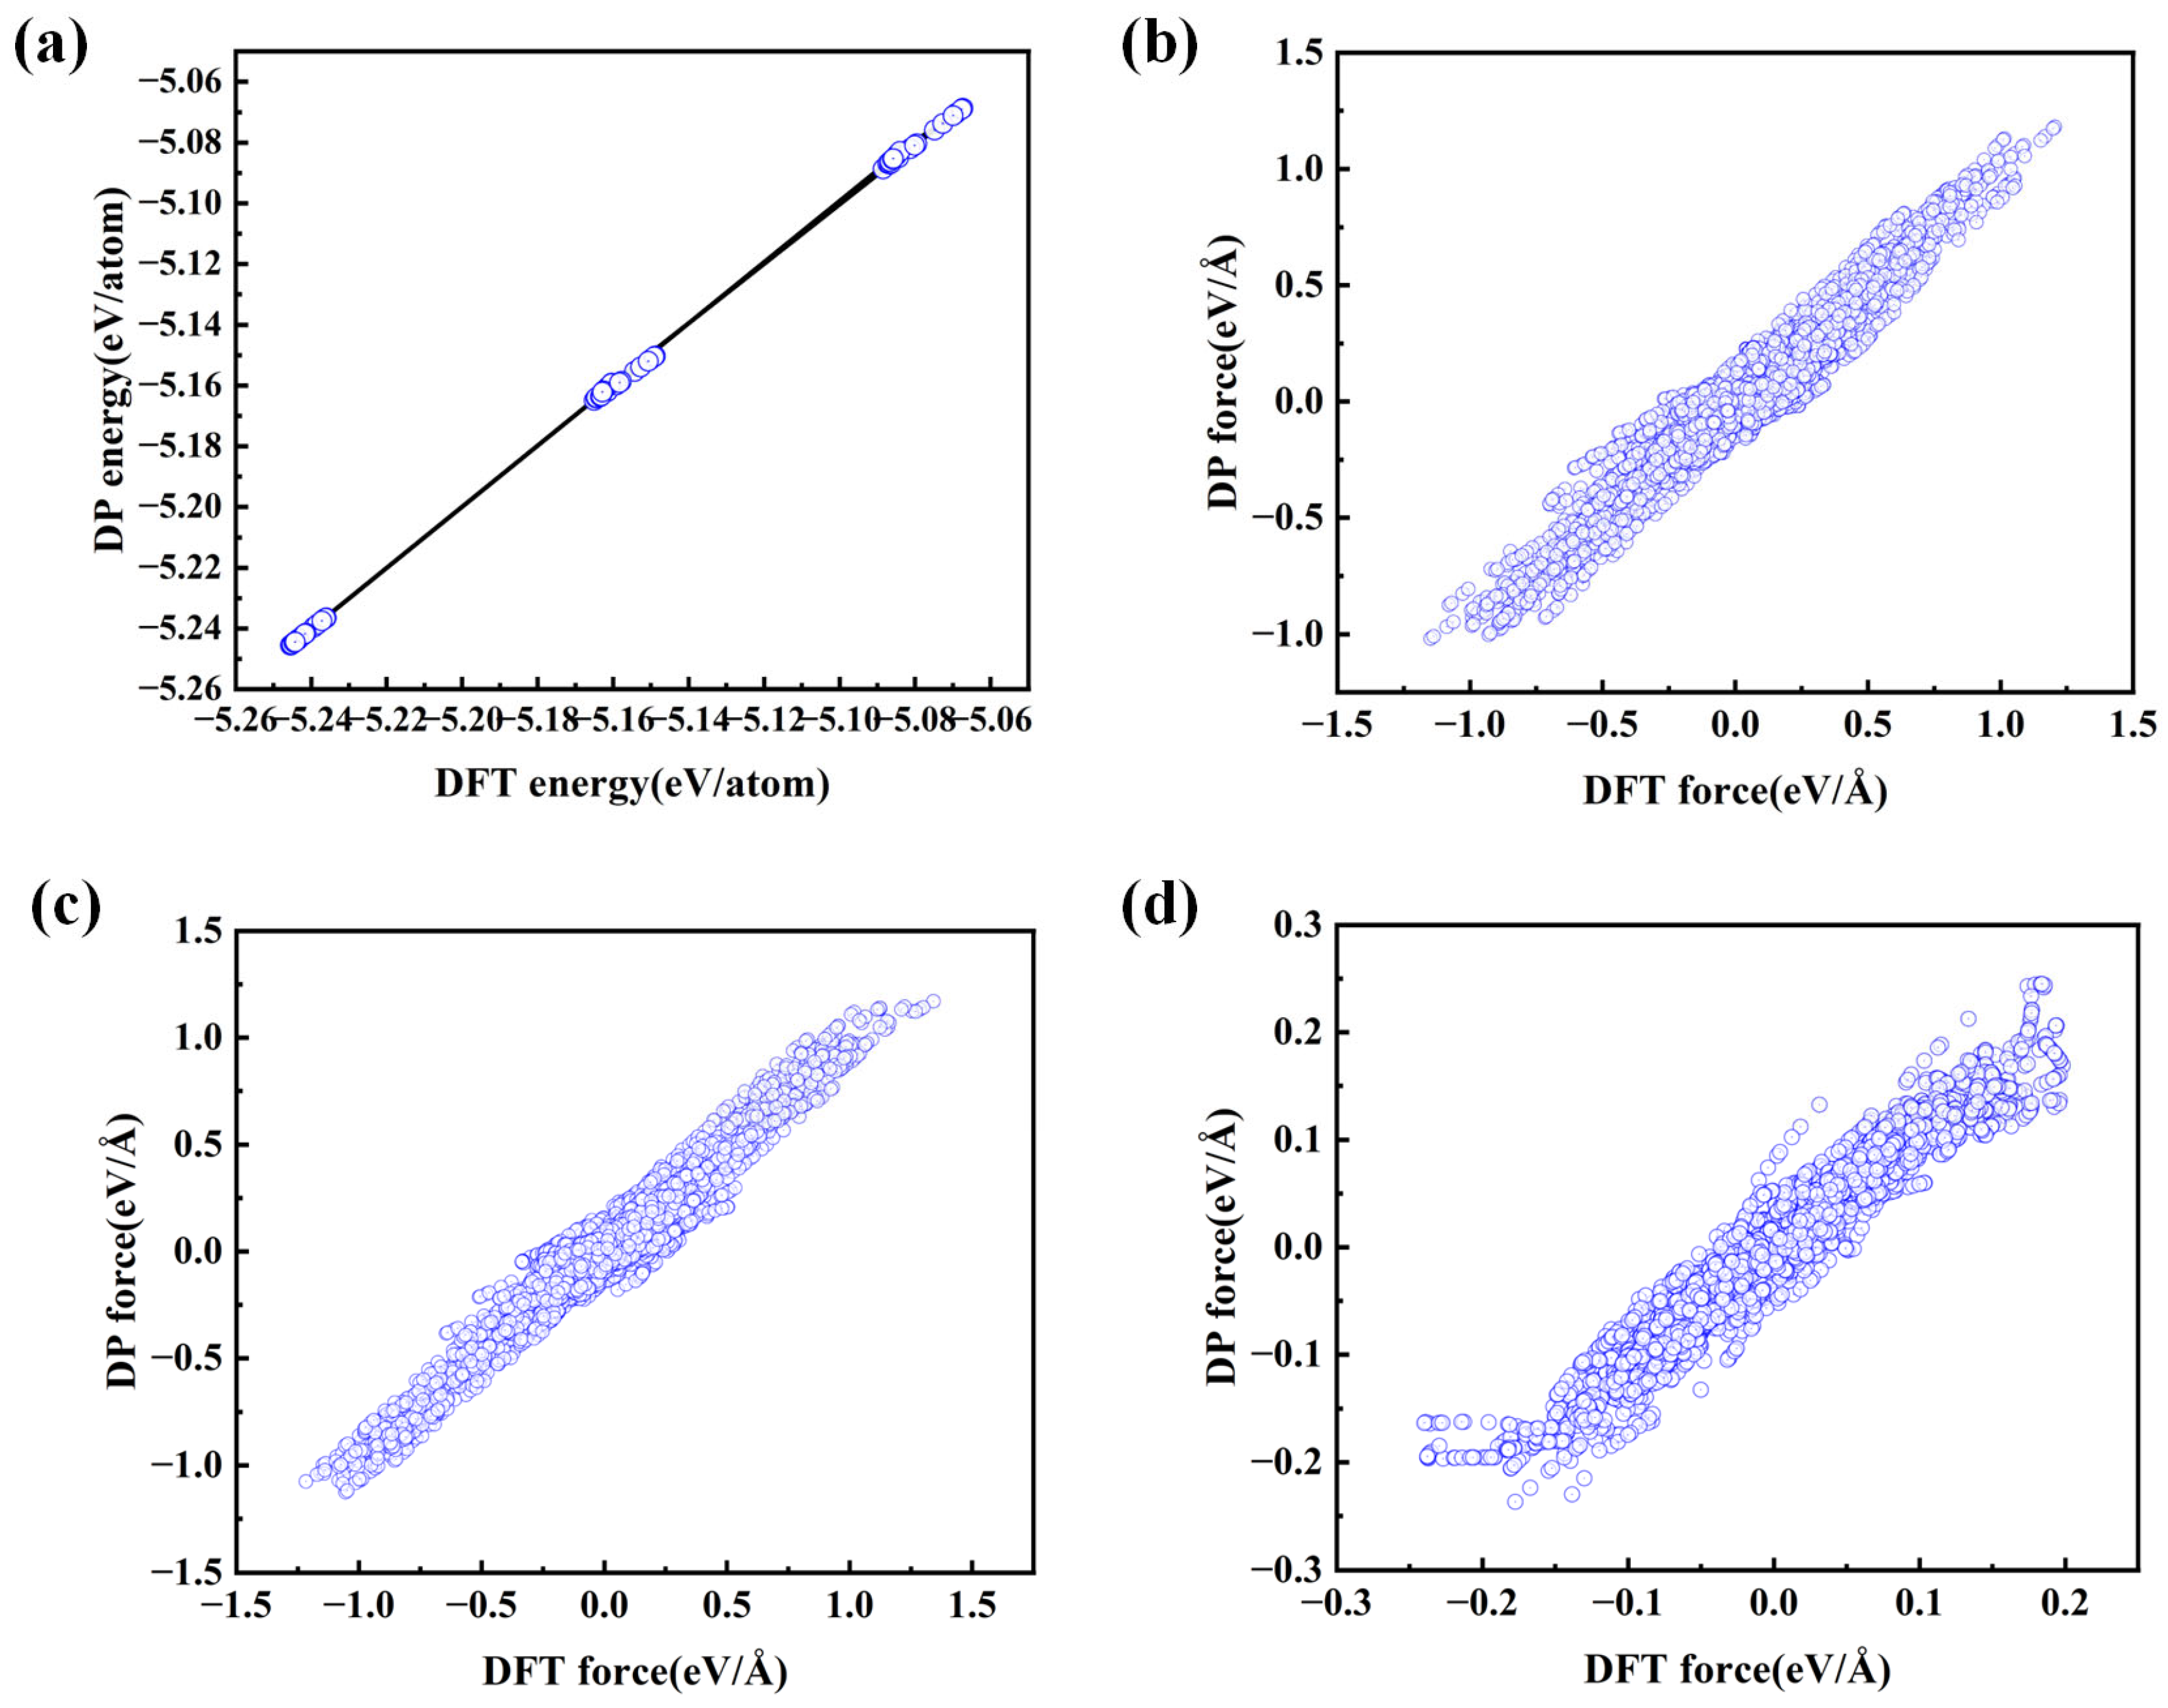
To further validate the accuracy and reliability of the DeePMD machine-learned interatomic potential (DP model) developed for the Sn-Pb-Bi ternary alloy system, direct comparisons were performed against DFT reference calculations for both energy and force. Figure 4a shows that the atomic energies predicted by the DP model exhibit excellent linear correlation with the DFT values, with nearly all data points lying tightly along the diagonal line. Combined with the error statistics in Table 1, the overall energy mean absolute error (MAE) is approximately 0.0572 eV, and the root-mean-square error (RMSE) is approximately 0.0714 eV, corresponding to a per-atom energy error of E_MAE/atom ≈ 0.572 meV/atom. For selected subsets of the dataset, the energy RMSE drops as low as 0.0188 eV, indicating that the model reaches or approaches chemical accuracy (~1 meV/atom) for representative configurations. Figure 4b–d present scatter plots of the force components along the x, y, and z directions, respectively. The DP-predicted forces show high consistency with the DFT references, with data points symmetrically distributed around the diagonal and no evident systematic bias or directional deviation. The overall force MAE is ≈0.0490 eV/Å, and the RMSE is ≈0.0696 eV/Å (corresponding to an error range of approximately 49–70 meV/Å). These accuracy levels are considered high for multi-component metal alloys, especially ternary systems containing heavy elements such as Pb and Bi, and are fully capable of capturing local atomic environment changes, segregation tendencies, mechanical responses at solid–liquid interfaces, and subtle force perturbations during diffusion.
Figure 4.
Energy and forces calculated using the DP model and DFT: (a) energy; (b) fx; (c) fy; (d) fz.
Table 1.
Error Statistics for the machine learning atomic potential model validation set.
The virial errors reported in Table 1 (V_MAE ≈ 307.9–311.2 eV and V_RMSE ≈ 639–658 eV) appear relatively large. However, because the virial tensor is a higher-order, system-wide quantity related to volume and pressure (with units representing the cumulative contribution of the entire supercell), these errors can be effectively mitigated in practical NPT ensemble simulations through long-time averaging or ensemble statistics. Consequently, they do not significantly impact the prediction of key thermodynamic properties such as melting point, volumetric thermal expansion coefficient, or thermal expansion behavior.
2.3. DPMD Simulation
The alloy model was constructed based on a body-centered cubic (BCC) initial configuration. The system consists of 12,000 atoms and is placed within a cubic periodic simulation box with an edge length of approximately 74.92 Å (volume of approximately 4.205 × 10⁵ Å3, atomic density of approximately 0.0285 atoms/Å3). Based on the specified Bi/Pb mass fraction ratio, the atomic fractions corresponding to each component were first determined. Subsequently, Pb or Bi atoms were randomly substituted at Sn lattice sites to ensure the uniform distribution of the components. The conjugate gradient method was employed for energy minimization to eliminate an initial high-energy configuration. The simulation utilized three-dimensional periodic boundary conditions (PBCs), effectively eliminating surface effects and enabling an accurate description of bulk properties.
The phase-transition simulation employs a complete “solid–liquid–solid” heating–cooling cycle: a 50 ps relaxation period at 300 K under the NPT ensemble (Nosé–Hoover thermal bath τ_T = 0.1 ps, Parrinello–Rahman pressure bath τ_P = 1.0 ps, pressure 0 MPa) [28]. Heating was carried out from 300 K to 600 K at a rate of 1 K/ps, followed by a 100 ps isothermal hold at 600 K using the NPT ensemble to obtain the equilibrium liquid configuration. Subsequently, the system was cooled to 300 K at a rate of 1 K/ps and relaxed again for 50 ps at 300 K using the NPT ensemble. The NPT ensemble is used to capture volume and density changes during the melting/solidification process, while the NVT ensemble is used to calculate statistical properties of the liquid structure and dynamics during the operational phase (radial distribution function RDF, mean square displacement MSD, self-diffusion coefficient, and viscosity) [29]. All simulations are driven by the DeePMD potential, with time steps calculated using the Verlet integration algorithm. Post-processing involves plotting potential energy–temperature, volume–temperature, and density–temperature curves to determine the melting temperature Tm and solidification temperature Ts. The radial distribution function (RDF) is a key parameter for characterizing the microstructural order and lattice distortion effects in a material system [30]; by quantifying the probability distribution of interparticle distances, it sensitively reflects structural features at the atomic scale. As the core of spatial correlation functions, the RDF is defined as the ratio of the probability density of finding another particle within a unit volume at a distance r from a given particle to the corresponding probability density in an ideal homogeneous system. Its formula is
Here, rmax and rmin denote the maximum and minimum radii of the integration interval, respectively; NAB(r) represents the number of class B atoms within the shell ranging from the minimum radius rmin to the maximum radius rmax; and ρB denotes the number density of class B atoms in the system. The mean square displacement (MSD) and the self-diffusion coefficient (D) characterize the mobility of the atoms, and D can be derived from MSD using the Einstein equation [31,32,33]. The formulas for these two quantities are as follows:
where r(t) is the position of the atom at time t. The viscosity is estimated using the Stokes–Einstein relation, which is given by
Here, D is the self-diffusion coefficient, which is typically calculated from the slope of the long-term linear region of the mean displacement curve; its units are usually Å2/ps; kB is the Boltzmann constant; T is the absolute temperature, with unit K; r is the effective hydrodynamic radius, representing the equivalent radius of motion of an atom in the melt; and 6π corresponds to the stick boundary condition [34,35].
It should be noted that the present simulations employ an idealized homogeneous solid-solution model based on a periodic BCC supercell. Such a simplified atomic configuration is intended to isolate and systematically investigate the intrinsic influence of the Bi/Pb ratio on phase transformation thermodynamics and atomic-scale transport behavior. Consequently, the simulation results should be interpreted primarily as atomistic insights into compositional effects and relative phase-transition trends.
Through the modeling and computational workflow described above, we obtained reliable data on the phase transformation characteristics and atomic-scale kinetic behavior of the alloy at different Bi/Pb ratios, providing an accurate microscopic foundation for subsequent mechanistic analysis. In this study, by determining the melting temperature Tm and solidification temperature Ts from the curves of potential energy, volume, and density as a function of temperature and combining these with microstructural and kinetic parameters such as RDF, MSD, self-diffusion coefficients, and viscosity, we reveal, at the atomic scale, the influence of Bi content on the alloy’s short-range order, diffusion behavior, viscous properties, and phase-transition hysteresis phenomena.
3. Results
In this study, to systematically elucidate the regulatory mechanisms underlying the phase-transition behavior and atomic-scale microstructural evolution of Sn-Pb-Bi ternary alloys as a function of Bi/Pb mass ratio, we employed DeePMD-based machine learning-driven large-scale molecular dynamics simulations to perform complete solid–liquid–solid heating–cooling cycle simulations for four representative compositions with Bi/Pb mass ratios of 0, 0.14, 0.33, and 0.60. These cycles faithfully replicate the full thermal history experienced by photovoltaic solder strips during actual soldering processes—including heating and melting, isothermal liquid holding, and cooling and solidification. The simulations capture the entire phase transformation pathway from the initial crystalline state through complete melting to the final solidified solder–joint microstructure, thereby establishing a high-precision, fully reproducible computational framework for quantifying the effects of Bi doping on melting temperature, solidification undercooling, dynamic phase-interface evolution, and atomic-scale microstructural stability.
The following sections provide a detailed analysis and discussion across three key aspects: the melting process, the solidification process, and the influence of alloy composition on atomic structure and kinetic behavior. Firstly, we examine the potential–temperature, volume–temperature, and density–temperature response curves during melting at different Bi/Pb ratios, integrating these with radial distribution function (RDF) analyses to uncover the microscopic mechanisms responsible for melting-point depression, disruption of short-range order, and enhanced liquid fluidity with increasing Bi content. Secondly, we analyze the degree of undercooling during the cooling and solidification stages to clarify how the Bi/Pb ratio modulates phase-transition hysteresis, microstructural refinement, and grain boundary segregation. Finally, we systematically compare atomic diffusion coefficients, self-diffusion dynamics, viscosity evolution, and local compositional segregation across the four compositions throughout the entire melting–solidification cycle. These comparisons quantitatively reveal the composition-dependent kinetic laws and structure–property relationships, offering a robust atomic-scale theoretical foundation for optimizing the formulation of Sn-Pb-Bi low-melting-point solders, designing low-temperature brazing processes, and enhancing solder–joint reliability.
3.1. Analysis of the Melting Process
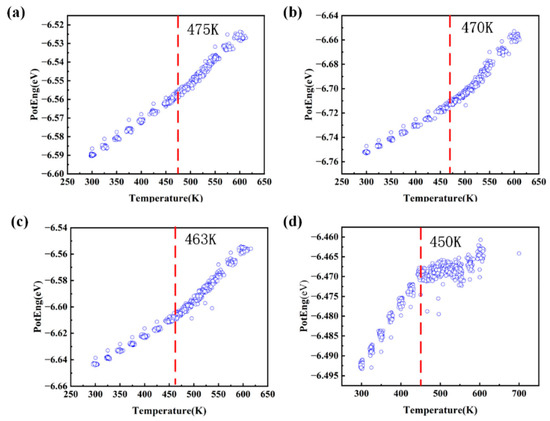
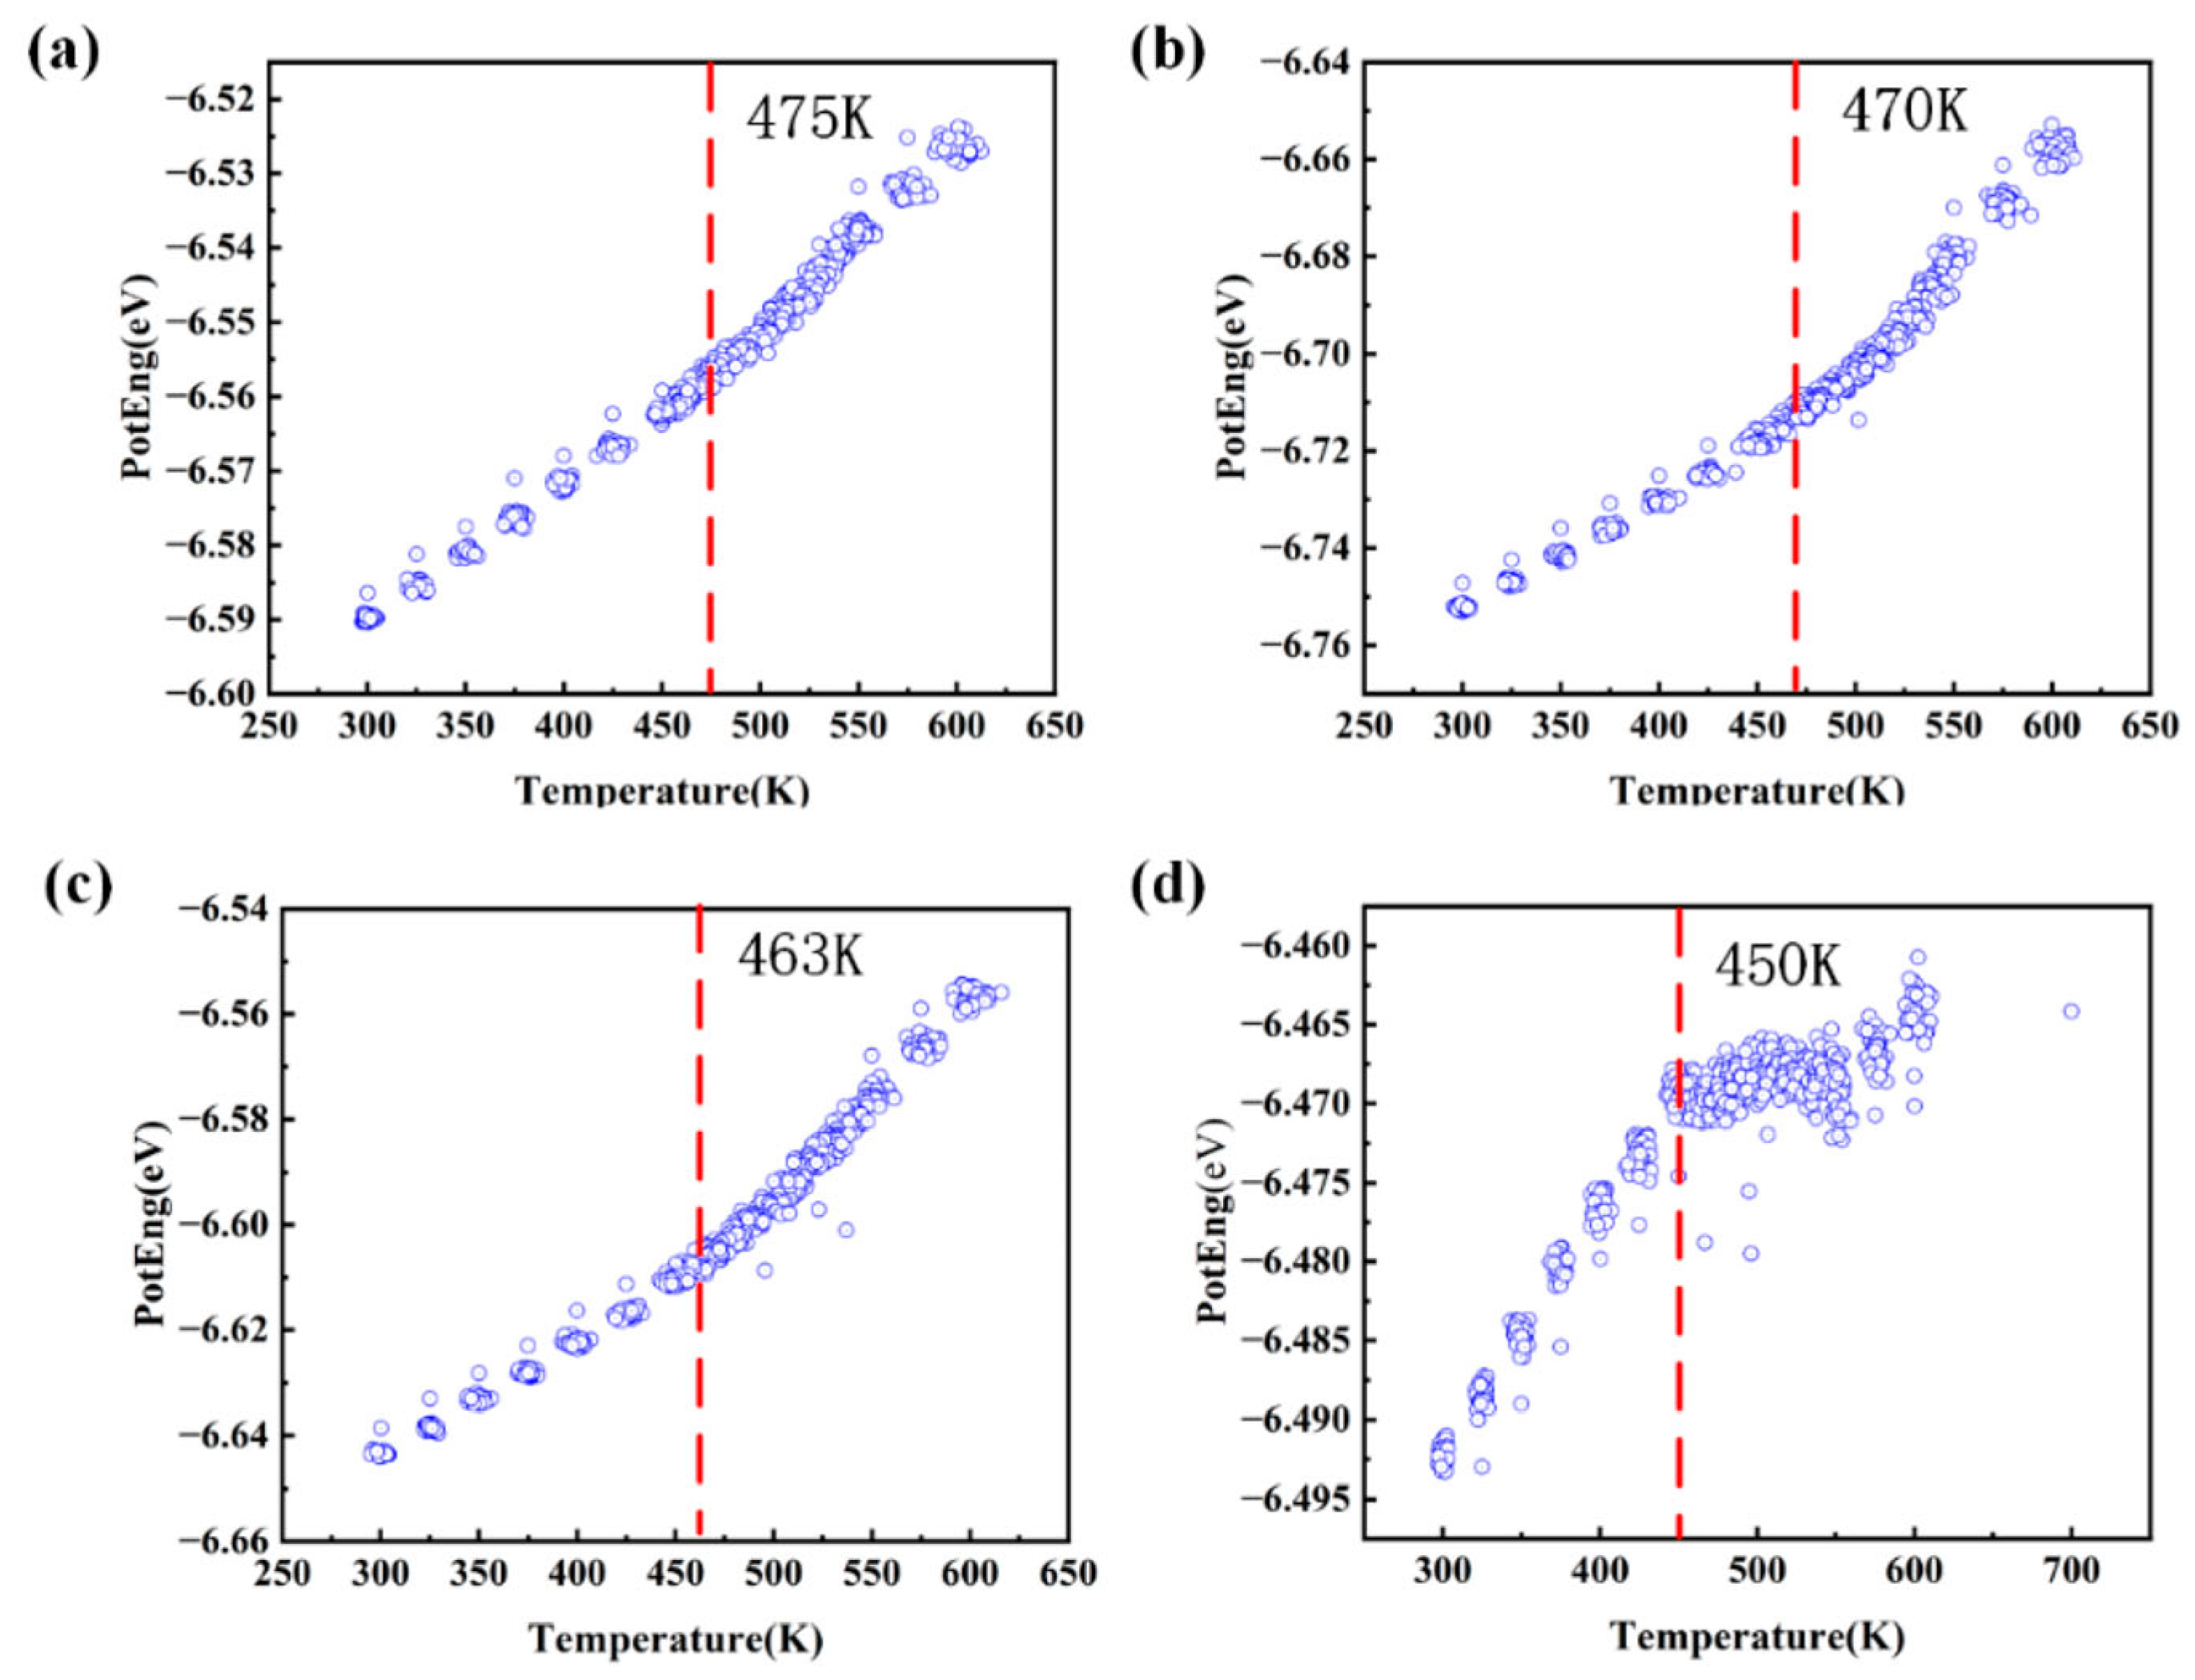
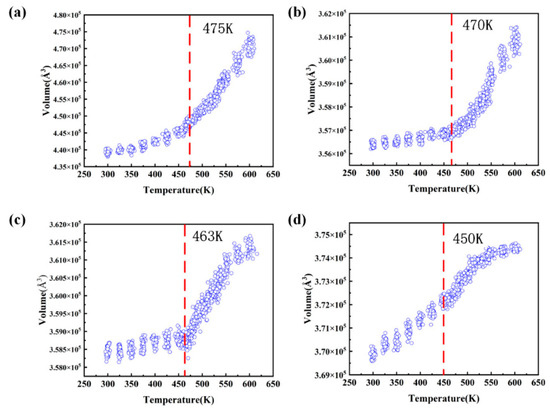
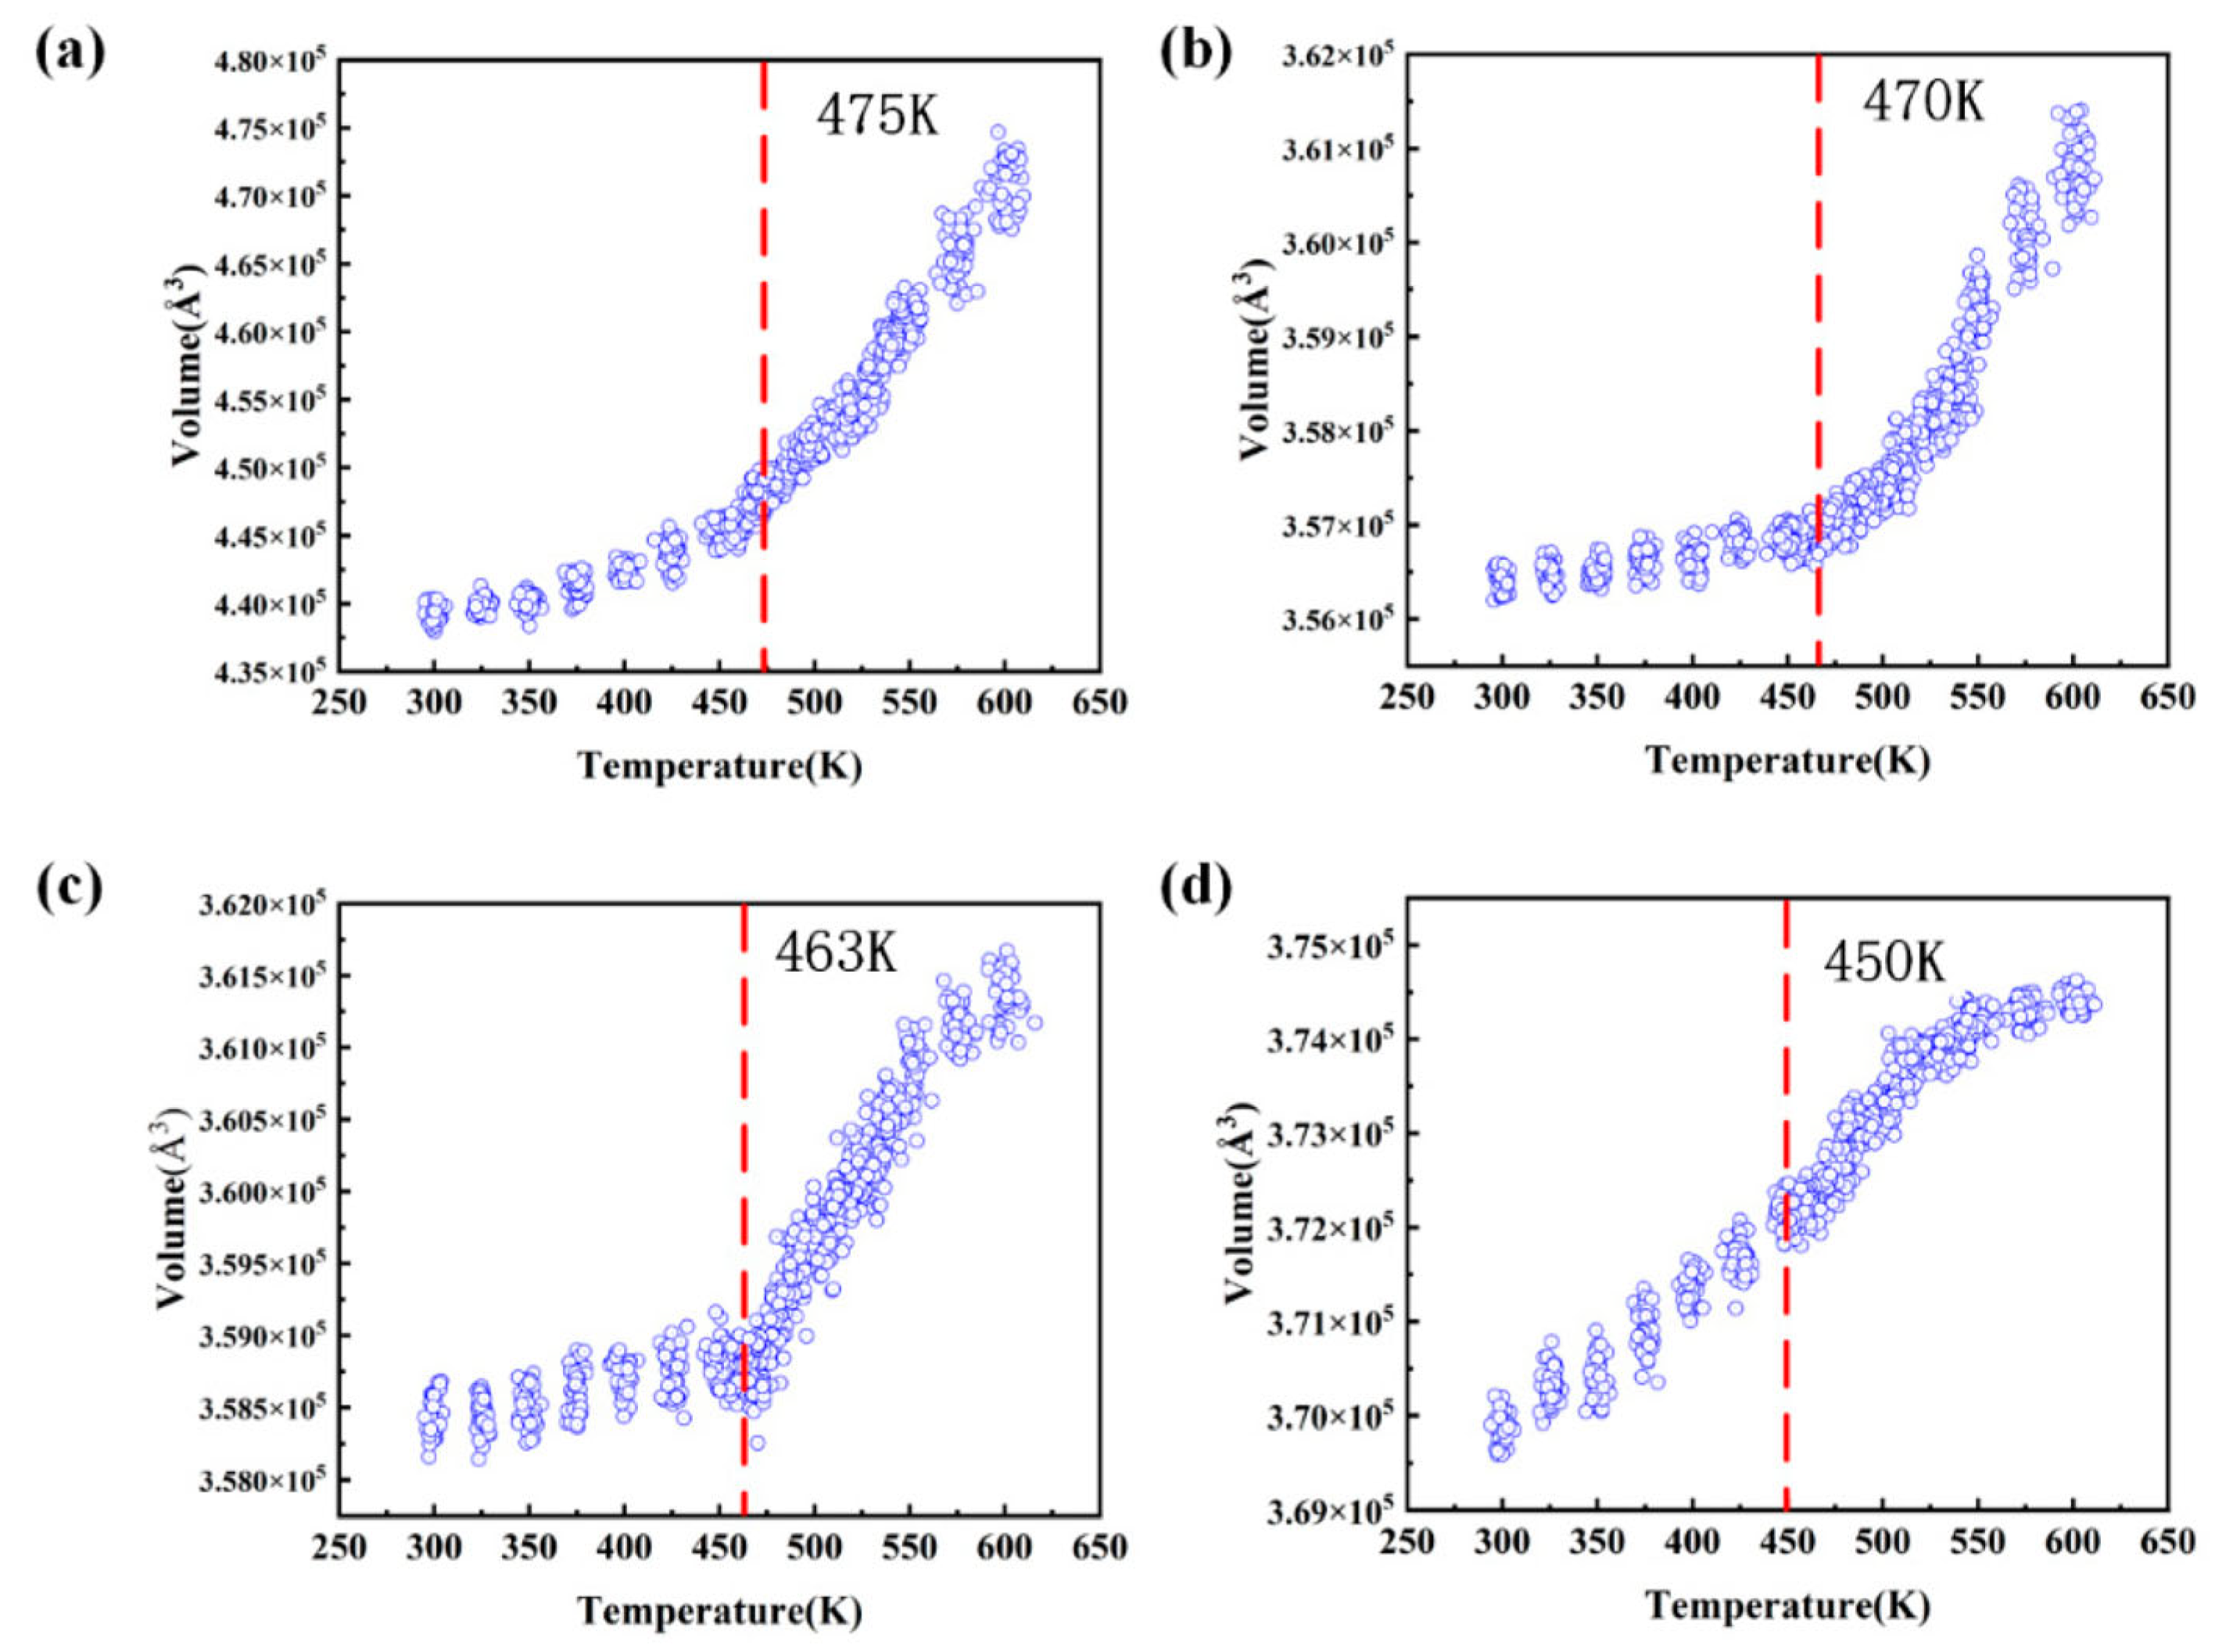
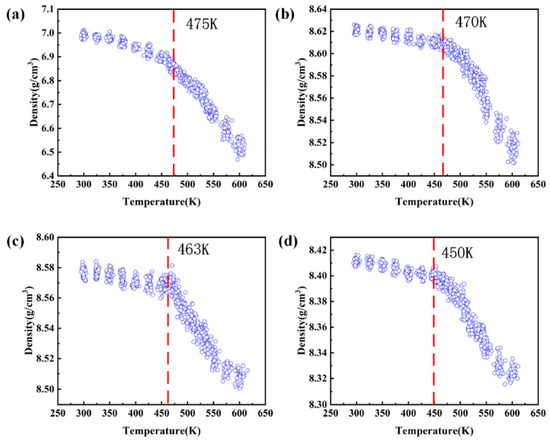
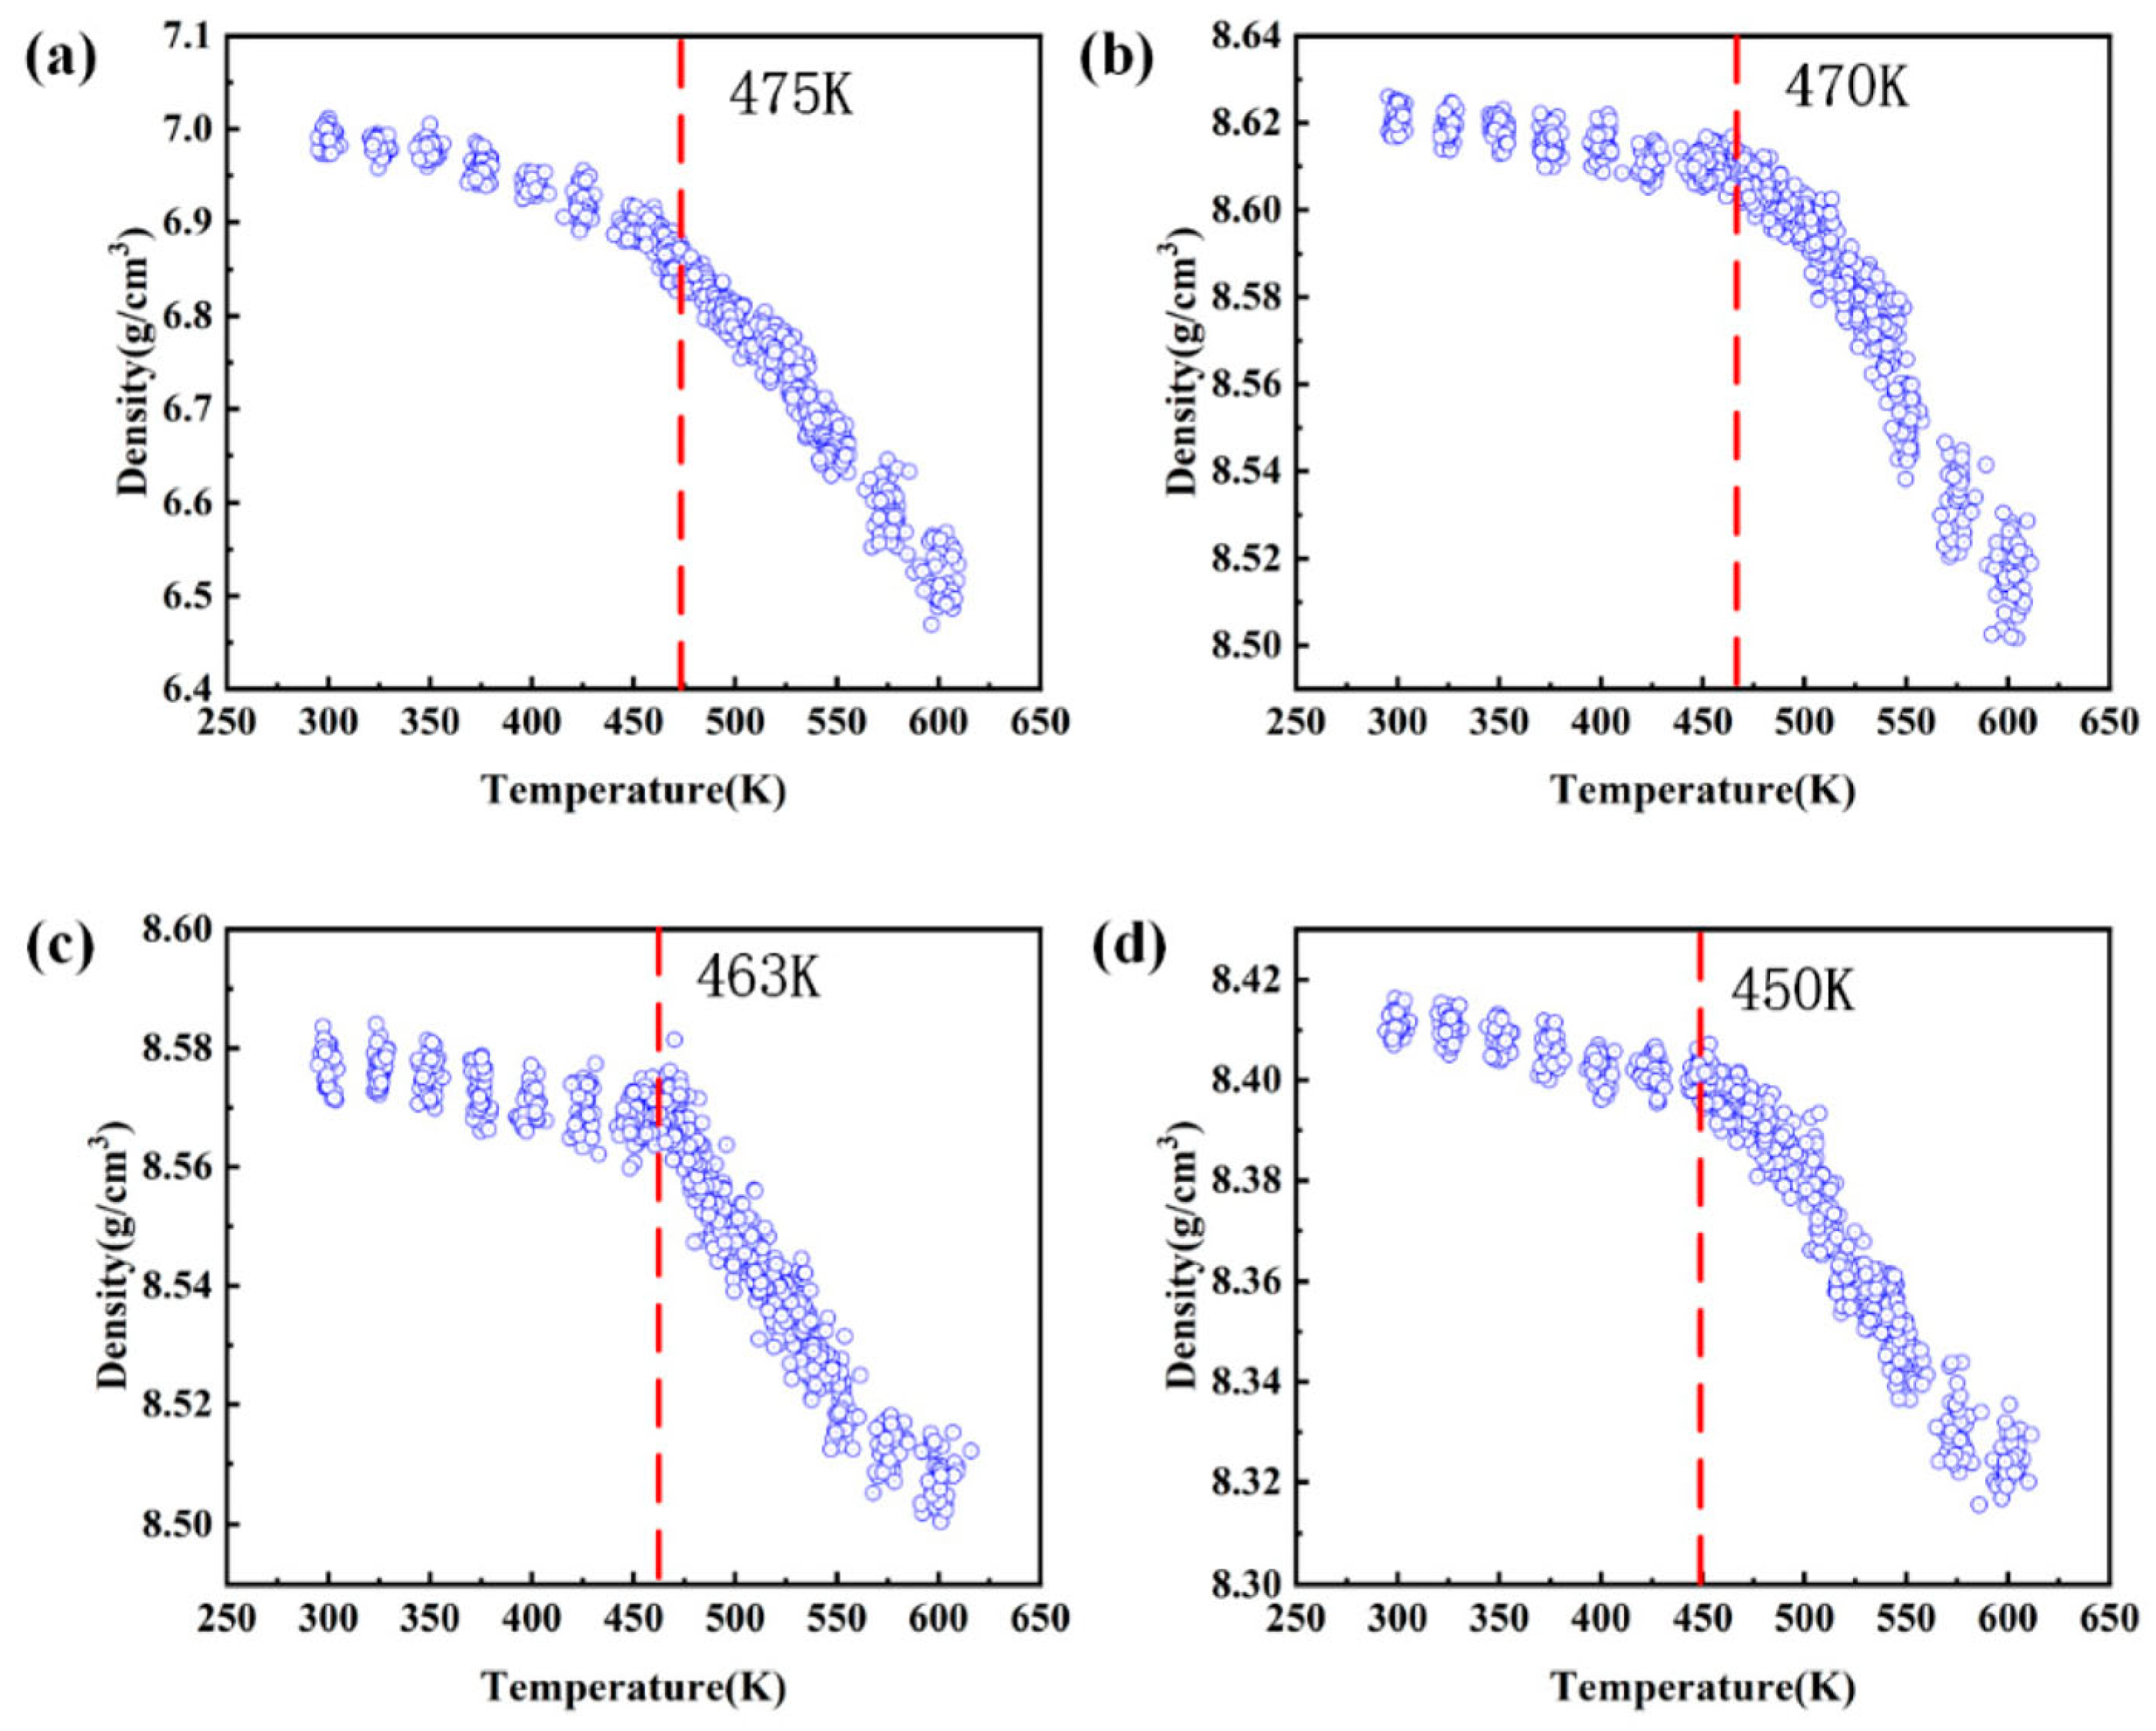
Figure 5, Figure 6 and Figure 7 present the temperature-dependent evolution of potential energy, volume, and density for Sn-Pb-Bi ternary alloys with four representative compositions (Bi/Pb mass ratios of 0, 0.14, 0.33, and 0.60) during continuous heating. These curves, obtained from large-scale molecular dynamics simulations based on DeePMD, clearly delineate the complete phase-transition behavior from solid to liquid. In the low-temperature solid regime, both potential energy and volume increase gradually and approximately linearly with temperature, while the density correspondingly decreases. As the temperature approaches the melting point, all three curves exhibit pronounced discontinuities: the potential energy increases sharply, the volume shows a step-like expansion, and the density drops abruptly, collectively signaling the onset of the solid–liquid phase transition.
Figure 5.
Changes in potential energy during the melting process of the Sn-Pb-Bi alloy system: (a) Bi/Pb = 0; (b) Bi/Pb = 0.14; (c) Bi/Pb = 0.33; (d) Bi/Pb = 0.60.
Figure 6.
Volume changes during the melting process of the Sn-Pb-Bi alloy system: (a) Bi/Pb = 0; (b) Bi/Pb = 0.14; (c) Bi/Pb = 0.33; (d) Bi/Pb = 0.60.
Figure 7.
Changes in density during the melting process of the Sn-Pb-Bi alloy system: (a) Bi/Pb = 0; (b) Bi/Pb = 0.14; (c) Bi/Pb = 0.33; (d) Bi/Pb = 0.60.
As the Bi/Pb mass ratio increases progressively from 0 to 0.60, the melting temperature (Tm) of the alloy shows a clear and systematic decline. Specifically, Tm is approximately 475 K at Bi/Pb = 0, decreases to about 470 K at 0.14, further drops to ~463 K at 0.33, and reaches ~450 K at 0.60—corresponding to a total reduction of roughly 25 K. This trend is consistent with the well-established role of Bi as a low-melting-point alloying element.
From an atomic perspective, the covalent radius of Bi (~1.54 Å) is notably larger than that of Sn (~1.39 Å) and Pb (~1.46 Å). Its incorporation into the Sn–Pb matrix via solid solution induces pronounced lattice distortion, which weakens metallic bonding strength and reduces thermodynamic stability in the solid phase. Consequently, the free energy of the solid state increases, facilitating the onset of melting and thereby lowering the alloy’s melting temperature. This atomistic mechanism aligns well with reported experimental observations of the melting point of Sn-Pb-Bi solders decreasing monotonically with increasing Bi content.
In the solid state below Tm, both potential energy and volume increase gradually and nearly linearly with temperature, while the density decreases correspondingly, reflecting typical thermal expansion governed by lattice vibrations. As the temperature approaches Tm, all three curves display noticeable changes in slope or slight plateaus, which can be attributed to the absorption of latent heat and the accompanying volumetric expansion during the phase transition.
Upon entering the liquid phase, the slopes of the potential energy and volume curves increase markedly, and the density decreases more rapidly, indicating that the enhanced atomic disorder in the liquid state renders the system more sensitive to temperature variations. Notably, for the high-Bi composition (Bi/Pb = 0.60), the fluctuations in potential energy and volume become more pronounced in the liquid phase, accompanied by greater statistical dispersion in density. This behavior suggests an increased tendency for Bi atoms to segregate in the liquid, leading to stronger local structural fluctuations; nevertheless, the overall signature of the phase transition remains clearly identifiable.
It should be noted that the simulations were conducted using a continuous heating rate of 1 K/ps. This rate was chosen as a compromise between computational efficiency and sufficient sampling of the phase-transition process in large-scale (12,000-atom) DeePMD simulations. It enables complete solid–liquid–solid thermal cycles within practical simulation times while clearly capturing the melting and solidification signatures in thermodynamic properties. As a result, the calculated Tm is slightly higher than the equilibrium thermodynamic melting point. However, the compositional trends remain robust, providing reliable atomistic insight into the role of Bi in regulating the thermal stability of the Sn–Pb matrix.
3.2. Analysis of the Solidification Process
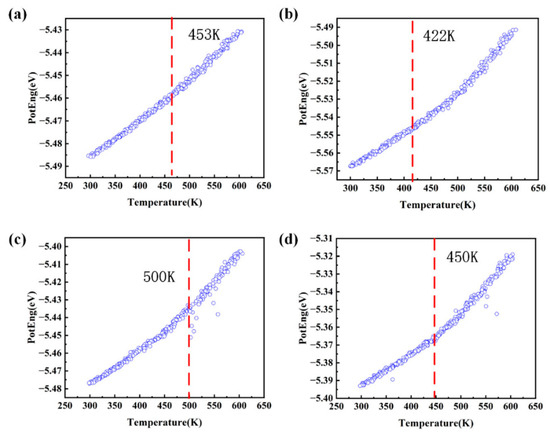
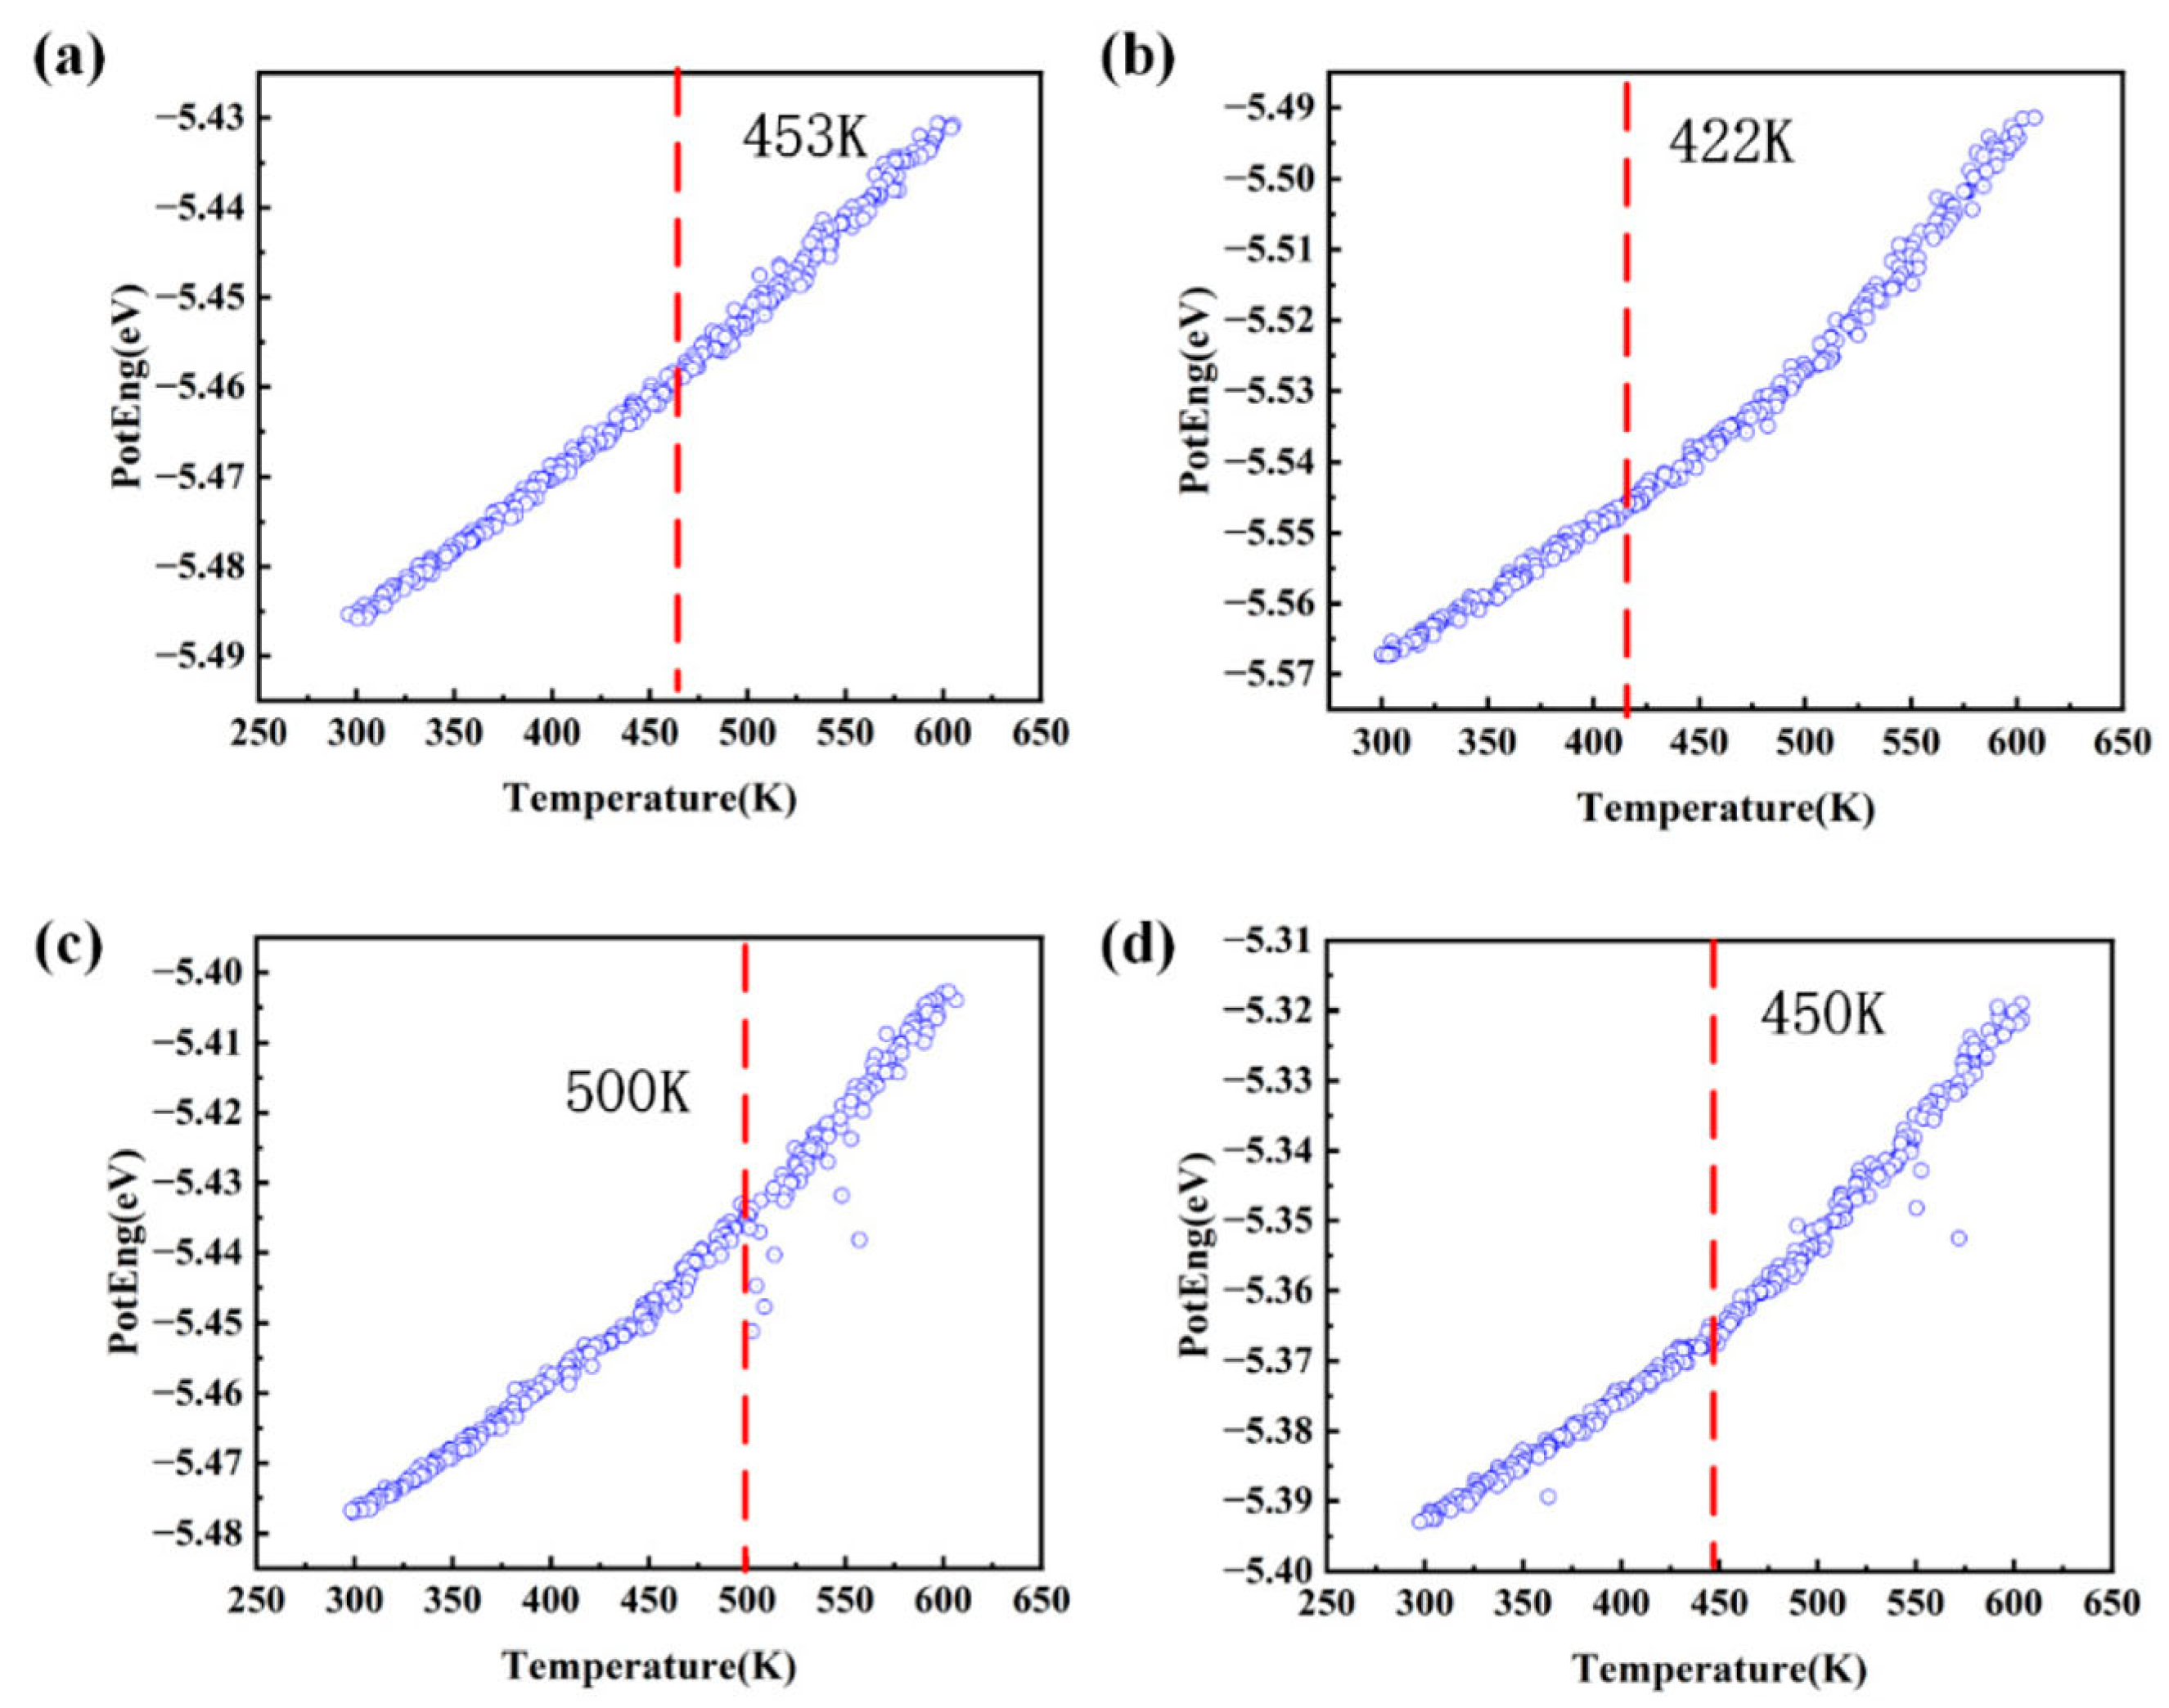
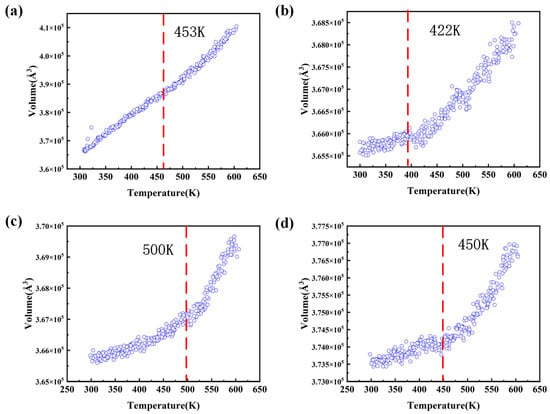
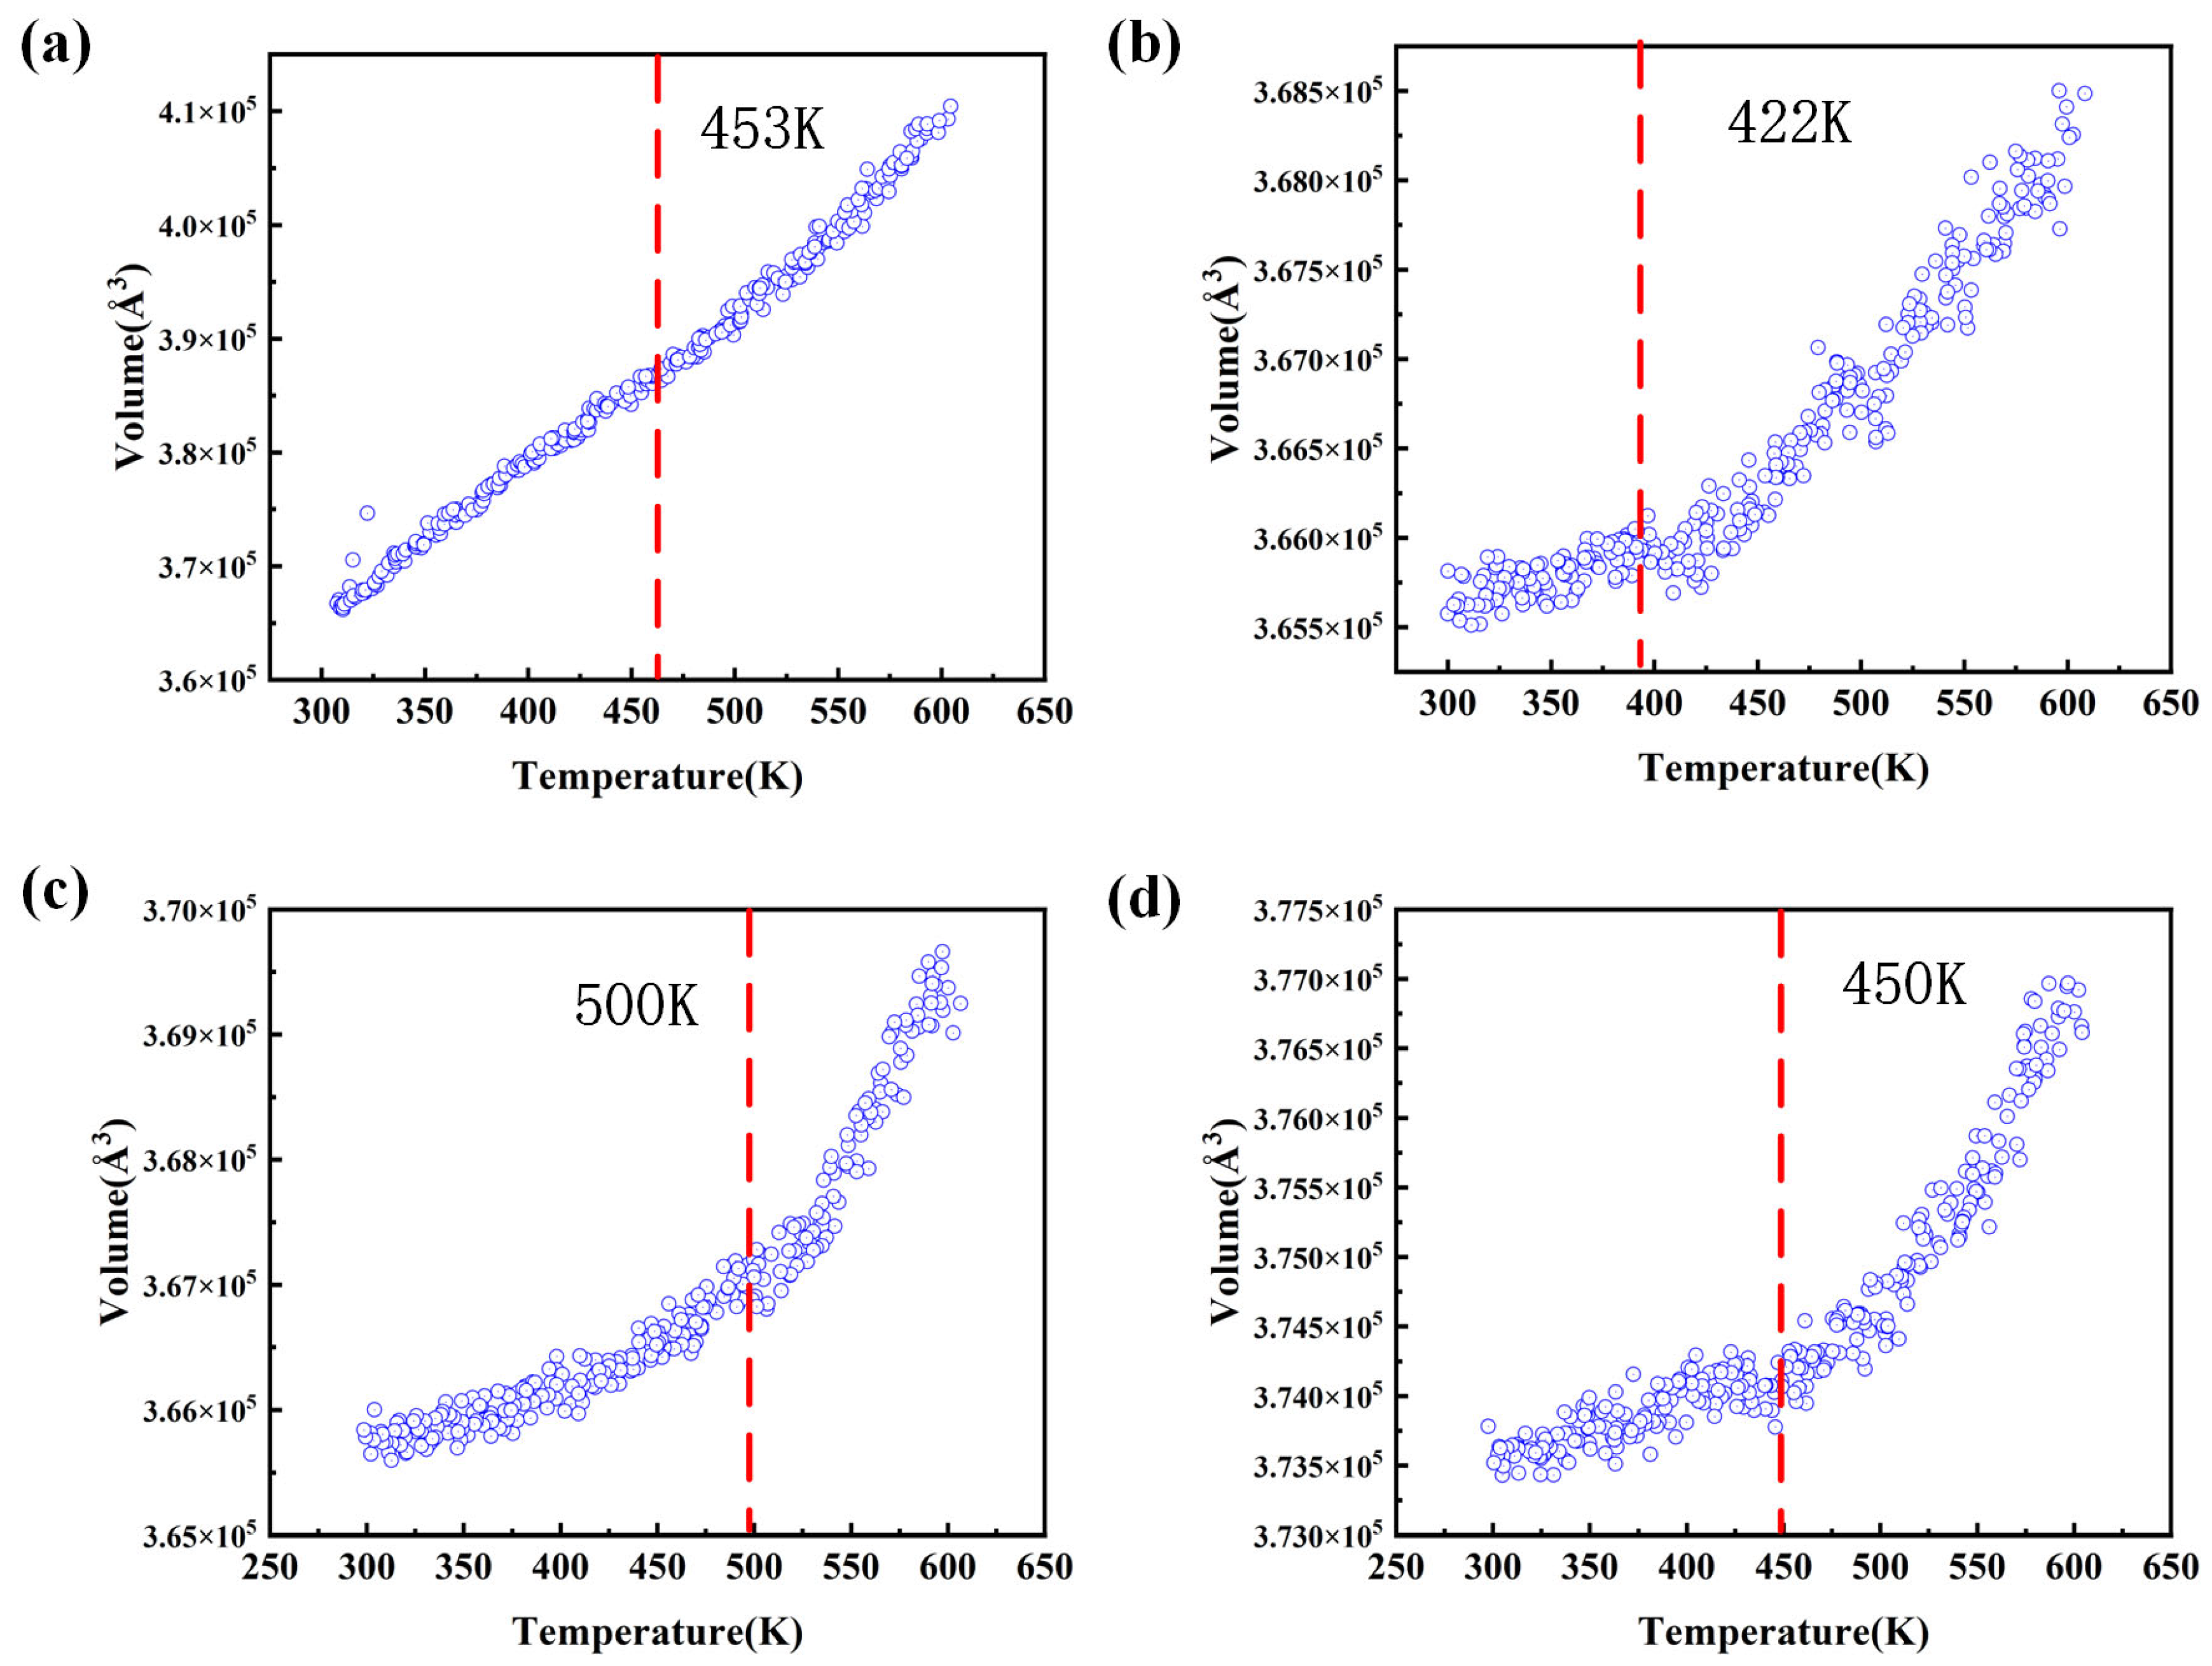
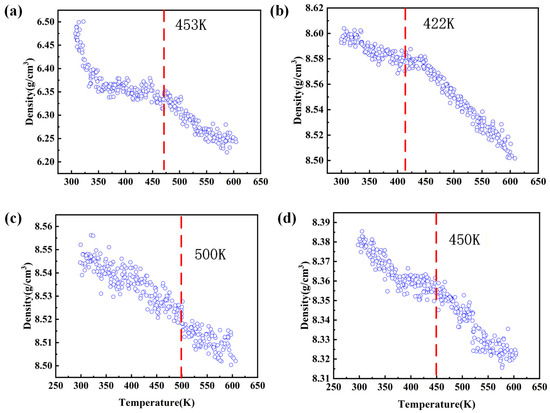
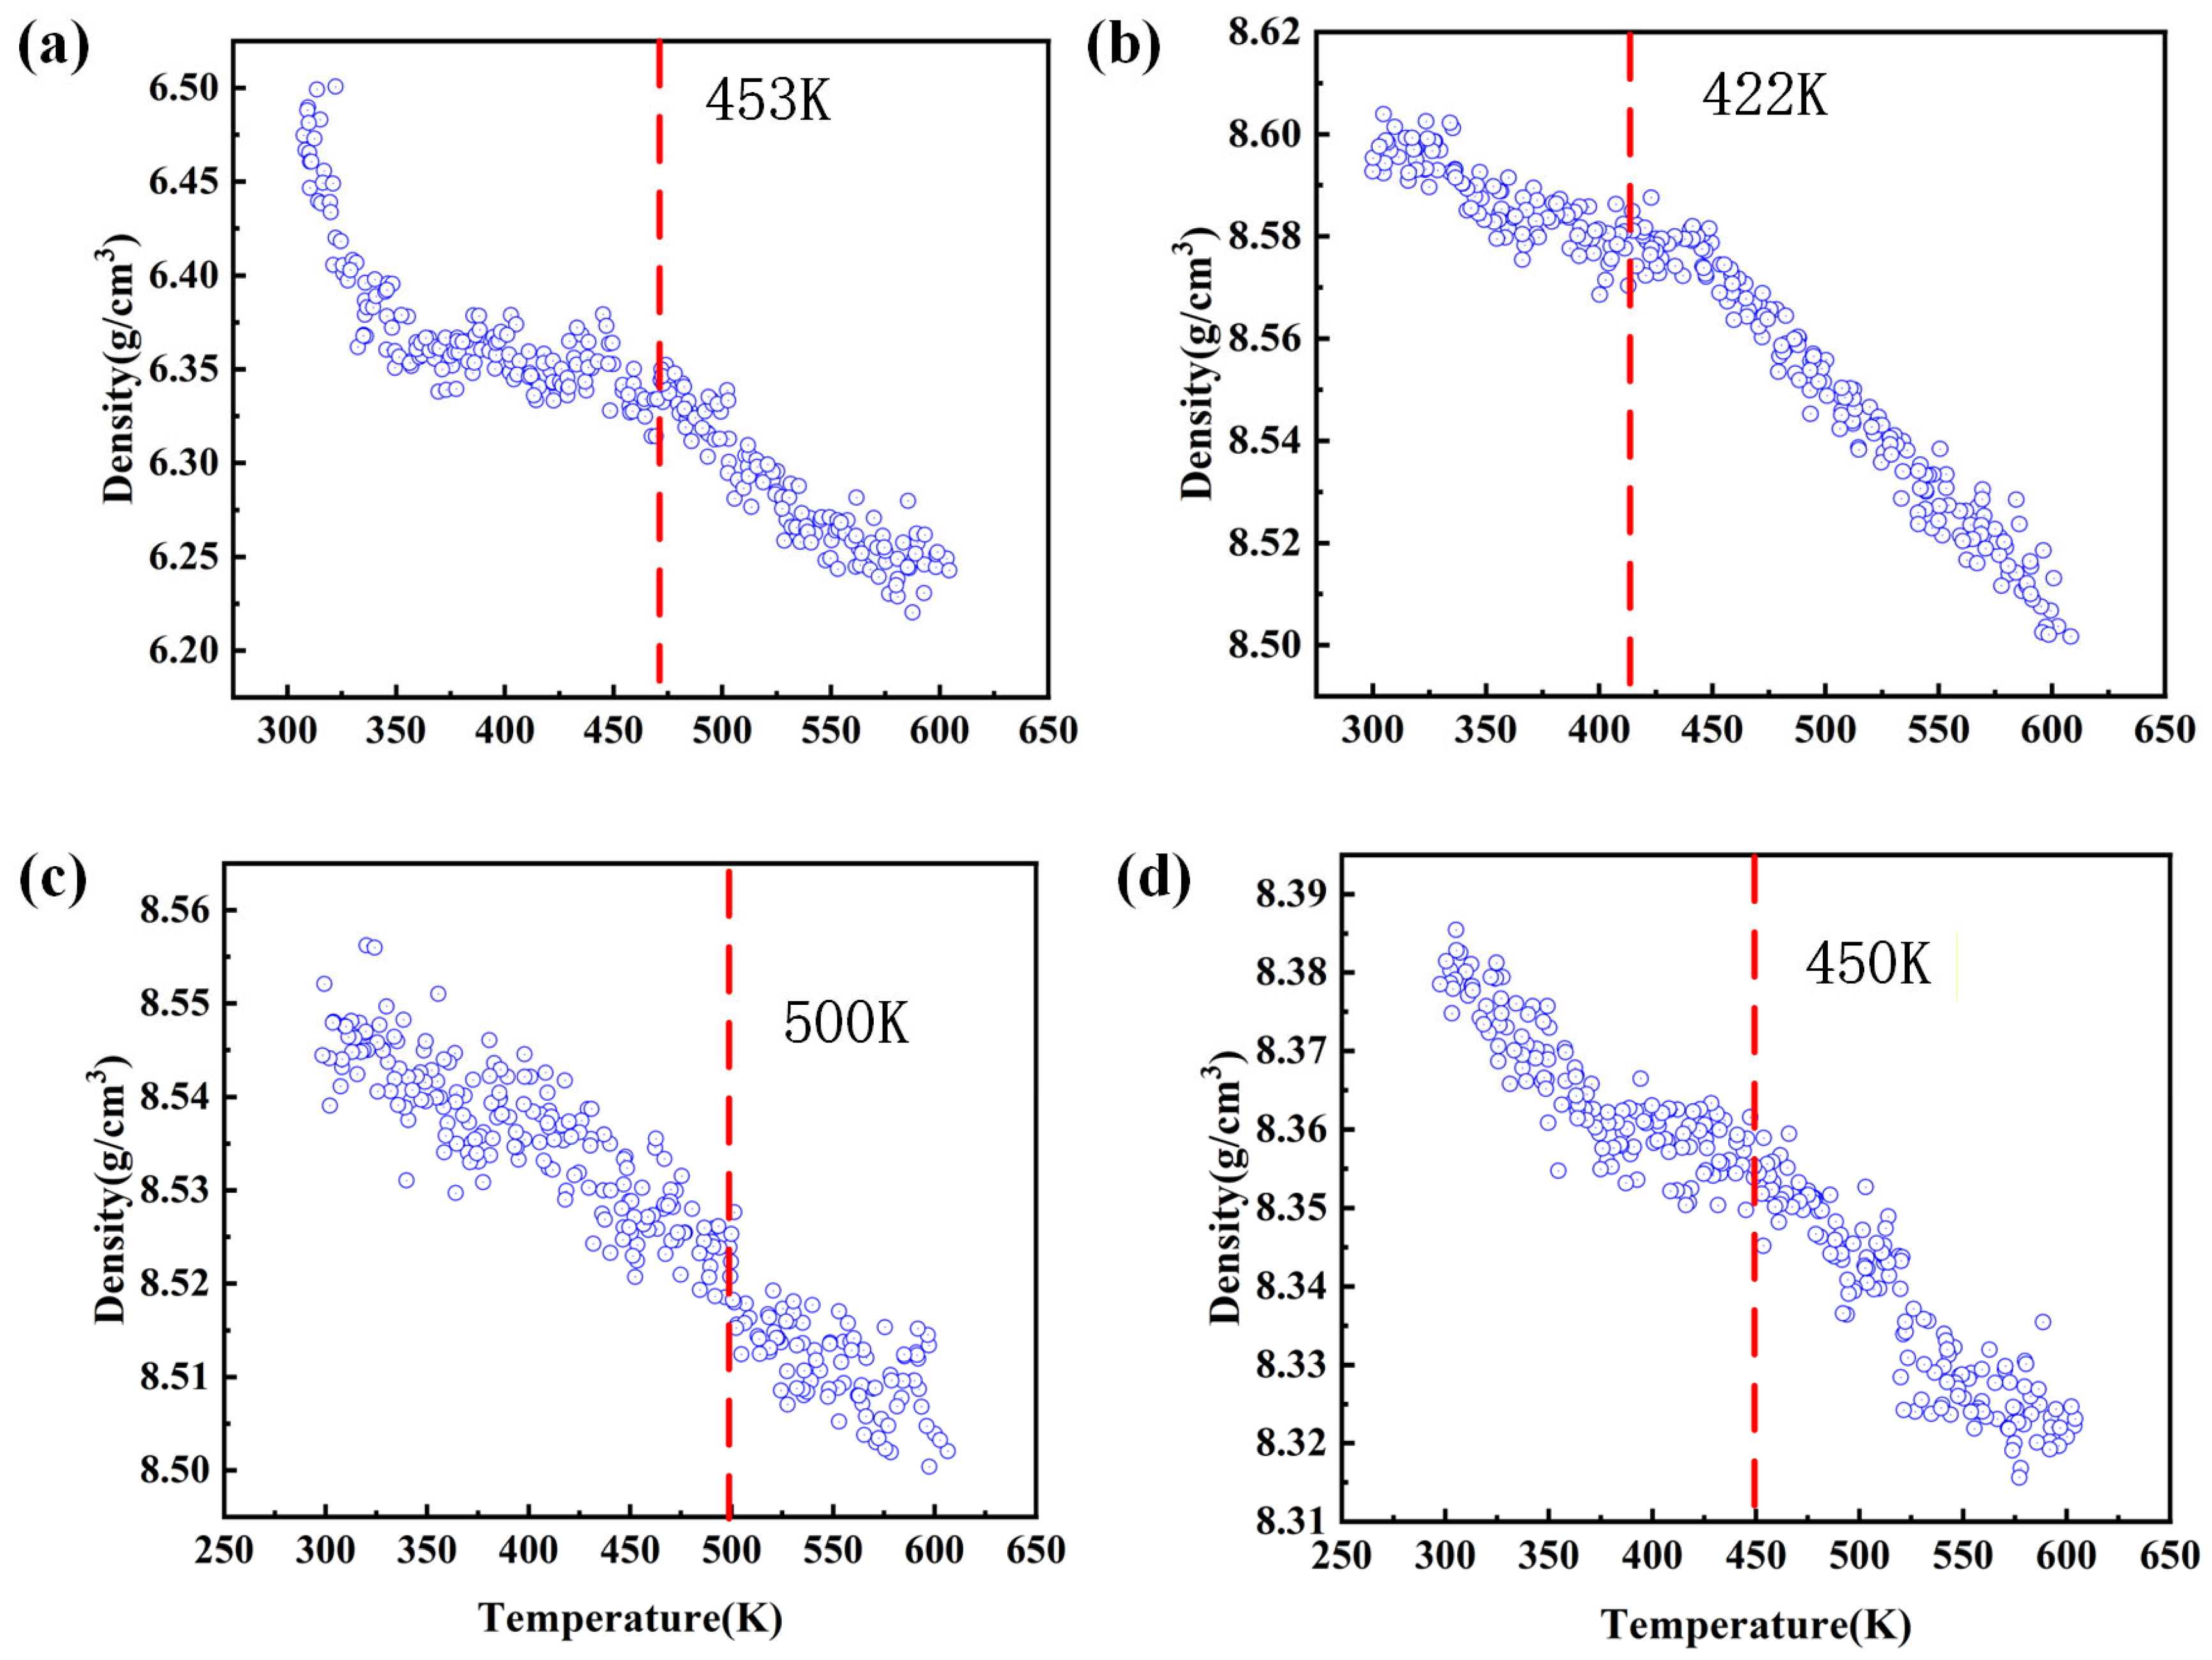
The solidification process exhibits a pronounced hysteresis relative to melting, as clearly reflected in the potential energy, volume, and density responses. Figure 8, Figure 9 and Figure 10 present the temperature-dependent evolution of potential energy, volume, and density during continuous cooling at 1 K/ps. In the high-temperature liquid regime, all three quantities vary slowly and approximately linearly with decreasing temperature. As the temperature approaches the solidification temperature (Ts), however, each curve shows a distinct discontinuity: the potential energy decreases sharply, the volume undergoes a step-like contraction, and the density increases abruptly, collectively marking the liquid–solid phase transition. This hysteresis behavior highlights the inherent thermodynamic irreversibility of phase transformations in Sn-Pb-Bi alloys under non-equilibrium conditions.
Figure 8.
Changes in potential energy during the solidification process of the Sn-Pb-Bi alloy system: (a) Bi/Pb = 0; (b) Bi/Pb = 0.14; (c) Bi/Pb = 0.33; (d) Bi/Pb = 0.60.
Figure 9.
Volume changes during the solidification process of the Sn-Pb-Bi alloy system: (a) Bi/Pb = 0; (b) Bi/Pb = 0.14; (c) Bi/Pb = 0.33; (d) Bi/Pb = 0.60.
Figure 10.
Changes in density during the solidification process of the Sn-Pb-Bi alloy system: (a) Bi/Pb = 0; (b) Bi/Pb = 0.14; (c) Bi/Pb = 0.33; (d) Bi/Pb = 0.60.
With increasing Bi/Pb mass ratio, the solidification temperature Ts generally remains lower than the corresponding melting temperature Tm and displays a non-monotonic trend—initially decreasing and then increasing. Specifically, at Bi/Pb = 0, Ts ≈ 453 K, corresponding to an undercooling ΔT = Tm − Ts of ~22 K. At Bi/Pb = 0.14, Ts decreases to ~422 K, while the undercooling increases significantly to ~48 K, representing the maximum among the four compositions. For Bi/Pb = 0.33, Ts is estimated to be ~500 K, exceeding the corresponding Tm (~463 K). This thermodynamically inconsistent result is attributed to kinetic limitations and statistical fluctuations inherent to the finite cooling rate (1 K/ps) and finite system size (12,000 atoms) in the molecular dynamics simulations. Under such conditions, premature crystallization can occur via random nucleation, leading to an overestimation of Ts for certain compositions.
As a typical surface-active element, Bi has a strong tendency to segregate at liquid interfaces, thereby effectively reducing the heterogeneous nucleation energy barrier. Moderate Bi addition (Bi/Pb = 0.14) can promote heterogeneous nucleation, increase the achievable degree of undercooling, and promote microstructural refinement tendencies during solidification, ultimately contributing to improved mechanical performance in solder joints. In contrast, excessively high Bi content leads to pronounced compositional segregation and the formation of brittle Bi-rich phases, which further lowers the nucleation barrier but reduces the extent of undercooling. This, in turn, can result in microstructural coarsening or the formation of solidification defects.
These simulation results are in good agreement with the solidification behavior observed in practical Sn-Pb-Bi solders used in photovoltaic ribbon interconnection processes, suggesting that the Bi/Pb mass ratio is a critical compositional parameter for tuning undercooling, suppressing macroscopic segregation, optimizing joint microstructure, and enhancing interfacial reliability.
Furthermore, the amplitude of volume and density fluctuations shows a clear dependence on Bi content. Alloys with higher Bi concentrations exhibit more pronounced thermal and density fluctuations in the liquid phase, further confirming that Bi-induced local structural inhomogeneities play a significant role in governing solidification kinetics and phase transformation pathways.
3.3. Structure and Kinetic Behavior of Alloys
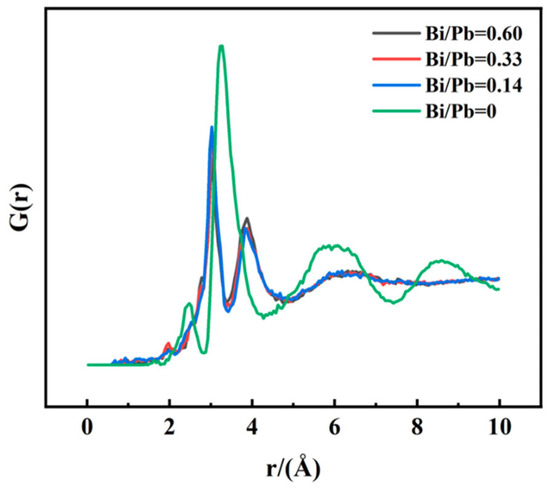
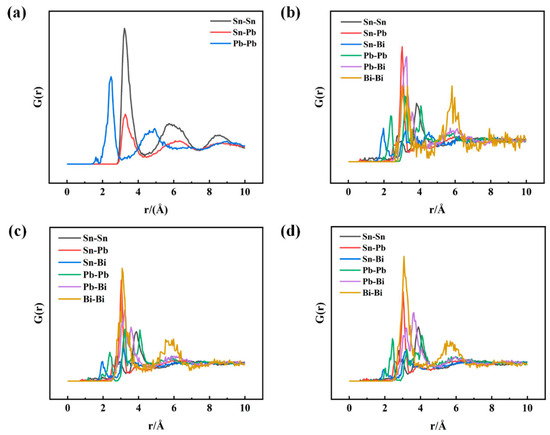
To gain deeper insights into how the Bi/Pb mass ratio regulates the short-range order in Sn-Pb-Bi ternary alloys, we systematically analyzed the distribution of atomic pairs across different compositions during the liquid state and the solid–liquid transition using the radial distribution function (RDF, g(r)). As shown in Figure 11 and Figure 12, the incorporation of Bi markedly perturbs the intrinsic short-range order of the Sn–Pb matrix, exhibiting a clear composition-dependent evolution.
Figure 11.
Radial distribution function curves for Sn-Pb-Bi alloys with different composition ratios.
Figure 12.
Radial distribution function curves for each element in the Sn-Pb-Bi alloy: (a) Bi/Pb = 0; (b) Bi/Pb = 0.14; (c) Bi/Pb = 0.33; (d) Bi/Pb = 0.60.
At Bi/Pb = 0, the first-neighbor peaks of Sn–Sn and Pb–Pb pairs display the highest intensities and sharp, symmetric profiles, indicating a strong preference for homonuclear coordination. In contrast, the first peak corresponding to Sn–Pb heteroatomic pairs is relatively weak, suggesting a tendency toward partial phase separation and reflecting the inherent chemical ordering and microscopic heterogeneity of the Sn–Pb binary system.
It is particularly noteworthy that the first-peak intensities of the Bi–Sn, Bi–Pb, and Bi–Bi atomic pairs increase simultaneously and eventually become dominant within the system. Meanwhile, the peak positions of Sn–Sn and Pb–Pb pairs shift systematically—toward larger and smaller r values, respectively—and the peak positions of all atomic pairs gradually converge toward an average distance. This evolution indicates that Bi atoms effectively dilute the original Sn–Pb metallic bonding network and establish a new Bi-centered short-range chemical order. As a result, the chemical homogeneity of the system is enhanced, while the degree of structural disorder is significantly increased.
With increasing Bi/Pb mass ratio, the overall height of the first-neighbor peaks decreases progressively, while their profiles broaden significantly. This peak broadening implies an increased dispersion in interatomic distances and a reduction in local structural order. Meanwhile, second-neighbor peaks near r ≈ 4 Å gradually emerge and become more pronounced, indicating the development of medium-range structural correlations and the onset of new mesoscale ordering features within the alloy system.
The observed RDF evolution directly reflects the lattice distortion and compositional redistribution induced by Bi. The incorporation of Bi not only weakens the bonding strength of the Sn–Pb matrix but also reconstructs the local atomic environment through electron redistribution and many-body interactions. These atomistic structural features provide clear microscopic evidence for the role of Bi in lowering the melting point, modulating undercooling, and optimizing the solidification microstructure. Increased structural disorder reduces the thermodynamic stability of the solid phase, thereby facilitating melting. At the same time, the formation of Bi-centered short-range order promotes liquid-state fluidity and enhances heterogeneous nucleation, ultimately improving the performance of Sn-Pb-Bi alloy solders in low-temperature brazing applications.
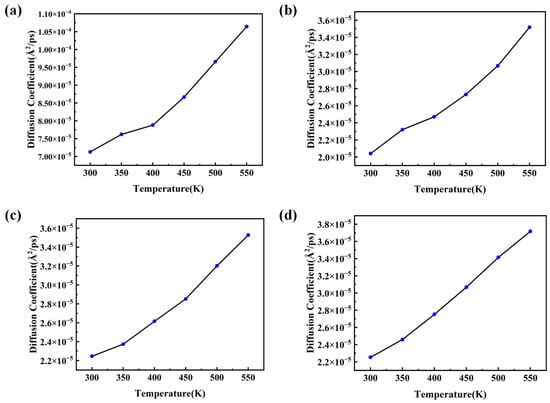
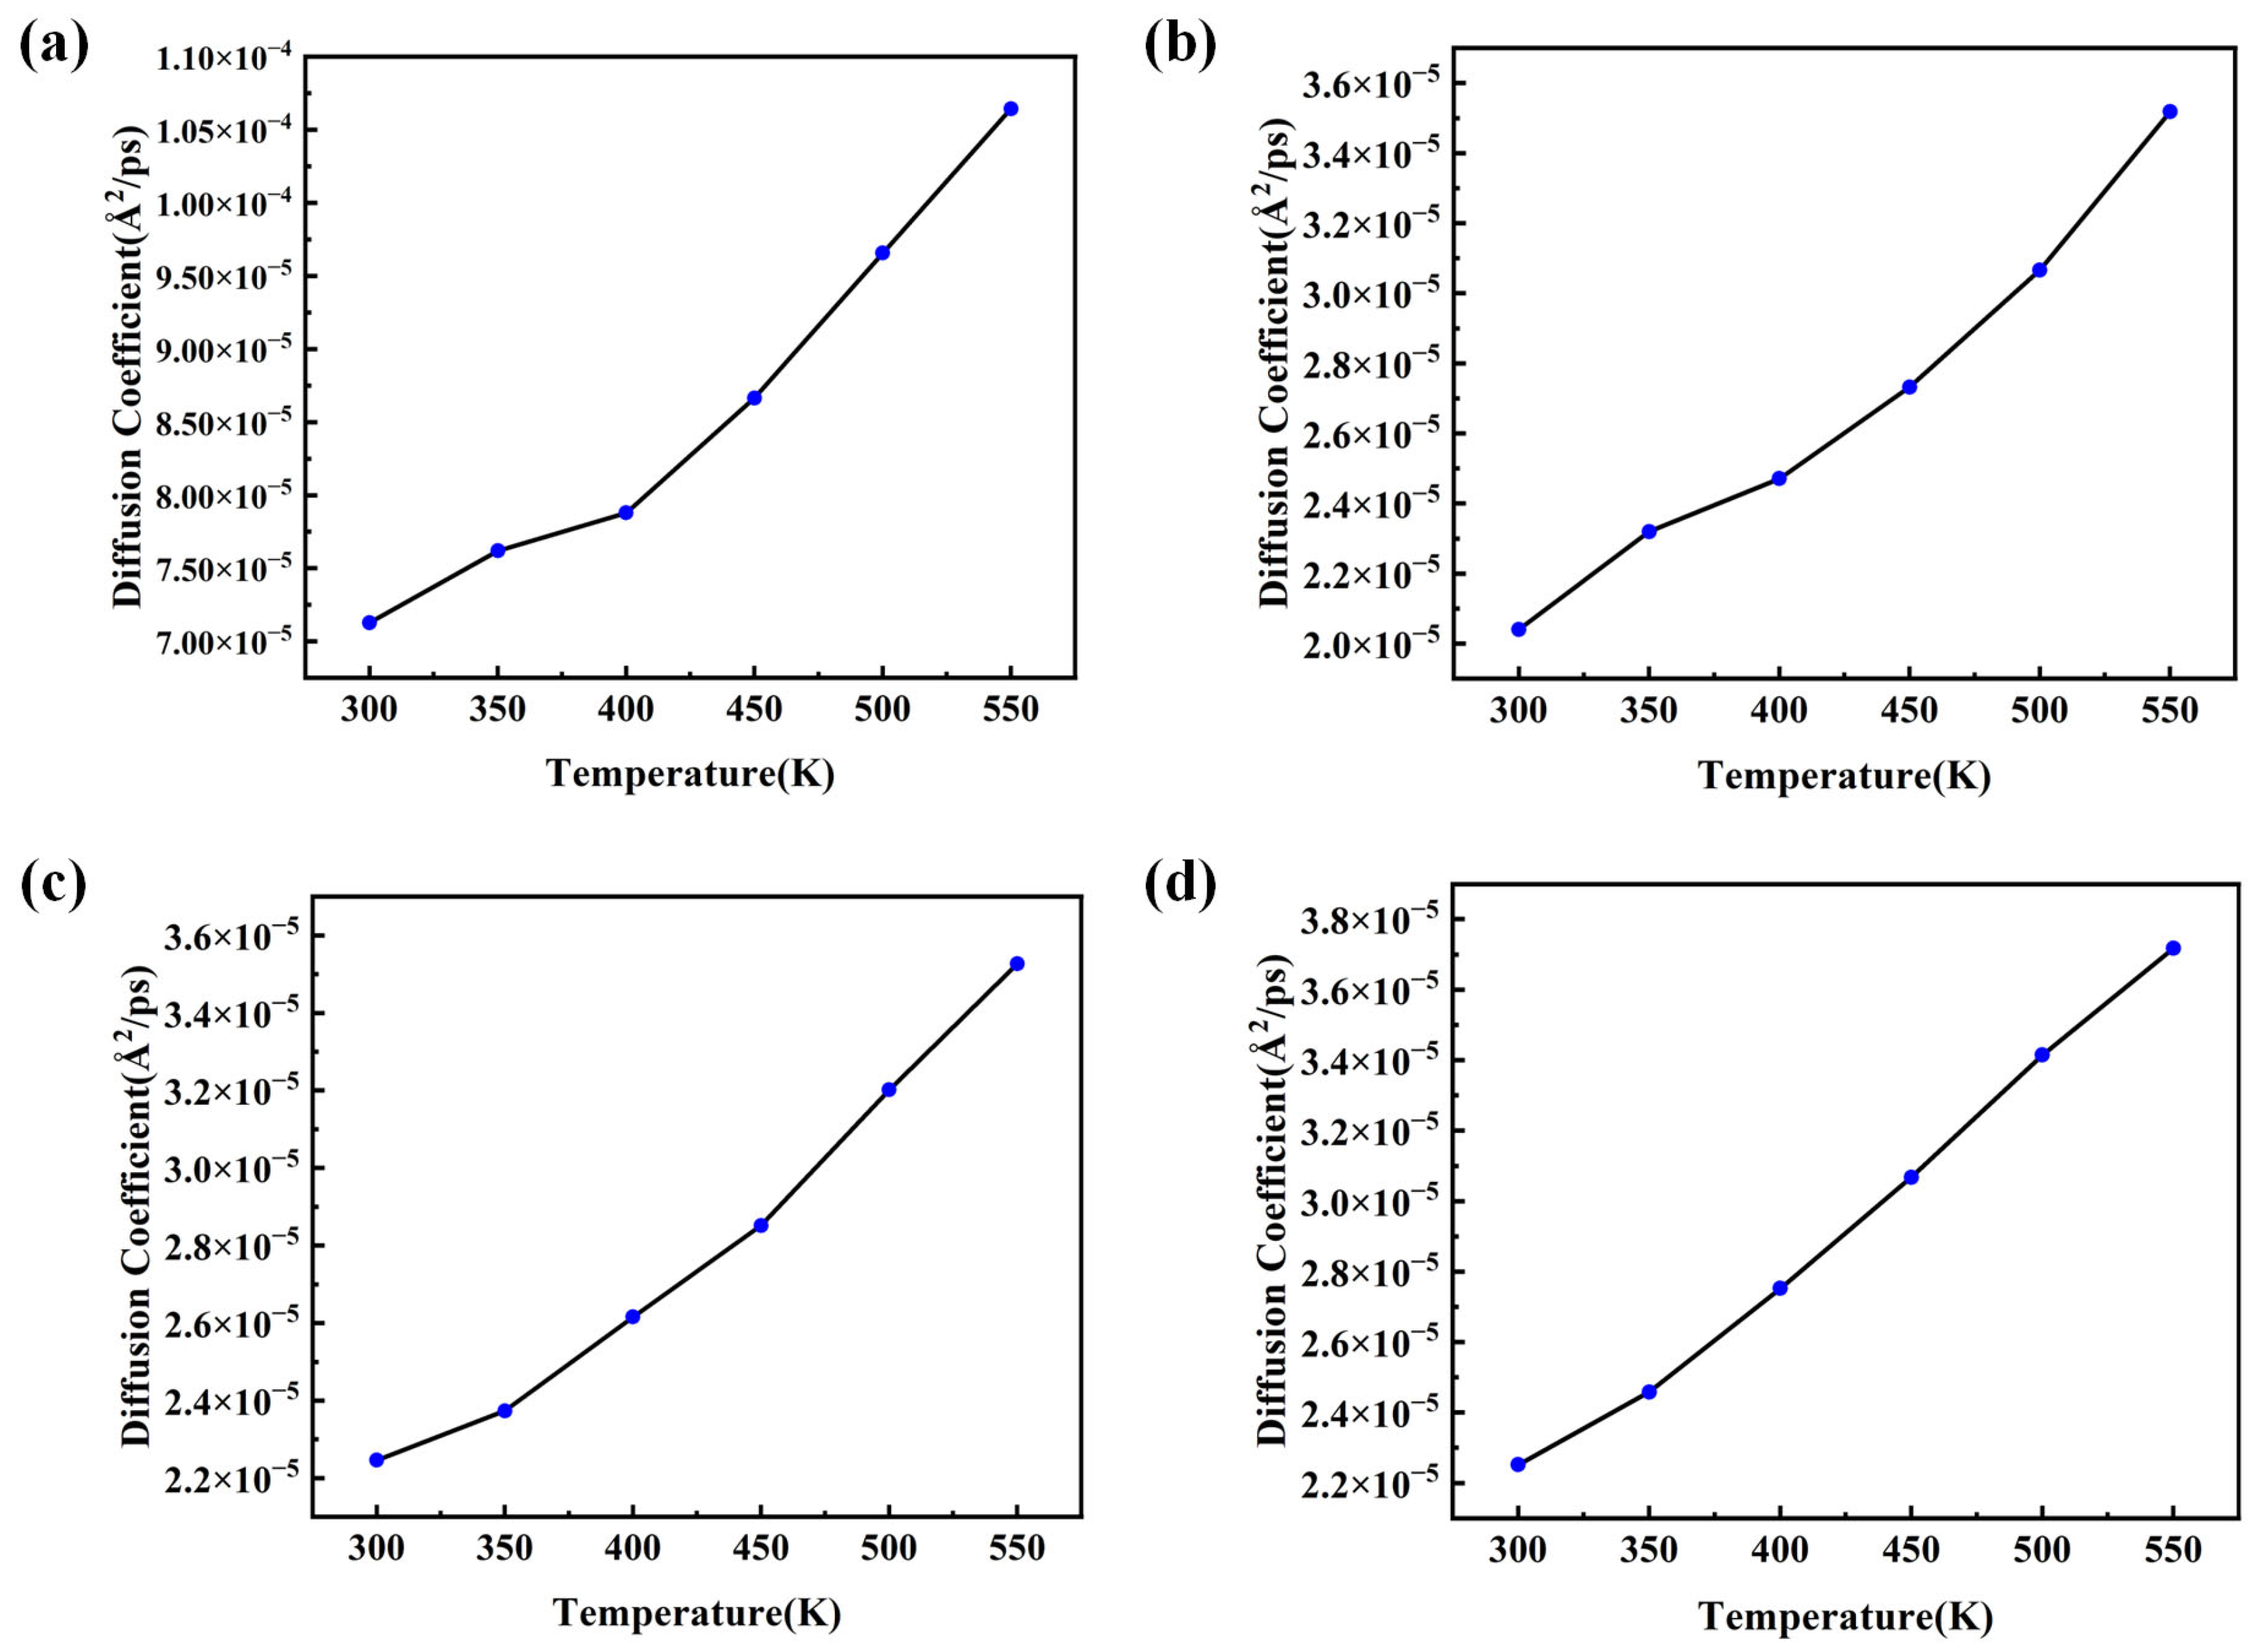
Further analysis of diffusion behavior and viscosity highlights the pronounced influence of Bi on liquid-state transport properties. As shown in Figure 13, the self-diffusion coefficient (D) exhibits a typical exponential increase with temperature. The four subplots illustrate the combined effects of temperature and composition over the range of 300–550 K. In the base Sn–Pb system (Bi/Pb = 0), D remains relatively high, indicating strong atomic mobility in the liquid phase. When the Bi/Pb ratio increases to 0.14, D decreases by more than 70% compared to the Bi-free system, reflecting a substantial suppression of liquid transport. At Bi/Pb = 0.33, D stabilizes at a similarly low level. When the ratio further increases to 0.60, D shows a slight recovery but still remains significantly lower than that of the pure Sn–Pb system.
Figure 13.
Diffusion curves of Sn-Pb-Bi alloys with different composition ratios as a function of temperature: (a) Bi/Pb = 0; (b) Bi/Pb = 0.14; (c) Bi/Pb = 0.33; (d) Bi/Pb = 0.60.
This non-monotonic dependence on composition indicates that even a small addition of Bi (Bi/Pb = 0.14) can markedly increase the atomic migration energy barrier through lattice distortion, electron redistribution, and enhanced short-range chemical ordering. As a result, the diffusion of Sn and Pb atoms is effectively suppressed. However, at higher Bi concentrations (Bi/Pb = 0.60), the segregation tendency of Bi partially counteracts this effect by creating local diffusion pathways with relatively lower energy barriers, leading to a modest recovery of the diffusion coefficient.
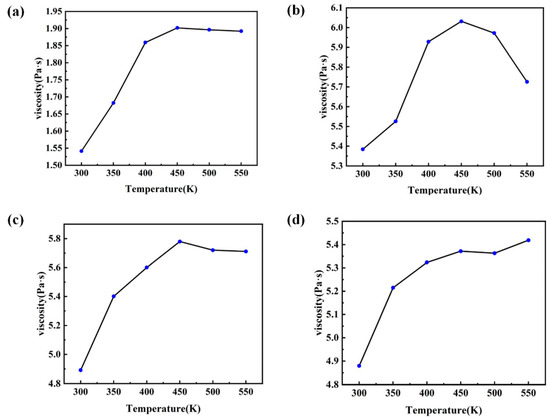
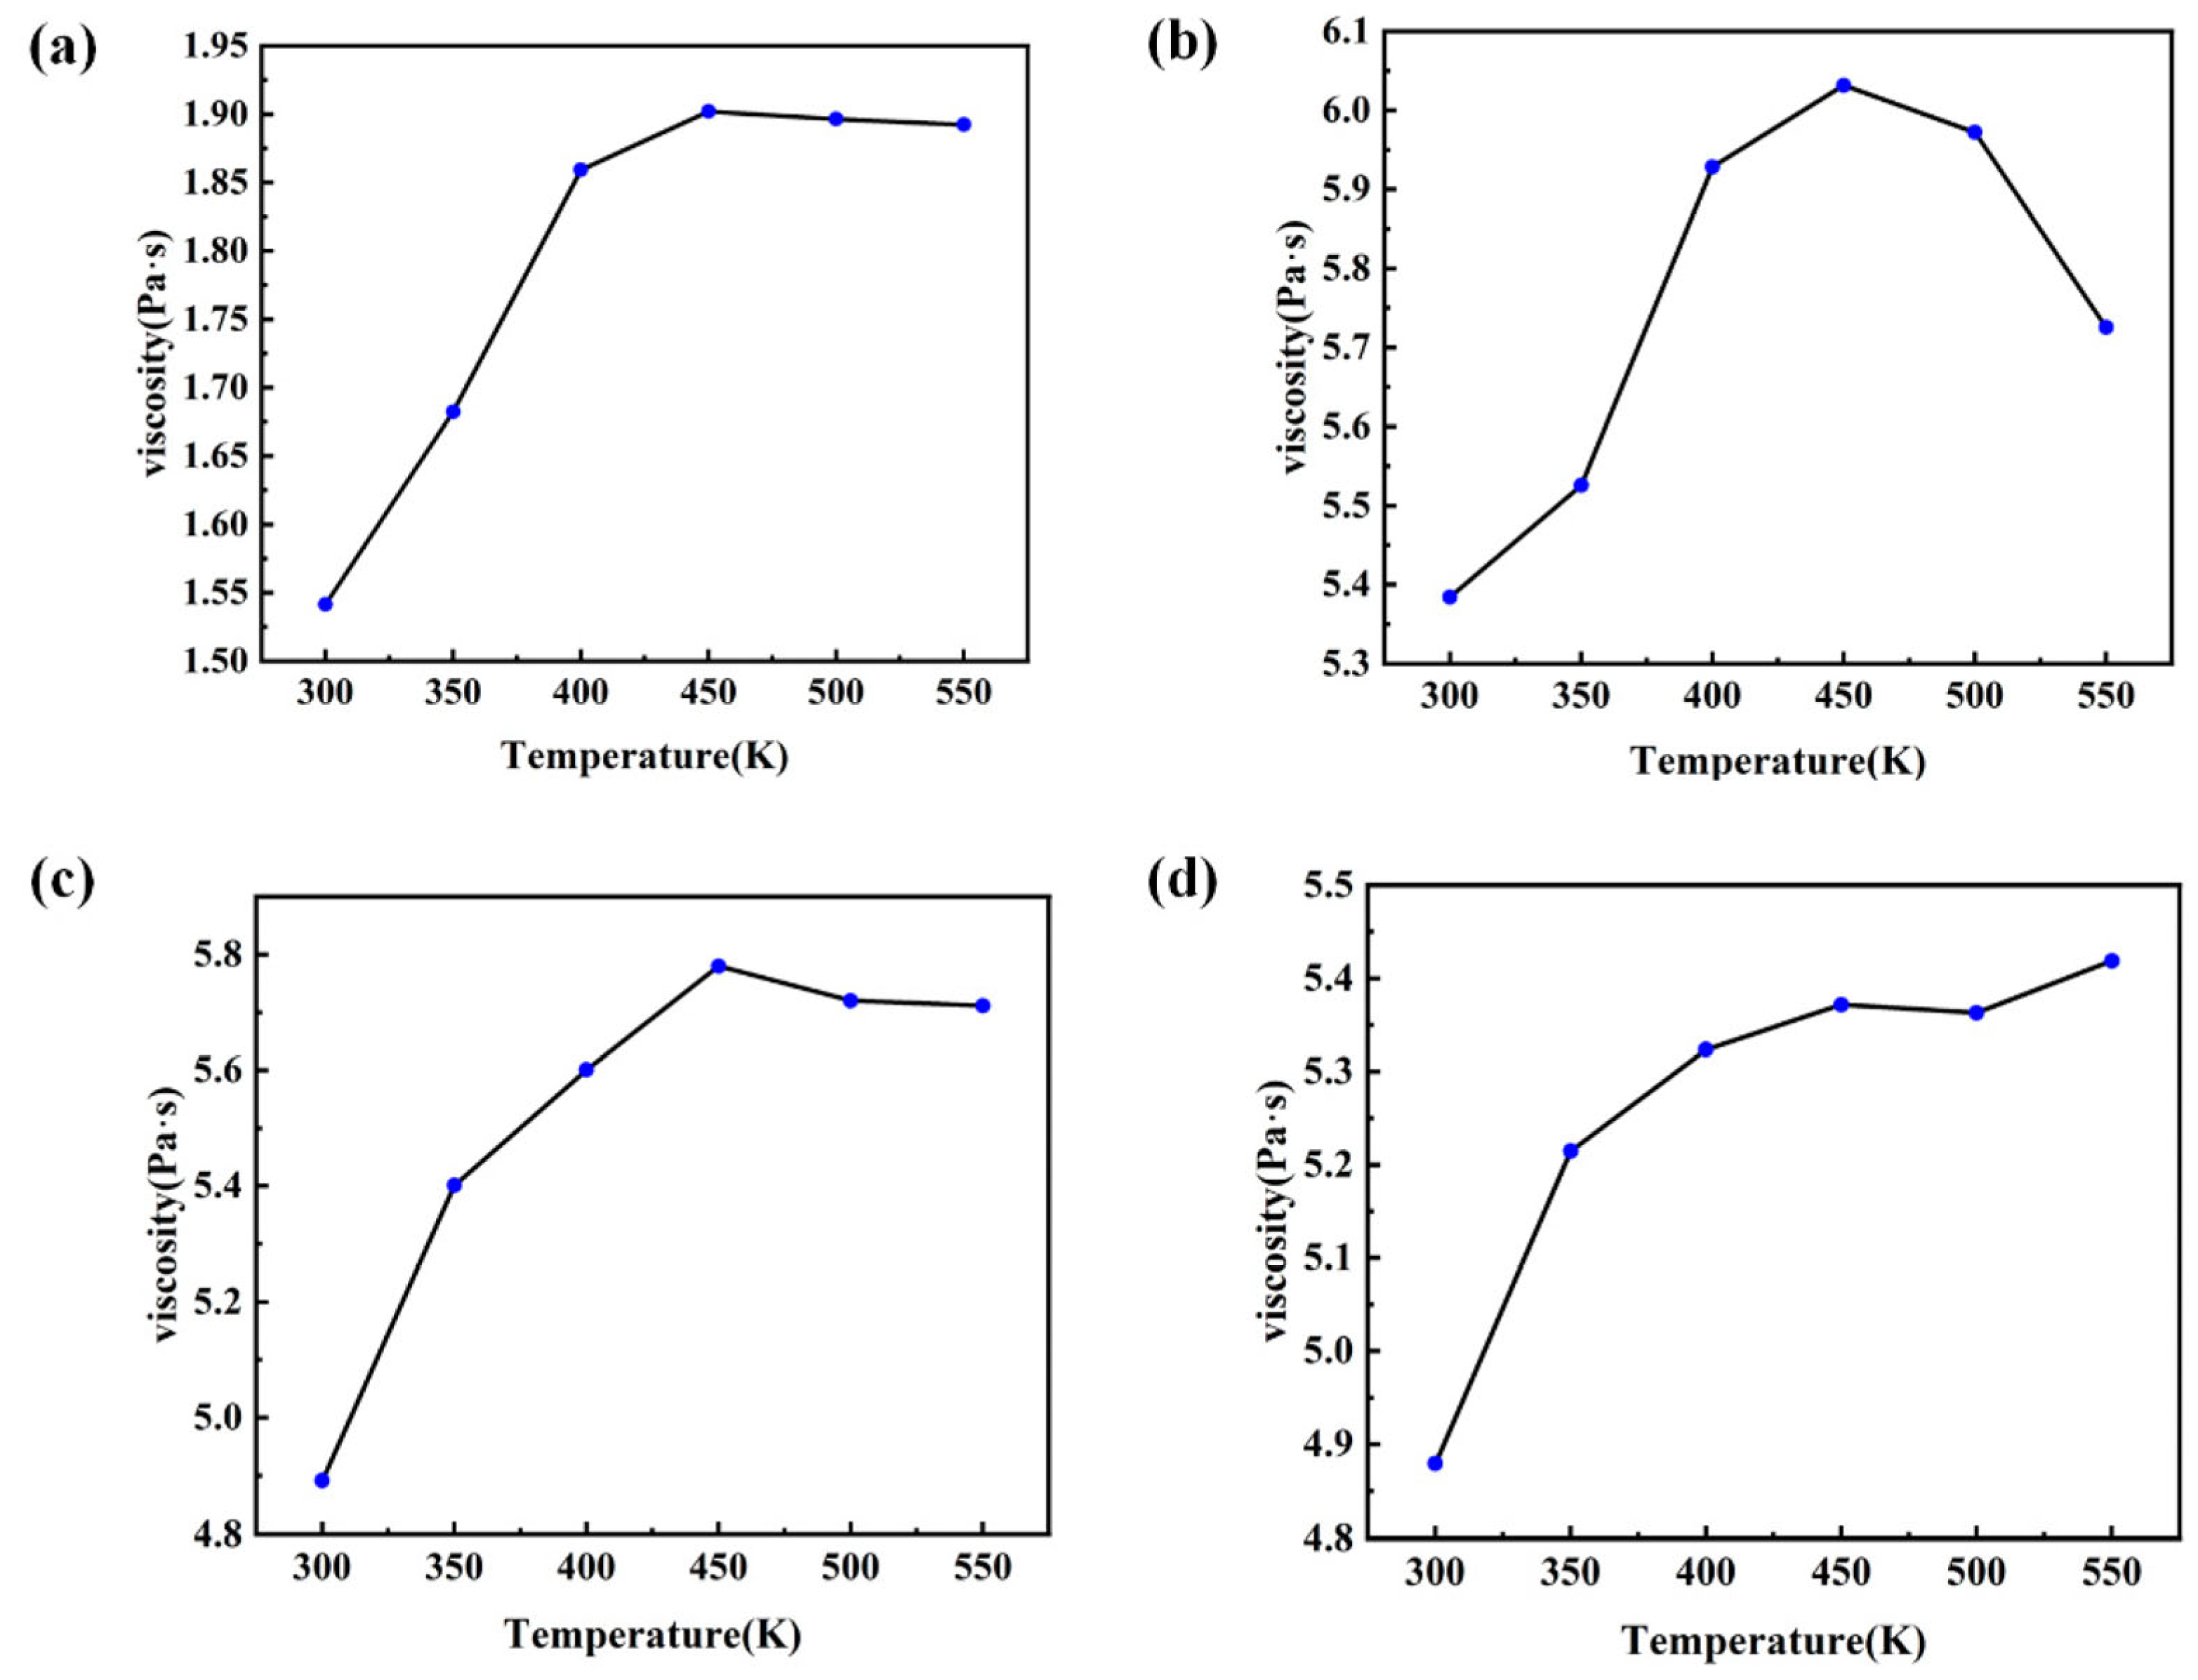
The liquid viscosity (η), estimated via the Stokes–Einstein relation, exhibits a composition dependence opposite to that of the self-diffusion coefficient, as shown in Figure 14. In the Bi/Pb = 0 system, the viscosity remains at the lowest overall level, increasing gradually from approximately 1.55 Pa·s at 300 K to a maximum of about 1.90 Pa·s near 450 K, followed by a slight decrease and stabilization—consistent with typical liquid metal behavior. When the Bi/Pb ratio increases to 0.14, the viscosity rises sharply, reaching a peak of approximately 6.05 Pa·s—more than three times that of the Sn–Pb system—before decreasing as the temperature is further increased beyond ~450 K. As the Bi/Pb ratio is further increased to 0.33 and 0.60, the viscosity decreases to values closer to those of the base Sn–Pb alloy, with peak values of approximately 5.75 Pa·s and 5.4 Pa·s, respectively, demonstrating a clear non-monotonic trend.
Figure 14.
Viscosity curves of Sn-Pb-Bi alloys with different composition ratios as a function of temperature: (a) Bi/Pb = 0; (b) Bi/Pb = 0.14; (c) Bi/Pb = 0.33; (d) Bi/Pb = 0.60.
This non-monotonic viscosity behavior is closely associated with the evolution of short-range order and the formation of local atomic clusters, as revealed via RDF analysis. A moderate Bi addition (Bi/Pb = 0.14) enhances chemical short-range order and promotes the formation of Bi-centered clusters, thereby increasing the atomic migration energy barrier and flow resistance, which leads to a substantial rise in liquid viscosity. In contrast, excessive Bi content results in pronounced compositional segregation and a more loosely packed local structure, partially offsetting this effect and causing the viscosity to decrease toward lower levels.
Moderate Bi doping thus increases the flow resistance of the liquid alloy, which not only improves wettability during low-temperature soldering but also enhances the filling capability of the solder. These atomistic transport characteristics provide important guidance for the precise compositional design of Sn-Pb-Bi photovoltaic solder strips. In particular, a Bi/Pb ratio of approximately 0.14 offers an optimal balance among fluidity, melting-point reduction, undercooling control, and microstructural refinement, potentially contributing to improved soldering reliability and long-term service stability in electronic packaging and flexible photovoltaic applications.
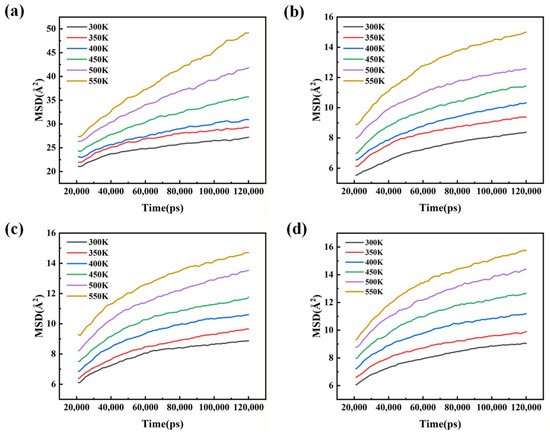
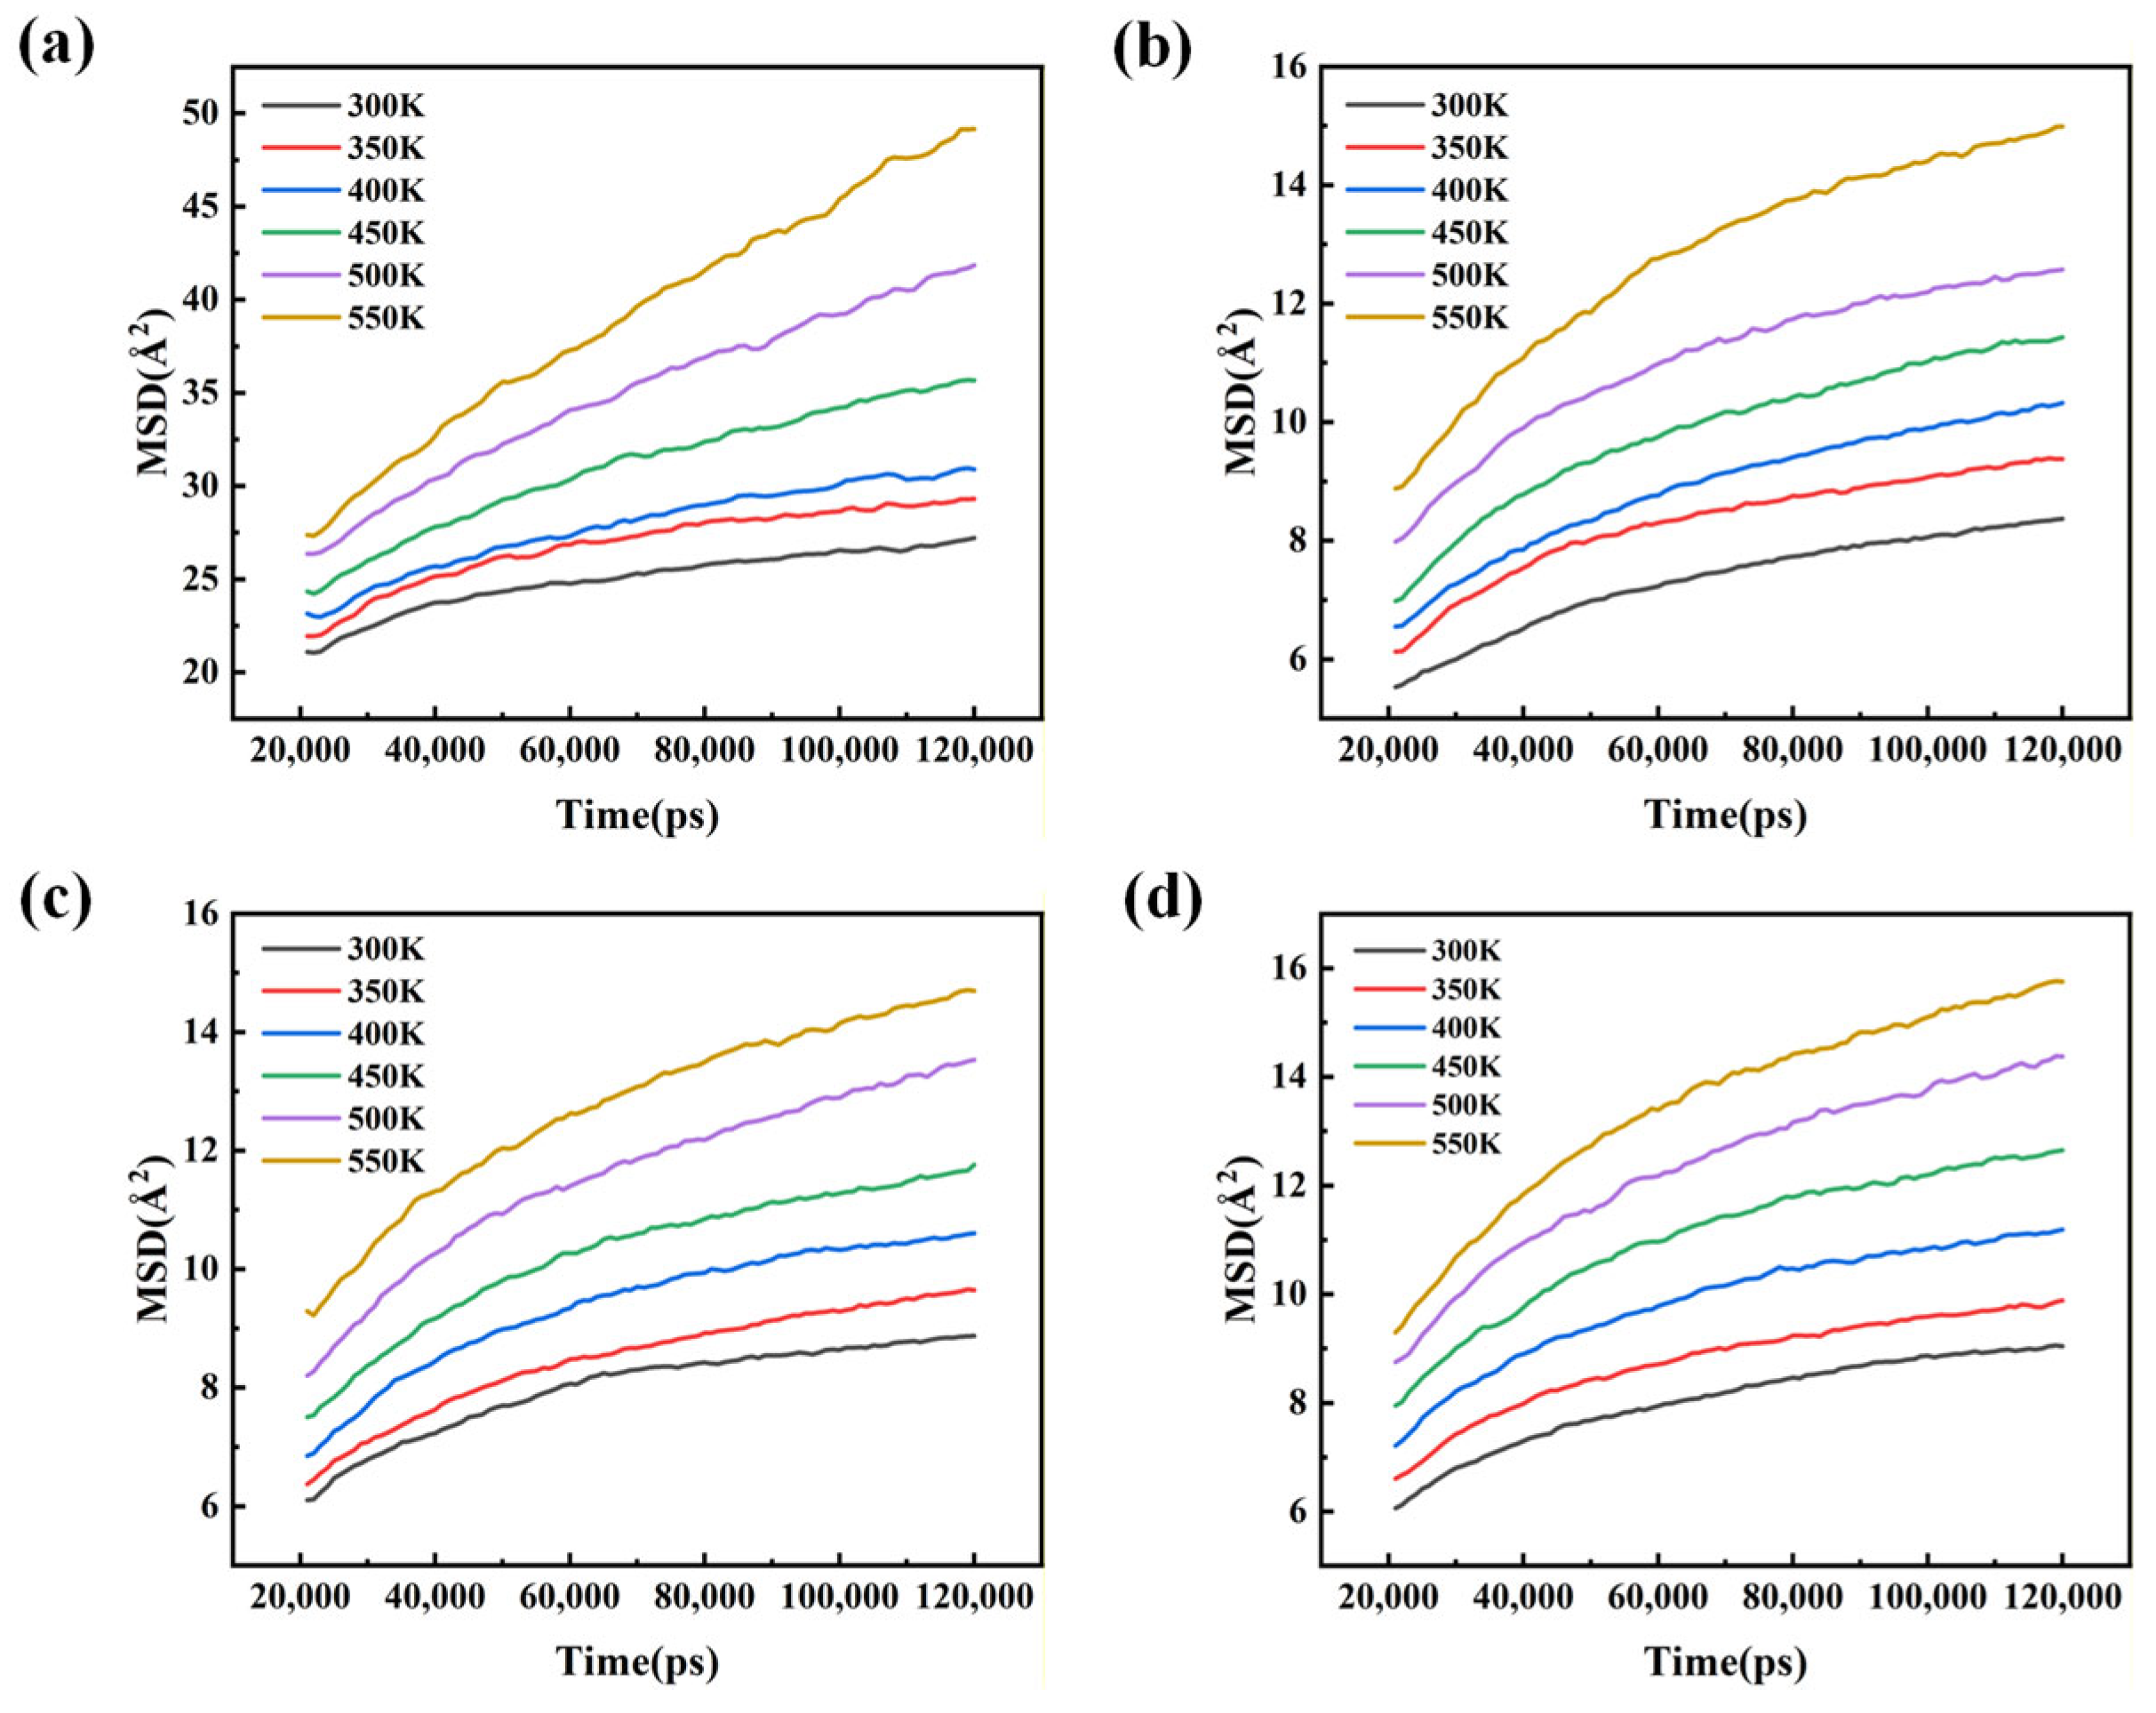
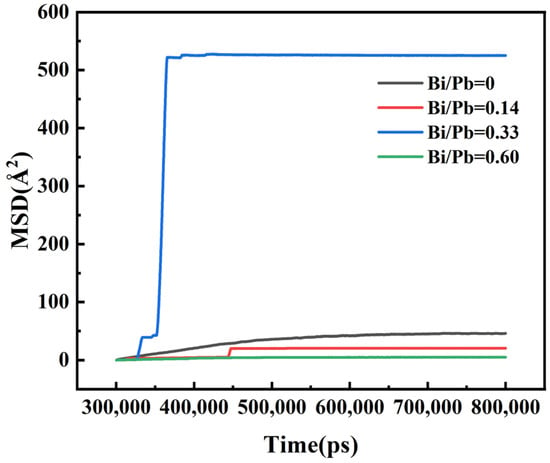
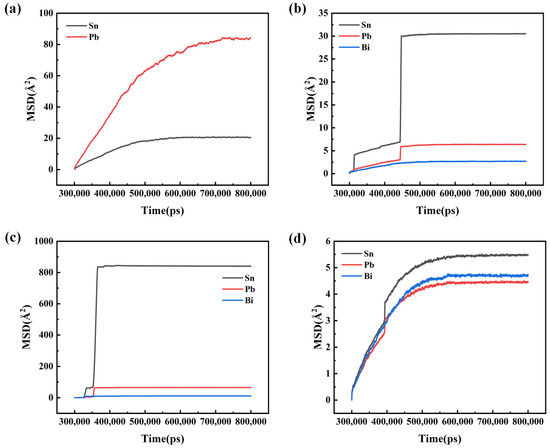
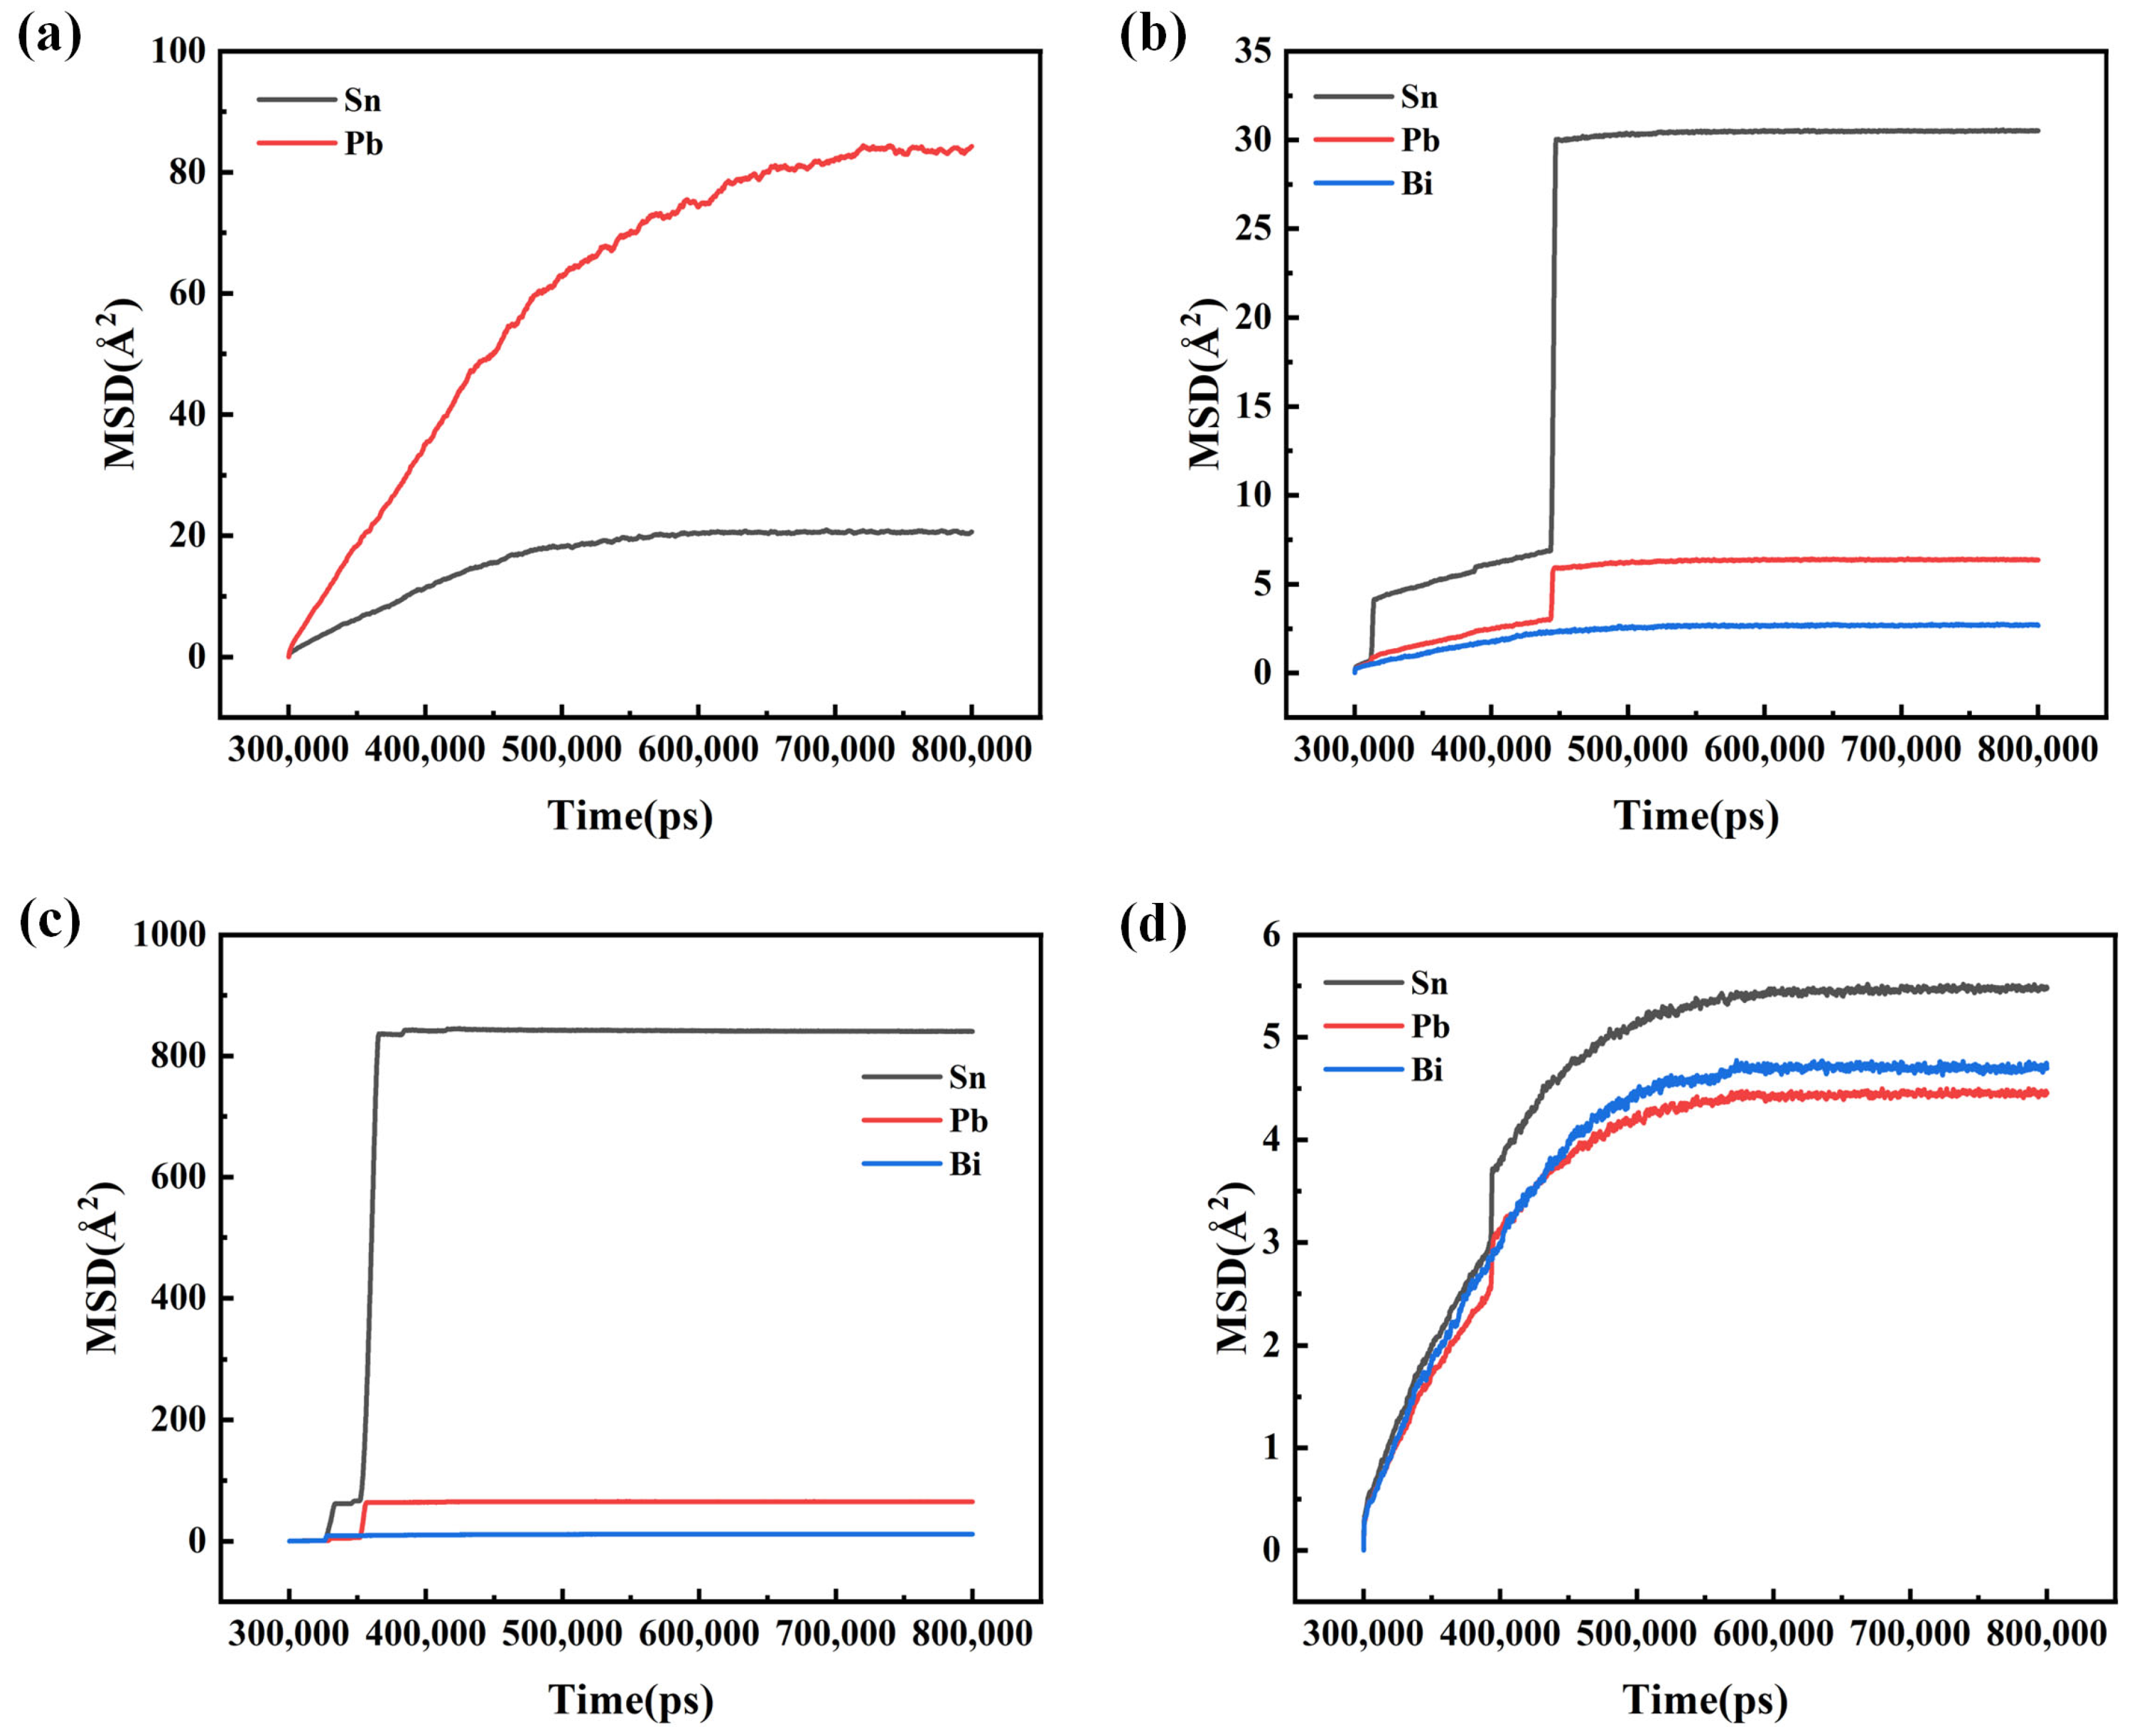
As shown in Figure 15, Figure 16 and Figure 17, the mean square displacement (MSD) curves further elucidate the influence of the Bi/Pb ratio on atomic diffusion kinetics in Sn-Pb-Bi ternary alloys. Under identical temperature conditions, increasing Bi content significantly reduces the growth rate of MSD, indicating a pronounced suppression of atomic mobility. Within the liquid-phase temperature range of 300–550 K, all MSD curves increase continuously with the simulation time, with faster growth observed at higher temperatures. However, at a given temperature, the MSD reaches its highest value when Bi/Pb = 0 (approaching ~50 Å2 at 550 K), while it decreases markedly to approximately 15 Å2 at Bi/Pb = 0.60, clearly demonstrating the inhibitory effect of Bi on atomic diffusion.
Figure 15.
Curves showing the time dependence of MSD for Sn-Pb-Bi alloys at different temperatures: (a) Bi/Pb = 0; (b) Bi/Pb = 0.14; (c) Bi/Pb = 0.33; (d) Bi/Pb = 0.60.
Figure 16.
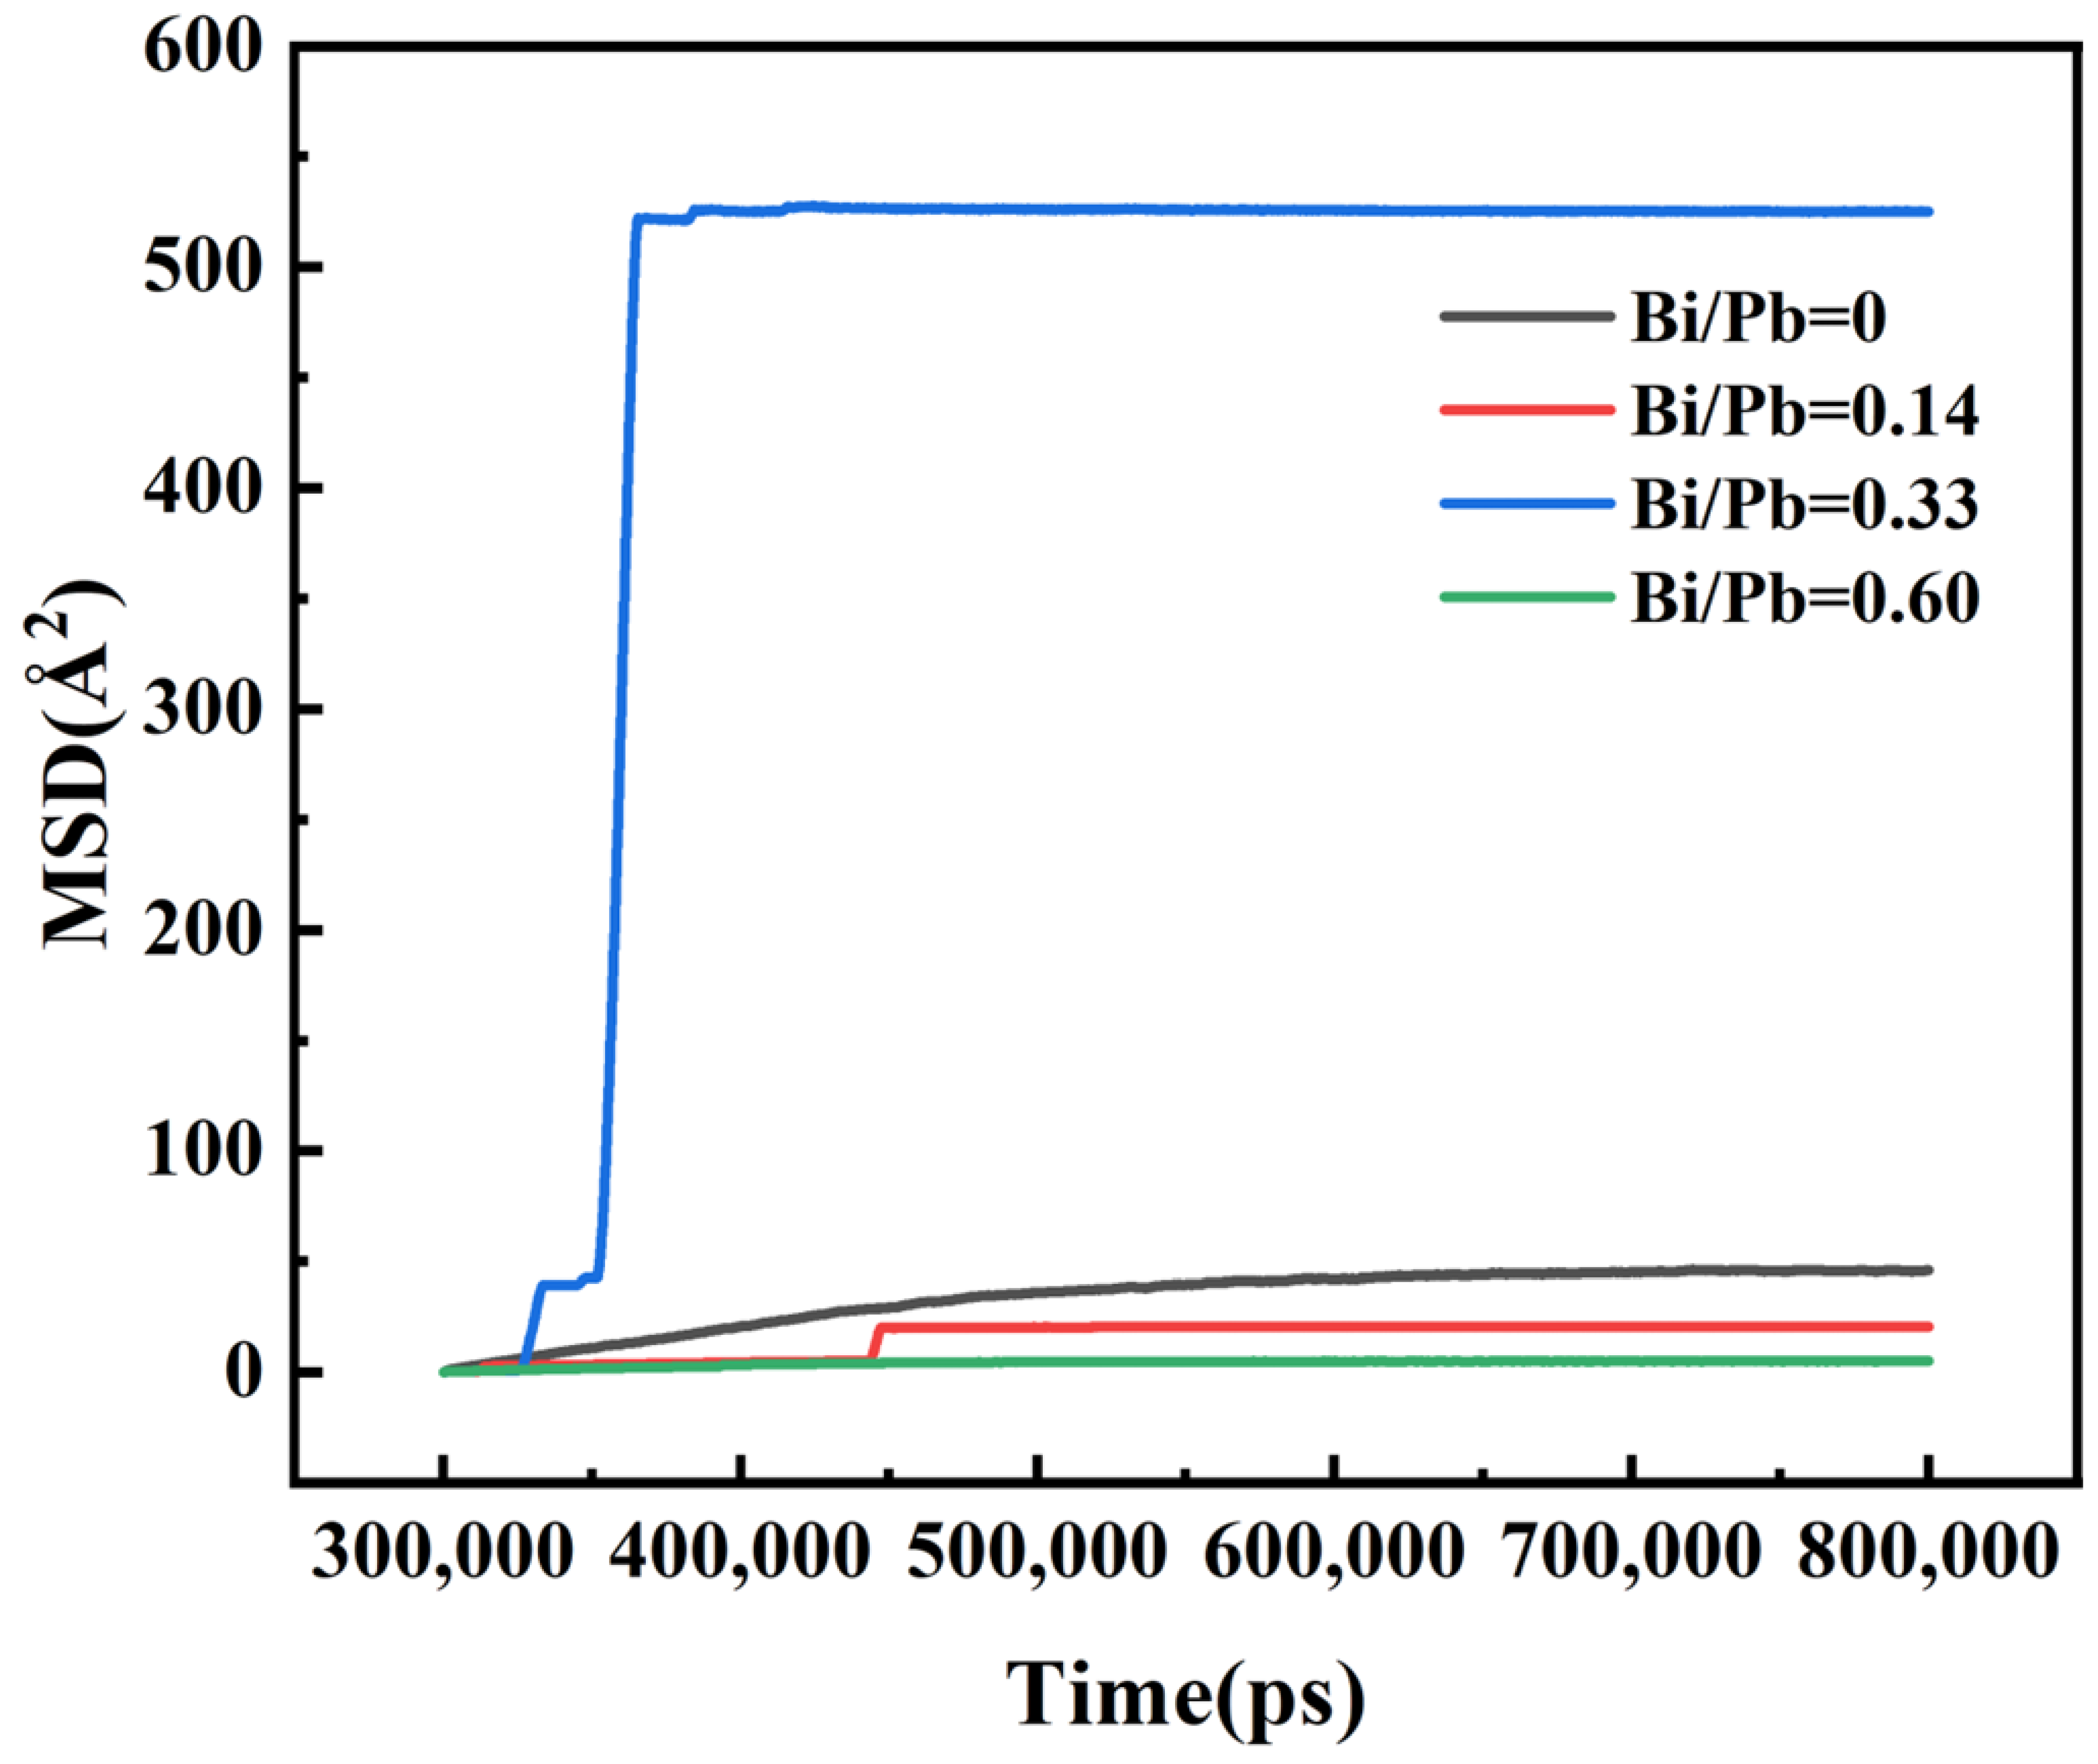
Curves showing the change in MSD over time for Sn-Pb-Bi alloys with different composition ratios.
Figure 17.
Curves showing the time-dependent MSD of each element in Sn-Pb-Bi alloys: (a) Bi/Pb = 0; (b) Bi/Pb = 0.14; (c) Bi/Pb = 0.33; (d) Bi/Pb = 0.60.
Figure 16 further presents MSD behavior over extended simulation times. In the later stages, MSD exhibits a strong linear dependence on time, and the slope varies systematically with both temperature and composition. Increasing Bi content generally reduces the slope, corresponding to a lower diffusion coefficient. Meanwhile, the alloy with Bi/Pb = 0.33 shows noticeable kinetic fluctuations under these conditions, which is consistent with the presence of local atomic clustering inferred from the viscosity and RDF analyses.
Figure 17, which presents an element-resolved MSD analysis, provides more detailed atomistic insight. Bi exerts a stronger restraining effect on the migration of both Pb atoms and its own species. At low Bi concentrations, the MSD of Pb is significantly higher than that of Sn, while Bi exhibits the lowest MSD, indicating strong interactions between Bi and Pb atoms. As the Bi/Pb ratio increases to 0.60, the MSD curves of Sn, Pb, and Bi converge and become highly consistent, suggesting that the overall diffusion behavior is governed by a Bi-dominated local structural environment. In this regime, the mobility of Sn and Pb is effectively reduced to levels comparable to that of Bi. This behavior arises directly from Bi-induced short-range chemical ordering and compositional segregation effects.
The MSD-derived kinetic parameters are consistent with the results from RDF, viscosity, and phase-transition temperature analyses. Together, they demonstrate that Bi precisely regulates the melting and solidification behavior, as well as the liquid-state transport properties of Sn-Pb-Bi alloys at the atomic scale through a combination of solid-solution effects, segregation behavior, and chemically driven short-range ordering.
4. Discussion
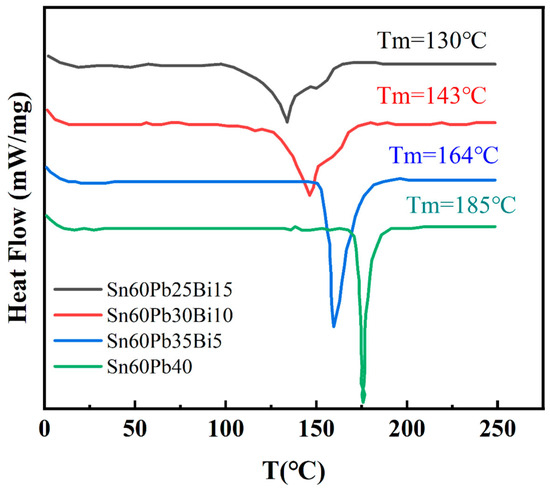
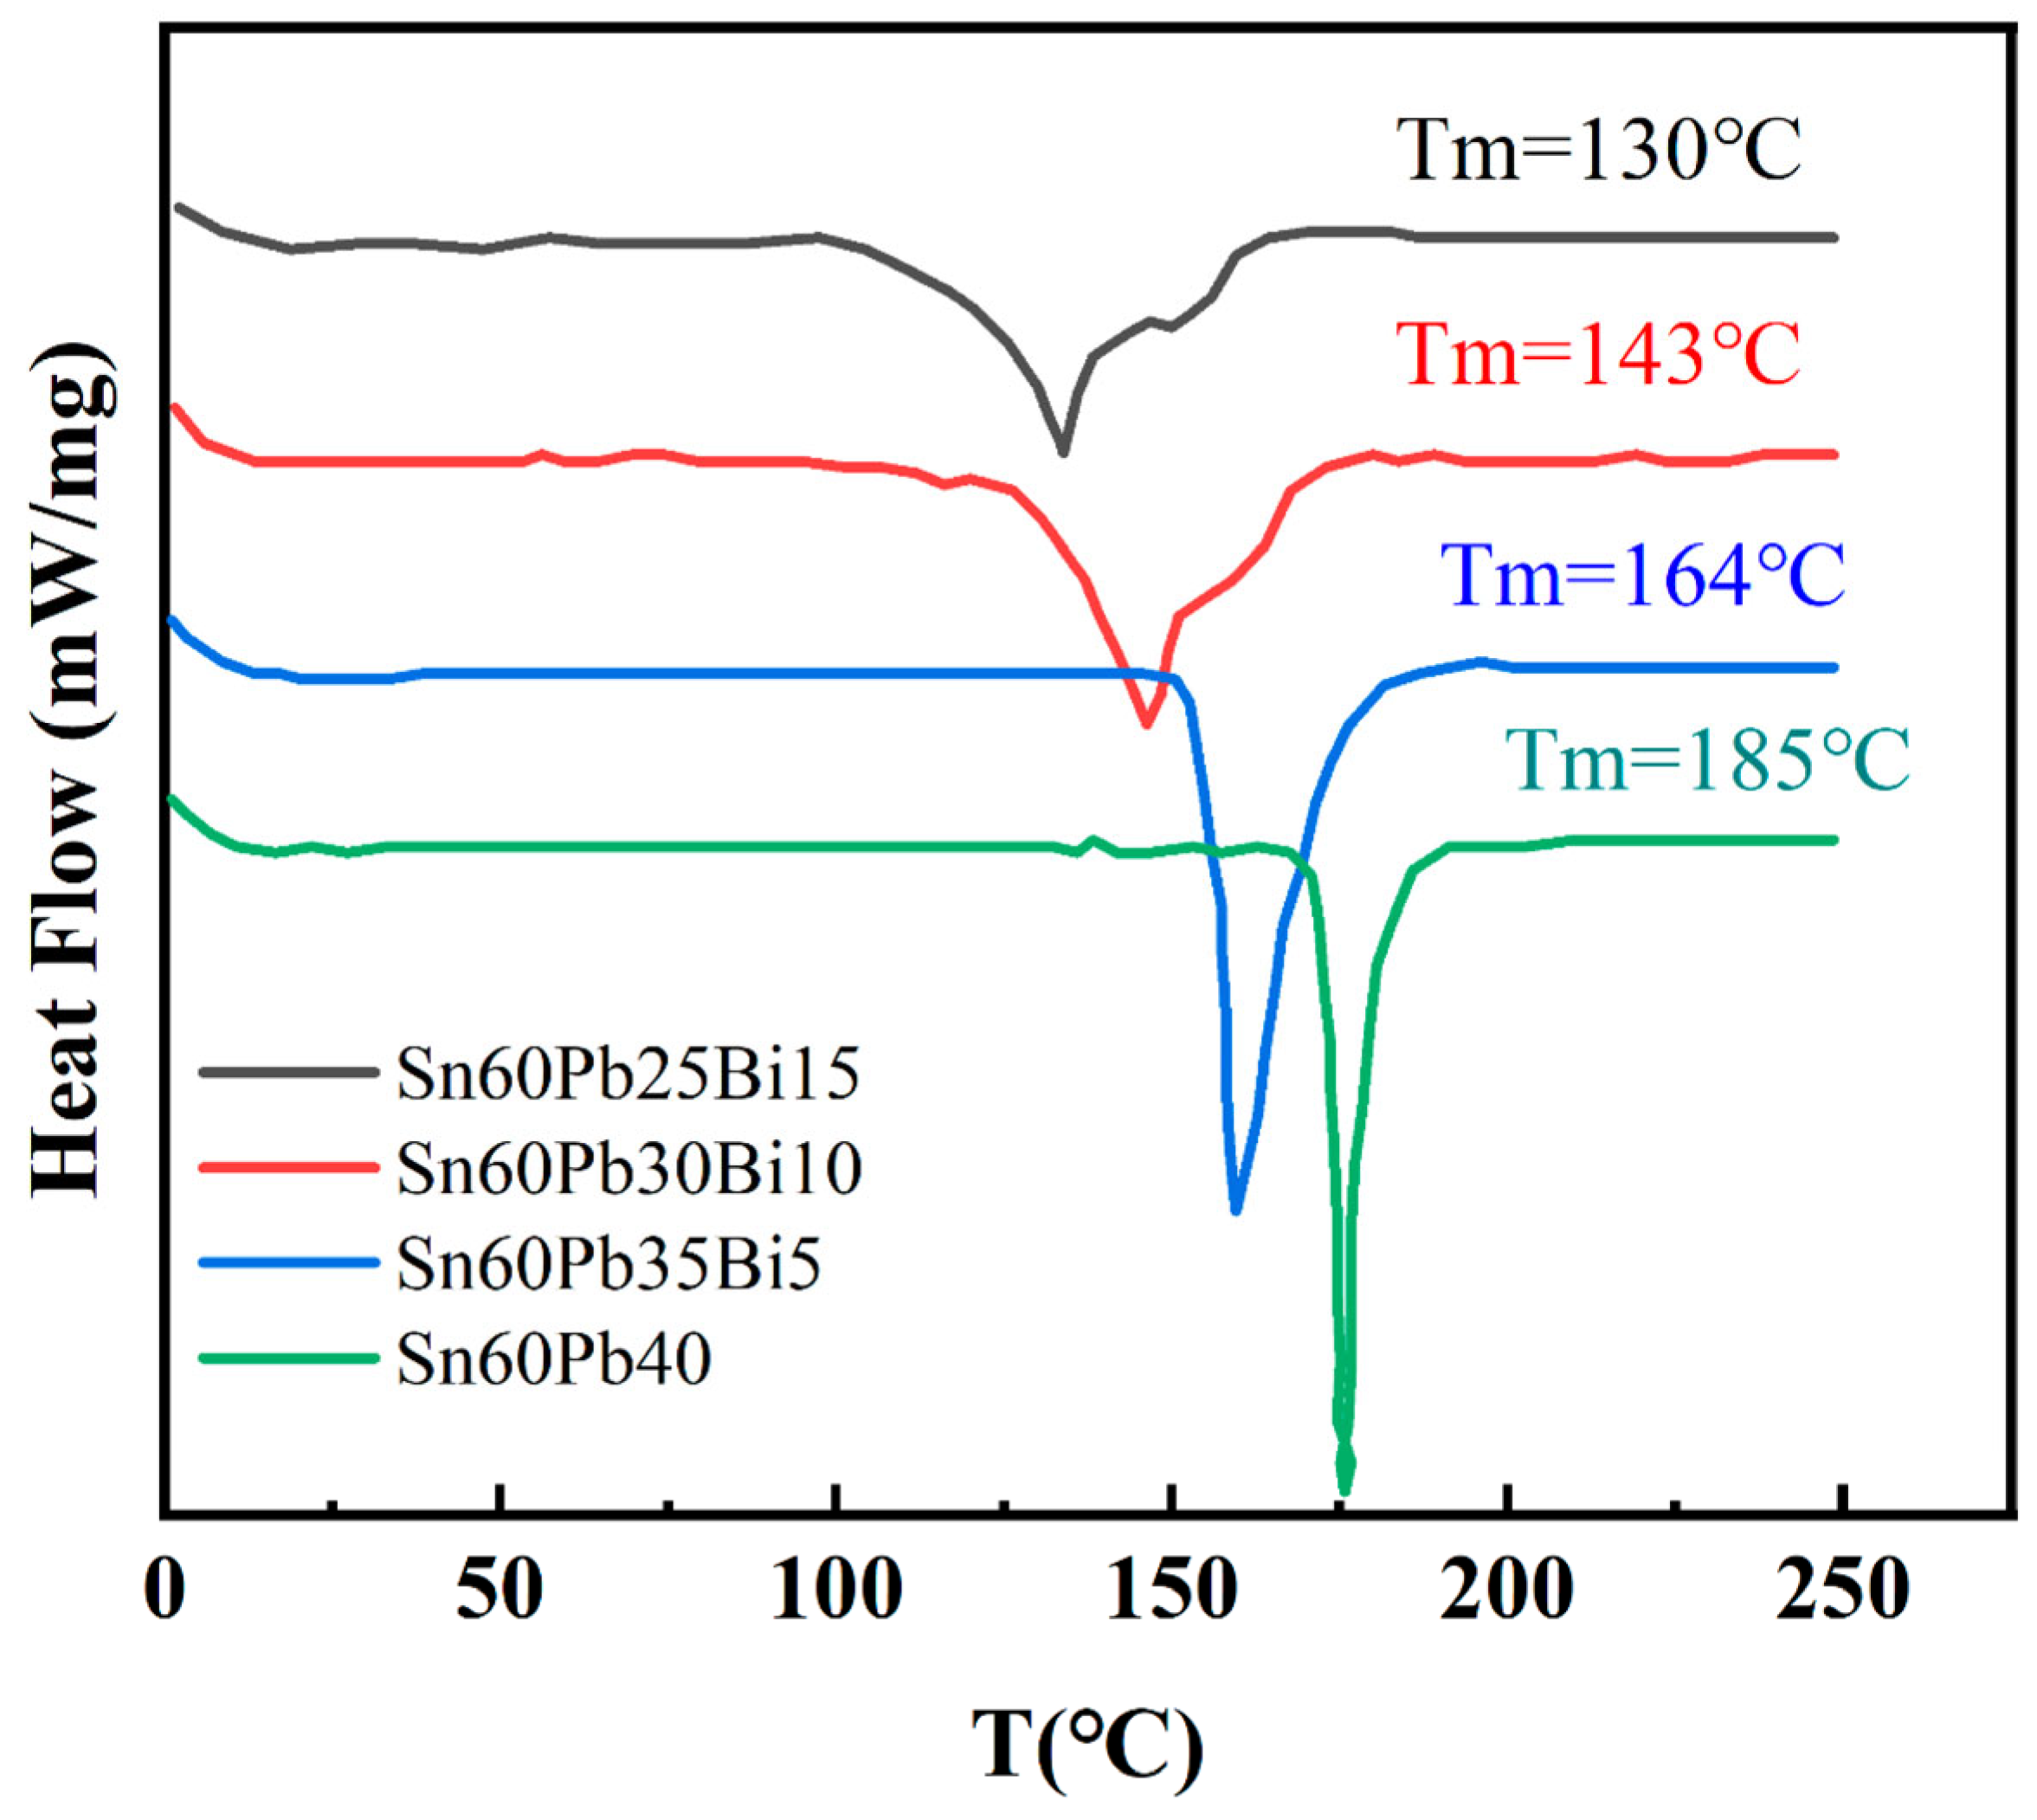
In this study, a combined approach of experimental characterization and deep potential molecular dynamics (DeePMD) simulations was employed to systematically elucidate the mechanism by which Bi content regulates the phase transformation characteristics and wetting behavior of Sn-Pb-Bi ternary alloys. The DSC curves in Figure 18 show that as the Bi content increases from 0 to 15 wt.%, corresponding to a Bi/Pb mass ratio increasing from 0 to 0.60, the alloy’s melting point (Tm) monotonically decreases from 185 °C to 130 °C. These DSC measurements were conducted at a heating rate of 5 K/min under a flowing nitrogen (N2) protective atmosphere to prevent oxidation. This trend is highly consistent with the DeePMD simulation’s prediction of a melting point decrease from 475 K to 450 K (approximately 202 °C to 177 °C). Although the experimental values are generally lower than the simulated values—a discrepancy that may stem from non-equilibrium effects caused by the 1 K/ps continuous heating rate used in the simulation—both sets of results collectively confirm the microscopic mechanism by which Bi, as a low-melting-point alloying element, effectively reduces the thermodynamic stability of the alloy through lattice distortion and weakening of metallic bonds. Notably, the experimental DSC curves show the most pronounced melting peak distortion and undercooling characteristics at a Bi content of 5 wt.% (Bi/Pb ≈ 0.14). This finding is consistent with the simulation results, which indicate that the undercooling ΔT reaches a maximum of ~48 K at this composition, suggesting that moderate Bi addition (Bi/Pb ≈ 0.14) yields the optimal effect in regulating solidification kinetics.
Figure 18.
DSC curves of Sn-Pb-Bi alloys with different Bi contents.
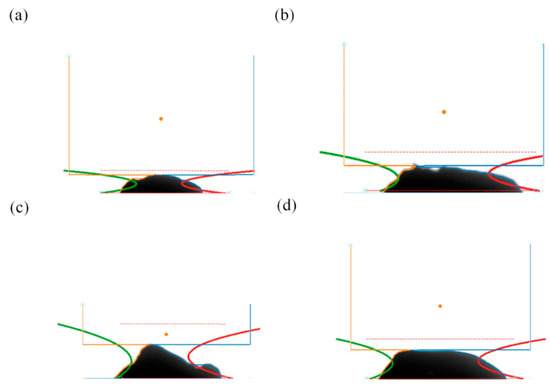
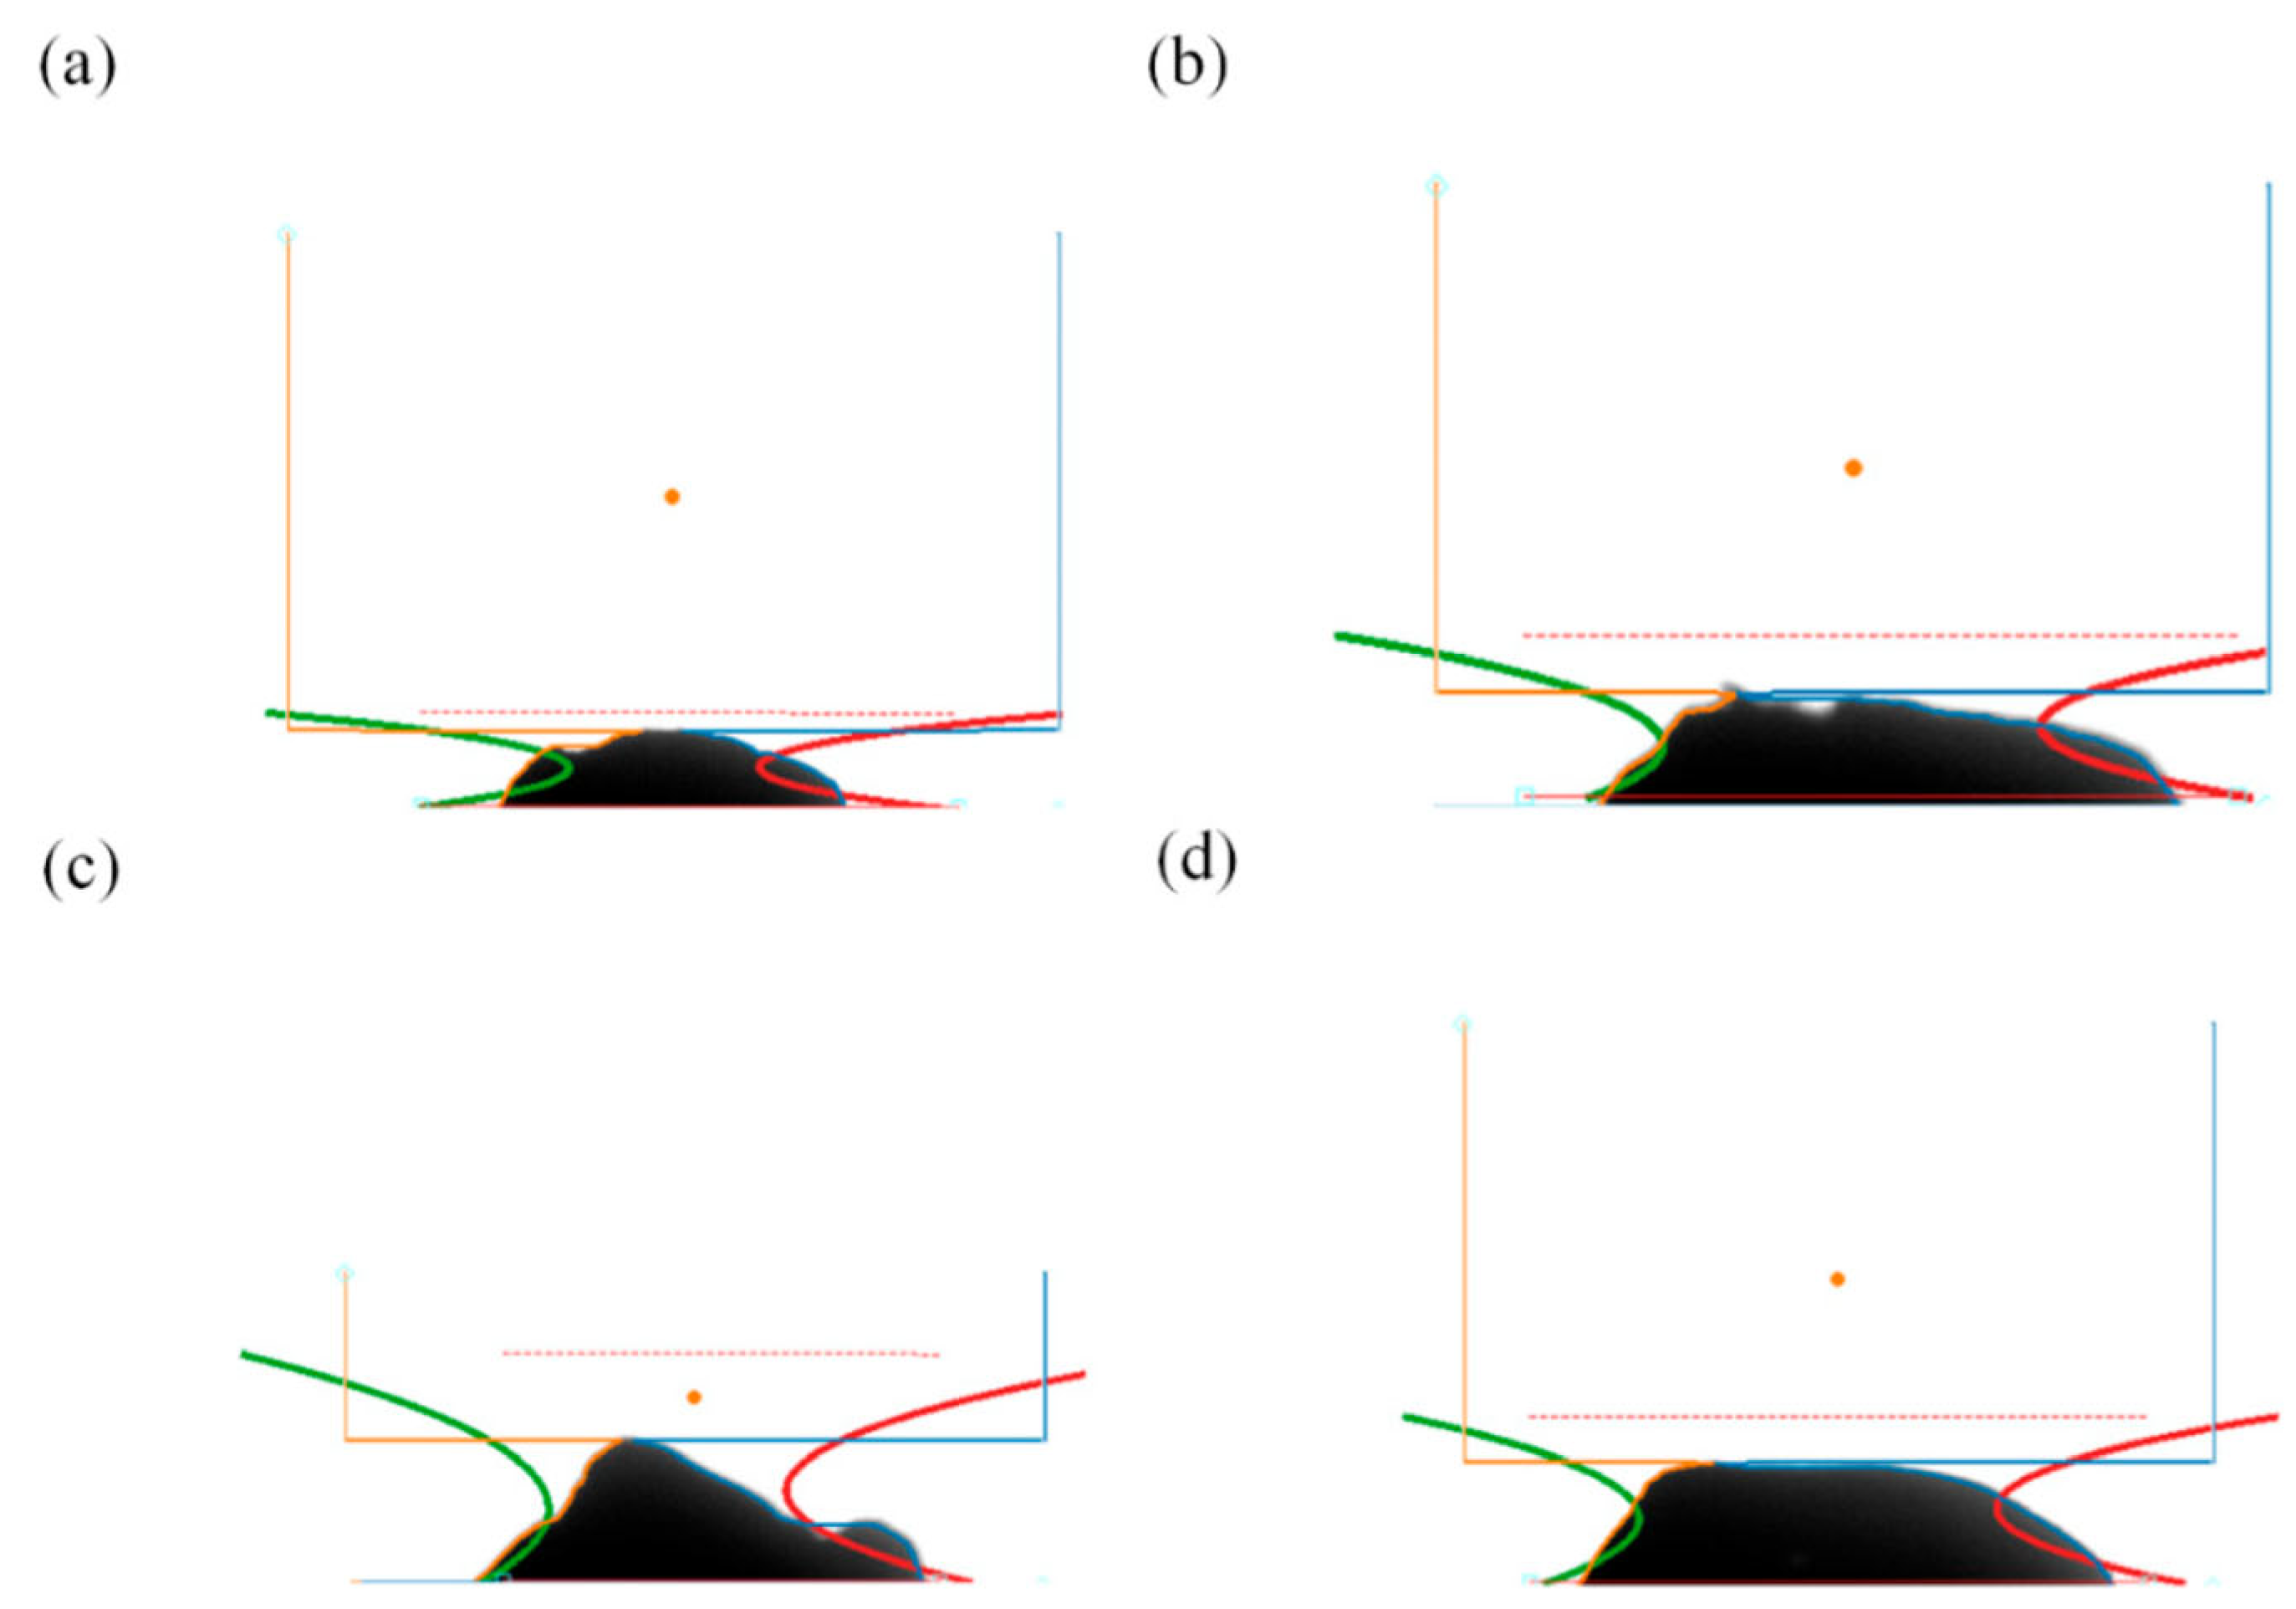
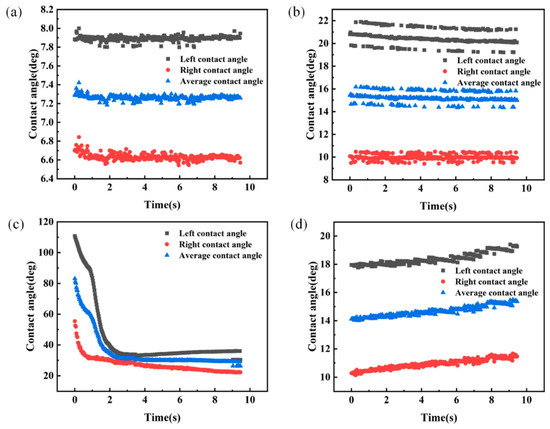
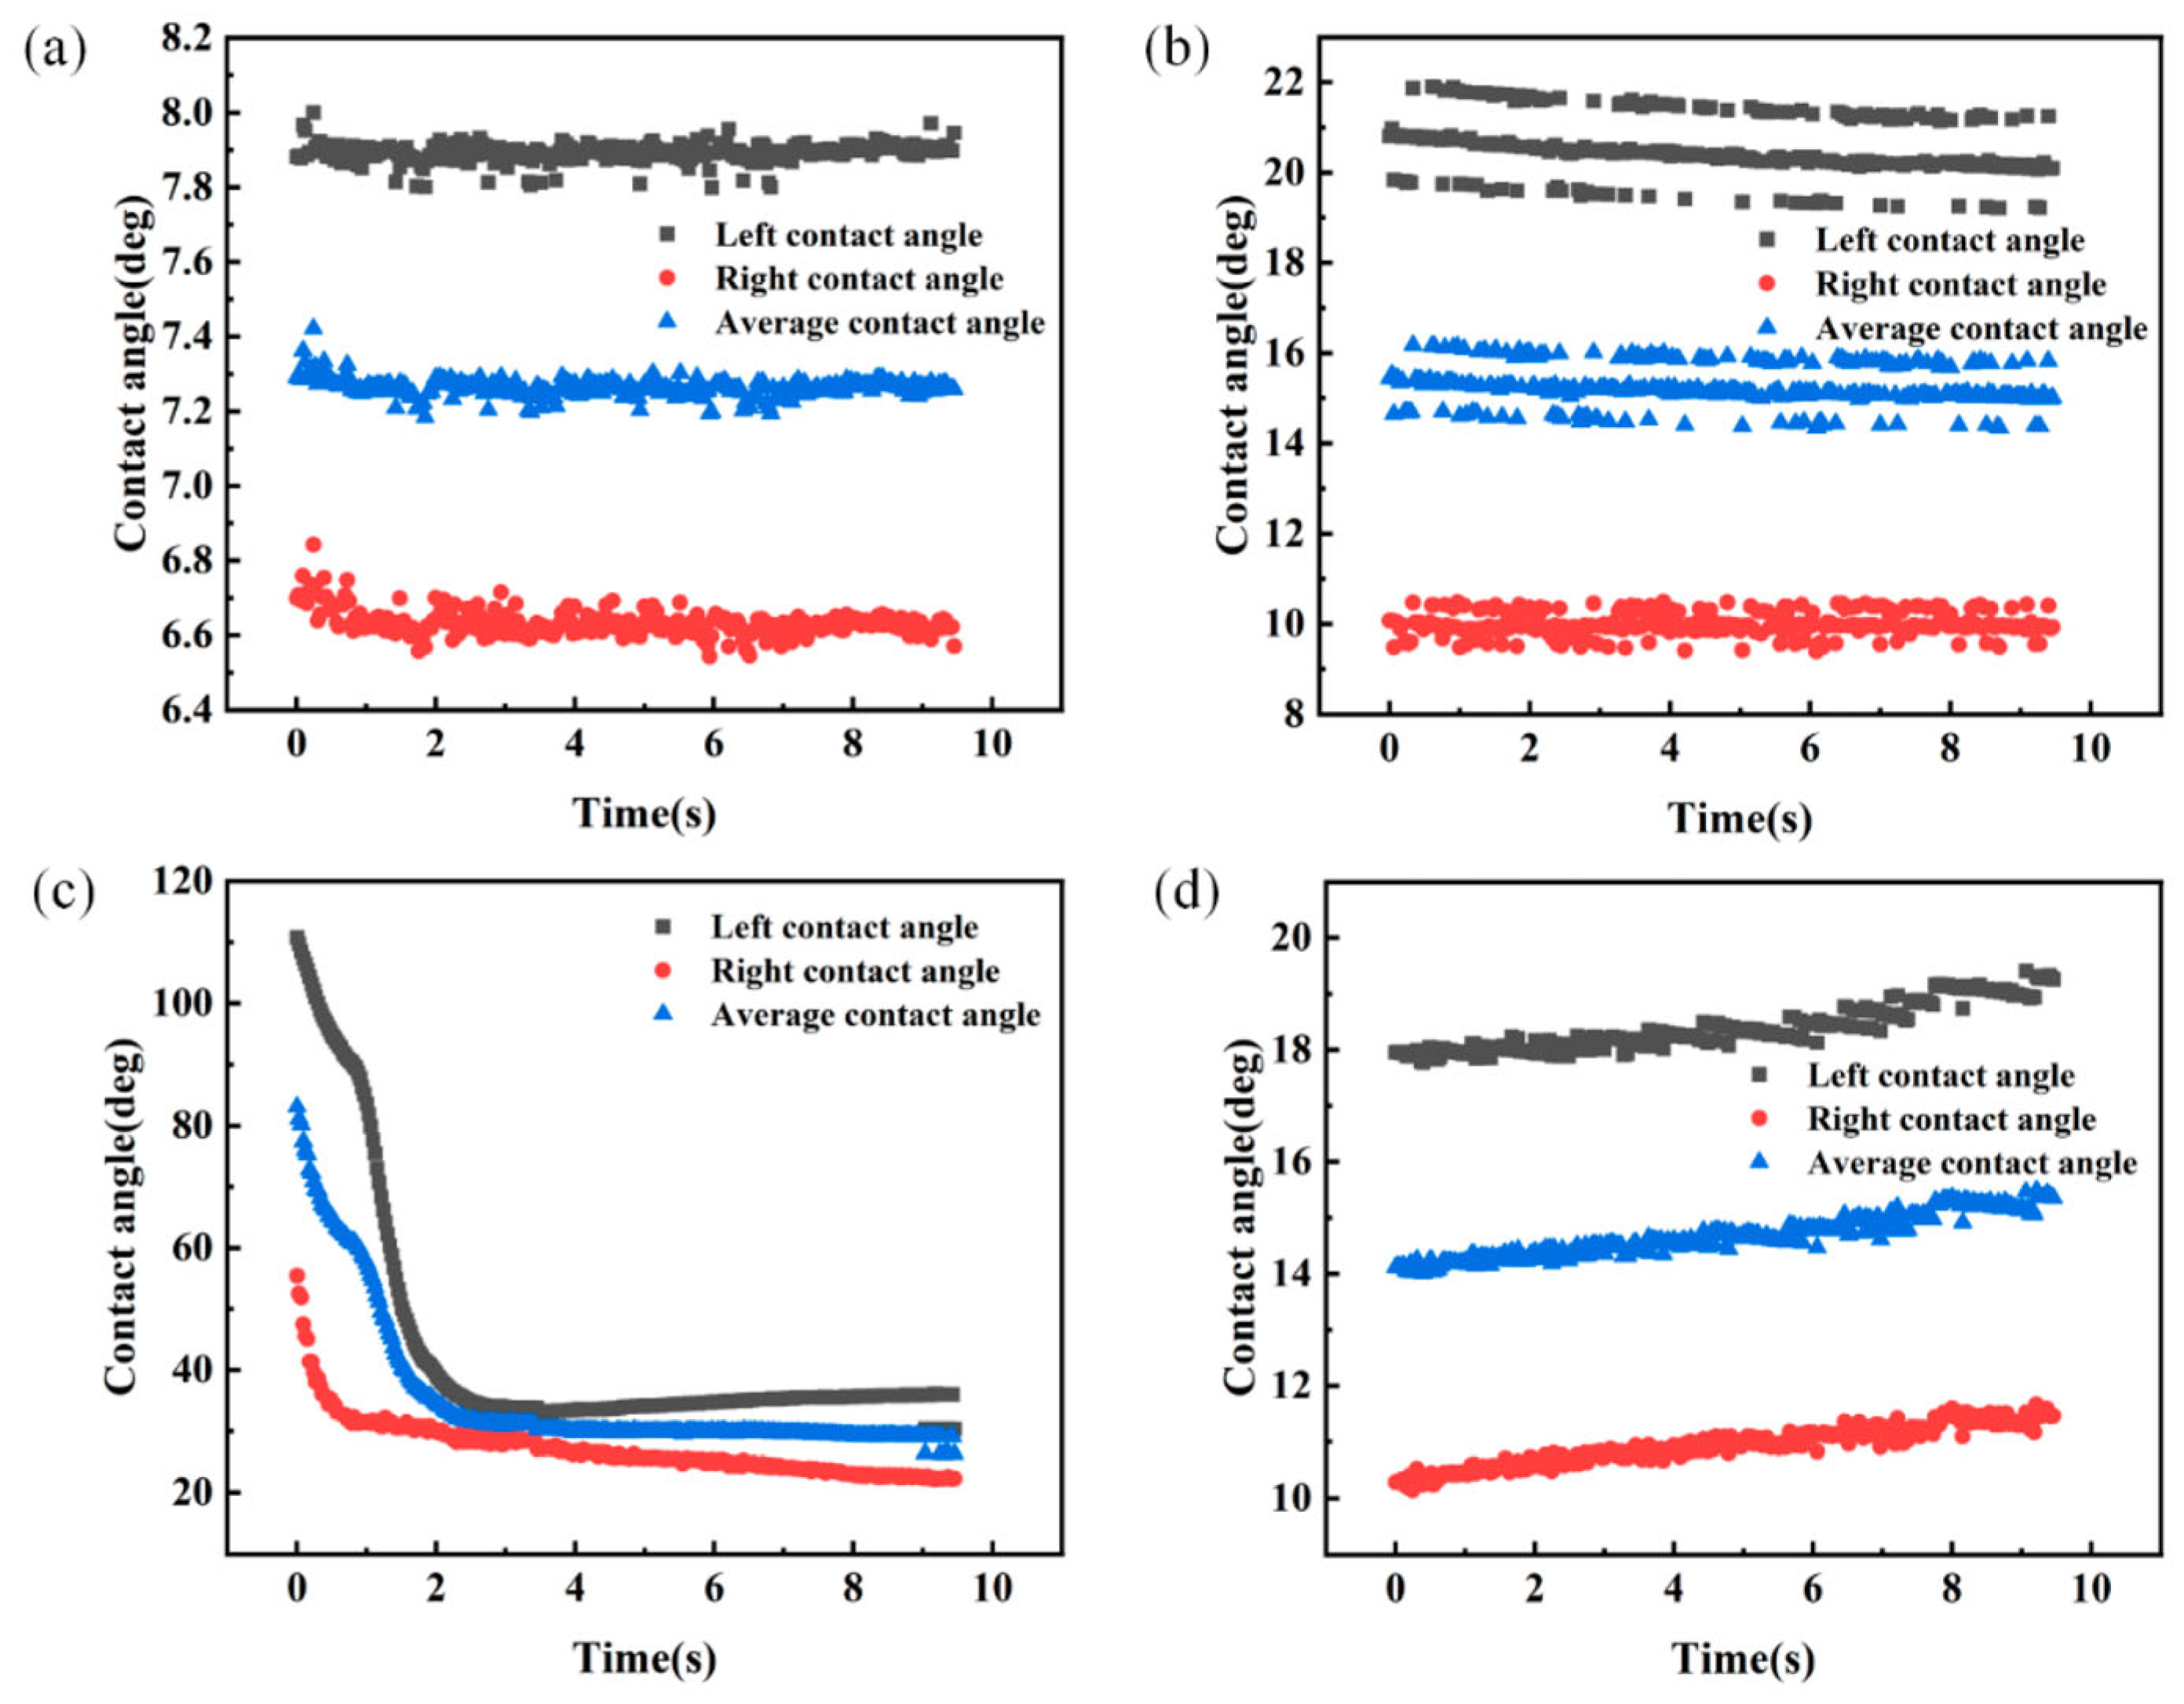
The liquid-state behavior under isothermal conditions was validated through contact angle measurements, which reflect the wetting and flowability of the molten solder at temperatures above the liquidus. As shown in Figure 19 and Figure 20, the contact angle tests were performed at a constant temperature of 200 °C (isothermal) under a nitrogen atmosphere. As can be seen from the static contact angle images, the droplet spreading for Bi/Pb = 0.14 and Bi/Pb = 0.33 is significantly better than that for Bi/Pb = 0 and Bi/Pb = 0.6, indicating that a moderate Bi content is beneficial for improving the substrate wettability of the liquid alloy. This observation is in close agreement with the viscosity–composition relationship predicted by DeePMD simulations that show that viscosity peaks at ~6.05 Pa·s for Bi/Pb = 0.14 and subsequently decreases as the Bi content increases further. The contact angle evolution curves in Figure 20 quantitatively validate this pattern: at Bi/Pb = 0.14, the initial contact angle is relatively high (approximately 21°) but gradually stabilizes over time, whereas at Bi/Pb = 0.33, the contact angle rapidly drops to and remains at a lower level of ~15°, indicating that this composition combines moderate flow resistance with good spreading kinetics. In contrast, at Bi/Pb = 0.60, the contact angle exhibits anomalous time-dependent fluctuations, which are directly related to the enhanced fluctuations in the liquid-phase structure and the increased tendency of Bi atoms to segregate that were observed in the simulations for this composition.
Figure 19.
Static contact angles of Sn-Pb-Bi alloys with different Bi contents measured at 200 °C under a nitrogen atmosphere (a) Bi/Pb = 0; (b) Bi/Pb = 0.14; (c) Bi/Pb = 0.33; (d) Bi/Pb = 0.60.
Figure 20.
Time-dependent evolution of contact angles of Sn-Pb-Bi alloys at 200 °C (a) Bi/Pb = 0; (b) Bi/Pb = 0.14; (c) Bi/Pb = 0.33; (d) Bi/Pb = 0.60.
5. Conclusions
In this study, the deep potential molecular dynamics (DeePMD) method was innovatively employed to systematically investigate the phase transformation behavior and atomistic mechanisms of Sn-Pb-Bi ternary alloys across four representative Bi/Pb mass ratios (0, 0.14, 0.33, and 0.60) in the temperature range of 300–600 K. A high-accuracy machine-learned interatomic potential was achieved using large-scale DFT-based AIMD datasets, achieving near-chemical accuracy (energy error < 5 meV/atom and force error < 100 meV/Å) while enabling large-scale, long-timescale simulations of complete solid–liquid–solid thermal cycles. This framework effectively overcomes the limitations of conventional EAM/MEAM potentials and the resolution constraints of experimental characterization, providing robust atomistic insights into the role of Bi in regulating the thermophysical behavior of the alloy system.
- (1)
- The key findings indicate that increasing the Bi/Pb ratio significantly reduces the melting temperature (Tm), with it decreasing monotonically from approximately 475 K (Bi/Pb = 0) to 450 K (Bi/Pb = 0.60). This behavior is attributed to Bi-induced lattice distortion, weakened metallic bonding, and an increase in solid-state free energy. In contrast, the solidification temperature (Ts) exhibits a non-monotonic trend, with notable undercooling occurring at Bi/Pb = 0.14, followed by a reduction in undercooling at higher Bi contents. These variations arise from the surface-active nature of Bi, which modifies heterogeneous nucleation barriers and phase-transition hysteresis.
- (2)
- Radial distribution function (RDF) analysis shows that Bi incorporation disrupts the short-range order of the Sn–Pb matrix, leading to broadened first-neighbor peaks, increased structural disorder, and the development of Bi-centered chemical short-range ordering. This process enhances chemical homogeneity in the liquid phase while inducing local compositional fluctuations at higher Bi concentrations. The kinetic properties further corroborate this composition-dependent behavior: the self-diffusion coefficient decreases sharply (by more than 70% at Bi/Pb = 0.14) and subsequently shows partial recovery, while the liquid viscosity reaches a maximum at moderate Bi content (~6.05 Pa·s) before decreasing. These trends are consistent with MSD results, which indicate suppressed atomic mobility, particularly for Pb and Bi atoms. Overall, these effects originate from increased atomic migration barriers associated with lattice distortion, electron redistribution, and cluster formation.
- (3)
- The results allow us to identify an optimal Bi/Pb ratio of approximately 0.14, which achieves a balanced combination of reduced melting temperature, controlled undercooling, refined solidification microstructure, and improved liquid flowability and wettability. This optimized composition provides valuable guidance for the design of low-melting-point, environmentally compatible Sn-Pb-Bi solders for photovoltaic ribbon interconnection and advanced electronic packaging, ultimately enhancing joint reliability and low-temperature process compatibility.
Author Contributions
Conceptualization, J.H.; methodology, D.F.; software, D.F.; validation, J.H., D.F., C.D. and J.X.; formal analysis, C.D.; investigation, J.X.; resources, J.X.; data curation, C.D.; writing—original draft preparation, D.F.; writing—review and editing, J.H.; visualization, D.F.; supervision, J.H.; project administration, J.H.; funding acquisition, J.H. All authors have read and agreed to the published version of the manuscript.
Funding
This work was supported by the Major Science and Technological Project of Gansu Province (No. 24ZDGD002).
Data Availability Statement
The original contributions presented in this study are included in the article. Further inquiries can be directed to the corresponding author.
Conflicts of Interest
The authors declare no conflicts of interest.
References
- Lee, H.B.; Kim, Y.W.; Kim, S.H.; Park, S.H.; Choi, J.; Aranas, C. A modular solder system with hierarchical morphology and backward compatibility. Small 2018, 14, e1801349. [Google Scholar] [CrossRef] [Scilit] [PubMed]
- Hao, Q.; Tan, X.; Gu, Q.; McDonald, S.D.; Nogita, K. The Effect of In Concentration and Temperature on Microstructure and Phase Transformation of Sn-Bi Based Low-Temperature Solder Alloys. Materials 2024, 17, 4372. [Google Scholar] [CrossRef] [Scilit] [PubMed]
- Zhou, J.; Tan, X.F.; Gu, Q.; McDonald, S.D.; Nogita, K. The Temperature-Dependent Phase Transformation and Microstructural Characterisation in In-Sn Solder Alloys. JOM 2023, 75, 3149–3161. [Google Scholar] [CrossRef] [Scilit]
- Zhang, L.; Han, J.; Wang, H.; Car, R.; E, W. Deep potential molecular dynamics: A scalable model with the accuracy of quantum mechanics. Phys. Rev. Lett. 2018, 120, 143001. [Google Scholar] [CrossRef] [Scilit]
- Hao, Q.; Tan, X.F.; Gu, Q.; Sweatman, K.; McDonald, S.D.; Nogita, K. The effects of temperature and solute diffusion on volume change in Sn-Bi solder alloys. JOM 2022, 74, 1739–1750. [Google Scholar] [CrossRef] [Scilit]
- Kang, H.; Rajendran, S.H.; Jung, J.P. Low melting temperature Sn-Bi solder: Effect of alloying and nanoparticle addition on the microstructural, thermal, interfacial bonding, and mechanical characteristics. Metals 2021, 11, 364. [Google Scholar] [CrossRef] [Scilit]
- Ko, W.-S.; Lee, J.S.; Kim, D.-H. Atomistic simulations of Ag–Cu–Sn alloys based on a new modified embedded-atom method interatomic potential. J. Mater. Res. 2022, 37, 145–161. [Google Scholar] [CrossRef] [Scilit]
- Liu, J.; Zhang, G.; Wang, J.; Zhang, H.; Han, Y. Research on Cu-Sn machine learning interatomic potential with active learning strategy. Comput. Mater. Sci. 2025, 246, 113450. [Google Scholar] [CrossRef] [Scilit]
- Behler, J.; Parrinello, M. Generalized neural-network representation of high-dimensional potential-energy surfaces. Phys. Rev. Lett. 2007, 98, 146401. [Google Scholar] [CrossRef] [Scilit]
- Bartók, A.P.; Payne, M.C.; Kondor, R.; Csányi, G. Gaussian approximation potentials: The accuracy of quantum mechanics, without the electrons. Phys. Rev. Lett. 2010, 104, 136403. [Google Scholar] [CrossRef] [Scilit]
- Schütt, K.T.; Arbabzadah, F.; Chmiela, S.; Müller, K.R.; Tkatchenko, A. Quantum-chemical insights from deep tensor neural networks. Nat. Commun. 2017, 8, 13890. [Google Scholar] [CrossRef] [Scilit]
- Fan, Z.; Zeng, Z.; Zhang, C.; Wang, Y.; Song, K.; Dong, H.; Chen, Y.; Ala-Nissila, T. Neuroevolution machine learning potentials: Combining high accuracy and low cost in atomistic simulations and application to heat transport. Phys. Rev. B 2021, 104, 104309. [Google Scholar] [CrossRef] [Scilit]
- Han, J.; Zhang, L.; Car, R.; E, W. Deep potential: A general representation of a many-body potential energy surface. arXiv 2017, arXiv:1707.01478. [Google Scholar] [CrossRef] [Scilit]
- Perdew, J.P.; Burke, K.; Wang, Y. Generalized gradient approximation for the exchange-correlation hole of a many-electron system. Phys. Rev. B 1996, 54, 16533–16539. [Google Scholar] [CrossRef] [Scilit]
- Blöchl, P.E. Projector augmented-wave method. Phys. Rev. B 1994, 50, 17953–17979. [Google Scholar] [CrossRef] [Scilit] [PubMed]
- Kresse, G.; Joubert, D. From ultrasoft pseudopotentials to the projector augmented-wave method. Phys. Rev. B 1999, 59, 1758–1775. [Google Scholar] [CrossRef] [Scilit]
- Monkhorst, H.J.; Pack, J.D. Special points for Brillouin-zone integrations. Phys. Rev. B 1976, 13, 5188–5192. [Google Scholar] [CrossRef] [Scilit]
- Patel, A.M.; Nørskov, J.K.; Persson, K.A.; Montoya, J.H. Efficient Pourbaix diagrams of many-element compounds. Phys. Chem. Chem. Phys. 2019, 21, 25323–25327. [Google Scholar] [CrossRef] [Scilit]
- Kresse, G.; Furthmüller, J. Efficient iterative schemes for ab initio total-energy calculations using a plane-wave basis set. Phys. Rev. B 1996, 54, 11169–11186. [Google Scholar] [CrossRef] [Scilit] [PubMed]
- Plimpton, S. Fast parallel algorithms for short-range molecular dynamics. J. Comput. Phys. 1995, 117, 1–19. [Google Scholar] [CrossRef] [Scilit]
- Zhang, L.F.; Han, J.; Wang, H.; Saidi, W.; Car, R. End-to-end symmetry preserving inter-atomic potential energy model for finite and extended systems. In Advances in Neural Information Processing Systems; Curran Associates, Inc.: Red Hook, NY, USA, 2018; Volume 31. [Google Scholar]
- Tian, H.; Liu, T.; Lan, X. Deep-learning-driven prediction strategy for the phase transition behavior of alkali chloride XCl (X = Li, Na, or K). Langmuir 2025, 41, 27401–27408. [Google Scholar] [CrossRef] [Scilit]
- Zeng, J.; Zhang, D.; Lu, D.; Mo, P.; Li, Z.; Chen, Y.; Rynik, M.; Huang, L.; Li, Z.; Shi, S.; et al. DeePMD-kit v2: A software package for deep potential models. J. Chem. Phys. 2023, 159, 054801. [Google Scholar] [CrossRef] [Scilit]
- Lu, D.; Wang, H.; Chen, M.; Lin, L.; Car, R.; E, W.; Jia, W.; Zhang, L. 86 PFLOPS deep potential molecular dynamics simulation of 100 million atoms with ab initio accuracy. Comput. Phys. Commun. 2021, 259, 107624. [Google Scholar] [CrossRef] [Scilit]
- Lu, D.; Jiang, W.; Chen, Y.; Zhang, L.; Jia, W.; Wang, H.; Chen, M. DP compress: A model compression scheme for generating efficient deep potential models. J. Chem. Theory Comput. 2022, 18, 5559–5567. [Google Scholar] [CrossRef] [Scilit]
- Zhang, L.; Lin, D.-Y.; Wang, H.; Car, R.; E, W. Active learning of uniformly accurate interatomic potentials for materials simulation. Phys. Rev. Mater. 2019, 3, 023804. [Google Scholar] [CrossRef] [Scilit]
- Zeng, J.; Zhang, L.; Wang, H.; Zhu, T. Exploring the chemical space of linear alkane pyrolysis via deep potential generator. Energy Fuels 2020, 35, 762–769. [Google Scholar] [CrossRef] [Scilit]
- Long, C.; Li, R.; Zhao, P.; Li, Z.; Kang, S.; Li, D.; Liu, H. Understanding the nanoindentation edge effect of single-crystal silicon using molecular dynamics simulations. Micromachines 2025, 16, 814. [Google Scholar] [CrossRef] [Scilit]
- Du, D.; Wu, P.; Liu, H.; Li, Z.; Tan, J. Nanoindentation response of monocrystalline copper via molecular dynamics: Anisotropic edge effects. Micromachines 2025, 16, 570. [Google Scholar] [CrossRef] [Scilit]
- Goharshadi, E.K. A review on the radial distribution function: Insights into molecular structure, intermolecular interactions, and thermodynamic properties. J. Mol. Liq. 2025, 433, 127900. [Google Scholar] [CrossRef] [Scilit]
- Jaradat, A.; Al-Salman, R.; Obeidat, A. Self-diffusion and shear viscosity of pure 1-alkanol unary system: Molecular dynamics simulation and review of experimental data. RSC Adv. 2024, 14, 22947–22961. [Google Scholar] [CrossRef] [Scilit] [PubMed]
- Meel, A.K.; Mogurampelly, S. A Hybrid Green–Kubo (hGK) Framework for Calculating Viscosity from Short MD Simulations. J. Phys. Chem. Lett. 2026, 17, 4016–4022. [Google Scholar] [CrossRef] [Scilit] [PubMed]
- Arampour, M.E.; Jin, H.; Chen, L.; Fan, J. Finite-size effect on self-diffusion. Phys. Fluids 2025, 37, 082066. [Google Scholar] [CrossRef] [Scilit]
- Bashiri, M.; Shojaeefard, M.H.; Qasemian, A. Molecular dynamics simulations and experimental investigation of viscosity of CuO-oil nanolubricant at different temperatures and volume fractions of nanoparticles. J. Mol. Graph. Model. 2024, 129, 108750. [Google Scholar] [CrossRef] [Scilit] [PubMed]
- Phillies, G.D.J. Mean-Square Displacements of Simulated Polymers. Polymers 2025, 17, 1193. [Google Scholar] [CrossRef] [Scilit] [PubMed]

Disclaimer/Publisher’s Note: The statements, opinions and data contained in all publications are solely those of the individual author(s) and contributor(s) and not of MDPI and/or the editor(s). MDPI and/or the editor(s) disclaim responsibility for any injury to people or property resulting from any ideas, methods, instructions or products referred to in the content. |
© 2026 by the authors. Licensee MDPI, Basel, Switzerland. This article is an open access article distributed under the terms and conditions of the Creative Commons Attribution (CC BY) license.