


Abstract
The α-phase microstructure and texture of a Ti-6Al-4V-0.5Ni-0.5Nb titanium alloy hot-rolled plate can easily lead to anisotropy in impact toughness. This study observed the microstructure and texture of the alloy plate on different planes, conducted impact toughness tests using four combinations of loading direction and crack propagation plane, analyzed the fracture morphology, and investigated the effects of texture and microstructure on the anisotropy of impact toughness. The differences in crack initiation and propagation behavior are discussed. The results show that the impact toughness of the four types of specimens exhibits strong anisotropy. Among them, the L-S specimen (fracture on TD-ND plane, loading along ND) shows the highest impact toughness (97.75 J/cm2), while the T-L specimen (fracture on RD-ND plane, loading along RD) shows the lowest (46.7 J/cm2). Analysis suggests that the strong T-type texture in the plate makes activating slip systems significantly easier for fracture on the TD-ND plane compared to the RD-ND plane. Consequently, the former demonstrates better plastic deformation ability during both crack initiation and propagation. Additionally, the elongated characteristic of α laths along the RD/TD direction and the grain boundary features cause a more tortuous crack path and greater energy consumption when the crack propagates along the ND direction. The combined effect of texture and microstructure determines the anisotropy of impact toughness in this alloy.
1. Introduction
Ti-6Al-4V titanium alloy has been widely used in industrial manufacturing, aerospace, biomedicine, and other fields due to its excellent comprehensive properties, including high temperature resistance, high specific strength, outstanding corrosion resistance, and good biocompatibility [1,2,3]. As an α + β dual-phase titanium alloy, Ti-6Al-4V contains a certain amount of α-stabilizing element (Al) and β-stabilizing element (V), combining the advantages of α-type and β-type titanium alloys. Al atoms dissolve in the matrix, providing solid solution strengthening and effectively increasing the alloy’s strength. Furthermore, Al atoms help improve the alloy’s heat resistance and corrosion resistance, allowing it to perform well in high-temperature and corrosive environments. The addition of V not only helps increase the alloy’s strength but also reduces the axial ratio of the α phase, enabling the alloy to maintain good plasticity during deformation and processing.
By adding Ni and Nb, the Ti-6Al-4V-0.5Ni-0.5Nb alloy further stabilizes the β phase, increases its strength, and improves its corrosion resistance and toughness, the 0.5 wt% level was selected to achieve a measurable effect while maintaining the workability [4]. This alloy can achieve an optimal match of strength and toughness through microstructural adjustment, which gives it excellent workability and broad industrial applicability. However, at room temperature, α + β dual-phase titanium alloy’s microstructure contains a relatively large amount of α phase. The α phase in titanium alloys has a hexagonal close-packed (HCP) structure. Due to the low symmetry, HCP structure has fewer activatable slip systems [5], resulting in limited plastic deformation ability and a tendency to form preferred orientations. This leads to anisotropy in various mechanical properties, such as Young’s modulus, yield strength, impact toughness, and fracture toughness [6]. Additionally, the dual-phase titanium alloy’s microstructure, including prior β grains, α grain morphology, α lath size, and their presence as colonies or a basket-weave structure, also plays an important role in mechanical properties [7]. In summary, the mechanical properties of the Ti-6Al-4V-0.5Ni-0.5Nb alloy are constrained not only by its phase composition and crystal structure but also influenced by its complex microstructure and texture. Therefore, when designing and optimizing this alloy, it is necessary to comprehensively consider the effects of phase, microstructure, and texture based on specific requirements to better predict and control its mechanical behavior and anisotropy.
The Ti-6Al-4V-0.5Ni-0.5Nb alloy is expected to be used in applications such as marine vessels, pipeline systems, and aerospace components, where materials are frequently subjected to dynamic impact loads that can potentially lead to catastrophic failure. However, the anisotropy of mechanical properties caused by texture and microstructure in this alloy remains unclear. Therefore, it is necessary to systematically study the impact toughness, i.e., the material’s resistance to fracture under impact loading. The Charpy impact test is the most common method for evaluating a material’s impact toughness under high strain rate deformation [8,9]. This study investigated the Charpy impact toughness of a Ti-6Al-4V-0.5Ni-0.5Nb alloy rolled plate by varying the loading direction and crack propagation plane. The influence and mechanisms of the plate’s microstructure and texture on the anisotropy of impact toughness are discussed, aiming to provide data support for the application of this alloy plate.
2. Materials and Methods
In this experiment, electrodes were prepared using Grade 0 sponge titanium, Al-60V, Ti-50Nb master alloy, Al beans, and pure Ni as raw materials. The Ti-6Al-4V-0.5Ni-0.5Nb alloy ingot was then obtained through two vacuum arc remelting processes. Chemical composition analysis was performed on the prepared ingot, and the results are shown in Table 1. The ingot underwent multiple forging and deformation processes as the temperature decreased from 1200 °C to 950 °C to produce a slab with dimensions of 300 mm × 60 mm × L. The slab was then rolled at 990 °C to obtain a finished plate with a thickness of 30 mm. After rolling, the Ti-6Al-4V-0.5Ni-0.5Nb alloy plate was heated at 700 °C for 1 h and then air-cooled [4].
Table 1.
Chemical composition of the alloy ingot.
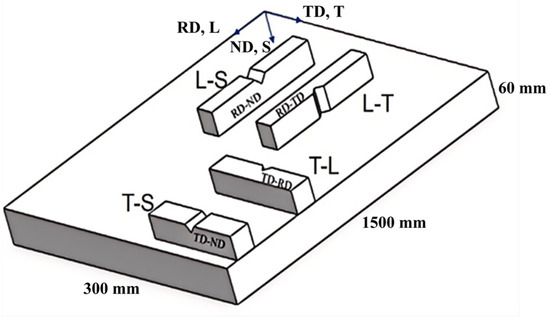
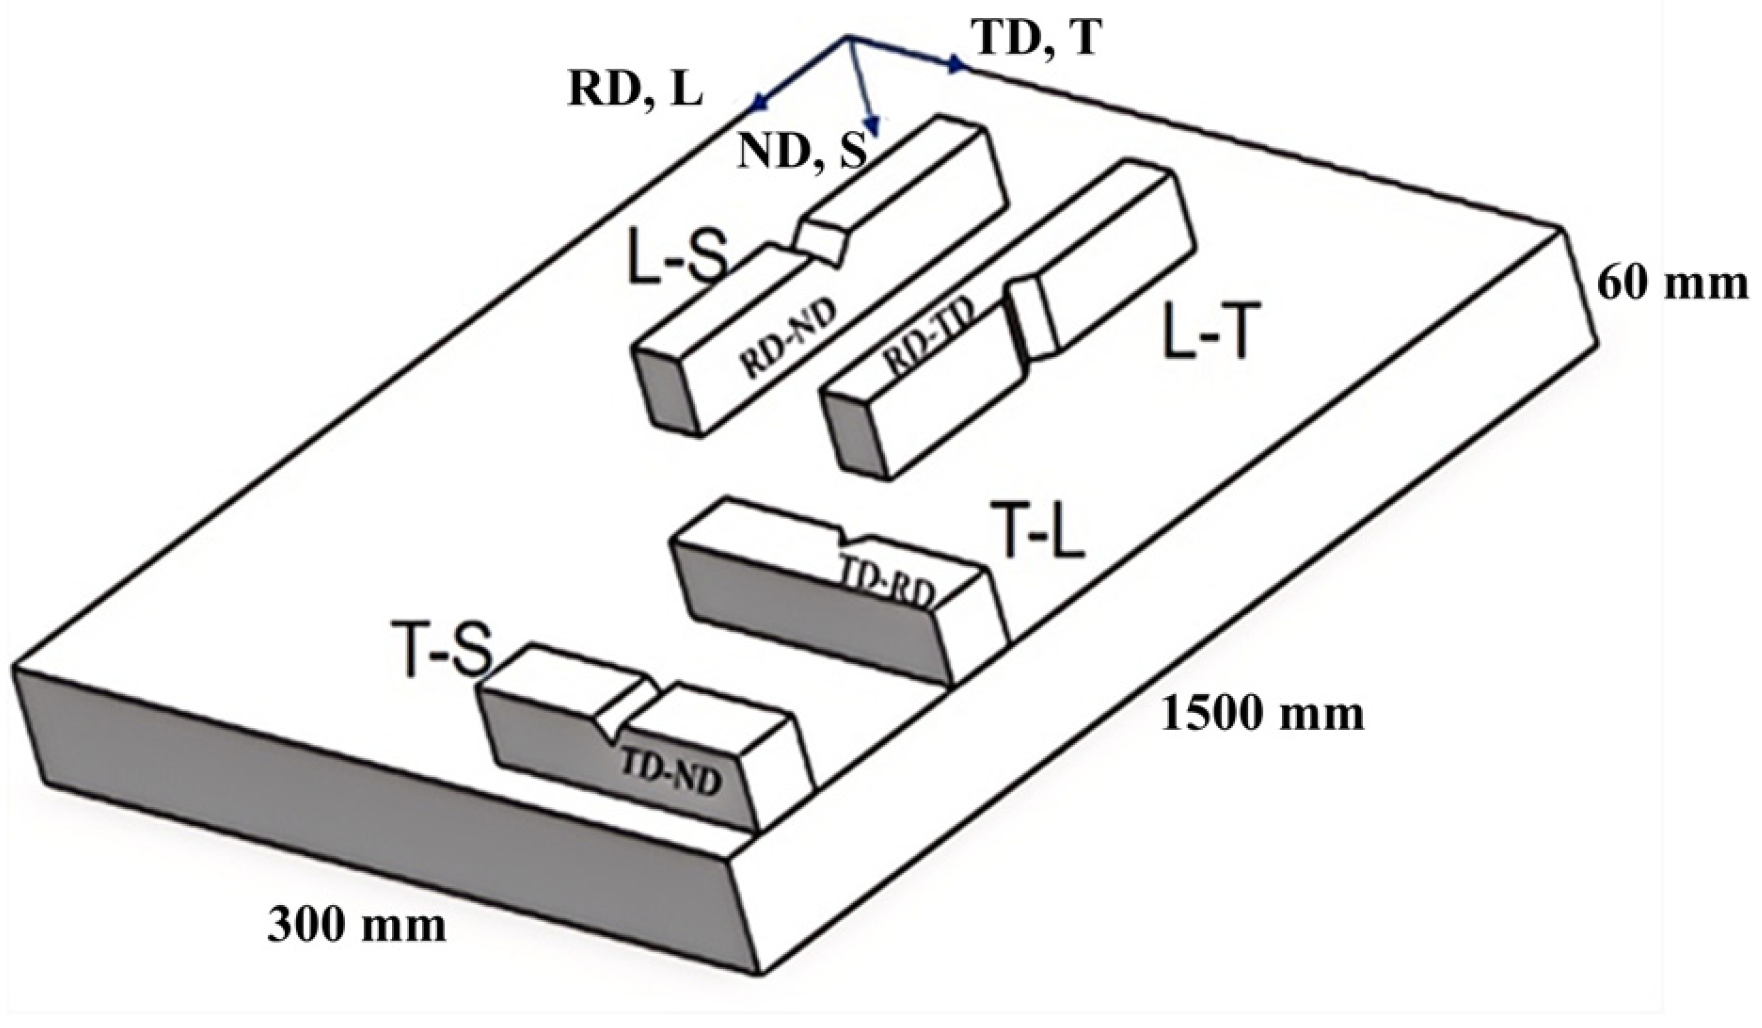
Charpy impact specimens had dimensions of 10 × 10 × 55 mm3 with a V-notch depth of 2 mm. They were taken from four different orientations (L-S, T-L, L-T, T-S), as shown in Figure 1. The three axes of the specimen coordinate system are parallel to the rolling direction (RD), the normal direction of the rolling plane (ND), and the transverse direction of the rolling plane (TD), respectively. During impact, the impact direction and crack propagation plane differ for four specimens. For example, for the L-S orientation, the impact direction is parallel to ND, and the crack propagates on the ND-TD plane. Room temperature impact tests were performed on an PIT452D-4 impact testing machine (WANCE, Shenzhen, China) according to international standard ISO 148-1:2016 to test the Charpy impact toughness of the annealed alloy [10]. Two specimens were prepared for each orientation for the Charpy impact test. After the impact test, oil stains on the fracture surfaces of specimens from different orientations were removed. Specimens obtained from the rolling plate for Optical Microscope (OM) (Zeiss, Oberkochen, Germany) observation were mechanically polished using SiC sandpaper from 200 to 4000 grit, followed by mechanical polishing and etching with a corrosive solution consisting of 9 vol.% HF, 27 vol.% HNO3 and 64 vol.% H2O. A Zeiss Smartzoom 5 Extended Depth of Field (EDoF) (Zeiss, Oberkochen, Germany) was used o observe and measure the macroscopic fracture morphology. A JSM-7900F Scanning Electron Microscope (SEM) (JEOL, Tokyo, Japan) was used to observe the microscopic fracture morphology of the specimens. Specimens obtained from the rolling plate for Electron Backscattered Diffrction (EBSD) (JEOL, Tokyo, Japan) observation were mechanically polished using SiC sandpaper from 200 to 4000 grit, followed by electropolishing using an electrolyte consisting of 5 vol.% HClO4 and 95 vol.% C2H4O2. The electropolishing process was performed at 60 V for 10–25 s to remove surface stress. EBSD observation was conducted at an accelerating voltage of 20 kV, and data were processed using EDAX OIM Analysis 7.0 software.
Figure 1.
Schematic of impact specimen orientations.
3. Results
3.1. Microstructure and Texture
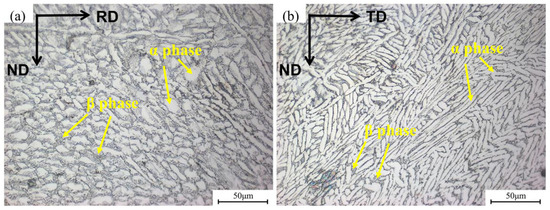
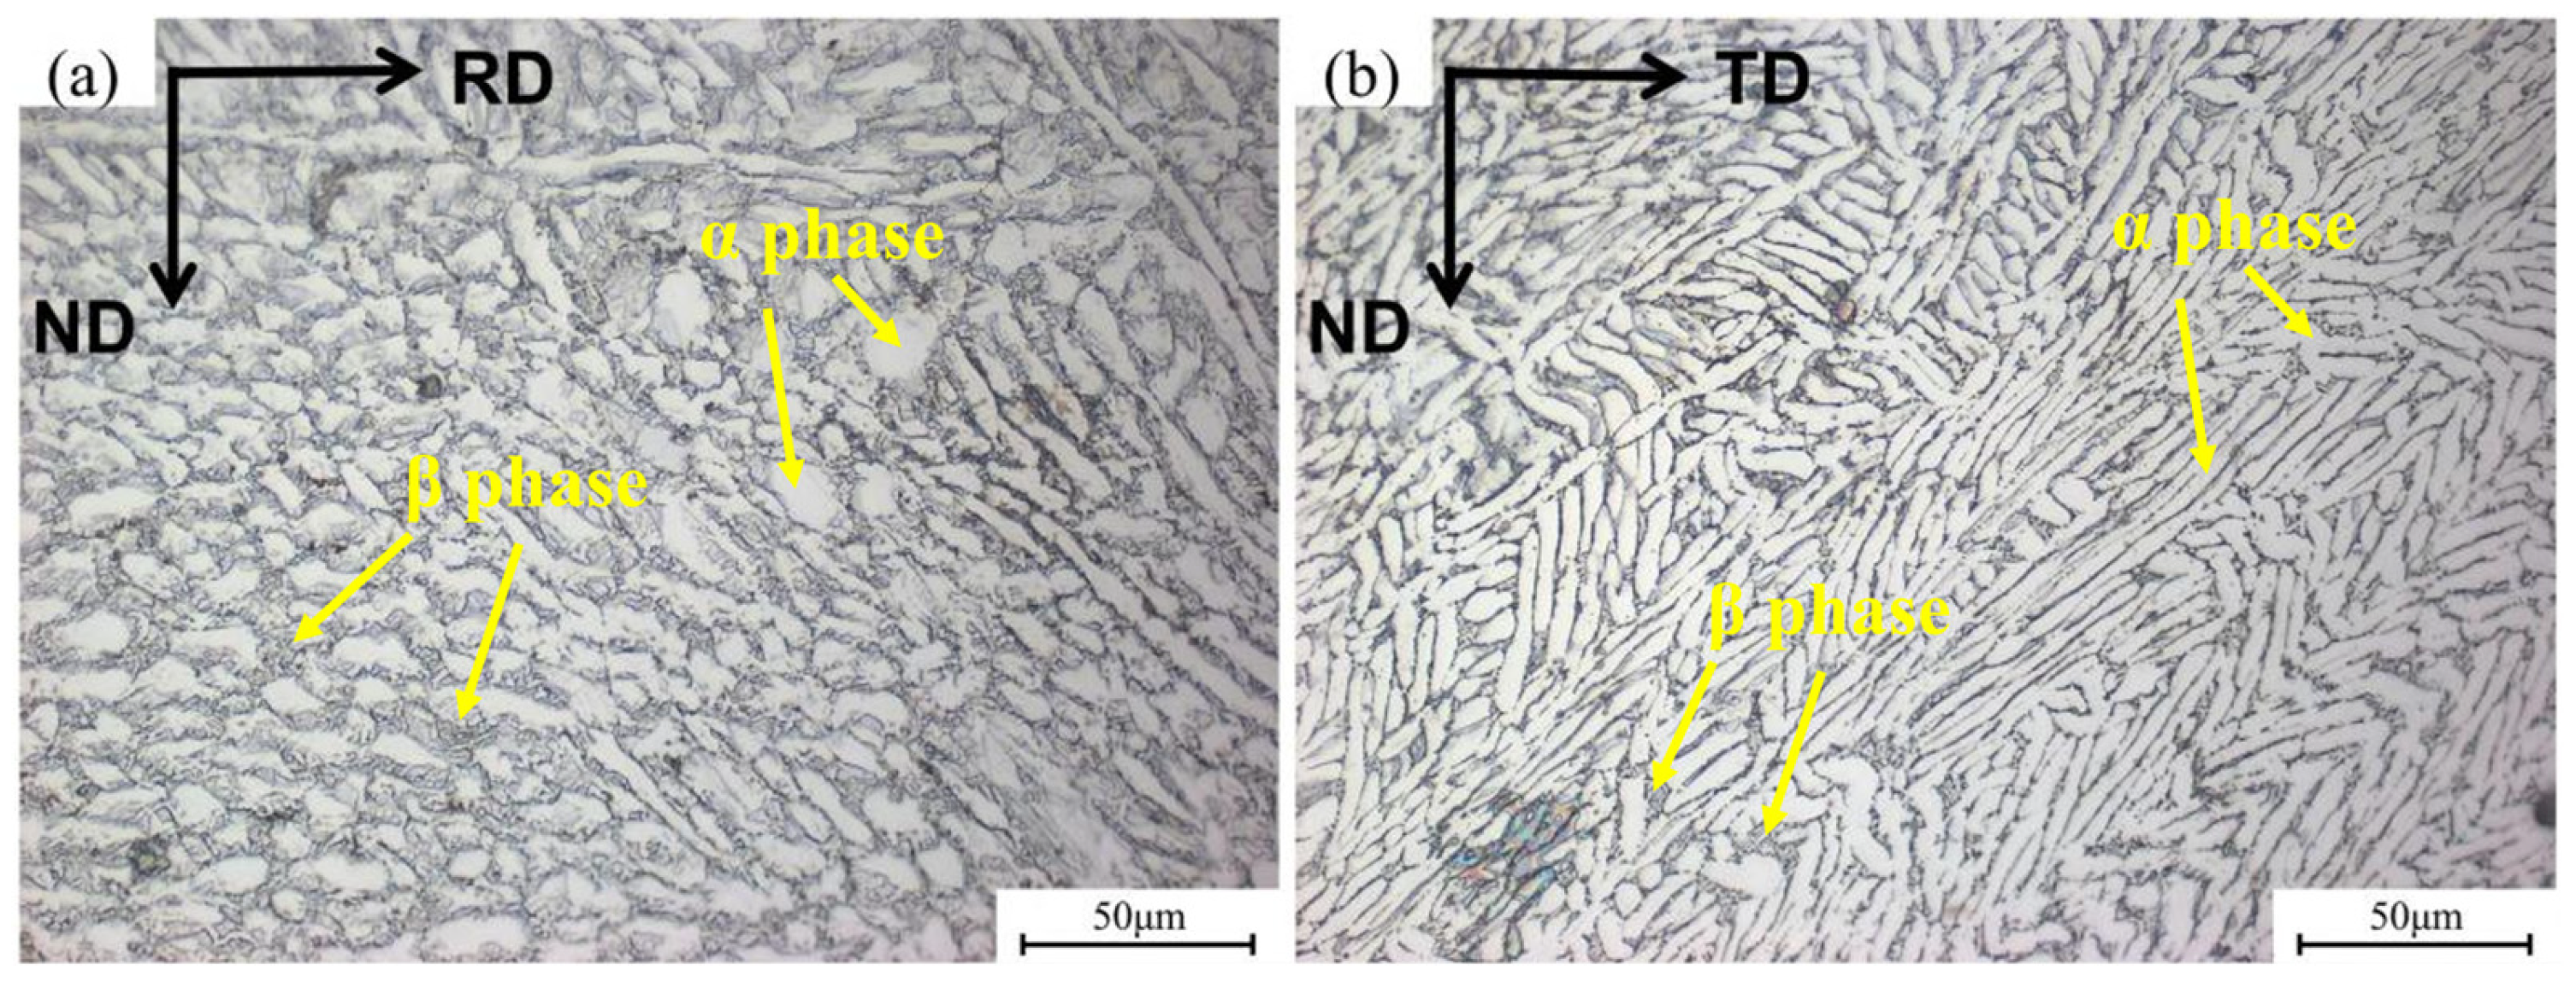
Figure 2 shows the microstructure of the Ti-6Al-4V-0.5Ni-0.5Nb alloy plate after annealing treatment. On the RD-ND plane (Figure 2a), the alloy exhibits a deformed basket-weave microstructure. The thickness of the α laths is approximately 10 μm, and the average aspect ratio is about 1.5. The β phase is distributed between the α laths. On the TD-ND plane (Figure 2b), the α phase appears as elongated strips with more pronounced directionality. The α lath thickness is about 6 μm, the average aspect ratio is about 3.3. This indicates that, compared to the RD-ND plane, the α laths on the TD-ND plane are thinner, have a larger aspect ratio, and the β phase content is lower. The β-phase fraction was quantified from Figure 2 using ImageJ 1.47, with approximately 8 vol.% β phase on the RD-ND plane and approximately 5 vol.% β phase on the TD-ND plane.
Figure 2.
Microstructure of (a) RD-ND and (b) TD-ND planes on Ti-6Al-4V-0.5Ni-0.5Nb alloy sheet.
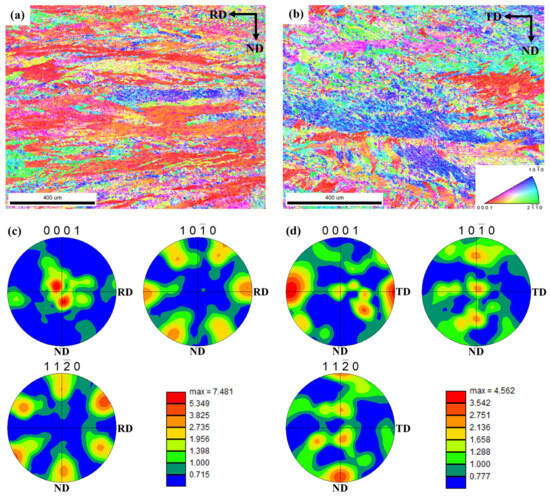
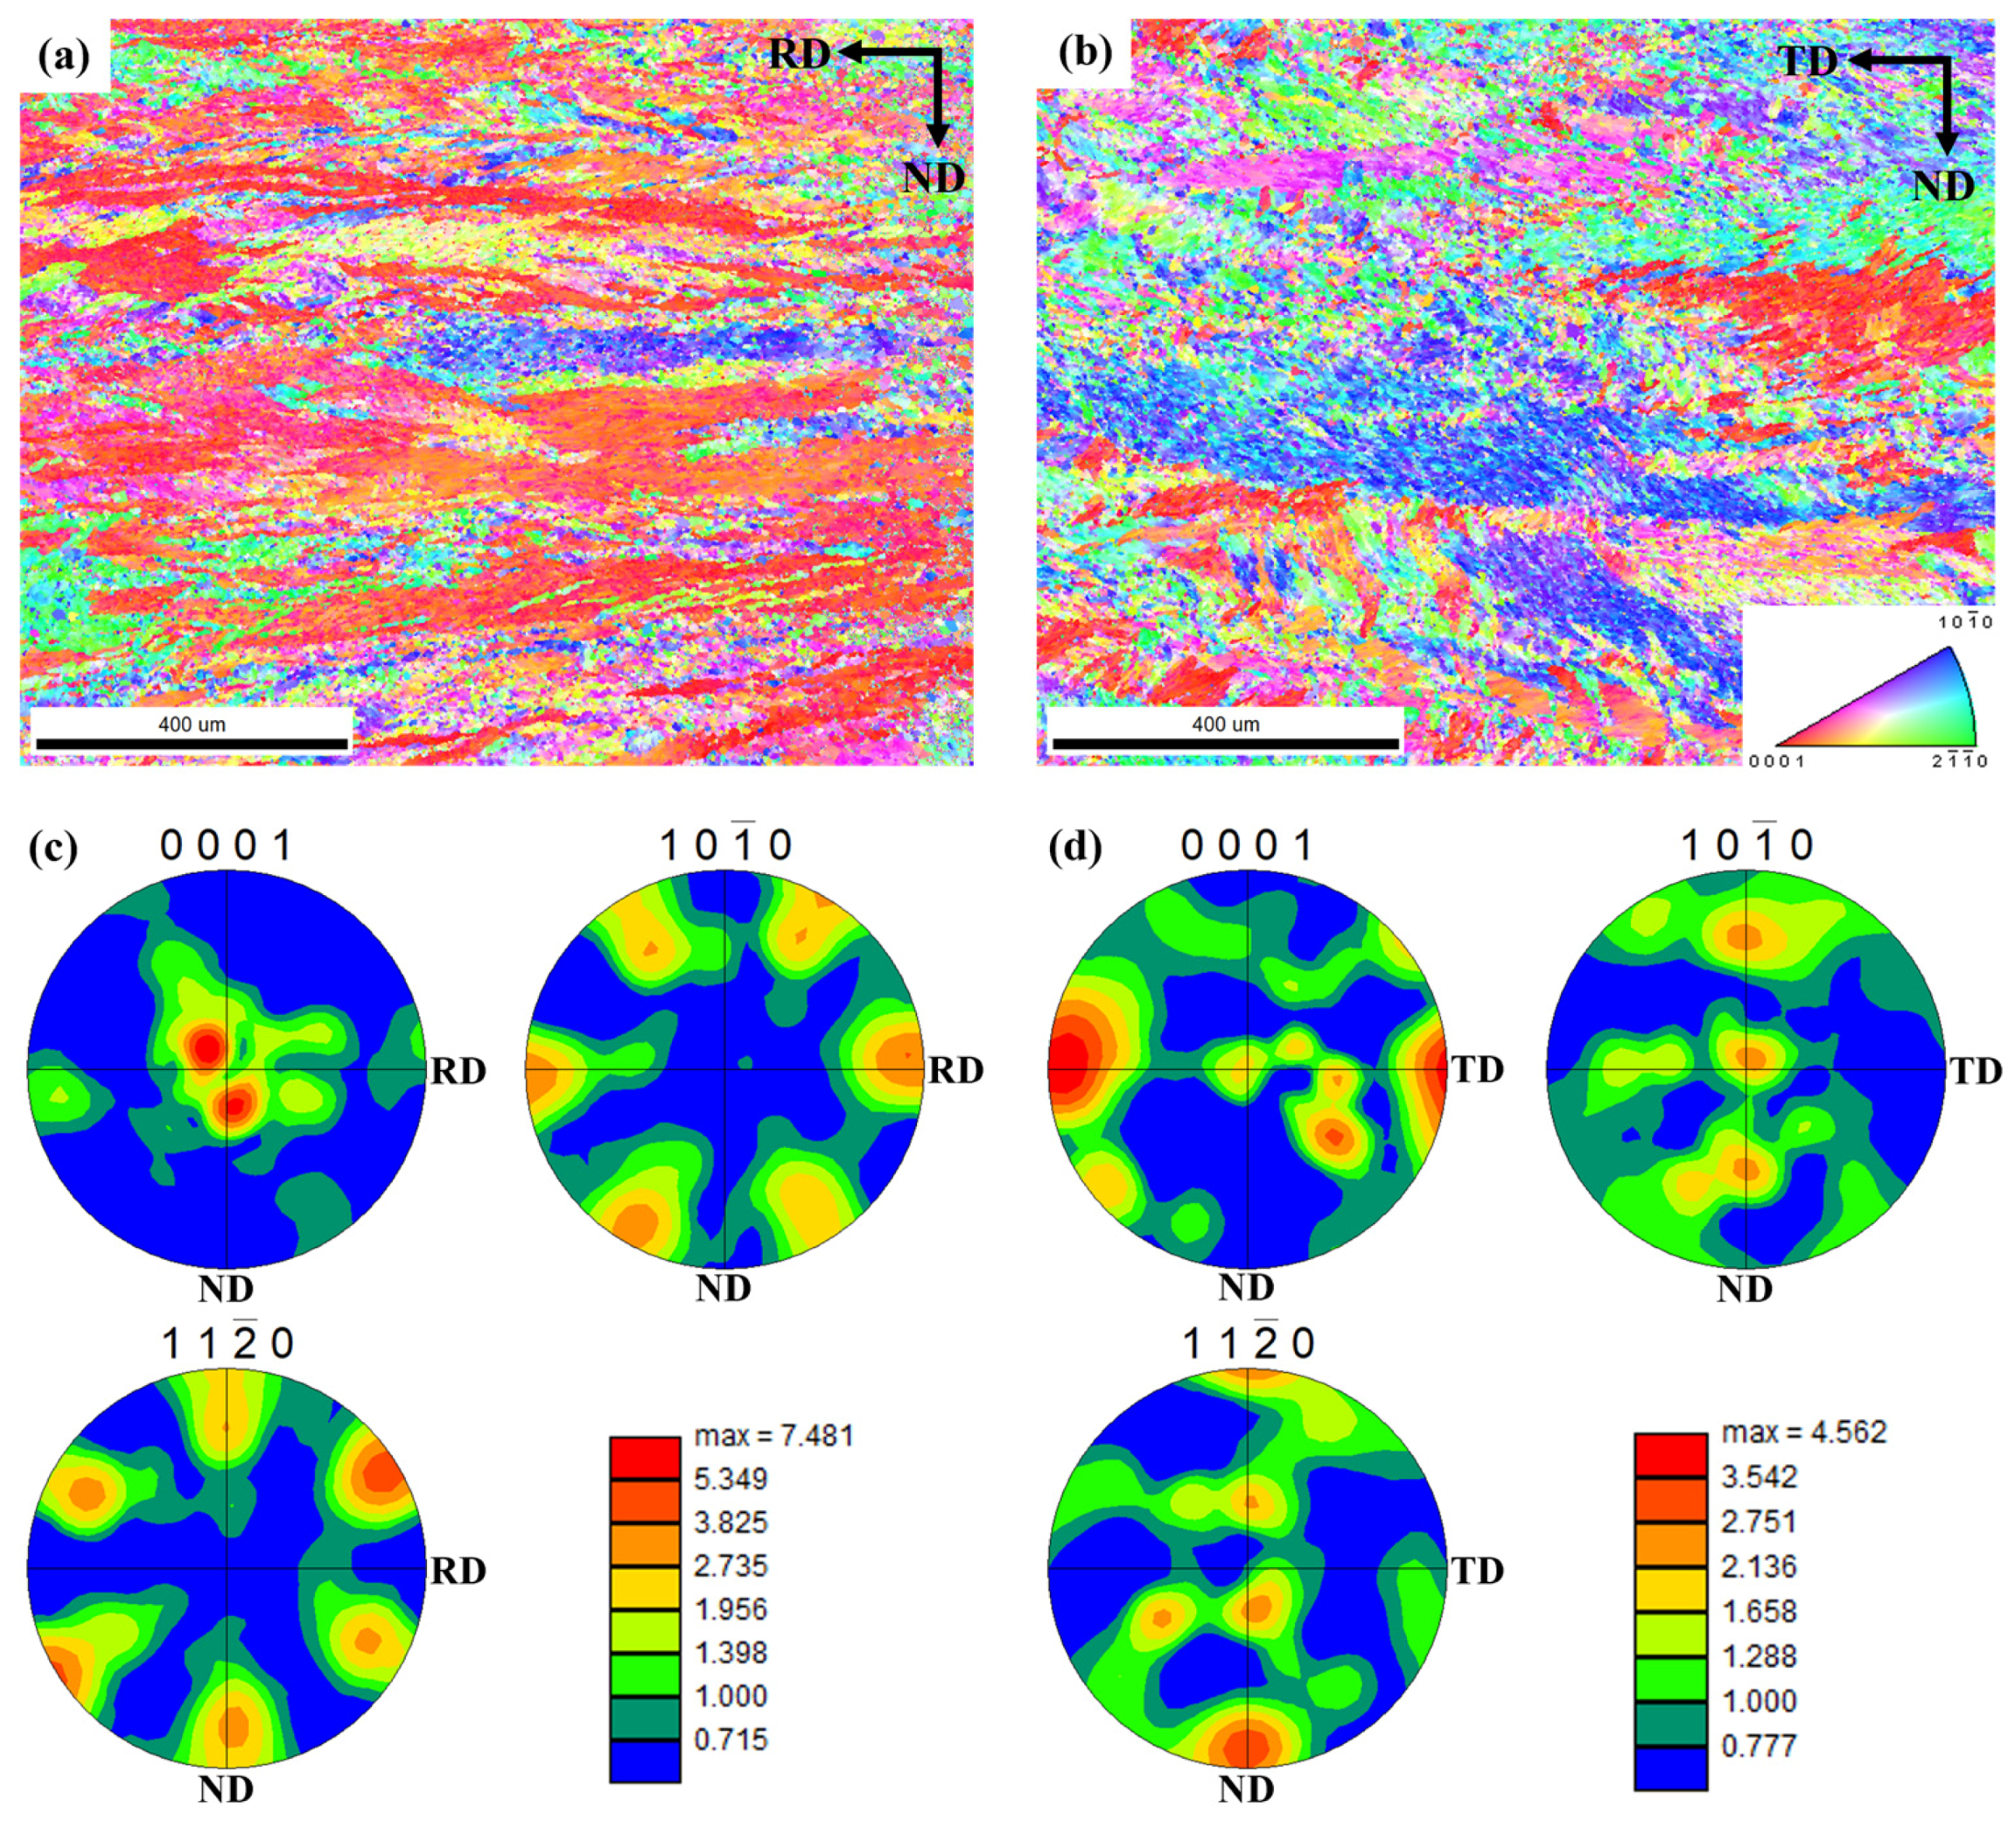
The texture of the alpha phase was further characterized. Figure 3a,b show the EBSD inverse pole figure (IPF) maps of the RD-ND and TD-ND planes, respectively. On the RD-ND plane (Figure 3a), red grains dominate, indicating that the (0001) plane of most grains is parallel to the RD-ND plane, reflecting a strong preferred orientation. In contrast, the TD-ND plane (Figure 3b) shows a mixed distribution of three colors (red, blue, green), with a significant increase in the proportion of blue and green grains and a notable decrease in red grains. This indicates that the planes parallel to the TD-ND plane are predominantly (10-10) and (11-20). Analysis combined with the {0001}, {10-10}, and {11-20} pole figures shown in Figure 3c,d reveals that the rolled plate possesses a strong T-type texture, meaning the c-axes of the grains are distributed along the TD direction, perpendicular to both RD and ND.
Figure 3.
IPF maps of (a) RD-ND and (b) TD-ND planes on Ti-6Al-4V-0.5Ni-0.5Nb alloy sheet; pole figures of (c) RD-ND and (d) TD-ND planes on Ti-6Al-4V-0.5Ni-0.5Nb alloy sheet.
3.2. Impact Toughness
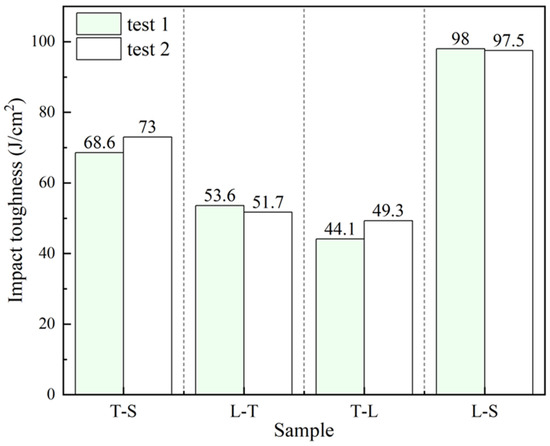
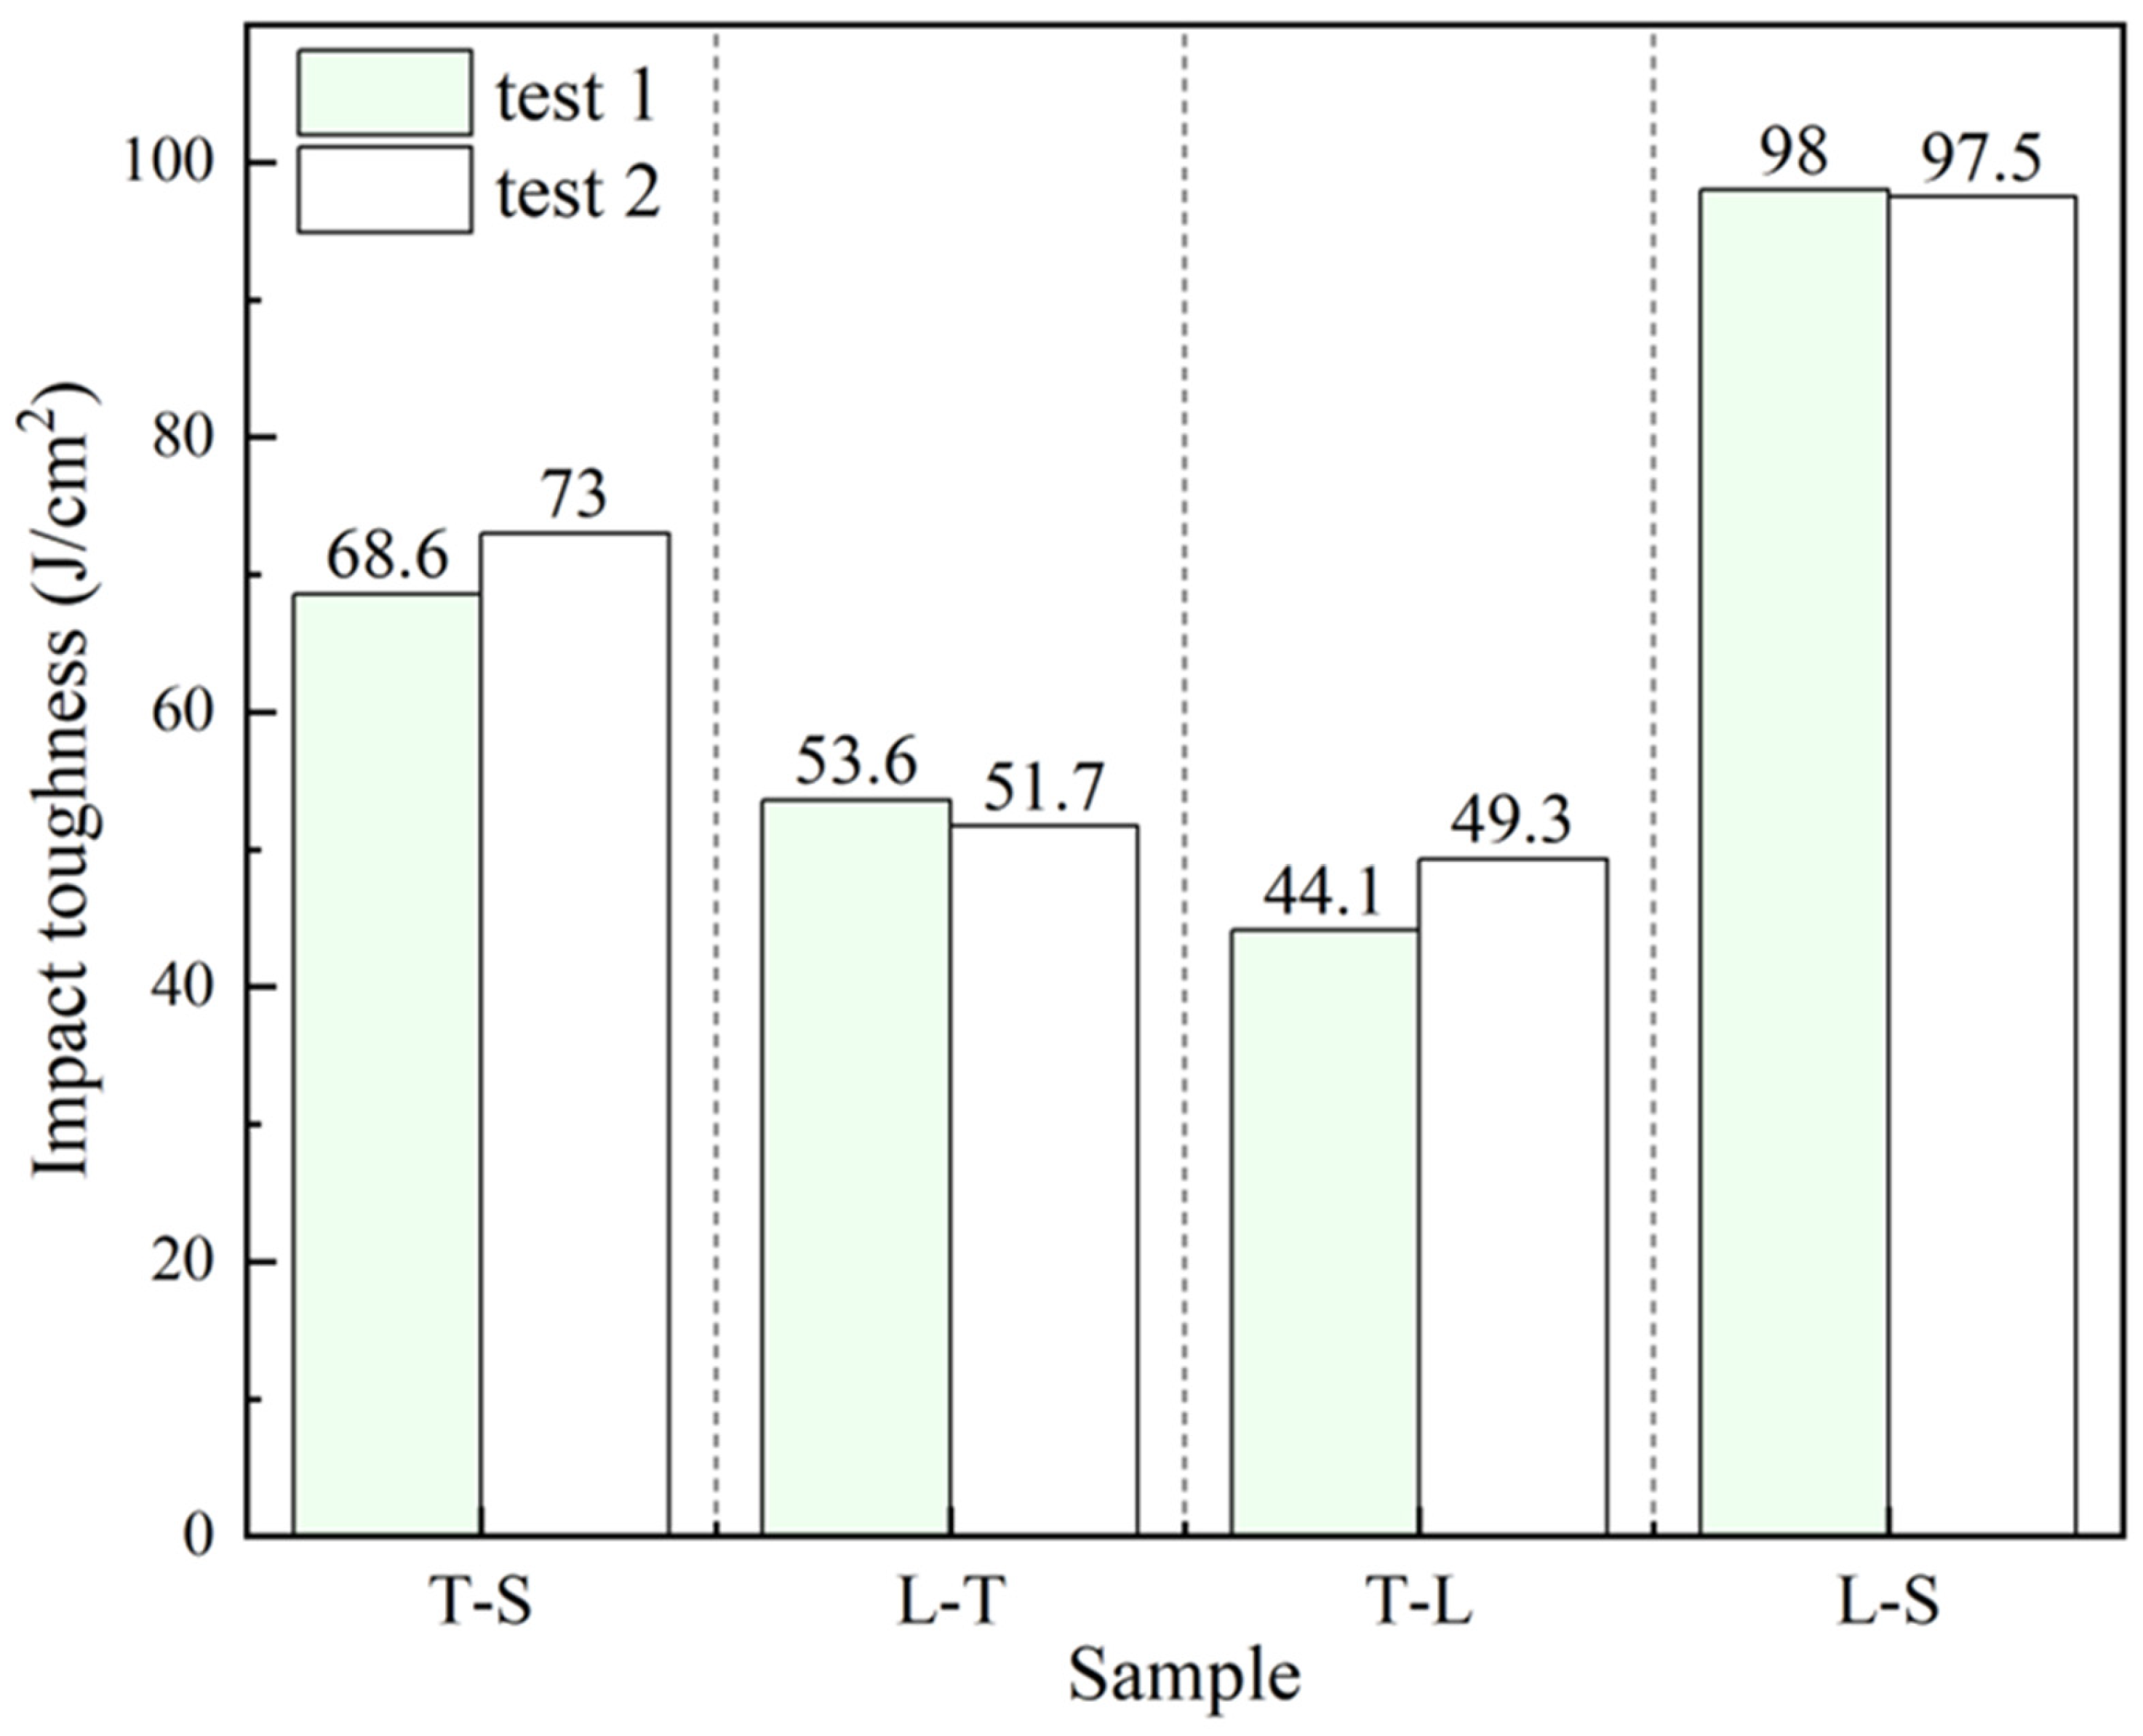
Figure 4 shows the impact toughness test results. The average impact toughness values from two tests each for T-S, L-T, T-L, and L-S specimens were 70.8 J/cm2, 52.65 J/cm2, 46.7 J/cm2, and 97.75 J/cm2, respectively. The L-S specimen exhibits the highest impact toughness, while the T-L specimen shows the lowest, indicating strong anisotropy in impact toughness for different orientations of the hot-rolled plate. When the crack propagation plane is the same (RD-ND plane), the impact toughness of the T-S specimen (loading along ND, 70.8 J/cm2) is greater than that of the T-L specimen (loading along RD, 46.7 J/cm2). When the crack propagation plane is the same (TD-ND plane), the impact toughness of the L-S specimen (loading along ND, 97.75 J/cm2) is greater than that of the L-T specimen (loading along TD, 52.65 J/cm2). When the impact loading direction is the same (ND direction), the impact toughness of the L-S specimen (fracture on TD-ND plane, 97.75 J/cm2) is greater than that of the T-S specimen (fracture on RD-ND plane, 70.8 J/cm2). In summary, both the crack propagation plane and the impact loading direction significantly affect the impact toughness. Within the same crack propagation plane, specimens with the impact loading direction along ND have higher impact toughness than those with loading along RD or TD. Under the same loading direction, impact toughness is superior when fracture occurs on the TD-ND plane compared to the RD-ND plane.
Figure 4.
Impact toughness of specimens with different orientations.
3.3. Impact Fracture Morphology
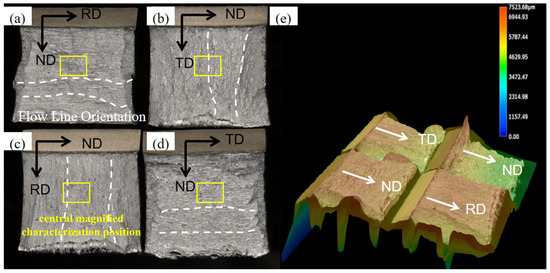
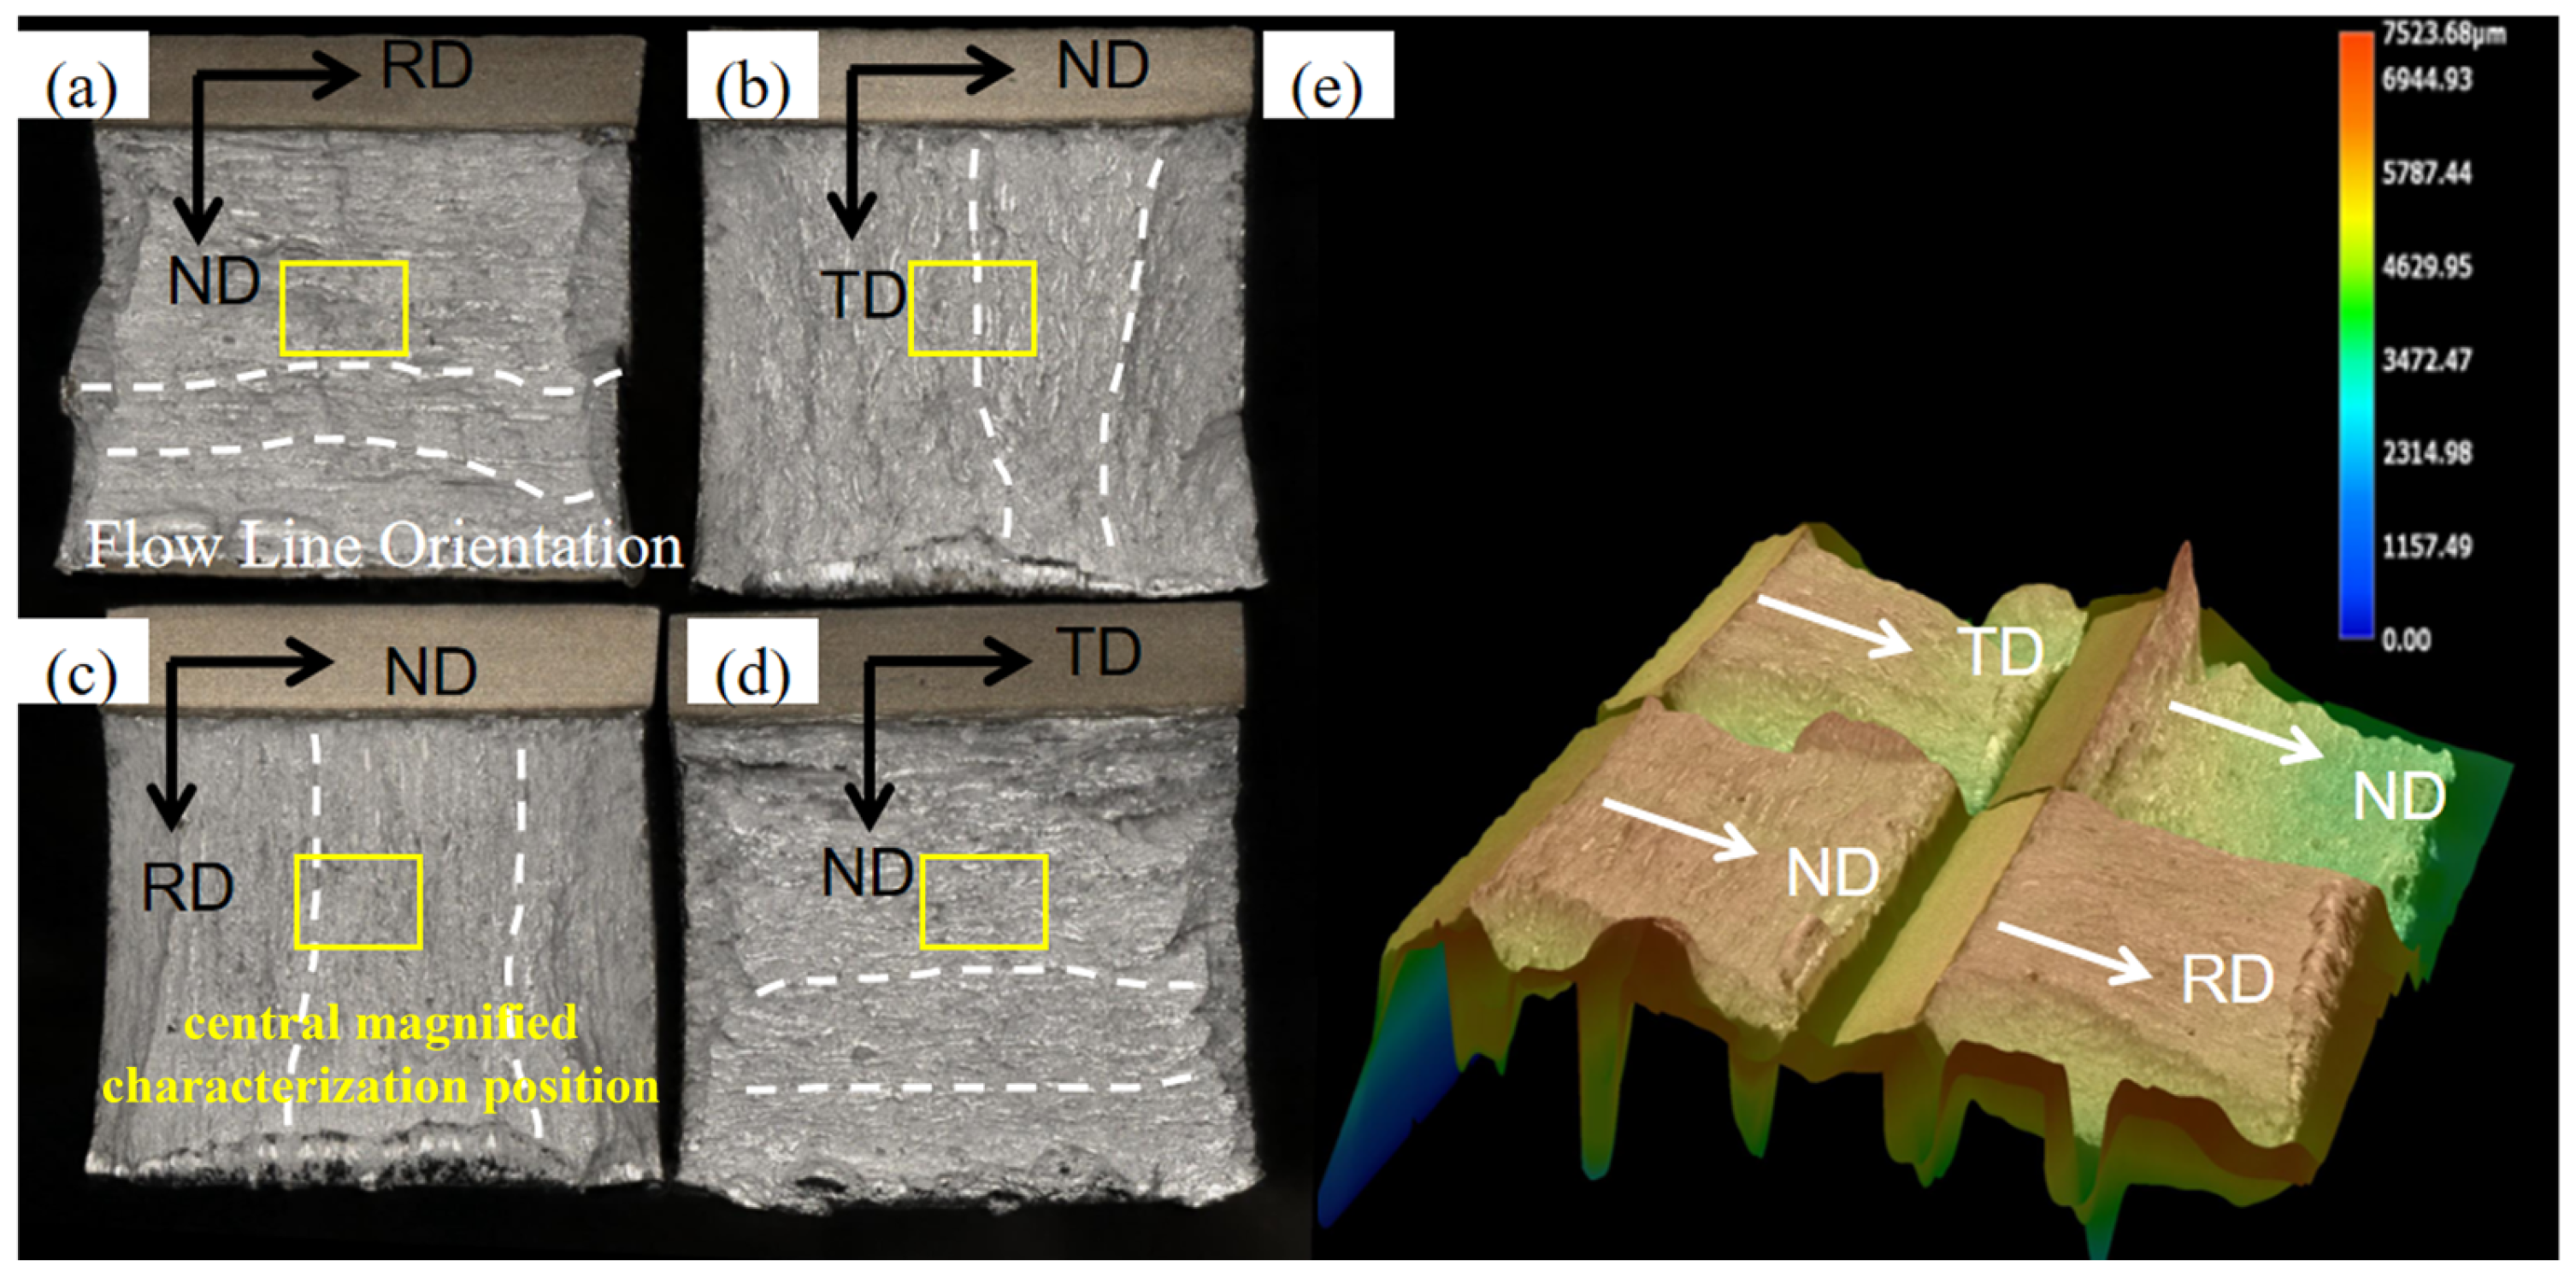
The fracture surfaces of the impact specimens were observed. Figure 5 shows low-magnification images. Flow lines can be observed in all specimens. Flow lines are traces left by the material ahead of the crack tip undergoing intense plastic deformation, stretching, and tearing during rapid crack propagation. They typically appear as fine streaks or fibrous morphologies aligned in specific directions. The formation of flow lines originates from the obstruction and guidance of crack propagation by the material’s microstructure. For the T-S specimen (Figure 5a), flow lines are along the RD, perpendicular to the loading direction. The L-T specimen (Figure 5b) shows deformation flow lines along the TD, parallel to the loading direction. For the T-L specimen (Figure 5c), flow lines are along the RD and parallel to the loading direction. The L-S specimen (Figure 5d) shows flow lines along the TD, perpendicular to the loading direction. The direction of the flow lines is consistent with the grain elongation direction. When the flow lines are perpendicular to the loading direction, the specimen’s impact toughness is higher (L-S and T-S specimens). Meanwhile, when the flow lines are parallel to the loading direction and appear smoother and straighter than other fracture surfaces, the specimen’s impact toughness is the lowest (T-L specimen). Figure 5e characterizes the height difference of the fracture surface features. It can be seen that the L-S specimen shows the largest fracture surface height difference, the roughest fracture plane, and a smaller shear lip area, while the T-L specimen shows the flattest fracture surface and a larger shear lip area. This also corresponds to their highest and lowest impact toughness values, respectively.
Figure 5.
Low-magnification impact fracture morphologies: (a) T-S, (b) L-T, (c) T-L, (d) L-S and (e) fracture surface height difference.
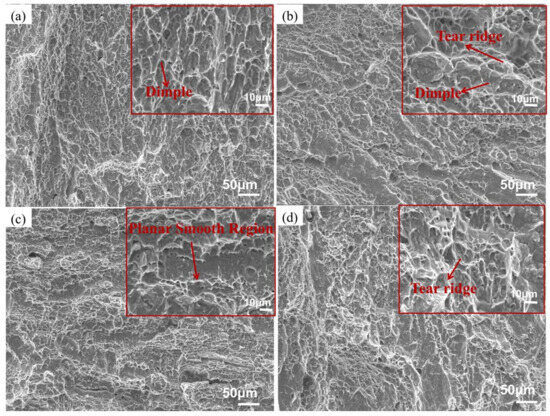
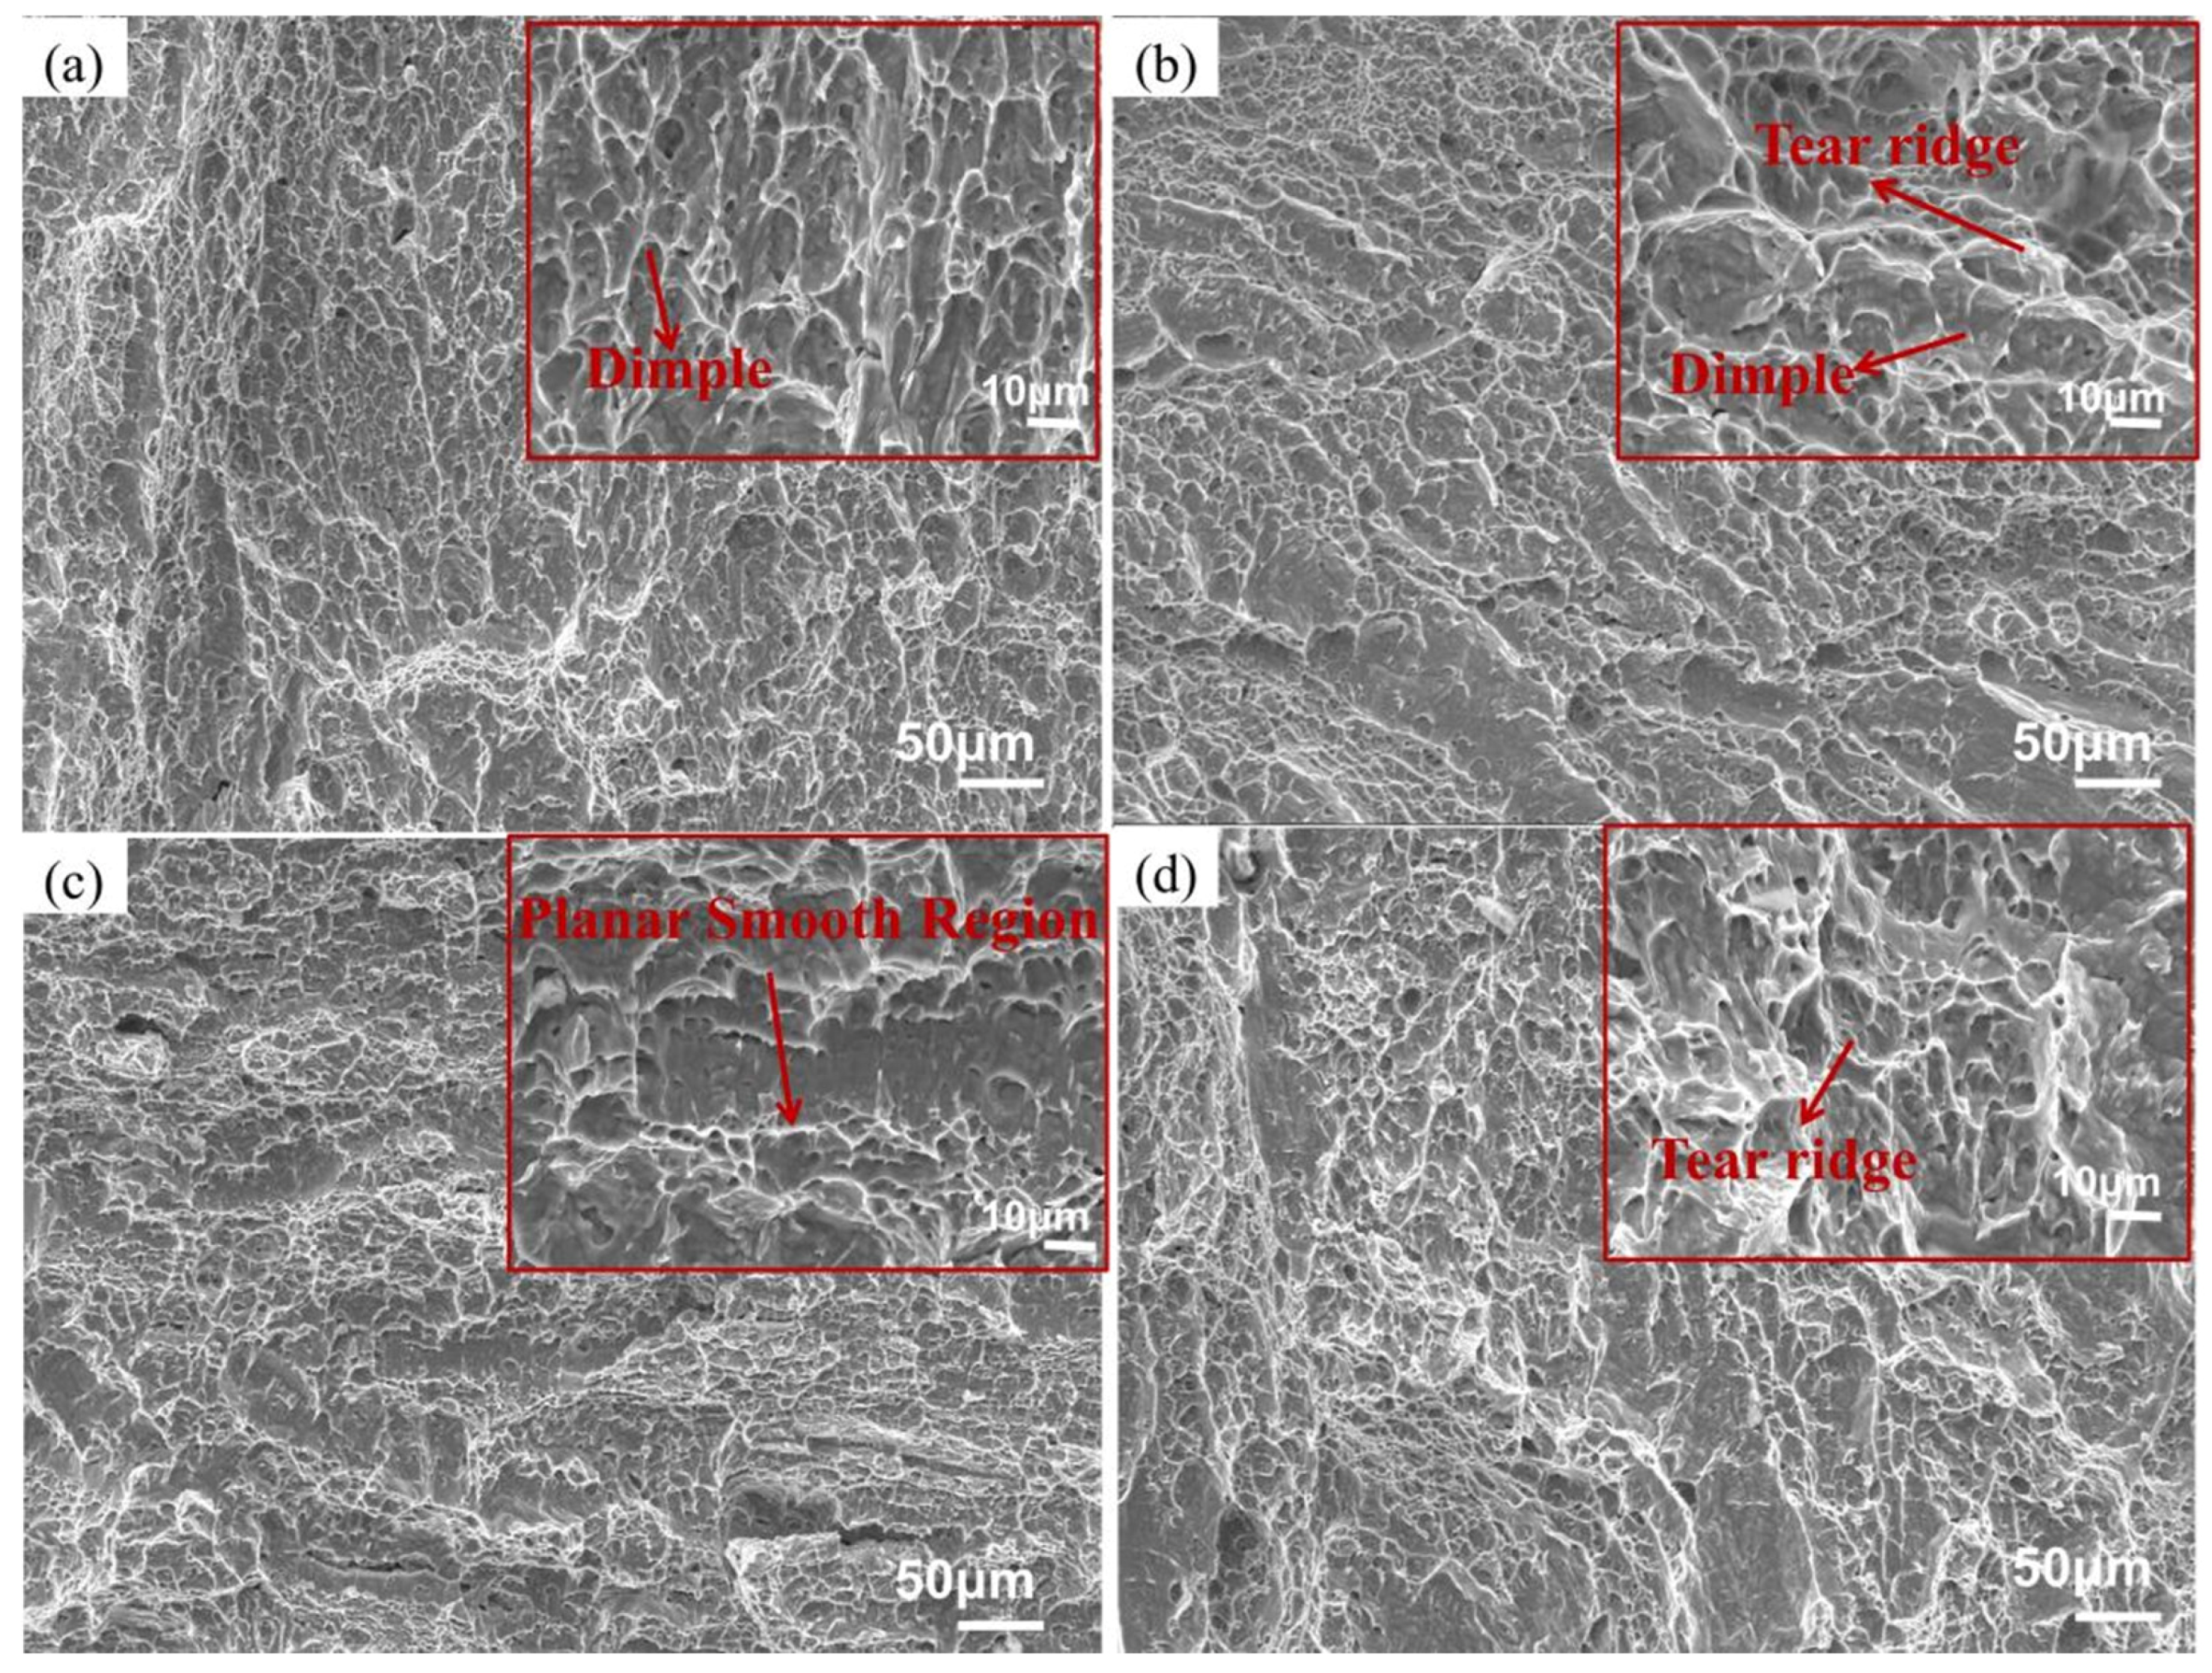
Figure 6 shows central high-magnification SEM images of Figure 5 impact fractures. The propagation area of all specimens consists of ductile dimples, although detailed fracture morphology features differ. In Figure 6a (T-S specimen), the dimples show a clear directionality, elongated along the loading direction (ND). In Figure 6b (L-T specimen), the dimples are equiaxed and shallow, and tear ridges are observed. In Figure 6c (T-L specimen), there are fewer dimples, and some flat, smooth areas are observed, indicating that the local fracture mechanism is close to quasi-cleavage fracture, leading to its lowest impact toughness. In Figure 6d (L-S specimen), the dimple depth is significantly greater than in the other fracture surfaces, confirming its best fracture toughness.
Figure 6.
High-magnification impact fracture morphologies: (a) T-S, (b) L-T, (c) T-L and (d) L-S.
4. Discussion
4.1. Effect of Texture on Slip System Activation
The slip systems of the alpha phase in titanium alloys mainly include prismatic {10-10}<11-20>, basal {0001}<11-20>, first-order pyramidal {10-11}<11-20>, and second-order pyramidal {11-22}<11-23> slip systems [11,12,13,14]. At room temperature, the critical resolved shear stress (CRSS) for prismatic slip is the lowest, followed by basal slip, with pyramidal slip having the highest CRSS [15,16,17]. Therefore, the slip behavior of the alpha phase in titanium alloys is primarily dominated by prismatic slip, supplemented by basal and pyramidal slip.
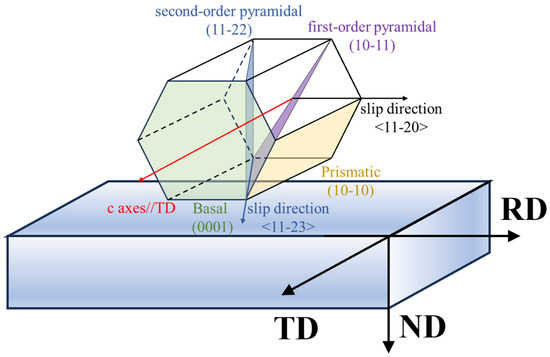
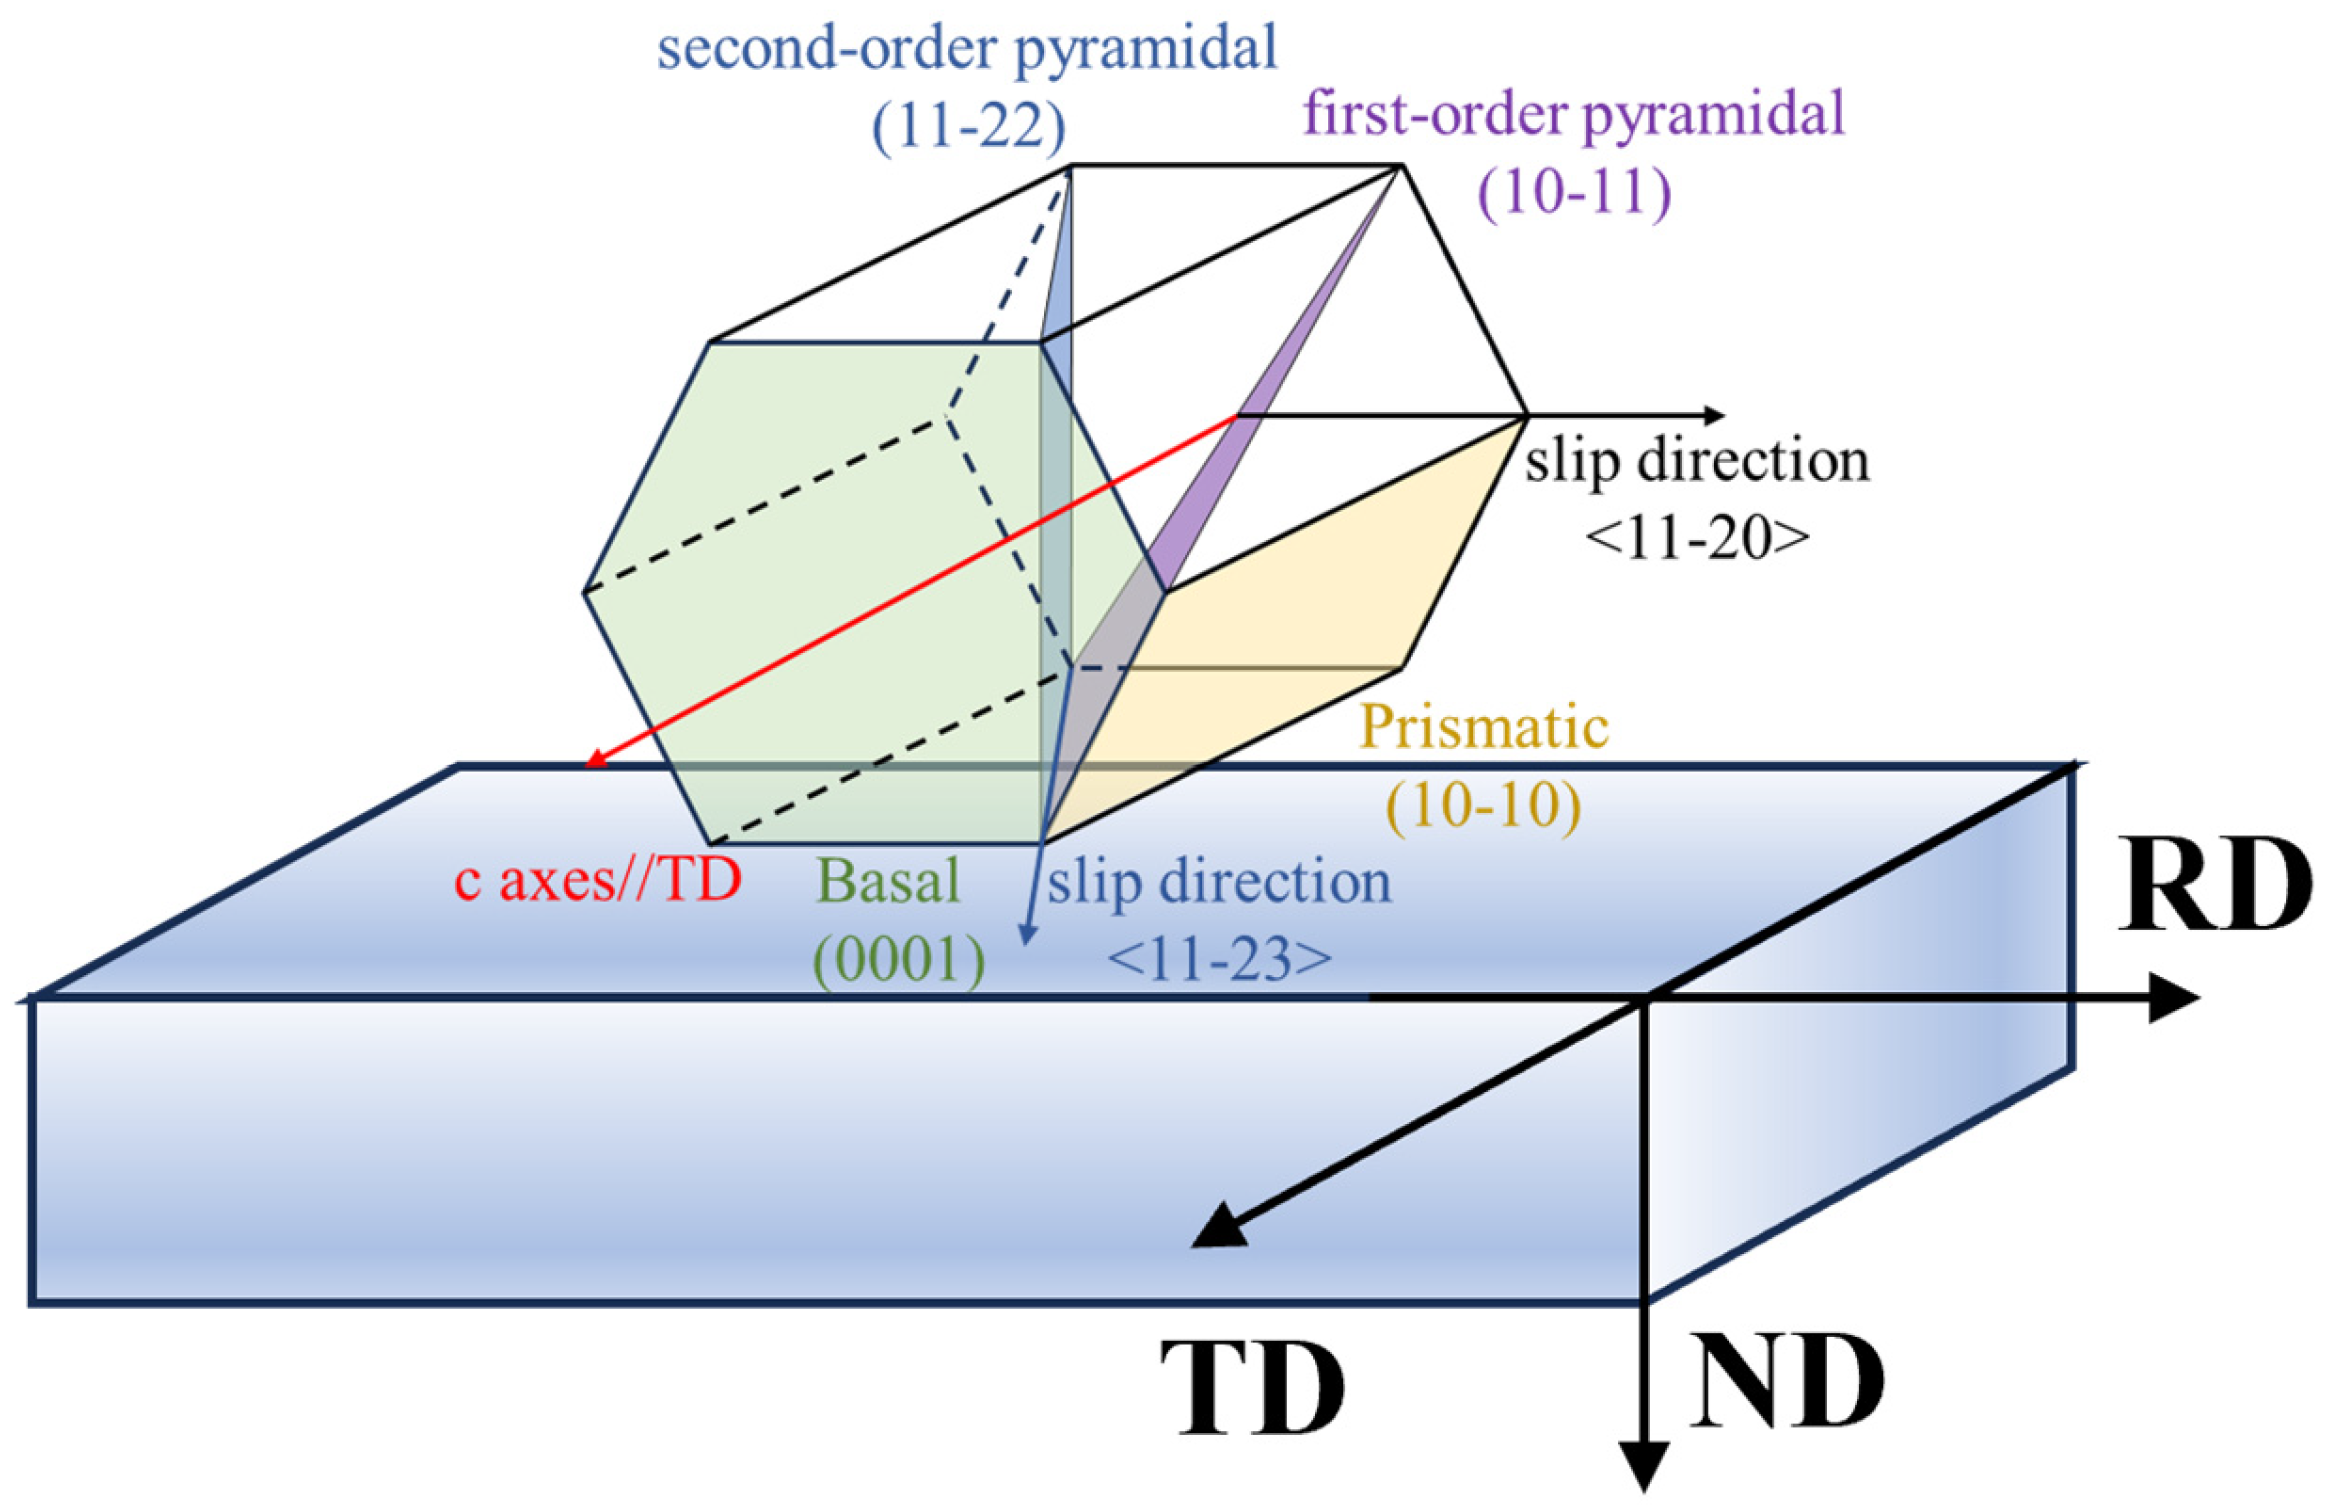
Besides CRSS, the Schmid factor (SF) is also an important factor determining whether a slip system can be activated, and the SF strongly depends on the crystal orientation [18,19,20]. Consequently, the strong T-type texture revealed by the pole figures (Figure 3c,d) plays a key role in determining slip system activation behavior. The {0001} pole figure shows that the c-axes of the α phase are preferentially oriented along the TD, causing most (0001) basal planes to be parallel to the RD-ND plane as shown in Figure 7, and the easily activated slip direction <11-20> is perpendicular to the TD. This leads to low SF values for slip systems along the <11-20> direction when a stress is applied along the TD, making activation significantly more difficult.
Figure 7.
Schematic diagram showing the relationship among grain orientation, slip planes, and macroscopic plate directions.
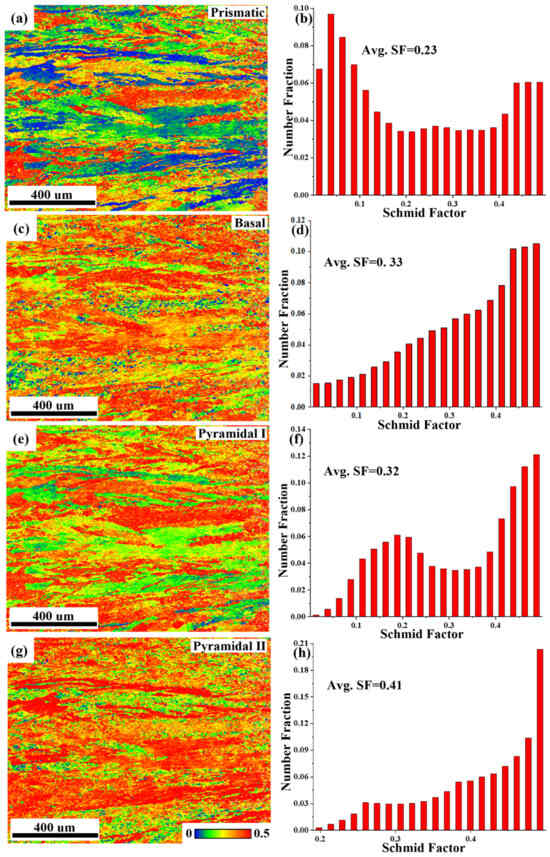
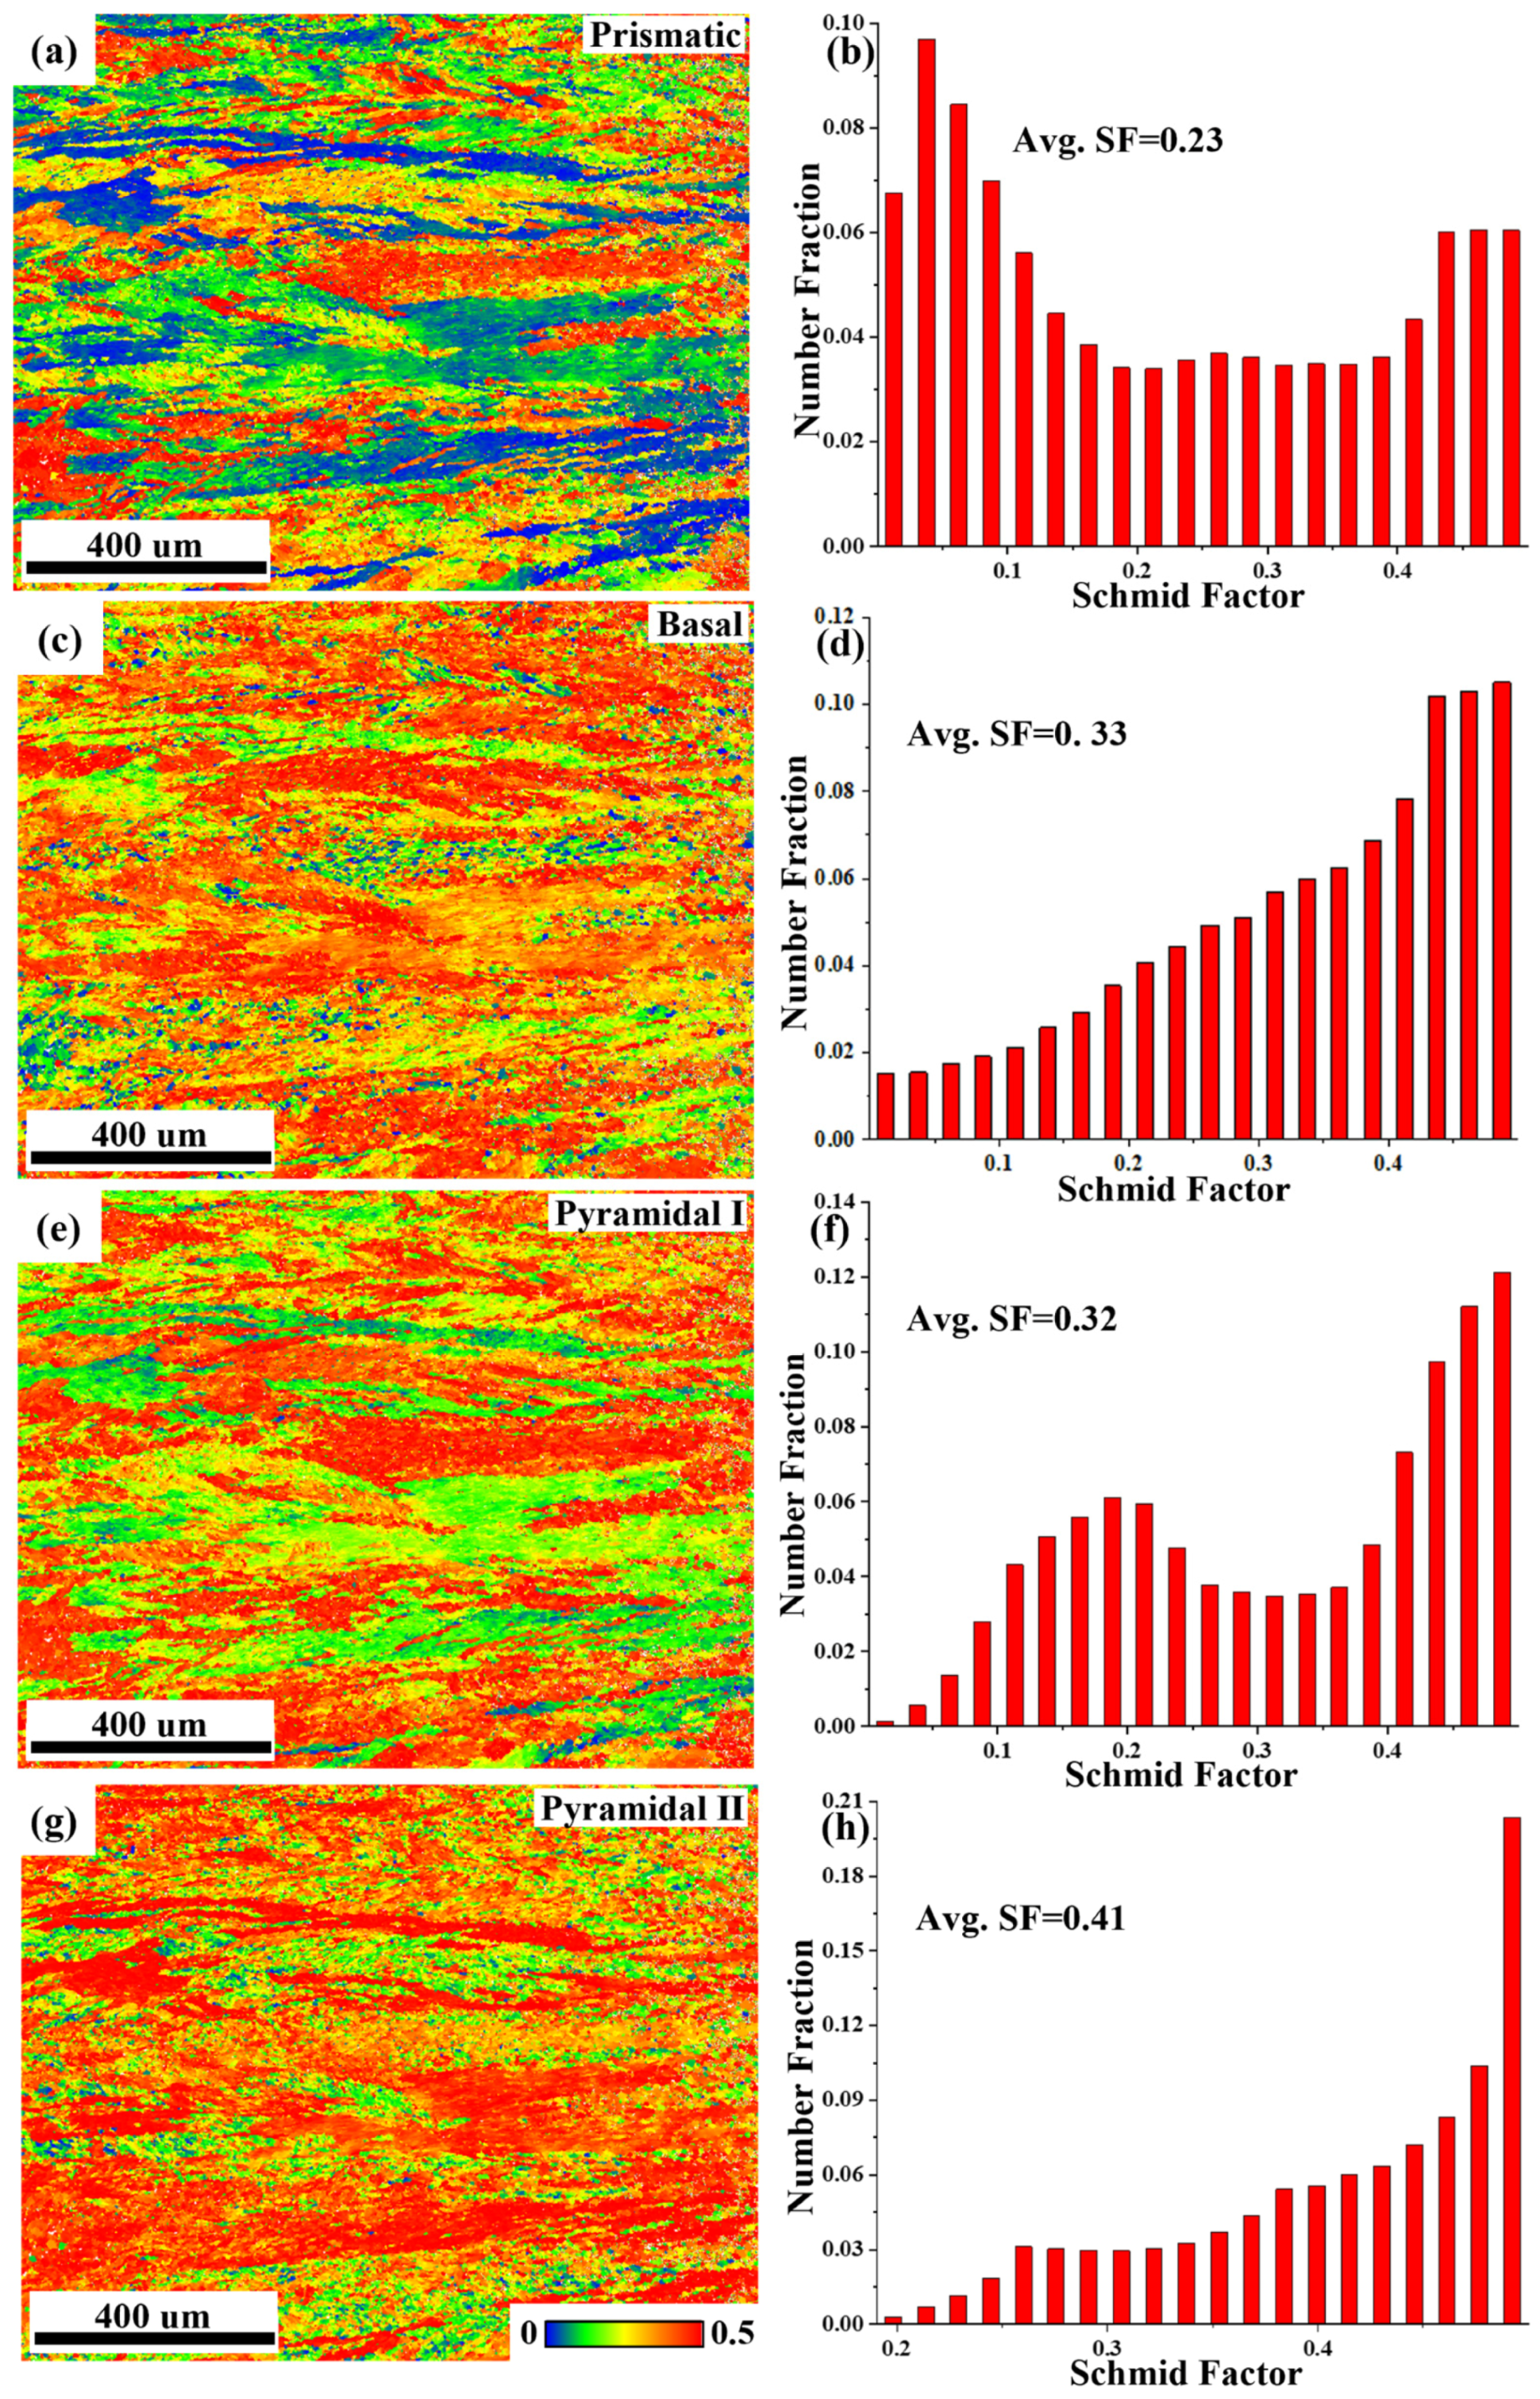
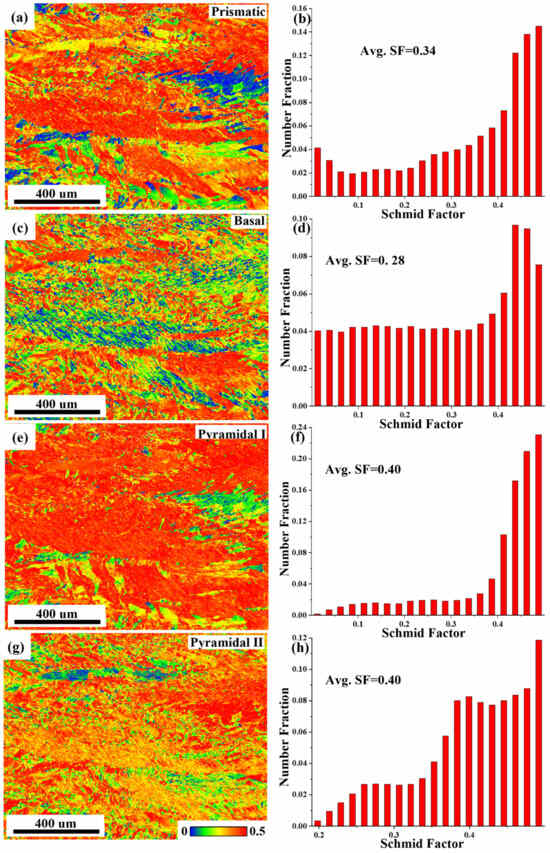
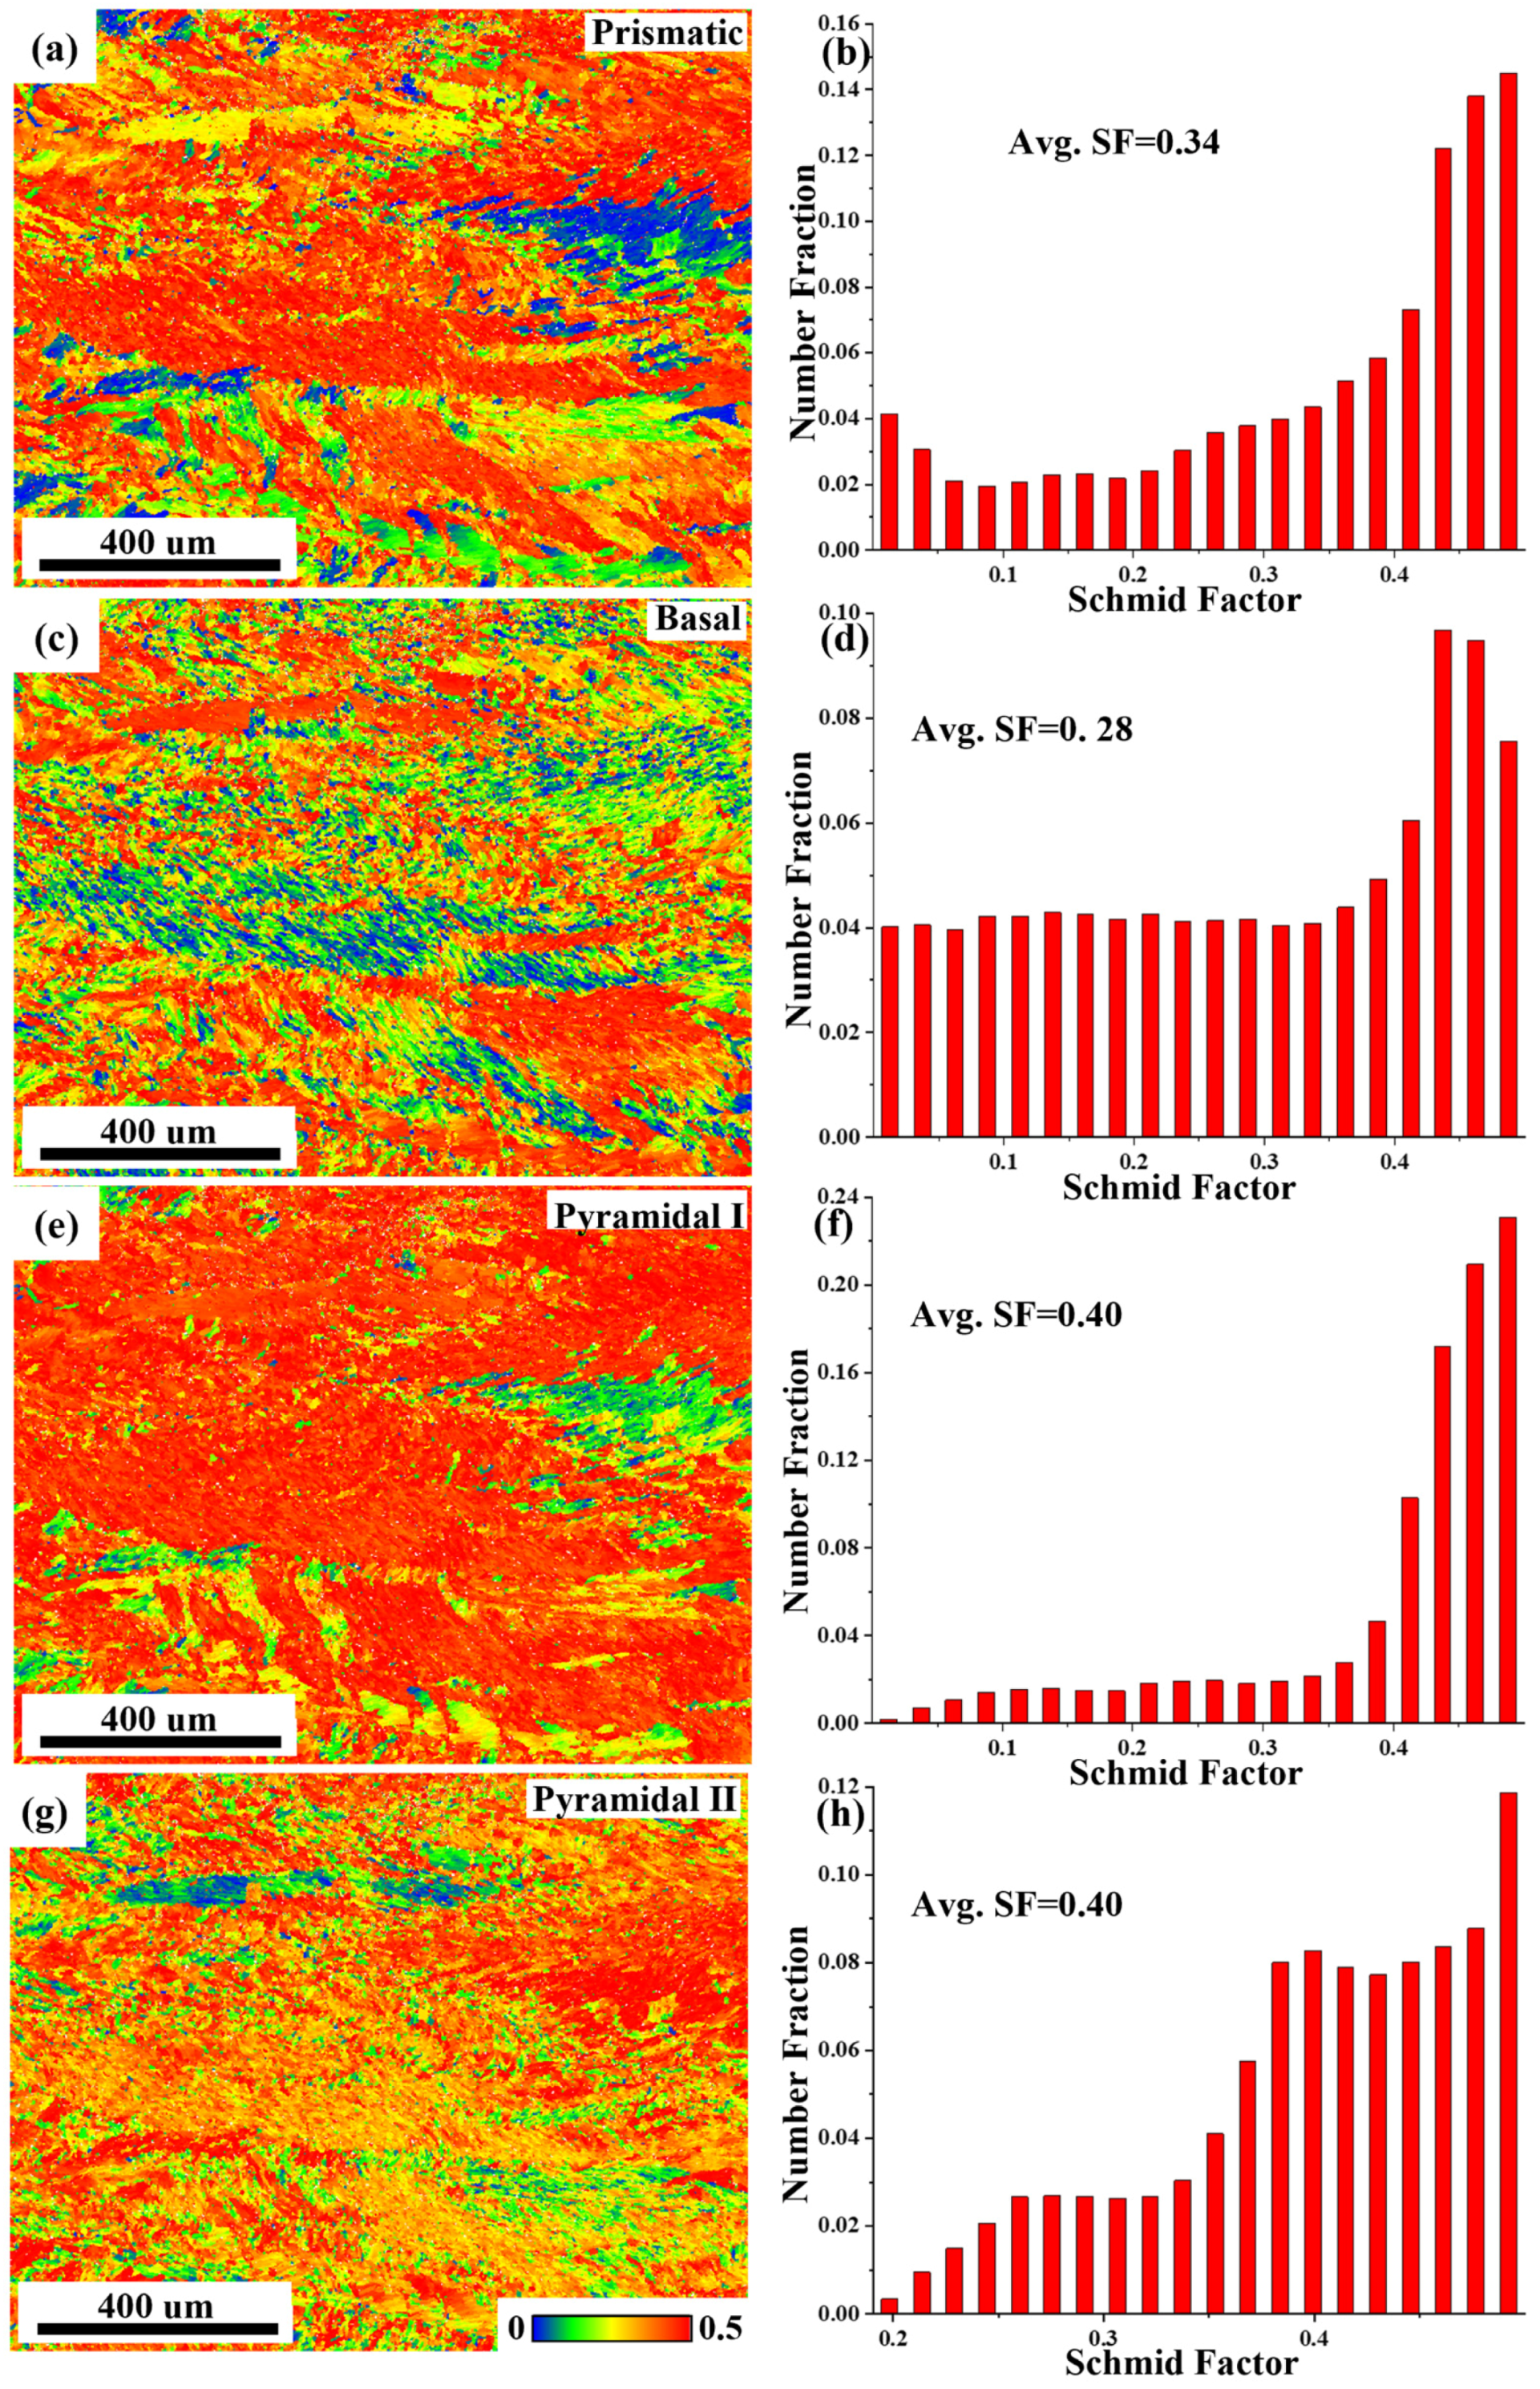
Quantitative calculation of SF was performed. The simplified stress state is set as tension along the specimen’s long side. Therefore, when the crack propagation plane differs, the stress direction also differs. The SF calculation results for crack propagation on different planes are shown in Figure 8 and Figure 9. When cracking occurs along the RD-ND plane (Figure 8), the red regions occupy a relatively large area in the SF map for second-order pyramidal slip and the blue and green regions occupy a relatively large area in the SF map for prismatic slip. The average SF for second-order pyramidal slip is the highest (0.41), followed by basal slip (0.33) and first-order pyramidal slip (0.32), with prismatic slip being the lowest (0.23). In comparison, when cracking occurs along the TD-ND plane (Figure 9), the red regions occupy a relatively large area in all SF maps except for that of basal slip, which is also composed of moderate amounts of green and blue areas. The average SF for prismatic slip increases to 0.34, basal slip decreases to 0.28, first-order pyramidal slip increases to 0.40, and second-order pyramidal slip remains essentially unchanged. Given that prismatic slip has the lowest CRSS and can be activated at a lower SF [21,22], its higher SF on the TD-ND plane directly promotes plastic deformation at the crack tip, thereby contributing to the superior impact toughness of the L-S specimen. Conversely, the very low prismatic SF on the RD-ND plane largely suppresses slip activation in the T-S specimen, leading to its poorer toughness.
Figure 8.
The distribution maps and statistical plot of SF in RD-ND plane: (a,b) prismatic slip; (c,d) basal slip; (e,f) first-order pyramidal slip and (g,h) second-order pyramidal slip.
Figure 9.
The distribution maps and statistical plot of SF in TD-ND plane: (a,b) prismatic slip; (c,d) basal slip; (e,f) first-order pyramidal slip and (g,h) second-order pyramidal slip.
The difference in plastic deformation ability affects impact toughness throughout both the crack initiation and propagation stages. During crack initiation, when the crystal orientation at the notch tip favors slip system activation, significant plastic deformation occurs at the crack tip, delaying crack initiation and absorbing more energy [23,24,25]. For the L-S and T-S specimens, the impact loading direction is ND. The former cracks along the TD-ND plane and has relatively higher SFs for slip systems. Multiple slip systems, primarily prismatic slip supplemented by first-order and second-order pyramidal slip, are more easily activated, promoting uniform plastic deformation at the crack tip and delaying crack initiation. This mechanism is consistent with the fracture surface observations of the L-S specimen (Figure 6d), which show larger and deeper dimples, along with a larger height difference and rougher fracture plane, all reflecting extensive plastic deformation at the crack tip. For the T-L specimen, the crack propagates along the RD-ND plane, and the extremely low SF (0.23) for prismatic slip limits plastic deformation, leading to earlier crack initiation. This corresponds to the flat, smooth areas observed on the T-L specimen’s fracture surface (Figure 6c).
During crack propagation, the SF influences the development of the plastic zone at the crack tip. When slip systems are easily activated, the plastic zone size at the crack tip is larger, plastic deformation is more sufficient, and more energy is consumed for crack propagation [26]. The favorable SFs for the L-S specimen allow it to maintain a larger plastic zone at the crack tip, resulting in higher crack propagation resistance. In contrast, due to limited slip activation, the T-L orientation has a smaller plastic zone, allowing the crack to propagate more quickly. Combining the differences in crack initiation and propagation stages, the L-S specimen exhibits higher impact toughness than the T-S specimen, while the T-L specimen shows lower impact toughness.
4.2. Influence of Microstructural Details on Crack Propagation
We have compared the effect of plastic deformation ability of the microstructure on crack initiation and propagation for different crack propagation planes. However, when the crack propagates within the same plane but the impact loading direction differs, the crack propagation direction also differs, leading to significant differences in the material’s impact toughness. This is because, in addition to the ease of slip system activation, the detailed characteristics of the microstructure (including the orientation and aspect ratio of the α laths, grain boundary features, and strain distribution) play a decisive role in the tortuosity of the crack propagation path.
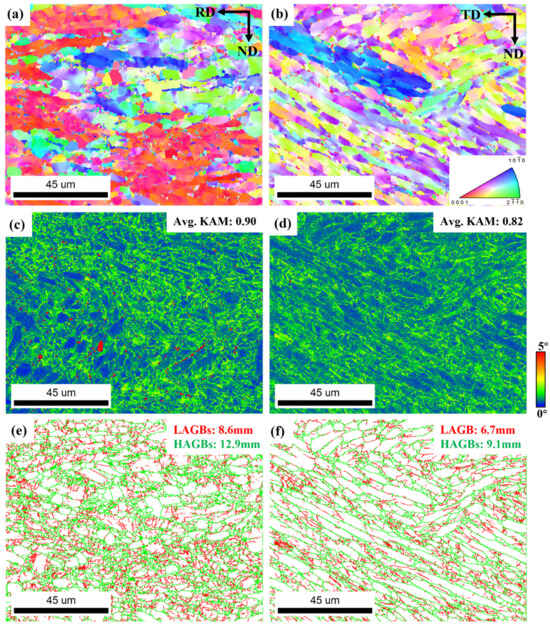
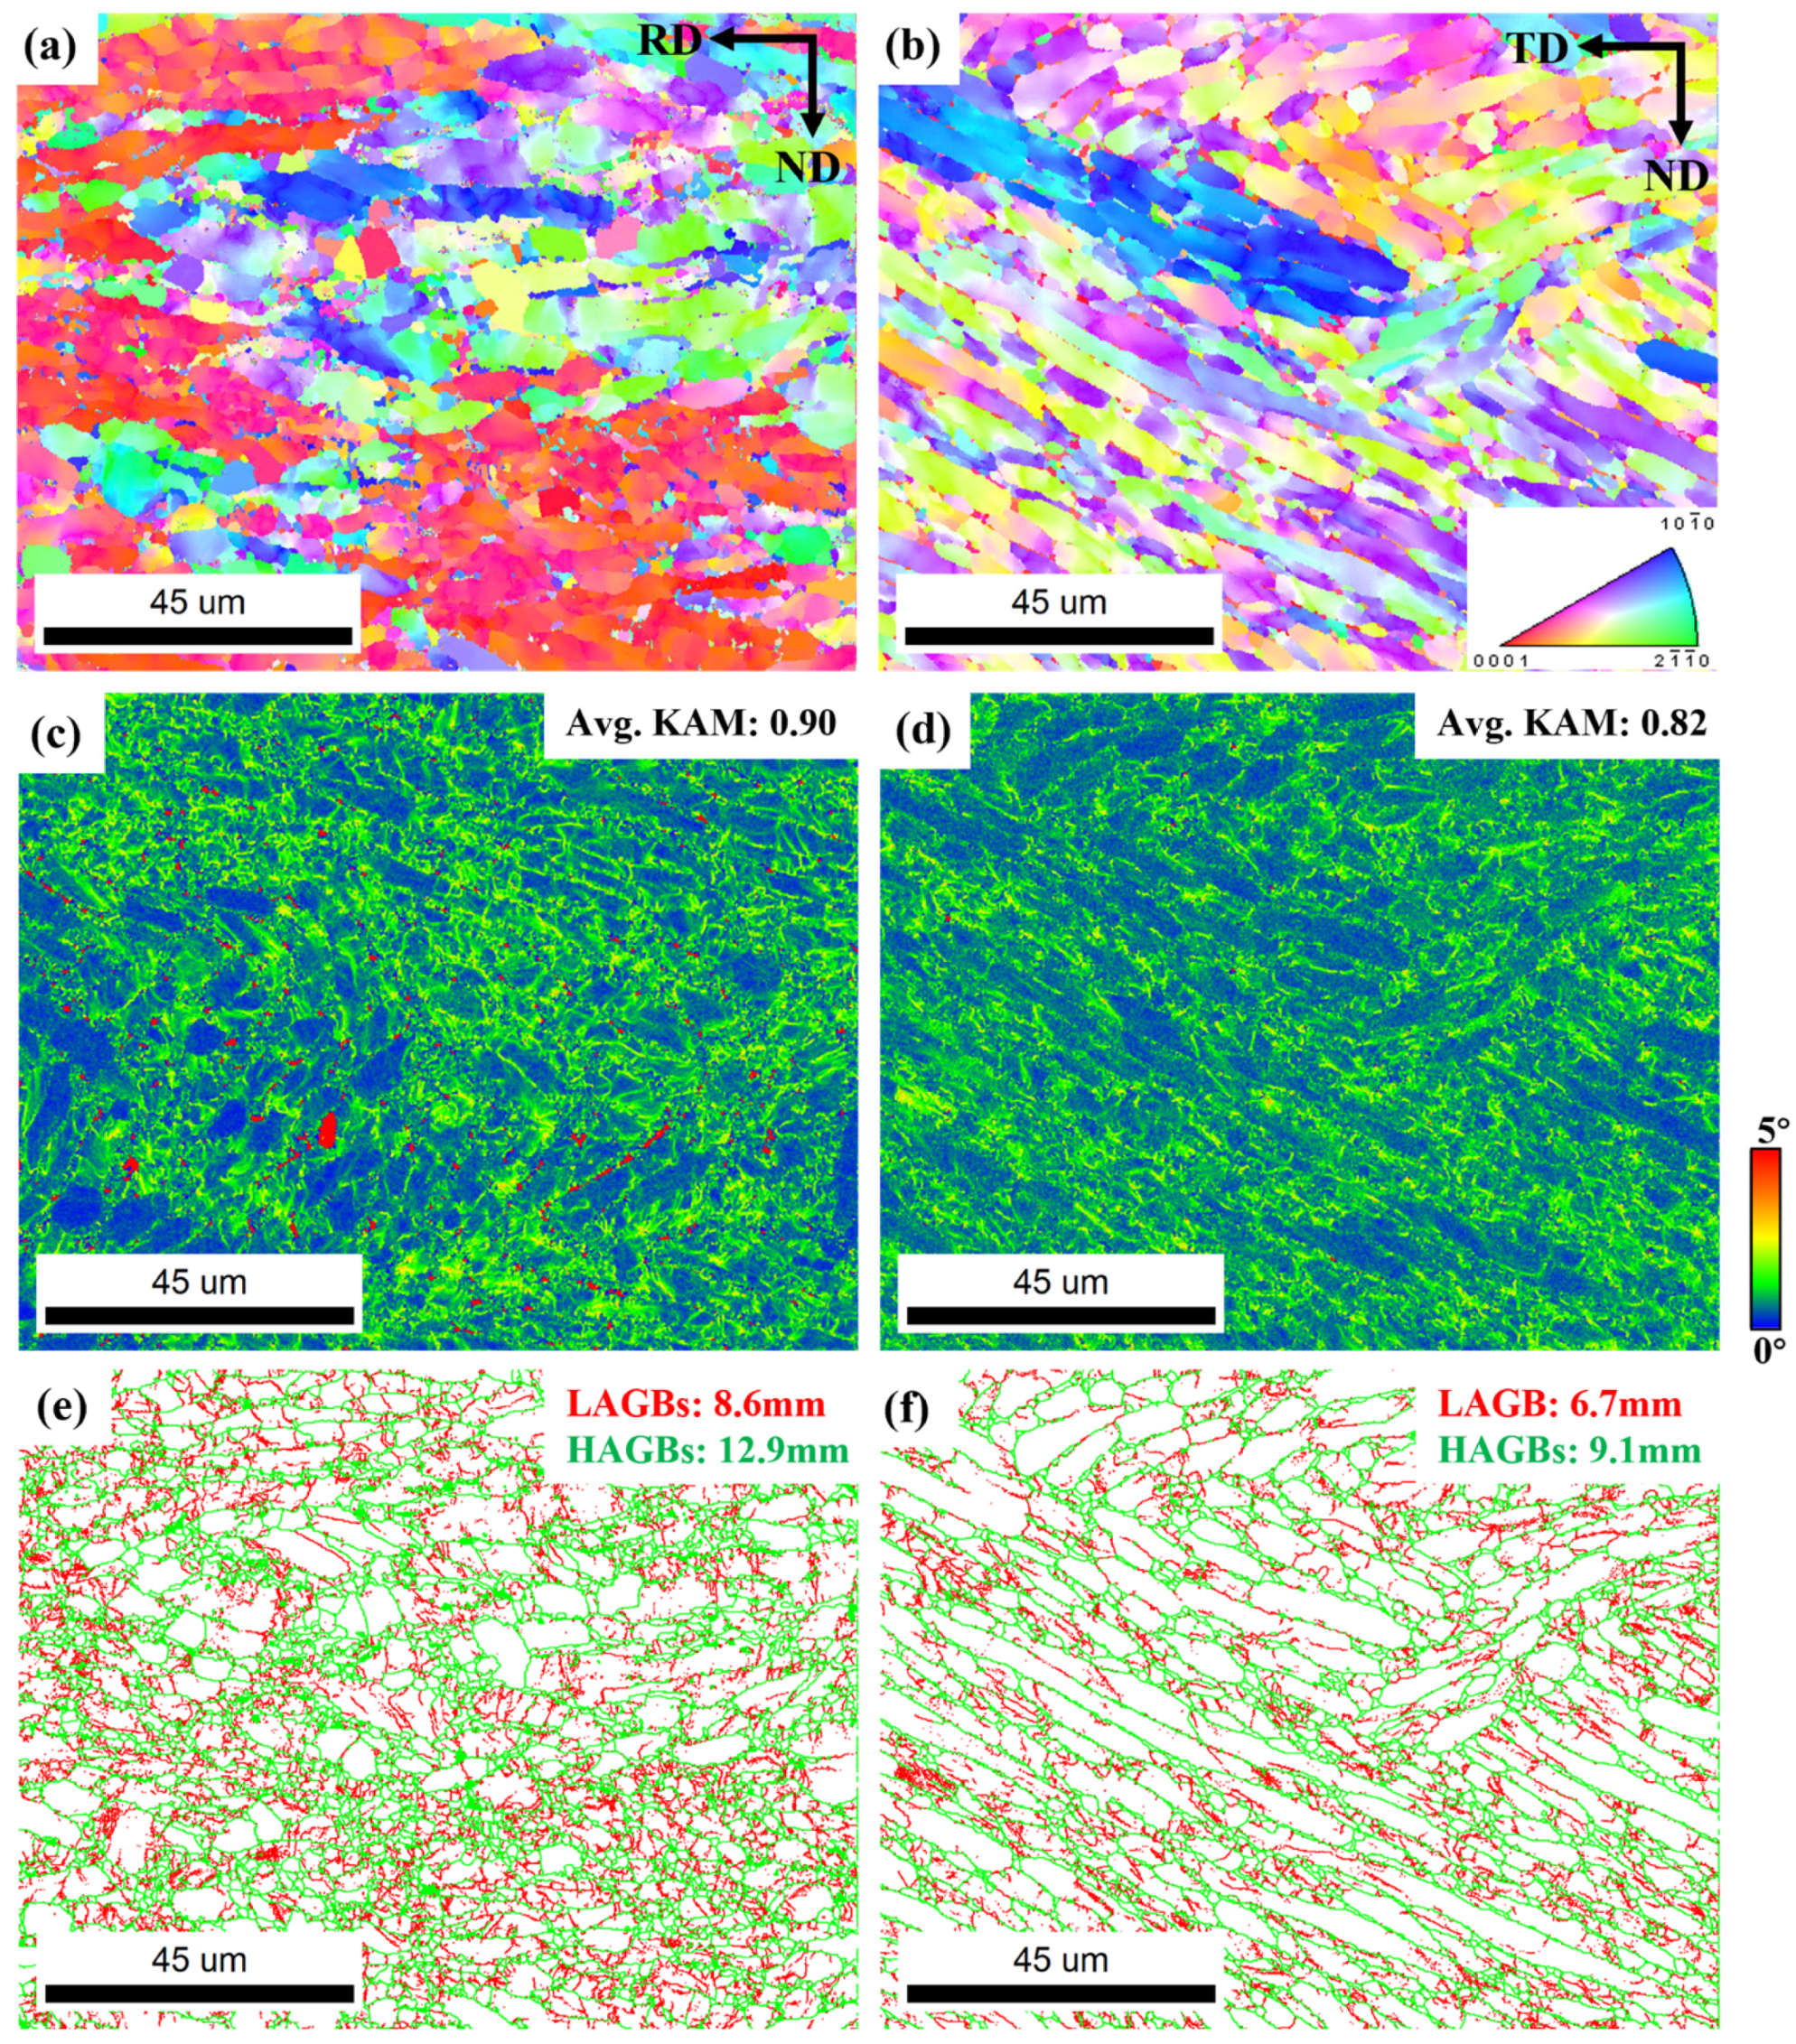
To further analyze the microstructure, EBSD was used to observe and analyze the rolled plate microstructure at higher magnifications, as shown in Figure 10. The kernel average misorientation (KAM) maps shown in Figure 10c,d reflect the strain concentration of the rolled plate microstructure. Due to the relatively low annealing temperature (700 °C), the microstructure did not fully recrystallize, and the deformation stress generated during rolling was not completely eliminated. On the TD-ND plane, the average KAM value is 0.82, while on the RD-ND plane, the average KAM value is higher (0.90), with some grain boundaries showing extremely high KAM values. This indicates that the RD-ND plane has higher strain concentration and dislocation density. When a propagating crack encounters a region with high strain concentration, the strain further increases, potentially leading to cracking and thus promoting crack propagation. This also correlates with the observation that the impact toughness of the T-S specimen is lower than that of the L-S specimen.
Figure 10.
The IPF maps, KAM maps and grain boundaries maps of (a,c,e) RD-ND and (b,d,f) TD-ND plane.
The basket-weave microstructure, characterized by interwoven α laths, promotes crack deflection. When the crack encounters α laths that are at a large angle to the propagation direction, the crack must deflect or branch, consuming additional energy [22,23,24]. This mechanism is most effective on the TD-ND plane because the α laths on this plane exhibit a more elongated morphology and larger aspect ratio, providing more opportunities for crack deflection.
Besides the geometric characteristics of the α laths, the type of grain boundaries also plays an important role in the crack propagation path. Grain boundary statistics from Figure 10 show that on the RD-ND plane, the total length of low-angle grain boundaries (LAGBs) is approximately 8.6 mm, and that of high-angle grain boundaries (HAGBs) is 12.9 mm. On the TD-ND plane, the total length of LAGBs is about 6.7 mm, and HAGBs is 9.1 mm. HAGBs have higher interfacial energy and larger misorientation, providing stronger resistance to dislocation motion and crack propagation [27,28,29]. In contrast, LAGBs are relatively easier paths for preferential crack propagation. On the RD-ND plane, the higher length of LAGBs, together with the smaller aspect ratio of the α laths, results in weaker interfacial resistance to crack propagation. On the TD-ND plane, although the absolute length of HAGBs is slightly lower, the combination of more elongated α lath morphology and their orientation, which has a certain angle with both TD and ND directions, may lead to more substantial crack deflection and energy dissipation [30,31].
The above microstructural features can well explain the difference in impact toughness under different loading directions within the same crack propagation plane. Take the RD-ND plane (T-S and T-L specimens) as an example. When the crack propagates along the ND direction (T-S specimen), the propagation direction is perpendicular to the elongation direction of the α laths. The crack needs to frequently cut through the α laths or deflect along the α/β interfaces, resulting in a tortuous path and high energy consumption. When the crack propagates along the RD direction (T-L specimen), the propagation direction is parallel to the elongation direction of the α laths. The crack can preferentially propagate along the grain boundaries between laths, resulting in a relatively straight path and low energy consumption [32]. Consequently, the impact toughness of the T-S specimen (70.8 J/cm2) is significantly higher than that of the T-L specimen (46.7 J/cm2). Similarly, within the TD-ND plane (L-S and L-T specimens), when the crack propagates along the ND direction (L-S specimen), the propagation direction is also perpendicular to the elongation direction of the α laths, leading to a tortuous crack path and the highest impact toughness (97.75 J/cm2). When the crack propagates along the TD direction (L-T specimen), the propagation direction has a certain angle with the lath elongation direction, but the hindering effect of the laths is less significant than when it is perpendicular, resulting in an intermediate impact toughness (52.65 J/cm2).
Fracture surface observations further support the above analysis. The L-S specimen (Figure 5d) shows flow lines perpendicular to the loading direction and the largest fracture surface height difference (Figure 5e), indicating the most tortuous crack propagation path. This is consistent with the thinner and longer α laths, the higher HAGB proportion on the TD-ND plane, and the geometry of crack propagation perpendicular to the laths. The T-L specimen (Figure 5c) shows flow lines parallel to the loading direction and the flattest fracture surface, indicating a relatively straight crack propagation path. This corresponds to the mechanism of crack propagation parallel to the lath elongation direction on the RD-ND plane, preferentially along weak interfaces.
The impact toughness of a Ti-6Al-4V alloy with a similar microstructure is about 60 J/cm2, whereas the present alloy exhibits higher impact toughness [8]. This is because the addition of Ni and Nb increases the content and stability of the β phase [33]. On the one hand, the number of activatable slip systems in the β phase is much higher than that in the α phase, so its increased content improves the plastic deformation ability. On the other hand, the increased amount of fine β phase acts as an effective barrier to crack propagation, thereby enhancing the impact toughness.
In summary, the superior impact toughness of the L-S specimen stems from: (1) The strong T-type texture provides higher SFs for prismatic and first-order pyramidal slip on the TD-ND plane, making multiple slip systems easily activatable. This results in sufficient plastic deformation at the crack tip, delaying crack initiation and developing a larger plastic zone. (2) The thinner and longer α laths (thickness 6 μm, aspect ratio 3.3) and the higher proportion of HAGBs on the TD-ND plane cause a rougher and more tortuous fracture surface, resulting in higher fracture energy consumption. (3) The lower KAM value (0.82) on the TD-ND plane indicates a lower degree of strain concentration, making it less prone to cracking due to local excessive strain and helping maintain crack propagation resistance. Conversely, the poor toughness of the T-L orientation is attributed to: The T-type texture results in a very low SF (0.23) for prismatic slip on the RD-ND plane, limiting slip activation; the coarser α laths (thickness 10 μm, aspect ratio 1.5) and higher proportion of LAGBs allow the crack to propagate straight along weak interfaces; the higher KAM value (0.90) reflects more severe strain concentration, which easily promotes crack initiation and propagation.
5. Conclusions
This study systematically investigated the effects and mechanisms of texture and microstructure on the anisotropy of impact toughness in a Ti-6Al-4V-0.5Ni-0.5Nb hot-rolled alloy plate by conducting Charpy impact tests in different orientations, combined with EBSD texture analysis, fracture morphology observation, and SF calculation for slip systems. The main conclusions are as follows:
(1) The impact toughness exhibits strong anisotropy. The L-S specimen (fracture on TD-ND plane, loading along ND) shows the highest impact toughness (97.75 J/cm2), while the T-L specimen (fracture on RD-ND plane, loading along RD) shows the lowest (46.7 J/cm2).
(2) Crystalline texture influences slip system activation behavior by modulating the SF. The plate has a strong T-type texture (c-axis//TD). When fracturing along the TD-ND plane, the SFs for prismatic and first-order pyramidal slip are higher. Multiple slip systems are easily activated, leading to sufficient plastic deformation at the crack tip, delaying crack initiation, and developing a larger plastic zone. When fracturing along the RD-ND plane, the SF for prismatic slip is extremely low (0.23), slip activation is limited, and the plastic deformation ability is poor.
(3) The geometric characteristics of α laths and the type of grain boundaries together appear to influence the tortuosity of the crack propagation path. The TD-ND plane features thinner and longer α laths and a higher proportion of HAGBs. When the crack propagates along the ND direction (L-S specimen), the propagation direction is perpendicular to the lath elongation direction, which may require the crack to frequently deflect or cut through laths, potentially resulting in a more tortuous path and higher energy consumption. In contrast, the RD-ND plane features coarser α laths and a higher proportion of LAGBs. When the crack propagates along the RD direction (T-L specimen), the propagation direction is parallel to the lath elongation direction, and the crack could propagate more straightly along weak interfaces, likely leading to lower energy consumption.
(4) The degree of strain concentration reflected by the KAM value is negatively correlated with impact toughness. The average KAM value on the RD-ND plane (0.90) is higher than that on the TD-ND plane (0.82). Higher strain concentration could promotes crack initiation and propagation, which corresponds to the lowest impact toughness of the T-L specimen.
In summary, the anisotropy of impact toughness in the Ti-6Al-4V-0.5Ni-0.5Nb hot-rolled alloy plate is the result of the combined action of crystalline texture and microstructure: texture dominates the activation behavior of slip systems and the plastic deformation ability, while the geometric characteristics of α laths, grain boundary types, and the degree of strain concentration together control the tortuosity of the crack propagation path and energy consumption.
Author Contributions
Conceptualization, B.F., J.S. and Y.Y.; methodology, B.F., Y.Y. and W.Y.; software, B.F., B.W.; validation, B.F.,Y.Y. and Y.L. (Yanfeng Li); formal analysis, B.F., J.S. and Y.L. (Yanfeng Li); investigation, B.W., Y.Y. and Y.L. (Yumeng Luo); writing—original draft preparation, B.F.; writing—review and editing, B.F., J.S., B.W., Y.Y., W.Y., Y.L. (Yumeng Luo)and S.H.; visualization, B.F.; supervision, B.W., Y.Y. and Y.L. (Yumeng Luo); project administration, J.S., B.W., Y.Y., W.Y. and S.H. All authors have read and agreed to the published version of the manuscript.
Funding
This research received no external funding.
Data Availability Statement
The original contributions presented in this study are included in the article. Further inquiries can be directed to the corresponding authors.
Conflicts of Interest
All authors were employed by State Key Laboratory of Nonferrous Structural Materials, GRIMAT Engineering Institute Co., Ltd., General Research Institute for Nonferrous Metals and author Songxiao Hui is also employed by GRINM (Guangdong) Institute for Advanced Materials and Technology. All authors declare that this research was conducted in the absence of any commercial or financial relationships that could be construed as potential conflicts of interest.
References
- Airao, J.; Nirala, C.K.; Bertolini, R.; Krolczyk, G.M.; Khanna, N. Sustainable Cooling Strategies to Reduce Tool Wear, Power Consumption and Surface Roughness during Ultrasonic Assisted Turning of Ti-6Al-4V. Tribol. Int. 2022, 169, 107494. [Google Scholar] [CrossRef] [Scilit]
- Akula, S.P.; Ojha, M.; Rao, K.L.; Gupta, A.K. A Review on Superplastic Forming of Ti-6Al-4V and Other Titanium Alloys. Mater. Today Commun. 2023, 34, 105343. [Google Scholar] [CrossRef] [Scilit]
- Nayak, S.; Singh, A.K.; Prasad, M.J.N.V.; Narasimhan, K. Development of Microstructural Heterogeneities and Dynamic Restoration Activity during Ring Rolling of Ti-6Al-4V Alloy and Its Tensile Response. J. Alloys Compd. 2023, 963, 171241. [Google Scholar] [CrossRef] [Scilit]
- Yao, X.J.; Yao, S.Y.; Qin, C.H.; Wang, Y.F.; Tang, W. Effect of annealing temperature on microstructures and mechanical properties of a hot-rolled Ti-6Al-4V-0.5Ni-0.5Nb alloy for offshore applications. Mater. Res. Express 2023, 10, 026510. [Google Scholar] [CrossRef] [Scilit]
- Won, J.W.; Suh, B.-C.; Kim, J.H.; Lee, D.W.; Hyun, Y.-T. Texture Development of Pure Ti by Rolling at Various Temperatures and Its Effect on Sheet Formability. J. Mater. Res. Technol. 2024, 32, 2214–2223. [Google Scholar] [CrossRef] [Scilit]
- Buirette, C.; Huez, J.; Gey, N.; Vassel, A.; Andrieu, E. Study of Crack Propagation Mechanisms during Charpy Impact Toughness Tests on Both Equiaxed and Lamellar Microstructures of Ti–6Al–4V Titanium Alloy. Mater. Sci. Eng. A 2014, 618, 546–557. [Google Scholar] [CrossRef] [Scilit]
- Li, L.; Li, M.Q.; Luo, J. Mechanism in the β Phase Evolution during Hot Deformation of Ti–5Al–2Sn–2Zr–4Mo–4Cr with a Transformed Microstructure. Acta Mater. 2015, 94, 36–45. [Google Scholar] [CrossRef] [Scilit]
- Lei, L.; Zhao, Y.; Zhao, Q.; Wu, C.; Huang, S.; Jia, W.; Zeng, W. Impact Toughness and Deformation Modes of Ti–6Al–4V Alloy with Different Microstructures. Mater. Sci. Eng. A 2021, 801, 140411. [Google Scholar] [CrossRef] [Scilit]
- Wu, M.-W.; Lai, P.-H.; Chen, J.-K. Anisotropy in the Impact Toughness of Selective Laser Melted Ti–6Al–4V Alloy. Mater. Sci. Eng. A 2016, 650, 295–299. [Google Scholar] [CrossRef] [Scilit]
- ISO 148-1:2016; Metallic Materials—Charpy Pendulum Impact Test—Part 1: Test Method. International Organization for Standardization: Geneva, Switzerland, 2016.
- Hooshmand, M.S.; Mills, M.J.; Ghazisaeidi, M. Atomistic Modeling of Dislocation Interactions with Twin Boundaries in Ti. Model. Simul. Mater. Sci. Eng. 2017, 25, 045003. [Google Scholar] [CrossRef] [Scilit]
- Kwasniak, P.; Clouet, E. Basal Slip of ⟨a⟩ Screw Dislocations in Hexagonal Titanium. Scr. Mater. 2019, 162, 296–299. [Google Scholar] [CrossRef] [Scilit]
- Rida, A.; Rao, S.I.; El-Awady, J.A. Characteristics of <a> Screw Dislocations and Their Slip on Prismatic and Pyramidal Planes in Pure α Titanium from Atomistic Simulations. Materialia 2022, 24, 101503. [Google Scholar] [CrossRef] [Scilit]
- Kale, C.; Garg, P.; Bazehhour, B.G.; Srinivasan, S.; Bhatia, M.A.; Peralta, P.; Solanki, K.N. Oxygen Effects on Crystal Plasticity of Titanium: A Multiscale Calibration and Validation Framework. Acta Mater. 2019, 176, 19–32. [Google Scholar] [CrossRef] [Scilit]
- Kishida, K.; Kim, J.G.; Nagae, T.; Inui, H. Experimental Evaluation of Critical Resolved Shear Stress for the First-Order Pyramidal c + a Slip in Commercially Pure Ti by Micropillar Compression Method. Acta Mater. 2020, 196, 168–174. [Google Scholar] [CrossRef] [Scilit]
- Li, H.; Mason, D.E.; Bieler, T.R.; Boehlert, C.J.; Crimp, M.A. Methodology for Estimating the Critical Resolved Shear Stress Ratios of α-Phase Ti Using EBSD-Based Trace Analysis. Acta Mater. 2013, 61, 7555–7567. [Google Scholar] [CrossRef] [Scilit]
- Wang, L.; Zheng, Z.; Phukan, H.; Kenesei, P.; Park, J.-S.; Lind, J.; Suter, R.M.; Bieler, T.R. Direct Measurement of Critical Resolved Shear Stress of Prismatic and Basal Slip in Polycrystalline Ti Using High Energy X-Ray Diffraction Microscopy. Acta Mater. 2017, 132, 598–610. [Google Scholar] [CrossRef] [Scilit]
- Xiao, Y.; Mann, W.; Liu, C.; Guo, L.; He, B.; Rong, Y. Mechanism of Impact Toughness Enhancement Obtained by Globularization of αGB Phase for Selective Laser Melted Ti–6Al–4V Alloy. Mater. Sci. Eng. A 2024, 892, 146036. [Google Scholar] [CrossRef] [Scilit]
- Peng, S.; Liu, Y.; Fu, M.; Liang, Y.; Zhang, K.; Feng, C.; Feng, W.; Zhang, P.; Liu, H. Synergistically Achieving High Strength and Impact Toughness in Ti–6Al–4V-0.5Mo-0.5Zr Alloy Pipe with Bimodal Microstructure. Mater. Sci. Eng. A 2024, 895, 146217. [Google Scholar] [CrossRef] [Scilit]
- Hu, B.; Ge, J.; He, J.; Kong, B.; Zhang, X.; Zhou, K. Research on the Related between Microstructures and Impact Toughness of Ti80 Alloy. J. Mater. Res. Technol. 2025, 35, 702–713. [Google Scholar] [CrossRef] [Scilit]
- Li, D.; Meng, Z.C.; Shen, Y.Y.; Zhang, J.H.; Hu, M.; Qiu, J.K.; Li, S.J. Study of Low-Temperature Impact Deformation Behavior of Ti–6Al–4V Alloy. Vacuum 2024, 222, 113066. [Google Scholar] [CrossRef] [Scilit]
- Yang, R.; Zhao, F.; Liu, Y.; Shi, K.; Yin, S.; Fan, M. Research on the Microstructural Evolution Mechanism and Impact Toughness of Ti-17 Alloy with an Initial Basket-Weave Microstructure. Mater. Today Commun. 2022, 31, 103640. [Google Scholar] [CrossRef] [Scilit]
- Jiang, C.; Zhu, D.; Wang, N.; Chen, Y.; An, Y.; Zhao, Q.; Xu, Y.; Hou, Z.; Zhao, Y. The Interrelation of Crack Propagation Behaviors and Lamellar Structure in a New near α Titanium Alloy at Low Temperature. J. Alloys Compd. 2023, 956, 170342. [Google Scholar] [CrossRef] [Scilit]
- Xu, J.; Zeng, W.; Zhao, Y.; Jia, Z. Effect of Microstructure Evolution of the Lamellar Alpha on Impact Toughness in a Two-Phase Titanium Alloy. Mater. Sci. Eng. A 2016, 676, 434–440. [Google Scholar] [CrossRef] [Scilit]
- Wilshaw, T.R.; Pratt, P.L. On the Plastic Deformation of Charpy Specimens Prior to General Yield. J. Mech. Phys. Solids 1966, 14, 7–19. [Google Scholar] [CrossRef] [Scilit]
- Duan, Q.Q.; Qu, R.T.; Zhang, P.; Zhang, Z.J.; Zhang, Z.F. Intrinsic Impact Toughness of Relatively High Strength Alloys. Acta Mater. 2018, 142, 226–235. [Google Scholar] [CrossRef] [Scilit]
- Luo, Y.; Wang, Y.; Wang, L.; Liu, B.; Cao, Y.; Liu, Y. Effect of Crystallographic Texture on the Anisotropy of Fracture Toughness in As-Forged Ti-45Al-7Nb-0.4W-0.1B Intermetallics. J. Alloys Compd. 2025, 1014, 178672. [Google Scholar] [CrossRef] [Scilit]
- Luo, Y.; Liu, B.; Wang, Y.; Liu, Y. Effect of Texture on Mechanical Anisotropy of Ti–47Al–2Cr-0.2Mo Intermetallics. Intermetallics 2022, 151, 107742. [Google Scholar] [CrossRef] [Scilit]
- Guo, B.; Gao, H.; Kong, C.; Wang, Z.; Cui, H.; Yu, H. Transverse Texture Weakening and Anisotropy Improvement of Ti-6Al-4V Alloy Sheet via Asymmetric Rolling and Static Recrystallization Annealing. J. Alloys Compd. 2025, 1010, 177507. [Google Scholar] [CrossRef] [Scilit]
- Zhang, M.; Qiu, J.; Fang, C.; Zhang, M.; Yang, Z.; Lei, J. Effect of Texture on the Room Temperature Tensile and Creep Properties of Ti–6Al–4V Plate with Large Thickness. J. Mater. Res. Technol. 2024, 30, 2311–2321. [Google Scholar] [CrossRef] [Scilit]
- Wang, H.; Tu, X.; Guo, P.; Fang, H.; Qiang, F.; Zhang, J.; Xin, S. Impact Toughness and Its Deformation Behavior of a Novel Low-Cost Titanium Alloy. J. Mater. Res. Technol. 2025, 35, 4412–4426. [Google Scholar] [CrossRef] [Scilit]
- Li, H.; Wang, K. Effect of lamellar-α geometry characteristics on impact toughness and fracture mechanism in Ti-6Al-4V alloy. J. Alloys Compd. 2025, 1042, 183963. [Google Scholar] [CrossRef] [Scilit]
- Ge, J.; Guo, J.; Yu, Y.; Ye, W.; Hui, S. Effect of annealing temperature on the microstructures and impact toughness of Ti-6Al-4V-0.5Ni-0.5Nb titanium alloy plates. J. Phys. 2023, 2454, 012014. [Google Scholar] [CrossRef] [Scilit]

Disclaimer/Publisher’s Note: The statements, opinions and data contained in all publications are solely those of the individual author(s) and contributor(s) and not of MDPI and/or the editor(s). MDPI and/or the editor(s) disclaim responsibility for any injury to people or property resulting from any ideas, methods, instructions or products referred to in the content. |
© 2026 by the authors. Licensee MDPI, Basel, Switzerland. This article is an open access article distributed under the terms and conditions of the Creative Commons Attribution (CC BY) license.