


Abstract
High-quality, large-weight alloy wires (>200 kg per coil) for aerospace fasteners require intermediate annealing prior to final cold drawing, as well as subsequent solution and aging heat treatments, which are critical processes during their manufacturing. However, the evolution of microstructure and mechanical properties during these procedures has not been systematically investigated. In this study, different cooling methods after intermediate annealing were comparatively investigated to clarify their influence on the microstructure evolution, precipitation behavior, and mechanical properties of Al–Zn–Mg–Cu alloy wires. The results revealed that the cold heading performance of alloy wires is determined by the strength–ductility balance, crystallographic texture, and precipitation behavior. Furnace cooling promoted η′ phase coarsening, resulting in lower strength and higher ductility, which enhanced deformation homogeneity and cold heading formability. The near-zero Δr reduced strain localization and cracking susceptibility, whereas higher Δr in water- and air-cooling samples increased anisotropy and cracking tendency. After heat treatment, strength differences became negligible, whereas elongation remained texture dependent, with the weaker texture in the furnace-cooling sample yielding superior ductility.
1. Introduction
A large aircraft typically requires millions of fasteners. Aerospace fastener stock materials (wires, rods, and bars) are predominantly aluminum alloys, owing to their low density, good formability, and recyclability [1,2]. Commonly used aluminum alloy wires for medium-to-high strength fasteners include Al–Cu, Al–Cu–Mg, Al–Mg, and Al–Zn–Mg–Cu alloys [3,4,5]. Among them, the heat-treatable Al–Zn–Mg–Cu alloy, characterized by high strength, good toughness, and excellent resistance to stress corrosion cracking and exfoliation corrosion, has been extensively applied in the field of high-end aluminum alloy fastener wires [6,7,8].
The preparation process of Al–Zn–Mg–Cu alloy wire has a significant influence on its microstructure and properties. Small-batch alloy wire can be produced using the traditional method of extrusion and cold drawing. However, this method is characterized by low efficiency [9,10]. Zhou [11] reported that the use of hot rolling and cold drawing processes instead of the traditional process can produce large rolls of heavy-gauge aluminum alloy wire and bar products with fine grains, a high density, complete streaks, and less anisotropy. The cold drawing process further reduces the diameter of Al–Zn–Mg–Cu alloy wires while maintaining the fine-grained microstructure [12]. Alloy wires with different target diameters must undergo multiple passes of cold drawing. Upon completion of the final cold drawing pass, the alloy wire is delivered in H13 temper condition. Intermediate annealing treatments are required between successive drawing passes to eliminate work hardening, thereby enabling subsequent cold drawing deformation [13,14,15]. The H13 temper wire is subsequently subjected to cold heading to fabricate finished fasteners. Cold-headed fasteners are typically subjected to artificial aging heat treatment and are widely used in applications such as aircraft skin panels and connecting rods, where they serve as critical fastening and joining components.
For alloy wires prior to cold heading, the strength must be maintained within an appropriate range as neither excessively high nor excessively low. In general, the tensile strength of H13 temper alloy wire is required to be controlled within 235~305 MPa [16]. Excessively high-strength wire tends to induce cracking during cold heading, whereas insufficient strength may lead to sticking during processing, resulting in wire fractures. In addition, a close microstructural correlation exists between the grain texture and cracking behavior during cold heading. Grains with different crystallographic orientations exhibit different slip system activation characteristics. These differences directly affect the deformation compatibility and plastic accommodation capability of the material during cold heading [17,18]. Equiaxed grains and weak texture can improve deformation compatibility, thereby reducing the tendency for cracking during cold heading [19,20].
Designing the cooling strategy after intermediate annealing before the final cold drawing can effectively regulate the precipitation state of strengthening phases in the alloy. Meanwhile, it can also influence the secondary particles in the alloy and regulate the grain texture characteristics, thereby enabling precise control of the strength range and texture components of the alloy wire to meet the specified delivery requirements [21,22,23].
In this work, 5.0 mm diameter Al–Zn–Mg–Cu alloy wire was subjected to an intermediate annealing treatment at 415 °C for 2 h. Following this, the wire was cooled to room temperature (RT) using three different cooling methods with water quenching, air cooling, and furnace cooling. After the final cold drawing, the wire was processed to the desired diameter of 3.5 mm in the finished state.
2. Materials and Methods
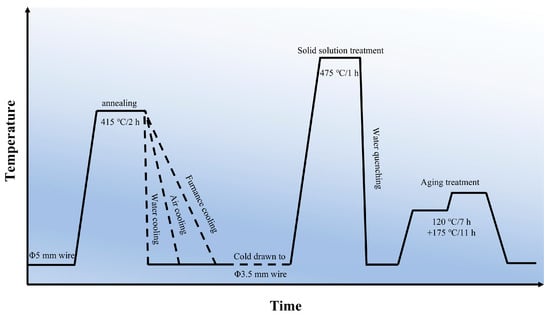
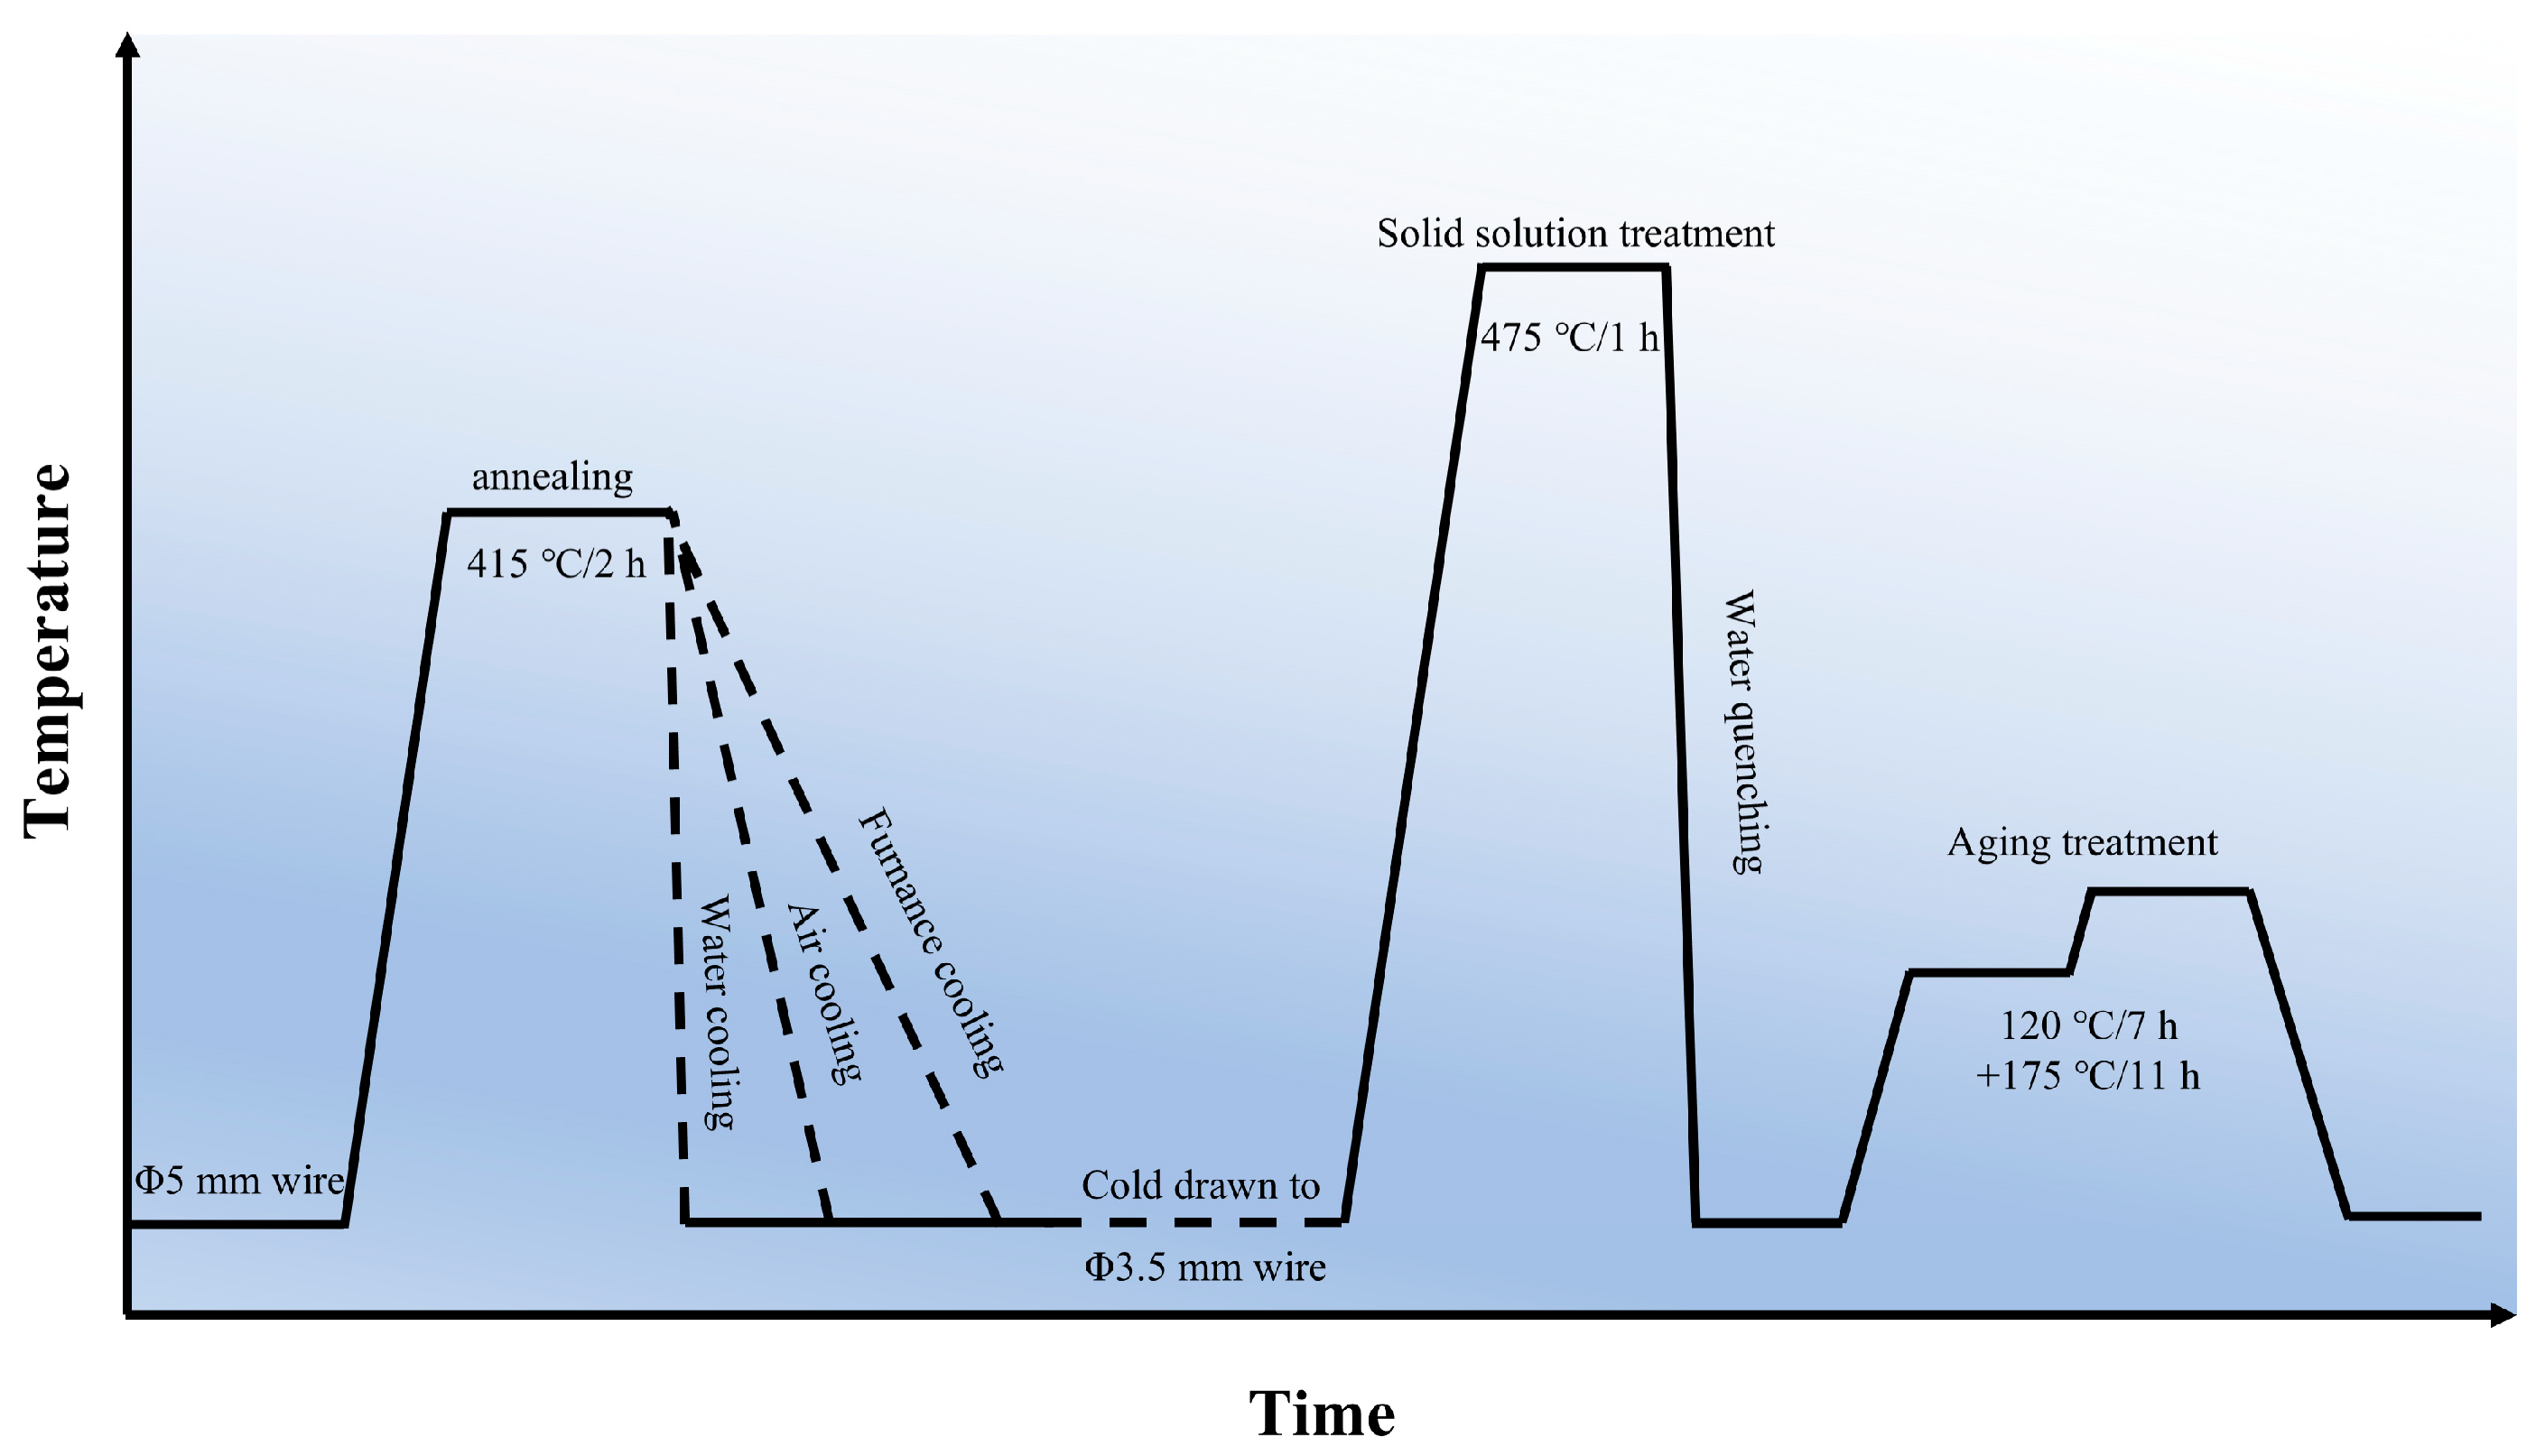
Typical Al–Zn–Mg–Cu alloy wires with a diameter of 5.0 mm were subjected to annealing at 415 °C for 2 h, followed by water quenching, air cooling, and furnace cooling. The chemical composition of Al 6.18%, Zn 2.09%, Mg 2.17%, Cu 0.10%, Fe-0.11%, and Zr (wt.%) was used in this work. After intermediate annealing followed by different cooling treatments, all alloy wires were subjected to a final cold drawing process to reduce the diameter to 3.5 mm, thereby obtaining the as-delivered condition. The wire samples cut to a length of 300 mm were solution heat treated at 475 °C for 60 min in an air-circulation furnace, followed by water quenching to room temperature. The alloy wire samples subjected to intermediate annealing followed by different cooling methods were subsequently pre-aged at 120 °C for 7 h, followed by a second-stage aging treatment at 175 °C for 11 h to achieve T73 temper. The detailed experimental process is schematically illustrated in Figure 1.
Figure 1.
Process flow diagram including all heat treatment and forming steps.
The tensile test and cold heading test were conducted at RT using an MTS-WD3100 electronic universal testing machine (Instron Corporation, Norwood, MA, USA) with a crosshead speed of 2 mm/min. For mechanical property tests, five parallel samples were tested for each condition to ensure statistical reliability. The recrystallized grain size of samples subjected to intermediate annealing followed by different cooling treatments was characterized using a JSM-7900F scanning electron microscope (SEM, ZEISS Company, Jena, Germany) equipped with an electron backscatter diffraction (EBSD) system. EBSD measurements were performed at an accelerating voltage of 20 kV with a step size of 2.0 µm. The acquired EBSD data were analyzed using OIM Analysis software (version 7.2) (AMETEK Inc., Mahwah, NJ, USA). The precipitation characteristics of the wire samples after artificial aging were examined by transmission electron microscopy (TEM) using a Talos F200X G2 microscope (FEI Company, Hillsboro, OR, USA). TEM thin foils were prepared by punching 3.0 mm diameter disks followed by twin-jet electropolishing in a Struers TenuPol-5 system (Struers Company, Westlake, OH, USA) using a solution of 30% HNO3 in methanol at temperatures below 25 °C and an operating voltage of 18 V. All TEM observations were carried out along the <110>Al zone axis. For microstructural characterization and statistical analysis, at least five fields of view were observed for each sample.
3. Results
3.1. Microstructure and Mechanical Properties Evolution from Intermediate Annealing to Cold Drawing
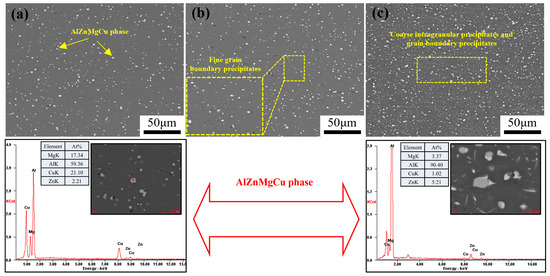
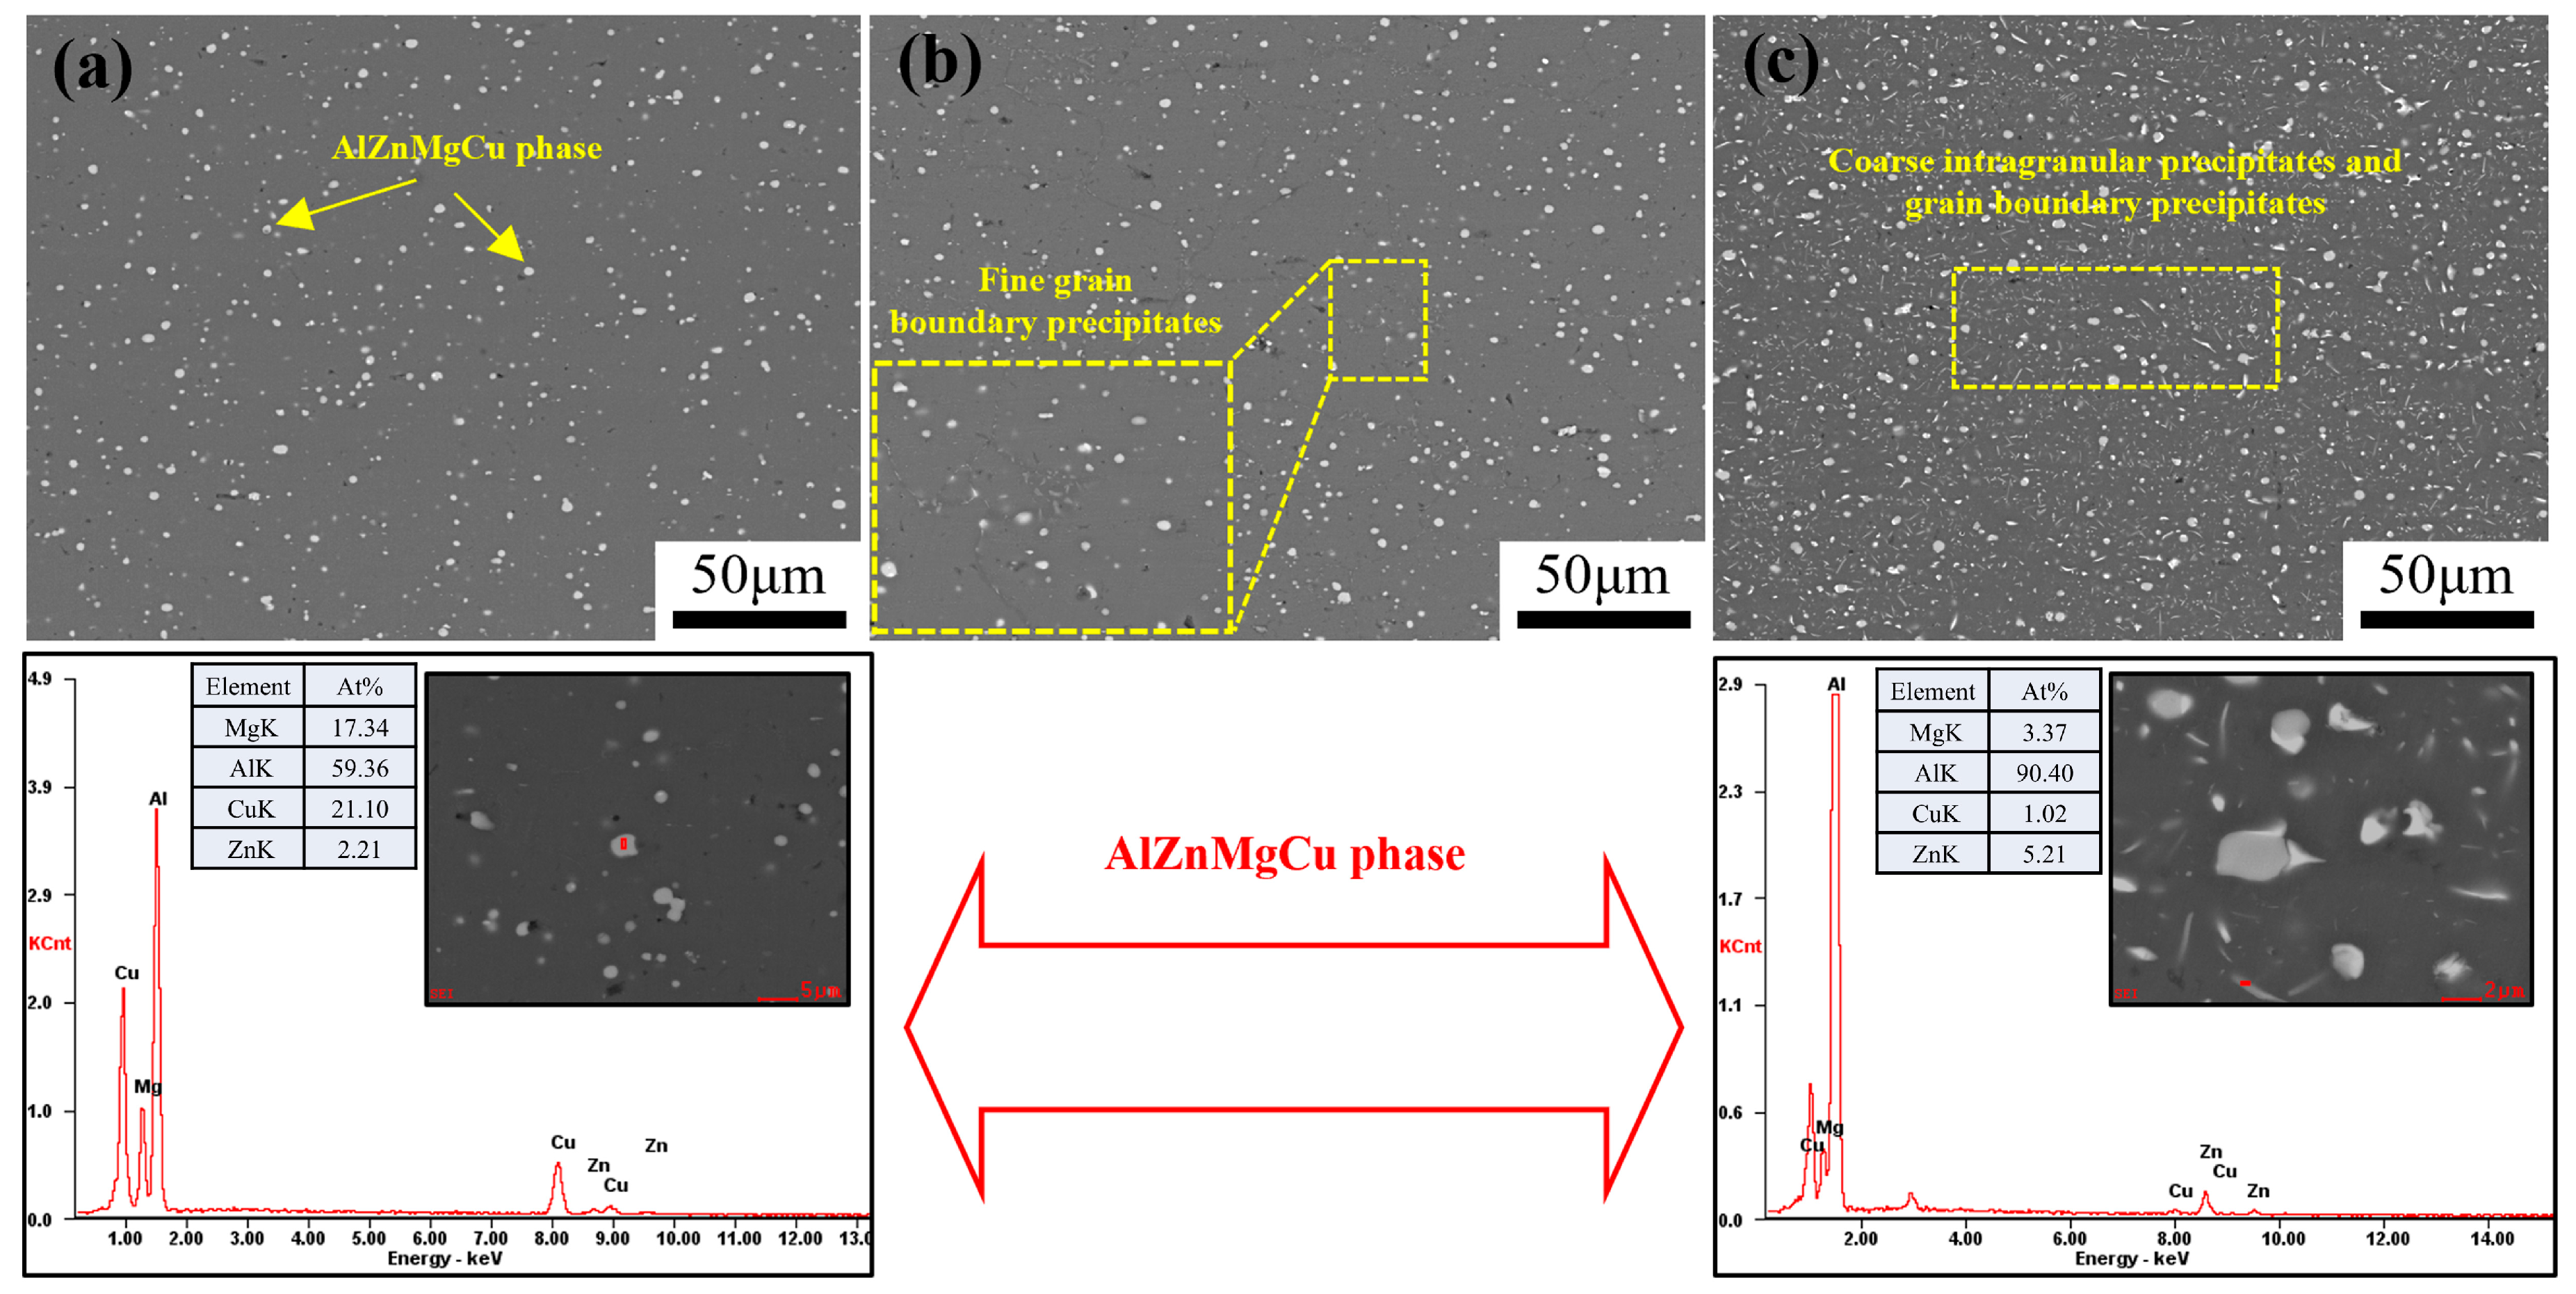
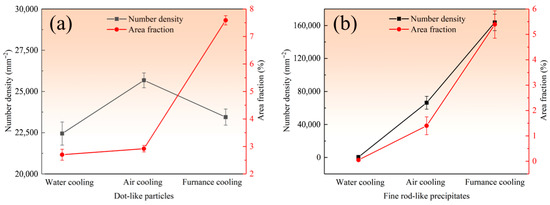
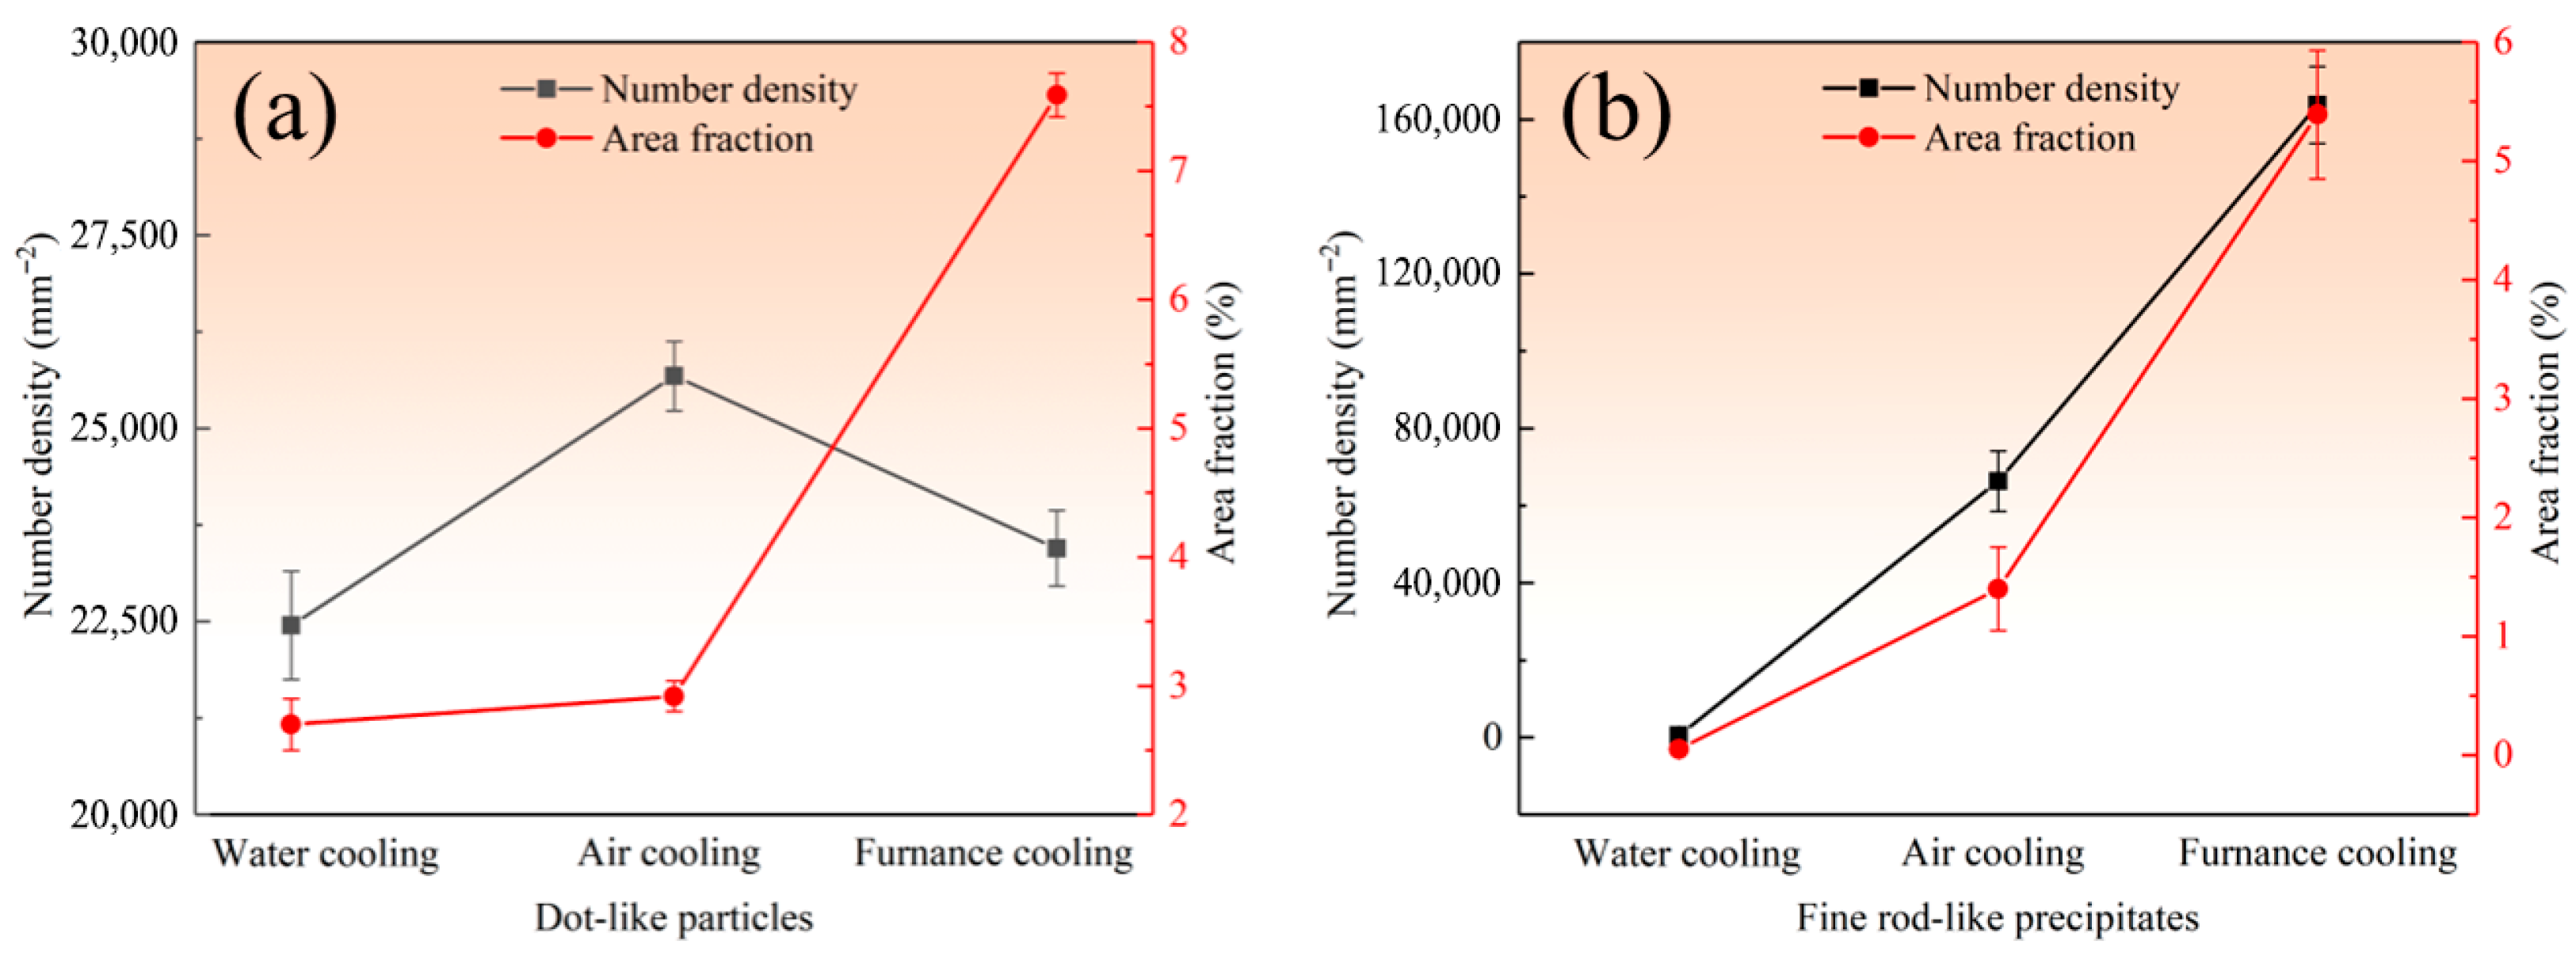
Figure 2 shows the secondary particles of alloy wires subjected to different intermediate annealing cooling methods. After intermediate annealing followed by water cooling, a large number of uniformly distributed white dot-like particles were observed within the grains. Energy-dispersive X-ray spectroscopy (EDS) analysis revealed that these white precipitates were rich in Al, Zn, Mg, and Cu. Fine rod-like precipitates were rarely observed. With the air-cooling method, the number of uniformly distributed white dot-like particles increased further. Extremely fine white precipitates were observed to distribute discontinuously along the grain boundaries. According to the results of EDS analysis, the intragranular and grain boundary white precipitates exhibited similar compositional ratios. This similarity indicated that both types of precipitates were Al–Zn–Mg–Cu phases. Statistical analysis showed that the number density and area fraction reached approximately 70,000 mm−2 and 1.5%, respectively. In contrast, the morphology and distribution of precipitates in the furnace-cooling alloy wire samples were markedly different from those in the water-cooling and air-cooling samples. A large number of precipitates were uniformly formed within the matrix, with a larger size of white dot-like precipitates. Under a similar number density, the area fraction reached approximately 8%. In addition, numerous fine rod-like white precipitates were densely distributed both within the grains and along the grain boundaries. The number density and area fraction of these fine rod-like precipitates were significantly higher than those in the alloy wire samples cooled by water and air after intermediate annealing, as shown in Figure 3.
Figure 2.
Secondary particles of alloy wires with different intermediate annealing cooling methods: (a) water cooling; (b) air cooling; (c) furnace cooling.
Figure 3.
Secondary particles statistics of alloy wires with different intermediate annealing cooling methods: (a) dot-like particles; (b) fine rod-like precipitates.
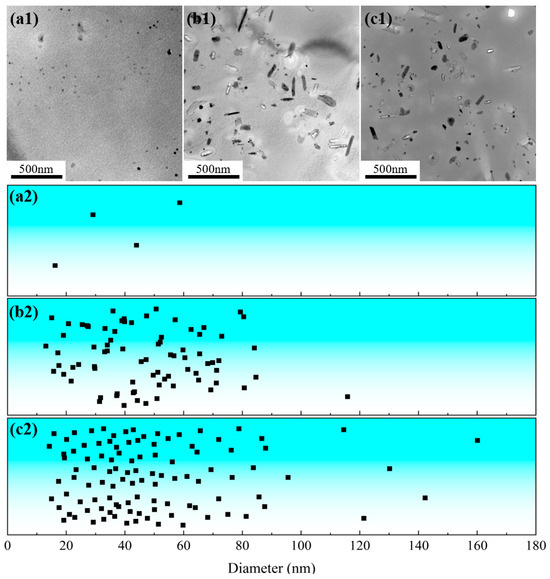
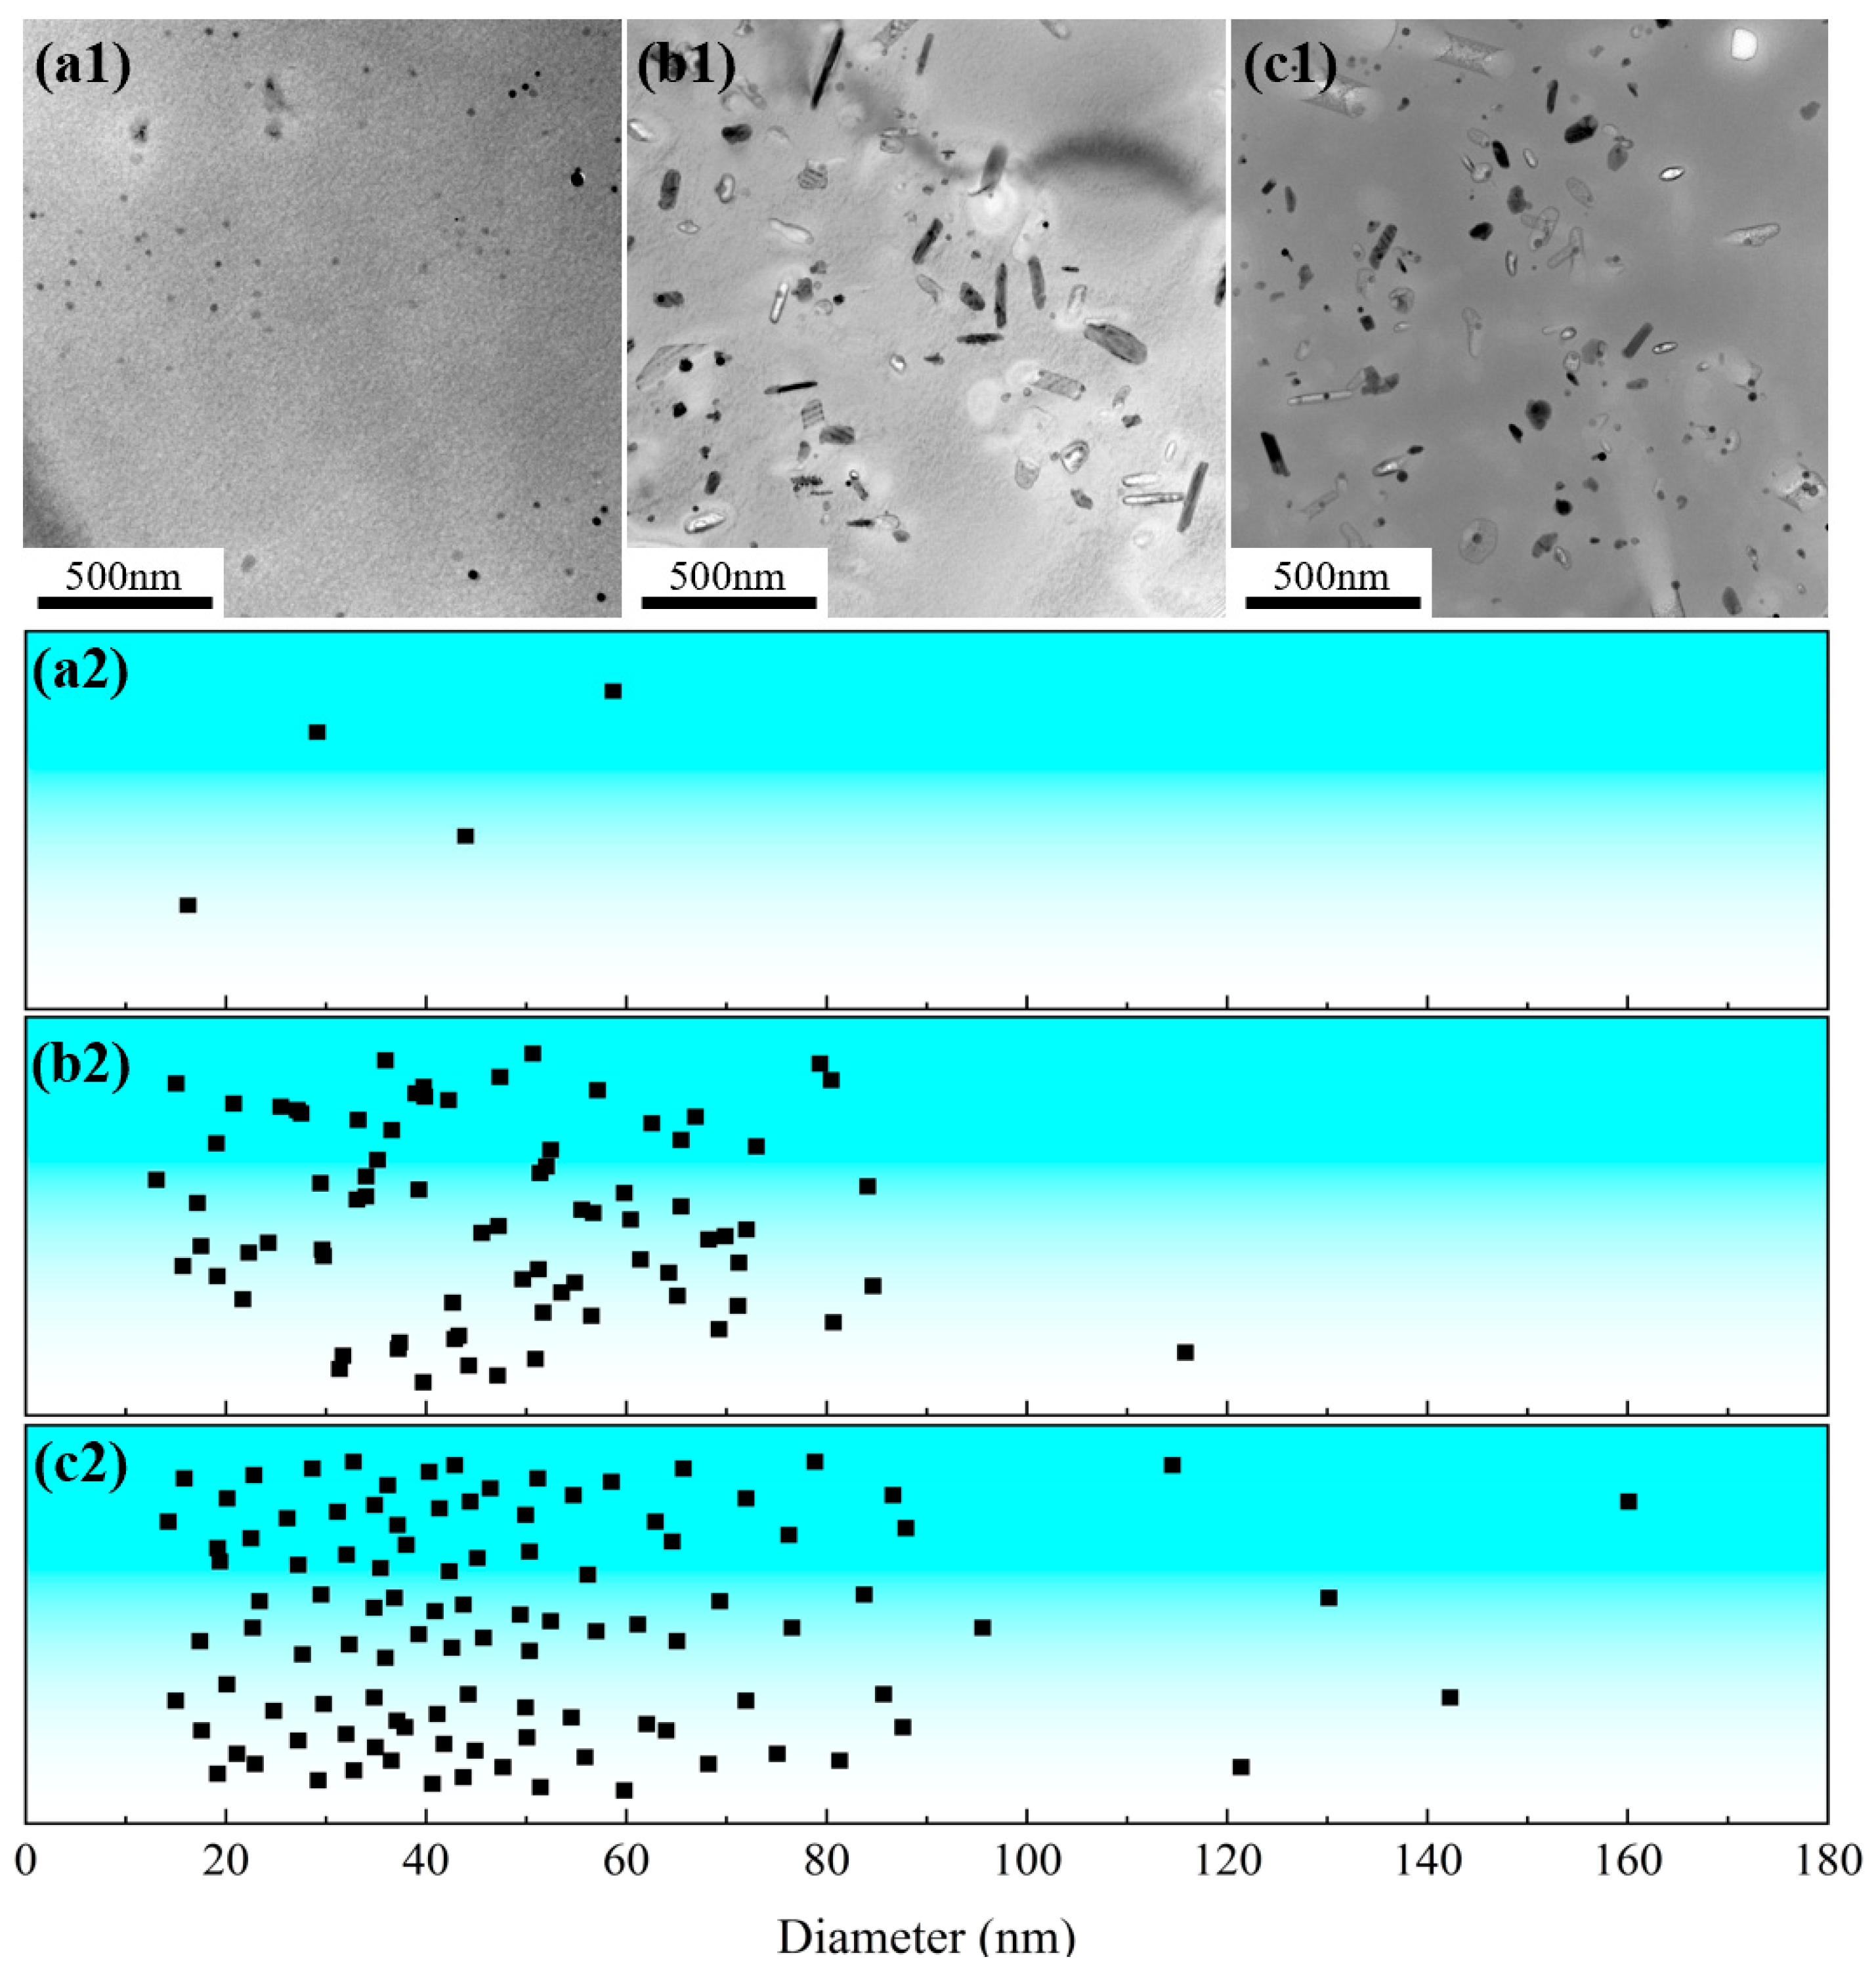
Figure 4 shows the TEM morphology of the wire samples with a diameter of 5.0 mm subjected to annealing treatment followed by different cooling methods. In the bright-field images along the [110]Al zone axis, it can be observed that the intragranular precipitates in the samples with annealing treatment followed by different cooling methods all exhibited submicron scale. With the water-cooling method, the precipitates were mainly spherical with a mean diameter smaller than 70 nm. In contrast, under air-cooling and furnace-cooling methods, the precipitates exhibited both spherical and short rod-like morphologies. The mean diameter of spherical precipitates remained smaller than 50 nm, whereas the short rod-like precipitates had sizes ranging from 50 to 100 nm. Based on the above SEM observations (Figure 2), it can be inferred that the larger micrometer-scale dark coarse precipitates corresponded to the Al–Zn–Mg–Cu phase.
Figure 4.
TEM micrographs of precipitates and corresponding size distribution scatter plot of alloy wires with different intermediate annealing cooling methods: (a1,a2) water cooling; (b1,b2) air cooling; (c1,c2) furnace cooling.
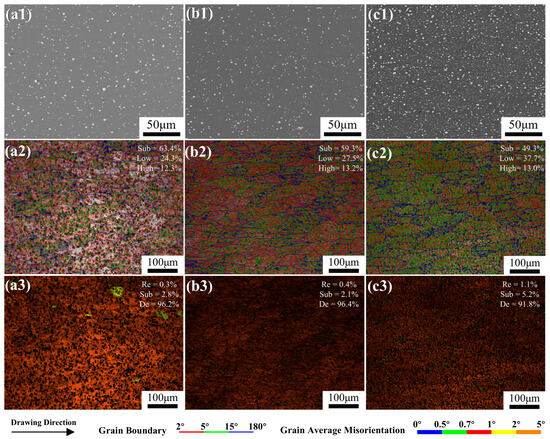
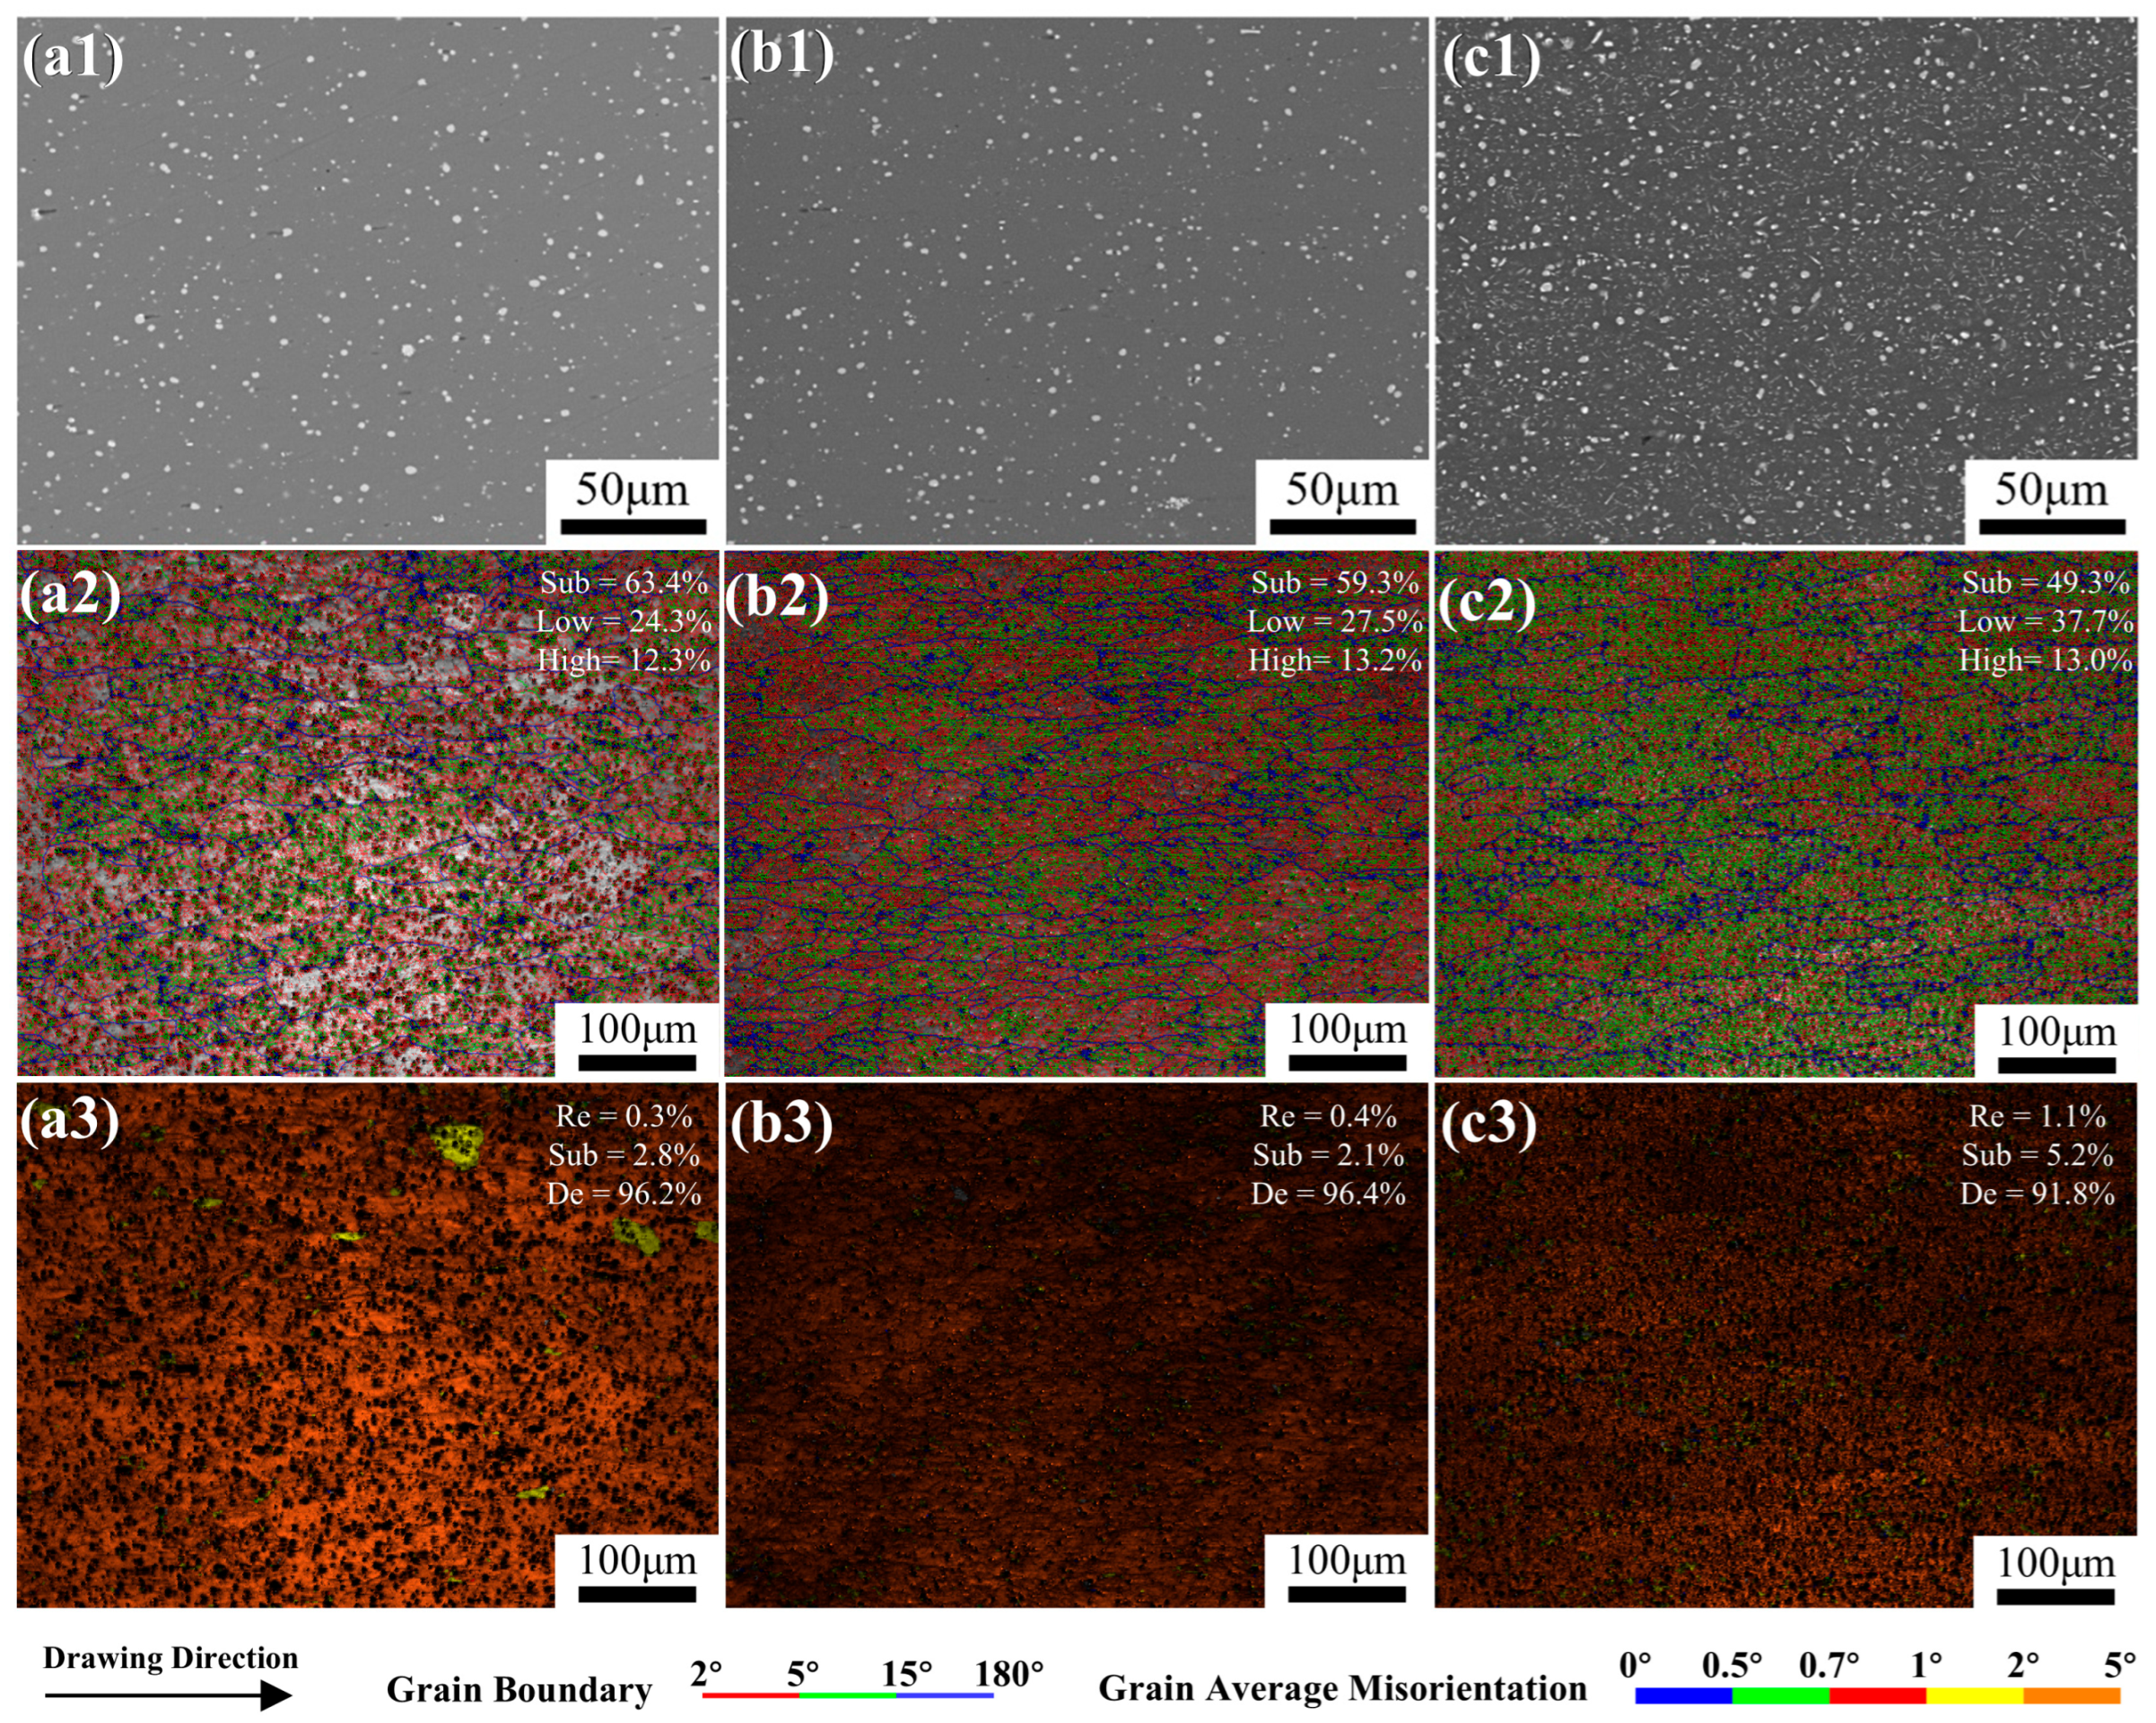
Figure 5 shows the secondary particles and grain characteristics of alloy wires cold drawn from 5.0 mm to 3.5 mm after different intermediate annealing cooling methods. After cold drawing from 5.0 mm to 3.5 mm, the alloy wire exhibited a refined structure. The morphology of secondary particles within the grains showed no significant differences among the samples. Similarly, the precipitates along the grain boundaries remained comparable. These observations were consistent across samples subjected to different intermediate annealing cooling methods. Regarding the grain characteristics, most grains were elongated along the drawing direction, and a large number of substructures were present within the elongated deformed grains. Notably, as shown in the grain boundary reconstruction maps (a2), (b2), and (c2) in Figure 5, 2–15° are defined as low-angle grain boundaries, while angles above 15° represent high-angle grain boundaries [24]. It can be seen that as the cooling method changes from water cooling to furnace cooling, a larger fraction of deformed grains undergo recrystallization and transform into fine and uniformly distributed equiaxed grains. The fraction of grain boundaries smaller than 5° decreases from 0.634 for the water-cooled sample to 0.493 for the furnace-cooled sample. In addition, the grain average misorientation (GAM) maps in (a3), (b3), and (c3) are labeled with three distinct regions: the range of 0–1° corresponds to recrystallized regions (Re), 1–2° corresponds to sub-structured regions (Sub), and 2–5° corresponds to deformed regions (De) [25]. It can be observed that the fraction of deformed regions accounts for 91.8% in the furnace-cooled sample, 96.2% in the air-cooled sample, and 96.4% in the water-cooled sample, which clearly demonstrates the differences in recrystallization behavior under different cooling conditions.
Figure 5.
Secondary particles and grain characteristics of alloy wires cold drawn from 5.0 mm to 3.5 mm with different intermediate annealing cooling methods: (a1–a3) water cooling; (b1–b3) air cooling; (c1–c3) furnace cooling.
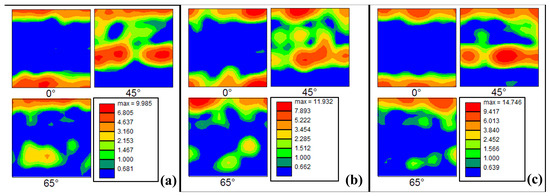
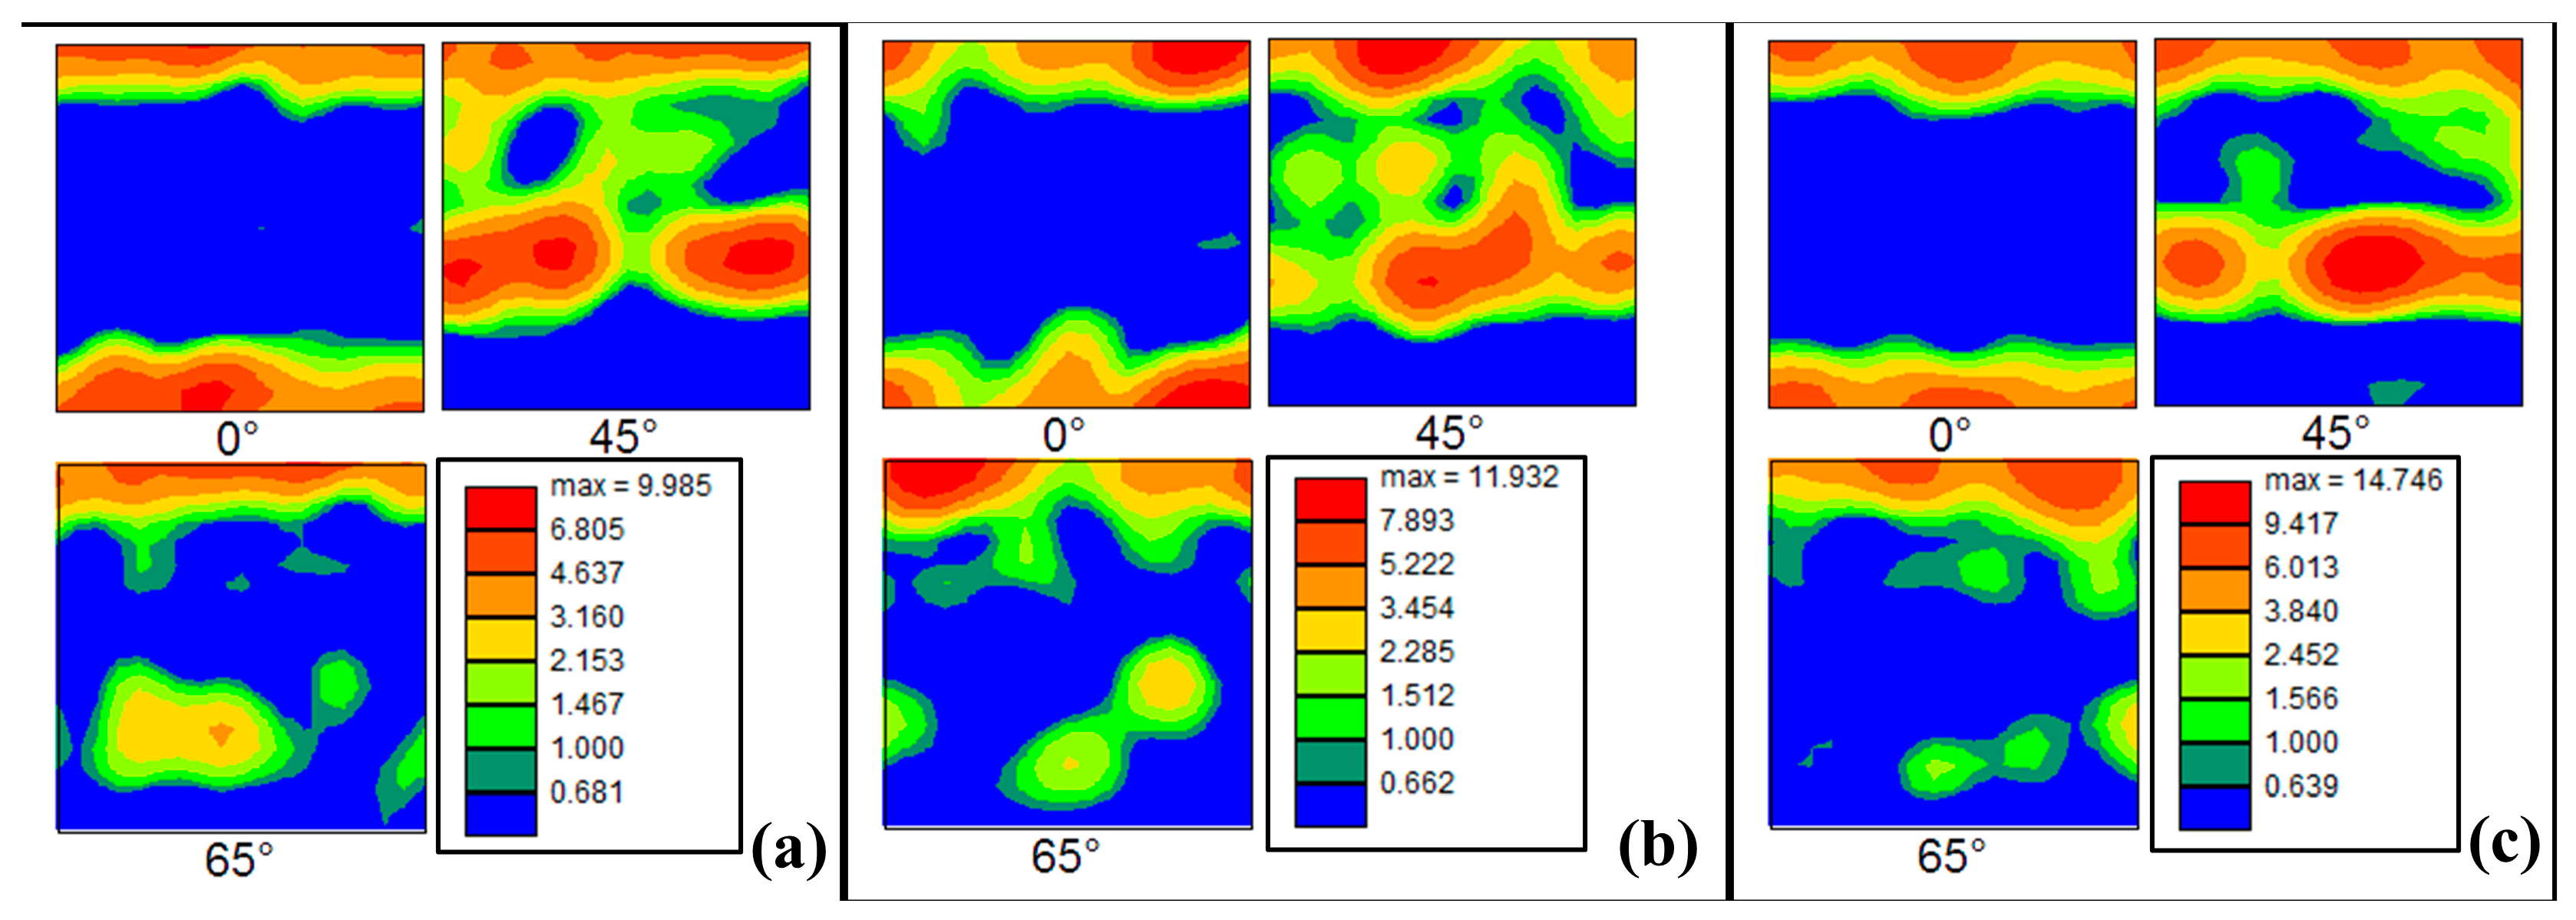
Figure 6 shows the textures of alloy wires cold drawn from 5.0 mm to 3.5 mm with different intermediate annealing cooling methods. The cold-drawn alloy wires all exhibited evident shear deformation and recrystallization texture characteristics, while plane strain texture components were almost absent. Among the texture components, the F component (111)[11-2] was dominant, with volume fractions of 0.147, 0.136, and 0.130 for the water-cooling, air-cooling, and furnace-cooling samples, respectively. It indicated that the cold drawing process induced a pronounced ⟨111⟩ related orientation in the samples. In addition to F component, the Cube component (001)[100] also showed a relatively high fraction, with the highest value in the air-cooling sample (0.112), followed by the furnace-cooling (0.087) and water-cooling samples (0.075). This suggested that the air-cooling sample retained more recrystallization-related orientations. In contrast, the water-cooling sample tended to preserve more deformation texture characteristics. Meanwhile, the D component (113)[33-2] showed the highest fraction in the water-cooling sample, further indicating a more pronounced deformation orientation concentration after cold drawing. In contrast, the Copper, S, and R components in the furnace-cooling sample were higher than those in the other two samples, suggesting a more complex mixed texture composition.
Figure 6.
Textures of alloy wires cold drawn from 5.0 mm to 3.5 mm with different intermediate annealing cooling methods: (a) water cooling; (b) air cooling; (c) furnace cooling.
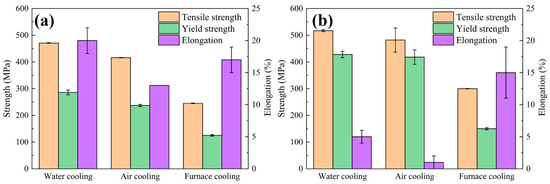
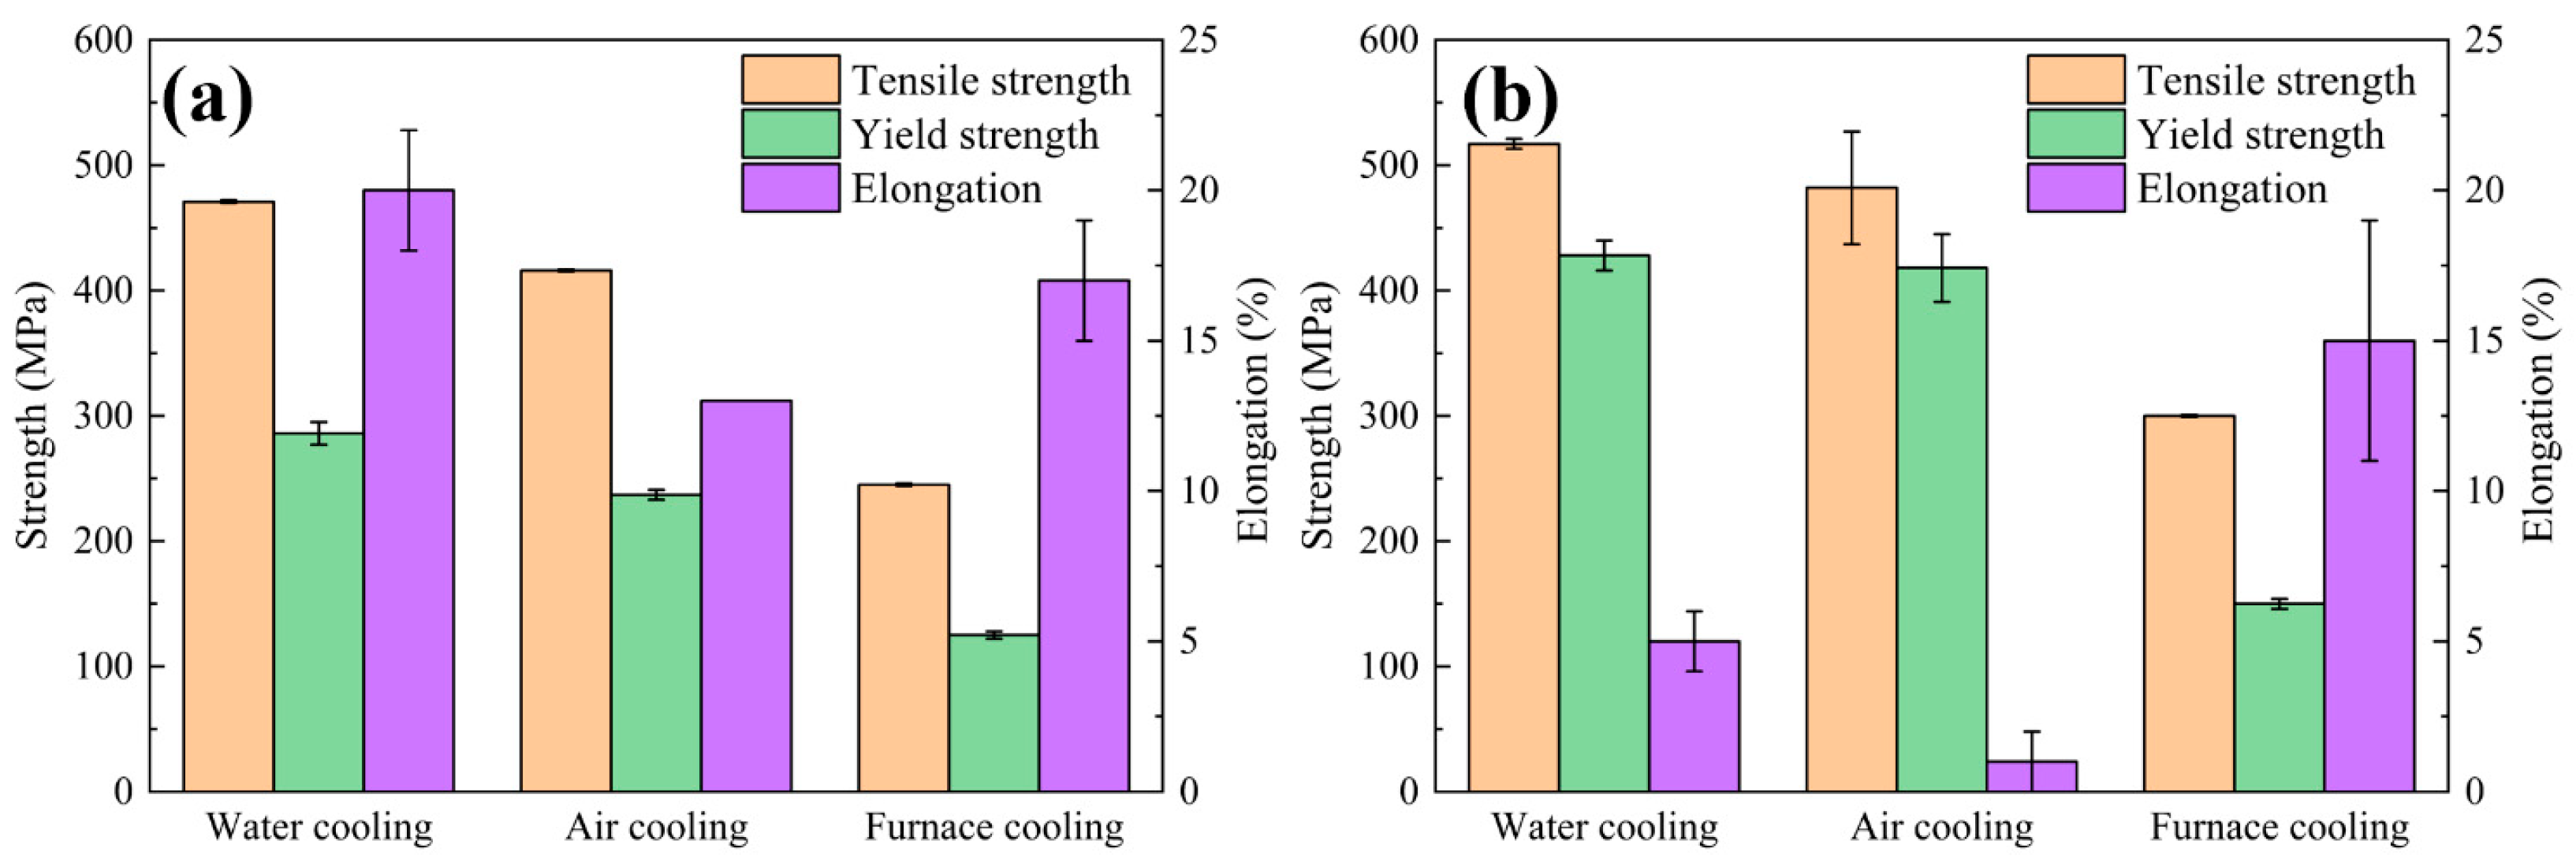
The mechanical properties of the wire samples before and after being cold drawn from 5.0 mm to 3.5 mm with different intermediate annealing cooling methods are shown in Figure 7. The alloy wires with an initial diameter of 5.0 mm exhibited significant differences in tensile properties after intermediate annealing with different cooling methods. The water-cooling samples showed the highest strength, followed by air cooling, while furnace cooling resulted in the lowest strength; the corresponding tensile strengths were approximately 470 MPa, 415 MPa, and 245 MPa, respectively. After the subsequent final cold drawing process, the wire diameter was reduced from 5.0 mm to 3.5 mm. The cold deformation led to a noticeable increase in strength, with an increment of about 45~65 MPa, accompanied by a marked decrease in elongation.
Figure 7.
Mechanical properties of the wire samples before and after cold drawn from 5.0 mm to 3.5 mm with different intermediate annealing cooling methods: (a) before cold drawing; (b) after cold drawing.
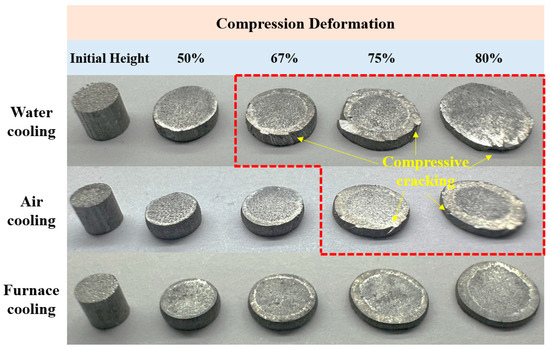
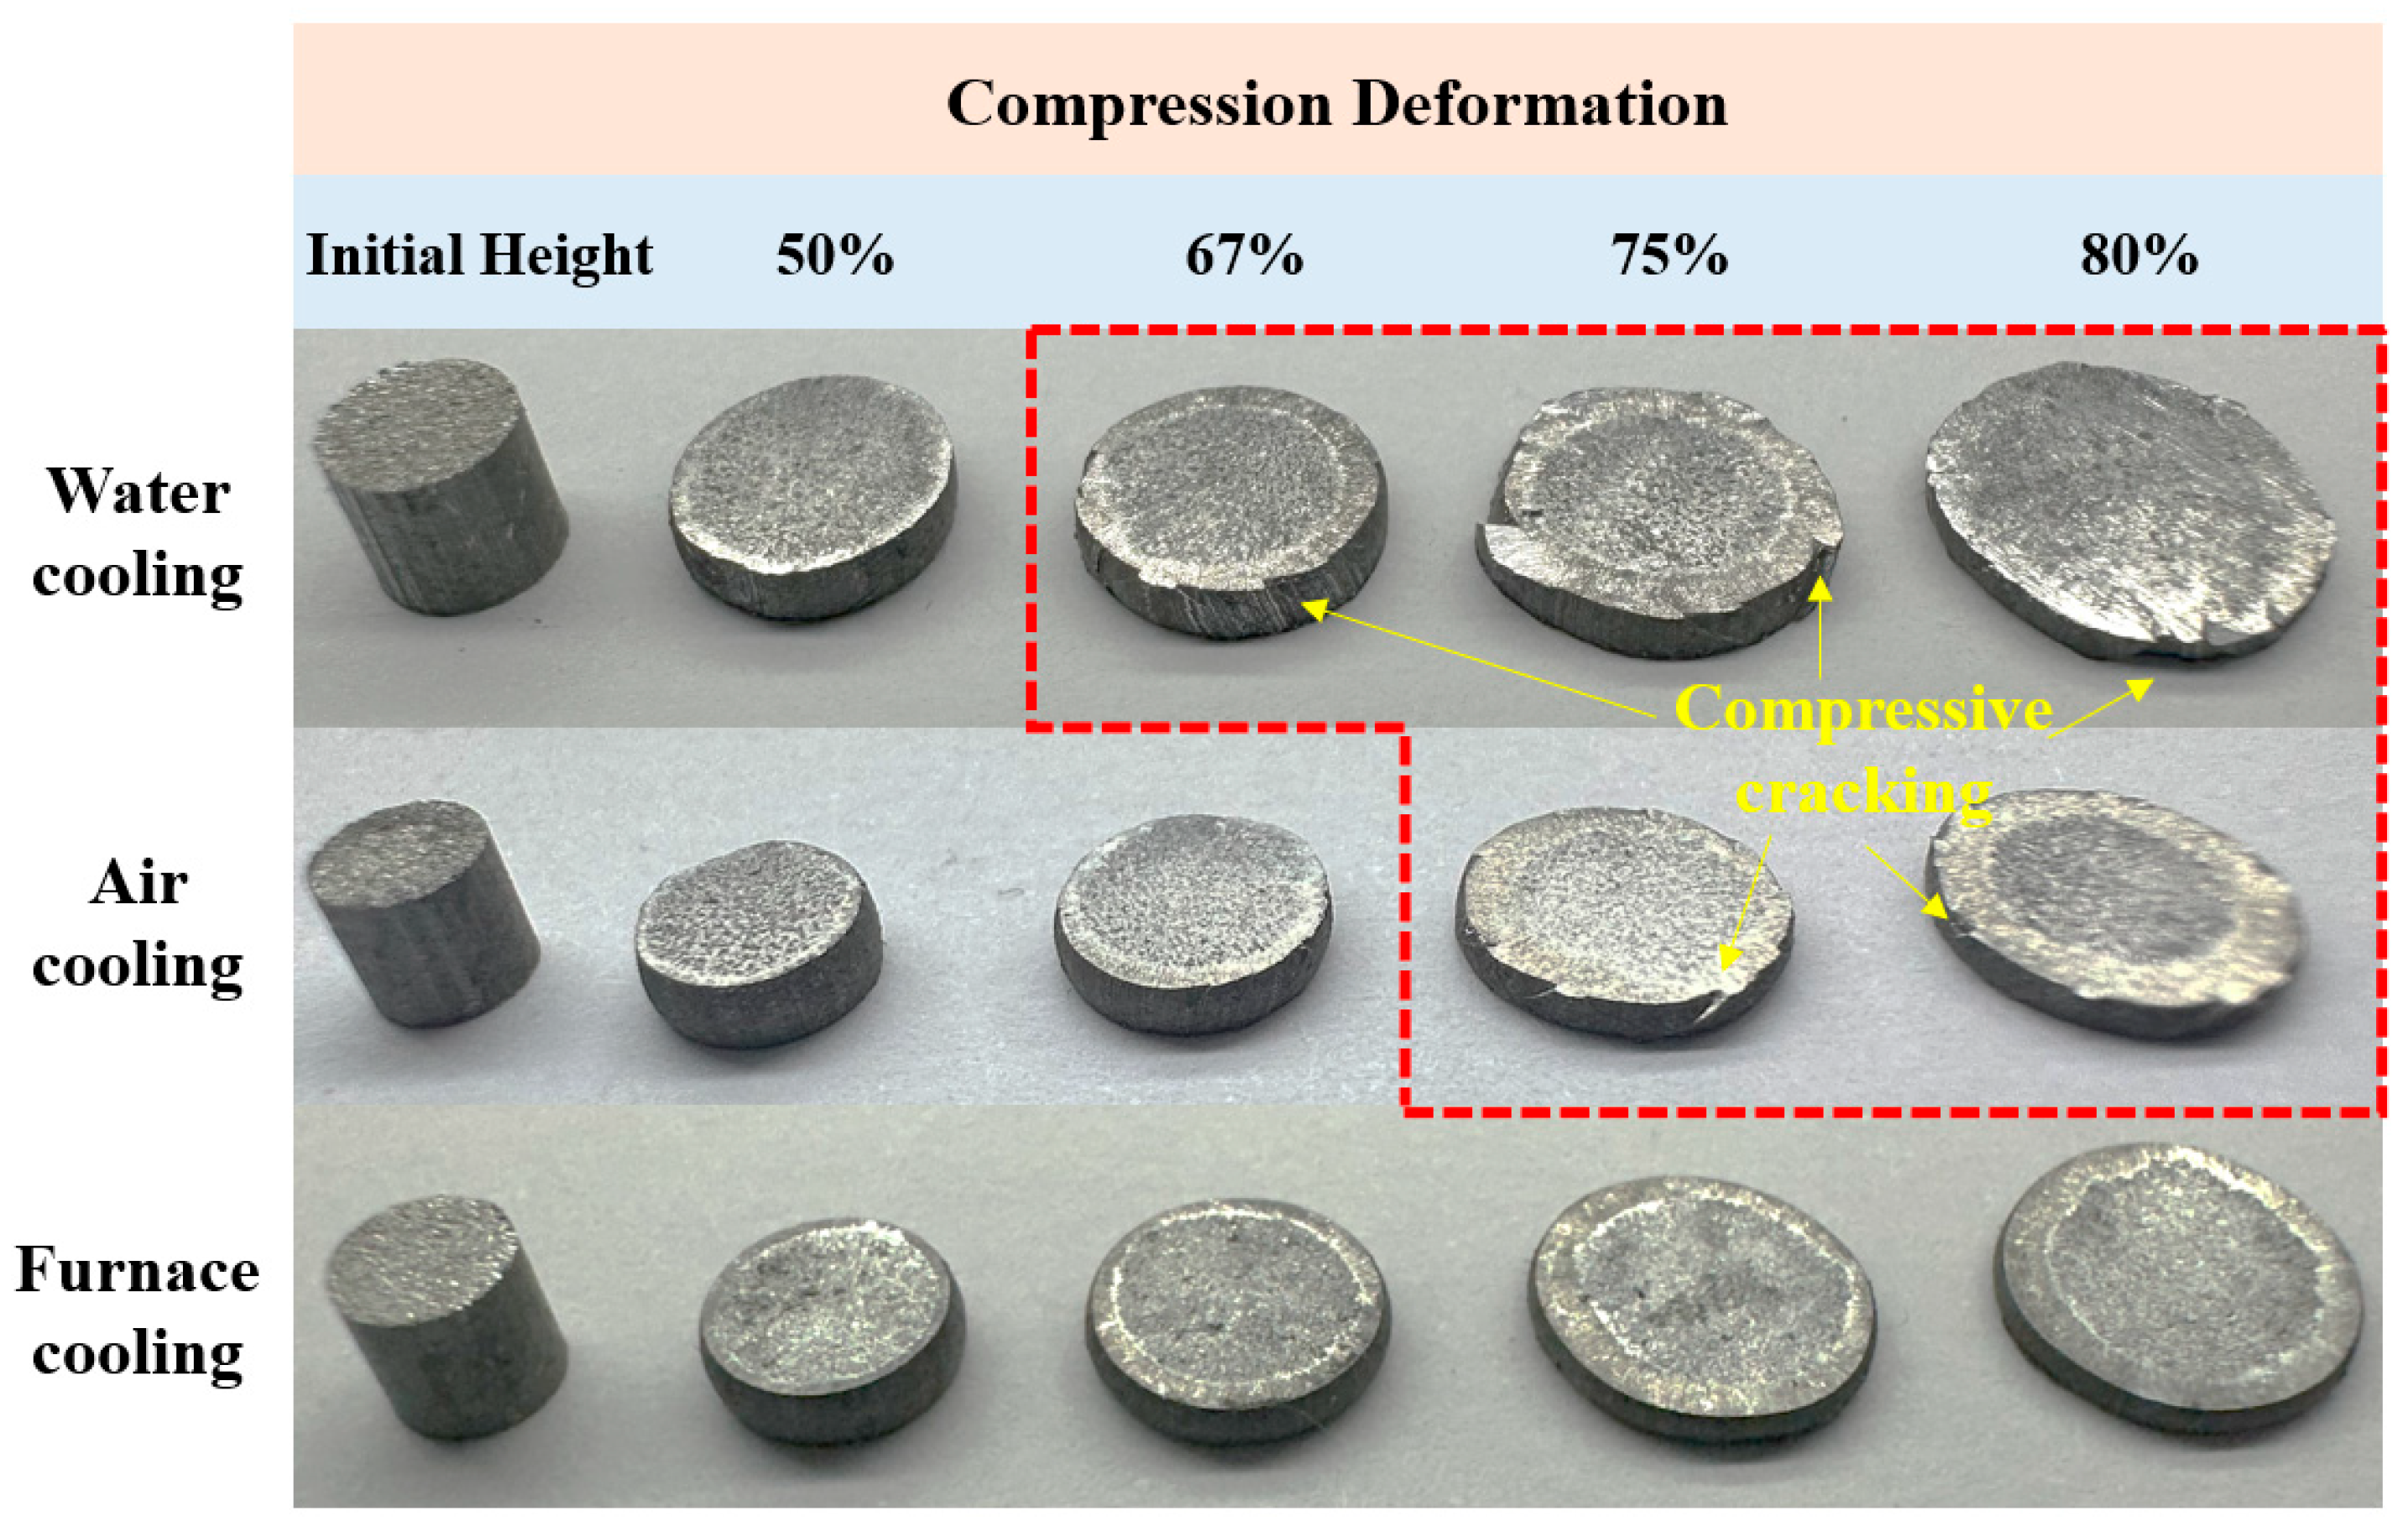
When the alloy wire was cold drawn from 5.0 mm to 3.5 mm (H13 temper), cold heading was subsequently performed to fabricate fasteners with the required geometric features. In this study, a uniaxial compression test was employed to simulate the cold heading process. The alloy wires had a diameter of 3.5 mm. They were previously subjected to different intermediate annealing cooling methods. These wires were then machined into cylindrical specimens. Each specimen had an initial height of 3.5 mm. The samples were compressed to different deformation levels (50%, 67%, 75%, and 80%). The corresponding cracking behavior is shown in Figure 8. For the water-cooling samples, the cracks initiated at a compressive deformation of approximately 67%, and the crack size gradually increased with further deformation. In contrast, the air-cooling samples exhibited crack initiation only when the compressive deformation reached about 75%. Notably, no visible cracking was observed in the furnace-cooling samples, even at a deformation level of 80%, demonstrating superior cold heading performance.
Figure 8.
Cracking behavior of H13 temper alloy wire samples subjected to cold heading treatment with 50%, 67%, 75% and 80% compression deformation.
3.2. Microstructure and Mechanical Properties Evolution After Heat Treatment
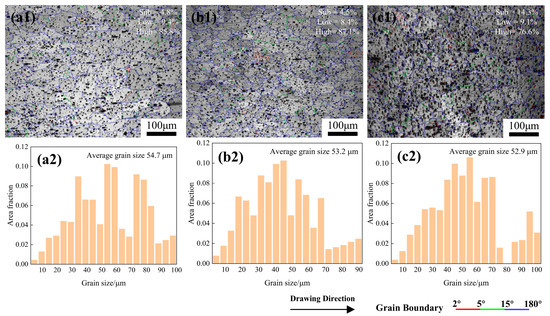
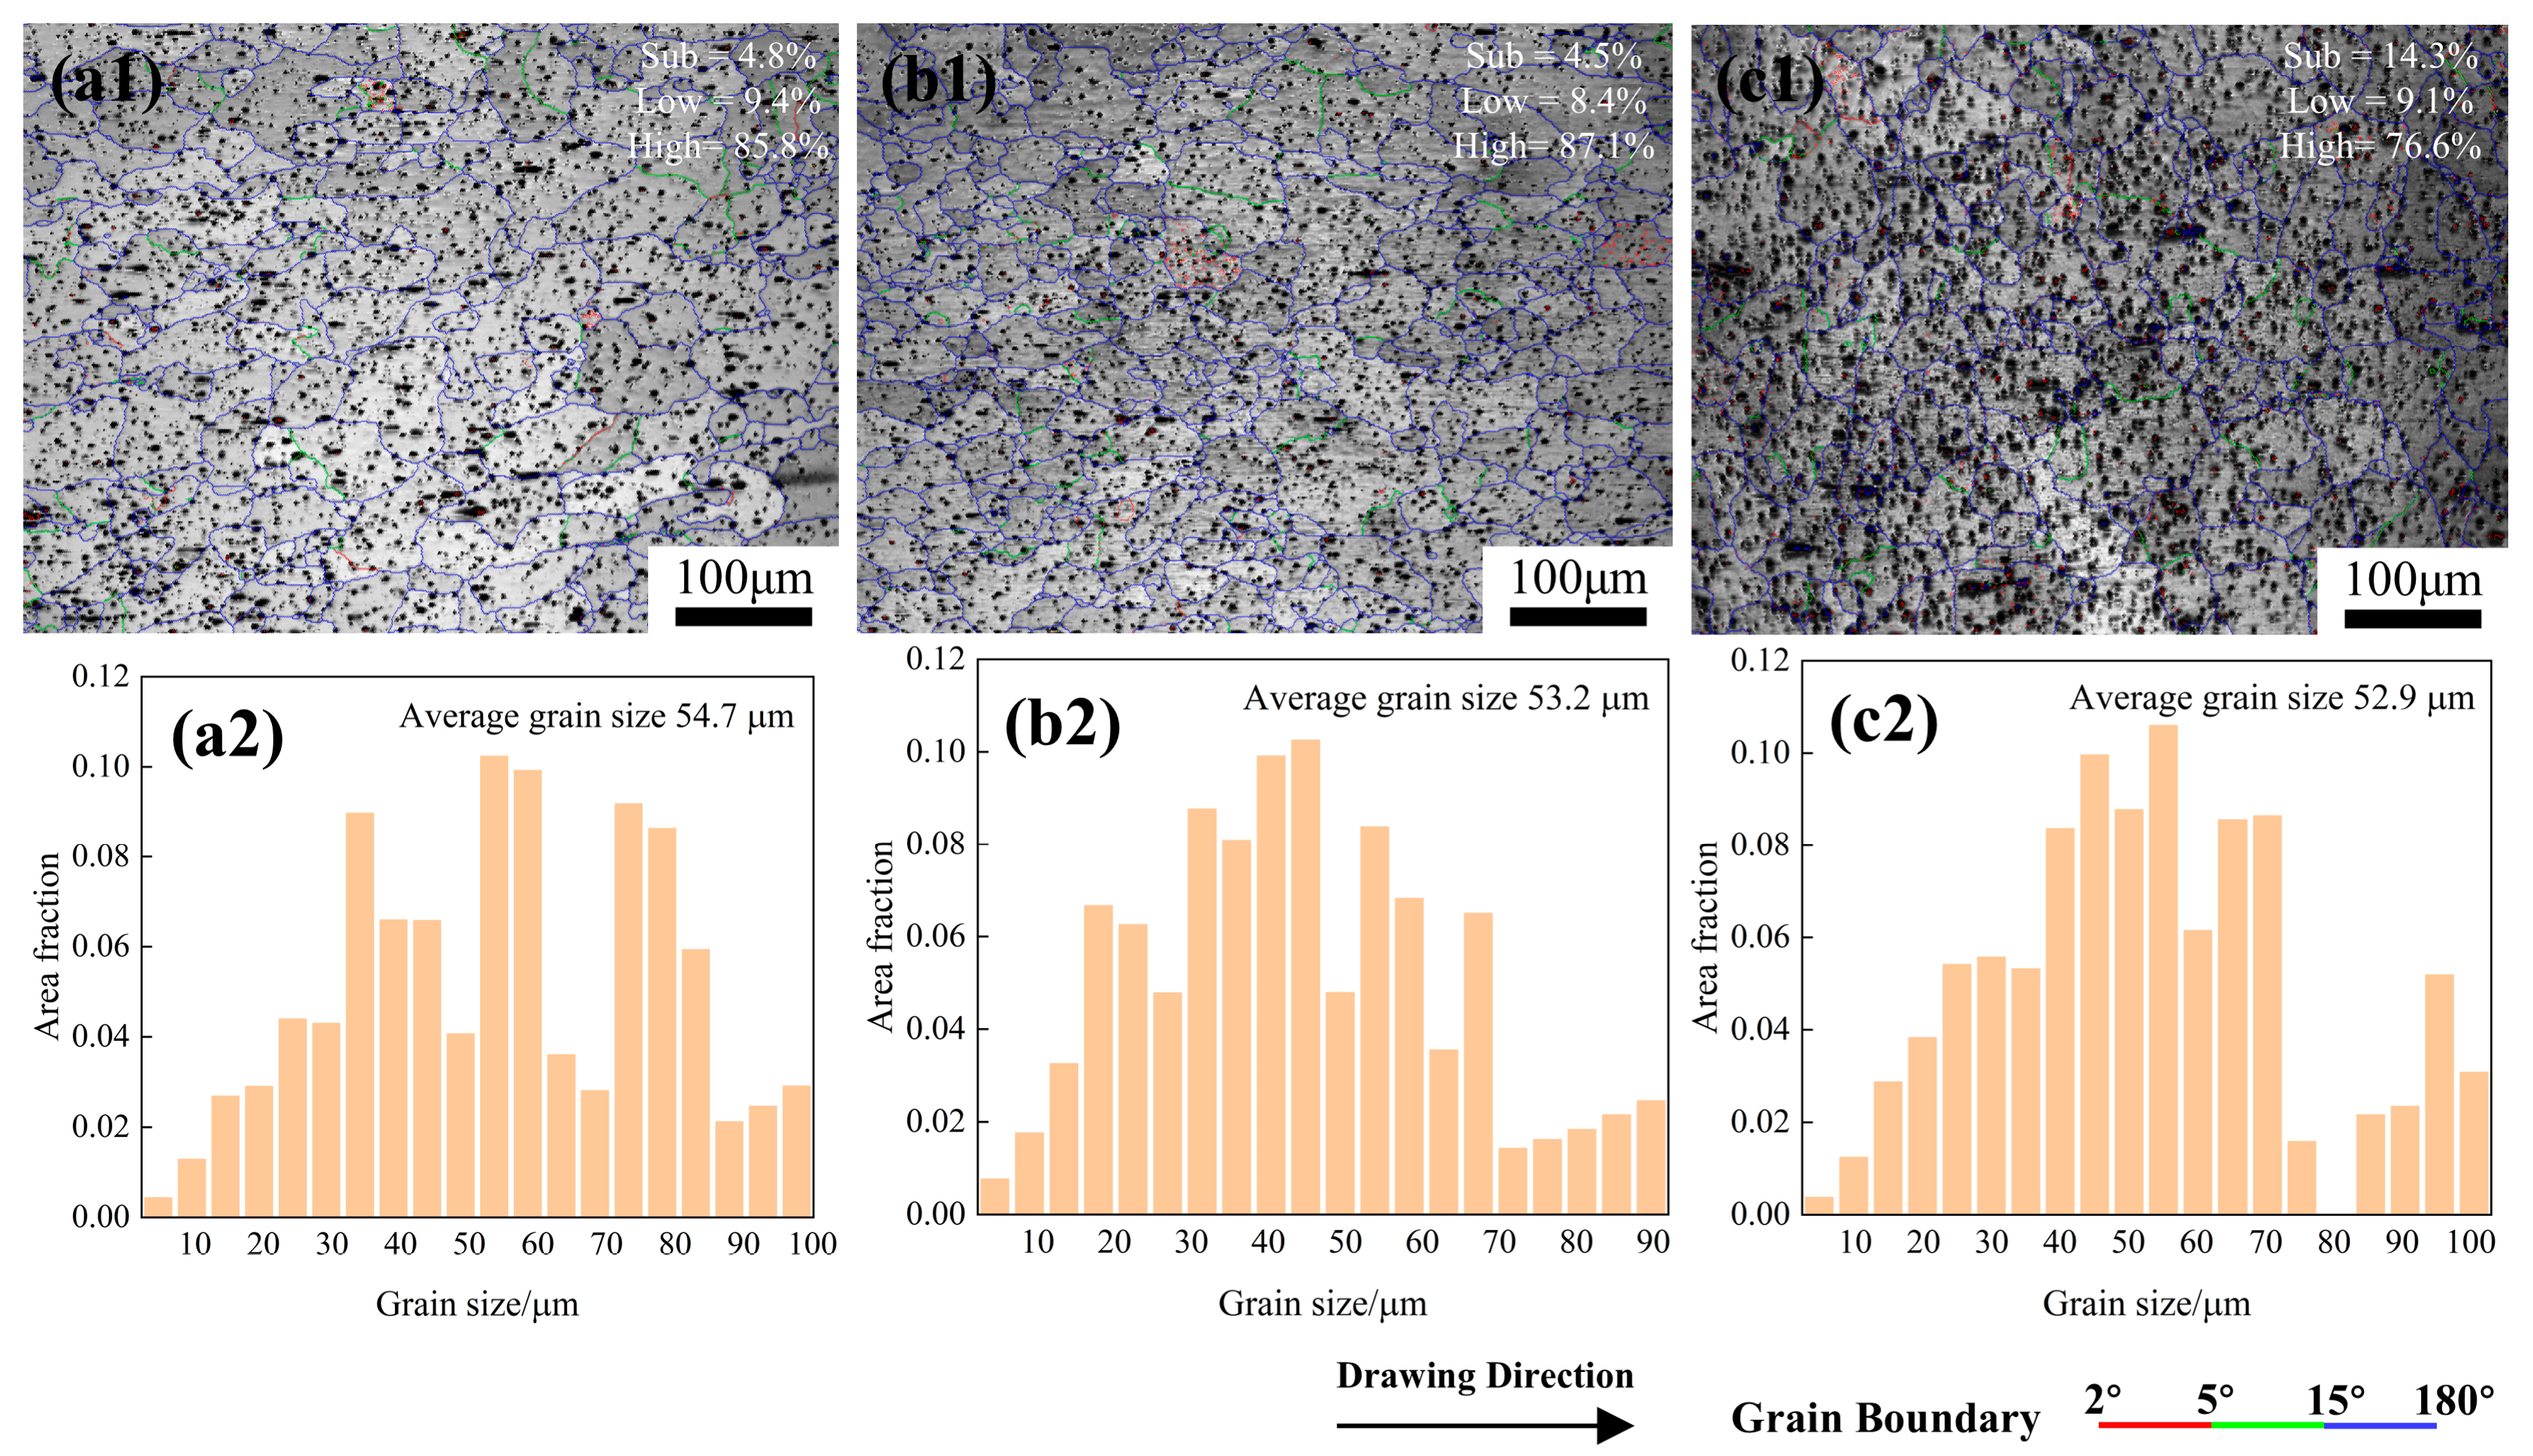
Figure 9 illustrates the recrystallized grain characteristics of wire samples processed under different cooling regimes after final cold drawing to 3.5 mm in diameter and subsequent solution heat treatment. It is evident that the deformed microstructure introduced by cold drawing underwent full recrystallization during solution treatment, resulting in a microstructure dominated by high-angle grain boundaries. The fractions of high-angle grain boundaries are measured to be 0.858, 0.871, and 0.766 for the water-cooled, air-cooled, and furnace-cooled samples, respectively. Following solution heat treatment, all samples, regardless of cooling mode, exhibited coarse equiaxed grains with an average grain size in the range of 50 to 55 μm.
Figure 9.
Recrystallized grain characteristics of the wire samples with different cooling methods subjected to a final cold drawing process to reduce the diameter to 3.5 mm after solution heat treatment: (a1,a2) water cooling; (b1,b2) air cooling; (c1,c2) furnace cooling.
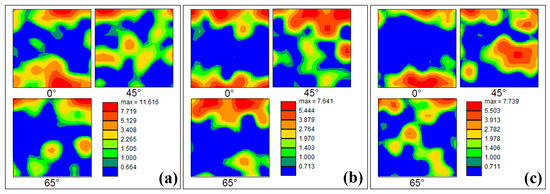
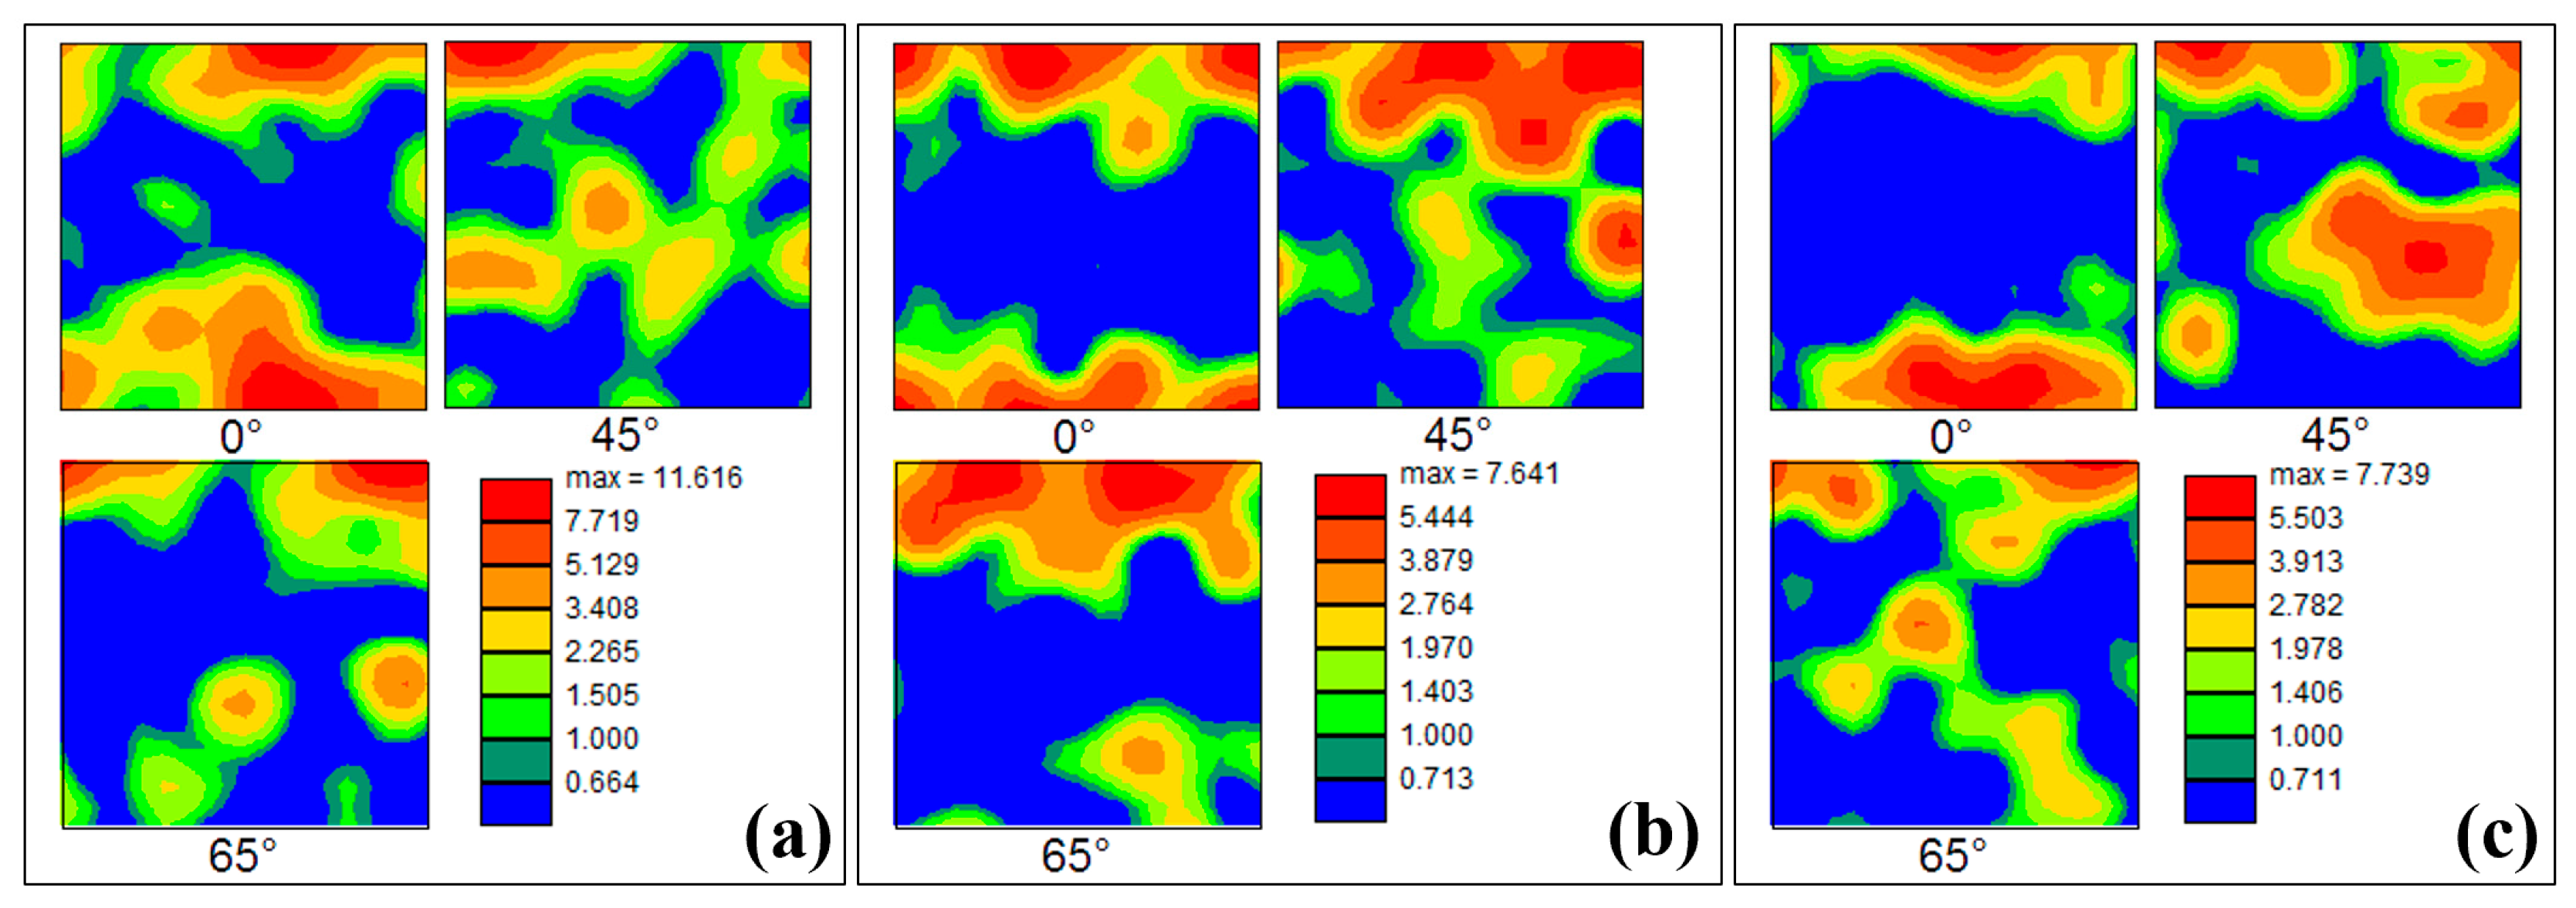
After heat treatment, all samples under different cooling conditions exhibited distinct multi-component mixed textures, although their dominant orientations differed considerably. As shown in Figure 10, in the water-cooling sample, the Cube and R components reached 0.081 and 0.072, respectively. Meanwhile, the Brass and D components increased to 0.044 and 0.048, indicating a more complex texture composition. Additionally, the maximum texture intensity reached 11.616, which was the highest among the three samples, suggesting the strongest local orientation concentration. In the air-cooling sample, the Cube component showed the highest fraction (0.094). Meanwhile, the R and F components reached 0.066 and 0.051, respectively, indicating that the texture was mainly dominated by recrystallization orientations with a certain inheritance of deformation texture. In contrast, the furnace-cooling sample was dominated by the F component, whose fraction reached 0.092, significantly higher than those of the other two samples, whereas the Cube component decreased to 0.060, suggesting that texture evolution under furnace cooling tended to favor the formation of the F-oriented component. Overall, different cooling methods significantly modified the texture composition of the alloy wires after heat treatment, wherein the water-cooling sample exhibited a stronger mixed texture and local orientation concentration, the air-cooling sample favored the retention of the Cube component, and the furnace-cooling sample highlighted the F-oriented texture feature.
Figure 10.
Recrystallized textures of the wire samples with different cooling methods subjected to a final cold drawing process to reduce the diameter to 3.5 mm after solution heat treatment: (a) water cooling; (b) air cooling; (c) furnace cooling.
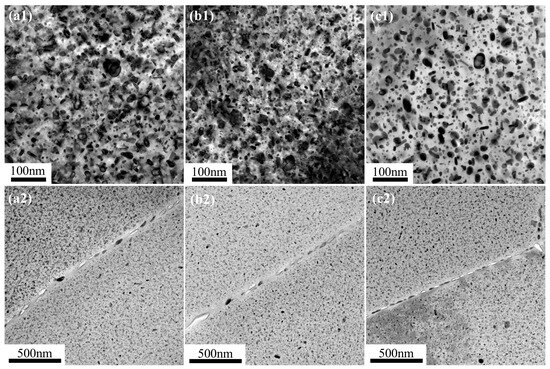
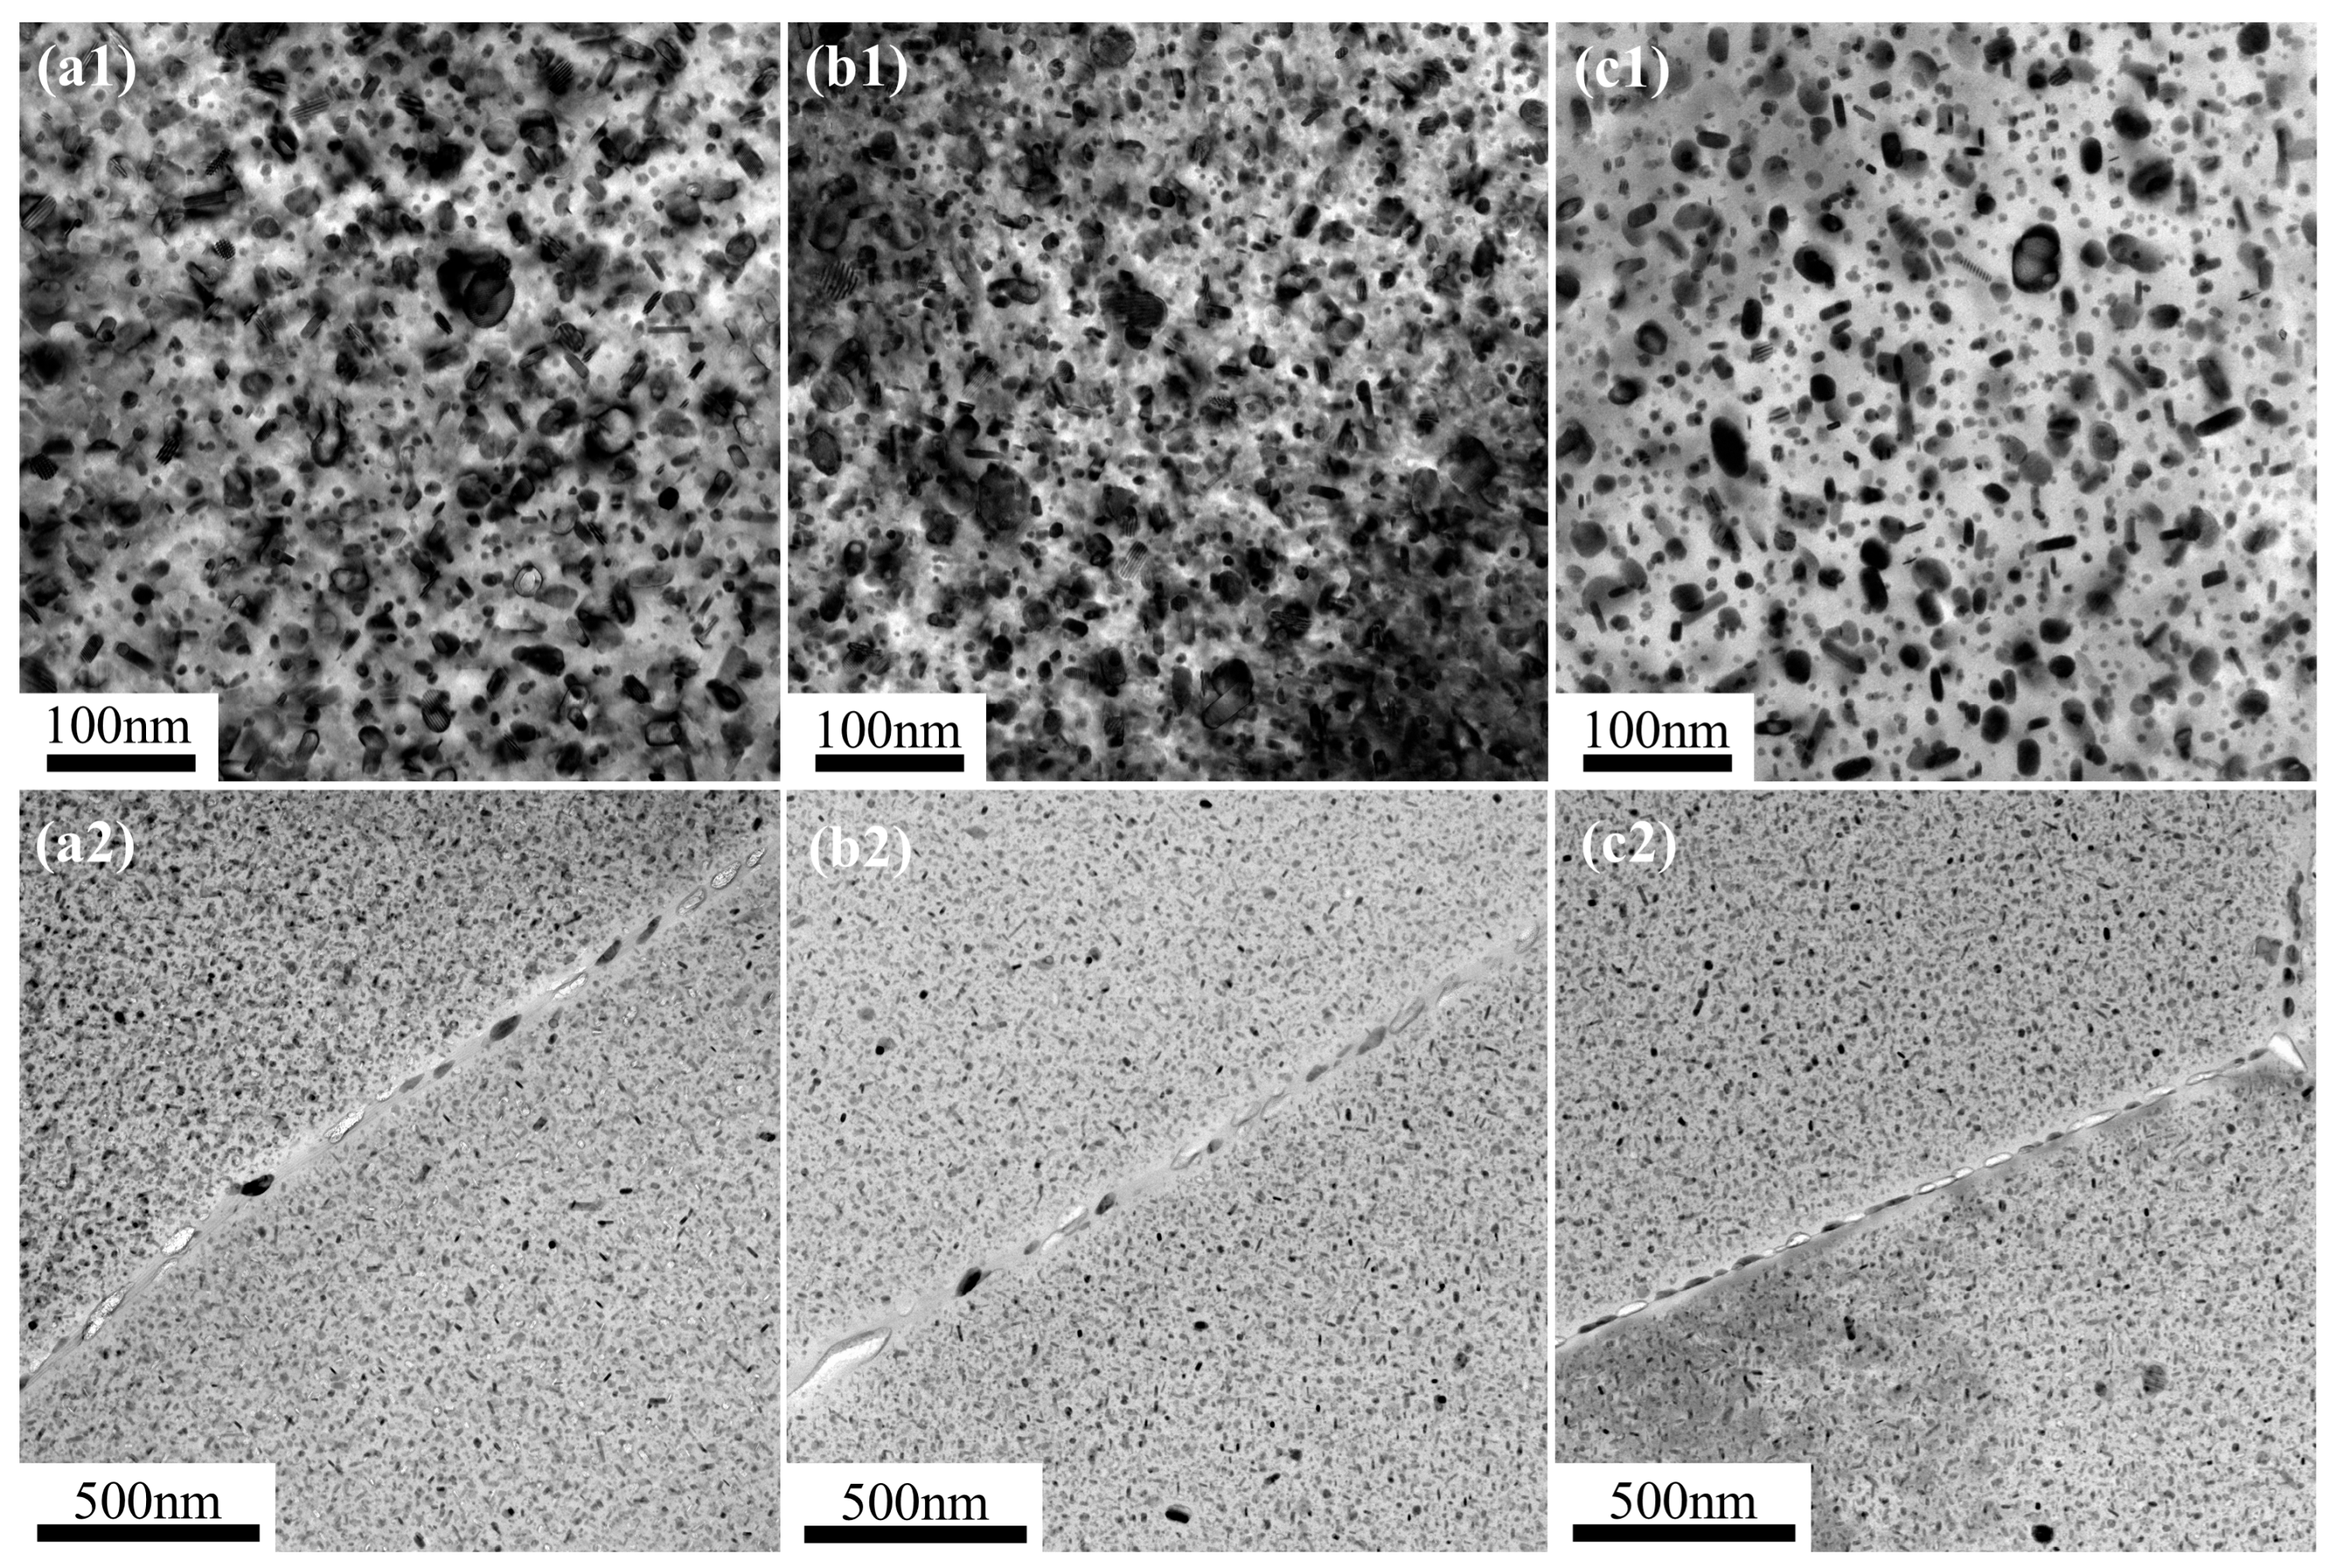
Figure 11 shows TEM images of the wire samples subjected to annealing treatment followed by different cooling methods, then a final cold drawing process to reduce the diameter to 3.5 mm, and finally T73 treatment. It can be observed from Figure 11(a1–c1) that the average size of the artificially aged intragranular precipitates in the samples is relatively large. The dominant precipitates in the microstructure exhibit disk-like and rod-like morphologies, and thus, it can be inferred that these aging precipitates are η′ phases. As observed from Figure 11(a2–c2), under different cooling methods, the grain boundary precipitates are distributed discontinuously. Such a discontinuous distribution of grain boundary precipitates is beneficial to improving the toughness and stress corrosion cracking resistance of the alloy.
Figure 11.
TEM images of the wire samples subjected to annealing treatment followed by different cooling methods, then a final cold drawing process to reduce the diameter to 3.5 mm, and finally T73 treatment: (a) water cooling; (b) air cooling; (c) furnace cooling. (a1–c1) show the micrographs of intragranular precipitates in the matrix, while (a2–c2) show the micrographs of precipitates at and near grain boundaries.
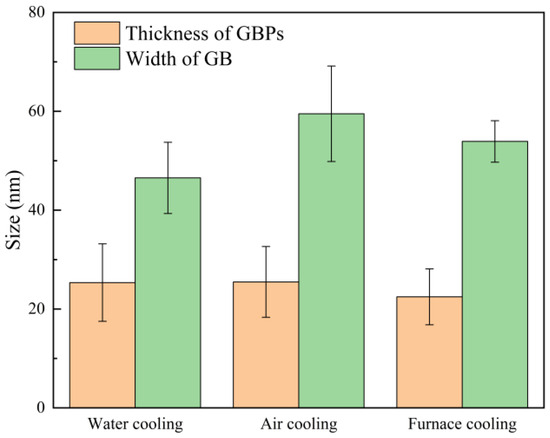
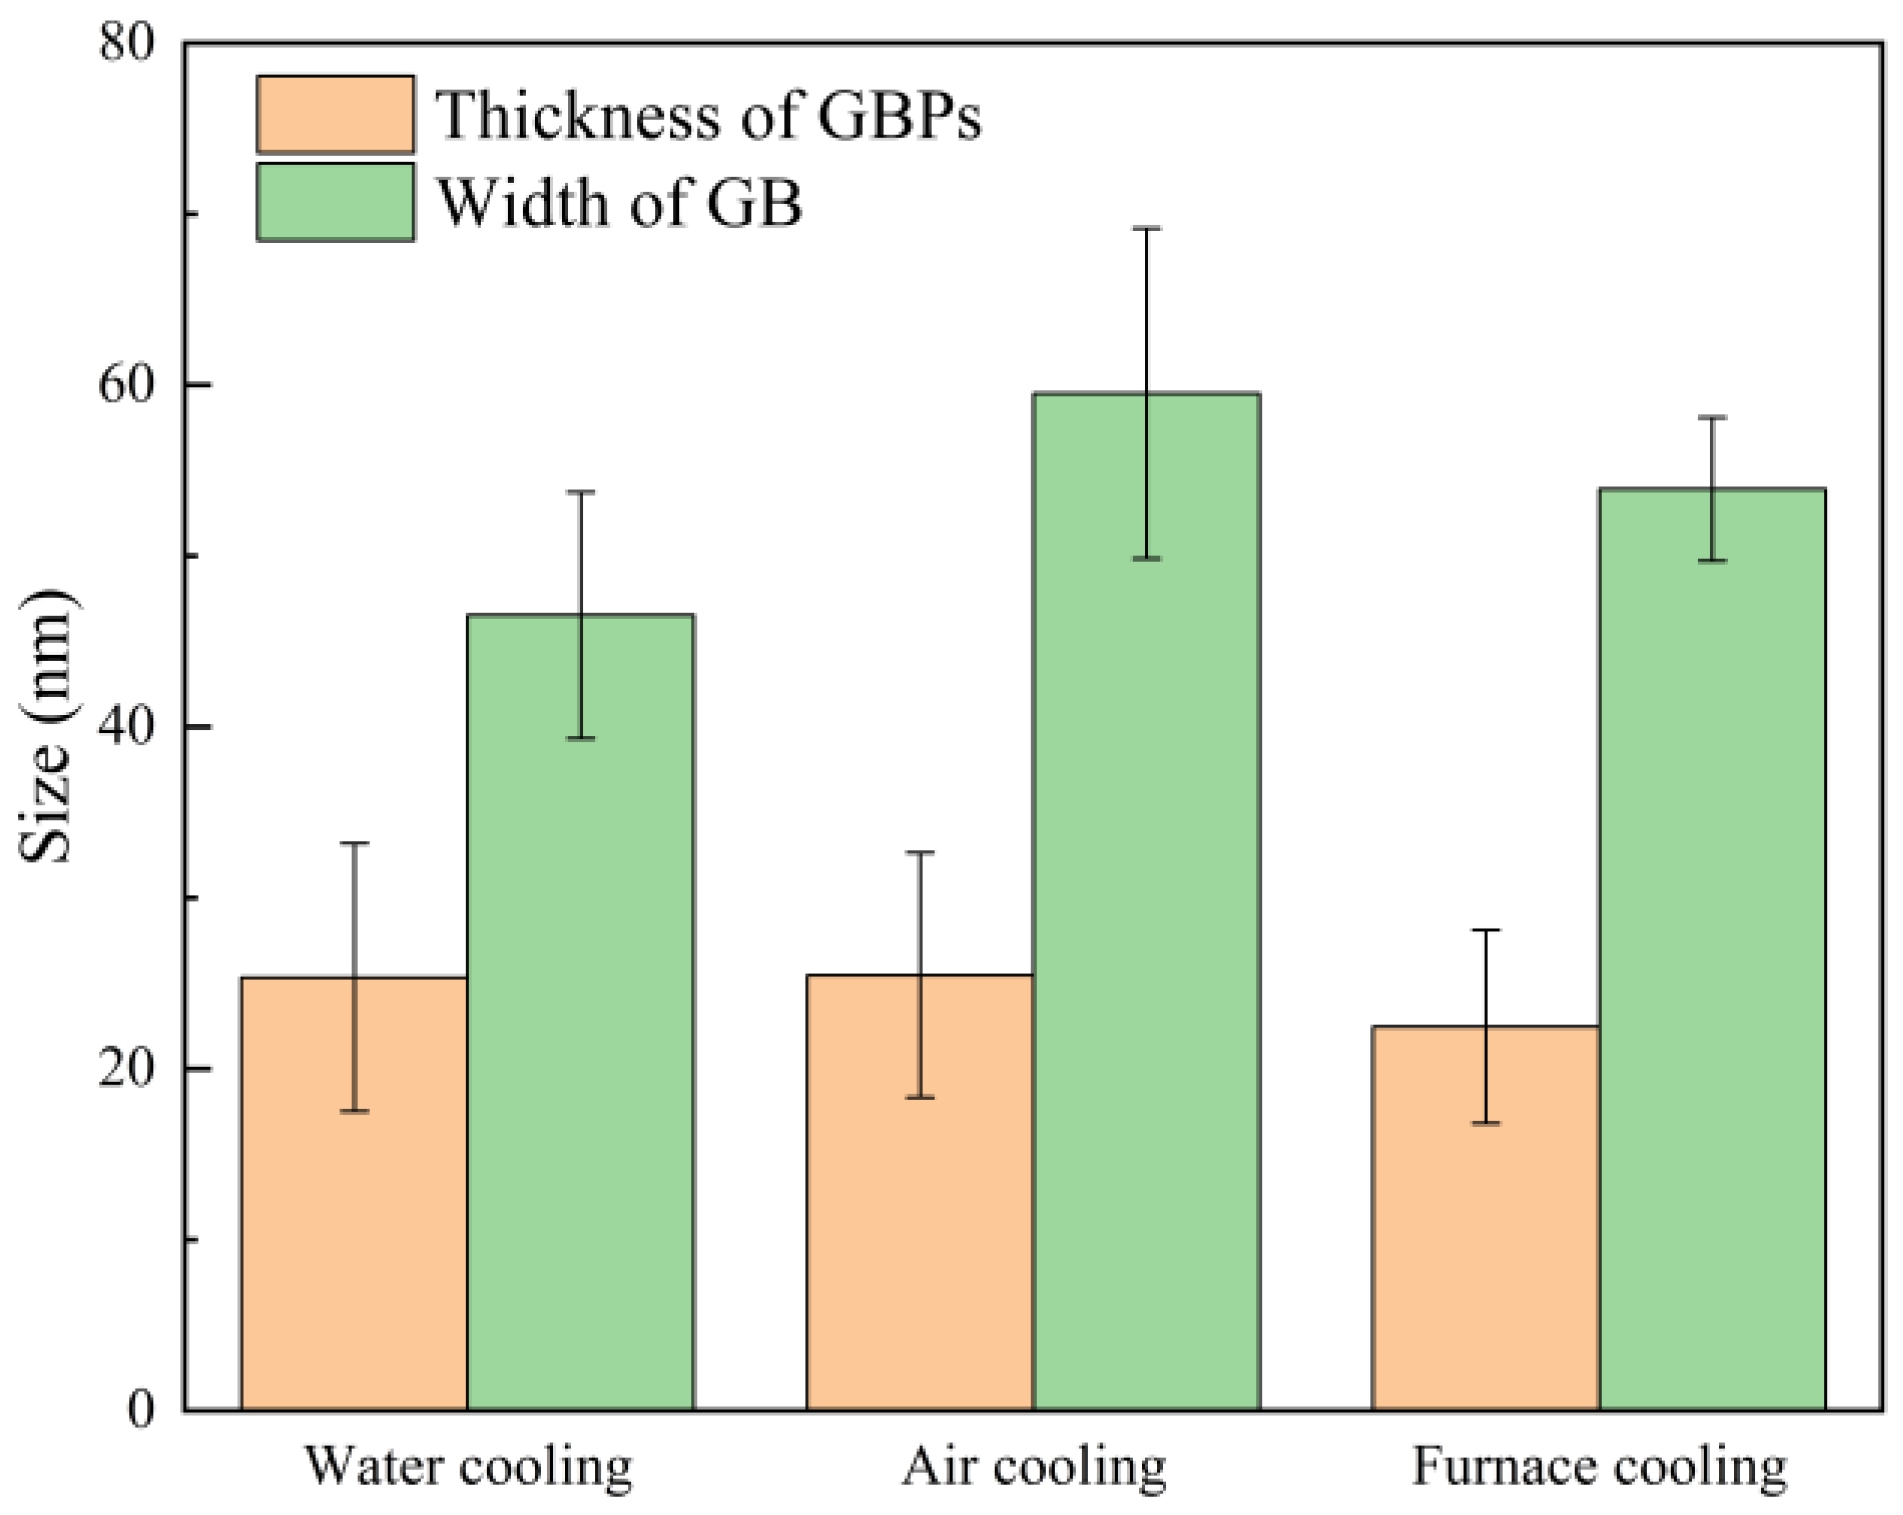
Statistical analysis was conducted on the size distribution of grain boundary precipitates and the grain boundary width in the wire samples. The samples experienced annealing followed by different cooling methods, a final cold drawing step to reduce the diameter to 3.5 mm, and subsequent T73 heat treatment, as shown in Figure 12. The size distribution of grain boundary precipitates in the alloy wire samples was mainly concentrated in the range of 20~30 nm, while the grain boundary width was approximately 40~60 nm. Overall, the alloy wire samples subjected to different intermediate annealing cooling methods exhibited no significant differences in the size of grain boundary precipitates and grain boundary width.
Figure 12.
Size distribution of grain boundary precipitates and grain boundary width of the wire samples with annealing treatment followed by different cooling methods subjected to a final cold drawing process to reduce the diameter to 3.5 mm after T73 treatment.
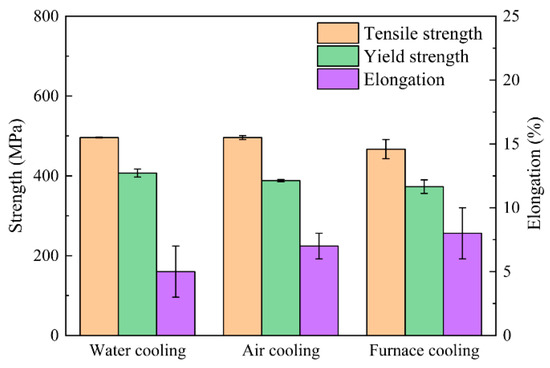
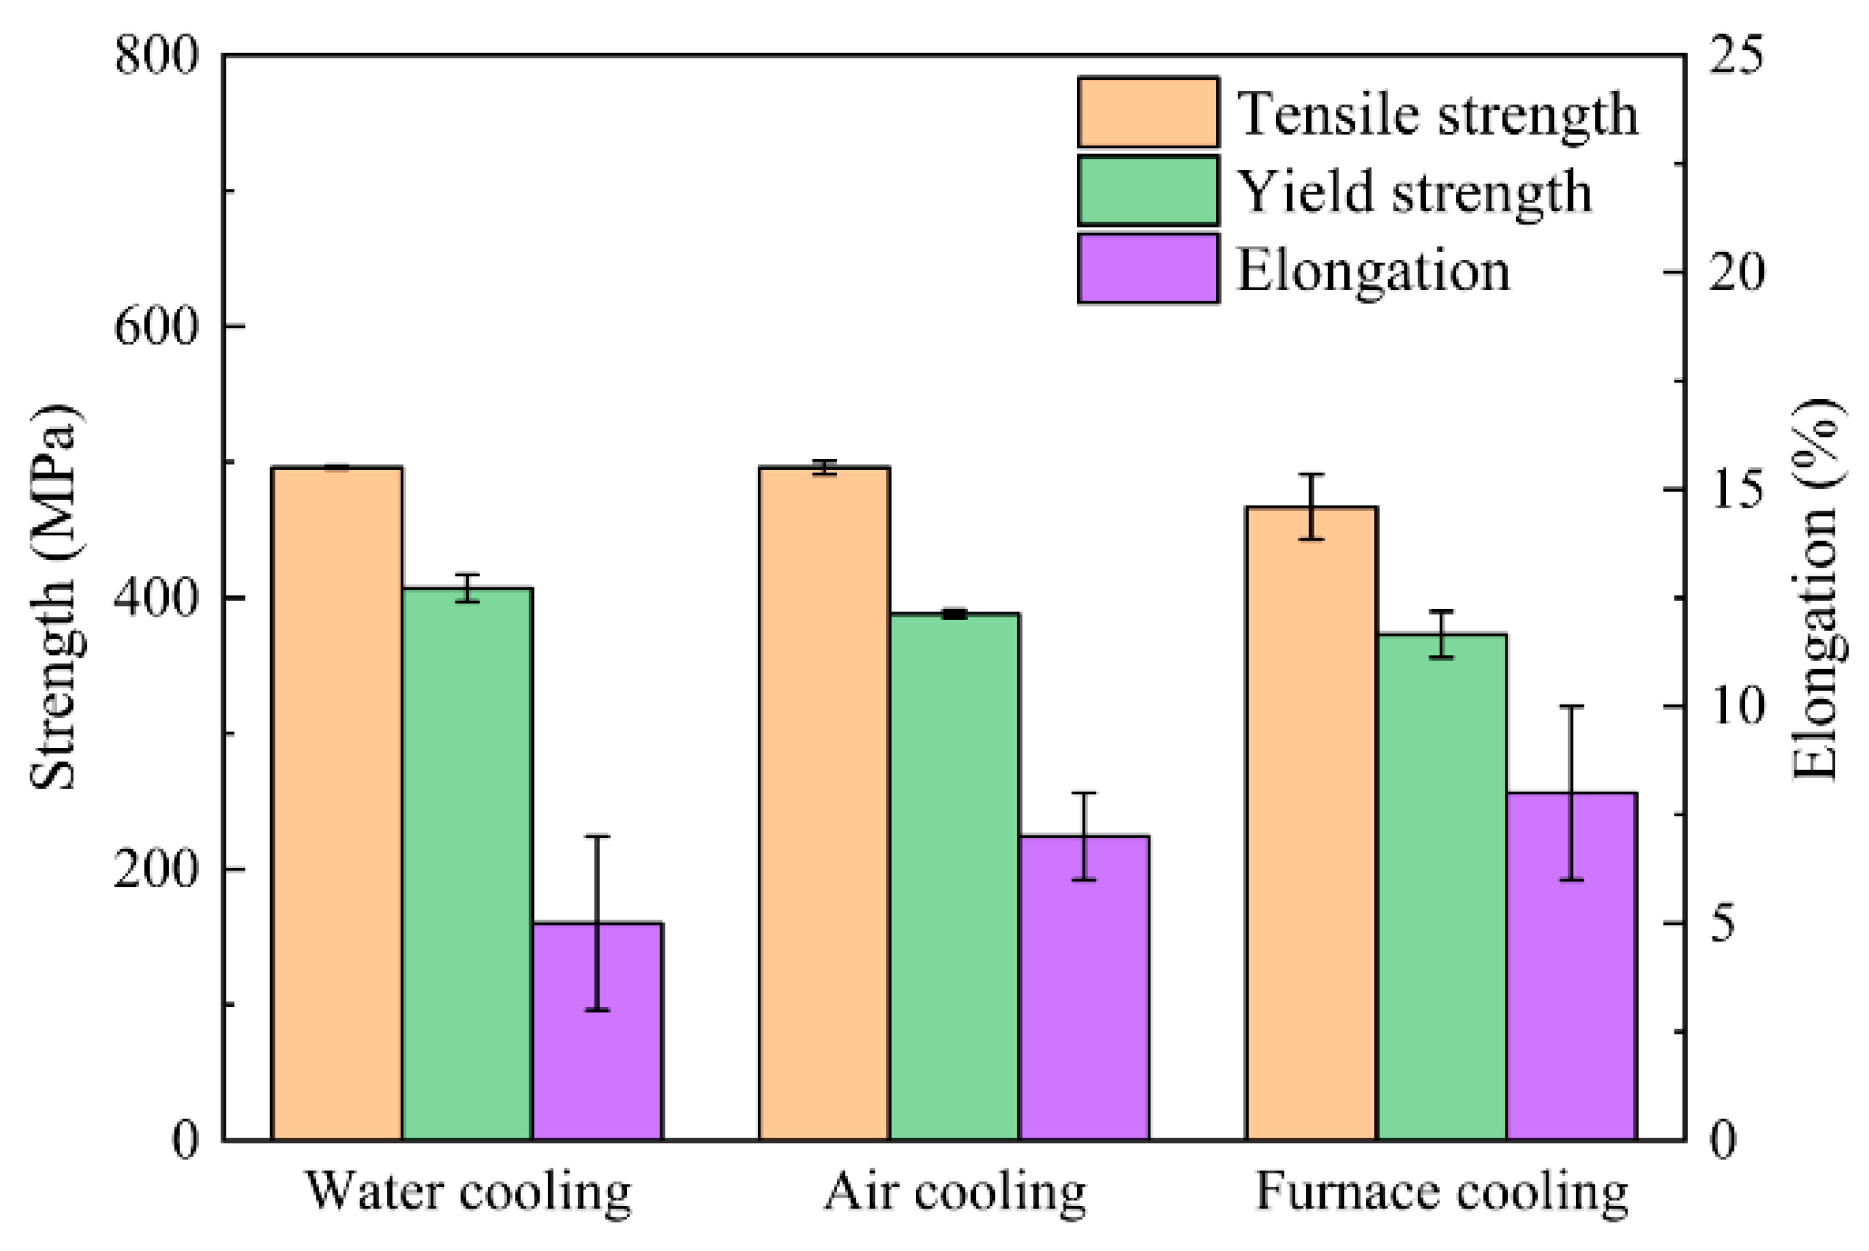
Figure 13 shows the mechanical properties of the wire samples subjected to annealing treatment followed by different cooling methods, then a final cold drawing process to reduce the diameter to 3.5 mm, and finally T73 treatment. For the water- and air-cooling alloy wires, the strength changed little after T73 treatment compared with the cold drawing condition, while the elongation slightly increased. In contrast, for the furnace-cooling alloy wire, the strength increased significantly after T73 treatment, accompanied by a reduction in elongation. Among the three alloy wire samples in T73 temper, the strength values were comparable, whereas the elongation gradually increased from the water-cooling to the air-cooling and furnace-cooling samples.
Figure 13.
Mechanical properties of the wire samples with annealing treatment followed by different cooling methods subjected to a final cold drawing process to reduce the diameter to 3.5 mm after T73 treatment.
4. Discussion
During the cold heading of alloy wires, susceptibility to cracking is strongly governed by the balance between strength and ductility. As strength increases, the flow stress of the alloy rises significantly during deformation. This results in higher forming loads and more pronounced local stress concentrations at regions experiencing severe plastic deformation. With such conditions, the ability of the alloy to accommodate strain through uniform plastic flow becomes critical [26]. When the elongation is relatively low, the deformation compatibility between different microstructural regions is reduced, leading to strain localization and ultimately crack initiation. Conversely, the alloy wire with higher elongation exhibited improved plastic accommodation during cold heading. Enhanced ductility allows the alloy to redistribute localized stresses through more homogeneous plastic deformation. This helps delay crack initiation and propagation [27]. Therefore, an optimized strength–ductility balance is essential for achieving good cold heading formability in alloy wires. Excessively high strength combined with insufficient ductility significantly increases the risk of cracking during severe plastic deformation [28]. Different intermediate annealing cooling methods with cold drawing treatment can significantly influence the precipitation behavior of the alloy. This, in turn, affects the strength–ductility balance and ultimately determines the cold heading cracking resistance of the alloy wire. The relatively low strength and high ductility of the furnace-cooling alloy wire sample contribute to its superior cold heading performance.
In addition, the cold heading cracking susceptibility of the alloy wire is strongly correlated with its crystallographic texture. The orientation results characterized by EBSD were analyzed and calculated, and the component contents of different crystallographic textures were counted, as shown in Table 1.
Table 1.
The volume fractions of different texture components.
The -values and -value of various textures in the aluminum alloy were simulated and calculated using the Taylor model [29], as shown in Table 2.
Table 2.
The calculated -values and -values.
The plastic strain ratio (r-value) and planar anisotropy (Δr-value) were evaluated based on the texture components and their corresponding volume fractions [30]. The r-value and Δr-value can be expressed as:
where denotes the volume fraction of each component. The fraction not included in the major texture components is assumed to be random, with and . As shown in Table 3, the furnace-cooling alloy wire sample exhibited a Δr value of −0.0306, which was close to zero. This indicates weak planar anisotropy and a relatively uniform plastic response in different directions. This implied that, during subsequent cold heading, plastic deformation can be more uniformly distributed throughout the material, thereby reducing local strain and stress concentrations. As a result, the alloy wire demonstrated superior resistance to cracking [31]. This finding is consistent with the experimental observation that no obvious cracks were detected in the furnace-cooling sample, even under 80% compressive deformation. In contrast, the air- and water-cooling samples exhibited Δr-values of 0.2173 and 0.2251, respectively, which were significantly higher than the furnace-cooling sample, indicating stronger planar plastic anisotropy under these cooling conditions. Higher Δr-values indicate more pronounced differences in plastic flow behavior along different directions. This makes the material more susceptible to inhomogeneous deformation and localized strain concentration during compression [32]. Consequently, the likelihood of crack initiation increased. Therefore, the air-cooling and water-cooling samples were more prone to cracking during cold heading compared to the furnace-cooling sample, which was consistent with the experimental observations.
Table 3.
Calculated r-values and ∆r-values of alloy wires cold drawn from 5.0 mm to 3.5 mm with different intermediate annealing cooling methods.
After T73 treatment, the alloy wires subjected to different intermediate annealing cooling methods exhibited only minor differences in strength. This indicated that, after subsequent solution and aging treatments, precipitation strengthening and microstructural uniformity become the dominant factors governing the strength. Meanwhile, the influence of texture variations induced by prior cooling conditions was significantly reduced [33]. However, the elongation still increased from water cooling to air cooling and further to furnace cooling. This suggests that the effect of texture on plastic deformation behavior was not completely eliminated. Texture analysis revealed that the water-cooling sample exhibited the highest orientation distribution function peak intensity. It showed pronounced Brass, D, and R components, indicating a higher degree of local orientation concentration. This promoted slip incompatibility and localized strain concentration during tensile deformation, resulting in the lowest elongation [34]. In contrast, the air-cooling sample, characterized by a relatively higher Cube component and lower texture intensity, showed a more favorable orientation distribution for uniform plastic deformation, leading to improved elongation. Although the furnace-cooling sample was dominated by the F component, its overall texture intensity was weaker. This facilitated better deformation compatibility among grains and thus resulted in the highest elongation [35].
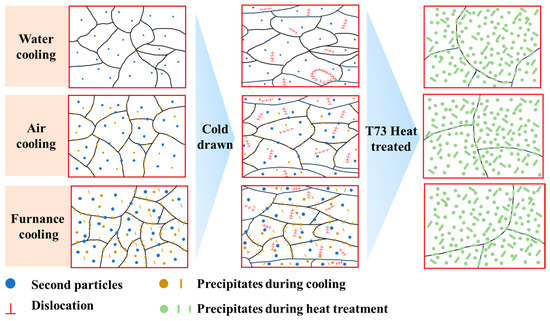
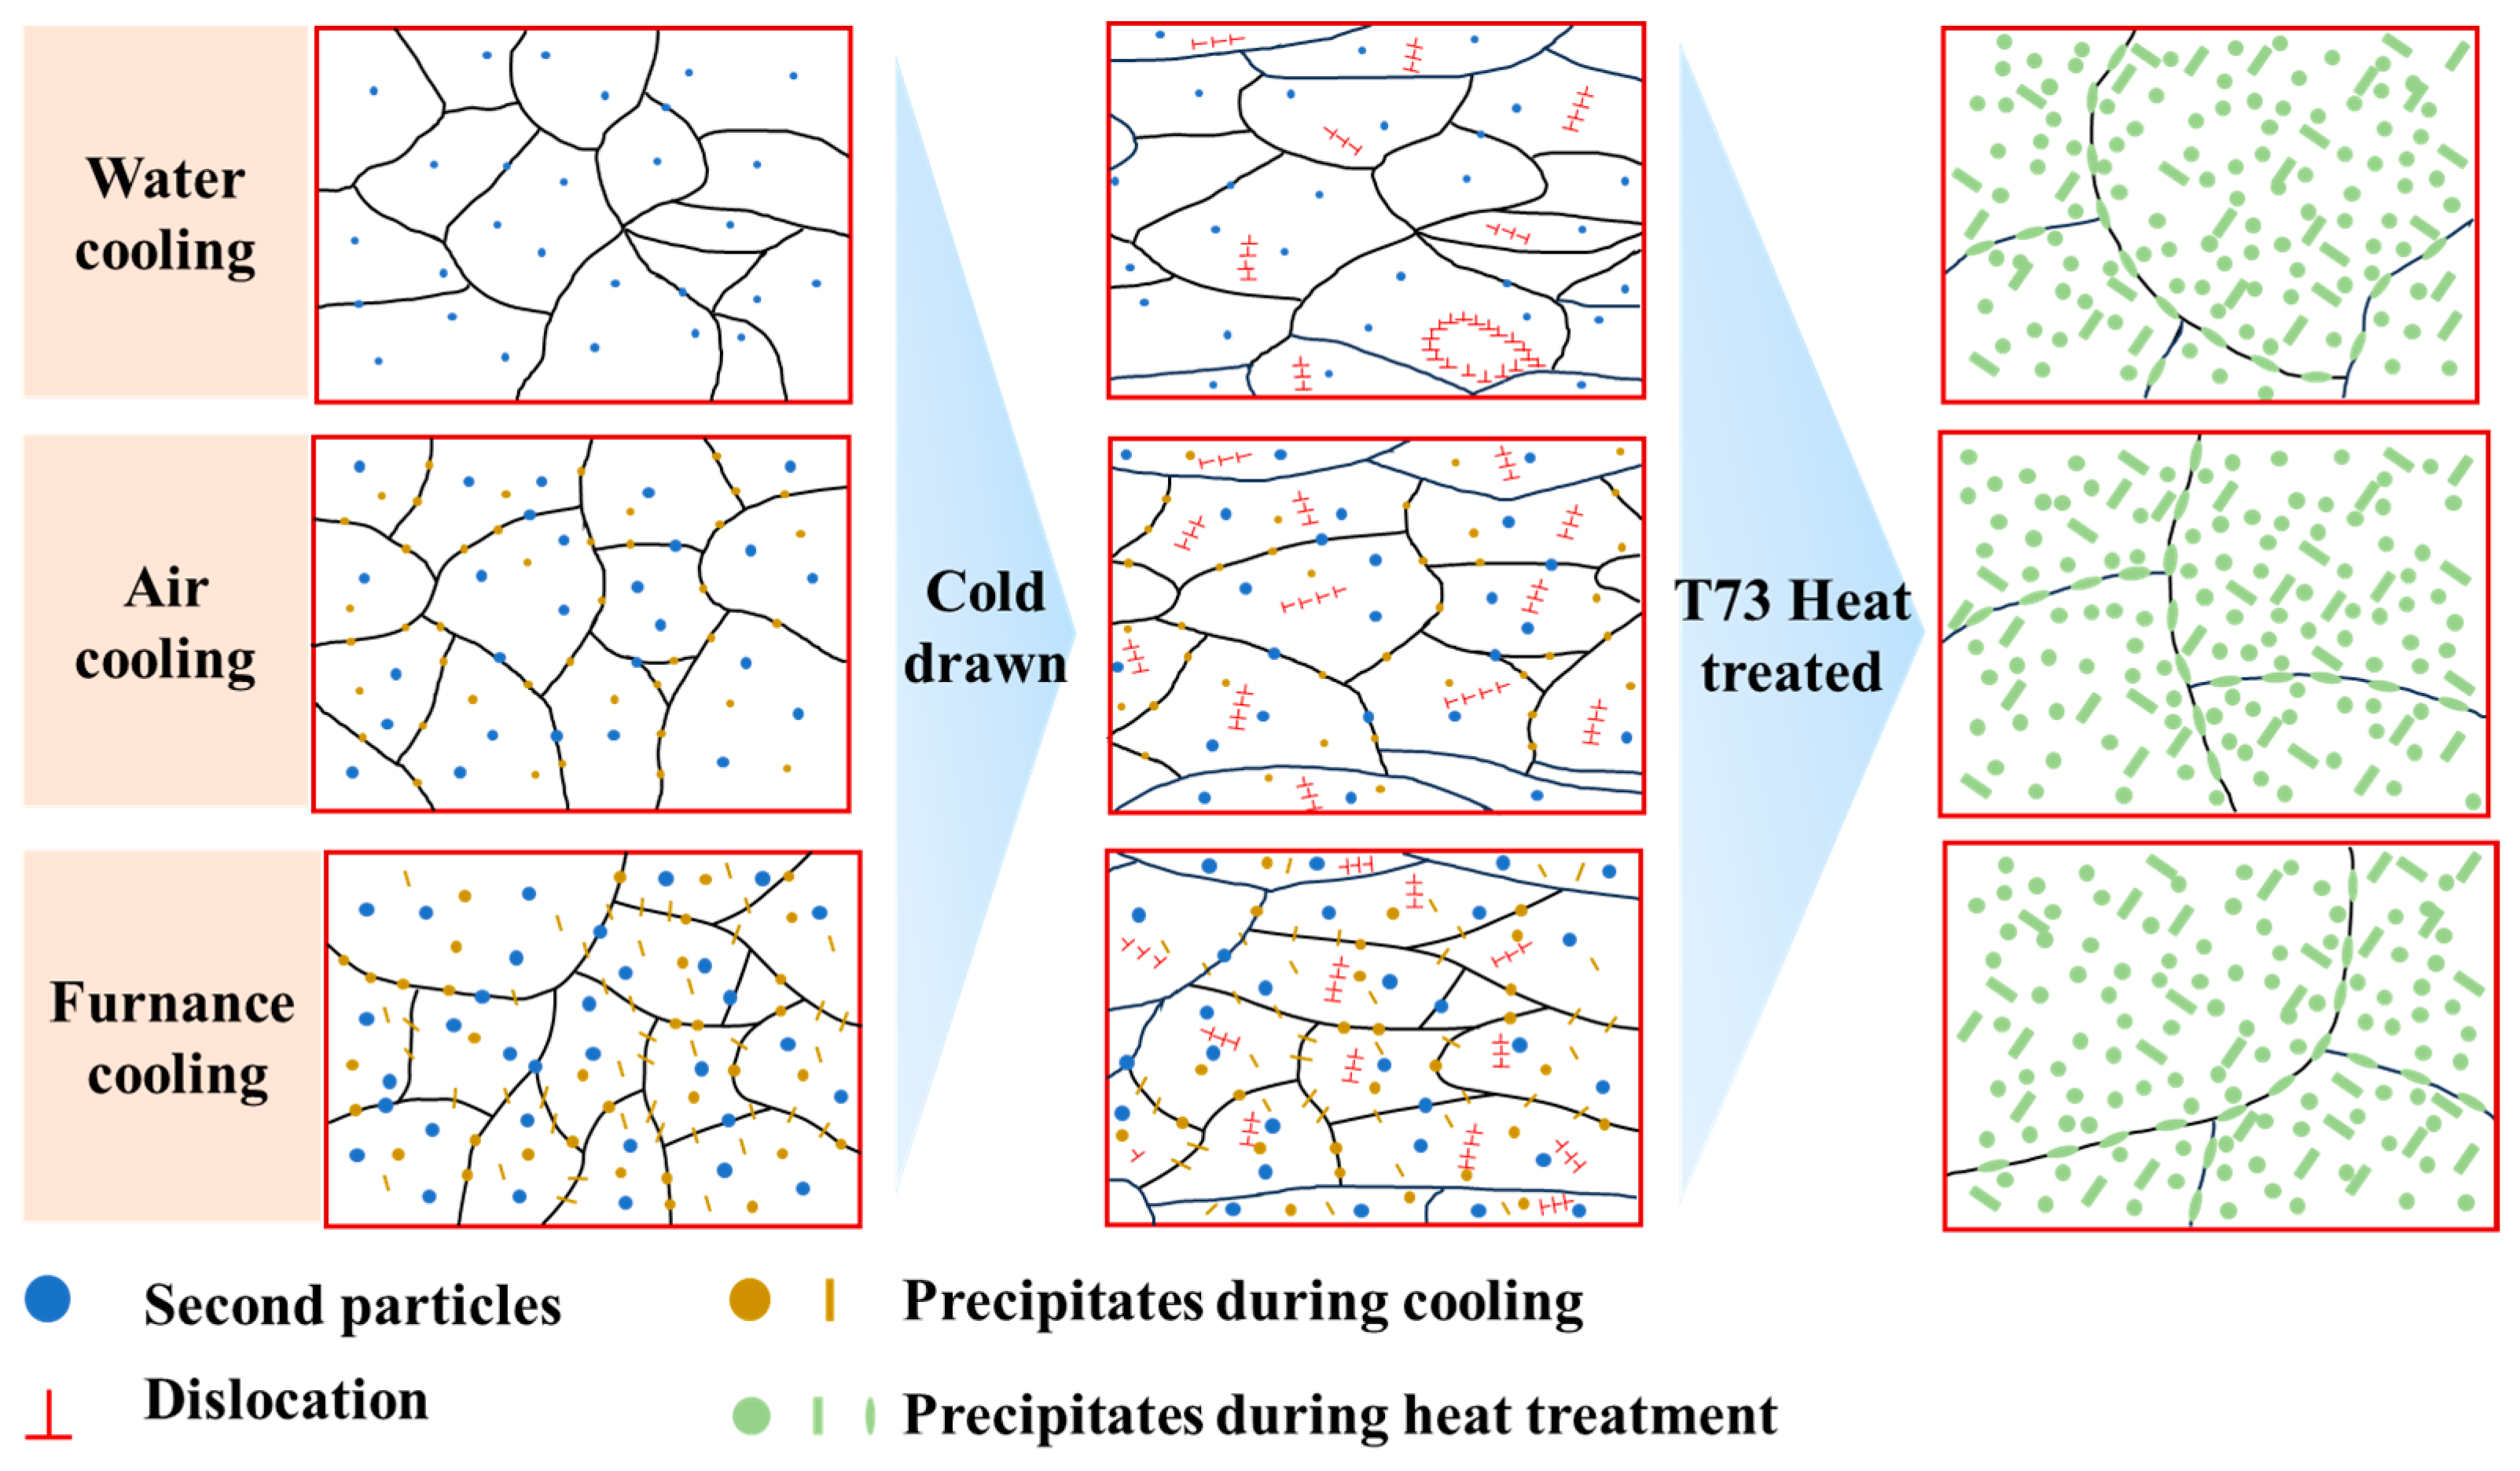
Figure 14 shows the schematic illustration of the evolution of the grain structure, secondary particles, and precipitates in alloy wires subjected to different intermediate annealing cooling methods during cold drawing and subsequent solution aging treatment. The primary purpose of intermediate annealing is to reduce the deformation resistance during subsequent cold drawing [36]. However, the heat treatment temperature is insufficient to dissolve the Al–Zn–Mg–Cu secondary particles. Instead, the prolonged exposure to elevated temperatures promotes further clustering of solute atoms in the solid solution. This facilitates the precipitation and growth of precipitates, particularly in high-energy regions such as the grain boundaries [37,38]. Depending on the cooling method after intermediate annealing, a slower cooling rate results in a longer high-temperature residence time. This results in an increased number and larger size of precipitated secondary particles [39]. Consequently, micrometer-scale precipitates formed within the grains and along the grain boundaries in the furnace-cooling alloy wire samples. The coarsened precipitates exhibit a weakened or even lost coherent relationship with the matrix. As a result, dislocations bypass the particles via the Orowan mechanism instead of shearing them [40]. As the strengthening effect of the bypass mechanism is significantly lower than that of the shearing mechanism, the strength of the alloy wire consequently decreases. Owing to the relatively high cooling rates with water- and air-cooling methods, part of the solute atoms remain in the supersaturated solid solution (SSS). Subsequent natural aging at RT promotes precipitation, thereby contributing to the higher strength of the alloy wires [41].
Figure 14.
Schematic illustration of the evolution of the grain structure, secondary particles, and precipitates in alloy wires subjected to different intermediate annealing cooling methods during cold drawing and subsequent solution aging treatment.
After cold drawing, the diameter of the alloy wire decreased from 5.0 mm to 3.5 mm. The imposed cold deformation introduced a large number of dislocations, leading to a rapid increase in dislocation density. These dislocations subsequently entangled and rearranged, forming dislocation walls within the grains. The alloy wires subjected to different intermediate annealing cooling methods all exhibited varying degrees of strength enhancement accompanied by a reduction in ductility [42]. After T73 heat treatment, most dislocations were annihilated. The deformed microstructure then underwent complete recrystallization, leading to the formation of equiaxed grains [43]. Meanwhile, the secondary particles in the alloy dissolved into the matrix [44]. The alloy wire samples subjected to different intermediate annealing cooling methods exhibited no significant differences in the size of grain boundary precipitates and grain boundary width. At this stage, the strength was predominantly controlled by precipitation and grain structure, with only slight differences in strength among the alloy wire samples processed with different intermediate annealing cooling methods.
The intermediate annealing cooling method prior to final cold drawing acts as the fundamental processing parameter that dominates the entire evolution chain of microstructure, texture, and mechanical properties. Different cooling rates directly regulate precipitation behavior, grain structure, and crystallographic texture during annealing and subsequent cold drawing. These features further determine the strength–ductility balance, plastic anisotropy, and cracking resistance during cold heading. After T73 heat treatment, precipitation strengthening becomes the dominant factor controlling the final strength, whereas the inherited texture still governs the elongation difference. The inherent correlation among processing conditions, microstructure, texture evolution, and mechanical behavior is therefore fully established.
5. Conclusions
In this study, the influence of annealing cooling methods prior to final cold drawing on the microstructure and mechanical properties of Al–Zn–Mg–Cu alloy wires is revealed in detail. The results provide guidance for optimizing the intermediate annealing cooling process before the final cold drawing and the subsequent solution aging heat treatment for high-quality, large-weight alloy wires. The main conclusions can be summarized as follows:
- (1)
- The cold heading cracking resistance of alloy wire is primarily governed by the strength–ductility balance. Compared with water- and air-cooling methods, the furnace-cooling alloy wire exhibited relatively lower strength and higher ductility, enabling more homogeneous plastic deformation and thus, superior cold heading formability.
- (2)
- The grain texture affects the cold heading cracking resistance of alloy wires through its influence on the Δr-values. The furnace-cooling sample was characterized by a near-zero Δr, leading to reduced strain localization and superior cracking resistance. The higher Δr-values in the air- and water-cooling samples resulted in pronounced anisotropy, increased strain concentration during deformation, consequently a higher susceptibility to cracking.
- (3)
- After T73 treatment, the elongation remains governed by texture. The weaker texture in the furnace-cooling sample enhanced deformation compatibility and yielded the highest elongation, whereas the stronger texture in the water-cooling sample promoted strain localization and reduced ductility.
- (4)
- Compared with the water-cooling and air-cooling methods, furnace cooling after intermediate annealing before the final cold drawing prolonged the high-temperature residence time, promoting the precipitation and coarsening of η′-strengthening phases. The reduced strengthening effect of these coarse precipitates led to lower strength and higher ductility of the alloy wires.
- (5)
- Cold drawing strengthens the alloy via dislocation accumulation. T73 treatment induced dissolution and re-precipitation of secondary particles, resulting in negligible strength differences among samples processed with different intermediate annealing cooling methods.
Author Contributions
Conceptualization, G.G. and K.W.; methodology, L.Y. and X.L.; software, X.L.; validation, T.H., Z.L. and L.C.; formal analysis, T.H., L.C. and H.Y.; investigation, H.Y., Y.Z. and B.X.; resources, B.X.; data curation, X.G., T.H. and L.C.; writing—original draft preparation, X.G.; writing—review and editing, G.G. and K.W.; visualization, X.G., G.G., T.H. and L.C.; supervision, L.Y. and B.X.; project administration, Z.L. and Y.Z.; funding acquisition, Z.L. All authors have read and agreed to the published version of the manuscript.
Funding
This work was financially supported by relevant national programs.
Data Availability Statement
The data presented in this study are available on request from the corresponding author. The data are not publicly available due to privacy.
Conflicts of Interest
Author Xinyu Gao, Guanjun Gao, Kai Wen, Zhihui Li, Lizhen Yan, Xiwu Li, Hongwei Yan, Yongan Zhang and Baiqing Xiong were employed by the company China GRINM Group Co., Ltd. Author Tianlong Hu and Lei Chen were employed by the company Northeast Light Alloy Co., Ltd.
References
- Turner, R.; Smith, C.; Zneimer, L.; Medlock, L.; Ridgeway, A.S.; Subramanian, G.O.; Warnken, N. Characterization of Ti-6Al-4V bar for aerospace fastener pin axial forging. Mater. Plus 2024, 3, 1–17. [Google Scholar] [CrossRef] [Scilit]
- Hidalgo, I.Y.; Rojas, V.A.; Palya, N.I.; Zhu, N.; Brewer, L.N.; Kubacki, G.W.; Jordon, J.B. Effect of tool pre-heating on the fatigue behavior of lubricant-free additive friction stir deposition repairs of AA7050 aircraft fastener holes. Int. J. Fatigue 2025, 203, 109272. [Google Scholar] [CrossRef] [Scilit]
- Fouad, R.A.; Habba, M.I.; Elshaghoul, Y.G.; El-Sayed Seleman, M.M.; Hafez, K.M.; Hamid, F.S.; Barakat, W.S. The influence of various welding wires on microstructure, and mechanical characteristics of AA7075 Al-alloy welded by TIG process. Sci. Rep. 2024, 14, 19023. [Google Scholar] [CrossRef] [Scilit] [PubMed]
- Jin, J.; Geng, S.; Shu, L.; Jiang, P.; Shao, X.; Han, C.; Wang, X. High-strength and crack-free welding of 2024 aluminium alloy via Zr-core-Al-shell wire. Nat. Commun. 2024, 15, 1748. [Google Scholar] [CrossRef] [Scilit]
- Wang, G.; Peng, C.; Zhang, B.; Xu, Z.; Li, Q.; Liu, K.; Lu, P. Effect of the annealing process on the microstructure and performance of 5056 aluminum alloy wires. Metals 2022, 12, 823. [Google Scholar] [CrossRef] [Scilit]
- Shu, W.X.; Hou, L.G.; Zhang, C.; Zhang, F.; Liu, J.C.; Liu, J.T.; Zhang, J.S. Tailored Mg and Cu contents affecting the microstructures and mechanical properties of high-strength Al-Zn-Mg-Cu alloys. Mater. Sci. Eng. A 2016, 657, 269–283. [Google Scholar] [CrossRef] [Scilit]
- Zou, Y.; Wu, X.; Tang, S.; Zhu, Q.; Song, H.; Guo, M.; Cao, L. Investigation on microstructure and mechanical properties of Al-Zn-Mg-Cu alloys with various Zn/Mg ratios. J. Mater. Sci. Technol. 2021, 85, 106–117. [Google Scholar] [CrossRef] [Scilit]
- Chinh, N.Q.; Lendvai, J.; Ping, D.H.; Hono, K. The effect of Cu on mechanical and precipitation properties of Al-Zn-Mg alloys. J. Alloys Compd. 2004, 378, 52–60. [Google Scholar] [CrossRef] [Scilit]
- Wang, S.; Hou, J.P.; Zhang, Z.J.; Gong, B.S.; Qu, Z.; Wang, H.; Zhou, X.H.; Jiang, H.C.; Wang, Q.; Li, X.W.; et al. Grain design in ultra-fine Al wire with remarkable combination of strength and conductivity: Ultra-fine-long grains with super strong <111> texture. Scr. Mater. 2024, 238, 115746. [Google Scholar] [CrossRef] [Scilit]
- Li, Z.; Chen, L.; Tang, J.; Zhao, G.; Zhang, C. Response of mechanical properties and corrosion behavior of Al-Zn-Mg alloy treated by aging and annealing: A comparative study. J. Alloys Compd. 2020, 848, 156561. [Google Scholar] [CrossRef] [Scilit]
- Zhou, Z.; Han, M.; Xiao, X.; Lv, D.; Cong, F.; Li, C.; Liu, Y. Microstructure, mechanical properties and corrrosion behavior of Al-Zn-Mg-Cu wire under different annealing conditions. J. Mater. Res. Technol. 2024, 30, 3900–3908. [Google Scholar] [CrossRef] [Scilit]
- Li, W.; Liu, W.; Qian, F.; Mao, P.; Wang, J. Microstructural evolution of AA7050 alloy wires during tandem hot rolling (THR) and cold-drawing process. Mater. Sci. Eng. A 2022, 849, 143512. [Google Scholar] [CrossRef] [Scilit]
- Zhou, Y.; Zhou, J.; Xiao, X.; Li, S.; Cui, M.; Zhang, P.; Long, S.; Zhang, J. Microstructural evolution and hardness responses of 7050 Al alloy during processing. Materials 2022, 15, 5629. [Google Scholar] [CrossRef] [Scilit]
- Jia, D.; He, T.; Song, M.; Huo, Y.; Du, X.; Vereshchaka, A.; Li, J.; Hu, H. Microstructure evolution of 7050 Al alloy fasteners during cold upsetting after equal channel angular pressing. J. Cent. South Univ. 2023, 30, 3682–3695. [Google Scholar] [CrossRef] [Scilit]
- Liu, X.; Li, D.; Zhang, D.; Pan, X.; Zhang, Y.; Zuo, Y.; Jiang, H. Effect of solidification structure on the microstructure and the mechanical properties of 7050 aluminum alloy sheet. J. Alloys Compd. 2025, 1031, 181005. [Google Scholar] [CrossRef] [Scilit]
- Dashti, A. Influence of the Cold Drawing Process on the Mechanical Behavior of Cu-Al Composite Wires. Ph.D. Thesis, Normandie Université, Caen, France, 2023. Available online: https://theses.hal.science/tel-04205190 (accessed on 11 April 2026).
- Li, X.; Shi, C.; Han, G.; Liu, H.; Li, X.; Liu, R. Microstructure evolution and mechanical properties of 7A52 aluminum alloy thin sheet repaired with friction stir surfacing. Materials 2024, 17, 2602. [Google Scholar] [CrossRef] [Scilit]
- Yang, J.; Wu, L.; Lian, Y.; Zhang, R.; Chen, X.; Zhang, J.; Ji, P.; Luo, J.; Chen, F. texture, residual stress and mechanical properties of 7039-T6 thick plate Al alloy with MIG-welded laminar tearing. Int. J. Miner. Metall. Mater. 2025, 32, 1176–1189. [Google Scholar] [CrossRef] [Scilit]
- Mireles-Ramos, A.; García-Pastor, F. Crystallographic texture evolution of aluminum samples with a rectangular cross-section during equal channel angular pressing processing. Metals 2024, 14, 1460. [Google Scholar] [CrossRef] [Scilit]
- Hu, J.; Zhang, Z.; Xing, C.; Wu, X.; Huang, S.; Bo, H. Microstructure evolution of 7050 aluminum forgings during surface cumulative plastic deformation. Trans. Nonferrous Met. Soc. China 2025, 35, 45–59. [Google Scholar] [CrossRef] [Scilit]
- Gao, X.; Gao, G.; Li, Z.; Li, X.; Yan, L.; Zhang, Y.; Xiong, B. Effects of different heating and cooling rates during solution treatment on microstructure and properties of AA7050 alloy wires. Materials 2024, 17, 310. [Google Scholar] [CrossRef] [Scilit] [PubMed]
- Qi, Q.; Bu, H.; Wu, K.; Duan, Y.; Li, M. Work hardening behavior and anisotropy microscopic mechanism of 7050 aluminum alloy at room temperature. Mater. Charact. 2026, 232, 115953. [Google Scholar] [CrossRef] [Scilit]
- Zheng, W.; Fan, Q.; Sun, S.; Tang, H.; Li, G.; Zhou, Y.; Li, J. Image processing technology and algorithm for microstructure evolution of aluminum alloy wire. In 2025 International Conference on Electrical Drives, Power Electronics & Engineering (EDPEE); IEEE: Piscataway, NJ, USA, 2025; pp. 151–155. [Google Scholar] [CrossRef] [Scilit]
- Zhu, C.; Jiang, Z.; Shi, D.; Zhang, J. Stress Relaxation Inhibits Recrystallization and Grain Growth in Deformed Al-Cu-Li Alloys. J. Alloys Compd. 2025, 1034, 181355. [Google Scholar] [CrossRef] [Scilit]
- Son, K.T.; Cho, C.H.; Kim, M.G.; Lee, J.W. Two-Stage Dynamic Recrystallization and Texture Evolution in Al-7Mg Alloy during Hot Torsion. Int. J. Miner. Metall. Mater. 2024, 31, 1900–1911. [Google Scholar] [CrossRef] [Scilit]
- Wu, J.F.; Chen, S.B.; Lin, Y.C.; Xiao, G.; He, D.G. Warm forming characteristics of AA7075: Microstructure interaction mechanisms and constitutive models. Materials 2026, 19, 666. [Google Scholar] [CrossRef] [Scilit]
- Wang, P.; Ye, L.; Liu, X.; Dong, Y.; Zhao, L. On the role of grain structure and crystal orientation in governing fatigue crack propagation behavior of Al-Cu-Li alloy. J. Alloys Compd. 2023, 945, 169317. [Google Scholar] [CrossRef] [Scilit]
- Li, Y.; Liu, F.; Chen, H.; Qi, X.; Ge, T.; Guo, X.; Gong, H.; Li, F. Cryogenic ductility enhancement mechanisms of AA7075 alloy under different deformation conditions: Tensile tests and incremental sheet forming. Mater. Des. 2025, 260, 115051. [Google Scholar] [CrossRef] [Scilit]
- Chen, K.-X.; Yan, L.-Z.; Zhang, Y.-A.; Li, X.-W.; Li, Z.-H.; Gao, G.-J.; Yan, H.-W.; Xiong, B.-Q. Enhanced Formability of Al–Mg–Si–Zn Alloy Sheet via Dislocation Structure and Texture during Cold Rolling. J. Mater. Res. Technol. 2024, 28, 3306–3318. [Google Scholar] [CrossRef] [Scilit]
- Zhang, Z.; Li, Z.; Tang, S.; Ma, Y.; Liu, W. Predicting the in-plane mechanical anisotropy of 7085 aluminum alloys through crystal plasticity simulations and machine learning. Mater. Today Commun. 2024, 38, 108381. [Google Scholar] [CrossRef] [Scilit]
- Zhao, Q.; Abdel Wahab, M.; Ling, Y.; Liu, Z. Grain-orientation induced stress formation in AA2024 monocrystal and bicrystal using crystal plasticity finite element method. Mater. Des. 2021, 206, 109794. [Google Scholar] [CrossRef] [Scilit]
- Tandon, R.; Yusufzai, M.Z.K.; Manna, R.; Mandal, R.K. Effect of friction stir processing on microstructure, texture, and mechanical properties of AA7075T7352 alloy. J. Alloys Compd. 2025, 1021, 179478. [Google Scholar] [CrossRef] [Scilit]
- Li, Y.; Xu, G.; Liu, S.; Wang, B.; Peng, X. Study on anisotropy of Al-Zn-Mg-Sc-Zr alloy sheet. Mater. Charact. 2021, 172, 110904. [Google Scholar] [CrossRef] [Scilit]
- Park, N.J.; Jin, S.J.; Jea, C.W.; Lim, S.T.; Lee, Y.Y.; Chung, D.-S. Effect of the 0.1% Sc addition on the texture development and mechanical properties in Al-Zn-Mg-Cu-Mn alloy. Solid State Phenom. 2005, 105, 213–218. [Google Scholar] [CrossRef] [Scilit]
- Sidor, J.; Miroux, A.; Petrov, R.; Kestens, L. Microstructural and crystallographic aspects of conventional and asymmetric rolling processes. Acta Mater. 2008, 56, 2495–2507. [Google Scholar] [CrossRef] [Scilit]
- Mukherjee, D.; Roy, H.; Chandrakanth, B.; Mandal, N.; Samanta, S.K.; Mukherjee, M. Enhancing properties of Al-Zn-Mg-Cu alloy through microalloying and heat treatment. Mater. Chem. Phys. 2024, 314, 128881. [Google Scholar] [CrossRef] [Scilit]
- Ma, Z.; Robson, J.D. Understanding the effect of deformation combined with heat treatment on age hardening of Al-Zn-Mg-Cu alloy AA7075. Mater. Sci. Eng. A 2023, 878, 145212. [Google Scholar] [CrossRef] [Scilit]
- Long, S.; Xia, R.Z.; Jiang, Y.P.; Peng, P.; Wang, S.Y.; Li, S.S.; Zhou, Y.T.; Dai, Q.W. Recrystallization behavior of an Al-Zn-Mg-Cu alloy during hot deformation and subsequent heat treatment. Mater. Today Commun. 2023, 37, 107570. [Google Scholar] [CrossRef] [Scilit]
- Luo, L.; Yang, B.H.; Yang, X.R.; Yan, W.W.; Gan, C.; Liu, X.Y.; Wang, J.Z. Effects of different cooling conditions on microstructure and precipitation behavior of fine-grained Al-Zn-Mg-Cu alloy friction stir welding joint. J. Mater. Res. Technol. 2023, 24, 4534–4550. [Google Scholar] [CrossRef] [Scilit]
- Cheng, J.; Shao, H.; Liu, Y.; Fu, R.; Huang, Y. Evolution of coarse second phase particles and dynamic recrystallization behavior in a highly alloyed Al-Zn-Mg-Cu-Zr-Sc alloy under hot deformation. J. Alloys Compd. 2025, 1039, 182844. [Google Scholar] [CrossRef] [Scilit]
- de Salvo, J.G.J.; Afonso, C.R.M. Fatigue strength and microstructure evaluation of Al 7050 alloy wires recycled by spray forming, extrusion and rotary swaging. Trans. Nonferrous Met. Soc. China 2020, 30, 3195–3209. [Google Scholar] [CrossRef] [Scilit]
- Rhee, Y.; Kobayashi, E. Effect of cold rolling on precipitates evolution in Al-5.5Zn-2.0Mg-2.4Cu alloy. Arch. Metall. Mater. 2025, 70, 1081–1084. [Google Scholar] [CrossRef] [Scilit]
- Kheradmand, A.B.; Tayebi, M.; Akbari, M.M.; Abbasian, A. Effect of quench-controlled precipitation hardening on microstructure and mechanical properties of Al-Zn-Mg-Cu-Zr alloys contain of Sc micro-alloying. J. Alloys Compd. 2022, 902, 163748. [Google Scholar] [CrossRef] [Scilit]
- Lu, J.; Huang, H.; Wu, H.; Wen, S.; Gao, K.; Nie, Z.R. Effect of solution treatment on the properties and microstructural evolution of Al-Zn-Mg-Cu-Er-Zr alloy. Mater. Sci. Forum 2016, 877, 303–309. [Google Scholar] [CrossRef] [Scilit]

Disclaimer/Publisher’s Note: The statements, opinions and data contained in all publications are solely those of the individual author(s) and contributor(s) and not of MDPI and/or the editor(s). MDPI and/or the editor(s) disclaim responsibility for any injury to people or property resulting from any ideas, methods, instructions or products referred to in the content. |
© 2026 by the authors. Licensee MDPI, Basel, Switzerland. This article is an open access article distributed under the terms and conditions of the Creative Commons Attribution (CC BY) license.