


Abstract
Residual stress induced by shot peening (SP) is inherently unstable. Stress relaxation has attracted widespread attention, and related research has been carried out. This study aims to study the residual stress relaxation phenomenon in a shot-peened TC4 titanium alloy due to cyclic load. Numerical simulations and experiments were performed to investigate the effects of the applied load amplitude, the number of cycles, the depth and the load ratios. The study may make contributions to the literature on understanding the residual stress relaxation induced by shot peening. The numerical and experimental results showed that the relaxation rate of the residual stress is correlated to the applied stress amplitude. Most of the relaxation of the residual stress was observed in the first cycle, which is up to 47.2% and 62.3% after 1000 cycles for the two different shot peening intensities. After the high relaxation at the first cycle, the residual stresses gradually decreased at a lower rate, remaining almost stable for up to 1000 cycles. The experimental residual stress in the specimens at a load of 550 MPa decreased more than that for a load of 450 Mpa; the decrease was more than 29.6% for the 550 MPa load with 1000 cycles, and the relaxation was stable after 10,000 cycles. Also, the relaxations in the surface and depth were studied. The maximum residual stress was more prone to relaxation. The presented model of residual stress relaxation, validated with experimental data, showed good agreement for the residual stress relaxation.
1. Introduction
Under practical service conditions, the surface-strengthening effect of shot peening (SP) gradually weakens owing to the relaxation of induced residual stresses (RSs). The relaxation behaviour of RS fields under cyclic loading has been extensively studied. The relaxation of SP-induced RSs in different materials has been investigated in previous studies [1,2,3]. The magnitudes of the initial RS and plastic strain, along with heating temperature and exposure time, were identified as key parameters controlling thermal relaxation. Most of the stress relaxation occurs within the first 20 min of exposure, and its extent rises with higher temperatures and greater initial as-peened RS [4]. However, that study did not address the effect of external loads. Zhu [5] studied the combined effects of temperature and cyclic loading on the RS relaxation of FGH95 powder superalloy after LSP treatment. Luan [6] reported that in the SP surface of TiB2/6351Al composite, longitudinal RS relaxation was more severe than transverse relaxation under static and cyclic loading. Under cyclic loading, rapid relaxation of the RS occurred within the first few cycles due to localised plastic deformation. Feng [7] reported that, in the duplex stainless steel S32205, longitudinal relaxation of RS in austenite and ferrite was more pronounced than transverse relaxation under static and cyclic loading. RS relaxation intensified when the applied stress exceeded the yield strength of the material. Wick [8] measured the surface RS of AISI 4140 specimens after the first cycle. The results showed that the relaxation increased exponentially with applied stress amplitude, while the relaxation rate accelerated with the number of loading cycles. Dalaei [9] observed that compressive RS progressively relaxed during fatigue loading. Furthermore, the surface compressive RS relaxed within five cycles and then remained relatively stable [10,11,12]. However, no significant RS relaxation was observed when applied loads were below a threshold value [13]. Under cyclic loading, the surface residual compressive stress field undergoes significant relaxation [14,15,16]. However, the sustained RS strengthening effect can considerably enhance component fatigue life [17]. Stress relaxation refers to the partial dissipation of initial residual compressive stresses. Even at the critical state of fatigue failure, an effective level of residual compressive stress can be maintained. Samples treated by conventional SP exhibited higher fatigue life at low strain amplitudes but lower fatigue life at high strain amplitudes [18]. The relaxation threshold stress, which reflects the stability of compressive RS, was directly correlated with specimen hardness [19,20]. Bhowmik [21] investigated microstructural and defect configuration changes in AISI 1020 steel after SP and reported that fatigue life was extended compared with un-peened specimens. The rate of RS primarily depends on the magnitude and depth of the peak compressive stress [22].
The effect of stress ratio on SP aluminium alloy specimens was also studied [23]. Under a stress ratio of R = 0.1, surface RS exhibited only slight relaxation. For a load ratio of R = −1, RS relaxation at room temperature after fatigue cycling was minimal, but relaxation increased significantly at elevated temperatures [24,25].
Studies have demonstrated that RS relaxation under static and dynamic loading differs in rate and magnitude. During the initial stage of fatigue loading, the RS field exhibited significant unsteady relaxation under static loads [26]. This behaviour was attributed to plastic flow dominated by dislocation movement in the surface layer material. The multi-field coupling of temperature and cyclic stress on RS relaxation was examined, and the underlying relaxation mechanisms were preliminarily analysed [27,28]. In SP ultra-high-strength steel, most surface RS relaxation occurred within the first 100 loading cycles [29]. The relaxation level decreased in subsequent cycles [30]. RS relaxation was analysed alongside microhardness, surface roughness, and other effects of SP [31,32]. Results indicated that the degree of cold working in the surface layer significantly influences relaxation [33]. In TC4 titanium alloy, compressive RS induced by wet SP relaxed when subjected to tensile loading [34].
Most studies have focused on theoretical interpretation of experimental results, with limited research on the evolution and predictive modelling of RS relaxation in TC4 titanium alloys under fatigue loading. This study systematically investigates the RS relaxation in SP TC4 specimens under cyclic loading using numerical simulations and experiments. The fatigue behaviour and RS relaxation at the surface and subsurface depths were examined. Based on simulation results, a predictive model for RS relaxation was developed, and its reliability was validated through experimental testing.
2. SP Experimental and Numerical Simulations
2.1. Materials and Specimens
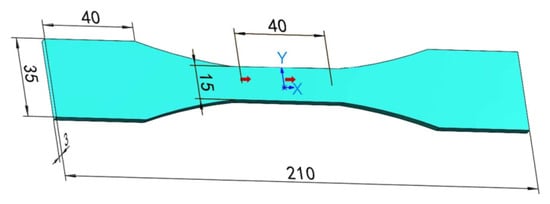
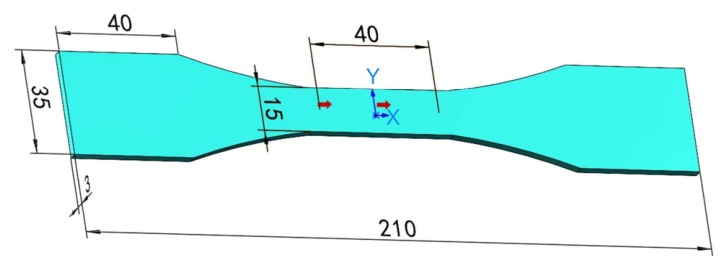
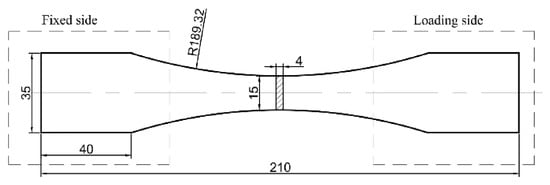
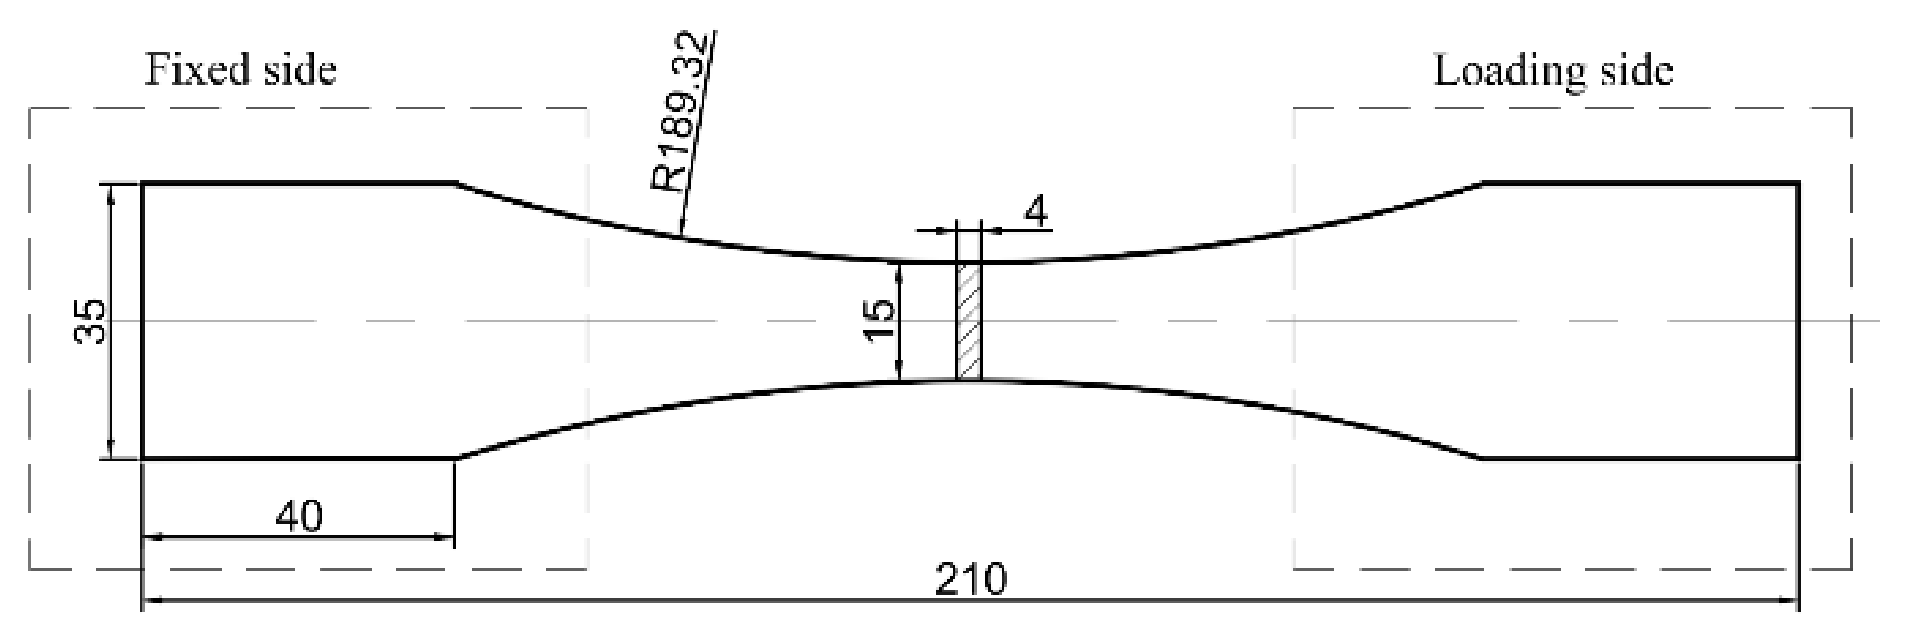
The study was undertaken on TC4 titanium alloy used as the base material. The material was received as a plate with a thickness of 3 mm prepared in accordance with GB/T 3075-2021 [35]. Tensile strength = 895 MPa, yield strength = 825 MPa, elastic modulus E = 110 GPa, elongation c = 11%, Poisson’s ratio = 0.32. The specimens were scaled in accordance with the Airbus standard [36] as shown in Figure 1. The use of the Airbus standard was chosen because this material is commonly used in aeroplane applications and the Airbus standard was written depending on the material applied. The chemical composition of TC4 titanium alloy is listed in Table 1.
Figure 1.
Geometry of the SP specimen (mm).
Table 1.
Chemical composition of Ti-6Al-4V.
2.2. Experimental Procedures
The double shot peening treatments were applied to the specimens using FT1000-G15/1/4X-LEAP SP device (Shanghai Peentech Equipment Tech. Co., Ltd., Shanghai, China) under controlled air pressure and peening time. Standard steel shots S110 [37,38,39] were used, compliant with the SAE J444 standard [40]. Dynamic pressure was controlled at 0.6 MPa with a ±15% fluctuation rate. Table 2 shows the effective parameters of shot peening treatments.
Table 2.
Values of effective parameters on the performed SP treatments.
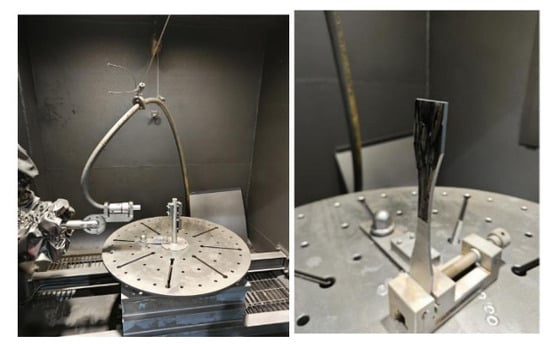
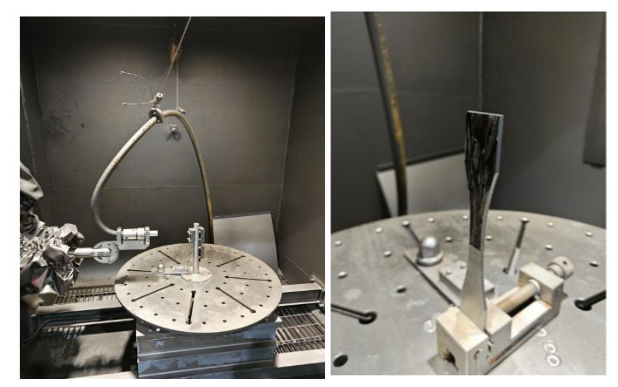
The Almen intensity was measured using Type “A” Almen strips. The specimens used for testing are shown in Figure 2.
Figure 2.
Shot peening specimens photograph.
Coverage is the extent of peening as shown by the percentage of the surface exhibiting a uniform impact pattern of overlapping indentations. SAE J2277 [41] defines full coverage as being equivalent to 98% actual coverage. Hence, this level of coverage was considered to be full coverage in the present study.
The different SP intensities with 100% peening coverage are listed in Table 3. SP1 and SP2 are experimental group numbers. The intensity of shot peening for SP1 and SP2 is 0.1 mmA and 0.2 mmA [7,29]. Two groups of specimens were used, each comprising three samples.
Table 3.
SP intensity and coverage.
2.3. RS Measurements
To study the state of residual stresses on the surface of the specimens, XRD analysis was applied using Proto-iXRD stress analyzer (Proto Manufacturing Ltd., LaSalle, ON, Canada). Residual stress was characterised in depth by the fixed incidence angle method and calculated by the “sin2Ψ” method.
The stress analyzer operated at 20 kV and 0.4 mA, with an X-ray spot diameter of 2 mm for the irradiation area. The tilt angles were set to 0.0°, −45.0°, and 45.0°, and the diffraction angle was 140° with a scanning step size of 0.10°. Electro polishing was selected as the method to drill the surface from 0 μm to 200 μm to measure residual stress in depth through the step of removing a very thin layer of material.
2.4. Finite Element Method–Discrete Element Method (FEM–DEM) Coupled Numerical Simulation of SP Process
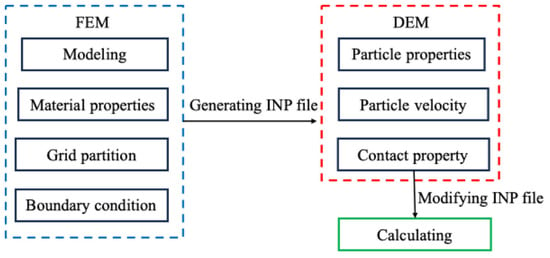
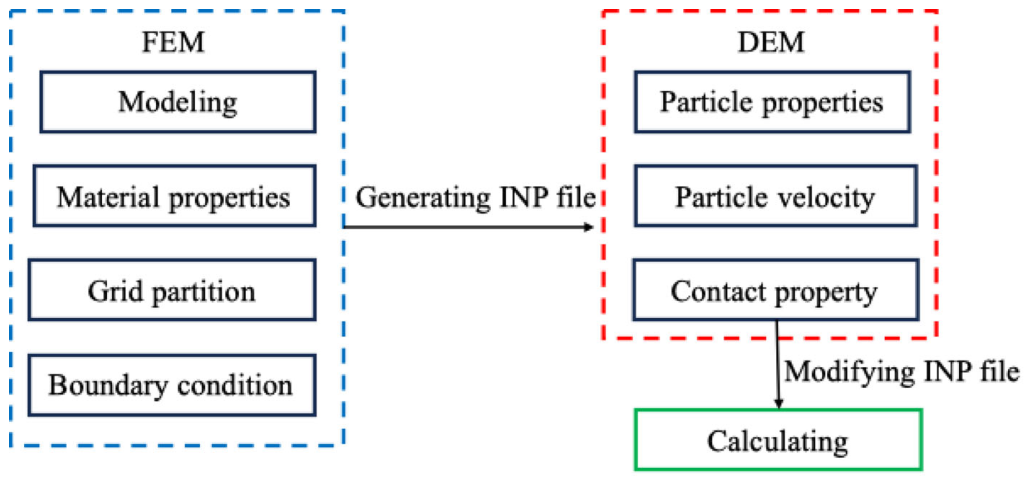
Figure 3 illustrates the coupled FEM–DEM numerical simulation. Particle flow parameters were controlled using a discrete element particle generator embedded in ABAQUS, and independent strategies for each were adopted in the input file, in which the finite element module retained continuous medium characteristics, while the discrete element module specified particle attributes independently.
Figure 3.
FEM–DEM coupled modelling process of SP.
The geometric model was constructed using ABAQUS Explicit software (2021). The elastoplastic model, boundary constraints, and contact pairs were defined. The mesh was then refined locally to improve accuracy.
The Johnson–Cook [42,43] constitutive equation was used to describe the dynamic response of the material as follows:
where A, B, n, C, and m are experimentally determined material constants. and represent the current and reference strain rates (). is the homologous temperature, defined as , where and are the melting and room temperatures, respectively. For TC4, the parameters A = 1098, B = 1092, n = 0.93, C = 0.014, and m = 1.1 were used [44]. Thermal effects were neglected in this simulation.
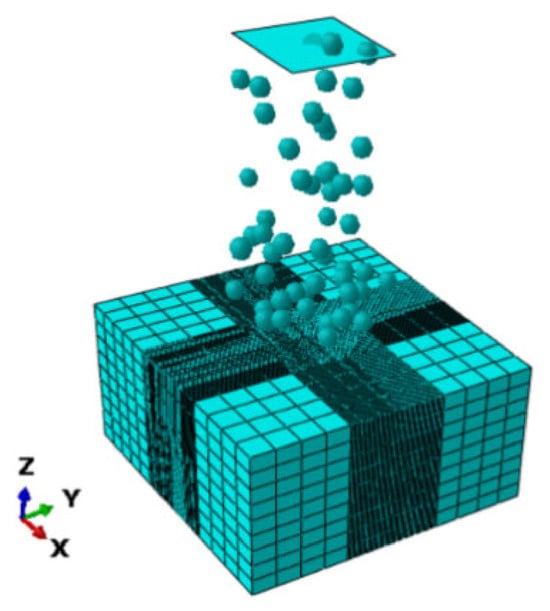
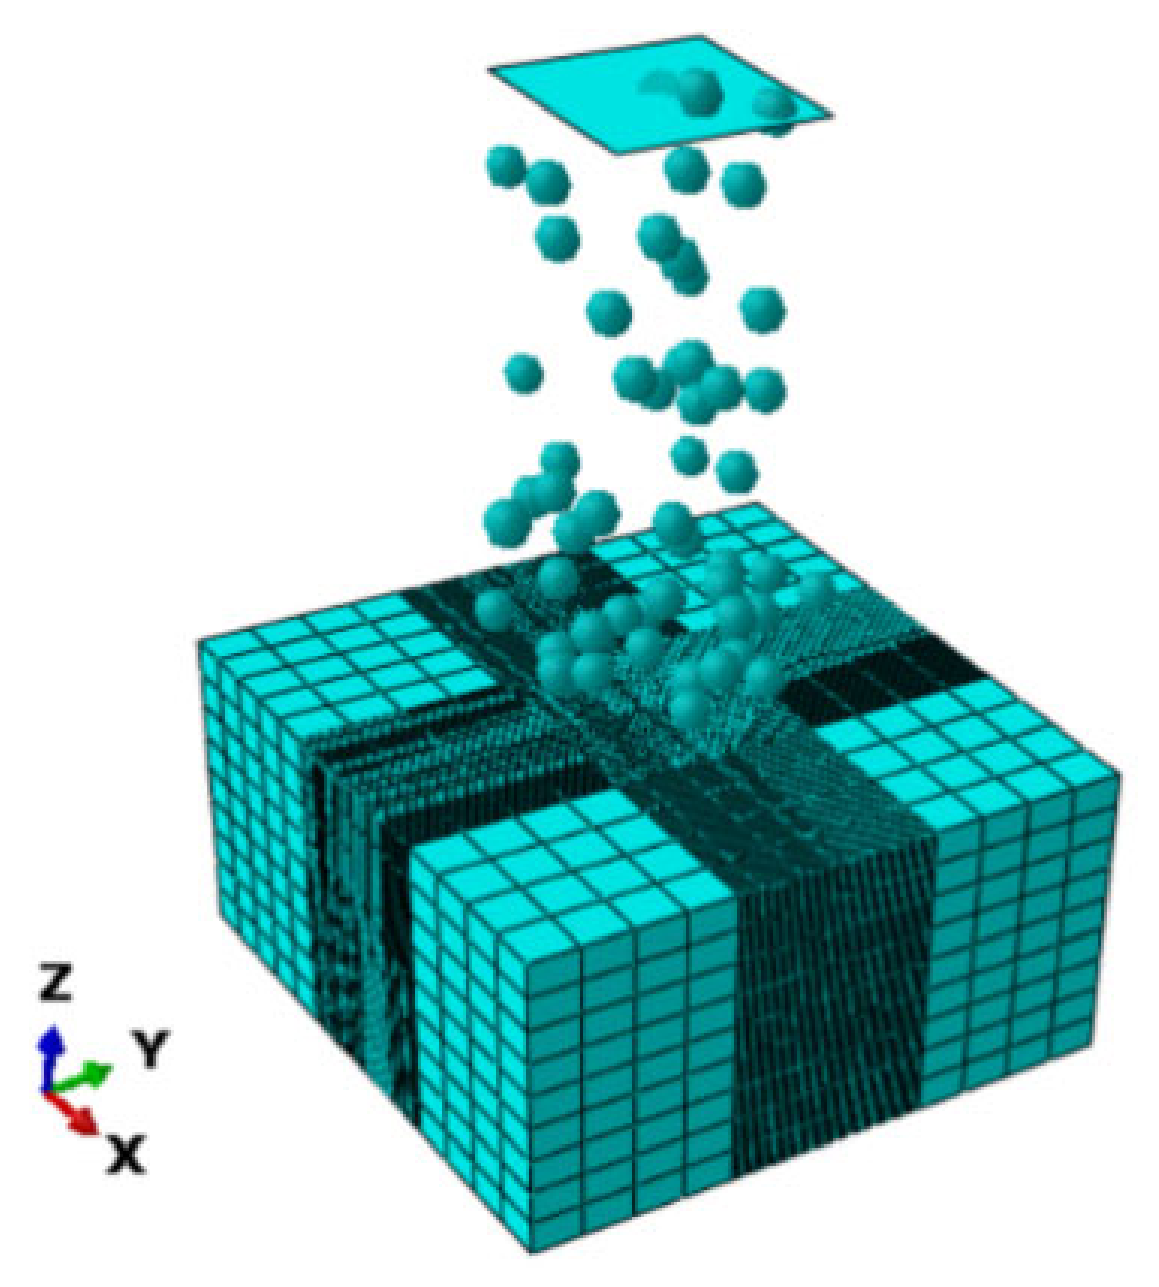
The dimensions of the target plate were 3 mm × 3 mm × 1.5 mm. Discretisation was performed using the C3D8R hexahedral-reduced integration elements. Local mesh refinement was performed within a 1 mm × 1 mm contact area after mesh convergence analysis. resulting in a non-uniform mesh with 18,954 nodes and 16,900 elements. In all FE simulations, the bottom of the workpiece was fixed. Figure 4 shows the finite element model.
Figure 4.
FEM–DEM coupled model of SP.
2.5. Comparison Between Simulation and Experiment
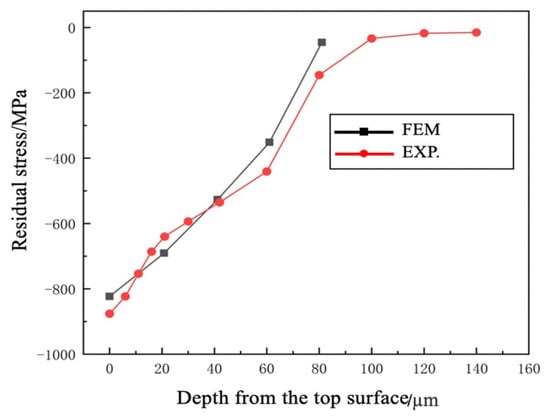
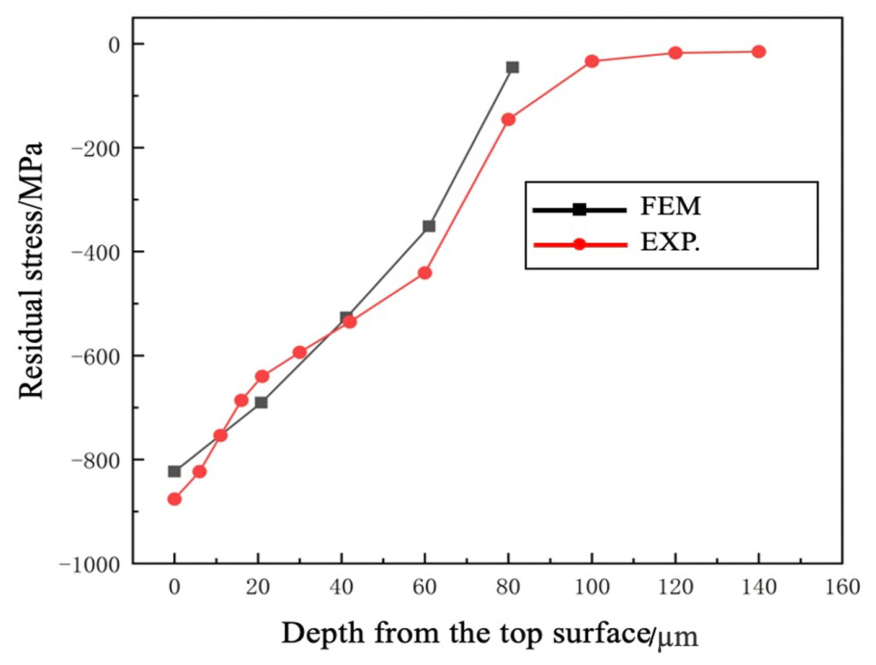
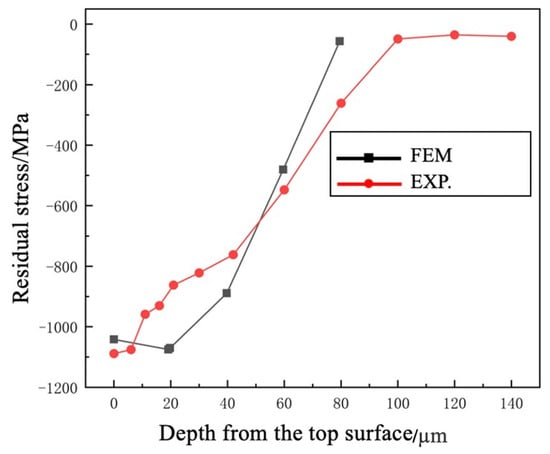
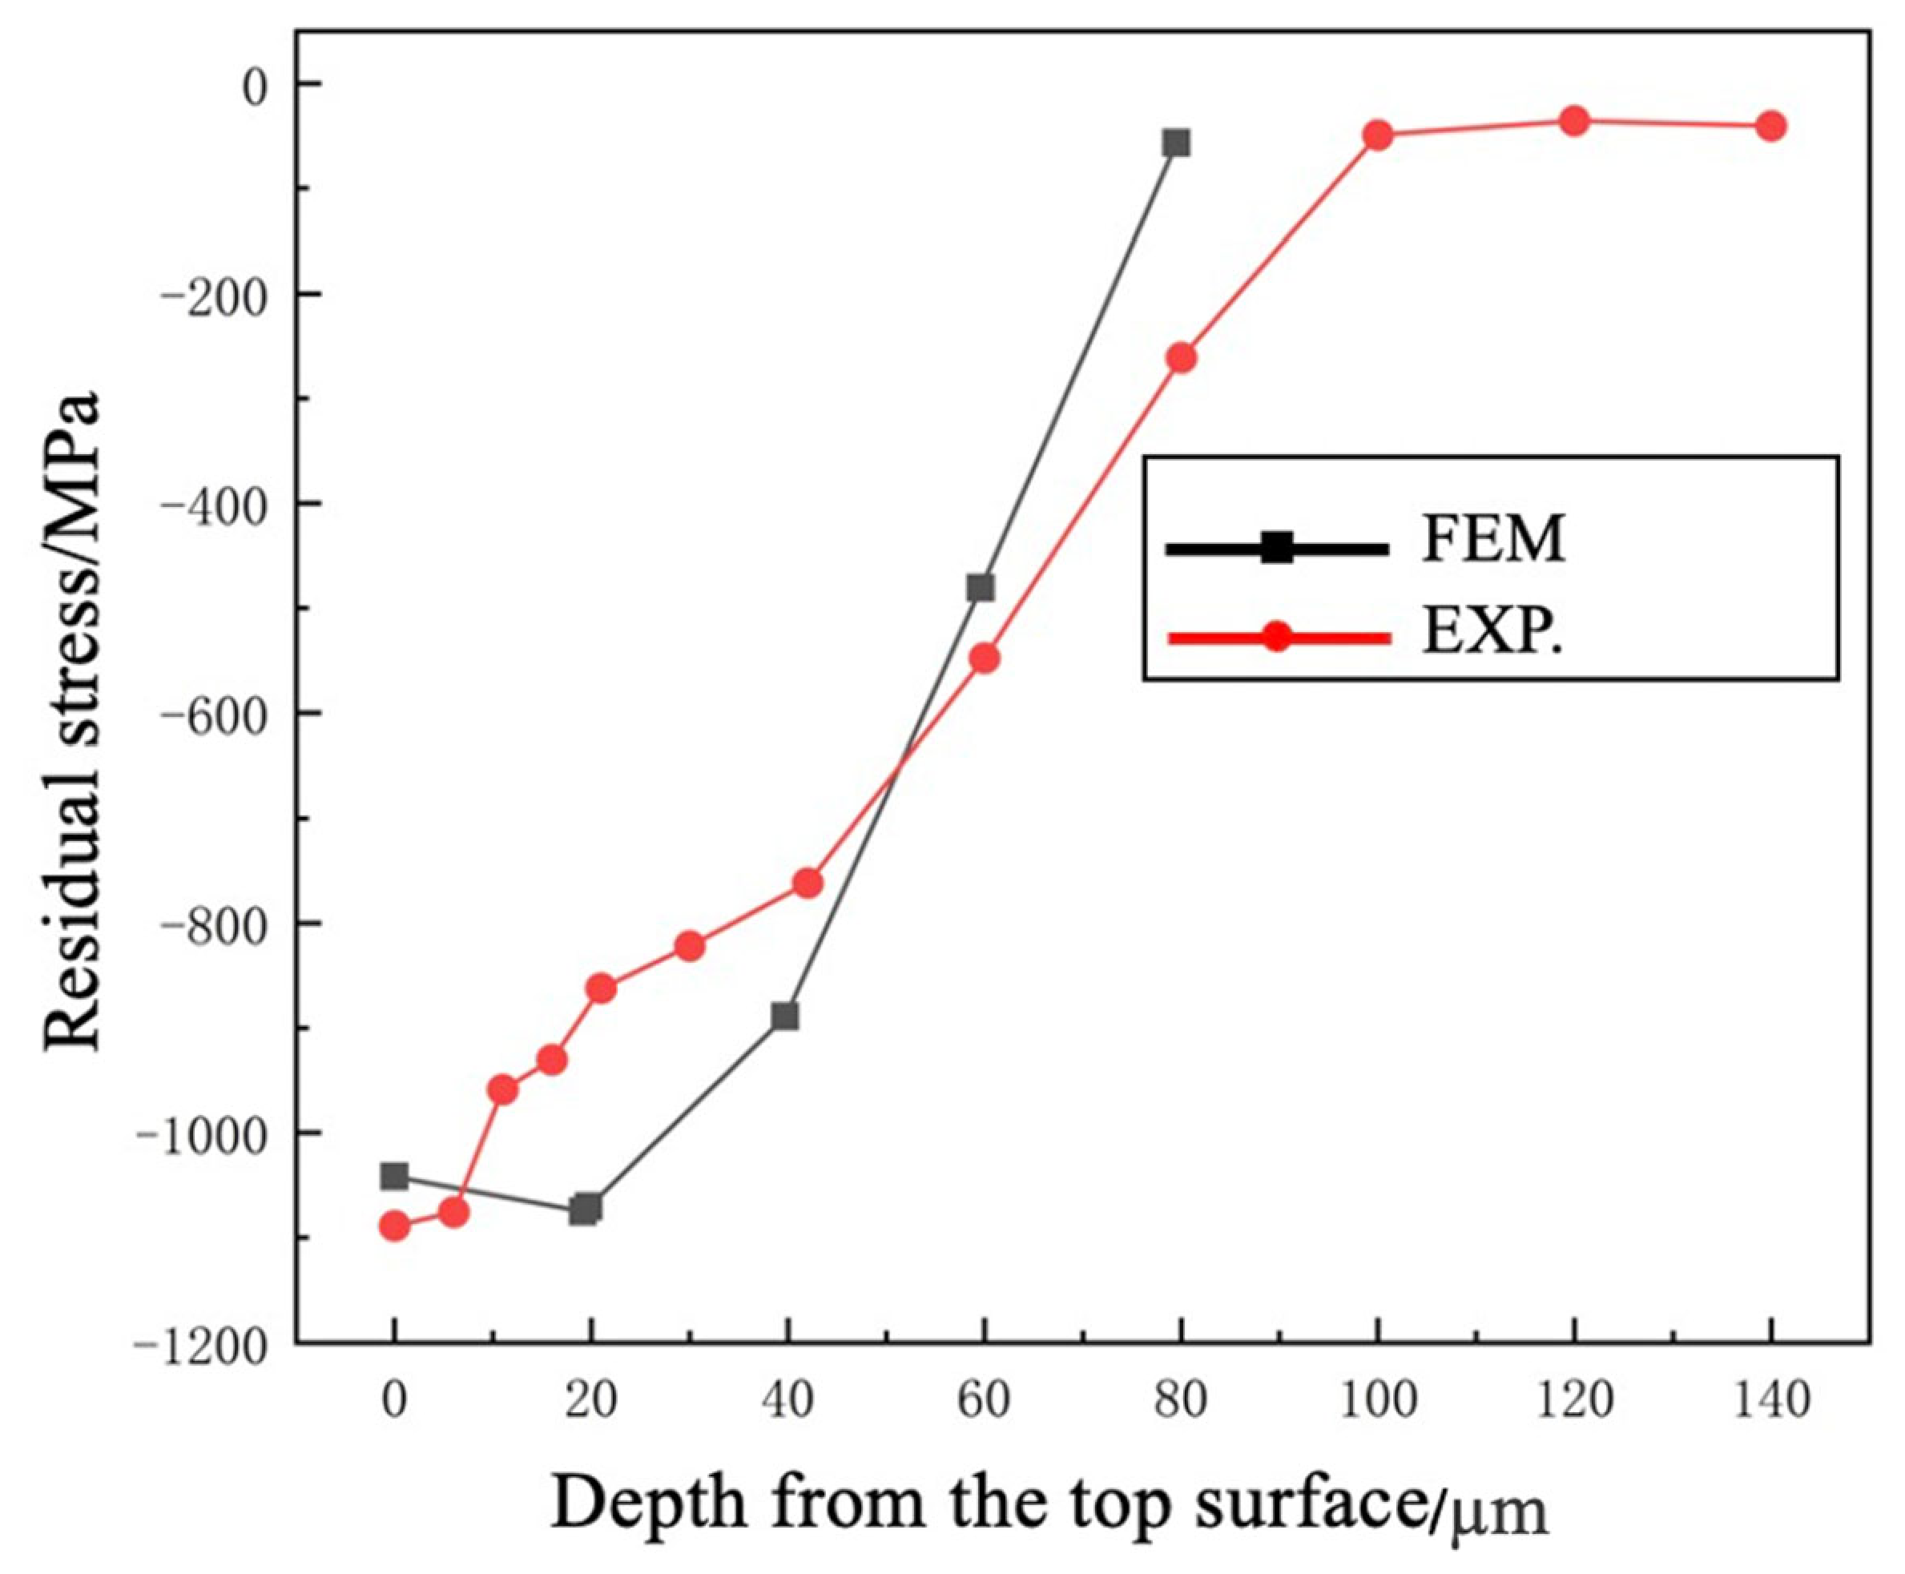
The simulation results of residual stress were compared with the experiment to validate the FE model. RS results were obtained from the experiments and numerical simulations. Figure 5 and Figure 6 present the comparison results.
Figure 5.
Comparison of FEM and experimental results along the depth of the SP1 specimen.
Figure 6.
Comparison of FEM and experimental results along the depth of the SP2 specimen.
The numerical and experimental results are −1042.19 MPa and −1088.962 MPa, respectively, and the error is about 4.3%. The RS field distribution obtained from numerical simulation was consistent with the experimental measurements from the SP experiment. The deviation of the RS peak was within 16%. Comparative analysis indicates that the FEM–DEM coupling model can accurately characterise the three-dimensional distribution of RS after SP, especially in the range of a 0–200 μm characteristic depth. The coupling method has a reliable engineering prediction ability for the evolution of SP-induced RS.
3. Simulation of RS Relaxation Induced by SP
3.1. Simulation Process
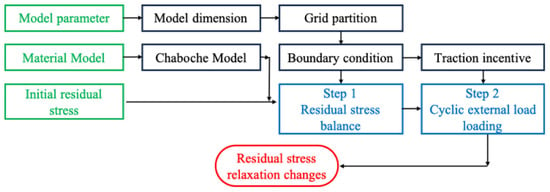
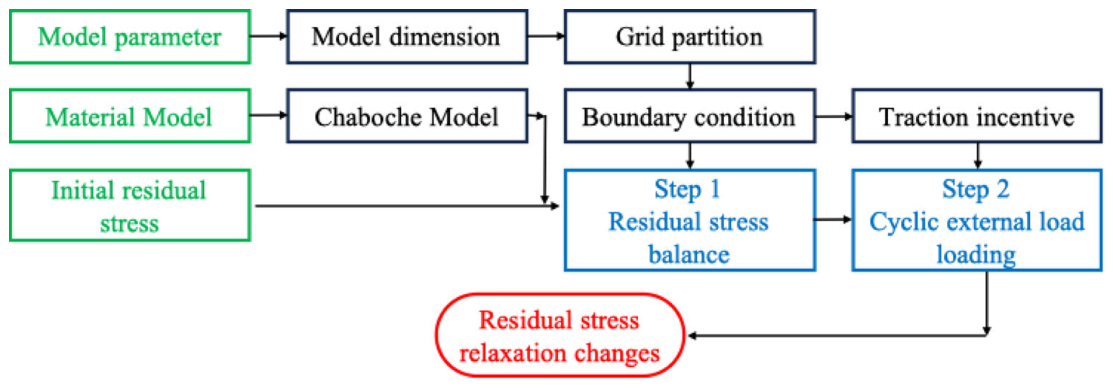
For the simulation of RS relaxation induced by SP, a geometric model was established based on the specimen, with the key region extracted for simulation according to the symmetry relationship. Local mesh refinement was applied, and the material constitutive model was defined. The RS distribution of shot peening was imported as the initial boundary condition into the finite element analysis model. Boundary conditions, including external loads, were applied according to the operating parameters, and the simulation was performed on the model. An FE model was constructed to capture the evolution of RS under varying cycle periods. Figure 7 illustrates the RS relaxation simulation scheme.
Figure 7.
Scheme for RS relaxation simulation.
3.2. Finite Element Modelling
A standard dumbbell-shaped flat specimen, shown in Figure 8, was used in the simulation. SP treatment was applied to both surfaces, and the central region was designated as the RS measurement zone. In the process of finite element simulation modelling, a computational model was constructed based on the plane strain assumption. Mesh complexity was reduced through geometric simplification.
Figure 8.
Geometry and loading state of the SP specimen for simulation (mm).
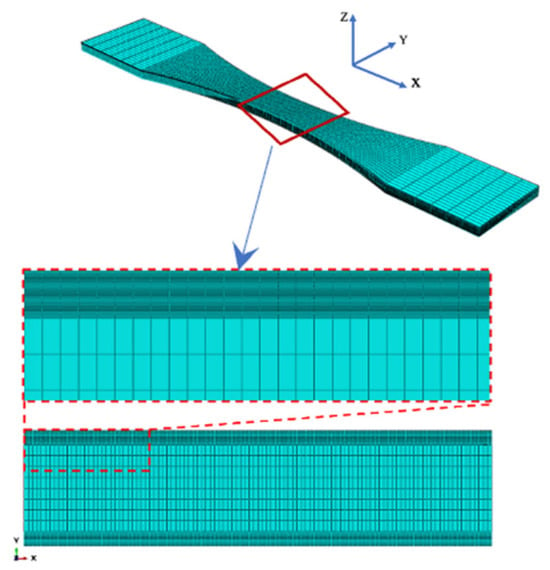
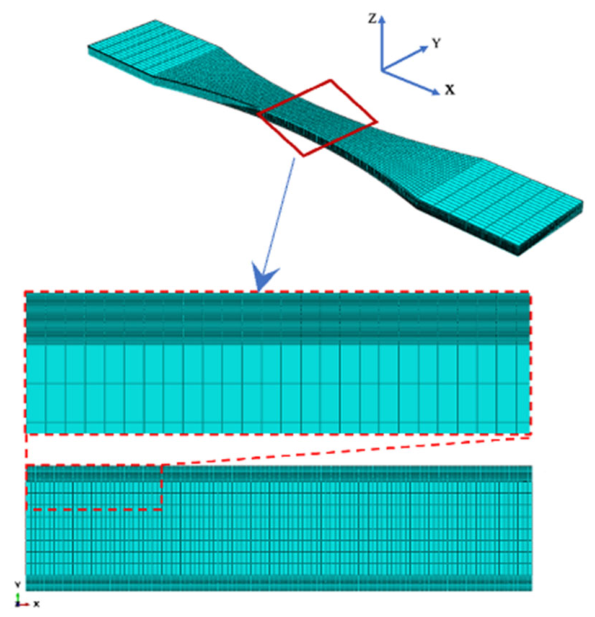
In this study, XRD was applied to study the residual stresses. Mesh independence was validated to minimise errors caused by mesh quality and will not be further elaborated here. A quarter model was employed for the numerical simulation due to the geometric symmetry of the specimen. The model dimensions were 16.25 mm × 4 mm. A CPE4 four-node plane strain-reduced integration element was selected. The initial element size of the global mesh was set to 0.01 mm × 0.1 mm. Local mesh refinement was applied within a depth of 0.4 mm from the surface. The refined element size was 0.01 mm × 0.01 mm, with an aspect ratio of 1:1. Figure 9 illustrates the local mesh refinement. The total number of elements was reduced by approximately 70% while maintaining accuracy in key regions, thereby improving computational efficiency.
Figure 9.
FE model.
The simulation data of residual stress were used and defined as initial stresses to all the nodes at the corresponding depth of the specimen. In the SP process, the values of residual stress in the X and Y directions are assumed to be homogeneous. It is an equi-biaxial stress state [26,45]. Therefore, the residual stress along the X direction was the output parameter, shown in Figure 9.
To simulate the rigid clamping of the testing machine, the left end of the specimen was fully constrained (U1 = U2 = U3 = 0). Reference point PR1 was defined at the geometric centre of the right-end face to apply the coupling constraint, as shown in Figure 10. The left-end face was fully fixed, rather than partially constrained, to prevent stress distortion from released degrees of freedom.
Figure 10.
Boundary conditions and loading.
A cyclic sinusoidal tensile load P(t) was applied at reference point PR1. The applied load was expressed mathematically as follows:
where A0 represents the mean stress amplitude, B represents the amplitude of the cyclic tensile external load, t represents the loading time, and w represents the variation in the loading frequency.
3.3. Chaboche Kinematic Hardening Model
For engineering applications, the constitutive model proposed by Chaboche was adopted to describe the stress–strain response of the TC4 titanium alloy under cyclic loading by defining the yield surface, flow rule, hardening rule, and critical state. The Chaboche model is based on the von Mises yield criterion, which governs plastic yield behaviour under cyclic loading.
(1) Non-linear kinematic hardening criterion
The overall back stress comprises multiple components, whose evolution is defined as follows:
where C represents the hardening parameter, and the evolution of due to plastic straining is directed along the current radius vector from the centre of the yield surface . Conversely, the contribution due to temperature change is directed toward the origin of stress space.
Nonlinearity is introduced by incorporating a relaxation term into the linear hardening criterion.
where α0 represents the initial back stress.
where represents the total strain, and E represents the Young modulus.
(2) Isotropic hardening model
The isotropic hardening component of the Chaboche model [42,46,47] was used to describe the material-hardening phenomenon during the early stages of cyclic loading. The evolution equation is expressed as Equation (6):
where represents the yield stress at zero plastic strain, and and b are determined through nonlinear fitting of experimental data (,), where represents the peak tensile stress for the cycle and represents the corresponding equivalent plastic strain; defines the maximum variation in the yield surface size, while b represents the rate of peak stress change with plastic strain development.
(3) Modelling the elastic–plastic behaviour of the material
This study used TC4 titanium alloy as the test material. The kinematic hardening parameters of the model were calibrated using the equivalent stress–plastic strain curves of each phase of the alloy.
where and are material parameters, defines the maximum change in back stress, and represents the rate of back stress evolution with increasing plastic strain. The Chaboche model parameters of TC4 alloy with three backstress components are obtained by Li et al. in Ref. [44], with the following properties: E = 110 GPa, , 109,585 MPa, , , = 1956.38, = 41.21, , , b = 7.2 respectively.
3.4. Establishment of Initial RS
The initial RS field was defined through a Fortran programming interface using the SIGINI subroutine in ABAQUS software.
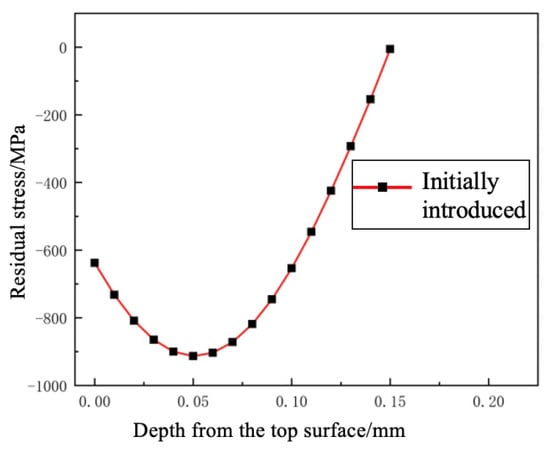
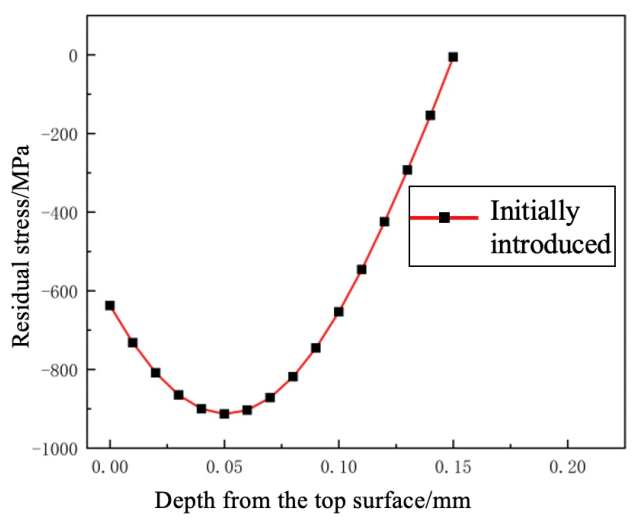
A depth-dependent RS model was generated for the SP specimens, producing a representative stress–depth curve. The initial stress field was formulated and subsequently verified through RS measurements using XRD. The RS distribution with depth, obtained under a SP intensity of 0.1 mmA and nominal velocity of 100 m/s, is shown in Figure 11.
Figure 11.
Initial RS distribution in depth induced by SP.
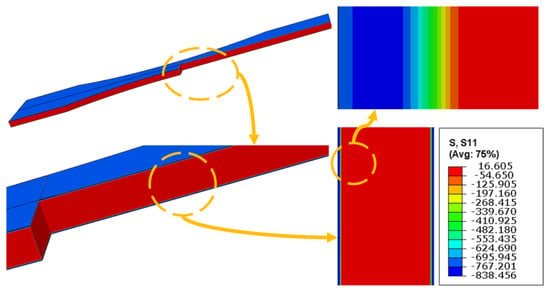
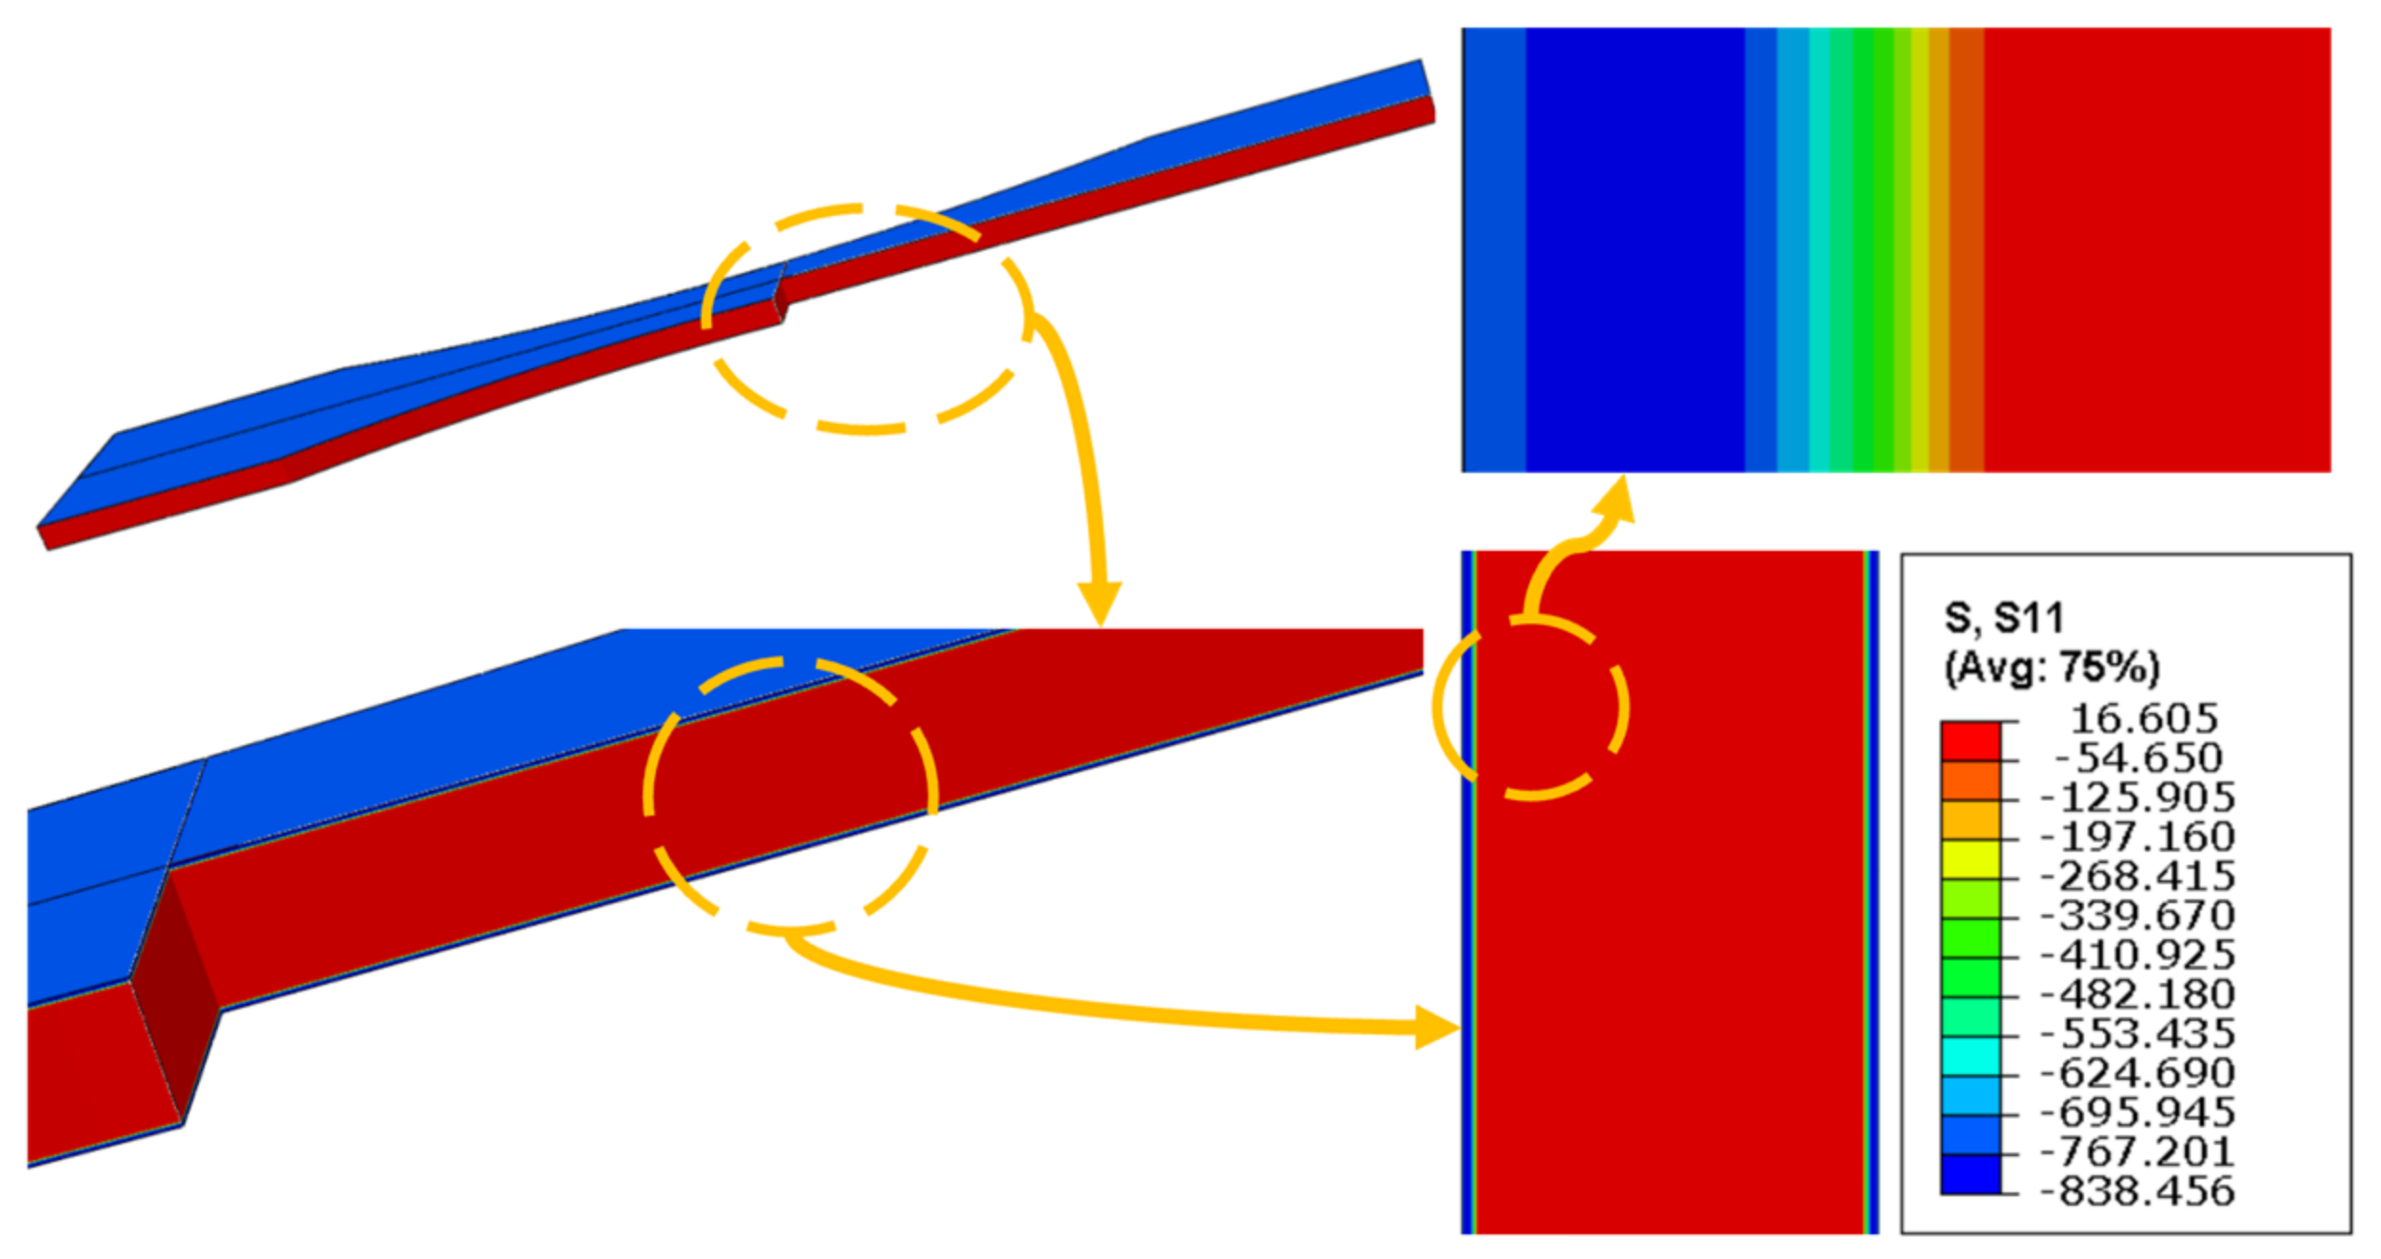
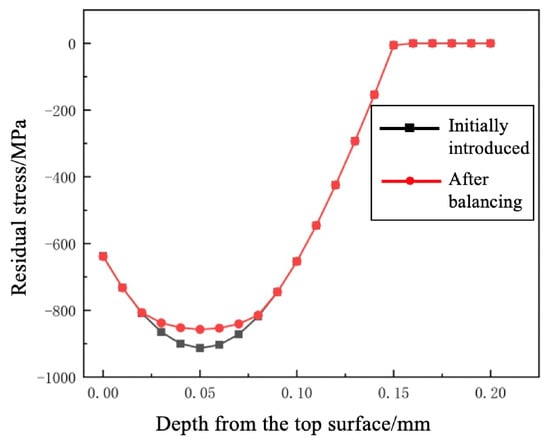
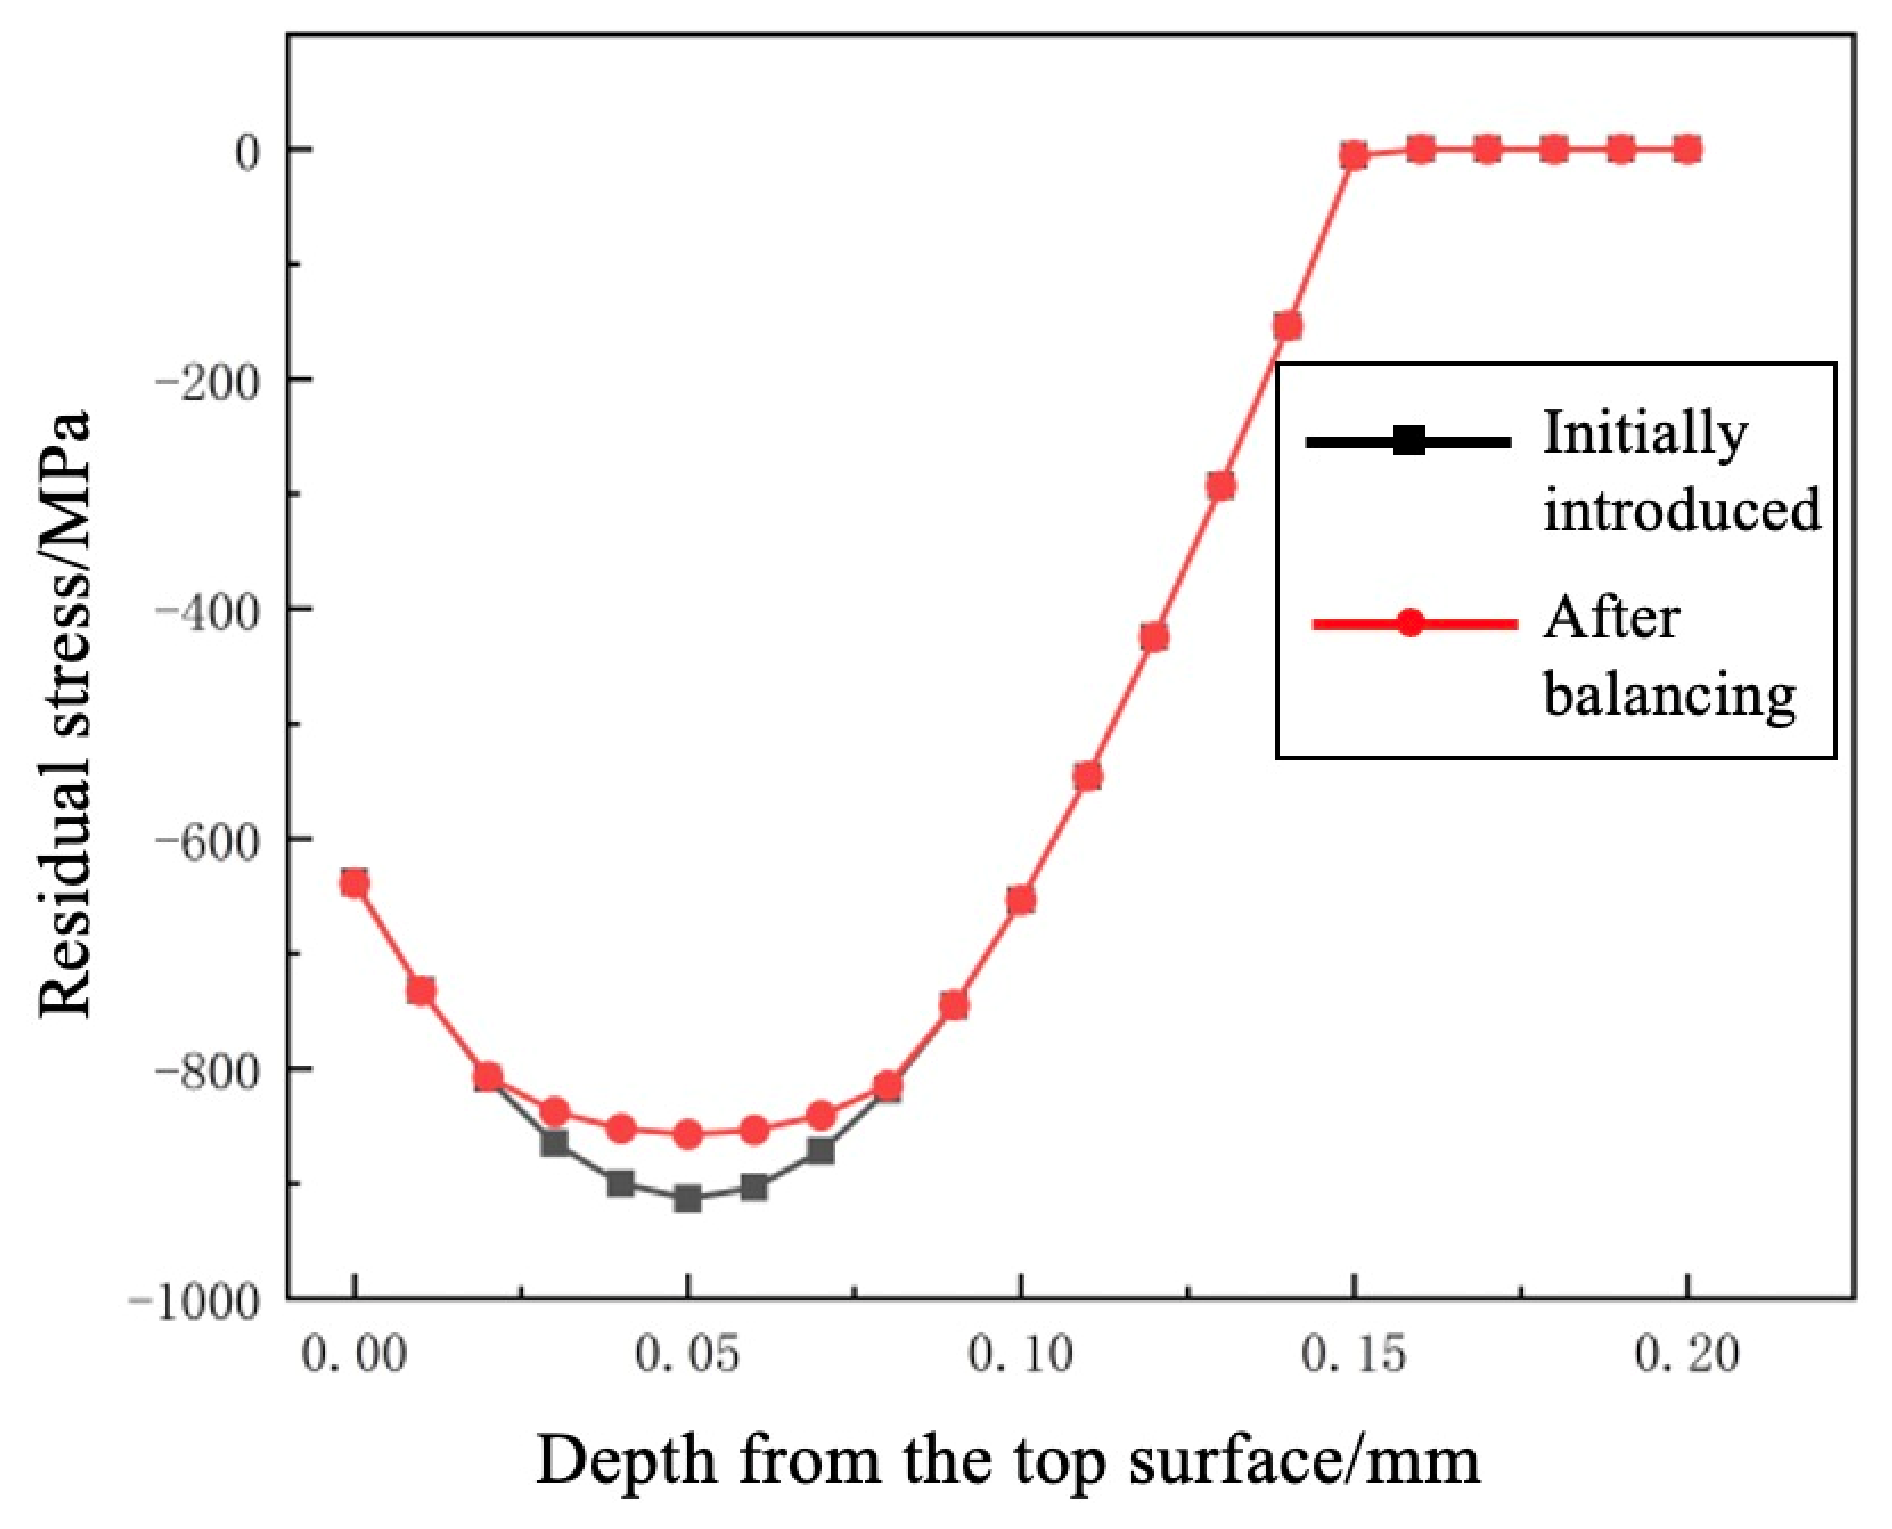
Stress equilibrium was calculated using static finite element analysis. The balanced RS was then adopted as the initial RS. The RS profiles before and after balancing were identical, with no significant changes observed. The FEM stress contour is shown in Figure 12, while Figure 13 compares the RS before and after equilibrium.
Figure 12.
Distribution of the initial residual stress.
Figure 13.
Comparison between the initial RS and after equilibrium.
3.5. RS Relaxation Analysis
RS relaxation in SP materials is governed by the applied loading [30,48,49], stress gradient, and constitutive properties.
(1) Effect of applied loading
RS relaxation exhibited a significant nonlinear dependence on the applied load. The behaviour can be classified into three regions, defined by the ratio of superimposed stress to the yield strength of the material. In the low-load region (σᵣ < 0.4σy), the superposition of applied stress and RS remains within the elastic range. Dislocation slip inside the material was restricted, with a relaxation rate of less than 5%. In the medium-load region (0.4σy < σᵣ < 0.7σy), the superimposed stress approached the yield strength. Local plastic deformation developed on the surface of the SP layer. The relaxation rate increased to 15–30%, with the relaxation diminishing exponentially as the number of loading cycles increased. In the high-load region (σᵣ ≥ 0.7σy), the superimposed stress greatly exceeded the yield strength. Plastic deformation penetrated the entire SP layer, and the RS relaxation rate reached approximately 50%. The relaxation behaviour transitioned from being dominated by dislocation slip to a synergistic effect of grain rotation and microcrack propagation [30,48,49]. In this study, the applied load intensity was selected between the medium- and high-load regions (approximately 0.7σy).
Static load relaxation occurs under the following conditions:
where denotes the residual compressive stress from SP (negative value), and represents the externally applied load stress. When the superimposed stress reached , the yield strength of the material, secondary plastic deformation occurred in the SP layer.
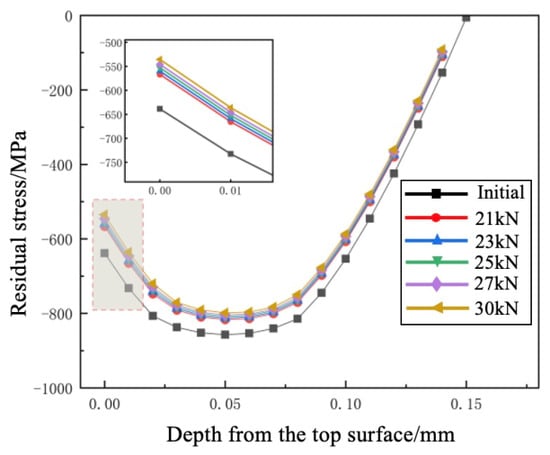
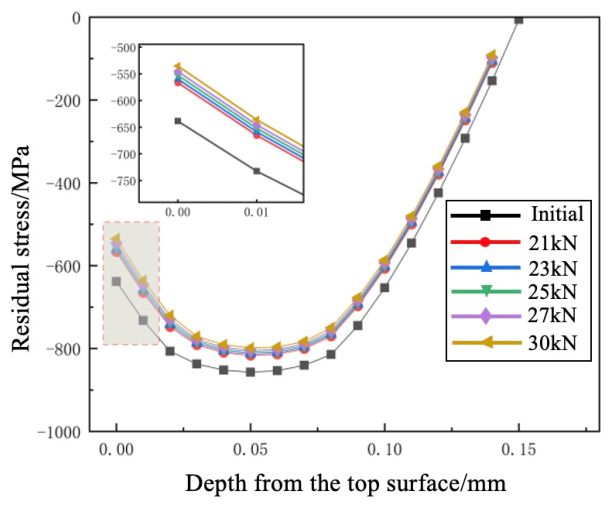
To investigate the influence of static load relaxation on the relaxation of RS in TC4 titanium alloy, specimens were subjected to different external load intensities for analysis. The initial RS corresponds to the SP1 SP condition, and the results under different loadings are presented in Figure 14.
Figure 14.
The relation between applied loading and RS relaxation in SP.
RS relaxation showed a strong correlation with loading amplitude. Under low-amplitude cyclic tensile loading, stress relaxation was minimal. As the load amplitude increased, the RS decayed rapidly. Elastoplastic constitutive analysis indicates that this relaxation mechanism arises from the double-yielding effect of the composite stress. When the equivalent stress, formed by the vector superposition of the residual and external load stresses, exceeds the dynamic yield limit, secondary plastic flow occurs in the subsurface. This redistribution process facilitates self-coordination of the RS field via dislocation slip. Consequently, a new stress equilibrium is established within the SP layer, accompanied by RS relaxation and redistribution.
(2) The number of loading cycles
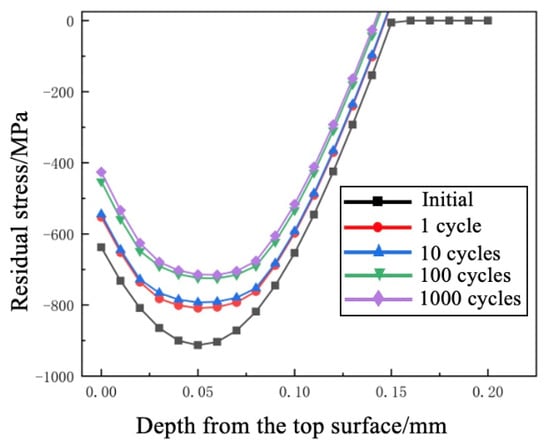
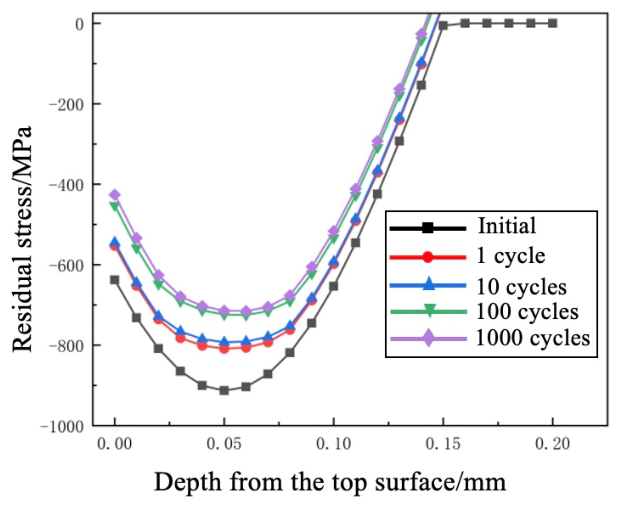
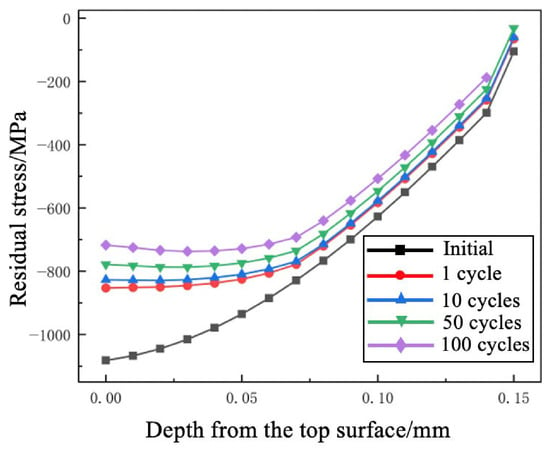
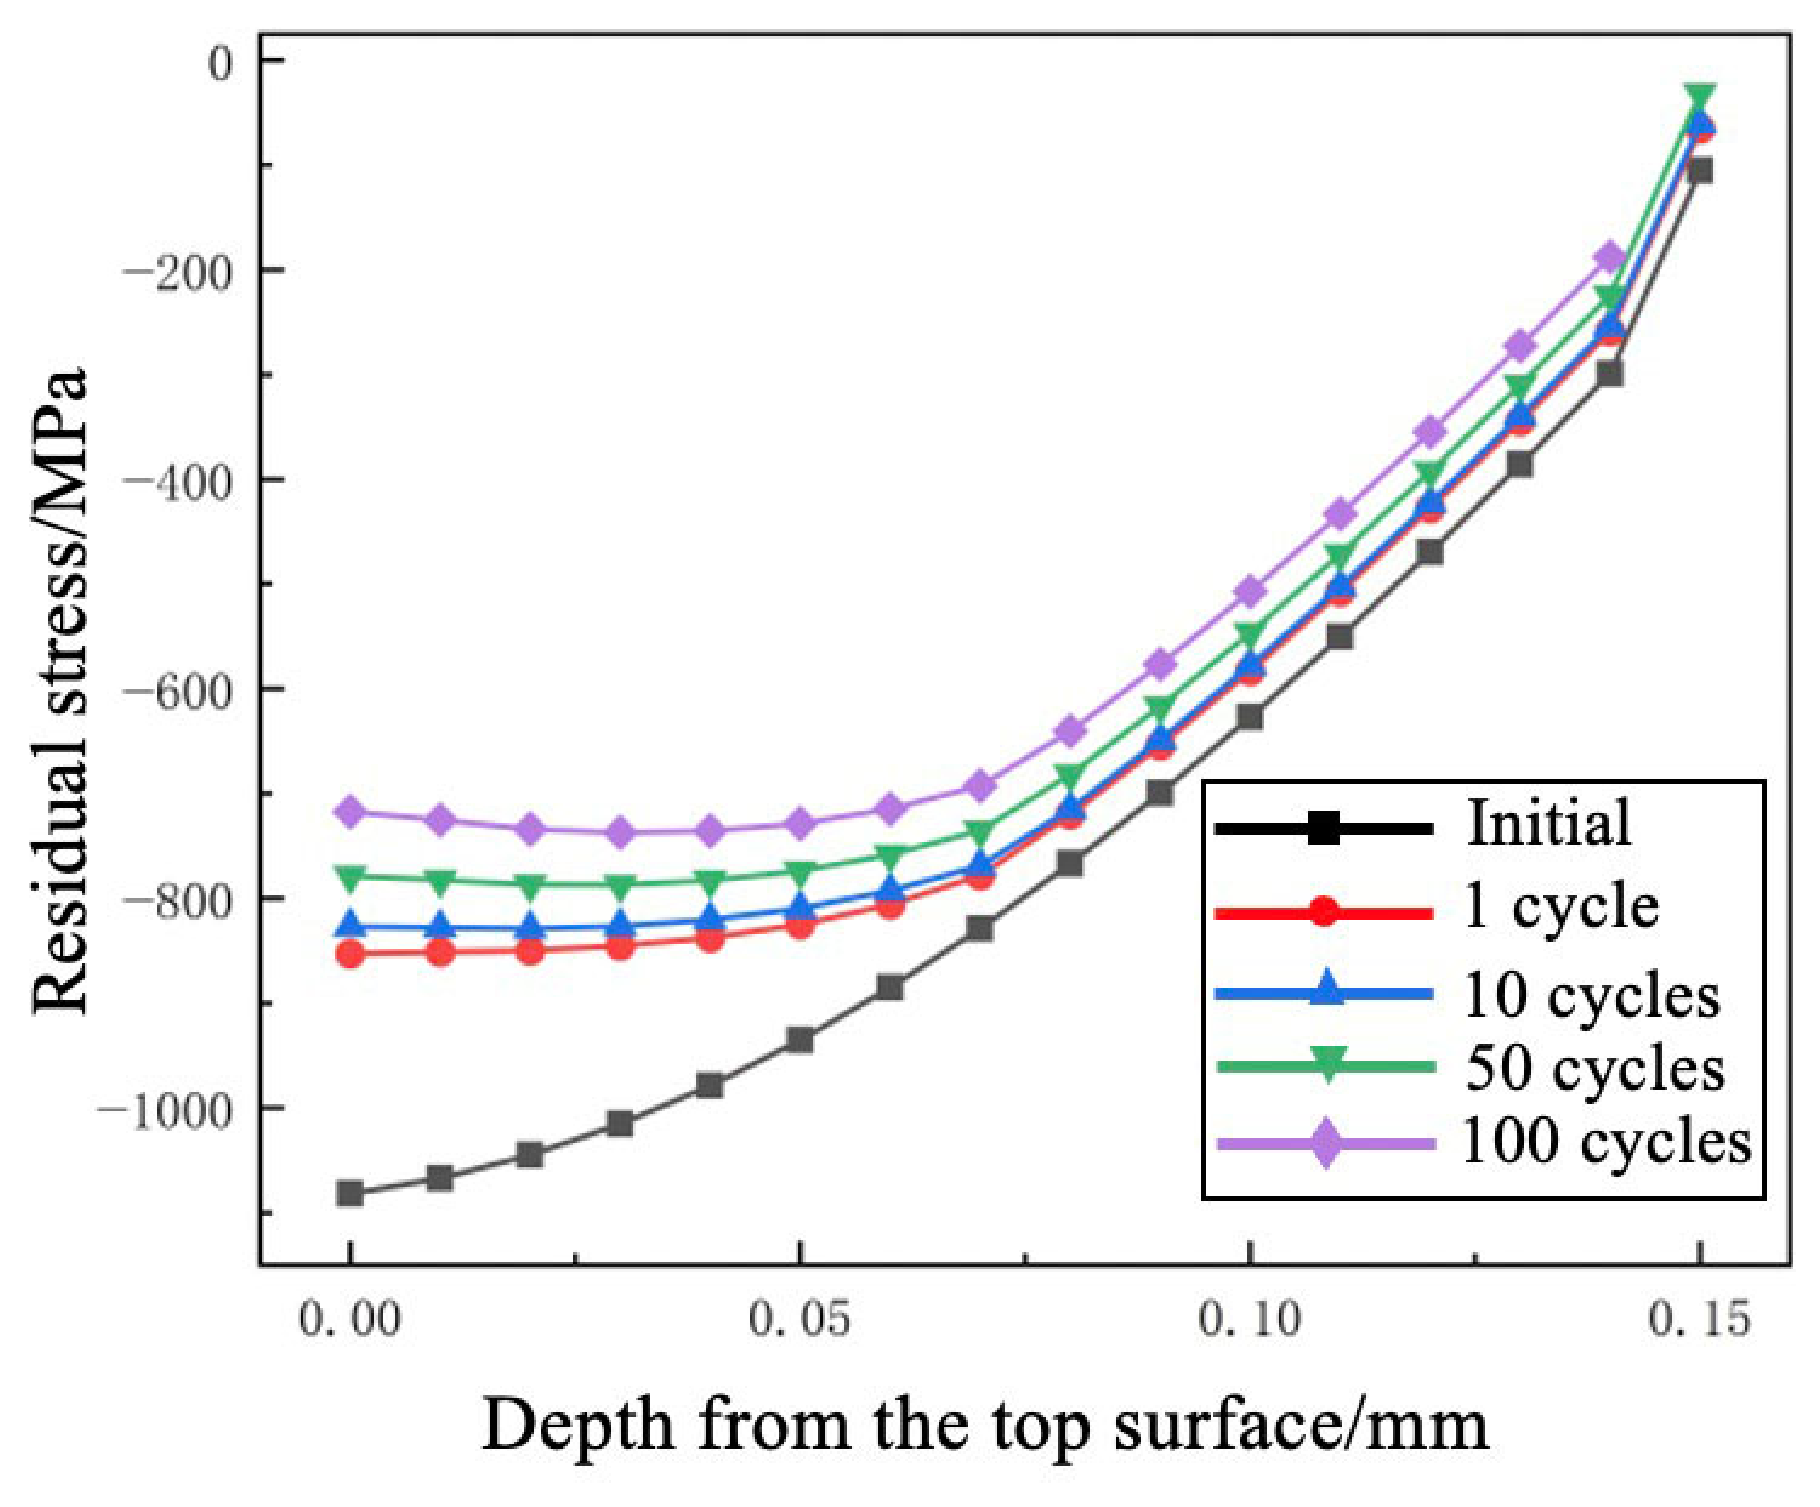
The evolution of the RS with increasing load cycles under the two SP intensities (SP1 and SP2) was evaluated. Figure 15 and Figure 16 present the relaxation of the RS with increasing cycles under an external load of 27 kN.
Figure 15.
RS distribution at different numbers of cycles for SP1 specimens.
Figure 16.
RS distribution at different numbers of cycles for SP2 specimens.
When the number of cycles was less than 1000, the RS fields of specimens (SP1 and SP2) exhibited a significant three-stage evolution. Most of the RS relaxation for the load of 27 kN was observed in the first cycle. For SP1 specimens, a relaxation of 47.2% of the initial RS was observed after 1000 cycles. For SP2 specimens, this proportion was as high as 62.3%. Thus, the RS relaxation that occurred within the first loading cycle increased with increasing load due to quasi-static relaxation effects. As the number of cycles increased to 1000, the relaxation rate followed an exponential decay and eventually stabilised after 103 cycles.
(3) Effect of RS layer depth
Figure 15 and Figure 16 show that the residual compressive stress amplitude can easily reach the highest stress in the surface layer (0~100 μm). The relaxation rate accounts for approximately 60% of the total relaxation. In the transition layer (100~150 μm), the RS amplitude decreased and then the relaxation rate stabilised. In the substrate (>150 μm), the RS approached zero. Elastic deformation was mainly generated under external loading, and the RS relaxation was negligible. In the SP layer, the amplitude of the residual compressive stress in the surface layer was high and decreased with depth. Thus, there were significant differences in relaxation behaviours among the regions at different depths.
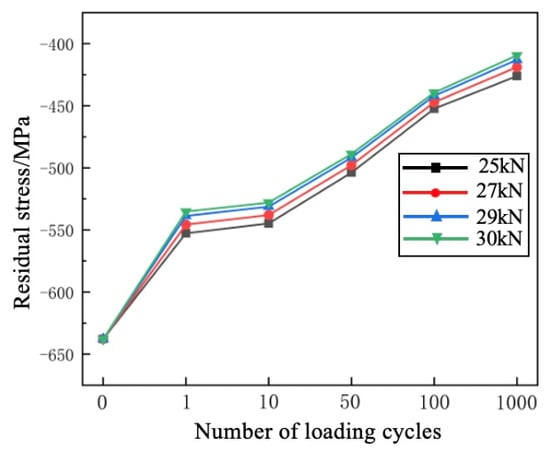
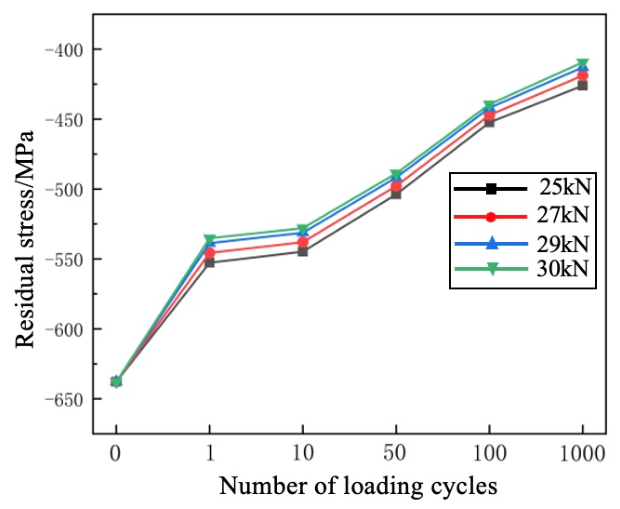
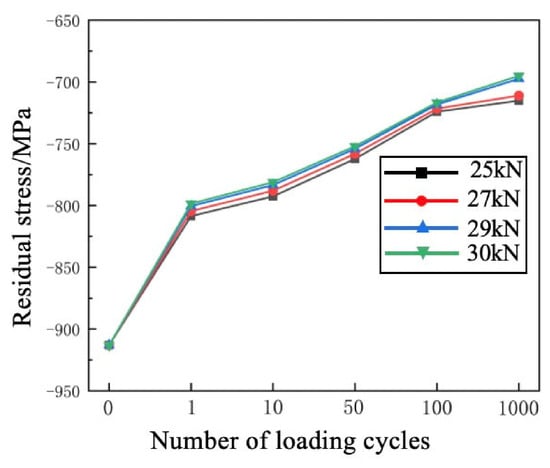
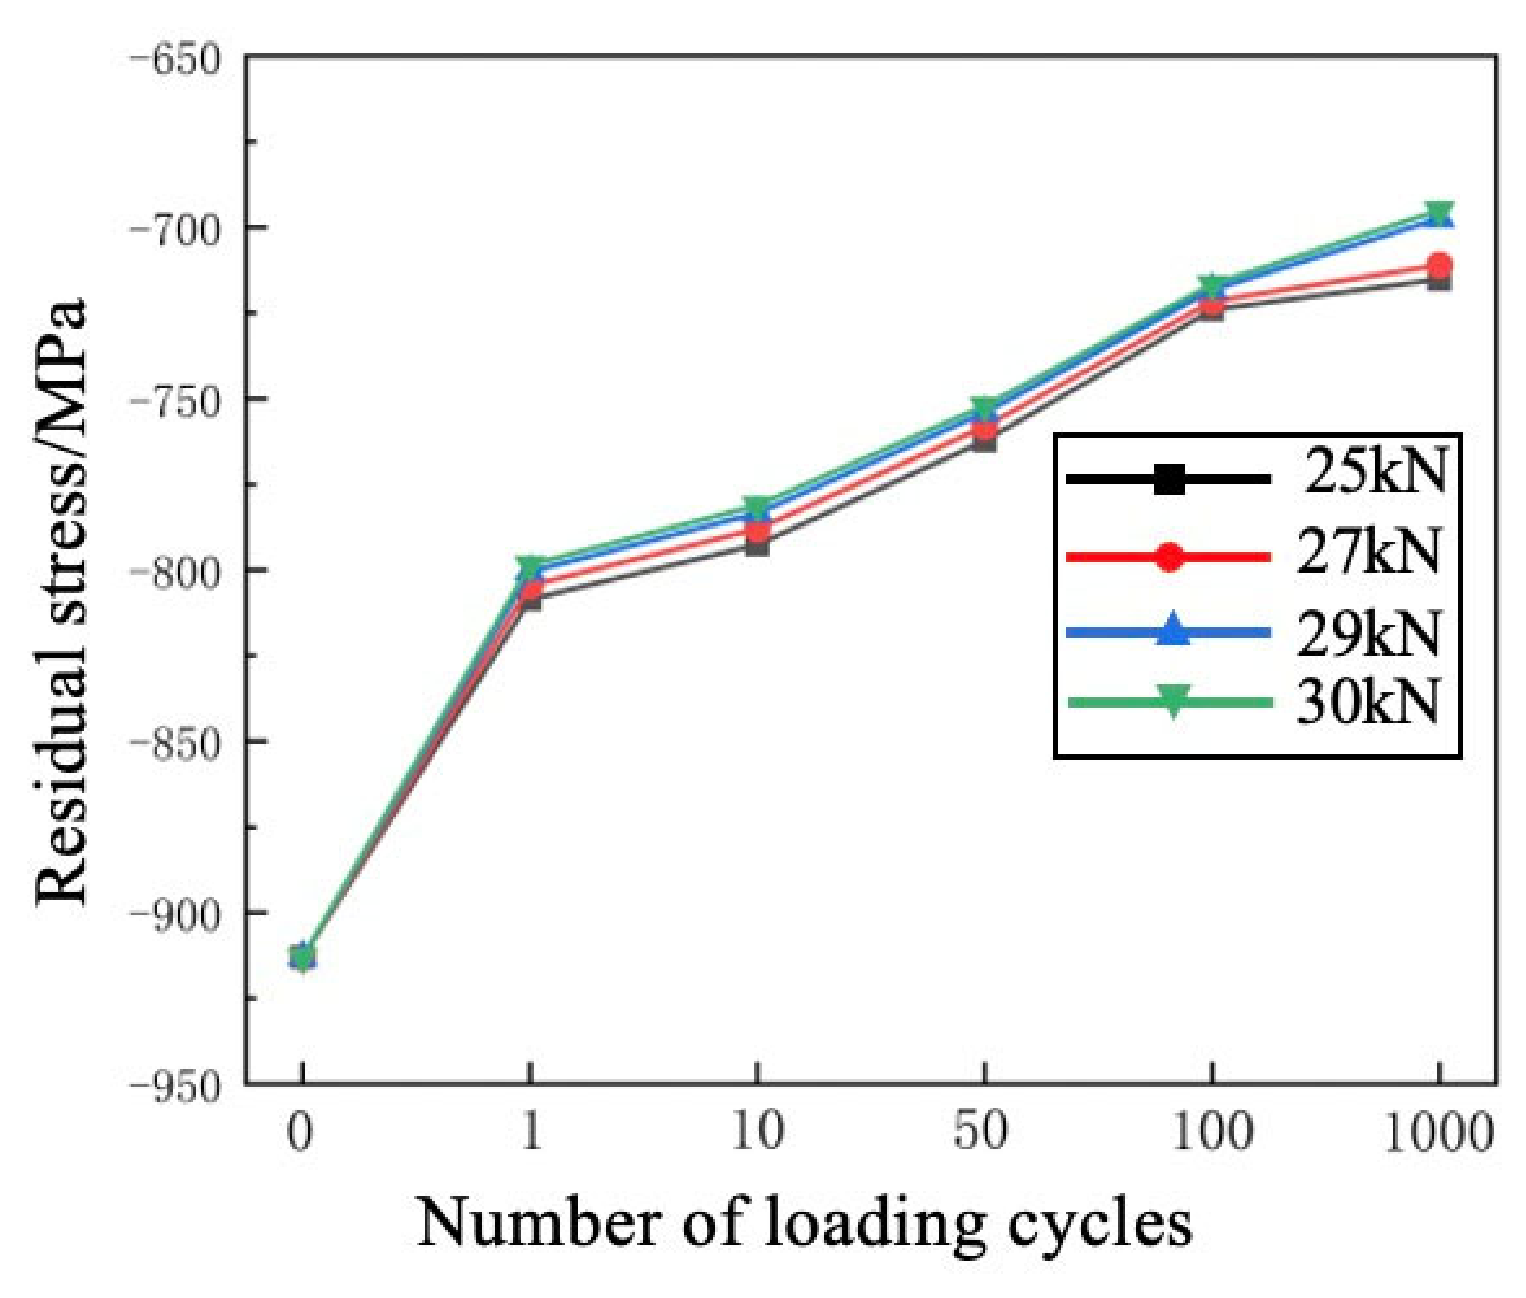
A clear spatial misalignment was observed between the peak zone of RS relaxation and the initial maximum RS zone. Considering plastic changes, the initial compressive stress peak zone, which is the region with the highest compressive plastic strain, undergoes the greatest depth-dependent change in yield strength due to the accumulated plastic strain, which in turn affects the depth distribution of the RS relaxation. The surface RS is considered as an example, as shown in Figure 17. The relaxation amount increased with an increase in the external load.
Figure 17.
Variations in surface RS under different loads.
Comparison of Figure 17 and Figure 18 indicates that the maximum RS is more prone to relaxation. The relaxation trend of the surface RS closely matched that of the maximum RS along the depth direction. The relaxation amount increased with an increase in the external load intensity, with greater relaxation observed during the early stage of low-cycle loading. The relaxation amount increased with an increase in the number of loading cycles, while the relaxation rate decreased. A marked reduction in the relaxation rate occurred after 100 cycles.
Figure 18.
Variations in maximum RS along depth under different loads.
(4) Effect of stress ratio
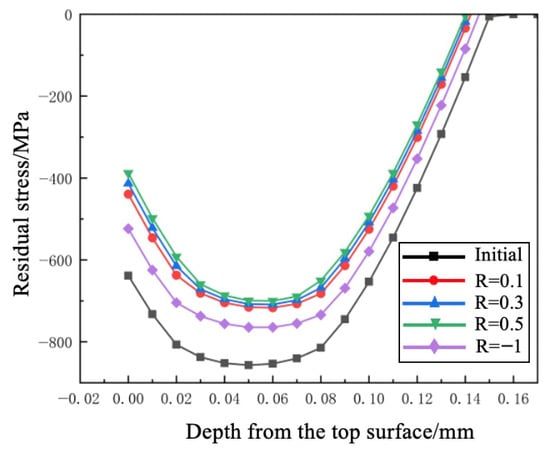
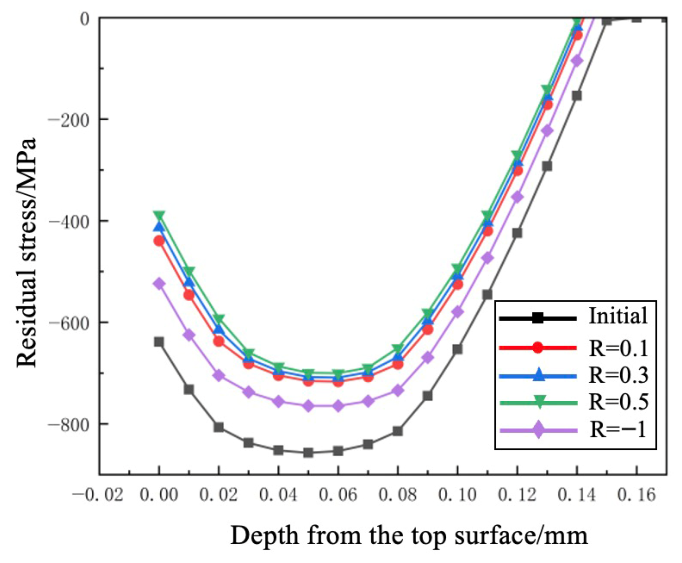
To investigate the dominant mechanism of the dynamic RS relaxation under cyclic loading, different stress ratios (R values) were applied to analyse how stress states regulate relaxation behaviour and redistribution. The simulation results are shown in Figure 19.
Figure 19.
RS distribution at different stress ratios.
Compressive loading superimposed on the surface RS field induces cyclic cumulative plastic strain in the compressive stress layer. Tensile loading combined with subsurface residual tensile stress triggers progressive plastic flow, dominated by dislocation slip in the tensile stress layer material.
For stress ratios of R = 0.1, 0.3, and 0.5, the SP surface was consistently subjected to tensile stress. Conversely, R = −1 represents symmetric cyclic loading, where specimens experienced alternating tensile–compressive loads with zero mean stress and maximum stress amplitude. As shown in Figure 19, at R = 0.5, the surface residual compressive stress decreased by 250.658 MPa. At R = 0.1 and 0.3, the stress relaxation amounts were 79.4% and 89.8% of the reduction observed at R = 0.5, respectively. RS relaxation under symmetric cycling (R = −1) was significantly lower than that under purely tensile loading (R > 0). Given that RS is dominated by compression, tensile external loading more readily creates stress superposition in the surface layer, potentially exceeding the yield limit. The RS redistribution in the SP TC4 titanium alloy showed significant load direction dependence, with relaxation occurring mainly during tensile loading.
4. RS Relaxation Experiment
4.1. Material and Test Conditions
Experiments were performed on SP TC4 titanium alloy specimens subjected to tension–tension sine wave cyclic loads via PLG-100 fatigue machine (Xi’an Letry Material Testing Technology Co., Ltd., Xi’an, China). The testing frequency was 10 Hz and a maximum cyclic stress of 550 MPa and 450 MPa respectively, with a load ratio (R) of 0.1, and the experimental conditions were conducted at room temperature. The evolution of the RS was studied and analysed. The geometric size of the specimens is shown in detail in Figure 8.
4.2. Experimental Results and Discussion
(1) Influence of applied loading on RS relaxation
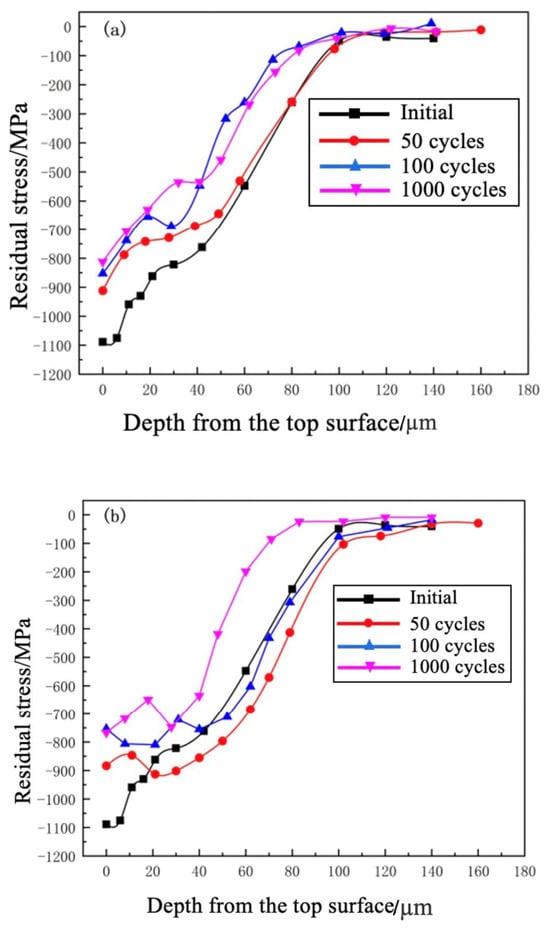
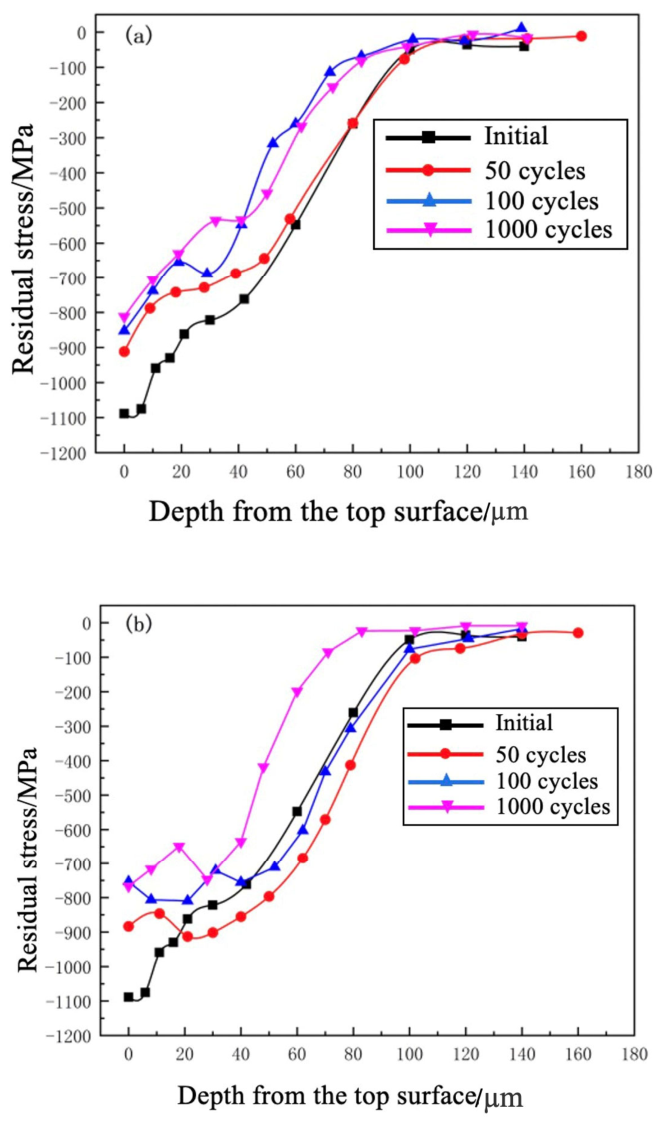
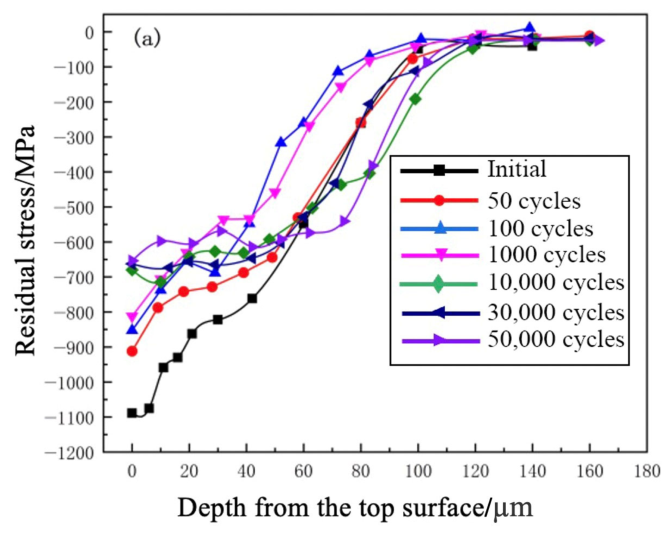
Comparative analyses of the RS under applied loads of 450 and 550 MPa are presented in Figure 20a and Figure 20b, respectively.
Figure 20.
Variation in RS with applied loading at a low number of cycles. (a) Load applied at 450 MPa. (b) Load applied at 550 MPa.
Figure 20 shows that the RS relaxation occurs at relatively low cycle numbers (<1000 cycles). After 1000 cycles at an applied load of 550 MPa, the specimen surface exhibited 29.6% RS relaxation. The RS decreased from −1088.97 to −766.82 MPa, with a relaxation of 322.15 MPa. At an applied load of 450 MPa, the surface RS decreased from −1088.97 to −811.90 MPa, a relaxation of 277.07 MPa, which was 45.08 MPa less than that of 550 MPa. RS relaxation increased with increasing loading. Cyclic loading promotes the precipitation process by inducing a large number of dislocations. The dislocation-induced lattice distortion provides nucleation energy for the precipitate’s nucleation and growth. Therefore, the precipitate size after cyclic loading increases. In addition, dislocations would interact with precipitates, thereby affecting subsequent precipitation and stress relaxation behaviour. The SP treatment increases the dislocation density in the surface layer, leading to the formation of high density dislocation walls or cellular structures. Under higher load bearing conditions, the dislocation walls collapse or cellular structures merge, releasing elastic strain energy and resulting in stress relaxation. Although SP-induced compressive stress inhibits crack propagation, high external loads can indicate microcracks in local tensile stress regions. Cracks propagate along grain or phase boundaries, releasing and creating pathways for relaxation.
Under cyclic loading, lattices undergo reciprocating slip, accompanied by microscopic evolution in which the dislocation density gradually increases and dislocations accumulate at the lattice boundaries. When the dislocation systems of adjacent lattices interact across lattice boundaries, local plastic yielding occurs. This transgranular coordination produces stress concentrations as dislocation pile-ups exceed the critical threshold. As the applied loading intensity increased, the number of cycles required to induce the material yield decreases significantly. This occurs because higher stress amplitudes activate dislocation slip more easily, thereby accelerating the relaxation effect of the RS.
The regulatory mechanism of yielding behaviour on RS relaxation is mainly governed by the magnitude distribution of the compressive and tensile stresses within the material. When the load exceeded the critical threshold, RS relaxation intensified, and the likelihood of macroscopic plastic deformation increased markedly. Higher stress gradients facilitate local regions reaching the dynamic plastic flow threshold. In the initial loading stage, abrupt stress changes can trigger redistribution, manifesting as a stepwise increase in the stress relaxation rate.
Comparison of Figure 14 and Figure 20 shows that the evolution of the RS relaxation is consistent between tests and simulations. This is confirmed by the significant positive correlation between the external load intensity and degree of RS relaxation. The mechanism arises from increased plastic dissipation due to a lower activation energy threshold for stress-driven dislocation motion. However, at the same external load intensity, differences remained between the RS amplitudes measured in cyclic tensile stress relaxation tests and those predicted by numerical simulation. At 450 MPa, the experimental value was 12.3% lower than the simulated result. At 550 MPa, the reduction narrowed to 7.1%. This deviation stems from the idealised assumptions in numerical simulations, which neglect practical engineering factors such as intrinsic material defects, surface work-hardening effects, and experimental system errors.
(2) Influence of the number of cycles on RS relaxation
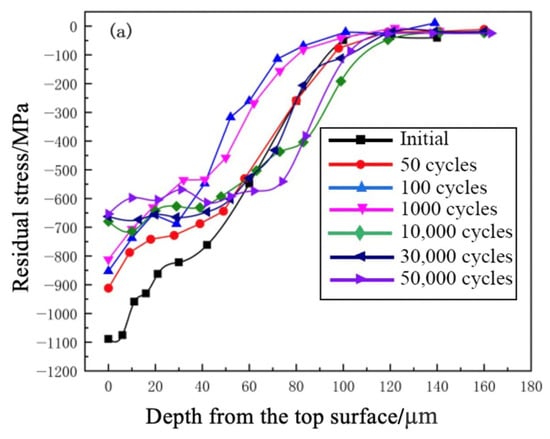
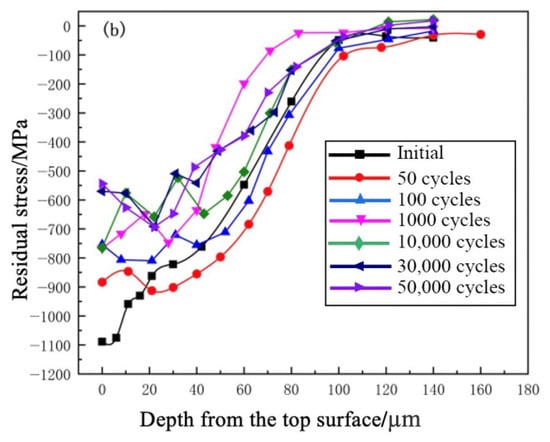
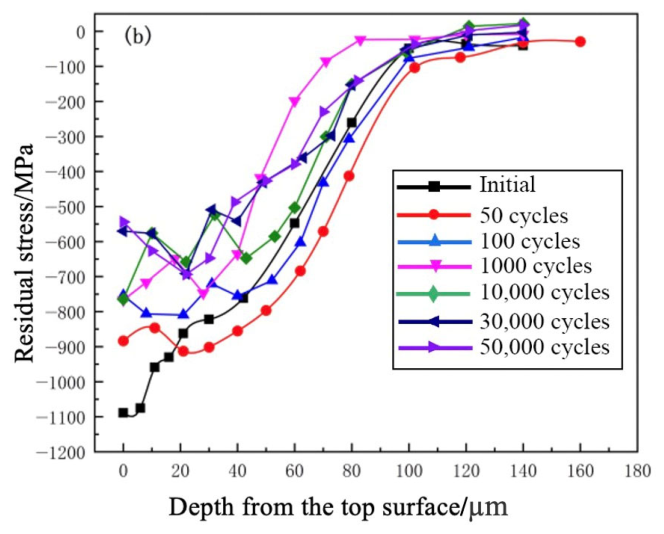
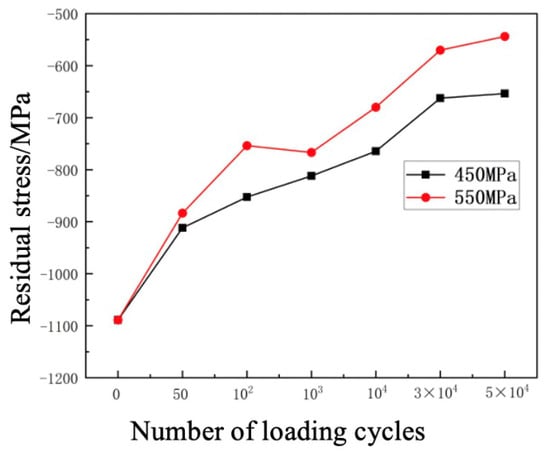
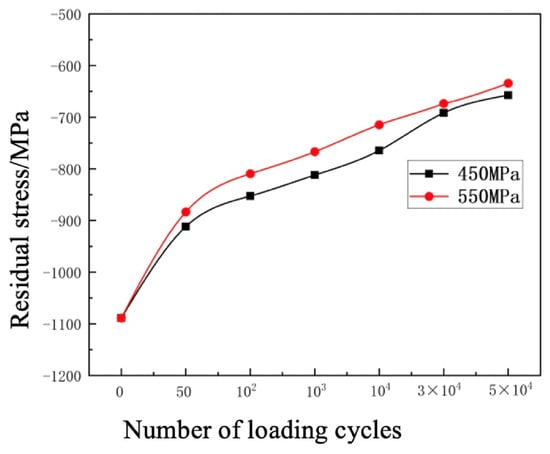
Figure 21 shows the variation in the RS distribution in the TC4 titanium alloy specimens under different cycle numbers. The number of loading cycles strongly influenced the RS relaxation. Relaxation mainly occurs in the early stages (<1000 loading cycles), when the relaxation rate is high and pronounced. RS relaxation was greater at 550 MPa, but the magnitude of the external load intensity was not the main factor affecting the variation law of stress relaxation. Similar relaxation trends were observed at 450 and 550 MPa. In the later stage of cycling (>104), the relaxation rate slowed, approaching a stable state. At 5 × 10⁴ cycles, the RS continued to relax, with no increase in stress amplitude, though the relaxation rate gradually decreased.
Figure 21.
Variation in RS with the number of loading cycles. (a) Applied load of 450 MPa. (b) Applied loading of 550 MPa.
With increasing cycles, the RS amplitude gradually decreased, and the subsurface RS also relaxed. At 5 × 10⁴ cycles, the relaxation amplitude of RS reaches a peak. For the specimen under the applied loading of 450 MPa, the amplitude of residual compressive stress on the surface decreased from −1088.97 to −653.59 MPa, corresponding to a relaxation rate of approximately 39.98%. At 3 × 10⁴ loading cycles, the surface RS are −662.36 and −570.07 MPa for the specimens subjected to applied loads of 450 MPa and 550 MPa, respectively. These values differed by 8.77 and 26.28 MPa, respectively, compared with those at 5 × 10⁴ loading cycles. These results indicate that most of the SP RS in the TC4 titanium alloy relaxed by approximately 3 × 10⁴ loading cycles.
Additionally, it can be observed that the RS field showed an exponential rapid attenuation during the initial loading stage (N ≤ 1000), after which it progressively stabilised and tended toward dynamic equilibrium. In the early stage of cycling, the quasi-static relaxation effect was dominated by dislocation rearrangement and the reconstruction of the SP-induced RS field. In the later stages of cycling, stress redistribution was governed by microscopic plastic accumulation, caused by the combined effects of dislocation density saturation and grain boundary sliding. This occurred because the externally applied stress activates dislocation motion within the material, counteracting the high density dislocation pile-ups introduced by SP, thereby reducing RS. In polycrystalline materials, grain rotation occurs along the direction of maximum shear stress, releasing the energy stored in the local stress concentration regions. Plastic deformation drives the inward transfer of residual compressive stress in the SP layer, leading to the formation of a new stress gradient.
During the later stage of cyclic loading, the internal microstructure evolution was dominated by dislocation density saturation and grain boundary sliding, producing a plastic accumulation effect that controlled stress redistribution. With increasing loading cycles, dislocation density approached saturation, reducing the contribution of conventional dislocation glide to plastic deformation, and driving the material into the work-hardening plateau stage. Consequently, even after extensive cycling, RS continued to evolve, though the relaxation became minimal.
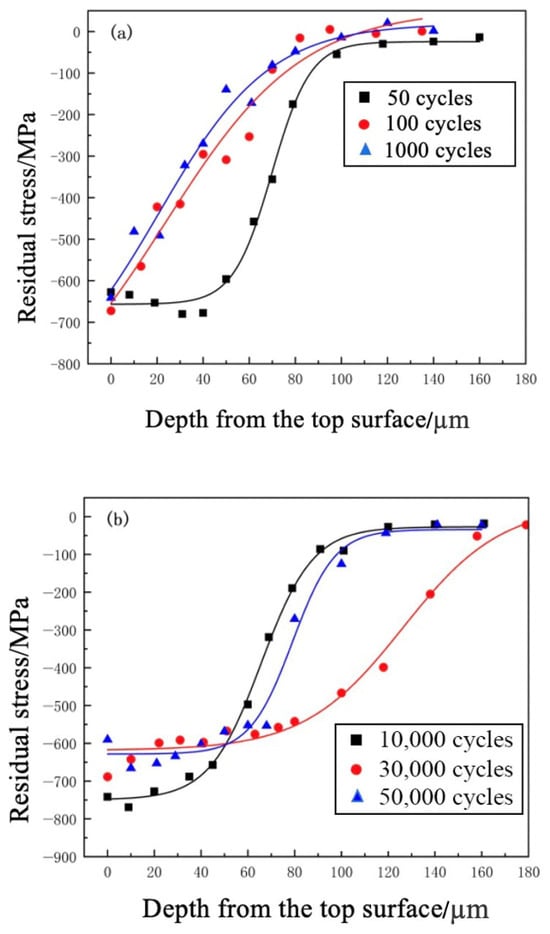
The curve exhibited an S-shaped trend. This indicated that the change was relatively gentle in the initial stage, accelerated in the middle stage, and then stabilised in the later stage. This behaviour is consistent with the characteristics of a classical Boltzmann function fitting. In the stress relaxation tests, the stress decreased slowly during the initial stage. As time elapsed, the rate of decrease accelerated before gradually stabilising. The Boltzmann function was used in the fitting analysis. The results are presented in Figure 22. At low cycle numbers, the RS relaxation was significant. The stress level and depth of the stress layer decreased, resulting in a reduced stress amplitude and a shallower depth. At higher cycle numbers, the degree of this change decreased, with slower trends and smaller relaxation amounts. Figure 22 shows the fitting curve of the RS variation with cycle number under an applied load of 500 MPa. The curve corresponding to 3 × 10⁴ loading cycles shows evidence of stress deepening. This may be due to deviations in the initial RS introduced during the SP experiment. In some specimens, partial repeated SP led to coverage exceeding 100%, which deepened the initial RS field.
Figure 22.
Fitted curve of RS variation with the cycles. (a) Low-loading cycles. (b) High-loading cycles.
(3) Maximum RS relaxation along the depth
Figure 23 shows the RS relaxation results of the TC4 alloy under applied loads of 450 and 550 MPa and different numbers of cycles. Significant surface RS occurred after approximately 104 loading cycles. The initial surface stress amplitudes were reduced from −1088.97 to −764.4 MPa and −679.8 MPa, respectively, with relaxation amounts of 324.6 MPa and 409.1 MPa, and relaxation rates of 29.8% and 37.6%. At approximately 3 × 10⁴ loading cycles, relaxation further increased, with the corresponding surface RS of −662.4 and −570.1 MPa. The relaxation amounts were 426.6 and 518.87 MPa, with relaxation rates of 39.2 and 47.6%. At 5 × 10⁴ loading cycles, the corresponding relaxation amount decreased, and the relaxation rate exhibited a decreasing trend. In conjunction with the previous analysis, it can be confirmed that the relaxation effect of RS is most pronounced at approximately 3 × 10⁴ loading cycles.
Figure 23.
Variation in surface RS with the number of cycles.
Owing to the characteristics of SP-induced RS, the stress distribution along the depth sometimes follows a classical S-shaped curve, where stress level first increases and then decreases. In such cases, the maximum RS is not located on the specimen surface, but on the shallow subsurface layer. To better evaluate relaxation and variation in the RS levels, the maximum RS levels along the specimen depth direction were examined, and the corresponding variation law is shown in Figure 24.
Figure 24.
Maximum RS with the number of cycles.
Comparison of Figure 23 and Figure 24 shows that the relaxation behaviour of the maximum RS and the surface RS is similar. However, the variation in the maximum RS with depth is more uniform and stable. Previous analysis of the magnitude and distribution characteristics of RS along the depth shows that RS decreases with an increase in the number of cycles, with significant relaxation occurring in the early stages of cycling. This relaxation increases with an increase in external load intensity. The depth of the compressive RS becomes shallower, and the overall stress level decreases.
5. RS Relaxation Model
5.1. Analysis of the RS Relaxation Model
A constitutive correlation exists between the SP-induced RS relaxation and material creep behaviour, although their macroscopic manifestations differ. From the perspective of the physical mechanisms, both phenomena originate from the time-dependent evolution of the internal structure under external loading, and they show a quantifiable correlation. Accordingly, an RS relaxation model is proposed, based on the creep model.
The RS relaxation rate, Re, is defined in the range 0% < Re < 100%. The relaxation rate Re at the maximum RS locations on the specimen surface and along the depth direction was analysed under different external load intensities and cycle numbers.
where represents the SP-induced RS and represents the RS after N loading cycles.
Phenomenological models are often used to study the RS relaxation behaviour. RS relaxation is closely related to dislocation motion and is often considered analogous to creep. Both cause time-dependent stress–strain evolution under external loading. The creep controlled by the dislocation motion can be expressed as follows:
where Q represents the activation energy for the dislocation motion, R represents a universal constant, and T represents the temperature, all of which are constants under RS conditions. represents a material-dependent constant. The equation can be expressed as follows:
Analogous to Equation (11), a model predicting the RS relaxation rate Re is proposed as follows:
where , controlling the relaxation rate, is a function of the number of loading cycles, while the relaxation amplitude is determined by . The constants a, b, and n are material-specific. These equations describe the strain and relaxation rates, which depend on the current stress state and material parameters. For simplicity, the expression of is rewritten as follows:
where m is a material constant. The relaxation rate Re can then be rewritten as
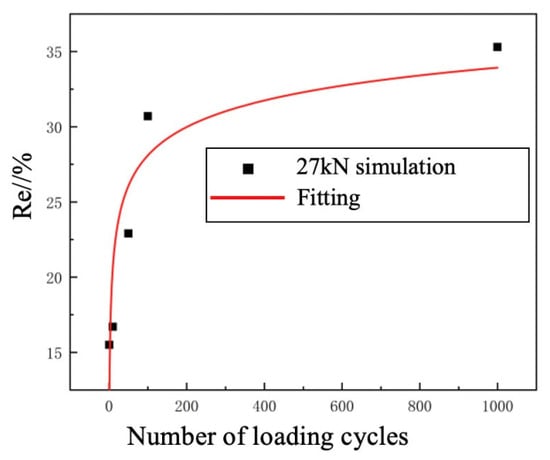
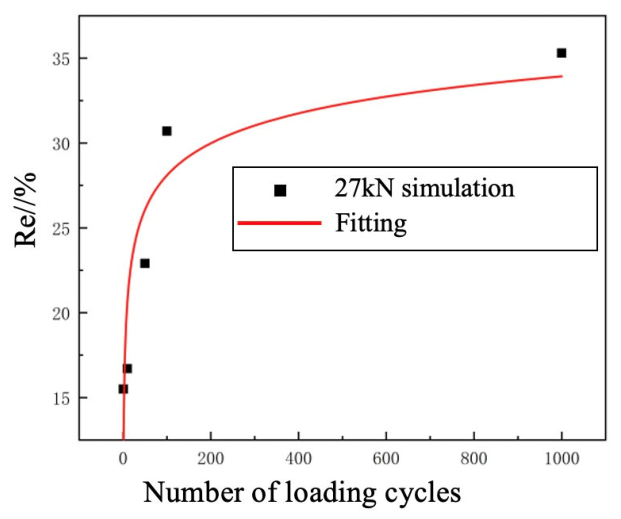
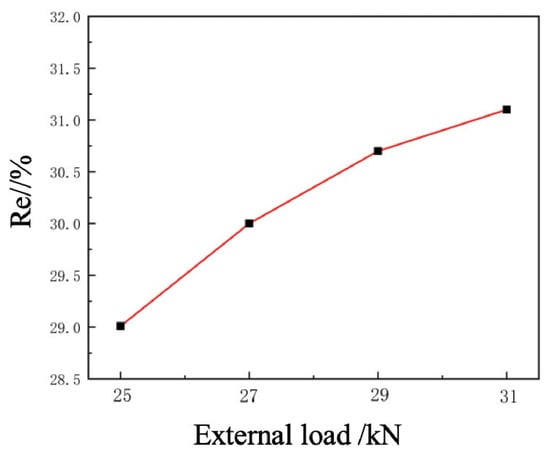
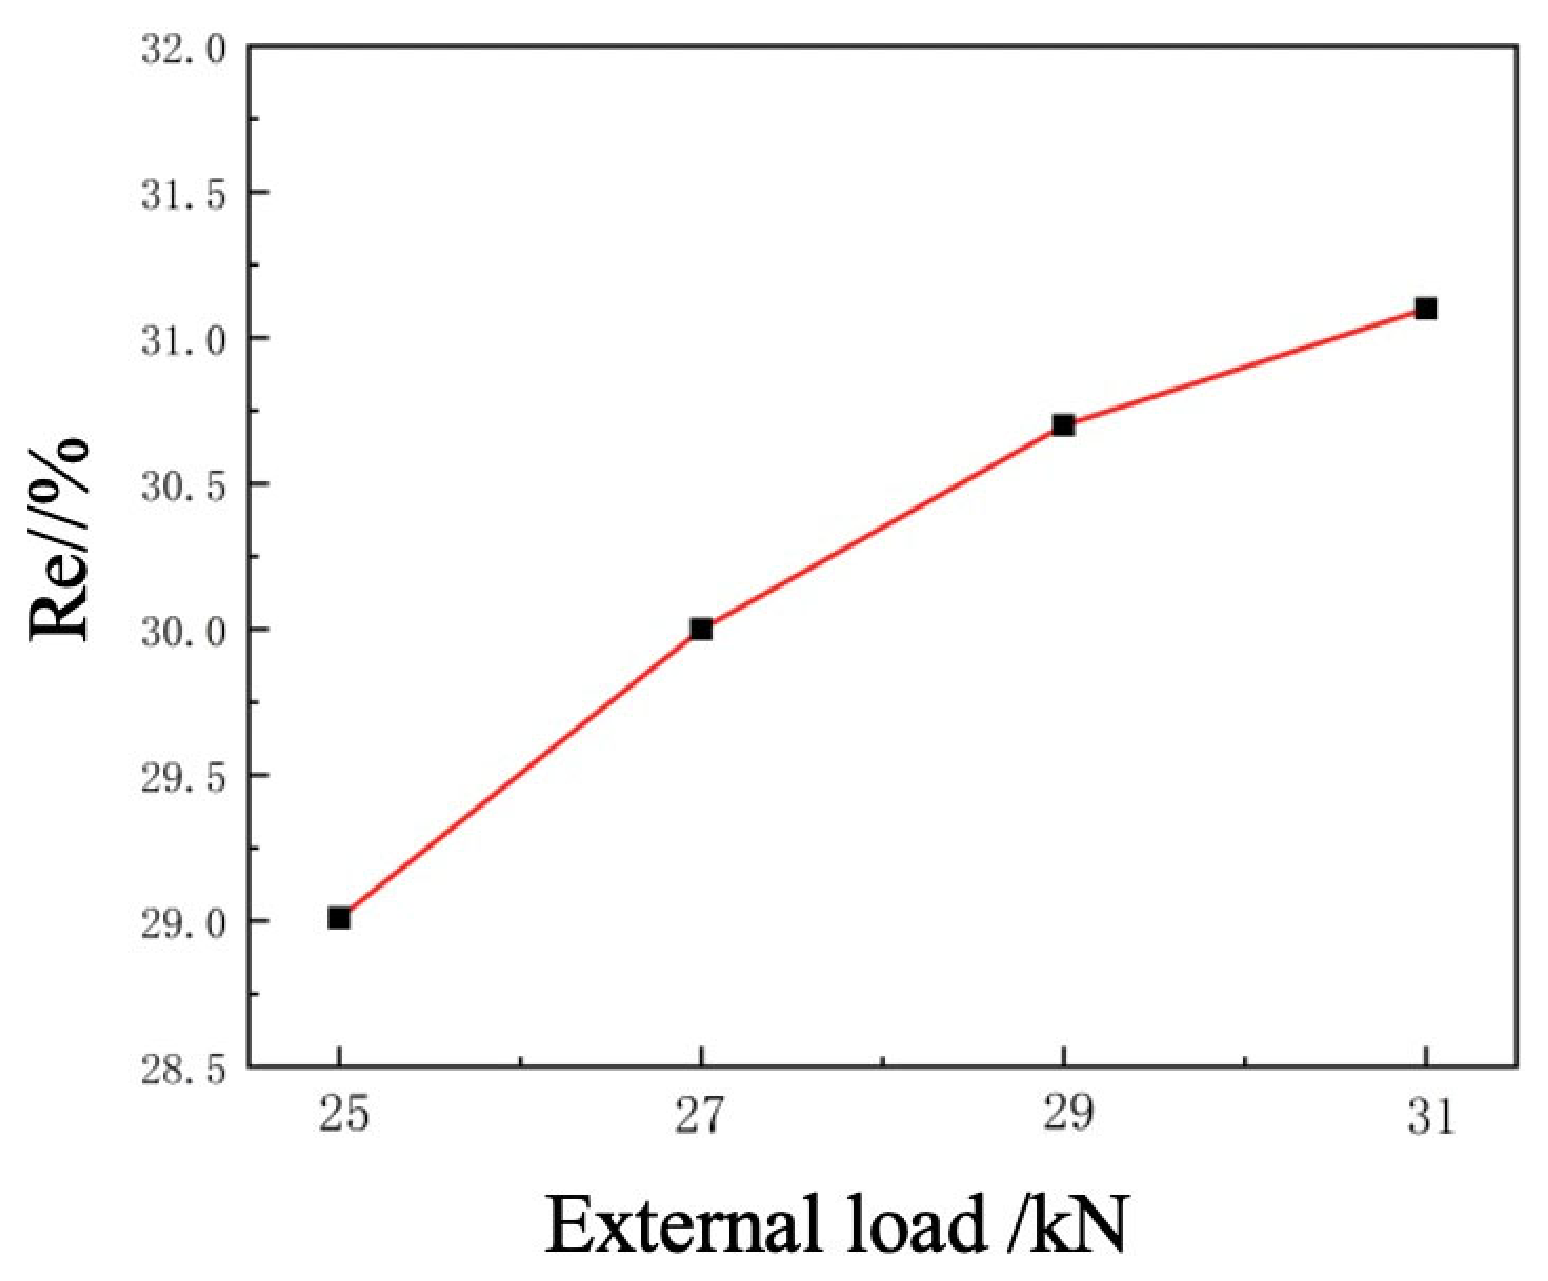
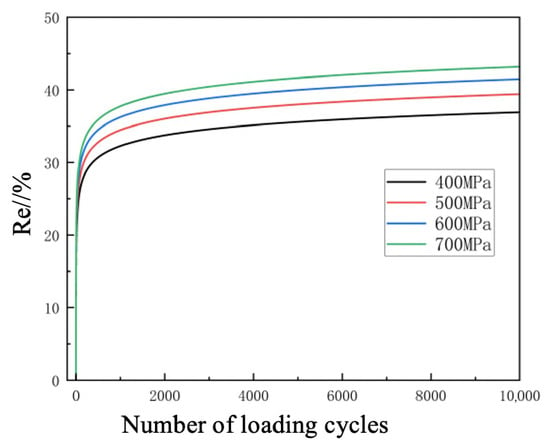
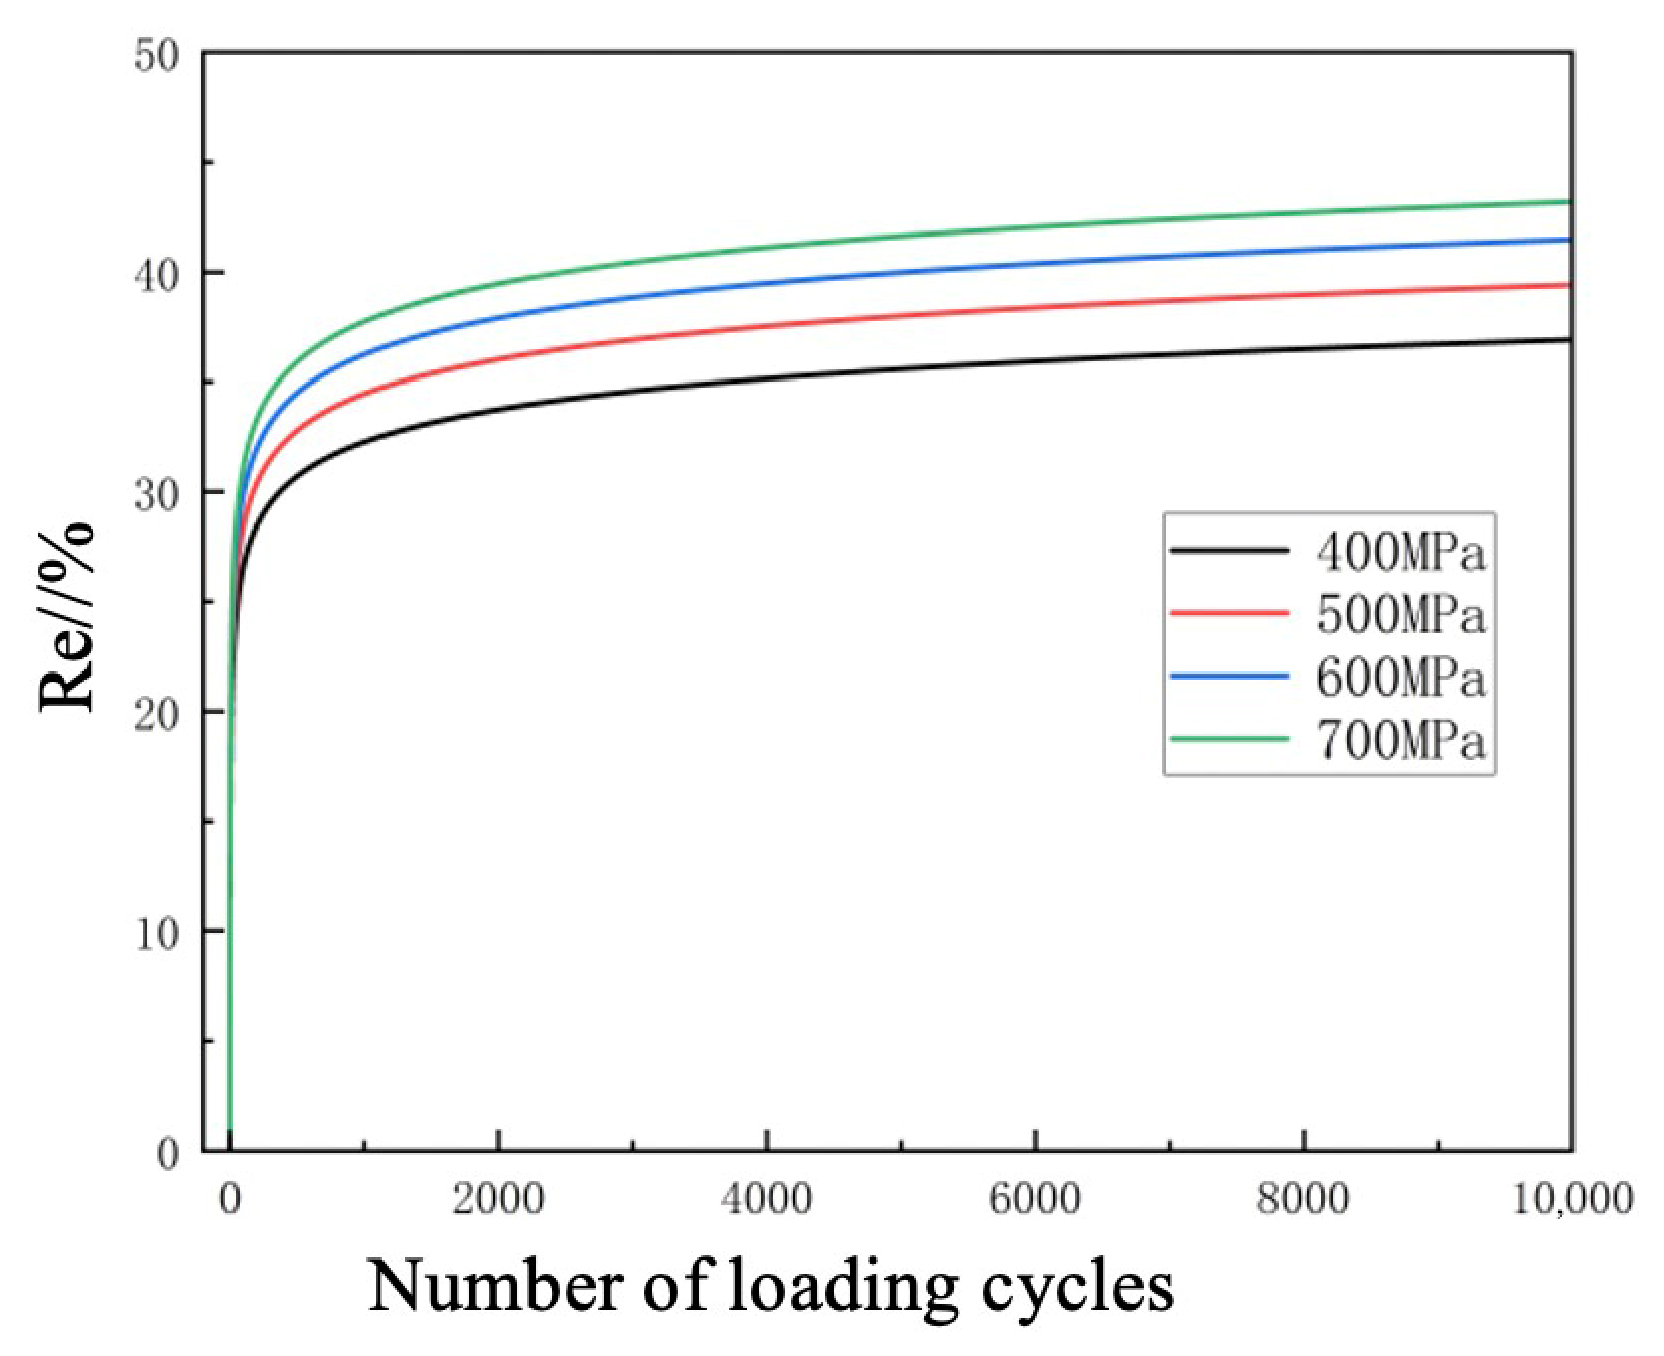
The model reflects the dependence of the RS relaxation on the applied stress and the number of loading cycles, as shown in Figure 25 and Figure 26. The proposed model showed good agreement with experimental data for the TC4 titanium alloy.
Figure 25.
Relaxation rate at different numbers of loading cycles.
Figure 26.
Relaxation rate under different load intensities.
Based on Equation (14), the RS relaxation is represented by Equation (15) and Figure 27.
Figure 27.
Relaxation rate under different applied loading and number of cycles.
5.2. Validation in the RS Relaxation Model
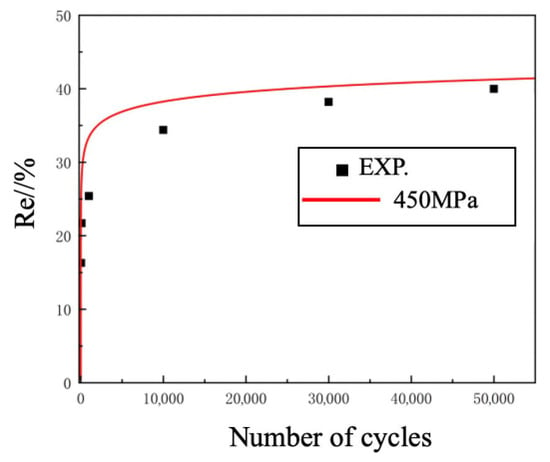
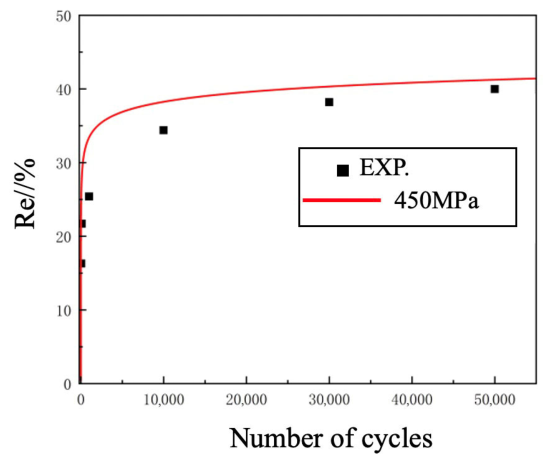
An applied load of 450 MPa for 100 cycles was randomly selected to verify the accuracy of the relaxation model. At 100 cycles, the RS relaxation can be predicted using the proposed equation. For an applied load of 450 MPa, the relaxation rate was calculated using the equation presented in Figure 28. The results showed that the relaxation rate predicted by the equation was 27.69%, compared with 25.4% from the experiment. The equation captures the influence of the applied load and cycle numbers on RS relaxation. The results are consistent with the experimental data, confirming the validation of the relaxation model.
Figure 28.
Comparison between experimental and proposed models.
6. Conclusions
(1) According to the numerical results, the relaxation rate of RS is correlated to the applied stress amplitude. Most of the RS relaxation was observed in the first cycle, which was up to 47.2% and 62.3% after 1000 cycles for the two different shot peening intensities. The experimental results show that the relaxation rate at 550 MPa is about 13.9% higher than that at 450 MPa.
(2) During the early stage (up to 1000 cycles) for TC4 titanium alloy, the relaxation rate was high, whereas in the later stage (exceeding 10,000 cycles), the relaxation slowed. Most RS relaxation occurred around 3 × 10⁴ cycles.
(3) The relaxations of residual stress in the surface and depth were studied and compared. The relaxation laws of surface RS and the maximum RS were similar. As the number of cycles and load amplitude increased, the depth of compressive RS became shallower and the magnitude decreased.
(4) The proposed model can predict the variation in the RS with cyclic load amplitude and number of cycles, with experimental validation showing a maximum error of 13.4%.
Author Contributions
Methodology, J.Z. (Jiuju Zhang) and Y.D.; software, Y.C. and J.Z. (Jiaqi Zhang); validation, H.Z.; formal analysis, Y.C.; investigation, Y.D.; data curation, J.Z. (Jiuju Zhang) and J.Z. (Jiaqi Zhang); writing—original draft, H.Z.; writing—review and editing, H.Z. and J.Z. (Jiuju Zhang). All authors have read and agreed to the published version of the manuscript.
Funding
This research received no external funding.
Data Availability Statement
The original contributions presented in this study are included in the article. Further inquiries can be directed to the corresponding author.
Acknowledgments
The authors wish to deliver their gratitude to the School of Mechanical Engineering, Beijing Institute of Petrochemical Technology.
Conflicts of Interest
The authors declare that they have no known competing financial interests or personal relationships that could have appeared to influence the work reported in this paper.
Glossary
| Almen Intensity | Standardised measure of shot peening intensity, determined using Almen strips (test coupons). |
| Chaboche Model | A nonlinear kinematic hardening constitutive model used to describe cyclic plasticity and stress–strain evolution under repeated loading. |
| Creep | Time-dependent plastic deformation under sustained load, conceptually similar to stress relaxation but under constant stress. |
| Discrete Element Method (DEM) | A numerical method for modelling interactions between discrete particles (such as shot media in SP). |
| Dislocation Slip | Movement of dislocations (line defects) through the crystal lattice, a key mechanism of plastic deformation. |
| Fatigue Loading/Cyclic Loading | Repeated application of fluctuating stress or strain over time, leading to progressive damage and failure. |
| FEM-DEM Coupling | Combined simulation technique where DEM models the peening media and FEM models the continuous material to capture shot peening effects. |
| Finite Element Method (FEM) | A numerical simulation approach that divides a structure into small elements to solve for stresses, strains, and deformations. |
| Grain Boundary Sliding/Grain Rotation | Microstructural mechanisms where grains move relative to each other under stress, contributing to relaxation and fatigue. |
| Isotropic Hardening | Expansion of the yield surface equally in all directions during plastic deformation, modelling strain hardening. |
| Kinematic Hardening | A material-hardening behaviour where the yield surface translates in stress space, used to model cyclic loading. |
| Plastic Deformation | Permanent shape change in a material after stress exceeds the yield strength. |
| Relaxation Rate | Percentage decrease in residual stress over cycles or time, used to quantify stress relaxation behaviour. |
| Relaxation Threshold Stress | The critical stress level above which residual stress relaxation occurs during cyclic or thermal loading. |
| Residual Stress (RS) | Internal stress remaining in a material after manufacturing or treatment, without external load. Compressive RS near the surface improves fatigue life. |
| Residual Stress Relaxation | Reduction in residual stress magnitude over time due to cyclic loading, thermal exposure, or plastic deformation. |
| Shot Peening (SP) | A mechanical surface treatment where small spherical media (“shots”) bombard a surface, creating compressive residual stresses to improve fatigue resistance. |
| Stress Ratio (R) | Ratio of minimum to maximum stress in a fatigue cycle: R = σmin/σmax. |
| TC4 Titanium Alloy (Ti-6Al-4V) | A widely used titanium alloy with a high strength-to-weight ratio, corrosion resistance, and good fatigue performance. |
| X-ray Diffraction (XRD) | A nondestructive technique to measure residual stress by analysing changes in crystal lattice spacing. |
References
- Cao, S.; Zhang, H.; Hu, J.; Li, C.; Li, B. Fatigue life prediction model for shot-peened laser powder bed fused 304L steel considering residual stress relaxation and defect distribution. Eng. Fail. Anal. 2024, 162, 108423. [Google Scholar] [CrossRef] [Scilit]
- Morar, N.I.; Holtham, N.; Hackel, L.; Davami, K.; Sharma, M.; DeWald, A.; Roy, R. Effects of high-energy laser peening follower by pre-hot corrosion on stress relaxation, microhardness, and fatigue life and strength of single-crystal nickel CMSX-4 superalloy. Int. J. Adv. Manuf. Technol. 2023, 126, 4893–4912. [Google Scholar] [CrossRef] [Scilit]
- Yin, A.; Yu, W.; Li, W.; Zhu, W.; Ji, V.; Jiang, C.; Wang, C. Microstructural and thermal relaxation of residual stress in dual peened TA15 titanium alloy fabricated by SLM. Mater. Charact. 2024, 218, 114496. [Google Scholar] [CrossRef] [Scilit]
- Zhou, Z.; Gill, A.S.; Telang, A.; Mannava, S.R.; Langer, K.; Mannava, S.R.; Langer, K.; Vasudevan, V.K.; Qian, D. Experimental and finite element simulation study of thermal relaxation of residual stresses in laser shock peened IN718 SPF superalloy. Exp. Mech. 2014, 54, 1597–1611. [Google Scholar] [CrossRef] [Scilit]
- Zhu, H.; Qu, X.; Cao, J.; Zhao, X.G.Y.; Wang, X.; Wang, W.; Zhang, Y. Study on stress relaxation characteristics of FGH95 powder superalloy treated by laser shock peening. Mater. Res. Express 2022, 9, 106502. [Google Scholar] [CrossRef] [Scilit]
- Luan, W.; Jiang, C.; Ji, V. Residual stress relaxation in shot peened surface layer on TiB2/Al composite under applied loading. Mater. Trans. 2009, 50, 158–160. [Google Scholar] [CrossRef] [Scilit]
- Feng, Q.; Jiang, C.; Xu, Z. Residual stress relaxation of shot-peened deformation surface layer on duplex stainless steel under applied loading. J. Mater. Eng. Perform. 2014, 23, 408–412. [Google Scholar] [CrossRef] [Scilit]
- Wick, A.; Schulze, V.; Vohringer, O. Effects of warm peening on fatigue life and relaxation behavior of residual stresses in AISI 4140 steel. Mater. Sci. Eng. A 2000, 293, 191–197. [Google Scholar] [CrossRef] [Scilit]
- Dalaei, K.; Karlsson, B.; Svensson, L.-E. Stability of shot peening induced residual stresses and their influence on fatigue lifetime. Mater. Sci. Eng. A 2011, 528, 1008–1015. [Google Scholar] [CrossRef] [Scilit]
- Liu, H.; Yang, B.; Zhang, J.; Gan, J.; Qu, W.; Wang, C.; Jiang, C. Surface mechanical property and residual stress stability of shot-peened Mg-8Gd-3Y alloy by in-situ X-ray diffraction. J. Mater. Res. Technol. 2023, 26, 3015–3024. [Google Scholar] [CrossRef] [Scilit]
- Gao, Z.; Gan, J.; Liu, H.; Liu, X.; Wu, W. Fatigue crack growth prediction for shot-peened steel considering residual stress relaxation. Mater. Des. 2023, 234, 112301. [Google Scholar] [CrossRef] [Scilit]
- Zhu, W.; Liu, H.; Xing, S.; Jiang, C.; Ji, V. Surface mechanical property and residual stress stability of nanostructured CNT/Al-Cu-Mg composites induced by shot peening. Mater. Charact. 2024, 218, 11415. [Google Scholar] [CrossRef] [Scilit]
- Benedetti, M.; Fontanari, V.; Scardi, P.; Ricardo, C.A.; Bandini, M. Reverse bending fatigue of shot peened 7075-T651aluminium alloy: The role of residual stress relaxation. Int. J. Fatigue 2009, 31, 1225–1236. [Google Scholar] [CrossRef] [Scilit]
- Leguinagoicoa, N.; Albizuri, J.; Larranaga, A. Fatigue improvement and residual stress relaxation of shot-peened alloy stee DIV 34CrNiMo6 under axial loading. Int. J. Fatigue 2022, 162, 107006. [Google Scholar] [CrossRef] [Scilit]
- Sun, R.; Cao, Z.; Che, Z.; Zhang, H.; Zou, S.; Wu, J.; Guo, W. A combined experimental-numerical study of residual stress and its relaxation on laser shock peened SiC partical-reinforced 2009 aluminum metal matrix composites. Surf. Coat. Technol. 2022, 430, 127988. [Google Scholar] [CrossRef] [Scilit]
- Vantadori, S.; Valeo, J.; Zanichelli, A. Fretting fatigue and shot peening: A multiaxial fatigue criterion including residual stress relaxation. Tribol. Int. 2020, 151, 106537. [Google Scholar] [CrossRef] [Scilit]
- Aviles, A.; Aviles, R.; Albizuri, J.; Pallares-Santasmartas, L.; Rodriguez, A. Effect of shot-peening and low-plasticity on the high-cycle fatigue strength of DIN 34CrNiMo6 alloy steel. Int. J. Fatigue 2019, 119, 338–354. [Google Scholar] [CrossRef] [Scilit]
- Zhou, J.; Retraint, D.; Sun, Z.; Kanoute, P. Comparative study of the effects of surface mechanical attrition treatment and conventional shot peening on low cycle fatigue of a 316L stainless steel. Surf. Coat. Technol. 2018, 349, 556–566. [Google Scholar] [CrossRef] [Scilit]
- Hayama, M.; Kikuchi, S.; Tsukahara, M.; Misaka, Y.; Komotori, J. Estimation of residual stress relaxation in low alloy steel with different hardness during fatigue by in situ X-ray measurement. Int. J. Fatigue 2024, 178, 107989. [Google Scholar] [CrossRef] [Scilit]
- Zhu, K.; Li, Z.; Fan, G.; Xu, R.; Jiang, C. Thermal relaxation of residual stress in shot-peened CNT/Al-Mg-Si alloy composites. J. Mater. Res. Technol. 2019, 8, 2201–2208. [Google Scholar] [CrossRef] [Scilit]
- Bhowmik, A.; Tan, J.L.; Yang, Y.J.; Aprilia, A.; Chia, N.; Williams, P.; Jones, M.; Zhou, W. Misorientation and dislocation evolution in rapid residual stress relaxation by electropulsing. J. Mater. Sci. Technol. 2025, 209, 292–299. [Google Scholar] [CrossRef] [Scilit]
- Gan, J.; Gao, Z.; Wang, Y.; Wang, Z.; Wu, W. Small-scale experimental investigation of fatigue performance improvement of ship hatch corner with shot peening treatments by considering residual stress relaxation. J. Mar. Sci. Eng. 2021, 419, 419. [Google Scholar] [CrossRef] [Scilit]
- Oberreiter, M.; Horvath, M.; Stoschka, M.; Fladischer, S. Effect of surface finishing state on fatigue strength of cast aluminium and steel alloys. Materials 2023, 16, 4755. [Google Scholar] [CrossRef] [Scilit]
- Fontanari, V.; Frendo, F.; Rosellini, W.; Scardi, P. Analysis of residual stress distribution in shot peened Al 6082 T5 alloy subjected to fatigue loading. WIT Trans. Eng. Sci. 2001, 33, 10. Available online: https://www.witpress.com/elibrary/wit-transactions-on-engineering-sciences/33/3513 (accessed on 10 April 2026).
- Martin, F.; Marcelo, A.; Maria, P.; Carlos, A. Investigation of residual stress, stress relaxation and work hardening effects induced by shot peening on the fatigue life of AA 6005-T6 aluminum alloy. Mater. Res. Express 2019, 6, 1265i2. [Google Scholar] [CrossRef] [Scilit]
- Maleki, E.; Farrahi, G.; Kashyzadeh, K.; Unal, O.; Gugaliano, M.; Bagherifard, S. Effects of conventional and severe shot- peening on residual stress and fatigue strength of steel AISI 1060 and residual stress relaxation due to fatigue loading: Experimental and numerical simulation. Met. Mater. Int. 2021, 27, 2575–2591. [Google Scholar] [CrossRef] [Scilit]
- Fan, K.; Liu, D.; Yang, J.; Zhang, X.; Liu, D.; Li, M.; Xiang, J.; Wang, C.; Wahab, M. Thermal relaxation of compressive residual stresses in surface gradient nanostructure of TC11 titanium alloy. J. Alloys Compd. 2024, 970, 172549. [Google Scholar] [CrossRef] [Scilit]
- Zhang, J.; Li, H.; Zhu, S.; Ji, D.; Su, K. Residual stress relaxation behaviors and fatigue strength of micro-shot peened EA4T axle steel under constant and variable loading. J. Mater. Eng. Perform. 2024, 33, 3770–3780. [Google Scholar] [CrossRef] [Scilit]
- Ju, L.; Li, K.; Cheng, L.; Gu, H.; Wang, R.; Zhang, X.; Tu, S. A Modified fatigue life prediction model considering residual stresses relaxation and microhardness distribution for surface strengthening matrerials. Int. J. Fatigue 2025, 195, 108862. [Google Scholar] [CrossRef] [Scilit]
- Xiao, G.; Zhang, X.; Zhang, C.; Liu, Y.; Zhu, W. Fatigue property and residual stress relaxation behavior of high-energy shot peened pure Zr. Coatings 2022, 12, 131. [Google Scholar] [CrossRef] [Scilit]
- Maleki, E.; Unal, O.; Guagliano, M.; Bagherifard, S. Analysing the fatigue behavior residual stress relaxation of gradient nano-structured 316L steel subjected to the shot peening via deep learning approach. Met. Mater. Int. 2022, 28, 112–131. [Google Scholar] [CrossRef] [Scilit]
- Karthik, D.; Swaroop, S. Laser peening without coating induced phase transformation and thermal relaxation of residual stress in AISI 321 steel. Surf. Coat. Technol. 2016, 291, 161–171. [Google Scholar] [CrossRef] [Scilit]
- Chin, K.S.; Idapalapati, S.; Ardi, D.T. Thermal stress relaxation in shot peened and laser peened nickel-based superalloy. J. Mater. Sci. Technol. 2020, 59, 100–106. [Google Scholar] [CrossRef] [Scilit]
- Yang, Q.; Cheng, J.; Guan, H.; Tan, W.; Zhang, Y. Investigation of wet shot peening on microstructure evolution and tensile-tensile fatigue properties of Ti-6Al-4V alloy. Mater. Chem. Phys. 2022, 291, 126635. [Google Scholar] [CrossRef] [Scilit]
- GB/T 3075-2021; Metallic Materials—Fatigue Testing—Axial Force-Controlled Method. Standards Press of China: Beijing, China, 2021.
- AITM 1-0011; Constant Amplitude Fatigue Testing of Metallic Materials. Airbus Industrie, Engineering Directorate: Blagnac, France, 2001.
- Xu, Z.; Dunleavey, J.; Antar, M.; Hood, R.; Soo, S.; Kucukturk, G.; Hyde, C.; Clare, A. The influence of shot peening on the fatigue response of Ti-6Al-4V surfaces subject to different machining process. Int. J. Fatigue 2018, 111, 196–207. [Google Scholar] [CrossRef] [Scilit]
- Ongtrakulkij, G.; Khantachawana, A.; Kajornchaiyakul, J. Effects of the secondary shot in the double shot peening process on the residual compressive stress distribution of Ti-6Al-4V. Heliyon 2022, 8, e08758. [Google Scholar] [CrossRef] [Scilit] [PubMed]
- Yao, C.; Wu, D.; Ma, L.; Tan, L.; Zhou, Z.; Zhang, J. Surface integrity evolution and fatigue evaluation after milling mode shot-peening and polishing mode for TB6 titanium alloy. Appl. Surf. Sci. 2016, 387, 1257–1264. [Google Scholar] [CrossRef] [Scilit]
- SAE J444-2023; Cast Shot and Grit Size Specifications for Cleaning and Peening. SAE International: Warrendale, PA, USA, 2023.
- SAE Standard J2277; Shot Peening Coverage, Developed by Surface Enhancement Committee. SAE International: Troy, MI, USA, 2003.
- Gangaraj, S.; Guagliano, M.; Farrahi, G. An approach to relate shot peening finite element simulation to the actual coverage. Surf. Coat. Technol. 2014, 243, 39–45. [Google Scholar] [CrossRef] [Scilit]
- Bazzaz, E.; Darvizeh, A.; Alitavoli, M.; Tooski, M.Y. Investigation of mechanical surface treatment effect on the properties of titanium thin film. Adv. Res. 2024, 17, 33–49. [Google Scholar] [CrossRef]
- Li, J. Investigation of Fatigue Properties and Fatigue Design Diagram of Titanium Alloy Ti-6Al-4V. Ph.D. Thesis, East China University of Science and Technology, Shanghai, China, 2014. [Google Scholar]
- Kim, T.; Lee, H.; Jung, S.; Lee, J. A 3D FE model with plastic shot for evaluation of equi-biaxial peening residual stress due to multi-impacts. Surf. Coat. Technol. 2012, 206, 3125–3136. [Google Scholar] [CrossRef] [Scilit]
- Santus, C.; Romanelli, L.; Grossi, T.; Bertini, L.; Le Bone, L.; Chiesi, F.; Tognarelli, L. Elastic-plastic analysis of high load ratio fatigue tests on a shot-peened quenched and tempered steel, combining the Chaboche model and the Theory of Critical Distances. Int. J. Fatigue 2023, 174, 107713. [Google Scholar] [CrossRef] [Scilit]
- Guan, Y.B.; Wang, Q.Y.; He, C.; Fu, L.; Lin, L.; Zhang, Y.Q.; Luo, Y.R.; Wang, Z.G.; Wu, X. Low-cycle fatigue mechanical behavior of 30CrMo steel under hydrogen environment and numerical verification of chaboche model. Mater. Res. Express 2024, 11, 016522. [Google Scholar] [CrossRef] [Scilit]
- Yu, W.; Yin, A.; Li, W.; Zhu, W.; Xing, S.; Wang, C.; Liu, H.; Jiang, C.; Ji, V. In-Situ XRD quantification of surface yield strength and residual stress relaxation under cyclic loading in shot-peened TC17 titanium alloy. J. Alloys Compd. 2025, 1048, 184942. [Google Scholar] [CrossRef] [Scilit]
- Wang, Y.; Wang, X.; Xu, C.; Qiu, S.; Wang, K.; Tian, K.; Yu, B.; Yu, Y. Effect of shot peening and nitrogen ion implantation on the fatigue behavior of TA15 titanium alloys. Int. J. Fatigue 2023, 172, 107649. [Google Scholar] [CrossRef] [Scilit]



Disclaimer/Publisher’s Note: The statements, opinions and data contained in all publications are solely those of the individual author(s) and contributor(s) and not of MDPI and/or the editor(s). MDPI and/or the editor(s) disclaim responsibility for any injury to people or property resulting from any ideas, methods, instructions or products referred to in the content. |
© 2026 by the authors. Licensee MDPI, Basel, Switzerland. This article is an open access article distributed under the terms and conditions of the Creative Commons Attribution (CC BY) license.