


Abstract
The precipitation characteristics and grain-boundary structure of Al–Cu–Mg alloys strongly affect their corrosion behavior, whereas the roles of Si and Ag microalloying in low Cu/Mg ratio systems are not yet fully understood. In this work, the effects of Si and Ag additions on age-hardening response, precipitation characteristics, and corrosion performance were systematically investigated by combining transmission electron microscopy with electrochemical and corrosion measurements. Si addition significantly accelerated the age-hardening kinetics, enabling the alloy to reach a hardness of 147 HV after only 6 h of aging, whereas the base alloy required 24 h to reach a similar level. This accelerated response was accompanied by refined S-phase precipitation and a markedly narrowed precipitation-free zone along grain boundaries. Further Ag addition introduced coherent Ω precipitates and a more complex multi-phase precipitation structure, which increased microstructural heterogeneity. As a result, the Al–Cu–Mg–Si alloy exhibited the lowest corrosion current density and the shallowest corrosion depth, whereas the Al–Cu–Mg–Si–Ag alloy showed deteriorated corrosion resistance. These results indicate that Si microalloying alone can simultaneously accelerate aging and improve corrosion resistance, while further Ag addition enhances precipitation complexity and strengthening potential but increases susceptibility to localized corrosion.
1. Introduction
Al–Cu–Mg (2xxx series) alloys are widely used as high-strength structural materials in aerospace and transportation industries due to their excellent strength-to-weight ratio and age-hardening capability [1,2]. However, their susceptibility to localized corrosion, particularly intergranular corrosion (IGC) in chloride-containing environments, remains a critical limitation for long-term service reliability [3,4].
The corrosion behavior of precipitation-hardened Al–Cu–Mg alloys is governed by precipitation characteristics and grain-boundary structure. Cu-rich precipitates such as the S phase (Al2CuMg) and phase (Al2Cu), together with grain-boundary precipitates (GBPs), are typically nobler than the α-Al matrix and can form micro-galvanic couples that accelerate localized dissolution [3]. The precipitation-free zone (PFZ) adjacent to grain boundaries also plays a critical role. Wide PFZs combined with cathodic GBPs can promote continuous anodic dissolution along grain boundaries, thereby increasing IGC susceptibility [5,6,7,8]. Therefore, tailoring precipitation morphology and grain-boundary structure offers an effective pathway for regulating corrosion behavior.
Microalloying with elements such as Si and Ag can effectively modify precipitation pathways in Al–Cu–Mg alloys. Si participates in GPB zone evolution and accelerates aging kinetics, particularly in alloys with low Cu/Mg ratios [5,9], while also promoting the formation of Q″ precipitates and modifying S-phase distribution [10]. Ag addition facilitates the formation of coherent Ω precipitates on {111}α planes through interfacial segregation, thereby enhancing strength and thermal stability [11,12]. Despite these advances, the influence of such microstructural modifications on corrosion behavior remains debated, largely because previous studies often compared alloys under different aging conditions or strength levels [7,13]. Since strength and corrosion resistance often show competing trends in precipitation-hardened Al alloys, differences in mechanical state can obscure the intrinsic effects of microstructure on electrochemical behavior [7,13,14].
Recent atomic-resolution studies have further shown that solute segregation at precipitate/matrix interfaces can significantly alter local interfacial chemistry and stability [12,15], potentially influencing both micro-galvanic coupling and corrosion film evolution [11,12,15]. However, the specific role of these interfacial features in governing corrosion behavior in Al–Cu–Mg-based alloys remains poorly understood. In this work, the precipitation characteristics, grain-boundary structure, mechanical properties, and corrosion behavior of low Cu/Mg ratio Al–Cu–Mg, Al–Cu–Mg–Si, and Al–Cu–Mg–Si–Ag alloys were systematically investigated. By combining TEM, atomic-resolution HAADF-STEM, and corrosion characterization, this study aims to clarify how Si and Ag additions modify precipitation pathways, hardening response, and interfacial chemistry, and to identify an alloying strategy for balancing rapid strengthening with corrosion resistance.
2. Materials and Methods
2.1. Materials and Processing
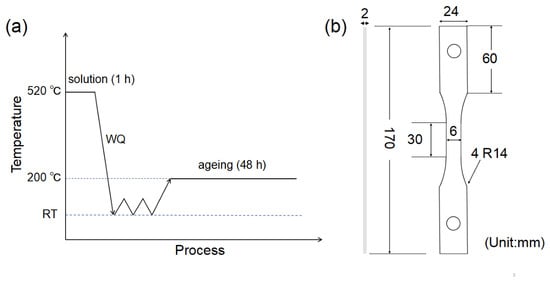
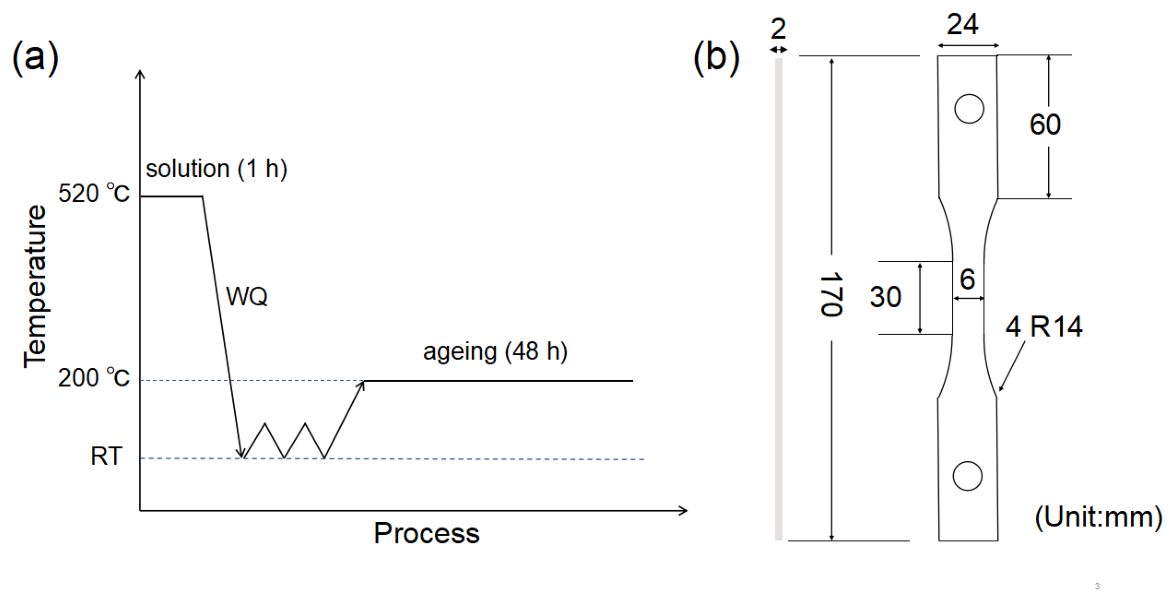
Three Al–Cu–Mg-based alloys with nominal compositions (wt.%) of Al–3.0Cu–2.0Mg (ACM), Al–3.0Cu–2.0Mg–0.5Si (ACMS), and Al–3.0Cu–2.0Mg–0.5Si–0.4Ag (ACMSA) were investigated in this study. These compositions are nominal values provided by the supplier, Kairui New Materials (Beijing) Technology Co., Ltd. (Beijing, China), and were used as the target alloy compositions in the present work. Dog-bone tensile specimens were machined using a CNC wire electrical discharge machine (DK7732CJF), with the geometry shown in Figure 1b. The heat treatment route applied to the alloys is illustrated in Figure 1a. The rolled sheets were solution-treated at 520 °C for 1 h followed by immediate water quenching to retain a supersaturated solid solution. Artificial aging treatments were subsequently carried out in an oil bath at 200 °C for up to 48 h.
Figure 1.
Schematic illustration of the heat-treatment route and specimen geometry: (a) solution treatment at 520 °C for 1 h followed by water quenching and aging at 200 °C for 48 h; (b) specimen dimensions in mm.
Unless otherwise stated, microstructural characterization and corrosion tests were performed on specimens aged to the first hardness peak (6 h) for the Si-containing alloys (ACMS and ACMSA) and the peak-hardness condition (24 h) for the base ACM alloy. This condition was selected to ensure comparable strength levels among the alloys and to minimize the influence of bulk strength on corrosion behavior. The second hardness peak condition (32–34 h) was only considered for the Si-containing alloys in mechanical testing to demonstrate their maximum strengthening potential.
2.2. Mechanical Testing
Mechanical properties were systematically evaluated. Uniaxial tensile tests were carried out on a stress-corrosion testing machine (SCD-50, Shanghai Bairo Testing Instrument Co., Ltd., Shanghai, China) at a nominal strain rate of 10−2 s−1, and strain was recorded using an extensometer. Dog-bone tensile specimens were prepared according to ISO 6892-1 [16]. At least three tensile specimens were tested for each alloy condition. Vickers hardness tests were performed using a load of 9.8 N and a dwell time of 10 s. For each condition, at least ten indentations were conducted and the average value was reported.
2.3. Corrosion Testing
Intergranular corrosion susceptibility was evaluated following ASTM G110. Prior to testing, the samples were mounted in epoxy resin, ground using SiC papers from 500 to 5000 grit, and polished with 0.5 µm diamond suspension, followed by ultrasonic cleaning in ethanol. The samples were etched in a mixed solution containing 945 mL deionized water, 50 mL HNO3 (70%), and 5 mL HF (48%) at 93 °C for 1 min. After rinsing with deionized water, the specimens were immersed in concentrated HNO3 (70%) for 1 min, rinsed, and air-dried. Subsequently, 57 g NaCl and 10 mL H2O2 (30%) were diluted to 1 L. The samples were fully immersed in this solution at 30 ± 1 °C for 6 h.
Electrochemical measurements were conducted in a 3.5 wt.% NaCl solution at room temperature using an electrochemical workstation (CH604, Shanghai Chenhua Instrument Co., Ltd., Shanghai, China) with a standard three-electrode configuration. The alloy specimen served as the working electrode, with an Ag/AgCl reference electrode and a platinum counter electrode. After immersion in the electrolyte for 60 min, the open-circuit potential (OCP) was monitored for 1 h until it stabilized. Electrochemical impedance spectroscopy was then recorded at OCP by applying a sinusoidal perturbation of 5 mV over the frequency range of 10−2 Hz to 105 Hz. Potentiodynamic polarization was subsequently performed by scanning the potential from −250 mV below OCP to +250 mV above OCP at a scan rate of 1 mV s−1. All electrochemical measurements were repeated at least three times.
Neutral salt spray tests were performed according to GB/T 10125-2012 [17]. Salt spray exposure was conducted in a chamber (OLT-60, Q-Lab Corporation, Westlake, OH, USA) for 72 h and 168 h using a 5 wt.% NaCl solution at 35 °C with a pH of 6.5–7.2. After exposure, specimens were rinsed, air-dried, and examined using SEM. Corrosion products were then removed and the surfaces were re-prepared. Surface morphology and pit depth were measured using a 3D optical profilometer (Contour X200, Bruker Corporation, Billerica, MA, USA).
2.4. Structural and Compositional Characterization
Microstructural characterization was performed using multiple techniques to analyze fracture surfaces, corrosion morphologies, and grain structures. Fracture surfaces and salt-spray-corroded morphologies were examined using a Zeiss Sigma 500 SEM (Oberkochen, Germany). Grain structures were characterized by electron backscatter diffraction (EBSD) using the same SEM equipped with an Oxford EBSD detector (Abingdon, UK). Prior to EBSD, samples were mechanically ground and then ion-polished using a Leica RES102 system (Wetzlar, Germany).
Transmission electron microscopy was employed to investigate precipitate structures and interfacial characteristics using an FEI Titan G2 ETEM (Hillsboro, OR, USA), an FEI Tecnai F30 (Hillsboro, OR, USA), and a Thermo Scientific Talos F200X G2 equipped with a Super-X EDS detector (Waltham, MA, USA). TEM foils were prepared by mechanically grinding to a thickness below 70 µm, punching 3 mm discs, and twin-jet electropolishing at −25 °C in a solution of 30% HNO3 and 70% CH3OH under an applied voltage of 30 V. Final thinning was performed using a Leica RES102 ion polisher (Wetzlar, Germany).
3. Results
3.1. Age-Hardening Response and Tensile Properties
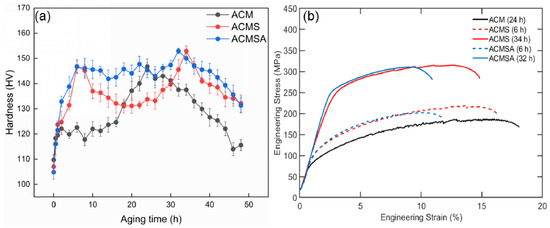
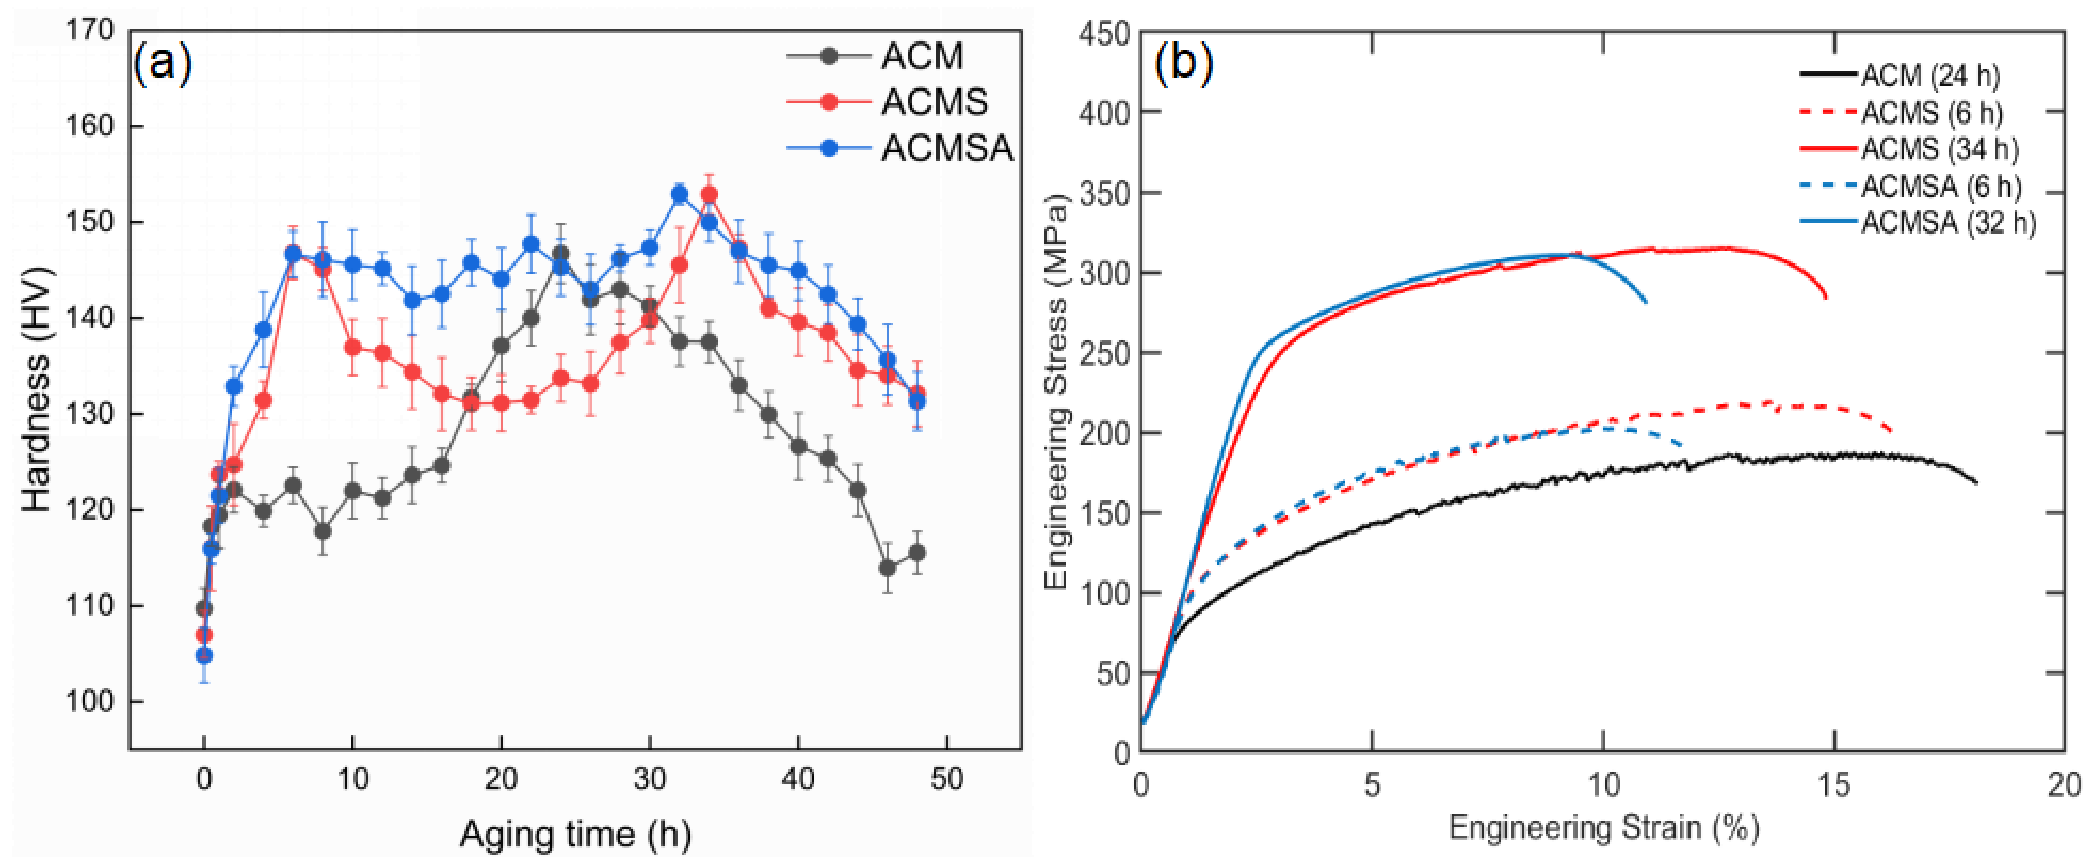
The evolution of Vickers hardness during artificial aging at 200 °C for the three alloys is presented in Figure 2a. All compositions exhibit a characteristic precipitation-hardening response, namely an initial rapid increase in hardness, attainment of a peak value, and a subsequent gradual decrease during over-aging. Despite this common trend, significant differences in precipitation kinetics and peak characteristics are evident among the alloys.
Figure 2.
Mechanical characterization of the investigated alloys: (a) age-hardening curves during aging at 200 °C for 48 h; (b) slow strain rate tensile engineering stress–strain curves obtained at a strain rate of 10−2 s−1.
The base alloy reaches a hardness of 146.7 ± 2.3 HV after 24 h of aging. In contrast, the ACMS and ACMSA alloys attain comparable hardness values of 146.5 ± 2.1 HV and 146.8 ± 2.6 HV, respectively, within only 6 h. This accelerated hardening response indicates that the addition of Si markedly enhances precipitation kinetics during the early stages of aging. This faster hardening rate can be correlated with an increased number density and refined size of nanoscale precipitates, as subsequently quantified by TEM analysis [5,10,18]. A higher number density of finer precipitates reduces the effective interparticle spacing, thereby impeding dislocation motion more effectively and allowing comparable strengthening to be achieved in a shorter time.
Furthermore, the ACMS and ACMSA alloys exhibit a distinct double-peak aging behavior, with secondary hardness maxima of 152.8 ± 2.4 HV and 152.1 ± 2.0 HV, respectively, appearing between 32 h and 34 h. By comparison, the ACM alloy displays a single-peak response with a lower maximum hardness of 146.7 ± 2.3 HV. In addition to achieving a higher peak hardness, the Si- and Ag-containing alloys demonstrate improved hardness retention during prolonged aging, as reflected by their higher hardness values after 42 h.
To enable a meaningful comparison of corrosion behavior under comparable mechanical strength levels, specific aging conditions were selected: 24 h for ACM and 6 h for ACMS and ACMSA. Under these conditions, all alloys exhibit a similar intermediate hardness (about 147 HV), thereby minimizing the influence of bulk strength differences on subsequent corrosion analysis.
The corresponding engineering stress–strain curves for these selected conditions are shown in Figure 2b. The ACM alloy exhibits an ultimate tensile strength of 187.15 ± 5 MPa with an elongation of 18.97 ± 0.6%. With the addition of Si, the UTS of the ACMS alloy increases to 220.33 ± 6 MPa, accompanied by a moderate reduction in elongation to 16.27 ± 0.5%. For the ACMSA alloy, the UTS reaches 202.06 ± 5 MPa, while the elongation decreases further to 11.71 ± 0.4%. At the second hardness peak condition, the ACMS and ACMSA alloys exhibit higher UTS values of 314.91 ± 7 MPa and 314.47 ± 7 MPa, respectively, with elongations of 14.80 ± 0.5% and 10.94 ± 0.4%, indicating their strong strengthening potential.
3.2. Microstructural Characterization
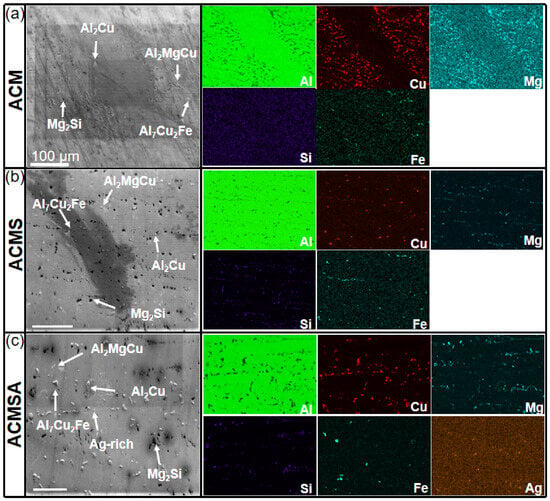
Figure 3 presents SEM micrographs and corresponding EDS elemental mappings of the investigated alloys under the selected aging conditions. In the SEM images, numerous second-phase particles with strong contrast relative to the α-Al matrix can be clearly observed on the alloy surface and along grain boundaries. For the ACM alloy, relatively coarse second-phase particles are distributed within the matrix and along grain boundaries. Combined with EDS elemental mappings, several types of intermetallic particles can be identified, including Al2Cu, Al2CuMg (S phase), Al7Cu2Fe, and Mg2Si. After Si addition, the second-phase particles appear slightly refined and more uniformly distributed. For the ACMSA alloy, localized Ag enrichment can also be detected in certain regions, indicating increased compositional complexity of the intermetallic phases after Ag addition.
Figure 3.
SEM microstructures and corresponding EDS elemental maps of the investigated alloys: (a) ACM, (b) ACMS, and (c) ACMSA.
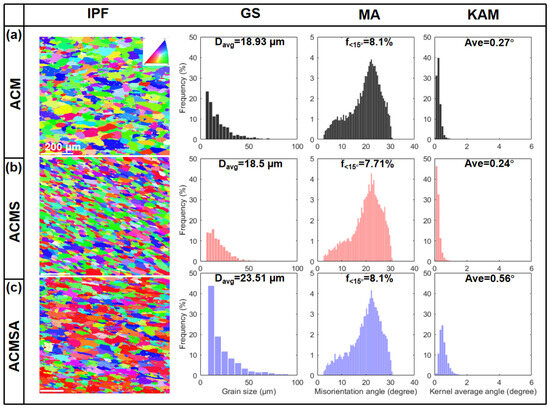
EBSD results are summarized in Figure 4. The inverse pole figure maps reveal that all three alloys exhibit predominantly equiaxed grain structures without pronounced crystallographic texture. The corresponding grain size distributions indicate that the average grain sizes of the ACM, ACMS, and ACMSA alloys are 18.93 ± 1.50 μm, 18.50 ± 1.30 μm, and 23.51 ± 1.80 μm, respectively. Compared with the base alloy, the Si-containing alloy shows a similar grain size, while additional Ag alloying results in slight grain coarsening. The fractions of low-angle grain boundaries are comparable among the alloys, being 8.1%, 7.71%, and 8.1%, respectively.
Figure 4.
EBSD maps of the investigated alloys: (a) ACM alloy, (b) ACMS alloy, and (c) ACMSA alloy.
In contrast, the kernel average misorientation distributions reveal noticeable differences among the alloys. The average KAM values increase from 0.27° for ACM and 0.24° for ACMS to 0.56° for ACMSA. Since KAM reflects the local lattice curvature associated with geometrically necessary dislocations, the higher KAM value suggests a greater density of lattice defects and intragranular strain in the Ag-containing alloy [19,20,21]. Overall, the EBSD analysis indicates that while Si addition has a limited influence on the grain structure, the further introduction of Ag increases the level of intragranular lattice distortion and microstructural heterogeneity.
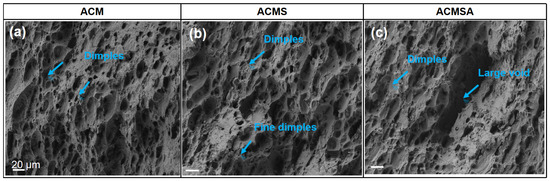
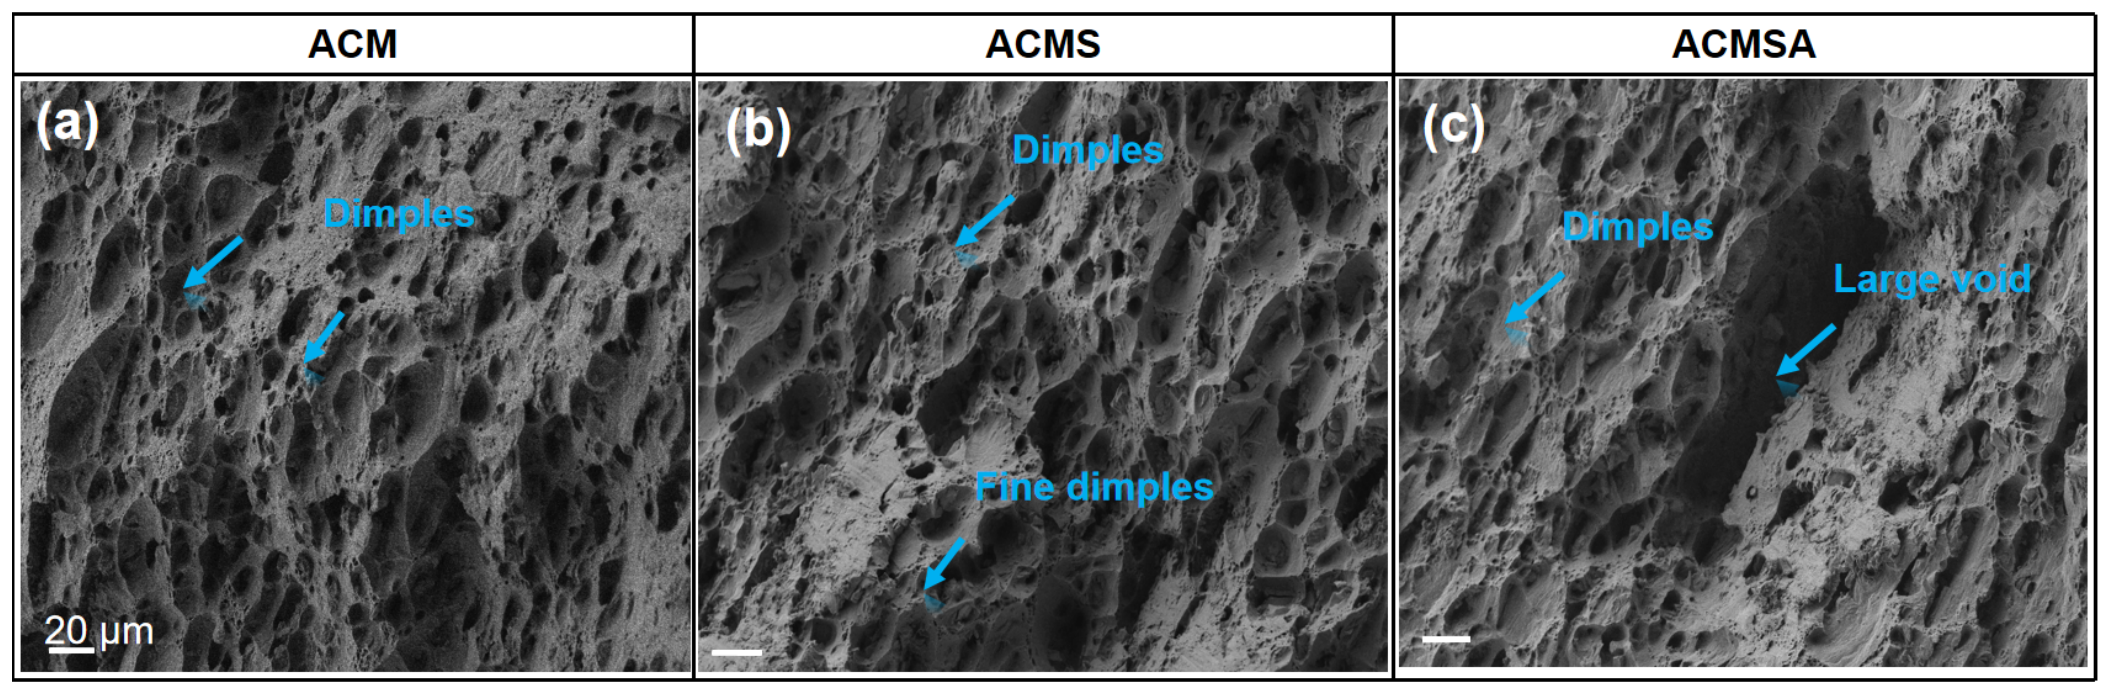
Figure 5 presents the tensile fracture morphologies of the three alloys. The ACM alloy exhibits a predominantly ductile fracture surface characterized by deep and uniformly distributed equiaxed dimples, indicating stable microvoid nucleation and coalescence. In the ACMS alloy, the dimples become finer and coexist with localized quasi-cleavage facets, suggesting the onset of mixed-mode fracture behavior and increased strain localization. The ACMSA alloy displays a higher density of secondary cracks and large voids, together with more pronounced flat facets and regions of crack branching. These features indicate enhanced damage heterogeneity and earlier void coalescence, consistent with its reduced elongation.
Figure 5.
Tensile fracture surface morphologies of the investigated alloys: (a) ACM alloy; (b) ACMS alloy; and (c) ACMSA alloy.
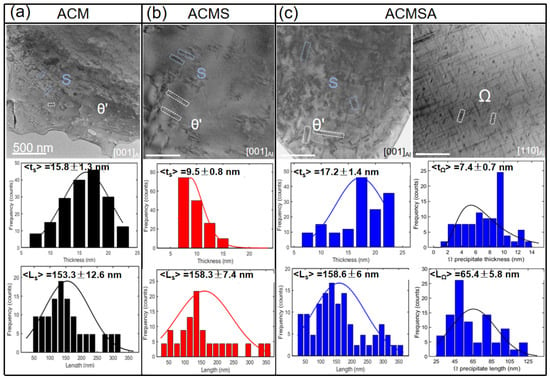
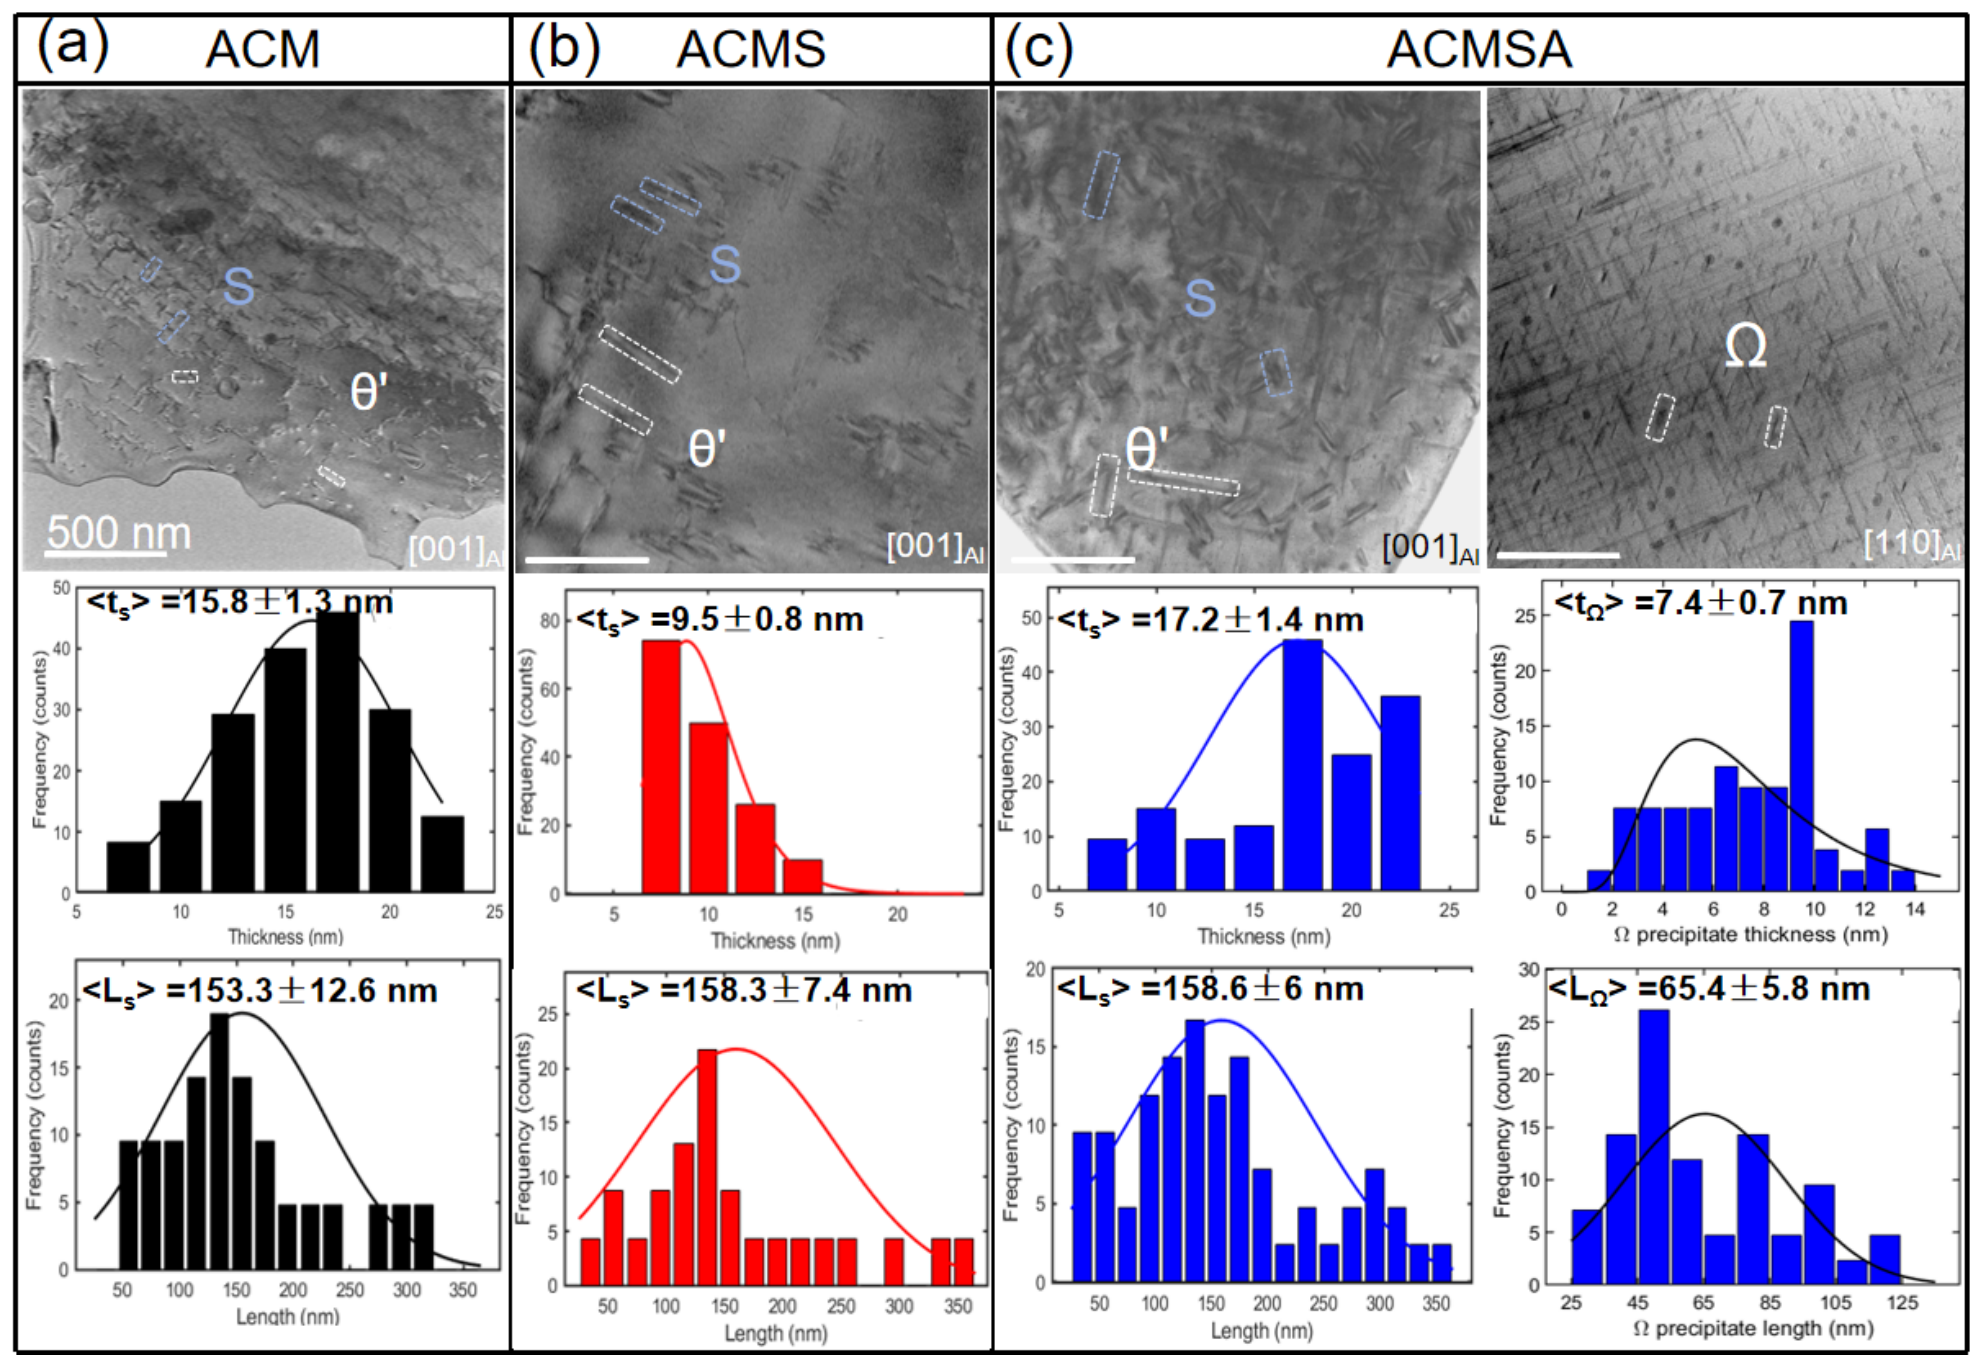
Bright-field TEM images of intragranular precipitates are shown in Figure 6a–c. In the ACM alloy, lath- or plate-like precipitates are observed within the α-Al matrix and are predominantly identified as S phase, accompanied by a minor fraction of precipitates. After Si addition, the intragranular precipitates become noticeably finer and the characteristic thickness of the S-phase plates decreases. With further Ag addition, the precipitation structure becomes more complex and fine plate-like Ω precipitates are observed together with the existing S-related precipitates.
Figure 6.
Bright-field TEM images of intragranular precipitates in the investigated alloys with corresponding statistical distributions of precipitate thickness and length: (a) ACM, (b) ACMS, and (c) ACMSA.
Quantitative measurements of precipitate morphology were performed in at least five independent regions for each alloy, as summarized in Figure 6 and Table 1. In the base alloy, the average thickness and length of S-phase precipitates are 15.8 ± 1.3 nm and 153.3 ± 12.6 nm, respectively, with an estimated areal number density of 3.72 × 10¹³ m−2. After Si addition, the average S-phase thickness decreases significantly to 9.5 ± 0.8 nm while the precipitate length remains comparable. With further Ag addition, the average S-phase thickness increases slightly to 17.2 ± 1.4 nm and the estimated areal number density of S phase further increases to 1.0 × 10¹⁴ m−2. In addition, the Ω precipitates exhibit an average thickness of 7.4 ± 0.7 nm and length of 65.4 ± 5.8 nm.
Table 1.
Estimated areal number density of different precipitate phases in the investigated alloys (× 1013 m−2).
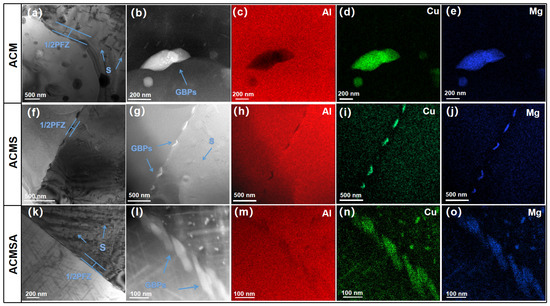
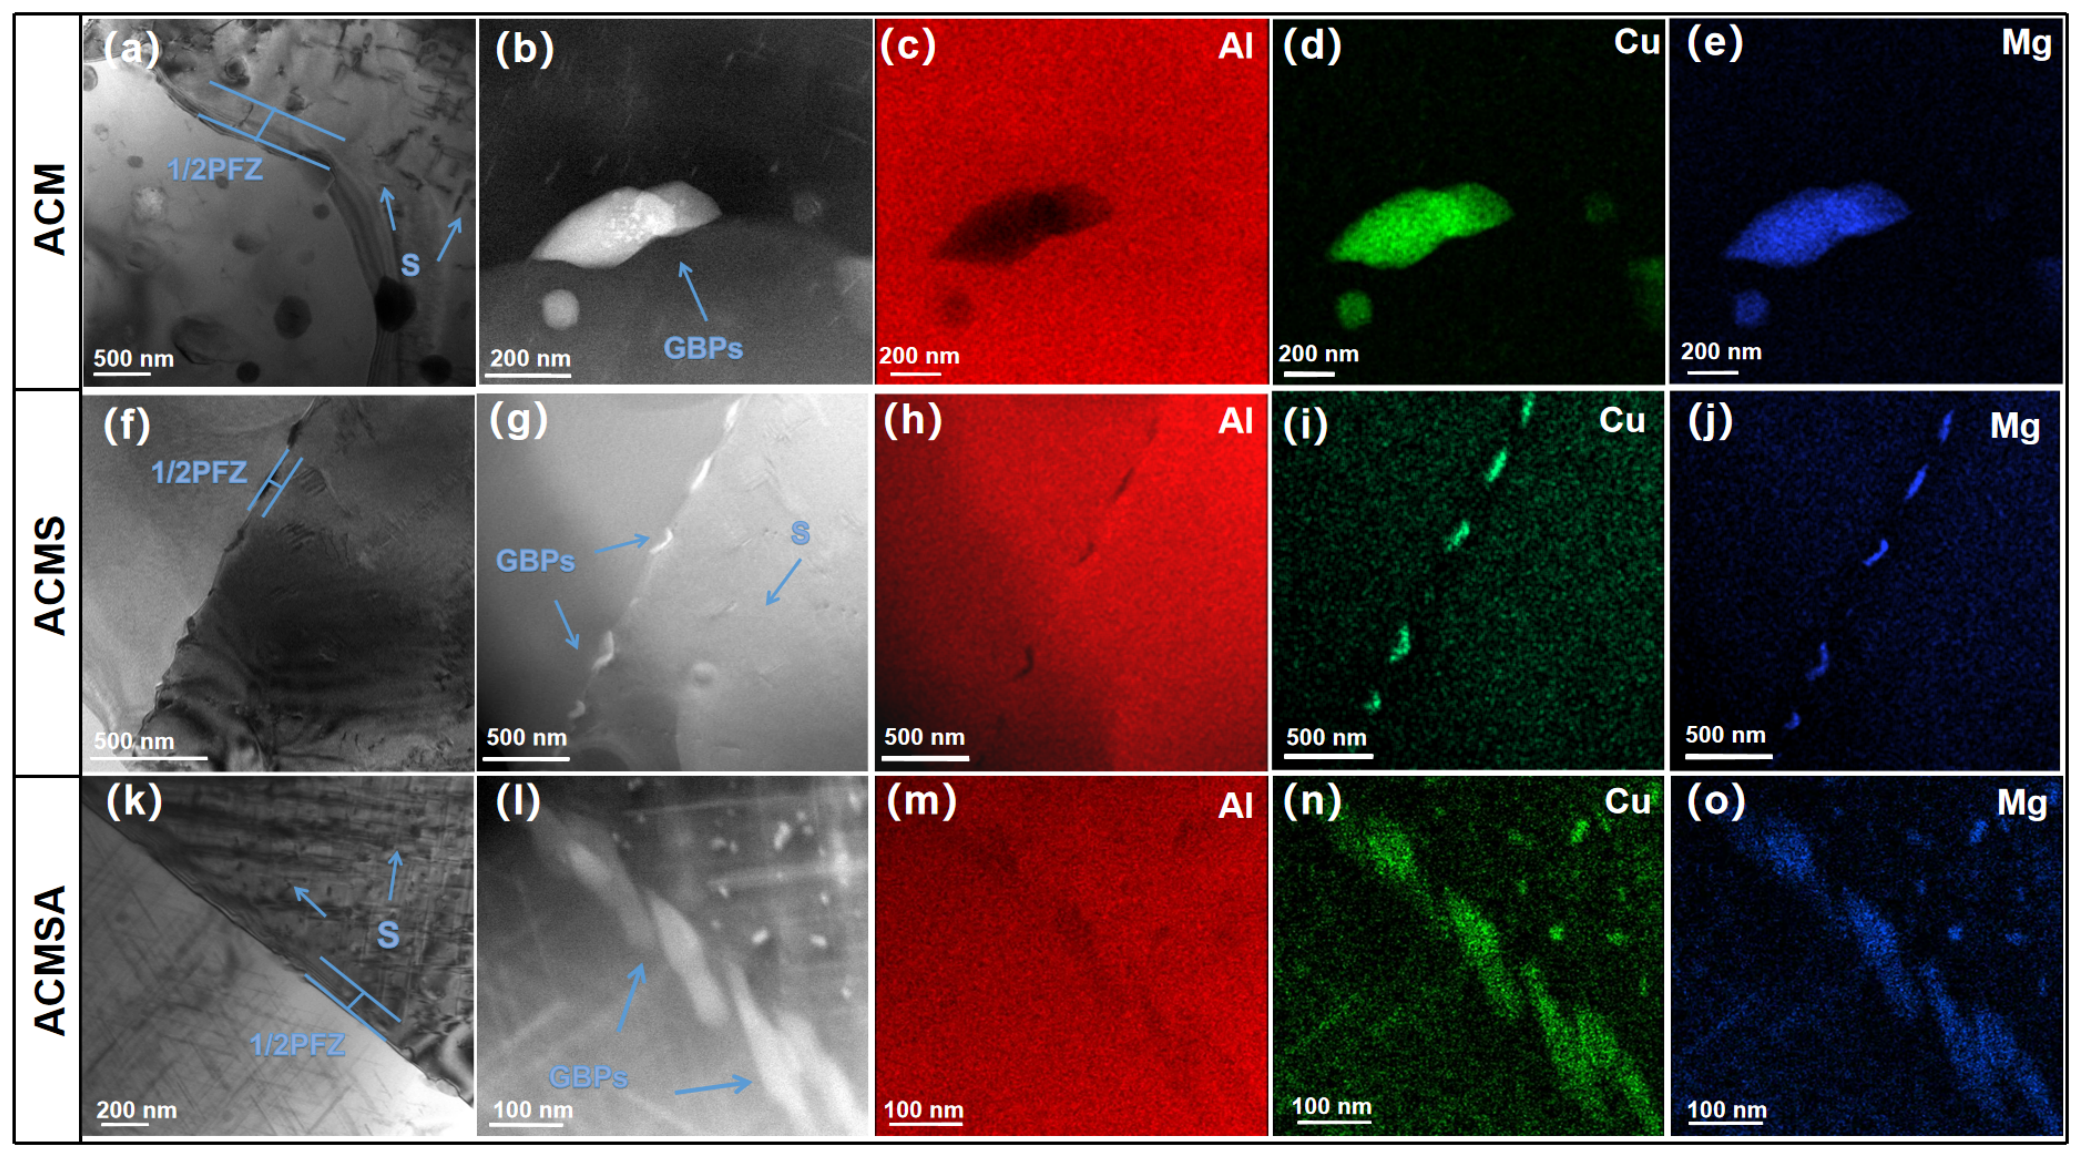
Grain-boundary regions exhibit distinct structural evolution, as shown in Figure 7. PFZ widths were measured perpendicular to grain boundaries at multiple locations, and the statistical results are summarized in Table 2. In the ACM alloy, a relatively wide PFZ with a half-width of 306 ± 21 nm is observed. The grain-boundary precipitates consist of coarse S-phase particles with an average size of 521 ± 38 nm and a large interparticle spacing of 928.5 ± 74 nm. After Si addition, the PFZ width decreases significantly to 122 ± 11 nm, accompanied by substantial refinement of grain-boundary precipitates. With further Ag addition, the PFZ width slightly increases to 143 ± 14 nm, while the grain-boundary precipitates remain relatively fine.
Figure 7.
Grain-boundary precipitation structures of the investigated alloys revealed by TEM and STEM-EDS analysis: (a–e) ACM alloy, (f–j) ACMS alloy, and (k–o) ACMSA alloy. (a,f,k) Bright-field TEM images; (b,g,l) corresponding STEM-HAADF images; (c,h,m) Al maps; (d,i,n) Cu maps; (e,j,o) Mg maps.
Table 2.
Grain-boundary precipitate size, spacing, and PFZ half-width for the investigated alloys (mean ± standard deviation).
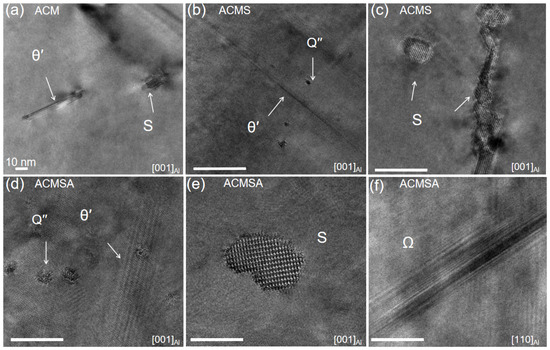
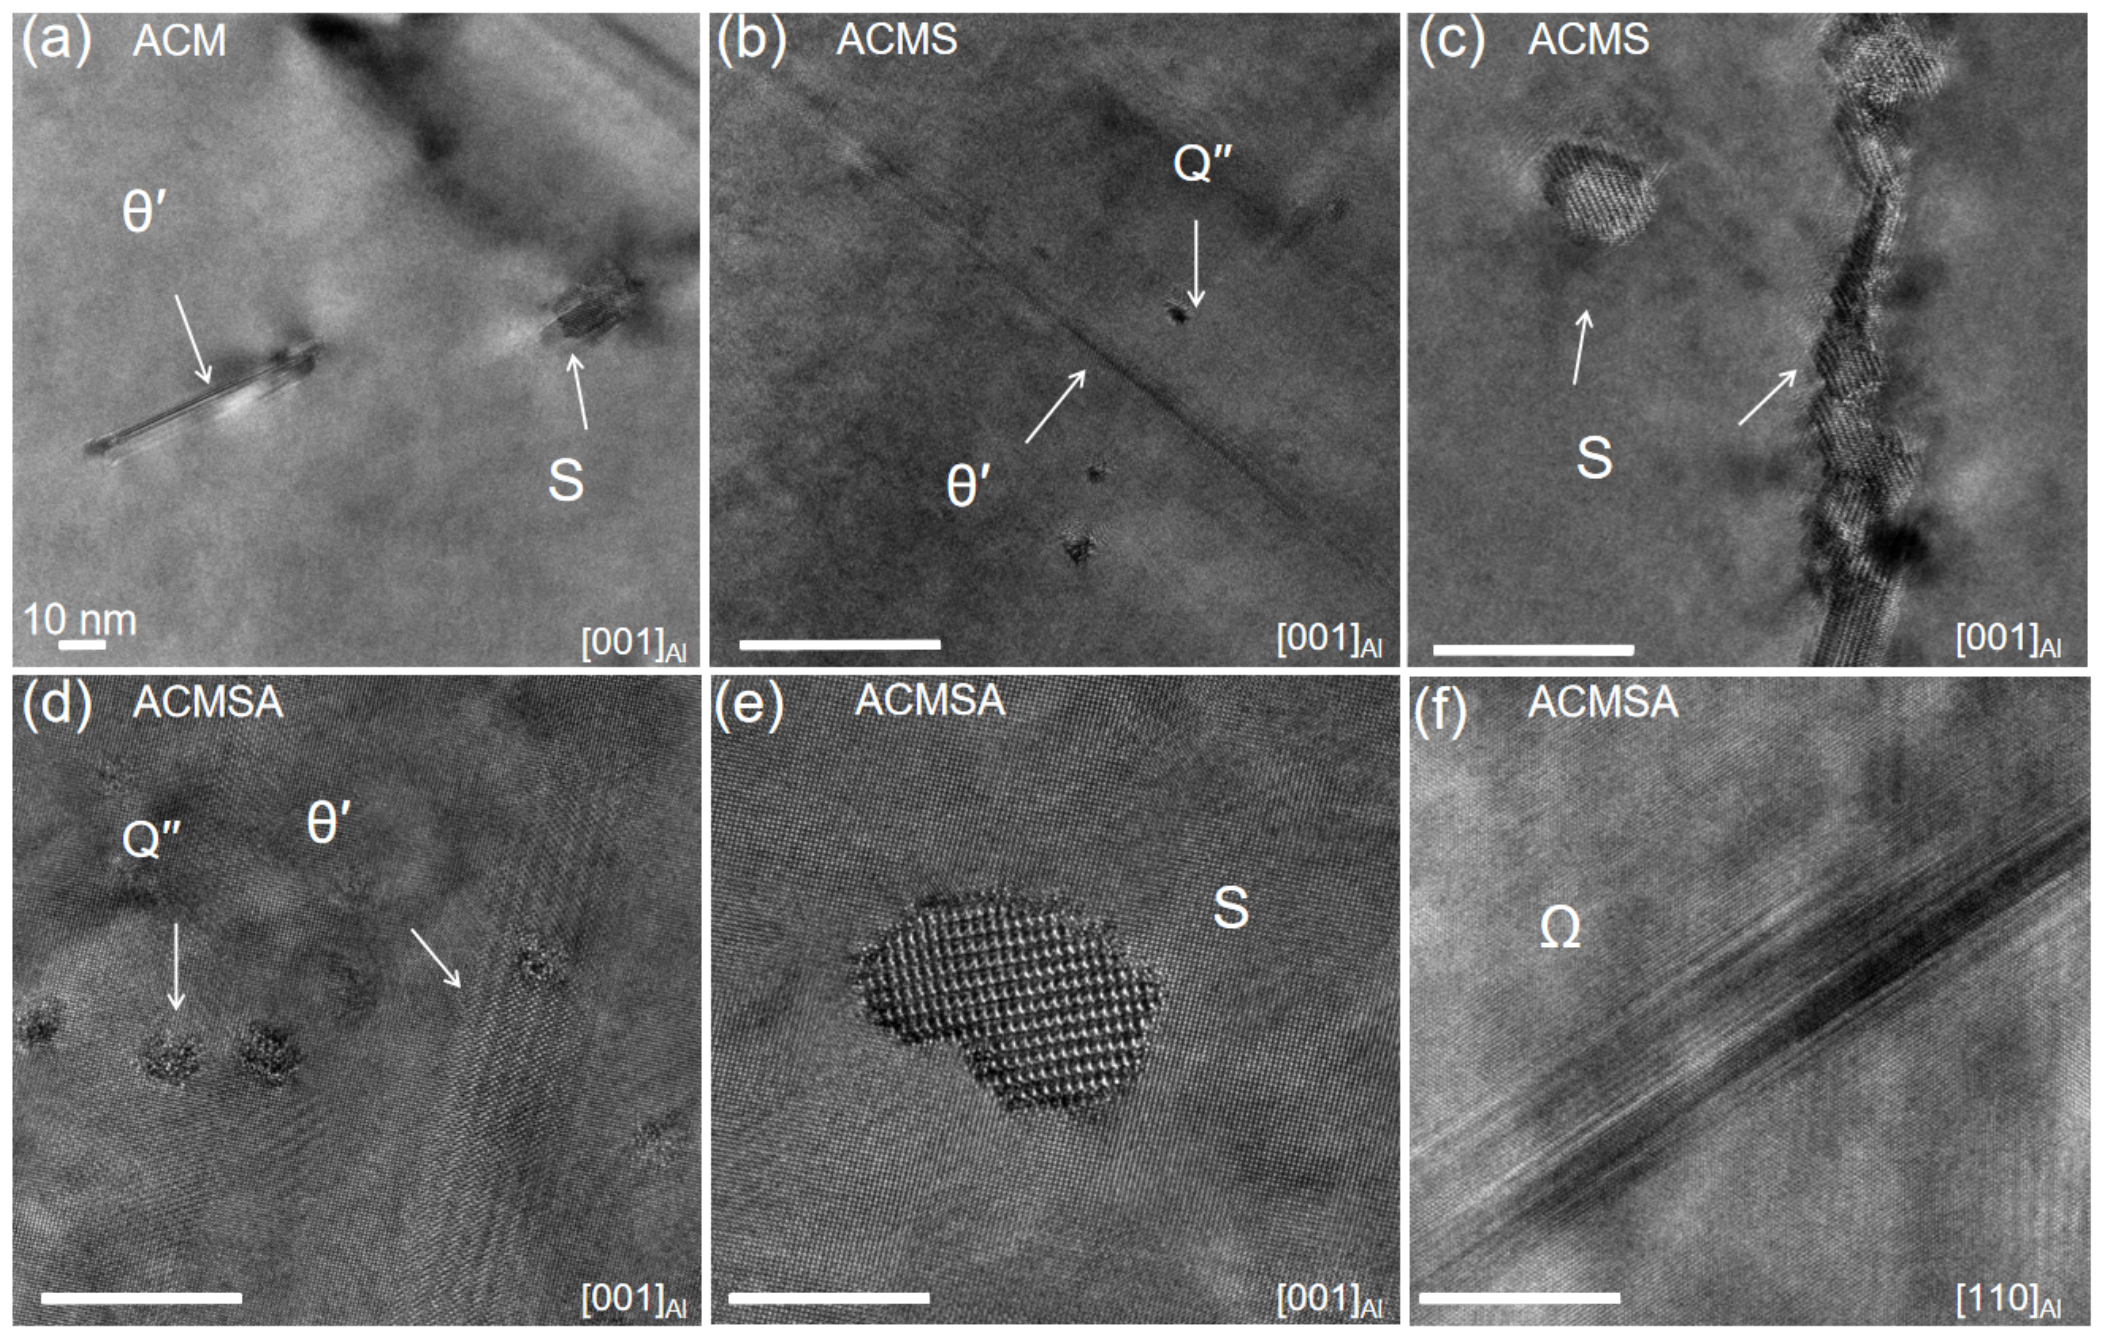
High-resolution TEM images of representative precipitates are shown in Figure 8. In the ACM alloy, plate-like precipitates coexist with S-phase precipitates within the α-Al matrix. After Si addition, fine Q″ precipitates are observed together with and S phases, indicating that Si modifies the precipitation sequence and introduces additional metastable phases. In the Ag-containing ACMSA alloy, multiple precipitate species including Q″, , and S phases are present, while thin plate-like Ω precipitates are clearly observed. These observations confirm the coexistence of multiple precipitate species after Si and Ag additions.
Figure 8.
High-resolution TEM images of the precipitates in the investigated alloys from representative regions: (a) ACM alloy; (b,c) ACMS alloy; and (d–f) ACMSA alloy.
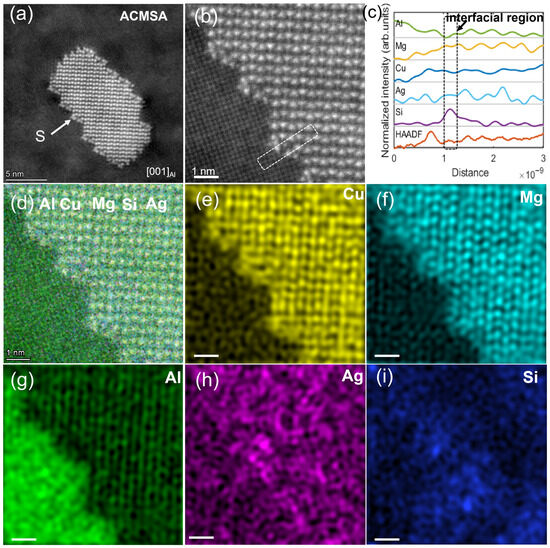
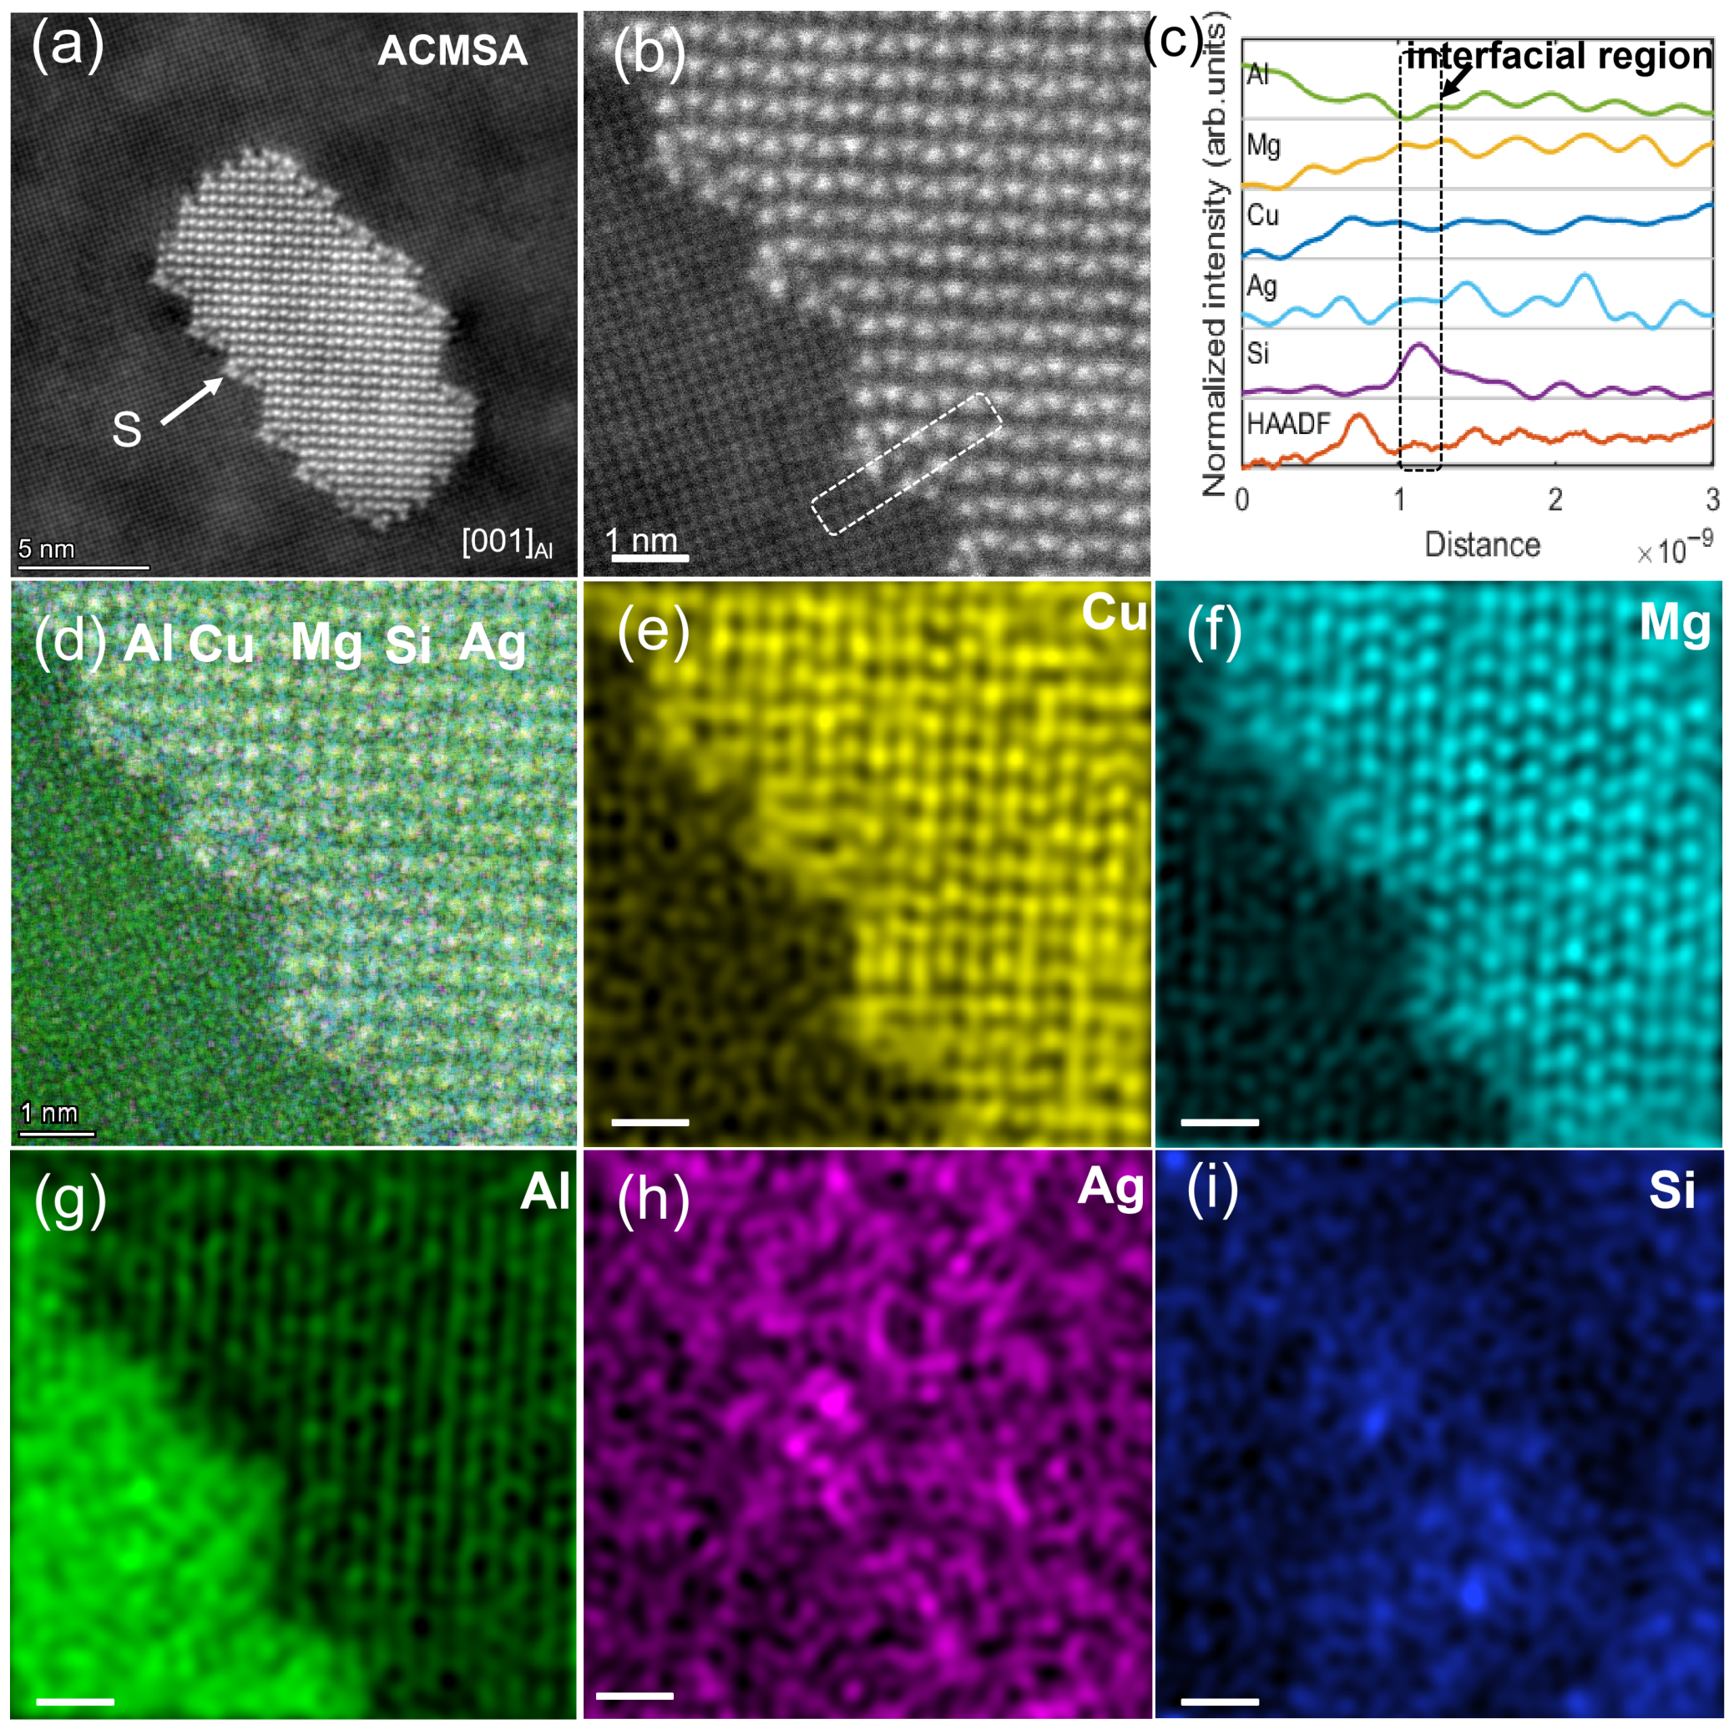
To further investigate the atomic-scale interfacial structure, HAADF-STEM analysis was performed on the ACMSA alloy (Figure 9). The atomic-resolution HAADF image clearly reveals the S-phase precipitate embedded in the α-Al matrix. The corresponding EDS line profile across the precipitate/matrix interface shows a distinct enrichment of Si at the interfacial region, while the Si signal decreases within the precipitate interior. In contrast, Ag exhibits stronger enrichment inside the precipitate. Such element segregation indicates a modification of the local interfacial chemistry. Previous studies have shown that Ag segregation can reduce the interfacial energy of Ω precipitates and stabilize their coherent morphology [9,11,12,22].
Figure 9.
HAADF images and EDS analysis of the ACMSA alloy: (a,b) S-phase precipitate; in (b), the dashed box indicates the region used for the EDS line-scan analysis shown in (c); (c) line-scan profile across the precipitate/matrix interface; (d) EDS elemental overlay map; and (e–i) individual EDS maps for Cu, Mg, Al, Ag, and Si.
3.3. Intergranular Corrosion Behavior
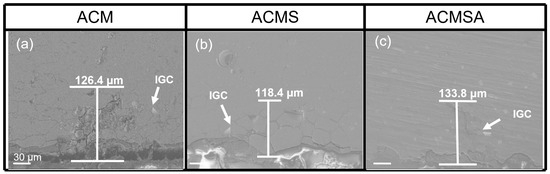
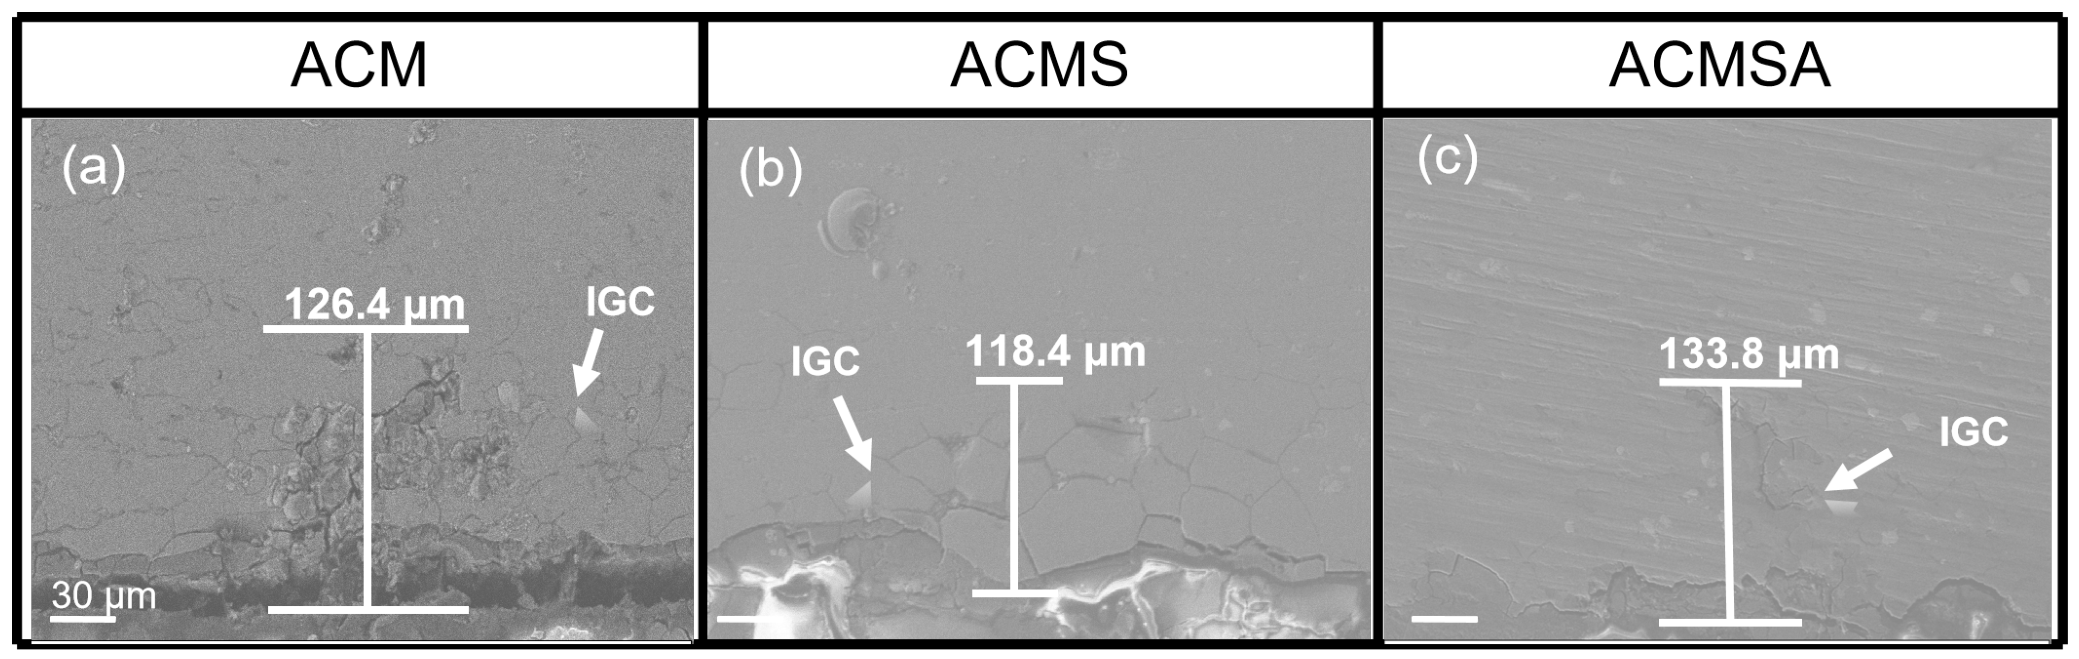
Representative cross-sectional morphologies of the alloys following accelerated intergranular corrosion testing are presented in Figure 10. All three compositions exhibit attack along grain boundaries, confirming susceptibility to intergranular corrosion under the employed test conditions. However, the depth of penetration varies significantly among the alloys. The base ACM alloy displays a maximum corrosion depth of 126.4 µm. With the addition of Si, the corrosion depth decreases to 118.4 µm for the ACMS alloy, indicating improved resistance. In contrast, the further addition of Ag results in an increased corrosion depth of 133.8 µm for the ACMSA alloy, signifying aggravated grain-boundary corrosion. Accordingly, the ranking of intergranular corrosion resistance among the three alloys is ACMS > ACM > ACMSA.
Figure 10.
Comparison of intergranular corrosion morphologies in cross-section for the investigated alloys: (a) ACM, (b) ACMS, and (c) ACMSA.
3.4. Electrochemical Corrosion Behavior
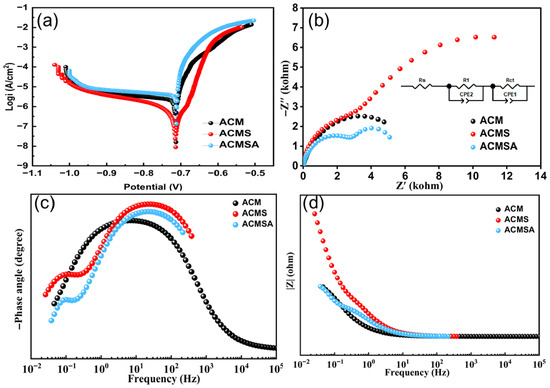
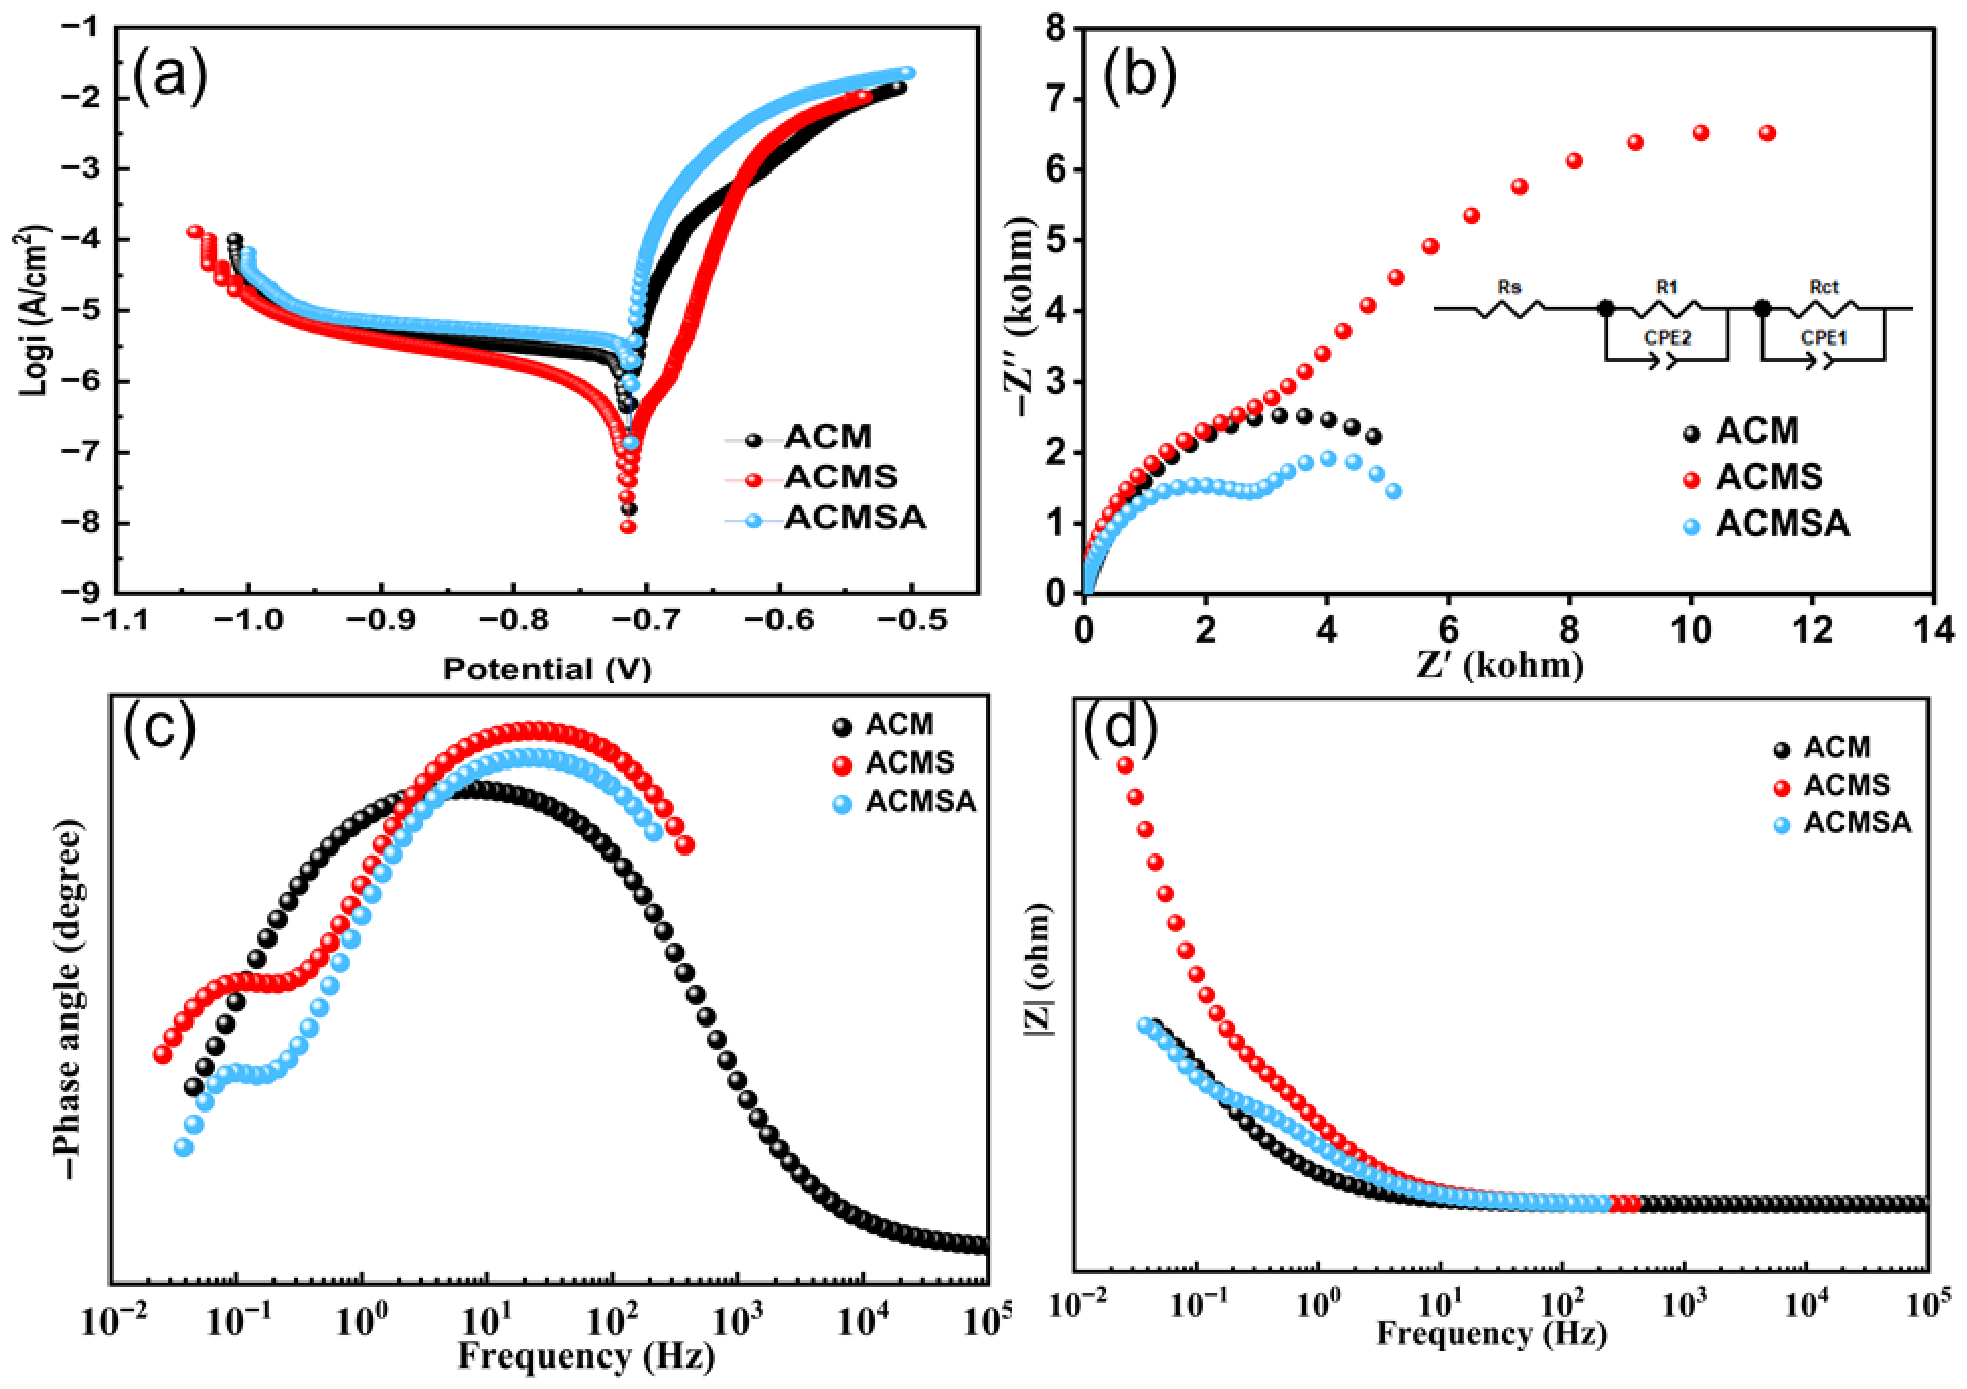
The electrochemical corrosion behavior of the ACM, ACMS, and ACMSA alloys was evaluated in 3.5 wt.% NaCl solution. Prior to polarization measurements, the open-circuit potential (OCP) of the samples was monitored for 1 h to ensure stabilization. The stabilized OCP values are −0.765 V for Al–Cu–Mg, −0.715 V for Al–Cu–Mg–Si, and −0.745 V for Al–Cu–Mg–Si–Ag alloys. The relatively more positive OCP of the Al–Cu–Mg–Si alloy suggests a lower thermodynamic tendency for corrosion, whereas the Al–Cu–Mg alloy exhibits the most negative OCP, indicating a higher corrosion susceptibility.
Subsequently, potentiodynamic polarization and electrochemical impedance spectroscopy measurements were carried out, with the results shown in Figure 11 and the extracted parameters summarized in Table 3 and Table 4. All alloys exhibit typical anodic dissolution behavior in the chloride-containing electrolyte. The ACMS alloy exhibits the lowest corrosion current density of 0.897 μA cm−2, compared with 2.22 μA cm−2 for ACM and 5.22 μA cm−2 for ACMSA.
Figure 11.
Electrochemical response of the ACM, ACMS, and ACMSA alloys in 3.5 wt.% NaCl solution: (a) potentiodynamic polarization curves; (b) Nyquist impedance plots; (c) Bode phase-angle plots; and (d) Bode magnitude plots.
Table 3.
Tafel parameters obtained from potentiodynamic polarization curves in 3.5 wt.% NaCl solution.
Table 4.
Fitted resistive parameters from EIS equivalent circuit analysis.
Furthermore, the ACMS alloy displays a more noble corrosion potential relative to ACM and ACMSA. Notably, the trend of corrosion potentials is consistent with the stabilized OCP values, with the Al–Cu–Mg–Si alloy exhibiting the most positive values, followed by Al–Cu–Mg–Si–Ag and Al–Cu–Mg. This consistency indicates that the initial electrochemical state of the alloys is well reflected in their polarization behavior. Based on the combined consideration of corrosion current density, corrosion potential, and the overall electrochemical results, the corrosion resistance ranks as ACMS > ACM > ACMSA.
For further comparison, the electrochemical parameters obtained in this study were compared with those reported for Al–Cu–Mg alloys in the literature [23,24,25,26]. Previous studies report corrosion current densities of 0.267 μA cm−2 for Al–Cu–Mg alloys in the T6 condition [23] and 2.29 μA cm−2 for typical 2024 Al alloy (Cu/Mg = 2.38) [24].
In the present work, the ACMS alloy exhibits a corrosion current density of 0.897 μA cm−2, which lies within the lower range of reported values for Al–Cu–Mg alloys and is lower than that of typical 2024 Al alloy, indicating relatively favorable corrosion resistance. In contrast, the ACM and ACMSA alloys show significantly higher corrosion current densities of 2.22 and 5.22 μA cm−2, respectively, indicating poorer corrosion resistance than ACMS.
These results are consistent with the general understanding that reduced electrochemical heterogeneity contributes to improved corrosion performance in Al–Cu–Mg-based alloys.
The Nyquist plots display depressed capacitive arcs, indicative of non-ideal interfacial capacitive behavior. Fitted resistive parameters reveal similar solution resistances for all alloys; however, the interfacial resistances differ markedly. The ACMS alloy exhibits the highest charge-transfer resistance, substantially exceeding that of ACM and ACMSA. Taken together, the polarization and EIS results consistently indicate that Si addition enhances the electrochemical corrosion resistance of the ACM alloy, whereas the further addition of Ag leads to a pronounced deterioration in corrosion performance.
3.5. Salt Spray Corrosion Behavior
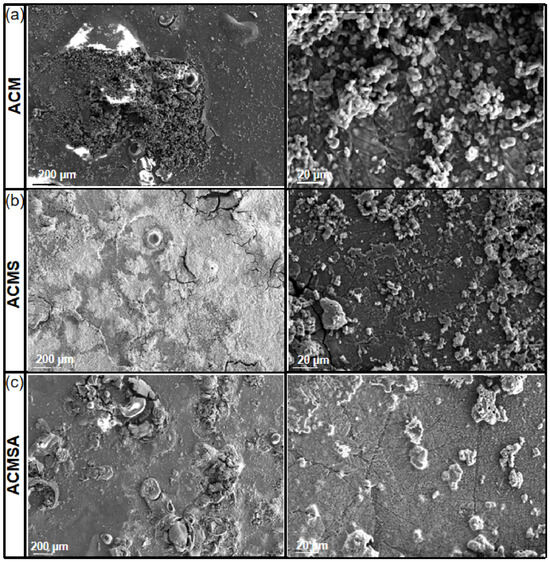
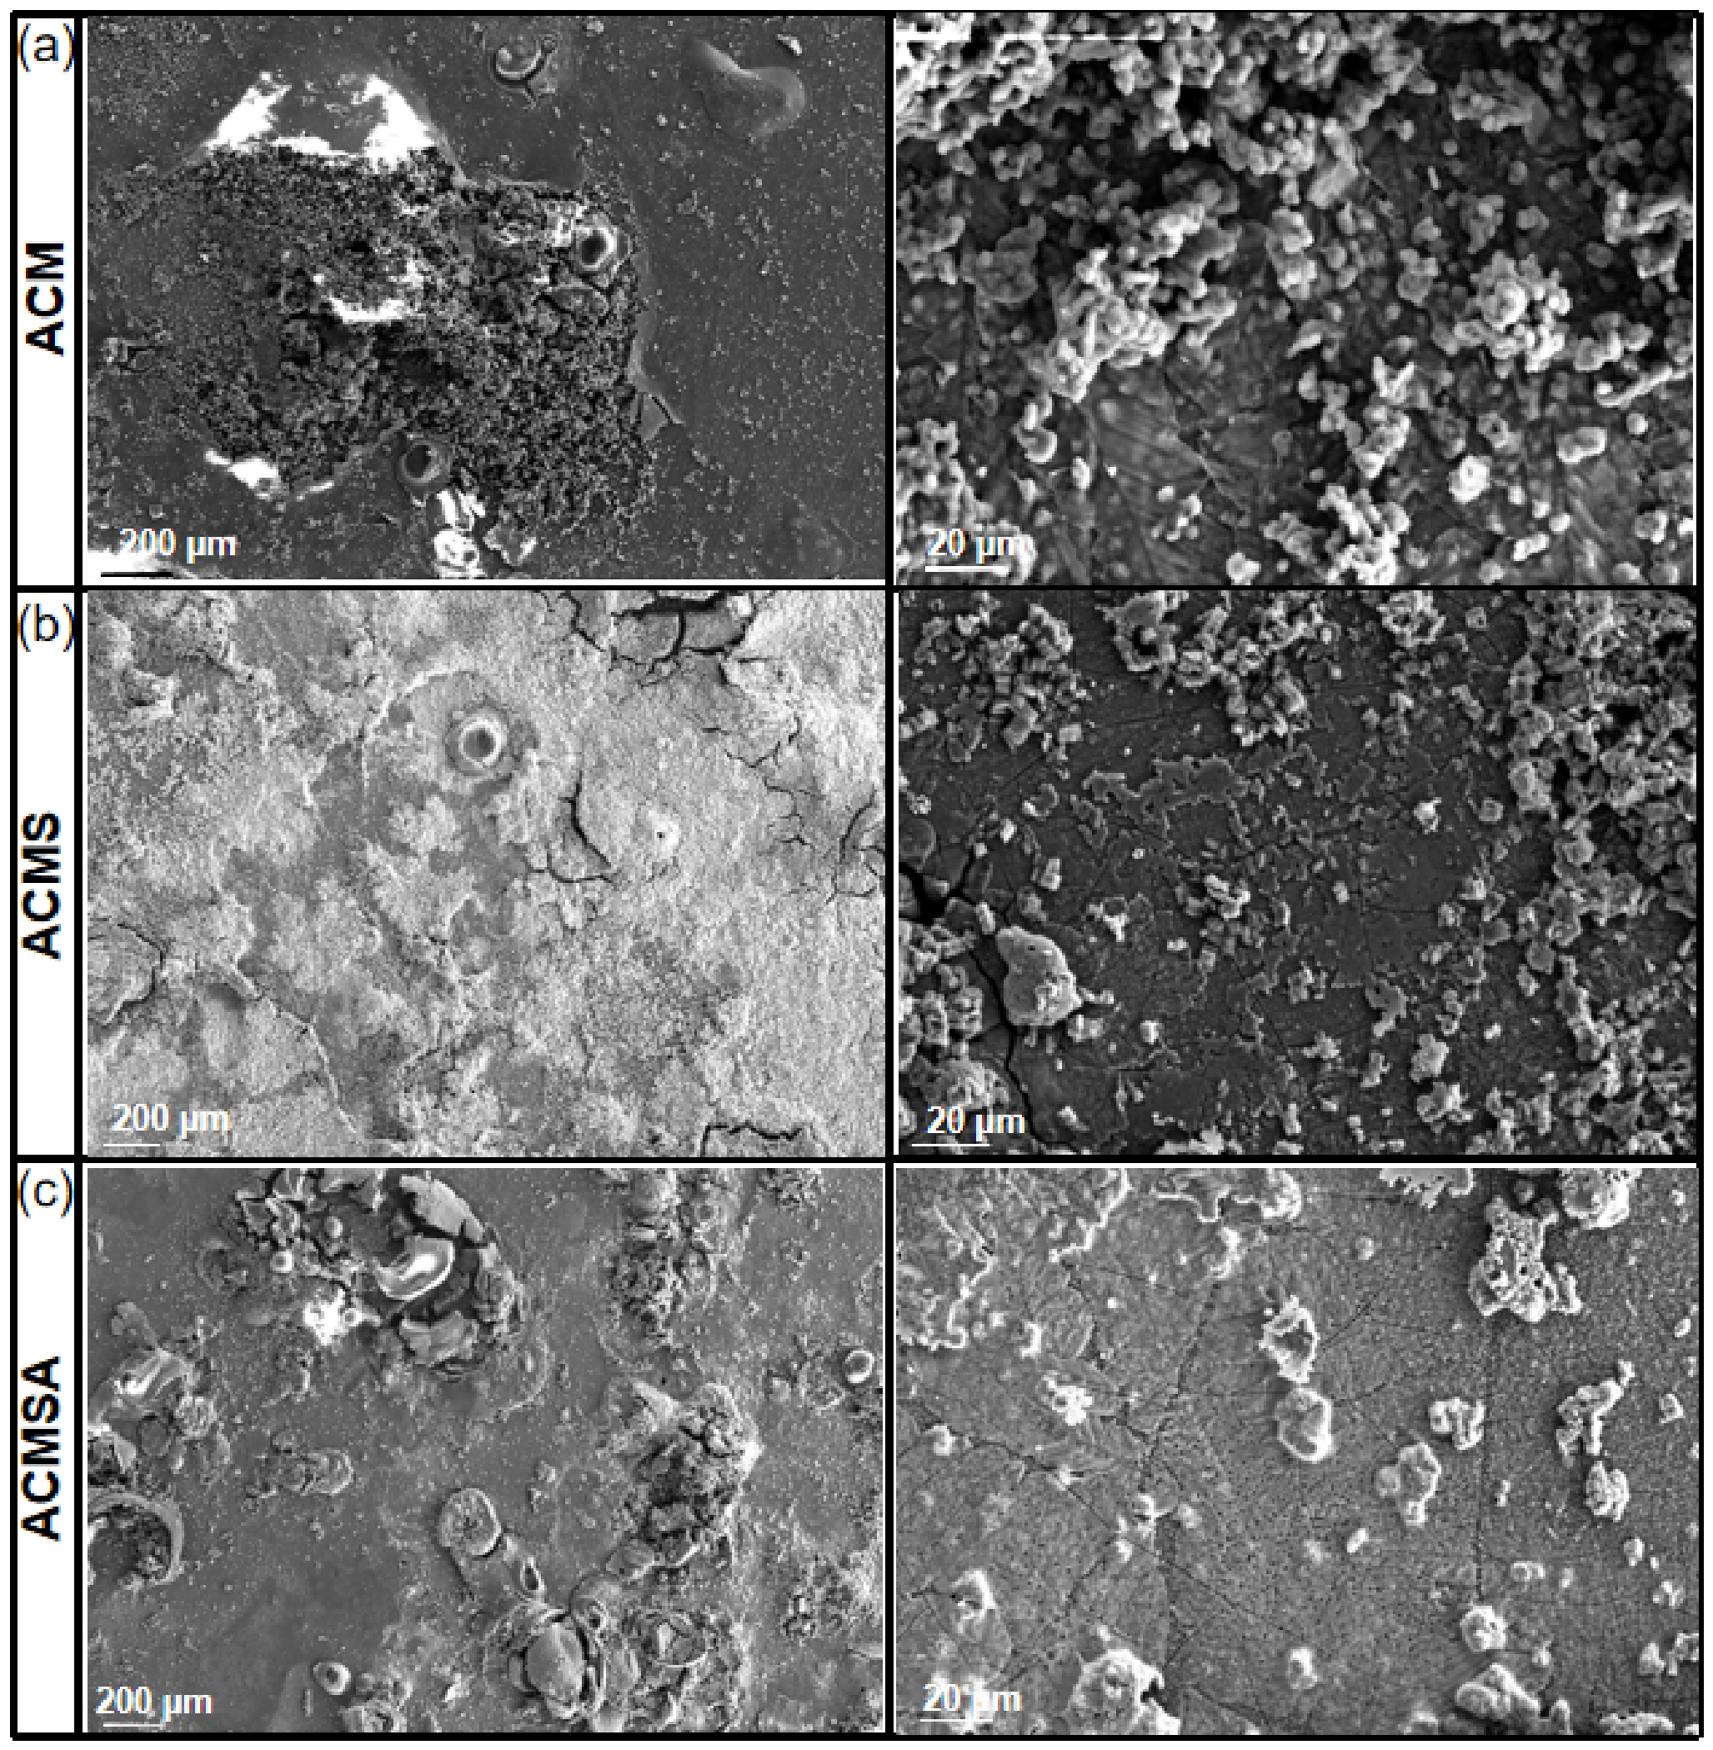
SEM observations of the corroded surfaces after 7 days of salt spray exposure are shown in Figure 12. ACM exhibits extensive corrosion-product accumulation and pronounced localized attack, while ACMS shows more limited corroded regions with comparatively milder surface degradation. ACMSA displays more strongly localized damage with discrete corroded patches and pits, indicating a higher tendency toward localized corrosion.
Figure 12.
SEM images showing the surface morphology of the investigated alloys after 7 days of salt spray corrosion: (a) ACM; (b) ACMS; and (c) ACMSA.
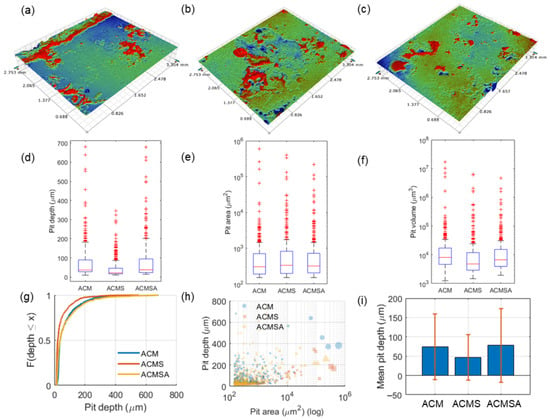
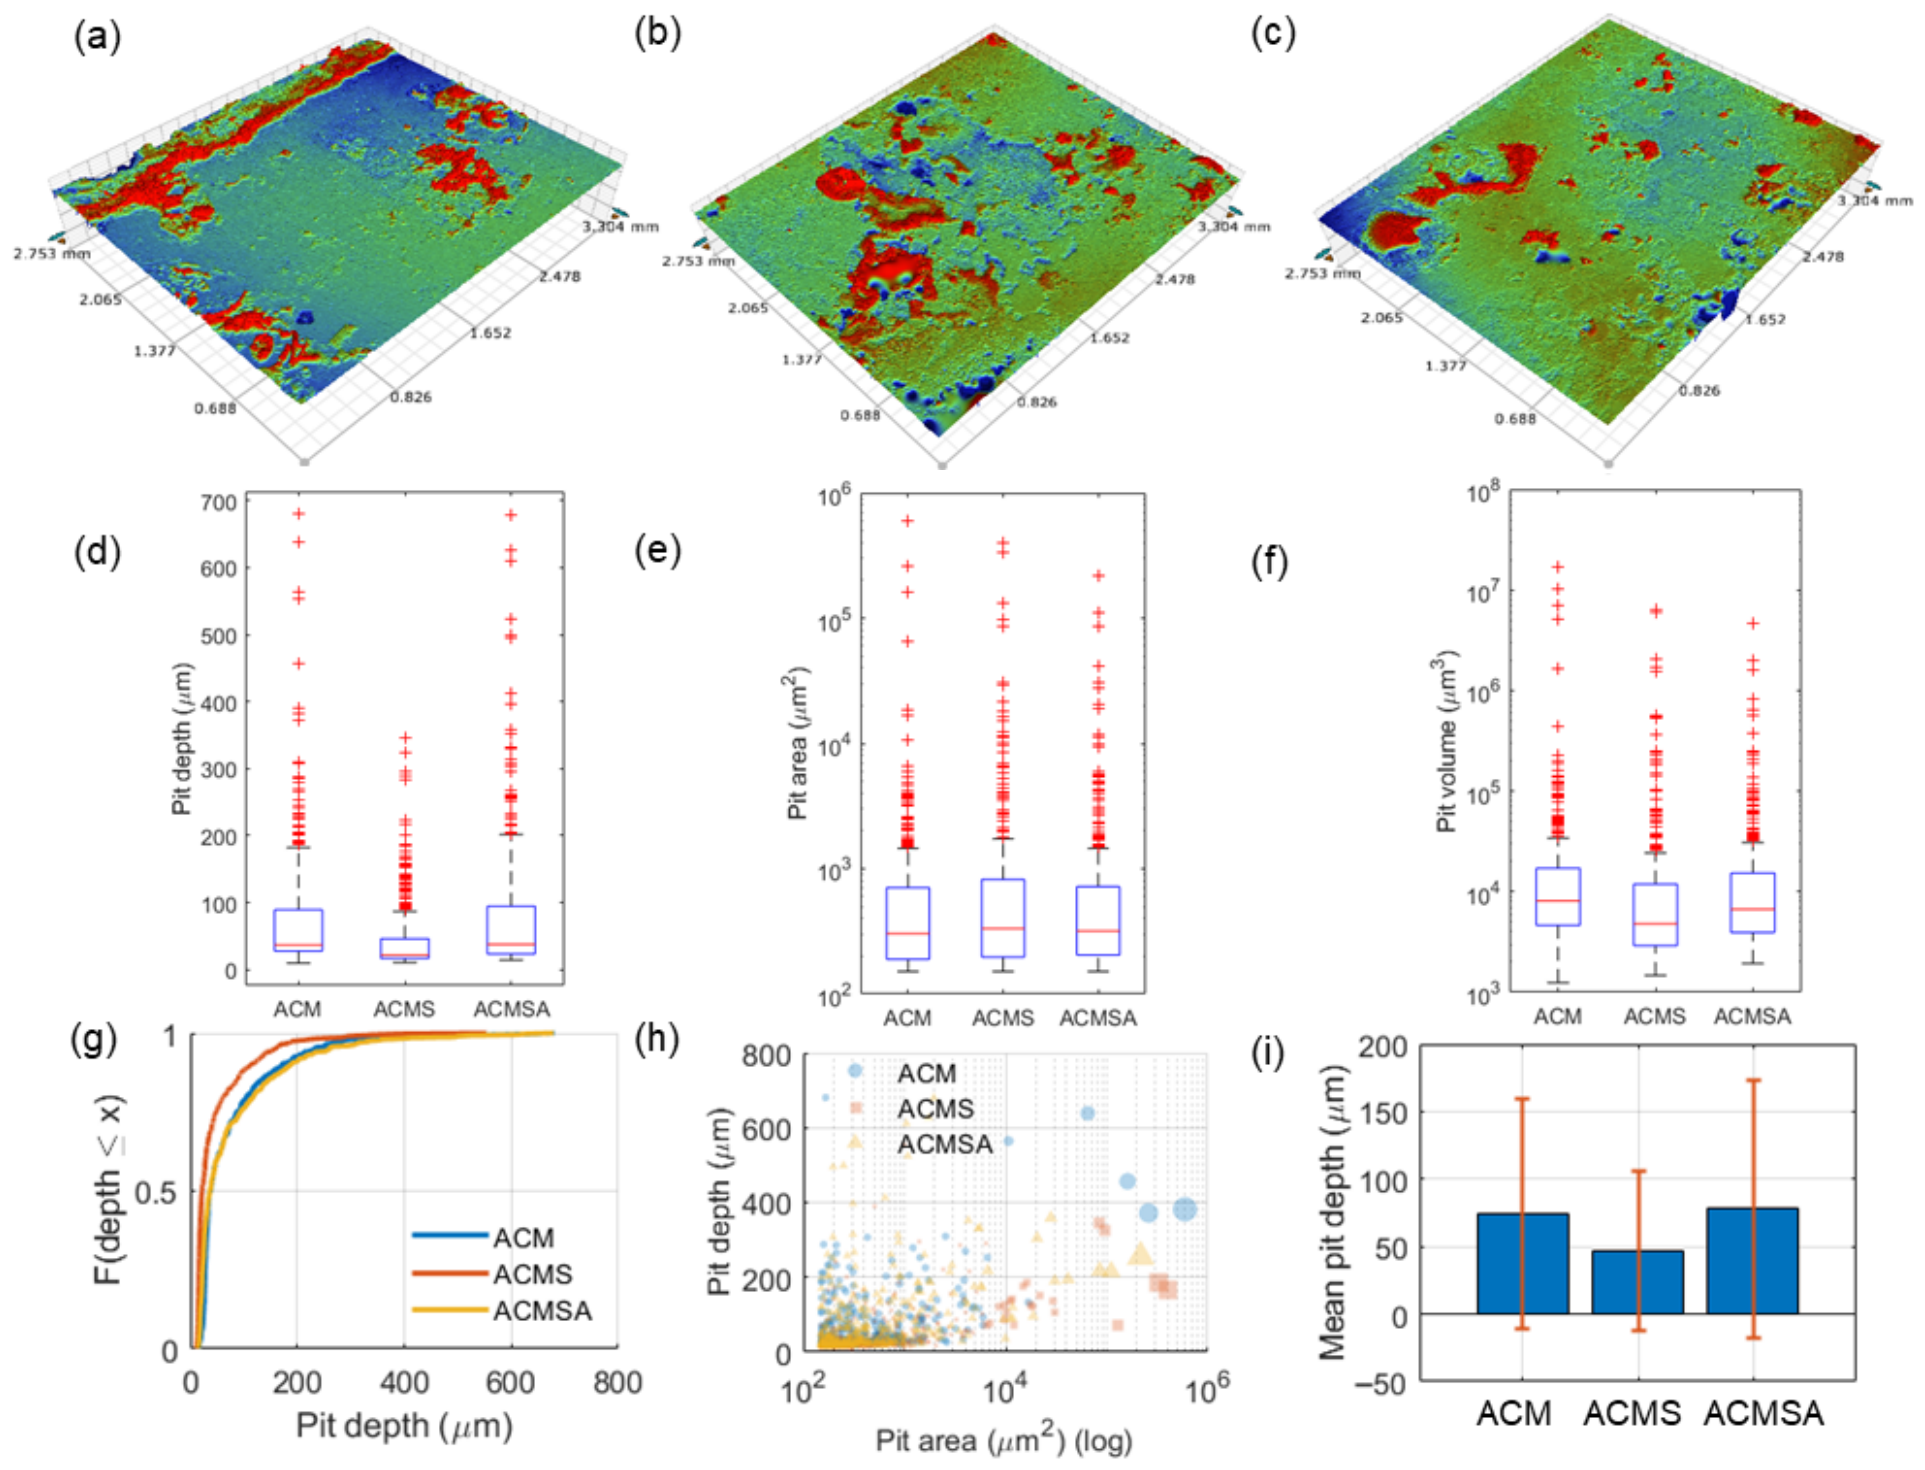
After 11 days of salt spray exposure, the investigated alloys exhibited localized corrosion with distinct pitting characteristics. A more quantitative assessment of pitting corrosion was carried out by white-light profilometry and statistical analysis, as shown in Figure 13. ACMS presents a markedly reduced pit-depth population compared with ACM and ACMSA. Specifically, the median and mean pit depths for ACMS are 22.316 µm and 46.90 ± 59.29 µm, respectively, which are lower than those of ACM and ACMSA. The empirical cumulative distribution functions further confirm the lowest probability of deep-pit formation for ACMS, whereas ACMSA exhibits a heavier upper tail. Overall, the severity of pitting corrosion follows the order ACMSA > ACM > ACMS.
Figure 13.
Characterization of pitting corrosion in the investigated alloys after 11 days of salt spray testing: (a–c) representative SEM images of the corroded surfaces; (d–f) quantitative pit metrics showing pit depth, pit area, and pit volume distributions; (g) cumulative distribution function of pit depth; (h) relationship between pit depth and pit area; and (i) comparison of mean pit depth across the three alloy compositions.
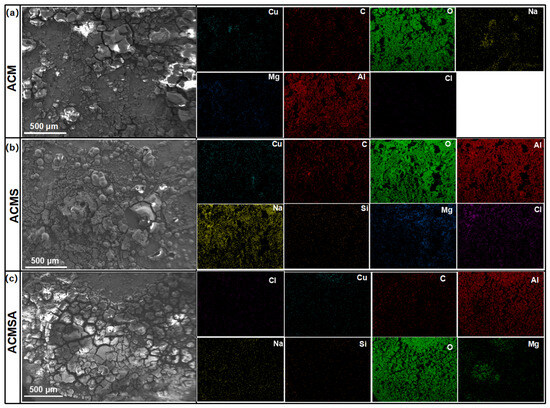
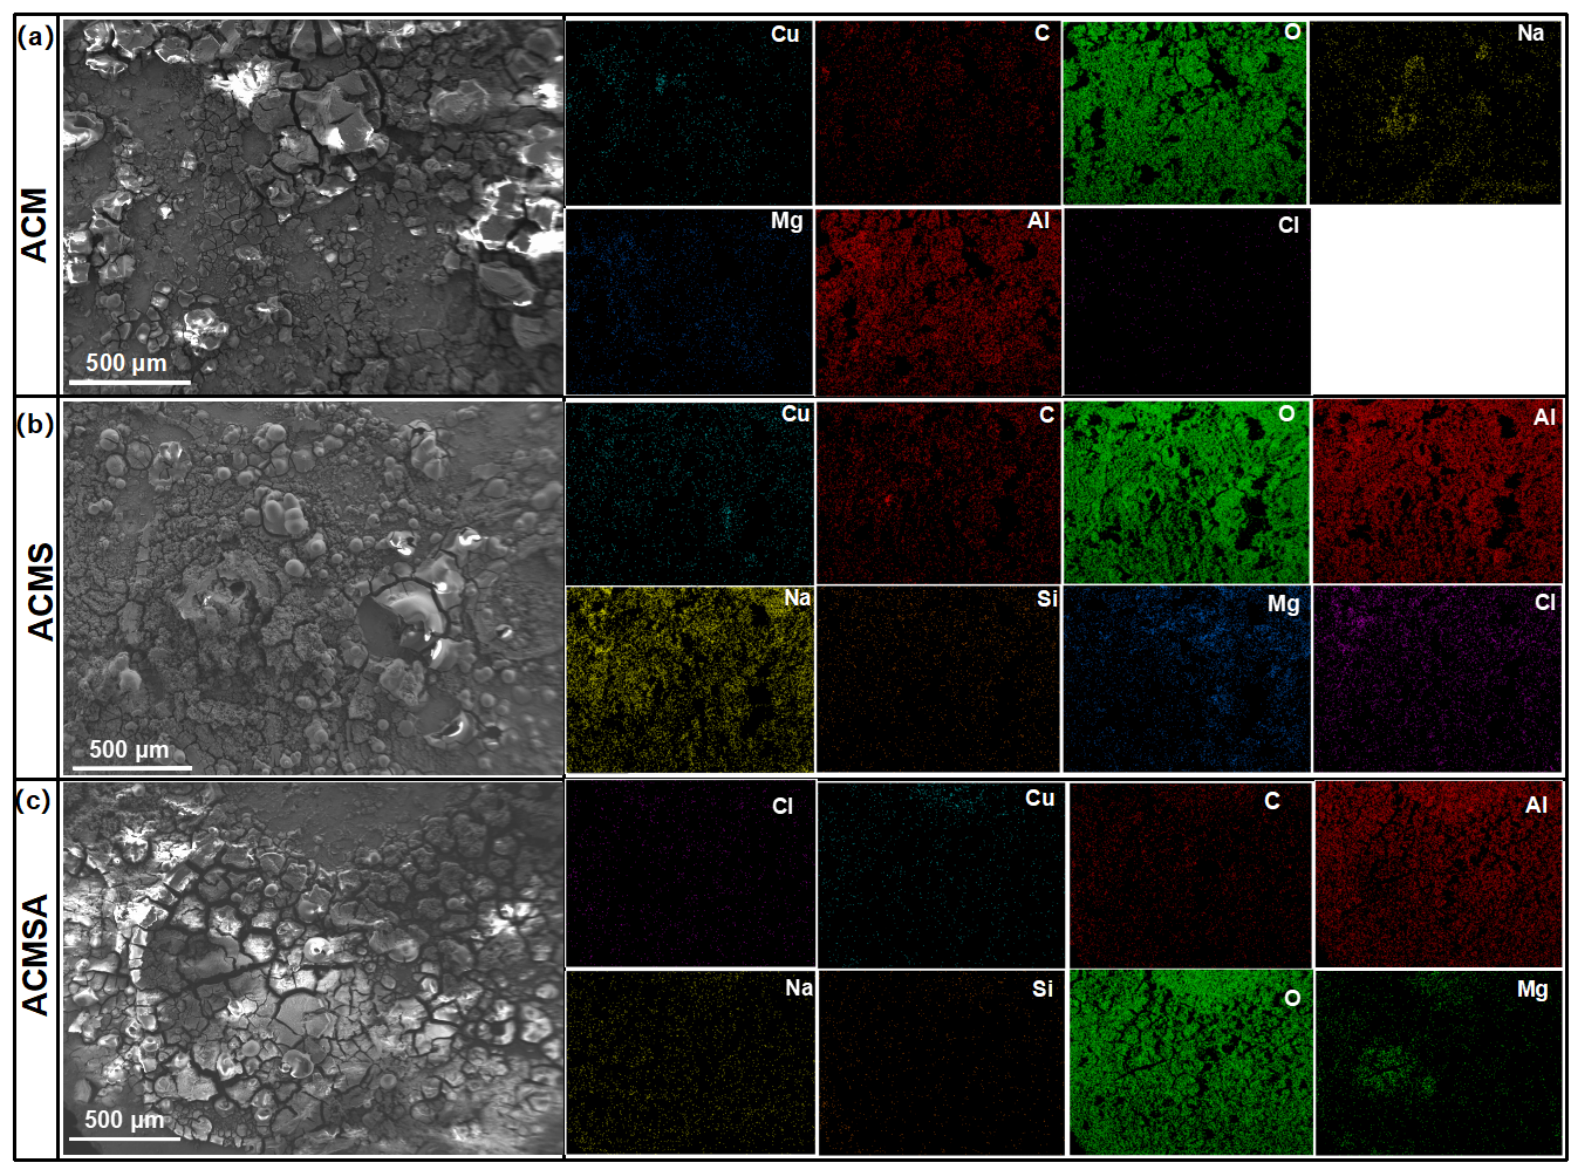
To further identify the composition of corrosion products formed during the salt spray test, EDS elemental mapping was performed on the corroded surfaces, as shown in Figure 14. The results indicate that the corrosion products are mainly enriched in O and Al, suggesting the formation of aluminum oxides and/or hydroxides. Meanwhile, localized enrichment of Cu and Mg is observed in certain regions, which can be attributed to micro-galvanic interactions between the Al matrix and second-phase particles [27]. In addition, Cl and Na signals are detected, which are mainly associated with residual salt species deposited during the salt spray exposure.
Figure 14.
SEM morphologies and corresponding EDS elemental distribution maps of the investigated alloys after salt spray corrosion: (a) ACM, (b) ACMS, and (c) ACMSA.
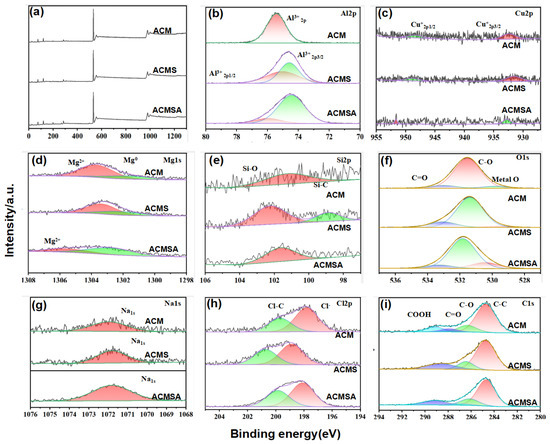
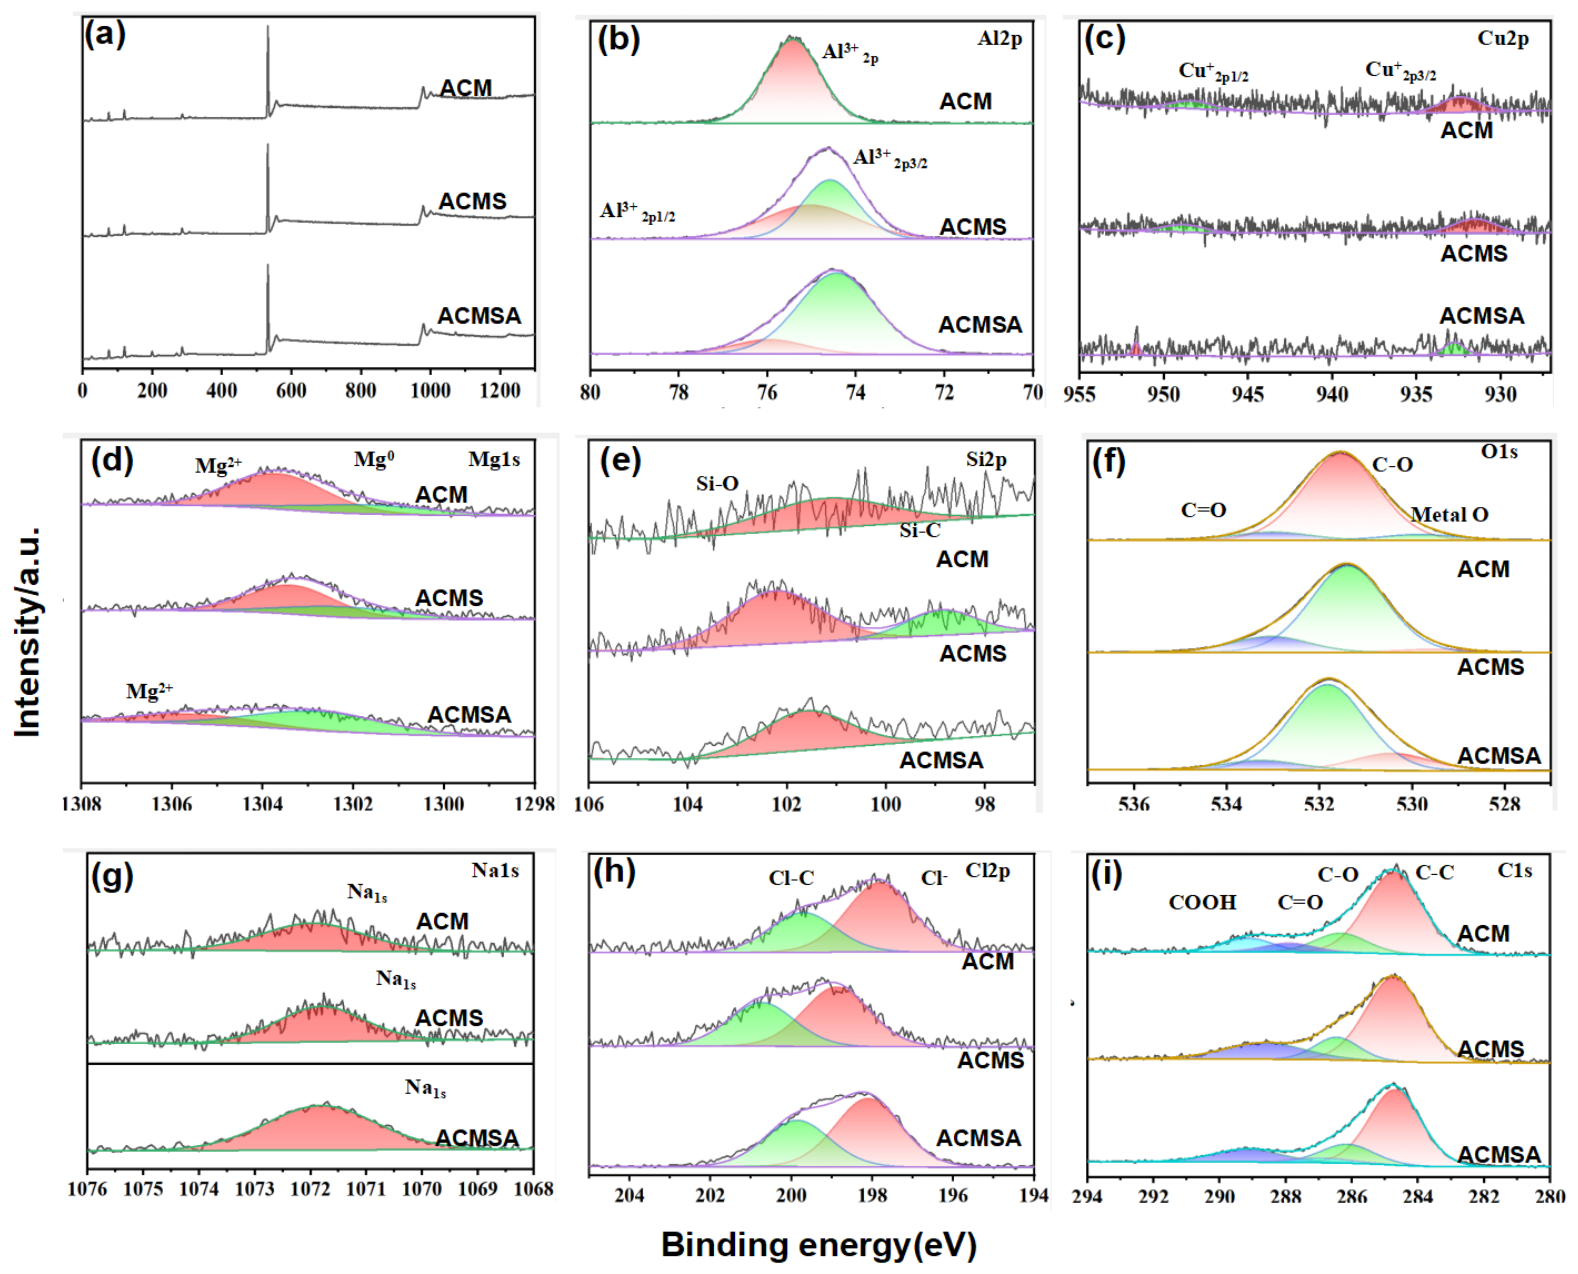
To further clarify the chemical states of the corrosion products identified by EDS analysis, XPS measurements were carried out, as shown in Figure 15. The XPS results indicate that Al is predominantly present in oxidized states, confirming that the corrosion film is mainly composed of aluminum oxides/hydroxides. The O 1s spectra reveal the coexistence of oxide (O2−) and hydroxide species, suggesting a mixed structure consisting of relatively dense oxides and more hydrated components [27].
Figure 15.
XPS spectra of the investigated alloys after salt spray corrosion: (a) survey spectra; high-resolution spectra of (b) Al 2p, (c) Cu 2p, (d) Mg 1s, (e) Si 2p, (f) O 1s, (g) Na 1s, (h) Cl 2p, and (i) C 1s for Al–Cu–Mg (ACM), Al–Cu–Mg–Si (ACMS), and Al–Cu–Mg–Si–Ag (ACMSA) alloys.
Comparative analysis of the XPS spectra indicates that the corrosion film formed on the ACMS alloy exhibits a more concentrated oxide-related signal and a relatively uniform chemical environment, suggesting a relatively more compact and stable film structure. In contrast, the ACMSA alloy shows a broader distribution of oxygen-related species and a more heterogeneous chemical environment, suggesting a less uniform and possibly more porous corrosion film.
These combined observations from SEM, EDS, and XPS demonstrate that the introduction of Si promotes the formation of a more stable and protective corrosion film, thereby improving corrosion resistance. In contrast, the addition of Ag leads to a less uniform corrosion film and enhanced localized electrochemical activity, resulting in more severe pitting corrosion.
4. Discussion
4.1. Influence of Si and Ag Additions on Precipitation Behavior and Hardening Response
The accelerated hardening behavior observed in the Si-containing alloys is closely related to the modification of precipitation behavior in low Cu/Mg ratio Al–Cu–Mg alloys. Previous studies have shown that minor Si additions can participate in the early clustering process and promote the formation of Si-modified GPB zones, which serve as effective precursors for subsequent S-phase precipitation [5,10,18]. These Si-containing clusters provide additional heterogeneous nucleation sites, thereby accelerating precipitation kinetics during the early stages of aging.
As a result, the Si-containing alloys reach a comparable hardness level within a significantly shorter aging time than the base alloy. From a strengthening perspective, the refinement and increased number density of nanoscale precipitates reduce the effective interparticle spacing for dislocation motion. A smaller obstacle spacing leads to a higher resistance to dislocation glide, allowing comparable strengthening to be achieved at shorter aging times [1]. Therefore, the accelerated hardening response in the ACMS alloy can be mainly attributed to the enhanced nucleation kinetics and refined precipitation structure induced by Si addition.
When Ag is further introduced, the precipitation characteristics become more complex due to the formation of additional metastable phases. Previous studies have reported that Ag strongly segregates at the precipitate/matrix interface and reduces the interfacial energy of Ω precipitates, thereby stabilizing their formation on {111}α planes [11,12,22]. The introduction of Ω precipitates leads to a multi-phase precipitation structure consisting of S, Q″, and Ω phases. Although this multi-phase structure can still contribute to rapid hardening, the coexistence of different precipitate species may also increase microstructural heterogeneity within the matrix.
Overall, Si addition mainly promotes a refined and dense precipitation structure that accelerates early-stage hardening, whereas further Ag addition introduces additional precipitate phases and increases structural complexity. These differences in precipitation characteristics not only influence the hardening kinetics but also contribute to the distinct corrosion behaviors observed among the investigated alloys.
4.2. Corrosion Behavior and Mechanisms
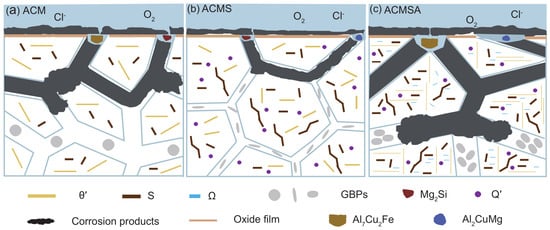
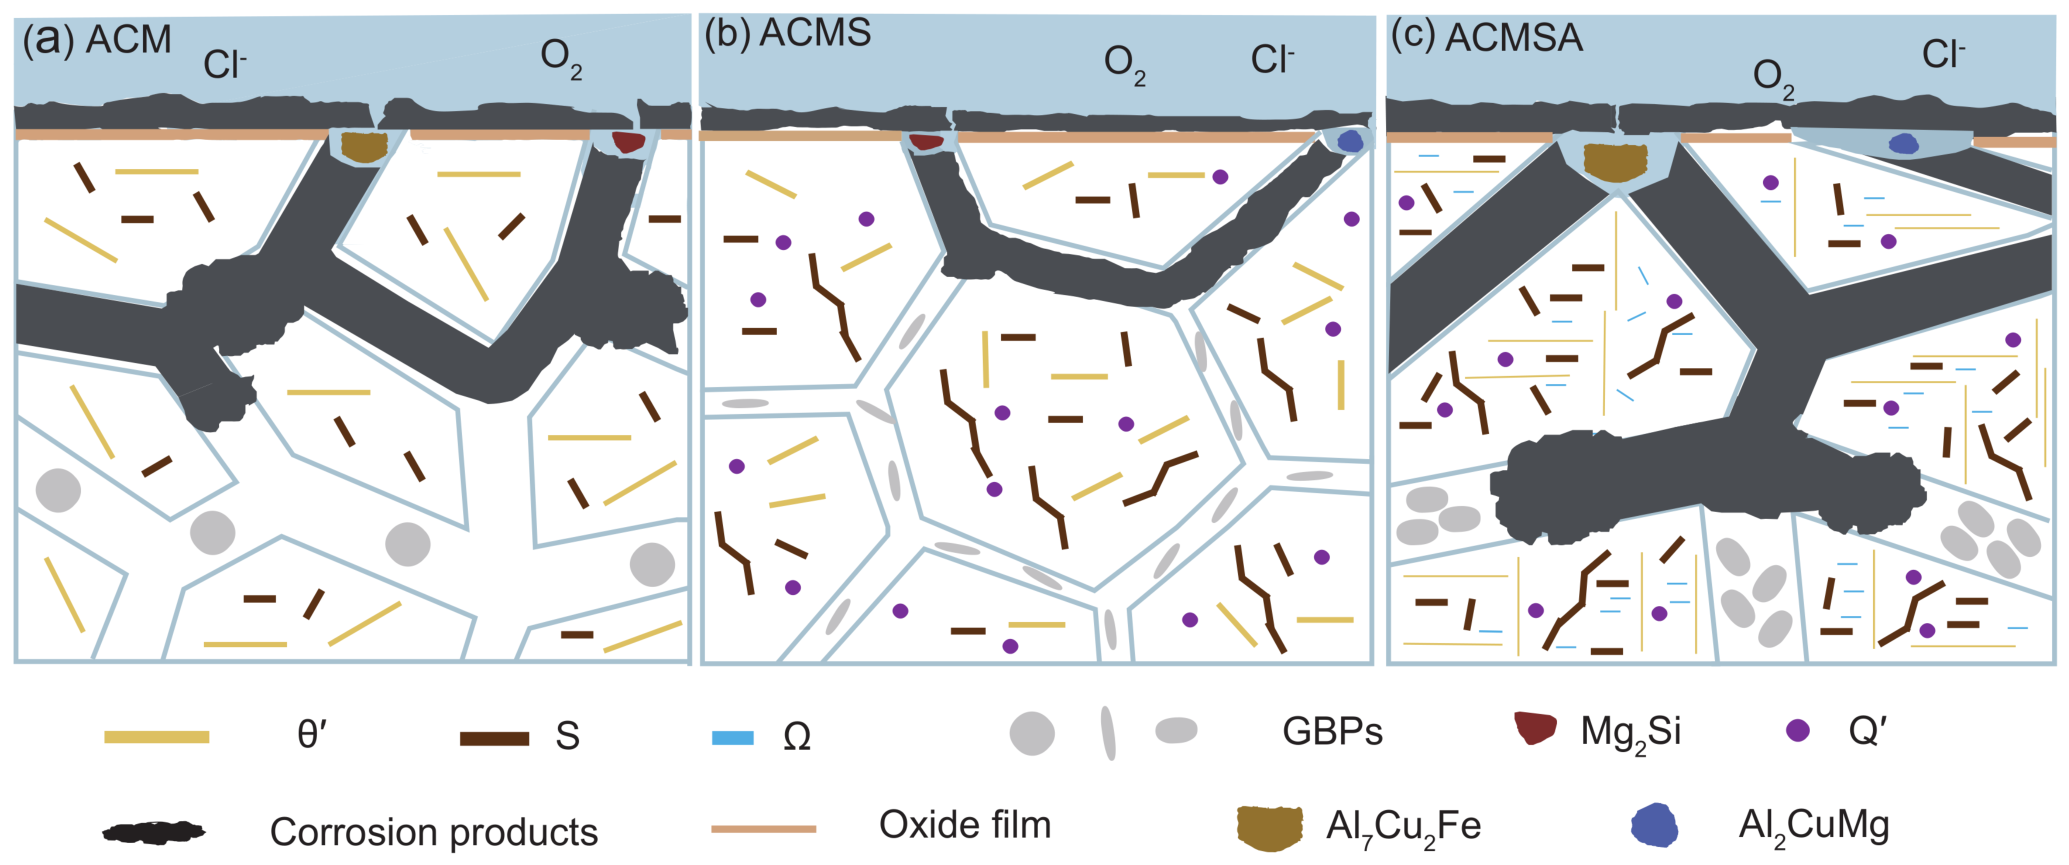
Figure 16 schematically summarizes the corrosion mechanisms inferred for the investigated Al–Cu–Mg-based alloys based on the combined evidence from the grain-boundary precipitation structure and PFZ characteristics (Figure 7), the intergranular corrosion cross-sections (Figure 10), and the electrochemical/localized corrosion behavior (Figure 11 and Figure 13). This figure serves as a mechanistic illustration, rather than representing a direct one-to-one experimental observation. The identification of corrosion products is supported by the SEM–EDS (Figure 14) and XPS (Figure 15) analyses conducted in this study. Therefore, the distribution of corrosion products along the corrosion path, as illustrated in the figure, should be regarded as a mechanistic interpretation based on the results presented here, which aligns with previous reports on aluminum alloys in the literature [28]. The differences in corrosion behavior primarily arise from variations in grain-boundary structure, intragranular precipitate distribution, and the presence of coarse intermetallic particles, all of which contribute to the electrochemical heterogeneity within the alloy.
Figure 16.
Schematic representation of the corrosion processes occurring in the investigated alloys under chloride exposure: (a) ACM, (b) ACMS, and (c) ACMSA.
The base ACM alloy contains relatively coarse grain-boundary precipitates with large spacing together with a wide PFZ. The solute-depleted PFZ becomes anodically active relative to the surrounding matrix, while Cu-rich S-phase precipitates and grain-boundary particles act as local cathodes. This combination produces strong electrochemical heterogeneity along grain boundaries and promotes localized dissolution [3,7,13,20,29].
After Si addition, the precipitation structure is significantly refined. The grain-boundary precipitates become smaller and more closely spaced, while the PFZ width decreases markedly. The reduced PFZ width alleviates solute depletion near the grain boundary, and the refined precipitate distribution promotes a more homogeneous electrochemical environment. As a result, the driving force for micro-galvanic coupling is weakened and the corrosion process is effectively suppressed [13,20,29,30].
With further Ag addition, the precipitation structure becomes more complex due to the coexistence of multiple precipitate species, including S, , Ω, and Q″ phases. The presence of multiple precipitate types increases interfacial complexity and enhances local electrochemical heterogeneity within the matrix. Although the PFZ width remains narrower than that of the base alloy, the coexistence of multiple intermetallic particles and precipitates further increases microstructural heterogeneity, which can promote the formation of localized cathodic sites and enhance pit initiation [7,31].
Consequently, the combined effects of grain-boundary structure, precipitate structure, and intermetallic particle distribution determine the corrosion behavior of the investigated alloys. Among them, the ACMS alloy exhibits the most homogeneous microstructure and therefore the lowest electrochemical heterogeneity, which explains its lowest corrosion current density and shallowest corrosion depth.
The corrosion products formed on the alloy surfaces were further analyzed based on the combined EDS and XPS results. The EDS elemental mapping reveals that the corrosion products are mainly enriched in Al and O, indicating the formation of aluminum oxides and/or hydroxides. Local enrichment of Cu and Mg is also observed, which can be attributed to the redistribution of alloying elements during corrosion and the micro-galvanic interactions between the Al matrix and second-phase particles.
XPS analysis further suggests that the corrosion products primarily consist of Al2O3 and Al(OH)3, with minor contributions from Cu- and Mg-containing species. The detected Cl signal is mainly associated with residual chloride ions from the salt spray environment rather than stable corrosion products.
The anodic dissolution of aluminum during corrosion can be described as:
followed by the hydrolysis and precipitation reactions:
Based on these observations, the corrosion mechanism illustrated in Figure 16 can be rationalized. The initiation of corrosion is associated with micro-galvanic coupling between the Al matrix and second-phase particles, leading to localized anodic dissolution [23,32]. The subsequent formation of corrosion products partially covers the surface; however, their non-uniform distribution and limited protectiveness may facilitate further localized attack [7].
5. Conclusions
This work systematically investigated the effects of Si and Ag microalloying on precipitation behavior, mechanical properties, and corrosion performance of low Cu/Mg ratio Al–Cu–Mg-based alloys. By combining detailed microstructural characterization with mechanical and corrosion testing, the relationships between precipitation regulation, grain-boundary structure, and corrosion behavior were clarified. The main conclusions are summarized as follows:
- 1.
- Si addition significantly accelerated the age-hardening response of the low Cu/Mg ratio Al–Cu–Mg alloy. The Si-containing alloys reached a hardness of about 147 HV after only 6 h of aging, whereas the base alloy required 24 h to achieve a comparable level.
- 2.
- Si addition refined intragranular S-phase precipitates and increased their estimated areal number density, while also markedly narrowing the PFZ from 306 ± 21 nm in ACM to 122 ± 11 nm in ACMS. Further Ag addition introduced coherent Ω precipitates and resulted in a more complex multi-phase precipitation structure.
- 3.
- Among the investigated alloys, ACMS exhibited the best corrosion resistance, showing the lowest corrosion current density (A cm−2), the highest interfacial resistance, and the shallowest intergranular corrosion depth (118.4 µm).
- 4.
- Further Ag addition increased precipitation complexity and strengthening potential, but deteriorated corrosion performance. The ACMSA alloy showed the highest corrosion current density, the lowest charge-transfer resistance, and the deepest intergranular corrosion depth (133.8 µm), indicating enhanced susceptibility to localized corrosion.
Overall, this work demonstrates that Si microalloying provides an effective strategy to simultaneously accelerate aging kinetics and improve corrosion resistance in Al–Cu–Mg alloys, whereas further Ag addition enhances precipitation complexity and strengthening potential but may adversely affect localized corrosion behavior.
Author Contributions
Conceptualization, Z.L.; methodology, G.H., S.P. and C.D.; validation, G.H., S.P. and Q.C.; formal analysis, G.H.; investigation, G.H.; resources, Z.L.; data curation, G.H.; writing—original draft preparation, G.H.; writing—review and editing, Z.L., S.P., C.D., Q.C. and K.F.; visualization, G.H.; supervision, Z.L.; project administration, Z.L.; funding acquisition, Z.L. All authors have read and agreed to the published version of the manuscript.
Funding
This work was supported by the Guangxi Science and Technology Major Program (No. AA23073019), the Natural Science Foundation of Guangxi Province (No. 2024GXNSFDA010014), the National Natural Science Foundation of China (No. 12364018), and the Innovation Project of Guangxi Graduate Education (No. YCBZ2024003).
Institutional Review Board Statement
Not applicable.
Informed Consent Statement
Not applicable.
Data Availability Statement
The original contributions presented in this study are included in the article. Further inquiries can be directed to the corresponding author.
Acknowledgments
The authors acknowledge the Center for Instrumental Analysis of Guangxi University for providing research facilities and experimental support.
Conflicts of Interest
The authors declare no conflicts of interest. The funders had no role in the design of the study; in the collection, analyses, or interpretation of data; in the writing of the manuscript; or in the decision to publish the results.
Abbreviations
| ACM | Al–Cu–Mg alloy |
| ACMS | Al–Cu–Mg–Si alloy |
| ACMSA | Al–Cu–Mg–Si–Ag alloy |
| IGC | Intergranular corrosion |
| PFZ | Precipitation-free zone |
| SEM | Scanning electron microscopy |
| TEM | Transmission electron microscopy |
| EBSD | Electron backscatter diffraction |
| EDS | Energy-dispersive spectroscopy |
| EIS | Electrochemical impedance spectroscopy |
| OCP | Open-circuit potential |
| UTS | Ultimate tensile strength |
| KAM | Kernel average misorientation |
| GOS | Grain orientation spread |
References
- Polmear, I. Light Alloys: From Traditional Alloys to Nanocrystals; Elsevier: Vienna, Austria, 2005. [Google Scholar]
- Williams, J.C.; Starke, E.A., Jr. Progress in structural materials for aerospace systems. Acta Mater. 2003, 51, 5775–5799. [Google Scholar] [CrossRef] [Scilit]
- Little, D.; Connolly, B.; Scully, J. An electrochemical framework to explain the intergranular stress corrosion behavior in two Al–Cu–Mg–Ag alloys as a function of aging. Corros. Sci. 2007, 49, 347–372. [Google Scholar] [CrossRef] [Scilit]
- Immarigeon, J.; Holt, R.; Koul, A.; Zhao, L.; Wallace, W.; Beddoes, J. Lightweight materials for aircraft applications. Mater. Charact. 1995, 35, 41–67. [Google Scholar] [CrossRef] [Scilit]
- Niu, F.; Yang, W.; Zhang, G.; Duan, S.; Guo, Y.; Fan, T.; Ming, W. Atomic mechanism of enhanced thermal stability in Al-Cu-Mg-Si alloys with a low Cu/Mg ratio. Mater. Charact. 2024, 217, 114417. [Google Scholar] [CrossRef] [Scilit]
- Ren, L.; Tan, R.; Zhang, D.; Zhang, X. Regulating grain boundary element distribution of Al-Cu alloy to improve corrosion resistance by boron addition. Corros. Sci. 2025, 244, 112665. [Google Scholar] [CrossRef] [Scilit]
- Deng, P.; Mo, W.; Ouyang, Z.; Ling, K.; Luo, B.; Bai, Z. Microstructural evolution and corrosion mechanism of micro-alloyed 2024 (Zr, Sc, Ag) aluminum alloys. Corros. Sci. 2023, 224, 111476. [Google Scholar] [CrossRef] [Scilit]
- Fang, N.; Wang, H.; Dong, D.; Wei, Z.; Zhu, L.; Zhu, D.; Wang, Z. Unraveling the pressure-induced microstructural origin of enhanced corrosion resistance in a high-strength Al-Si-Cu-Mg alloy. Corros. Sci. 2025, 252, 112972. [Google Scholar]
- Lu, Q.; Hu, J.; Yang, T.; Wang, Y.; Xiao, Y.; Li, X.; Xiao, N.; Wang, J.; Wang, Z.; Li, H.; et al. Revisiting the effect of Ag additions on Ω precipitation and heat resistance of Al–Cu–Mg–Si–Ag alloys. Mater. Sci. Eng. A 2023, 885, 145539. [Google Scholar] [CrossRef] [Scilit]
- Niu, F.; Chen, J.; Duan, S.; Ming, W.; Lu, J.; Wu, C.; Le, Z. The effect of pre-deformation on the precipitation behavior of AlCuMg (Si) alloys with low Cu/Mg ratios. J. Alloys Compd. 2020, 823, 153831. [Google Scholar] [CrossRef] [Scilit]
- Yang, S.; Zhao, X.; Chen, H.; Wilson, N.; Nie, J. Atomic structure and evolution of a precursor phase of Ω precipitate in an Al-Cu-Mg-Ag alloy. Acta Mater. 2022, 225, 117538. [Google Scholar]
- Liu, Y.; Zhang, Y.; Xiao, N.; Li, X.; Dai, F.Z.; Chen, M. Investigating interfacial segregation of Ω/Al in Al–Cu alloys: A comprehensive study using density functional theory and machine learning. Acta Mater. 2024, 279, 120294. [Google Scholar] [CrossRef] [Scilit]
- Inagaki, M.; Nishimoto, M.; Takaya, M.; Muto, I. In situ microscopy and electrochemical characteristics of initiation of intergranular corrosion of aging-treated Al–1Mg–0.65 Si–0.8 Cu alloy in 0.1 M NaCl. Corros. Sci. 2025, 252, 112985. [Google Scholar] [CrossRef] [Scilit]
- Zhang, H.; Yu, Z.; Wu, R.; Ma, X.; Feng, X.; Ma, Z.; Turakhodjaev, N.; Betsofen, S. Evading the strength-corrosion trade-off in high-Li-content Al-Cu-Li alloy through high-pressure heat treatment and artificial aging. Corros. Sci. 2025, 246, 112720. [Google Scholar] [CrossRef] [Scilit]
- Duan, S.; Huang, L.; Yang, S.; Zhou, Z.; Song, S.; Yang, X.; Chen, Y.; Li, Y.; Liu, G.; Liu, F. Uncovering the origin of enhanced strengthening in Li-added Al–Cu–Mg alloys. Mater. Sci. Eng. A 2021, 827, 142079. [Google Scholar] [CrossRef] [Scilit]
- ISO 6892-1; Metallic Materials—Tensile Testing—Part 1: Method of Test at Room Temperature. International Organization for Standardization: Geneva, Switzerland, 2009.
- GB/T 10125-2012; Corrosion Tests in Artificial Atmospheres—Salt Spray Tests. Standards Press of China: Beijing, China, 2012.
- Zhang, X.; Sun, L.; Wang, D.; Nagaumi, H.; Zhang, M.; Wu, Z.; Wang, R.; Weng, W.; Wang, P.; Hua, F.; et al. Si-induced aging response acceleration for high strength-ductility in cast Al-Cu-Mg alloy. J. Alloys Compd. 2025, 1037, 182382. [Google Scholar] [CrossRef] [Scilit]
- Wang, X.; Li, G.; He, Q.; Jiang, J.; Li, D.; Shao, W.; Zhen, L. Intergranular corrosion of an Al-Cu-Li alloy: The influence from grain structure. Corros. Sci. 2023, 211, 110845. [Google Scholar] [CrossRef] [Scilit]
- Feng, Z.; Wu, Z.; Wang, D.; Nagaumi, H.; Li, Y.; Chen, N.; Zhang, X.; Wang, R.; Hua, F.; Zhang, H.; et al. Clarifying the role of quenching conditions on microstructure, intergranular corrosion behavior and mechanical properties of Al-Mg-Si-Cu alloy with high Cu. Corros. Sci. 2024, 237, 112336. [Google Scholar] [CrossRef] [Scilit]
- Tang, H.; Zhang, Y.; Sun, Y.; Wang, S.; Yan, L.; Shen, J.; Ge, B. Electron microscopy study of the impact of solution treatment on the corrosion behavior of an Al-Zn-Mg-Cu alloy. Corros. Sci. 2024, 226, 111665. [Google Scholar] [CrossRef] [Scilit]
- Lu, Q. Precipitation Behavior and Heat Resistance Properties of Al-Cu-Mg-Ag-(Si) Alloy. Ph.D. Thesis, University of Antwerp, Antwerp, Belgium, 2024. [Google Scholar]
- Zhao, Z.; Zhang, Y.; Liang, J.; He, Z.; Xiang, Z.; Long, F.; Gan, P. Visiting the microstructures, mechanical properties and corrosion resistance of hot-rolled Al-Cu (-Mg) alloys with and without T6 treatment. Mater. Today Commun. 2024, 41, 110692. [Google Scholar] [CrossRef] [Scilit]
- Wu, X.; Luo, B.; Bai, Z.; Deng, P.; Mo, W. Effect of Cu/Mg Content on the Corrosion Resistance of 2024 Aluminum Alloy. Non-Ferr. Met. Mater. Eng. 2022, 43, 1–7. [Google Scholar]
- Feng, H.; Chen, Y.; Yang, H.; Yang, P.; Zhang, J.; Shu, B. Effects of aging treatment on the mechanical properties and corrosion resistance of an Al-Cu-Mg-Li alloy. Mater. Today Commun. 2023, 35, 105487. [Google Scholar]
- Lorenzi, S.; Carrozza, A.; Cabrini, M.; Nani, L.; Andreatta, F.; Virtanen, E.; Tirelli, T.; Pastore, T. Corrosion behavior assessment of an Al-Cu alloy manufactured via laser powder bed fusion. Corros. Sci. 2024, 227, 111698. [Google Scholar] [CrossRef] [Scilit]
- Zhang, T.; Wang, H.; Li, Y.; Qian, X.; Li, B.; Yu, W.; Zhang, X.; Lin, J.; Tang, H. Investigation of the microstructure, growth mechanism, and corrosion behavior of a new Zr–Ti conversion coating on 6016 aluminum alloy. J. Mater. Res. Technol. 2024, 30, 7585–7596. [Google Scholar] [CrossRef] [Scilit]
- Xue, W.; Wang, Y.; Wu, S.; Zhang, B.; Zhang, Z.; Zhuo, X.; Zuo, P.; Lu, S.; Xia, J.; Li, X.; et al. Influence of impurity content on corrosion behavior of Al-Zn-Mg-Cu alloys in a tropical marine atmospheric environment. Corros. Sci. 2024, 237, 112319. [Google Scholar] [CrossRef] [Scilit]
- Bartawi, E.H.; Marioara, C.D.; Shaban, G.; Rahimi, E.; Mishin, O.V.; Sunde, J.K.; Gonzalez-Garcia, Y.; Holmestad, R.; Ambat, R. Effects of grain boundary chemistry and precipitate structure on intergranular corrosion in Al-Mg-Si alloys doped with Cu and Zn. Corros. Sci. 2024, 236, 112227. [Google Scholar]
- Bartawi, E.H.; Shaban, G.; Ambat, R. Role of aging time and Cu/Zn additions on the microstructure and intergranular corrosion resistance of 6082 Al-Mg-Si alloy. Corros. Sci. 2025, 254, 113027. [Google Scholar]
- Bai, S.; Zhou, X.; Liu, Z.; Xia, P.; Liu, M.; Zeng, S. Effects of Ag variations on the microstructures and mechanical properties of Al–Cu–Mg alloys at elevated temperatures. Mater. Sci. Eng. A 2014, 611, 69–76. [Google Scholar] [CrossRef] [Scilit]
- Ouyang, Z.; Mo, W.; Pan, Y.; Xiang, Z.; Wang, S.; Bai, Z.; Luo, B.H. Effect of Cu Content on Mechanical and Intergranular Corrosion Properties of Al-Cu-Mg-Ag Alloy. 2024. Available online: https://ssrn.com/abstract=5074135 (accessed on 10 April 2026).

Disclaimer/Publisher’s Note: The statements, opinions and data contained in all publications are solely those of the individual author(s) and contributor(s) and not of MDPI and/or the editor(s). MDPI and/or the editor(s) disclaim responsibility for any injury to people or property resulting from any ideas, methods, instructions or products referred to in the content. |
© 2026 by the authors. Licensee MDPI, Basel, Switzerland. This article is an open access article distributed under the terms and conditions of the Creative Commons Attribution (CC BY) license.