


Abstract
The high-temperature corrosion behavior of A1, T22, and T91 steels was investigated in molten nitrate salts at 400, 500, and 600 °C during 100 h of exposure. The combined influence of temperature and chromium content on corrosion kinetics and oxide-scale stability was evaluated using open-circuit potential (OCP), linear polarization resistance (Rp), electrochemical impedance spectroscopy (EIS), scanning electron microscopy, X-ray diffraction, and cross-sectional elemental mapping. OCP measurements showed a progressive shift toward more negative potential with increasing temperature, indicating enhanced oxidation tendency. Electrochemical measurements revealed a systematic decrease in Rp and impedance magnitude as temperature increased, confirming accelerated corrosion kinetics and reduced interfacial resistance. EIS spectra exhibited two characteristic time constants associated with the outer corrosion products and the inner metal/oxide interface. Significant differences in scale growth were observed depending on alloy composition. At 600 °C, oxide thickness reached approximately 700–800 μm for A1, ~100 μm for T22, and ~10 μm for T91. Chromium-containing steels promoted the formation of a compact Cr-rich inner oxide layer that improved scale adhesion and suppressed the exfoliation phenomena observed in A1 steel. Overall, temperature controls corrosion kinetics, whereas chromium content governs oxide-scale compactness and long-term stability in molten nitrate environments.
1. Introduction
The growing demand for decarbonized energy systems has stimulated the development of technologies capable of supplying electricity with integrated energy storage. In this context, concentrated solar power (CSP) plants have gained attention due to their ability to incorporate thermal storage using molten salts, which allows decoupling solar energy collection from electricity generation and improves grid stability [1]. However, the progressive increase in operating temperatures aimed at improving thermodynamic efficiency has intensified challenges related to salt degradation and corrosion of structural materials in contact with molten media [2]. Consequently, the durability of structural alloys has become a key factor in the reliability and economic viability of CSP systems.
The most widely used thermal storage medium in commercial plants is the 60 wt.% NaNO3–40 wt.% KNO3 mixture, known as “solar salt” [3,4]. This mixture presents favorable thermophysical properties, including high heat capacity, acceptable thermal stability up to about 565 °C, and relatively low cost. Nevertheless, alkali nitrates are not completely inert at high temperatures. Partial thermal decomposition of nitrate ions generates nitrites and oxygen, modifying the redox chemistry of the molten medium and influencing oxidation kinetics of metallic materials [5]. The fraction of nitrite increases with temperature and exposure time, creating a more oxidizing environment that can significantly affect corrosion rates and oxide layer stability in structural alloys exposed to molten nitrate salts [2,6,7,8].
Corrosion in molten nitrate salts is a complex phenomenon involving interfacial electrochemical reactions, ion transport in the molten electrolyte, and solid-state diffusion through oxide layers formed on the metal surface [8,9]. Compared with aqueous systems, the high ionic conductivity of molten salts and the absence of a conventional solvent modify corrosion mechanisms, often leading to diffusion-controlled processes through corrosion products and coupled redox reactions at the metal/oxide/salt interface. These processes frequently produce multilayer oxide scales whose protectiveness depends on their thermodynamic stability and transport properties [9,10].
The stability of the protective layer strongly depends on alloy composition. In carbon steels such as ASTM A210-A1, high-temperature oxidation mainly produces magnetite (Fe3O4) and hematite (Fe2O3), which may exhibit limited adhesion and compactness in highly oxidizing environments [10]. In contrast, chromium-alloyed steels such as ASTM A213-T22 (2.25Cr–1Mo) and ASTM A213-T91 (9Cr–1Mo) generally display improved oxidation resistance due to the formation of Cr2O3-rich scales or mixed spinels such as (Fe,Cr)3O4, characterized by higher thermodynamic stability and lower diffusion coefficients for metallic species and oxygen [3,10,11,12,13]. Chromium therefore plays a key role in controlling oxide growth kinetics and enhancing long-term stability at high temperatures.
However, the stability of Cr2O3 in molten nitrate salts is not absolute. Dissolved oxygen activity, the presence of nitrites, and impurities may promote partial dissolution of the oxide layer or modify interfacial equilibria, reducing its protective character [14]. In addition, the solubility of certain oxides in molten salts can lead to dynamic corrosion mechanisms in which oxide formation and dissolution occur simultaneously, accelerating degradation [2,10,14,15,16,17]. Temperature strongly influences these processes by increasing nitrate decomposition kinetics, ionic mobility in the molten electrolyte, and diffusion within oxide layers.
Traditionally, corrosion studies in molten salts have relied on gravimetric measurements and post-exposure surface characterization techniques [18]. Although these methods provide valuable information regarding overall degradation and oxide morphology, they do not allow real-time monitoring of electrochemical processes at the metal/molten salt interface. Electrochemical techniques therefore provide important advantages by enabling in situ evaluation of corrosion behavior under controlled conditions [19]. Methods such as open-circuit potential (OCP), linear polarization resistance (LPR), and electrochemical impedance spectroscopy (EIS) have been increasingly applied to investigate corrosion processes in molten salts and other high-temperature electrochemical systems [19,20].
Among these techniques, EIS is particularly useful for analyzing systems in which several electrochemical processes with different characteristic time constants coexist [20]. Interpretation of impedance spectra typically involves equivalent electrical circuit modeling to identify contributions associated with electrolyte resistance, charge transfer processes, and oxide layer properties. In addition, the LPR technique allows estimation of corrosion kinetics through polarization resistance near the open-circuit potential. The application of these electrochemical techniques at high temperatures requires careful control of experimental conditions, particularly reference electrode stability and temperature gradients in the electrochemical cell [21]. Recent studies have demonstrated the usefulness of these approaches for understanding corrosion mechanisms and oxide-scale evolution in molten salt environments relevant to energy applications [22,23,24,25,26,27,28,29].
A previous study reported kinetic and thermodynamic aspects associated with the onset of corrosion of ferritic steels in nitrate salts at 400, 500, and 600 °C [14]. That work showed that the presence of Cr and Mo modifies parameters such as activation energy, standard enthalpy of formation, and entropy of formation related to the corrosion initiation process. Although these alloying elements influence thermodynamic aspects of degradation, the results also indicated a reduction in the overall corrosion rate, attributed to a synergistic mechanism involving the formation of iron oxide layers that promote the development of a chromium-enriched oxide layer at the metal/oxide interface, thereby limiting further oxidation of iron.
2. Experimental Procedure
2.1. Materials Evaluated
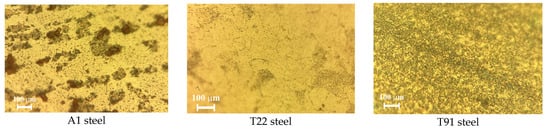
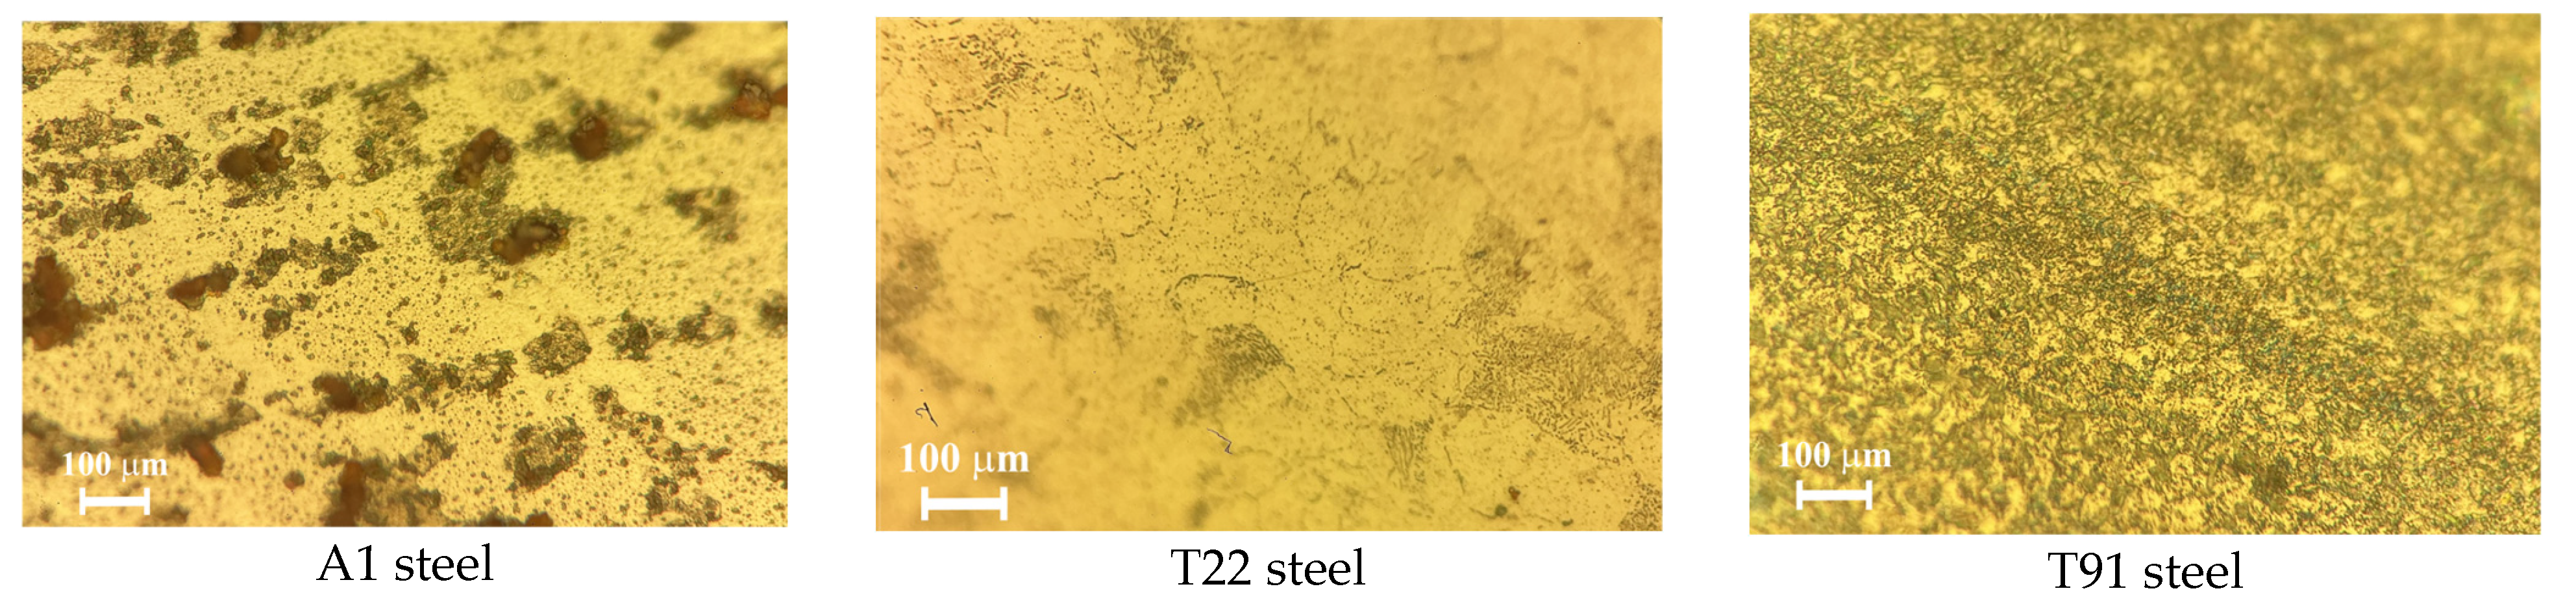
The materials evaluated were ASTM A210-A1, ASTM A213-T22, and ASTM A213-T91 steels, which for simplicity will be referred to as A1, T22, and T91 steels, respectively. According to ASTM A210/A210M [30] A1 steel does not contain Mo or Cr in its chemical composition, and according to ASTM A 213/A 213M [31] T22 steel has a Mo and Cr content of 1.00% and 2.25%, respectively, and T91 steel has a Mo and Cr content of 0.95% and 8.95% (by weight), respectively. The Mo and Cr contents were verified by energy-dispersive X-ray spectroscopy (EDS), and the analyses were reported in a previous study [14], finding no significant variation from those reported in the respective standards The analyses indicated that A1 steel has a Cr and Mo content of 0.00%, T22 steel has a Cr content of 2.27% and a Mo content of 1.10%, and T91 steel has a Cr content of 9.23% and a Mo content of 0.95% (by weight). The microstructural characteristics of the steels (Figure 1) showed that A1 steel has a ferrite and pearlite structure, typical of hot-rolled tubes [32], T22 steel has a structure composed of ferrite, pearlite, and granular bainite [33] and T91 steel a typical structure of tempered martensite and ferrite [34].
Figure 1.
Microstructural aspects of the steels evaluated, 1000X.
The samples used for the various tests were obtained from new pipes made of the aforementioned steels. Samples with dimensions of 3 × 5 × 10 mm were obtained, which were surface prepared by a successive grinding process using abrasive paper, starting with 120 grit and progressing to 600 grit. The samples were washed with distilled water, ethanol, and acetone, dried with hot air, and stored in a desiccator until use.
2.2. Corrosive Medium
For the electrochemical studies, a mixture of nitrate salts known as Solar Salt was used widely employed to simulate the operating conditions of solar concentrators [35,36]. The composition of the mixture was 60% NaNO3 and 40% KNO3 (wt.) with a melting point of 238 °C. Although the eutectic mixture (46% NaNO3–54% KNO3, wt.) has a melting point of 222 °C [37,38], the aforementioned mixture is commercially used due to the lower cost of NaNO3 compared to KNO3 [3].
2.3. Electrochemical Tests
The electrochemical tests were carried out using a three-electrode cell. For the preparation of the working electrodes, the metal specimens were connected by spot welding to a Ni20Cr conductor wire. A platinum wire was used as the counter electrode and reference pseudo-electrode. The electrical conductors of each electrode were insulated with mullite tubes and subsequently sealed with ceramic cement to ensure their stability during the tests.
The experiments were conducted in a vertical electric furnace under static air conditions. Once the experimental system was assembled, the electrode array was immersed in molten salt contained in an alumina crucible, which was placed inside an electric resistance furnace. The electrochemical techniques applied included open-circuit potential (OCP) measurements, linear polarization resistance (LPR), and electrochemical impedance spectroscopy (EIS).
The tests were performed at 400, 500, and 600 °C. This temperature range encompasses the typical operating conditions of a concentrated solar power plant (≈400 °C), as well as the temperature limit associated with the thermal stability of solar salt (≈600 °C). Consequently, the results obtained allow for the evaluation of the influence of increased temperature on the degradation mechanisms of the steels studied.
OCP measurements were performed by recording the working electrode potential with respect to the pseudo-reference electrode at one-hour intervals during the test. Linear polarization resistance was determined by applying an overpotential of ±10 mV around the OCP value, with a sweep speed of 0.1667 mV·s−1, also at one-hour intervals.
Electrochemical impedance spectroscopy (EIS) measurements were performed using a three-electrode cell under the same experimental conditions described previously. Tests were conducted at temperatures of 400, 500, and 600 °C, once the system had reached thermal equilibrium and the open-circuit potential (OCP) had stabilized. Measurements were performed by applying a small-amplitude (10 mV rms) sinusoidal perturbation signal around the open-circuit potential to ensure linear behavior of the electrochemical system. The frequency range evaluated was from 100 kHz to 10 mHz, with a minimum of 10 points per logarithmic decade, using a down-frequency scan. Before each impedance measurement, the system was maintained at OCP for a minimum of 1 h to allow for stabilization of the metal/molten salt interface. EIS measurements were performed at defined time intervals during exposure, with the purpose of monitoring the evolution of polarization resistance and the charge transfer and ion transport processes through the formed oxide layer. The experiments were performed in triplicate, and no significant variations were observed in the different measurements. All measurements were performed under open-circuit potential conditions.
The different tests were carried out using a Gamry Instruments model Interface 1010E potentiostat–galvanostat (Gamry Instruments, Warminster, PA, USA), where experimental control was carried out using the Gamry Instrument Framework software (version 6.03), and the processing and obtaining of the electrochemical parameters were carried out with Gamry Echem Analyst (version 6.03).
2.4. Additional Analyses
Once the electrochemical tests were completed, the samples of the different steels were washed with distilled water at 60 °C until all traces of nitrate salts were removed. Subsequently, morphological analyses were performed using scanning electron microscopy, as well as X-ray diffraction studies, to identify the phases present in the corrosion product layer.
Additionally, the specimens were encapsulated in epoxy resin and subjected to metallographic preparation for cross-sectional evaluation. This procedure allowed for the examination of the morphology and thickness of the protective layer, as well as elemental mapping and line-scan analysis to characterize the compositional distribution across the metal/oxide interface.
3. Results and Discussion
3.1. OCP Measurements
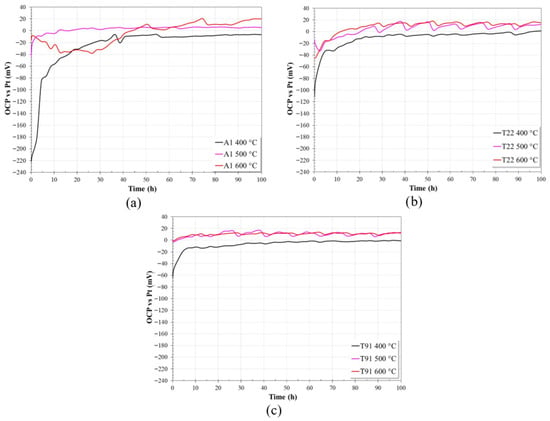
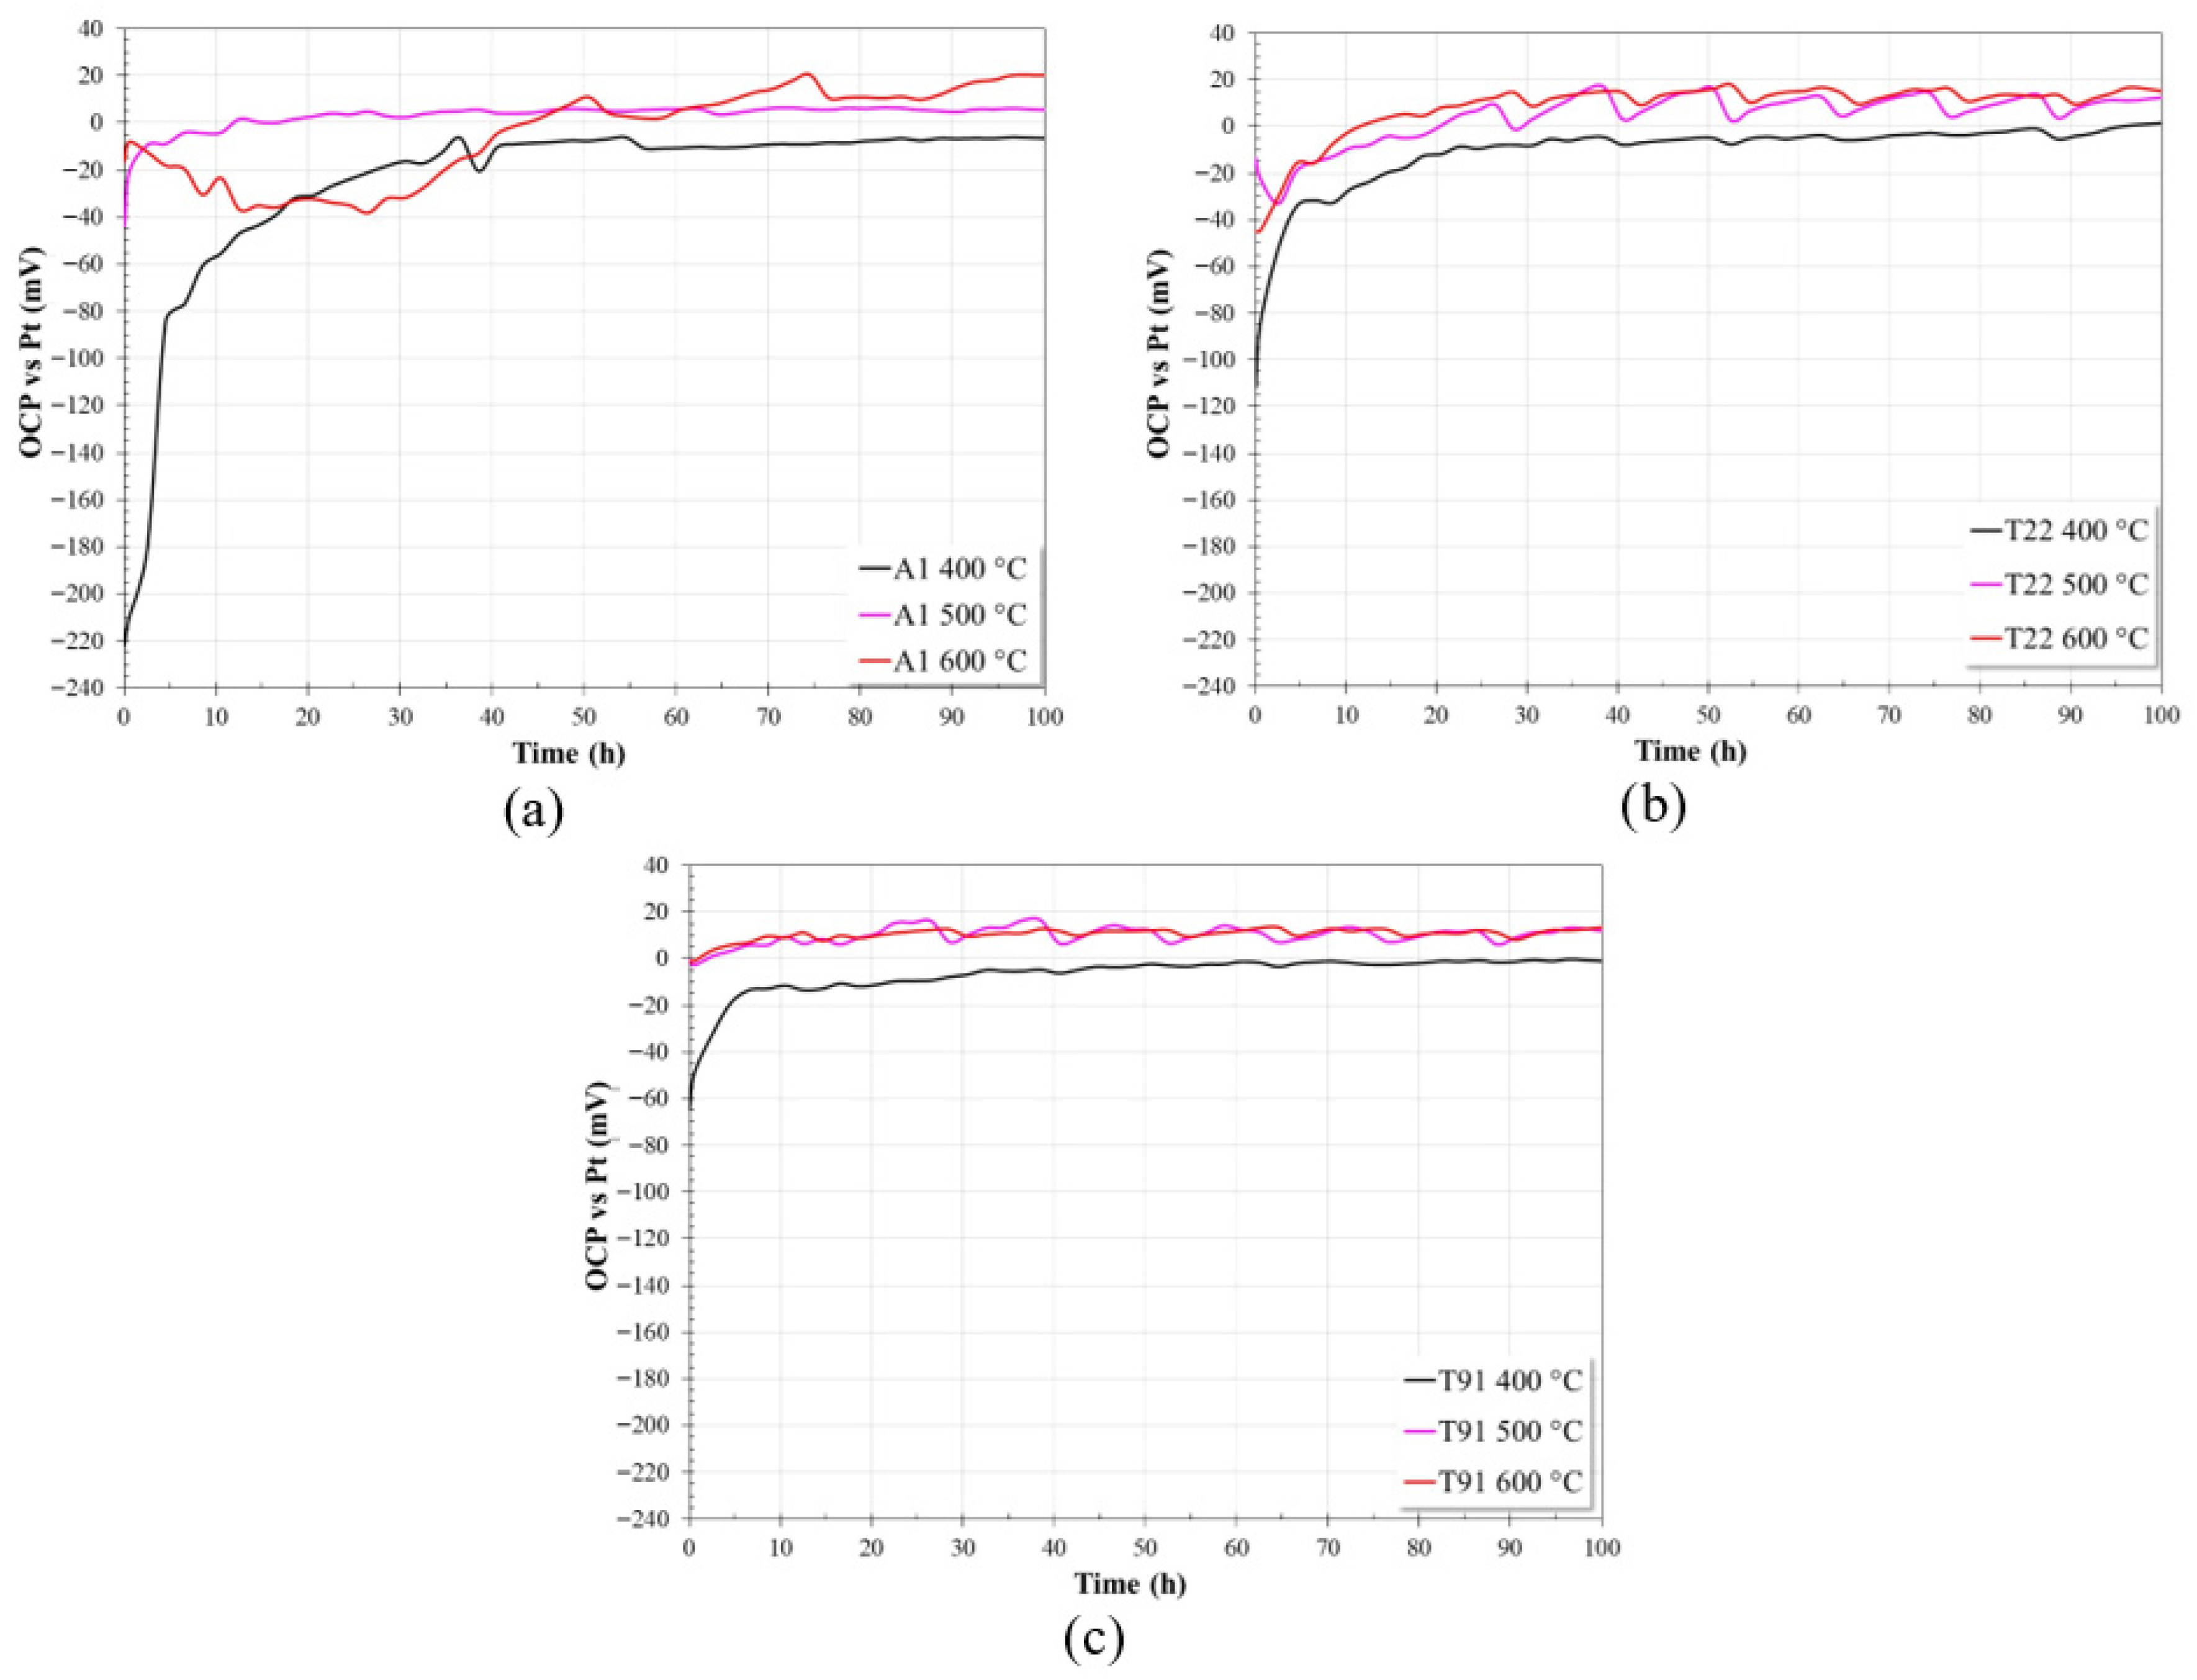
Figure 2 shows the evolution of the OCP values of the steels evaluated in nitrate salts at different test temperatures. It should be noted that the open-circuit potential reflects the mixed potential of the electrochemical system and is influenced by both thermodynamic and kinetic factors. Therefore, the OCP values are discussed here only as indicators of the electrochemical state of the surface, while corrosion resistance is evaluated primarily through polarization resistance and impedance measurements.
Figure 2.
Evolution of open-circuit potential values in nitrate salts at 400 °C, 500 °C and 600 °C; (a) A1, (b) T22 and (c) T91.
At 400 °C, it can be observed that all three steels show an abrupt increase in their OCP values during the first 10 h of immersion, after which their OCP values tend to stabilize at a more noble potential. The abrupt increase in OCP values was greatest for steel A1, followed by T22 and T91. That is, as the Cr content increased (from 0% to 9%), the abrupt increase in OCP values was less pronounced. This may be associated with a decrease in the corrosion rate of the steel.
At 500 °C a similar trend can be observed, but the magnitude of the initial increase in OCP values was smaller, also depending on the Cr content of the steel.
However, at 600 °C, the behavior was different. In the case of A1 steel, it showed a constant decrease in its OCP values during the first 30 h of immersion, subsequently exhibiting a trend toward higher values until the end of the test. This suggests that, during the initial hours of the test, the steel underwent a constant degradation process, followed by the precipitation and accumulation of corrosion products, which limited the free access of the molten salt to the metal surface. T22 steel, during the same time interval, showed an upward trend in its OCP values, subsequently reaching a quasi-steady state. On the other hand, T91 steel exhibited very similar behavior to that observed at 500 °C; that is, its OCP values were very similar. This minor variation in its OCP values indicates greater chemical stability of the T91 surface.
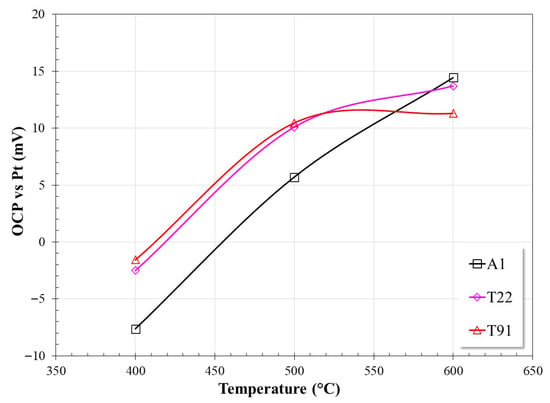
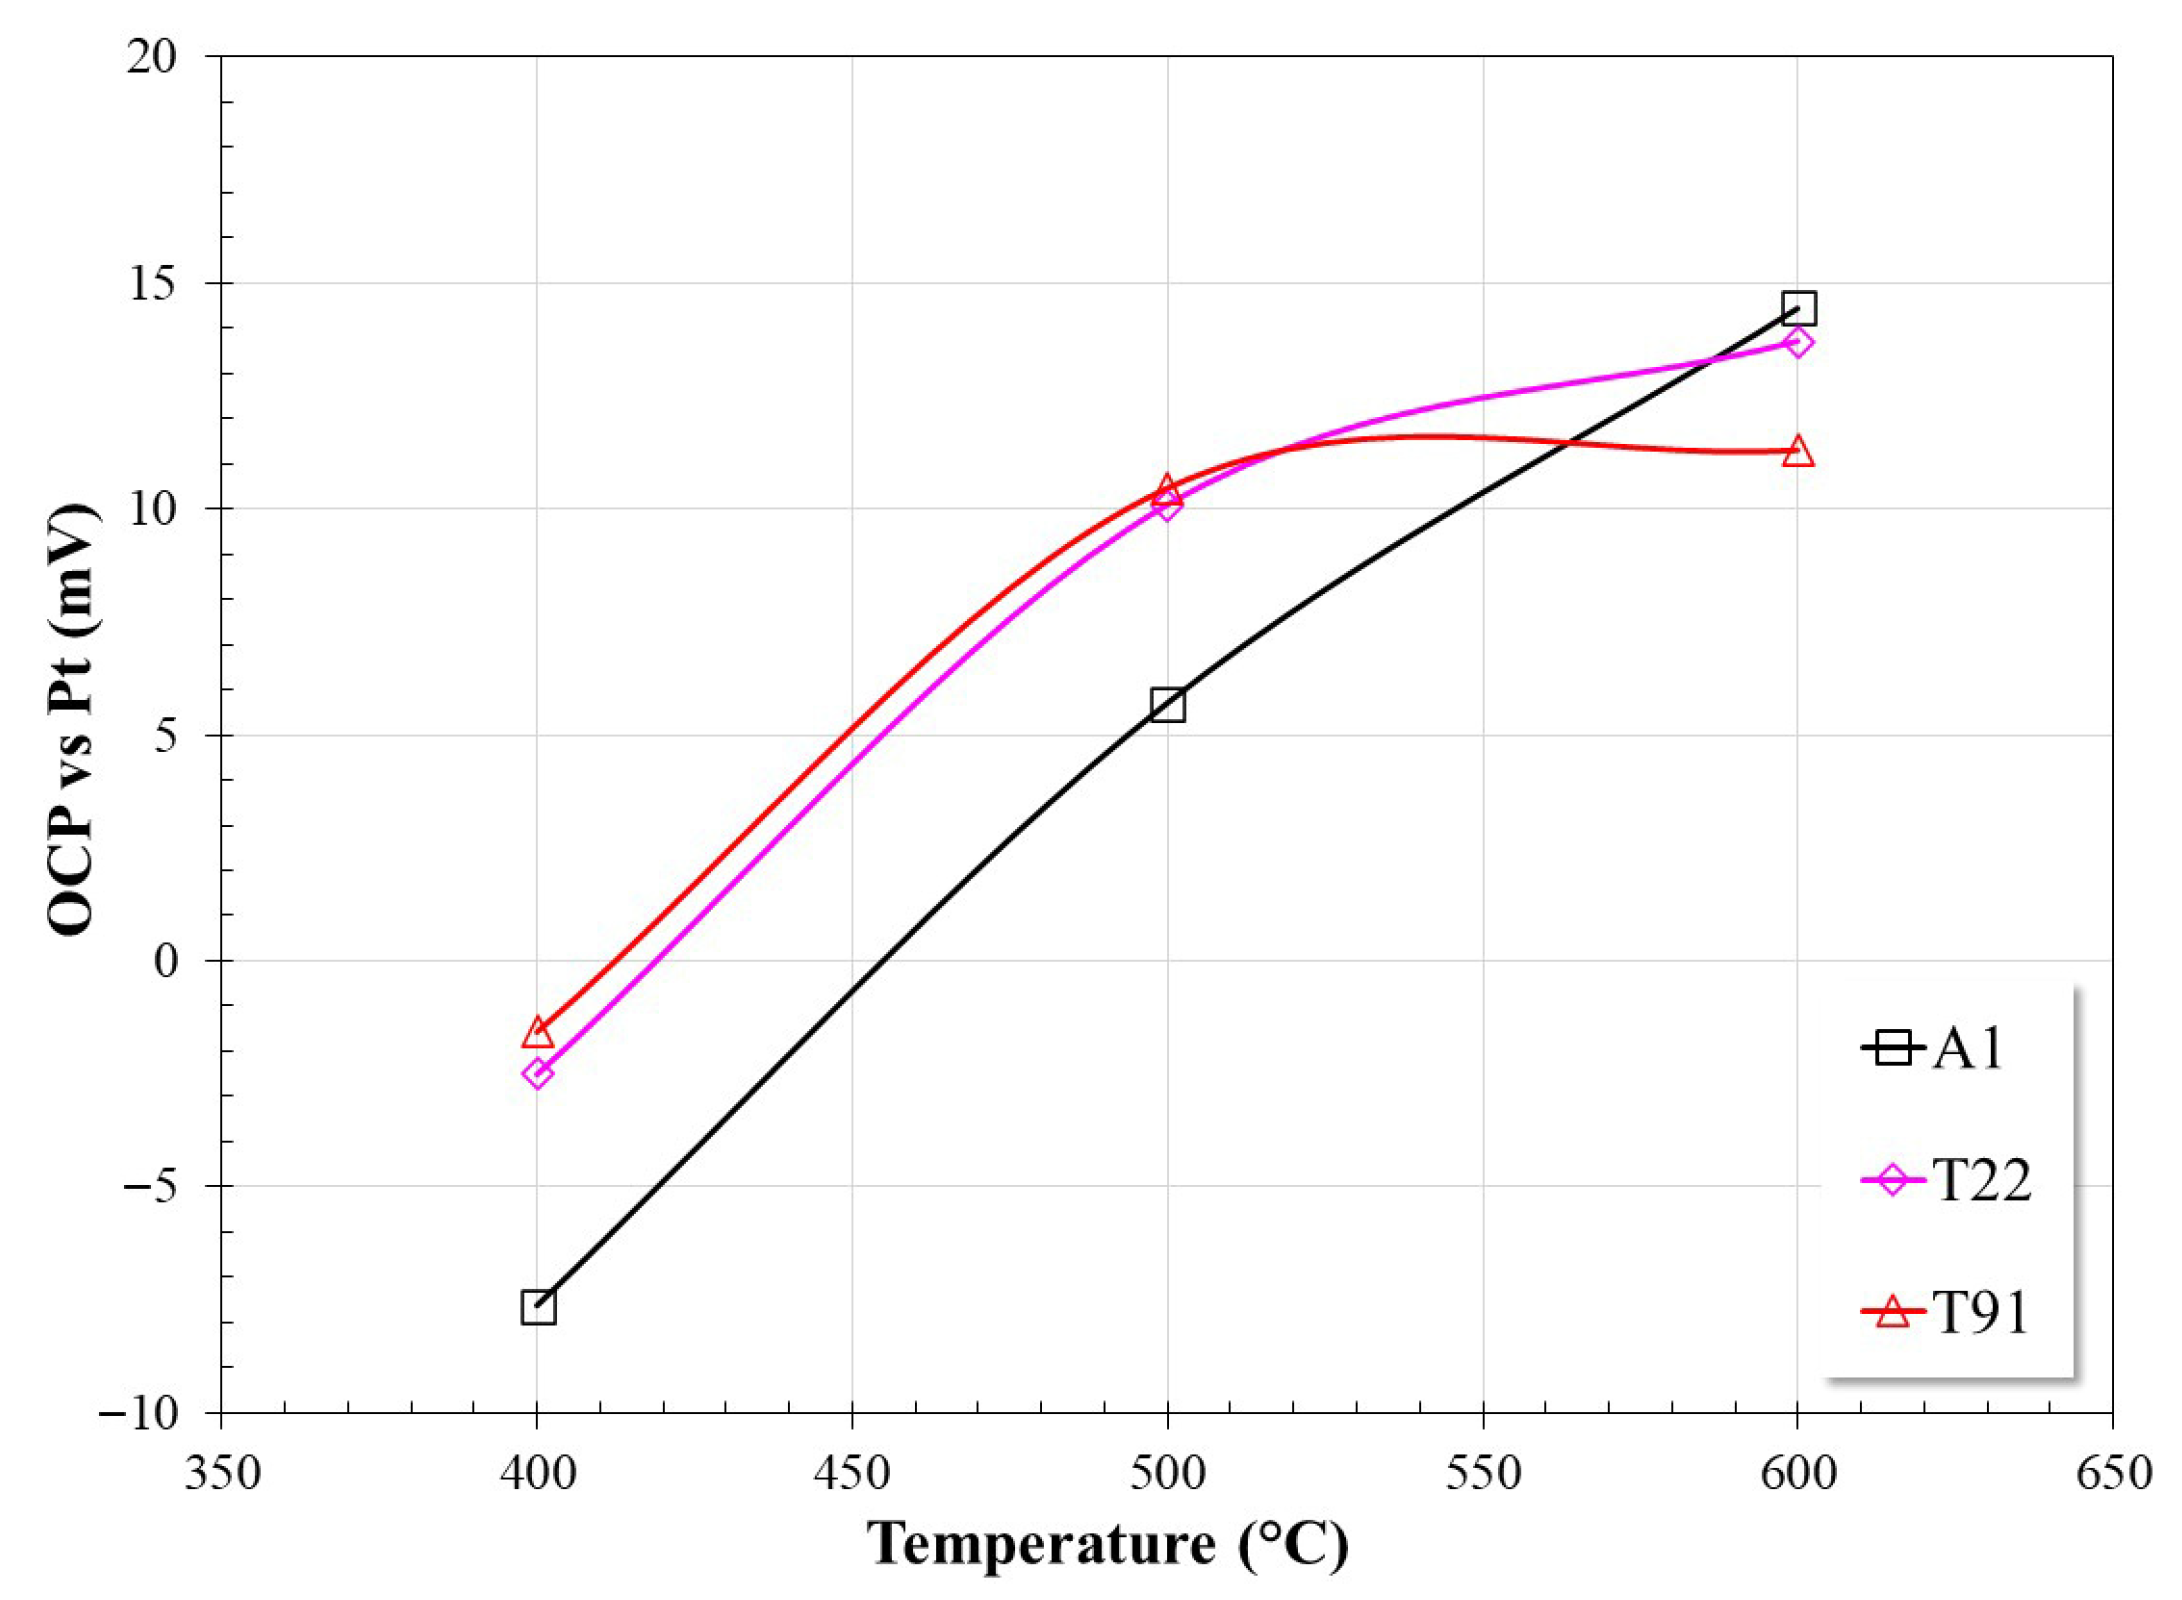
Figure 3 shows the average OCP values for the last 30 h of immersion of the steels as a function of temperature. According to the graph, it can be observed that up to 500 °C, steel A1 showed the highest surface activity, and that the presence of Cr in the steel reduced the surface activity of steels T22 and T91. However, at 600 °C, steel A1 exhibited more positive values, followed by T22 and T91. The trend observed at this temperature can be attributed to the possible formation of a dense layer of insoluble corrosion products in steel A1 [2,15,16,17], which limited the diffusion of molten salts to the substrate. In the case of T22 steel, the slope of the potential increase decreased markedly, indicating a decrease in surface activity. In the case of T91, this decrease was even greater, with its potential value similar to that observed at 500 °C. These trends confirm that the presence of Cr in the alloy reduces the surface activity of the alloys [14]. The OCP values are within the range reported by other studies [19].
Figure 3.
Average OCP values from the last 30 h of testing as a function of temperature.
3.2. Linear Polarization Resistance (LPR) Measurements
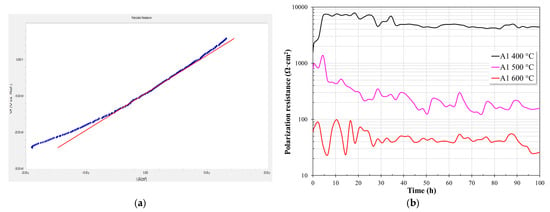
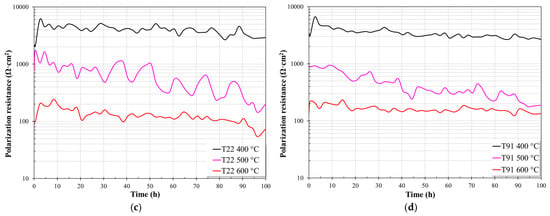
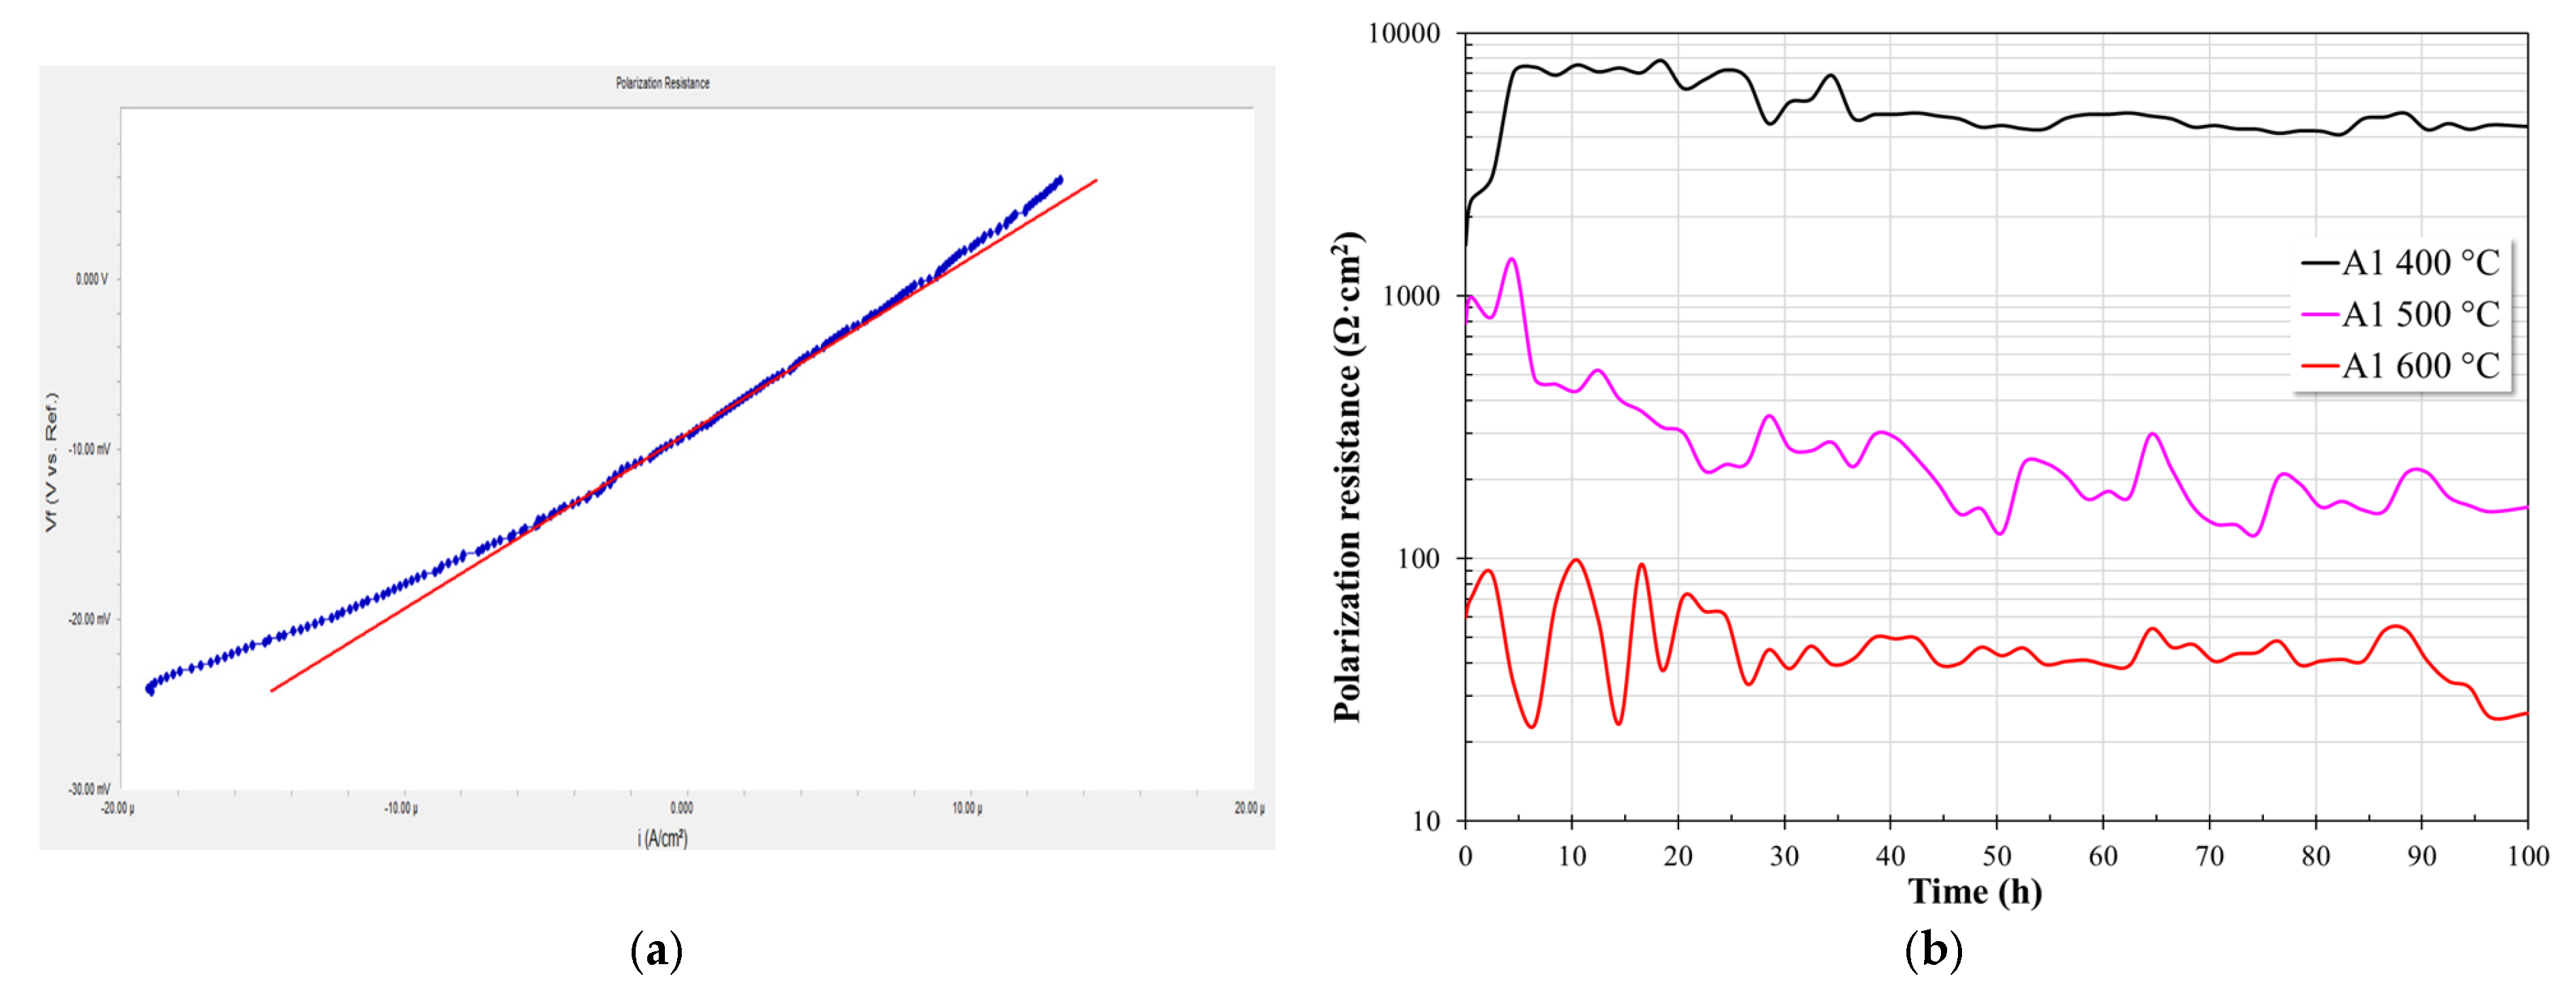
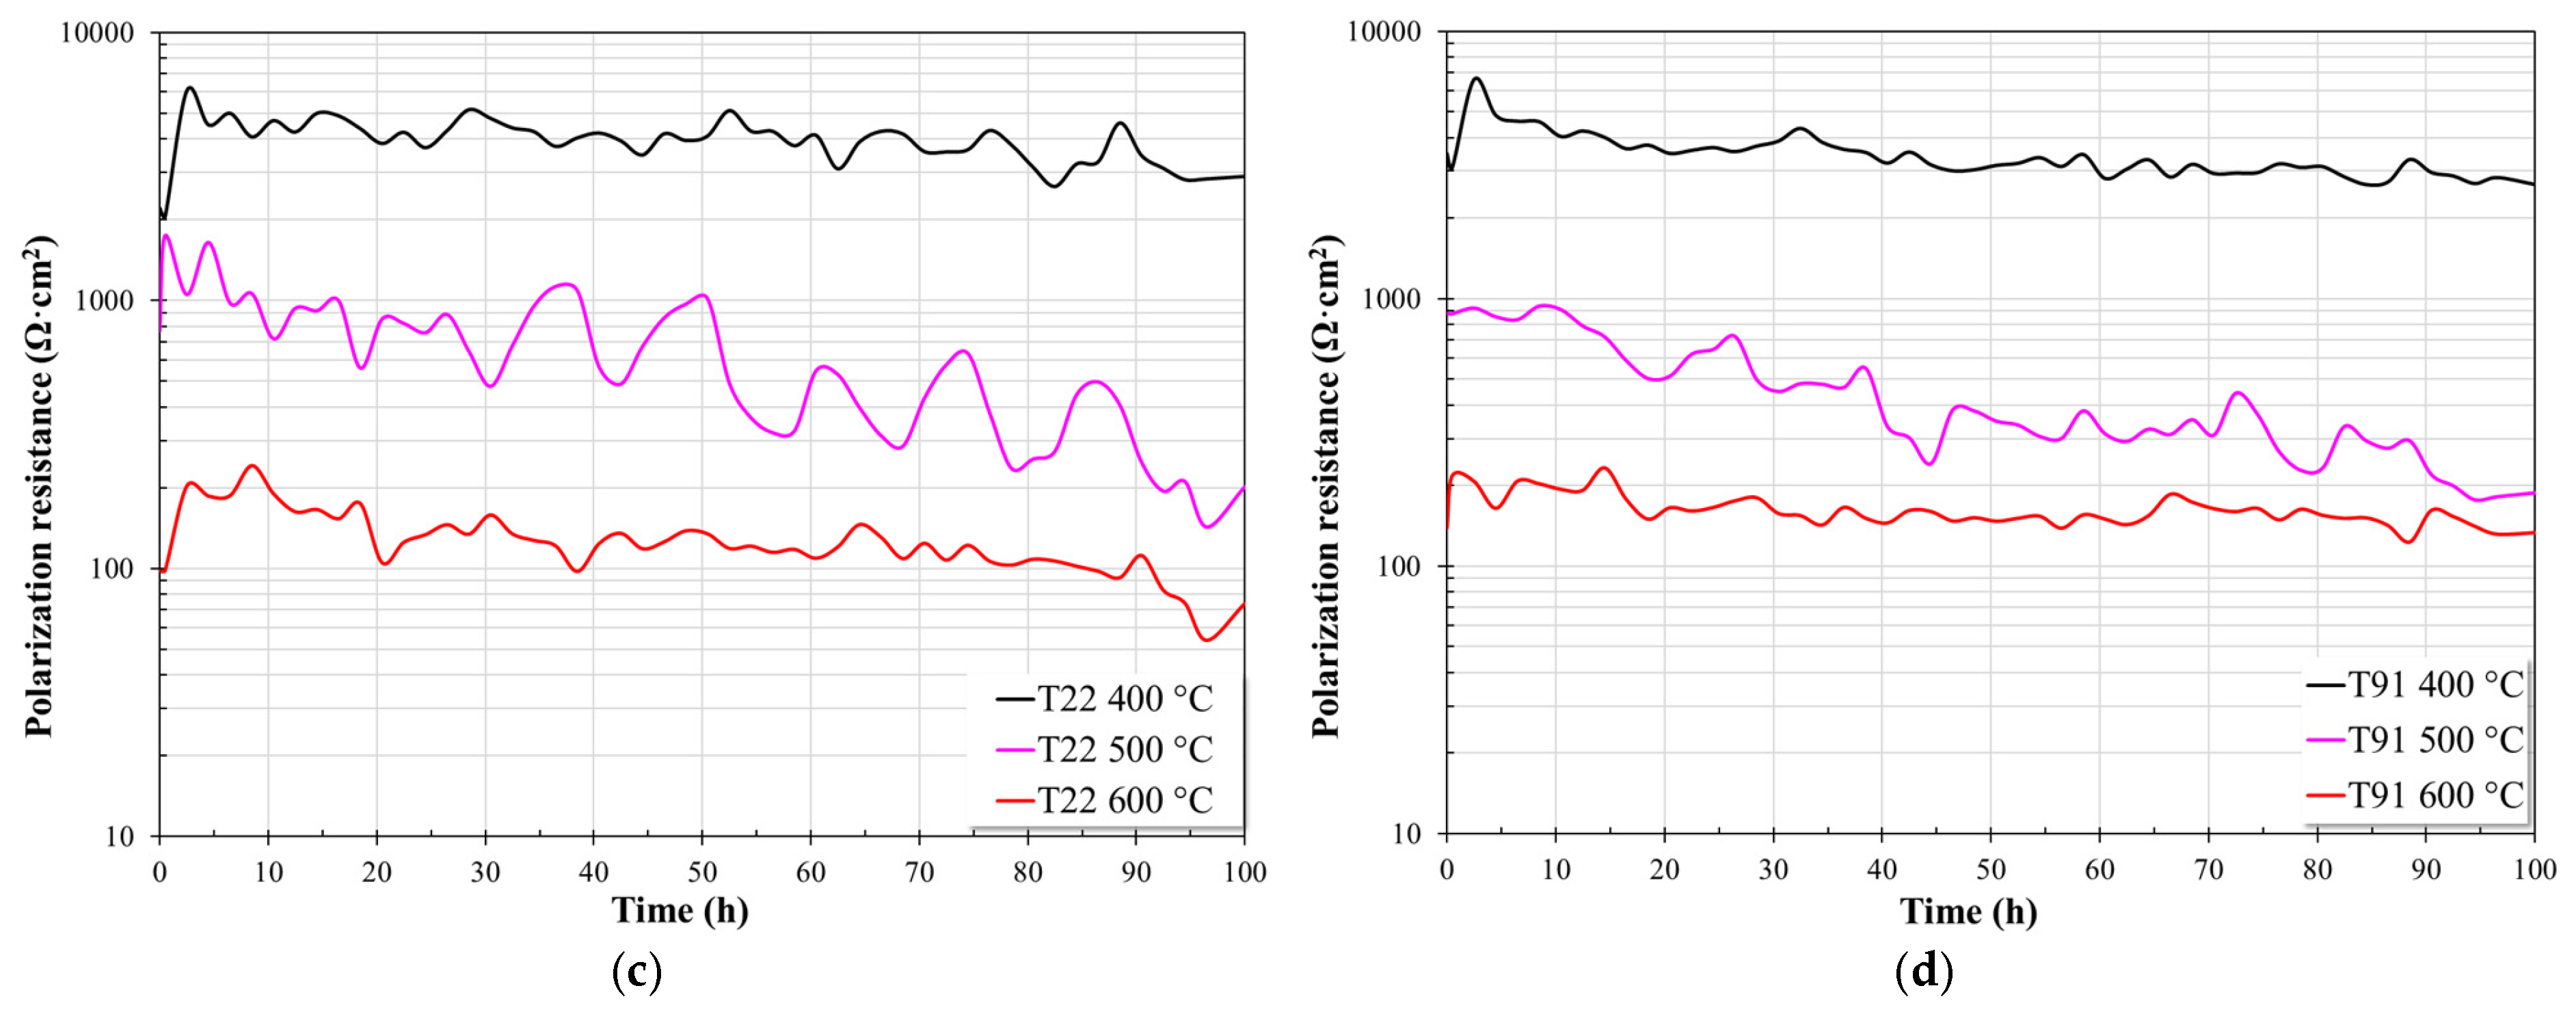
Figure 4 shows the evolution of the Rp values of the steels evaluated in nitrate salts at different test temperatures. Regardless of the steel, it can be observed that with increasing temperature, the polarization resistance of the steels tends to decrease, suggesting an increase in surface activity due to the increased corrosion rate.
Figure 4.
Evolution of Rp values in nitrate salts at 400 °C, 500 °C, and 600 °C; (a) example of a typical linear polarization curve; (b) A1, (c) T22, and (d) T91.
At 400 °C, A1 steel showed an abrupt increase in its Rp values during the first 5 h of the test. Once it reached its maximum value (around 7500 Ω·cm2), it showed some stability until 20 h, followed by a gradual decrease to around 4500 Ω·cm2. This behavior indicates that at the beginning of the test, the steel rapidly formed a protective layer on its surface. However, this layer was not dense, as the Rp values tended to decrease, possibly due to the diffusion of the molten salt to the steel surface. At 500 °C, also during the first 5 h of immersion, the steel attempted to form a protective layer. However, for the remainder of the test, its Rp values tended to decrease steadily due to its low protective capacity or defects in the layer. However, at 600 °C, during the first 25 h of testing, the steel showed large fluctuations in its Rp values, subsequently tending to reach a quasi-steady state. This initial behavior may be associated with the constant formation and breakdown of the protective layer or with the presence of localized attack.
T22 steel exhibited similar behavior to A1 steel at both 400 °C and 500 °C. At 400 °C, an abrupt increase in Rp values was observed during the first 3 h of the test (to approximately 6000 Ω·cm2), followed by a steady decrease to around 3000 Ω·cm2 at the end of the test. At 500 °C, during the first 5 h of immersion, the steel attempted to form a protective layer; however, for the remainder of the test, its Rp values tended to decrease steadily, exhibiting oscillations throughout the test. This could be associated with protective layer rupture and regeneration events or localized attack; however, the timescale suggests that these oscillations correspond to protective layer rupture and regeneration processes. At 600 °C, an initial increase in Rp values is observed in the first 10 h of testing, followed by a constant decrease in Rp values until the end of the test.
At 400 °C, T91 steel exhibited similar behavior to T22 steel, showing an increase in its Rp values during the first 3 h of testing (to approximately 6500 Ω·cm2) followed by a steady decrease to around 3000 Ω·cm2. At 500 °C, it showed quasi-stable behavior during the first 10 h of immersion, followed by a steady decrease until the end of the test. However, at 600 °C, the steel exhibited quasi-steady behavior throughout the test, with only a slight downward trend in its Rp values.
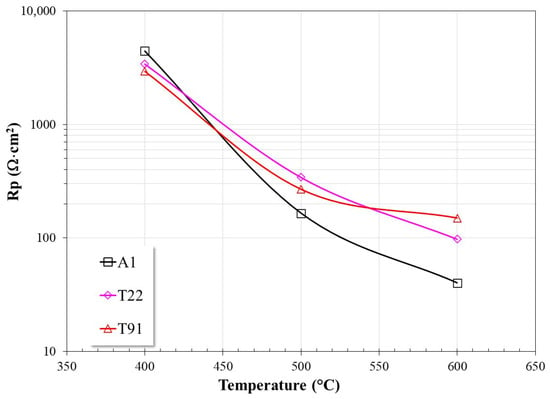
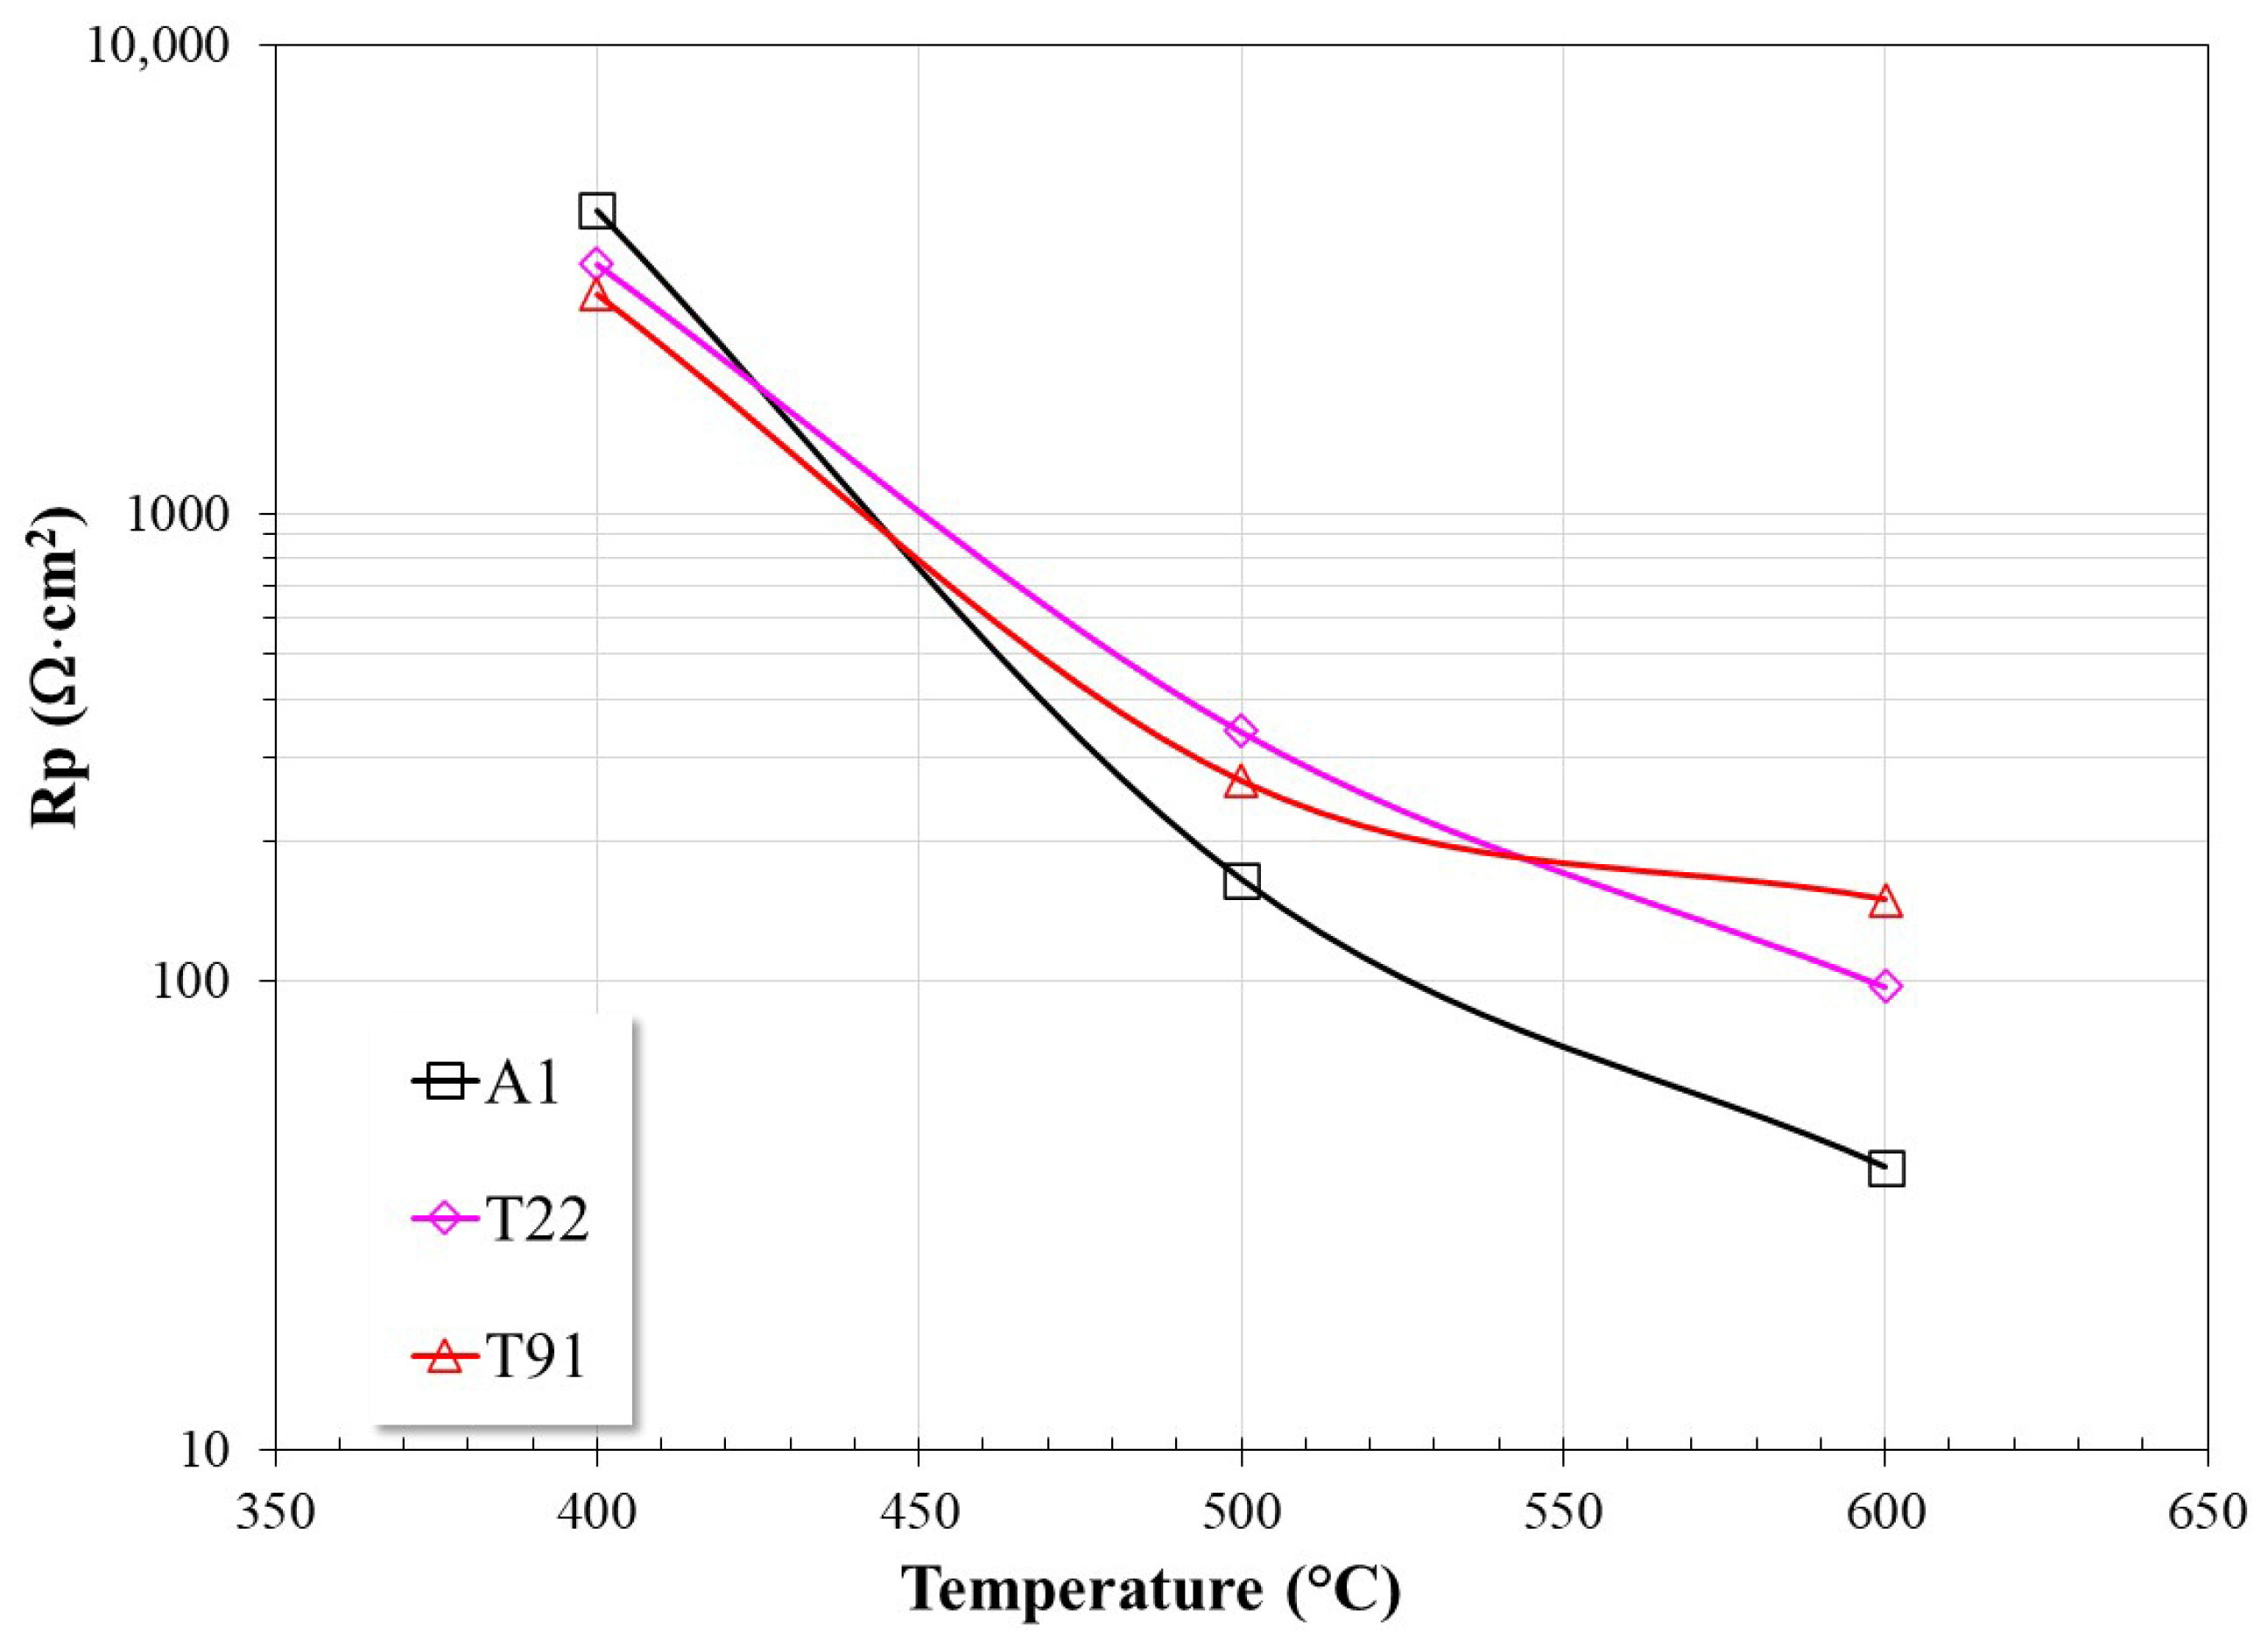
Figure 5 shows the average Rp values for the last 30 h of immersion of the steels as a function of temperature. The graph clearly shows a decrease in Rp values with increasing temperature.
Figure 5.
Average Rp values from the last 30 h of testing as a function of temperature.
At 400 °C, A1 steel showed the highest Rp values, followed by T22 and T91 steels. This may be due to the low reactivity of the nitrate salts, which allowed A1 steel to develop a layer of corrosion products that limited the free access of the molten salt to its surface. It is known that in this type of steel, the main corrosion products are iron oxides, which are insoluble in nitrate salts [2,15,16,17], and therefore their corrosion rate decreases. Conversely, T22 and T91 steels, due to their Cr and Mo content, exhibit a highly reactive surface in nitrate salts, as demonstrated in a previous study [14]. Only once these elements are depleted on the surface is the formation of an insoluble Fe oxide layer possible. This explains why the Rp values for these materials were lower, and as can be observed, the Rp value decreased as the Cr content increased. At 500 °C, in addition to observing a decrease in Rp values, steel A1 showed the lowest Rp value, while steels T22 and T91 showed higher and similar values. However, at 600 °C, a clear definition of the effect of Cr content on the behavior of the steels is observed, in that with higher Cr content, the rate of metal dissolution tends to decrease.
In the case of A1 steel, although its protective layer is composed of iron oxides, which are insoluble in nitrate salts, the observed trend suggests that with increasing temperature, the integrity of this layer is compromised, possibly due to cracking, thus facilitating the penetration of the electrolyte to the metal surface. In the case of T22 and T91 steels, the presence of Cr and Mo makes them highly reactive at the beginning of the corrosion process. These elements react exothermically with nitrate salts, forming Na and K chromates (K3Na(CrO4)2, Na2CrO4, NaCrO2, K3CrO8, K2Cr2O7, K2Cr2O7) and Na molybdates (Na2MoO4) [14], leaving a surface free of these elements. Subsequently, only Fe reacts, forming insoluble iron oxides. The formation of these insoluble layers limits the contact of the metal surface with the molten salts and makes it possible for the Cr in the alloy to oxidize and form an internal layer rich in chromium oxides that reduces the subsequent oxidation of the alloy.
Based on the data in Figure 5, the corrosion rate of the evaluated steels was calculated. From the Rp values, the Icorr values were determined using the Stern-Geary equation [39,40]:
The Tafel slopes used to estimate the corrosion current were taken from a previous study performed under the same molten nitrate salt environment and using the same materials [14]. Subsequently, the Icorr values were converted to corrosion rates based on ASTM G102 [41]:
where K = 3.27 × 10⁻³ (mm·g/μA·cm·year), Icorr = corrosion current density (μA/cm2), EW = equivalent weight (dimensionless) and ρ = material density (g/cm3).
Table 1 shows the corrosion current density and corrosion rate values obtained from the Rp values shown in Figure 5.
Table 1.
Corrosion current density and corrosion rates of the evaluated steels.
In a previous study [14], the corrosion rates for these steels, determined by polarization curves, were 0.1160, 0.7421, and 3.4440 mm/y at 400, 500, and 600 °C, respectively, for A1 steel; 0.1116, 0.4873, and 2.2410 mm/y at 400, 500, and 600 °C, respectively, for T22 steel; and 0.0839, 0.2787, and 1.0584 mm/y at 400, 500, and 600 °C, respectively, for T91 steel. These corrosion rates correspond to the beginning of the corrosion process and can change at longer immersion times, as observed in the values obtained at 100 h of immersion (Table 1). Despite these variations, the trends show the same conclusions: the corrosion rate increases with temperature and decreases with increasing chromium content in the steel. At longer immersion times, the corrosion rate may increase or decrease depending on the stability of the protective layer. A chemically stable and compact protective layer would reduce the corrosion rate.
The literature reports corrosion rates of 0.9706 mm/y for A1 steel in mass loss tests at 390 °C for 1000 h of immersion and 0.0710 mm/y for T22 steel under the same test conditions [42]. For T91 steel, corrosion rates of 0.0169 mm/y at 560 °C are reported in synthetic air immersion tests for 1200 h [10]. Corrosion rates measured by EIS for P91 steel of 0.305 mm/y after 1000 h of immersion at 580 °C are also reported [43], and other studies report corrosion rates determined by mass loss after 360 h of immersion at 565 °C of 0.0318 mm/y for P91 steel [44]. In steels with higher Cr content than those evaluated here, corrosion rates determined from polarization curves are reported to be 0.239 and 1.476 mm/y for 304 steel at 500 and 600 °C, respectively, and 0.188 and 1.11 mm/y for 316L steel at 500 and 600 °C respectively [13], and mass loss studies at immersion times of 3000 h report corrosion rates of 304 and 316L steels of 0.01391 and 0.0069 mm/y, respectively, at 565 °C [45].
It can be observed that although the corrosion rate values may be different, this is due to the technique used for their determination and the immersion time; however, the values are within the same order of magnitude, and the corrosion rate of steels is a function of temperature, and the chromium content improves their chemical stability.
3.3. Surface Analysis
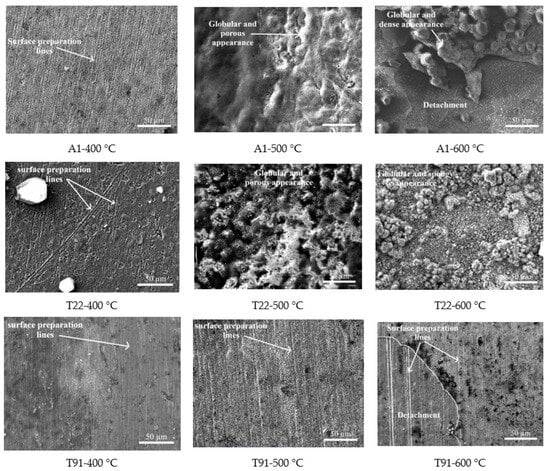
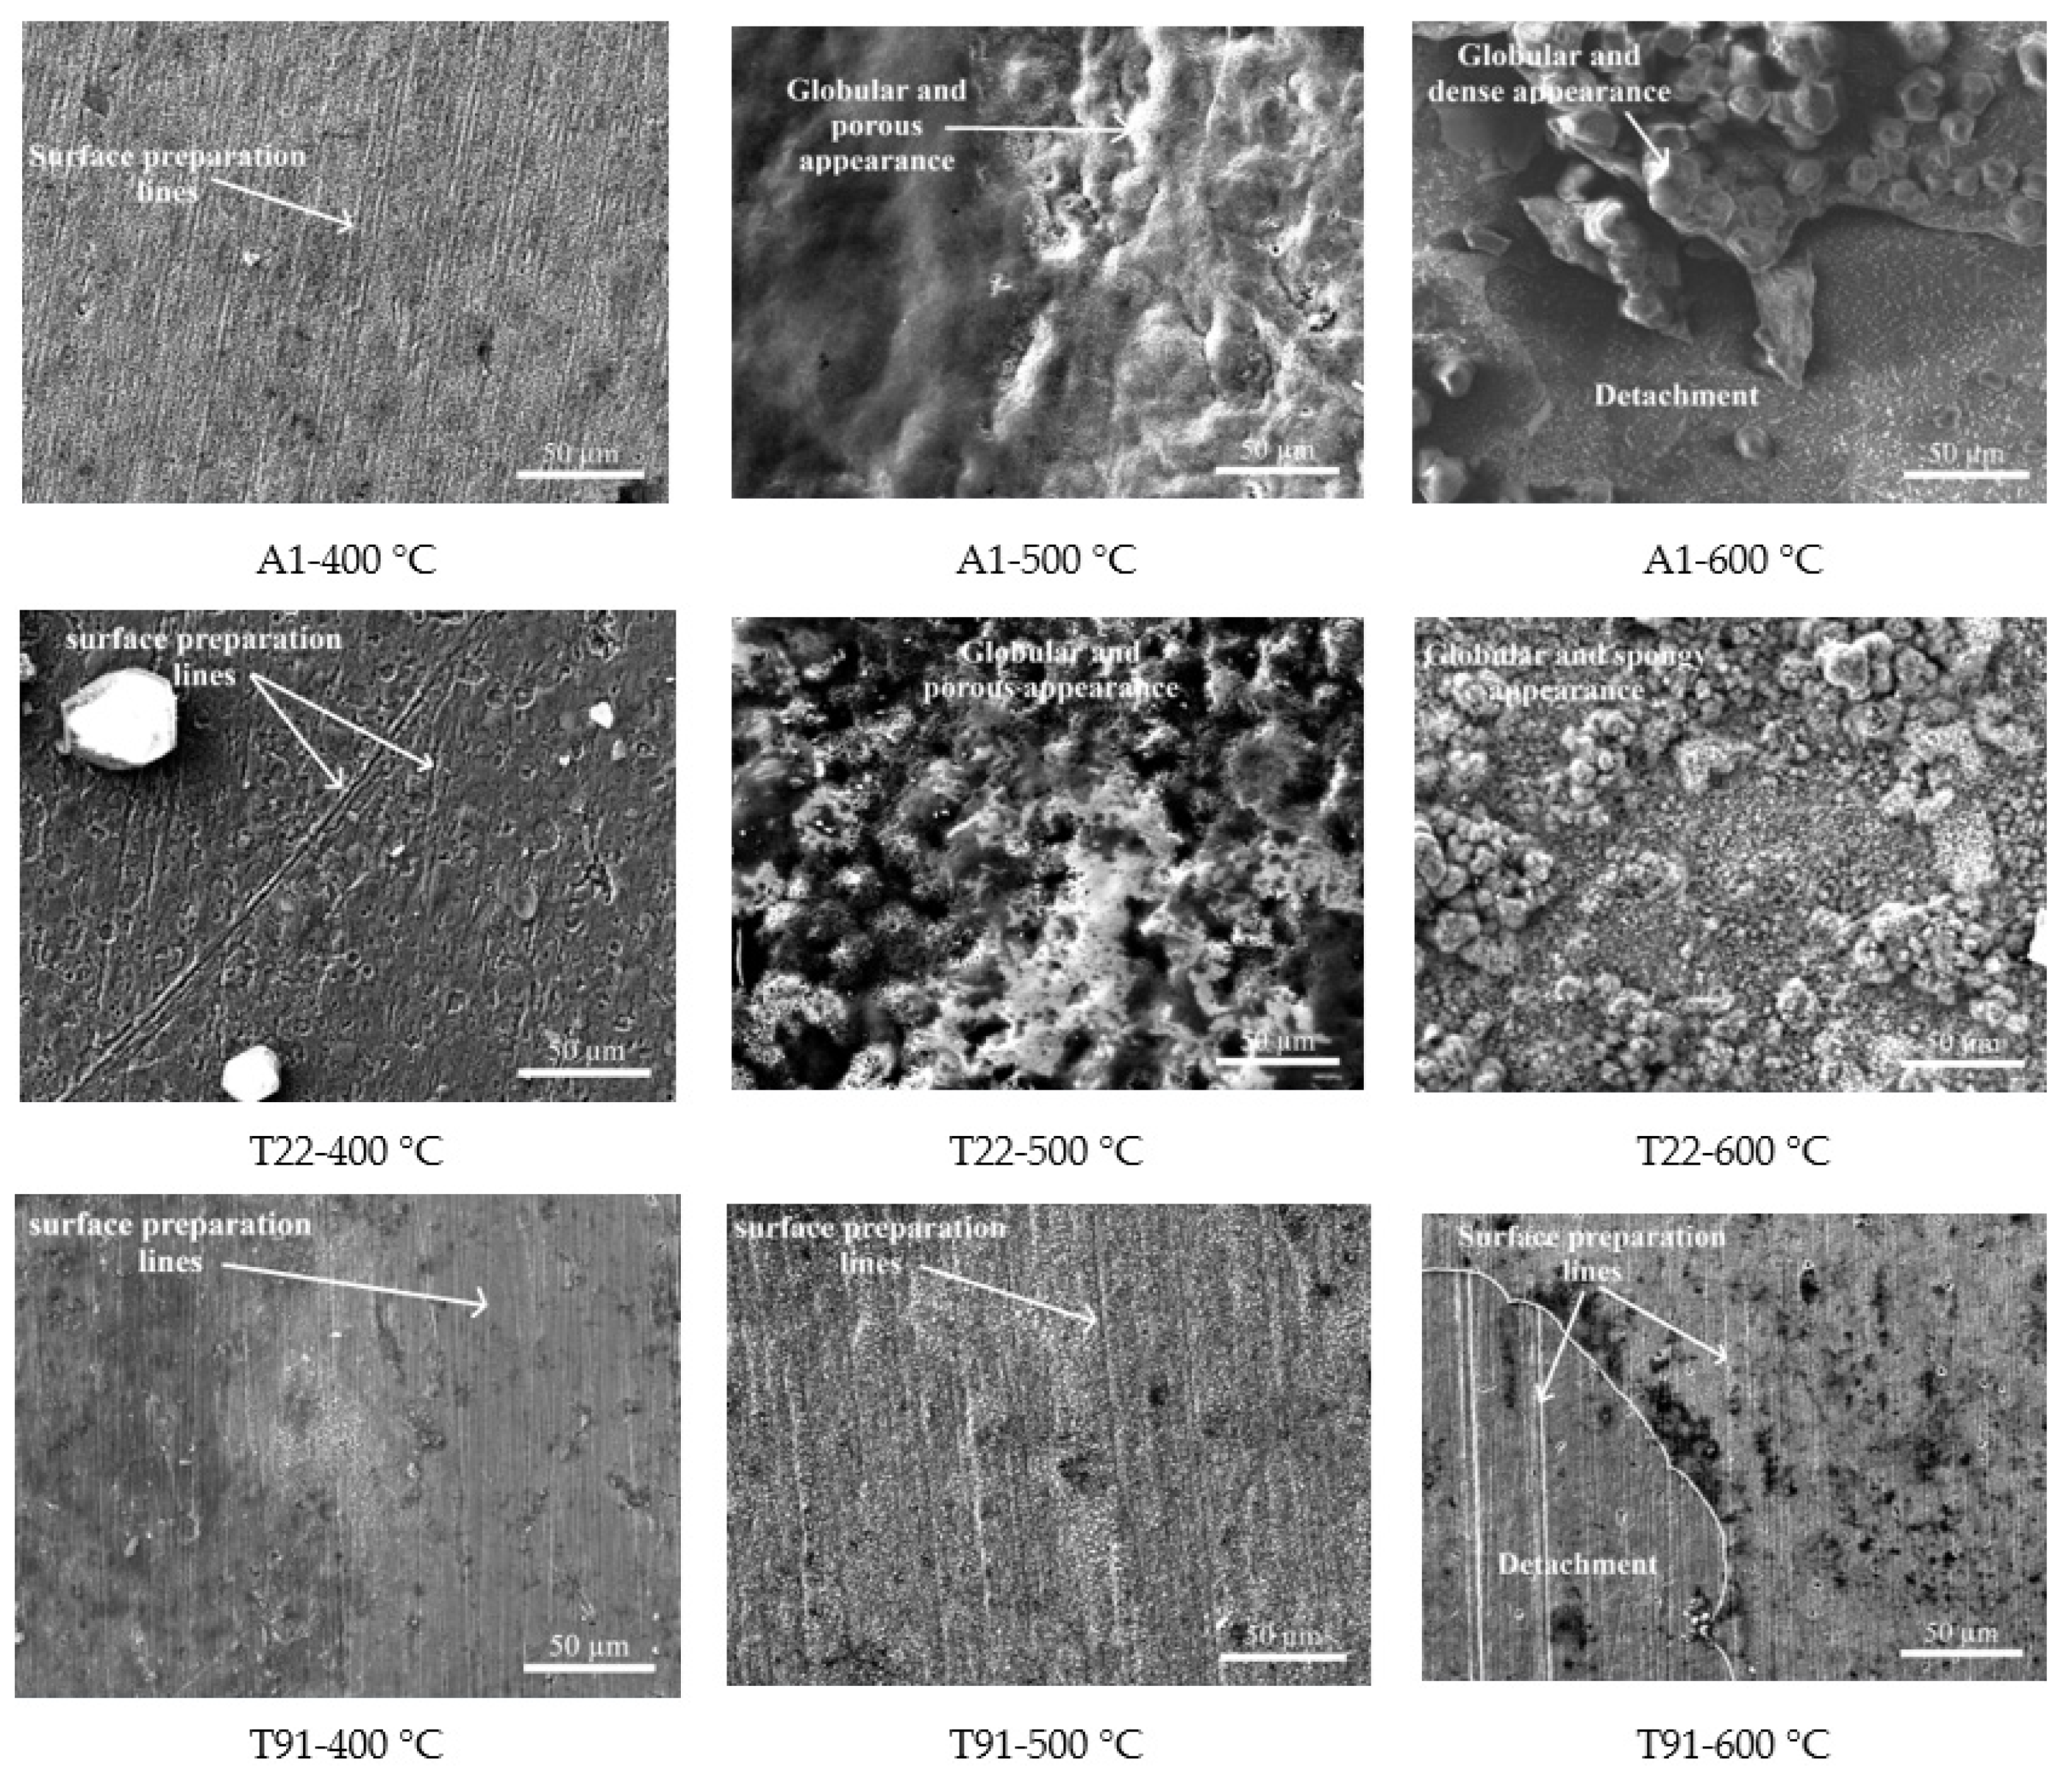
Figure 6 shows the surface aspects of steels immersed in nitrate salts at different temperatures after 100 h of testing.
Figure 6.
Morphological aspects of steel after 100 h of immersion in nitrate salts at different temperatures.
At 400 °C, all surfaces showed minimal corrosion product accumulation, and the lines generated during surface preparation prior to testing were still evident. This was consistent with the high Rp values obtained and the low reactivity of nitrate salts at this temperature [14].
However, increasing the temperature to 500 °C showed an increase in the aggressiveness of the nitrate salts [14]. In the case of A1 and T22 steels, this led to the formation of sufficiently thick corrosion product layers that cover the lines generated by the surface preparation process of the samples. The surface of the scale showed a globular and relatively low-density or porous appearance. However, the surface of T91 steel still displayed the lines from the surface preparation process, suggesting the formation of a denser and more homogeneous corrosion product layer, and therefore greater chemical stability. However, increasing the temperature to 500 °C showed an increase in the aggressiveness of the nitrate salts [14]. In the case of A1 and T22 steels, this led to the formation of sufficiently thick corrosion product layers that obscured the lines generated by the surface preparation process of the samples. The surface of the scale showed a globular and relatively low-density or porous appearance. However, the surface of T91 steel still displayed the lines from the surface preparation process, suggesting the formation of a denser and more homogeneous corrosion product layer, and therefore greater chemical stability.
The subsequent temperature increase (600 °C) revealed completely different surface characteristics for the three steels. Steel A1 showed apparent densification and greater growth of its corrosion product layer, which caused it to detach in some areas, possibly during the cooling process. The surface also exhibited a globular appearance. Steel T22 showed a more homogeneous surface with a globular, spongy appearance. However, on steel T91, the corrosion product layer still showed lines resulting from surface preparation, indicating a thinner and denser protective layer than that observed with the other steels. The micrograph also shows fracture and detachment of the protective layer (also possibly during sample cooling), which still reveals the lines from the surface preparation process. This suggests greater chemical stability of this steel compared to the others. This type of descaling of the protective layers is commonly observed due to the accumulation of stresses during their growth or to the difference in the coefficients of thermal expansion between the alloy and the protective layers formed [13].
As indicated by the Rp studies, at the highest test temperature the effect of Cr content on the corrosion resistance of steels is clearly observed,
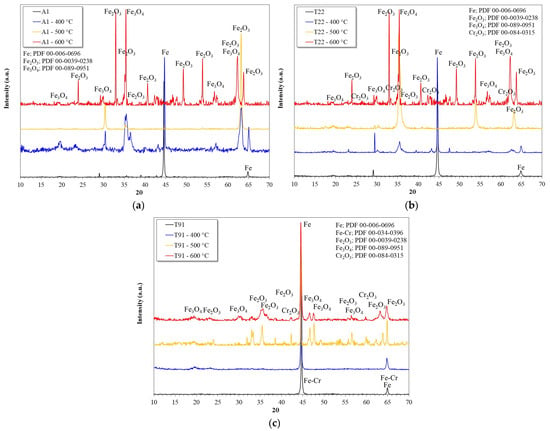
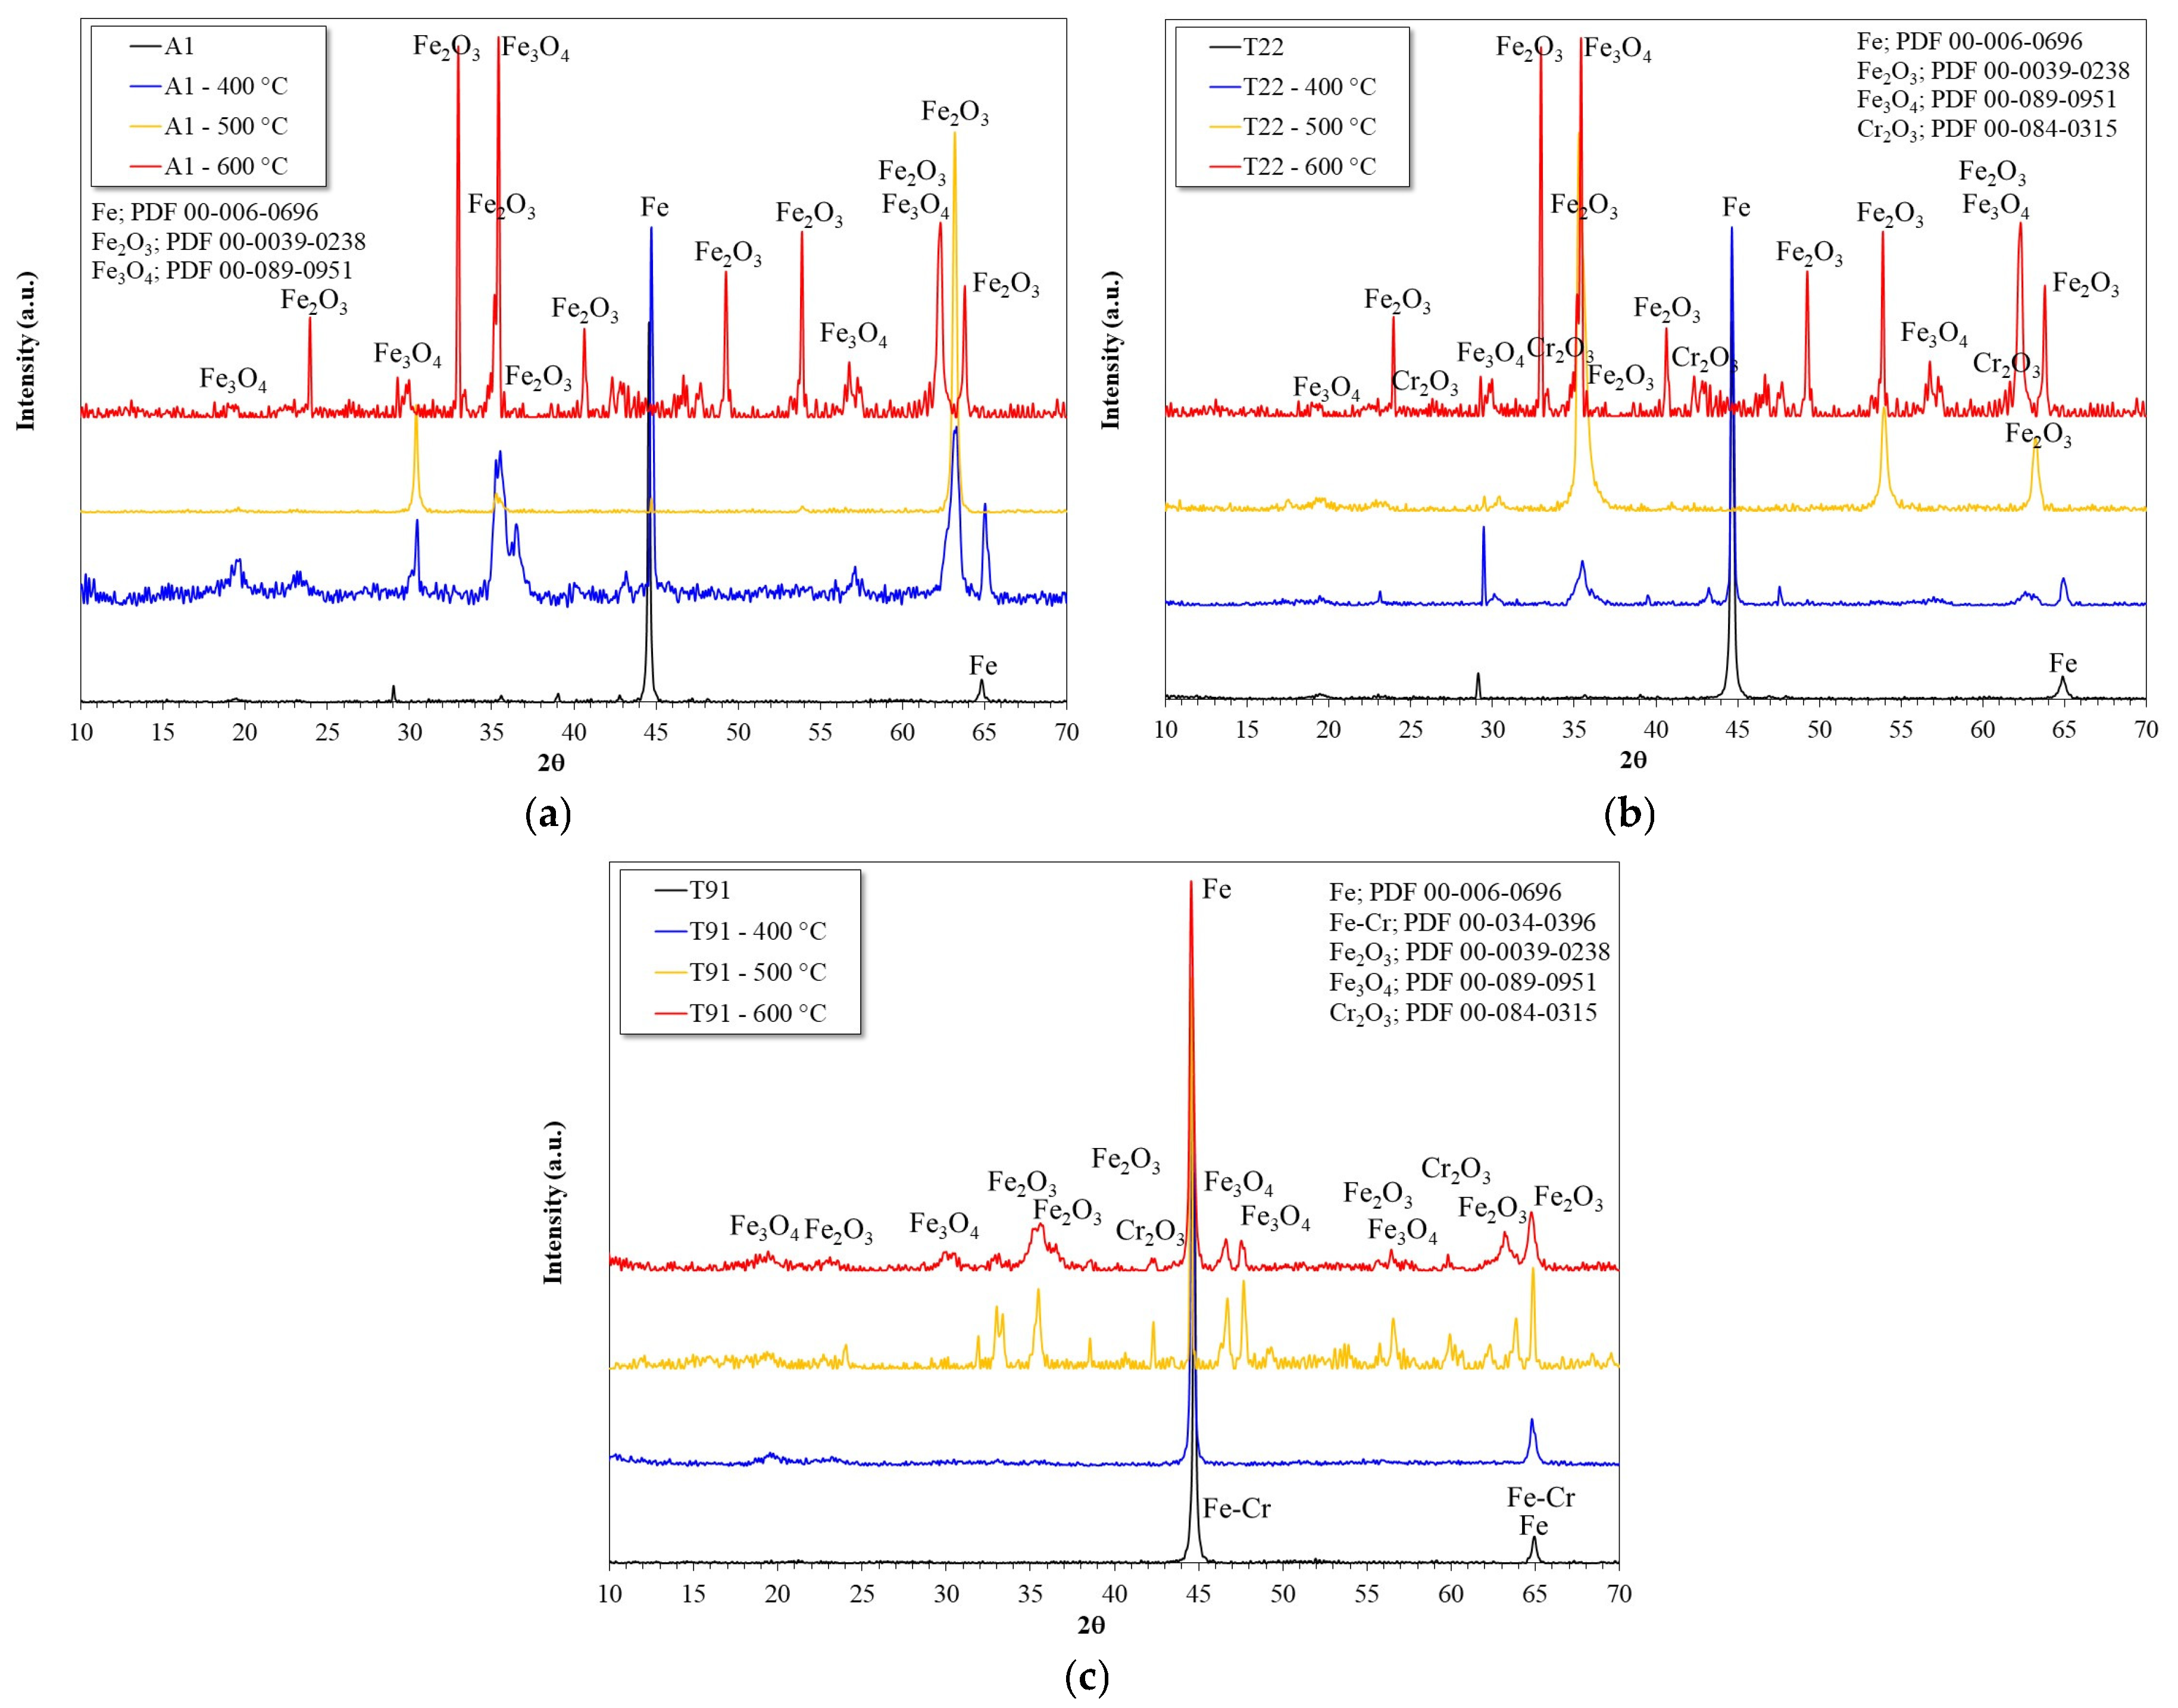
Figure 7 shows the X-ray diffraction patterns of the surface of the steels after 100 h of testing.
Figure 7.
X-ray diffraction patterns of the surface of steels after 100 h of immersion in nitrate salts at different temperatures; (a) A1, (b) T22, (c) T91.
In the case of A1 steel, as expected, only Fe-O compounds, specifically Fe2O3 and Fe3O4, were detected in its protective layer [10,19]. The presence of NaFeO2 was not detected, as suggested in other studies [2,45], possibly due to the short reaction times. Furthermore, NaFeO2 does not form a protective layer, and its presence weakens the external layers of insoluble iron oxides [45]. Interestingly, above 500 °C, the steel signal is no longer detectable, possibly due to the thickness of the corrosion product layer.
In the case of T22 steel, in addition to Fe oxides, the presence of Cr2O3 was also detected. As with A1 steel, the substrate signal is no longer detectable above 500 °C. This also suggests a thick layer of corrosion products.
In the case of T91 steel, the same compounds identified in T22 steel (Fe oxides and Cr oxide) were detected. Unlike what was observed in A1 and T22 steels, in this case the substrate signal was detected at all temperatures, suggesting the formation of a thinner protective layer.
In all cases, it can be observed that up to 500 °C the main iron oxide formed is Fe2O3, and at 600 °C the presence of Fe3O4 was similar to that of Fe2O3. This may be due to the greater activity of the oxide ion generated by the decomposition of nitrate salts [2,10,46,47,48], which in turn increases the corrosiveness of the melt. Similar diffraction patterns have been reported in studies of stainless steels immersed in nitrate salts [10].
3.4. Cross-Section Analysis
Because at 600 °C there is a clear definition of the effect of Cr content, only these results will be presented in this section.
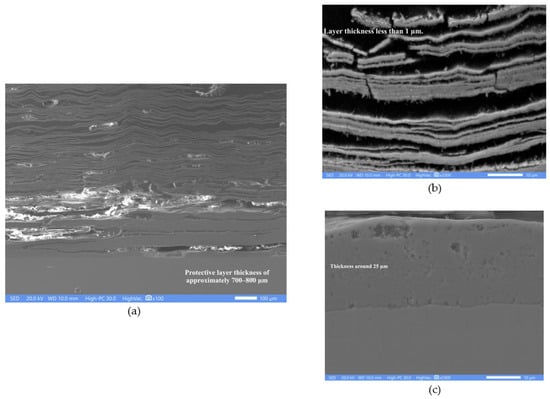
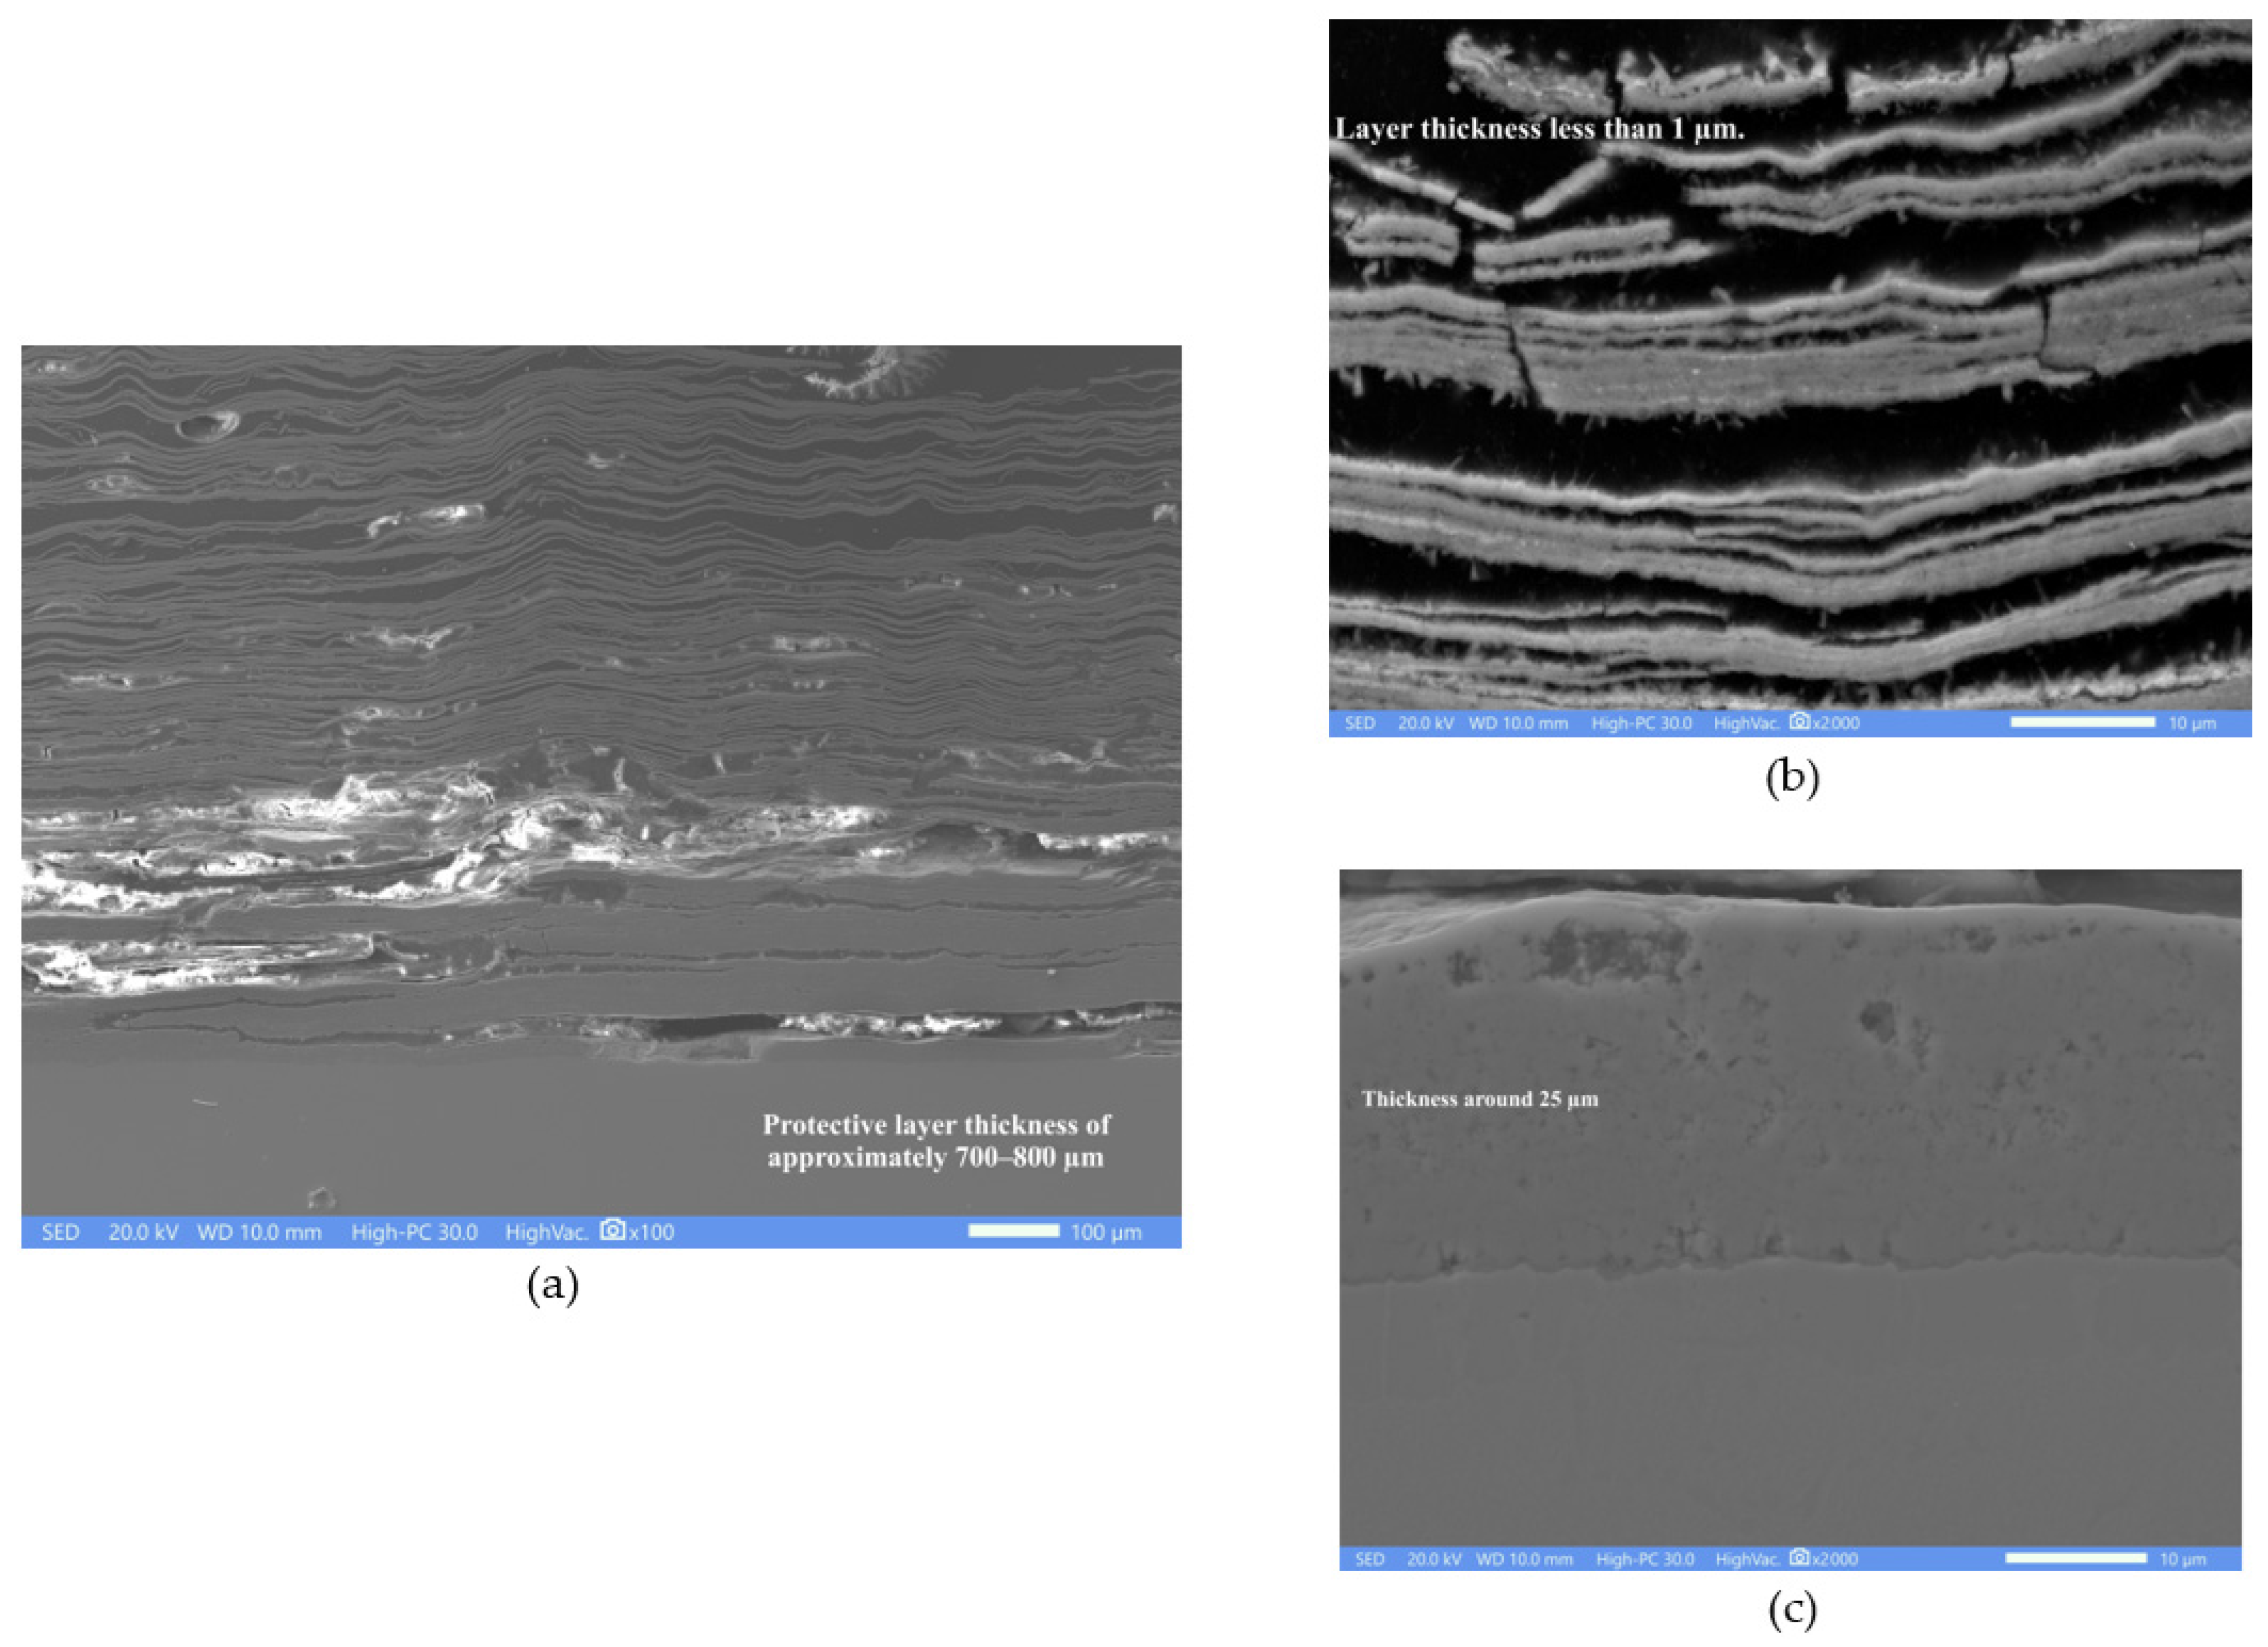
Figure 8 shows the cross-sectional appearance of A1 steel evaluated in nitrate salts for 100 h at 600 °C. Figure 8a shows that the corrosion product layer reached a thickness of approximately 700–800 μm, exhibiting a laminated appearance in areas that were in contact with the molten salts. Figure 8b shows a close-up of the outer zone of the corrosion product layer. The thickness of the Fe oxide lamellae is less than 1 µm. In contrast, Figure 8c shows a dense-looking layer of Fe oxides adhered to the surface of the steel with an approximate thickness of 25 µm.
Figure 8.
Cross-sectional appearance of the corrosion product layer of A1 steel evaluated at 600 °C in nitrate salts for 100 h. (a) General appearance; (b) Approach to the external part of the oxide layer; (c) Approach to the alloy-oxide interface.
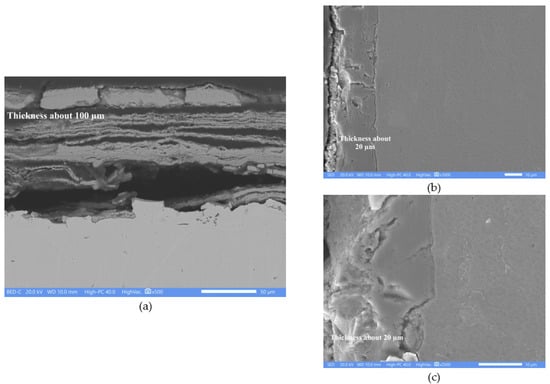
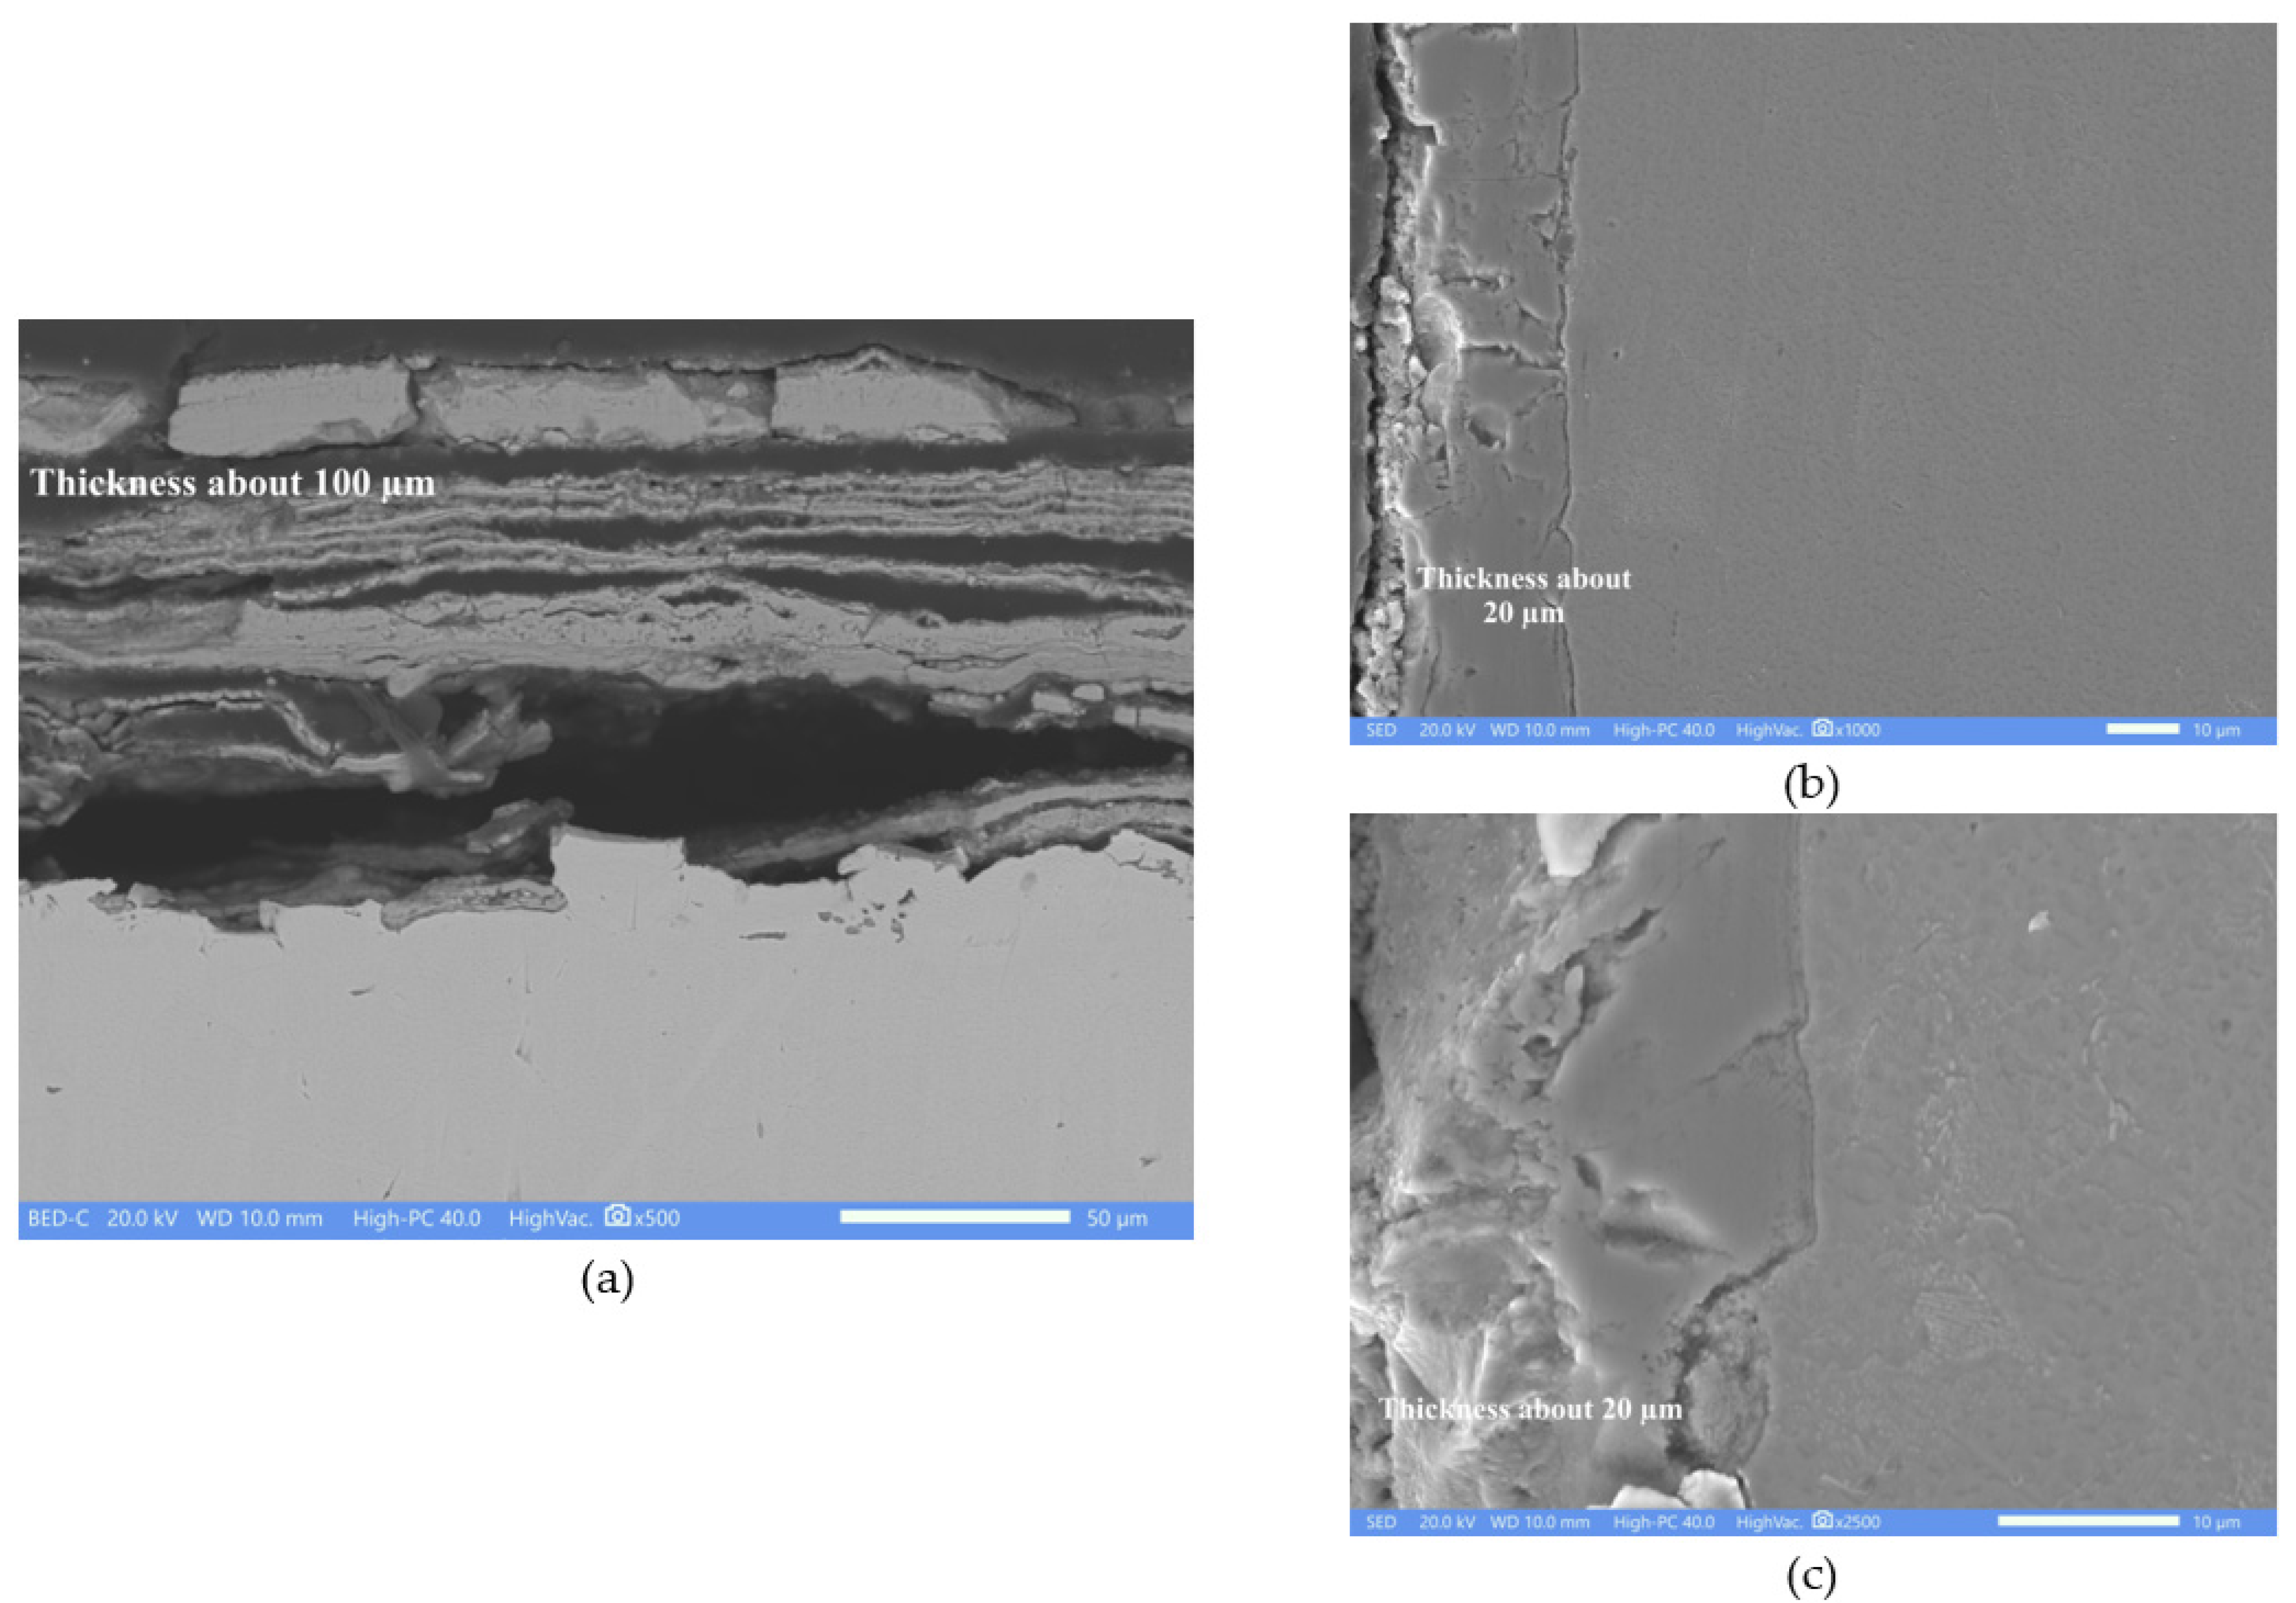
The T22 steel showed a corrosion product layer approximately 100 μm thick (Figure 9a). This thickness is about an order of magnitude less than that observed for the A1 steel; this significant decrease suggests that the presence of Cr significantly reduced the steel’s degradation rate. However, the protective layer also exhibits a laminated appearance. Similarly to the previous micrographs, these areas may also correspond to layers of Fe oxides. Voids are also observed within the corrosion product layer, possibly due to its detachment during the metallographic preparation of the samples. A denser layer is visible on the outer surface, as is the area bonded to the alloy. Figure 9b,c show a close-up of the alloy-corrosion product interface. According to the micrographs, this thin layer (approximately 20 µm thick) appears dense and adheres well to the substrate.
Figure 9.
Cross-sectional appearance of the corrosion product layer of T22 steel evaluated at 600 °C in nitrate salts for 100 h. (a) General appearance; (b) Close-up of the alloy-oxide interface; (c) Closer approach to the alloy-oxide interface.
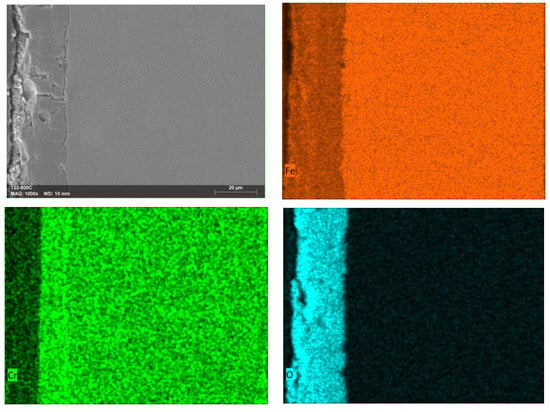
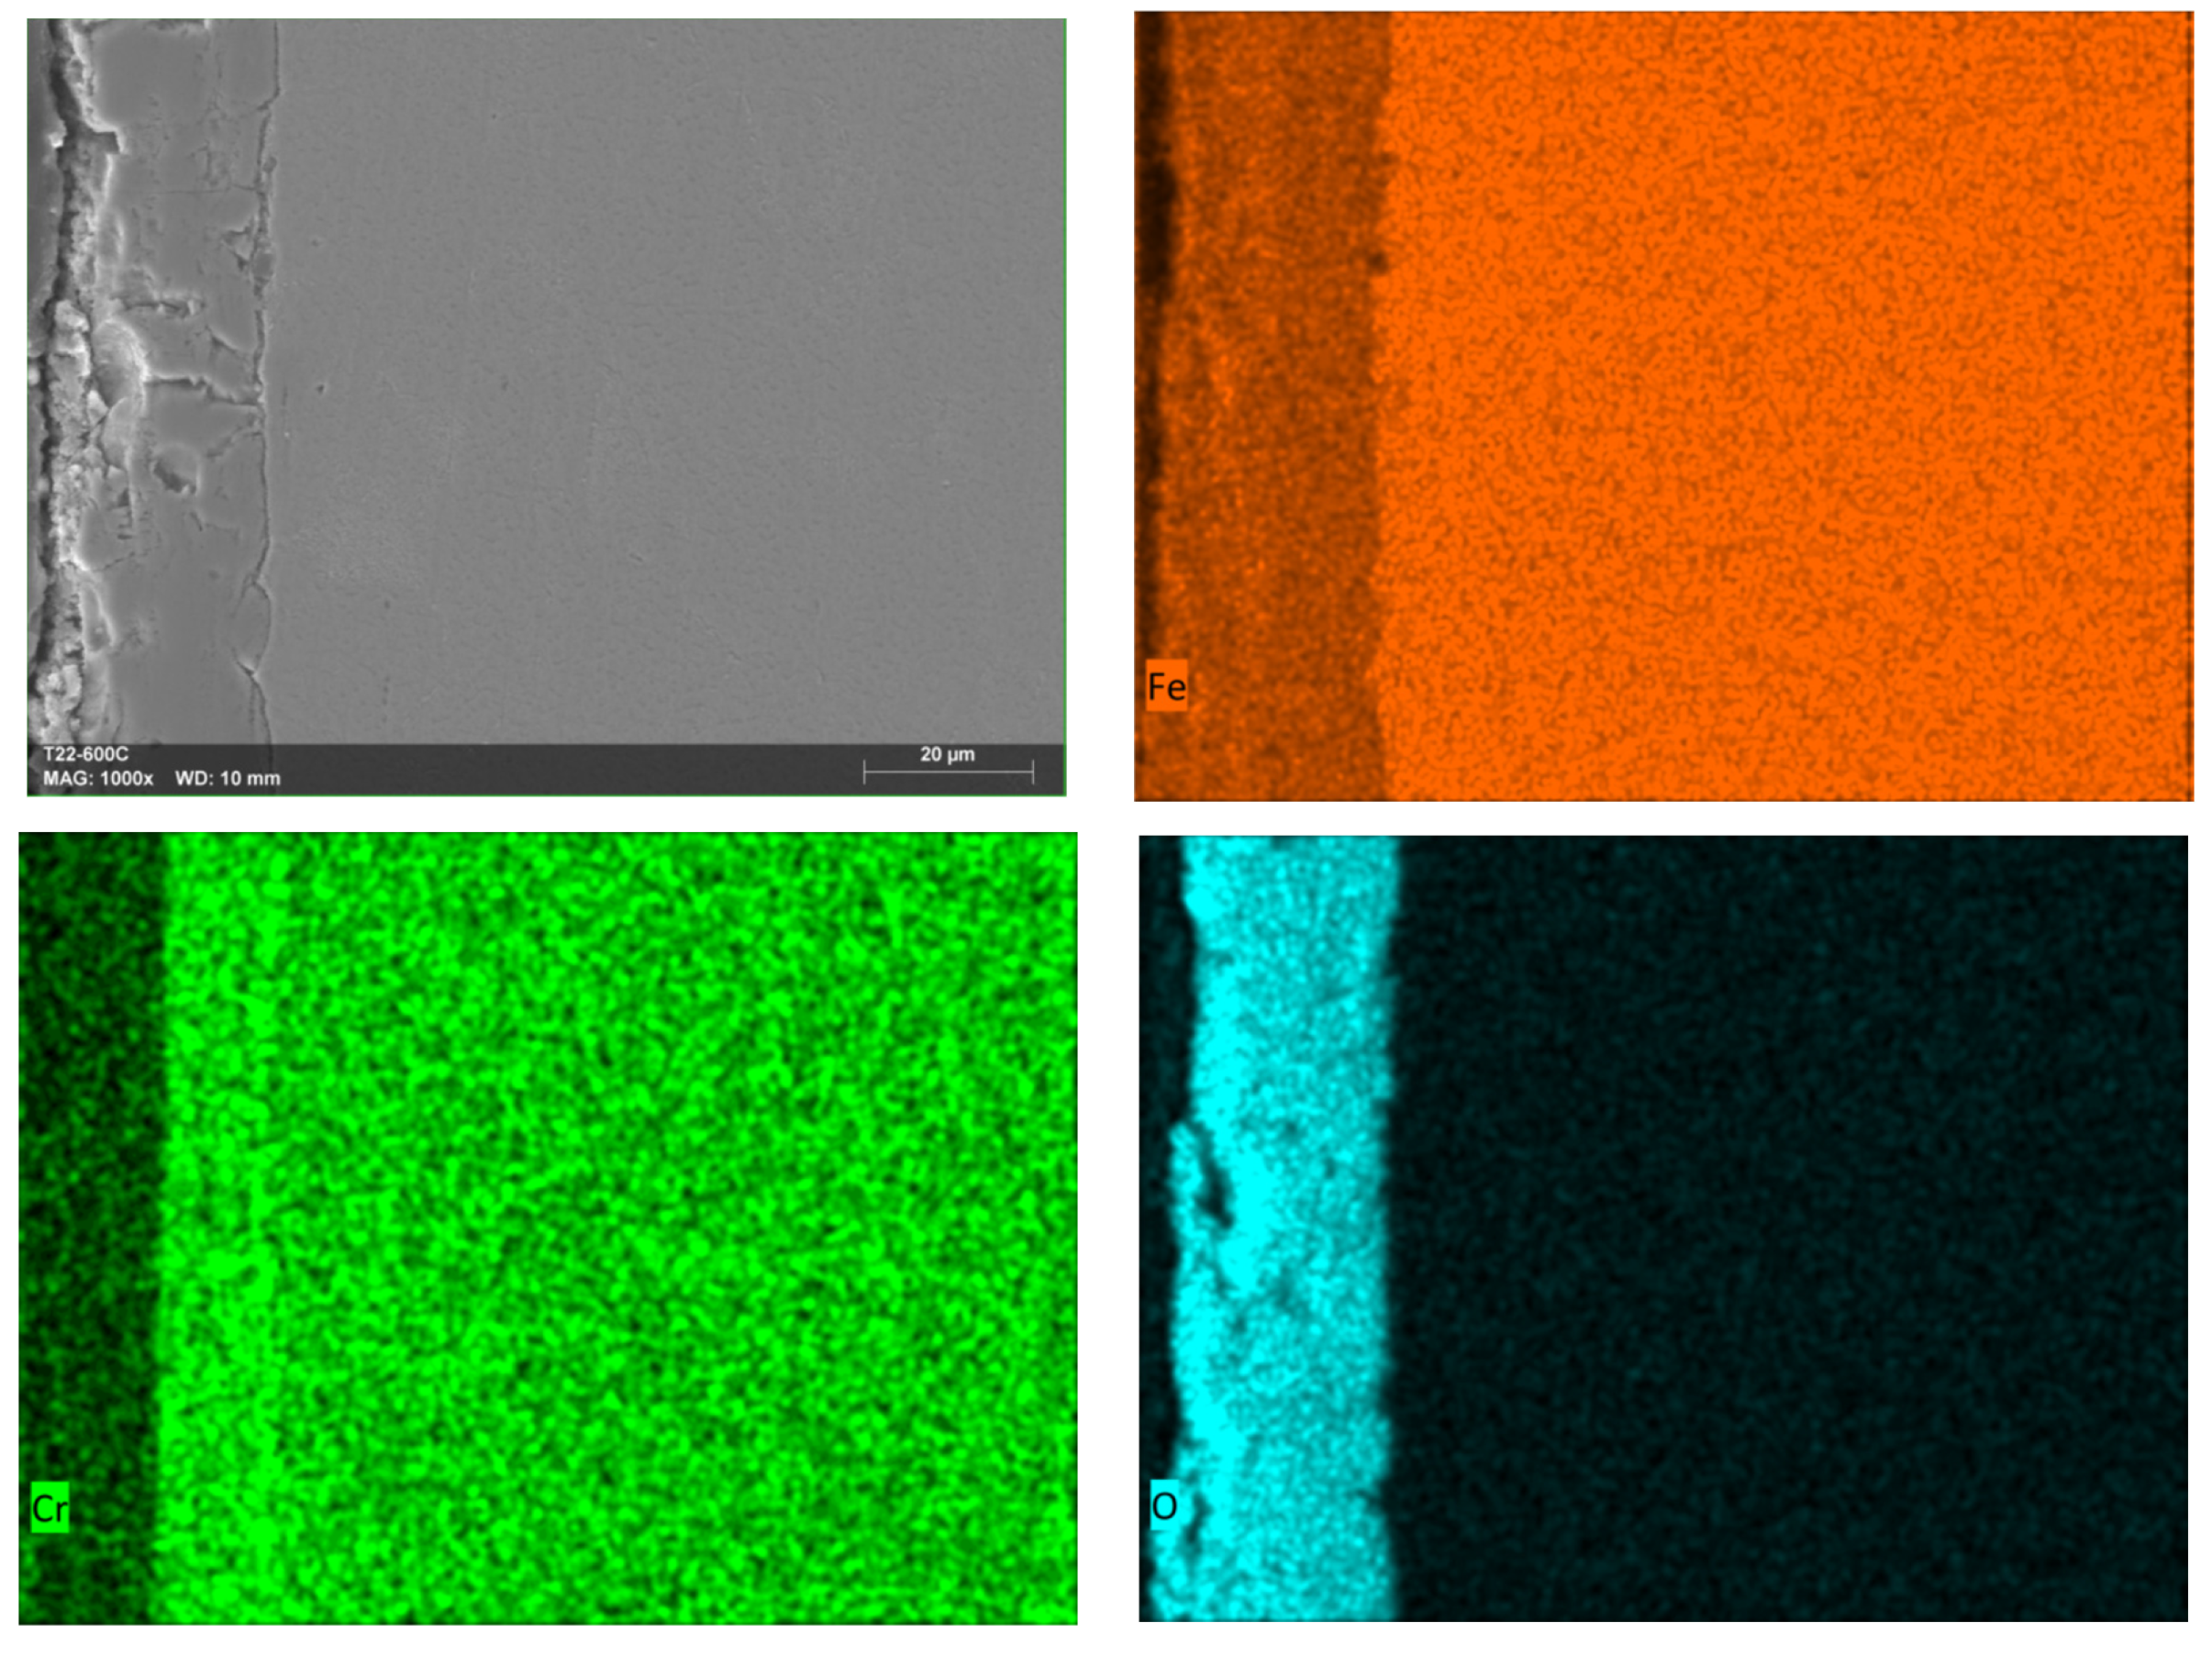
Figure 10 shows the mapping of elements to the corrosion product zone in contact with the alloy. According to the mappings, this layer is composed of Fe oxides and Cr oxides. The entire layer shows the presence of Fe, and only approximately half the layer thickness shows the presence of Cr (near the steel surface). This supports what has been previously established in other studies: that the initial presence of a layer of Fe oxides (insoluble in nitrate salts) favors the formation of a Cr oxide layer on the steel surface [14,17,46]. This is because the direct contact of nitrate salts with a metallic surface containing Cr and Mo causes their spontaneous dissolution, forming sodium chromates and molybdates, and not their respective oxides [2,14,15,16].
Figure 10.
Elements mapping of the cross-section of the protective layer-alloy interface of T22 steel evaluated at 600 °C in nitrate salts for 100 h.
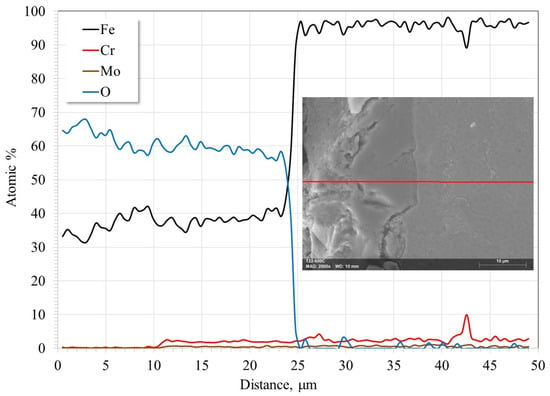
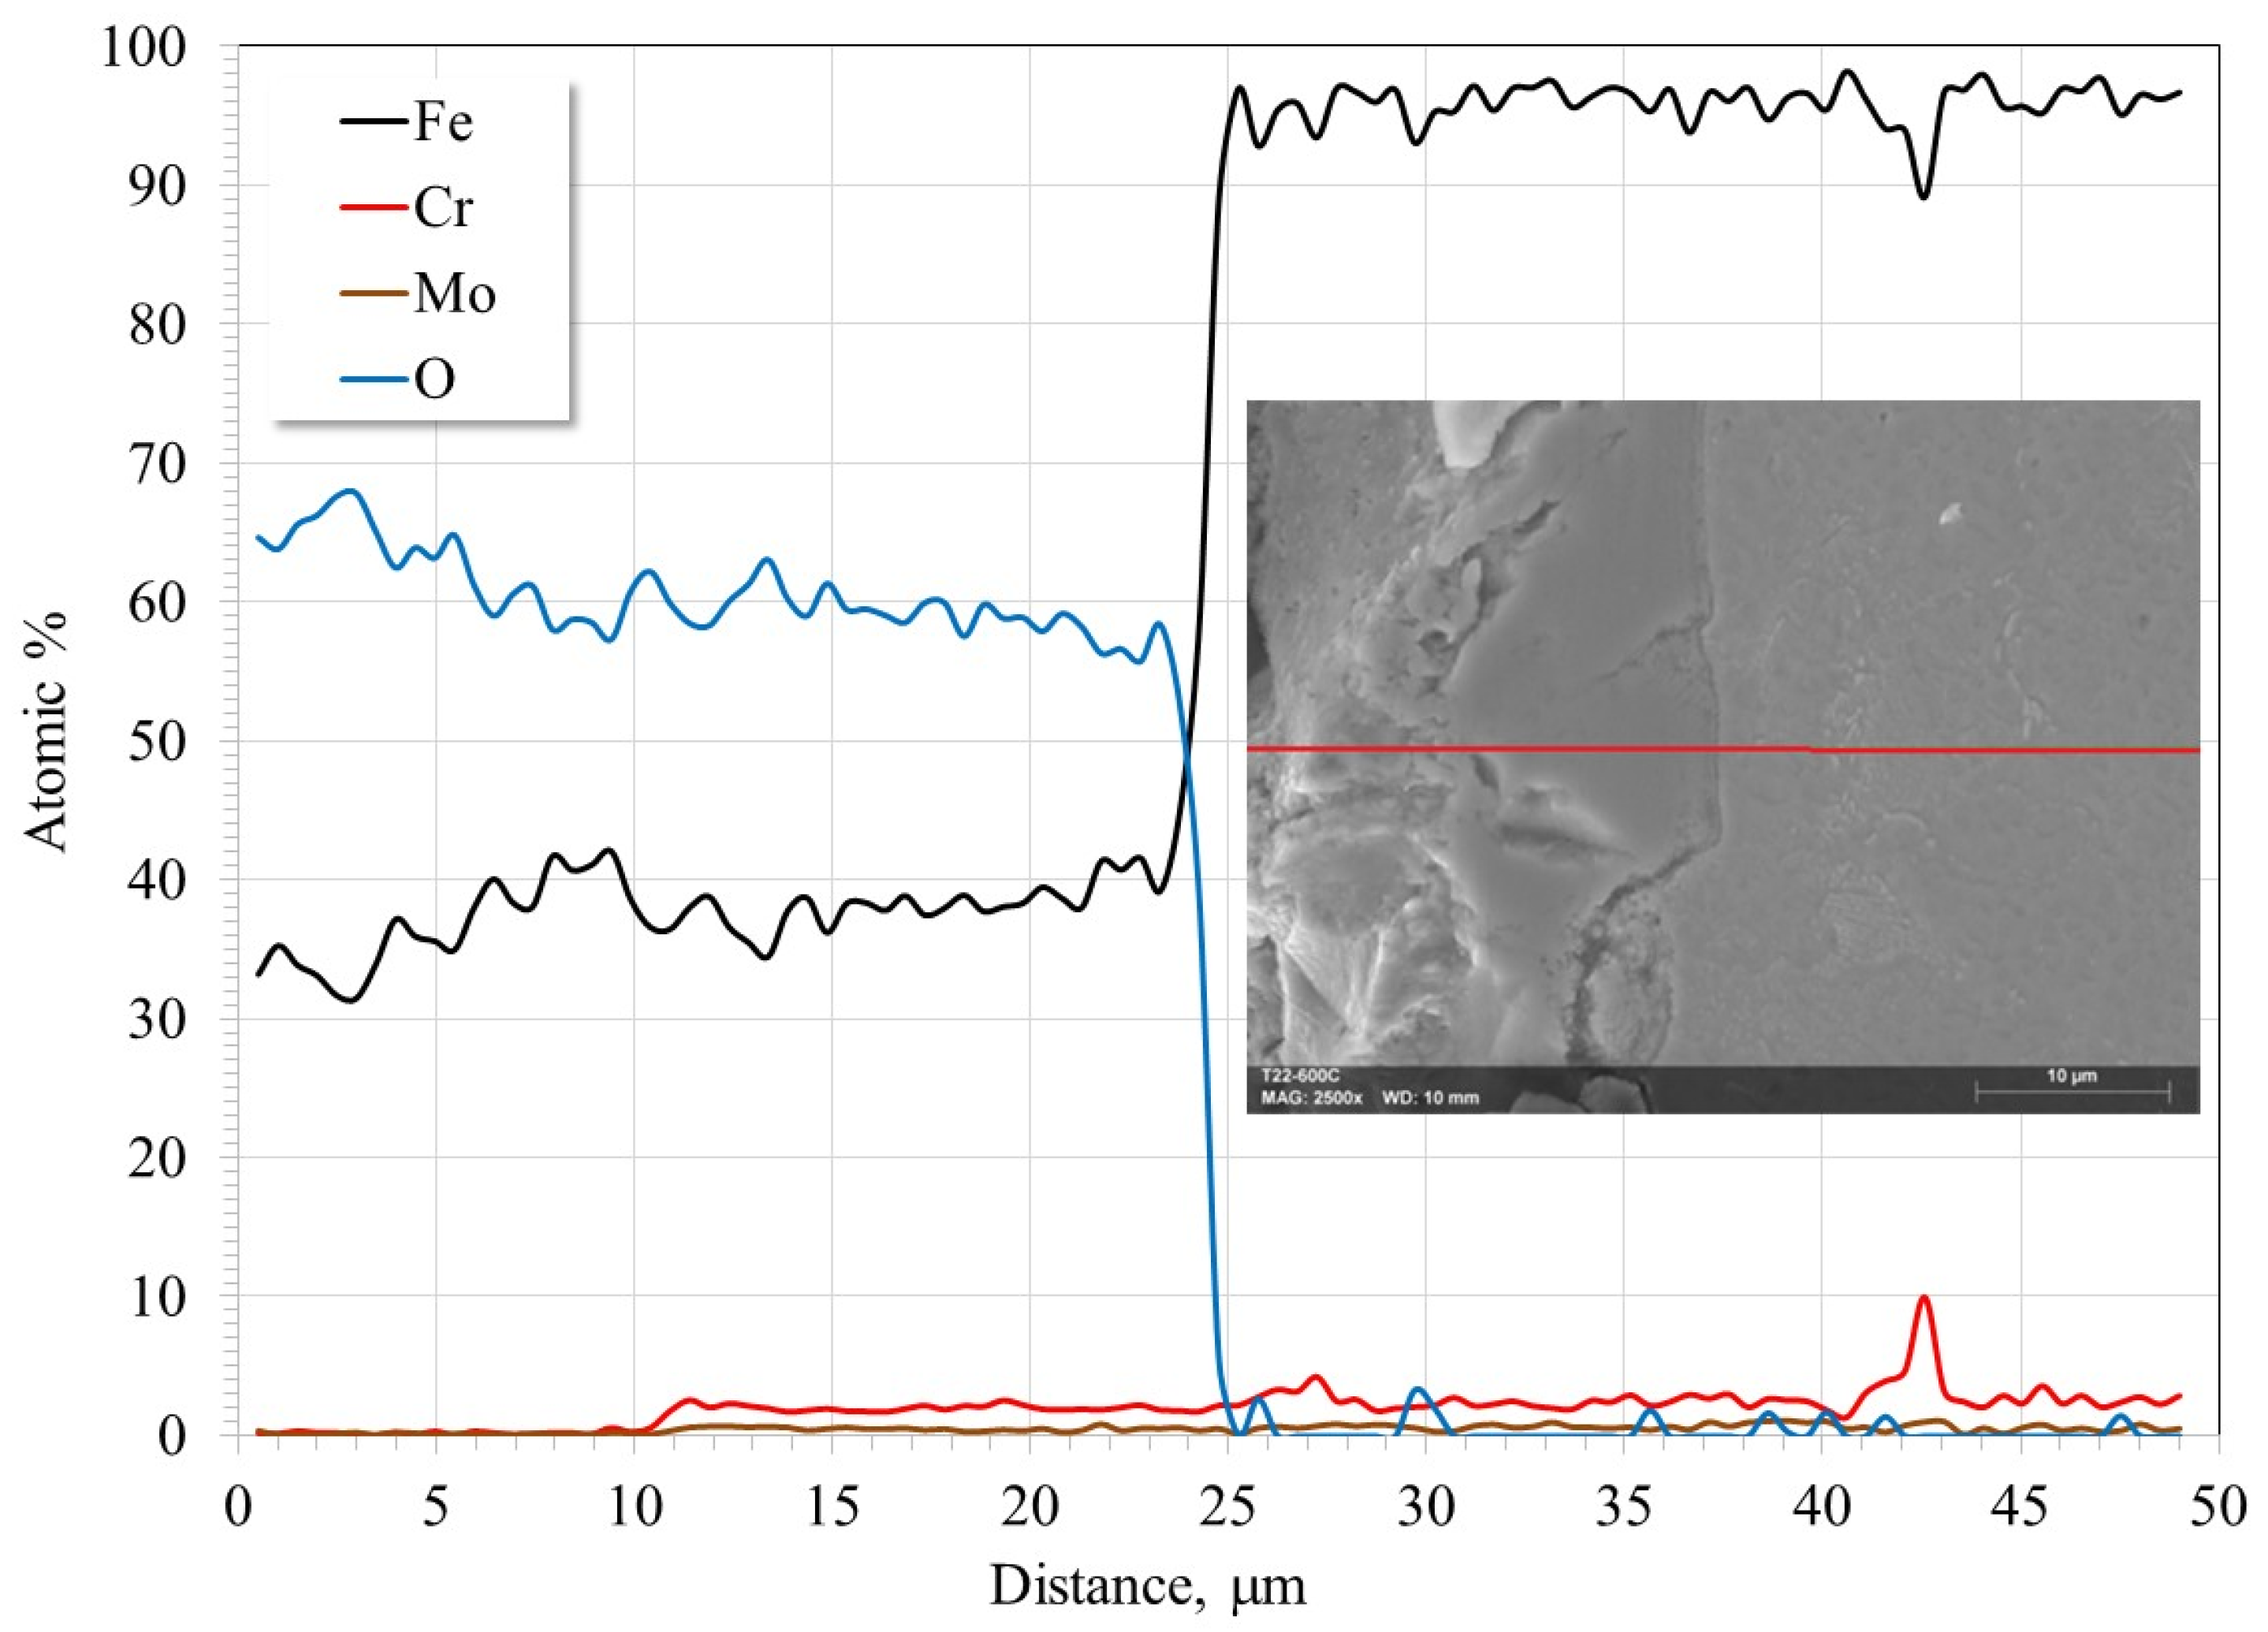
Figure 11 shows the online scan of the layer adhering to the surface of T22 steel. This layer is composed of a mixture of Fe and Cr oxides. The Cr oxides are concentrated near the steel surface in an area approximately 10 µm thick. Some authors suggest the possible formation of FeCr2O4 [3,11,12,13,45]; however, the atomic proportions of the elements suggest the simple presence of a mixture of oxides. Its presence has usually been detected with steels having a higher Cr content or with longer exposure times [13,45].
Figure 11.
Line-scan of the cross-section of the interface layer bonded to T22 steel evaluated at 600 °C in nitrate salts for 100 h.
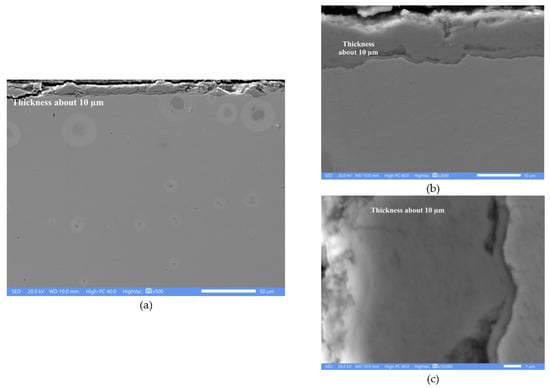
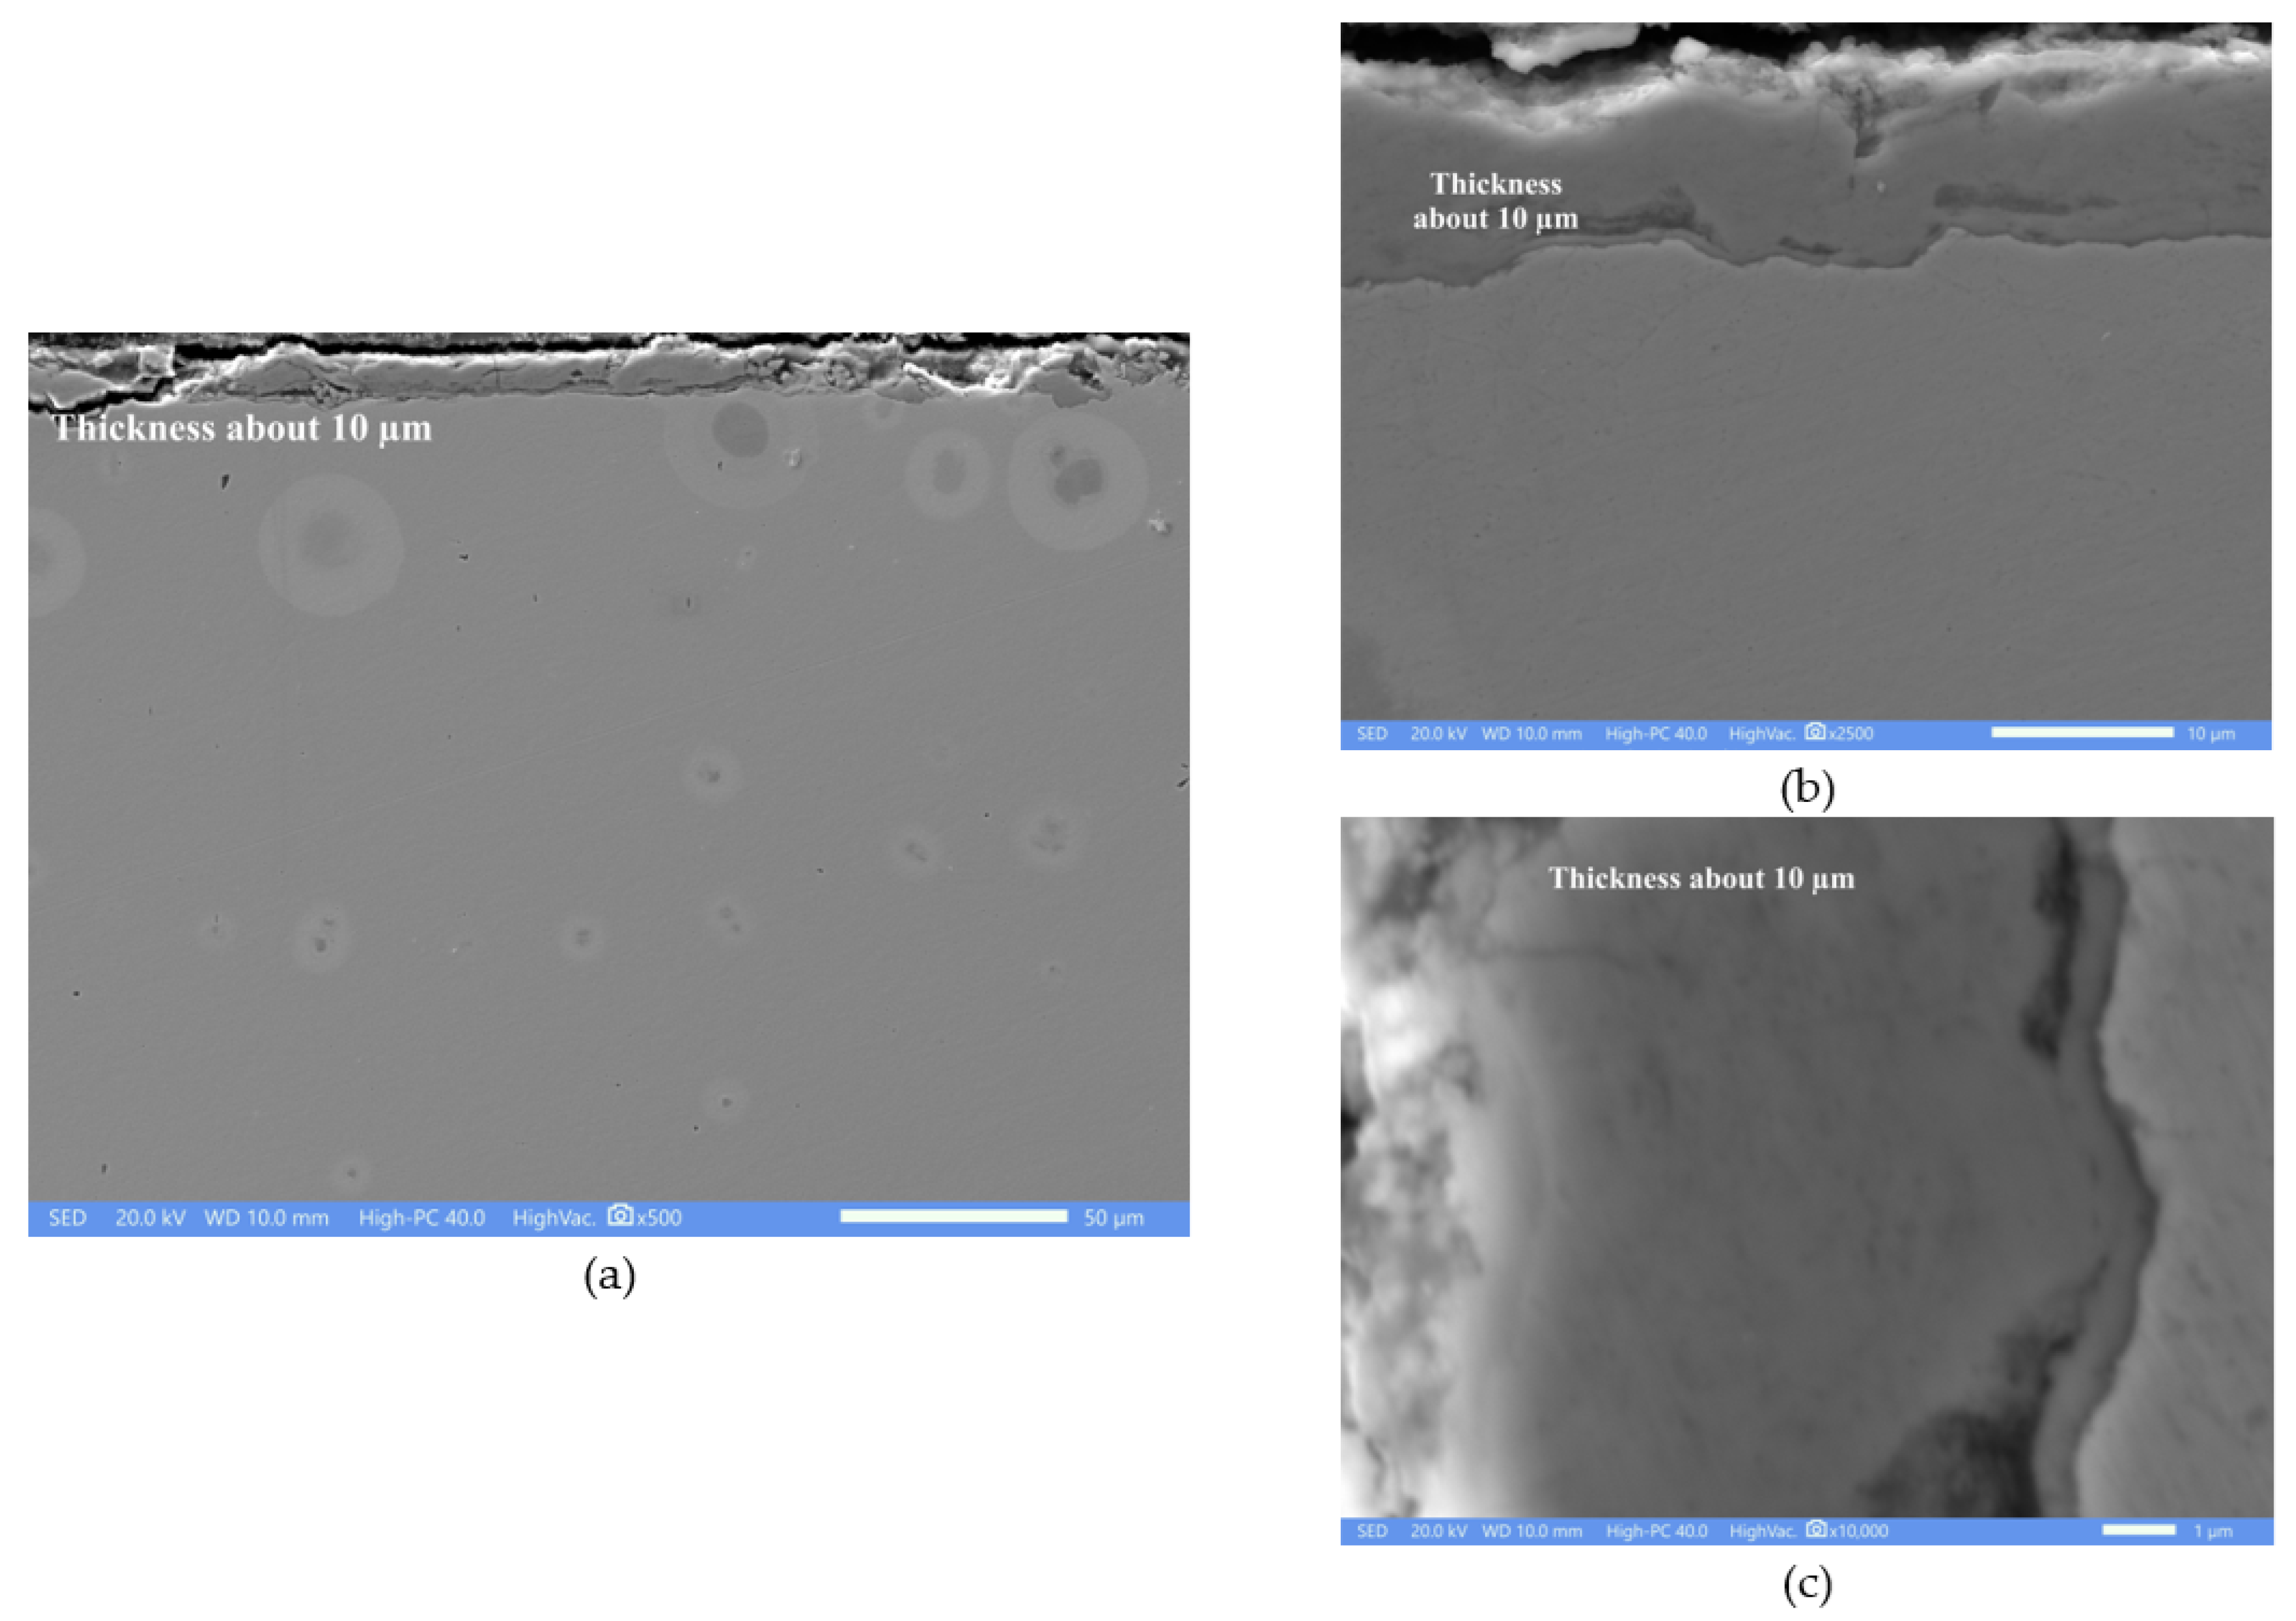
T91 steel showed the thinnest corrosion layer (Figure 12), with a thickness of approximately 10 µm. This is an order of magnitude less than the thickness shown by T22 steel. This again confirms that the presence and content of chromium decrease the steel degradation rate. Unlike the previous cases, the protective layer appears more compact and denser, with no evident exfoliation. Close-up views of the protective layer (Figure 12b,c) show a denser appearance and greater adhesion to the substrate.
Figure 12.
Cross-sectional appearance of the corrosion product layer of T91 steel evaluated at 600 °C in nitrate salts for 100 h. (a) General appearance; (b) Close-up of the alloy-oxide interface; (c) Closer approach to the alloy-oxide interface.
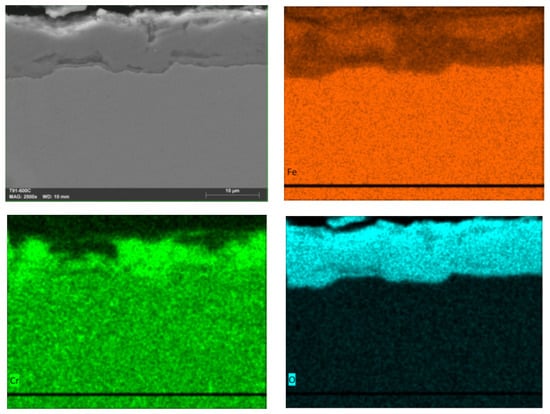
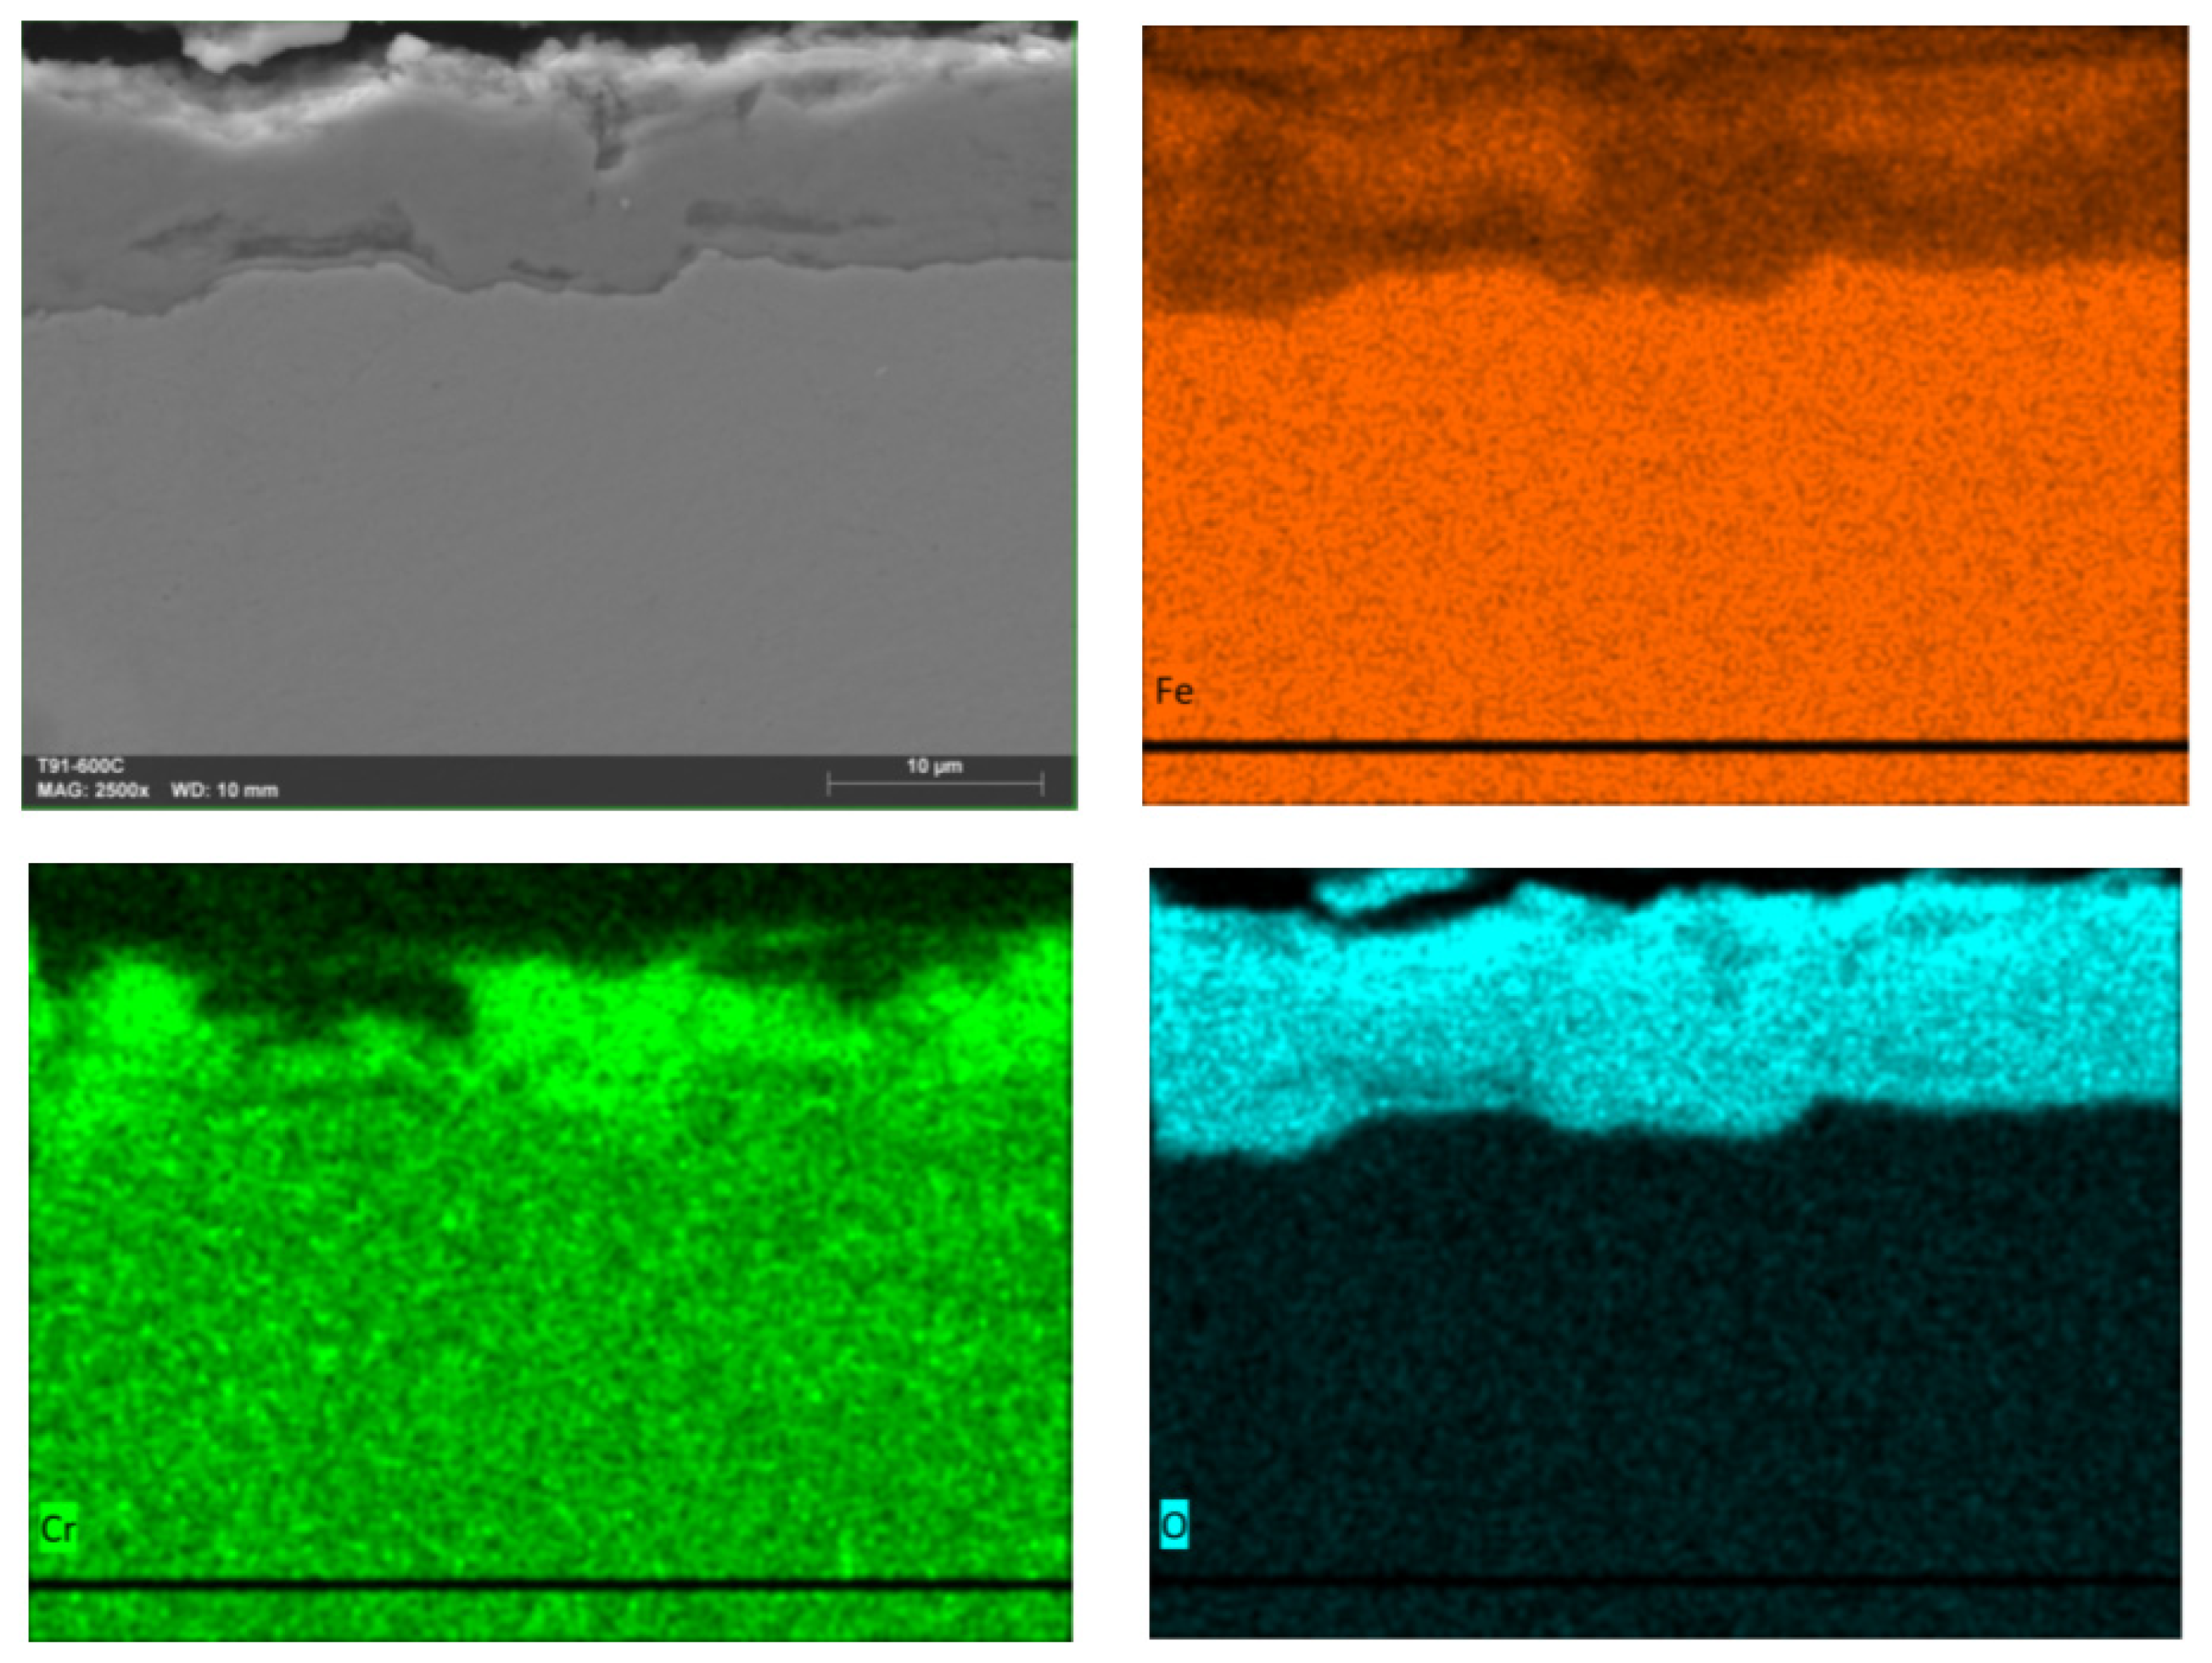
Element mapping (Figure 13) shows that the protective layer is also formed by a mixture of Fe oxides and Cr oxide. The concentration of Cr oxides is higher at the interface with the steel. This again confirms that an external layer of Fe oxides favors the formation of Cr oxides on the steel surface [2,10,14,15,16,17].
Figure 13.
Elements mapping of the cross-section of the protective layer-alloy interface of T91 steel evaluated at 600 °C in nitrate salts for 100 h.
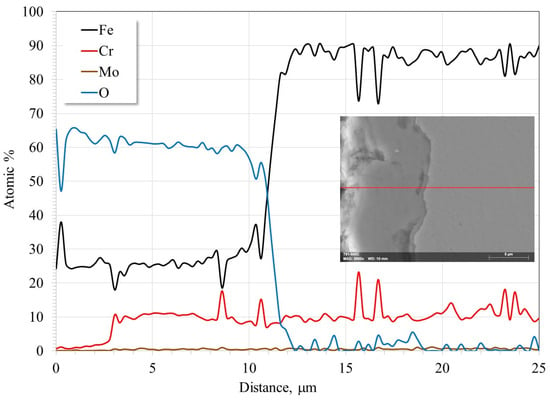
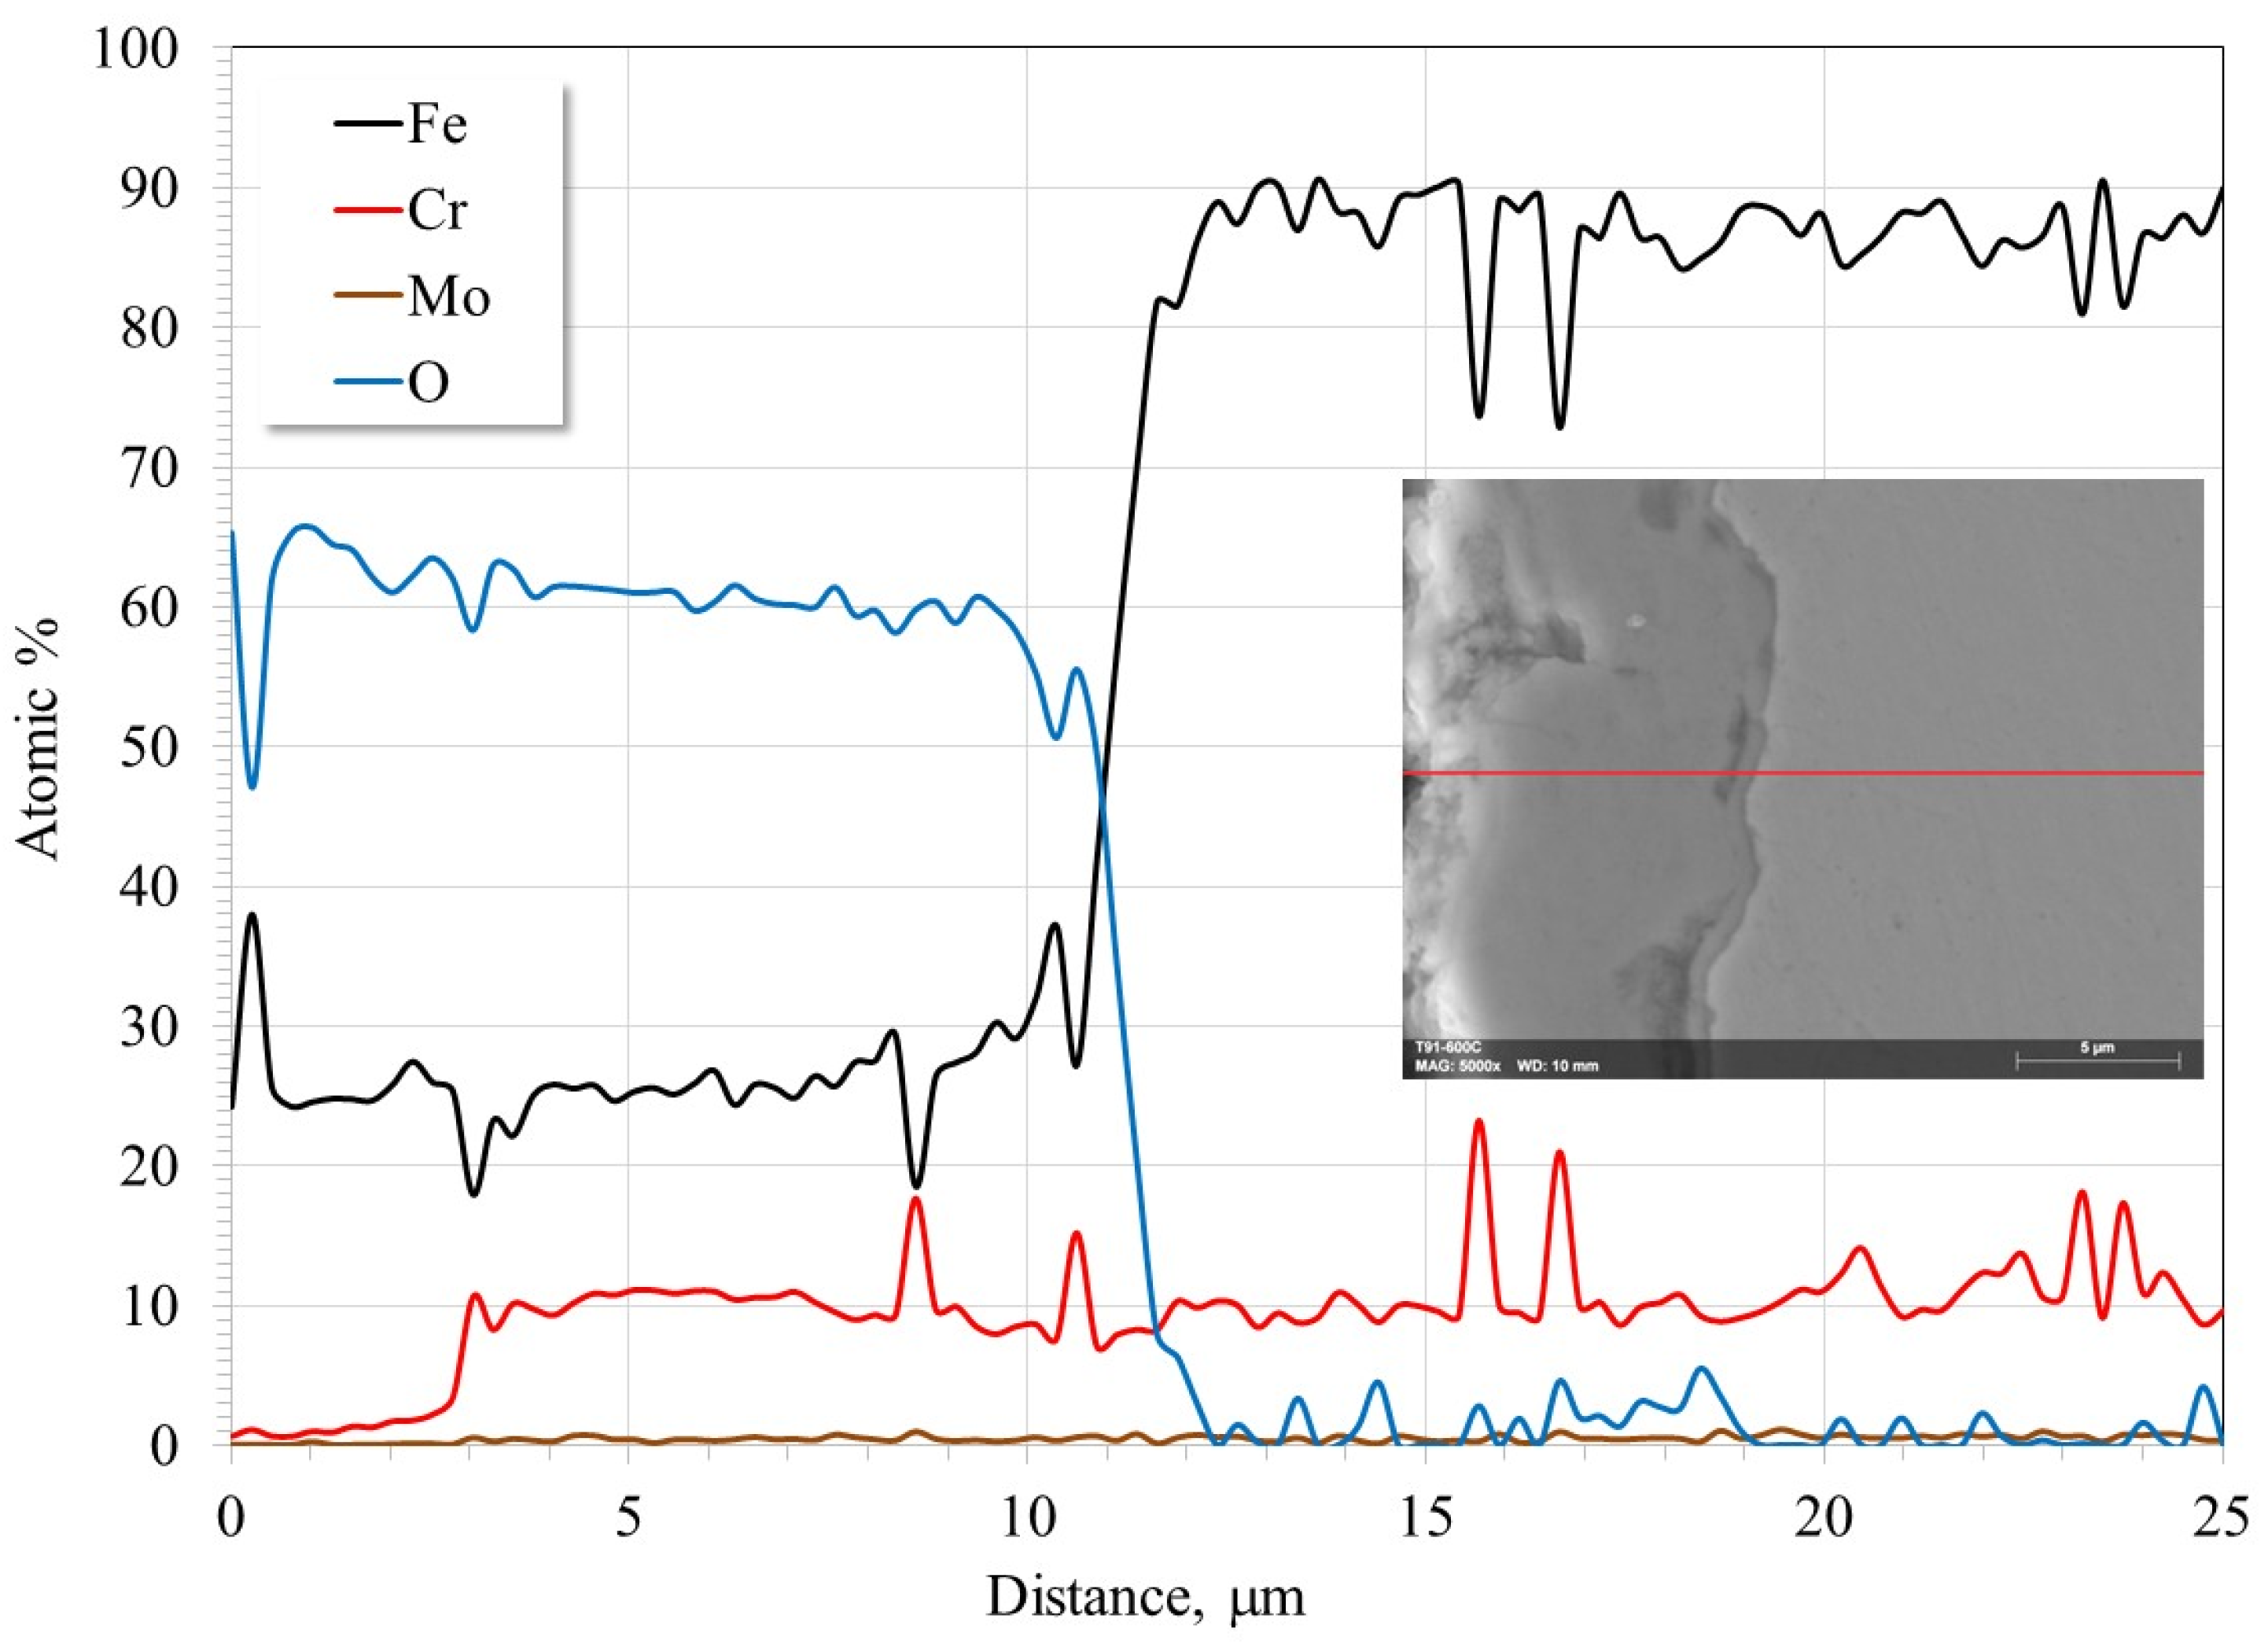
The online scan of the layer bonded to T91 steel (Figure 14) shows that the outer portion, approximately 1/3 of the total thickness, is composed mainly of Fe oxides, while the remainder consists of a mixture of Fe and Cr oxides, with a significantly high Cr content (approximately 10 atomic percent). No Cr depletion zone is observed within the alloy, suggesting that, although increased temperature enhances the aggressiveness of the melt, the protective layer is sufficiently stable to prevent its constant regeneration, as occurs with more aggressive electrolytes [49,50]. The atomic proportions of the elements do not suggest the formation of FeCr2O4, and its presence has been reported to occur at reaction times much longer than those used in the tests described here [3,10,11,12,13]. Therefore, it is confirmed that the protective layer is formed by a mixture of Fe and Cr oxides, where the presence of Cr oxides prevents the exfoliation process of the Fe oxides and increases their densification and adhesion to the steel. It has been reported that the Cr content of T91 steel is too low to form a layer of pure Cr2O3 [10].
Figure 14.
Line-scan of the cross-section of the interface layer bonded to T91 steel evaluated at 600 °C in nitrate salts for 100 h.
The formation of the corrosion products identified in this study can be rationalized considering the electrochemical reactions occurring in molten nitrate salts. These reactions involve the anodic dissolution of the alloying elements and the cathodic reduction in nitrate species, which promote the formation of iron and chromium oxides. The results shown indicate that the main corrosion products are metal oxides, where the cationic species come from the anodic reaction of the metal surface:
Some reports have also suggested the existence of the following reaction [10]:
In oxygen-rich atmospheres, the only anionic species comes mainly from the decomposition of the nitrate ion through the cathodic reaction [2,5,10,46,47,48,51]:
Surface enrichment in the oxide ion favors the chemical precipitation of the identified metal oxides [10]:
The corrosion behavior of the investigated steels is strongly influenced by both temperature and alloy composition. Increasing temperature generally accelerates the electrochemical reactions occurring in molten nitrate salts, promoting faster oxidation and growth of surface oxide scales. At higher temperatures, these oxide layers may become thicker but also more prone to structural defects such as porosity or cracking, which can reduce their protective character.
3.5. Electrochemical Impedance Spectroscopy
All impedance spectra exhibited two characteristic time constants associated with the corrosion product layer and the metal/oxide interface.
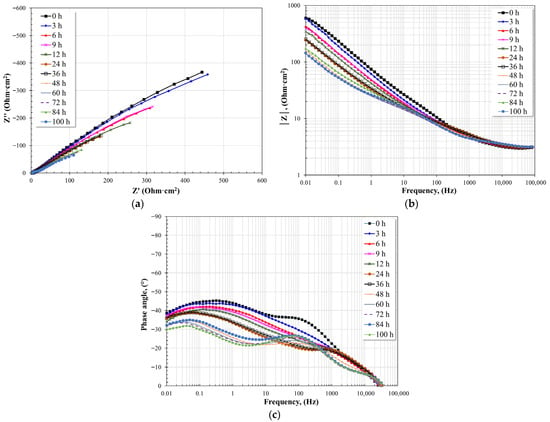
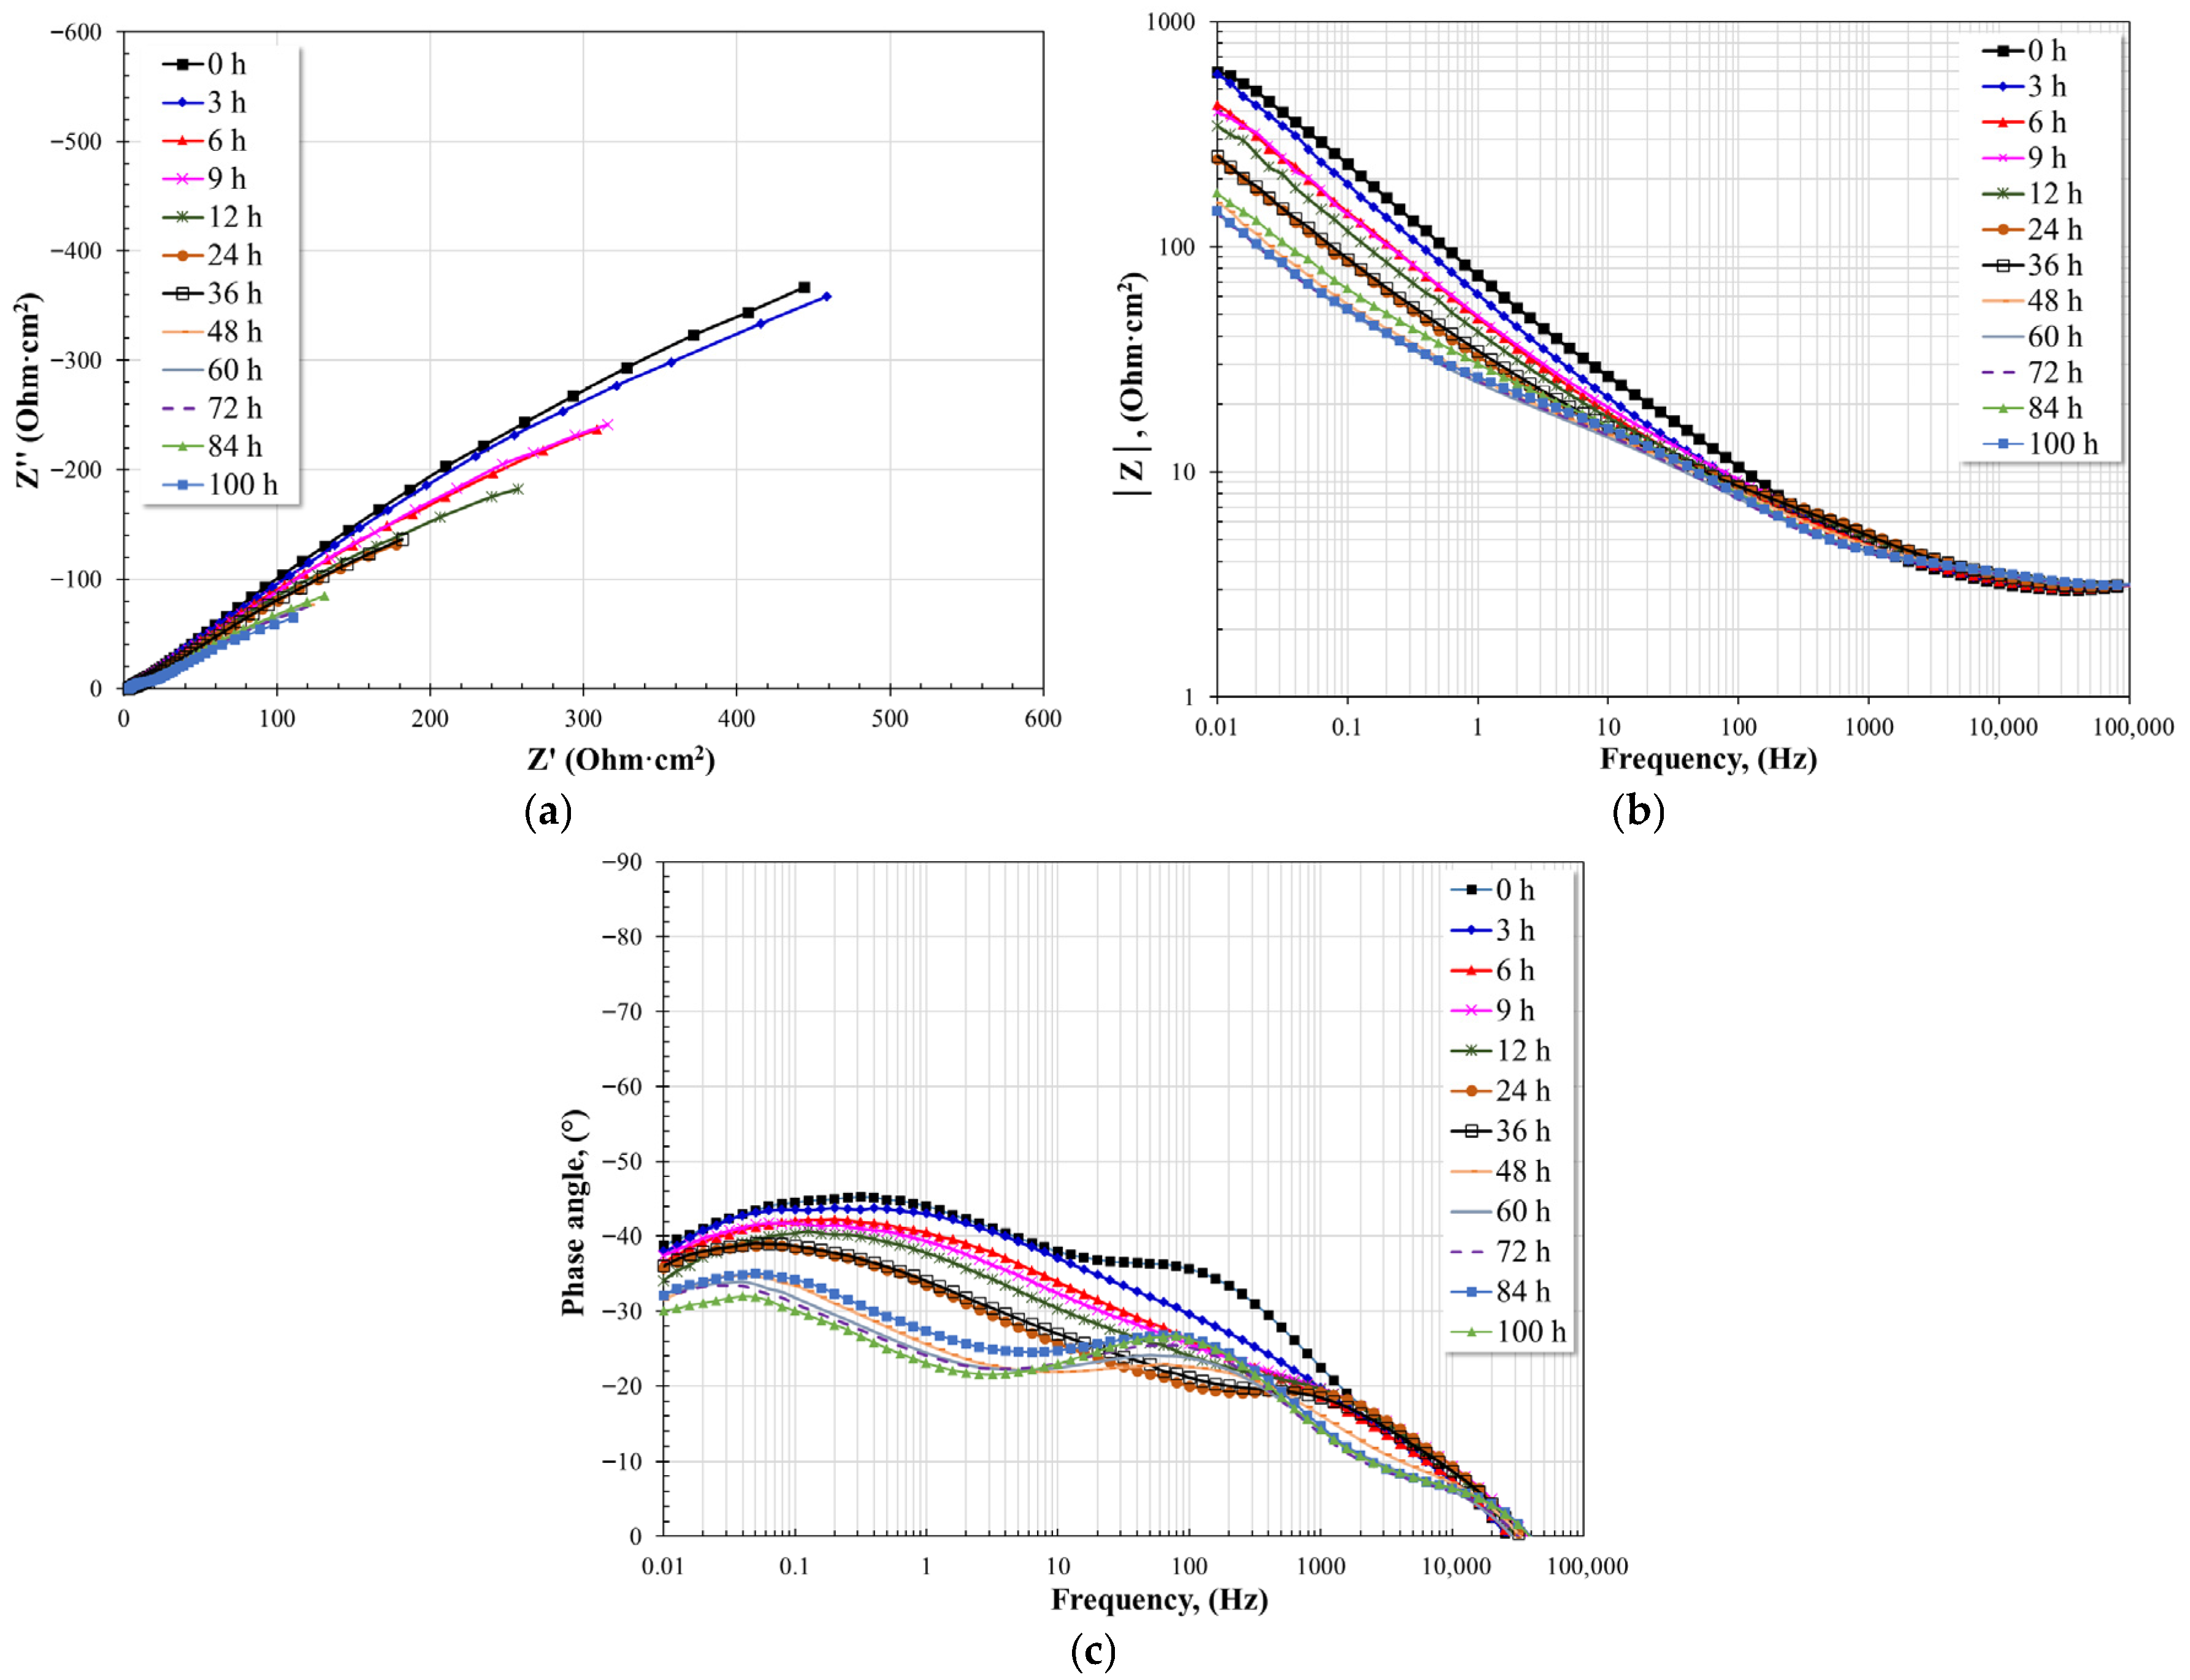
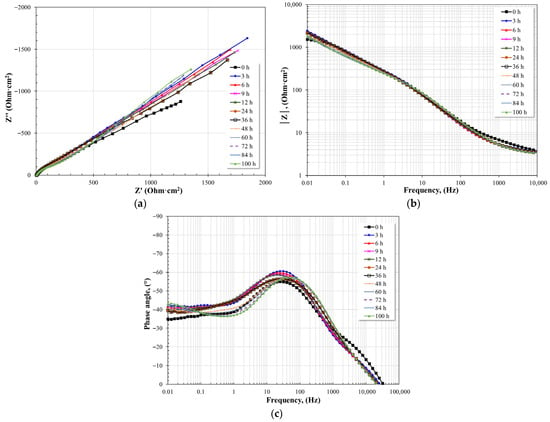
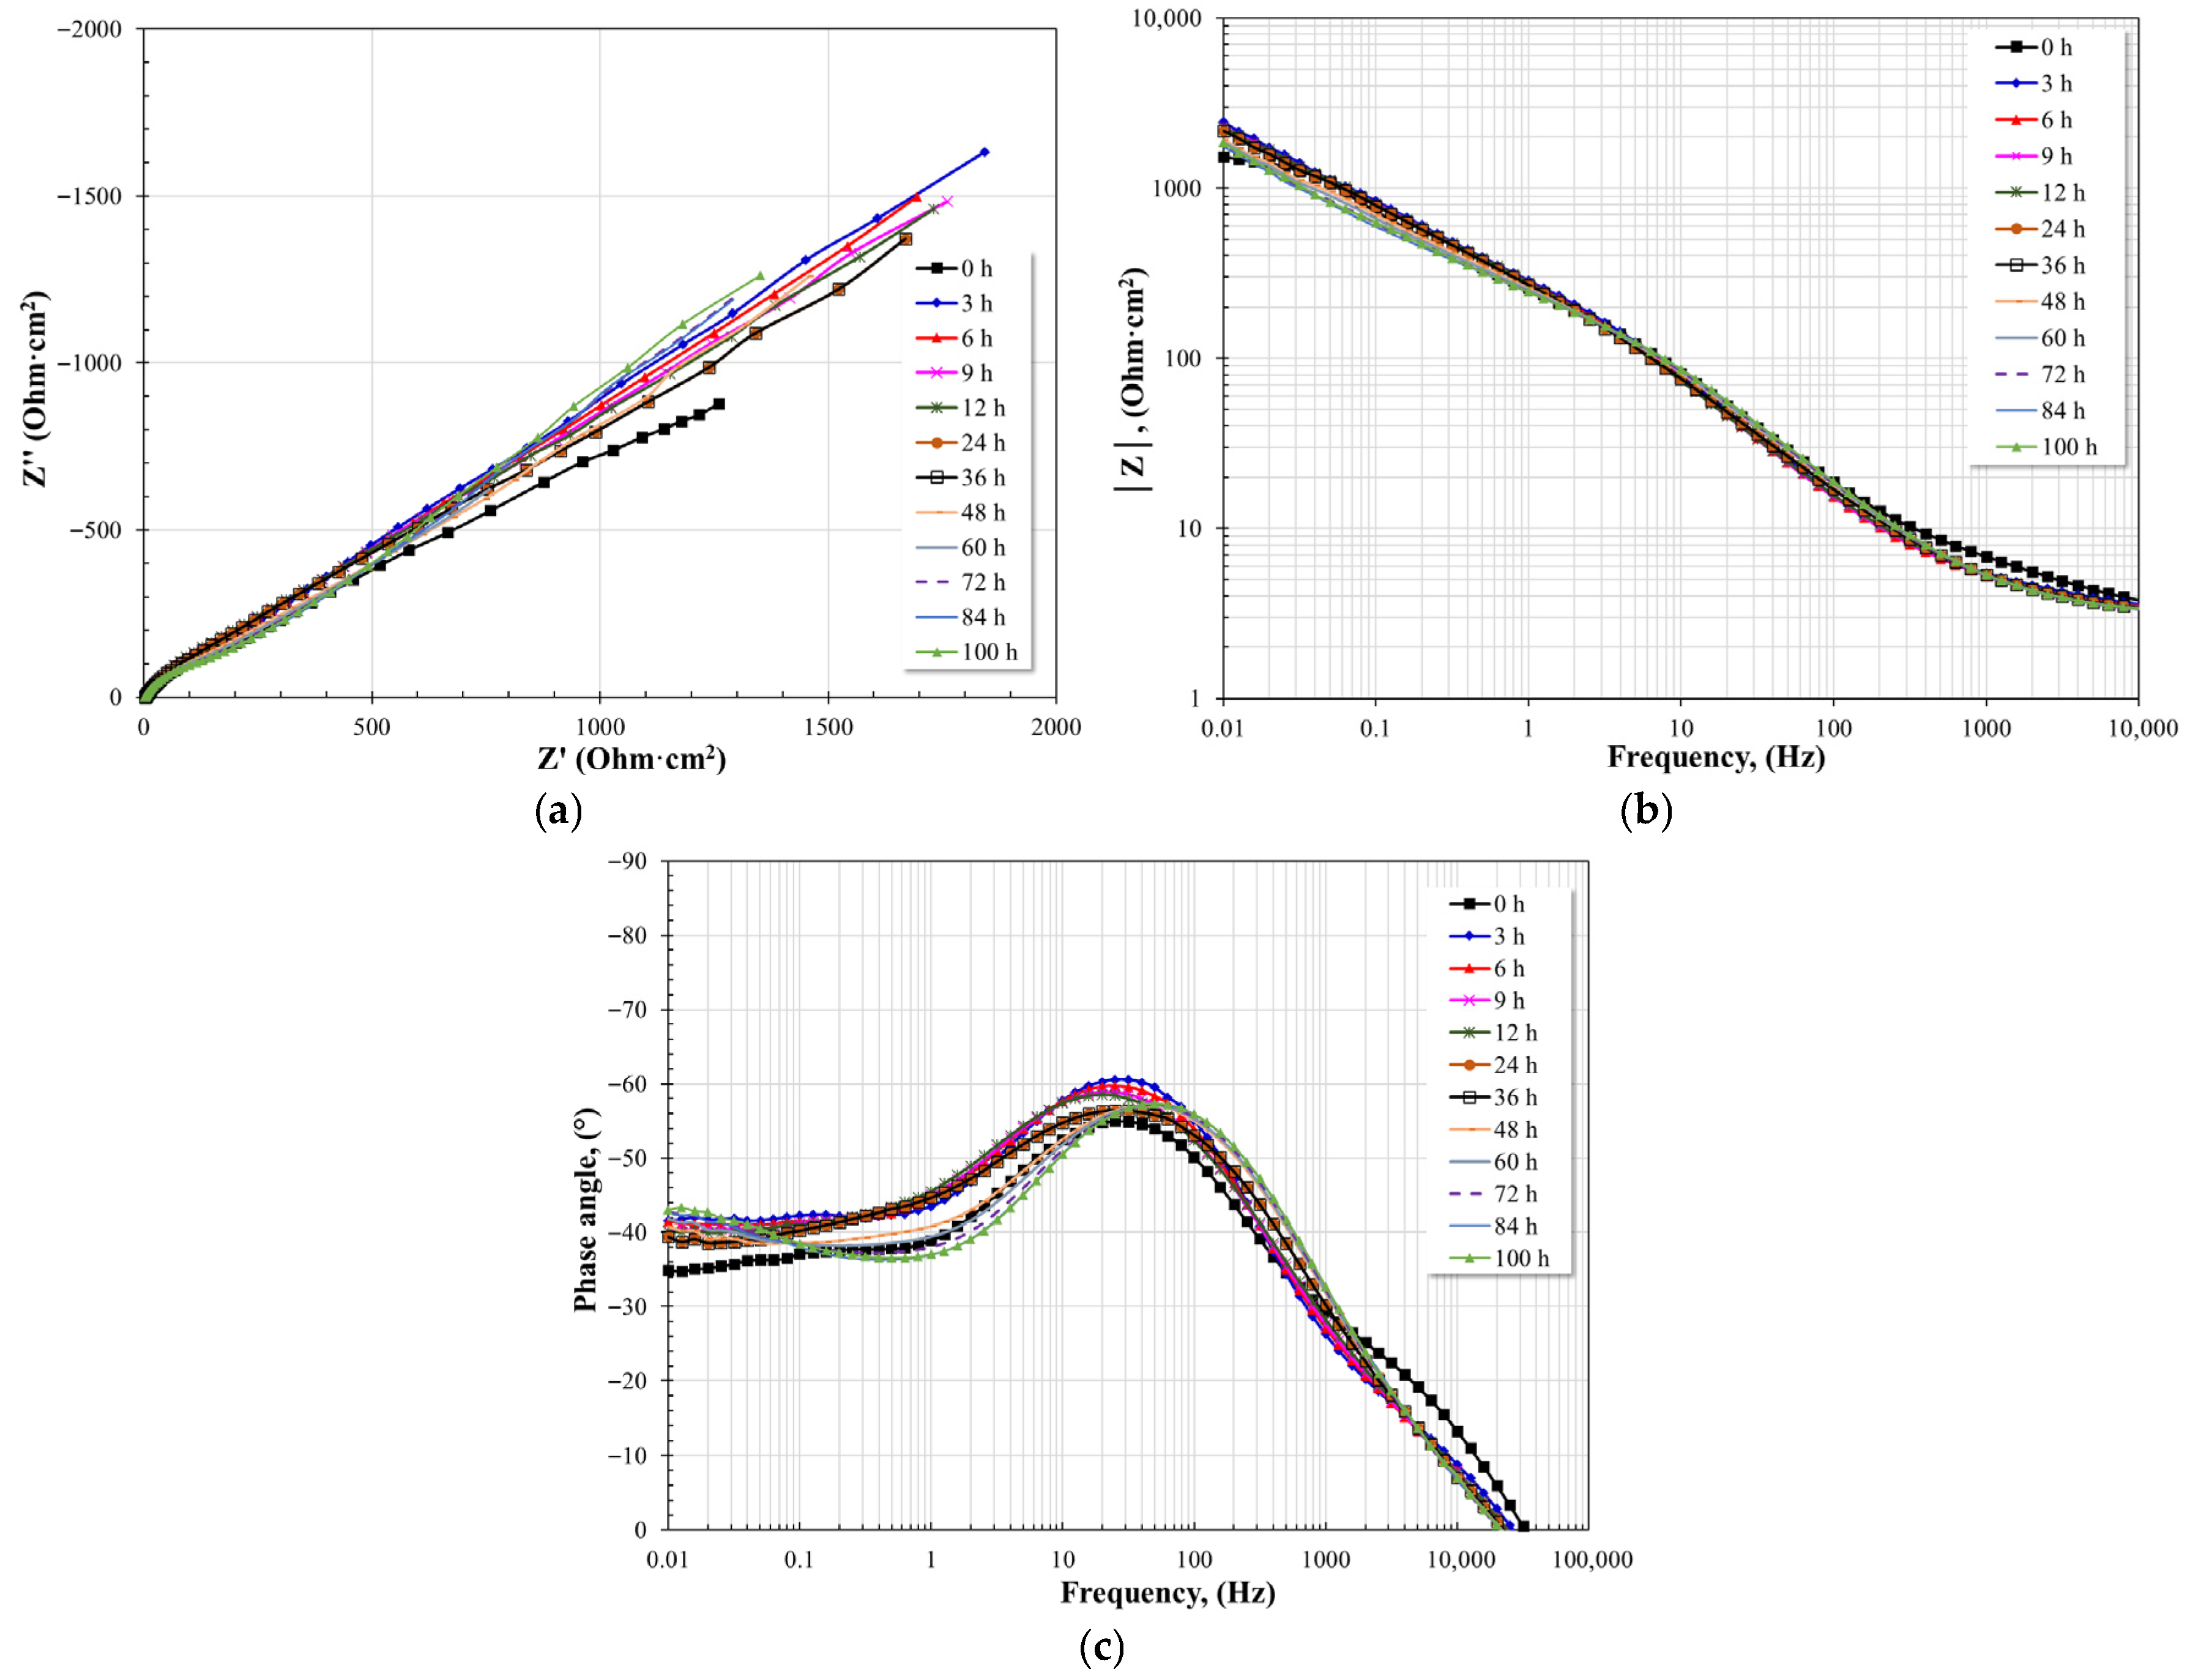
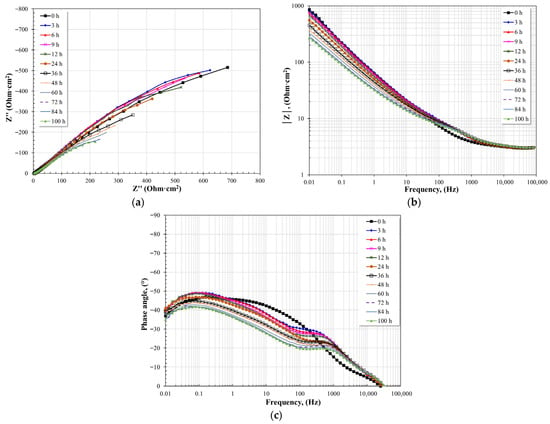
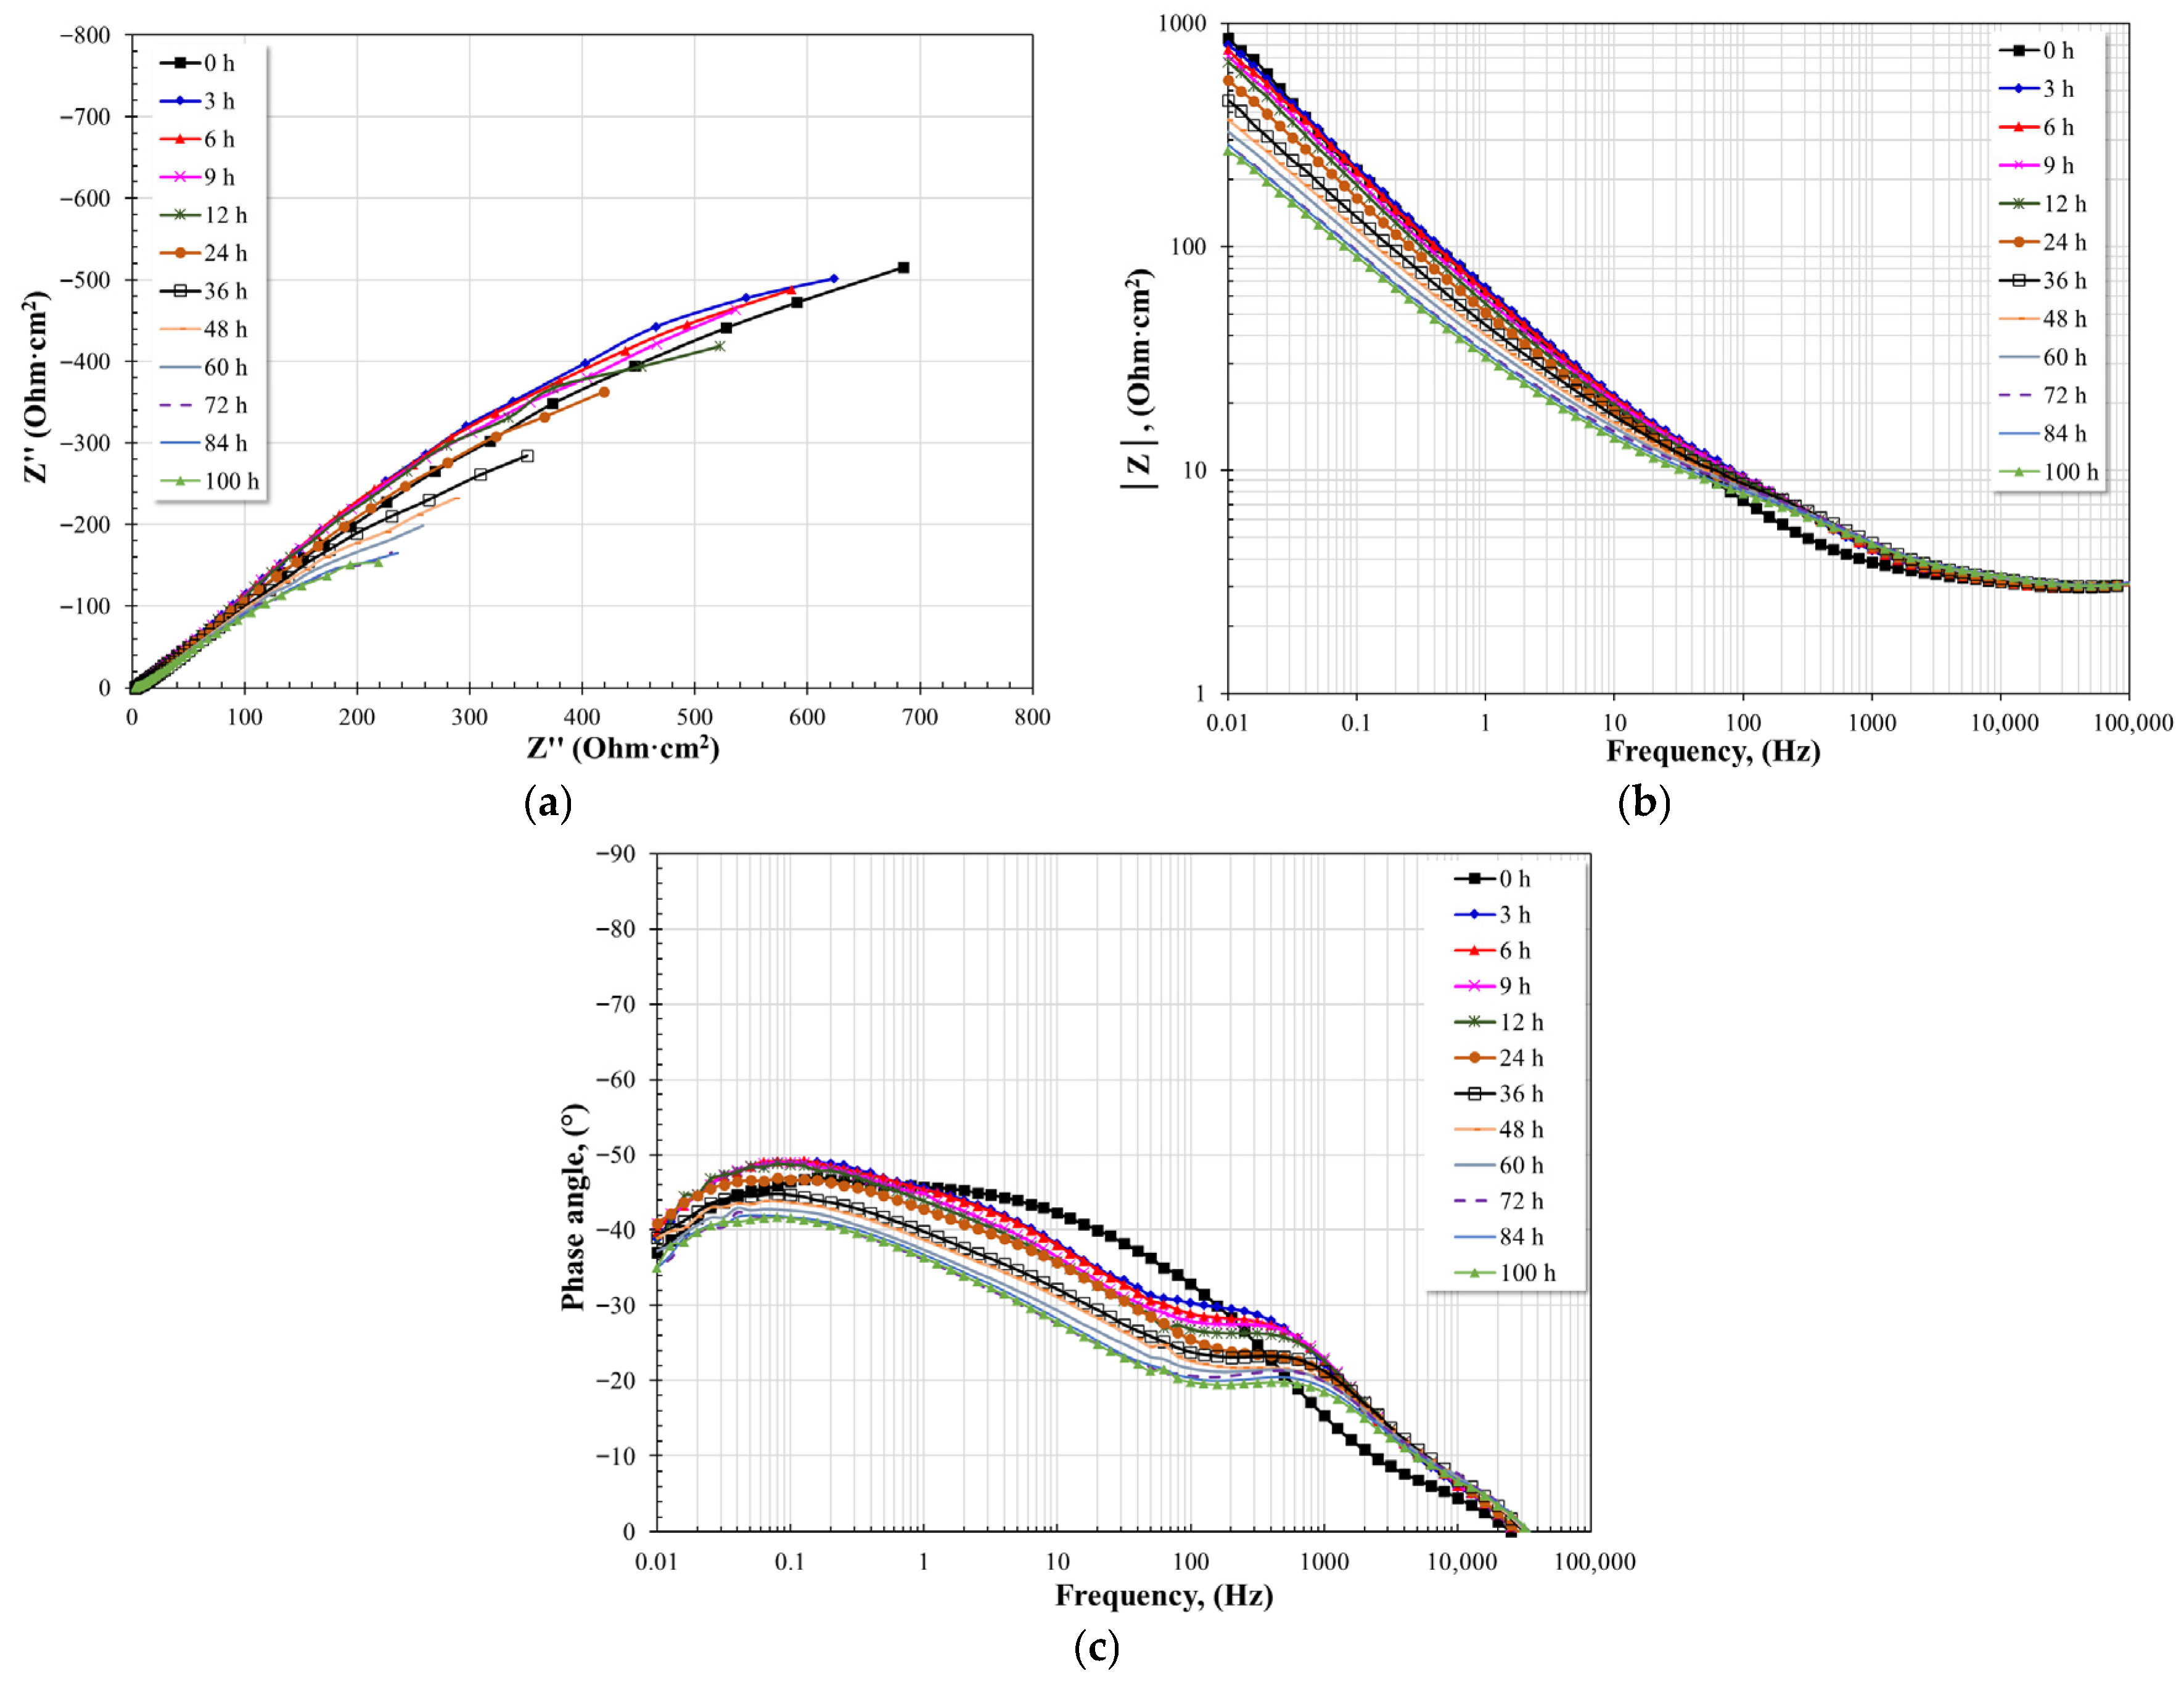
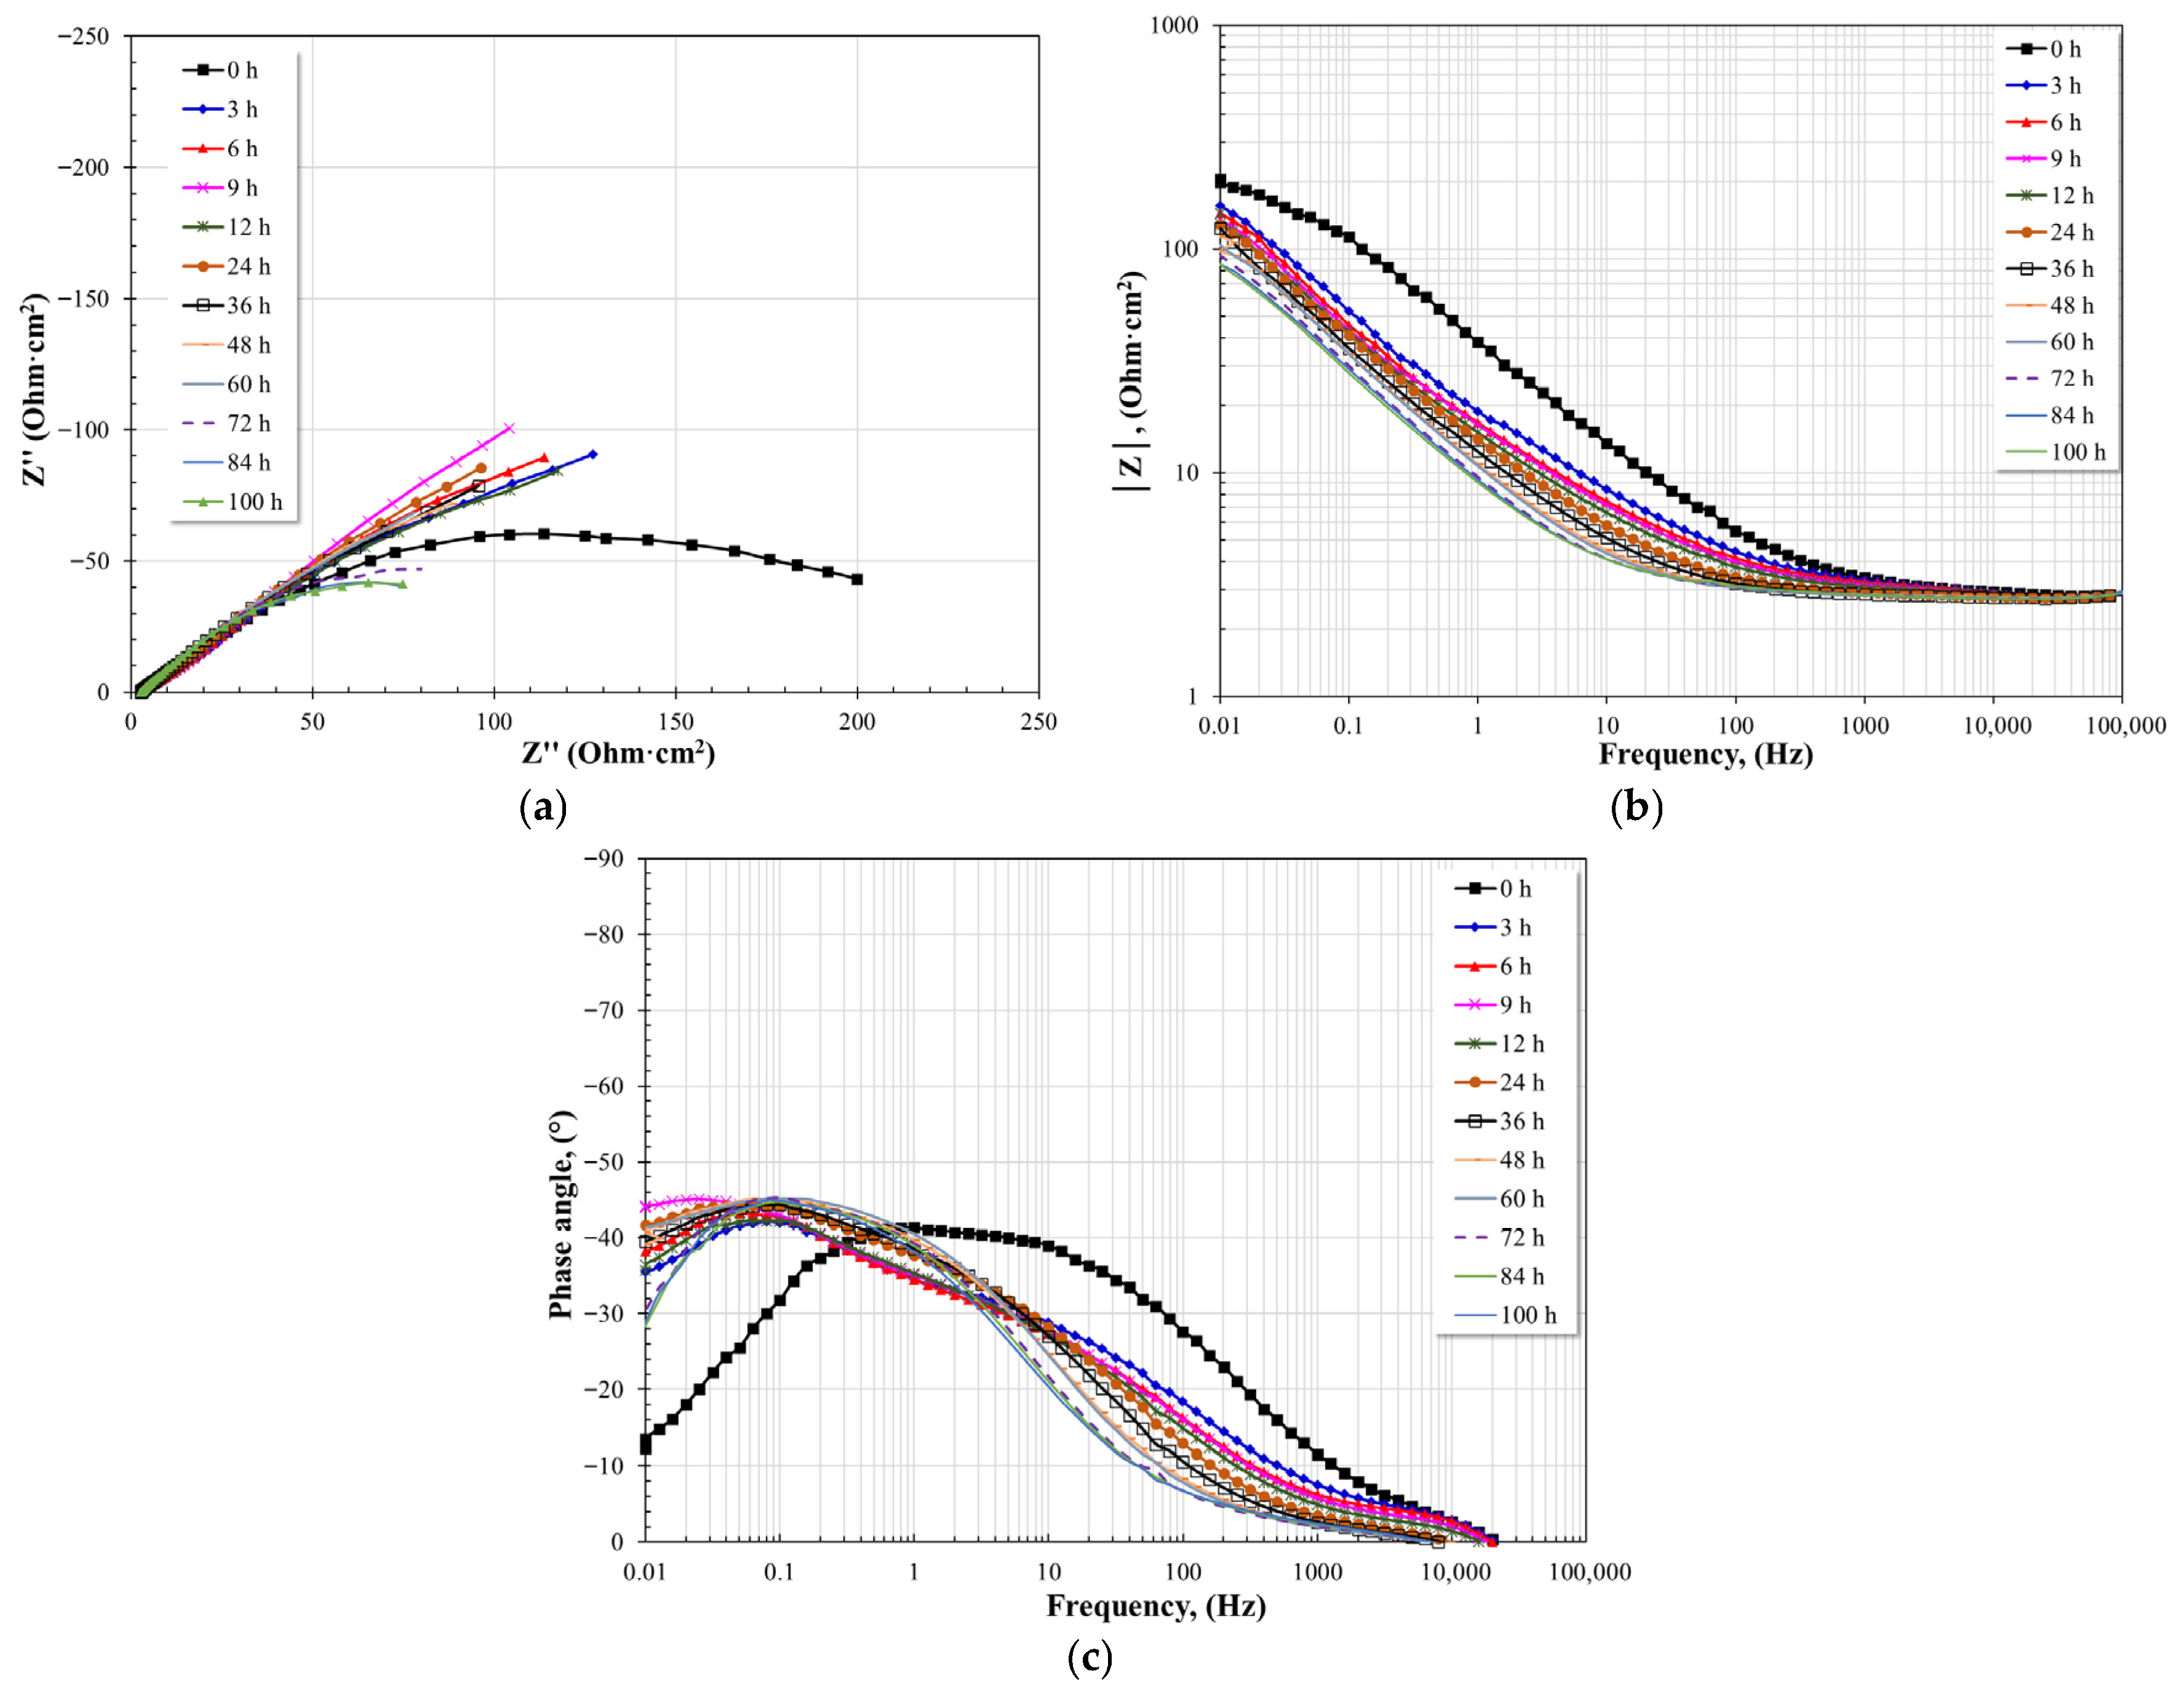
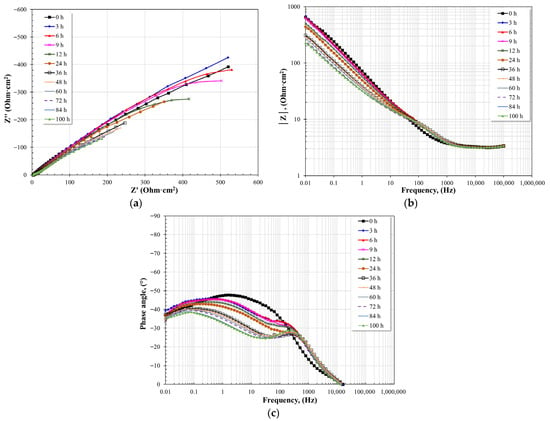
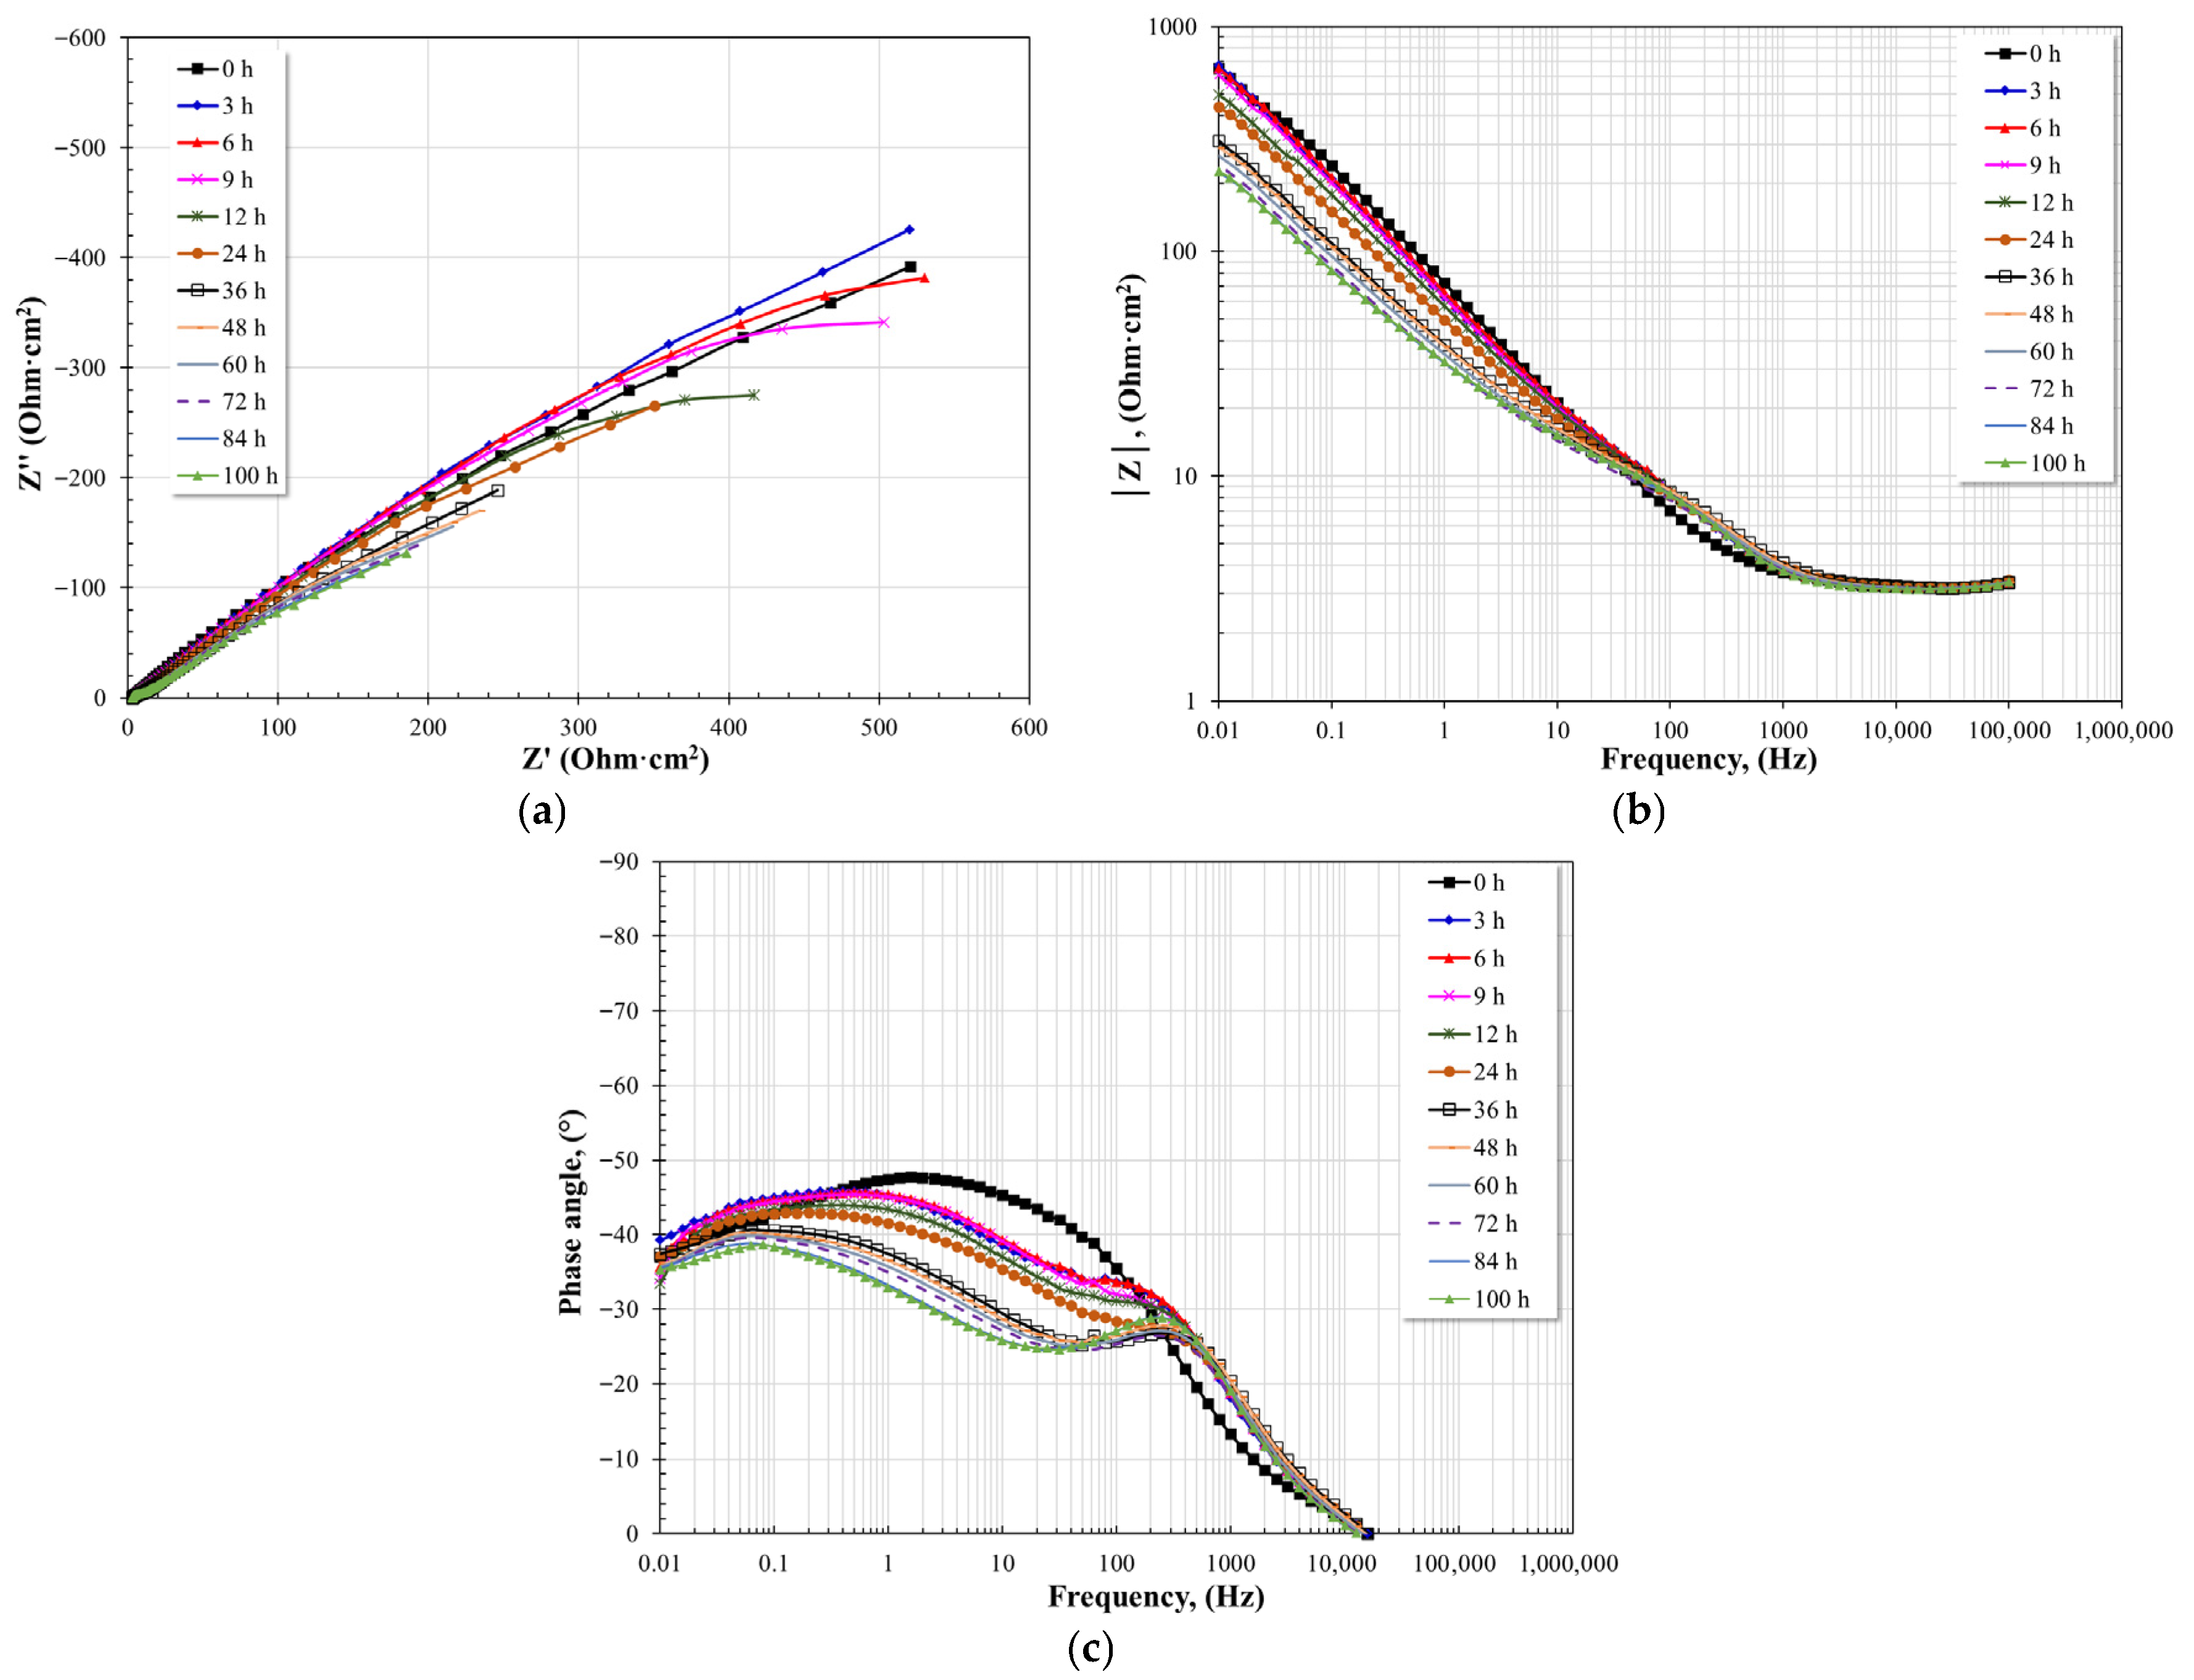
Figure 15, Figure 16 and Figure 17 show the evolution of the impedance spectra, as a function of immersion time, of A1 steel in nitrate salts at different test temperatures. In general, Nyquist plots show that the diameter of the capacitive semicircles decreases with increasing temperature. This general observation implies that the resistance to charge transfer decreases with temperature, and consequently, the corrosion rate increases. Similarly, Bode plots show that the magnitude of the impedance modulus (|Z|) follows the same behavior observed in the Nyquist plots; that is, an increase in temperature causes a decrease in the values of |Z| in the low-frequency region. The same is observed with the phase angle: an increase in temperature decreases the maximum phase angle, suggesting a reduction in the resistive-capacitive properties of the interfaces present.
Figure 15.
Evolution of the Nyquist and Bode diagrams for A1 steel immersed in nitrate salts at 400 °C for 100 h. (a) Nyquist plot, (b) Bode plot; impedance module, (c) Bode plot; phase angle.
Figure 16.
Evolution of the Nyquist and Bode diagrams for A1 steel immersed in nitrate salts at 500 °C for 100 h. (a) Nyquist plot, (b) Bode plot; impedance module, (c) Bode plot; phase angle.
Figure 17.
Evolution of the Nyquist and Bode diagrams for A1 steel immersed in nitrate salts at 600 °C for 100 h. (a) Nyquist plot, (b) Bode plot; impedance module, (c) Bode plot; phase angle.
Specifically at 400 °C, the capacitive semicircles, given their amplitude, suggest the existence of two-time constants. Initially, the diameter of the semicircles tended to increase with immersion time up to 12 h and subsequently decreased until the end of the test. This suggests the initial formation of a protective layer, and possibly due to defects and imperfections, nitrate salts penetrated, causing substrate dissolution in those areas. From the Bode plot in its impedance modulus format, the formation of a high-frequency plateau and two linear relationships (log f–log |Z|) are observed. One of these relationships is in the intermediate frequency region, which shows no significant variation over time, and the other is in the low-frequency region, whose evolution corresponds to the variation in the diameter of the capacitive semicircles. The formation of a low-frequency plateau is not detectable, suggesting that the impedance modulus values are higher than the last recorded value. The presence of the two linear relationships suggests the existence of two-time constants. The Bode plot in its phase angle format shows the existence of two-time constants. The first is between 100 and 1000 Hz, and the second between 1 and 10 Hz. The maximum phase angle of the first-time constant shows no significant variation and is consistent with the first linear relationship observed in the Bode plot in its impedance modulus format. The second time constant shows an increase in its maximum phase angle with a slight shift towards lower frequencies. Both behaviors suggest the formation of a thin and stable layer of corrosion products that provided protection to the steel. The impedance spectra obtained agree with those reported in the literature for similar steels [19]. The presence of two time constants is associated with the electrochemical processes occurring at the oxide layer and at the metal/oxide interface.
At 500 °C, the Nyquist diagrams also suggest the existence of two-time constants. At this temperature, the evolution of the capacitive semicircles shows a constant decrease in their diameter. This suggests a constant metal dissolution process because the corrosion products are unable to form an effective protective barrier that prevents the diffusion of molten nitrates to the metal surface. From the Bode plot in its impedance modulus format, it can be observed that the high-frequency plateau forms above 10,000 Hz, and at lower frequencies, two linear relationships (log f–log |Z|) are present. The formation of a low-frequency plateau is also not detectable. Furthermore, the impedance modulus values tend to decrease steadily with immersion time. These characteristics suggest the presence of a layer of porous corrosion products or surface defects that allows free access of molten salts to the metal surface. The two linear relationships suggest the existence of two-time constants. The Bode plot in its phase angle format also shows the existence of two-time constants. The first is located between 10 and 1000 Hz, and the second at frequencies below 1 Hz. In general, the maximum phase angle observed is much lower than that observed at 400 °C. This large decrease indicates a significant reduction in the resistive-capacitive properties of the detected interfaces, namely, the protective layer-electrolyte and the alloy-protective layer. Additionally, as the immersion time increases, the maximum phase angle for both time constants tends to decrease steadily, suggesting a continuous degradation in the resistive-capacitive properties of the detected interfaces.
At 600 °C, the Nyquist diagrams show that the capacitive semicircles exhibit a steady decrease in diameter until 12 h into the test, followed by a slight increase in diameter for the remainder of the test. This trend suggests an initial active dissolution process, after which corrosion products limit the diffusion of nitrate salts to the metal surface. This is consistent with the cross-sectional analysis, which revealed the formation of a thick layer of corrosion products. The Bode plot in impedance modulus format shows the formation of two linear relationships (log f–log |Z|), and the impedance modulus values in the low-frequency region exhibit the same trend as that described for the diameter of the capacitive semicircles: a steady decrease up to 12 h of immersion, followed by an increase, but with lower |Z| values than those obtained in the initial measurement. This indicates an initial active corrosion process, and the subsequent precipitation of corrosion products limited free access of the electrolyte. The Bode plot in phase angle format shows the presence of two-time constants, whose maxima are lower than those observed at 500 °C. This indicates that the temperature increases further decreased the resistive-capacitive properties of the detected interfaces.
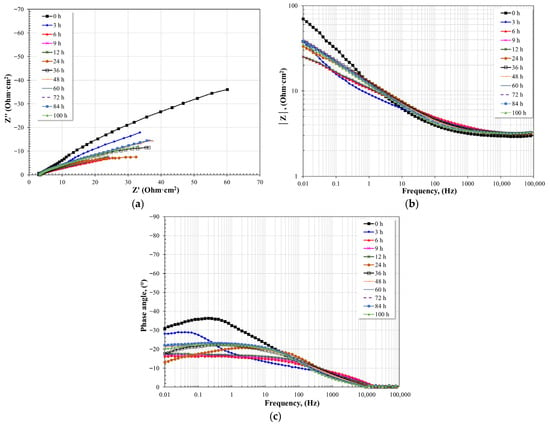
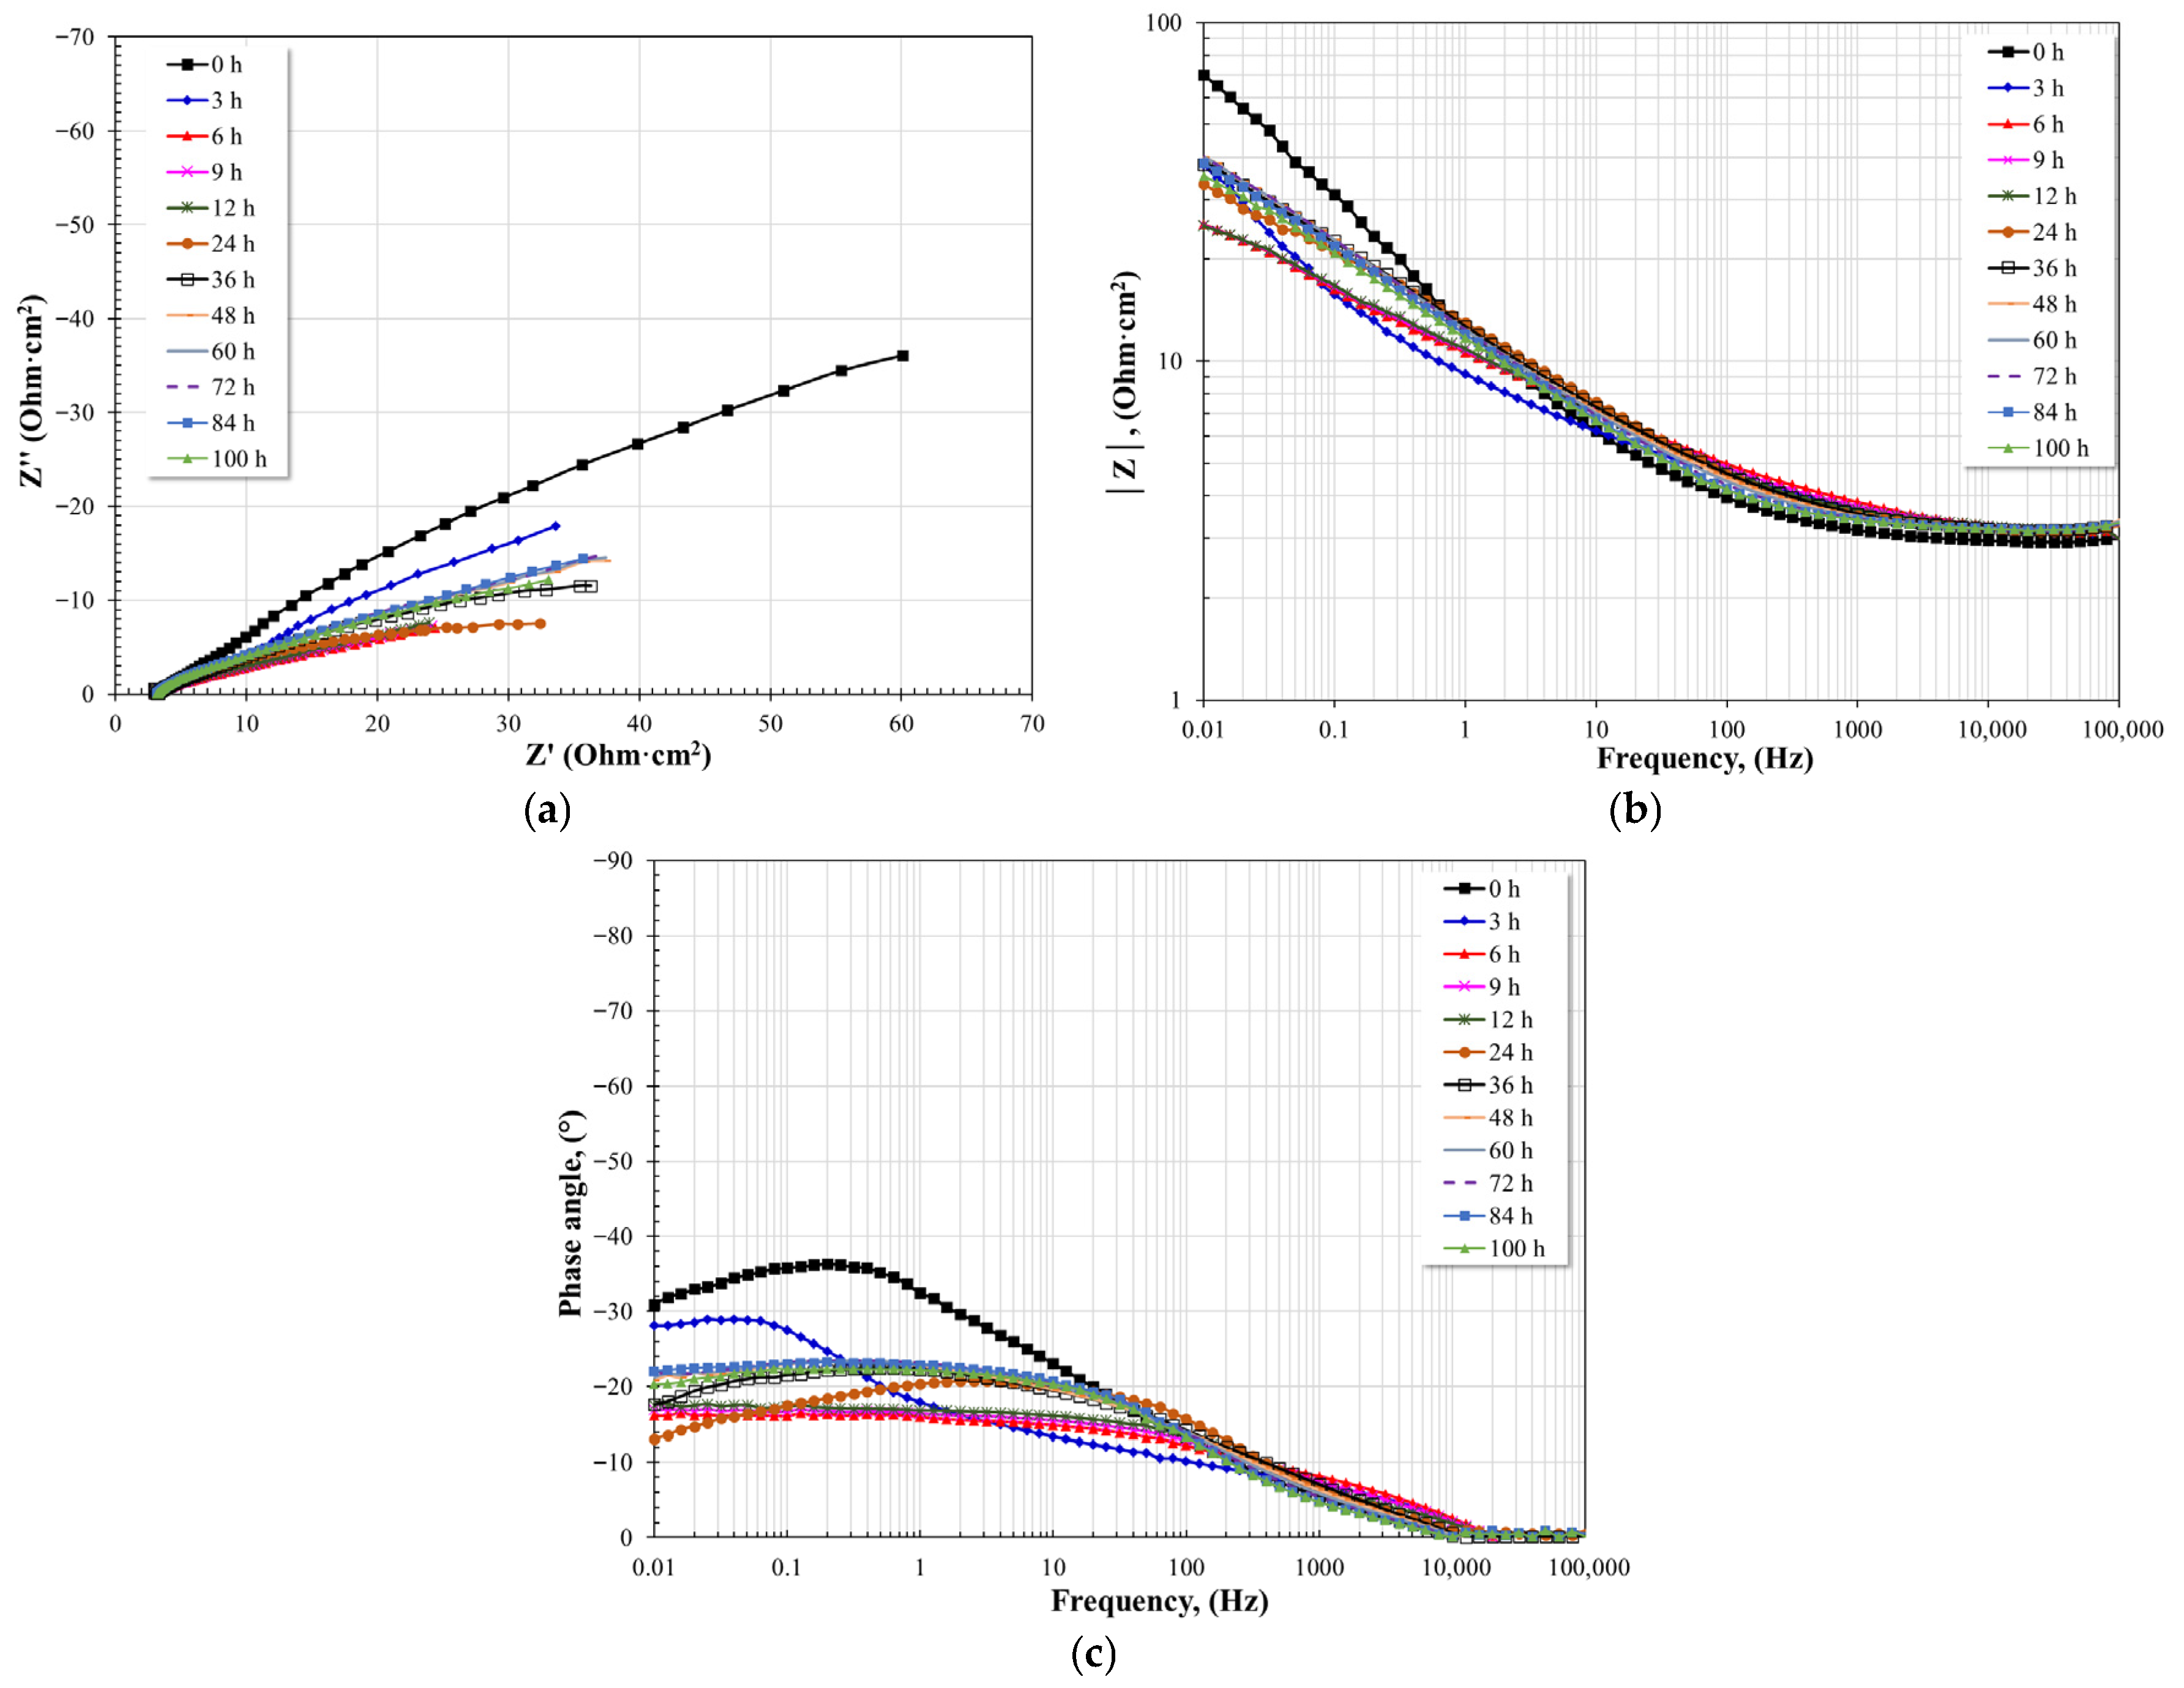
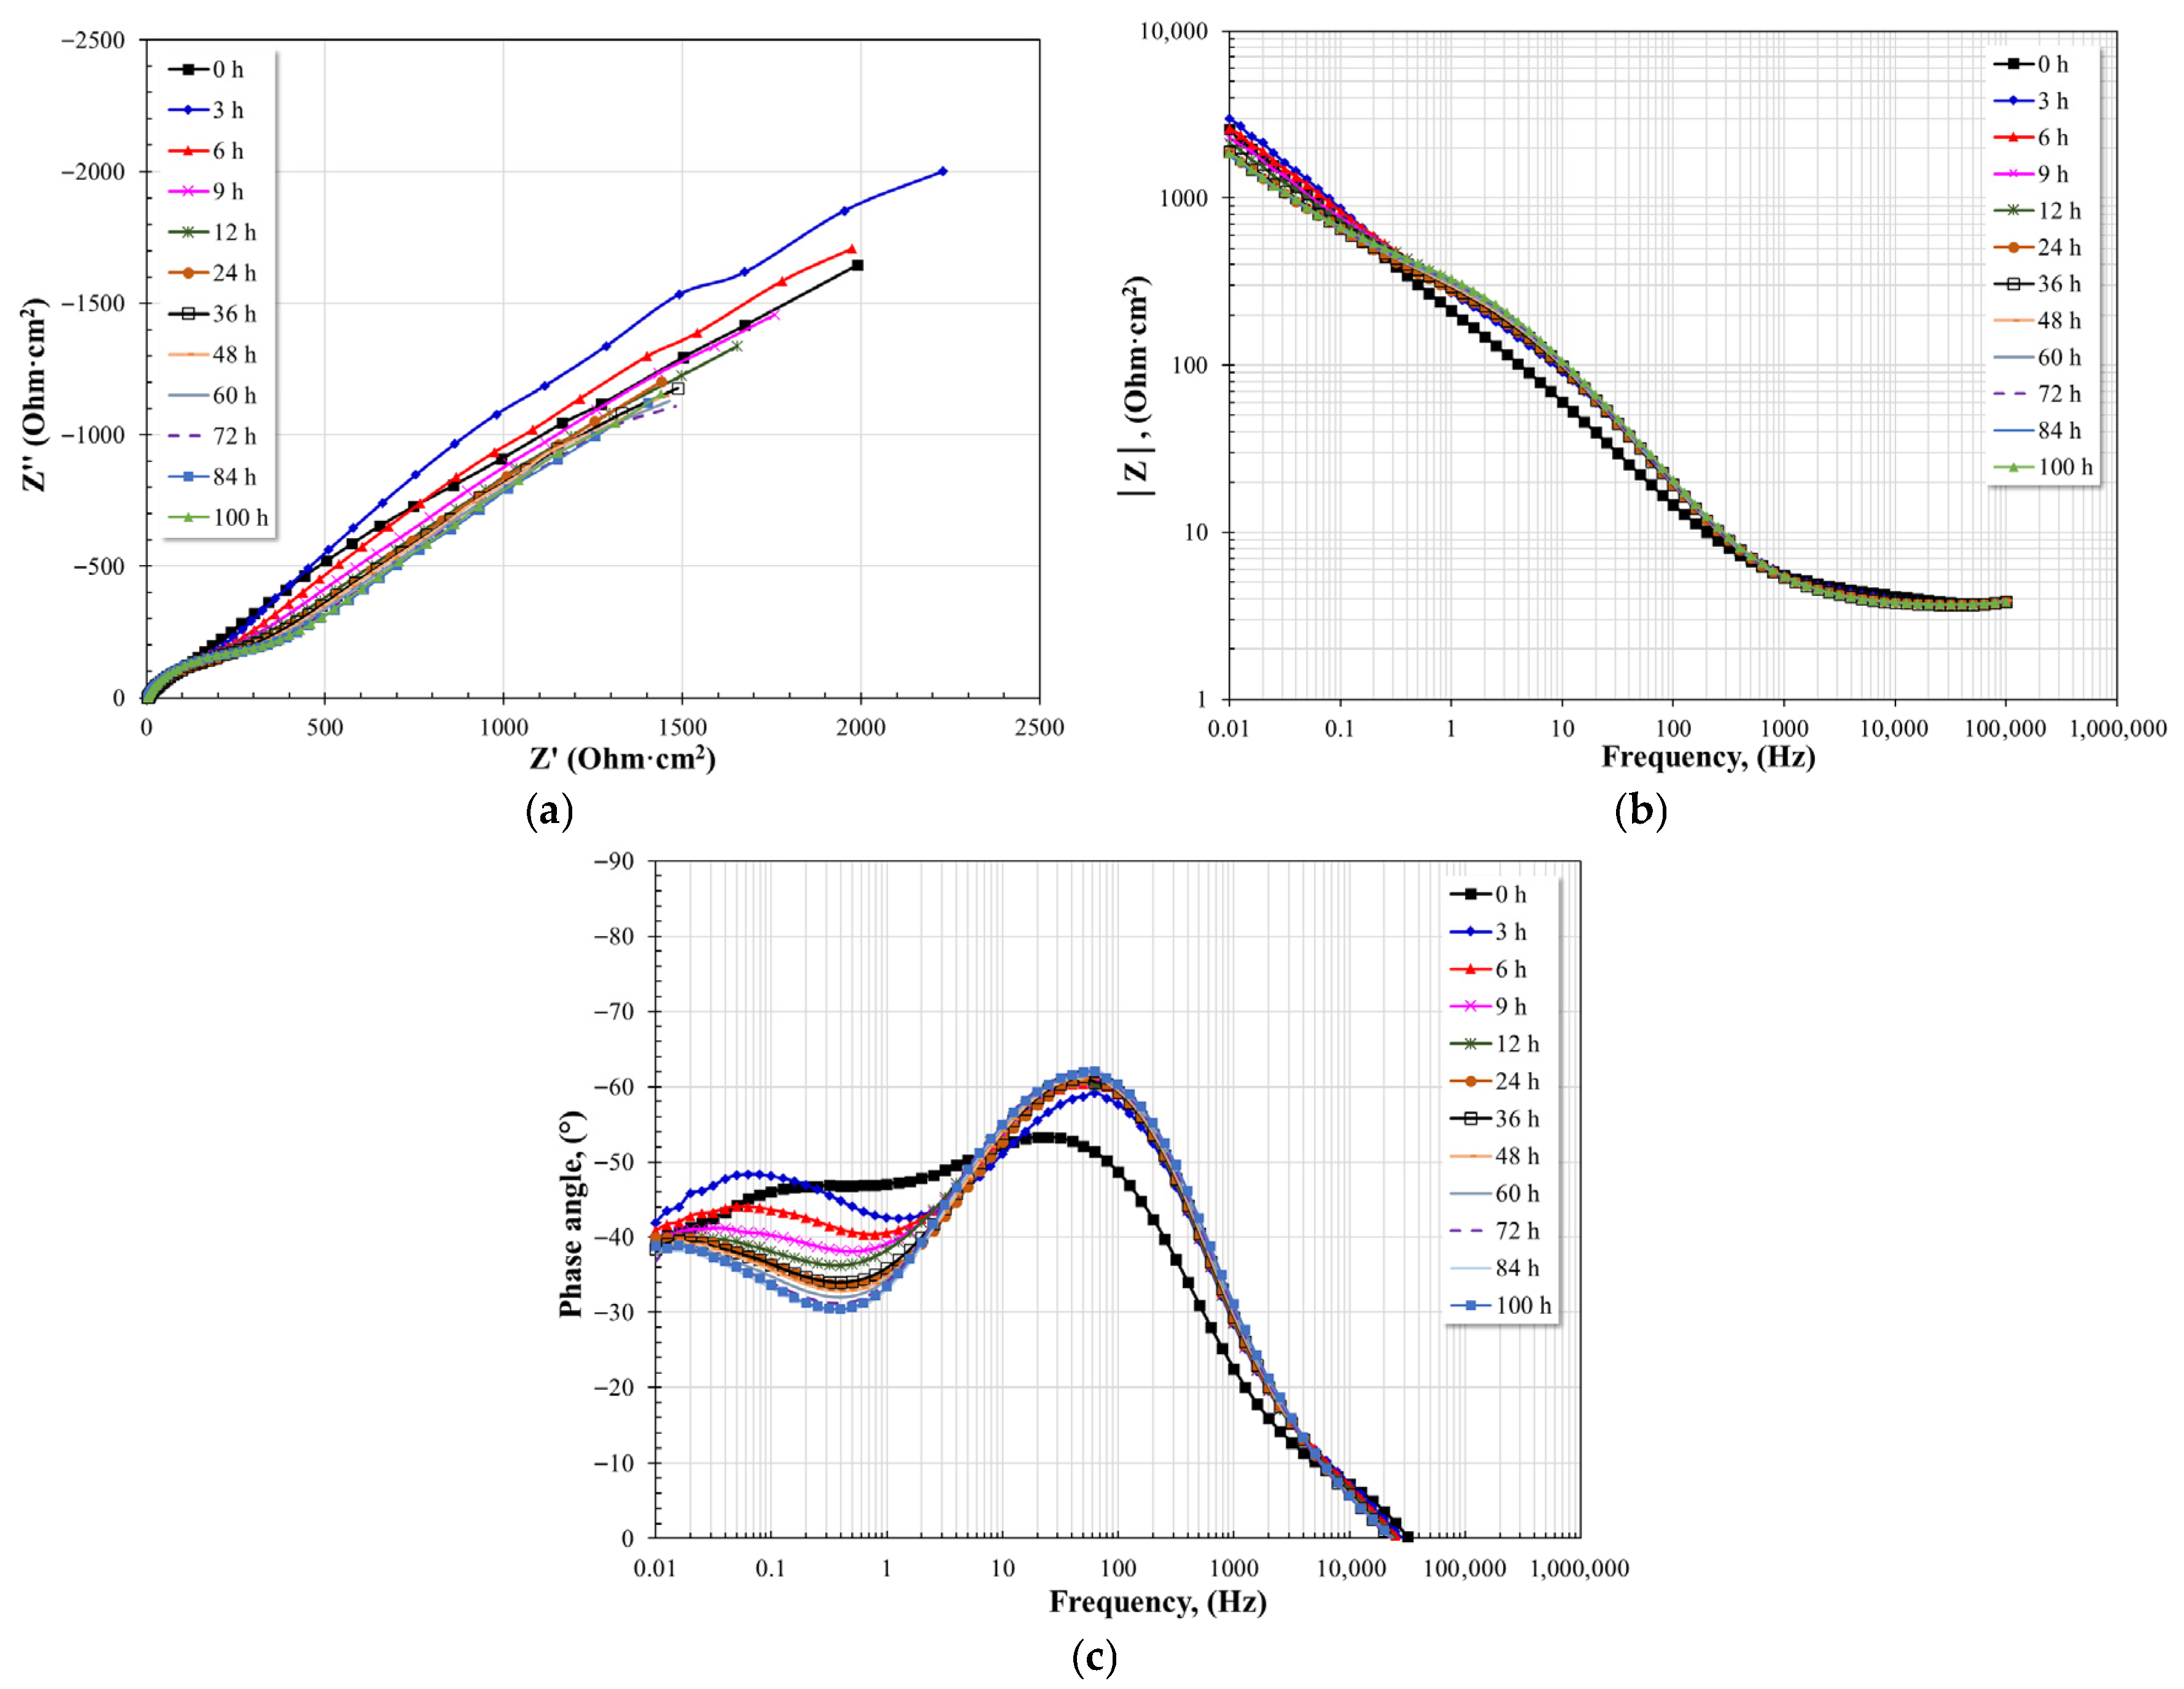
Figure 18, Figure 19 and Figure 20 show the evolution of the impedance spectra, as a function of immersion time, of T22 steel in nitrate salts at different test temperatures. Similarly to the EIS spectra observed for A1 steel, similar characteristics were generally observed in this case. The Nyquist plots show that the diameter of the capacitive semicircles decreases with increasing temperature, implying a decrease in the resistance to charge transfer and, consequently, an increase in the corrosion rate. The Bode plots show that the magnitude of the impedance modulus (|Z|) exhibits the same behavior as the diameter of the capacitive semicircles; that is, an increase in temperature causes a decrease in the values of |Z| in the low-frequency region. An increase in temperature also causes a decrease in the maximum phase angle, indicating a reduction in the resistive-capacitive properties of the interfaces present.
Figure 18.
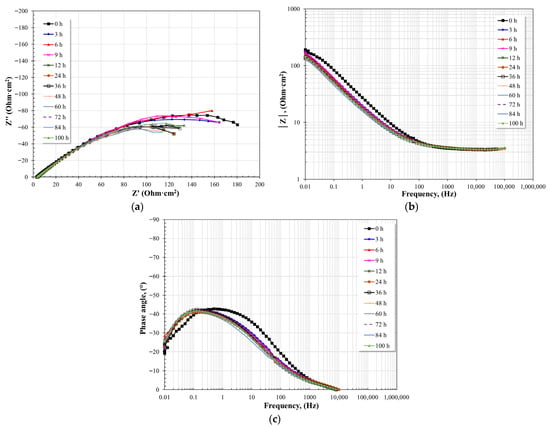
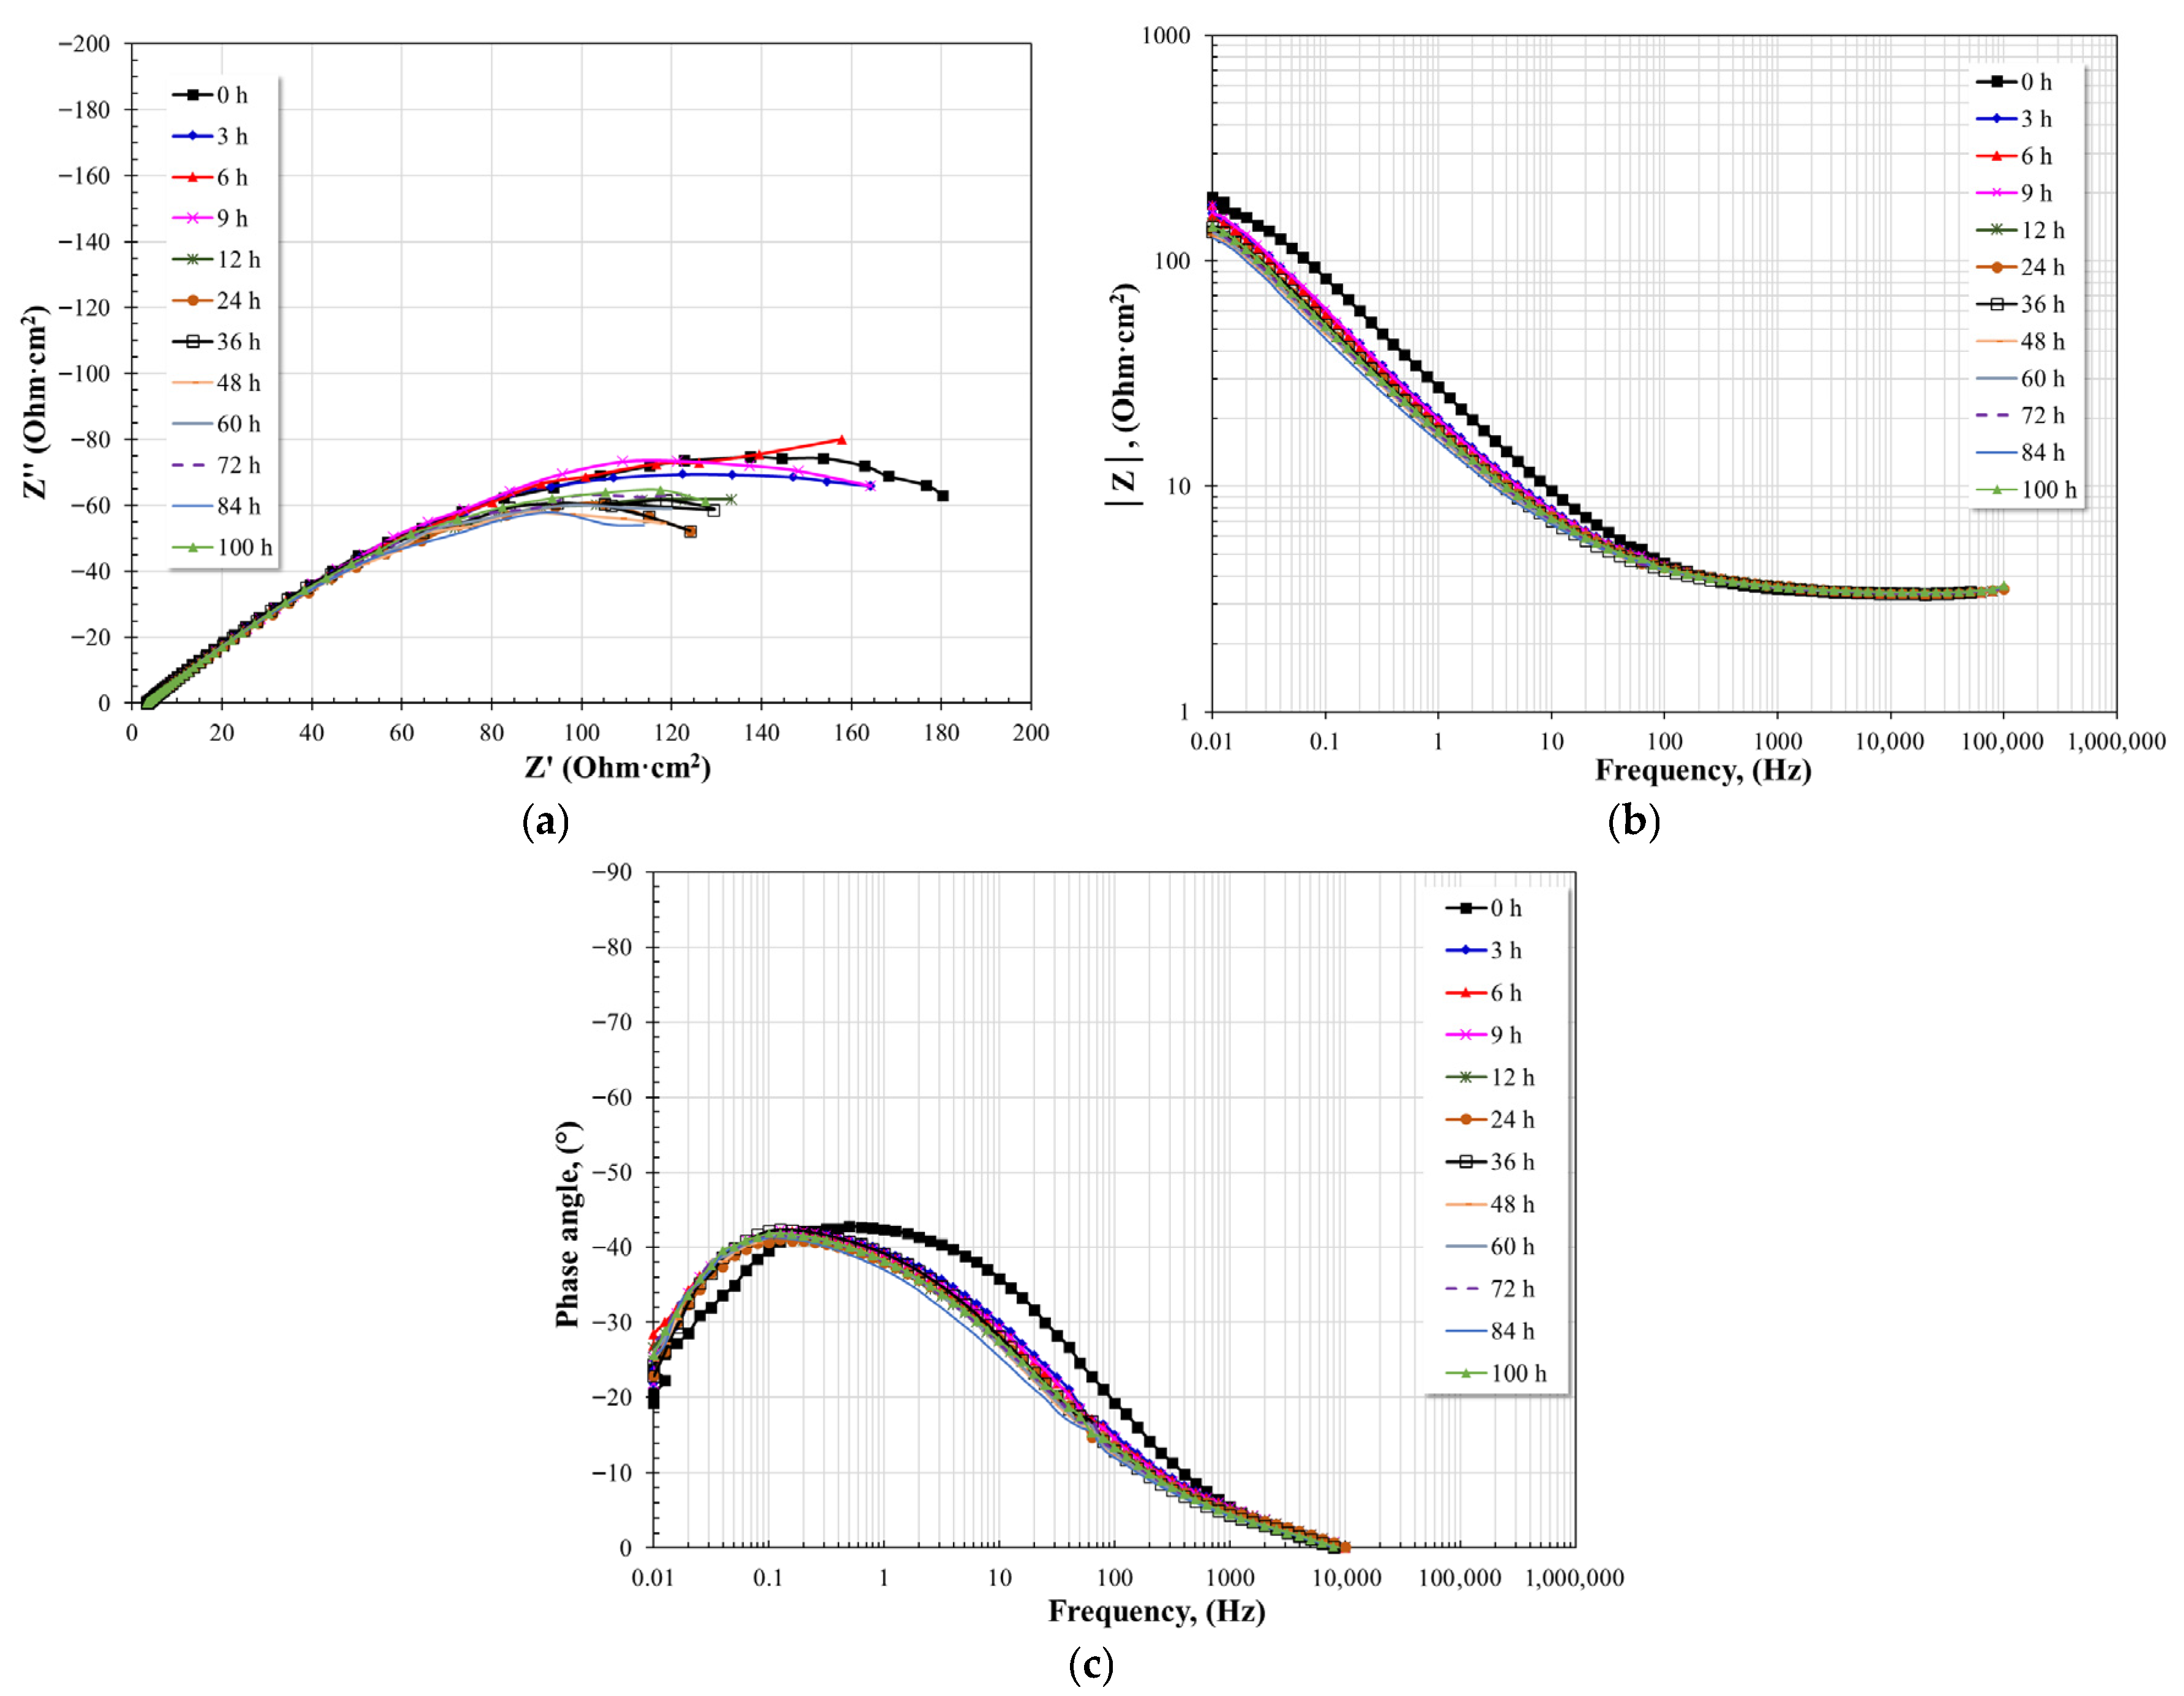
Evolution of the Nyquist and Bode diagrams for T22 steel immersed in nitrate salts at 400 °C for 100 h. (a) Nyquist plot, (b) Bode plot; impedance module, (c) Bode plot; phase angle.
Figure 19.
Evolution of the Nyquist and Bode diagrams for T22 steel immersed in nitrate salts at 500 °C for 100 h. (a) Nyquist plot, (b) Bode plot; impedance module, (c) Bode plot; phase angle.
Figure 20.
Evolution of the Nyquist and Bode diagrams for T22 steel immersed in nitrate salts at 600 °C for 100 h. (a) Nyquist plot, (b) Bode plot; impedance module, (c) Bode plot; phase angle.
At 400 °C, the diameter of the second semicircle increased during the first hours of exposure, indicating a temporary increase in polarization resistance. This behavior may be associated with the formation of a more stable protective layer due to the chromium content of the alloy. The Bode plot in its impedance modulus format shows the formation of two linear relationships (log f–log |Z|), and no plateau is visible at either high or low frequencies. Similarly to the Nyquist plot, no significant variation or evolution of the values is observed. The presence of the two linear relationships suggests the existence of two-time constants, and the minimal variation in the spectra also suggests the formation of a more stable protective layer. The Bode plot in its phase angle format also shows little variation in the spectra. A time constant is observed between 10 and 100 Hz, which does not change appreciably in either magnitude or position. The second time constant is observed at frequencies below 1 Hz with a phase angle that fluctuates between 40 and 45°. This suggests mass transfer limitations or diffusion effects [20,52,53]. The existence of these mass transfer limitations explains the little variation in the evolution of the spectra and suggests the formation of a more stable and denser protective layer that prevented the free diffusion of the molten salts to the alloy surface.
At 500 °C, the Nyquist diagrams show very similar characteristics to those observed at 400 °C. Two capacitive semicircles form, with the first showing no significant variations and the second remaining unchanged until 12 h of immersion. After longer immersion times, a decrease in their diameter is observed until the end of the test. This indicates the presence of a stable layer on the alloy surface, but that increasing the immersion time allowed for electrolyte diffusion due to the formation of imperfections in its structure. This can be corroborated from the Bode plot in its impedance modulus format. Two linear relationships are observed (log f–log |Z|), the formation of a high-frequency plateau above 10,000 Hz, and in the low-frequency region, the impedance modulus shows little variation until 12 h of immersion and subsequently a constant decrease until the end of the test. This behavior is consistent with the observed evolution of capacitive semicircles. The Bode plot in its phase angle format shows the presence of two-time constants. The first, between 100 and 1000 Hz, has a maximum phase angle that tends to decrease with immersion time. The second, around 0.1 Hz, exhibits the same behavior. The maximum phase angle for the first time constant is lower than that for the second. The first-time constant may be associated with the resistive-capacitive characteristics of the protective layer, and the second with the resistive-capacitive characteristics of the metallic surface. The evolution of the spectra indicates a degradation of the protective properties of the layer formed on the alloy surface, which allowed the electrolyte to diffuse.
At 600 °C, the Nyquist diagrams show the apparent formation of two capacitive semicircles. The first semicircle shows no significant variations, while the second appears to increase in diameter to 48 h of immersion, subsequently decreasing until the end of the test. This suggests the initial formation of a stable layer on the alloy surface. However, as the immersion time increased, imperfections in the alloy’s structure allowed electrolyte diffusion, leading to an increase in the corrosion rate of the alloy’s surface. The Bode plot in impedance modulus format shows the presence of two linear relationships (log f–log |Z|) and the formation of a high-frequency plateau above 1000 Hz. In the low-frequency region, the impedance modulus shows a constant decrease in its value over time. This trend suggests that the apparent initial increase in the diameter of the capacitive semicircles is due to mass transfer limitations, but that these limitations did not affect the surface degradation of the alloy. This can be corroborated by analyzing the Bode plot in its phase angle format. This shows the presence of two-time constants, where the first shows a shift from the intermediate frequency region to the low frequency region, and the second is located at frequencies below 0.1 Hz with a phase angle value of around 45°, which suggests diffusive effects in the corrosion product layer.
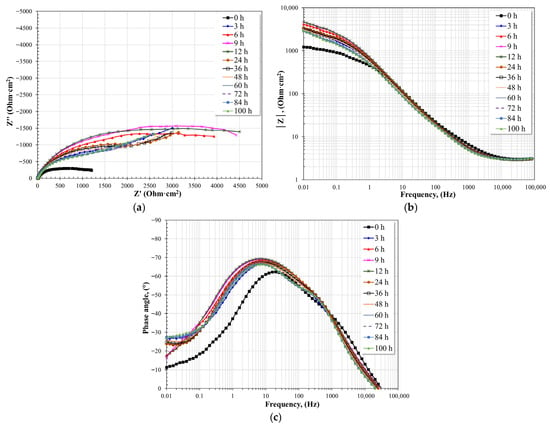
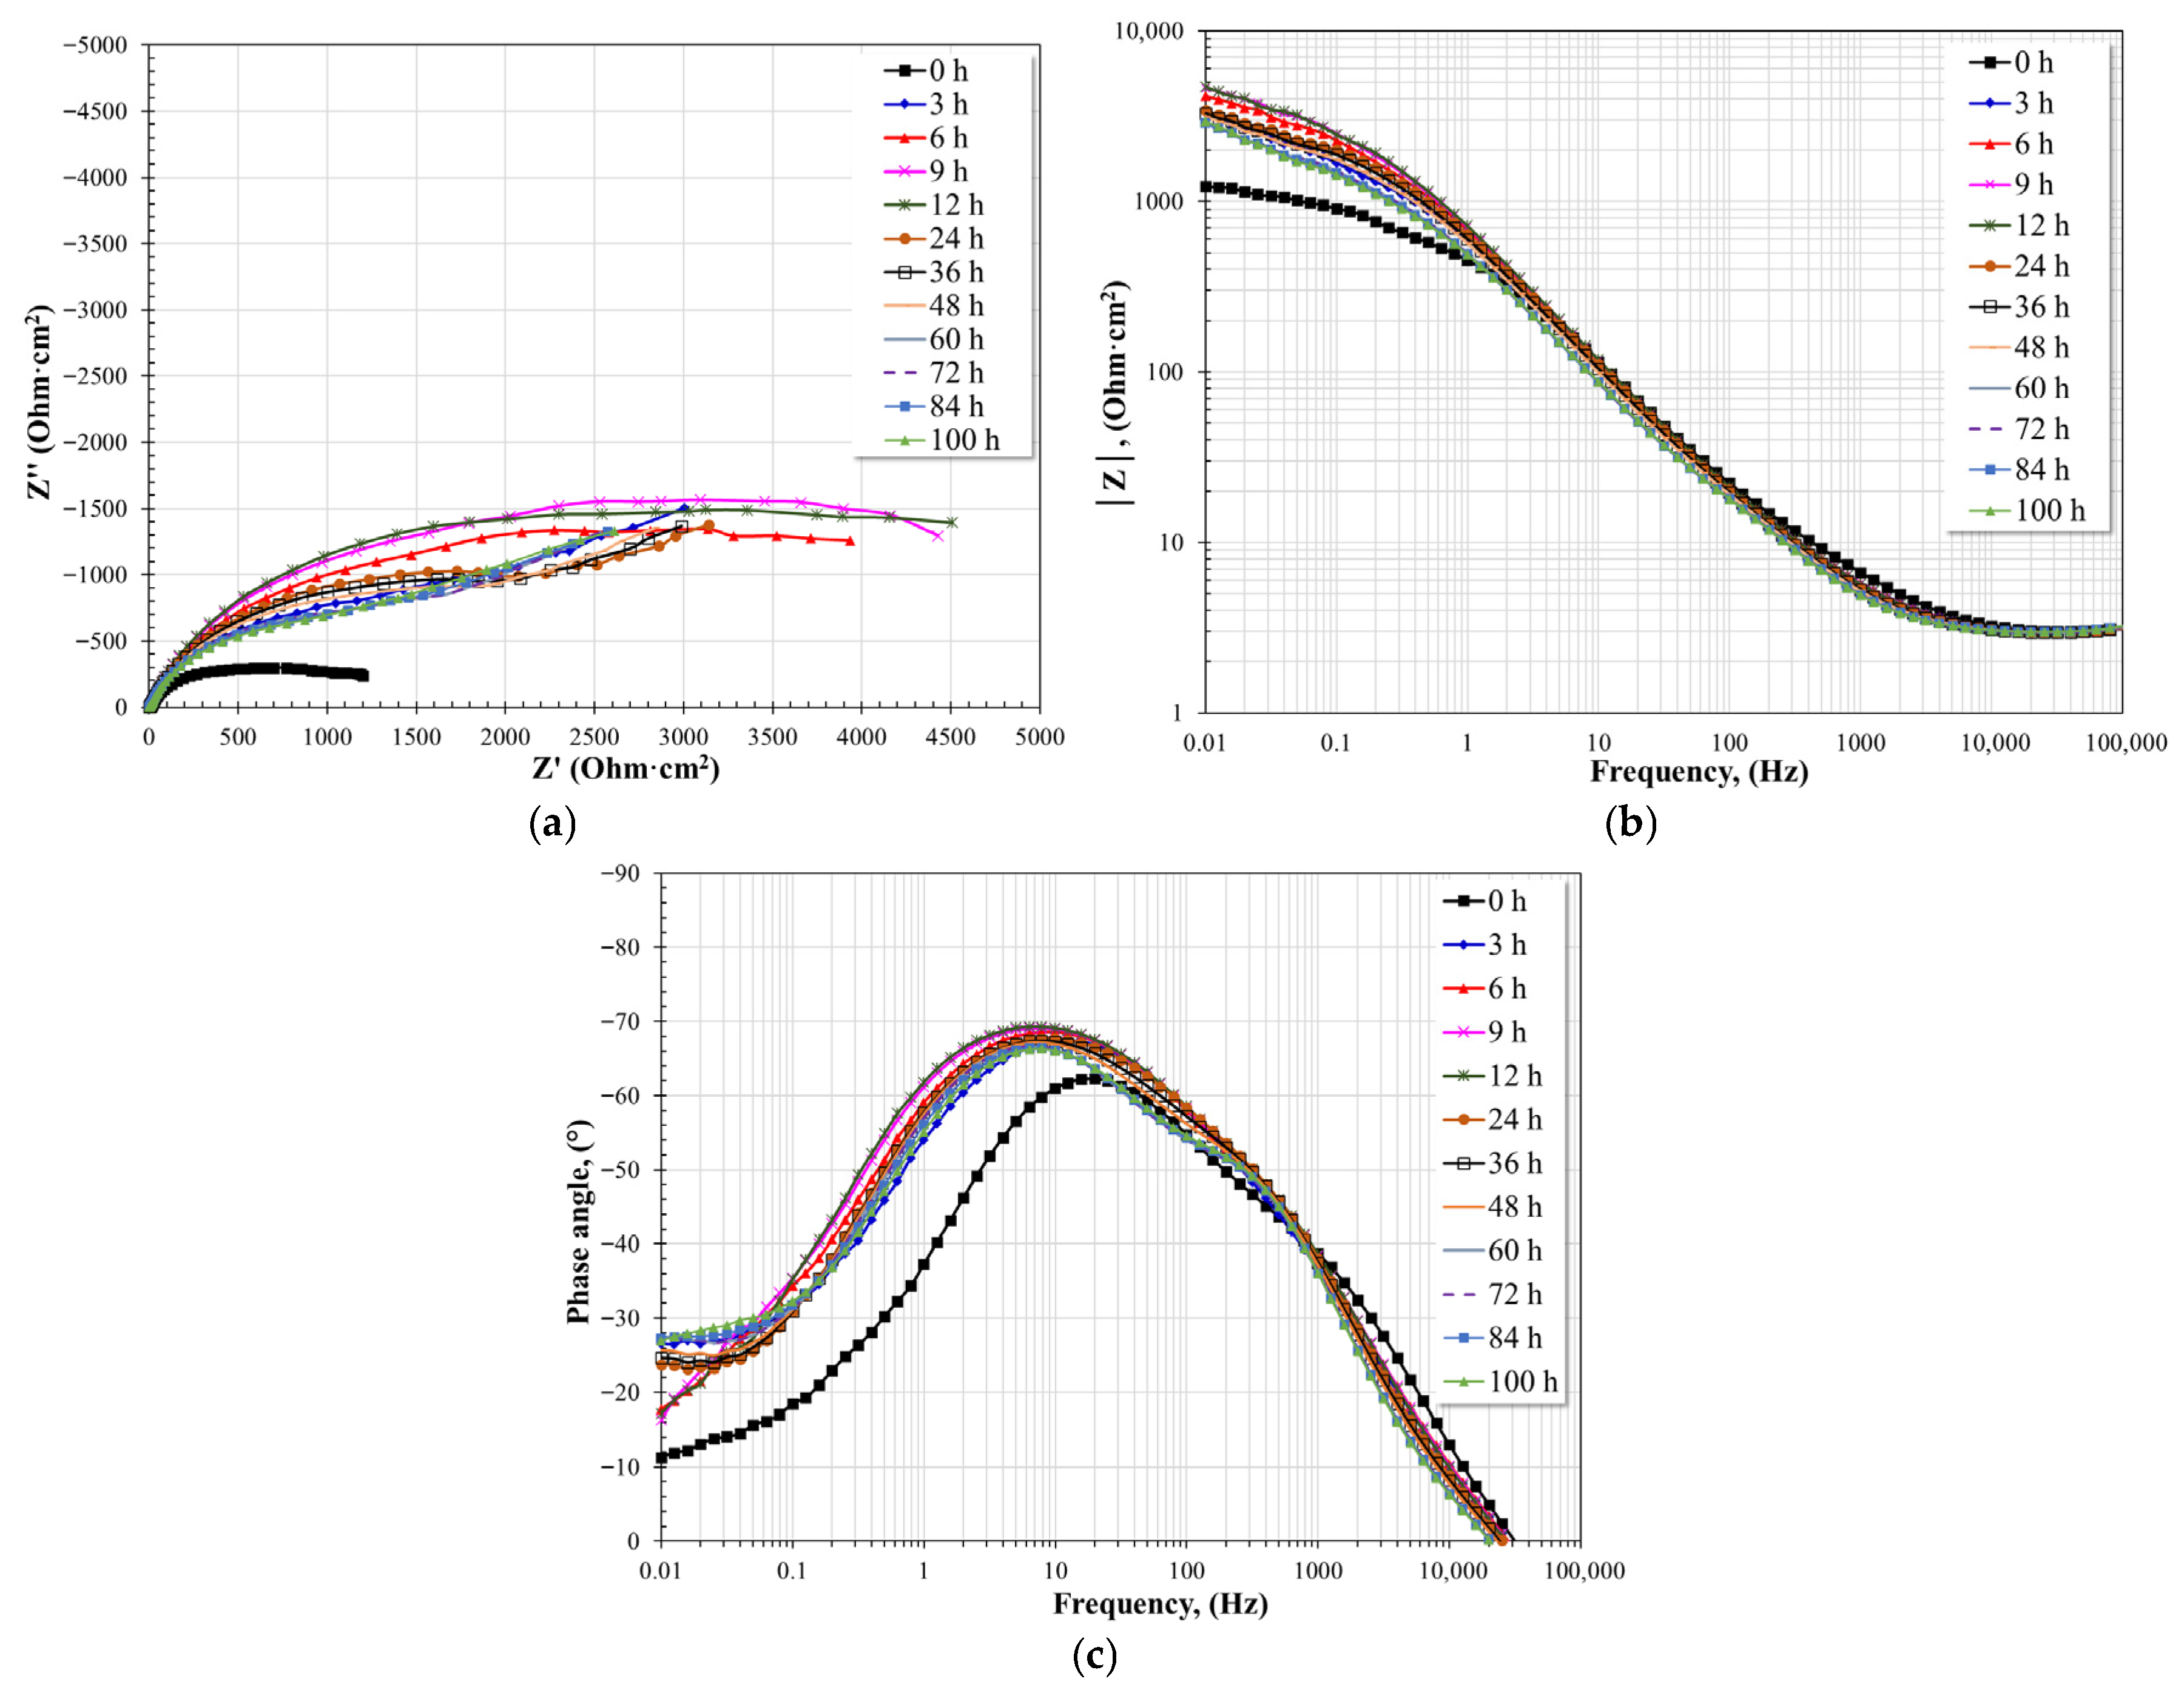
Figure 21, Figure 22 and Figure 23 show the evolution of the impedance spectra, as a function of immersion time, of T91 steel in nitrate salts at different test temperatures. The general characteristics of the EIS spectra show the same observations made for A1 and T22 steels. That is, a decrease in the magnitude of the diameter of the capacitive semicircles as a function of temperature. Similarly, a decrease in the magnitude of the impedance modulus (|Z|) and a decrease in the maximum phase angle. All of this indicates a reduction in the resistive-capacitive properties of the interfaces present.
Figure 21.
Evolution of the Nyquist and Bode diagrams for T91 steel immersed in nitrate salts at 400 °C for 100 h. (a) Nyquist plot, (b) Bode plot; impedance module, (c) Bode plot; phase angle.
Figure 22.
Evolution of the Nyquist and Bode diagrams for T91 steel immersed in nitrate salts at 500 °C for 100 h. (a) Nyquist plot, (b) Bode plot; impedance module, (c) Bode plot; phase angle.
Figure 23.
Evolution of the Nyquist and Bode diagrams for T91 steel immersed in nitrate salts at 600 °C for 100 h. (a) Nyquist plot, (b) Bode plot; impedance module, (c) Bode plot; phase angle.
At 400 °C, the Nyquist diagram shows the formation of two capacitive semicircles. The first semicircle shows no significant changes, while the second increases in diameter during the first 3 h of immersion, subsequently decreasing over time. This behavior may be associated with the rapid formation of a protective layer followed by a loss of its resistive-capacitive properties or a rearrangement of its structure. The Bode plot in its impedance modulus format also shows the formation of two linear relationships (log f–log |Z|) from the intermediate frequency region to the low frequency region. The formation of the high-frequency plateau is also observed. After 3 h of immersion, the intermediate frequency linear relationship shows no significant variations, while the second linear relationship shows variations consistent with the second capacitive semicircle observed in the Nyquist plot. The presence of these two linear relationships suggests the existence of two-time constants, and the minimal variation in these relationships suggests the formation of a stable protective layer. The Bode plot in its phase angle format confirms the existence of two-time constants: the first located around 100 Hz with little variation after three hours of immersion, and the second located around 0.1 Hz with phase angle values around 40–45°. The latter suggests mass transfer limitations or diffusion effects [20,52,53]. The mass transfer limitations caused the little variation observed in the evolution of the spectra and suggested the formation of a stable protective layer that prevented the free diffusion of the molten salts to the alloy surface.
At 500 °C, the Nyquist diagrams also show characteristics similar to those observed at 400 °C. Two capacitive semicircles formed, the first showing no significant variations and the second increasing in diameter during the first 3 h of immersion, subsequently showing an apparent decrease in diameter until the end of the test. These characteristics suggest the presence of a stable layer on the alloy surface, but increasing the immersion time allowed for electrolyte diffusion due to the formation of imperfections in its structure. The Bode plot in its impedance modulus format shows the formation of the high-frequency plateau and the presence of two linear relationships (log f–log |Z|). The presence of the high-frequency plateau indicates that the protective layer developed on the alloy surface did not exhibit imperfections such as porosity or cracks that would allow the presence of electrolyte in those areas. In the low-frequency region, the impedance modulus shows a decrease in its value over time. The Bode plot in its phase angle format also shows the presence of two-time constants. The first occurs around 200 Hz with little variation in its maximum phase angle, while the second occurs at frequencies below 1 Hz, shifting towards lower frequencies as the immersion time increases and exhibiting a slight decrease in its maximum phase angle. The first-time constant shows a smaller maximum phase angle than that observed with the second time constant. The first-time constant may be associated with the resistive-capacitive characteristics of the protective layer, and the second time constant with the resistive-capacitive characteristics of the metallic surface. The evolution of the time constants suggests a degradation of the protective properties of the layer formed on the alloy surface, which allowed the electrolyte to diffuse.
At 600 °C, the Nyquist diagrams also show the apparent formation of two capacitive semicircles. The first shows no significant variations, while the second shows a slight decrease in diameter after 9 h of immersion until the end of the test. This suggests the development of a stable layer on the alloy surface, which limits the diffusion of the electrolyte. The Bode plot in its impedance modulus format also shows the presence of two linear relationships (log f–log |Z|) and the formation of a high-frequency plateau above 100 Hz. The appearance of the high-frequency plateau at such low frequencies indicates a surface with few surface defects that limit the diffusion of the electrolyte to the metal surface. The two linear relationships also show little variation, confirming the above. The Bode plot in phase angle format shows two overlapping time constants, which are detected at frequencies below 10 Hz. This coincides with observations made with the other plots. The location of the time constants at such low frequencies indicates the formation of a dense, compact, thin protective layer with few surface defects, as observed in the cross-sectional analyses.
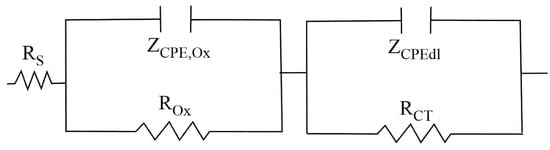
These results highlight the combined influence of temperature and alloy composition on the electrochemical behavior of the steels in molten nitrate salts. The EIS spectra were modeled based on the equivalent circuit shown in Figure 24. Because the capacitive semicircles did not exhibit ideal behavior, appearing depressed, the proposed equivalent circuit employed a constant phase element (CPE) to compensate for the scattering effect caused by the roughness of the working electrode. The equivalent circuit elements consist of Rs (electrolyte resistance), ZCPE,Ox (oxide layer CPE), ROx (oxide layer resistance), ZCPE,dl (electrochemical double layer CPE), and RCT (charge transfer resistance).
Figure 24.
Equivalent circuit used to model the EIS spectra.
The impedance of the CPE is defined by the expression [54]:
The elements that define it are: Y, a constant directly related to capacitance (F·cm−2·sn−1), ω, angular frequency (rad·s−1), j2 = −1, imaginary number, and n defined as a phenomenological coefficient that indicates the phase shift and is directly related to the heterogeneity of the surface. This coefficient (n) can take different values: if n = 1, then CPE = C; if n = 0.5, then CPE = ZW (Warburg impedance); and if n = 0, then CPE = R.
Once the values of the CPEs have been calculated, the capacitance can be calculated according to the equation [55,56]:
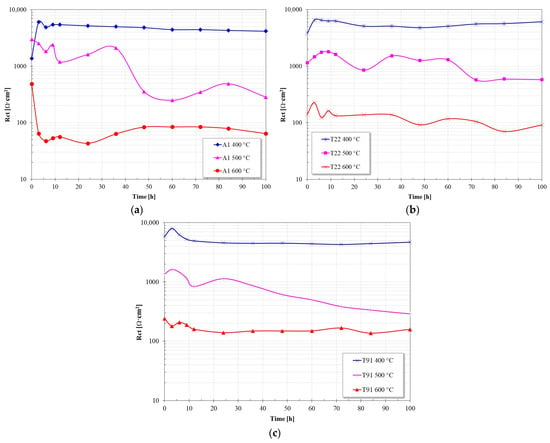
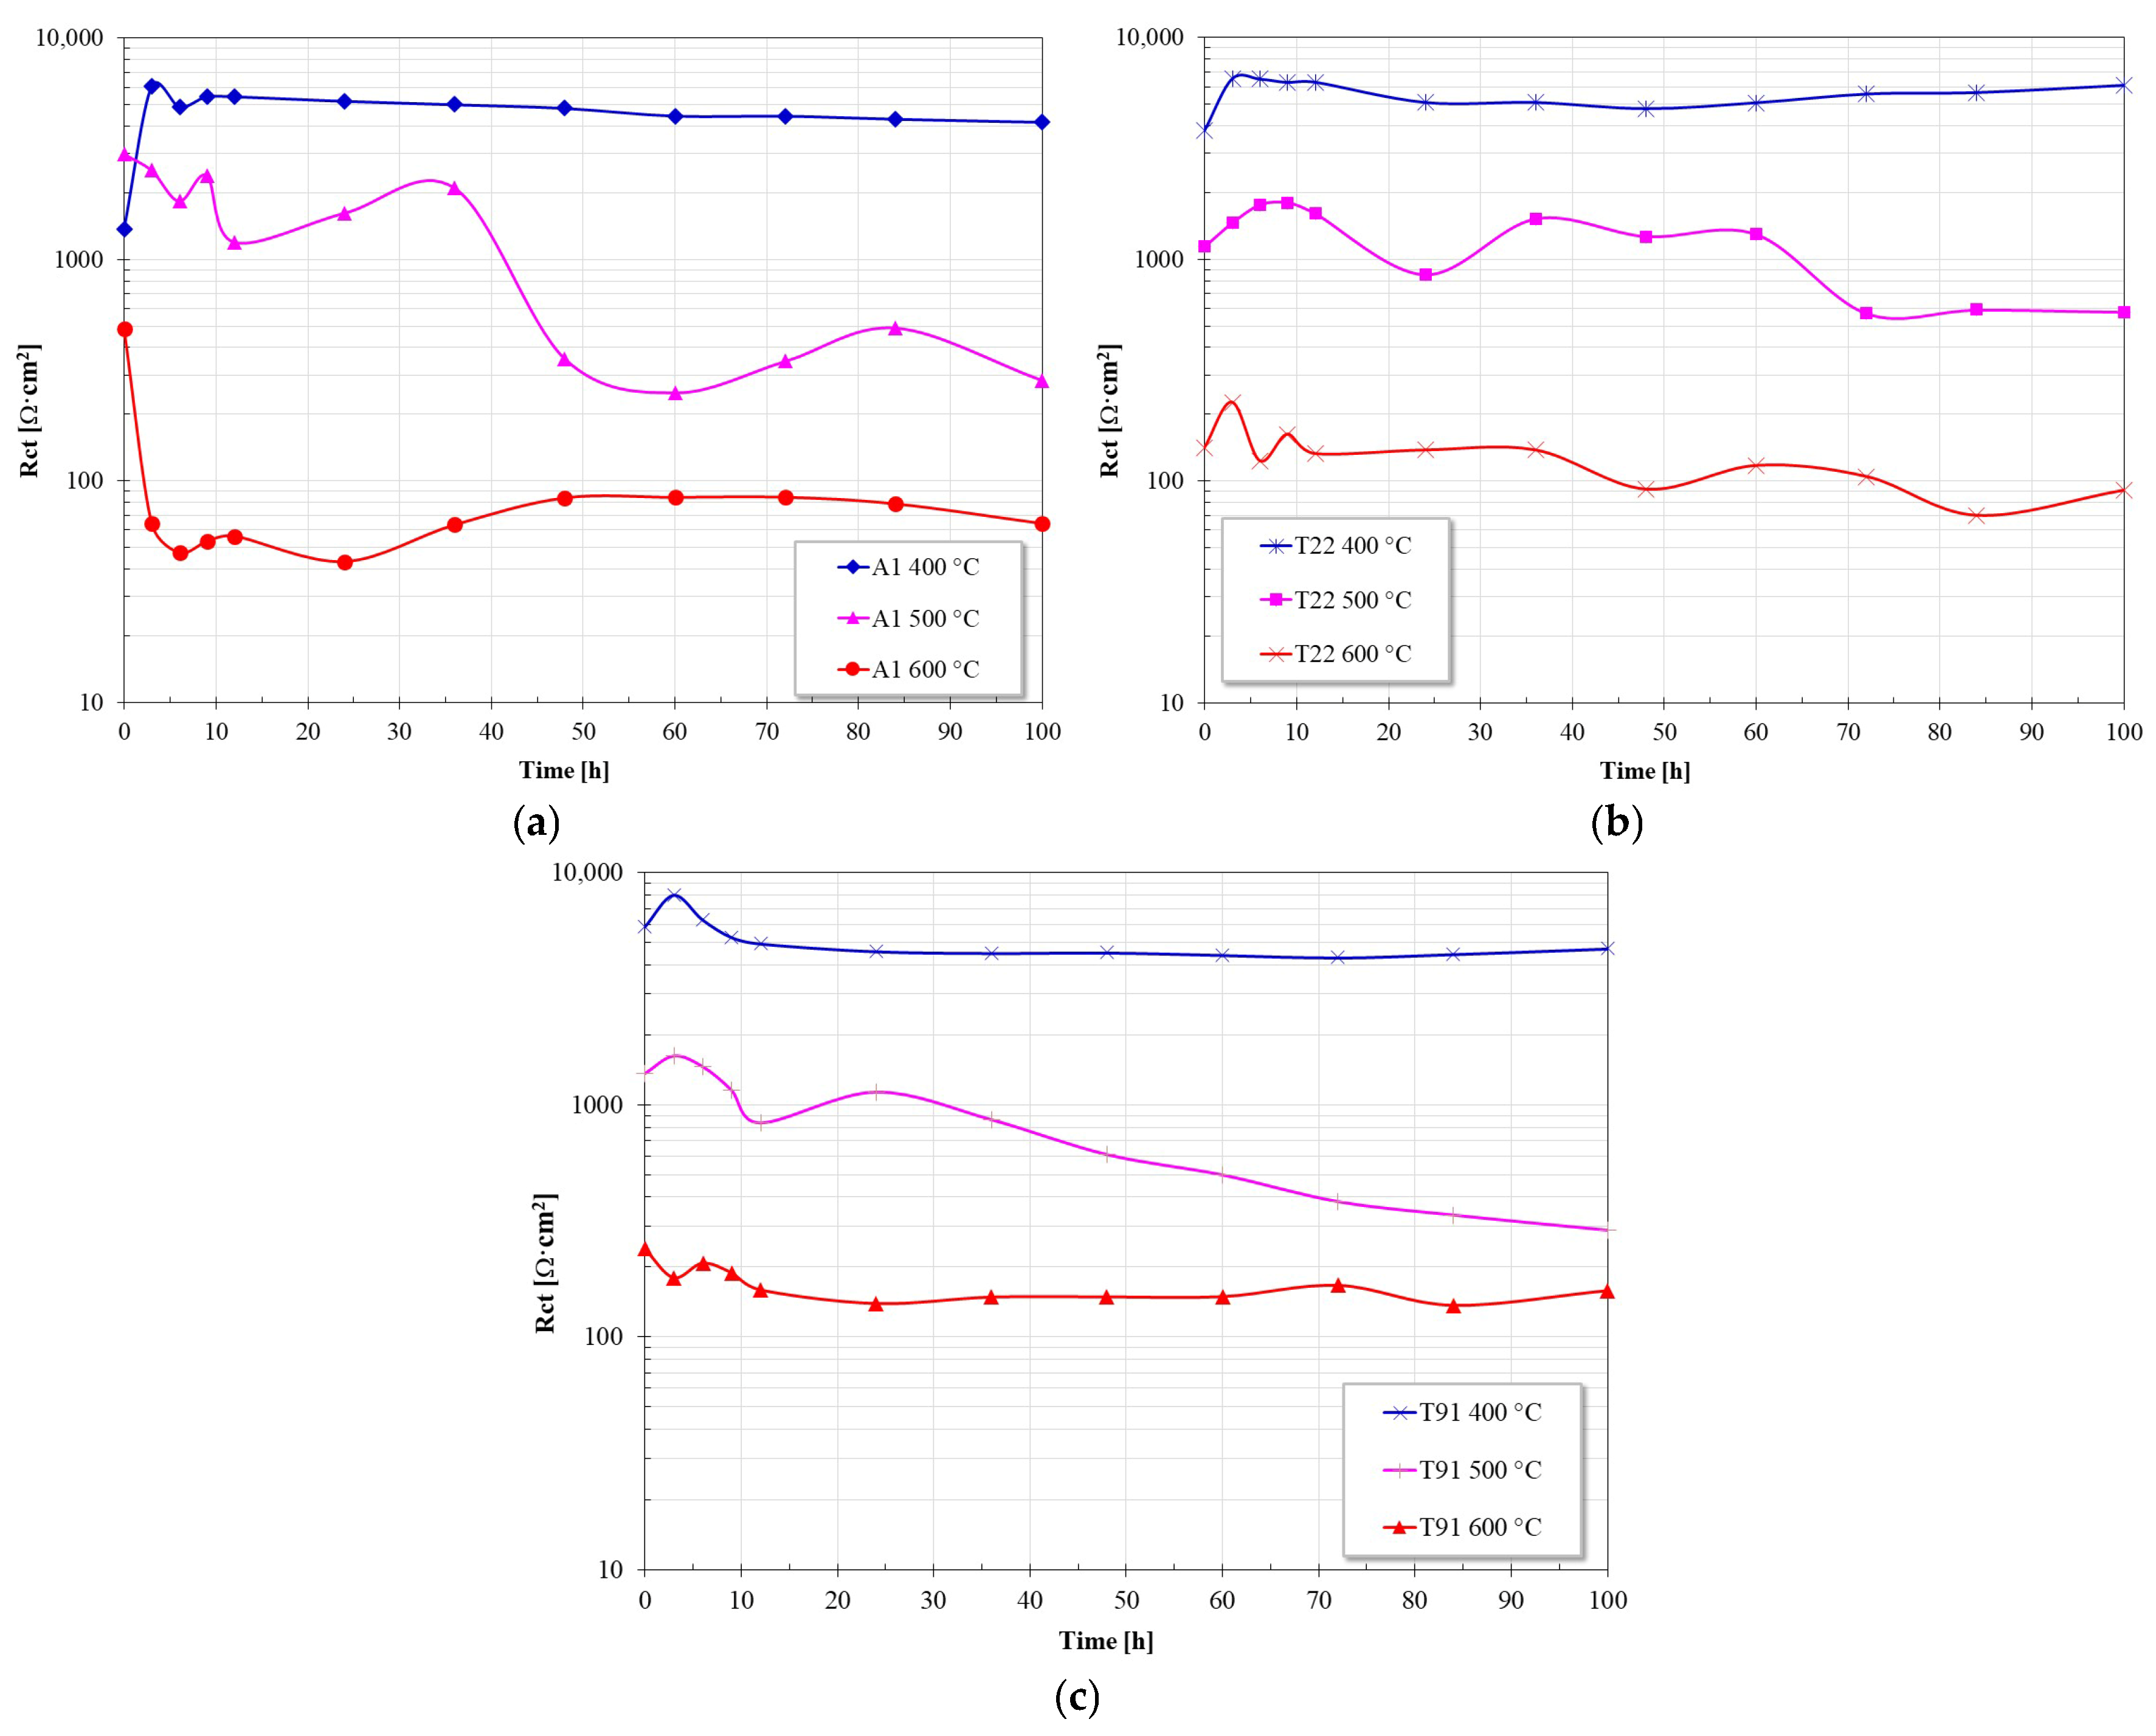
To correlate the results obtained with those of the linear polarization resistance measurements, in Figure 25 it was considered that Rp = RCT + Rox. Comparing the values shown with those shown in Figure 4, it can be observed that both Rp values show the same trend and their values are of the same order of magnitude; this suggests that the proposed equivalent circuit adequately represents the surface processes that occur at the working electrodes.
Figure 25.
Evolution of Rp values obtained from electrochemical impedance measurements in nitrate sales at 400 °C, 500 °C and 600 °C; (a) A1, (b) T22 and (c) T91.
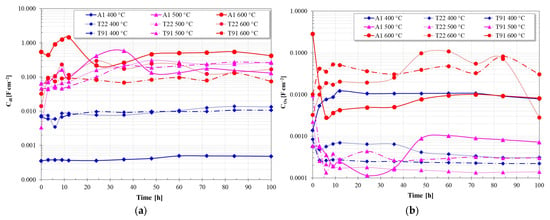
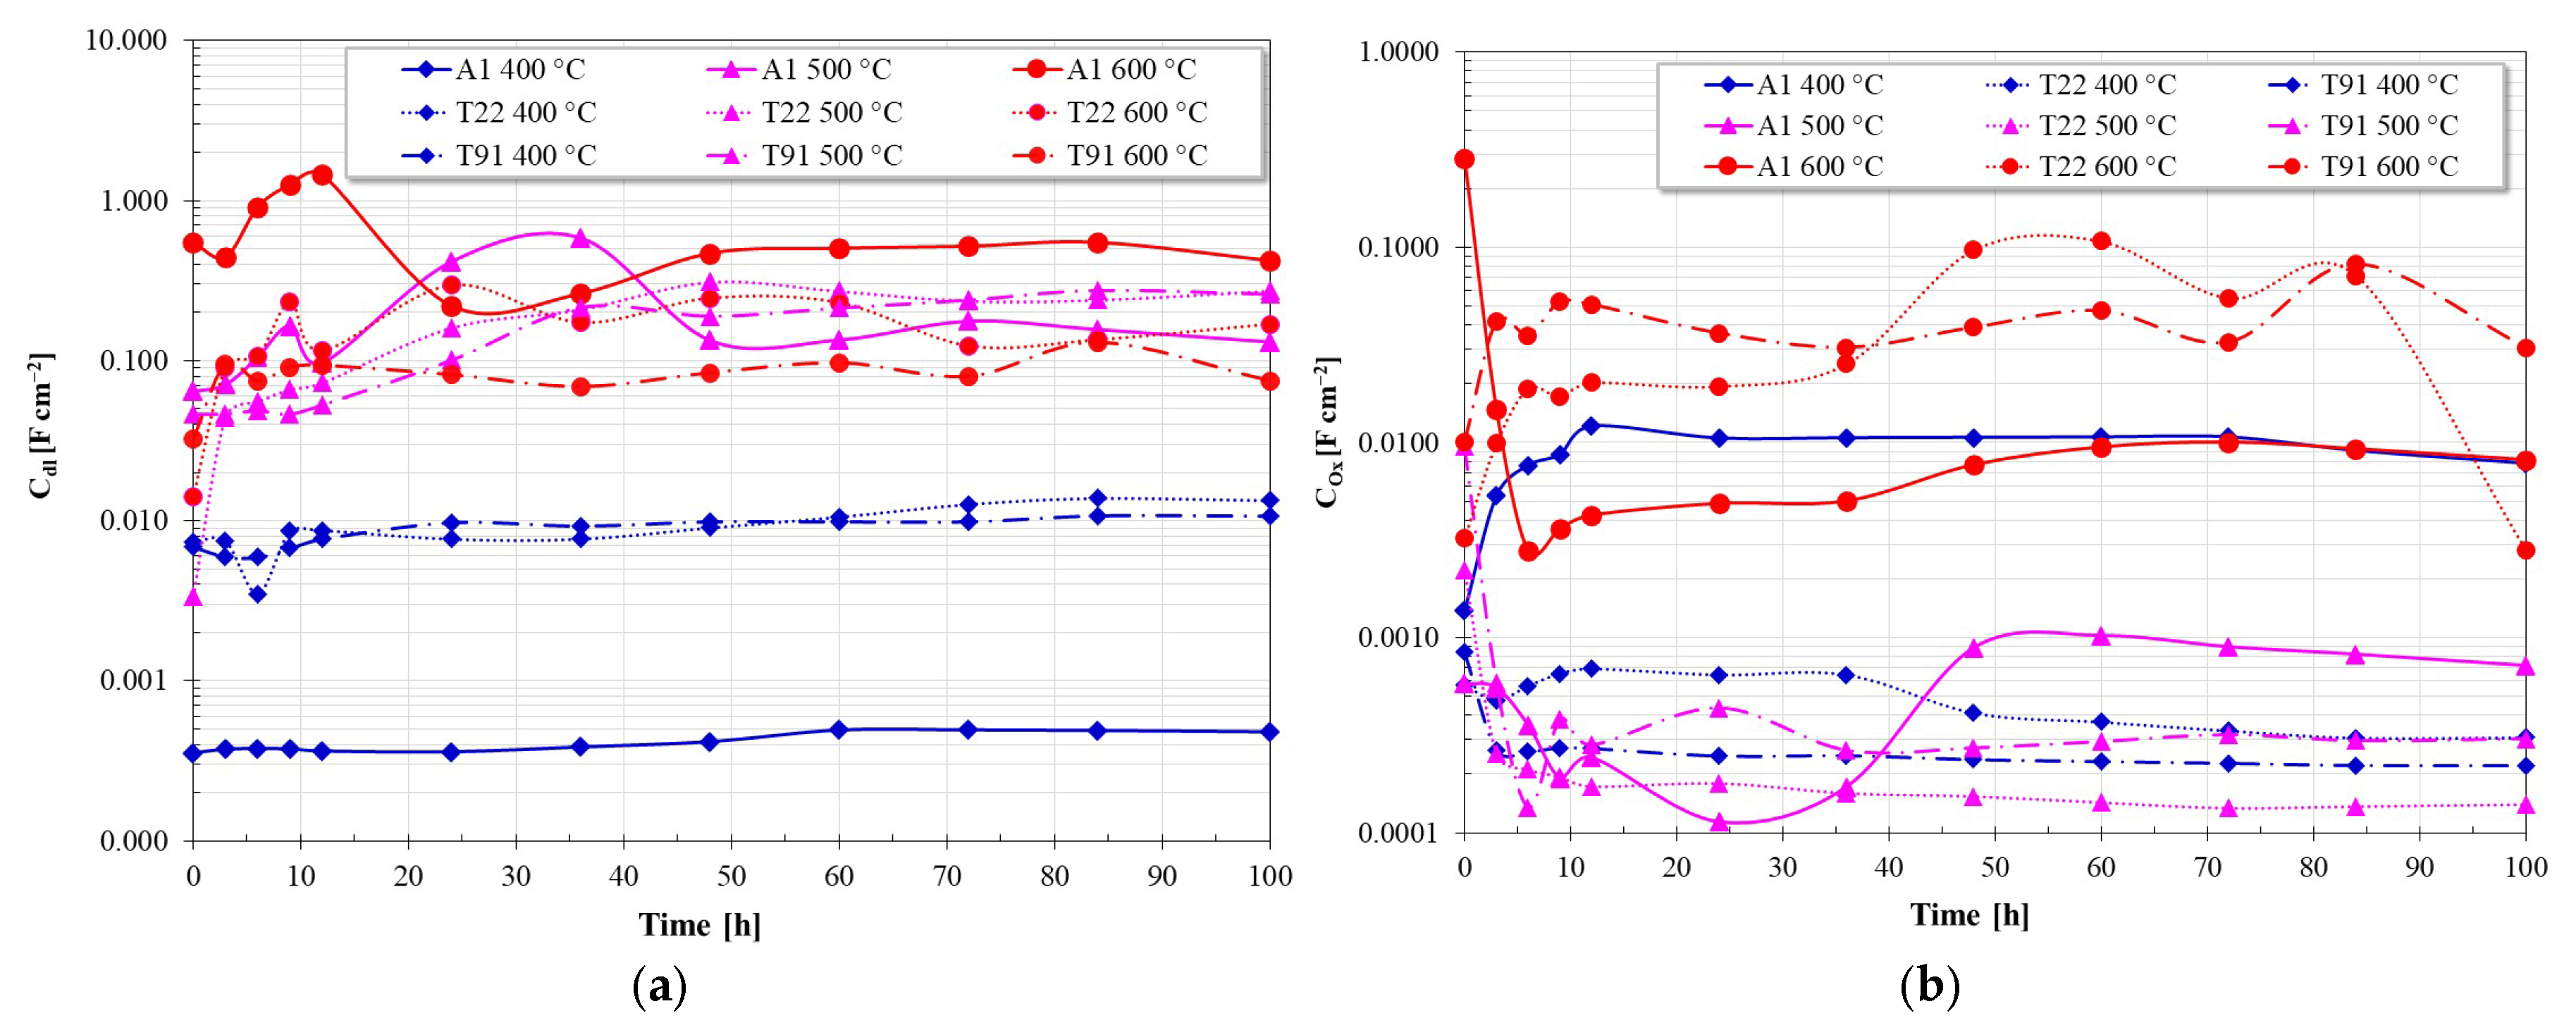
Figure 26 shows the capacitance values (Cdl, COx) as a function of time. In general, low capacitance values are correlated with low corrosion rates, and conversely, an increase in these values is associated with an increase in the corrosion rate of steels. Based on this, it can be observed that the capacitance values of the electrochemical double layer are lower at 400 °C, and that as the temperature increased, these values increased significantly due to the increased corrosivity of the nitrate salts. On the other hand, the capacitance values of the protective oxide film are lower than those of the double layer due to its lower reactivity compared to the metal surface. However, at 400 °C, the capacitance values of the oxide layer of T22 and T91 steels were lower than those shown by A1 steel, suggesting the development of a more compact oxide layer with higher protective character. On the other hand, the increase in temperature led to an increase in the capacitance values of the oxide film due to the increased aggressiveness of the molten salts.
Figure 26.
Evolution of capacitance values in nitrate salts at 400 °C, 500 °C and 600 °C for the evaluated steels; (a) Capacitance of the electrochemical double layer, (b) Capacitance of the oxide film.
The EIS results indicate that temperature is the dominant factor controlling the electrochemical degradation of the steels in molten nitrate salts. Increasing temperature reduced the impedance response and polarization resistance, indicating accelerated corrosion processes and reduced stability of the oxide layers.
The different corrosion responses of T22 and T91 steels can be associated with their alloy composition and the stability of the oxide layers formed in the molten nitrate environment. T91 steel has a higher chromium content, which favors the formation of chromium-rich oxides, such as Cr2O3 or Fe-Cr mixed spinels, at longer exposure times, as demonstrated in other studies [3,10,11,12,13]. These oxides are generally more protective and can reduce transport across the layer, leading to higher polarization resistance values.
Conversely, T22 steel contains lower chromium content, which can lead to the formation of less protective iron oxides, such as magnetite (Fe3O4) or hematite (Fe2O3). Under nitrate oxidizing conditions, these oxides can grow rapidly and become porous or poorly bonded, facilitating ongoing corrosion.
The electrochemical impedance results support this interpretation, as the higher impedance response observed for T91 suggests the development of a more resistive surface layer, which aligns with the higher Rp values measured during exposure.
4. Conclusions
Temperature was identified as the dominant parameter controlling the electrochemical degradation of the studied steels in molten nitrate salts. Increasing temperature resulted in a systematic decrease in polarization resistance (Rp), impedance modulus (|Z|), and maximum phase angle, indicating a progressive loss of the resistive–capacitive properties of the corrosion scale.
At 400 °C, steel A1 exhibited the highest polarization resistance, suggesting better short-term corrosion resistance under these conditions. This behavior is associated with the rapid formation of iron oxides that initially act as a protective layer.
However, at higher temperatures (600 °C), corrosion resistance becomes strongly dependent on alloy composition, particularly chromium content. Under these conditions, the steels followed the performance order: T91 > T22 > A1, indicating that higher chromium content improves the stability and protectiveness of the oxide scale.
Surface analysis revealed that T91 developed the thinnest and most compact corrosion layer (~10 μm), enriched in chromium, which reduced exfoliation and improved the chemical stability of the oxide scale.
The electrochemical impedance spectra showed two characteristic time constants associated with the corrosion product layer and the metal/oxide interface, indicating that the corrosion process is controlled by charge transfer and transport through the oxide scale.
Considering the combined electrochemical and surface analysis results, T91 steel exhibited the best overall corrosion resistance at elevated temperature, making it the most suitable candidate among the evaluated alloys for applications involving molten nitrate salts in concentrated solar power systems.
Author Contributions
Conceptualization, C.D.A.-G., J.G.G.-R. and J.P.-C.; Methodology, R.F.-C., C.D.A.-G., J.d.l.V.O., A.Q.-H., R.A.R.-D., J.G.G.-R. and J.P.-C.; Validation, J.d.l.V.O. and J.P.-C.; Formal analysis, R.F.-C., C.D.A.-G., A.Q.-H., R.A.R.-D. and J.P.-C.; Investigation, R.F.-C., C.D.A.-G., A.Q.-H. and J.P.-C.; Resources, J.P.-C.; Data curation, J.d.l.V.O.; Writing—original draft, J.G.G.-R. and J.P.-C.; Writing—review and editing, J.P.-C.; Supervision, C.D.A.-G., J.d.l.V.O., A.Q.-H., R.A.R.-D., J.G.G.-R. and J.P.-C. All authors have read and agreed to the published version of the manuscript.
Funding
This research received no external funding.
Data Availability Statement
The original contributions presented in this study are included in the article. Further inquiries can be directed to the corresponding author.
Acknowledgments
R. Felix-Contreras thanks CONAHCYT (National Council of Humanities, Science and Technology) for the financial support received.
Conflicts of Interest
The authors declare no conflict of interest.
References
- Pascual, S.; Lisbona, P.; Romeo, L.M. Thermal Energy Storage in Concentrating Solar Power Plants: A Review of European and North American R&D Projects. Energies 2022, 15, 8570. [Google Scholar] [CrossRef] [Scilit]
- Bell, S.; Steinberg, T.; Will, G. Corrosion mechanisms in molten salt thermal energy storage for concentrating solar power. Renew. Sustain. Energy Rev. 2019, 114, 109328. [Google Scholar] [CrossRef] [Scilit]
- Bradshaw, R.W.; Goods, S.H. Corrosion of Alloys and Metals by Molten Nitrates; Sandia Report SAND2000-8727; Sandia National Laboratories: Albuquerque, NM, USA, 2001. [Google Scholar]
- Vignarooban, K.; Xu, X.; Arvay, A.; Hsu, K.; Kannan, A.M. Heat transfer fluids for concentrating solar power systems—A review. Appl. Energy 2015, 146, 383–396. [Google Scholar] [CrossRef] [Scilit]
- Sötz, V.A.; Bonk, A.; Forstner, J.; Bauer, T. Microkinetics of the reaction NO−3 ⇌ NO−2 + 0.5O2 in molten sodium nitrate and potassium nitrate salt. Thermochim. Acta 2019, 678, 178301. [Google Scholar] [CrossRef] [Scilit]
- Wang, Y.; Wu, H.; Zhou, W.; Guo, S. Thermodynamics of corrosion products in molten nitrate salts. J. Nucl. Mater. 2023, 587, 154713. [Google Scholar] [CrossRef] [Scilit]
- Zhang, J.; Forsberg, C.W.; Simpson, M.F.; Guo, S.; Lam, S.T.; Scarlat, R.O.; Carotti, F.; Chan, K.J.; Singh, P.M.; Doniger, W.; et al. Redox potential control in molten salt systems for corrosion mitigation. Corros. Sci. 2018, 144, 44–53. [Google Scholar] [CrossRef] [Scilit]
- Wei, Y.; La, P.; Zheng, Y.; Zhan, F.; Yu, H.; Yang, P.; Zhu, M.; Bai, Z.; Gao, Y. Review of Molten Salt Corrosion in Stainless Steels and Superalloys. Crystals 2025, 15, 237. [Google Scholar] [CrossRef] [Scilit]
- Summers, K.; Chidambaram, D. Corrosion in Molten Salts for Solar Thermal Power. Electrochem. Soc. Interface 2021, 30, 63–66. [Google Scholar] [CrossRef] [Scilit]
- Bonk, A.; Ruckle, D.; Kaesche, S.; Braun, M.; Bauer, T. Impact of Solar Salt aging on corrosion of martensitic and austenitic steel for concentrating solar power plants. Sol. Energy Mater. Sol. Cells 2019, 203, 110162. [Google Scholar] [CrossRef] [Scilit]
- Liu, Q.; Wang, C.; Qian, J.; Pessu, F. Investigation of the early stage corrosion characteristics of molten (nitrate) salt–oxide–metal interfaces, and the links to interfacial thermo-mechanical stress. Corros. Sci. 2023, 220, 111282. [Google Scholar] [CrossRef] [Scilit]
- Trent, M.C.; Goods, S.H.; Bradshaw, R.W. Comparison of corrosion performance of grade 316 and grade 347H stainless steels in molten nitrate salt. AIP Conf. Proc. 2016, 1734, 160017. [Google Scholar] [CrossRef] [Scilit]
- Li, H.; Feng, X.; Wang, X.; Yang, X.; Tang, J.; Gong, J. Impact of temperature on corrosion behavior of austenitic stainless steels in solar salt for CSP application: An electrochemical study. Sol. Energy Mater. Sol. Cells 2022, 239, 111661. [Google Scholar] [CrossRef] [Scilit]
- Felix-Contreras, R.; de la Vega Olivas, J.; Arrieta-Gonzalez, C.D.; Chacon-Nava, J.G.; Rodriguez-Diaz, R.A.; Gonzalez-Rodriguez, J.G.; Porcayo-Calderon, J. Kinetic and Thermodynamic Aspects of the Degradation of Ferritic Steels Immersed in Solar Salt. Materials 2024, 17, 5776. [Google Scholar] [CrossRef] [Scilit] [PubMed]
- Slusser, J.W.; Titcomb, J.B.; Heffelfinger, M.T.; Dunbobbin, B.R. Corrosion in Molten Nitrate-Nitrite Salts. JOM 1985, 37, 24–27. [Google Scholar] [CrossRef] [Scilit]
- Kettrakul, P.; Thamrongsin, S.; Piyorose, P. Corrosion behavior of stainless in molten salts used for concentrated solar power. Suranaree J. Sci. Technol. 2022, 29, 010107. [Google Scholar]
- Xue, X.J.; Dong, J.; Zhao, C.Y. Corrosion evaluation of austenitic stainless steels in Li2CO3-K2CO3 eutectic salt for thermal energy storage. J. Energy Storage 2024, 99, 113312. [Google Scholar] [CrossRef] [Scilit]
- Palacios, A.; Navarro, M.E.; Jiang, Z.; Avila, A.; Qiao, G.; Mura, E.; Ding, Y. High-temperature corrosion behaviour of metal alloys in commercial molten salts. Sol. Energy 2020, 201, 437–452. [Google Scholar] [CrossRef] [Scilit]
- Pineda, F.; Walczak, M.; Vilchez, F.; Guerra, C.; Escobar, R.; Sancy, M. Evolution of corrosion products on ASTM A36 and AISI 304L steels formed in exposure to molten NaNO3–KNO3 eutectic salt: Electrochemical study. Corrs. Sci. 2022, 196, 110047. [Google Scholar] [CrossRef] [Scilit]
- Vivier, V.; Orazem, M.E. Impedance Analysis of Electrochemical Systems. Chem. Rev. 2022, 122, 11131–11168. [Google Scholar] [CrossRef] [Scilit]
- Yuan, R.; Jiao, H.; Zhu, H.; Fang, D.; Jiao, S. In situ characterization techniques and methodologies for high-temperature electrochemistry. Chem 2023, 9, 2481–2508. [Google Scholar] [CrossRef] [Scilit]
- Fernández, A.G.; Cabeza, L.F. Molten salt corrosion mechanisms of nitrate based thermal energy storage materials for concentrated solar power plants: A review. Sol. Energy Mater. Sol. Cells 2019, 194, 160–165. [Google Scholar] [CrossRef] [Scilit]
- Encinas-Sánchez, V.; Batuecas, E.; Macías-García, A.; Mayo, C.; Díaz, R.; Pérez, F.J. Corrosion resistance of protective coatings against molten nitrate salts for thermal energy storage and their environmental impact in CSP technology. Sol. Energy 2018, 176, 688–697. [Google Scholar] [CrossRef] [Scilit]
- Nithiyanantham, U.; Grosu, Y.; González-Fernández, L.; Zaki, A.; Igartua, J.M.; Faik, A. Corrosion aspects of molten nitrate salt-based nanofluids for thermal energy storage applications. Sol. Energy 2019, 189, 219–227. [Google Scholar] [CrossRef] [Scilit]
- Fernández, A.G.; Cabeza, L.F. Corrosion monitoring and mitigation techniques on advanced thermal energy storage materials for CSP plants. Sol. Energy Mater. Sol. Cells 2019, 192, 179–187. [Google Scholar] [CrossRef] [Scilit]
- Mallco, A.; Portillo, C.; Kogan, M.J.; Galleguillos, F.; Fernández, A.G. Materials Screening Test of Corrosion Monitoring in LiNO3 Containing Molten Salts as a Thermal Energy Storage Material for CSP Plants. Appl. Sci. 2020, 10, 3160. [Google Scholar] [CrossRef] [Scilit]
- Fernández, A.G.; Pérez, F.J. Improvement of the corrosion properties in ternary molten nitrate salts for direct energy storage in CSP plants. Sol. Energy 2016, 134, 468–478. [Google Scholar] [CrossRef] [Scilit]
- Yu, F.; Nicholls, J.R.; Aria, A.I.; Syed, A.U. High-Temperature Challenges: Electrochemical Investigations into Molten Salt Corrosion Mechanisms. Crystals 2026, 16, 200. [Google Scholar] [CrossRef] [Scilit]
- Encinas-Sánchez, V.; Macías-García, A.; de Miguel, M.T.; Pérez, F.J.; Rodríguez-Rego, J.M. Electrochemical Impedance Analysis for Corrosion Rate Monitoring of Sol–Gel Protective Coatings in Contact with Nitrate Molten Salts for CSP Applications. Materials 2023, 16, 546. [Google Scholar] [CrossRef] [Scilit]
- ASTM A210/A210M; Standard Specification for Seamless Medium-Carbon Steel Boiler and Superheater Tubes. ASTM International: West Conshohocken, PA, USA, 2019.
- ASTM A 213/A 213M; Standard Specification for Seamless Ferritic and Austenitic Alloy-Steel Boiler, Superheater, and Heat-Exchanger Tubes. ASTM International: West Conshohocken, PA, USA, 2018.
- Hoseiny, H.; Akmal, M.S. An Investigation on the Causes of Failure in A210 Carbon Steel Boiler Tubes in an Oil Refinery. J. Fail. Anal. and Preven. 2018, 18, 759–768. [Google Scholar] [CrossRef] [Scilit]
- Sun, J.; Wang, T.; Liu, F.; Zhang, Z.; Chen, Y.; Lin, H.; Liu, H.; Zhao, X.; Cheng, X. Microstructural and Performance Analysis of TP304H/T22 Dissimilar Steel Welded Joints. Materials 2023, 16, 4474. [Google Scholar] [CrossRef] [Scilit]
- Łomozik, M.; Hernas, A.; Zeman, M.L. Effect of welding thermal cycles on the structure and properties of simulated heat-affected zone areas in X10CrMoVNb9-1 (T91) steel at a state after 100,000 h of operation. Mater. Sci. Eng. A 2015, 637, 82–88. [Google Scholar] [CrossRef] [Scilit]
- McConohy, G.; Kruizenga, A. Molten nitrate salts at 600 and 680 °C: Thermophysical property changes and corrosion of high-temperature nickel alloys. Sol. Energy 2014, 103, 242–252. [Google Scholar] [CrossRef] [Scilit]
- Dorcheh, A.S.; Durham, R.N.; Galetz, M.C. Corrosion behavior of stainless and low-chromium steels and IN625 in molten nitrate salts at 600 °C. Sol. Energy Mater. Sol. Cells 2016, 144, 109–116. [Google Scholar] [CrossRef] [Scilit]
- Tizzoni, A.C.; Sau, S.; Corsaro, N.; Giaconia, A.; D’Ottavi, C.; Licoccia, S. Thermal fluids for CSP systems: Alkaline nitrates/nitrites thermodynamics modelling method. AIP Conf. Proc. 2016, 1734, 040007. [Google Scholar] [CrossRef] [Scilit]
- Delise, T.; Tizzoni, A.C.; Ferrara, M.; Telling, M.; Turchetti, L.; Corsaro, N.; Sau, S.; Licoccia, S. Phase Diagram Predictive Model for a Ternary Mixture of Calcium, Sodium, and Potassium Nitrate. ACS Sustain. Chem. Eng. 2020, 8, 111–120. [Google Scholar] [CrossRef] [Scilit]
- Stansbury, E.E.; Buchanan, R.A. Fundamentals of Electrochemical Corrosion; ASM International: Materials Park, OH, USA, 2000. [Google Scholar]
- Sotelo-Mazon, O.; Cuevas-Arteaga, C.; Porcayo-Calderon, J.; Salinas-Bravo, V.M.; Izquierdo-Montalvo, G. Corrosion behavior of pure Cr, Ni, and Fe exposed to molten salts at high temperature. Adv. Mater. Sci. Eng. 2014, 2014, 923271. [Google Scholar] [CrossRef] [Scilit]
- ASTM G102; Standard Practice for Calculation of Corrosion Rates and Related Information from Electrochemical Information. ASTM International: West Conshohocken, PA, USA, 2023.
- Fernandez, A.G.; Galleguillos, H.; Perez, F.J. Thermal influence in corrosion properties of Chilean solar nitrates. Sol. Energy 2014, 109, 125–134. [Google Scholar] [CrossRef] [Scilit]
- Encinas-Sánchez, V.; de Miguel, M.T.; Lasanta, M.I.; García-Martín, G.; Pérez, F.J. Electrochemical impedance spectroscopy (EIS): An efficient technique for monitoring corrosion processes in molten salt environments in CSP applications. Sol. Energy Mater. Sol. Cells 2019, 191, 157–163. [Google Scholar] [CrossRef] [Scilit]
- Li, N.; Tariq, N.U.H.; Han, B.; He, R.; Wang, J.; Cui, X.; Xiong, T. Study of Corrosion Performance and Mechanisms of P91, 304SS and IN625 Alloys in Molten Nitrate Salts Used for Thermal Energy Storage System. Metals 2023, 13, 806. [Google Scholar] [CrossRef] [Scilit]
- Li, H.; Yang, X.; Yin, X.; Wang, X.; Tang, J.; Gong, J. Effect of Chloride Impurity on Corrosion Kinetics of Stainless Steels in Molten Solar Salt for CSP Application: Experiments and Modeling. Oxid. Met. 2021, 95, 311–332. [Google Scholar] [CrossRef] [Scilit]
- Villada, C.; Bonkb, A.; Bauer, T.; Bolívar, F. High-temperature stability of nitrate/nitrite molten salt mixtures under different atmospheres. Appl. Energy 2018, 226, 107–115. [Google Scholar] [CrossRef] [Scilit]
- Abd El-Rahman, H.A.; Baraka, A.M.; Morsi, M.S.; Abd El-Gwad, S.A. Role of oxide ion concentration on the oxidation behaviour of zirconium in molten NaNO3-KNO3 eutectic. Thin Solid Film. 1994, 247, 56–63. [Google Scholar] [CrossRef] [Scilit]
- Sustersic, M.G.; Triaca, W.E.; Arvia, A.J. Potentiodynamic behaviour of graphite and platinum electrodes in molten sodium nitrite-potassium nitrite eutectics. Electrochim. Acta 1974, 19, 1–17. [Google Scholar] [CrossRef] [Scilit]
- Kruska, K.; Olszta, M.J.; Wang, J.; Schreiber, D.K. Intergranular corrosion of Ni-30Cr in high-temperature hydrogenated water after removing surface passivating film. npj Mater. Degrad. 2024, 8, 25. [Google Scholar] [CrossRef] [Scilit]
- Salinas-Solano, G.; Porcayo-Calderon, J.; Gonzalez-Rodriguez, J.G.; Salinas-Bravo, V.M.; Ascencio-Gutierrez, J.A.; Martinez-Gomez, L. High Temperature Corrosion of Inconel 600 in NaCl-KCl Molten Salts. Adv. Mater. Sci. Eng. 2014, 2014, 696081. [Google Scholar] [CrossRef] [Scilit]
- Kumar, S.; Hanke, A.; Bonk, A.; Bauer, T. Influence of atmosphere and austenitic stainless steel on the solar salt corrosivity. Heliyon 2024, 10, e25966. [Google Scholar] [CrossRef] [Scilit]
- Pototskaya, V.V.; Gichan, O.I. On the Origin of Phase Angle in Warburg Finite Length Diffusion Impedance. Int. J. Electrochem. Sci. 2019, 14, 8195–8205. [Google Scholar] [CrossRef] [Scilit]
- Park, S.-M.; Yoo, J.-S. Peer Reviewed: Electrochemical Impedance Spectroscopy for Better Electrochemical Measurements. Anal. Chem. 2003, 75, 455A–461A. [Google Scholar] [CrossRef] [Scilit]
- Fattah-alhosseini, A.; Soltani, F.; Shirsalimi, F.; Ezadi, B.; Attarzadeh, N. The semiconducting properties of passive films formed on AISI 316 L and AISI 321 stainless steels: A test of the point defect model (PDM). Corros. Sci. 2011, 53, 3186. [Google Scholar] [CrossRef] [Scilit]
- Hsu, C.H.; Mansfeld, F. Concerning the Conversion of the Constant Phase Element Parameter Y0 into a Capacitance. Corrosion 2001, 57, 747–748. [Google Scholar] [CrossRef] [Scilit]
- Brug, G.J.; Van Den Eeden, A.L.G.; Sluyters-Rehbach, M.; Sluyters, J.H. The analysis of electrode impedances complicated by the presence of a constant phase element. J. Electroanal. Chem. 1984, 176, 275. [Google Scholar] [CrossRef]

Disclaimer/Publisher’s Note: The statements, opinions and data contained in all publications are solely those of the individual author(s) and contributor(s) and not of MDPI and/or the editor(s). MDPI and/or the editor(s) disclaim responsibility for any injury to people or property resulting from any ideas, methods, instructions or products referred to in the content. |
© 2026 by the authors. Licensee MDPI, Basel, Switzerland. This article is an open access article distributed under the terms and conditions of the Creative Commons Attribution (CC BY) license.