Review

Melt Pool Imaging in Metal Additive Manufacturing Processing

by
Andrei C. Popescu
1,2,
Sabin Mihai
1,2,*,
Petru Vlad Toma
1,3,
Alexandru-Ionuț Bunea
1,2,
Andrei-Cosmin Rusu
1,2,
Sînziana Andreea Anghel
3,4 and
Ion Nicolae Mihailescu
4
1
Center for Advanced Laser Technologies (CETAL), National Institute for Laser, Plasma and Radiation Physics (INFLPR), 077125 Magurele, Ilfov, Romania
2
Faculty of Industrial Engineering and Robotics, National University of Science and Technology Politehnica Bucharest, 060042 Bucharest, Romania
3
Faculty of Physics, University of Bucharest, 077125 Magurele, Ilfov, Romania
4
Lasers Department, National Institute for Laser, Plasma and Radiation Physics (INFLPR), 077125 Magurele, Ilfov, Romania
*
Author to whom correspondence should be addressed.
Metals 2026, 16(4), 409; https://doi.org/10.3390/met16040409
Submission received: 2 March 2026 / Revised: 31 March 2026 / Accepted: 3 April 2026 / Published: 8 April 2026

Abstract

Additive manufacturing has recently become a key enabling technology in industrial fields, ranging from customized products for everyday usage to aerospace applications and small-batch industrial tooling. The future prospects extend up to the biofabrication of human organs. Ensuring the quality and repeatability of this process requires a systematic and comprehensive investigation of the underlying physical phenomena. In particular, melt-pool evolution is a critical feature, since irregularities in its spatial profile can influence microstructural evolution and weaken the integrity of the manufactured part. Microscale defects arising from balling and keyhole phenomena, often associated with recoil pressure, can severely degrade the quality of the resulting scanned track. This paper reviews the current state of optical approaches for melt-pool characterization and feature monitoring relevant to industrial laser additive manufacturing for process control and quality improvement, with a special focus on pyrometry and high-speed imaging. A single high-speed camera was generally used in experiments for melt-pool feature extraction, but two cameras were used to bypass emissivity values, which are otherwise difficult to obtain. Mathematical models were introduced to provide complementary information about melt-pool features, while artificial intelligence algorithms were used in other cases to process optical information. New melt-pool imaging databases and classifiers are expected in the near future to enable fast selection of appropriate process parameter windows, eliminating costly trial-and-error experiments.

1. Introduction

Metal additive manufacturing (AM) enables the fabrication of metallic components through a layer-by-layer deposition process, in which powder or wire feedstock is selectively melted using a high-energy laser or electron beam [1,2,3]. Compared with conventional manufacturing methods, this approach reduces the number of processing stages, as steps, such as mold preparation, bulk melting, casting, and extensive subtractive post-processing, can be partially or entirely eliminated. Consequently, production time, labor requirements, and associated energy consumption may be significantly decreased [4,5,6]. Furthermore, AM facilitates the design and fabrication of compositionally graded or multi-layered structures with complex geometries that are difficult to achieve using traditional methods [7,8,9]. By delivering multiple powders simultaneously and precisely controlling their interaction within the energy beam, the process enables tailored microstructures and mechanical properties within a single build.
Both photon and particle beams were used for precursor melting in additive manufacturing, but lasers stand as the most adopted commercial option at the moment, mainly because electron beam machines require a high vacuum for operation. Also, lasers are available in a rather extended wavelength range from UV to IR and can generate large high-power signals in either continuous wave (CW) or pulse modes [10,11].
Laser additive manufacturing (LAM) is currently conducted using either laser direct energy deposition (DED-LB) [12,13,14,15,16] or laser powder bed fusion (PBF-LB) [3,17,18,19,20] techniques.
DED-LB involves the blowing of powder streams or a wire towards the laser/electron beam spot, which, after melting rapidly, solidifies, forming a dense metallic structure [21,22]. Complex trajectories can be drawn by simultaneously moving the laser spot and the powder stream to deposit superposed layers in order to fabricate innovative 3D metallic materials in shape and composition. The transport of the powder and laser beams is usually independently designed and carried out by means of a nozzle (generally mounted on a robotic arm to allow movement with 6 degrees of freedom) to finally meet on the deposition substrate [23].
In turn, PBF-LB involves local laser irradiation to melt the powder bed in the spot. The process continues with every next pulse irradiating and melting the new powder, covering the deposition bed under the control of a scanning leveler [24]. This way, a 3D part is fabricated layer by layer.
DED-LB and PBF-LB techniques are complementary to each other, with specific strengths/weaknesses. In fact, DED-LB allows for the fabrication of large parts with versatile composition consisting of multi-layered, multi-metal structures, while in situ alloys or compositional gradients are relatively easy to achieve. The technique exhibits, however, a limited resolution: sub-millimeter structures are thus, e.g., very difficult to produce. In contrast, the PBF-LB technique excels at resolution, making it possible to fabricate parts with very complex geometries, unfortunately, under restrictions with respect to part size and compositional versatility.
In practice, laser power, beam focusing, scanning speed, powder feeding rate, and hatch distance stand among the main parameters that control the overall performance of fabricated parts [25]. Their imperfect tuning can cause improper thermal management issues, porosity, cracking, or the advent of undesired microstructures [26,27].
The local laser energy dose, determined by the incident laser energy density, is a critical process parameter that must be carefully optimized, as defects can arise at both excessively high and insufficient energy inputs. At high-energy doses, often associated with low scanning speeds and heat accumulation, the melt pool deviates from its ideal shallow hemispherical shape and forms a deep, narrow, keyhole-shaped cavity dominated by metal boiling and a high evaporation rate [28,29]. This prolongs the lifetime of the liquid phase, delays solidification, and promotes gas entrapment, leading to pore formation. In contrast, when the laser energy dose is too low, the heat input is insufficient to fully melt the powder particles, resulting in incomplete fusion and highly porous solid structures [30].
Signature defect detection (e.g., cooling rates, keyholing, or microstructural discrepancies) can be conducted by melt-pool temperature measurement and/or the monitoring of morphological features [31]. This is not, in fact, an easy task, due to a combination of restriction factors such as the high laser speed in PBF-LB processes (up to 3000 mm/s), the rather small diameter of the melt pool (less than 1 mm), and the high temperature gradients (of the order of thousands of K/s) [32]. The macroscopic features, such as spatter, vapors, and powder spreading, can simultaneously impede the observations but also offer insightful information concerning process stability [33]. It depends on the experimenter’s ability to identify the appropriate features that can serve as the best prominent indicators for the success or failure of the process and to focus on those specific ones with respect to the available equipment.
During manufacturing, critical locations can occur, favoring unstable flow pattern evolution (such as vortices and droplet formation) with a significant impact on the quality of the part. At the start and just before the end of each printing stage, when the laser beam has a short stop before setting into motion/shutting down, the melt-pool temperature rises above the process mean, leading to the generation of large plasma plumes and related instabilities. The flow and temperature characteristics in these zones require careful monitoring, in particular in the DED-LB case [34].
We focused this review on relevant recent contributions in monitoring and measuring the key aspects related to the melt-pool, which play, in our opinion, an essential role during additive manufacturing processing. High-speed visible-spectrum cameras, photodetectors, pyrometers, microphones, and thermal infrared cameras were considered for the investigation of optical, acoustic, thermal, and vibration signals generated in the related laser-metal interaction processes. The X-ray results of melt-pool analyses were left out, since they require complicated setups, often incompatible with industrial needs. DED-LB and PBF-LB were considered separately because of the particularities of the two techniques in terms of laser power, spot size, powder delivery, and processing speed, which produce different effects with respect to the melt pool, requiring different monitoring approaches for the investigations. The content was organized in the two cases in sections devoted to temperature monitoring by multi-color pyrometry and melt pool spatial distribution profile and aspect ratio, pointing every time to the reliability versus limitations of the mentioned techniques and reported results. Next, a section was introduced concerning anomalies, instabilities, and defects appearing during the additive manufacturing process, which can be considered key parameters in fabrication stages, with special emphasis on their prediction and possible elimination.

2. Multi-Wavelength Pyrometry

The temperature measurement/monitoring of a certain surface/sample by optical pyrometry relies upon the application (extension) of Planck’s spectral distribution law, according to which the maximum thermal radiation power emitted by an ideal black surface (black body), per unit area and unit solid angle, and corresponding to an absolute temperature T, reads as [32,35,36,37]
B = 2 h c 2 λ 5 exp h c λ k B T 1 1
To this aim, one assumed that this equation, which relates temperature to the intensity of radiation emitted at individual wavelengths, can be solved for temperature if Planck’s statement of the intensities at two different wavelengths is divided.
In practice, one assumes that this equation, which relates temperature to the intensity of radiation emitted at individual wavelengths, can be solved for temperature if Planck’s assertion of the intensities at two different wavelengths is divided.
In fact, the knowledge of the exact emissivity (ϵ) values of the investigated material (generally difficult to obtain) is not mandatory. These difficulties can be surpassed by experimentally selecting two measurement wavelengths λ1 and λ2, which are very close to each other so that ϵ1ϵ2, i.e., ln ϵ1/ϵ2 ≅ 0. This solution assumes that the emissivity is the same at both wavelengths and cancels out in the division, a procedure that is generally known as the gray-body assumption.
The term ln (ϵ1/ϵ2) appearing in the respective ratio is thus eliminated, and the temperature can be calculated according to the simplified form of Wien’s law [38] (Equation (2)) based upon the intensity values (I1 and I2) measured at the two wavelengths.
T = h c k B 1 λ 2 1 λ 1 ln I 1 I 2 ln ε 1 ε 2 ln A 1 A 2 5 ln λ 2 λ 1
Here, h is Planck’s constant, c is the speed of light, k B is Boltzmann’s constant, and A 1 and A 2 are instrumental calibration constants at wavelengths λ 1 and λ 2 .
The thermal radiation of the objects under investigation is therefore currently recorded in pyrometry for two different but rather close wavelengths in order to minimize possible uncertainty due to the influence of the emissivity of measured surfaces.
In fact, a pyrometer is a non-contact device that intercepts and absorbs the thermal radiation emitted by an investigated surface, which consists of an optical system that focuses the incoming radiation onto a detector. Instruments operating with very narrow spectral bands, for which the incoming radiation is assumed to be of a single wavelength (monochromatic radiation), are usually called multi-wavelength pyrometers [39].
Technically, the melt-pool radiance is split and directed via independent optical paths to camera sensors, where two melt-pool images are formed and recorded.
If the two selected wavelengths are sufficiently close to each other, the application of the gray body assumption is justified, and the temperature could be deduced with good resolution, while, when the two wavelengths are separated by a small difference, bandwidth overlap in filters can appear, causing the temperature resolution to decrease due to a flattened signal ratio.
In practice, one finally aims to convert the multi-color images into a relevant thermal map [39].
Possible discrepancies between the actual and the measured values of the temperature via two-color pyrometry can be related to selected wavelengths and surface emissivities [33,39,40,41,42,43].
One should stress that the method allows for precise temperature measurements, even under a variable emissivity regime or the partial obscuration of the investigated heated object. Two-wavelength pyrometry measurements are consequently proper for industrial applications characterized by exposure to high temperatures and challenging measurement conditions where partial obscuration caused by contamination, smoke, vapors, dirty glass, and/or dust is most likely to occur. Two-color pyrometers are capable of withstanding substantial optical attenuation and may continue to operate stably even in the presence of significant contamination. However, two-color pyrometry is not inherently immune to visual obstructions. Instead, it is generally less affected by such conditions than one-color pyrometry, provided that both wavelength channels undergo comparable attenuation.

3. Melt-Pool Imaging Studies

3.1. Powder Bed Fusion (PBF) Melt-Pool Investigations

Laser pulses are often used in PBF-LB for powder bed melting, which makes it mandatory to select proper camera refresh rates in correlation with adequate technical intervals in order to avoid multiple-event recording or artifact imaging generation and to ensure accurate visualization of plasma and melt-pool features.

3.1.1. Temperature Measurement Challenges in Powder Bed Fusion: Plume Obstruction and Emissivity Evolution

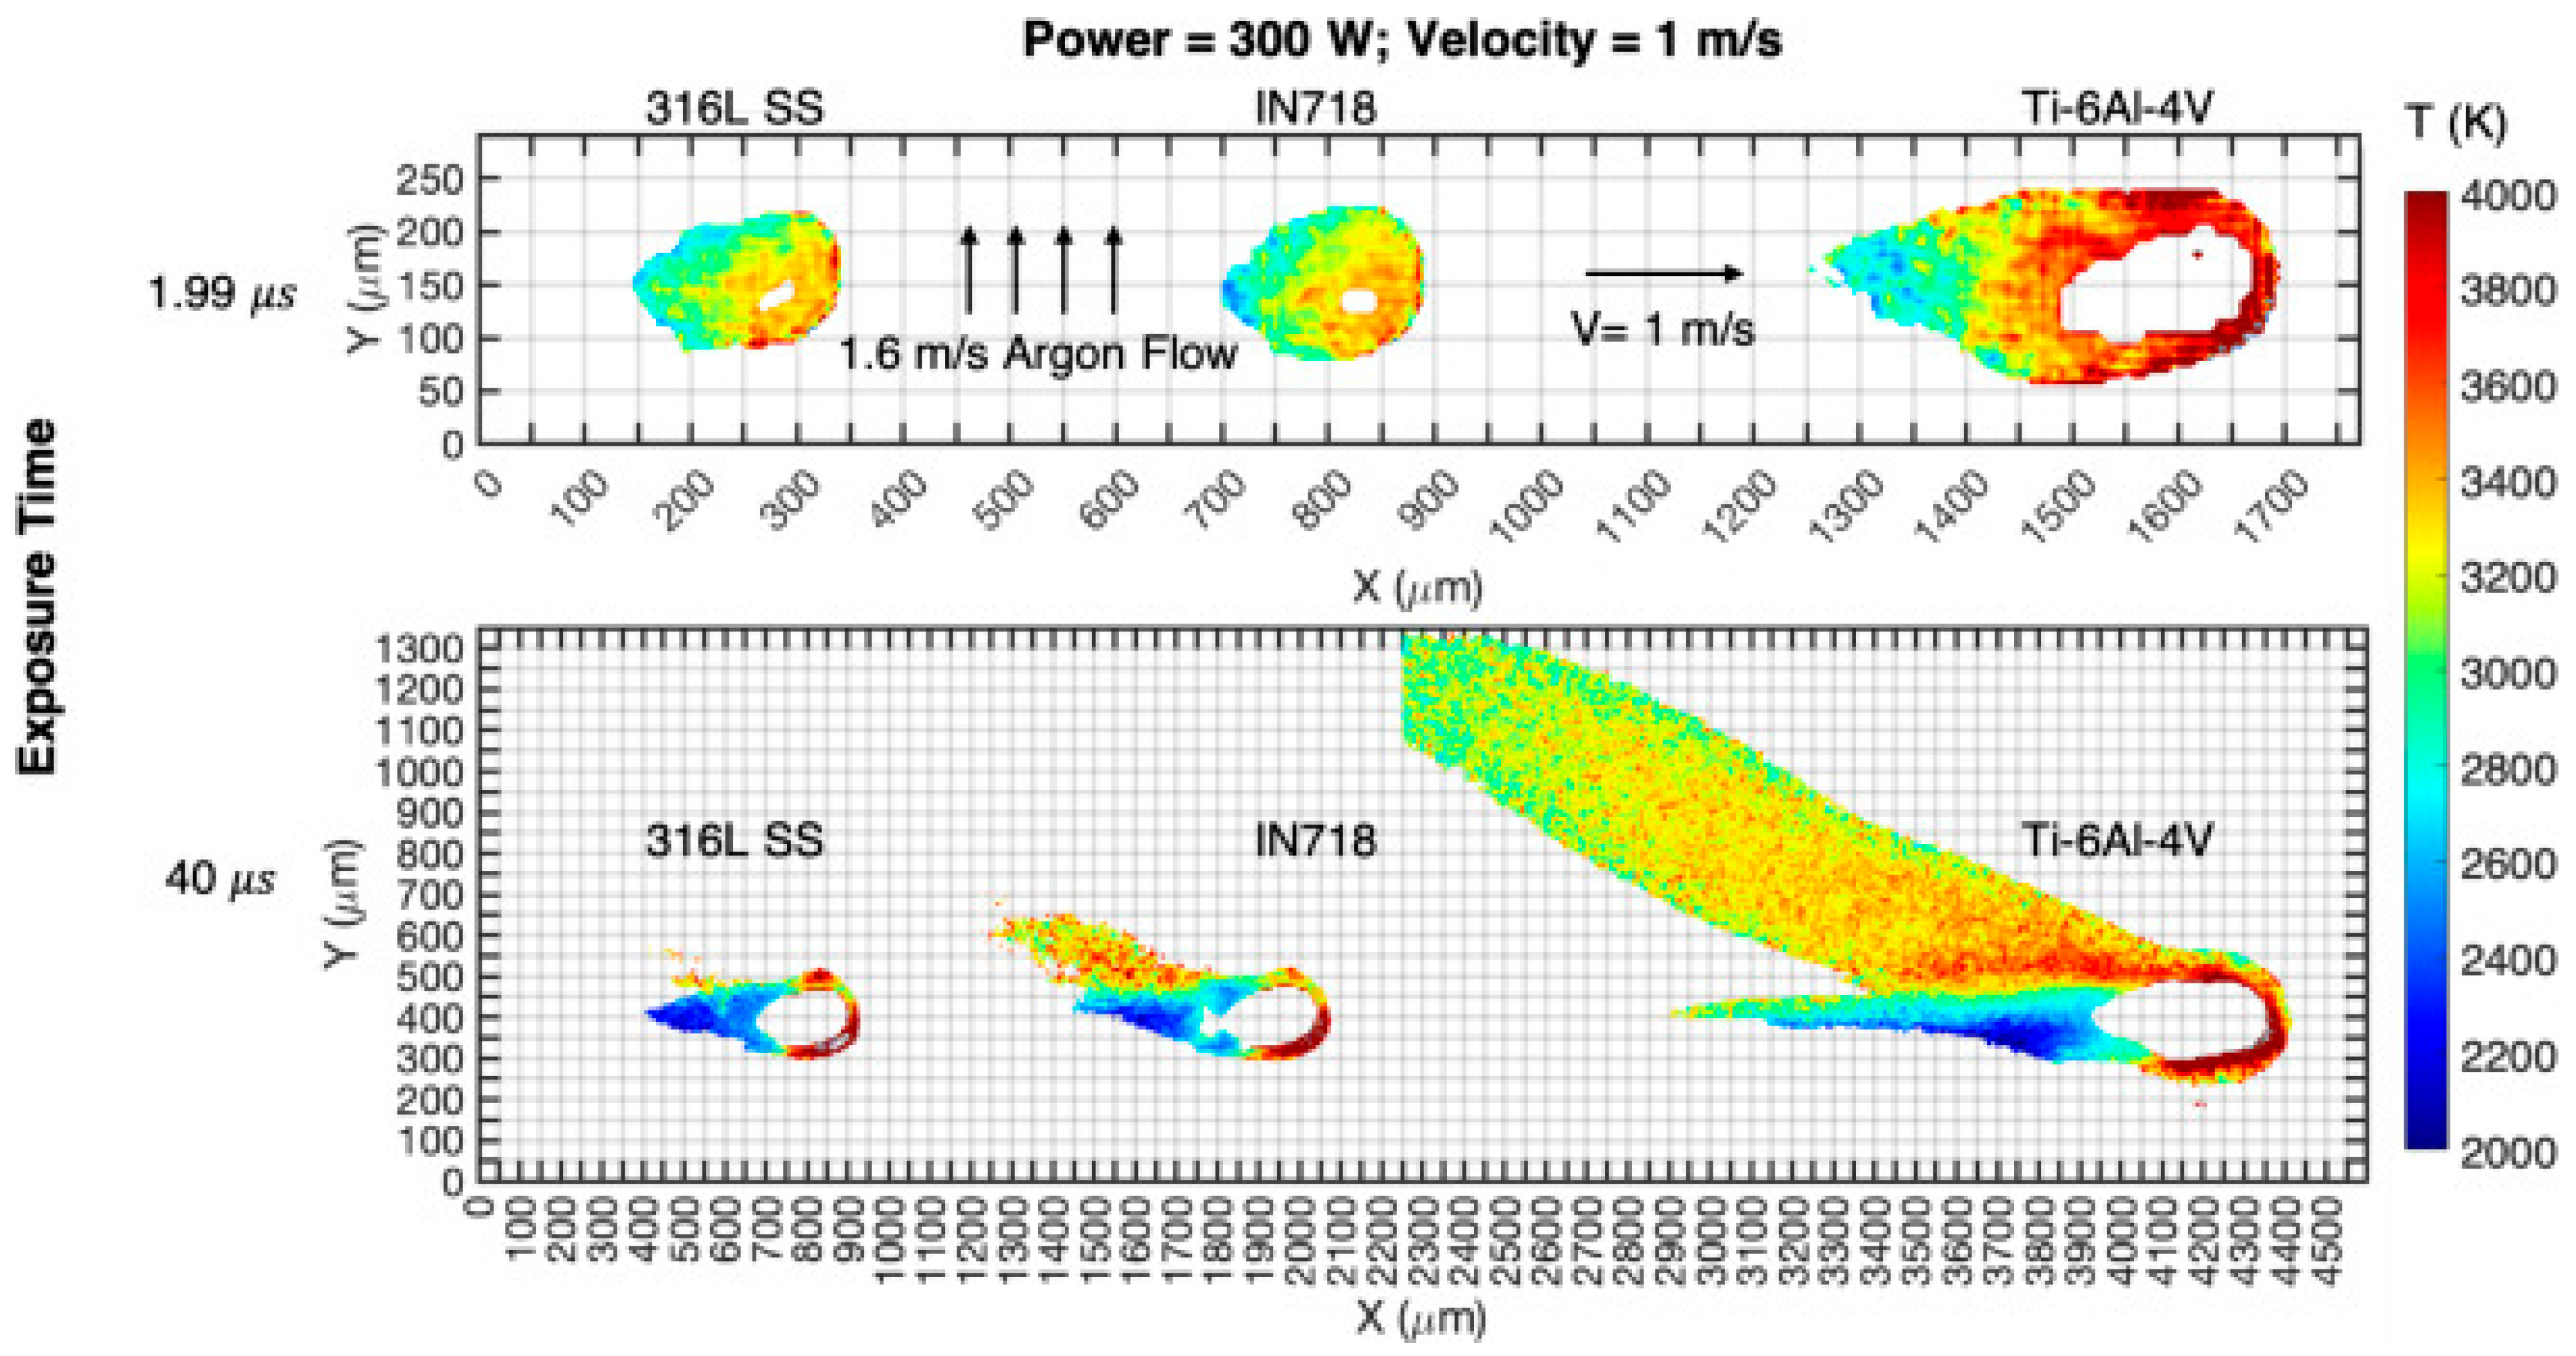
A. J. Myers et al. [31] performed measurements of the melt-pool temperatures for PBF-LB of 316 L stainless steel and recorded values between (3300–3700) K in the center of the melt pool. They also extended the analysis to IN718 and Ti-6Al-4V, observing comparable temperatures but substantially stronger plume-induced saturation and optical obstruction in Ti-6Al-4V, which they associated with enhanced vaporization, likely related to aluminum (compare images in Figure 1 of 316L stainless steel, IN718, and Ti-6Al-4V, and melt pools) [31]. These temperatures are in good agreement with the PBF-LB study of Ma et al. [44], who developed a coaxial dual-wavelength thermometry system based on a single high-speed camera and reported that PBF-LB melt-pool temperatures can reach up to about 4000 K in titanium-alloy processing. Ma et al. [44] also showed that both the average and peak melt-pool temperatures increase with increasing linear energy density during single-line printing. Accordingly, the temperature range reported by Myers et al. [31] lies near the upper end but remains consistent with the broader temperature levels measured in PBF-LB by Ma et al. [44]. However, these values should still be interpreted with caution, since Myers et al. [31] validated their camera-based method only between 1600 and 2800 K, whereas the reported melt-pool peaks exceeded this interval; moreover, plume obstruction and powder-related variability can affect the inferred temperature field. By comparison, Ma et al. [44] reported a validation error of less than 1% for their developed system, indicating high instrumental accuracy under calibration conditions, although in-process PBF-LB measurements remain sensitive to process disturbances and optical interference.
An explanation for this unexpected behavior was provided by César A. Terrazas-Nájera et al. [45], who used a multi-wavelength FMPI spectro-pyrometer (FAR Associates, Macedonia, OH, USA) in an electron beam powder bed fusion (PBF-EB) system to continuously measure temperatures and thermal emissive evolutions during sintering and melting of various metal powders.
The spectro-pyrometer was equipped with an InGaAs detector to capture spectral intensities over the nominal range of 900–1700 nm with a wavelength resolution of 1.56 nm after radiometric calibration in the 1080–1637 nm active range. The calibration was carried out with a conical IR-563 blackbody source, which was tuned to the detector’s recorded spectrum at 1000 °C.
The technique is capable of detecting variations in signal intensity, expressed in terms of emissivity, associated with changes in the material’s temperature, phase, morphology, and chemical composition.
Terrazas-Nájera et al. [45] showed that multi-wavelength pyrometry can track not only temperature evolution but also state-dependent radiative changes during electron beam powder bed fusion of Inconel 625. Their results suggest that the measured signal varies significantly as the material passes through sintering and melting, owing to simultaneous changes in phase, morphology, and chemistry. Thus, the study highlights that reliable in situ thermal monitoring in powder bed fusion requires consideration of dynamic emissive behavior, rather than assuming a fixed emissivity throughout processing.
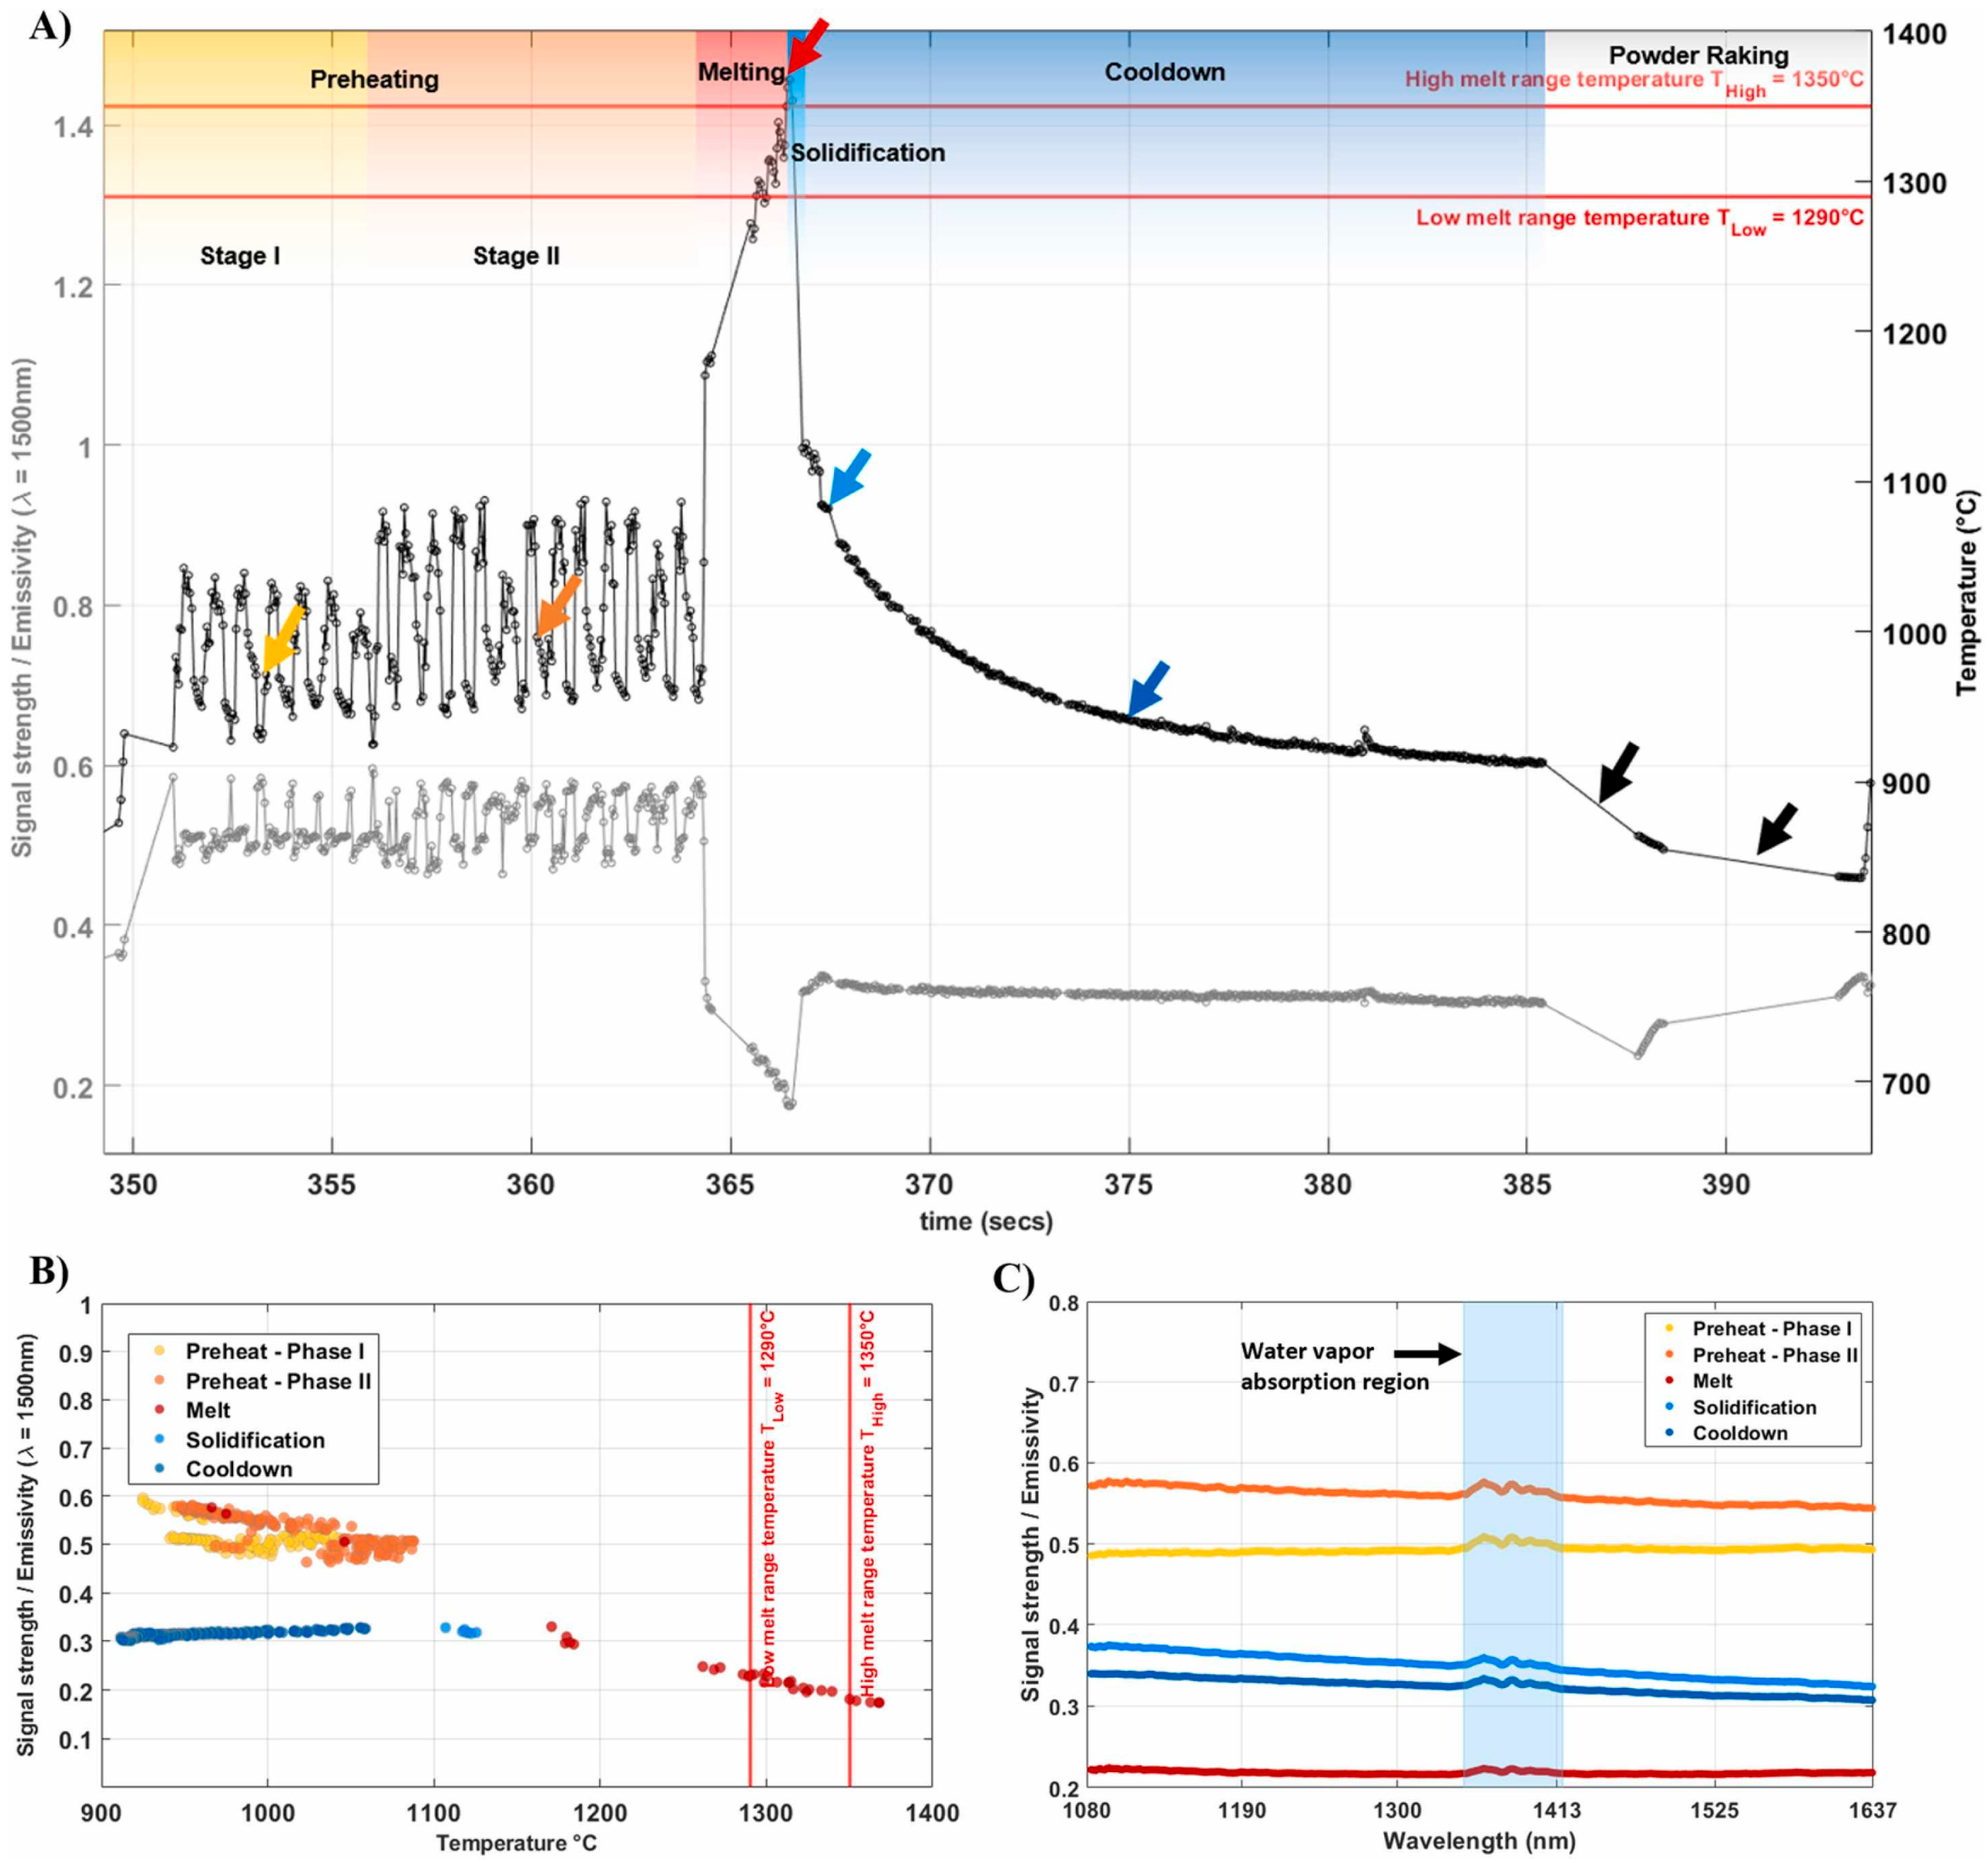
Thus, during the preheating stage (Figure 2A), the signal strength revealed an oscillating behavior that can be correlated with the development of preheating wavefronts generated by the electron beam raster scanning strategy. The scanning during melting (graded red region) resulted in a sharp increase in the temperature measured by the pyrometer, from ∼1050 to over 1290 °C, while the signal strength/emissivity dropped sharply from ∼0.60 to ∼0.17. After melting, the signal strength/emissivity increased to ∼0.30 during solidification (graded region in light blue) (Figure 2B). Finally, during the cooldown (graded blue region), the temperature dropped from above the melting range and approached ∼900 °C prior to the next powder ranking sequence, at t 385 s. During the cooling process, the signal strength/emissivity remained rather stable at ∼0.31 (Figure 2C). The spread of a new layer of powder was detected as a temperature drop and fluctuations of signal strength/emissivity.
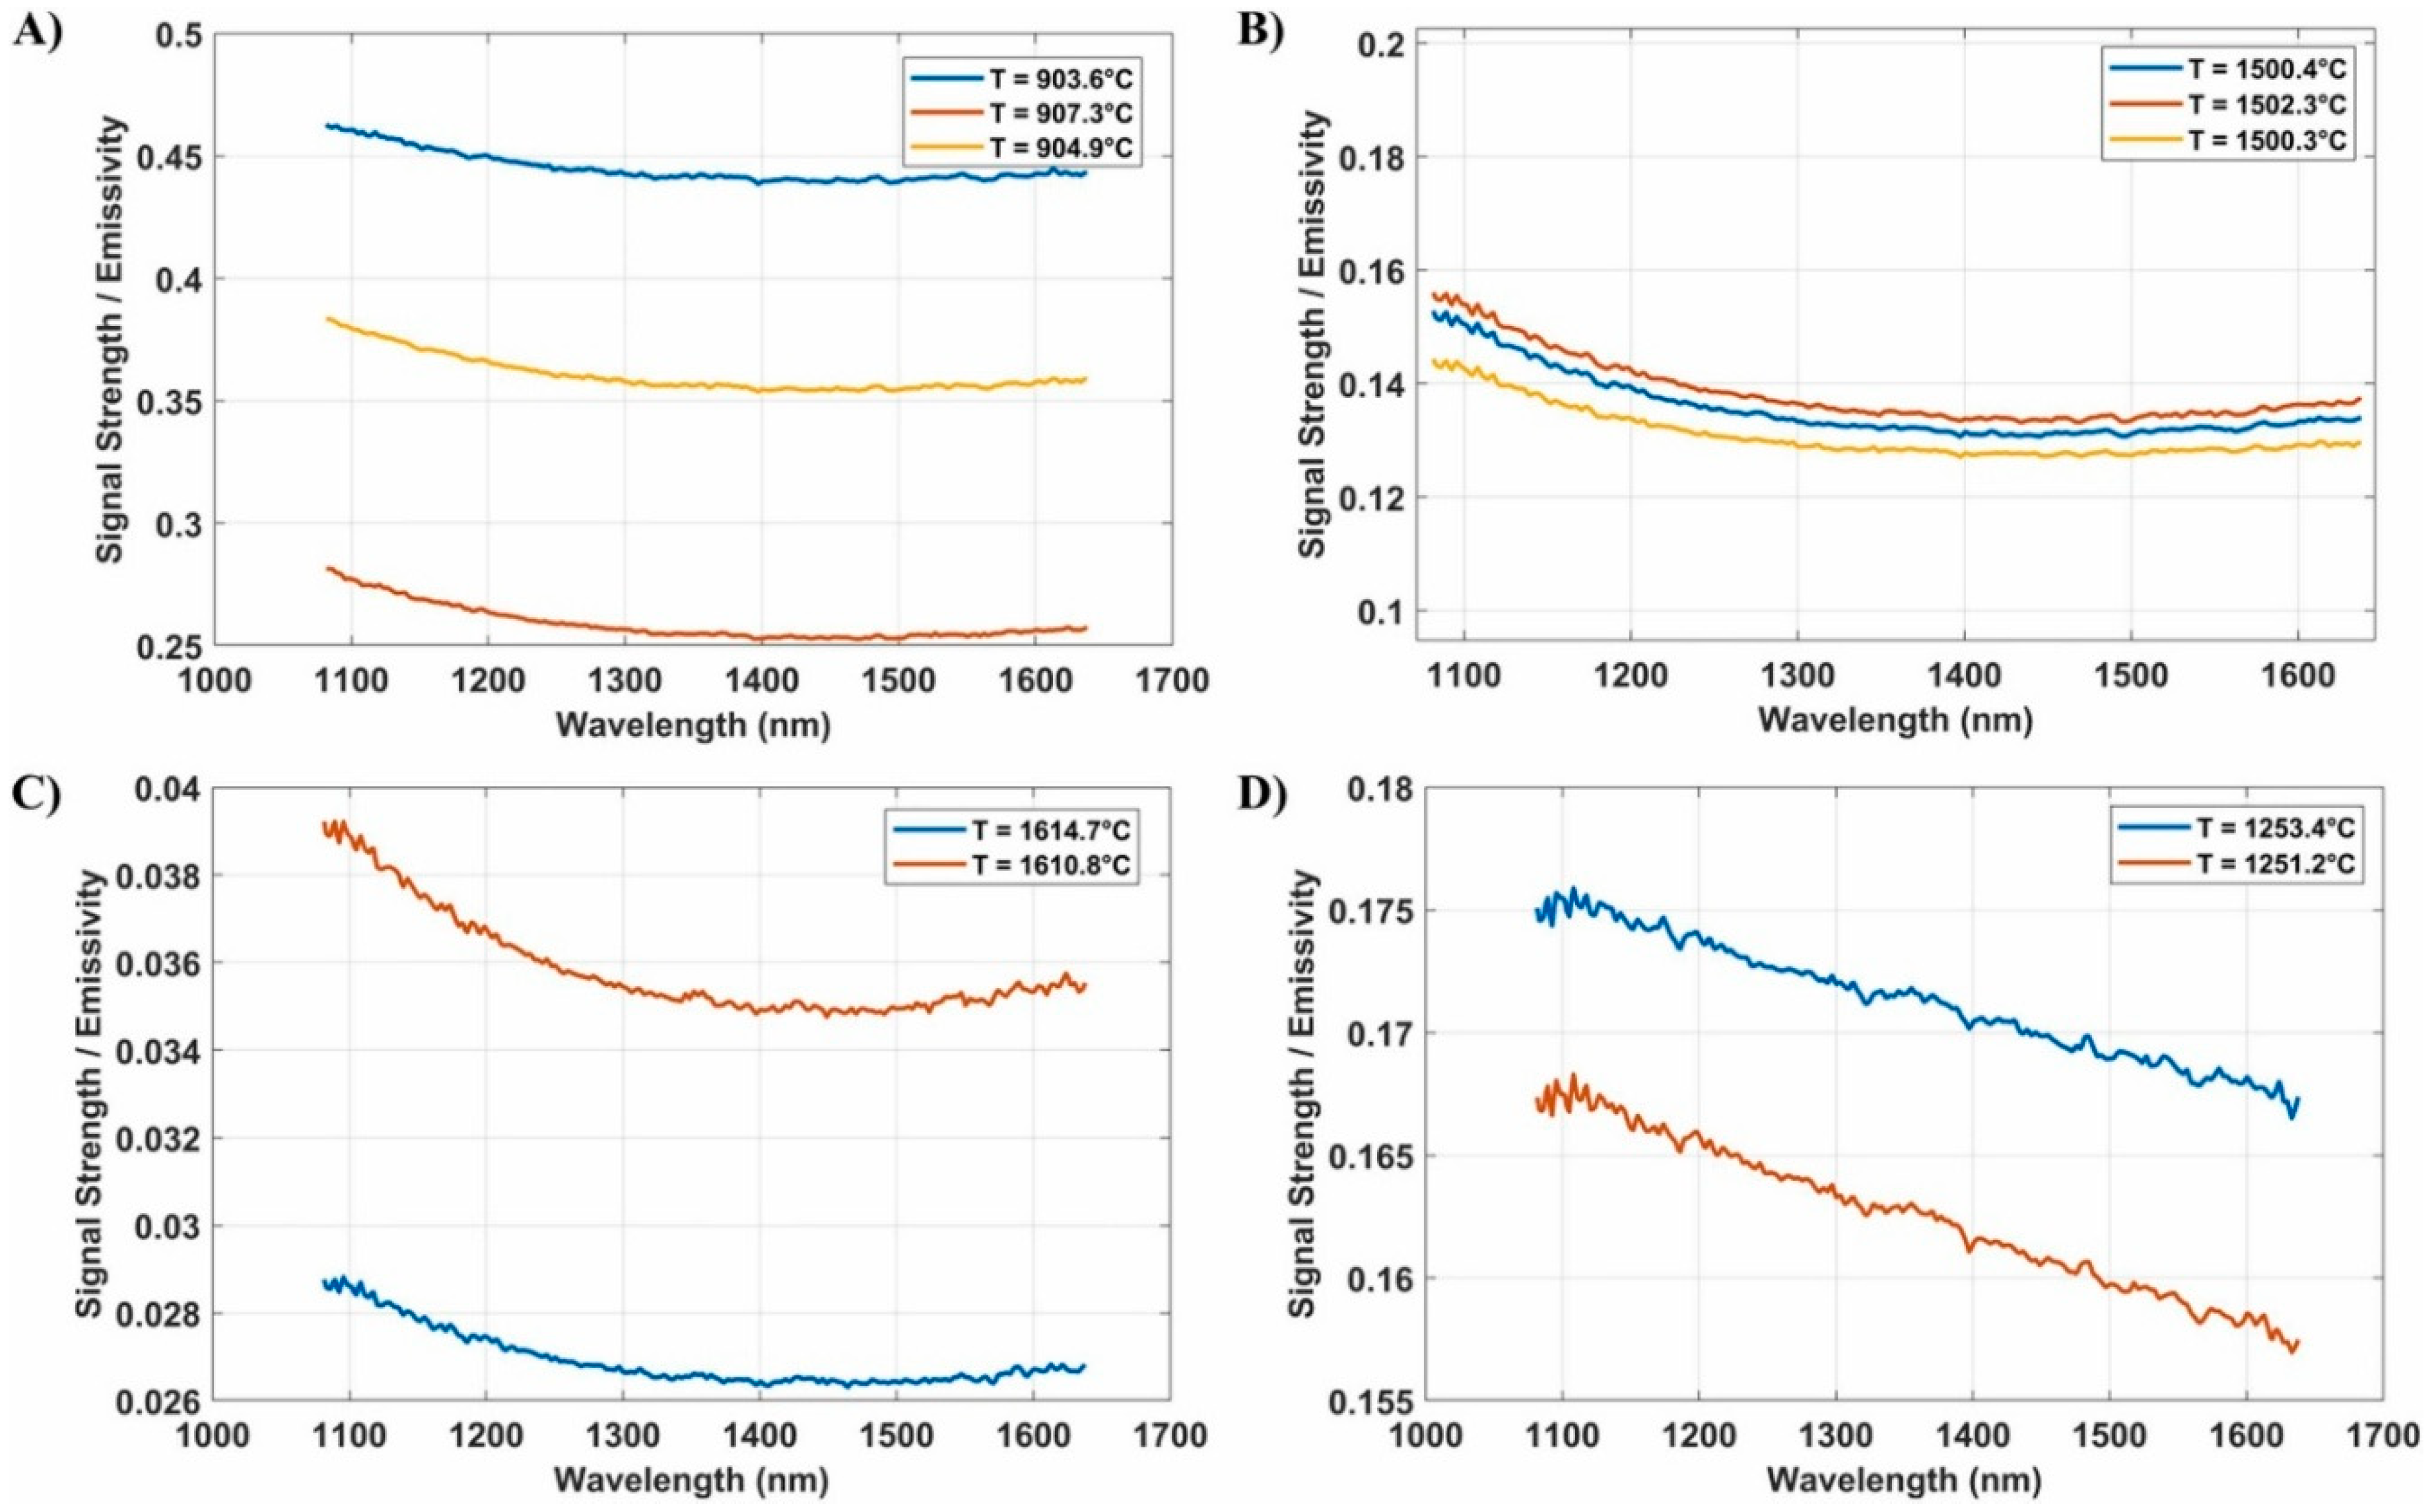
César A. Terrazas-Nájera et al. [46] extended the investigation to the melt pools of four other alloys, i.e., Ti6Al4V, TiAl, stainless steel 316 L, and IN625 thin-layer depositions obtained via PBF-EB. The measured emissive behaviors of the four materials significantly varied when the materials’ status changed from powder to liquid and back to solid. Thus, Figure 3 shows the typical emissivity recorded using the setup in [26] when monitoring the melt pool during PBF-EB of a Ti6Al4V sample, which was selected due to the highly variable emissivity fluctuations. As one may see, the measured emissive behavior is highly dynamic, with fluctuations up to 300%.
These results show that if a single emissivity is assumed, the deduced temperature values can be spoiled by errors of hundreds of degrees, i.e., by a deviation of ~50%. One should therefore conclude that melt-pool monitoring during PBF-EB via conventional radiation thermometry techniques can be affected by artifacts like the one visible in Figure 4 and should be replaced by pyrometry techniques that are independent of emissivity. This can be achieved by conducting investigations with several (minimum two) wavelengths, which corresponds to the introduction of multi-wavelength pyrometry.

3.1.2. Temperature Monitoring by Multi-Color Pyrometry

Two-Color Wavelength Pyrometry
P. A. Hooper [32] investigated the melt-pool temperature distribution in a Ti6Al4V part using two FASTCAM SA5 high-speed monochrome cameras (Photron, Tokyo, Japan) operating at 200,000 frames per second at a resolution of 128 × 128 pixels and a 12-bit pixel depth. Two bandpass filters were inserted in the setup to ensure optimum transmission efficiency by selecting the 700 nm wavelength for one camera and the 950 nm wavelength range for the second one. The recorded signal was then governed, generally increasing, by the separation distance between the laser beam and the melt-pool signal wavelength values. In fact, the center of the melt pool did not coincide in this case with the image center plane but moved around along with the change in the scanning mirrors’ position, making it difficult to align the images with both cameras and therefore correctly calculate the intensity ratios for each pixel. Although Hooper’s dual-camera two-color thermography setup provided high-resolution melt-pool temperature fields, its dependence on two synchronized cameras and accurate pixelwise image alignment under scanner-induced melt-pool motion makes it more representative of a laboratory research configuration than a directly deployable industrial monitoring system; in industrial LPBF, simpler sensors or compact coaxial thermography architectures are generally more practical.
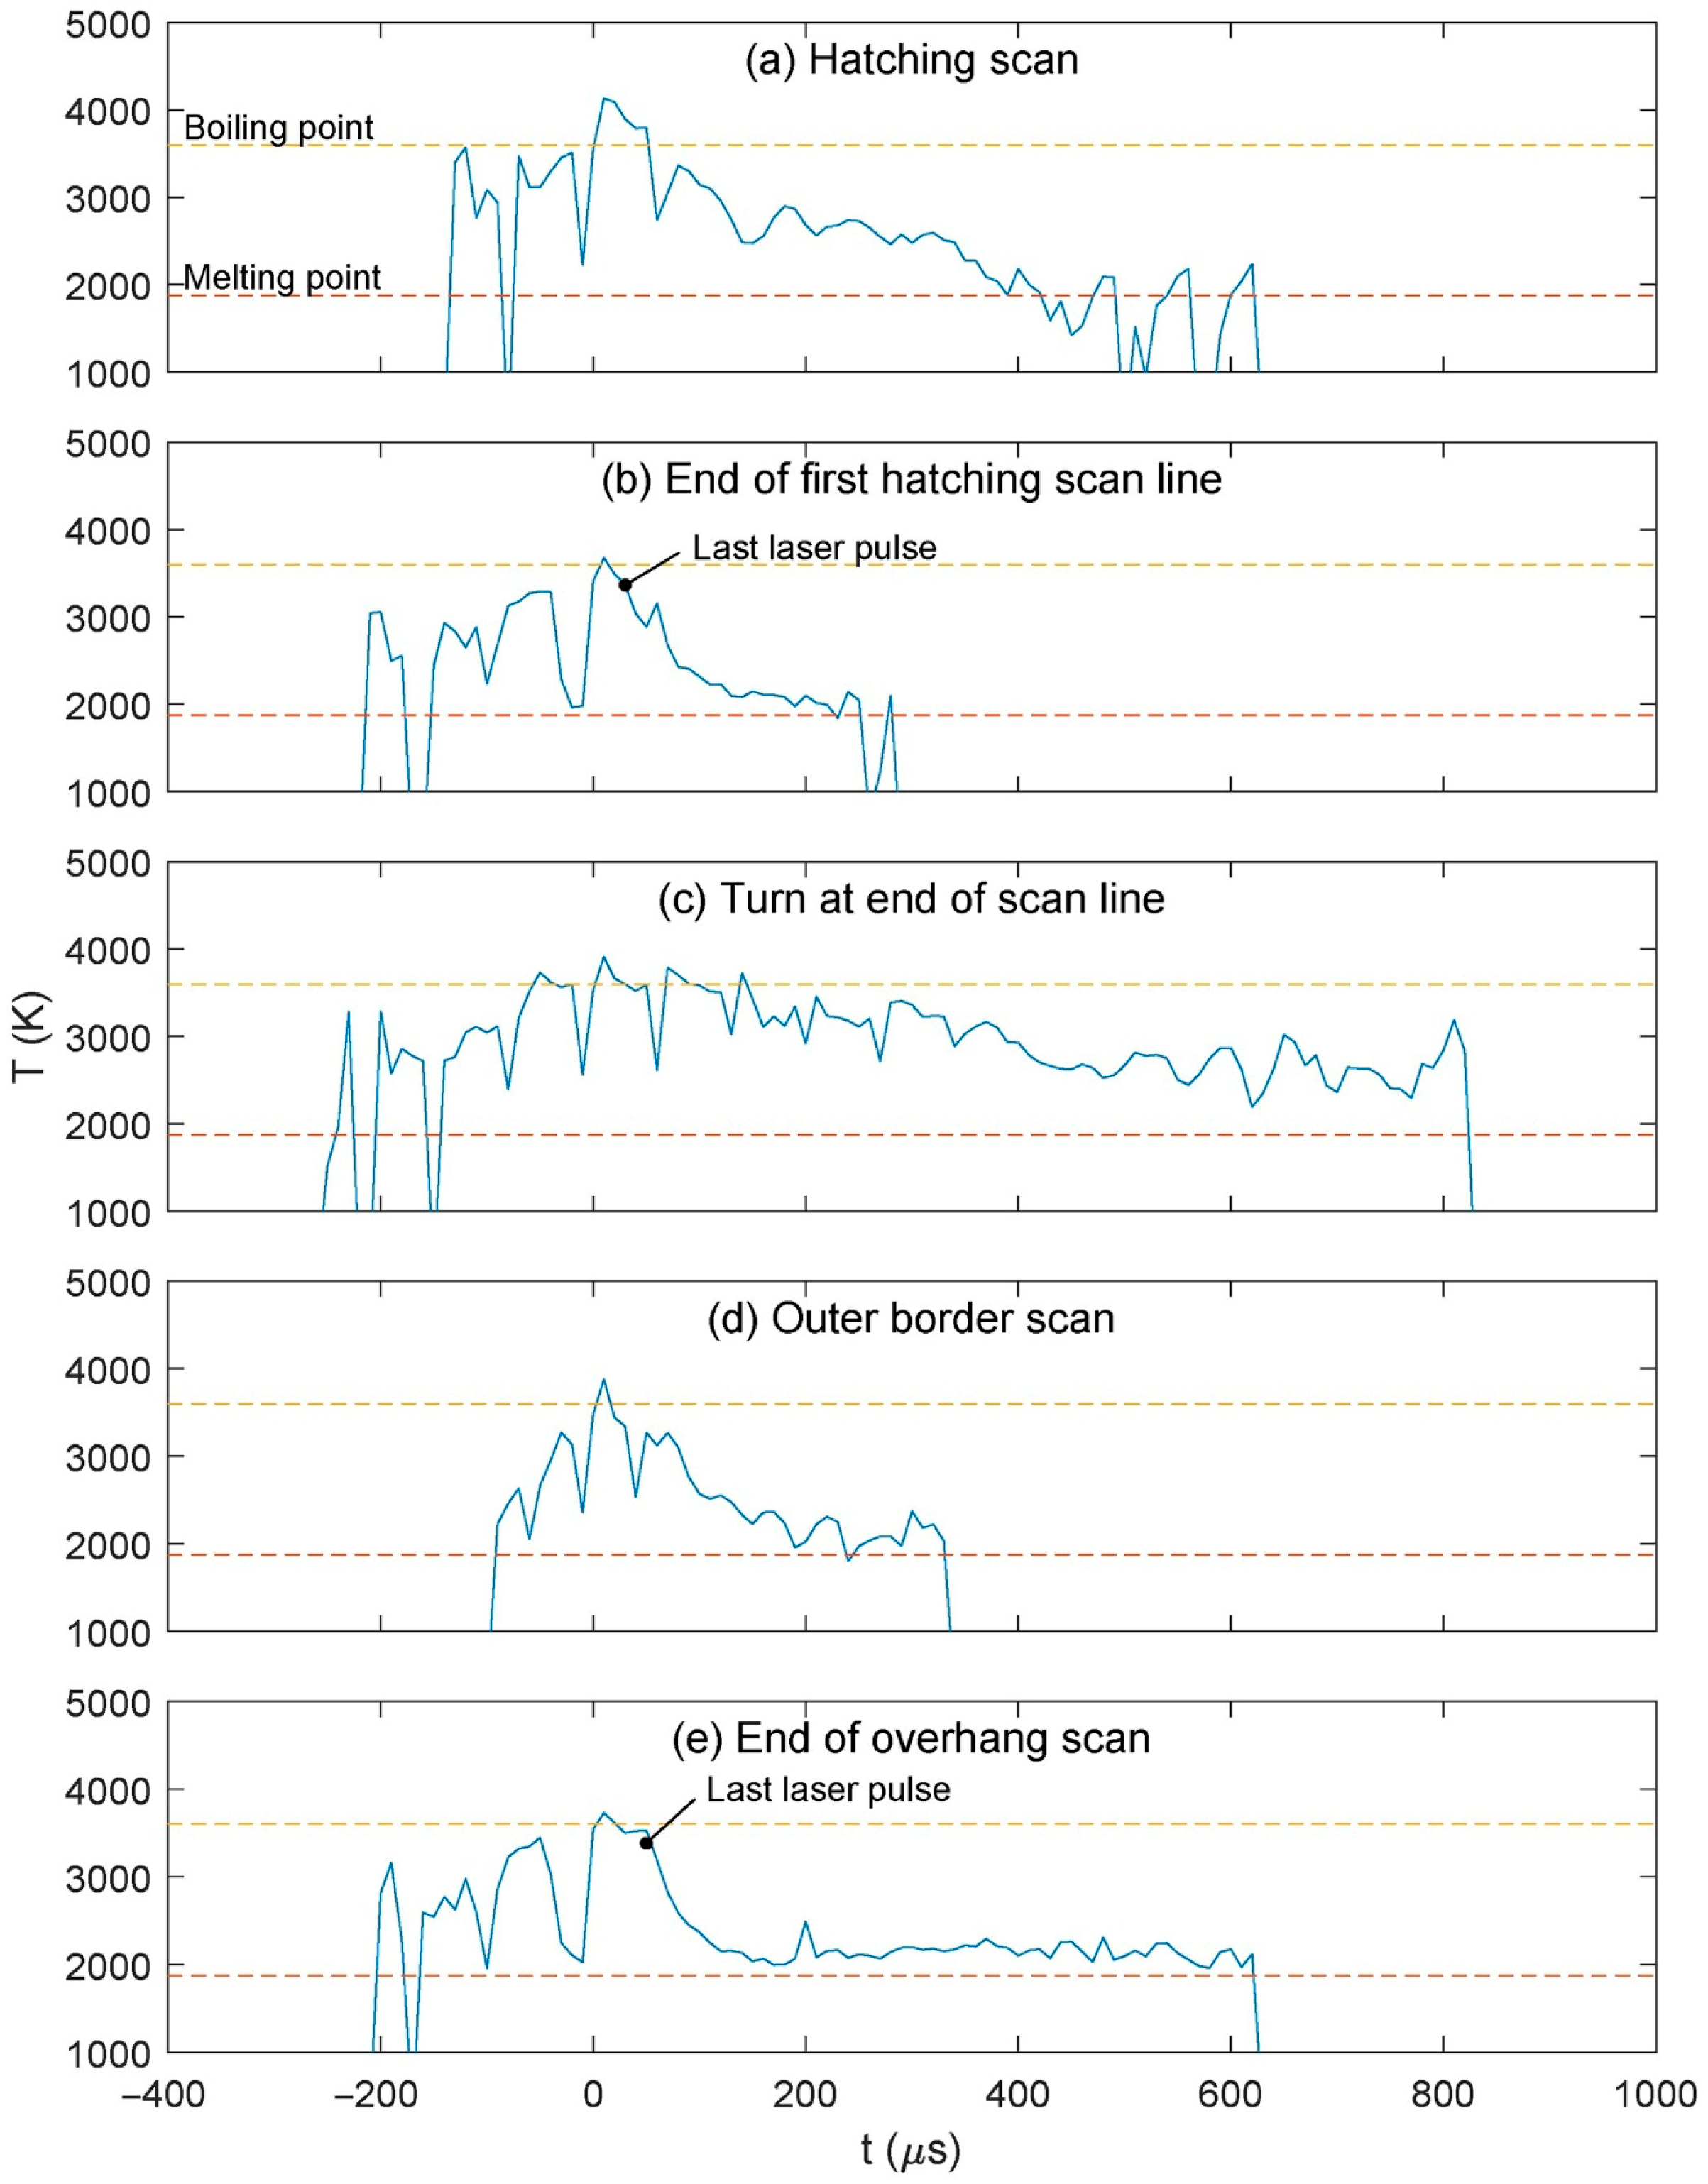
The part tested had an overhanging feature and a notch in the top surface, and a melt-pool temperature value of ~2000 K was inferred, very close to the melting temperature of the material, Ti6Al4V. Events like the start/end of the irradiation and turning during hatching were shown to make the melt pool more volatile, the temperature rising occasionally above 4000 K, i.e., superior to the boiling point of the material (Figure 4).
Vallabh et al. [47] used a simplified setup to measure the temperature with a single camera (NOVA S12, Photron, Tokyo, Japan, with a pixel resolution of 128 × 48 pixels) while directing the signal towards two optical arms equipped with filters for 550 (λ1) and 620 nm (λ2), respectively [47]. Limitations were met due to the built-in beam splitter system of the PBF-LB commercial machine, which cut the wavelengths in excess of 750 nm and limited temperature assessment according to Wien’s approximation to values inferior to 1000K. The accuracy of the melt-pool temperature assessment was checked against thermocouple calibrations and was found in all cases to be above 90%, with a repeatability higher than 95%.
The calibration procedure in the method consisted of characterizing the two-wavelength optical transmission ratio A12 with a broadband light source and spectrometer, followed by thermocouple-based validation using embedded Type C thermocouples. The calibrated transmission ratio was reported as A 12 = 1.601 ± 0.0163, and the subsequent thermocouple comparison showed relative differences of 12.08 ± 2.77% and 2.29 ± 1.50% for two scan patterns. The main sources of error identified in the paper are the assumption of nearly equal emissivities at the two wavelengths, uncertainty in optical-path transmission, image-registration and transformation errors between the two spectral images, camera-related intensity uncertainty, and the limitations of subsurface thermocouple validation. In addition, plume/vapor obstruction and surface-condition changes during PBF-LB can perturb the recorded intensities and thereby influence the inferred temperature field.
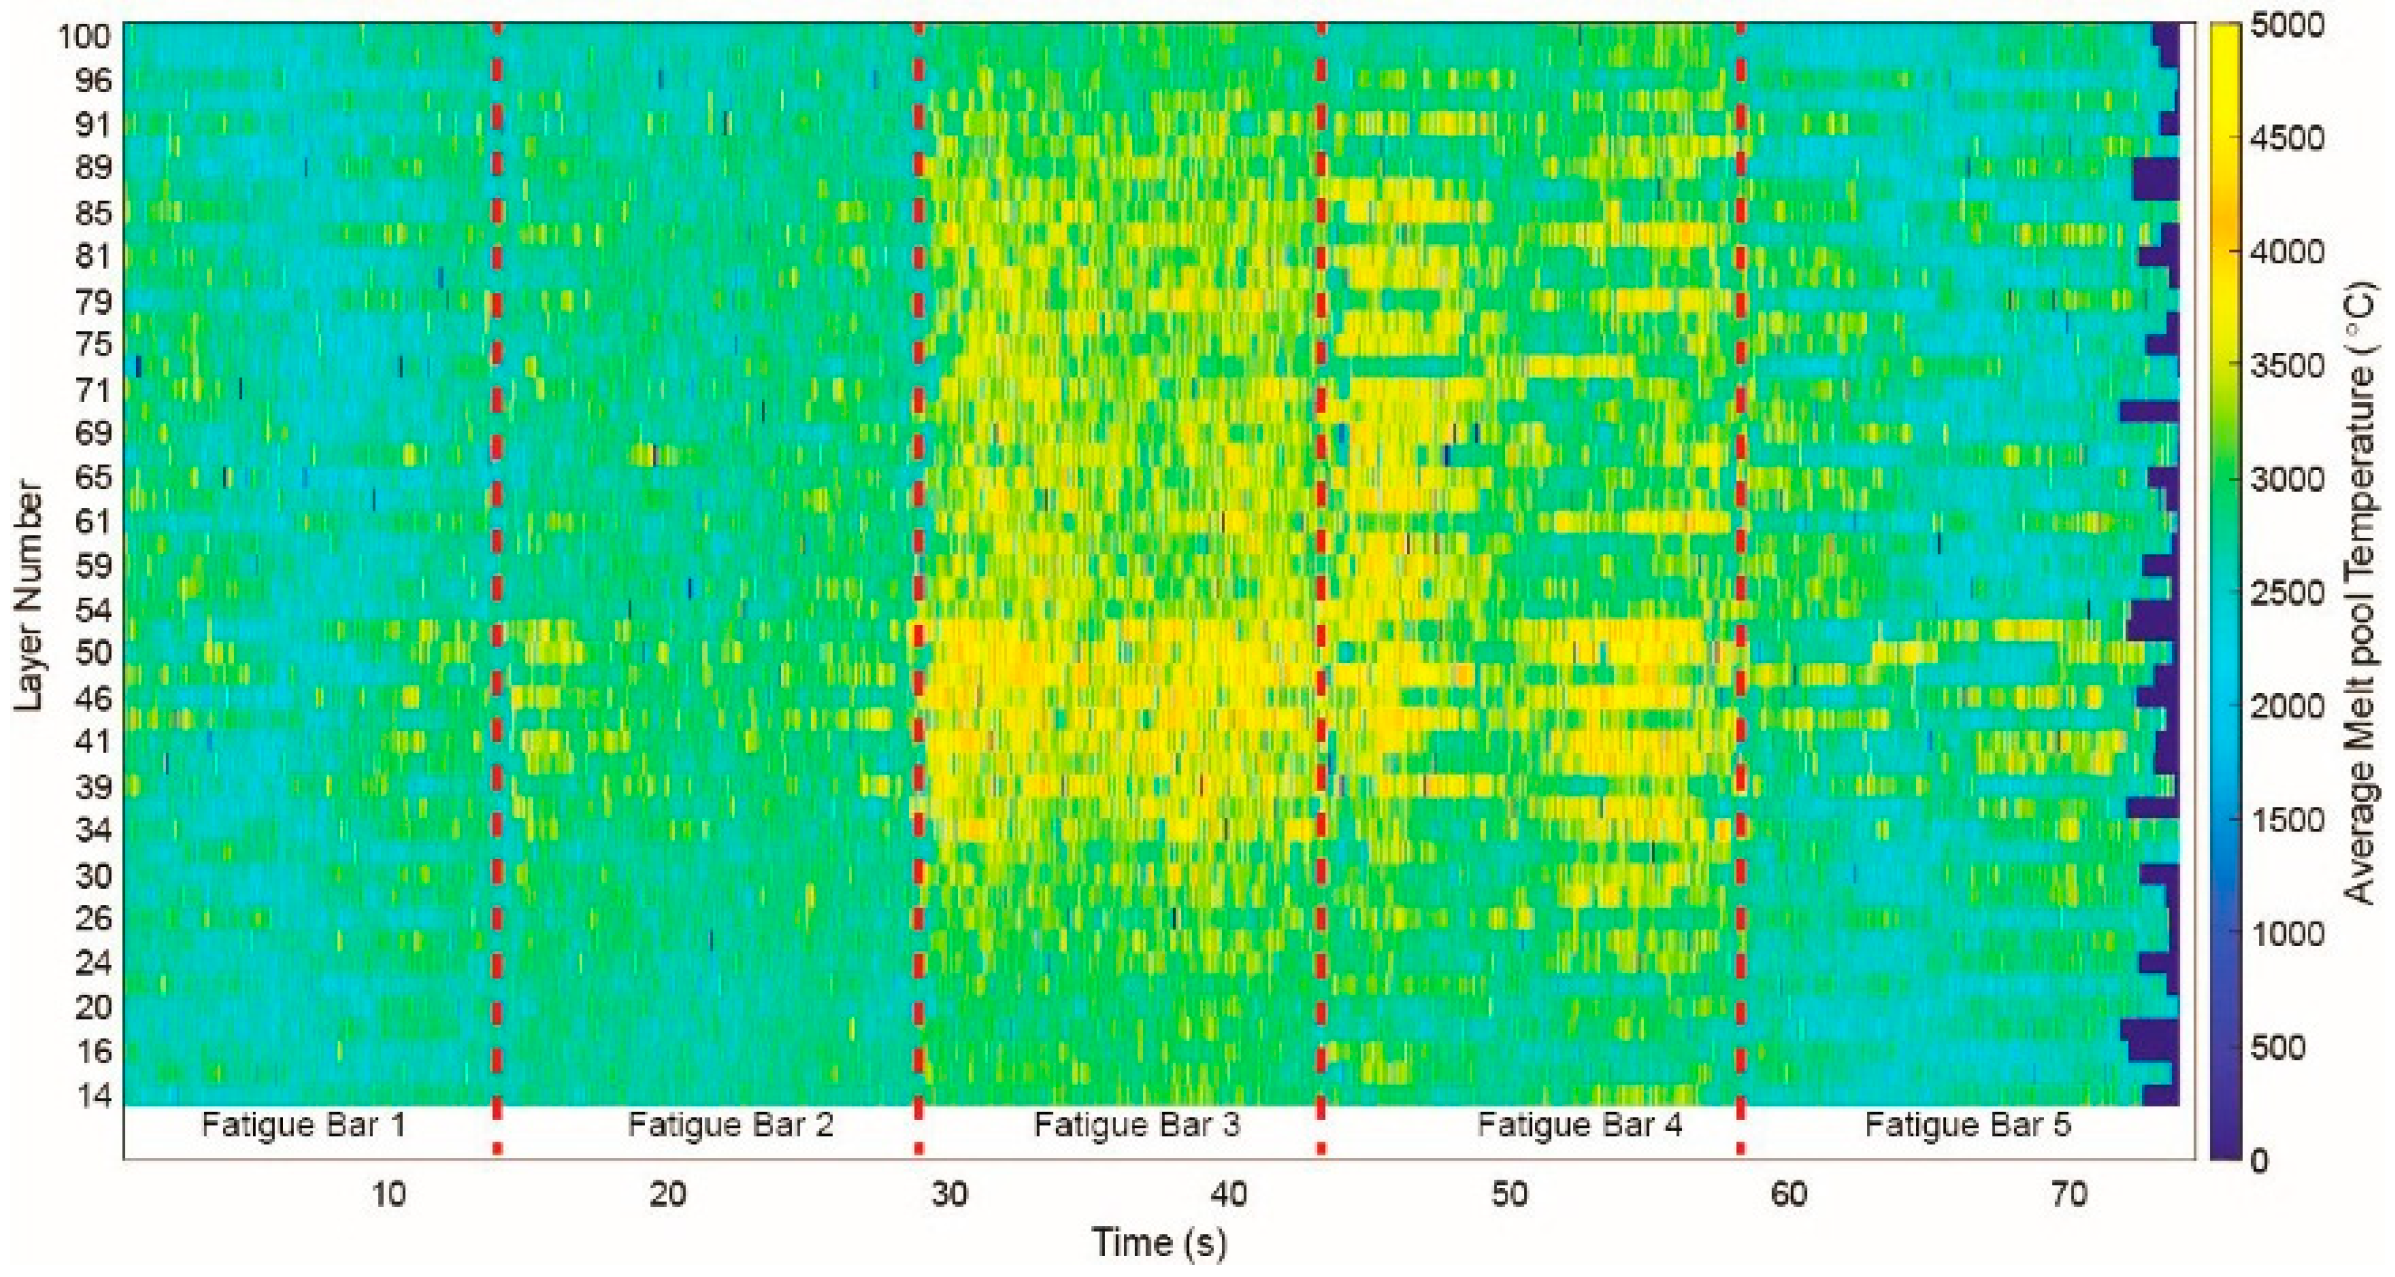
In-printed fatigue bars in Inconel 718 were used to validate the temperature monitoring setup. The print comprised a total of 100 layers with a nominal print layer height of 40 μm, out of which 53 layers were monitored by high-speed imaging, with a duration of ~74 s at a rate of 30,000 fps. The average melt-pool temperature variation between printed samples (Figure 5) was due to the fatigue bars’ positioning on the substrate: Fatigue Bar 1 stayed the closest to the bottom end of the build plate (closer to the machine door) and Fatigue Bar 5 was at the top end of the build plate, with heat accumulating in the central part of the substrate.
H. Ma et al. [44] developed a coaxial melt-pool temperature measurement system based on dual-wavelength (two-color) pyrometry with a single high-speed camera in PBF-LB during the processing of 316L stainless steel. Validation experiments conducted by a high-temperature blackbody furnace and a standard photoelectric pyrometer showed that the temperature measuring errors of the proposed procedure were less than 1%. The FASTCAM NOVA S12 camera (Tokyo, Japan,) acquired melt-pool images at frame rates between 3000 and 5000. The melt-pool characteristics, including the temperature distribution, profile, gradient, and cooling rate, were measured. The single-line printing results of different parameters showed that the higher the linear energy density, the larger the average temperature and peak temperature of the melt-pool. The operation parameters could be further optimized, using this setup, with a view to minimizing the fluctuation of the melt pool temperature for the engineering of high-quality parts.
Md. J. Alam et al. [48] studied the melt-pool temperature profile in PBF-LB using single-camera two-wavelength imaging pyrometry, confirming that precise optical alignment and a camera with high spectral sensitivity are required to get reliable, high-precision results. An original method, defined as blob analysis-based melt-pool guided image transformation (BMPIT), not affected by the image size, melt-pool position, and surrounding noise, was introduced to get an improved processing of the spatially and temporally resolved melt-pool temperature and geometrical profiles. Remarkably, the shift/error between the actual lamp temperature and the value measured by the BMPIT single-camera two-wavelength imaging pyrometry system was less than 4%. The temperature estimated by BMPIT was also verified against calibrated tungsten filament strip lamp data and thermocouples fixed on an irradiated Inconel plate, and an error of 5% was inferred.
Three-Color (Wavelengths) Pyrometry
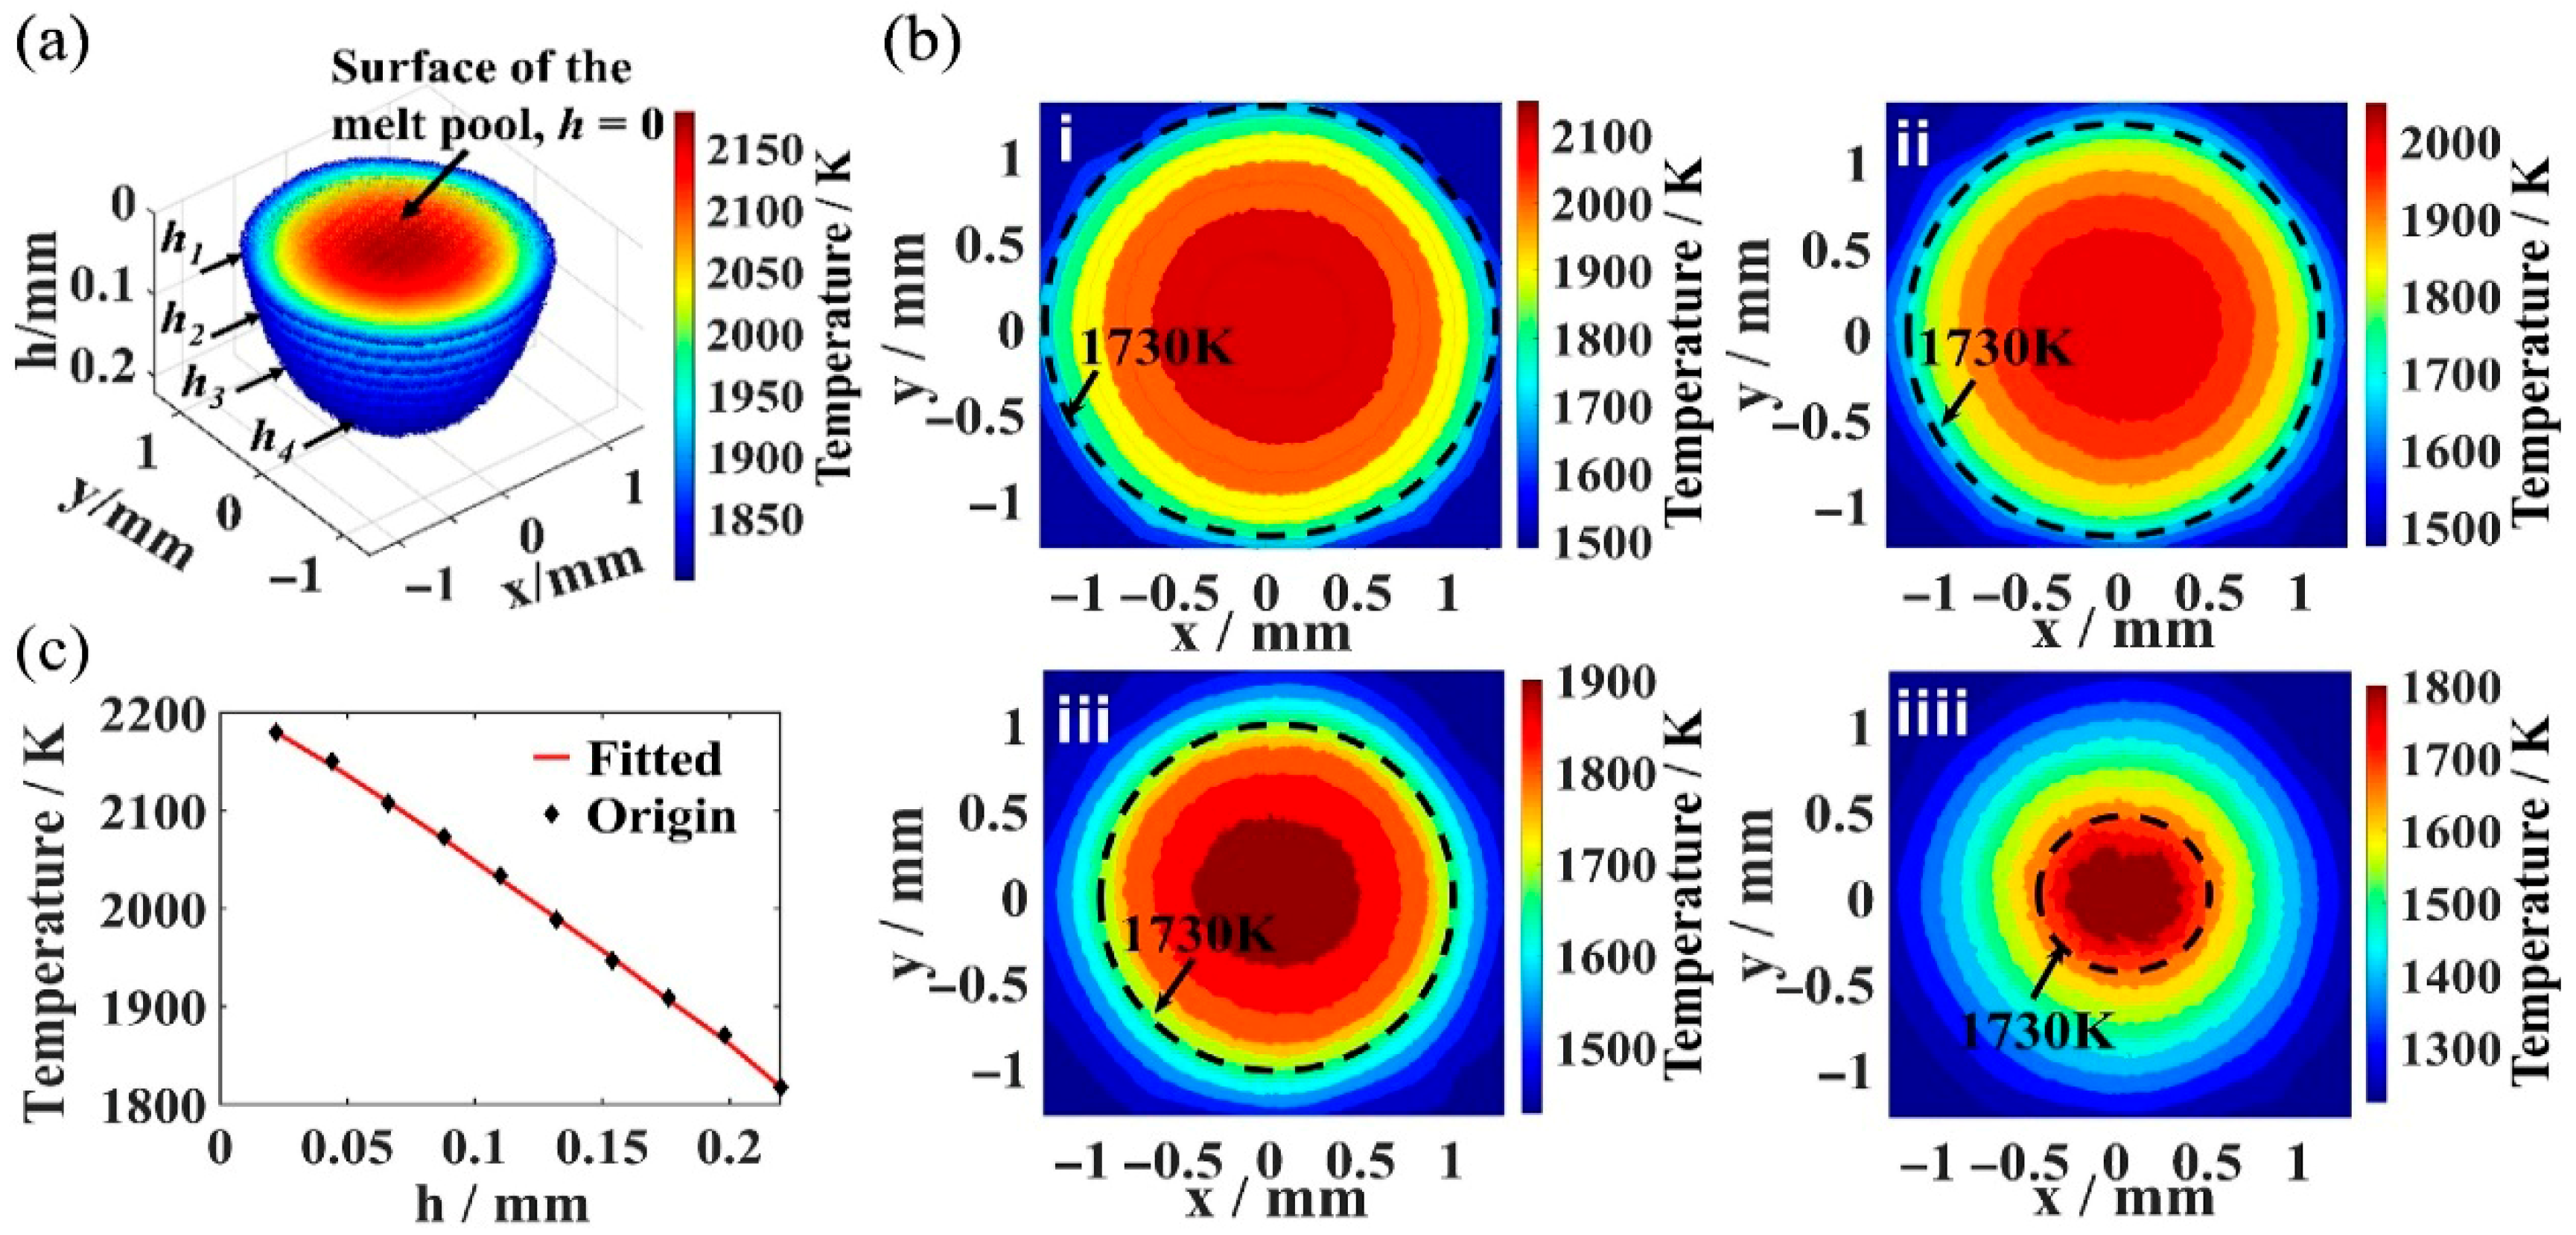
N. Wang et al. [49] proposed a setup resorting to an orthogonal two-channel 3D temperature field for the monitoring of the melt pool during PBF-LB, allowing for 3D temperature assessment based on orthogonal dual-channel single-camera spectral imaging. In this study, the two perpendicular angles refer to two mutually orthogonal observation directions used to image the melt pool. Two cameras were employed, with optical axes perpendicular to each other, while each axis was oriented at 45° to the incident laser beam. They carried out imaging at three wavelengths, λ1 = 440 nm, λ2 = 540 nm, and λ3 = 620 nm, respectively, instead of the regular two. The 3D temperature field distribution of the melt pool was obtained by superposing projected radiation images obtained via two perpendicular angles (Figure 6). The considered intensities were, in this case, the projections of the radiation field on the CCD, while the 3D reconstruction of the spectral radiation field was inferred by an algebraic reconstruction technique (ART) [50]. The use of a single monochromatic camera for spectral imaging at three wavelengths ensured spatial and temporal consistency during measurements. To check the validity of the applied method, the 3D temperature field was measured in a melt pool of 304 stainless steel irradiated by a CW laser with a Gaussian laser-beam distribution for different irradiation times. The results showed that the temperature field exhibited an axisymmetric depth distribution on each cross-section. Thus, along with the depth increase, the high-temperature (>1730 K) distribution area gradually diminished, and the temperature of each cross-section decreased (Figure 6a). The maximum temperature, depth, width, and depth-to-width ratio of the melt pool at different times corresponded to the measured 3D temperature distributions (Figure 6b). For an irradiation time of up to 80 s, the maximum temperature of the melt pool crosses three stages: rapid increase (20–2230 K), slow increase (2230–2280 K), and final stabilization (Figure 6c). The growth of the width and depth of the melt pool presented a similar evolution: increasing rapidly at first and gradually slowing down. Correspondingly, the depth-to-width ratio decreased rapidly at first and then gradually stabilized thereafter.
N. Wang et al. [49] did not report a formal external calibration procedure. The method was effectively calibrated through optical-path balancing and synchronization of the multispectral imaging system. In particular, a single CCD was used to improve temporal and spatial consistency across the three wavelength channels, while mirrors and attenuators were employed to match optical path lengths and balance channel intensities. The main possible sources of error are therefore expected to arise from the limited-angle 3D reconstruction based on only two orthogonal views, residual inter-channel optical mismatch, assumptions introduced in the emissivity-constrained optimization algorithm, and the complex non-stationary behavior of the melt pool itself, including anisotropy and convection. In addition, because the study was presented as a feasibility demonstration without external temperature validation, the absolute uncertainty of the reconstructed temperature field was not fully quantified.
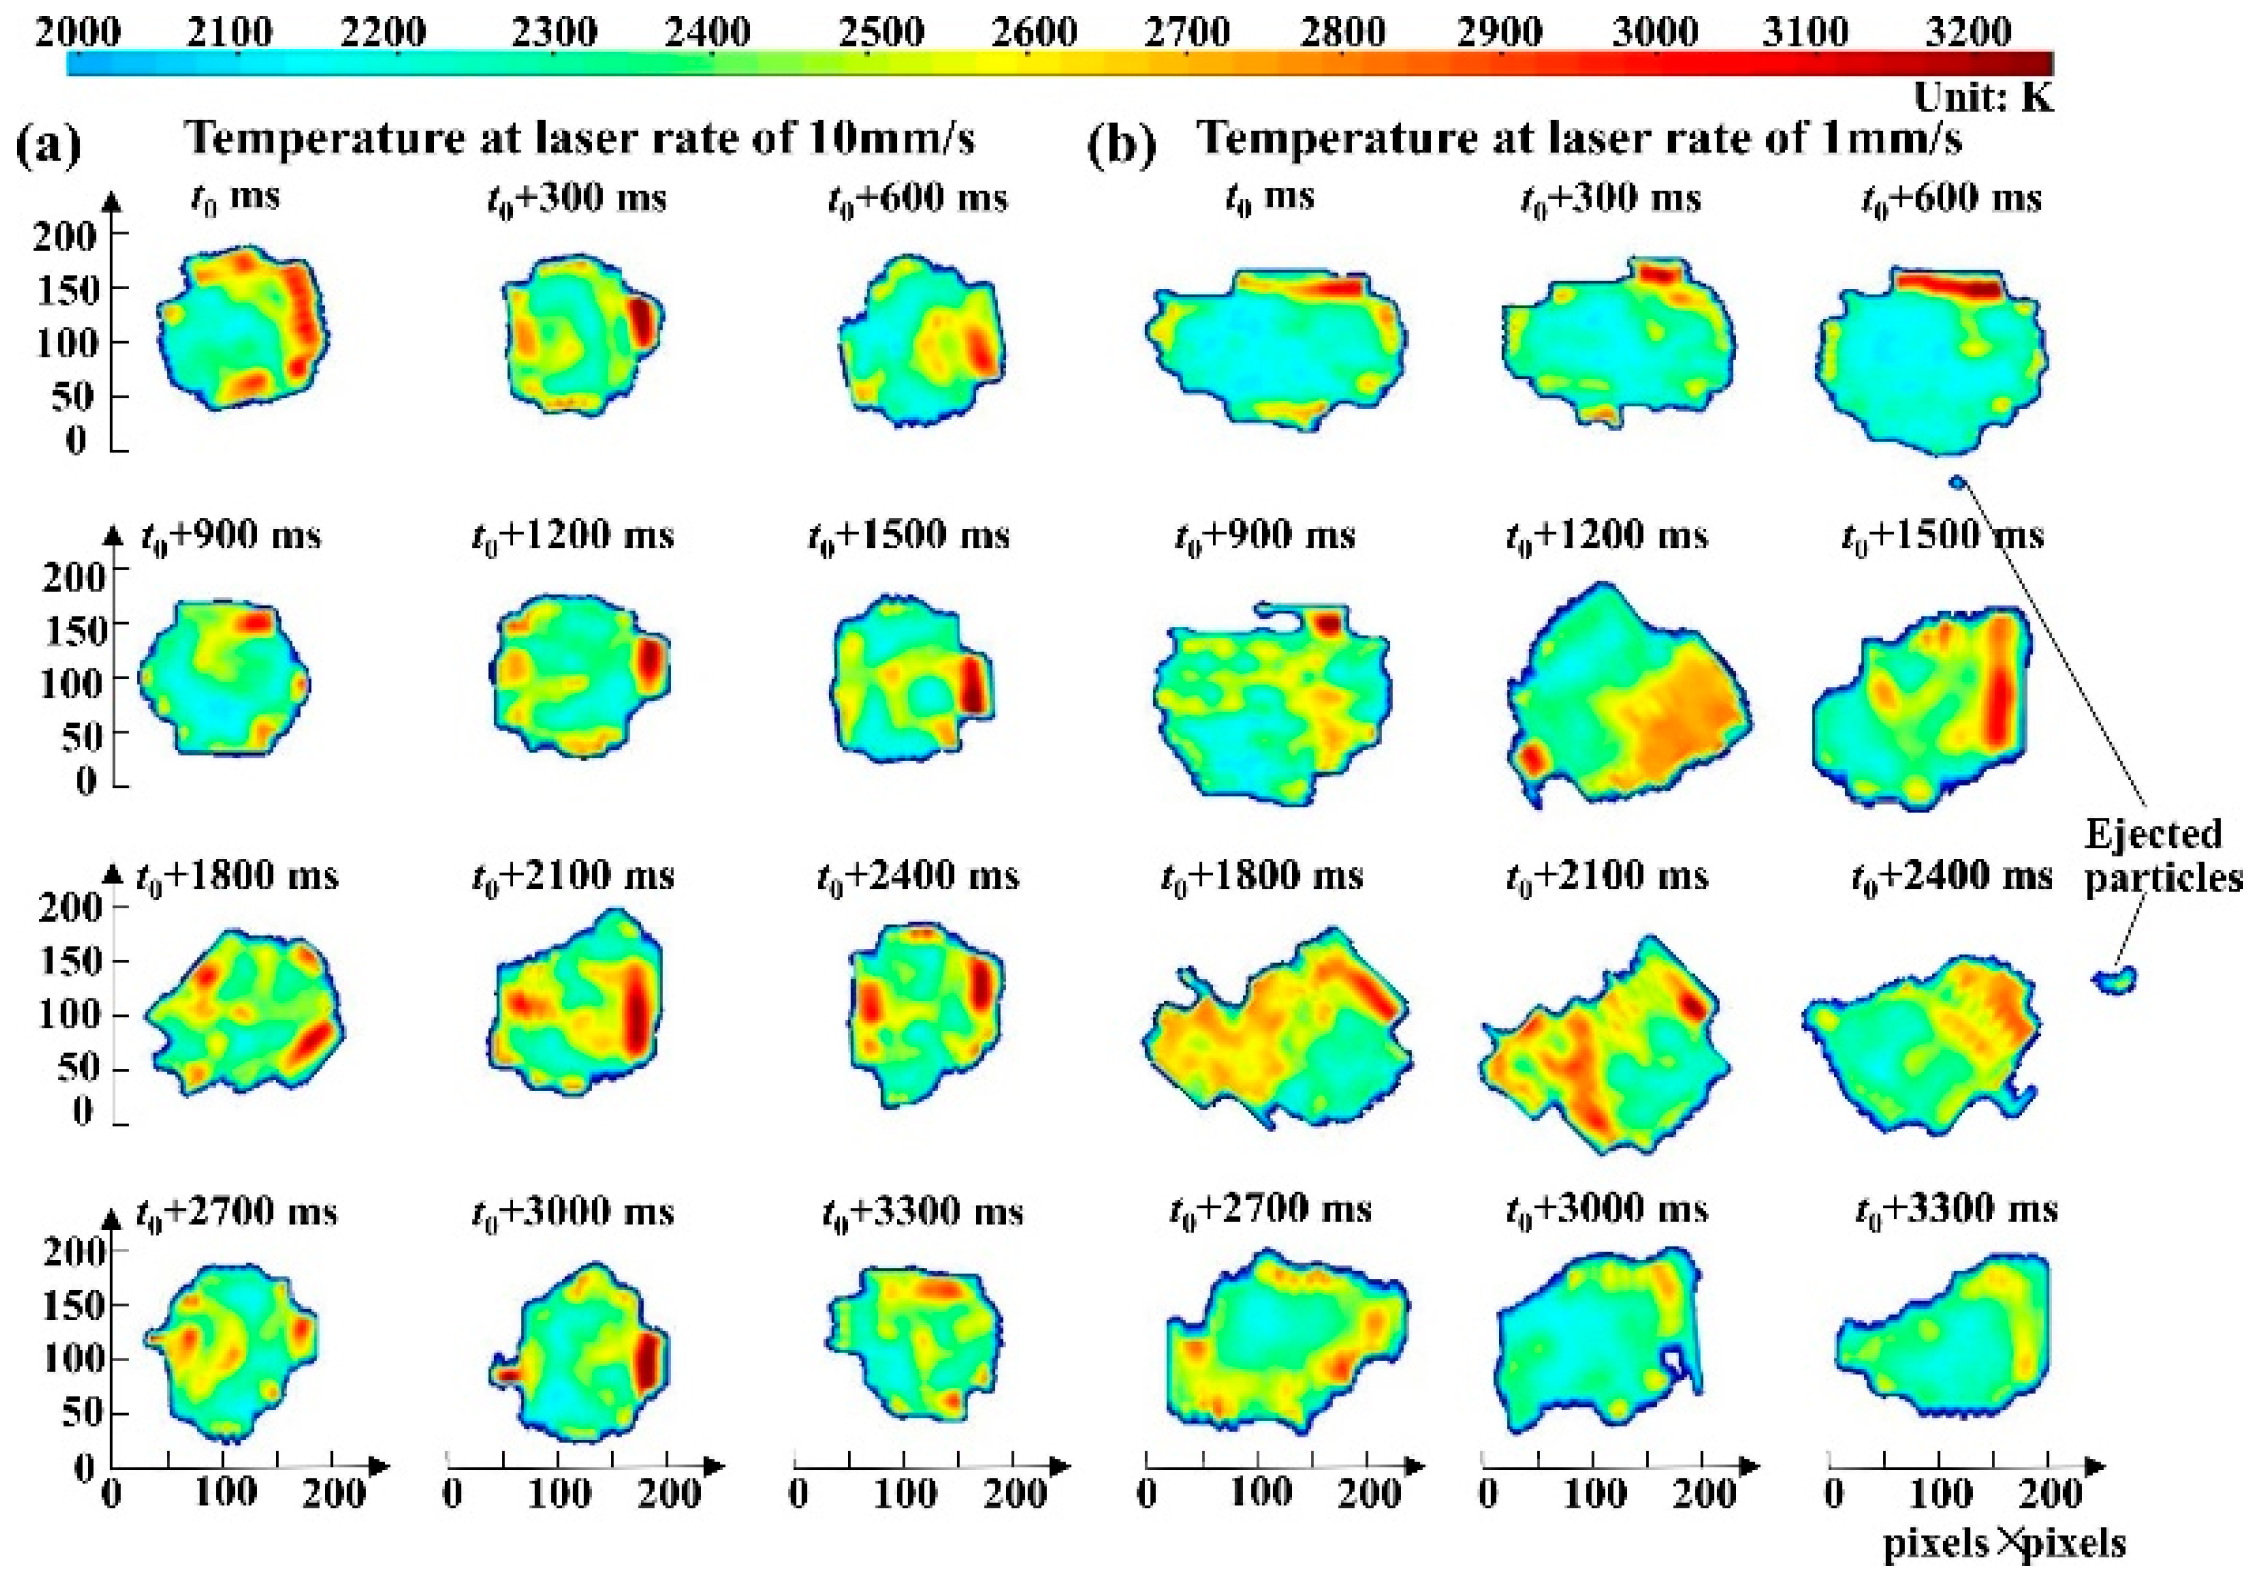
X. Li et al. [51] proposed a multi-eye investigation method using a light field camera for in situ melt-pool temperature field monitoring, undertaking the complex problem of studying the melt pool of Ti6Al4V. Melt-pool images at red, green, and blue (R, G, and B) wavelengths were extracted. The melt pool’s temperature field was derived based on dual-wavelength theory from two images at the R, G, and B channels. A neutral density filter operating in the 0.1–0.9 optical density range was placed between the LF camera and the blackbody furnace to reduce light intensity and prevent overexposure at high temperatures, ensuring accurate calibration. A single calibration only is required with this method, which reduces the challenges of multiple imaging alignment and extensive spatial correction. Experiments were conducted on high-entropy alloy and Ti6Al4V alloys manufactured by both DED-LB and PBF-LB equipment, while the evolution of length, width, and maximum temperature was analyzed. The temperature field error for a central 30  ×  30 pixel area was found to be less than 3 %, with contour errors below 1.4%. The coaxial system was designed for in situ temperature monitoring on PBF-LB equipment, revealing temperature ranges of 2000 K to 3210 K in the case of Ti6Al4V alloy for a laser power of 1800 W, scanning speeds of 10 mm/s and 1 mm/s, and a spot diameter of 2 mm (Figure 7).
Figure 7b shows the melt-pool temperature distribution of the Ti6Al4V alloy at a laser power of 1800 W, a scanning speed of 1 mm/s, and a spot diameter of 2 mm, with a temperature range similar to that in Figure 7a. In Figure 7a, the Ti6Al4V melt pool exhibits an irregular temperature distribution from time t 0 , with temperatures ranging from 2100 up to 3215 K.
Comparing the temperature contours of the melt-pool at different laser scanning rates (Figure 7a versus b) showed that lower scanning rates resulted in larger melt-pool contours. This was due to the proportional relationship between the laser’s dwell time at a position and the heat-affected area: longer dwell times caused by lower laser speeds resulted in larger heat-affected areas and, subsequently, a larger melt pool contour.

3.1.3. Melt-Pool Spatial Distribution: Profile, Signature, and Aspect Ratio

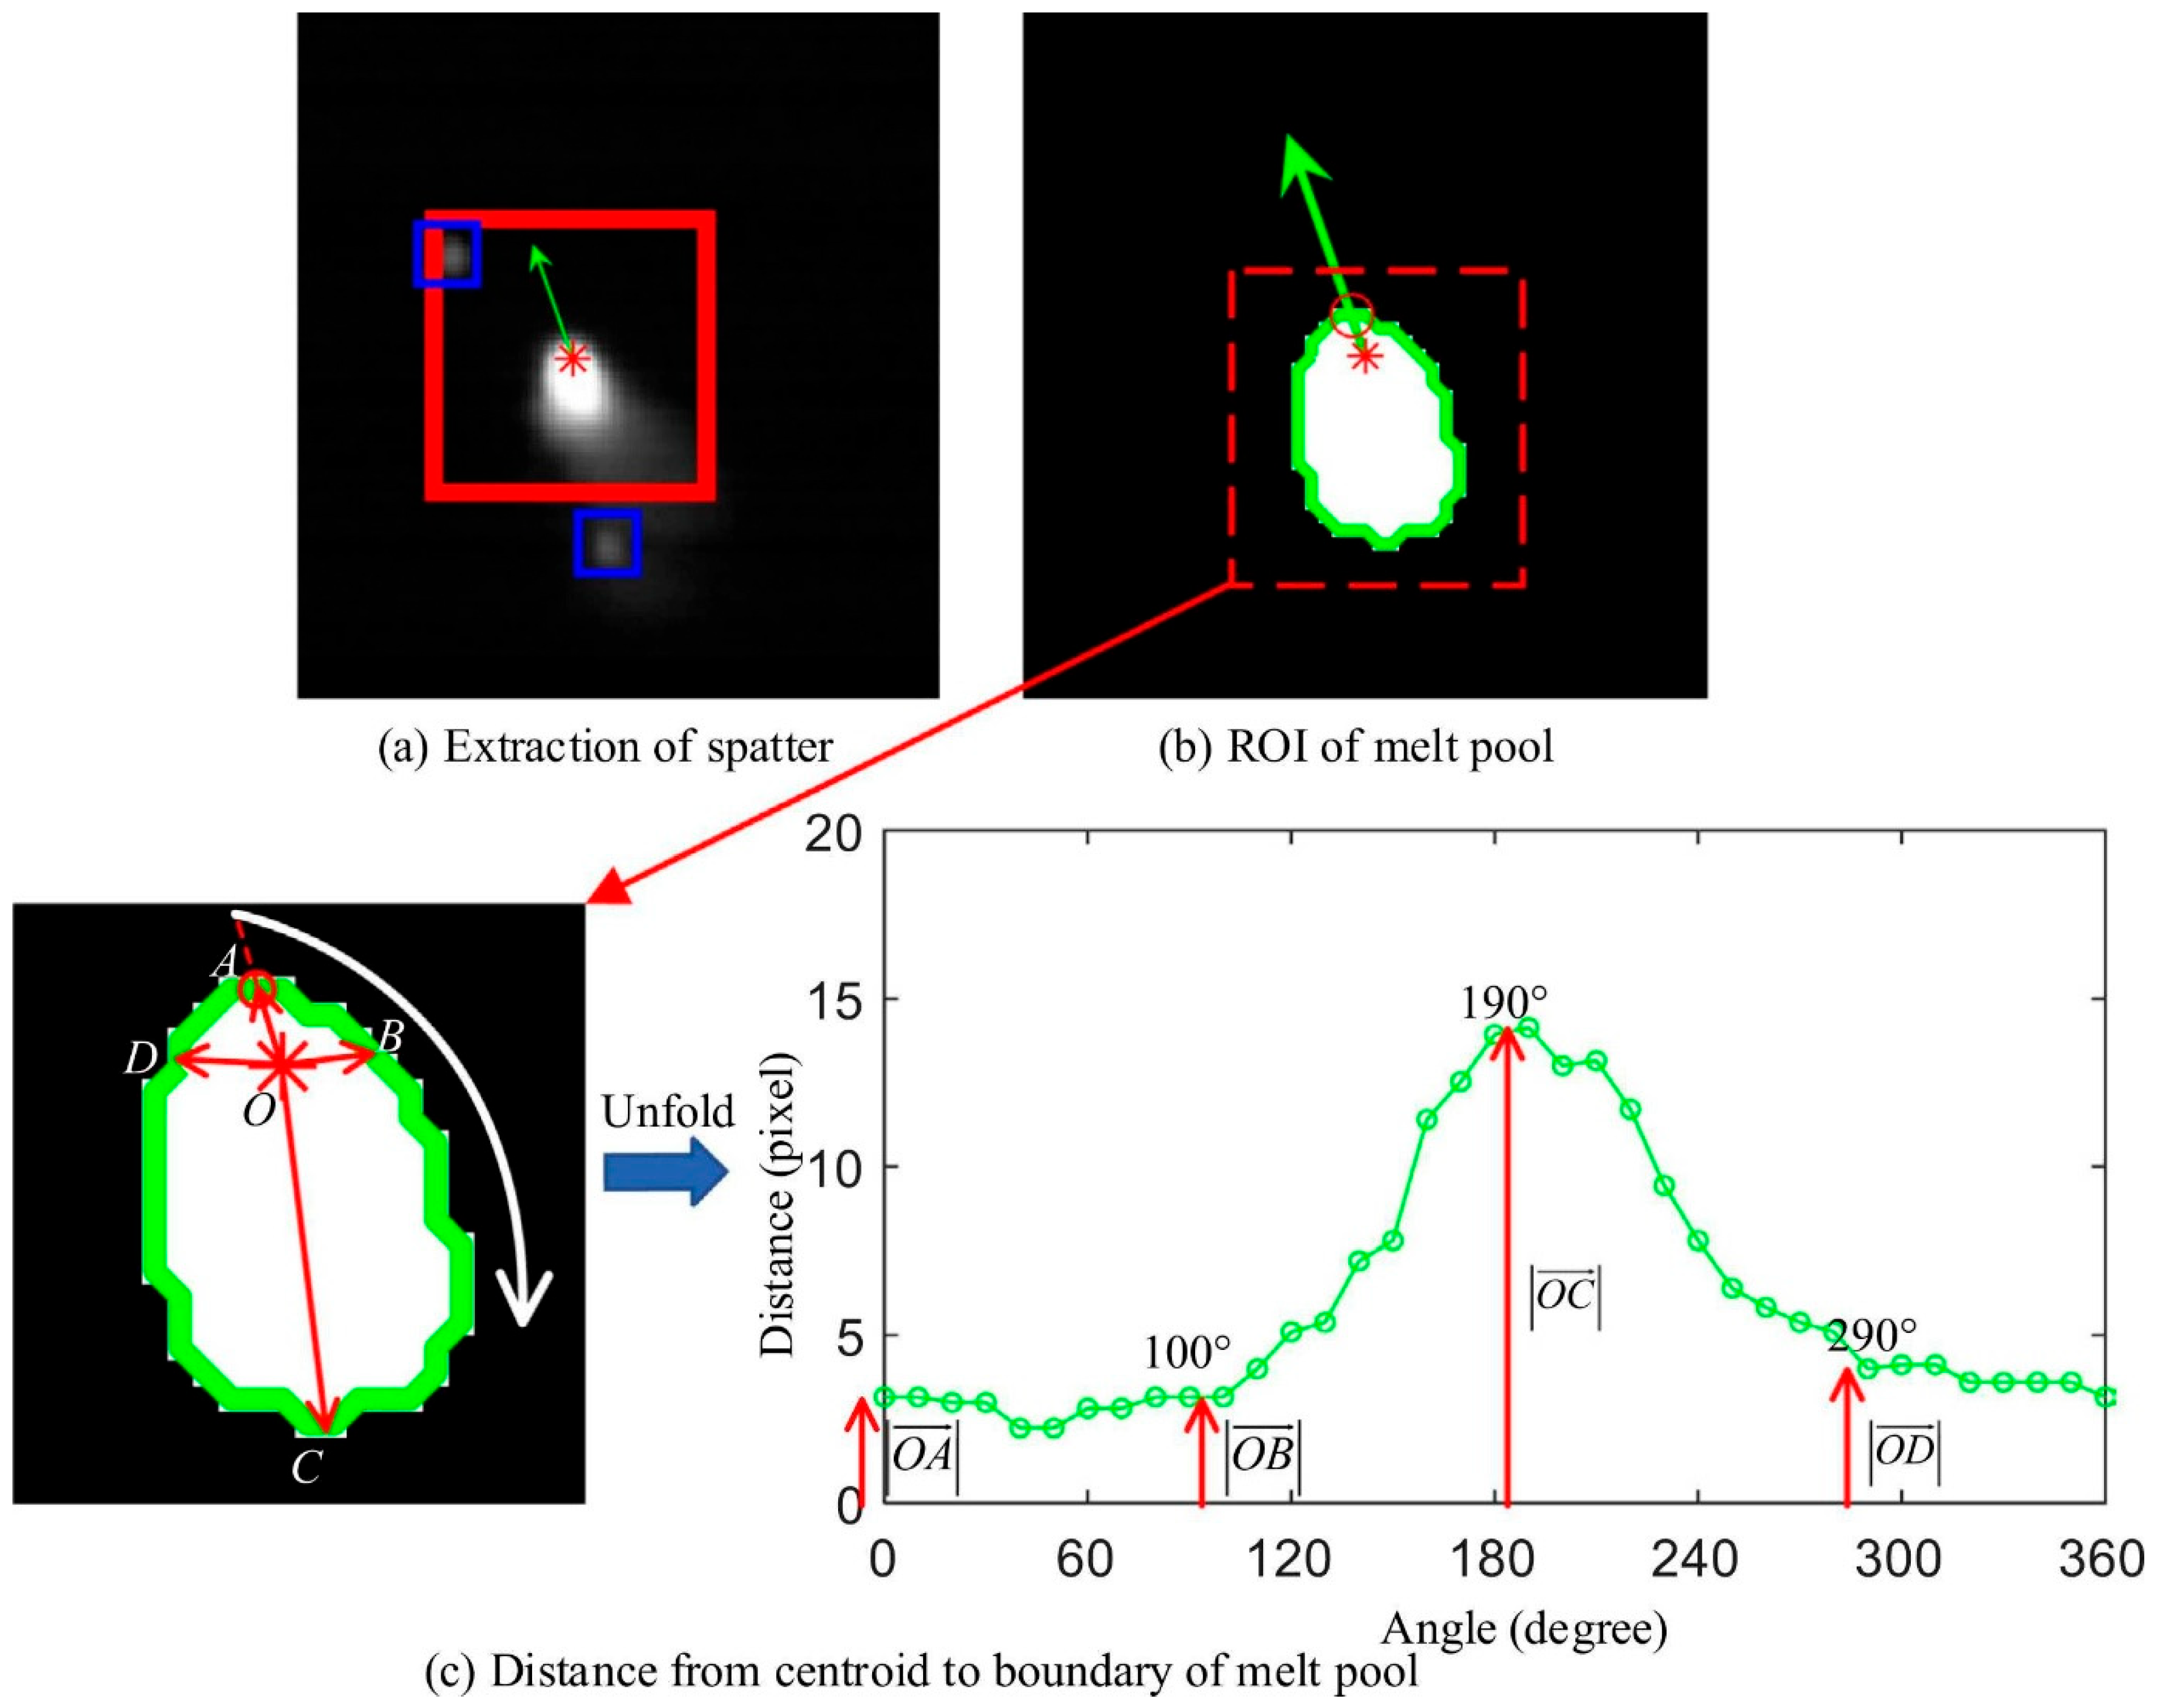
X. Lin et al. [52] studied the spatial dynamic variations in a melt-pool from a wrought nickel alloy 625 (IN625) using a coaxial monitoring setup. It consisted of a galvo mirror system, a beam splitter, an 850 nm bandpass filter, and a high-speed camera model EoSenS 3CL (Mikrotron, Unterschleißheim, Germany) operated with a sampling frequency of 2 kHz. The recorded images were selected using a three-scale binarization threshold system, as large, medium, and small, and the melt pool and the spatter could thus be extracted based on the connected component analysis method. The influence of spatter was efficiently reduced, and the extraction of melt-pool features was further improved. The boundary of the melt pool was tracked via the method of the 8-connected neighbors. Intersection points between the moving direction line of the melt pool and the boundary were next set as the starting point. The distance between the centroid and boundary of the melt pool could be calculated from the unfolded clockwise boundary at a step angle, and a 36-dimensional feature vector was found convenient to describe the motion defects of the melt pool (Figure 8).
This study does not include a formal external calibration procedure. The method is effectively calibrated through an experimentally determined coordinate transformation, empirically selected image thresholds, and fixed geometric settings for ROI and contour unfolding. The main sources of error are therefore expected to arise from threshold sensitivity in melt-pool/spatter segmentation, inaccuracies in determining the melt-pool moving direction, plume- and spatter-induced optical interference, limited spatial and temporal resolution, and the absence of independent ground-truth validation for the clustered melt-pool states.
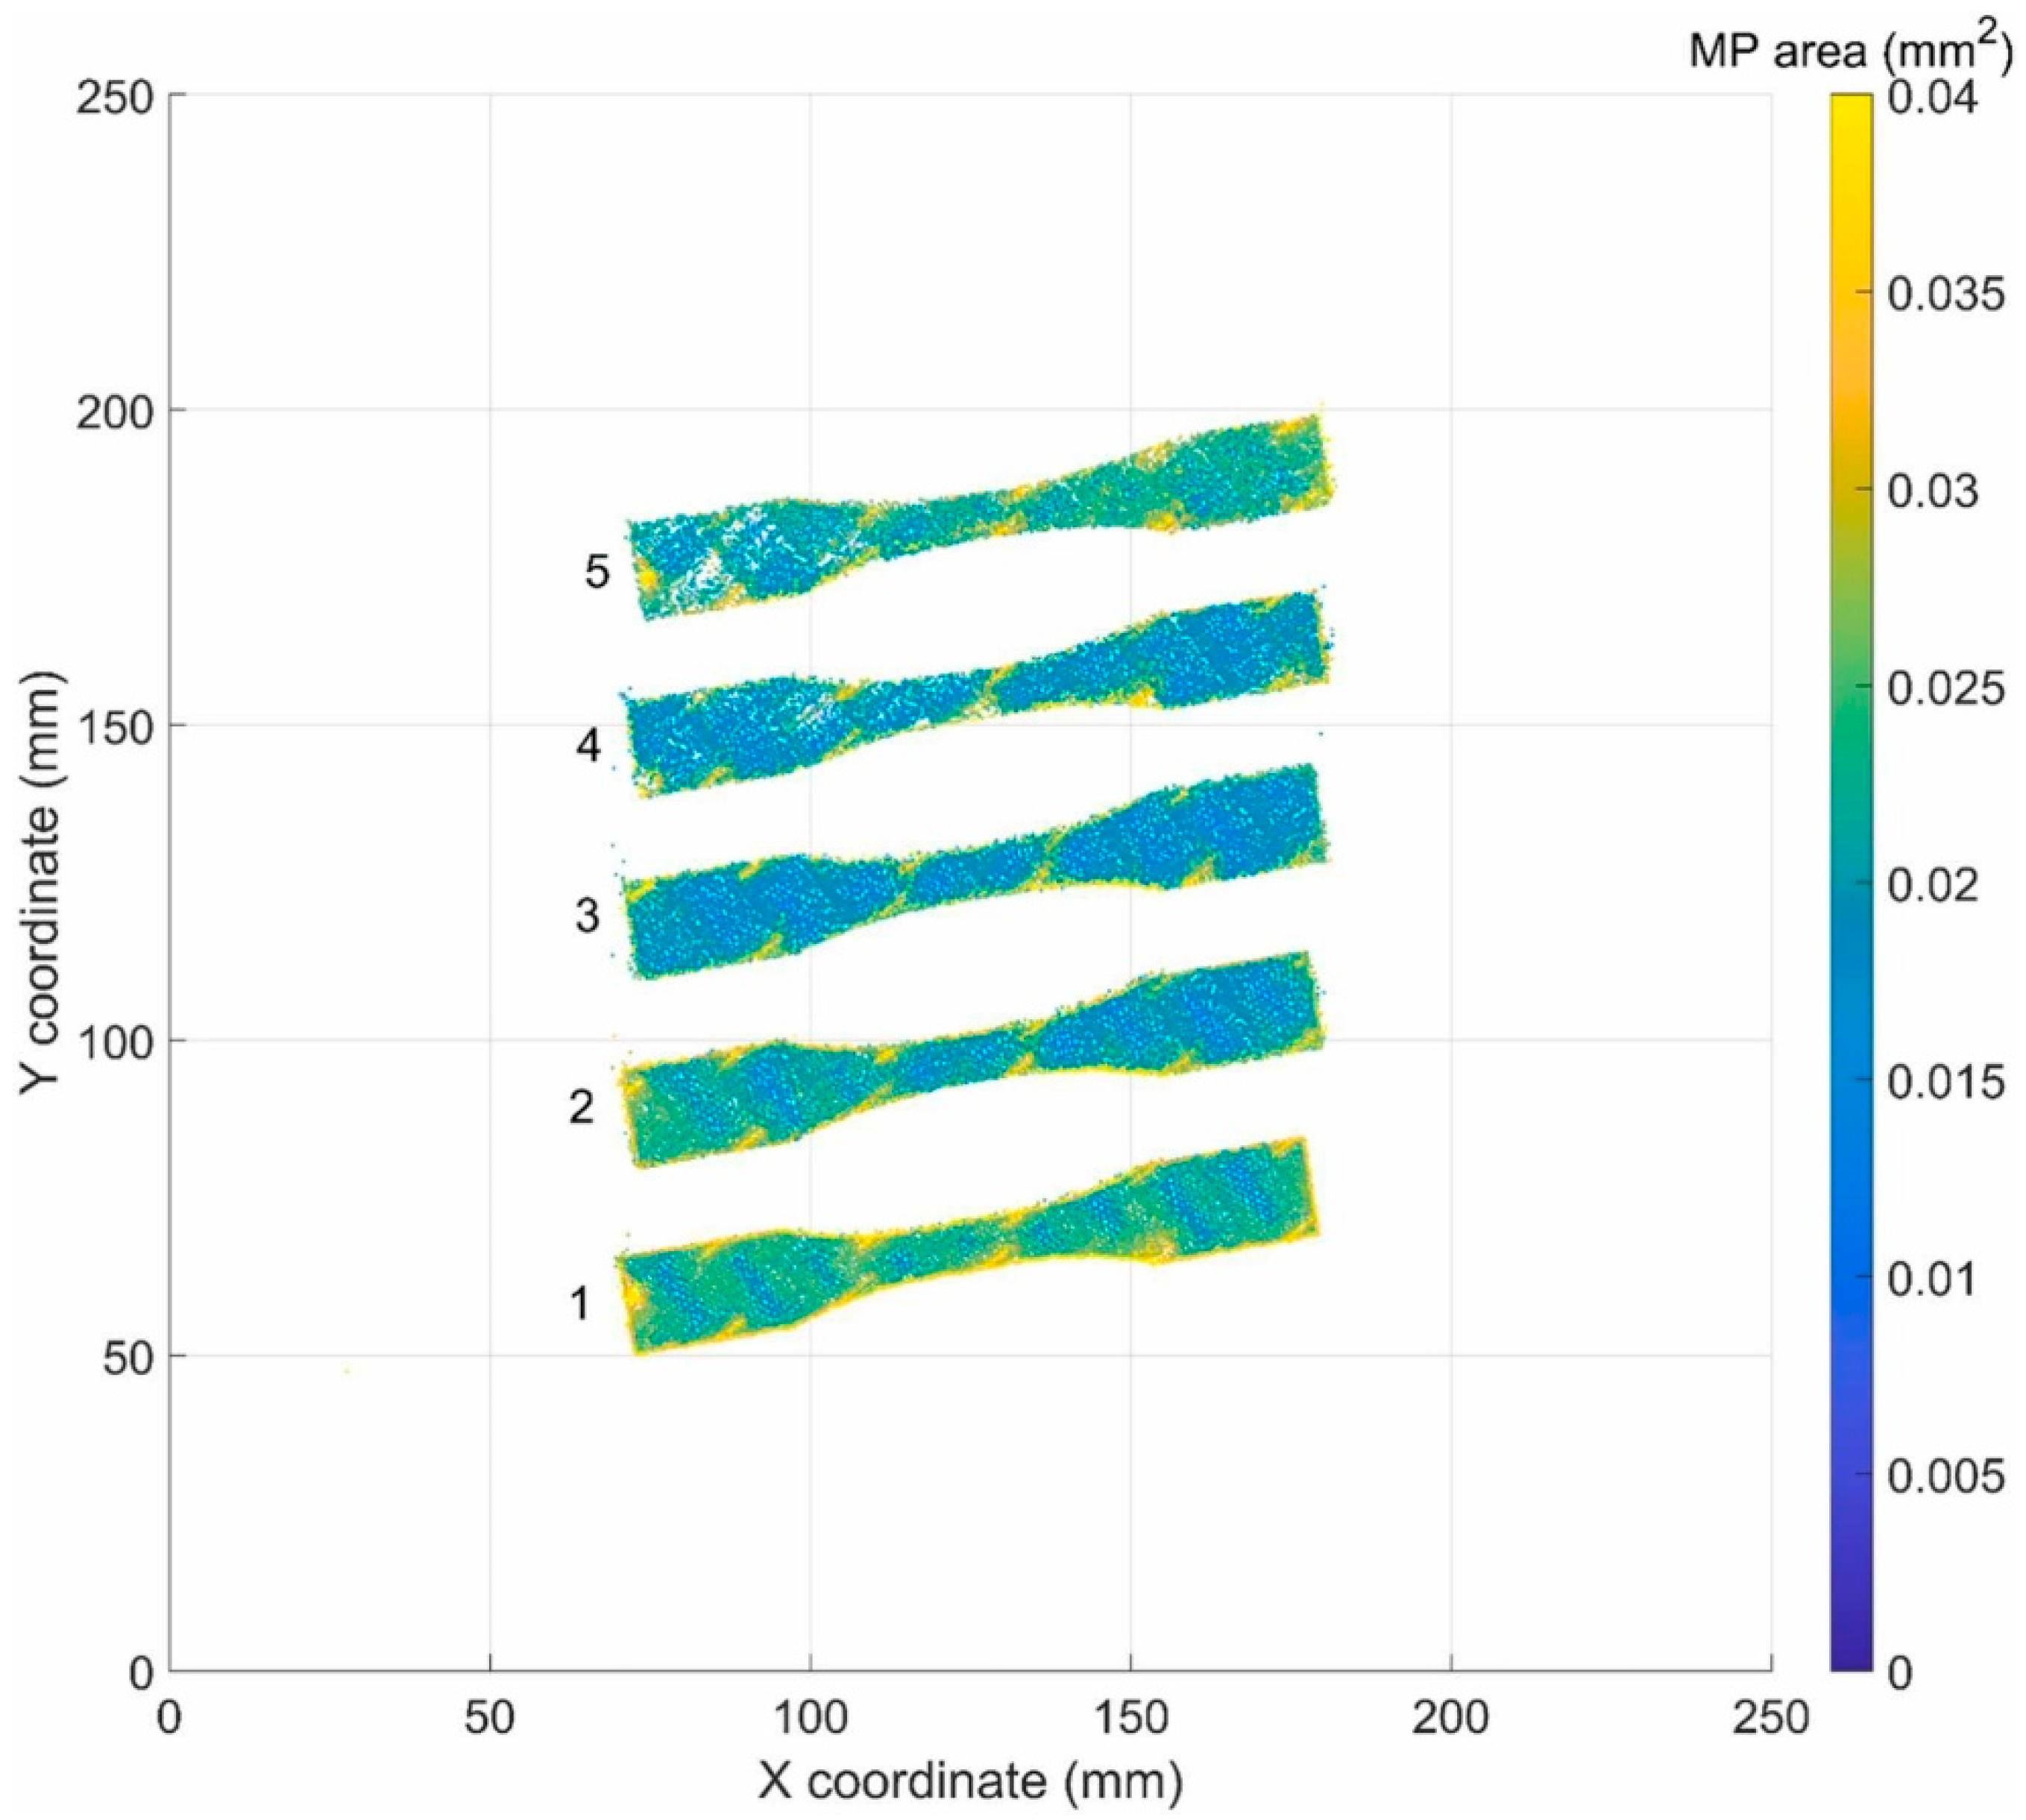
H. Zhang et al. [53] proposed a method for investigating the key melt-pool signatures (intensity, temperature, and area) based upon a two-wavelength imaging pyrometry system to acquire information from an off-axis camera system (FASTEC IL5, Fastec Inc., San Diego, CA, USA, 30,000 FPS at a resolution of 128 × 48 pixels). The melt pool was imaged at two different wavelengths of 550 and 620 nm, respectively. Machine learning was involved in image analysis for retrieving the spatial distribution of melt pools within the corresponding coordinate system and for the final elaboration of the signature maps (Figure 9). A short-term memory neural network was then developed for estimating the layer surface topography from the registered melt-pool signatures, without resorting to scanning devices.
J. Stajkovic et al. [54] developed a dimensionless enthalpy model to predict the melt-pool aspect ratio in PBF-LB. A linear relationship between the depth of melt pools, pyrometric signals, and dimensionless enthalpy was established in the case of a powder-free tungsten substrate by correlation of model predictions with metallographic cross-section measurements. Images of each hatch block were acquired with a Kleiber KG 740-LO pyrometer (Kleiber Infrared GmbH, Unterwellenborn, Germany), operated at an optimum wavelength of 1753 nm, converting the recorded signal in mV at a polling rate of 100 kHz. The melt-pool location inside a circular area with a diameter of approximately 300 µm, concentric to the laser spot, was detected by correlation with the laser scanning system, and the data were introduced into the model to deduce the depth of the melt pools.
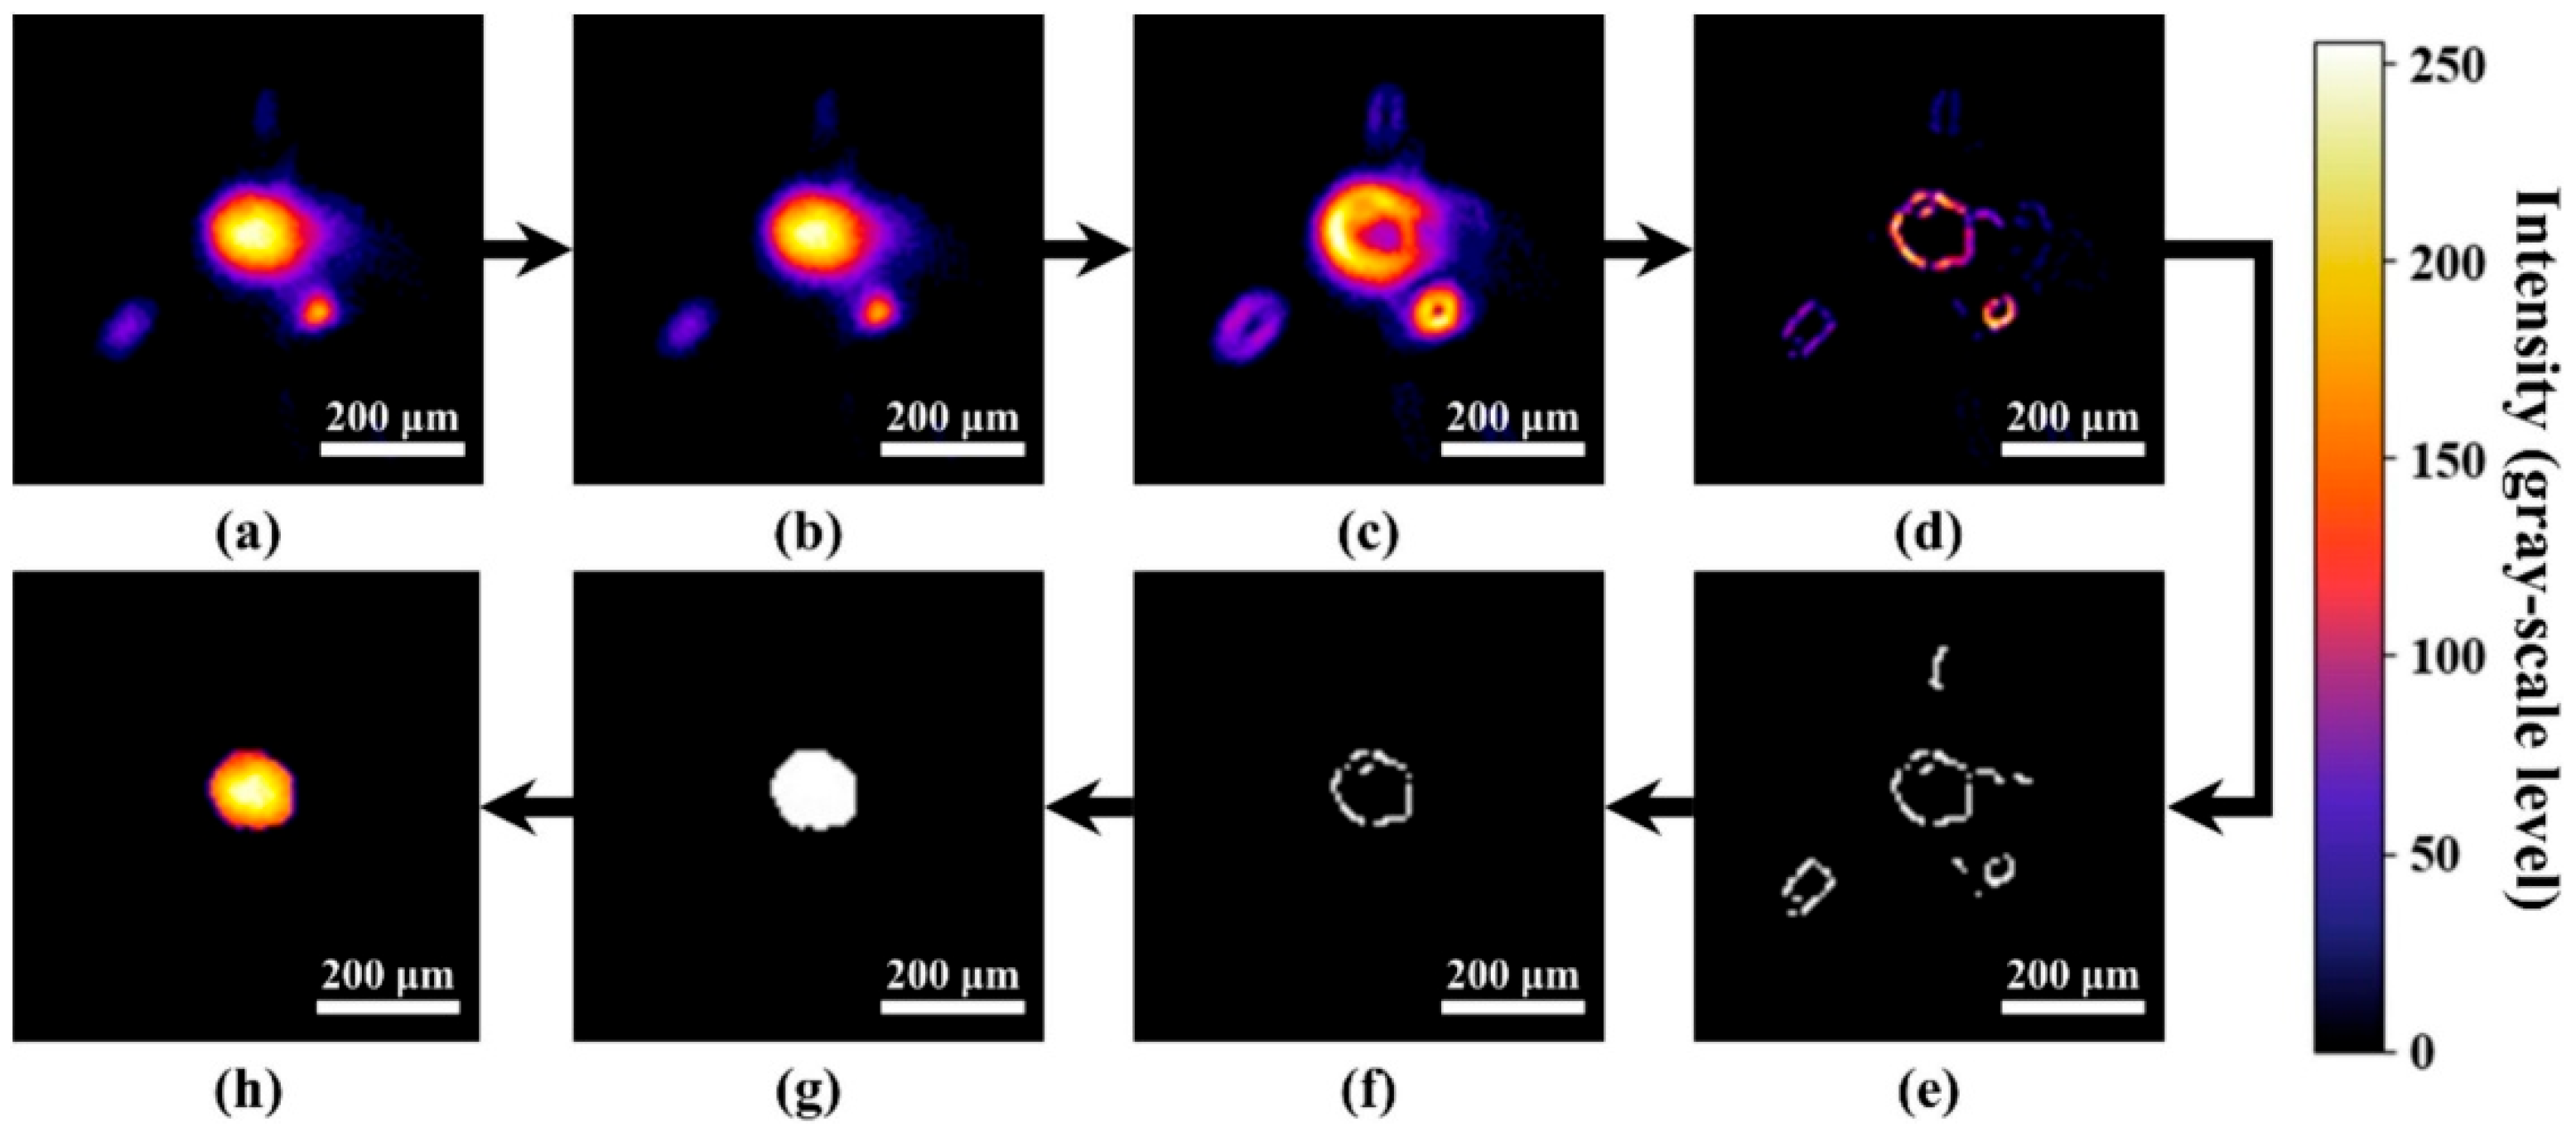
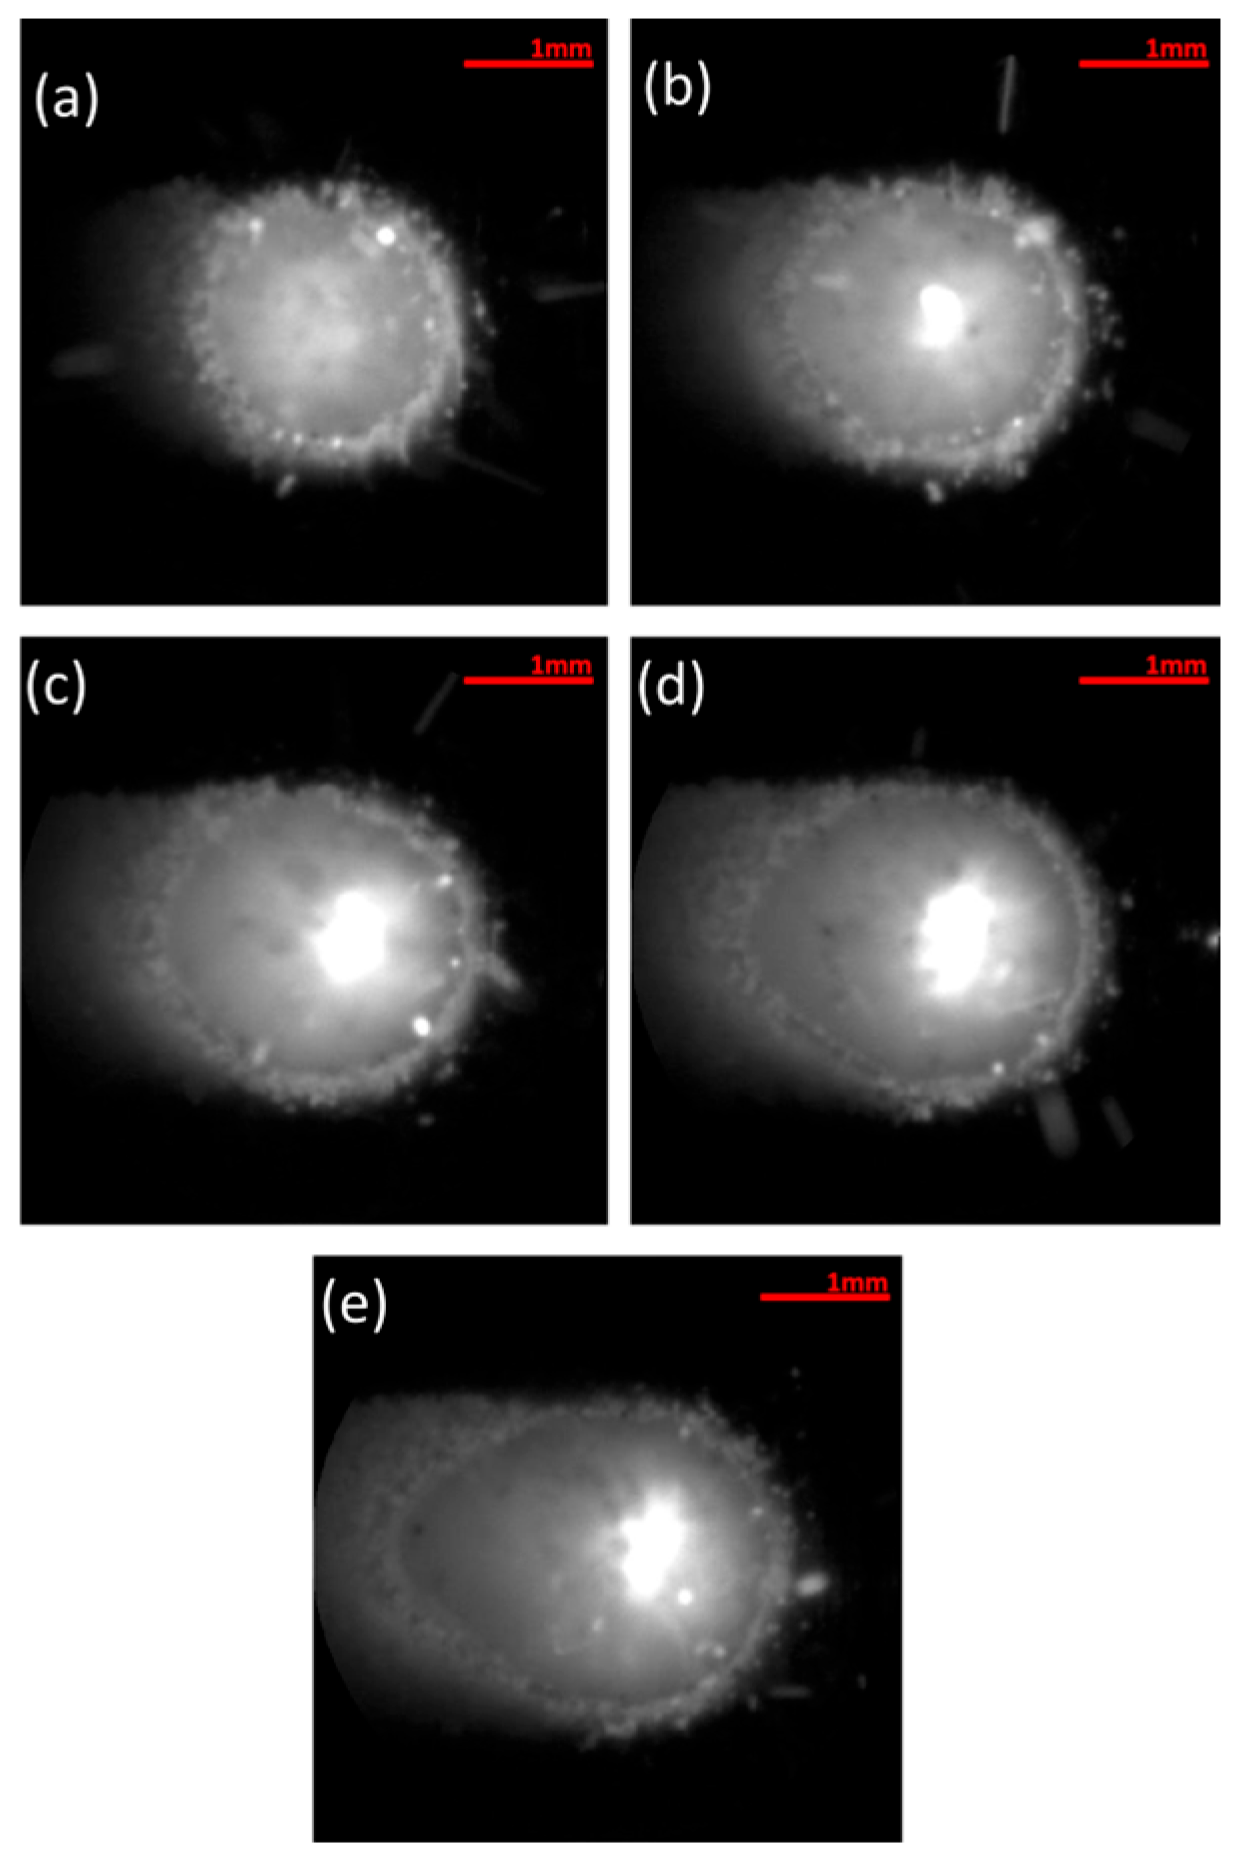
J. Li et al. [55] proposed an evaluation method for imaging in PBF-LB that segments the melt-pool into regions based on the intensity gradient of the boundaries and allows for the extraction of texture features from the gray-level co-occurrence matrix. The emitted light from the melt-pool crossed a dichroic mirror (Camera Adapter, SCANLAB GmbH, München, Germany), an NIR filter, and finally illuminated the CMOS chip of a high-speed camera (EoSens CAMMC1362, Mikrotron, Unterschleißheim, Germany), which enabled the acquisition of melt pool images. The intensity gradient showed extreme values at the melt pool boundary, so that the region within the extreme values corresponds to the melt pool itself. The area outside this boundary may remain as powder or consist of the formed solid region (Figure 10).
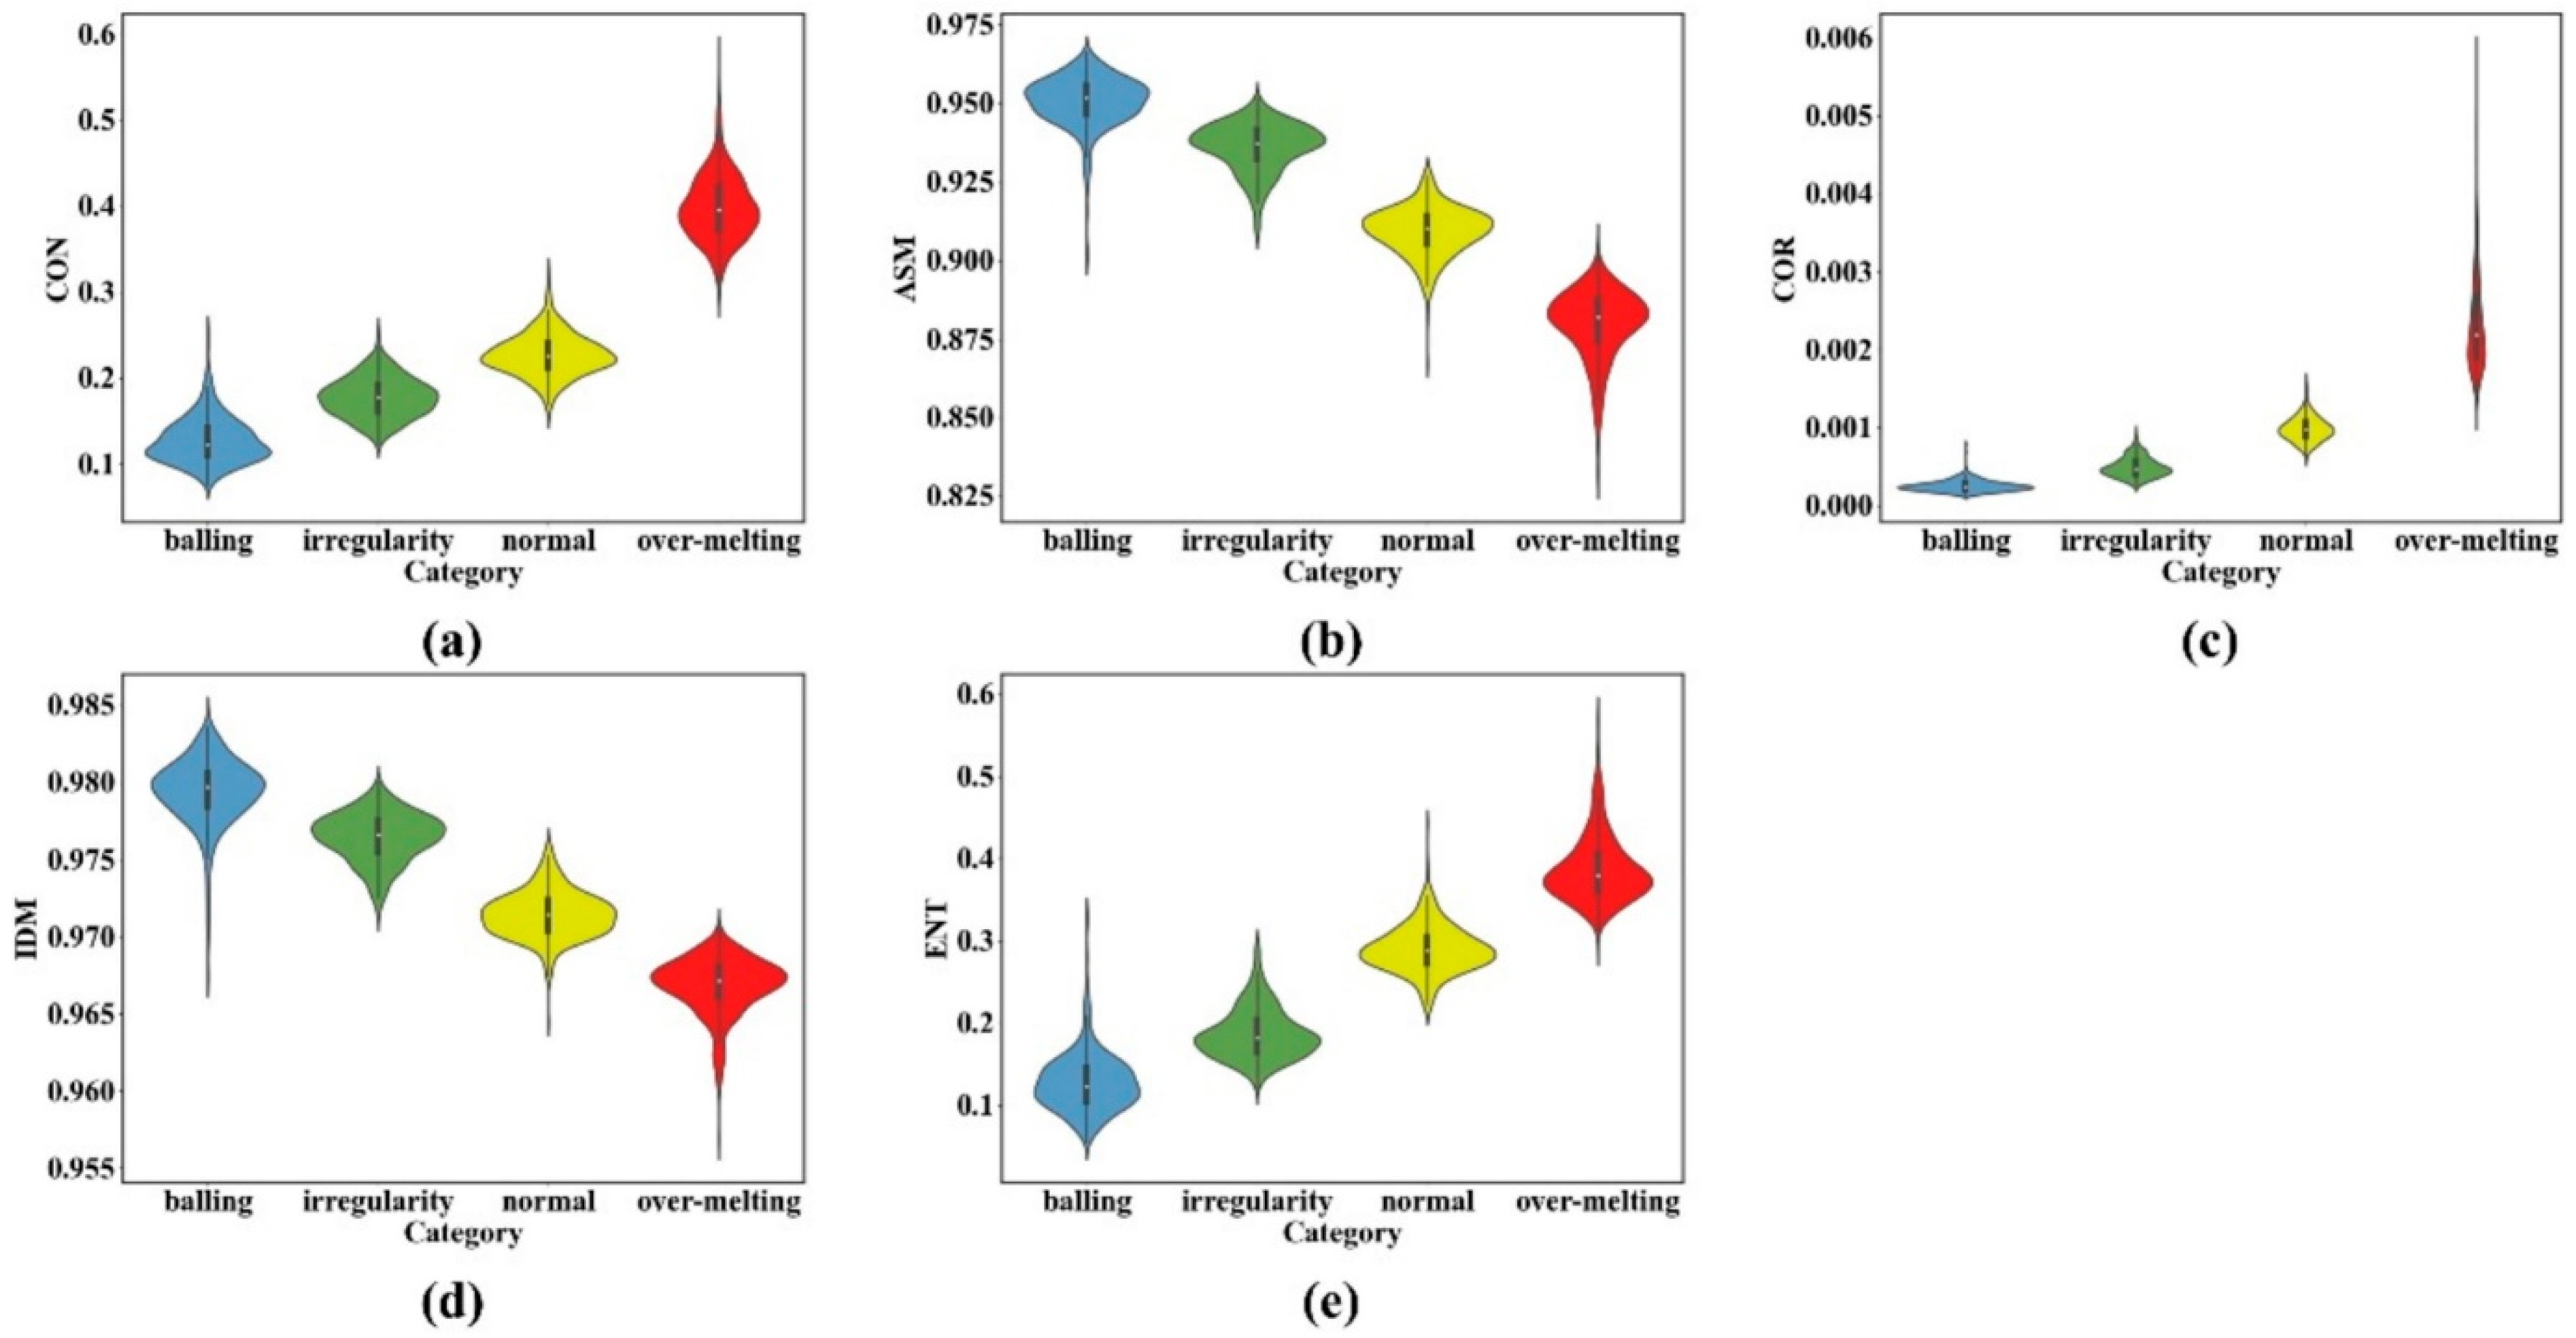
Single tracks were built on substrates using laser power ranging from 50 to 350 W and scanning speeds from 200 to 2000 mm/s. The tracks were not visible on the substrate when the line energy density was inferior to 0.05 J/mm. When observable, the tracks were classified according to their morphology as: over-melting, normal, irregular, or balling. The over-melting tracks, generally observed for high laser powers and low scan speeds, were characterized by a continuous, straight morphology with a nearly uniform width throughout the scanning direction. In contrast, the normal tracks exhibited a continuous, straight morphology deposited on the substrate. The irregularity category showed non-uniform fluctuations along the track length, with sporadic discontinuities. To analyze the sensitivity of different texture characteristics for melt-pool classification, graphs can be compiled (Figure 11) with respect to various features, such as contrast (CON), angular second moment (ASM), correlation (COR), inverse difference moment (IDM), and entropy (ENT). Different colors stand for melt-pool states: balling, irregularity, normal, and over-melting.
One notes the significant distinctions between states that allow for high specificity and discrimination between normal and over-melting cases, pointing to their superior potential for classifying the melt-pool status.

3.1.4. Defect Detection

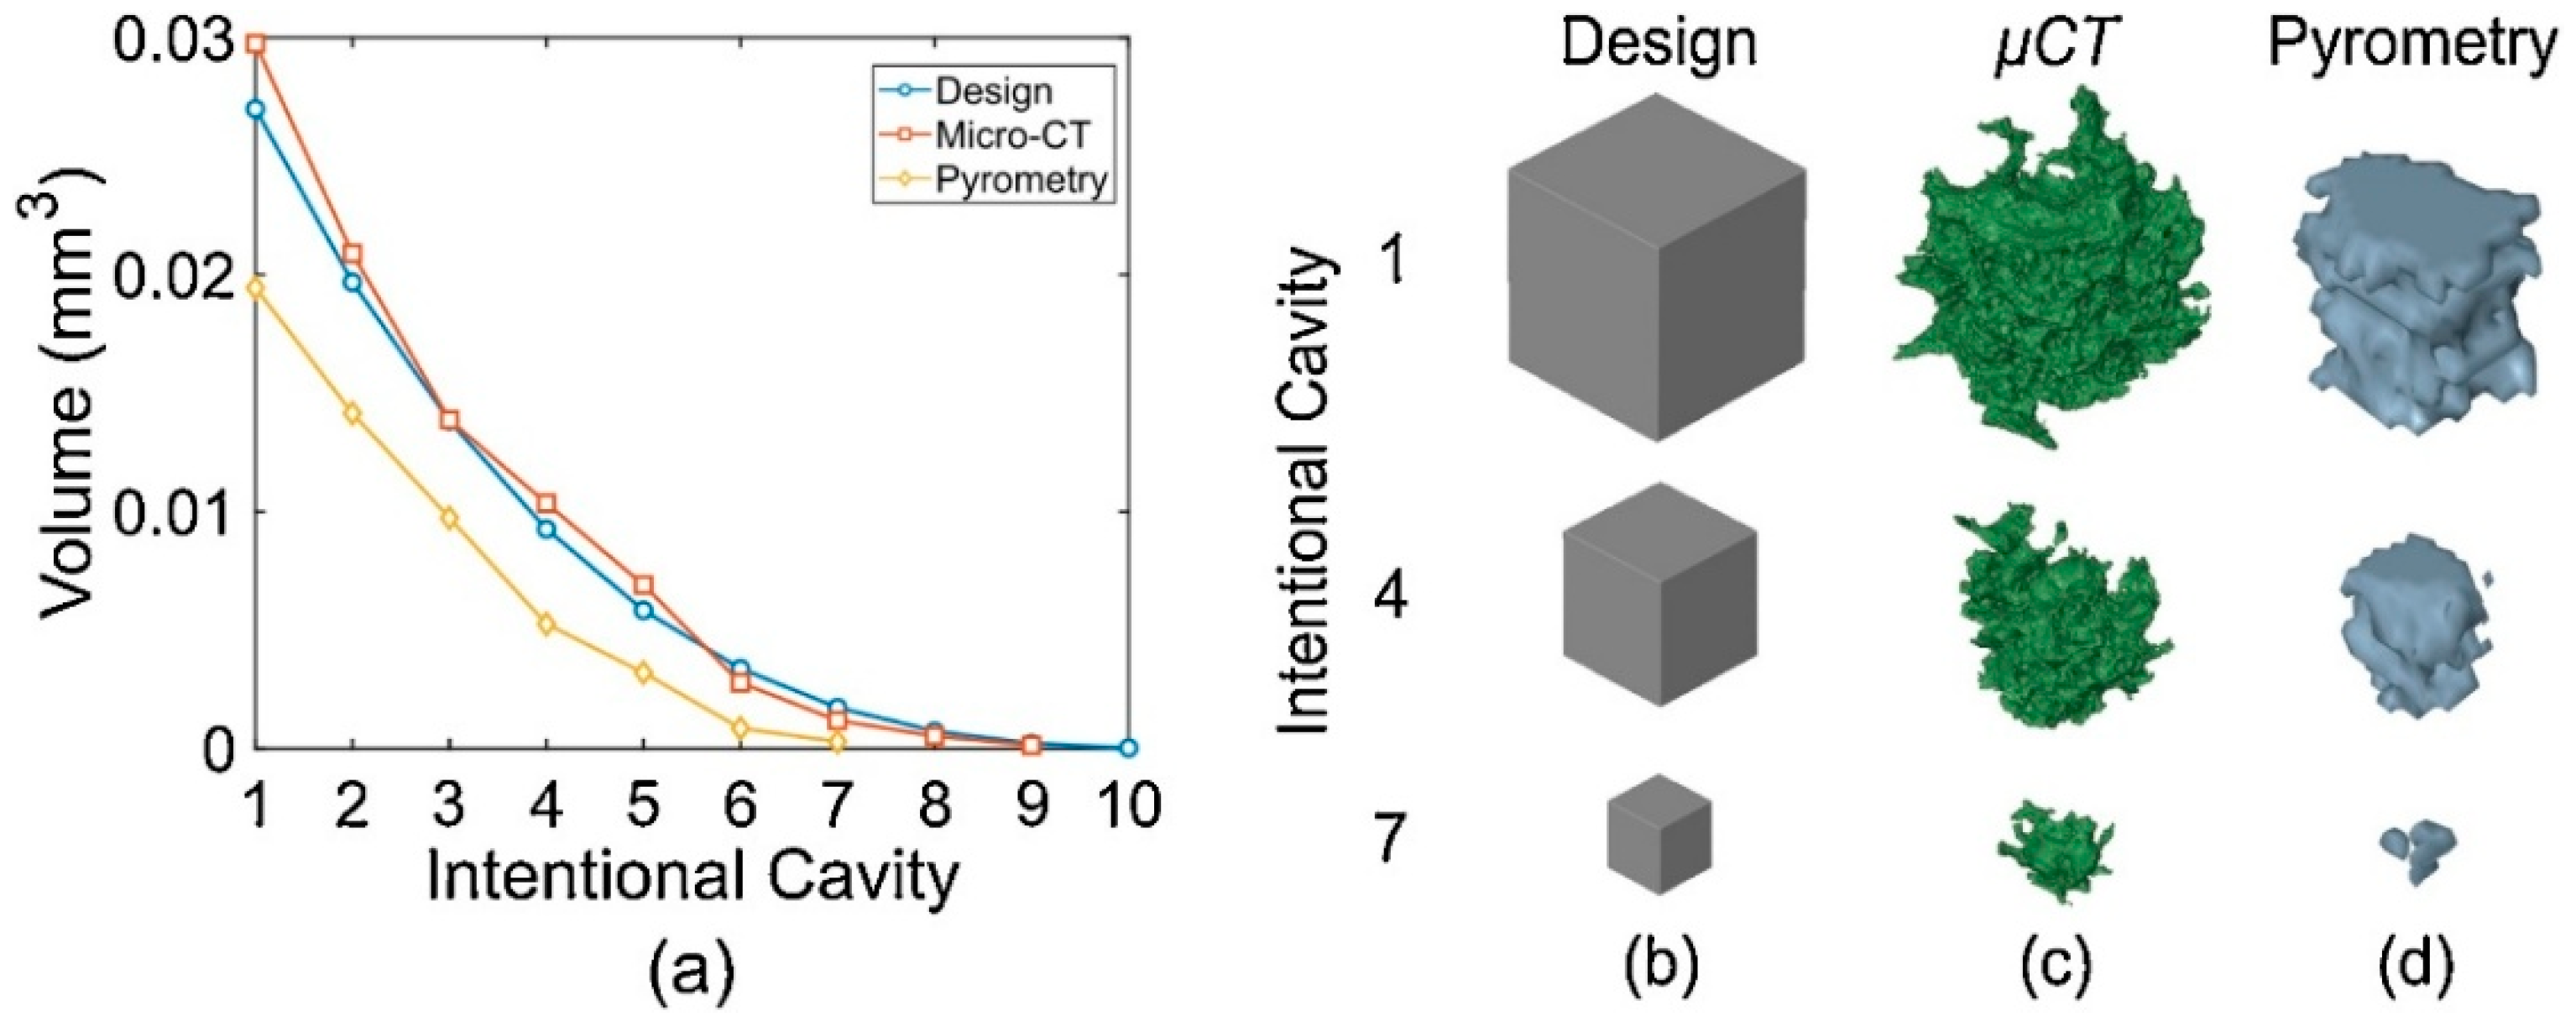
Two-color pyrometry was also extended to the detection of [38,56]. Thus, Mitchell et al. [57] collected data during PBF-LB of 316L stainless steel parts to predict pore locations and validated the input by micro-computed tomography (micro-CT) imaging. They used a Stratonics two-color pyrometer to record the radiance originating from the melt pool, equipped with two silicon CMOS cameras (MV1-D1024E from Photon Focus) that were calibrated to collect light at 750 and 900 nm, respectively, through 50 nm bandpass filters. The camera field of view was 65 × 80 pixels with a resolution of 21 μm per pixel. The emissivity at different wavelengths was assumed constant with an estimated error not surpassing 4%. A tungsten lamp was inserted for calibration at the focus of the pyrometer. The heat signatures of defects were inferred via superposing the pyrometry heat maps with micro-CT recordings. A part was fabricated for dedicated investigations by PBF-LB with ten cubic cavities of increasing size. Seven of these cavities were identified from pyrometry data versus nine detected by micro-CT (Figure 12). The smallest cavities, which could be located from pyrometry and micro-CT data, were respectively 120 and 60 μm, with only s on one side. Pores of 60 to 90 μm could not be detected, even though the limit of detection of the pyrometer was 42 μm. This failure was attributed to the sampling frequencies, which did not allow for a point-by-point scanning of the whole volume, leaving unexplored small areas of ~215 μm between subsequent pyrometry images, making it impossible to reliably observe the pores due to these gaps.
The method proposed by Mitchell et al. [57] is an indirect approach for porosity detection, based on anomaly identification in two-color pyrometry data and its correlation with post-build micro-CT measurements. A key limitation of the method arises from the micro-CT resolution, characterized by a cubic voxel size of 1.98 μm. Consequently, defects with dimensions below this voxel size cannot be reliably resolved or analyzed using this setup.
Process anomalies and/or part defect detection were also carried out by H. Zhang et al. [53].

3.2. DED-LB Melt-Pool Investigations

Imaging method extension to DED-LB differs significantly from PBF-LB due to peculiarities of the deposition process, which require higher laser intensities, greater spot sizes, and larger melt pools, and presuppose the possible influence of the powder blown into the melt pool, which currently needs the introduction of filters and/or attenuators and even the use of AI tools.

3.2.1. Temperature Monitoring by Two-Color Pyrometry

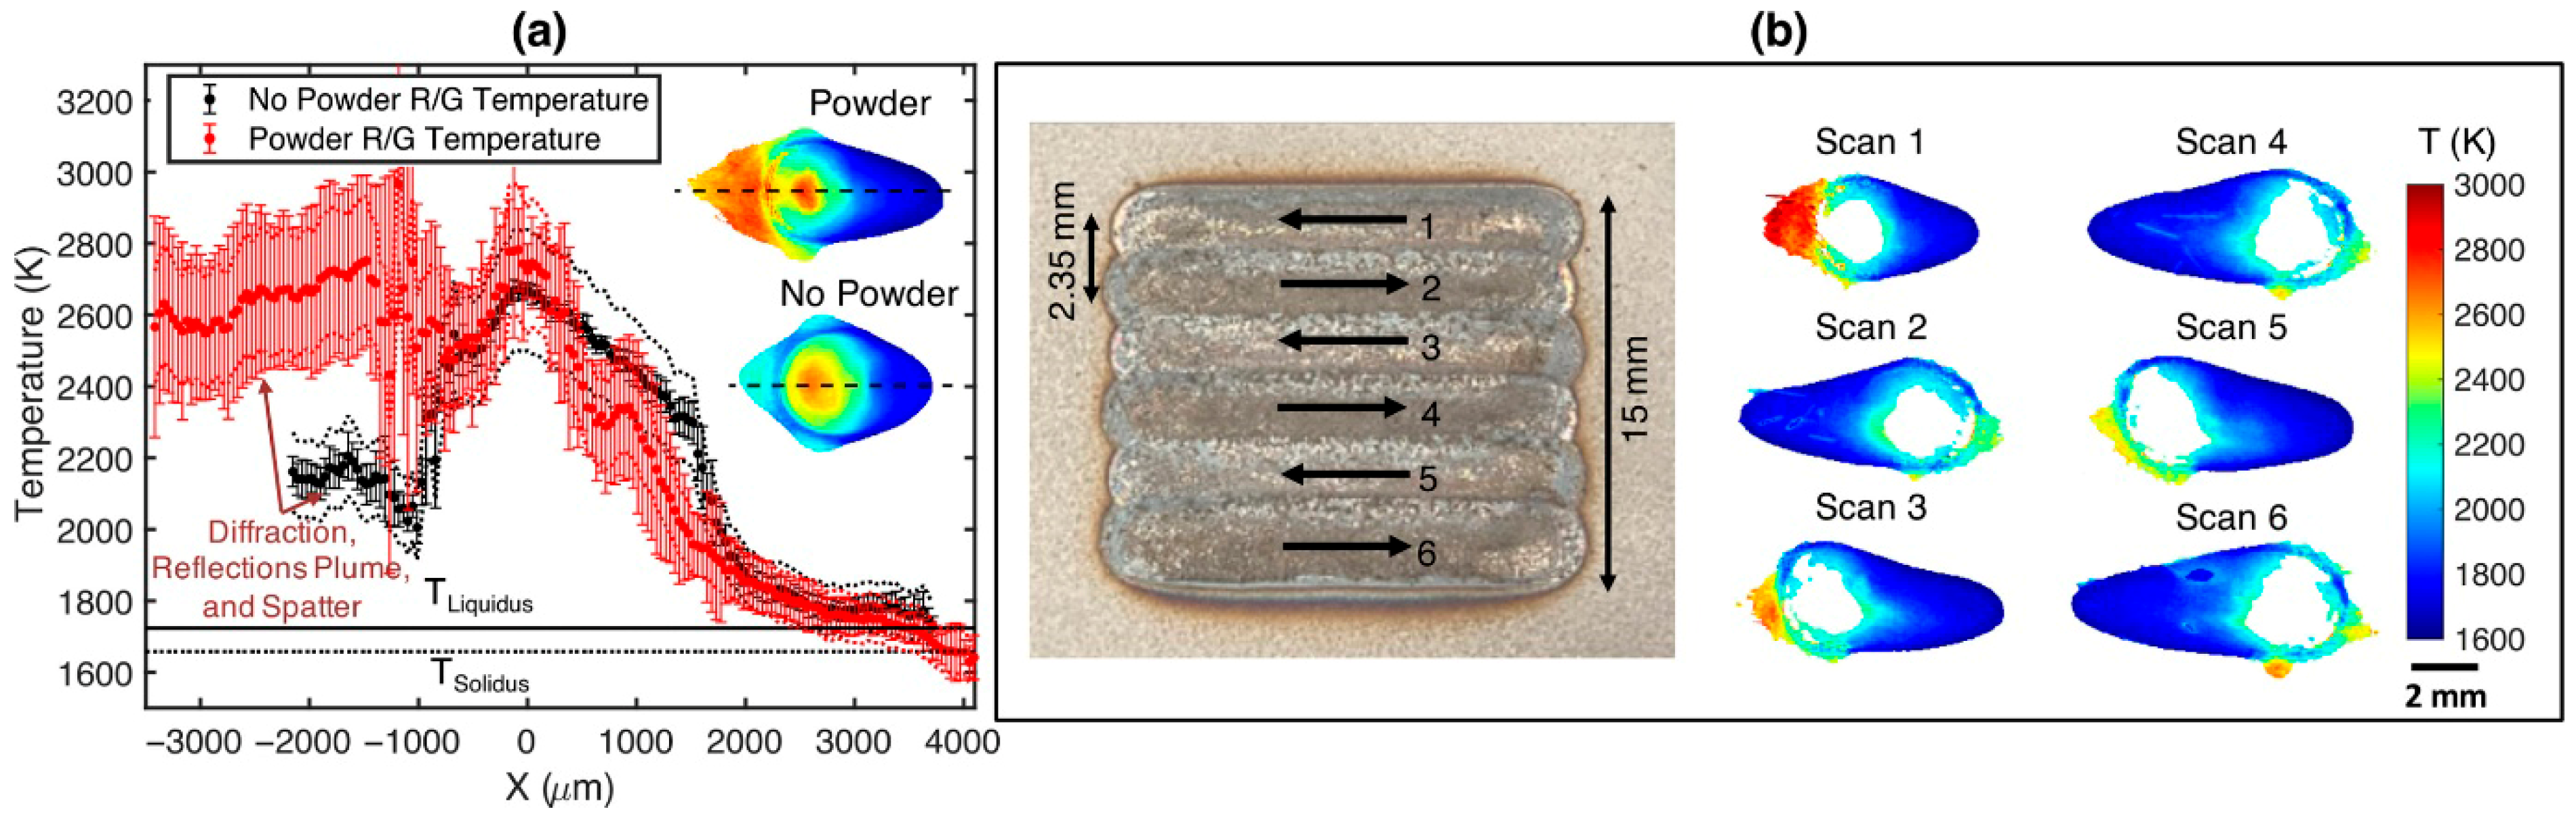
A. J. Myers et al. [58] used two-color thermography in a different manner, i.e., to construct spatially resolved temperature fields of a 316L stainless-steel melt-pool from room (solidus) to near-boiling temperatures, using a FLIR BlackFly 04S2C USB3 color camera (Teledyne FLIR, Wilsonville, OR, USA). In situ temperature measurements were combined with ex situ cross-sectional geometry investigations to study the material’s effective absorptivity and the coefficient of temperature-dependent surface tension. Surface temperature measurements were used to evaluate the peak temperatures and cooling rates at the melt-pool border, which affect microstructure (Figure 13). Peak temperature evaluation in the 1750–3000 K range showed that below the boiling point, the temperature increases with increasing laser power density but decreases with increasing scanning velocity. Mapping these features to the process parameters evidenced that the peak melt pool temperature was more sensitive to laser power and diameter, while the cooling rate was more affected by the scanning velocity and power.
Compared with the other DED-LB monitoring approaches reviewed here, the two-color thermography method of Myers et al. [58] provides the most direct quantitative thermal information, since it yields spatially resolved temperature fields and cooling-rate data rather than only geometric descriptors. Methods such as those of Sampson et al. [59], García-Moreno et al. [60], and da Silva et al. [61] primarily extract melt-pool edges, contours, width, area, or orientation, whereas Shin et al. [62] and Lafirenza et al. [63] focus mainly on closed-loop geometric control. Ji et al. [64] also include temperature, but mainly as an input to a hybrid CNN model for bead-geometry prediction, with reported temperatures of 1450–1700 °C, overlapping only with the lower part of the 1750–3000 K interval reported by Myers et al. In contrast, Zhang et al. [65] and Ertay et al. [66] emphasize anomaly detection and process-state classification based on emission or vision signatures. Therefore, Myers et al. [58] occupy a distinct position among the reviewed LDED methods by linking melt-pool monitoring directly to the underlying thermal physics of the process.

3.2.2. Melt-Pool Spatial Distribution Under Normal and Oblique Laser Incidence: Size, Area, Signature, Widths, and Borders

Canny [67] first introduced a computational approach to edge detection via identification and localization criteria of a class of edges and proposed associated mathematical forms to describe the functioning of the corresponding operator impulse response. A supplementary criterion was added to ensure that the detector presents only one response to a single edge.
R. Sampson et al. [59] proposed, based on this concept, a machine vision technique to enhance images indicating the true melt-pool edges acquired by the melt-pool monitoring systems. A NIR CMOS machine vision camera was used to improve melt-pool imaging in combination with a UV/VIS cut-off imaging filter with a 135 nm notch. The filter had an optical density of 3.0 for the 200–750 nm and 4.0 for the 1000–1200 nm wavelength ranges, respectively. The notch filter and NIR CMOS camera were coaxially installed inside the laser deposition head to facilitate a clear birds’-eye view of the melt-pool. The technique provided improved accuracy and allowed for performing melt pool investigations, independent of emissivity values (Figure 14). Preliminary studies showed that low exposure times provided true melt-pool edge features, but variation in laser power affected the image quality. To overcome this difficulty, a series of scans was conducted to identify the best exposure time for various input laser power values. It was found that the following equation (Equation (3)) could be used to identify the optimum exposure time in the case of steel EN25 submitted to laser irradiation within the 600–1200 W power range:
E = 6 × 10 4 × P + 0.9192
Here, E is the exposure time setting, while P stands for the effective laser power applied in the system. The Canny edge detection algorithm was next used for calculating the melt-pool width [59].
Sampson et al. [59] proposed a machine-vision-based melt-pool monitoring method that improves the identification of the true melt-pool edge and enables width measurements without relying on emissivity-based thresholding. Its main advantages are improved edge-detection accuracy, coaxial in situ implementation, and suitability for process monitoring and control. However, the method requires material- and power-dependent exposure calibration, was demonstrated in a specific DED setup, and is limited primarily to geometric melt-pool characterization rather than direct thermal measurement.
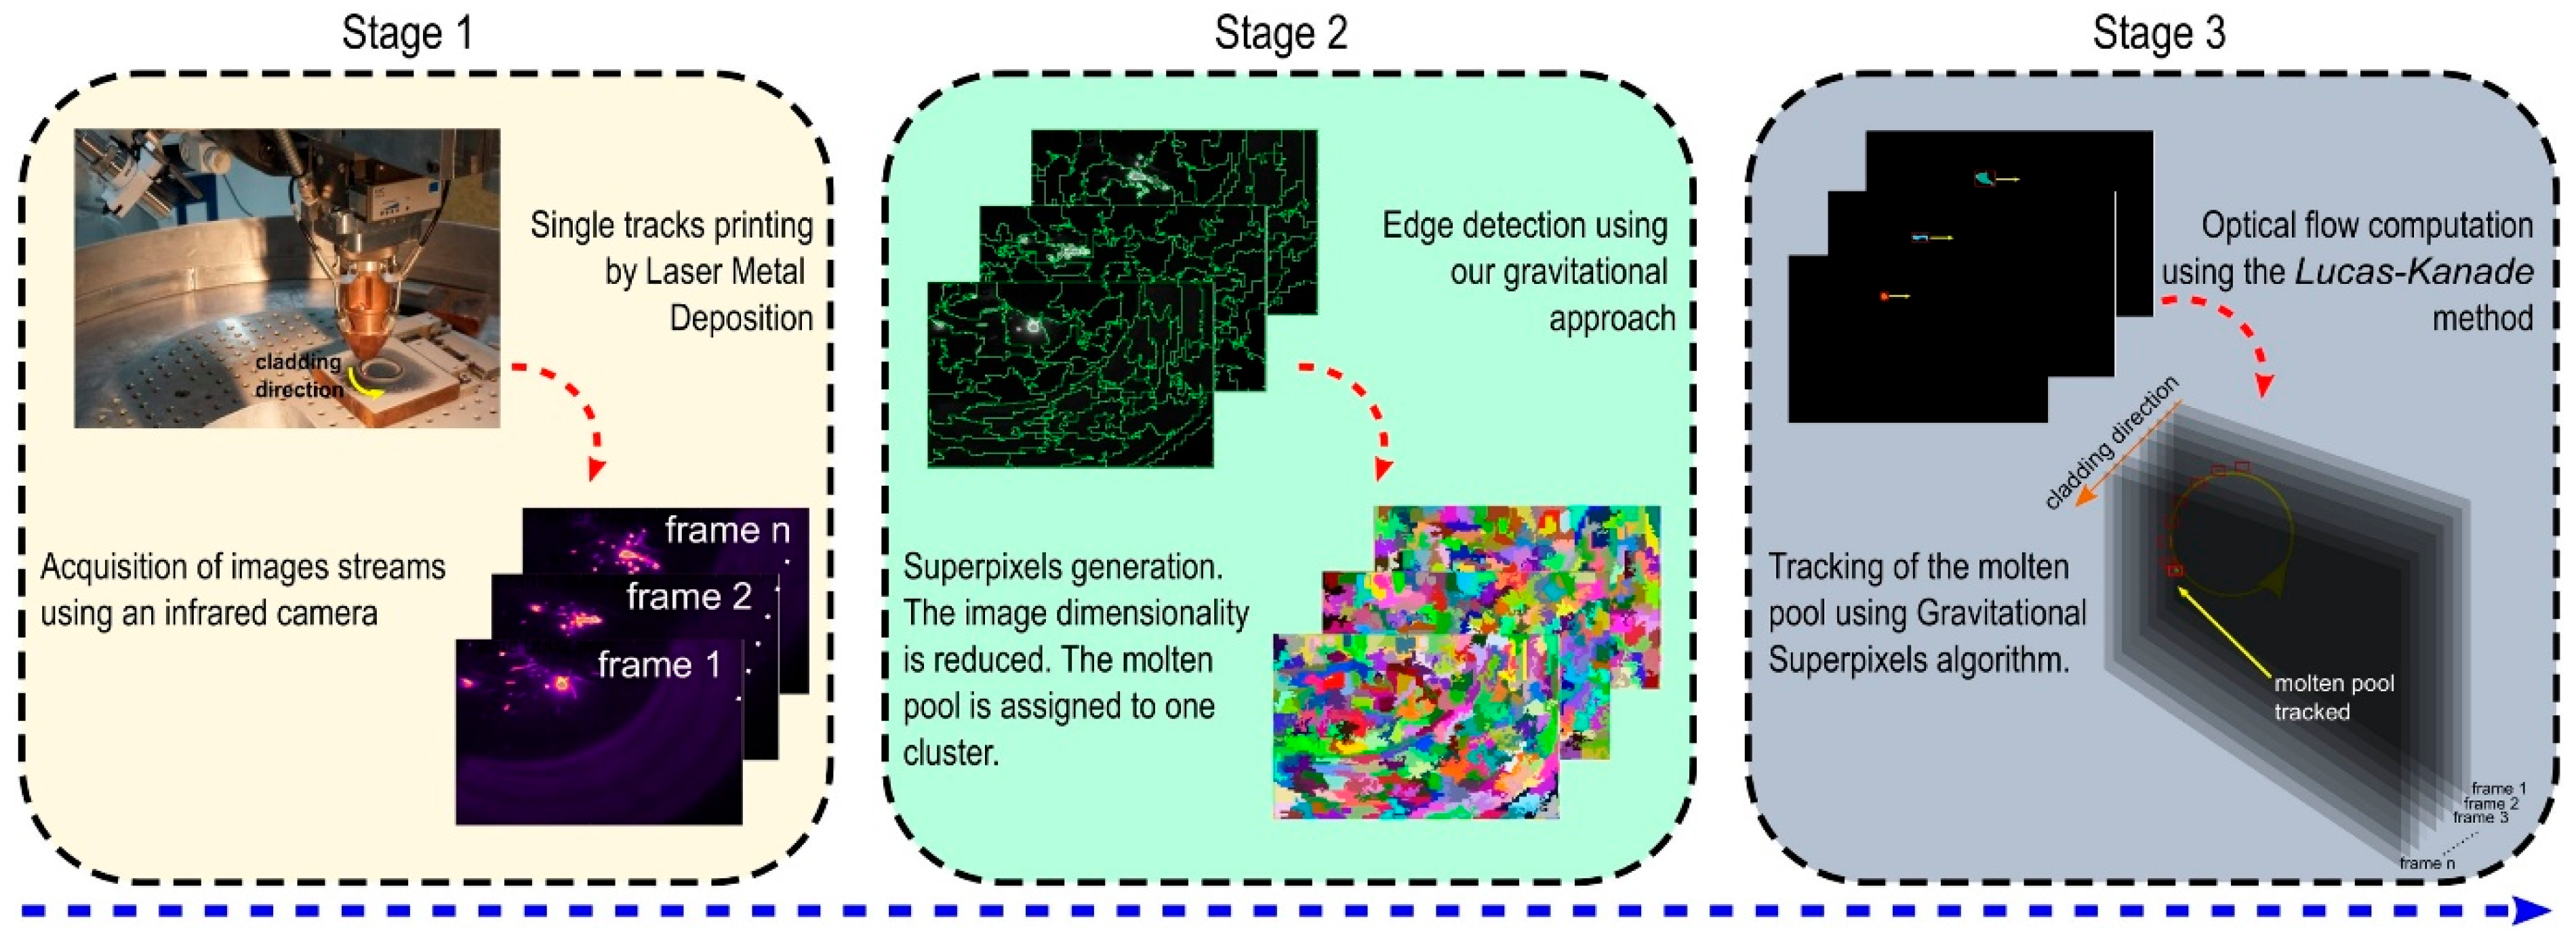
A.-I. García-Moreno et al. [60] used a middle-wavelength infrared camera operating in the (3–5) μm spectral range to monitor DED-LB of the Ni-based alloy Inconel 718. An algorithm was developed for image processing in two parts: (i) pixel clustering to generate superpixels and (ii) an approach to calculate the contours of images based on the law of universal gravitation (Figure 15).
To reach this aim, one should split the image into homogeneous regions, which are hereafter called superpixels, that must be connected to each other and preserve the edges between the objects forming the image. These superpixels are groups of pixels that possess similar characteristics such as color, brightness, texture, and, in our case, temperature. One could thus capture the redundancy of the image, providing a convenient primitive form to calculate its characteristics under conditions of considerable cutting of the complexity of subsequent image processing tasks [65]. In terms of image processing, each pixel stands for a body with a mass equal to its corresponding gray-scale value. The total force, which should be used to detect the contours, can therefore be calculated as the combination of the forces acting on that particular pixel. The force of the gravitational field was next introduced to describe the contrast between the bright and dark areas of the image. After all the pixels are associated with the system, a new one is calculated as the average of the contributions of all the blocks belonging to the cluster. The process of associating all pixels with the closest cluster center and recalculating the center of the block until convergence was repeated iteratively.
A. Da. Silva et al. [61] processed 5 overlapping tracks, recorded during DED-LB, by coaxial thermal imaging at variable laser power, in order to extract the average pixel values as well as the melt-pool area, length, width, and orientation. The radiated visible light was collimated and then focused by the camera and additional lenses onto the camera sensor. A narrow bandpass filter was placed in front of the camera in order to select the 770–830 nm wavelength spectrum only and filter out the 1070 nm laser radiation wavelength, ensuring a near-infrared (NIR) recording. The Basler acA1920-40gm type camera (Basler, Ahrensburg, Germany) with a frame size of 1920 × 1216 pixels was operated in 8 bits at a 5 FPS regime.
The evolution of each track deposition was modeled as a function of the laser power and used to calculate and test laser reduction strategies based on different signals. The observed length of the melt pool increased from layer to layer due to geometric modifications of the deposition conditions. The solution to keep the spot area constant is to decrease the laser power incrementally from one track to another so as to hold both signals constant over time. Laser power optimization based on monitoring of the melt-pool area indicated high process stability, while the process maximization with respect to the mean pixel values resulted in too large a laser power reduction, pointing out that the melt pool area is a more relevant signal to monitor than the mean pixel value.
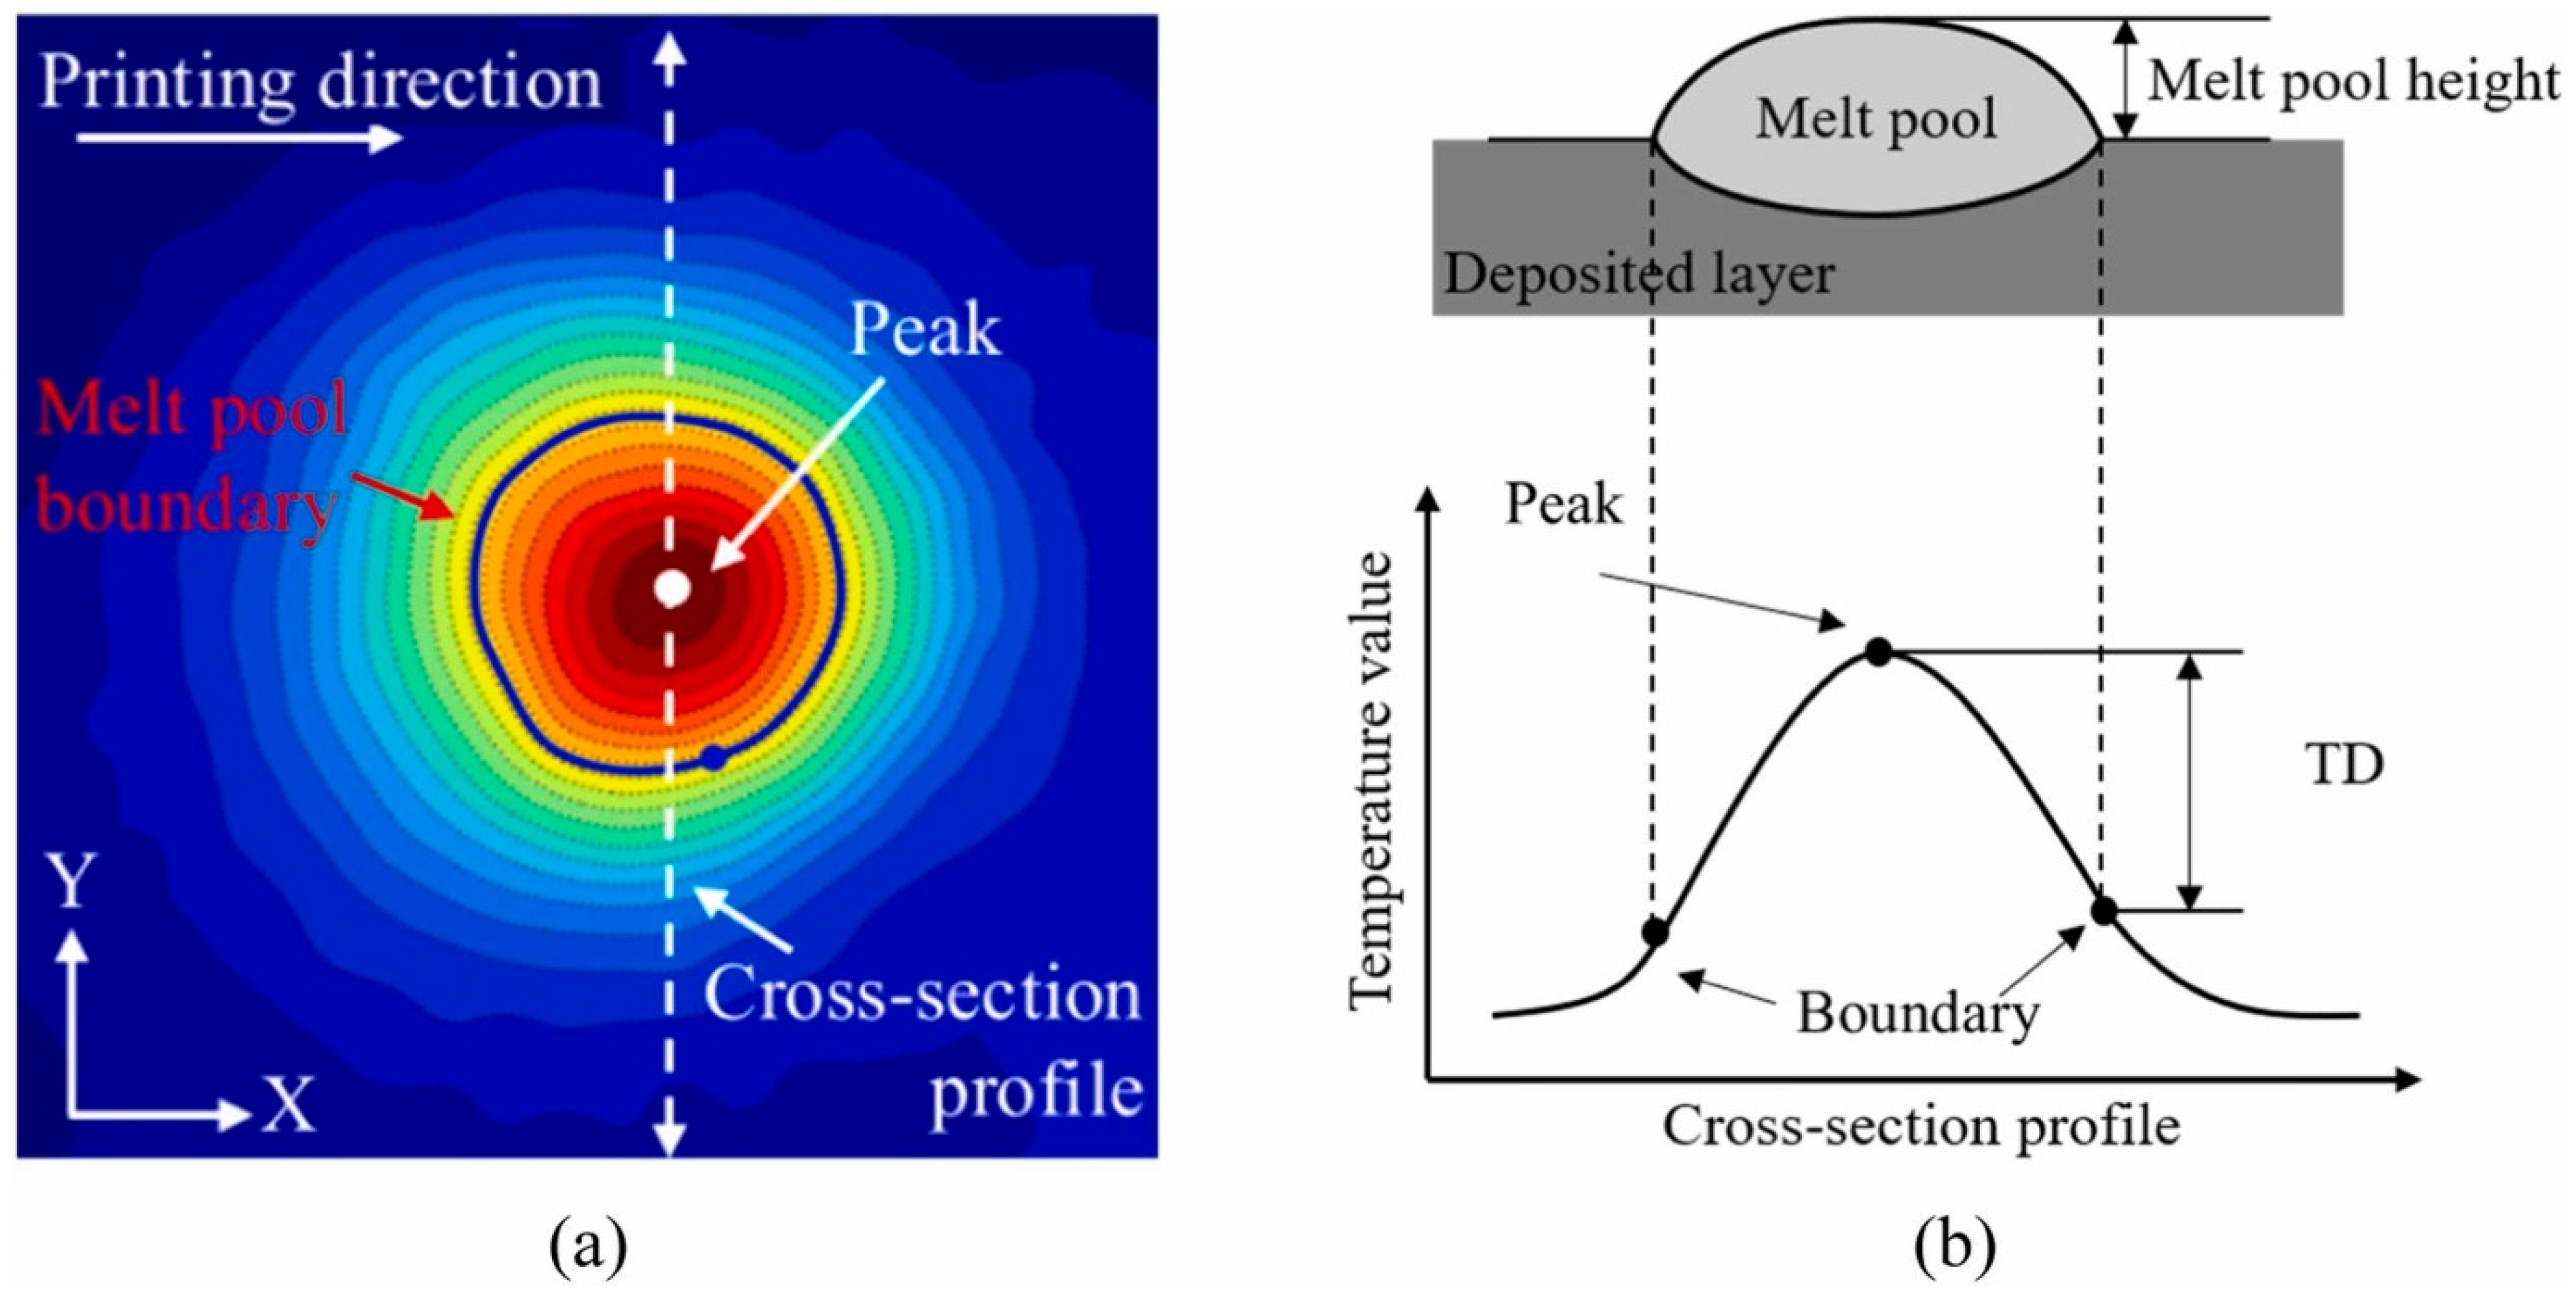
S. Shin et al. [62] used a closed-loop melt-pool height control system based on real-time thermal imaging to enhance the geometric accuracy of the DED-LB process. To this aim, a long-wave infrared camera (A655sc, FLIR Systems, Inc. (Teledyne FLIR, Wilsonville, OR, USA) was mounted coaxially with the printing nozzle in order to share the optical path with the laser beam. The thermal radiation generated by the melt-pool passed through a beam splitter, bandpass filter, and reflecting mirror to be finally measured by the infrared camera. The difference between the peak and boundary temperatures was monitored and correlated to the melt-pool height and laser power (Figure 16) and used as feedback for dynamic adjustment of incident laser power to maintain a stable melt pool height throughout the printing process.
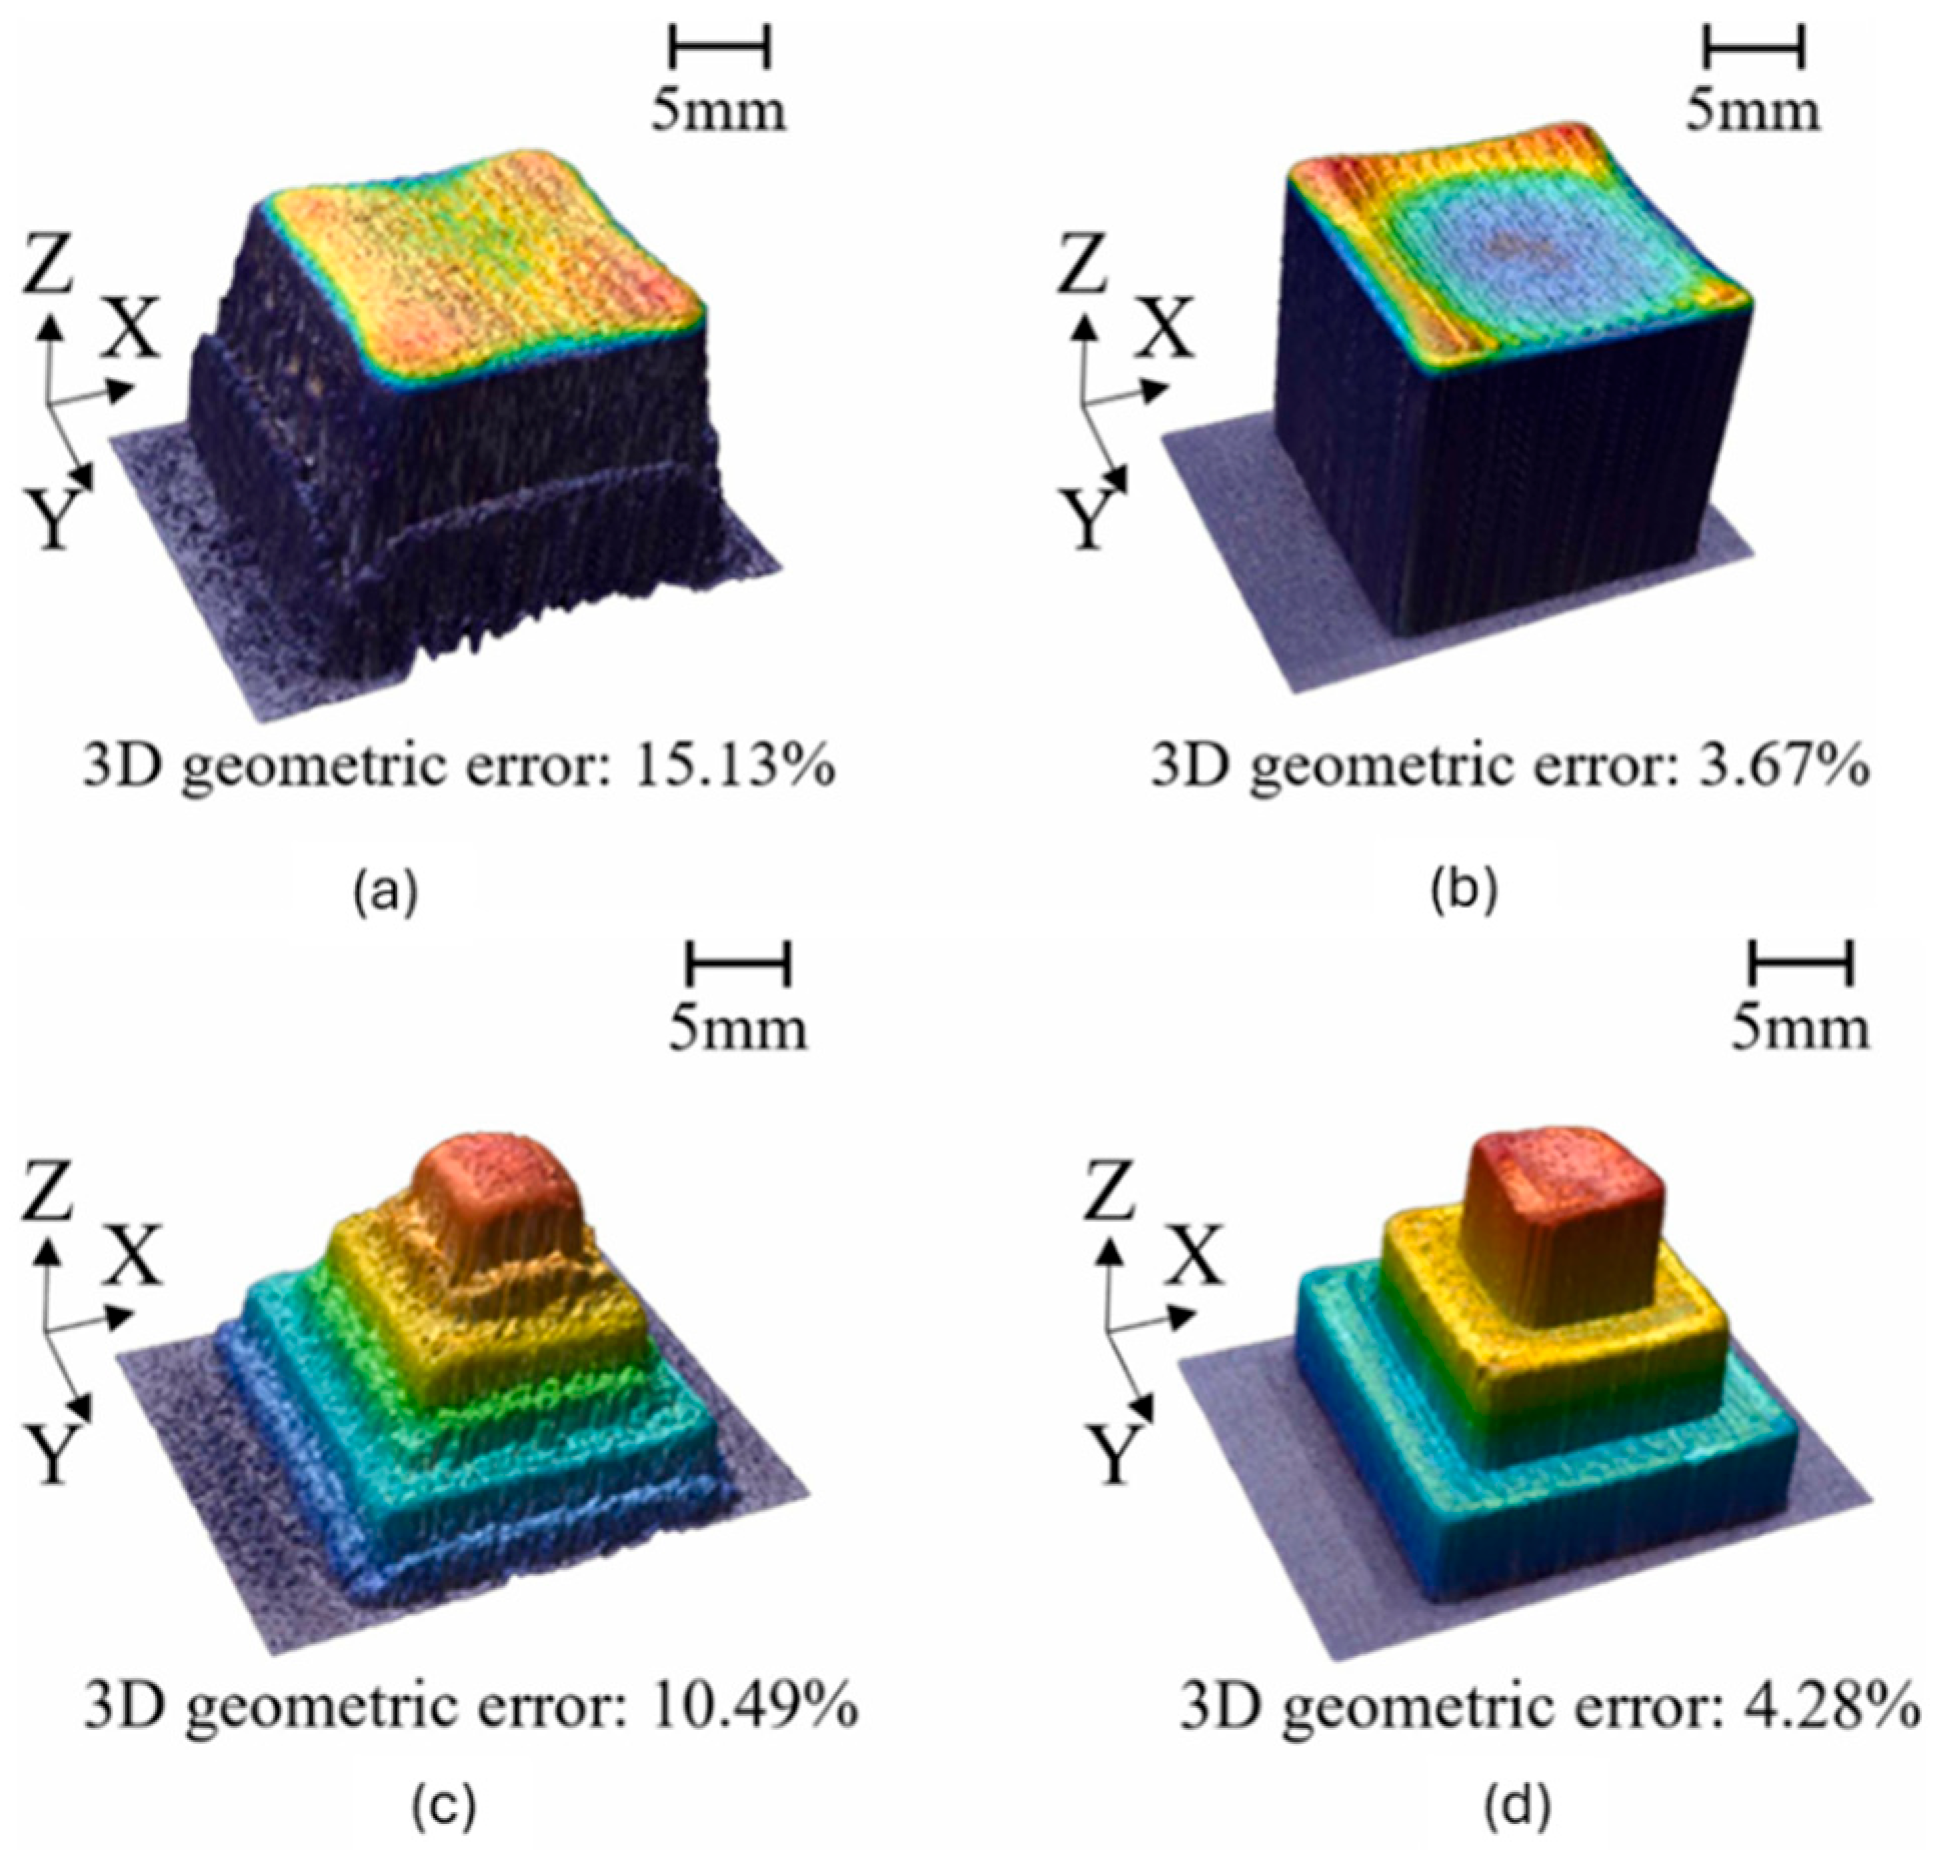
The system provided an efficient solution for enhancing the geometric precision of DED-LB-manufactured components (Figure 17). The system’s effectiveness was validated via testing on both cube and pyramid geometries, and significant improvements were observed in overall geometric accuracy. Indeed, 3D shape scans showed a reduction in the cube and pyramidal shape errors from 15.13 to 3.67% and 10.49 to 4.28 %, respectively.
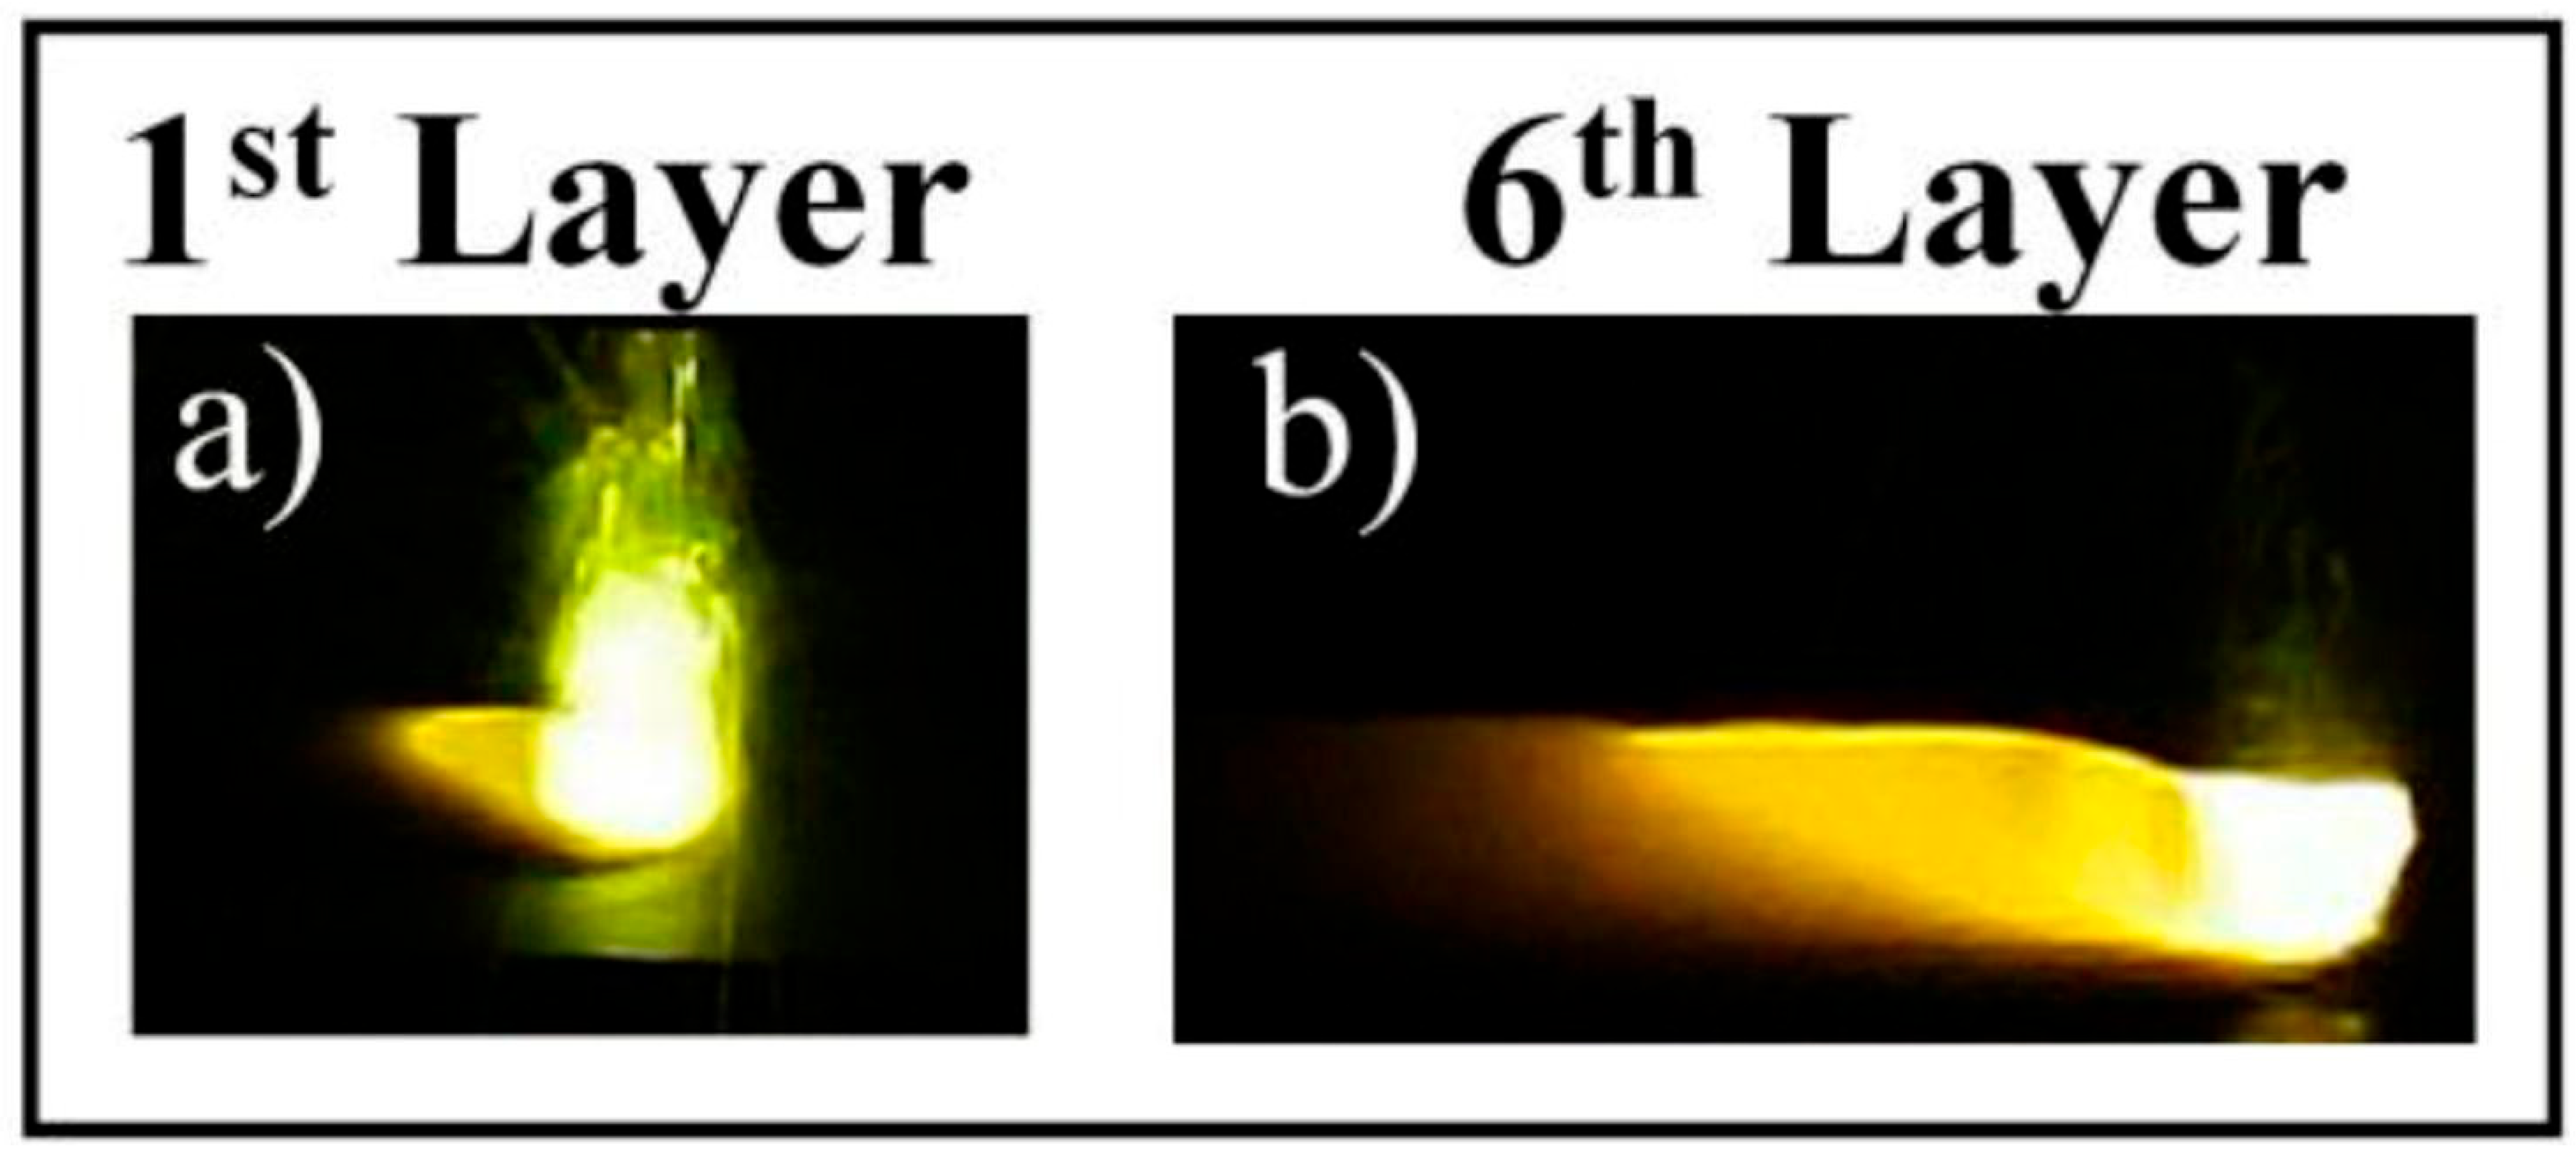
M. Lafirenza et al. [63] also devised a method to characterize the melt-pool height in real time for cost-effective control of clad height in 3D deposition processes. An in situ melt-pool height monitoring system using two CMOS cameras and based on real-time measurements was thus proposed to detect the laser head scanning direction, select the optimal camera for clad height measurement, predict the height error, and provide input for height compensation in the control system. The cameras of the USB130W01MT-MF40 (ELP, Shenzhen, China) type were equipped with a complementary CMOS image sensor, having a resolution of 1280 × 720 pixels, a 4 mm lens, and a frame rate of up to 30 Hz. One proceeds by performing melt-pool measurements from both cameras to acquire melt-pool height values. The spot area was calculated by an ellipse angle algorithm to identify and select the appropriate camera, which provided the most reliable height measurement. A height error compensation procedure, based on the average height percentage error and deposition scanning angle fitting, was then implemented for different scanning angles, and the corrected result served as an input for the real-time height control system. This approach was proven to be able to detect the laser head scanning direction angle and to appropriately correct the melt-pool height for different deposition angles.
Experimental results showed that the height measurement error was larger for the first layer compared to subsequent ones because of spatter and melt-pool instabilities, while multi-layer deposition exhibited greater stability, accuracy, and reduced spatter (Figure 18). Additionally, the relationship between the average height error percentage and deposition scanning angle could be established in the case of both single- and multi-layers. Thus, in the case of multi-layer deposition, the system could measure the clad height with an error of ±11% (i.e., ±91 μm).
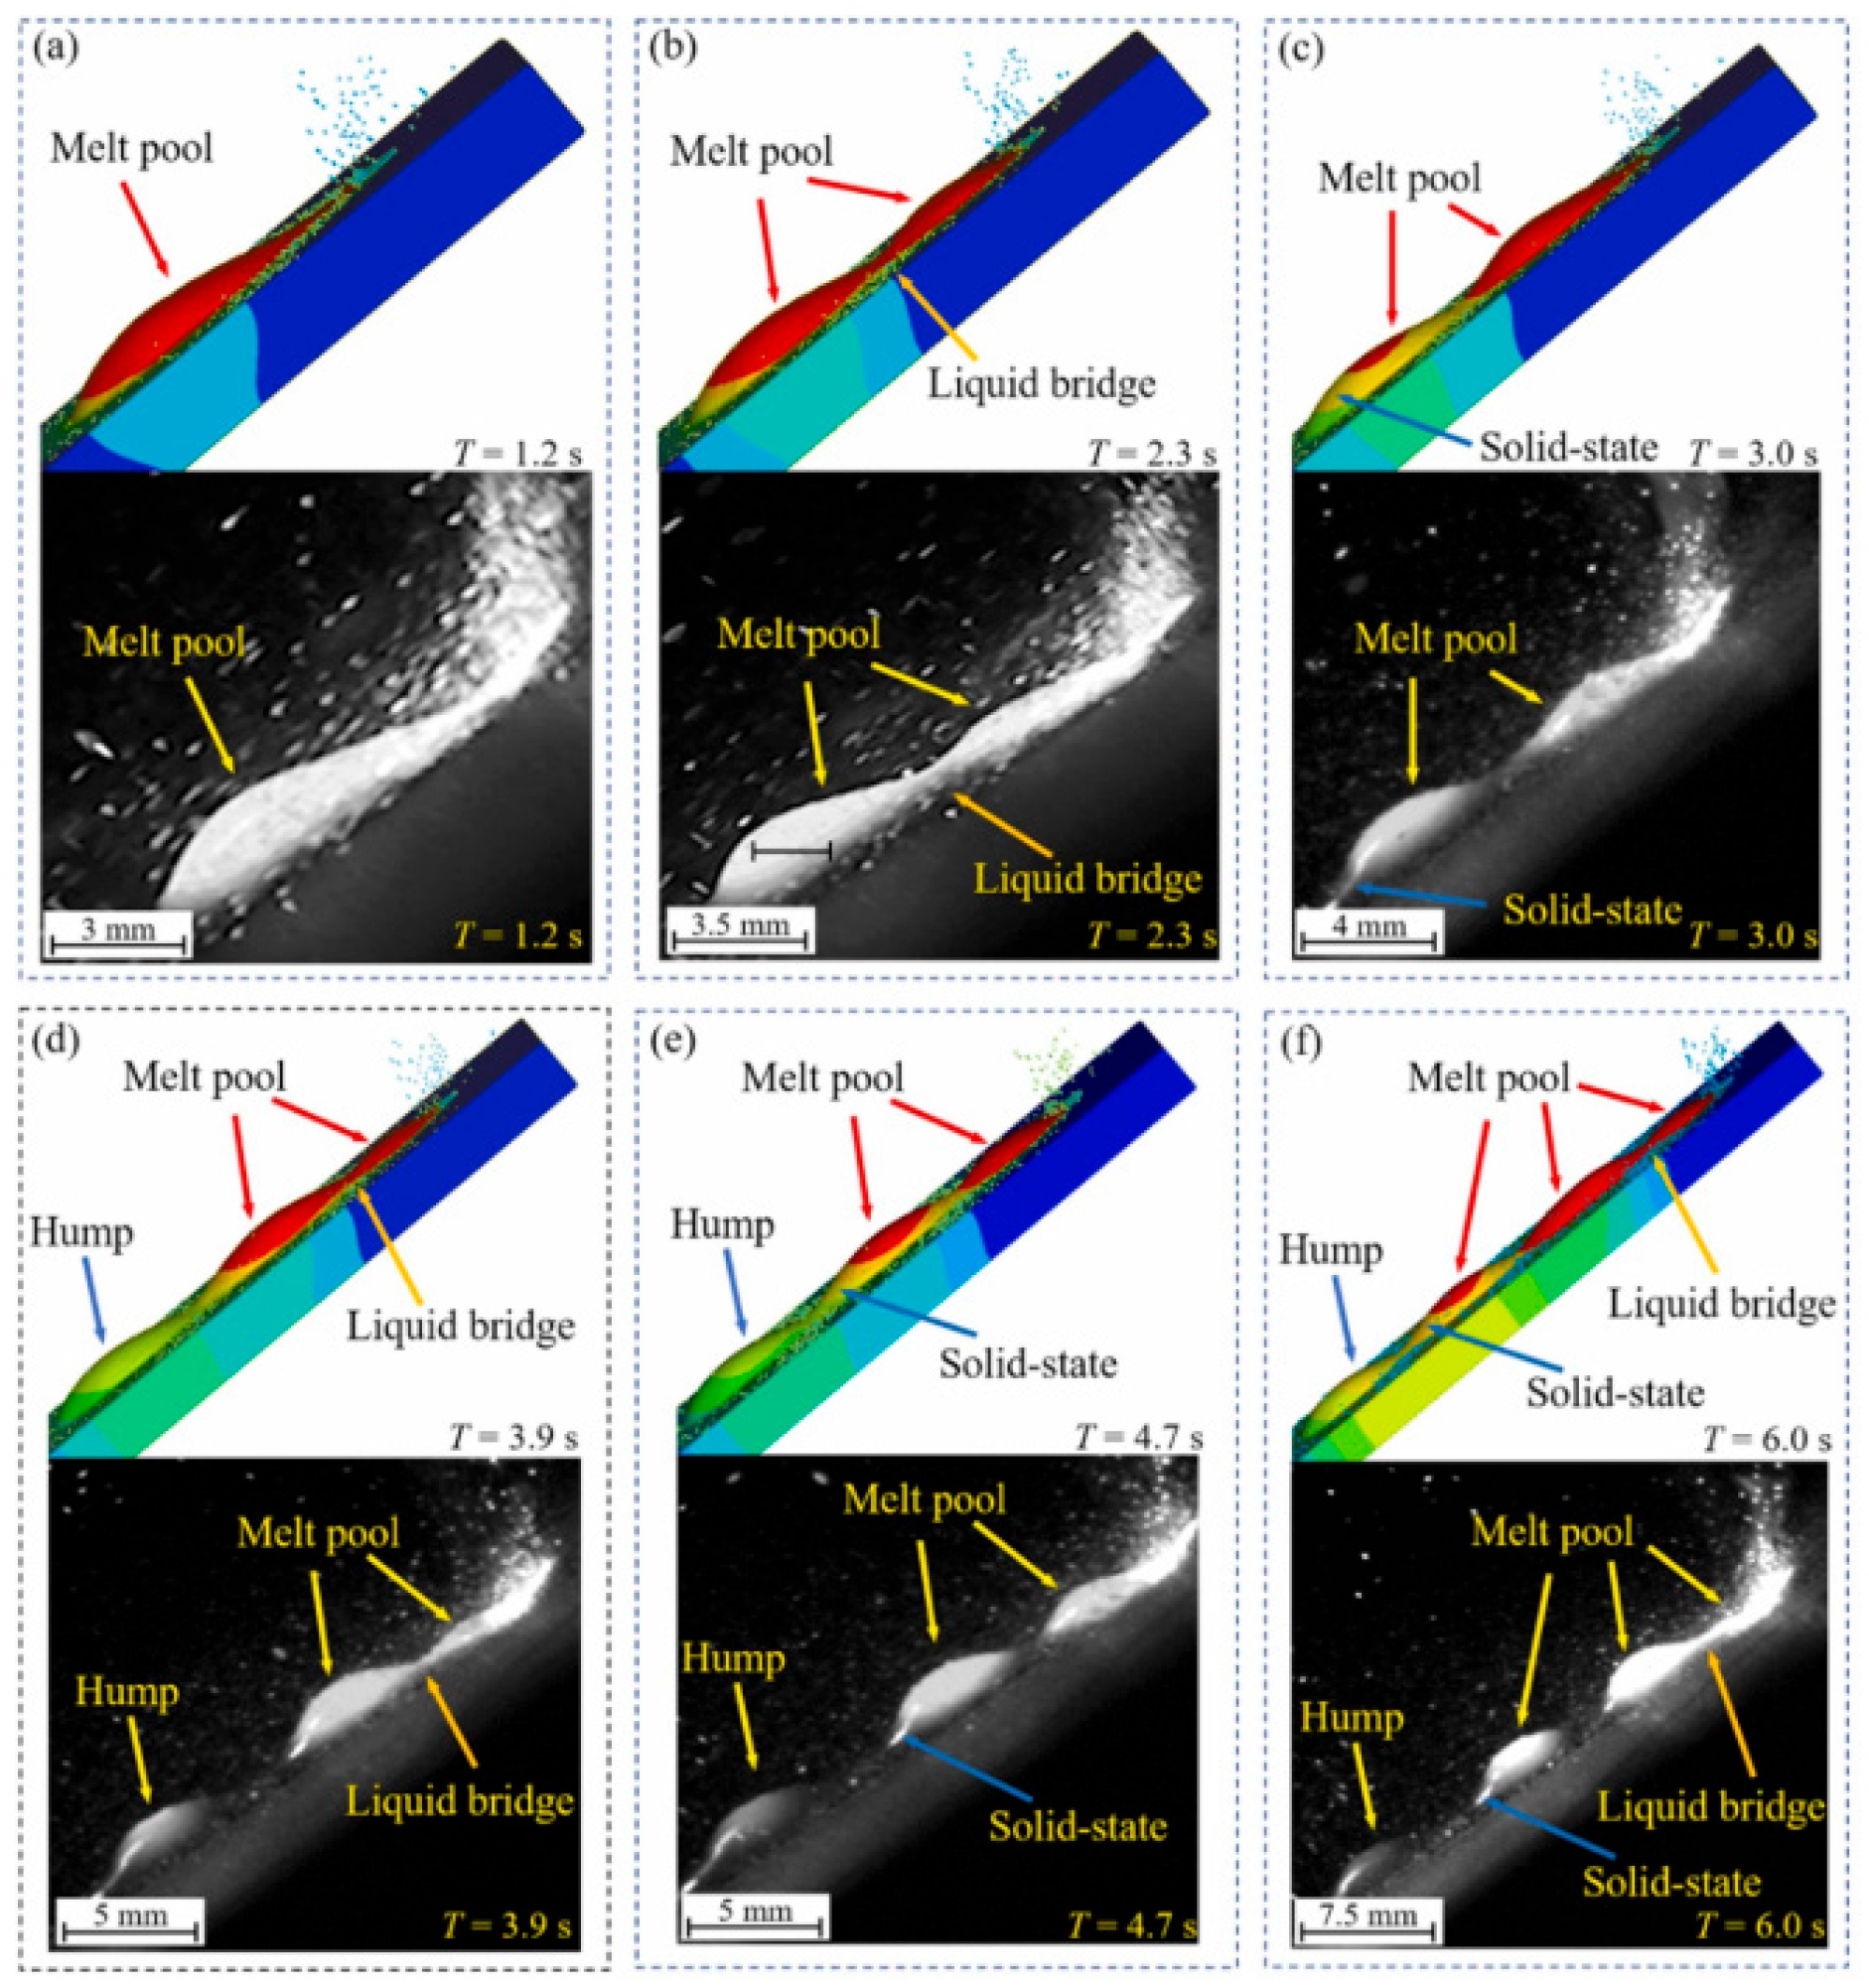
K. Zhao et al. [68] studied the fluid dynamics of the melt-pool under non-vertical irradiation (i.e., under oblique incidence on substrates) and developed a multi-physics numerical model to explore the mechanisms of melt-pool development. It was shown that as the inclination angle increased, deposited track fluctuations became more and more evident, with a critical angle of from 40° to 42.5° corresponding to hump formation. An increase was observed in the likelihood of humps and irregularities in the case of a smaller laser spot diameter, while larger spot diameters caused the expansion of the deposition layer and melt pool wettability enhancement.
To validate the effectiveness of the simulation model, a comparison was conducted between experimentally captured deposition layers using a Memrecan HX-7S (NAC, Tokyo, Japan) with an 808 nm laser illumination system (FC-W-808; CNI, Changchun, China), a high-speed camera, and theoretically simulated results for an inclination angle of 45°, laser power of 2500 W, and laser spot diameter of 3 mm. One notices from Figure 19a–f that the simulated melt-pool morphology of the deposition layer exhibits excellent agreement with the experimental results.

3.2.3. Mixed Temperature and Spatial Distribution Versus Modeling of the Melt Pool

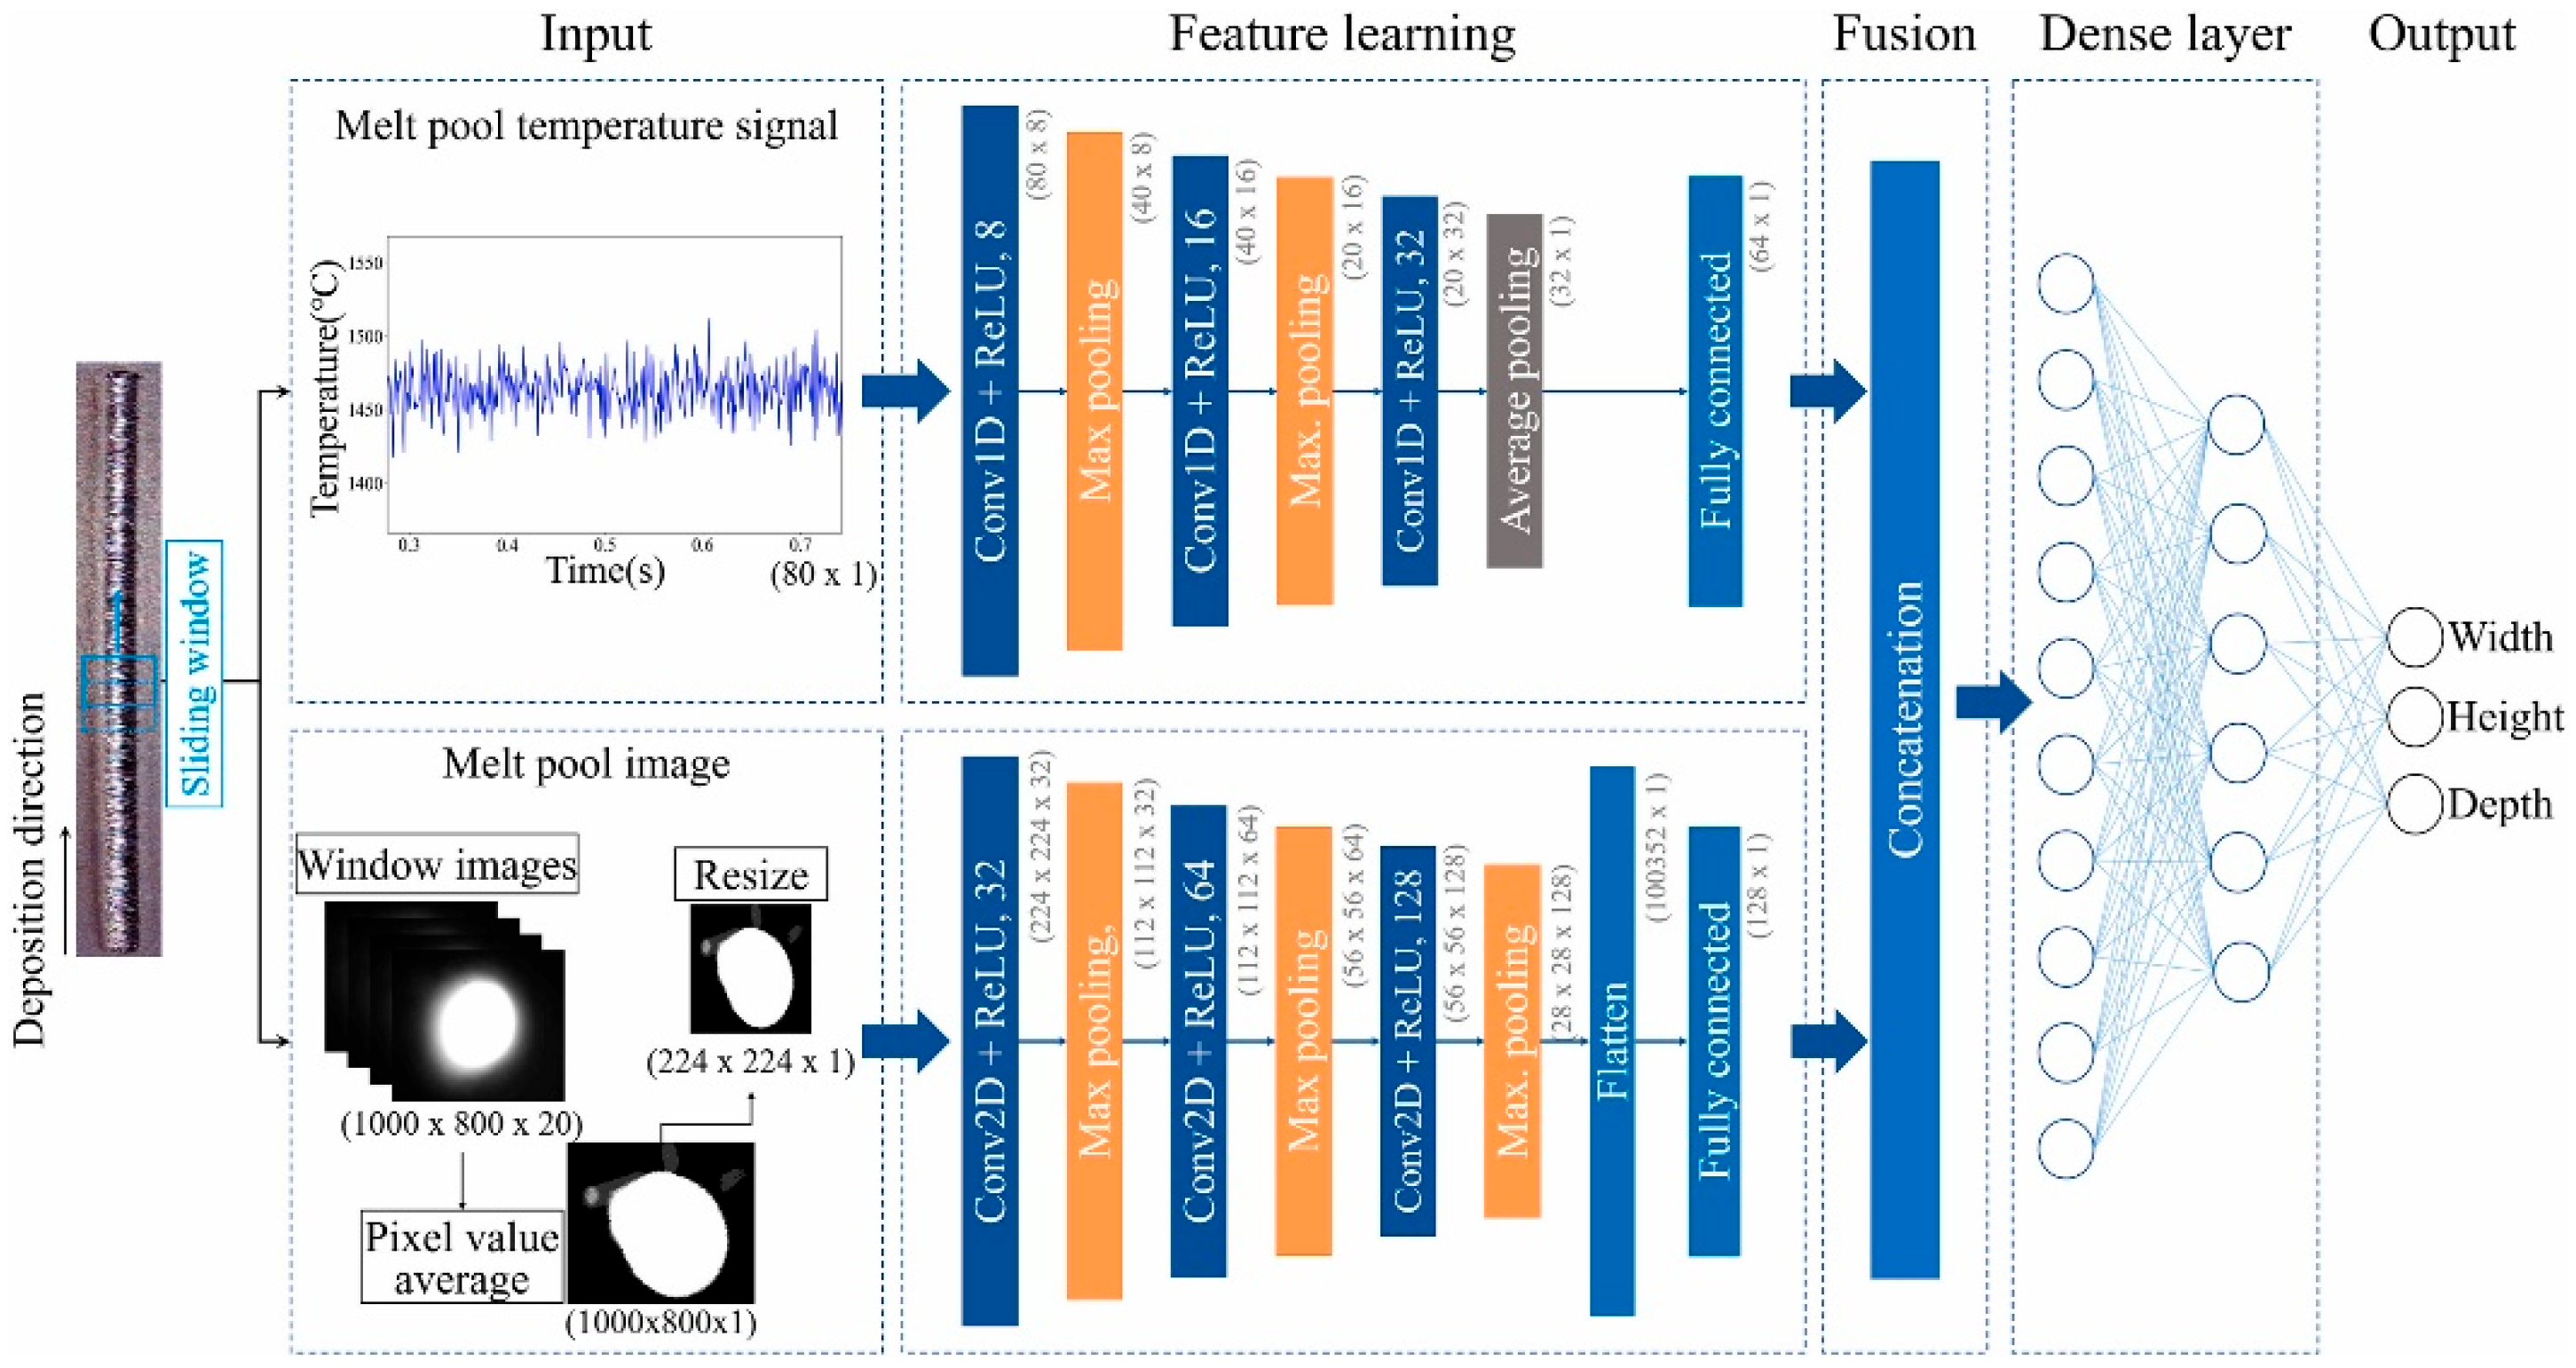
S. H. Ji et al. [64] integrated a two-color pyrometer and a CMOS vision camera on the deposition head of a robot, enabling the simultaneous acquisition of temperature and image data. A hybrid Convolutional Neural Network (CNN) regression model was introduced for data interpretation by combining 1D CNN-based temporal analysis with 2D CNN-based spatial feature extraction. A hybrid model was needed because the 1D CNN can capture temporal variations in process parameters, but it fails at bead height prediction due to the complex influence of process parameters. Also, the 2D CNN model, which leverages spatial image data, provides higher predictive performance but lacks the proper ability to incorporate dynamic variations over time. The original hybrid CNN regression model achieved the highest coefficient of determination (R2 = 0.988, 0.970, and 0.978 for bead width, height, and depth, respectively) as an outcome of integrating both feature sets. A CMOS camera (Basler, Ace1920-160um, Basler, Ahrensburg, Germany) and a two-color pyrometer (Sensortherm, M332, Steinbach, Germany) were used to record the melt-pool temperature during the single-bead deposition process with a sampling rate of 200 Hz. The assessed temperatures of the melt-pool were in the range of 1450–1700 °C. Laser power, scan speed, powder feed rate, process signatures (melt pool temperature and width), and process responses (bead width, height, and depth) were used to train the model in order to adapt the best bead geometry (Figure 20).

3.2.4. Detection of Anomalies and Instabilities: Melt-Pool Emission

P. Zhang et al. [65] designed a low-cost method for measuring the emission characteristics of the melt pool (average intensity and associated coefficient). A single track was used as a synthetic parameter for process monitoring in large-scale (industrial) applications instead of laser power, scanning velocity, or powder feeding regime. Stainless steel 316L was used for deposition, while a silicon photodiode (PDA10A2, Thorlabs Inc., Newton, NJ, USA) with a wavelength range of 200–1100 nm and 1000 Hz acquisition frequency was coaxially installed for detection inside the laser head. The laser beam could be ruled out under controlled conditions via a bandpass filter. Simultaneously, a two-color pyrometer (E1RH, Fluke Inc., Everett, WA, USA), a visible CCD camera (MQ013Xg-E2, Ximea Inc., Münster, Germany), and a CMOS high-speed camera (Y7-S3, IDT Inc., San Jose, CA, USA) were integrated within the DED-LB machine. A criterion was proposed on this basis corresponding to the parameter variations in terms of the emissions characteristics. Thus, if only one of the three most widely used processing parameters (i.e., laser power, scanning velocity, and powder feeding rate) changes while the other two remain constant, then an evaluation criterion can be formulated as follows:
(i).
A significant increase in emission intensity with a decrease in the variable coefficient (defined as the ratio of the standard deviation to the mean) corresponds to an increase in laser power;
(ii).
A decrease in both emission intensity and the variable coefficient corresponds to an increase in powder feeding rate;
(iii).
An increase in scanning speed does not correspond to any evident change in emission intensity but does correspond to an increase in the variable coefficient.
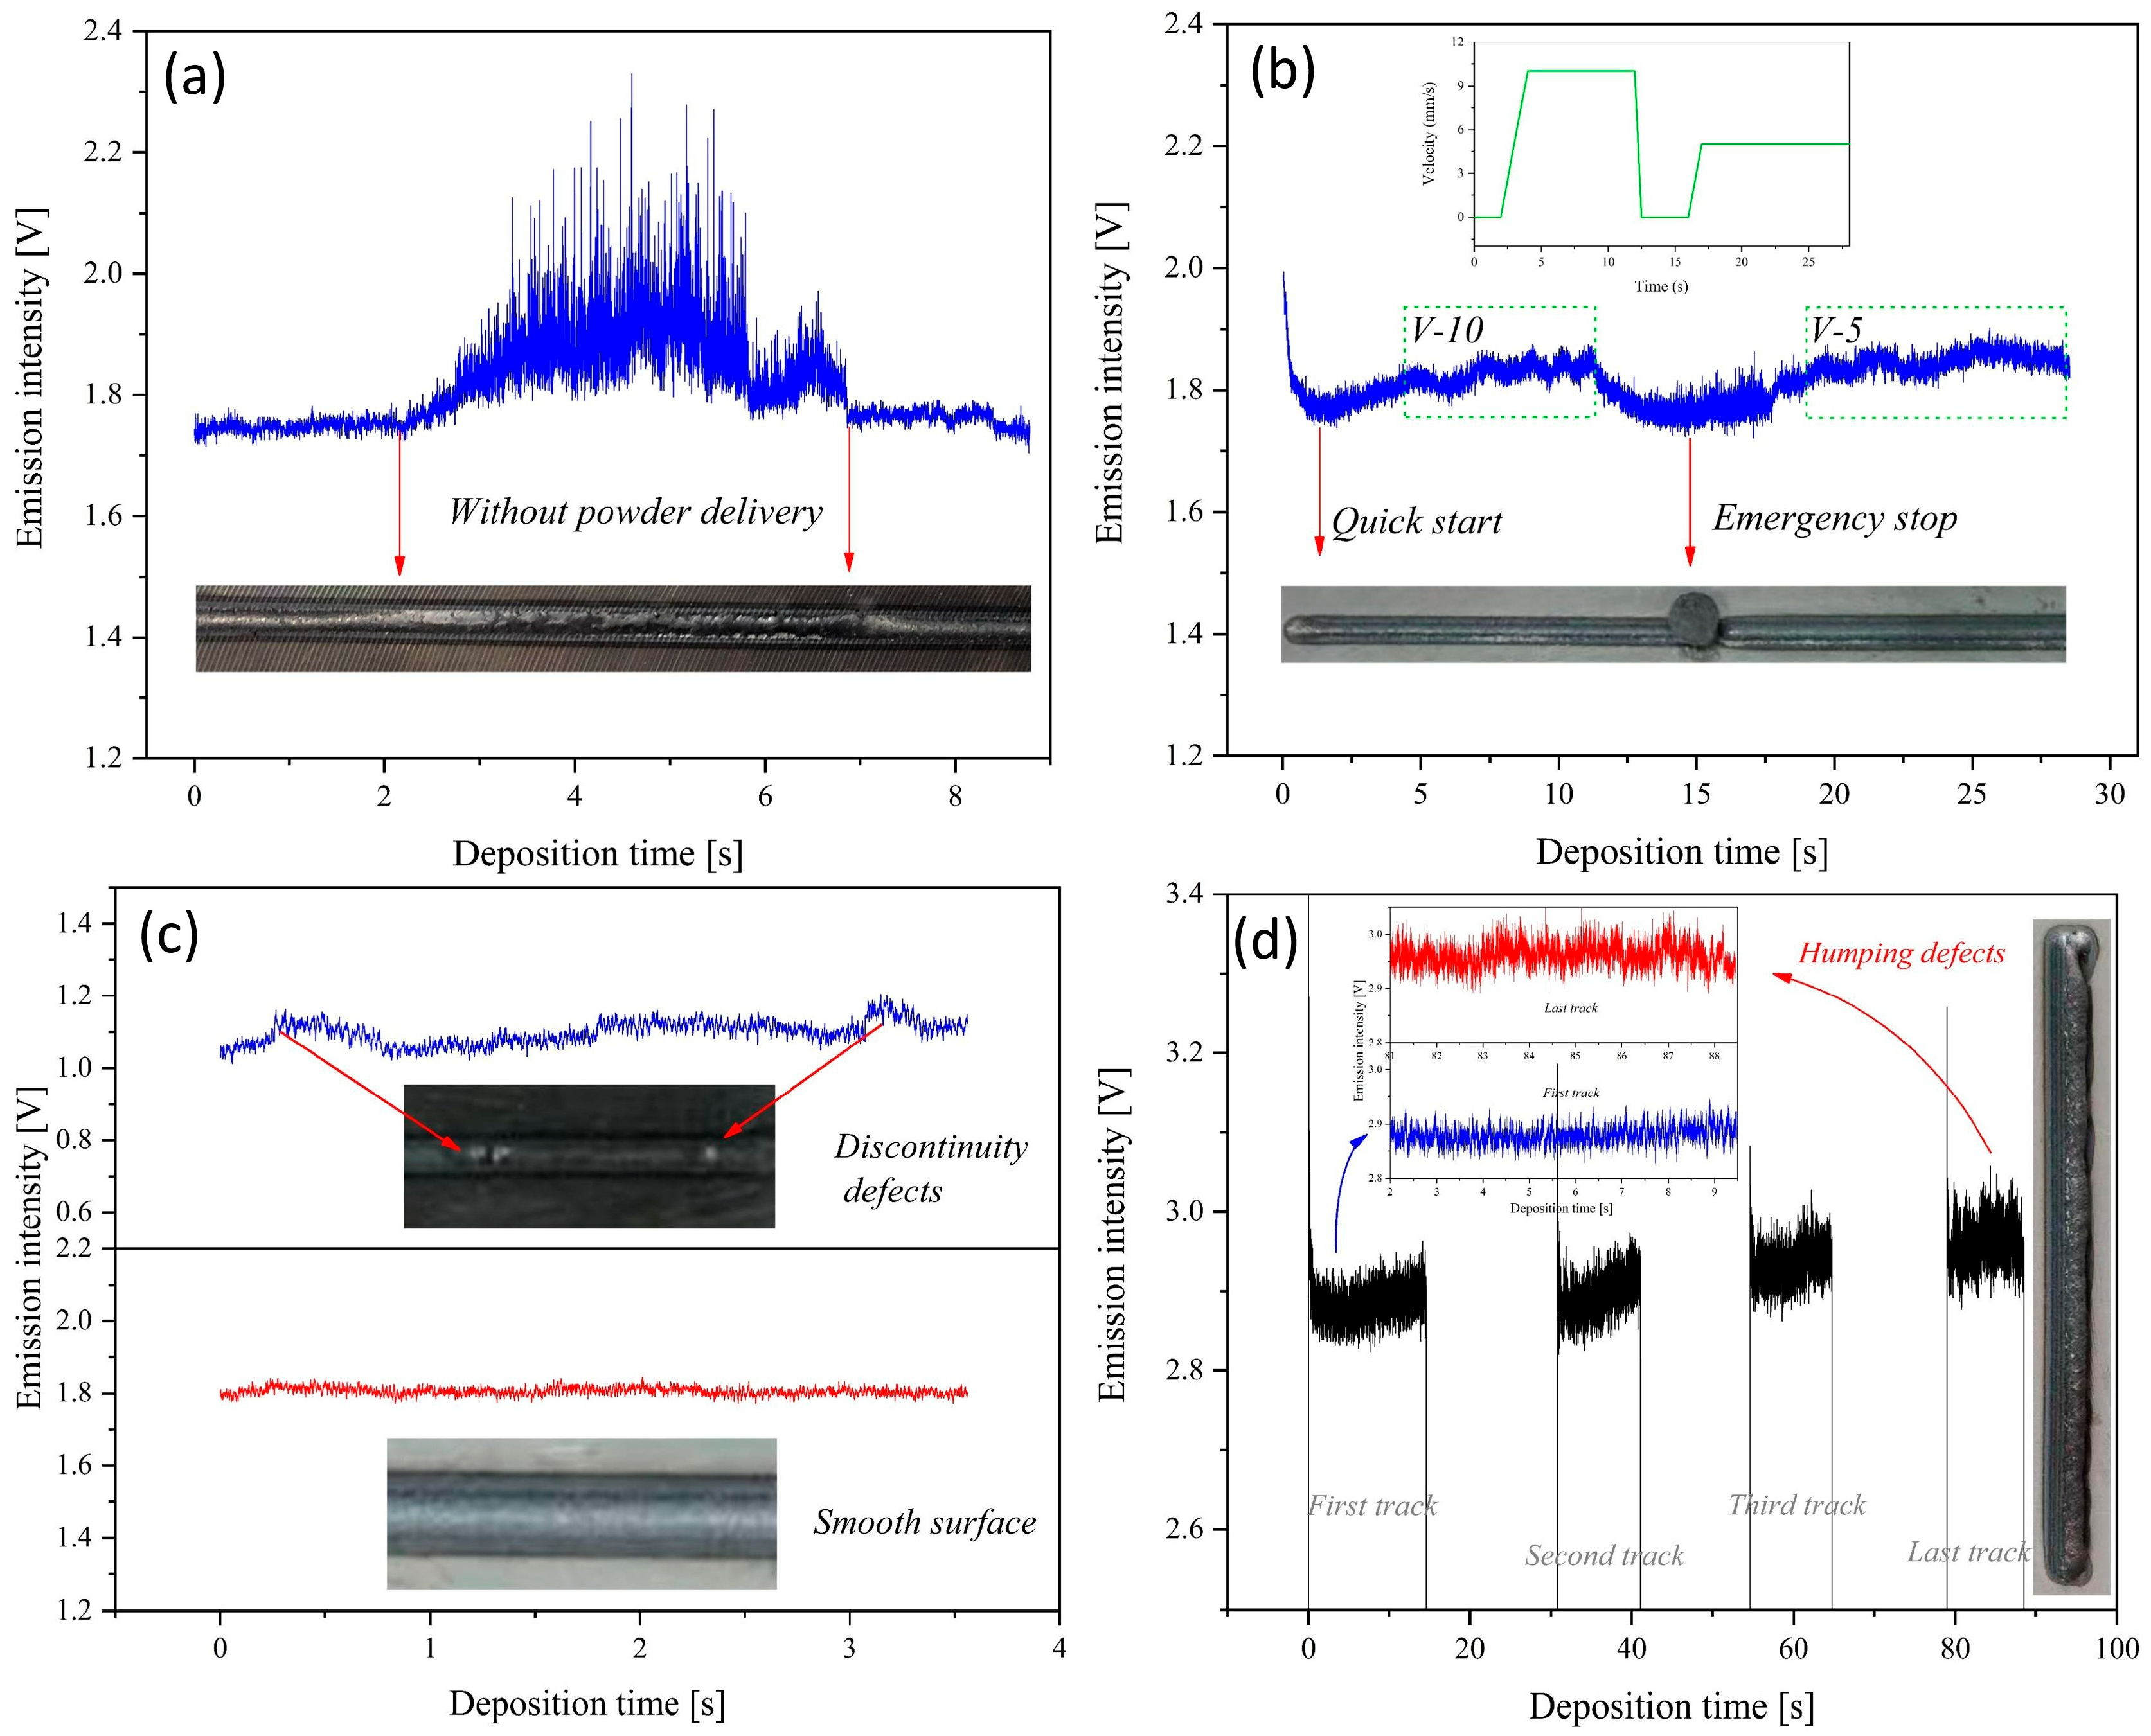
Despite differences in detection sensitivity, the proposed criterion is suitable for most processing conditions and allows for anomaly detection in DED-LB processes, using the photodiode measurement method only (Figure 21).
D. Sera Ertay et al. [66] used a high-dynamic-range camera in combination with a physical model to monitor the melt-pool signatures to predict the DED-LB process stability of stainless steel 316L. Attention was paid to the examination of process maps using an analytical model, in situ melt-pool monitoring, and ex situ characterization, respectively, in order to identify the process zones associated with instabilities, defects, and anomalies. Decisions can be taken on this basis to conduct, if possible, appropriate corrective actions (e.g., machining, re-manufacturing) or to scrap the manufactured part without ex situ characterization.
In practice, a mono-chrome XVC-1000 high-dynamic-range (HDR) weld camera (Xiris Automation, Burlington, ON, Canada) with a dimmable illumination was used for process monitoring via a green band filter inserted to select the 470–600 nm wavelength range, while a UV filter was additionally introduced to eliminate parasitic reflections. 3D surface topography of the deposition was carried out by confocal microscopy to extract the associated 2D profile. The modeling method was used to predict deposition width and height and normalized enthalpy to define theoretical feature geometry and process zones. It was shown that the balling and keyhole process zones can be detected just by using the melt-pool process signatures captured by the in situ vision sensors.

4. Conclusions

Image acquisition and fast processing of melt-pools during additive manufacturing under laser or electron beam irradiation were shown to provide unique, valuable characterization and control of the physical phenomena involved in the deposition of thin films. Relevant information with respect to temperature and spatial configuration of the melt-pool area and volume has been recently acquired and is now available from the exhaustive investigation of additive manufacturing of metals, allowing for efficient fabrication of high-performance parts for top technologies. In practice, a complete working procedure is now accessible from laboratory to industrial level, which provides relevant and valid optical and thermal data for appropriate characterization of fabricated parts. Special emphasis is currently put on intricate anomalies and associated defects, aiming for their attenuation until complete elimination. One therefore expects that imaging techniques for melt pool monitoring with machine learning integration will be widely adopted in industry, aiming for the fabrication of improved quality parts, free of defects, and more reliable production [69].
The biggest progress in the last 5 years in relation to melt-pool imaging was the introduction of artificial intelligence in image processing [70,71,72]. Large volumes of data can be interpreted and sorted, and features can be extracted or arranged in databases in real time. New information on multi-layer temperature evolution during laser or electron beam processing can be obtained or predicted [73], while in the past, this would have been impossible due to the large volumes of data that needed sorting and interpretation.
Significant, up-to-date results and development trends on these topics were compiled and systematized in this review in dedicated chapters and sections. Investigation methods and experimental setups involved were presented according to the two main cases of metal additive processing, i.e., laser direct energy deposition (DED-LB) and laser powder bed fusion (PBF-LB), respectively. The main conclusion coming up from the examination of results and the entire dedicated literature in the field is that optical techniques and procedures are now in order for real-time investigation of additive manufacturing processes. Adequate opportunities were introduced for fast and efficient intervention for correction of inadvertences causing the formation of different types of associated defects.

5. Prospective Development of Melt-Pool Imaging in Additive Manufacturing

The future is expected to change the way we use information. Till now, the imaging data valorization was mostly passive; the data were being collected, analyzed, and interpreted, and afterwards, a solution for a problem, such as porosity, balling, spatter, deformed deposition, or cracking, could be envisaged. From now on, the data would be interpreted in real time using AI recognition and algorithms for the correction of scanning or laser/electron beam parameters. Defects will be detected and corrected in real time without human intervention [74,75,76], while very complex data can be interpreted by AI software, such as geometry correction and measurement adjustments, depending on the angle of image acquisition. For example, the melt pool can appear as an ellipse in the recorded images because of the tilting angle of the camera, but an AI interpreter can correct the ellipse to a circle and adjust the measurement results.
Hardware is awaited to advance in order to allow for more accurate additive manufacturing melt-pool monitoring. High-fidelity multiphysics models will be developed to predict with high accuracy melt-pool instabilities (porosity, lack of fusion) and to help pre-tune laser parameters, thus drastically reducing trial and error [70,71,72,73,74,75,76,77,78,79,80,81,82,83,84,85]. In addition, combining NIR, visible, and X-ray imaging with thermal information will allow for more accurate defect identification or characterization of materials [76]. Moreover, these will provide complementary information to reconstruct melt-pool geometry, temperature fields, and subsurface features in 3D during a build.
The future of monitoring will be guided by the syntagm ‘defect prevention, not detections’ by focusing on early signals to trigger parameter corrections rather than post-build quality assessment [86,87]. This tight coupling of models and measurements will move imaging from passive monitoring to proactive control.
Costly trial-and-error experiments will be eliminated by future melt-pool imaging databases and classifiers that will indicate the proper process parameter windows [73,74,75].
For example, high-frame-rate cameras paired with efficient feature extraction will be able to provide info on more transitions by narrowing the dead zones between frames, and such monitoring devices will be part of the additive manufacturing machines.
Hopefully, the imaging techniques for melt-pool monitoring with machine learning integration will be more and more adopted in industry for all additive manufacturing applications using lasers and electron beams, and data will be shared for future standardization [69]. This will translate into improved quality assurance with certified technologies with end results like better part quality, fewer defects, and more reliable production, promoting additive manufacturing as a viable tool for large-scale industrial use. Improved additive manufacturing can help the scalability of the techniques, which can find use in space technologies, the aviation industry, and the biomedical field, where custom parts are essential.

Author Contributions

Conceptualization, A.C.P. and S.M.; methodology, A.C.P., S.M., P.V.T. and I.N.M.; formal analysis, A.C.P., S.M., P.V.T., A.-I.B., A.-C.R., S.A.A. and I.N.M.; investigation, A.C.P., S.M., P.V.T., A.-I.B., A.-C.R., S.A.A. and I.N.M.; resources, A.C.P.; writing—original draft preparation, A.C.P., S.M. and I.N.M.; writing—review and editing, A.C.P., S.M. and I.N.M.; supervision, A.C.P., S.M. and I.N.M.; project administration, A.C.P.; funding acquisition, A.C.P. All authors have read and agreed to the published version of the manuscript.

Funding

This work was supported by grants from the Romanian Ministry of Research, Innovation, and Digitalization under Romanian National Core Program LAPLAS VII-contract No. 30N/2023.

Data Availability Statement

No new data were created or analyzed in this study.

Acknowledgments

We acknowledge the support of the National Interest Infrastructure Facility, IOSIN-CETAL, at INFLPR.

Conflicts of Interest

The authors declare no conflicts of interest.

References

  1. Han, F.; Li, C.; Huang, J.; Wang, J.; Xue, L.; Wang, C.; Zhang, Y. Research Advances in Additively Manufactured High-Entropy Alloys: Microstructure, Mechanical Properties, and Corrosion Resistance. Metals 2025, 15, 136. [Google Scholar] [CrossRef]
  2. ISO/ASTM 52900:2021(en); Additive Manufacturing—General Principles—Fundamentals and Vocabulary. ISO: Geneva, Switzerland, 2021. Available online: https://www.iso.org/obp/ui/#iso:std:iso:5725:-1:ed-1:v1:en (accessed on 23 February 2026).
  3. Armstrong, M.; Mehrabi, H.; Naveed, N. An overview of modern metal additive manufacturing technology. J. Manuf. Process. 2022, 84, 1001–1029. [Google Scholar] [CrossRef]
  4. Klenam, D.; McBagonluri, F.; Asumadu, T.; Osafo, S.; Bodunrin, M.; Agyepong, L.; Osei, E.; Mornah, D.; Soboyejo, W. Additive manufacturing: Shaping the future of the manufacturing industry—Overview of trends, challenges and opportunities. Appl. Eng. Sci. 2025, 22, 100224. [Google Scholar] [CrossRef]
  5. Lolli, F.; Coruzzolo, A.M.; Peron, M.; Sgarbossa, F. Age-based preventive maintenance with multiple printing options. Int. J. Prod. Econ. 2022, 243, 108339. [Google Scholar] [CrossRef]
  6. Cantini, A.; Peron, M.; De Carlo, F.; Sgarbossa, F. A decision support system for configuring spare parts supply chains considering different manufacturing technologies. Int. J. Prod. Res. 2024, 62, 3023–3043. [Google Scholar] [CrossRef]
  7. Calignano, F.; Manfredi, D.; Ambrosio, E.P.; Biamino, S.; Lombardi, M.; Atzeni, E.; Salmi, A.; Minetola, P.; Iuliano, L.; Fino, P. Overview on Additive Manufacturing Technologies. Proc. IEEE 2017, 105, 593–612. [Google Scholar] [CrossRef]
  8. Attaran, M. The rise of 3-D printing: The advantages of additive manufacturing over traditional manufacturing. Bus. Horiz. 2017, 60, 677–688. [Google Scholar] [CrossRef]
  9. Gupta, A.; Sahu, S.; Ukey, P.; Kumar, A.; Gupta, V.K.; Sachdeva, A.; Kumar, N. Additive manufacturing for space applications: A review of processes, properties, and prospects. Acta Astronaut. 2025, 236, 1037–1062. [Google Scholar] [CrossRef]
  10. Khandpur, M.S.; Giubilini, A.; Iuliano, L.; Minetola, P. On the Use of Green and Blue Laser Sources for Powder Bed Fusion: State of the Art Review for Additive Manufacturing of Copper and Its Alloys. Metals 2024, 14, 1464. [Google Scholar] [CrossRef]
  11. Wei, Y.; Wen, Y.; Du, J.; Tian, Y.; Zhou, H.; Dong, X.; Shen, Z.; Liu, L.; Xiong, G.; Zhou, W.; et al. Melt pool behavior of pure copper-stainless steel multi-materials fabricated by the coaxial hybrid blue-infrared lasers additive manufacturing. J. Manuf. Process. 2024, 125, 50–63. [Google Scholar] [CrossRef]
  12. Ahn, D.-G. Directed Energy Deposition (DED) Process: State of the Art. Int. J. Precis. Eng. Manuf. Technol. 2021, 8, 703–742. [Google Scholar] [CrossRef]
  13. He, W.; Zhu, L.; Liu, C.; Jiang, H. Metal Additive Manufacturing and Molten Pool Dynamic Characterization Monitoring: Advances in Machine Learning for Directed Energy Deposition. Metals 2025, 15, 106. [Google Scholar] [CrossRef]
  14. Yazar, K.; Pawar, S.; Park, K.-S.; Choi, S.-H. Effect of process parameters on the clad morphology, microstructure, microtexture, and hardness of single layer 316 L stainless steel during direct energy deposition. Mater. Charact. 2022, 191. [Google Scholar] [CrossRef]
  15. Thompson, S.M.; Bian, L.; Shamsaei, N.; Yadollahi, A. An overview of Direct Laser Deposition for additive manufacturing; Part I: Transport phenomena, modeling and diagnostics. Addit. Manuf. 2015, 8, 36–62. [Google Scholar] [CrossRef]
  16. Xiao, R.; Guo, S.; Zheng, M.; Zhu, B.; Wu, Q.; Xu, J.; Huang, T. New method for high-efficiency keyhole-based wire direct energy deposition: Process innovation and characterization. J. Laser Appl. 2024, 36, 032017. [Google Scholar] [CrossRef]
  17. Soni, N.; Renna, G.; Leo, P. Advancements in Metal Processing Additive Technologies: Selective Laser Melting (SLM). Metals 2024, 14, 1081. [Google Scholar] [CrossRef]
  18. Kaščák, Ľ.; Varga, J.; Bidulská, J.; Bidulský, R.; Kvačkaj, T. A Review of Simulation Tools Utilization for the Process of Laser Powder Bed Fusion. Materials 2025, 18, 895. [Google Scholar] [CrossRef] [PubMed]
  19. Sefene, E.M. State-of-the-art of selective laser melting process: A comprehensive review. J. Manuf. Syst. 2022, 63, 250–274. [Google Scholar] [CrossRef]
  20. Ho, V.; Ladani, L.; Razmi, J.; Gruber, S.; Murphy, A.B.; Chen, C.; East, D.; Lopez, E. Powder Bed Fabrication of Copper: A Comprehensive Literature Review. Metals 2025, 15, 1114. [Google Scholar] [CrossRef]
  21. Shu, Z.; Dong, B.; Li, S.; Tian, C.; Wang, L.; Li, P.; Bian, Y.; He, X.; Yu, G. Influence of processing parameters on deposition stability and geometric morphology in micrometric wire laser directed energy deposition. Opt. Laser Technol. 2026, 193, 114249. [Google Scholar] [CrossRef]
  22. Shaikh, M.O.; Chen, C.-C.; Chiang, H.-C.; Chen, J.-R.; Chou, Y.-C.; Kuo, T.-Y.; Ameyama, K.; Chuang, C.-H. Additive manufacturing using fine wire-based laser metal deposition. Rapid Prototyp. J. 2020, 26, 473–483. [Google Scholar] [CrossRef]
  23. Sun, C.; Wang, Y.; McMurtrey, M.D.; Jerred, N.D.; Liou, F.; Li, J. Additive manufacturing for energy: A review. Appl. Energy 2021, 282, 116041. [Google Scholar] [CrossRef]
  24. Mehrpouya, M.; Tuma, D.; Vaneker, T.; Afrasiabi, M.; Bambach, M.; Gibson, I. Multimaterial powder bed fusion techniques. Rapid Prototyp. J. 2022, 28, 1–19. [Google Scholar] [CrossRef]
  25. Thijs, L.; Verhaeghe, F.; Craeghs, T.; Van Humbeeck, J.; Kruth, J.-P. A study of the microstructural evolution during selective laser melting of Ti–6Al–4V. Acta Mater. 2010, 58, 3303–3312. [Google Scholar] [CrossRef]
  26. Sanaei, N.; Fatemi, A. Defects in additive manufactured metals and their effect on fatigue performance: A state-of-the-art review. Prog. Mater. Sci. 2021, 117, 100724. [Google Scholar] [CrossRef]
  27. Mahmood, M.A.; Popescu, A.C.; Oane, M.; Chioibasu, D.; Popescu-Pelin, G.; Ristoscu, C.; Mihailescu, I.N. Grain refinement and mechanical properties for AISI304 stainless steel single-tracks by laser melting deposition: Mathematical modelling versus experimental results. Results Phys. 2021, 22, 103880. [Google Scholar] [CrossRef]
  28. Mahmood, M.A.; Popescu, A.C.; Oane, M.; Channa, A.; Mihai, S.; Ristoscu, C.; Mihailescu, I.N. Bridging the analytical and artificial neural network models for keyhole formation with experimental verification in laser melting deposition: A novel approach. Results Phys. 2021, 26, 104440. [Google Scholar] [CrossRef]
  29. Rehman, A.U.; Mahmood, M.A.; Pitir, F.; Salamci, M.U.; Popescu, A.C.; Mihailescu, I.N. Mesoscopic Computational Fluid Dynamics Modelling for the Laser-Melting Deposition of AISI 304 Stainless Steel Single Tracks with Experimental Correlation: A Novel Study. Metals 2021, 11, 1569. [Google Scholar] [CrossRef]
  30. Wu, Q.; Yang, F.; Lv, C.; Liu, C.; Tang, W.; Yang, J. In-Situ Quality Intelligent Classification of Additively Manufactured Parts Using a Multi-Sensor Fusion Based Melt Pool Monitoring System. Addit. Manuf. Front. 2024, 3, 200153. [Google Scholar] [CrossRef]
  31. Myers, A.J.; Quirarte, G.; Ogoke, F.; Lane, B.M.; Uddin, S.Z.; Farimani, A.B.; Beuth, J.L.; Malen, J.A. High-resolution melt pool thermal imaging for metals additive manufacturing using the two-color method with a color camera. Addit. Manuf. 2023, 73, 103663. [Google Scholar] [CrossRef]
  32. Hooper, P.A. Melt pool temperature and cooling rates in laser powder bed fusion. Addit. Manuf. 2018, 22, 548–559. [Google Scholar] [CrossRef]
  33. De Witt, D.P.; Nutter, G.D. Theory and Practice of Radiation Thermometry; John Wiley & Sons: Hoboken, NJ, USA, 1988; pp. 1–1138. [Google Scholar] [CrossRef]
  34. Krapez, J.C. Radiative measurements of temperature. In Thermal Measurements and Inverse Techniques; CRC Press, Taylor & Francis Group: Boca Raton, FL, USA, 2011; pp. 185–230. [Google Scholar] [CrossRef]
  35. Jorge, V.L.; Bendaoud, I.; Soulié, F.; Bordreuil, C. Rear Weld Pool Thermal Monitoring in GTAW Process Using a Developed Two-Colour Pyrometer. Metals 2024, 14, 937. [Google Scholar] [CrossRef]
  36. Fisher, B.A.; Lane, B.; Yeung, H.; Beuth, J. Toward determining melt pool quality metrics via coaxial monitoring in laser powder bed fusion. Manuf. Lett. 2018, 15, 119–121. [Google Scholar] [CrossRef] [PubMed]
  37. Yu, Y.; Wang, L.; Zhou, J.; Li, H.; Li, Y.; Yan, W.; Lin, F. Impact of fluid flow on the dendrite growth and the formation of new grains in additive manufacturing. Addit. Manuf. 2022, 55, 102832. [Google Scholar] [CrossRef]
  38. Müller, B.; Renz, U. Development of a fast fiber-optic two-color pyrometer for the temperature measurement of surfaces with varying emissivities. Rev. Sci. Instrum. 2001, 72, 3366–3374. [Google Scholar] [CrossRef]
  39. Araújo, A. Multi-spectral pyrometry—A review. Meas. Sci. Technol. 2017, 28, 082002. [Google Scholar] [CrossRef]
  40. Yeh, C.-H.; Liu, Y.-H. Development of Two-Color pyrometry for flame impingement on oxidized metal surfaces. Exp. Therm. Fluid Sci. 2024, 152, 111108. [Google Scholar] [CrossRef]
  41. Zhu, L.; Yin, C.; Huang, X.; Cao, J.; Hou, Z. High temperature measurements based on unknown spectral emissivity using a joint two-color and three-color pyrometry method. Int. J. Therm. Sci. 2025, 218, 110084. [Google Scholar] [CrossRef]
  42. Felice, R.A. Temperature Determining Device and Process. US6379038B1, 21 June 1999. [Google Scholar]
  43. De Iuliis, S.; Dondè, R.; Altman, I. On Pyrometry in Particulate-Generating Flames. Combust. Sci. Technol. 2022, 194, 1800–1814. [Google Scholar] [CrossRef]
  44. Ma, H.; Mao, Z.; Feng, W.; Yang, Y.; Hao, C.; Zhou, J.; Liu, S.; Xie, H.; Guo, G.; Liu, Z. Online in-situ monitoring of melt pool characteristic based on a single high-speed camera in laser powder bed fusion process. Appl. Therm. Eng. 2022, 211, 118515. [Google Scholar] [CrossRef]
  45. Terrazas-Nájera, C.A.; Romero, A.; Felice, R.; Wicker, R. Multi-wavelength pyrometry as an in situ diagnostic tool in metal additive manufacturing: Detecting sintering and liquid phase transitions in electron beam powder bed fusion. Addit. Manuf. 2023, 63, 103404. [Google Scholar] [CrossRef]
  46. Terrazas-Nájera, C.A.; Fernández, A.; Felice, R.; Wicker, R. On the thermal emissive behavior of four common alloys processed via powder bed fusion additive manufacturing. Addit. Manuf. 2024, 82, 104023. [Google Scholar] [CrossRef]
  47. Vallabh, C.K.P.; Zhao, X. Melt pool temperature measurement and monitoring during laser powder bed fusion based additive manufacturing via single-camera two-wavelength imaging pyrometry (STWIP). J. Manuf. Process. 2022, 79, 486–500. [Google Scholar] [CrossRef]
  48. Alam, J.; Zhang, H.; Zhao, X. Enhancing image processing in single-camera two-wavelength imaging pyrometry for advanced in-situ melt pool measurement in laser powder bed fusion. Precis. Eng. 2025, 93, 1–17. [Google Scholar] [CrossRef]
  49. Wang, N.; Zhang, M.; Bian, Y.; Zhu, R.; Shen, H. Orthogonal dual-channel single-camera spectral imaging for online measurement of three-dimensional space–time evolution of temperature field in laser melt pool. J. Manuf. Process. 2023, 85, 695–701. [Google Scholar] [CrossRef]
  50. Gordon, R.; Bender, R.; Herman, G.T. Algebraic Reconstruction Techniques (ART) for three-dimensional electron microscopy and X-ray photography. J. Theor. Biol. 1970, 29, 471–481. [Google Scholar] [CrossRef] [PubMed]
  51. Li, X.; Li, H.; Chen, X.; Shen, S.; Zhang, G.; Wei, H.; Hu, Y.; Li, Z.; Dai, L. In-situ multi-eye monitoring of melt pool temperature field in laser additive manufacturing by light field camera. Addit. Manuf. 2025, 102, 104747. [Google Scholar] [CrossRef]
  52. Lin, X.; Wang, Q.; Fuh, J.Y.H.; Zhu, K. Motion feature based melt pool monitoring for selective laser melting process. J. Mater. Process. Technol. 2022, 303, 117523. [Google Scholar] [CrossRef]
  53. Zhang, H.; Vallabh, C.K.P.; Zhao, X. Registration and fusion of large-scale melt pool temperature and morphology monitoring data demonstrated for surface topography prediction in LPBF. Addit. Manuf. 2022, 58, 103075. [Google Scholar] [CrossRef]
  54. Stajkovic, J.; Kahl, M.; Kaserer, L.; Braun, J.; Scheuringer, S.; Mayr-Schmölzer, B.; Distl, B.; Leichtfried, G. Correlating dimensionless enthalpy, pyrometry, and melt pool geometry within the laser powder bed fusion energetic regime: A path to in-situ melt pool control demonstrated on tungsten. J. Manuf. Process. 2025, 141, 1310–1323. [Google Scholar] [CrossRef]
  55. Li, J.; Zhang, K.; Liu, T.; Zhu, Z.; Zou, Z.; Wei, H.; Xiong, Z.; Yun, S.; Liao, W. A novel extraction and evaluation method for melt pool images in laser powder bed fusion. Opt. Laser Technol. 2025, 191, 113333. [Google Scholar] [CrossRef]
  56. Tempelman, J.R.; Wachtor, A.J.; Flynn, E.B.; Depond, P.J.; Forien, J.-B.; Guss, G.M.; Calta, N.P.; Matthews, M.J. Sensor fusion of pyrometry and acoustic measurements for localized keyhole pore identification in laser powder bed fusion. J. Mater. Process. Technol. 2022, 308, 117656. [Google Scholar] [CrossRef]
  57. Mitchell, J.A.; Ivanoff, T.A.; Dagel, D.; Madison, J.D.; Jared, B. Linking pyrometry to porosity in additively manufactured metals. Addit. Manuf. 2020, 31, 100946. [Google Scholar] [CrossRef]
  58. Myers, A.J.; Quirarte, G.; Beuth, J.L.; Malen, J.A. Two-color thermal imaging of the melt pool in powder-blown laser-directed energy deposition. Addit. Manuf. 2023, 78, 103855. [Google Scholar] [CrossRef]
  59. Sampson, R.; Lancaster, R.; Sutcliffe, M.; Carswell, D.; Hauser, C.; Barras, J. An improved methodology of melt pool monitoring of direct energy deposition processes. Opt. Laser Technol. 2020, 127, 106194. [Google Scholar] [CrossRef]
  60. García-Moreno, A.-I.; Alvarado-Orozco, J.-M.; Ibarra-Medina, J.; Martínez-Franco, E. In-process monitoring of the melt-pool motion during continuous-wave laser metal deposition. J. Manuf. Process. 2021, 65, 42–50. [Google Scholar] [CrossRef]
  61. Da Silva, A.; Frostevarg, J.; Kaplan, A.F. Melt pool monitoring and process optimisation of directed energy deposition via coaxial thermal imaging. J. Manuf. Process. 2023, 107, 126–133. [Google Scholar] [CrossRef]
  62. Shin, S.; Jeon, I.; Sohn, H. Enhanced geometric accuracy in directed energy deposition via closed-loop melt pool height control using real-time thermal imaging. Addit. Manuf. 2025, 109, 104846. [Google Scholar] [CrossRef]
  63. Lafirenza, M.; Zhang, W.; Soshi, M. Development of a cost-effective dual-camera real-time monitoring system for clad height control in 3D direct energy deposition processes. Manuf. Lett. 2025, 44, 904–914. [Google Scholar] [CrossRef]
  64. Ji, S.H.; Ko, T.H.; Yoon, J.; Lee, S.H.; Lee, H. Coaxial melt pool monitoring with pyrometer and camera for hybrid CNN-based bead geometry prediction in directed energy deposition. Precis. Eng. 2025, 94, 1–12. [Google Scholar] [CrossRef]
  65. Zhang, P.; Zhou, X.; Ma, H.; Hu, J.; He, Y.; Wang, X.; Duan, Y. Anomaly detection in laser metal deposition with photodiode-based melt pool monitoring system. Opt. Laser Technol. 2021, 144, 107454. [Google Scholar] [CrossRef]
  66. Ertay, D.S.; Naiel, M.A.; Vlasea, M.; Fieguth, P. Process performance evaluation and classification via in-situ melt pool monitoring in directed energy deposition. CIRP J. Manuf. Sci. Technol. 2021, 35, 298–314. [Google Scholar] [CrossRef]
  67. Canny, J. A Computational Approach to Edge Detection. IEEE Trans. Pattern Anal. Mach. Intell. 1986, 8, 679–698. [Google Scholar] [CrossRef]
  68. Zhao, K.; Chen, M.; Wang, Z.; Li, R.; Jia, Z.; Lan, H.; Sun, G. Investigation of thermal and fluid dynamics behaviors of melt pool during laser direct metal deposition on inclined substrates. Mater. Today Commun. 2024, 41, 110953. [Google Scholar] [CrossRef]
  69. Seifi, M.; Gorelik, M.; Waller, J.; Hrabe, N.; Shamsaei, N.; Daniewicz, S.; Lewandowski, J.J. Progress Towards Metal Additive Manufacturing Standardization to Support Qualification and Certification. JOM 2017, 69, 439–455. [Google Scholar] [CrossRef]
  70. Smoqi, Z.; Bevans, B.D.; Gaikwad, A.; Craig, J.; Abul-Haj, A.; Roeder, B.; Macy, B.; Shield, J.E.; Rao, P. Closed-loop control of meltpool temperature in directed energy deposition. Mater. Des. 2022, 215, 110508. [Google Scholar] [CrossRef]
  71. Montazeri, M.; Nassar, A.R.; Stutzman, C.B.; Rao, P. Heterogeneous sensor-based condition monitoring in directed energy deposition. Addit. Manuf. 2019, 30, 100916. [Google Scholar] [CrossRef]
  72. Gibson, B.T.; Bandari, Y.K.; Richardson, B.S.; Henry, W.C.; Vetland, E.J.; Sundermann, T.W.; Love, L.J. Melt pool size control through multiple closed-loop modalities in laser-wire directed energy deposition of Ti-6Al-4V. Addit. Manuf. 2020, 32, 100993. [Google Scholar] [CrossRef]
  73. Petrik, J.; Kavas, B.; Bambach, M. MeltPoolGAN: Auxiliary Classifier Generative Adversarial Network for melt pool classification and generation of laser power, scan speed and scan direction in Laser Powder Bed Fusion. Addit. Manuf. 2023, 78, 103868. [Google Scholar] [CrossRef]
  74. Yang, Z.; Lu, Y.; Yeung, H.; Krishnamurty, S. Investigation of deep learning for real-time melt pool classification in additive manufacturing. In Proceedings of the 2019 IEEE 15th International Conference on Automation Science and Engineering (CASE), Vancouver, BC, Canada, 22–26 August 2019; pp. 640–647. [Google Scholar] [CrossRef]
  75. Lane, B.; Yeung, H. Process Monitoring Dataset from the Additive Manufacturing Metrology Testbed (AMMT): “Three-Dimensional Scan Strategies”. J. Res. Natl. Inst. Stand. Technol. 2019, 124, 1–14. [Google Scholar] [CrossRef]
  76. Gaikwad, A.; Yavari, R.; Montazeri, M.; Cole, K.; Bian, L.; Rao, P. Toward the digital twin of additive manufacturing: Integrating thermal simulations, sensing, and analytics to detect process faults. IISE Trans. 2020, 52, 1204–1217. [Google Scholar] [CrossRef]
  77. Kim, J.; Yang, Z.; Lu, Y. A physics-guided deep generative model for predicting melt pool behavior in laser powder bed fusion additive manufacturing. J. Intell. Manuf. 2024, 36, 5715–5735. [Google Scholar] [CrossRef]
  78. Naderi, M.; Weaver, J.; Deisenroth, D.; Iyyer, N.; McCauley, R. On the Fidelity of the Scaling Laws for Melt Pool Depth Analysis During Laser Powder Bed Fusion. Integr. Mater. Manuf. Innov. 2022, 12, 11–26. [Google Scholar] [CrossRef]
  79. Wang, J.; Zhu, R.; Liu, Y.; Zhang, L. Understanding melt pool characteristics in laser powder bed fusion: An overview of single- and multi-track melt pools for process optimization. Adv. Powder Mater. 2023, 2, 100137. [Google Scholar] [CrossRef]
  80. Knapp, G.L.; Coleman, J.; Rolchigo, M.; Stoyanov, M.; Plotkowski, A. Calibrating uncertain parameters in melt pool simulations of additive manufacturing. Comput. Mater. Sci. 2023, 218, 111904. [Google Scholar] [CrossRef]
  81. Hussain, S.Z.; Kausar, Z.; Koreshi, Z.U.; Sheikh, S.R.; Rehman, H.Z.U.; Yaqoob, H.; Shah, M.F.; Abdullah, A.; Sher, F. Feedback Control of Melt Pool Area in Selective Laser Melting Additive Manufacturing Process. Processes 2021, 9, 1547. [Google Scholar] [CrossRef]
  82. Gadde, D.; Elwany, A.; Du, Y. Deep Learning to Analyze Spatter and Melt Pool Behavior During Additive Manufacturing. Metals 2025, 15, 840. [Google Scholar] [CrossRef]
  83. Scime, L.; Beuth, J. Using machine learning to identify in-situ melt pool signatures indicative of flaw formation in a laser powder bed fusion additive manufacturing process. Addit. Manuf. 2019, 25, 151–165. [Google Scholar] [CrossRef]
  84. Yuan, B.; Guss, G.M.; Wilson, A.C.; Hau-Riege, S.P.; DePond, P.J.; McMains, S.; Matthews, M.J.; Giera, B. Machine-Learning-Based Monitoring of Laser Powder Bed Fusion. Adv. Mater. Technol. 2018, 3, 1800136. [Google Scholar] [CrossRef]
  85. Xiao, Y.; Wang, X.; Yang, W.; Yao, X.; Yang, Z.; Lu, Y.; Wang, Z.; Chen, L. Data-driven prediction of future melt pool from built parts during metal additive manufacturing. Addit. Manuf. 2024, 93, 104438. [Google Scholar] [CrossRef]
  86. Tang, Z.-J.; Liu, W.-W.; Wang, Y.-W.; Saleheen, K.M.; Liu, Z.-C.; Peng, S.-T.; Zhang, Z.; Zhang, H.-C. A review on in situ monitoring technology for directed energy deposition of metals. Int. J. Adv. Manuf. Technol. 2020, 108, 3437–3463. [Google Scholar] [CrossRef]
  87. Sabzi, H.E.; Rivera-Díaz-Del-Castillo, P.E.J. Defect Prevention in Selective Laser Melting Components: Compositional and Process Effects. Materials 2019, 12, 3791. [Google Scholar] [CrossRef] [PubMed]
Figure 1. Temperature field for 316L stainless steel, IN718, and Ti-6Al-4V melt pools, recorded for a power of 300 W, scanning velocity of 1 m/s with 1.6 m/s argon flow, and no powder. Reprinted from Ref. [31].
Metals 16 00409 g001
Figure 2. (A) Temperature (black) and signal strength/emissivity (gray) plot recorded at λ  =  1500 nm for a single melt event during PBF-EB processing of Inconel 625, (B) signal strength/emissivity versus temperature plot with process phases color coded, and (C) spectral emissivity in the active range of the FMPI for selected data points indicated by colored arrows in (A). Reprinted from Ref. [45].
Metals 16 00409 g002
Figure 3. Spectral variation in signal strength/emissivity of a Ti6Al4V sample for four independent scans within +/− 5 °C of selected temperatures at (A) preheat (905 °C), (B) melt scan (1500 °C), (C) liquid (1615 °C), and (D) cooldown (1250 °C). Reprinted from Ref. [46].
Metals 16 00409 g003
Figure 4. Temperature evolution of a Ti6Al4V melt pool under multi-pulse laser irradiation versus time plots for fixed positions on the build plate with different parameter types. Time reference t = 0 s was set for the laser pulses’ impact moment onto the measurement point. Melting and boiling point positions of Ti6Al4V at atmospheric pressure are figured by horizontal dashed lines. Details on: (a) hatching scan; (b) end of first hatching scan line; (c) turn of end of scan line; (d) outer boarder scan, and (e) end of overhang scan. Reprinted from Ref. [32].
Metals 16 00409 g004
Figure 5. Average melt-pool temperature of the five printed fatigue bars corresponding to 49 layers, derived from the melt-pool intensity profiles acquired at the two working wavelengths of 550 and 620 nm. The red dashed lines indicate the approximate temporal boundaries for each printed fatigue bar. Reprinted with permission from ref. [47]. Copyright 2022 ELSEVIER LTD.
Metals 16 00409 g005
Figure 6. 3D temperature reconstruction result: (a) Cloud image of 3D temperature field (>1730 K, the melting point of 304 stainless steel), (b) Cross-sections of temperature distributions at different depths: (i) h1 = 0.022 mm, (ii) h2 = 0.088 mm, (iii) h3 = 0.154 mm and (iiii) h4 = 0.22 mm and (c) Evolution of maximum temperature of each cross-section with depth. Reprinted with permission from ref. [49]. Copyright 2023 ELSEVIER LTD.
Metals 16 00409 g006
Figure 7. In situ monitoring of melt-pool temperature for Ti6Al4V alloy with a laser power of 1800 W and laser scanning rates of 10 mm/s (a) and 1 mm/s (b). Reprinted with permission from ref. [51]. Copyright 2025 Elsevier.
Metals 16 00409 g007
Figure 8. Extraction procedure of the motion feature of the melt pool. Reprinted with permission from ref. [52]. Copyright 2022 ELSEVIER B.V.
Metals 16 00409 g008
Figure 9. Melt-pool area signature map in the case of a layer during printing of 5 fatigue bars. Reprinted with permission from ref. [53]. Copyright 2022 Elsevier.
Metals 16 00409 g009
Figure 10. Intensity-gradient image processing: (a) original image, (b) bilateral filter, (c) computing gradients, (d) non-maximum suppression, (e) determining the boundary, (f) removal of non-melt-pool boundary, (g) melt-pool region of interest (ROI), and (h) melt-pool area. Reprinted with permission from ref. [55]. Copyright 2025 ELSEVIER LTD.
Metals 16 00409 g010
Figure 11. Distribution of five texture features in different melt-pool states: (a) contrast (CON), (b) angular second moment (ASM), (c) correlation (COR), (d) inverse difference moment (IDM), and (e) entropy (ENT). Reprinted with permission from ref. [55]. Copyright 2025 ELSEVIER LTD.
Metals 16 00409 g011
Figure 12. Intentional cavities (a) versus 3D reconstructed volumes cavities by Design (b), μCT (c), Pyrometry (d). Reprinted with permission from ref. [57]. Copyright 2020 Elsevier.
Metals 16 00409 g012
Figure 13. Melt-pool thermal images with powder flow. (a) Melt-pool red-to-green temperature profiles taken along powder lengths and no-powder melt pools at the center line (power = 2000 W, velocity = 20 mm/s, and laser diameter = 3 mm) averaged in the case (across) twenty images taken with at least three different exposure times. (b) Image of the square powder pad, along with thermal fields imaged near the center of each scan in the pad. Reprinted from Ref. [58].
Metals 16 00409 g013
Figure 14. A series of melt-pool images for various laser powers was taken using the best exposure time. The laser power settings were (a) 600 W, (b) 750 W, (c) 900 W, (d) 1050 W, and (e) 1200 W. Reprinted from Ref. [59].
Metals 16 00409 g014
Figure 15. Stages of the molten pool tracking process. The first stage shows a printing process and the data acquisition using an infrared camera. The second stage illustrates the edge detection using the proposed algorithm based on the gravitational law. Then, the superpixels generation was carried out, and the molten pool was segmented into a single cluster. The third stage corresponds to the optical flow calculation, tracking this way, the molten pool. Reprinted with permission from ref. [60] Copyright 2021 ELSEVIER LTD.
Metals 16 00409 g015
Figure 16. Definition and calculation of the difference between the peak and boundary temperatures of the melt-pool: (a) thermal image of the melt pool with a marked peak temperature and melt pool boundary, and (b) cross-sectional temperature profile illustrating TD calculation. Reprinted with permission from ref. [62]. Copyright 2025 Elsevier.
Metals 16 00409 g016
Figure 17. 3D geometric comparison of the cube and pyramid models: (a,c) without control and (b,d) with closed-loop control Reprinted with permission from ref. [62]. Copyright 2025 Elsevier.
Metals 16 00409 g017
Figure 18. Camera frames from the 90-degree line production: (a) first layer melt pool and spatter; (b) sixth layer melt pool with less spatter influence. Reprinted from Ref. [63].
Metals 16 00409 g018
Figure 19. Simulated and experimental melt-pool morphology of deposition layer (inclination angle 45°). (a) T = 1.2 s, (b) T = 2.3 s, (c) T = 3.0 s, (d) T = 3.9 s, (e) T = 4.7 s, (f) T = 6.0 s. Reprinted with permission from ref. [68]. Copyright 2024 Elsevier.
Metals 16 00409 g019
Figure 20. Architecture and pre-processing of a hybrid CNN regression model with time-series and image data. Reprinted from Ref. [64].
Metals 16 00409 g020
Figure 21. Detection of process anomalies in single-track deposition. (a) Powder plugging; (b) emergency stop, (c) discontinuity, and (d) humping. Reprinted with permission from ref. [65]. Copyright 2021 ELSEVIER LTD.
Metals 16 00409 g021
Disclaimer/Publisher’s Note: The statements, opinions and data contained in all publications are solely those of the individual author(s) and contributor(s) and not of MDPI and/or the editor(s). MDPI and/or the editor(s) disclaim responsibility for any injury to people or property resulting from any ideas, methods, instructions or products referred to in the content.