


Abstract
High-lithium dual-phase Mg–Li alloys exhibit excellent lightweighting potential, but their relatively low strength limits practical applications. In this study, water-cooled friction stir processing (FSP) of rolled LA103Z was examined by combining experiments with three-dimensional finite element analysis in Deform 3D. The simulations were used to investigate material-flow trajectories and the spatial and temporal distributions of temperature, stress, and strain under the investigated processing conditions. The tracked material points exhibited a truncated-conical flow region, while the predicted temperature and accumulated strain were generally higher on the advancing side than on the retreating side. Tool diameter and rotational speed had stronger effects on the predicted peak-temperature level than traverse speed, whereas traverse speed mainly influenced the heating and cooling rates and temperature uniformity. The local thermomechanical histories were subsequently introduced into a previously established CDRX–ISV model for LA103Z to calculate β-Li grain-size and regularized dislocation-density evolution. The predicted grain sizes were compared with experimental measurements; the calculated dislocation-density histories are presented as model outputs and were not independently verified by direct dislocation measurements. The main contribution is the spatially resolved analysis of material flow and thermomechanical histories and their sequential use in microstructure-evolution modeling, rather than the first demonstration of FSP-induced refinement or strengthening in LA103Z.
1. Introduction
As the lightest metallic structural materials, Mg–Li alloys possess high specific stiffness, excellent damping capacity, and good low-temperature formability, making them attractive for lightweight and high-performance applications in aerospace, high-end equipment, new energy systems, and precision electronics [1,2]. However, Mg–Li alloys inherently exhibit low surface hardness and poor wear resistance. Under complex loading and reciprocating friction conditions, surface wear and degradation of the underlying material can readily occur, significantly reducing component service life and structural stability and thereby limiting their large-scale engineering applications [3]. Therefore, the development of efficient and reliable surface modification technologies to improve the surface microstructure and overall service performance of Mg–Li alloys is essential for overcoming these application limitations and facilitating their engineering implementation.
Friction stir processing (FSP), a solid-state surface modification and microstructure-strengthening technique derived from friction stir welding, has become a widely used approach for surface modification of lightweight alloys [4,5,6,7,8]. Through extrusion, shearing, and stirring actions, the rotating tool induces severe plastic flow within the processed region, promoting grain refinement, microstructure homogenization, and defect elimination, thereby improving the surface properties of the material [9,10,11]. LA103Z is a high-lithium-content Mg–Li alloy whose matrix is dominated by the β-Li phase. This phase is highly sensitive to processing temperature and plastic deformation conditions, and its microstructural evolution differs substantially from that of conventional magnesium alloys. Previous studies on the hot deformation behavior of the dual-phase Mg–Li alloy LA103Z have shown that it exhibits excellent plastic deformability over a wide range of processing parameters, making it suitable for severe plastic deformation strengthening processes. Nevertheless, the β-Li phase in LA103Z exhibits relatively low thermal stability against grain growth. When the FSP temperature exceeds 350 °C, recrystallized grains undergo pronounced grain-boundary migration and abnormal grain growth, resulting in grain coarsening and microstructural inhomogeneity, which can weaken or even counteract the strengthening effect of grain refinement [12]. Conventional FSP without auxiliary cooling involves concentrated heat input and prolonged exposure to elevated temperatures, readily causing thermal accumulation within the processed region and inducing grain coarsening and microstructural degradation in the β-Li phase. Consequently, achieving effective strengthening of high-lithium Mg–Li alloys remains challenging.
The distribution and evolution of physical fields, such as temperature and strain, during FSP are key factors governing the microstructure and mechanical properties of Mg–Li alloys; therefore, elucidating their coupled evolution is essential [13]. However, FSP is a severe plastic deformation process involving complex material flow under the action of the rotating tool, making it difficult to directly obtain the spatial distribution and temporal evolution of the relevant physical fields within the processed region through experimental methods. Finite element numerical simulation provides and effective means of quantitative characterizing these physical fields and analyzing the thermo-mechanical deformation behavior under different processing parameters, thereby providing a basis for process optimization [14,15].
Previous numerical studies have primarily focused on the distribution characteristics of individual physical fields during FSP of lightweight alloys. Asadi et al. [16] established an Arrhenius constitutive model based on hot compression tests of AZ91 at temperatures ranging from 200 to 400 °C and strain rates from 0.01 to 1 s−1, and subsequently used numerical simulation to predict the temperature and equivalent strain distributions during FSP, followed by experimental validation. Ansari et al. [17] employed an efficient coupled Eulerian–Lagrangian finite element model to investigate FSP, while Tutunchilar et al. [18] used point tracking in Deform to analyze material-flow patterns. Xue et al. [19] combined microstructural characterization and finite element simulation to examine the asymmetric thermomechanical fields and microstructure of friction-stir-welded joints. In addition, previous experimental studies have directly investigated single-pass sub-merged FSP of LA103Z. Li et al. [20] examined the effects of tool size, rotational speed, and traverse speed on microstructure and tensile properties, while Li et al. [21] reported the microstructural evolution and tensile behavior of FSPed LA103Z, including α-Mg redistribution and the formation of grain-boundary layers. These studies established the effects of submerged FSP on grain refinement, phase evolution, and mechanical properties of LA103Z. Accordingly, these phenomena are not claimed as the primary novelty of the present work. However, the three-dimensional material-flow trajectories and the local transient thermomechanical histories, together with their use in spatially resolved microstructure-evolution prediction, warrant further investigation.
Building on the previous experimental studies of LA103Z, the present work focuses on the three-dimensional material-flow behavior and the spatial evolution of thermomechanical fields during water-cooled FSP. A Deform 3D finite element model was used to analyze material trajectories and the distributions of temperature, stress, and strain under different processing conditions. The temperature, strain, and strain-rate histories at selected tracking points were then sequentially introduced into the previously established CDRX–ISV model for LA103Z [12] to calculate the evolution of β-Li grain size and regularized dislocation density. Thus, the principal contribution is the application of this sequential numerical framework to relate local process histories to the heterogeneous material flow and predicted microstructure evolution during water-cooled FSP; it is not the first demonstration of FSP-induced microstructural refinement or strengthening in LA103Z. The results provide further insight into the spatial heterogeneity of the thermomechanical response and its relationship with microstructural evolution.
2. Materials and Methods
2.1. Experimental Procedures
The base metal (BM) used in this study was a rolled LA103Z sheet produced by Xi’an Sifang Ultralight Material Co., Ltd. in Xi’an, China, with dimensions of 300 mm in length, 100 mm in width, and 4 mm in thickness. Its chemical composition is listed in Table 1. During hot processing, the grain size of the β-Li phase in LA103Z is highly sensitive to the deformation temperature, and grain growth readily occurs when the deformation temperature exceeds 350 °C [12].
Table 1.
Composition of LA103Z sheet (wt%).
To suppress recrystallized grain growth in the stir zone (SZ), underwater FSP with effective cooling capability was employed in this study. Two tools with plain shoulders and conical threaded pins produced by Beijing Tanrand New Materials Technology Co. in Beijing, China, were used, as shown in Figure 1, and their detailed dimensions are listed in Table 2. Figure 2a schematically illustrates the single-pass underwater FSP process. The cooling water was continuously circulated to ensure rapid heat dissipation from the material in the FSP region. The side on which the tool rotation direction coincides with the traverse direction was defined as the AS, whereas the opposite side was defined as the RS. During FSP, the spindle was tilted backward by 3°. The tool rotated counterclockwise, the traverse direction was parallel to the rolling direction (RD), and the plunge depth was maintained at 0.4 mm.
Figure 1.
FSP tools used in the experiments: (a) Tool A, (b) Tool B.
Table 2.
Dimensions of the FSP tools.
Figure 2.
(a) Schematic illustration of the FSP process and (b) dimensions of the tensile specimen (units: mm).
The observation plane of the FSPed samples was the cross-section of the processed region perpendicular to the processing direction, and the sampling location was selected at the center of the SZ. Metallographic observations were performed using a LEICA DM6 optical microscope produced by Leica Microsystems GmbH, Wetzlar, German. Quantitative elemental distribution analysis was conducted using a JXA-8530F PLUS electron probe microanalyzer (EPMA) produced by JEOL Ltd., Akishima, Japan. Scanning electron microscopy (SEM) and electron backscatter diffraction (EBSD) analyses were performed using a JSM-7800F instrument produced by JEOL Ltd., Akishima, Japan. The EBSD coordinate system was set to be consistent with the red coordinate system in Figure 2a. Hardness measurements were conducted using an HVS-1000A micro-Vickers hardness tester produced by Laizhou Huayin Testing Instrument Co., Ltd., Laizhou, China, with a test force of 200 g and a holding time of 15 s. Room-temperature tensile tests were performed using a SANS CMT-5015 universal testing machine produedc by SANS Testing Machine Co., Ltd., Shenzhen, China, with three specimens tested for each group at an initial strain rate of 1 × 10⁻³ s−1. The tensile specimens were dumbbell-shaped with a rectangular cross-section and a thickness of 2 mm. Specimens were cut from the central region of the sheet width and thickness from both the BM and FSPed regions. The detailed sampling method and specimen dimensions are shown in Figure 2b, where PD denotes the processing direction. The α-Mg and β-Li phases were distinguished using the phase-indexed EBSD maps. The phase fractions were calculated from the indexed area fractions of the corresponding phases. Phase-specific grain-size distributions were obtained by recon-structing grains from the EBSD orientation maps and analyzing the resulting phase-separated grain maps. To examine overall differences among the ten conditions, Welch’s one-way analysis of variance (ANOVA) was applied separately to YS, UTS, and EL. Pairwise Welch t-tests were then used to compare each FSP condition with the BM, with Holm adjustment for multiple comparisons within each property. A significance threshold of adjusted p < 0.05 was used. Because only three specimens were tested per condition, the inferential analyses are exploratory and should be interpreted cautiously. The 2 mm thickness specified in Figure 2b refers to the tensile coupon geometry used for post-processing mechanical tests.
The processing direction was parallel to the RD of the material. The FSP parameters are listed in Table 3. Throughout the manuscript, the FSP conditions are designated using the tool–rotational speed–traverse speed format. For example, A-1000-100 denotes processing using Tool A at a rotational speed of 1000 rpm and a traverse speed of 100 mm/min along the RD.
Table 3.
FSP parameters used for processing the LA103Z alloy.
2.2. Numerical Simulation: Establishment of the FSP Finite Element Model
Three-dimensional models of the LA103Z sheet and FSP tool were established using UG NX. The dimensions of the sheet in the numerical model were 200 × 50 × 4 mm to limit computational cost. The threads on the tool pin were also neglected. The tool was positioned above the centerline of the sheet, with its center located 1 mm above the top surface and 15 mm from the sheet edge in the width direction, and the tool tilt angle was set to 3°. The model was subsequently imported into Deform 3D, as shown in Figure 3. The reduced in-plane dimensions mean that the numerical model represents a local processing domain rather than the full experimental plate; the influence of the truncated end and lateral boundaries was not independently quantified and is therefore a limitation of the model.
Figure 3.
Finite element model for FSP of LA103Z.
The LA103Z sheet and the tool were discretized separately. Because severe plastic deformation occurs in the processed region, excessive mesh distortion during the simulation can significantly reduce the simulation accuracy and may even lead to simulation failure. Therefore, mesh refinement was applied to the processed region, including the vicinity of the pin and the region beneath the shoulder, as well as the adjacent regions. The sheet was discretized into approximately 100,000 elements and 18,000 nodes, whereas the tool was discretized into approximately 32,000 elements and 7000 nodes. A single mesh resolution was used in the present simulations; a systematic mesh-convergence study was not conducted. Accordingly, the predicted local field magnitudes should be interpreted with the discretization limitation in mind, while the comparisons among processing conditions are discussed primarily in terms of relative trends and spatial distributions.
During processing, the nodes on the bottom surface of the sheet were constrained to zero velocity in the X, Y, and Z directions. Contact between the tool and the sheet was defined as to non-separable. The simulated processing parameters were identical to those used in the FSP experiments (Table 3). According to the actual experimental procedure, the FSP process was divided into three steps: plunging, preheating, and traversing. First, the rotating tool was plunged at a speed of 10 mm/s. When the plunge depth reached 0.4 mm, the tool rotated in place for 5 s for preheating, increasing the material temperature to above 235 °C. The traversing stage was then initiated, during which the tool moved along the +X direction over 70 mm.
The constitutive behavior of LA103Z was described using an Arrhenius-type constitutive model. The heat-generation model accounted for frictional heat generation at the bottom surface of the shoulder, the side surface of the pin, and the bottom surface of the pin, whereas heat generated by plastic deformation was neglected as a modeling simplification [22]. Tool–workpiece contact was described using a constant shear-friction model with a friction factor of m = 0.45 [23]. In the cited DEFORM-based friction-stir welding study, this value provided the closest agreement between calculated and measured axial forces among the three friction factors examined (0.30, 0.45, and 0.60). The tool–workpiece heat-transfer coefficient was set to 11 N·s−1·mm−1·°C−1, following the value reported in a separate DEFORM-based FSW model [24]. For the water-cooled configuration, the bottom surface of the sheet exchanged heat with the backing plate using an effective coefficient of 0.06 N·s−1·mm−1·°C−1, whereas the other exposed surfaces exchanged heat with the continuously circulated cooling water using an effective coefficient of 0.4 N·s−1·mm−1·°C−1. These two boundary conditions represent the distinct heat-removal paths in the experimental setup. Previous underwater FSW thermal modeling has shown that the coolant-side boundary condition and water vaporization influence the thermal response [25]. No parameter-sensitivity analysis was performed in the present study; consequently, the numerical field magnitudes are interpreted with the limitations of the prescribed boundary conditions in mind.
3. Results
3.1. Experimental Results
3.1.1. Macroscopic Morphology
Figure 4 shows the surface appearance of LA103Z after FSP under the A-400-100, A-800-100, and B-400-100 conditions. Almost no flash is observed on the AS, whereas distinct flash forms on the RS. Overall, underwater FSP produces a uniform and flat processed surface, with no apparent oxidative blackening, peeling, groove defects, or obvious cracks. These observations suggest that the selected processing parameters provide sufficient heating for effective plastic flow within the SZ, resulting in good surface-forming quality.
Figure 4.
Surface morphology of the FSPed LA103Z.
Figure 5 shows the cross-sectional macroscopic morphology of the processed region obtained under the B-400-100 condition. The central region is the SZ, which is surrounded by the BM; the left and right sides correspond to the RS and the AS, respectively. The BM retains the original strip-like rolling features, whereas the SZ exhibits a relatively homogeneous microstructural appearance. A distinct boundary between the SZ and BM is observed on the AS, whereas the transition between the SZ and BM on the RS is relatively gradual, with no clearly distinguishable boundary.
Figure 5.
Optical micrograph of the cross-section of the FSPed region.
Figure 6a presents a locally magnified view of the SZ/BM interface on the AS. As indicated by the red curve, the α-Mg phase bends upward during the transition from the BM toward the AS of the SZ. This morphology indicates pronounced material flow in the thickness direction on the AS. The width of the thermo-mechanically affected zone (TMAZ) on the AS is approximately 73 μm, whereas the width of the heat-affected zone (HAZ) is approximately 140–150 μm.
Figure 6.
Optical micrographs of the SZ/BM interfaces on (a) the AS and (b) the RS.
Figure 6b shows a locally magnified view of the SZ/BM interface on the RS. The α-Mg phase in the RS-side BM remains approximately horizontally distributed, while the original flow lines disappear within the SZ. This observation suggests that the material on the RS experience comparatively limited flow in the thickness direction. Comparison of Figure 6a,b indicates that the deformation on the AS is substantially more pronounced than that on the RS, consistent with the experimental observations reported by Jiang et al. [26].
For the counterclockwise tool rotation used in this study, the material on the AS experiences intense relative motion with respect to the BM under the action of the rotating pin and associated shear deformation. On the RS, the metal flow is more closely aligned with the tool rotation direction, and is entrained by the pin to fill the transient cavity generated behind the tool. The difference in deformation between the RS-side SZ and the adjacent BM is therefore comparatively small, resulting in a less distinct metallographic boundary.
3.1.2. Microstructure of LA103Z in the SZ
Figure 7 shows the cross-sectional microstructure of the BM and the SZs processed under the A-800-100 and B-400-200 conditions. The corresponding processing parameters are indicated in the upper-left corner of each image. As shown in Figure 7a, the BM contains island-like α-Mg phases with lengths of approximately 30–90 μm, together with a large number of parallel, stream-like α-Mg features distributed within the β-Li matrix. The spacing between adjacent stream-like α-Mg features is approximately 10–20 μm.
Figure 7.
Microstructures of (a) the BM and SZs processed under (b) A-800-100 and (c) B-400-200.
After FSP under the A-800-100 condition, the β-Li grains in the SZ become considerably finer and more fragmented, while a relatively large amount of α-Mg phase is retained and maintains a stream-like distribution within the β-Li matrix, as shown in Figure 7b. Under the B-400-200 condition, the β-Li grains become predominantly equiaxed, whereas the α-Mg phase is substantially reduced. Only a small amount of island-like and ellipsoidal α-Mg phases remains, as shown in Figure 7c.
To further investigate the effect of FSP direction on the microstructure of LA103Z, EBSD analysis was performed on the SZ processed under the B-800-100 condition. Figure 8a shows the inverse pole figure (IPF) map of the α-Mg phase in the SZ. Both fine α-Mg phases dispersed within the β-Li matrix and equiaxed α-Mg grains arranged in linear aggregates are observed. The measured volume fractions of the α-Mg phase are 17.33% and 18.86%, respectively, and the average grain size of the α-Mg phase is 2.11 μm. Figure 8b presents the IPF map of the β-Li phase in the SZ. The β-Li phase consists predominantly of randomly oriented equiaxed grains, indicating extensive dynamic recrystallization (DRX). The average grain size of the β-Li phase after FSP is 5.42 μm.
Figure 8.
IPF maps of the FSPed sample processed under B-800-100: (a) α-Mg phase and (b) β-Li phase.
Figure 9a shows the {0001} pole figure of the α-Mg phase in the SZ after FSP, with a maximum texture intensity of 5.12. The texture intensity maximum of the α-Mg phase is shifted by approximately 40–50° toward the RD, indicating the development of a weak TD//[] texture. This texture evolution suggests that basal and secondary pyramidal slip systems may be activated in the α-Mg phase during FSP, accompanied by grain rotation. At the same time, a considerable number of randomly oriented α-Mg are observed.
Figure 9.
(a) {0001} pole figure of the α-Mg phase and (b) ODF sections at φ2 = 45° of the β-Li phase in the SZ processed under B-800-100.
Figure 9b presents the ODF section of the β-Li phase at φ2 = 45°. A pronounced {111}<110> texture is observed in the β-Li phase of the SZ. The development of this texture is associated with the severe deformation and subsequent recrystallization experienced during FSP. The predominantly equiaxed and randomly oriented β-Li grains observed in the IPF map, together with the ODF results, indicate substantial microstructural reorganization of the original BM during FSP.
An increase in tool diameter and rotational speed increases the heat generated at the tool shoulder, thereby increasing the heat input and peak temperature in the SZ. Excessive thermal input can promote the growth of recrystallized β-Li grains and increase the dissolution of the α-Mg phase. In contrast, the traverse speed has little influence on the instantaneous shoulder heat generation but affects the linear energy input and residence time of the tool over a given position [27]. At a constant level of shoulder heat generation, increasing the traverse speed reduces the interaction time between the tool and the local material, resulting in more rapid heating and cooling of the processed region.
In the present study, flowing cooling water was employed for forced cooling. As the heat generation in the SZ increases, the temperature difference between the workpiece and the cooling water also increases, thereby enhancing heat dissipation. Consequently, the influence of traverse speed on the thermal field and microstructure becomes more pronounced at higher heat-generation levels. When the heat generation is relatively low, the corresponding effect of traverse speed on the microstructure is weaker.
Figure 10 presents the IPF maps and grain-size distribution histograms of the β-Li phase in the SZs processed under A-800-100, A-800-200, A-400-100, B-400-100, and B-400-200. Compared with the BM, the β-Li grains in the SZ are predominantly equiaxed and more homogeneous in size, while the original crystallographic anisotropy is substantially reduced. These features are consistent with extensive DRX.
Figure 10.
IPF maps and grain-size distributions of the β-Li phase in the SZ after processing under different FSP conditions: (a,b) A-800-100, (c,d) A-800-200, (e,f) A-400-100, (g,h) B-400-100.
The grain-size distributions show that reducing the tool diameter and rotational speed increases the fraction of fine β-Li grains. The average β-Li grain size decreases from 7.37 μm to approximately 3 μm. Once the grain size is refined to approximately 3 μm, further changes in traverse speed have only a limited effect on the grain size. For comparison, the average β-Li grain size in the BM is 14.11 μm, demonstrating that FSP effectively refines the β-Li grains in LA103Z.
However, β-Li grains larger than 40 μm are observed under the A-800-100 and A-800-200 conditions, indicating that grain growth occurs after recrystallization under these relatively high-heat-input conditions. The β-Li grain size is highly sensitive to temperature and can increase rapidly within a short time when the deformation temperature reaches approximately 350 °C. The water-cooled configuration may help limit post-recrystallization grain growth by increasing heat extraction; however, because an otherwise identical non-water-cooled FSP condition was not tested, the independent contribution of water cooling cannot be isolated in the present study. Under the B-400 conditions, the lower heat input limits the thermal driving force for grain growth, resulting in a smaller average β-Li grain size.
3.1.3. Precipitation Behavior of α-Mg Layers at β-Li Grain Boundaries in the SZ
Hot-compression experiments on LA103Z have shown that when the deformation temperature exceeds 288.5 °C (567.5 K), the α-Mg phase can precipitate preferentially at β-Li grain boundaries, which reduces the free energy of the system [12]. To investigate the precipitation behavior of α-Mg layers during FSP, EPMA analysis was performed on the SZ of the sample processed under the A-800-200 condition.
Figure 11a shows the backscattered electron (BSE) image of the analyzed region, while Figure 11b–d show the corresponding elemental distribution maps of Mg, Al, and Zn, respectively. The color scales represent the intensity of the corresponding characteristic X-ray signals. The bright white regions in the BSE image are associated with locally increased Al signals in Figure 11c. Because Zn is relatively uniformly distributed throughout the matrix, with only slight enrichment in these bright regions, these features are identified as precipitates.
Figure 11.
(a) BSE image of the SZ processed under A-800-200 and corresponding EPMA elemental distribution maps of (b) Mg, (c) Al, and (d) Zn.
Because Li has a relatively low atomic number, the darkest matrix regions in the BSE image correspond to the β-Li phase. Two characteristic morphologies of gray regions can be identified in Figure 11a: island-like regions distributed within the β-Li grains and elongated, strip-like regions approximately 1 μm in width located along the β-Li grain boundaries. Both types of regions coincide with areas of increased Mg intensity in Figure 11b, confirming that they correspond to the α-Mg phase.
Unlike the parallel, stream-like α-Mg phase observed in the BM, the α-Mg layers in the SZ intersect along β-Li grain boundaries at an angle of approximately 120°. Previous hot-compression studies have shown that α-Mg layers can precipitate along β-Li grain boundaries in LA103Z, and similar grain-boundary precipitation of α-Mg has also been reported in some dual-phase Mg–Li alloys after solution treatment and aging [28,29,30]. These observations are consistent with the present experimental results.
The occurrence of α-Mg layers along β-Li grain boundaries, together with their distinct morphology from the stream-like α-Mg phase in the BM, suggests that thermal exposure during FSP plays an important role in their formation rather than the layers being formed solely by mechanical transport of the pre-existing α-Mg phase from the BM.
The hot-deformation microstructure of LA103Z is strongly dependent on the deformation temperature. The temperature in the SZ is governed by the heat generated during FSP, which is closely related to the selected processing parameters [31]. Because the LA103Z sheet used in this study was relatively thin and water cooling was employed, heat generation during FSP was dominated by the shoulder [32]. A larger shoulder diameter provides a larger contact area with the workpiece and therefore generates greater frictional heat.
The heat generated by the shoulder, Q*, can be calculated using Equation (1) [33]:
where ω is the tool rotational speed (rad/s), R1 is the shoulder radius (m), and R2 is the average pin radius (m). τ is the interfacial shear stress (Pa), which is determined by the friction coefficient and contact pressure. Because the machine plunge force was maintained constant in this study and the temperature dependence of the friction coefficient was neglected, τ was assumed to remain constant. For simplicity, the constant term was introduced. By substituting the corresponding processing parameters into Equation (1), the relative heat generation under different processing conditions can be compared. For example, the calculated Q* values for A-1000-100, A-800-100, and B-1000-100 are 8.13a, 6.50a, and 3.49a, respectively.
To further investigate the influence of FSP parameters on the precipitation behavior of α-Mg layers, Figure 12 presents optical micrographs of the SZ obtained under different Q* values.
Figure 12.
Distribution of α-Mg layers in the SZ after processing under different FSP conditions: (a) A-1000-100, (b) A-800-100, (c) B-1000-100, (d) A-400-100, (e) B-800-100, (f) B-400-100.
Under all investigated processing conditions, lamellar white α-Mg regions are observed along the β-Li grain boundaries in the SZ, suggesting that the peak temperature in the SZ reached at least 288.5 °C. At relatively high Q* values, the α-Mg layers extend into the β-Li grains, as indicated by the red arrows in Figure 12a–d. The thickness of the α-Mg layers is approximately 0.5–1 μm, which is slightly smaller than that observed in the hot-compression specimens.
This difference may be attributed to the shorter thermal exposure time during FSP. The rapid nature of FSP limits the time available for Mg atoms to diffuse toward β-Li grain boundaries and for the precipitated α-Mg phase to grow. Consequently, thinner α-Mg layers are formed in the FSPed material. At lower Q* values, α-Mg precipitation at the β-Li grain boundaries still occurs, but the layer thickness becomes less uniform, and continuous α-Mg layers may not fully develop, as shown in Figure 12e,f.
3.1.4. Effects of FSP Process Parameters on Hardness and Tensile Properties
During FSP, the material undergoes severe plastic deformation under the combined effects of pin rotation and shoulder-induced compression, resulting in substantial changes in its microstructure and mechanical properties. Grain refinement and deformation-induced hardening are plausible contributors to the measured hardness increase. Changes in phase morphology and solute distribution may also contribute; however, their individual strengthening contributions were not quantified in the present study [34,35].
Table 4 summarizes the microhardness values measured at the center of the SZ under different FSP conditions. The highest hardness, 75.0 HV, is obtained under the A-1000-100 condition, corresponding to an increase of 35.66% relative to the BM. The lowest hardness increase is observed under the B-400-100 condition, for which the SZ hardness is 61.1 HV, corresponding to an increase of 10.49%. Comparison of A-1000-100, A-800-100, and A-400-100, as well as B-1000-100, B-800-100, and B-400-100, shows that, at the same rotational and traverse speeds, the SZ hardness increases with increasing tool diameter. At a fixed tool and traverse speed, increasing the rotational speed also increases the SZ hardness. In addition, comparison of B-800-50, B-800-100, and B-800-200 indicates that increasing the traverse speed produces a slight increase in SZ hardness.
Table 4.
Microhardness at the center of the SZ processed under different FSP conditions.
The hardness variations can be correlated with the microstructural evolution in the SZ. At relatively high heat input, the α-Mg phase is more strongly redistributed and appears to be partially dissolved, while Mg-rich regions are observed in the EPMA maps. This behavior is consistent with the possibility that some Mg enters the β-Li matrix and contributes to solid-solution strengthening. However, the EPMA maps in this study do not provide a quantitative Mg concentration for the β-Li matrix, and the change in solid-solution content was not measured directly. Solid-solution strengthening is therefore proposed as a plausible contribution rather than a quantitatively established mechanism.
At relatively high heat input, increasing the traverse speed reduces the interaction time between the tool and the material at a given location, and leads to more rapid heating and cooling in the simulations. The CDRX–ISV calculations indicate that the regularized dislocation-density variable may remain relatively high at the end of deformation under some faster-traverse conditions. This provides a possible explanation for the slight increase in hardness observed in certain parameter comparisons. Nevertheless, because dislocation density was not measured directly, the proposed contribution from retained dislocations should be regarded as a model-based interpretation rather than an experimentally verified strengthening increment.
Overall, tool diameter and rotational speed have stronger effects on SZ hardness than traverse speed. The SZ hardness generally increases with increasing tool diameter and rotational speed, whereas the effect of traverse speed is relatively limited.
Table 5 summarizes the yield strength (YS), ultimate tensile strength (UTS), and elongation after fracture of the BM and SZ specimens processed under different FSP conditions; the values are reported as mean ± standard deviation (SD, n = 3). Both the YS and UTS of the FSPed LA103Z are substantially higher than those of the BM, whereas the elongation after fracture is reduced. In general, decreasing the FSP heat generation leads to a decrease in YS and UTS and an increase in elongation after fracture.
Table 5.
Tensile properties of the BM and FSPed samples.
Welch’s one-way ANOVA indicated an overall effect of processing condition on YS (F(9, 8.02) = 380.16, p = 1.40 × 10⁻⁹), UTS (F(9, 7.50) = 270.58, p = 1.64 × 10⁻⁸), and EL (F(9, 7.88) = 1552.62, p = 7.61 × 10⁻¹²). In the exploratory pairwise comparisons with the BM, all nine FSP conditions differed from the BM for each property after Holm adjustment (adjusted p < 0.05). These tests establish differences relative to the BM under the stated analysis, but do not establish that every pair of FSP conditions differs significantly. The small sample size (n = 3) limits the strength of statistical inference. The Holm-adjusted p-values for the FSP-versus-BM comparisons ranged from 0.00009 to 0.0162 for YS, 0.0057 to 0.0227 for UTS, and 0.00071 to 0.00324 for EL.
Four processing conditions—A-1000-100, A-800-100, A-800-200, and B-1000-100—produce increases in UTS of more than 50% relative to the BM. Among these conditions, the A-800-200 specimen exhibits the highest strength, with a YS of 285.95 ± 1.83 MPa, a UTS of 305.53 ± 10.45 MPa, and an elongation after fracture of 4.04 ± 0.14%. Its UTS is 127.61 MPa higher than that of the BM, corresponding to an increase of approximately 72%. Compared with other strengthened Mg–Li alloys with similar Li contents, the UTS obtained in this study is approximately 50 MPa higher [36,37].
Figure 13a presents the engineering stress–strain curves of the BM and specimens processed using different tools and rotational speeds at a constant traverse speed of 100 mm/min. With the other processing parameters held constant, reducing the tool diameter and rotational speed decreases the strength of the SZ material while improving its ductility. This result indicates that the larger-diameter Tool A and higher rotational speed provide a stronger strengthening effect in LA103Z.
Figure 13.
Engineering stress–strain curves of the BM and samples processed under different FSP conditions: (a) v = 100 mm/min, (b) A-800, and (c) B-800.
At a rotational speed of 1000 rpm, the YS values of the materials processed using the two tools are 238.85 and 238.50 MPa, respectively, while the corresponding UTS values are 278.90 and 273.12 MPa and the elongations after fracture are 2.97% and 3.00%, respectively. These tensile properties are very similar. Compared with A-800-100, increasing the rotational speed to 1000 rpm does not produce a substantial further increase in strength but results in a noticeable reduction in ductility. Therefore, an appropriate processing window should be selected for FSP of LA103Z sheets. Once the rotational speed reaches approximately 800 rpm, further increasing the rotational speed provides only a limited improvement in tensile strength.
Figure 13b,c present the engineering stress–strain curves of SZ specimens processed at different traverse speeds under the A-800 and B-800 conditions, respectively. The effect of traverse speed on the tensile properties is closely related to the FSP heat input. At higher heat input, increasing the traverse speed produces a more pronounced strengthening effect. As discussed in Section 3.1.2, this behavior is associated with strain hardening.
The shorter interaction time and rapid cooling predicted for some higher-traverse-speed conditions may limit the time available for dynamic recovery. The CDRX–ISV model accordingly predicts a relatively high terminal regularized dislocation-density variable in these cases. This trend may be associated with the measured strength–ductility response, but the retention of dislocations was not directly measured in this study.
3.2. Numerical Simulation Results
3.2.1. Macroscopic Material Flow Behavior During FSP
To investigate the material flow behavior at different locations within the processed region, 35 designated tracking points were distributed across different thickness layers at four representative positions: the outer shoulder edge (columns 1 and 7), shoulder center (columns 2 and 6), outer pin edge (columns 3 and 5), and pin center (column 4) for Tools A and B. The initial positions of these designated points are shown in Figure 14.
Figure 14.
Initial positions of the 35 designated points in the Y–Z plane.
Taking A-800-200 as a representative processing condition, the trajectories of the 35 designated points during FSP were obtained using moving-point tracking. Figure 15 shows the positions of the designated points in the X–Y plane after the tool passed through the X = 40 plane. Designated points 1–7 remain essentially stationary because of the imposed boundary conditions. The calculated trajectories of points 10, 17, 23, and 24 follow or adhere to the pin surface and therefore do not represent the motion of the surrounding bulk workpiece material. These four points were excluded only from the subsequent interpretation of bulk-material trajectories. This exclusion does not imply that the four locations represent no physical material motion; rather, their pin-attached paths are not used to characterize the general stir-zone flow. The flow analysis is consequently based on the selected non-adhering points and should not be interpreted as a complete volumetric description of every material parcel in the stir zone.
Figure 15.
Distribution of the 35 designated points in the X–Y plane after processing under A-800-200.
The exclusion of designated point 17 in this paragraph applies only to the moving-material trajectory analysis. In the subsequent fixed-location field-history analysis, the label 17 identifies a prescribed spatial sampling location on the X = 40 plane; the temperature, stress, and strain histories are extracted at that fixed location and are not interpreted as the pin-attached moving trajectory described above.
The trajectories of the remaining representative designated points during FSP are shown in Figure 16. The tracking points exhibit spiral trajectories around the pin and ultimately remain behind the tool, where they contribute to filling the transient cavity generated by the advancing pin. Under the combined effects of tool rotation and translation, the material within the SZ undergoes both circumferential movement around the pin and displacement along the processing direction, resulting in substantial accumulated deformation.
Figure 16.
Material-flow trajectories of representative designated points in the SZ during FSP: (a) 3D view; (b) view perpendicular to the PD; (c) view along the PD (unit: mm).
Because the tool is tilted by 3°, material on the AS initially moves upward and subsequently moves downward beneath the shoulder. During tool translation, the shoulder imposes a strong constraint on material flow in the thickness direction. This behavior is analogous to a local upsetting action and contributes to material consolidation within the SZ, thereby reducing the tendency for defect formation.
The driving force for material flow decreases as the distance from the shoulder in the thickness direction and the distance from the pin in the width direction increase. At the pin center, the trajectory radii of designated points 32, 25, 18, and 11 at different thickness layers are approximately 6, 5, 4.5, and 4 mm, respectively. In contrast, the displacement ranges of designated points 8 and 14 near the bottom surface at the outer shoulder edge are only approximately 0.1 mm.
The designated points therefore exhibit arc-shaped trajectories, with both the radial extent of rotation around the pin and the overall displacement decreasing from the upper to the lower part of the sheet. The resulting material-flow region exhibits a truncated-conical morphology, which is consistent with the cross-sectional shape of the SZ observed experimentally in Figure 5.
3.2.2. Evolution of the Thermal, Stress, and Strain Fields During FSP
To investigate the evolution of physical field variables during FSP, fixed-location histories were extracted at selected positions on the X = 40 plane under the A-800-200 condition, excluding the pin center. The selected positions represent four locations near the shoulder center and outer pin edge on the advancing and retreating sides and are used as local sampling points rather than as a uniform or exhaustive representation of the entire three-dimensional stir zone. Figure 17a shows these positions, while Figure 17b–d present their temperature–time curves at distances of 1, 2, and 3 mm from the bottom surface of the sheet, respectively. As the tool passes through the designated plane, the temperature at each point first increases and then decreases, with the cooling rate generally lower than the heating rate. The peak temperatures at corresponding positions across different thickness layers are similar, with differences generally within 10 °C, indicating a relatively uniform temperature distribution through the sheet thickness. In contrast, the temperature difference between points extending from the outer pin edge toward the outer shoulder edge reaches 30–60 °C, indicating a pronounced temperature gradient in the width direction. At corresponding positions, the peak temperature on the RS is approximately 10 °C lower than that on the AS.
Figure 17.
(a) Positions of the selected designated points in the X = 40 plane and temperature–time curves of the designated points at thickness levels of (b) 1 mm, (c) 2 mm, and (d) 3 mm from the bottom surface of the sheet under the A-800-200 condition.
Figure 18a–f show the variations in strain and stress with time for selected designated points located at thickness levels of 1, 2, and 3 mm from the bottom surface of the sheet in the X = 40 plane under the A-800-200 condition. Because the material-flow direction and strain rate within the SZ continuously change during FSP, pronounced fluctuations in stress are observed at the designated points.
Figure 18.
Strain–time and stress–time relationships of the designated points at thickness levels of (a,b) 1 mm, (c,d) 2 mm, and (e,f) 3 mm from the bottom surface of the sheet.
Before the tool reaches the X = 40 plane, the strain at each designated point remains zero. Once the tool reaches the X = 40 plane, the material undergoes severe plastic deformation, and the strain at each designated point increases rapidly. Under the A-800-200 condition, the tool rotates approximately 30 revolutions within about 2 s after the pin completely passes through the designated plane. Under the action of the rotating tool, the material in the SZ accumulates substantial strain over a short period, resulting in severe plastic deformation. After the tool completely leaves the X = 40 plane, deformation ceases, and the strain at each designated point remains essentially unchanged.
Along the sheet thickness direction, the closer a designated point is to the top surface, the stronger the shearing effect imposed by the shoulder, the earlier deformation begins, and the greater the total strain. As the distance from the top surface increases, the influence of the shoulder decreases, resulting in a lower total strain. The total strains of designated points 9, 16, and 23 at the shoulder center on the AS are 14.09, 48.72, and 101.25, respectively, whereas those of the corresponding designated points 13, 20, and 27 on the RS are 3.25, 12.84, and 43.56, respectively. Consistent with the material-flow trajectories obtained from moving-point tracking, the total strains obtained from fixed-point tracking are also higher on the AS than on the corresponding RS.
As shown by Figure 17 and Figure 18, at approximately 10.5 s, the leading edge of the shoulder reaches the X = 40 designated plane. The temperature at the designated points then begins to increase, accompanied by a gradual increase in stress, whereas the designated points have not yet undergone significant deformation. At approximately 12 s, the temperatures of the designated points approach their peak values, and deformation begins successively at different locations, resulting in a rapid increase in strain. The designated points near the outer edge of the pin experience strong shear deformation, and their stress continues to increase, whereas the stress at the shoulder center and outer shoulder edge begins to decrease. At approximately 12.95 s, the center of the pin reaches the X = 40 designated plane, the temperature reaches its peak, and the stress at the designated points near the outer edge of the pin also reaches its maximum. At approximately 15 s, the tool leaves the designated plane. The strain at each designated point then ceases to increase, while both stress and temperature decrease rapidly.
To investigate the coupling among temperature, stress, and deformation during FSP, Figure 19 presents the stress–strain–temperature curves of designated points 15–17 and 19–21 located at the middle thickness layer. In Figure 19, blue, yellow, and red correspond to designated-point temperatures below 200 °C, between 300 and 350 °C, and above 400 °C, respectively. During the early stage of deformation, temperature and stress increase simultaneously at the different designated points. When the temperature reaches approximately 300 °C, the material begins to yield. As the temperature increases to approximately 350 °C, the stress begins to decrease, and a local peak appears on the stress–strain curve. Subsequently, the deformation stress at designated points 15, 16, 20, and 21, which are located near the shoulder center and outer shoulder edge, decreases gradually with increasing strain, and then decreases rapidly as the deformation temperature falls. The temperatures at designated points 17 and 19, located near the outer edge of the pin, increase above 400 °C, and the stress initially increases and subsequently decreases with increasing temperature and strain.
Figure 19.
Stress–strain–temperature curves of designated points (a) 15, 16, 20, and 21, and (b) 17 and 19 under the A-800-200 condition.
Comparison of Figure 17, Figure 18 and Figure 19 shows that the stress–strain–temperature curves provide an intuitive representation of the coupled thermal, mechanical, and deformation behavior at different locations during FSP. The total strains of designated points 15–17 and 19–21 are 25.03, 48.72, 142.52, 141.31, 12.84, and 12.19, respectively. The corresponding peak stresses are 22.92, 27.33, 35.02, 36.74, 29.18, and 26.37 MPa, while the corresponding peak temperatures are 370.71, 412.68, 447.32, 437.60, 403.81, and 360.04 °C, respectively. Designated points near the outer edge of the pin exhibit relatively large total strains, high peak stresses, and high peak temperatures, whereas those near the shoulder center and outer shoulder edge exhibit comparatively lower total strains, peak stresses, and peak temperatures.
Overall, the larger-diameter tool produces more severe material deformation during FSP. As the tool approaches the designated plane, the deformation temperature at each designated point gradually increases, accompanied by an increase in stress. When the tool reaches the designated plane, the temperature approaches its peak range, the strain increases rapidly, and the rate of stress variation decreases. As the tool leaves the designated plane, the temperature begins to decrease. After the tool completely leaves the designated plane, the strain remains essentially unchanged, while both temperature and stress decrease rapidly. The designated points near the pin exhibit high peak temperatures, large total strains, high strain rates, and high peak stresses, whereas those beneath the shoulder exhibit lower peak temperatures, smaller total strains, lower strain rates, and relatively low peak stresses. In addition, the peak temperature and total strain on the AS are slightly higher than those on the RS.
3.2.3. Effect of FSP Process Parameters on the Temperature Field
Because the sheet thickness has a relatively limited effect on the evolution of the thermal, stress, and strain fields during processing, designated points 16, 17, 19, and 20 at the middle thickness layer were selected for further analysis. These points are located near the shoulder center and outer edge of the pin on both the AS and RS.
The temperature–time curves of designated points 16, 17, 19, and 20 under different FSP conditions are shown in Figure 20a–d. Before and after the tool passes through the X = 40 designated plane, the temperature at each designated point first increases and then decreases with time. The peak temperatures in the central region of the SZ under the different processing conditions range from 300 to 450 °C. The initial temperatures of the designated points are relatively similar. Increasing the traverse speed results in more rapid temperature changes.
Figure 20.
Temperature–time curves of designated points (a) 16, (b) 17, (c) 19, and (d) 20 under different FSP conditions.
Taking designated point 16 as an example, the peak temperatures under the A-400-50, A-400-100, and A-400-200 conditions are 346.70, 347.14, and 343.19 °C, respectively, indicating only a minor difference in peak temperature. However, the corresponding heating rates are 8.78, 17.95, and 34.26 °C/s, while the cooling rates are 5.58, 10.77, and 18.05 °C/s, respectively. These values increase approximately proportionally with traverse speed, indicating that traverse speed has a pronounced effect on the heating and cooling rates of the SZ material. In addition, traverse speed affects the spatial uniformity of the temperature field.
Table 6 presents the peak temperature of designated points under different FSP conditions. Under otherwise identical processing conditions, the temperatures of designated points 17 and 19 near the outer edge of the pin are higher than those of designated points 16 and 20 near the shoulder center. The temperature difference is approximately 35 °C at a traverse speed of 200 mm/min and approximately 24 °C at 50 mm/min. This indicates that the temperature distribution within the SZ is more uniform at lower traverse speeds.
Table 6.
Peak temperatures (°C) of the designated points under different FSP conditions.
The temperature at each designated point increases with increasing tool diameter and rotational speed, whereas traverse speed has only a limited effect on the peak temperature. Taking designated point 19 as an example, the peak temperatures under the A-800-100, A-400-100, and B-400-100 conditions are 441.65, 374.75, and 297.41 °C, respectively, corresponding to a difference of approximately 70 °C. In contrast, comparison of the peak temperatures under A-800-100 and A-800-200, as well as under A-400-50, A-400-100, and A-400-200, shows that when the other processing parameters are identical, the difference in peak temperature associated with traverse speed is only 1–5 °C. Therefore, the effect of traverse speed on peak temperature is substantially smaller than that of tool diameter and rotational speed.
Furthermore, when the tool diameter and rotational speed differ, the heating and cooling rates at the same traverse speed also vary because of differences in peak temperature. Overall, tool diameter and rotational speed primarily determine the temperature level and heating/cooling rates within the SZ, whereas traverse speed primarily affects the heating and cooling rates and the spatial uniformity of the temperature field.
As shown by the experimental results in Section 3.1.3, lamellar α-Mg regions are present along β-Li grain boundaries in the SZ under the investigated processing conditions. Previous hot-deformation studies of LA103Z re-ported that deformation of the β-Li phase can promote Mg redistribution toward β-Li grain boundaries and that α-Mg may precipitate along these boundaries when the temperature exceeds approximately 288.5 °C [12]. This prior result provides a possible basis for interpreting the present morphology, but the formation sequence during FSP was not directly observed in situ.
The simulated peak temperatures in the selected SZ locations exceed the reported threshold of approximately 288.5 °C under the listed conditions. Together with the Mg-rich grain-boundary regions observed by EPMA, this finding is consistent with a possible sequence involving partial dissolution of pre-existing α-Mg, Mg redistribution, and subsequent α-Mg precipitation at β-Li grain boundaries. However, the present study did not measure the transient matrix composition or follow the phase transformation in situ, so the dissolution–redistribution–precipitation sequence is therefore a mechanistic hypothesis supported by the observed morphology and prior hot-compression results.
3.2.4. Effects of FSP Process Parameters on the Stress and Strain Fields
Figure 21 shows the stress–strain–temperature curves of designated points 16, 17, 19, and 20 under different FSP conditions. The overall evolution of the thermal, stress, and deformation responses is similar under the different processing conditions. As the tool gradually approaches the X = 40 designated plane, the temperature at each designated point increases and the stress rises, whereas the accumulated strain remains relatively small. When the tool reaches the X = 40 designated plane, the strain increases rapidly, the temperature approaches its peak range, and the variation in stress becomes less pronounced. As the tool moves away from the X = 40 designated plane, the strain ceases to increase, while both temperature and stress decrease. The stress at each designated point exhibits a three-stage evolution with increasing strain: a sharp increase, a relatively stable stage, and a sharp decrease.
Figure 21.
Stress–strain–temperature curves of designated points (a) 16, (b) 17, (c) 19, and (d) 20 under different FSP conditions.
The peak stresses and total strains of the designated points under different processing conditions are listed in Table 7 and Table 8, respectively. As shown in Figure 21, the peak stress and quasi-steady stress of the SZ material under the investigated deformation conditions are approximately 20–60 MPa. Under the B-400-100 condition, the peak stress at each designated point exceeds 50 MPa, indicating the highest deformation stress among the investigated conditions. In contrast, under the A-800-100 and A-800-200 conditions, the peak stresses at designated points 16 and 20 are below 30 MPa, corresponding to relatively low deformation stresses.
Table 7.
Peak stresses (MPa) of the designated points under different FSP conditions.
Table 8.
Total strains of the designated points under different FSP conditions.
The flow stress of a material under hot-deformation conditions depends on temperature, strain rate, and strain. The simulation results indicate that, at corresponding locations, the deformation stress of the LA103Z material in the SZ during FSP is primarily governed by the deformation temperature. Increasing the tool diameter and rotational speed raises the temperature at which the designated points undergo plastic deformation and consequently reduces the deformation stress. In comparison, traverse speed has a relatively limited effect on the stress response during FSP of LA103Z.
In addition to affecting the flow-stress level, the FSP process parameters have a significant influence on the total strain accumulated at each designated point. Comparative analyses of the total strains under A-400-200, A-400-100, and A-400-50; A-400-100 and A-800-100; and B-400-100 and A-400-100 show that the total strain increases with decreasing traverse speed, increasing rotational speed, and increasing tool diameter. As discussed in Section 3.2.2, increasing tool diameter and rotational speed enhances the interaction between the tool and the processed material, increases the SZ temperature, and improves material flow. A lower traverse speed also increases the residence time of the tool near the designated plane, thereby increasing the total strain accumulated at the designated points.
Overall, when a large-diameter tool is operated at a high rotational speed, the SZ exhibits a high temperature, rapid heating and cooling, large accumulated strain, and relatively low deformation stress. At a high traverse speed, the heating and cooling rates at the designated points are higher and the accumulated total strain is smaller, whereas the effects on peak temperature and deformation stress are relatively limited.
4. Discussion
4.1. CDRX-ISV Constitutive Model Based on the Internal State Variable Method
In previous work by the authors, hot-compression tests were conducted on the dual-phase Mg–Li alloy LA103Z using a Gleeble-3500 thermal simulation testing machine at temperatures of 250, 300, 350, and 400 °C and strain rates of 0.001, 0.01, 0.1, and 1 s−1 [12]. The effects of deformation temperature, strain rate, and strain on the microstructural evolution of LA103Z were investigated, and a CDRX–ISV model was established from these hot-compression data. The model was calibrated for the thermomechanical conditions represented by those compression tests; its application to FSP histories is an extension to a different deformation configuration and should not be interpreted as a direct reproduction of the hot-compression loading path.
The CDRX-ISV model incorporates the evolution of several ISVs, including flow stress, dislocation density, grain size, grain-boundary misorientation, and DRX volume fraction. The CDRX-ISV constitutive model for hot deformation of LA103Z is expressed as Equation (2).
where is the plastic strain rate; A1 and z are temperature-dependent material parameters; d is the average grain size; and d0 is the initial grain size, which characterizes the effect of grain size on the flow behavior of the material [38]. H is the work-hardening stress, whose evolution is related to the dislocation density. and denote the regularized dislocation density and its evolution rate, respectively, and B is a temperature-dependent material parameter.
The evolution of the regularized dislocation density is governed by the effects of grain size, plastic deformation, dynamic recovery, and dislocation annihilation associated with recrystallization [39,40]. S denotes the recrystallized volume fraction and Ṡ its evolution rate. A2, χ1 , χ2 A3 and χ3 are material parameters, with being temperature-dependent [41,42].
The grain-size evolution rate, , is determined by the competing effects of grain growth associated with thermally activated atomic diffusion and grain refinement associated with DRX [43]. Ad, d1, A4, δ1, and δ2 are the corresponding material parameters. denotes the evolution rate of the grain-boundary misorientation angle, while is the critical misorientation angle corresponding to the transition from low-angle grain boundaries to high-angle grain boundaries. R is the gas constant. A5, A5, and A7 are parameters introduced to facilitate the numerical calculation, while , ψ and ξ provide additional flexibility in describing the evolution of grain-boundary misorientation.
The evolution rate of the DRX volume fraction, Ṡ, is related to the evolution of the interface area between recrystallized and unrecrystallized regions and the migration rate of the grain boundaries [44]. A8, Qs, and c are the corresponding material parameters. σ denotes the deformation stress, E is Young’s modulus, εT is the total strain, and εP is the plastic strain.
The material parameters of the model were determined using a genetic-algorithm-based optimization method. The optimization minimized the discrepancies between calculated and experimentally measured flow stress and grain size from the hot-compression tests [45]. The FSP grain-size measurements discussed below were not used in this parameter optimization and therefore provide a cross-process comparison of the calibrated model. However, this comparison is limited to final β-Li grain size and does not independently validate every state variable or the full transient evolution predicted by the model. The optimized material parameters are listed in Table 9.
Table 9.
Determined material constants of LA103Z in the CDRX-ISV model.
4.2. Prediction of Microstructure Evolution
The temperature, strain, and strain-rate histories extracted at designated locations 16, 17, 19, and 20 were introduced sequentially into the CDRX–ISV model as input variables. These locations sample selected regions near the shoulder center and the outer pin edge on the AS and RS; they do not constitute a spatially exhaustive sampling of the full stir zone. The model was used to calculate the corresponding evolution of β-Li grain size and regularized dislocation density under the investigated FSP conditions.
Figure 22 presents the predicted evolution of the average grain size and the final predicted grain sizes at designated points 16, 17, 19, and 20 under different FSP conditions. Comparison of Figure 21 and Figure 22 shows that when the deformation temperature approaches the peak-temperature range or the flow stress begins to decrease, the grain size starts to decrease, indicating the onset of dynamic recrystallization.
Figure 22.
Evolution of the predicted β-Li grain size at designated points (a) 16, (b) 17, (c) 19, and (d) 20 under different FSP conditions.
However, the grain size does not decrease continuously throughout the FSP process. At relatively large strains, such as those obtained under the A-800-100 and A-400-50 conditions, the grain size remains approximately constant during the later stage of deformation, and slight grain growth is observed at some AS designated points. This behavior suggests that, at sufficiently large strains, grain refinement associated with dynamic recrystallization and grain growth promoted by elevated temperatures can approach a dynamic balance during deformation.
Large accumulated strains are generally associated with either a relatively high deformation temperature or a prolonged deformation duration. Under these conditions, grain-boundary mobility is enhanced or sufficient time is available for grain-boundary migration, thereby increasing the tendency for grain growth.
During hot deformation of LA103Z, the β-Li phase is the primary deformation-bearing phase, whereas the α-Mg phase contributes relatively little to plastic deformation and does not undergo pronounced dynamic recrystallization. Therefore, the comparison below focuses on the grain size of the β-Li phase rather than that of the α-Mg phase.
Figure 23 compares the predicted final β-Li grain sizes at the selected locations with the experimental average grain sizes measured for the corresponding processing conditions. This comparison provides a cross-process consistency check for the predicted grain-size scale and the overall condition-dependent tendency. It should not be interpreted as validation of the complete spatial or transient grain-size field, because the measured values are averages over the EBSD observation regions whereas the simulations represent selected local positions. In addition, no point-by-point numerical error metric was calculated from the currently compiled prediction and measurement dataset. The comparison is therefore presented as a limited assessment of the grain-size prediction, rather than as evidence of fully quantified predictive accuracy.
Figure 23.
Comparison between the predicted and experimental average β-Li grain sizes at designated points 16, 17, 19, and 20 under different FSP conditions.
Figure 24 presents the CDRX–ISV model predictions for the evolution of regularized dislocation density at designated points 16, 17, 19, and 20 under different FSP conditions. As the tool approaches the designated plane, the model predicts an increase in the regularized dislocation-density variable during the work-hardening stage. These curves are model outputs; no direct TEM, X-ray line-profile, or EBSD-based dislocation-density measurement was performed to independently verify their absolute magnitude or temporal evolution.
Figure 24.
Evolution of the regularized dislocation density at designated points (a) 16, (b) 17, (c) 19, and (d) 20 under different FSP conditions.
Within the CDRX–ISV framework, increasing deformation temperature and strain promotes the evolution of grain-boundary misorientation and dynamic recrystallization, while the model accounts for dislocation recovery and annihilation through its internal-state variables. The resulting inflection in the calculated regularized dislocation-density curves reflects the competition represented by the constitutive model. It should not be interpreted as a direct measurement of the physical dislocation density during FSP.
The predicted regularized dislocation-density histories vary with processing condition and location. Lower predicted temperatures under some small-tool/low-speed conditions reduce the recovery terms represented in the model and lead to higher calculated values of the regularized dislocation-density variable. Because the model was calibrated using hot-compression data and was not independently verified for dislocation density under FSP, these differences are used to compare model responses among conditions rather than to establish absolute dislocation-density values.
At higher traverse speeds, the model predicts a shorter thermal–mechanical interaction interval and a relatively high terminal regularized dislocation-density variable for some selected locations. This result is a model-based trend and should not be equated directly with an experimentally measured retained dislocation density.
The tensile data indicate that, for some tool and rotational-speed combinations, increasing traverse speed is accompanied by a modest change in strength. The model-predicted regularized dislocation-density response may be one factor associated with this trend. However, the present data do not allow the contribution of dislocations to be separated quantitatively from grain-size, phase-morphology, or solute-related effects.
Under conditions involving a larger tool diameter and higher rotational speed, the measured strength increases even though the average β-Li grain size is not always the smallest. This indicates that grain-size strengthening alone cannot explain all observed differences. The Mg-rich phase redistribution seen in the EPMA maps is compatible with a possible solid-solution contribution, but the Mg content of the β-Li matrix was not quantified and the relative strengthening contributions were not determined. Accordingly, solid-solution strengthening is discussed here as a plausible mechanism requiring further quantitative compositional analysis.
Overall, the results show that tool geometry and rotational speed influence the predicted thermal histories and measured mechanical response within the investigated parameter window. The present evidence does not isolate a single dominant strengthening mechanism; the observed property changes are more appropriately interpreted as the combined response to grain structure, phase morphology, and deformation history.
The tensile results demonstrate a clear strength–ductility trade-off. The A-800-200 condition provides the highest mean UTS (305.53 ± 10.45 MPa), but its mean elongation is only 4.04 ± 0.14%. The A-1000-100 and B-1000-100 conditions also exhibit elongations of approximately 3%. In comparison, B-800-100 provides a more balanced response, with a mean UTS of 230.93 ± 9.94 MPa and elongation of 22.56 ± 0.87%, while B-400-100 retains a higher elongation of 30.35 ± 1.10% at a lower mean UTS of 194.35 ± 4.51 MPa. These results suggest that the processing condition should be selected according to the required balance between strength and ductility rather than maximum strength alone.
The pronounced ductility loss after FSP may be associated with the combined effects of severe deformation, the development of a refined and textured β-Li grain structure, phase redistribution, and the formation of lamellar α-Mg regions along β-Li grain boundaries. Such phase-boundary features may constrain local deformation compatibility and promote strain localization.
Strengthening mechanisms here remain unquantified: EPMA maps only offer qualitative elemental distribution, and the CDRX–ISV dislocation variable lacks independent measurement. The simulation also has limitations: absent in-situ thermal/mechanical validation data, no mesh convergence or sensitivity tests, a truncated domain, and no non-cooled control group. Future work will tackle these gaps for robust conclusions.
5. Conclusions
In this study, rolled dual-phase LA103Z Mg–Li alloy was subjected to water-cooled FSP, and the process was examined using experiments and a sequential finite element/CDRX–ISV modeling framework. The conclusions below are restricted to the investigated processing conditions and the available experimental and numerical evidence:
- (1)
- Under the investigated water-cooled FSP conditions, the stir zone exhibited a substantially reconstructed microstructure with predominantly equiaxed β-Li grains and redistributed α-Mg regions. Within the tested parameter window, tool diameter and rotational speed had stronger effects on the predicted peak-temperature level than traverse speed. Traverse speed mainly affected the heating and cooling rates and the spatial uniformity of the predicted temperature field.
- (2)
- The tensile results show that the highest mean UTS was obtained under A-800-200 (305.53 ± 10.45 MPa), accompanied by a low mean elongation (4.04 ± 0.14%). B-800-100 provided a more balanced strength–ductility response (UTS: 230.93 ± 9.94 MPa; elongation: 22.56 ± 0.87%), whereas B-400-100 retained greater elongation (30.35 ± 1.10%) at lower strength. The observed strengthening is consistent with contributions from grain structure, phase morphology, and deformation history.
- (3)
- The temperature, strain, and strain-rate histories from Deform 3D were sequentially introduced into the previously calibrated CDRX–ISV model. The predicted final β-Li grain sizes were compared with experimental average grain sizes as a cross-process consistency check.
Author Contributions
Conceptualization, J.Z. and W.C.; methodology, J.Z.; software, L.Z.; validation, L.Z., W.Z. and X.L.; formal analysis, L.Z.; investigation, W.C., W.Z. and X.L.; resources, W.Z.; data curation, W.Z. and X.L.; writing—original draft preparation, J.Z. and L.Z.; writing—review and editing, W.C. and M.L.; visualization, L.Z.; supervision, W.C. and M.L.; project administration, J.Z. and M.L.; funding acquisition, J.Z. and W.C. All authors have read and agreed to the published version of the manuscript.
Funding
This research was funded by “Key Technology Research and Development Program of Shandong Province, grant number 2026CXGC010221”.
Data Availability Statement
The original contributions presented in the study are included in the article, further inquiries can be directed to the corresponding author.
Conflicts of Interest
Author Wenzhong Cai, Weijia Zheng and Xiaohuan Liu were employed by the company Zhejiang Yiduan Precision Machinery co., Ltd. The remaining authors declare that the research was conducted in the absence of any commercial or financial relationships that could be construed as a potential conflict of interest.
Abbreviations
The following abbreviations are used in this manuscript:
| FSP | Friction stirring processing |
| AS | Advancing side |
| RS | Retreating side |
| BM | Base metal |
| RD | Rolling direction |
| EPMA | Electron probe microanalyzer |
| SEM | Scanning electron microscopy |
| EBSD | Electron backscatter diffraction |
| SZ | Stir zone |
| TMAZ | Thermo-mechanically affected zone |
| HAZ | Heat-affected zone |
| IPF | Inverse pole figure |
| YS | Yield strength |
| UTS | Ultimate tensile strength |
| DRX | Dynamic recrystallization |
| ODF | Orientation distribution function |
| BSE | Backscattered electron |
| CDRX | Continuous dynamic recrystallization |
| ISV | Internal state variable |
References
- Zhao, J.; Zhang, X.; Wu, R.; Li, T.; Ma, X.; Wang, G.; Zhou, J.; Krit, B.; Betsofen, S. Research Progress on Micro-Arc Oxidation of Mg-Li Alloys: A Review. Surf. Interfaces 2025, 69, 106796. [Google Scholar] [CrossRef] [Scilit]
- Zhao, N.; Liu, Z.; Li, X.; Zhu, D.; Le, Q.; Liu, D. Composition, Microstructure and Mechanical Properties of Mg–Li Alloys: A Review of State-of-the-Art Development and Trend. J. Rare Earths 2026, 44, 3102–3123. [Google Scholar] [CrossRef] [Scilit]
- Su, H.; Wang, J.; Li, Y.; Xue, C.; Tian, G.; Wang, S.; Yang, X.; Li, Q.; Yang, Z.; Dou, R. Effective Strategies for Improving the Mechanical Stability of Aged Mg-Li Alloys. Mater. Des. 2024, 244, 113180. [Google Scholar] [CrossRef] [Scilit]
- Matsunoshita, H.; Edalati, K.; Furui, M.; Horita, Z. Ultrafine-Grained Magnesium–Lithium Alloy Processed by High-Pressure Torsion: Low-Temperature Superplasticity and Potential for Hydroforming. Mater. Sci. Eng. A 2015, 640, 443–448. [Google Scholar] [CrossRef] [Scilit]
- Mineta, T.; Hasegawa, K.; Sato, H. High Strength and Plastic Deformability of Mg–Li–Al Alloy with Dual BCC Phase Produced by a Combination of Heat Treatment and Multi-Directional Forging in Channel Die. Mater. Sci. Eng. A 2020, 773, 138867. [Google Scholar] [CrossRef] [Scilit]
- Dash, S.S.; Chen, D. A Review on Processing–Microstructure–Property Relationships of Al-Si Alloys: Recent Advances in Deformation Behavior. Metals 2023, 13, 609. [Google Scholar] [CrossRef] [Scilit]
- El-Eraki, B.; El-Sayed Seleman, M.M.; El-Sissy, A.; Eisa, A. Structural and Mechanical Modifications of Hyper-Eutectic Al–16Si Alloy Using Friction Stir Processing. Discov. Appl. Sci. 2025, 7, 875. [Google Scholar] [CrossRef] [Scilit]
- El-Eraki, B.; Shalaby, M.F.Y.; El-Sissy, A.; Eisa, A.; Ataya, S.; El-Sayed Seleman, M.M. The Role of Friction Stir Processing Travel Speed on the Microstructure Evolution and Mechanical Performance of As-Cast Hypoeutectic Al-5Si Alloy. Crystals 2025, 15, 546. [Google Scholar] [CrossRef] [Scilit]
- Yousefpour, F.; Jamaati, R.; Aval, H.J. Effect of Traverse and Rotational Speeds on Microstructure, Texture, and Mechanical Properties of Friction Stir Processed AZ91 Alloy. Mater. Charact. 2021, 178, 111235. [Google Scholar] [CrossRef] [Scilit]
- Pouraliakbar, H.; Jandaghi, M.R.; Aval, H.J.; Shim, S.H.; Moverare, J.; Na, Y.-S.; Khalaj, G.; Fallah, V. An EBSD Study on Microstructure and Texture Development in Graphene-Reinforced Al–Mg–Si Nanocomposites via FSP. J. Mater. Res. Technol. 2025, 35, 685–701. [Google Scholar] [CrossRef] [Scilit]
- Ahmed, M.M.Z.; El-Sayed Seleman, M.M.; Eid, R.G.; Zawrah, M.F. Production of AA1050/Silica Fume Composite by Bobbin Tool-Friction Stir Processing: Microstructure, Composition and Mechanical Properties. CIRP J. Manuf. Sci. Technol. 2022, 38, 801–812. [Google Scholar] [CrossRef] [Scilit]
- Li, Y.; Guan, Y.; Liu, Y.; Zhai, J.; Lin, J. Study on Microstructure Evolution and Continuous Dynamic Recrystallization Constitutive Model of Dual-Phase Mg-Li Alloy LA103Z during Hot Deformation. J. Mater. Eng. Perform. 2023, 32, 2626–2634. [Google Scholar] [CrossRef] [Scilit]
- Albaijan, I.; Ahmed, M.M.Z.; El-Sayed Seleman, M.M.; Touileb, K.; Habba, M.I.A.; Fouad, R.A. Optimization of Bobbin Tool Friction Stir Processing Parameters of AA1050 Using Response Surface Methodology. Materials 2022, 15, 6886. [Google Scholar] [CrossRef] [Scilit] [PubMed]
- Negozio, M.; Bocchi, S.; Rath, L.; Ghio, E. Finite Element Modeling of Microstructure Evolution and Bonding during Friction Stir Extrusion of AA6061 Powder at Different Tool Feed Rates and Rotational Speeds. Mater. Charact. 2025, 219, 114639. [Google Scholar] [CrossRef] [Scilit]
- Li, G.; Li, B.; Bai, X.; Chen, H.; Huang, Y.; Yang, Y.; Wei, G.; Xie, W.; Peng, X.; Liu, J. Research Advances in Multi-Scale Numerical Simulations of Forming and Microstructures for Magnesium Alloys. J. Magnes. Alloys 2024, 12, 3898–3946. [Google Scholar] [CrossRef] [Scilit]
- Asadi, P.; Mahdavinejad, R.A.; Tutunchilar, S. Simulation and Experimental Investigation of FSP of AZ91 Magnesium Alloy. Mater. Sci. Eng. A 2011, 528, 6469–6477. [Google Scholar] [CrossRef] [Scilit]
- Ansari, M.A.; Samanta, A.; Behnagh, R.A.; Ding, H. An Efficient Coupled Eulerian-Lagrangian Finite Element Model for Friction Stir Processing. Int. J. Adv. Manuf. Technol. 2019, 101, 1495–1508. [Google Scholar] [CrossRef] [Scilit]
- Tutunchilar, S.; Haghpanahi, M.; Besharati Givi, M.K.; Asadi, P.; Bahemmat, P. Simulation of Material Flow in Friction Stir Processing of a Cast Al–Si Alloy. Mater. Des. 2012, 40, 415–426. [Google Scholar] [CrossRef] [Scilit]
- Xue, W.; Xiao, L.; Huang, C.; He, D.; Ren, X. Asymmetric Study on the Microstructure and Mechanical Properties of Friction Stir Welded Joints: Finite Element Simulation and Experiment. CIRP J. Manuf. Sci. Technol. 2024, 55, 108–128. [Google Scholar] [CrossRef] [Scilit]
- Li, Y.; Guan, Y.; Liu, Y.; Zhai, J.; Hu, K.; Lin, J. Effect of Processing Parameters on the Microstructure and Tensile Properties of a Dual-Phase Mg–Li Alloy during Friction Stir Processing. J. Mater. Res. Technol. 2022, 17, 2714–2724. [Google Scholar] [CrossRef] [Scilit]
- Li, Y.; Guan, Y.; Liu, Y.; Zhai, J.; Hu, K.; Lin, J. Microstructure and Tensile Properties of the Friction Stir Processed LA103Z Alloy. Mater. Charact. 2023, 196, 112616. [Google Scholar] [CrossRef] [Scilit]
- Zhang, X.X.; Xiao, B.L.; Ma, Z.Y. A Transient Thermal Model for Friction Stir Weld. Part I: The Model. Metall. Mater. Trans. A 2011, 42, 3218–3228. [Google Scholar] [CrossRef] [Scilit]
- Pashazadeh, H.; Masoumi, A.; Teimournezhad, J. Numerical Modelling for the Hardness Evaluation of Friction Stir Welded Copper Metals. Mater. Des. 2013, 49, 913–921. [Google Scholar] [CrossRef] [Scilit]
- Su, Q.; Xu, J.; Li, Y.; Yoon, J.I.; Shan, D.; Guo, B.; Kim, H.S. Microstructural Evolution and Mechanical Properties in Superlight Mg-Li Alloy Processed by High-Pressure Torsion. Materials 2018, 11, 598. [Google Scholar] [CrossRef] [Scilit] [PubMed]
- Zhang, H.; Liu, H.; Yu, L. Thermal Modeling of Underwater Friction Stir Welding of High Strength Aluminum Alloy. Trans. Nonferrous Met. Soc. China 2013, 23, 1114–1122. [Google Scholar] [CrossRef] [Scilit]
- Jiang, L.; Jiang, W.; Guo, F.; Huang, W.; Dong, H.; Hu, H.; Dai, Q. Micro-Nano Structure Characteristics and Texture Evolution of the Friction Stir Processed Dual-Phase Mg–Li Alloy. Mater. Charact. 2021, 173, 110979. [Google Scholar] [CrossRef] [Scilit]
- Hamilton, C.; Dymek, S.; Sommers, A. A Thermal Model of Friction Stir Welding in Aluminum Alloys. Int. J. Mach. Tools Manuf. 2008, 48, 1120–1130. [Google Scholar] [CrossRef] [Scilit]
- Wang, J.-Y. Mechanical Properties of Room Temperature Rolled MgLiAlZn Alloy. J. Alloys Compd. 2009, 485, 241–244. [Google Scholar] [CrossRef] [Scilit]
- Wu, S.K.; Li, Y.H.; Chien, K.T.; Chien, C.; Yang, C.S. X-Ray Diffraction Studies on Cold-Rolled/Solid–Solution Treated α + β Mg–10.2Li–1.2Al–0.4Zn Alloy. J. Alloys Compd. 2013, 563, 234–241. [Google Scholar] [CrossRef] [Scilit]
- Lin, M.-C.; Lin, S.-Q.; Uan, J.-Y. Effect of Annealing Temperature on the Microstructure and Mechanical Properties of an As-Rolled Mg-9wt.%Li-3wt.%Al-1wt.%Zn Alloy Sheet. Front. Mater. Sci. 2014, 8, 271–280. [Google Scholar] [CrossRef] [Scilit]
- Elangovan, K.; Balasubramanian, V. Influences of Tool Pin Profile and Tool Shoulder Diameter on the Formation of Friction Stir Processing Zone in AA6061 Aluminium Alloy. Mater. Des. 2008, 29, 362–373. [Google Scholar] [CrossRef] [Scilit]
- Thomas, W.M.; Nicholas, E.D. Friction Stir Welding for the Transportation Industries. Mater. Des. 1997, 18, 269–273. [Google Scholar] [CrossRef] [Scilit]
- Schmidt, H.; Hattel, J.; Wert, J. An Analytical Model for the Heat Generation in Friction Stir Welding. Model. Simul. Mater. Sci. Eng. 2003, 12, 143. [Google Scholar] [CrossRef] [Scilit]
- Wen, Q.; Li, W.; Patel, V.; Gao, Y.; Vairis, A. Investigation on the Effects of Welding Speed on Bobbin Tool Friction Stir Welding of 2219 Aluminum Alloy. Met. Mater. Int. 2020, 26, 1830–1840. [Google Scholar] [CrossRef] [Scilit]
- Jia, Y.; Qin, Y.; Ou, Y.; Wang, K.; Liu, J. The Influence of Microstructural Heterogeneity on Mechanical Properties of Friction Stir Welded Joints of T6-Treated Al-Zn-Mg Alloy 7A52. Metals 2018, 8, 527. [Google Scholar] [CrossRef] [Scilit]
- Cao, F.; Xue, G.; Xu, G. Superplasticity of a Dual-Phase-Dominated Mg-Li-Al-Zn-Sr Alloy Processed by Multidirectional Forging and Rolling. Mater. Sci. Eng. A 2017, 704, 360–374. [Google Scholar] [CrossRef] [Scilit]
- Wang, T.; Zheng, H.; Wu, R.; Yang, J.; Ma, X.; Zhang, M. Preparation of Fine-Grained and High-Strength Mg–8Li–3Al–1Zn Alloy by Accumulative Roll Bonding. Adv. Eng. Mater. 2016, 18, 304–311. [Google Scholar] [CrossRef] [Scilit]
- Lin, J.; Liu, Y.; Farrugia, D.C.J.; Zhou, M. Development of Dislocation-Based Unified Material Model for Simulating Microstructure Evolution in Multipass Hot Rolling. Philos. Mag. 2005, 85, 1967–1987. [Google Scholar] [CrossRef] [Scilit]
- Lin, J.; Dean, T.A. Modelling of Microstructure Evolution in Hot Forming Using Unified Constitutive Equations. J. Mater. Process. Technol. 2005, 167, 354–362. [Google Scholar] [CrossRef] [Scilit]
- Ji, H.; Liu, J.; Wang, B.; Tang, X.; Lin, J.; Huo, Y. Microstructure Evolution and Constitutive Equations for the High-Temperature Deformation of 5Cr21Mn9Ni4N Heat-Resistant Steel. J. Alloys Compd. 2017, 693, 674–687. [Google Scholar] [CrossRef] [Scilit]
- Estrin, Y. Dislocation Theory Based Constitutive Modelling: Foundations and Applications. J. Mater. Process. Technol. 1998, 80–81, 33–39. [Google Scholar] [CrossRef] [Scilit]
- Zheng, J.-H.; Lin, J.; Lee, J.; Pan, R.; Li, C.; Davies, C.M. A Novel Constitutive Model for Multi-Step Stress Relaxation Ageing of a Pre-Strained 7xxx Series Alloy. Int. J. Plast. 2018, 106, 31–47. [Google Scholar] [CrossRef] [Scilit]
- Sandström, R.; Lagneborg, R. A Model for Hot Working Occurring by Recrystallization. Acta Metall. 1975, 23, 387–398. [Google Scholar] [CrossRef] [Scilit]
- Brown, A.A.; Bammann, D.J. Validation of a Model for Static and Dynamic Recrystallization in Metals. Int. J. Plast. 2012, 32–33, 17–35. [Google Scholar] [CrossRef] [Scilit]
- Lin, J.; Cheong, B.H.; Yao, X. Universal Multi-Objective Function for Optimising Superplastic-Damage Constitutive Equations. J. Mater. Process. Technol. 2002, 125–126, 199–205. [Google Scholar] [CrossRef] [Scilit]
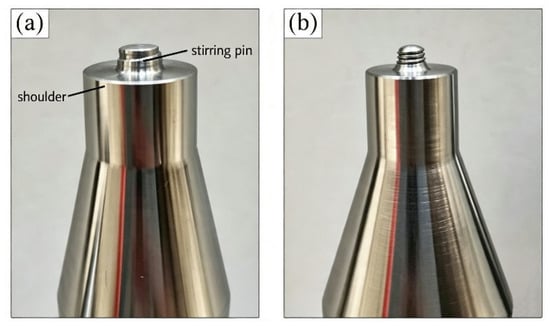
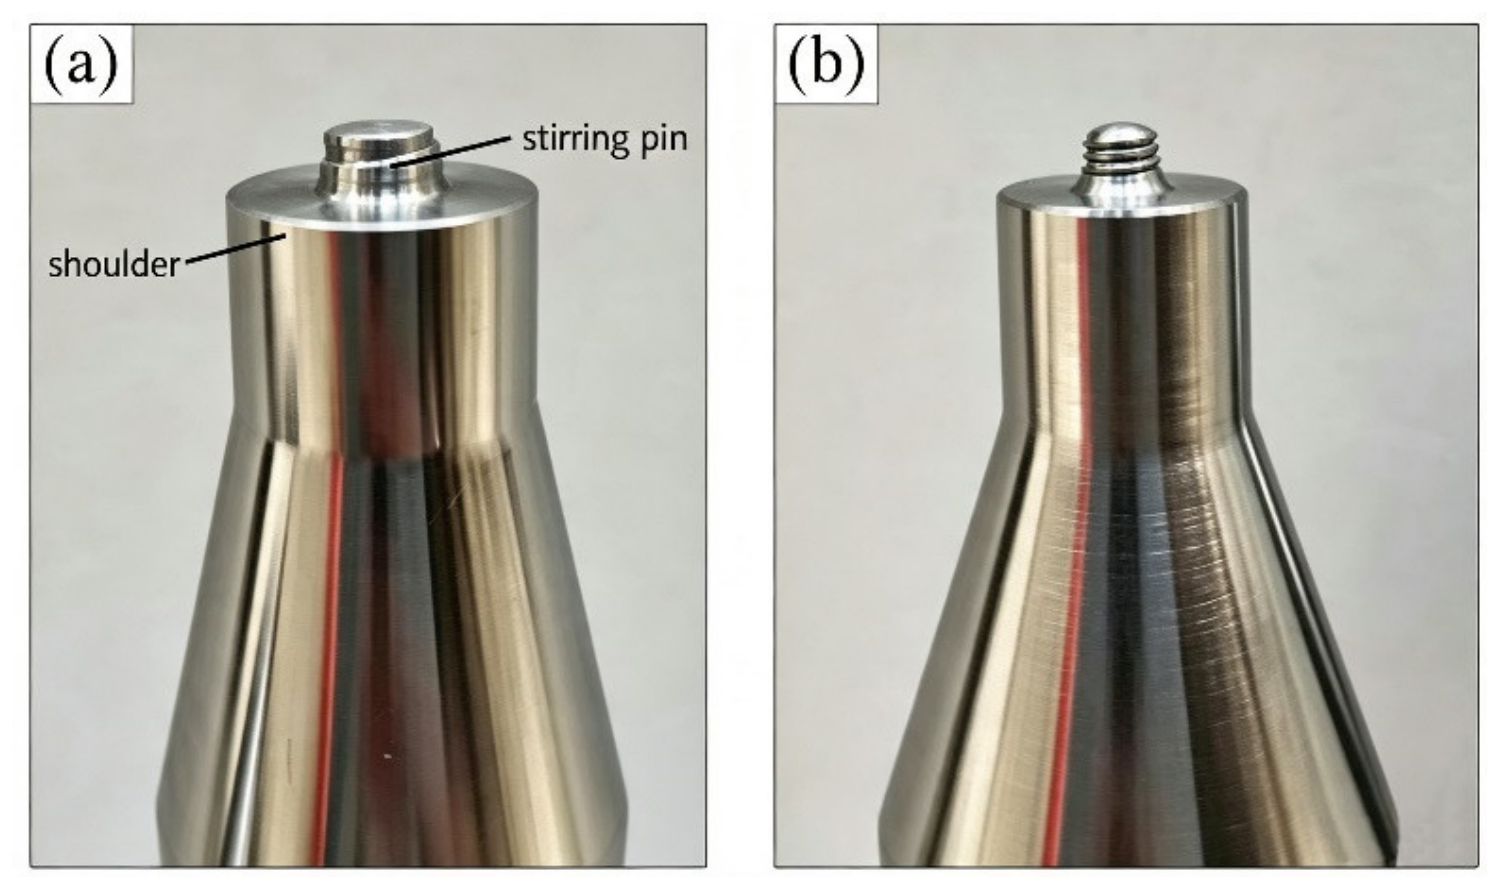
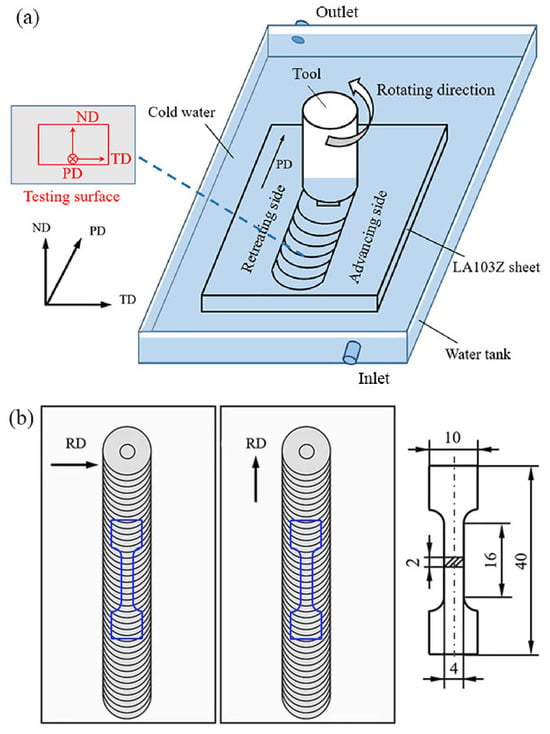
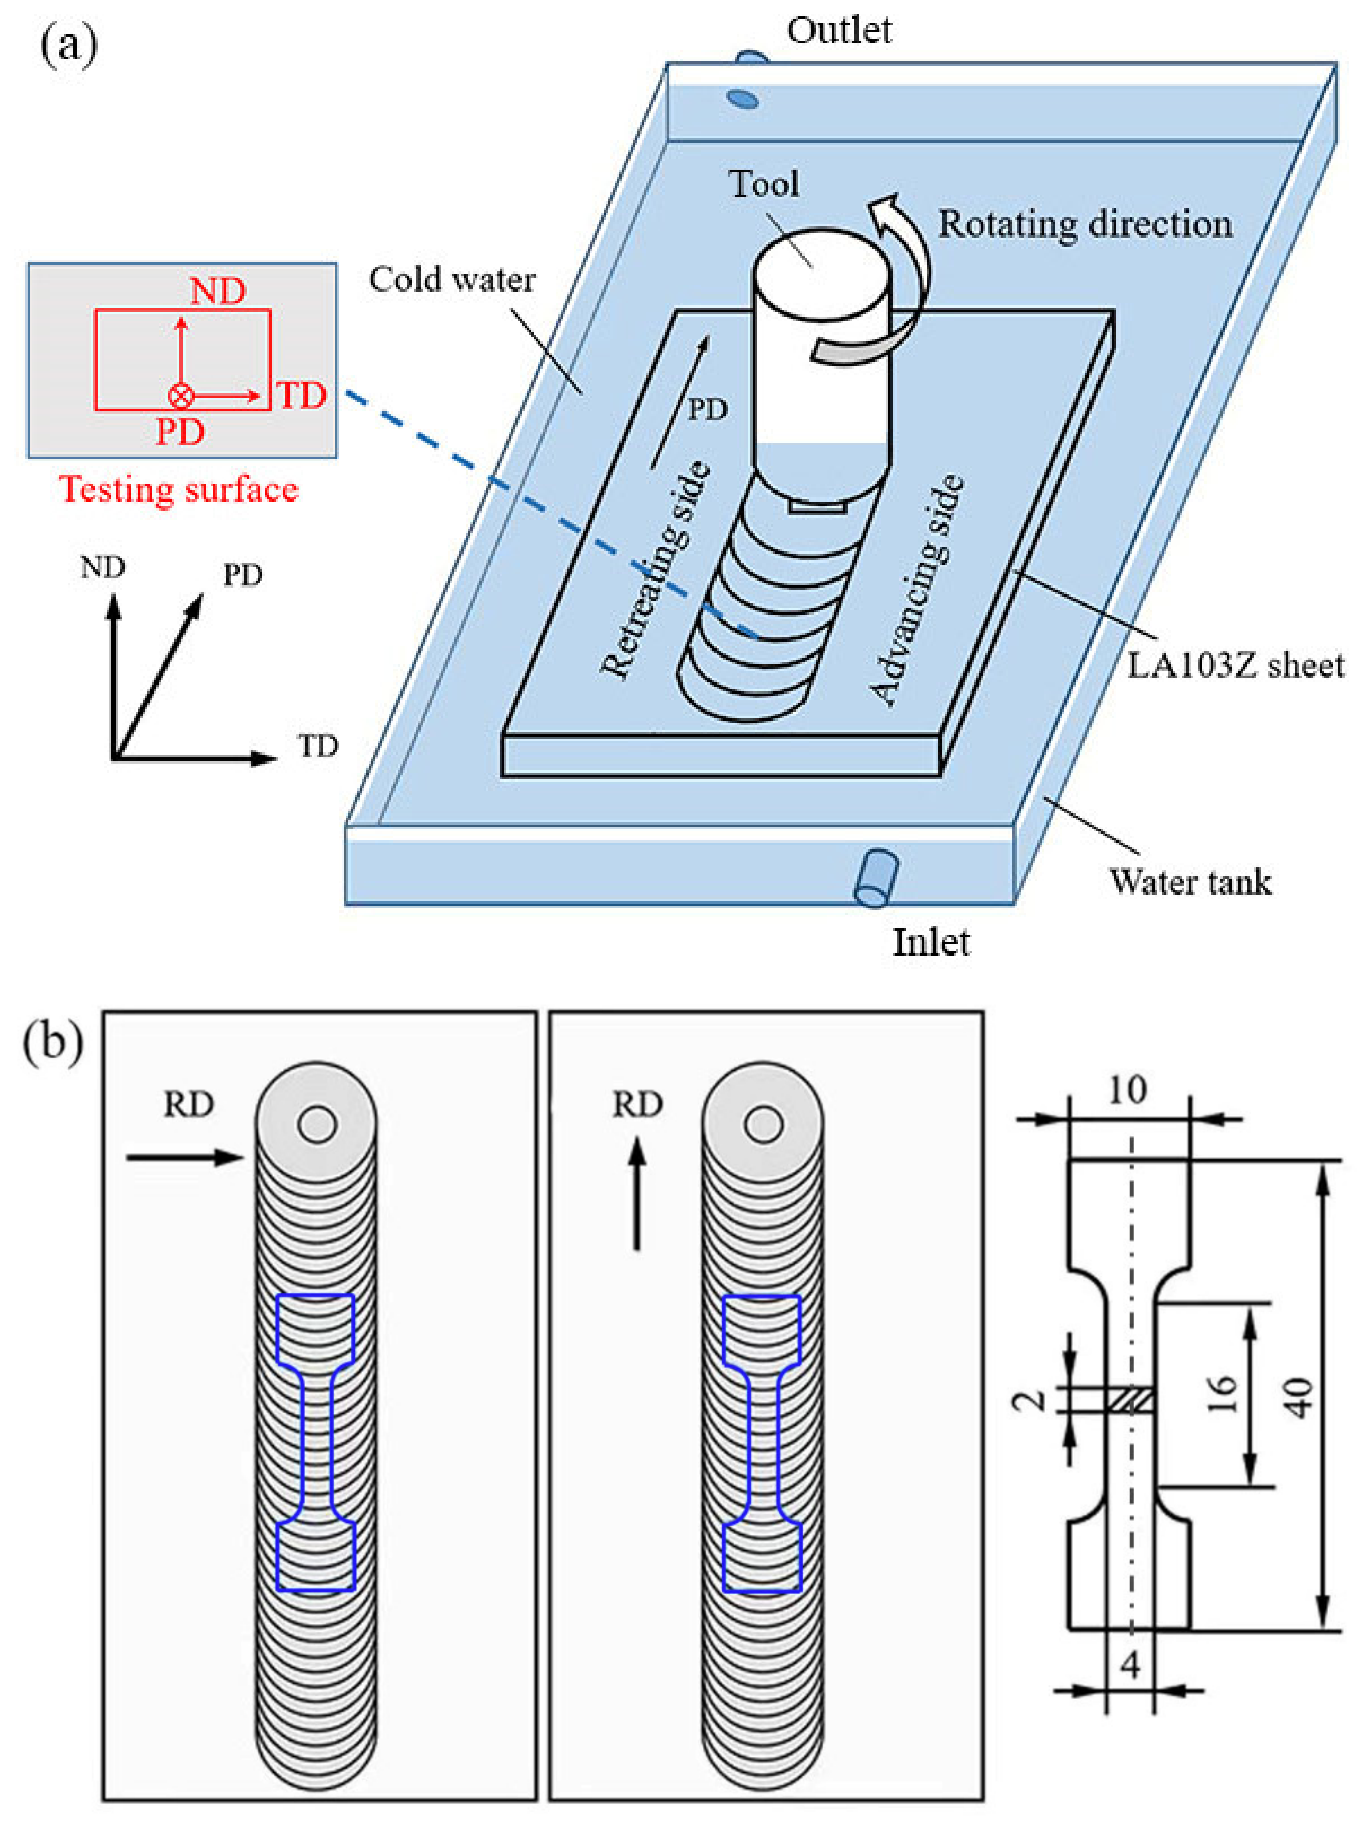
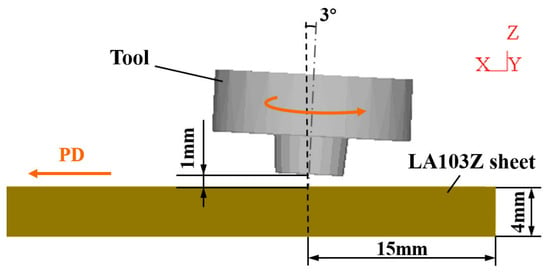
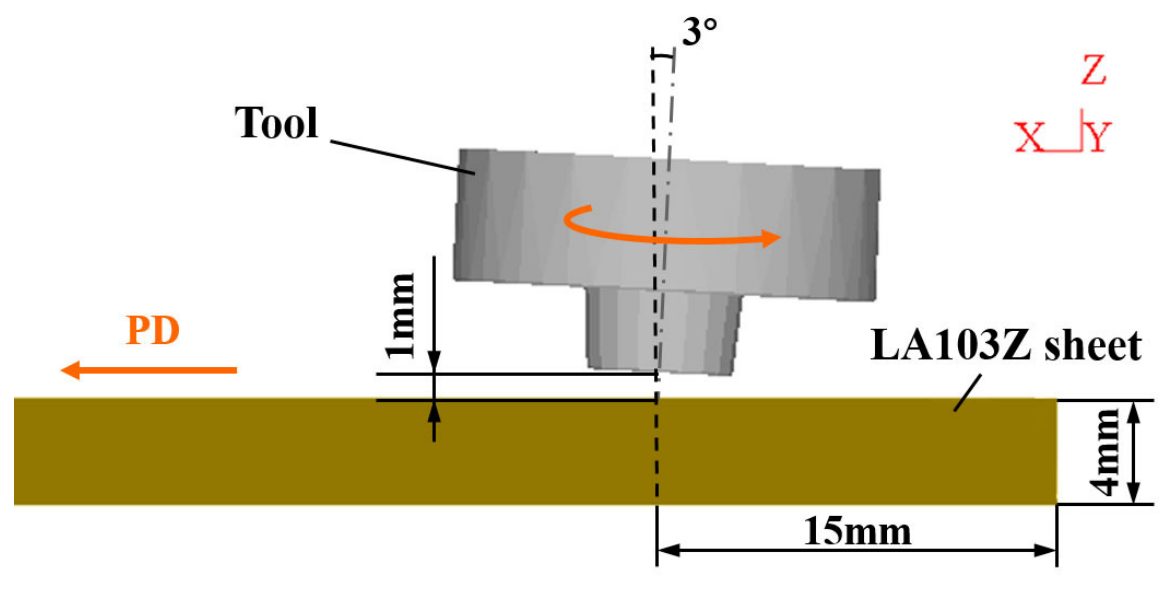
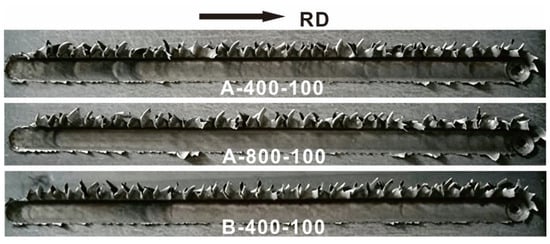
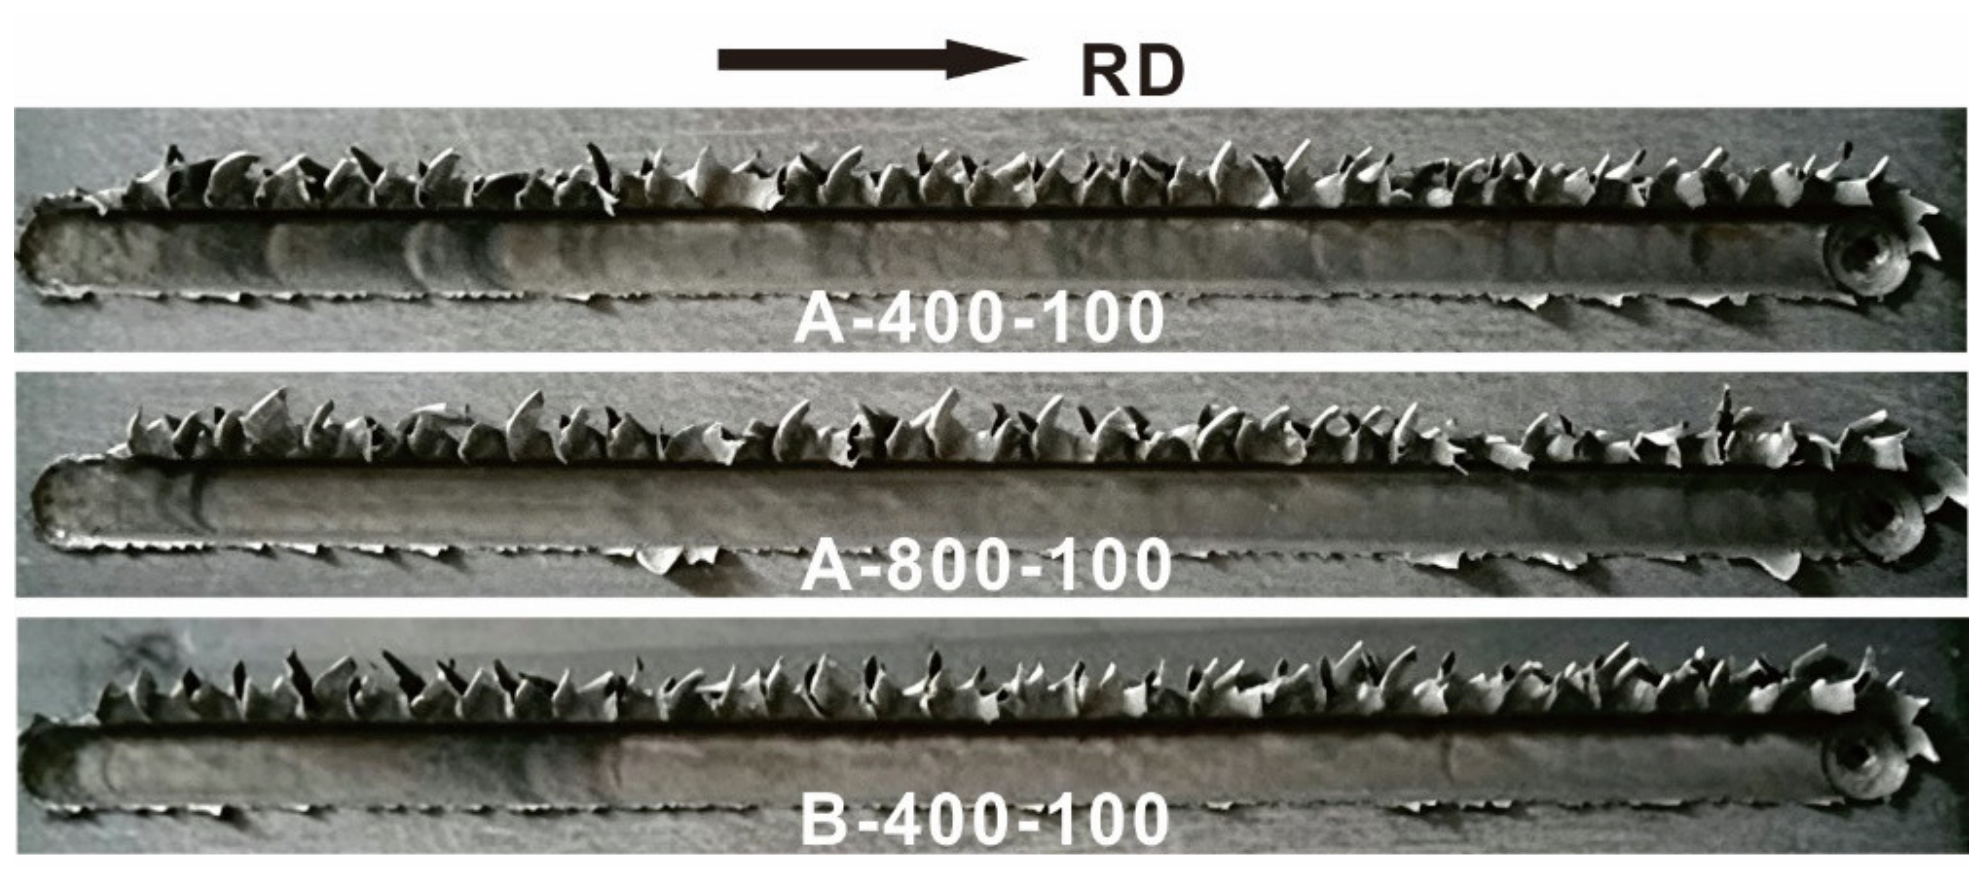
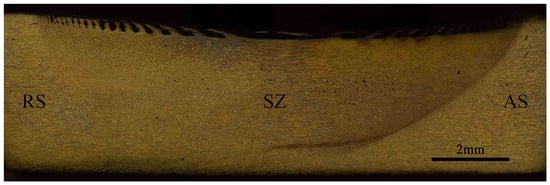
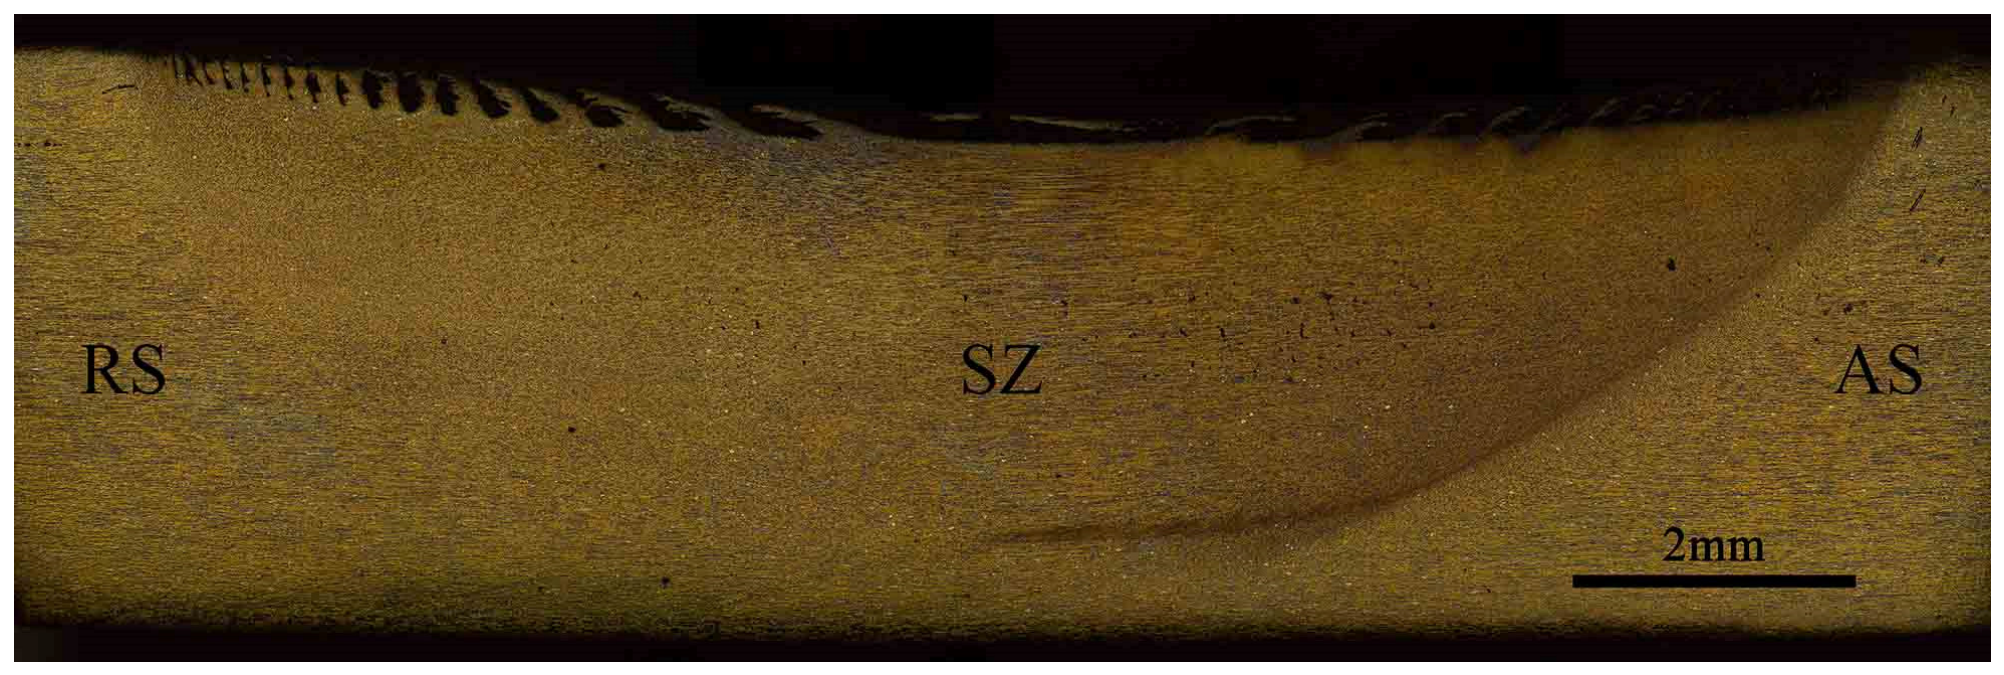
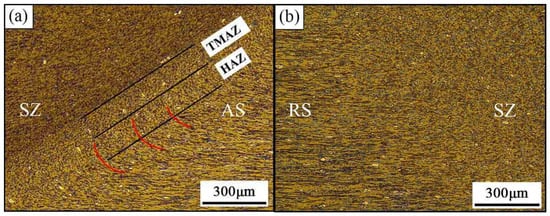
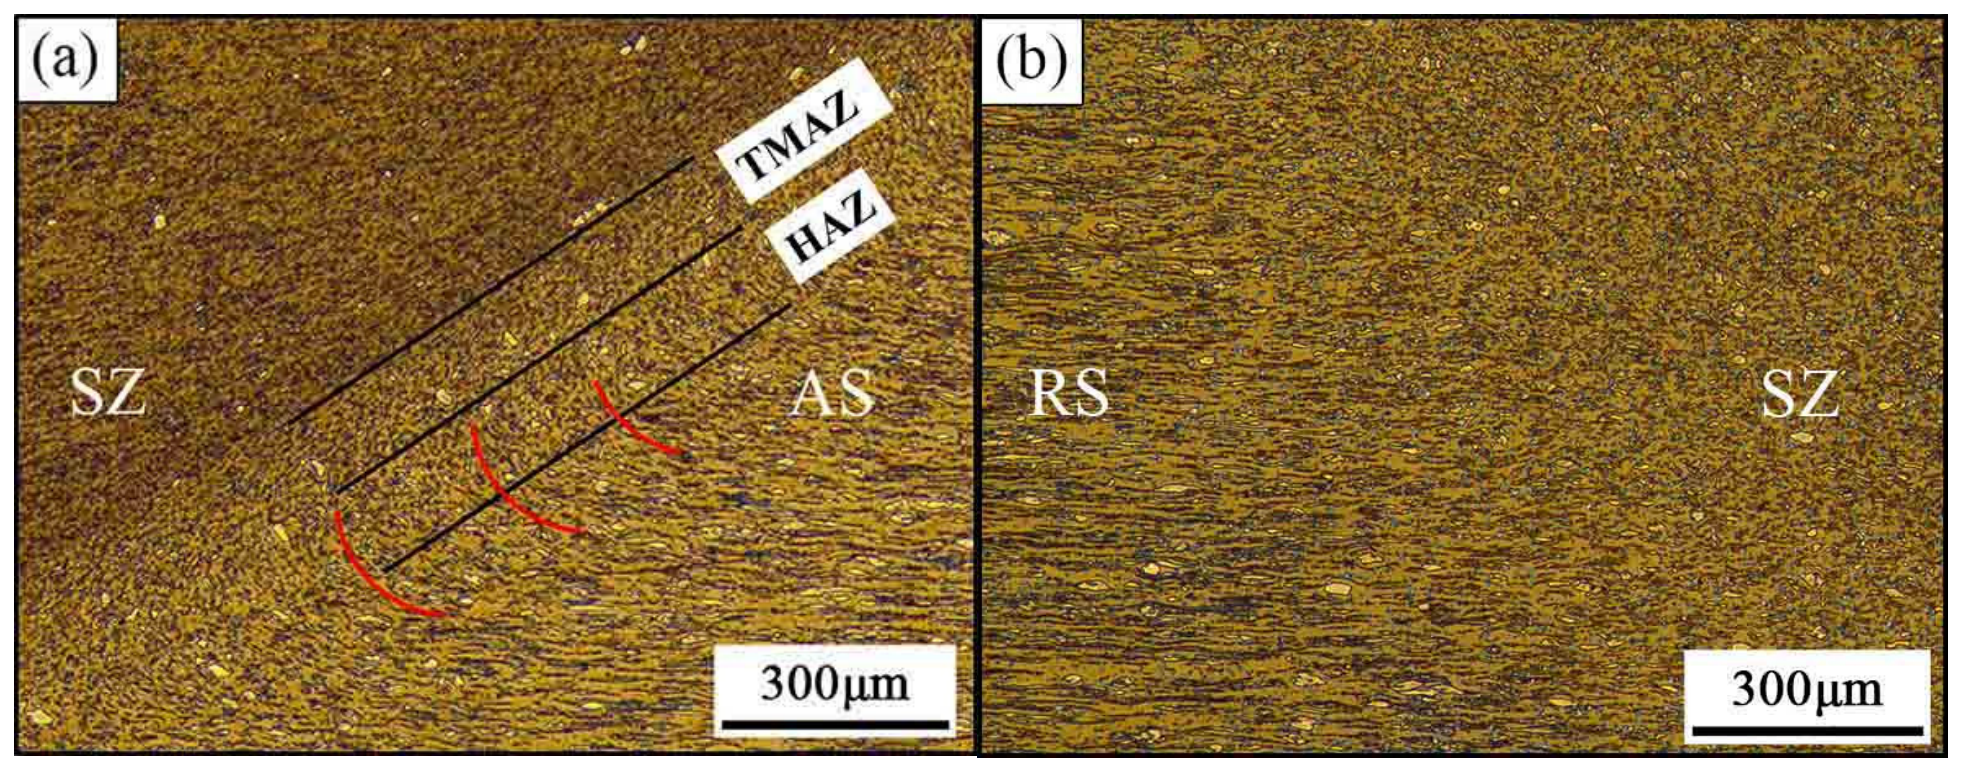
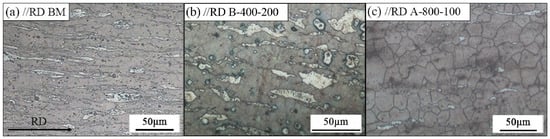
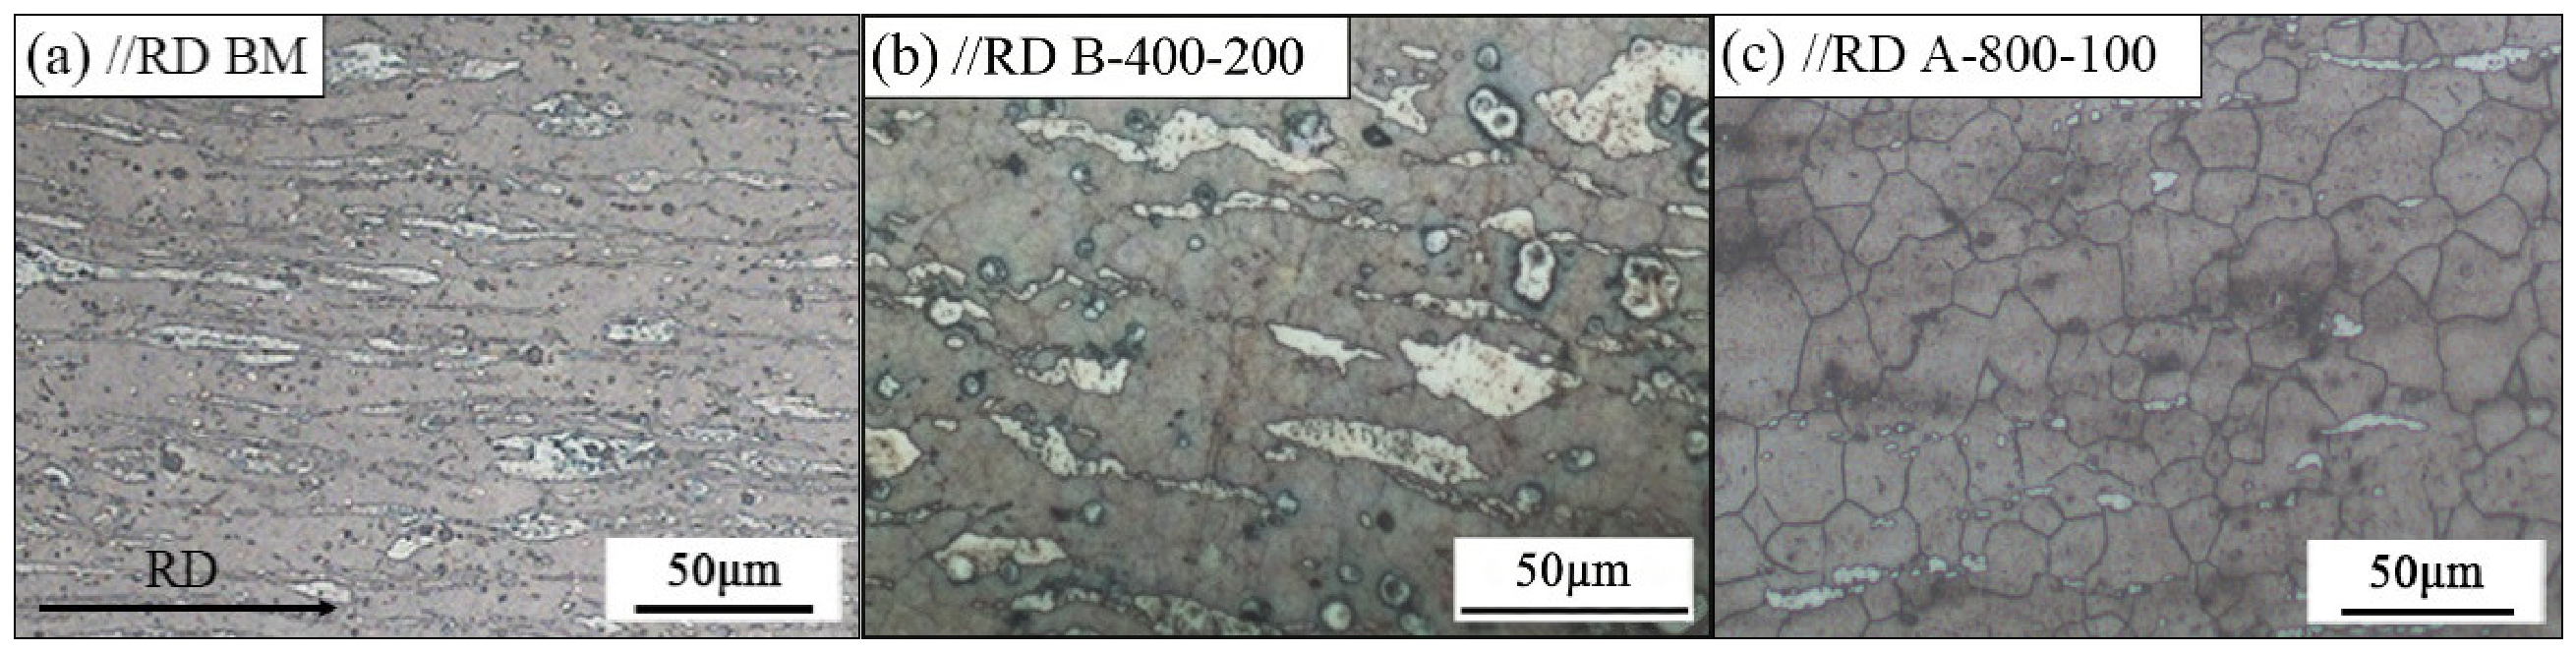
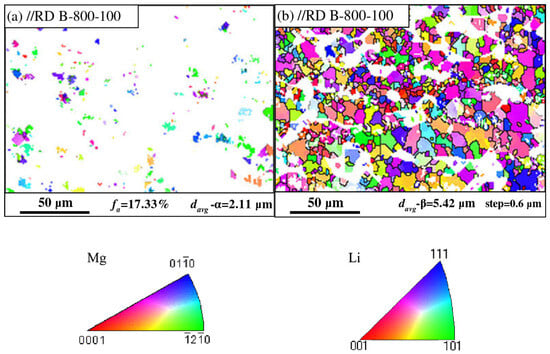
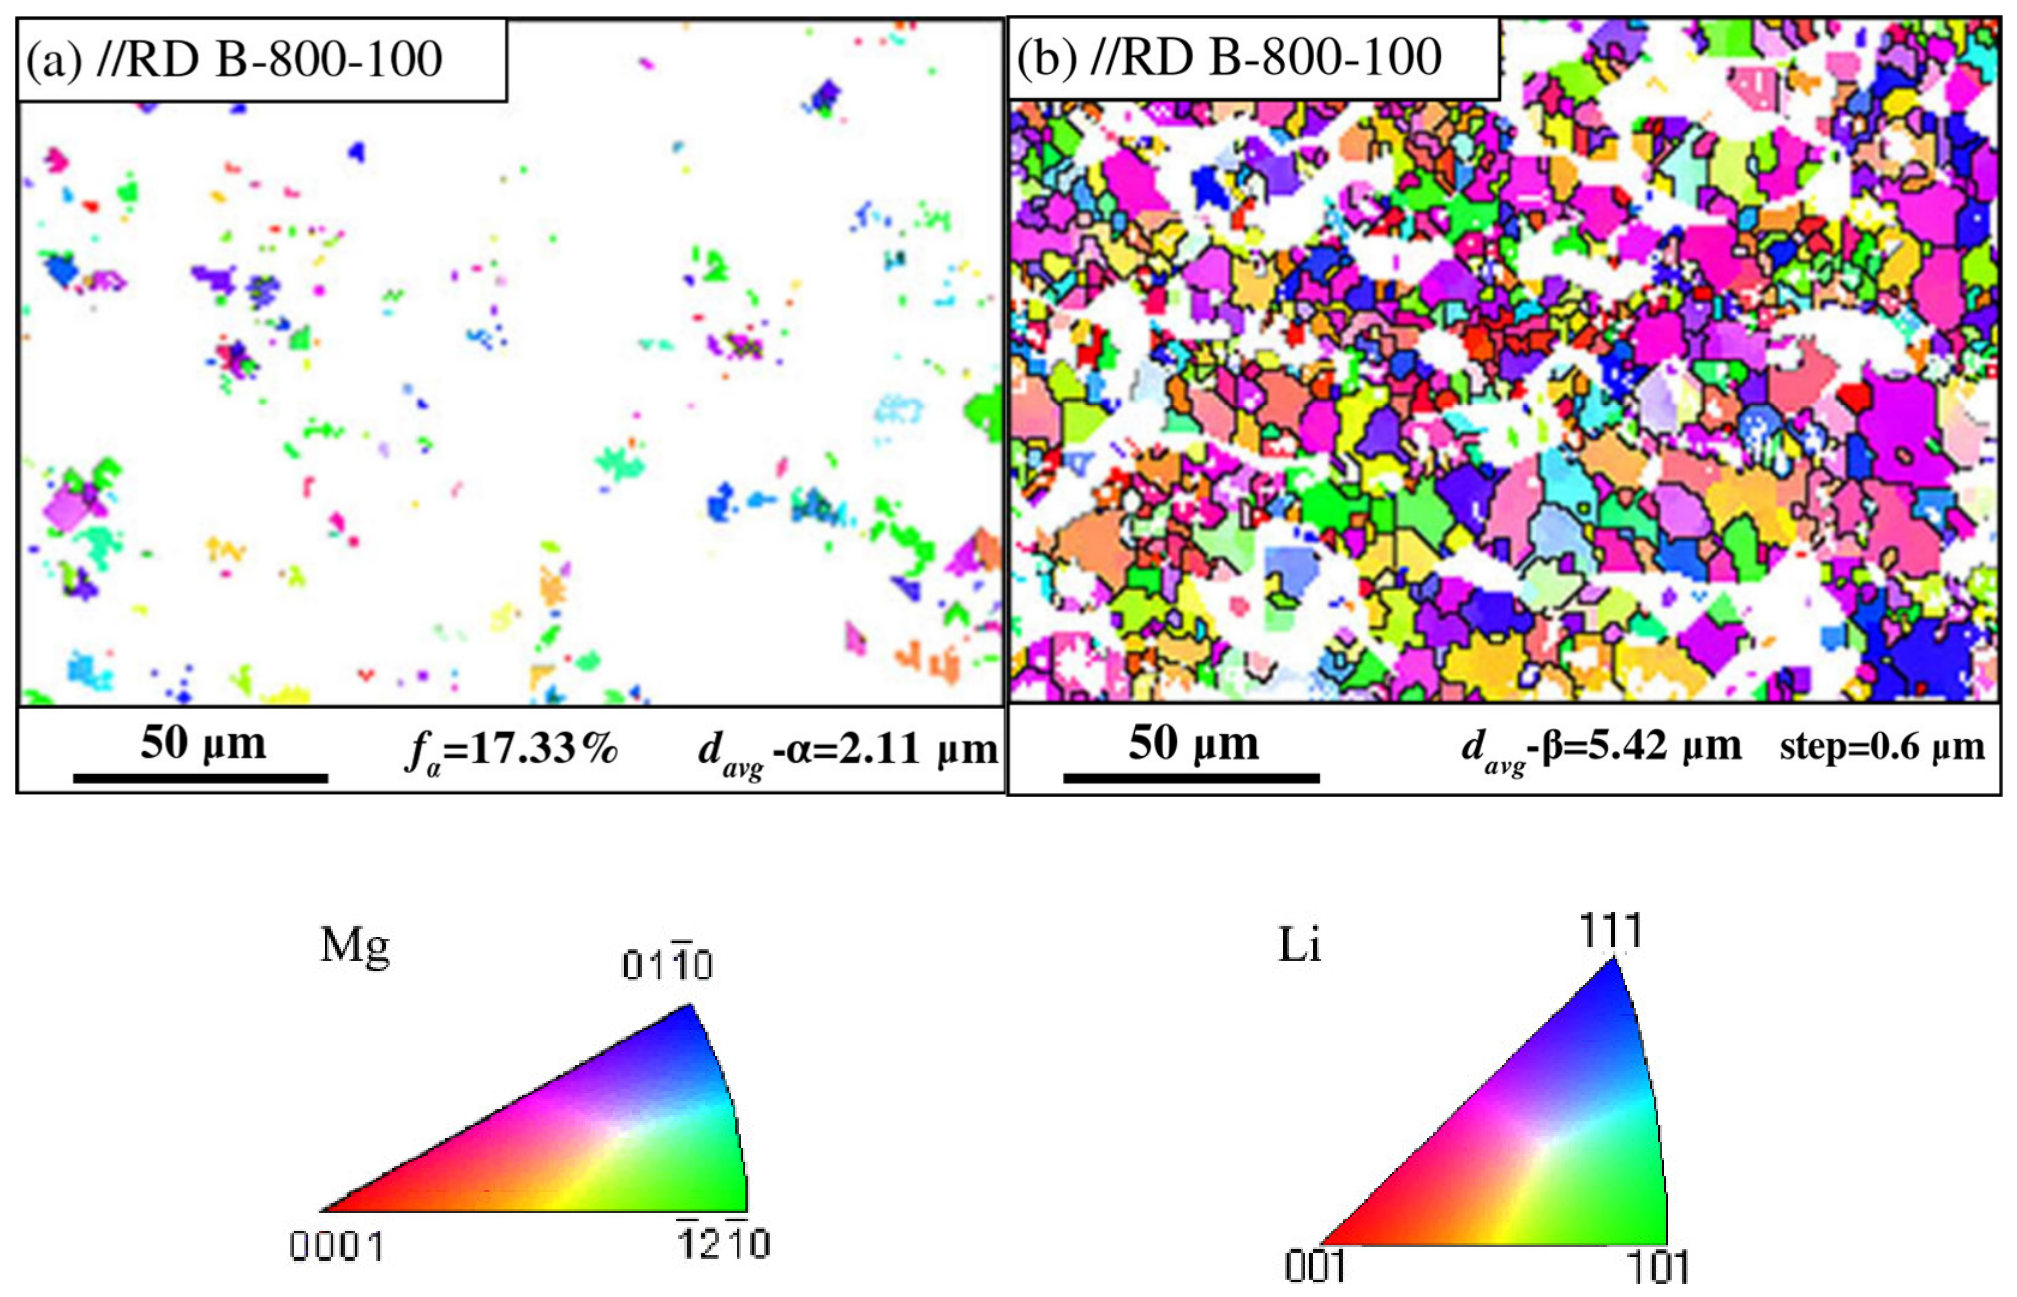
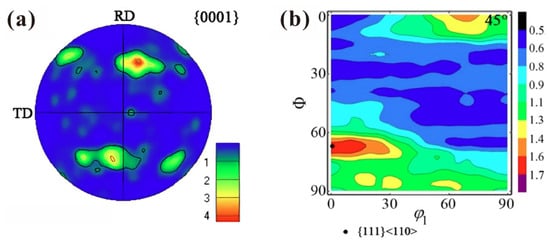
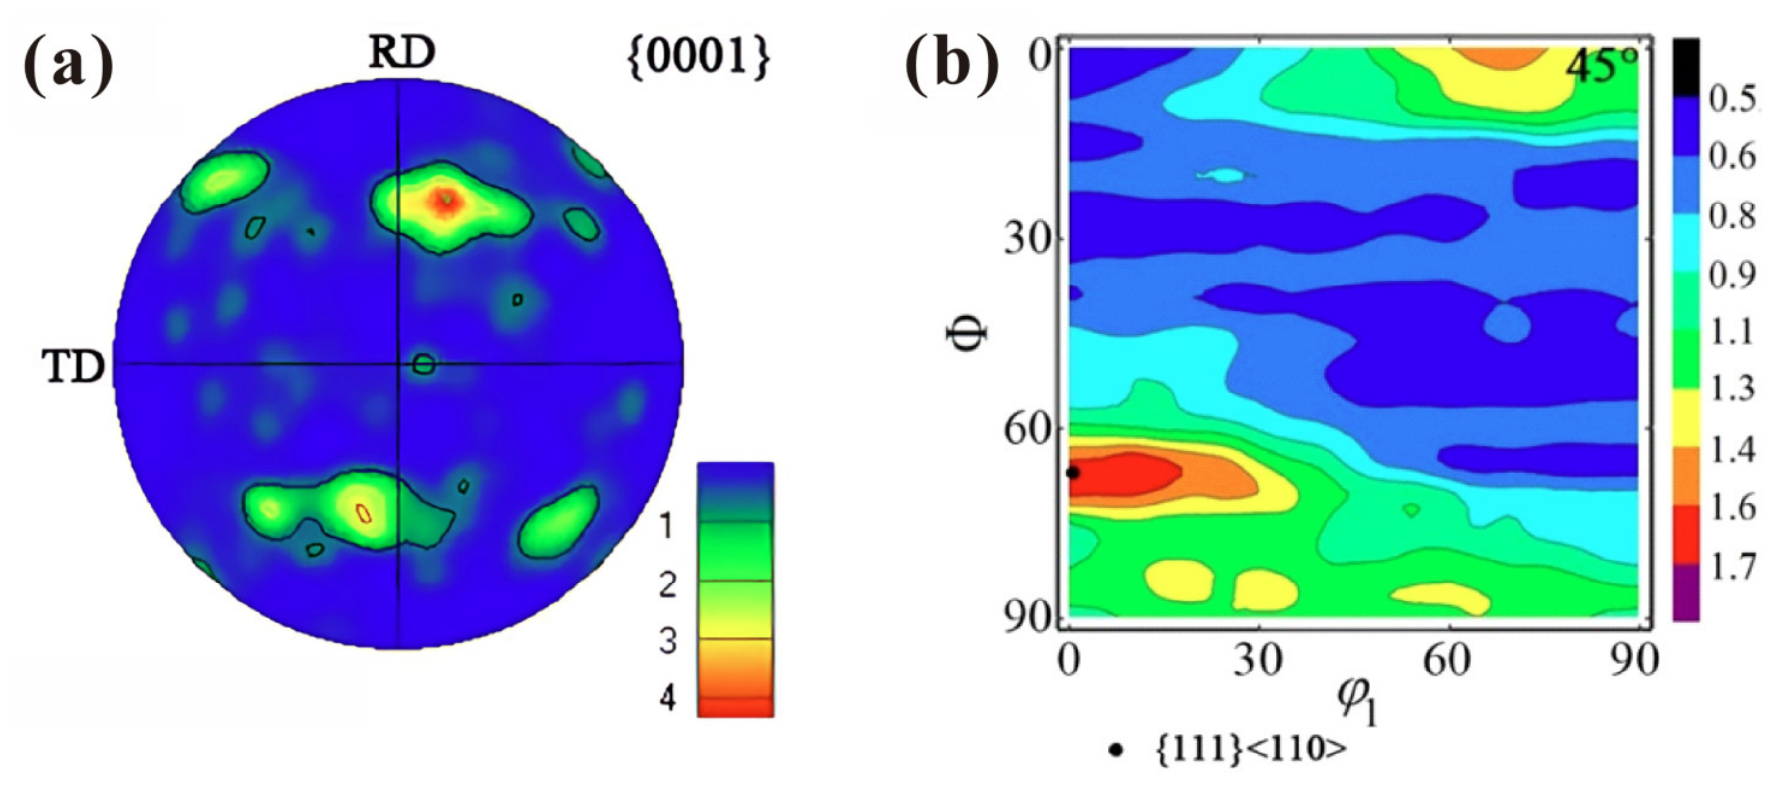
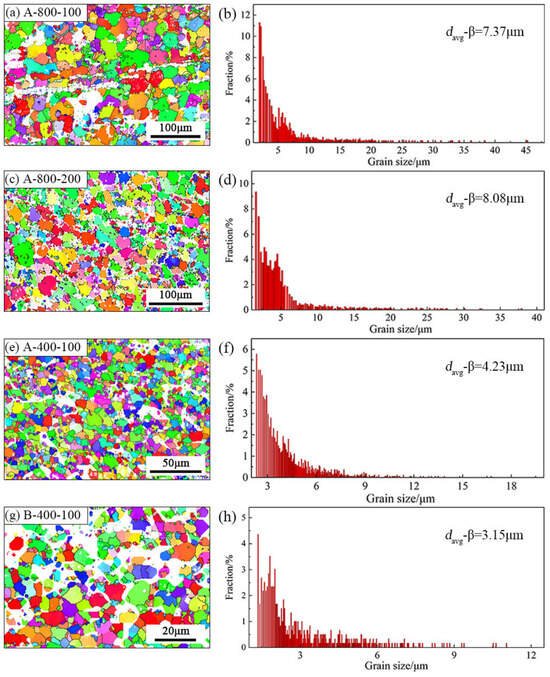
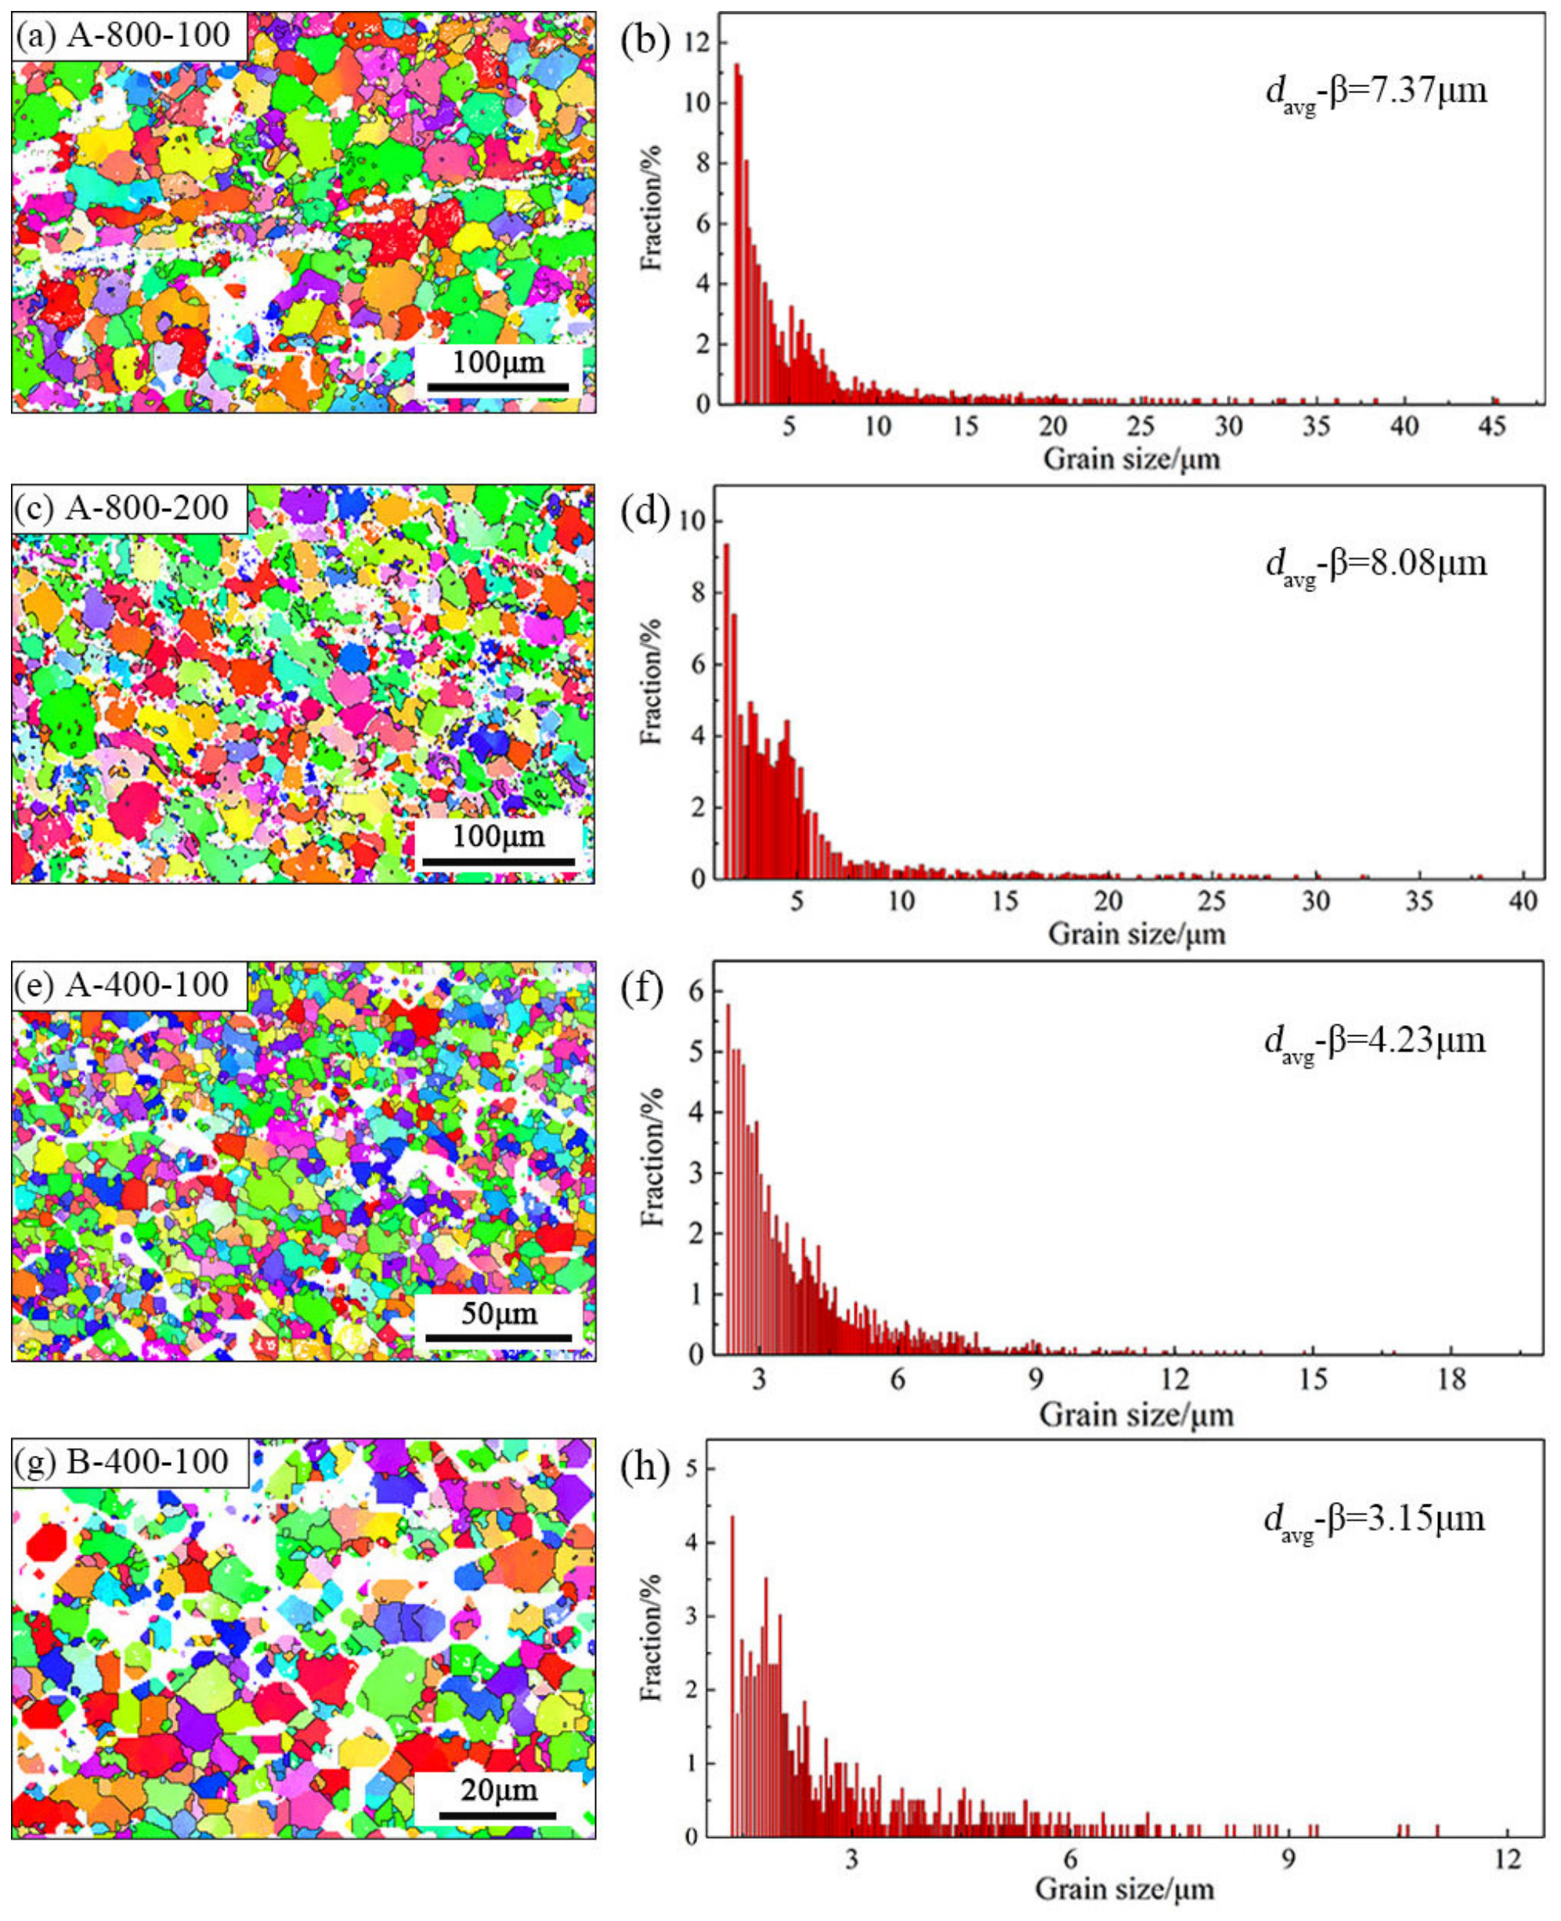
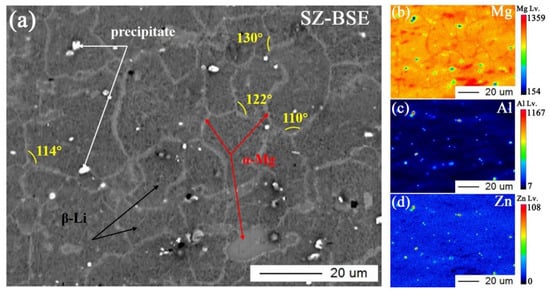
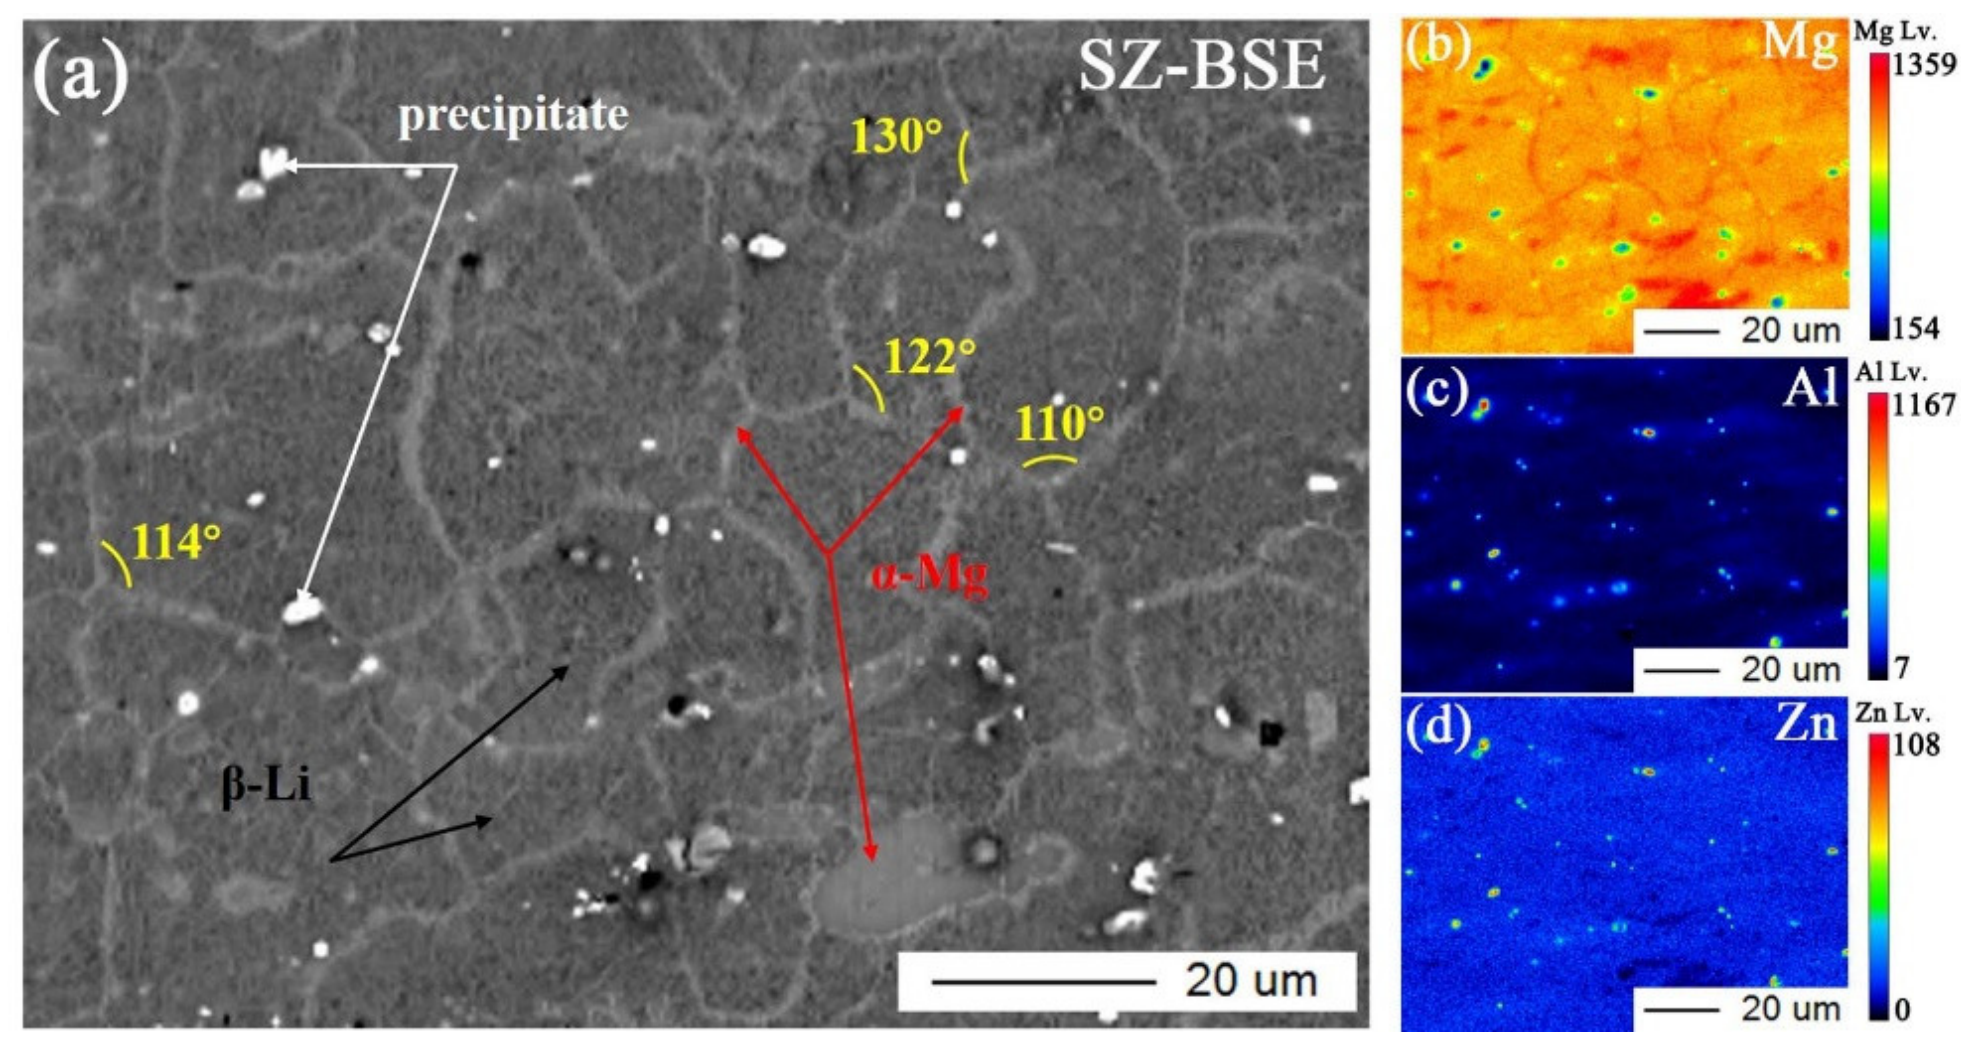
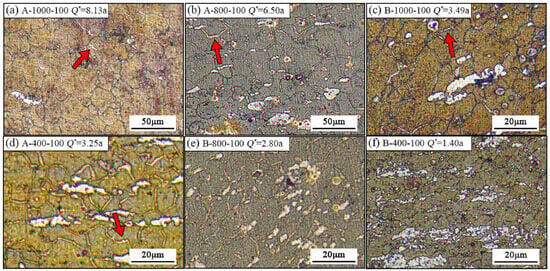
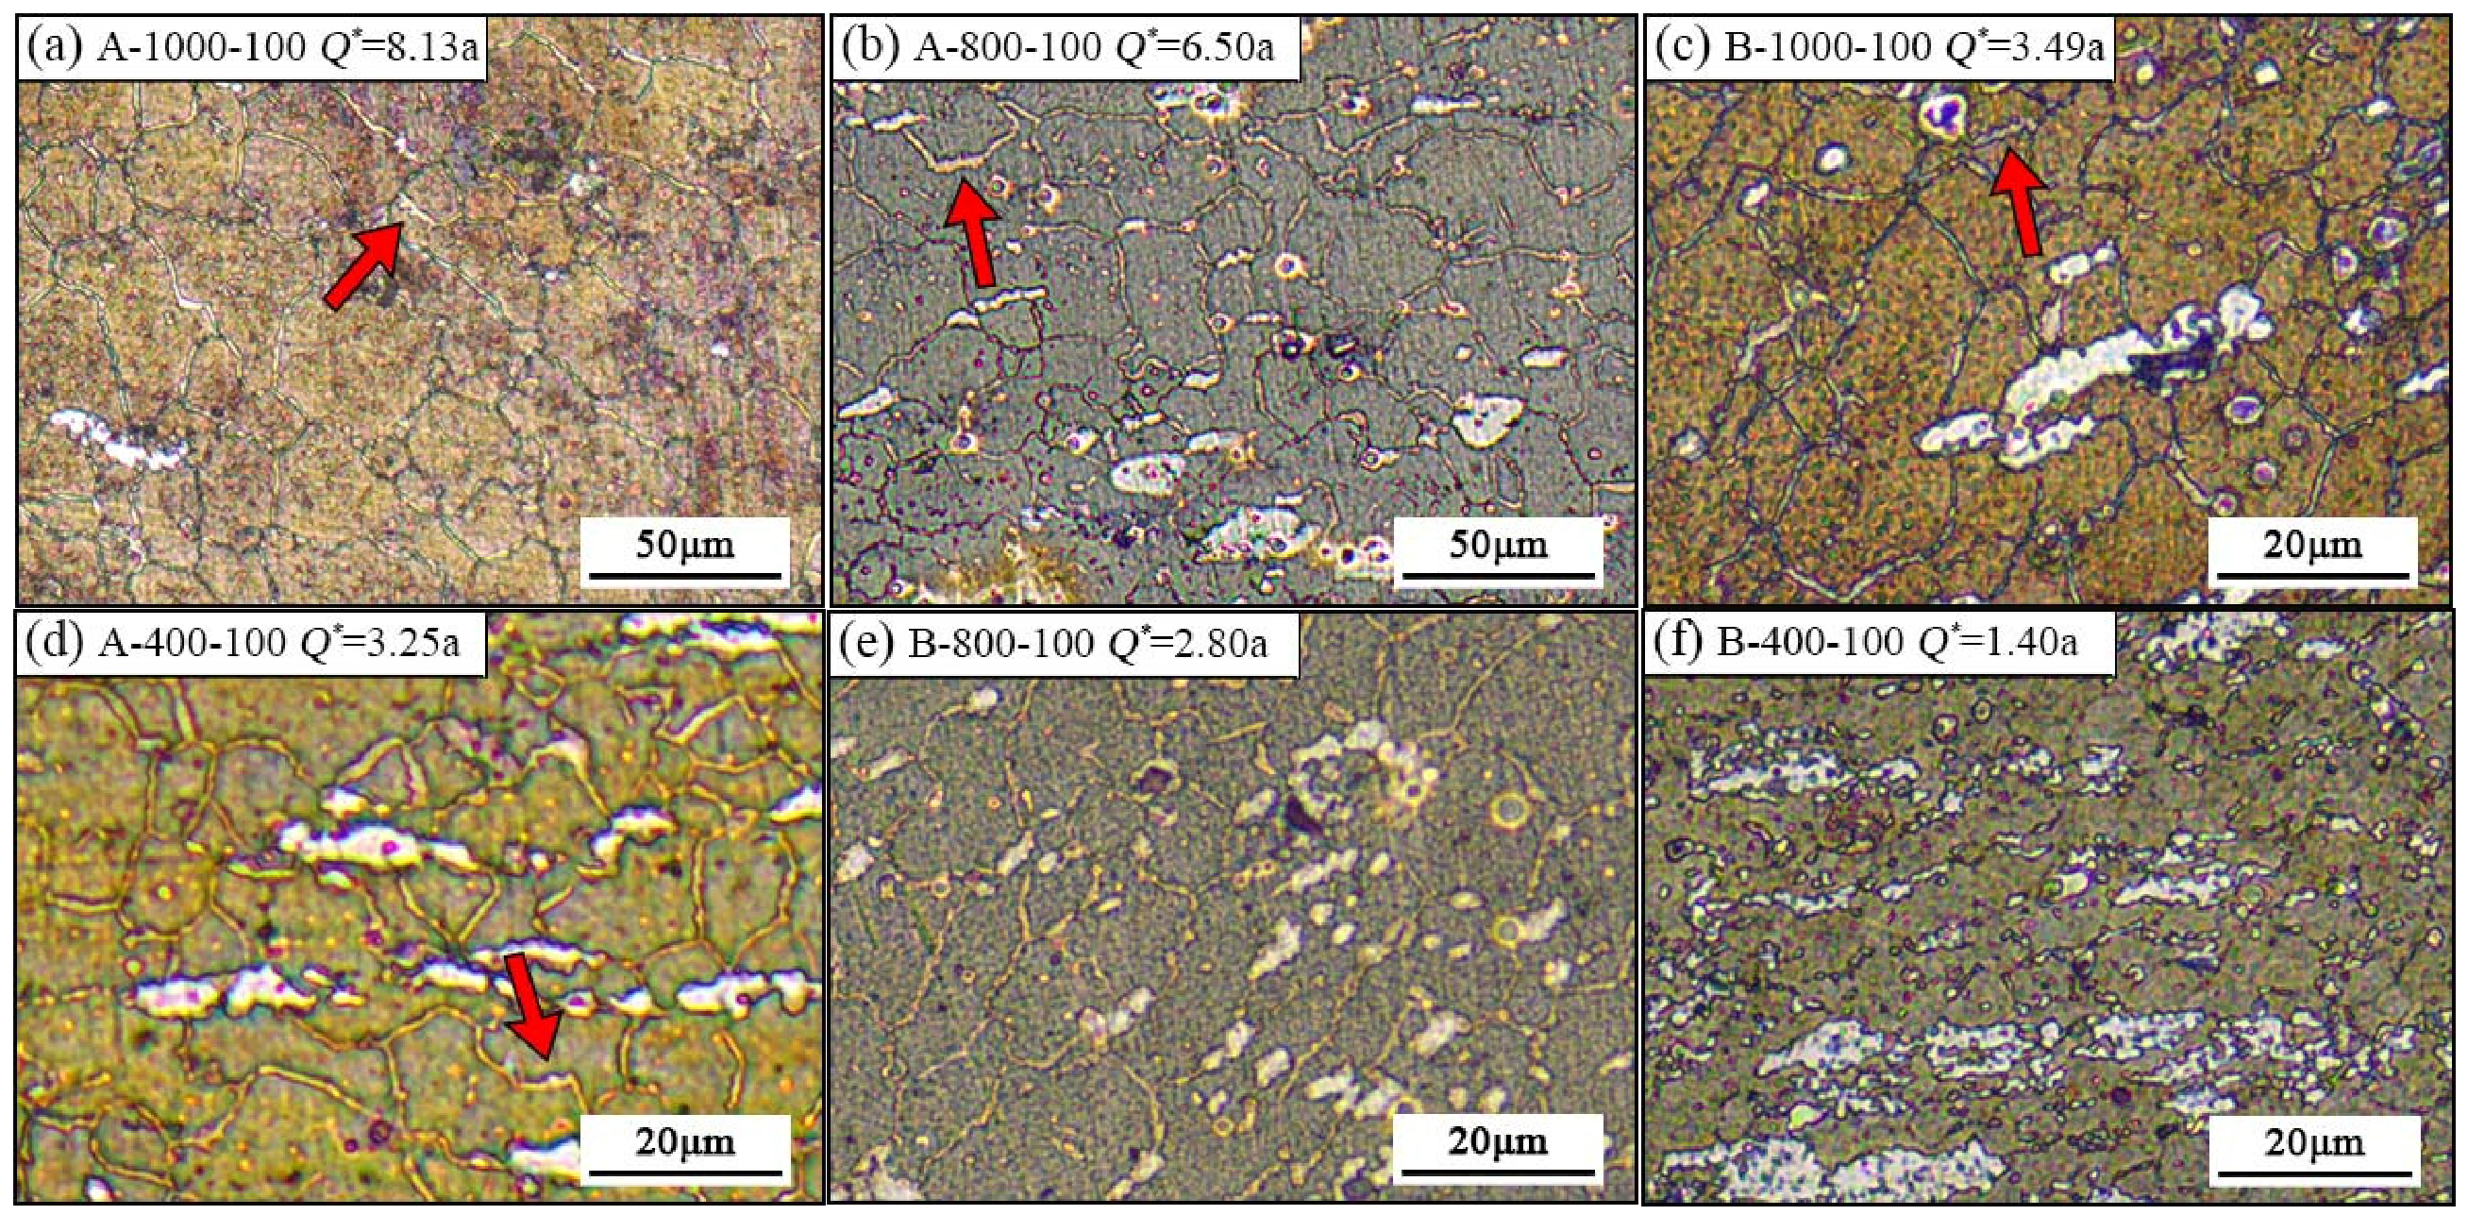
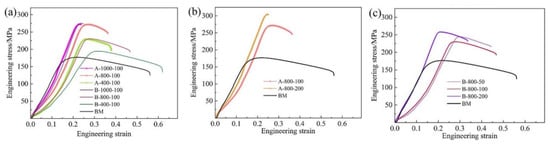
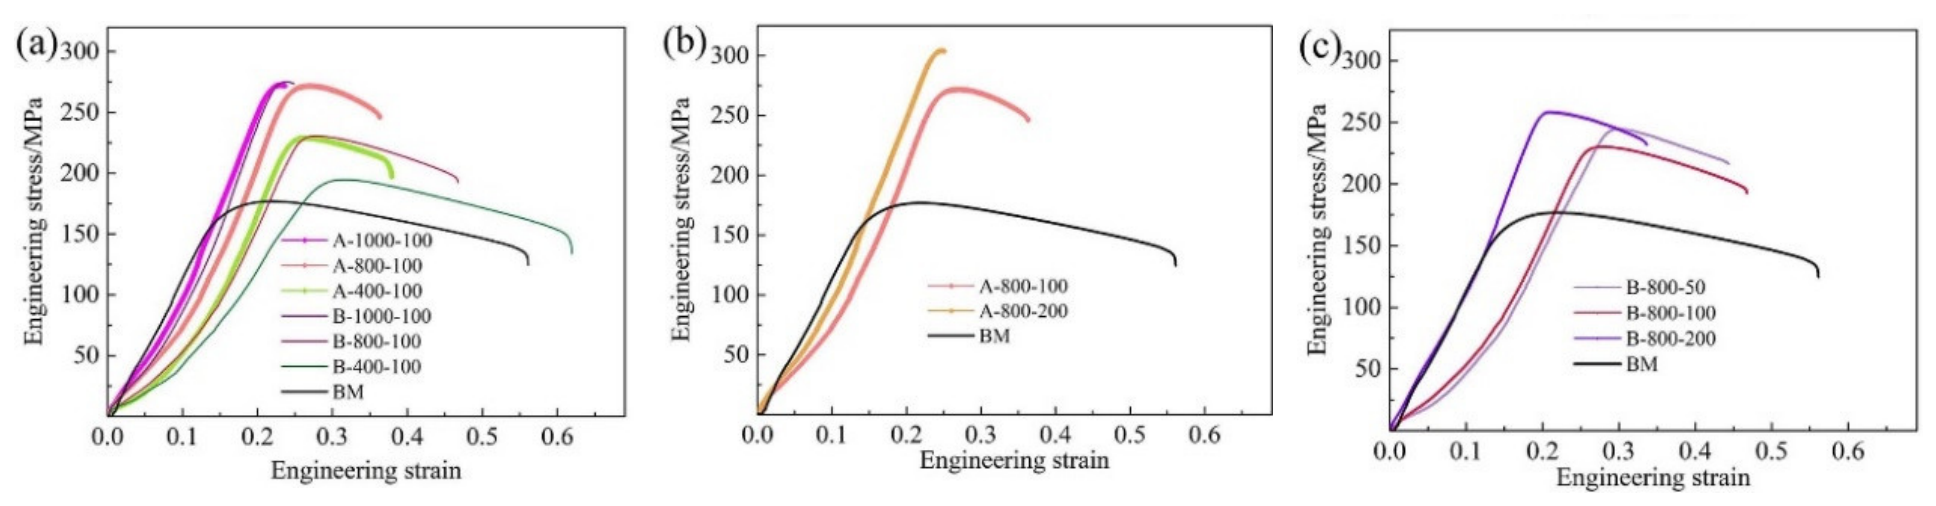
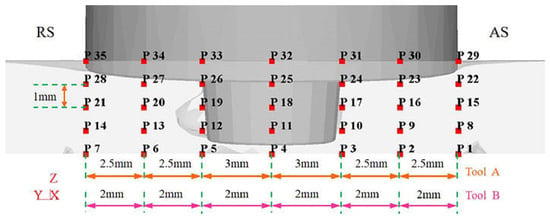
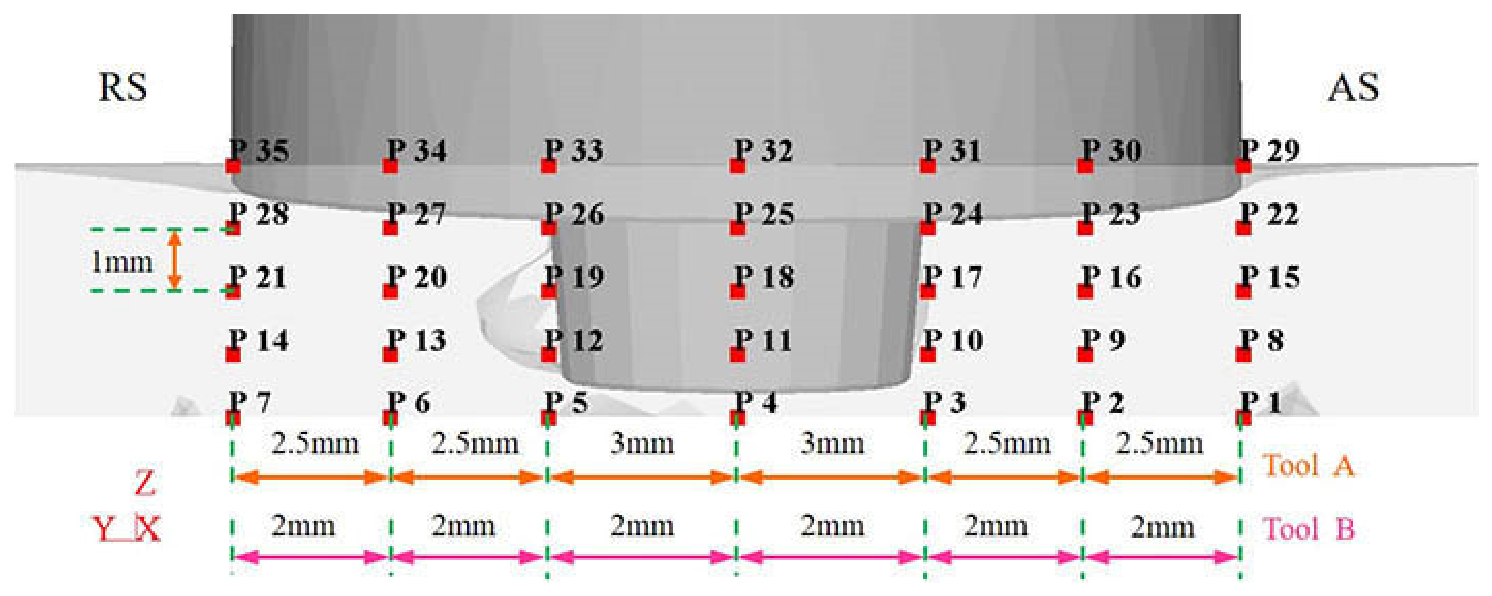
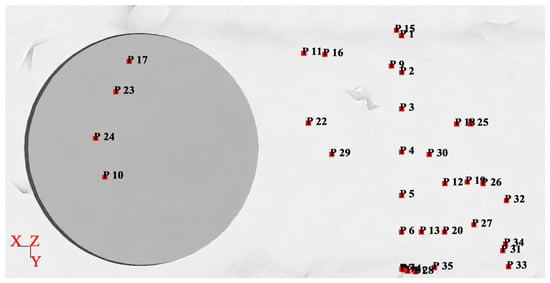
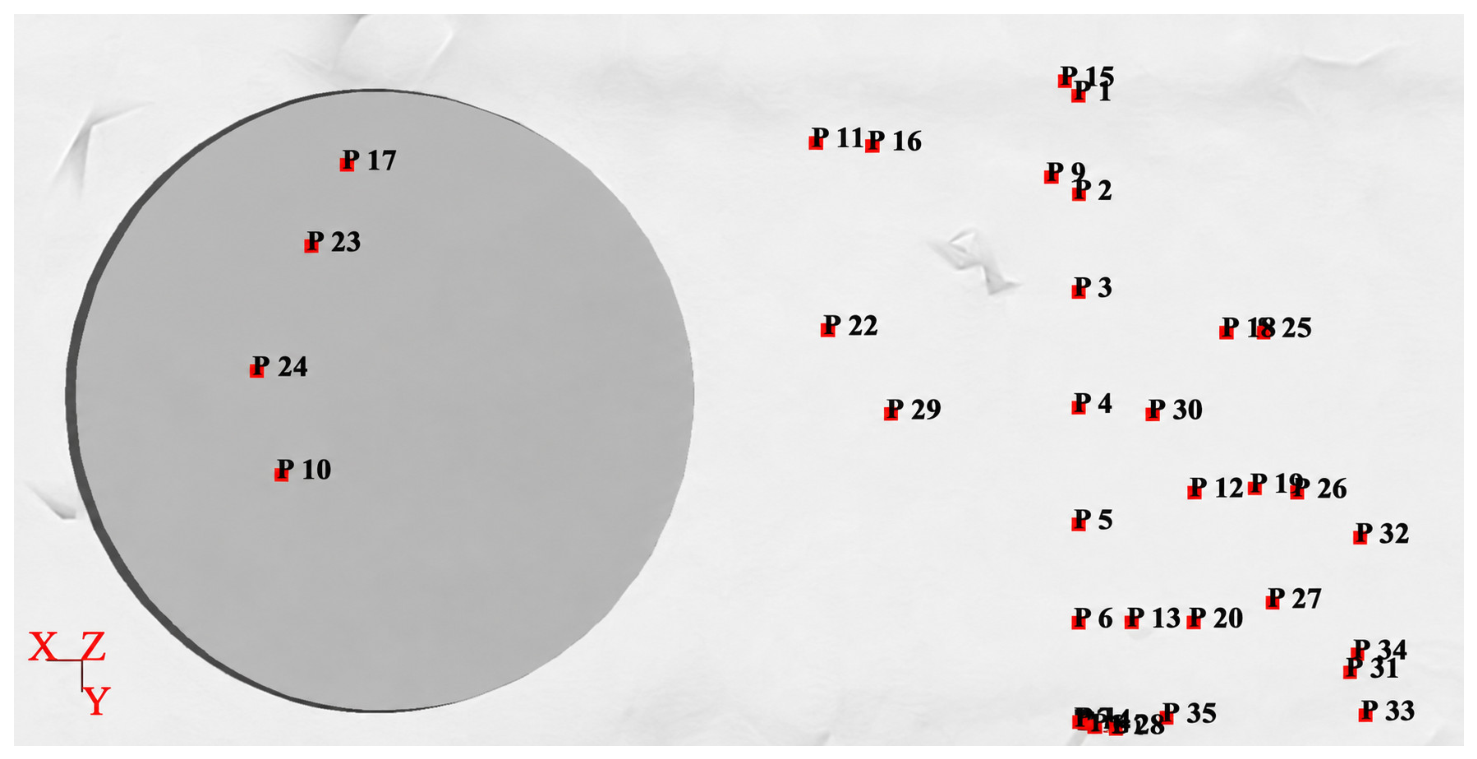
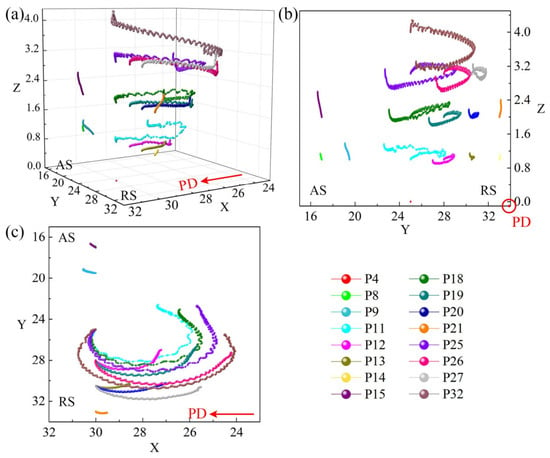
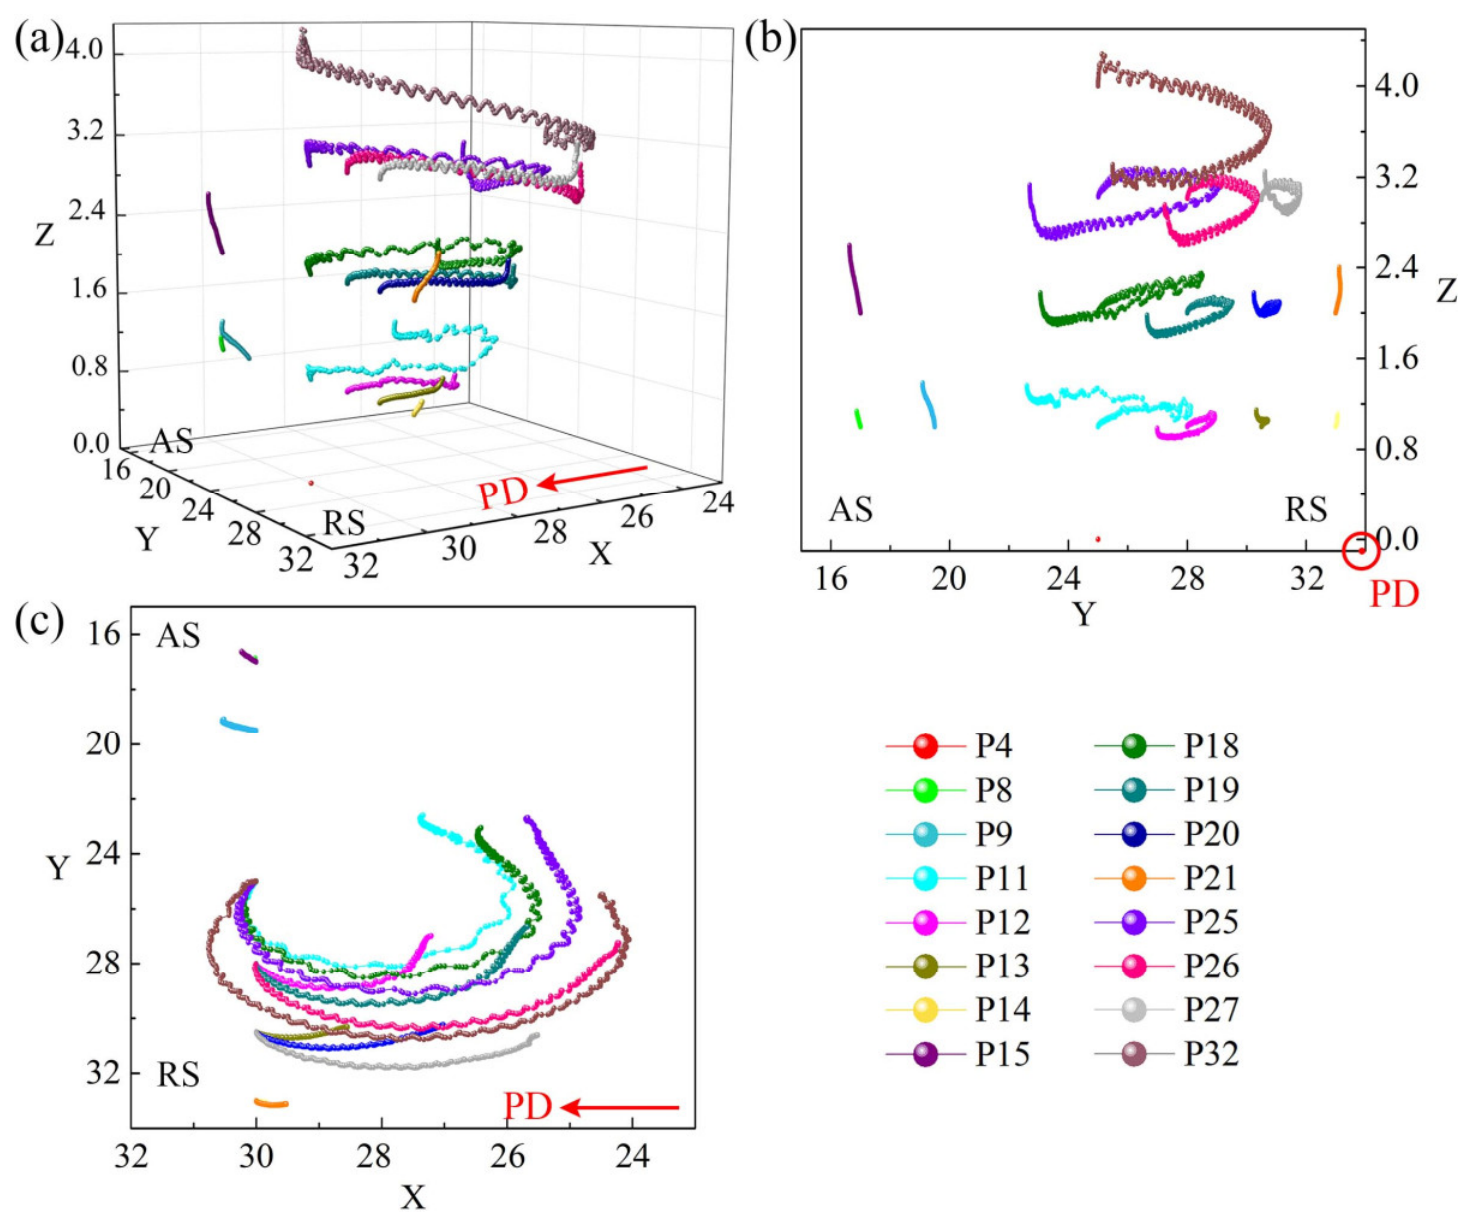
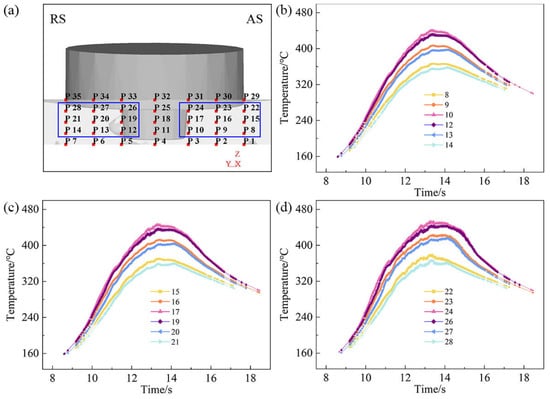
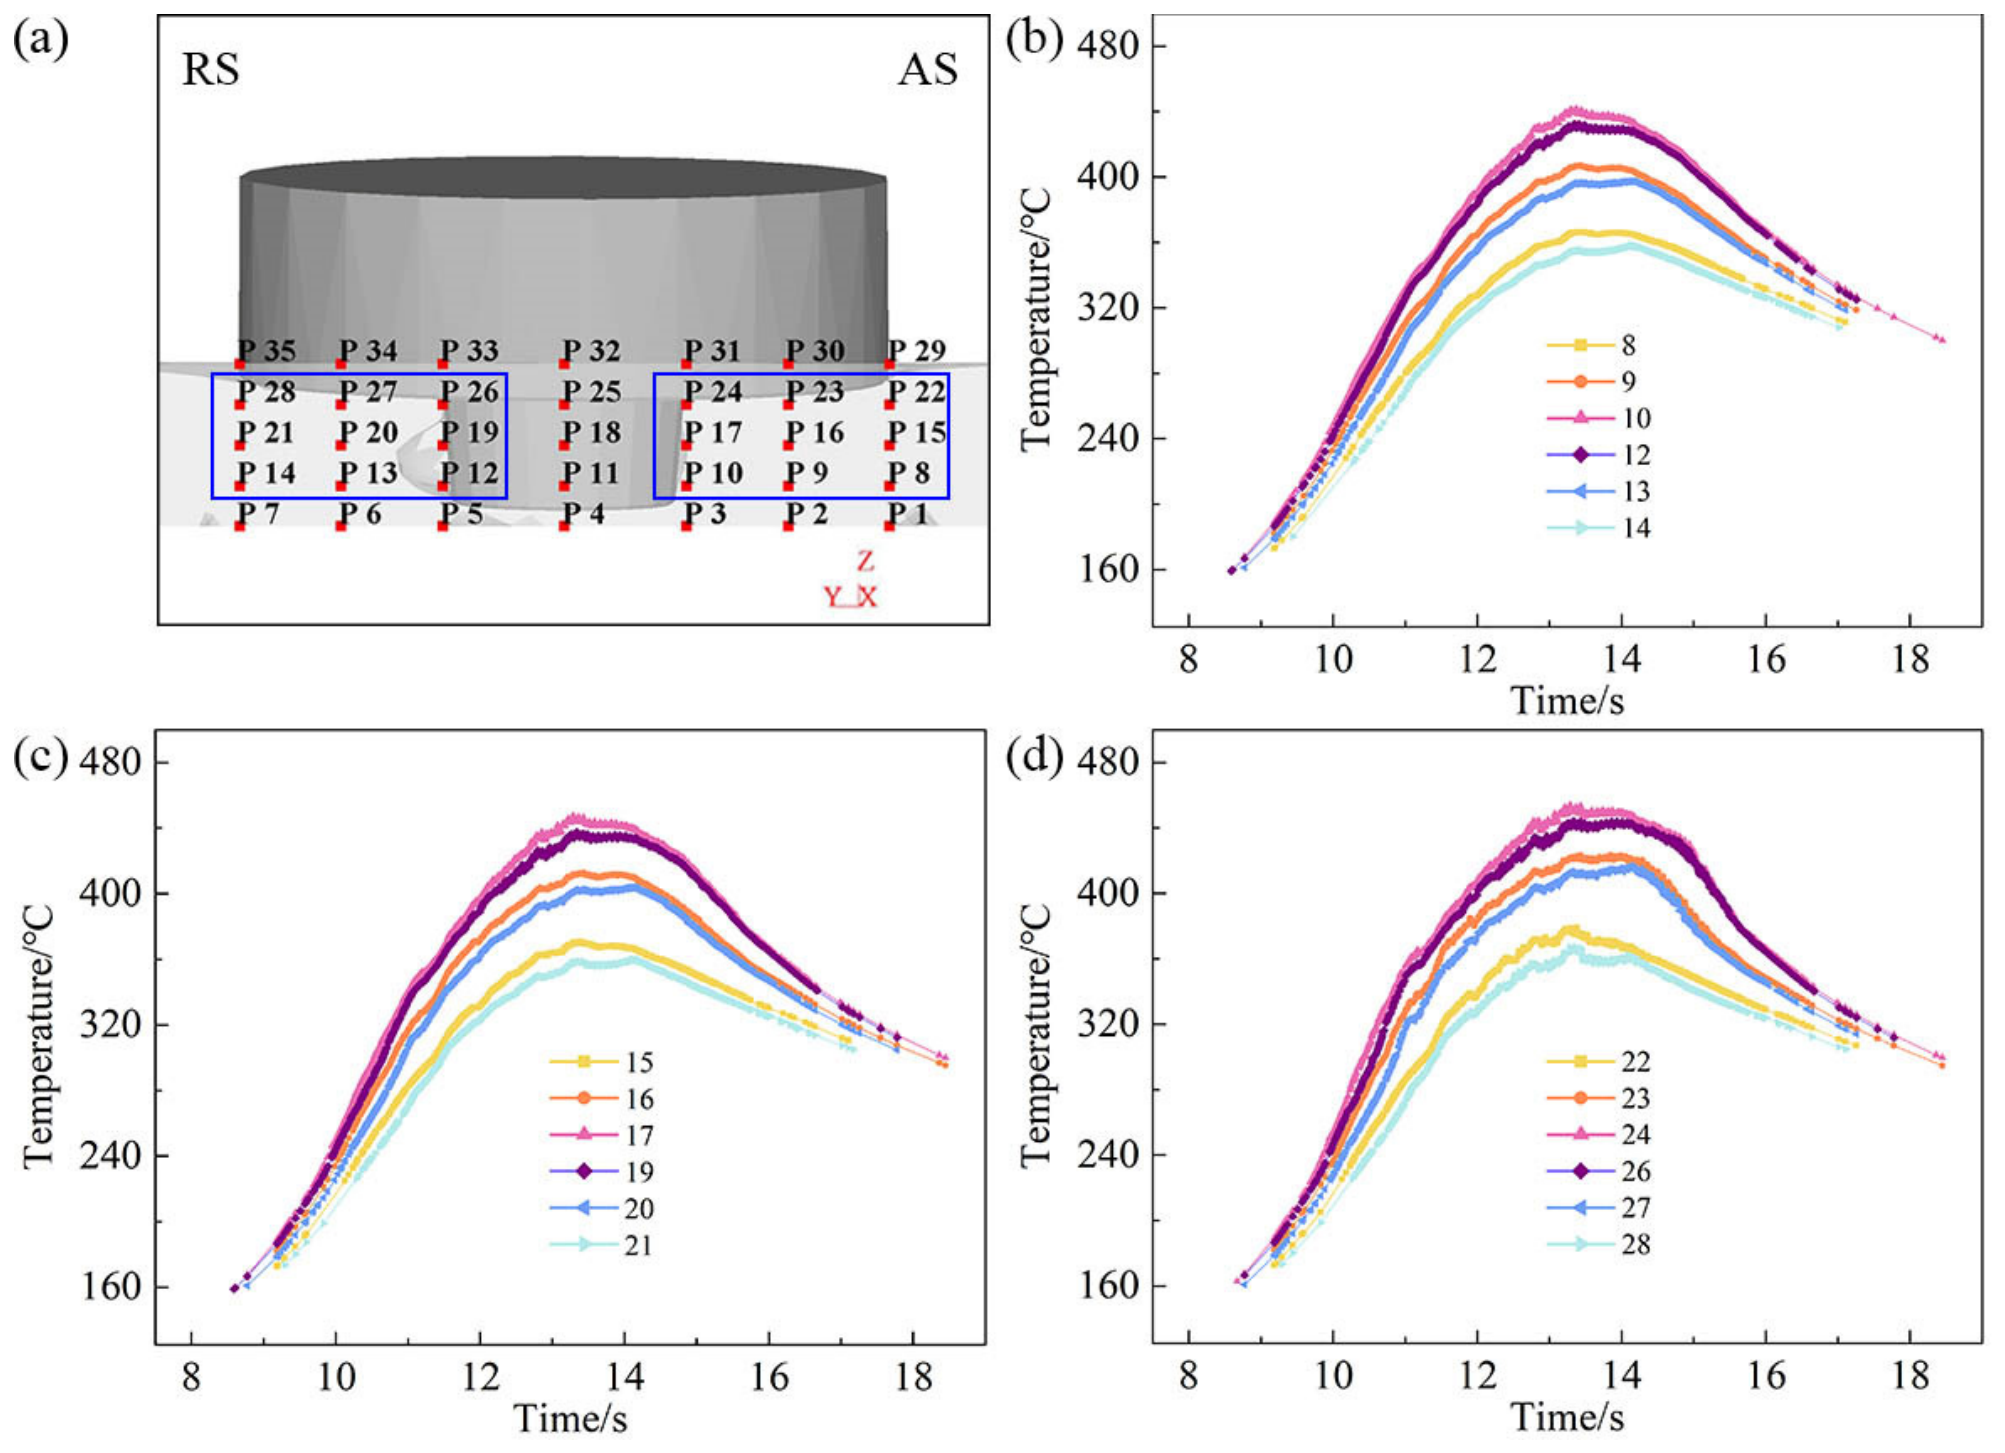
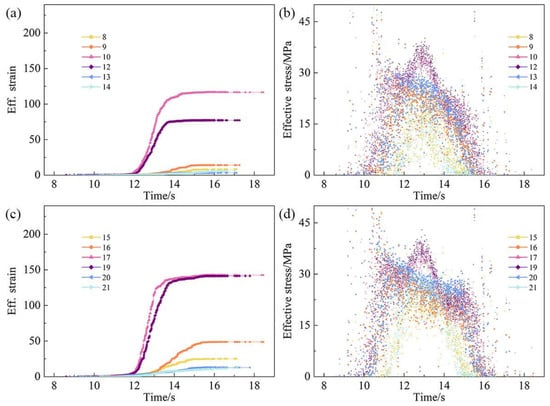
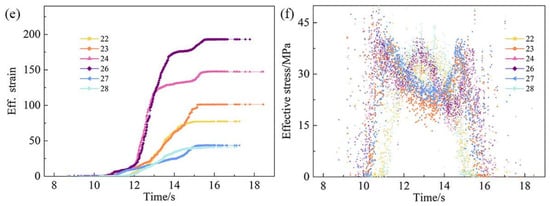
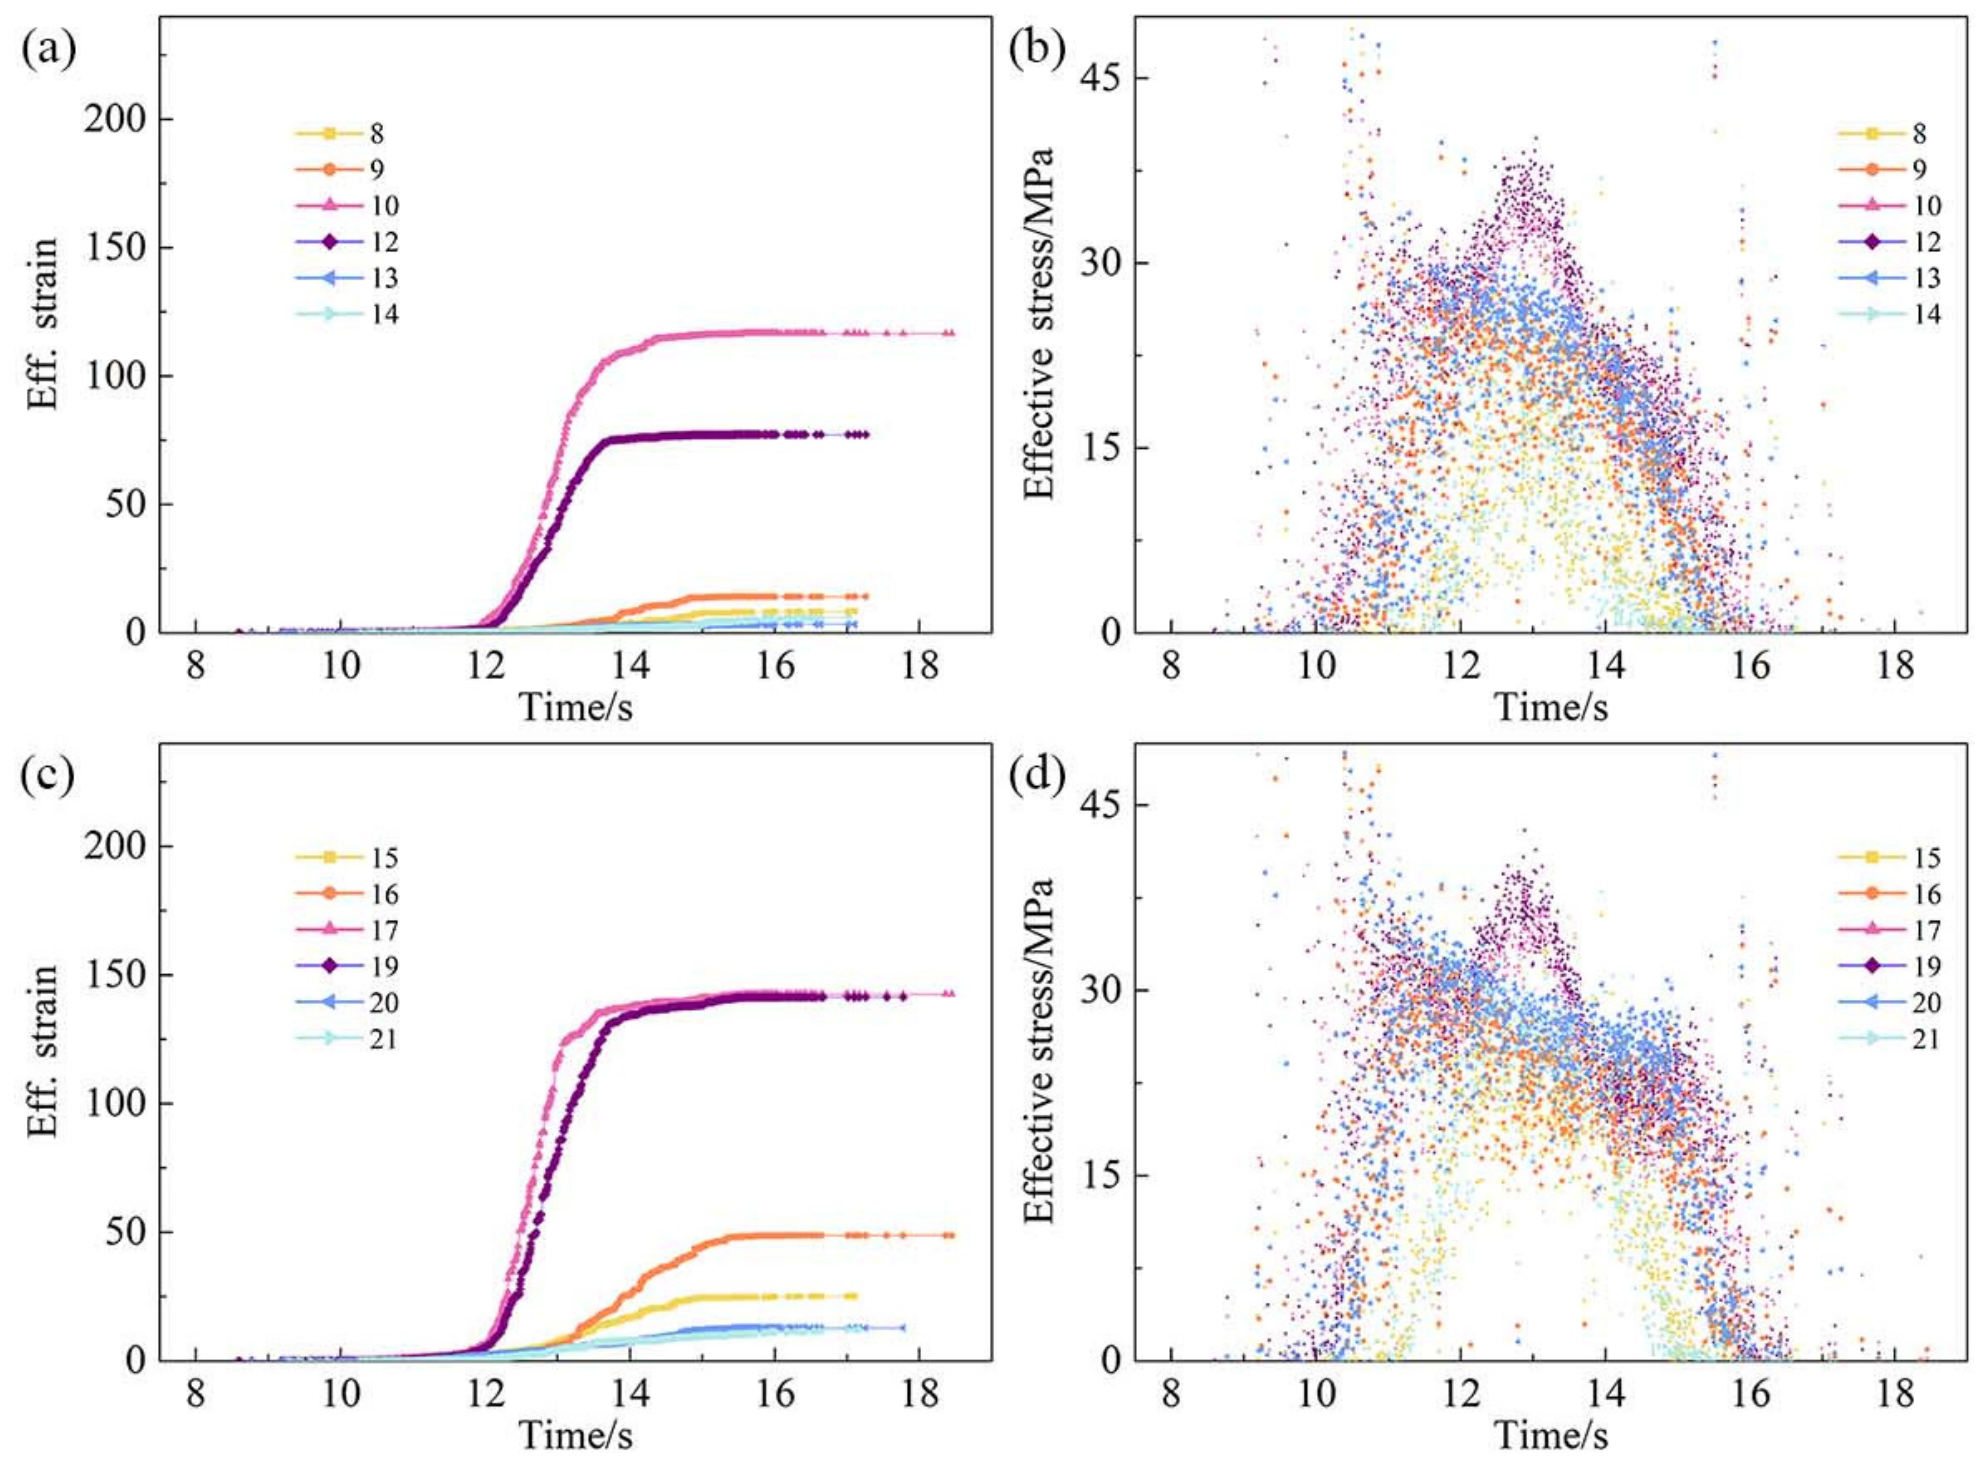
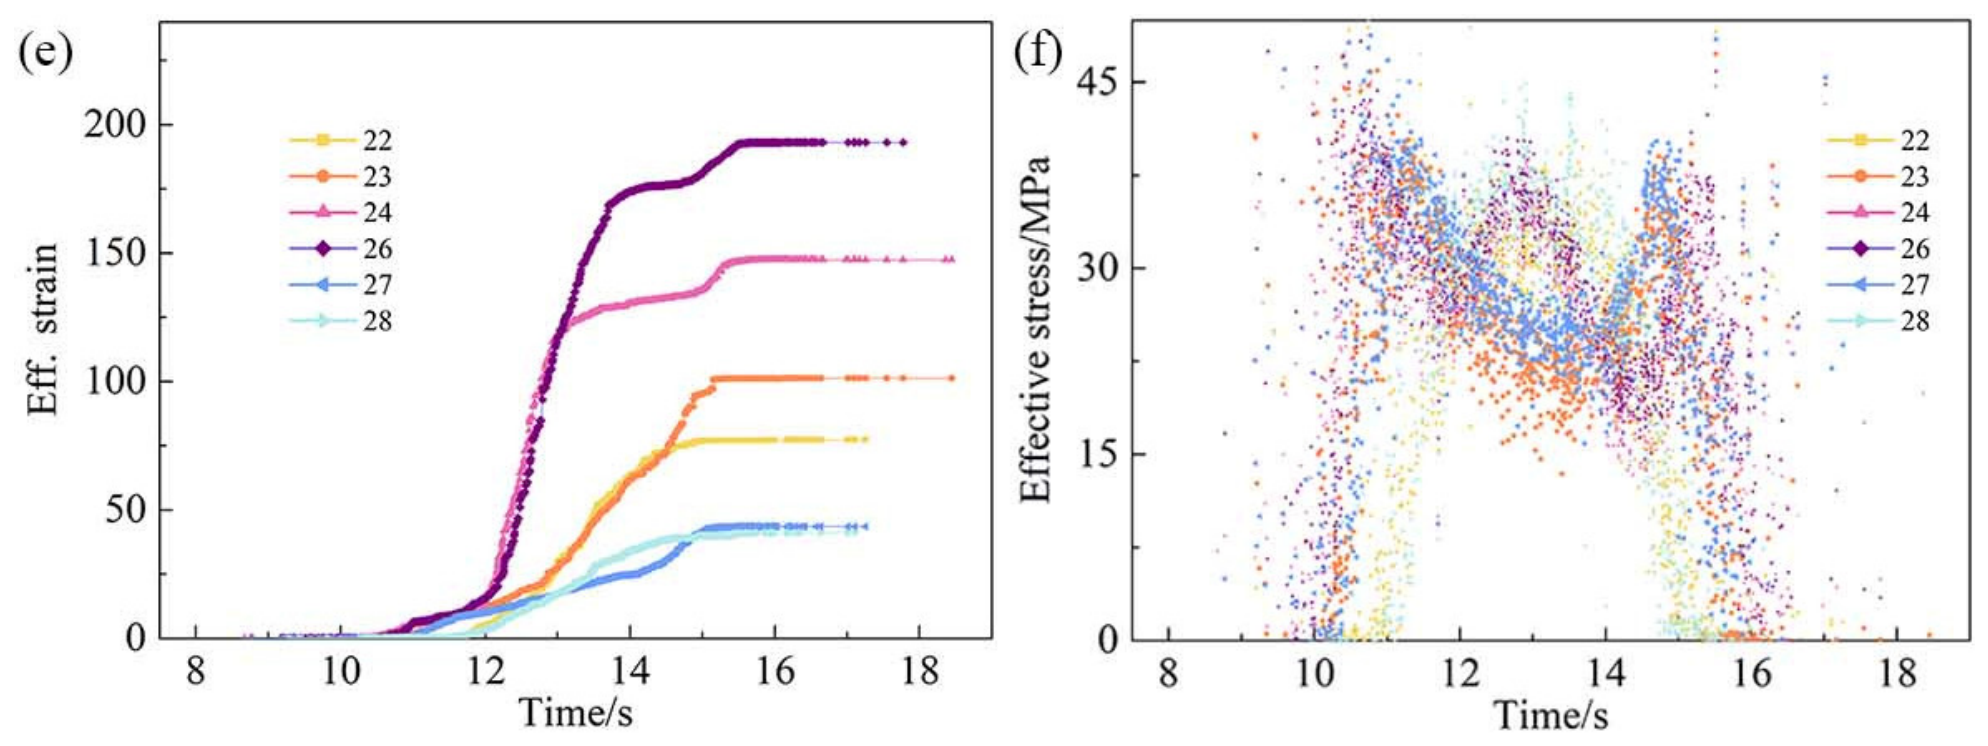
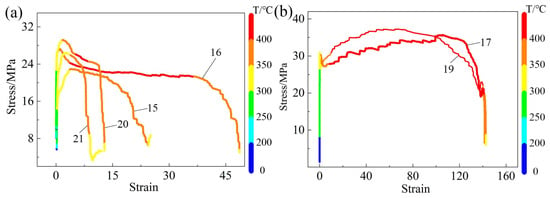
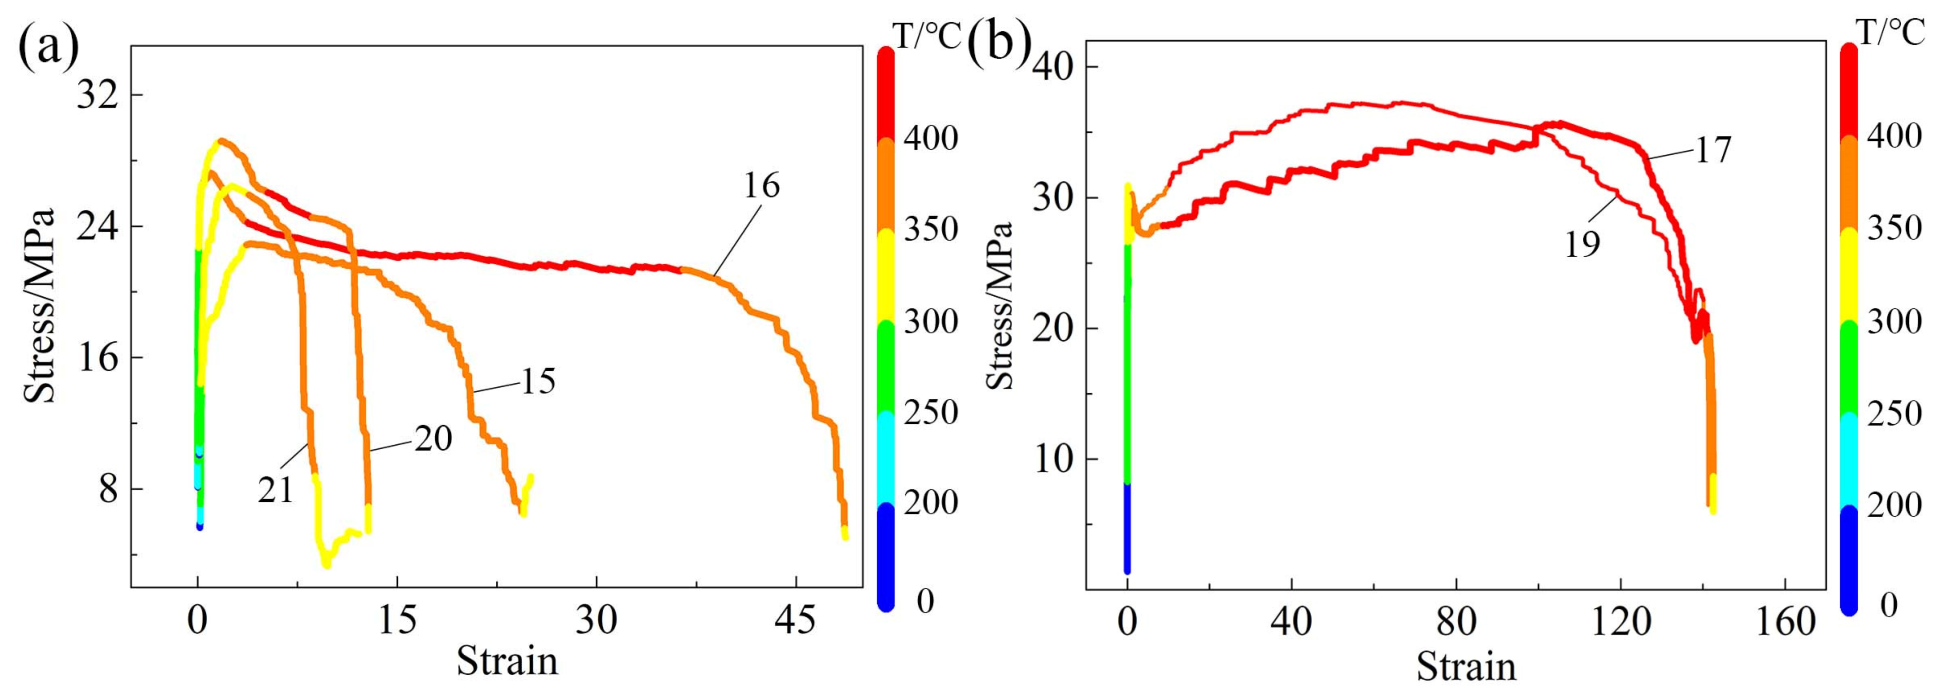
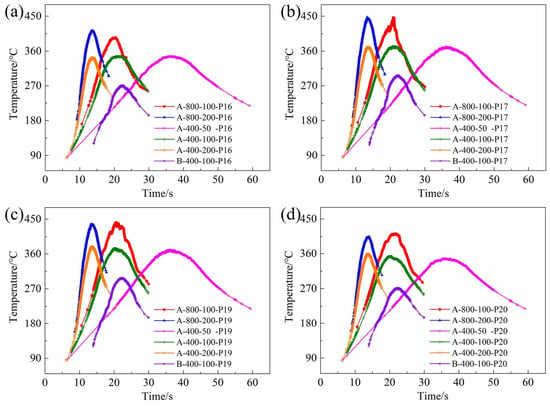
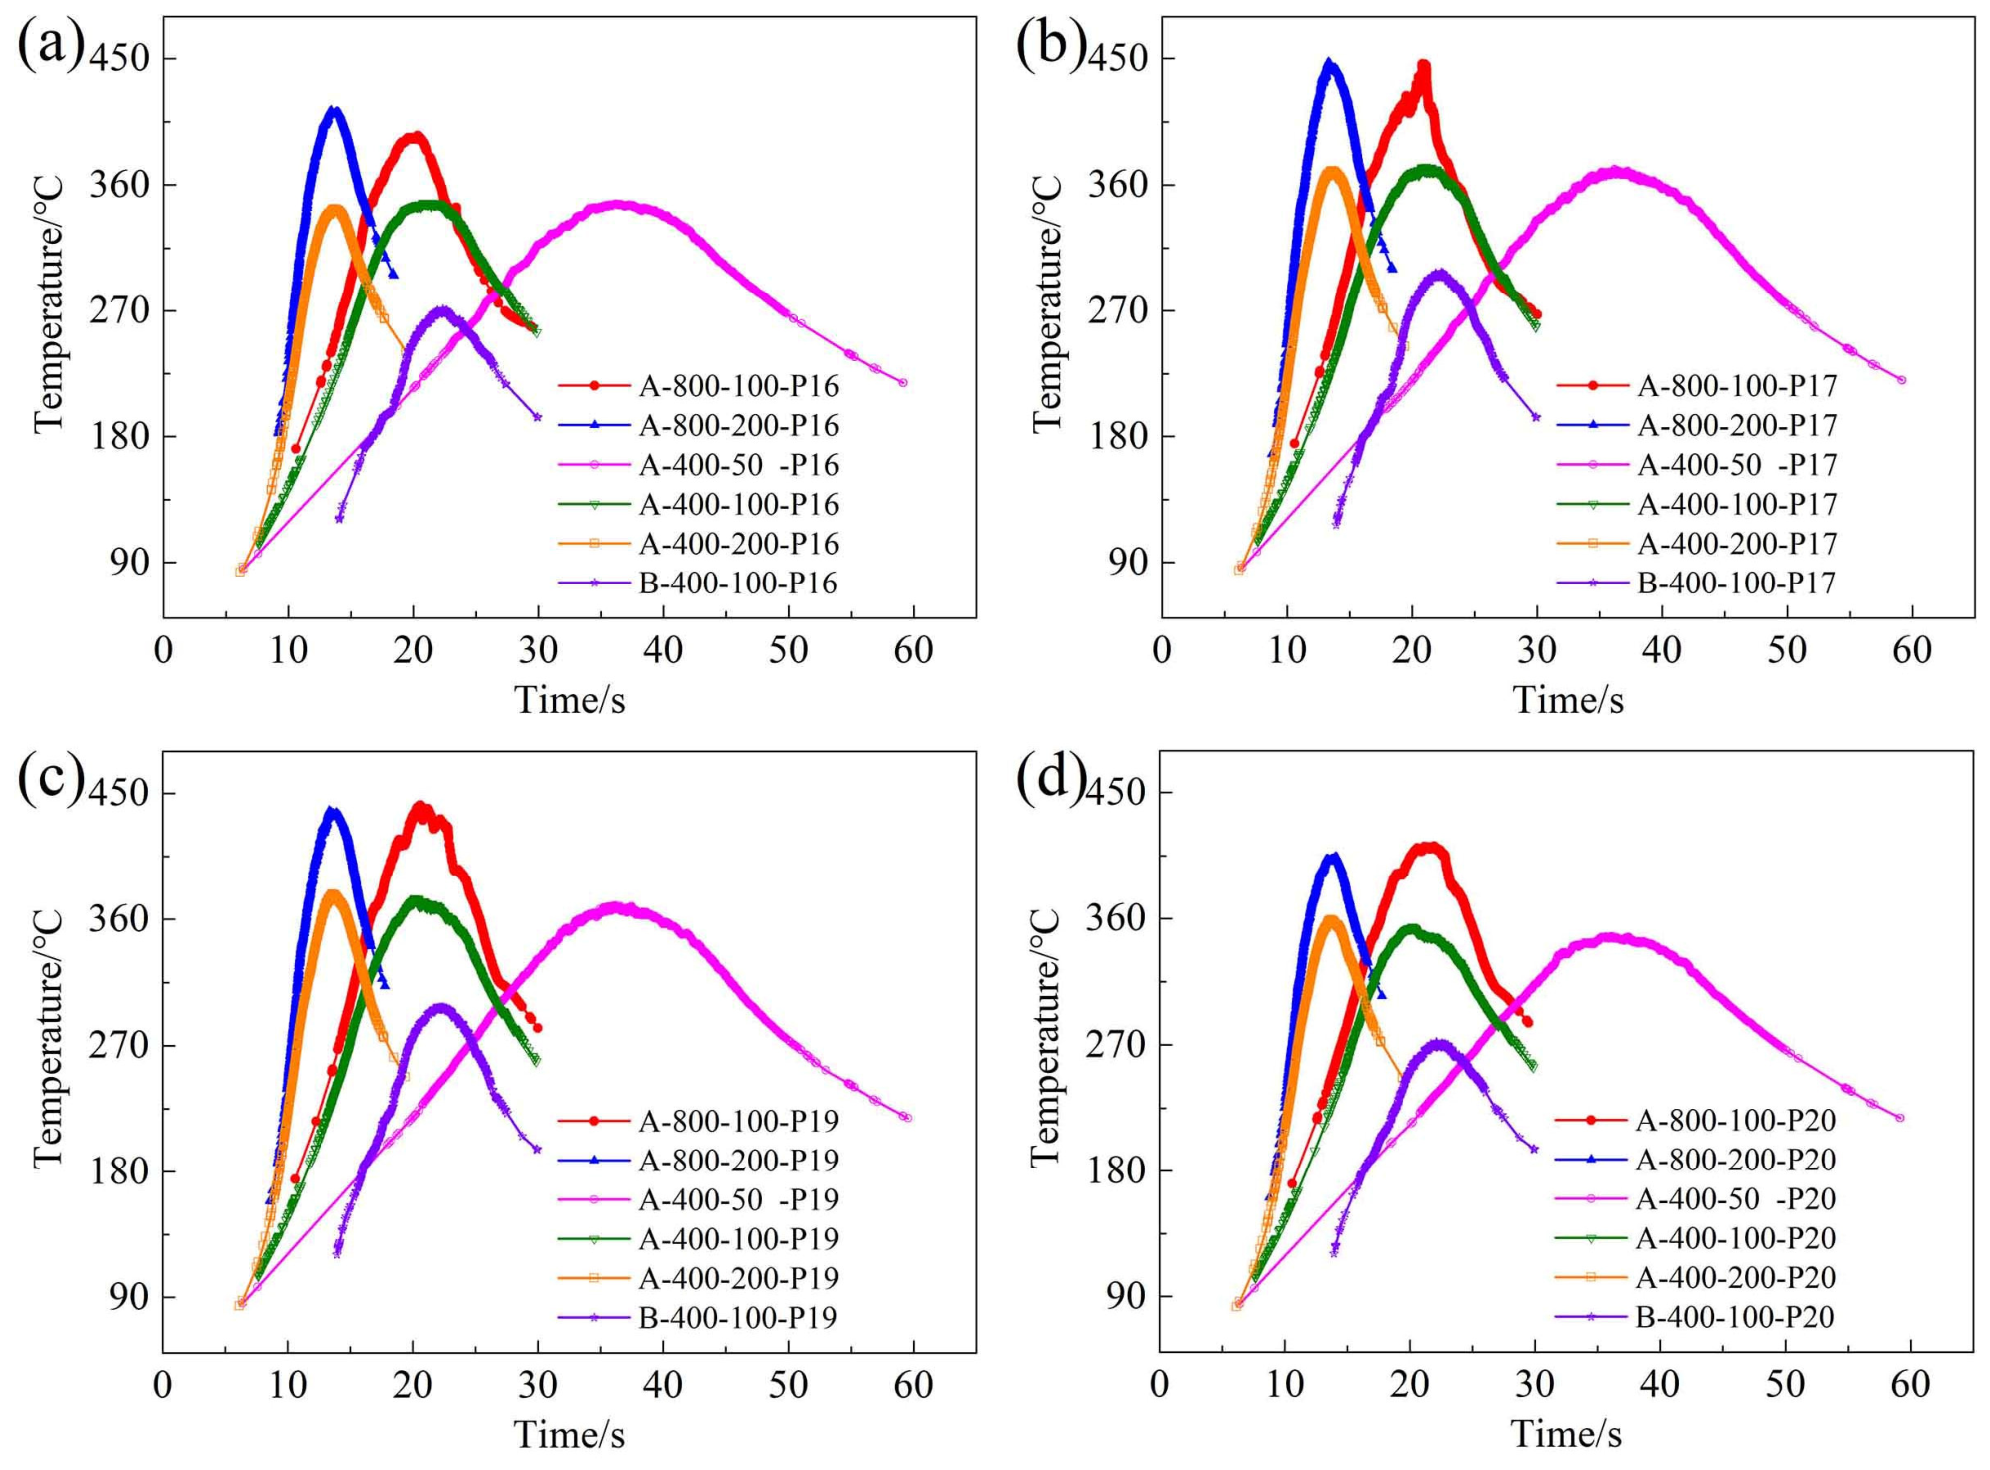
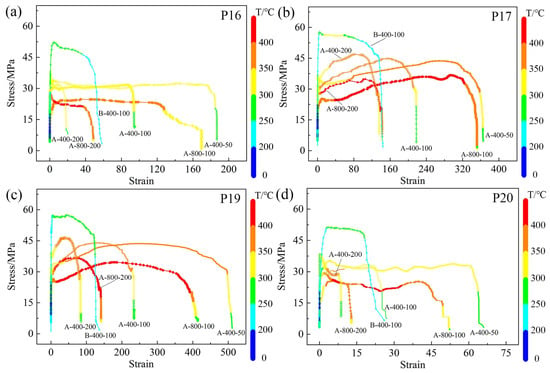
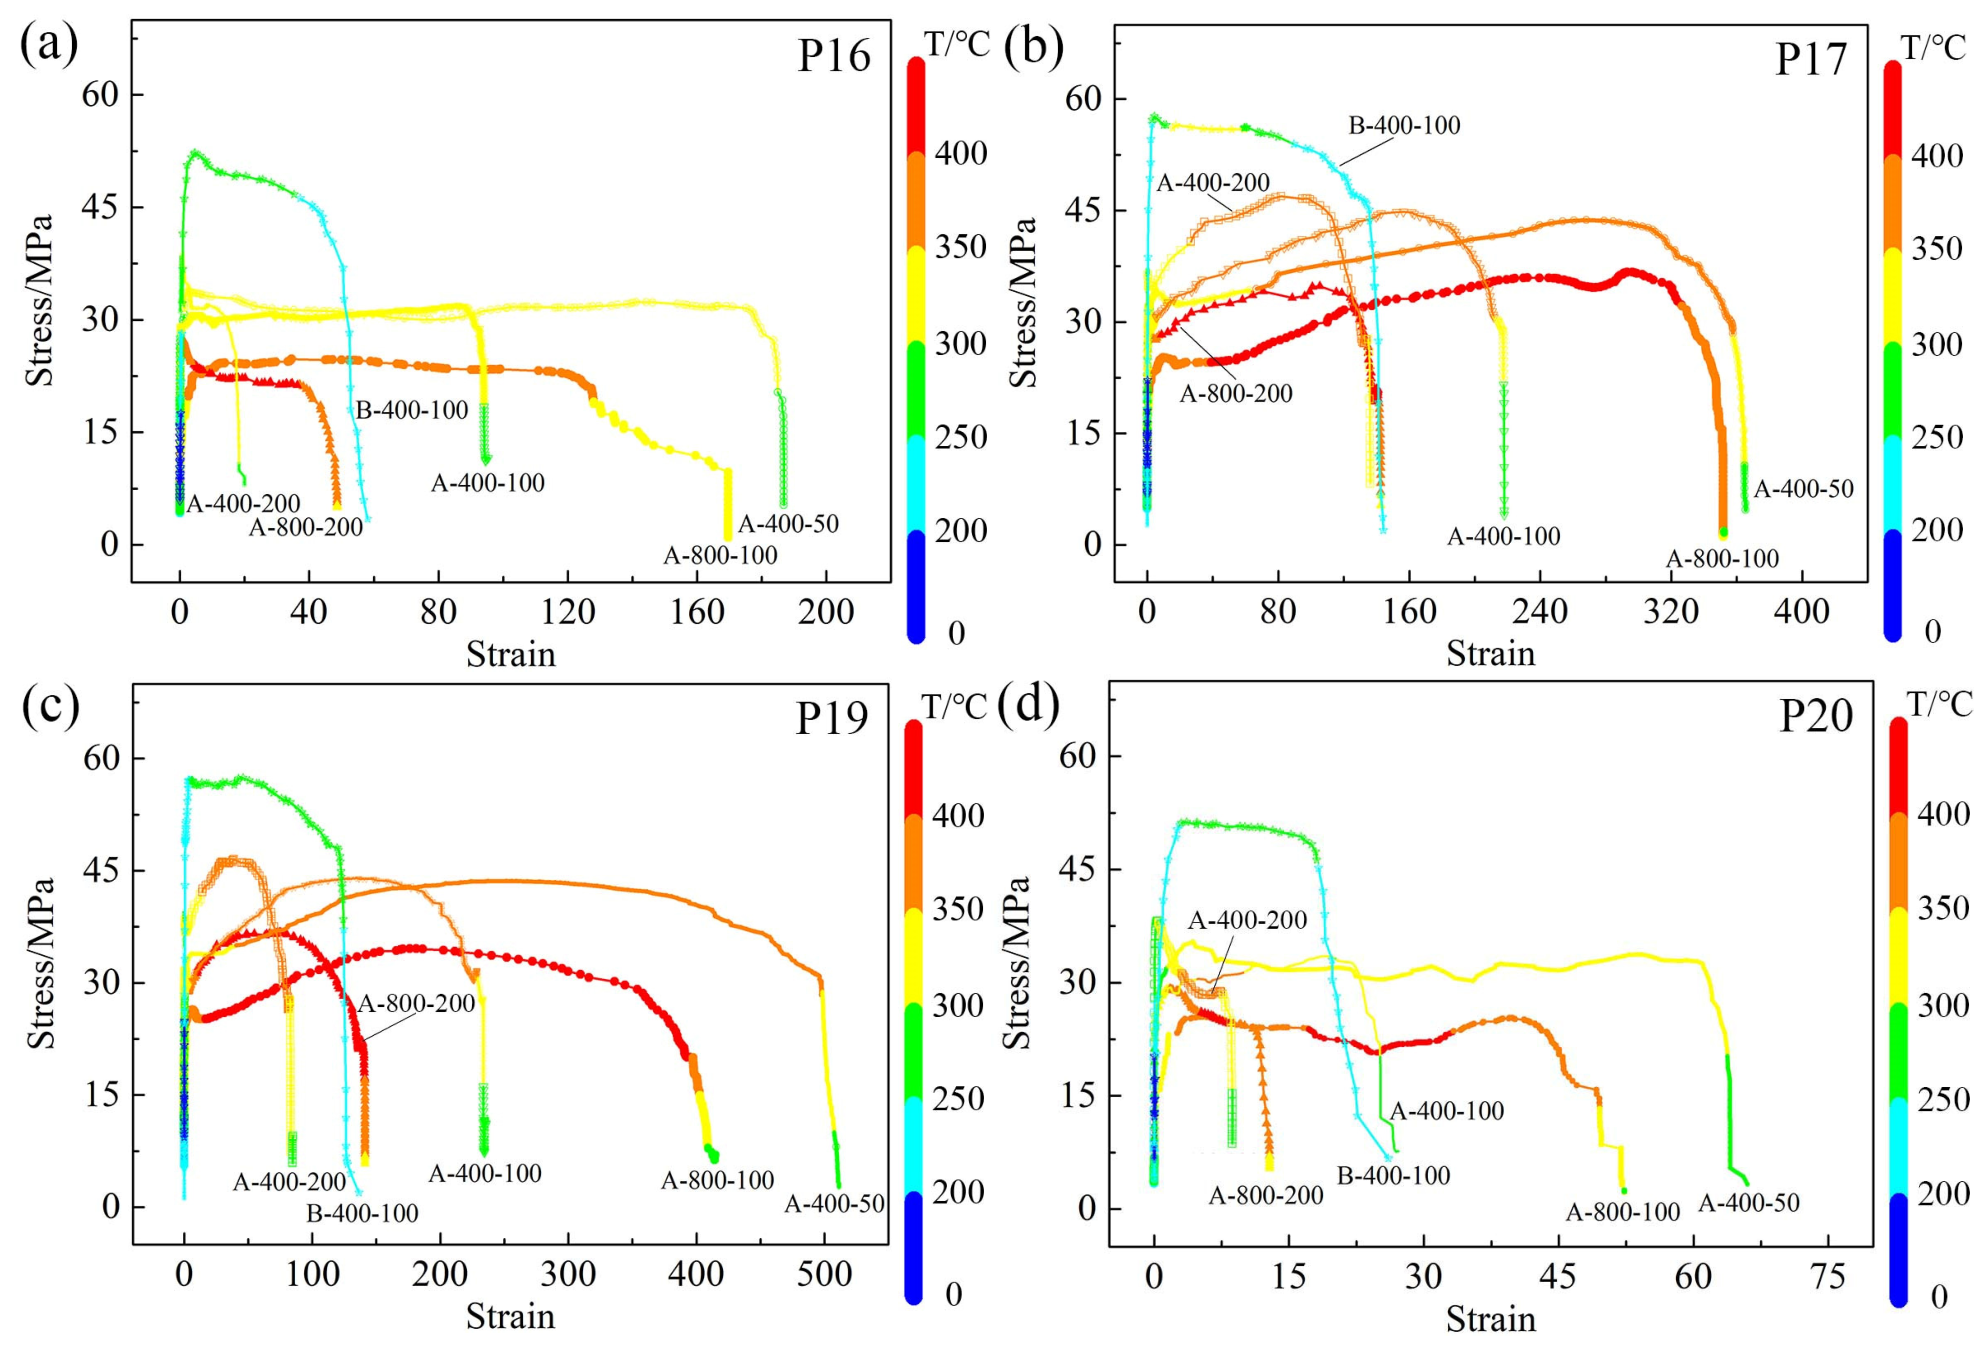
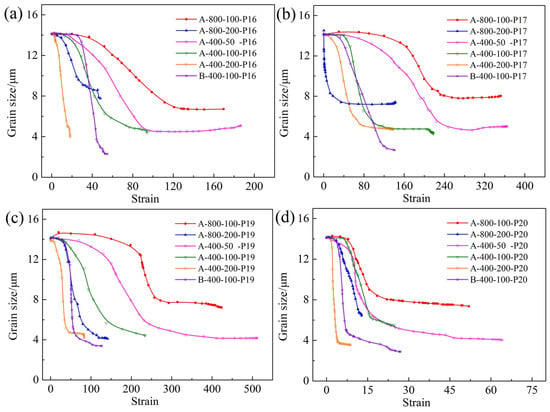
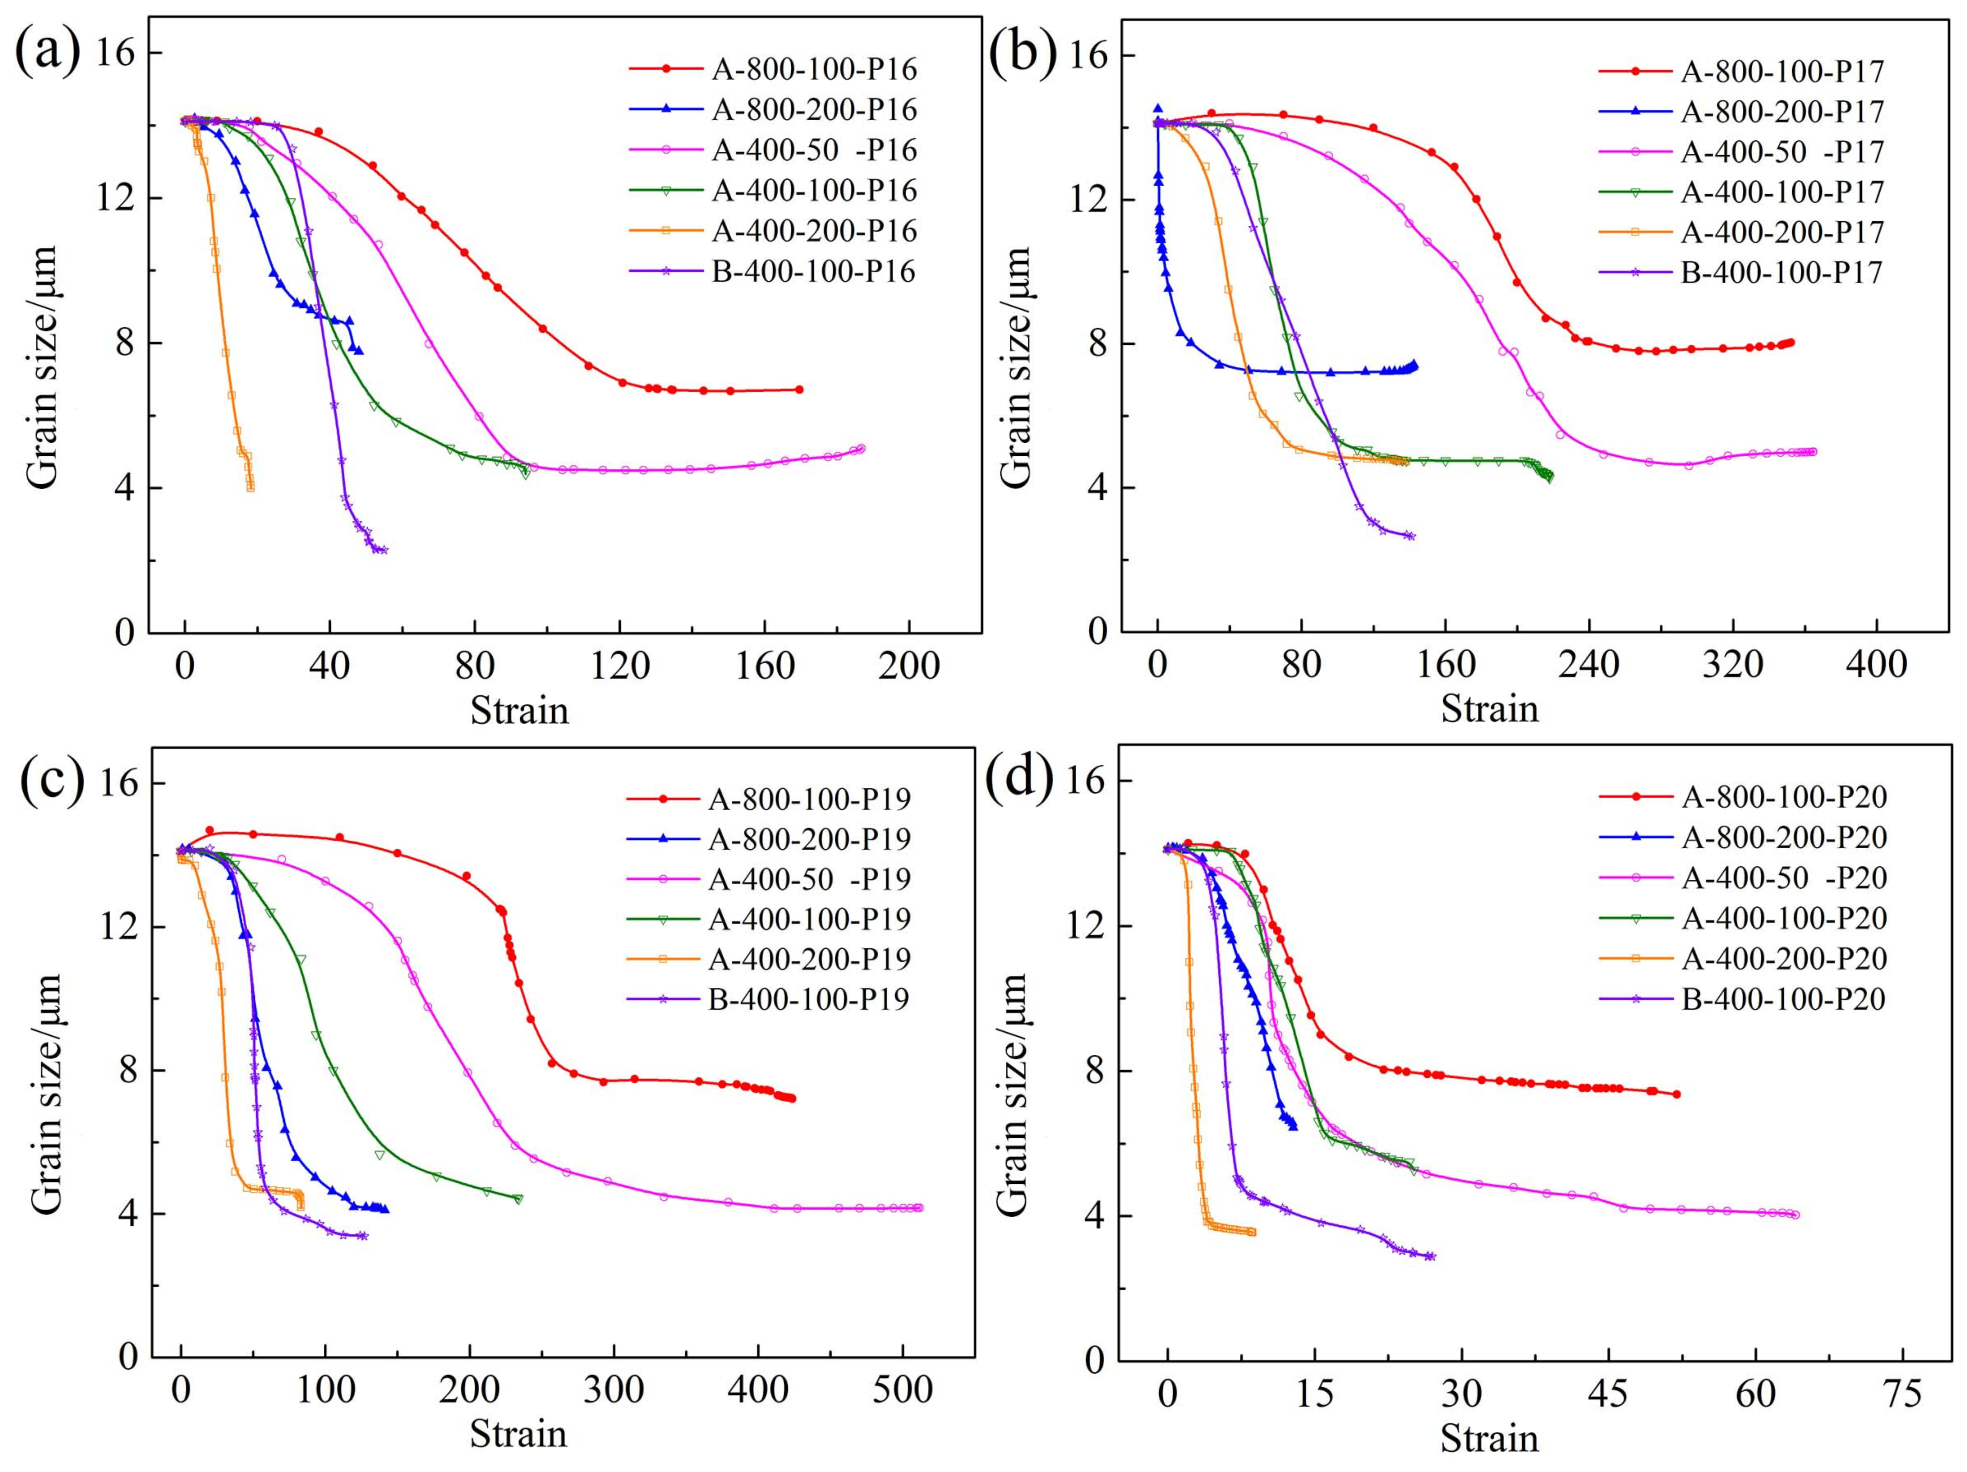
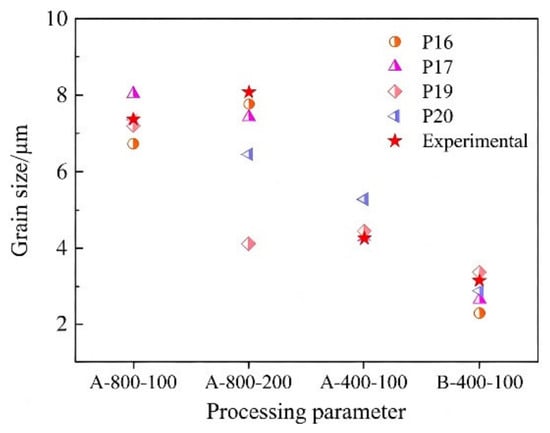
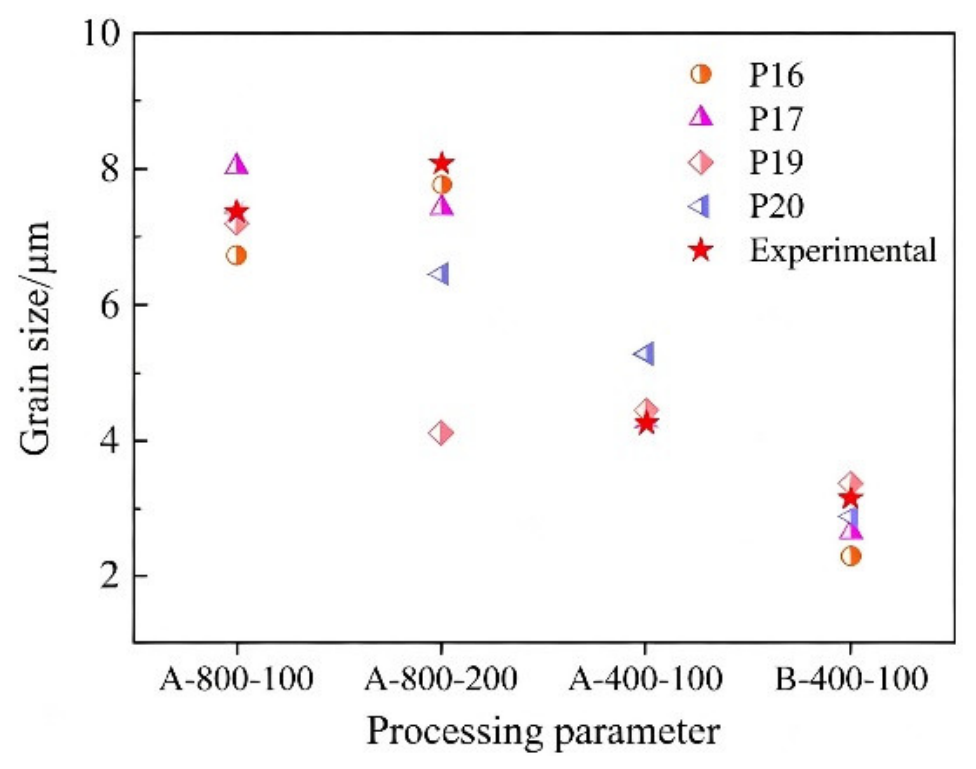
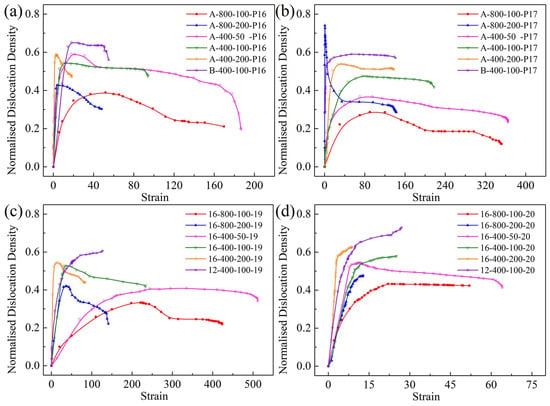
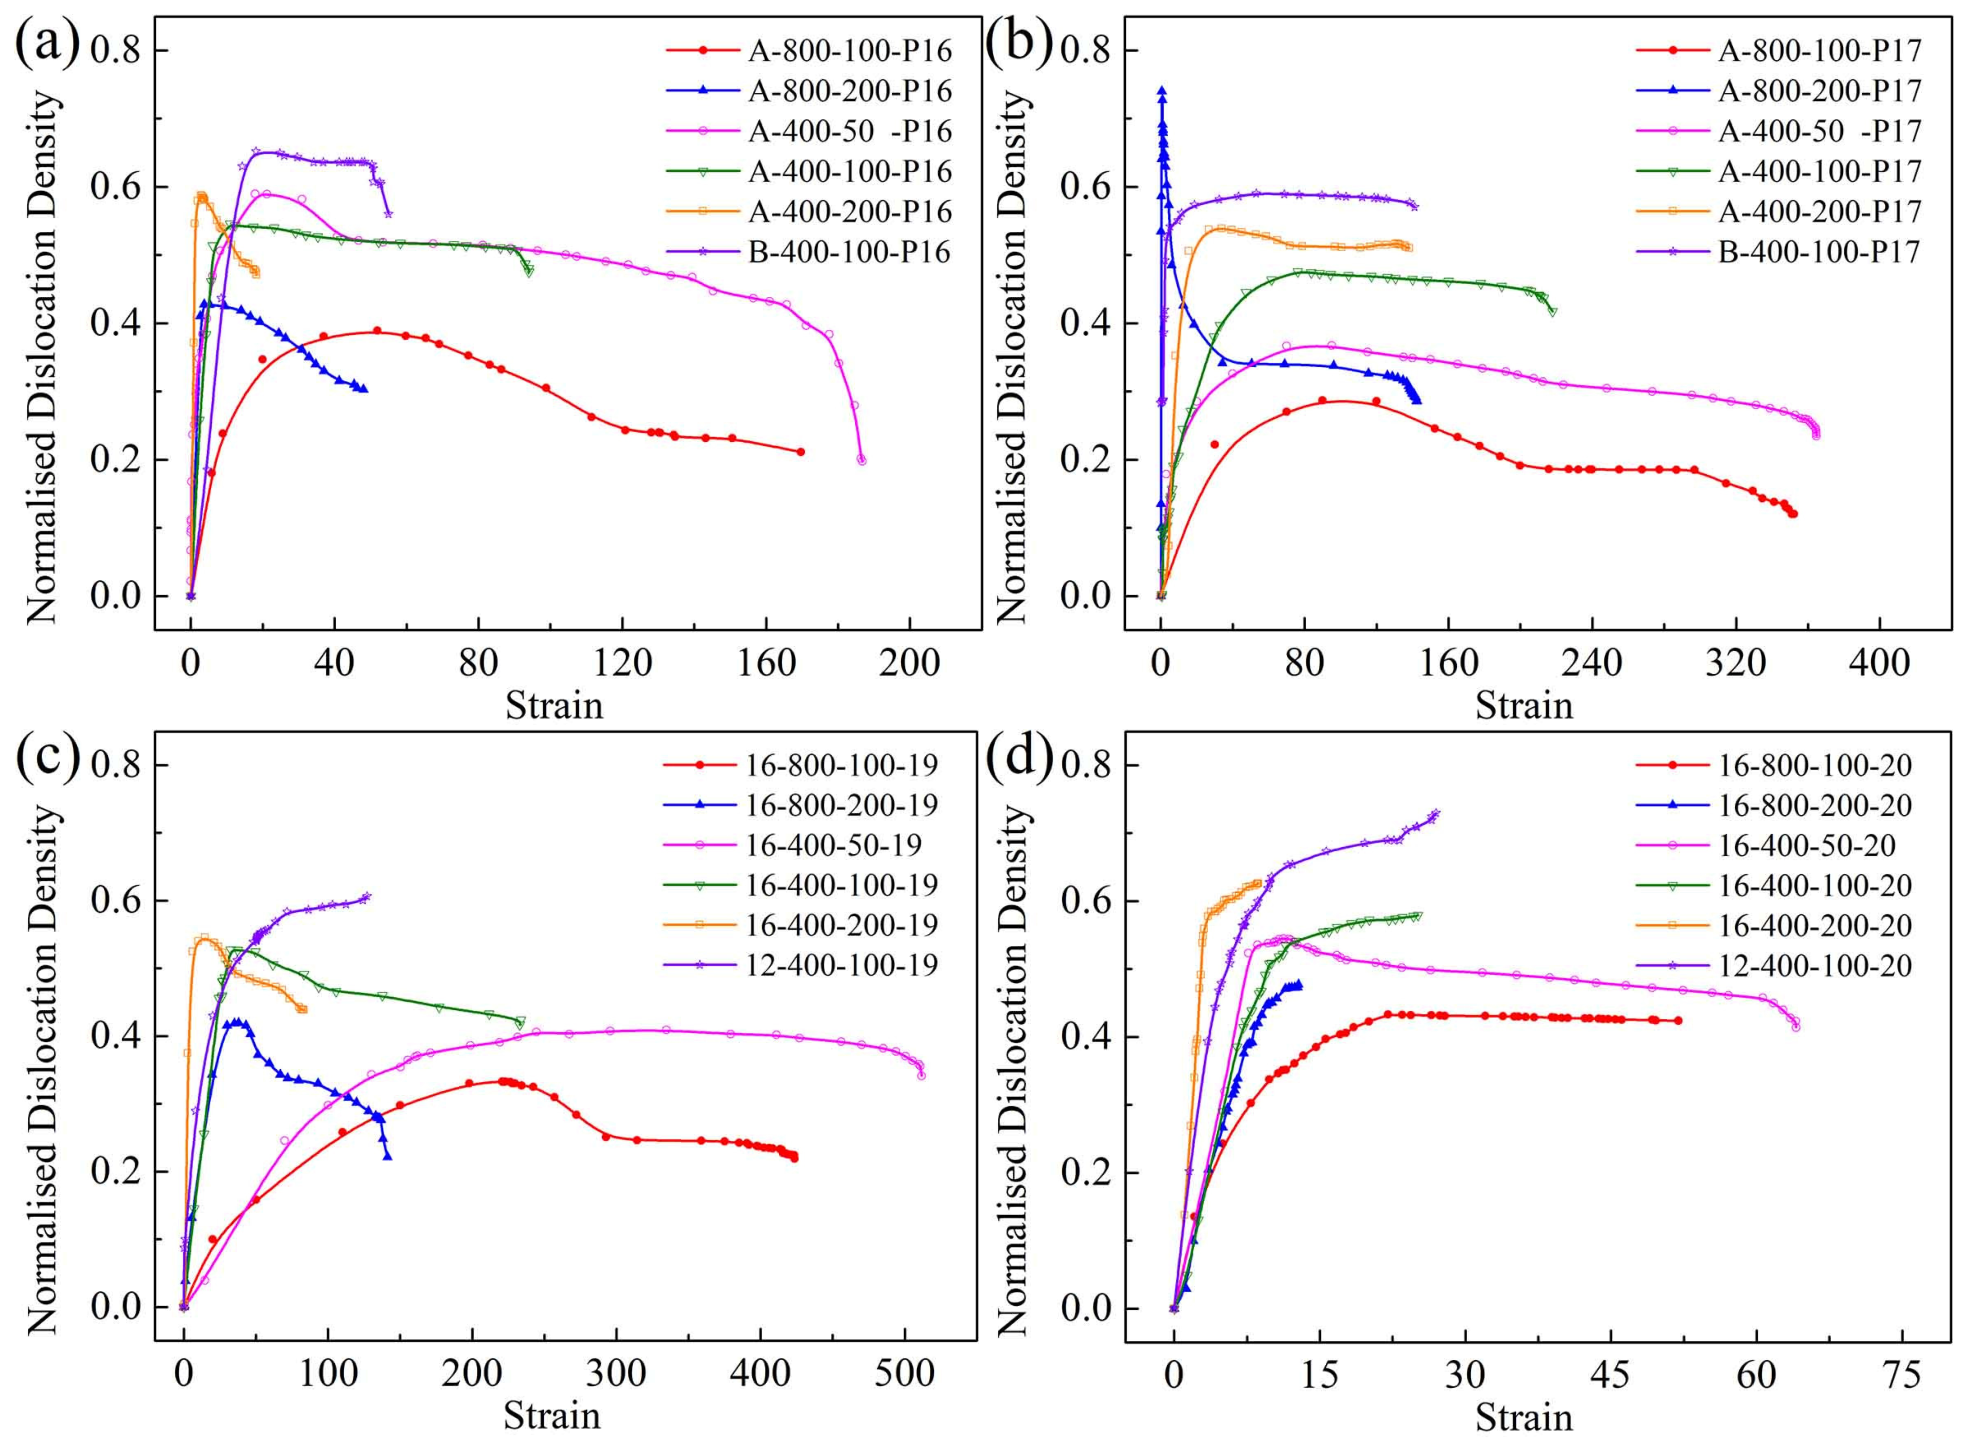

Disclaimer/Publisher’s Note: The statements, opinions and data contained in all publications are solely those of the individual author(s) and contributor(s) and not of MDPI and/or the editor(s). MDPI and/or the editor(s) disclaim responsibility for any injury to people or property resulting from any ideas, methods, instructions or products referred to in the content. |
© 2026 by the authors. Licensee MDPI, Basel, Switzerland. This article is an open access article distributed under the terms and conditions of the Creative Commons Attribution (CC BY) license.