


Abstract
Fretting wear behavior of 2A70 forged aluminum alloy with different grain size grades was investigated. Specimens (Grades 3.5 and 5) were tested against 42CrMoA steel at 115 °C under 40 and 240 μm amplitudes and 90–150 N loads. EBSD characterized the microstructural features, while SEM and laser confocal microscopy analyzed the wear surfaces. Grade 5 exhibited fine equiaxed grains, higher high-angle grain boundary (HAGB) density, lower second-phase content, and weaker texture. Grade 3.5 showed mixed grains, lower boundary density, and a higher unindexed fraction possibly originating from unindexed Al9FeNi particles as well as local micro-defects. At 40 μm, the microstructural effect was minor. At 240 μm, Grade 5 showed stable friction, lower wear depth, finer debris, and a continuous compacted layer. Conversely, Grade 3.5 showed fluctuating friction, higher and non-monotonic wear depth, coarse debris, and discontinuous compacted layers with microcracks. The anomalous maximum wear depth of Grade 3.5 at 90 N may be attributed to severe third-body abrasion before a protective layer forms. The superior wear resistance of Grade 5 is the result of the combined effect of multiple microstructural parameters, primarily driven by dense HAGBs, microstructural uniformity, and weak texture.
1. Introduction
Fretting is defined as the relative motion with extremely small amplitude between contact interfaces, and its displacement amplitude is typically on the order of micrometers [1,2]. Fretting commonly occurs in mechanical joints subjected to vibration or alternating loads, such as aeroengine tenon–mortise connections, wheel–axle interference fits, turbine blade roots, and piston assemblies [3,4,5]. Fretting damage can lead to increased fit clearance and reduced dimensional accuracy, and may induce the initiation and propagation of fretting fatigue cracks, posing a serious threat to the service safety of equipment. Therefore, elucidating the damage mechanisms of fretting wear is of great engineering significance for developing effective protective strategies.
In marine engine piston structures, the mating surfaces between the piston crown and the piston skirt are typical fretting-sensitive locations [5,6,7]. A composite piston consists of a piston crown and a piston skirt connected by bolts. The piston crown is usually made of high-temperature-resistant materials, while the piston skirt is made of lightweight aluminum alloy, so as to balance structural strength and lightweight requirements. During high-speed reciprocating motion, the piston is subjected to cyclic combustion gas pressure. Under the combined action of mechanical and thermal loads, the crown–skirt interface undergoes small-amplitude relative motion, thereby inducing fretting wear. 2A70 aluminum alloy is a typical heat-resistant aluminum alloy with good thermal stability and excellent high-temperature performance, and is widely used in components such as aeroengine pistons, impellers, and compressor blades [8,9,10,11].
Grain size is an important microstructural parameter affecting the mechanical properties and damage behavior of metallic materials. Previous studies have shown that grain size has a significant effect on fretting wear behavior. Farhat et al. [12] found that the wear rate of nanocrystalline aluminum is linearly related to the square root of the grain size, and that refining the grain size to 16.4 nm reduced the peak coefficient of friction by approximately 55%. Li et al. [13] studied Inconel 600 and showed that the fretting wear volume increased linearly with increasing grain size, whereas hardness had a limited effect on the fretting wear volume; small grains favored the formation of a tribologically transformed structure (TTS) layer and produced shorter delamination cracks. Rai et al. [14] confirmed in low-carbon steel that the fine-grained microstructure exhibited the highest wear resistance, and that a bimodal grain structure also outperformed coarse-grained structures; this mechanism is related to the role of grain boundaries in dispersing dislocations and plastic strain. Zhang et al. [15] refined the grain size of GCr15 bearing steel to 5.23 μm by secondary quenching, reducing the fretting wear volume by 18.2%, and attributed this to the strengthening effect of a high-density high-angle grain boundary (HAGB) network and nano-carbide precipitation. Yadav et al. [16] investigated constrained groove pressed (CGP) aluminum sheets and showed that after grain refinement from 21.64 μm to 5.60 μm, the hardness increased by about 1.5 times, both the fretting wear rate and coefficient of friction decreased significantly, and the transverse wear resistance was superior to the longitudinal wear resistance. Xu et al. [17] studied 1420 Al-Li alloy extruded profiles and found that increasing the extrusion ratio refined the grains to 31.1 μm, and the fretting wear volume was about 50% lower than that of the 1:2 specimen at the same temperature; after fretting wear, a refined-deformed composite structure formed, improving the capacity for coordinated deformation. However, Guo et al. [18] pointed out in a review that the effect of grain size on fretting wear is not fixed but is also jointly controlled by carbide size distribution, surface condition, and sliding condition, and even opposite trends occur in different nickel-based alloys. The above studies indicate that grain size has an important effect on fretting wear behavior, but the effects of other microstructural parameters have not been considered.
Therefore, this study takes 2A70 forged aluminum alloy as the research object, selects specimens with grain-size grades 3.5 and 5 in two microstructural states, and conducts fretting wear tests under displacement amplitudes of 40 and 240 μm and loads of 90–150 N in dry air at 115 °C. Combined with EBSD microstructural characterization, microstructural characteristics such as grain size, grain boundary characteristics, secondary phases, texture, and intragranular misorientation are analyzed. The coefficient of friction, wear depth, and worn surface morphology of specimens with two grain-size grades are compared, the influence of differences in microstructural characteristics on fretting wear behavior is discussed, and the mechanism by which microstructural characteristics affect fretting wear behavior is revealed, thereby providing a theoretical basis for the microstructural control of piston skirt materials.
2. Materials and Test Methods
2.1. Materials and Specimens
This study focuses on the piston skirt-piston crown contact zone of a certain type of marine piston engine and conducts an experimental study on the fretting wear problem of this contact zone. The lower specimens used in the tests were made of 2A70 forged aluminum alloy identical to that of the piston skirt, with grain size grades of 3.5 and 5. The macroscopic grain size grades of the two materials were determined by the standard metallographic intercept method. In this grading system, a larger number represents a smaller average grain size. The chemical compositions of the two materials and their mechanical properties at 115 °C are listed in Table 1 and Table 2. The hardness was measured using a high-temperature Vickers hardness tester (ZD-HVZHT-10, Shandong Zongde Mechanical and Electrical Equipment Co., Ltd., Jinan, China); three measurement points at different locations on each sample were measured, and the average value was taken. 42CrMoA alloy structural steel was selected as the counterpart material for the upper specimen.
Table 1.
Chemical compositions of the two materials (wt%).
Table 2.
Mechanical properties of the two materials.
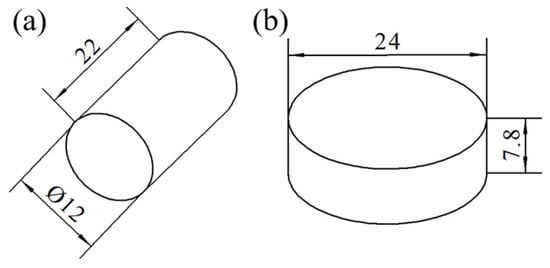
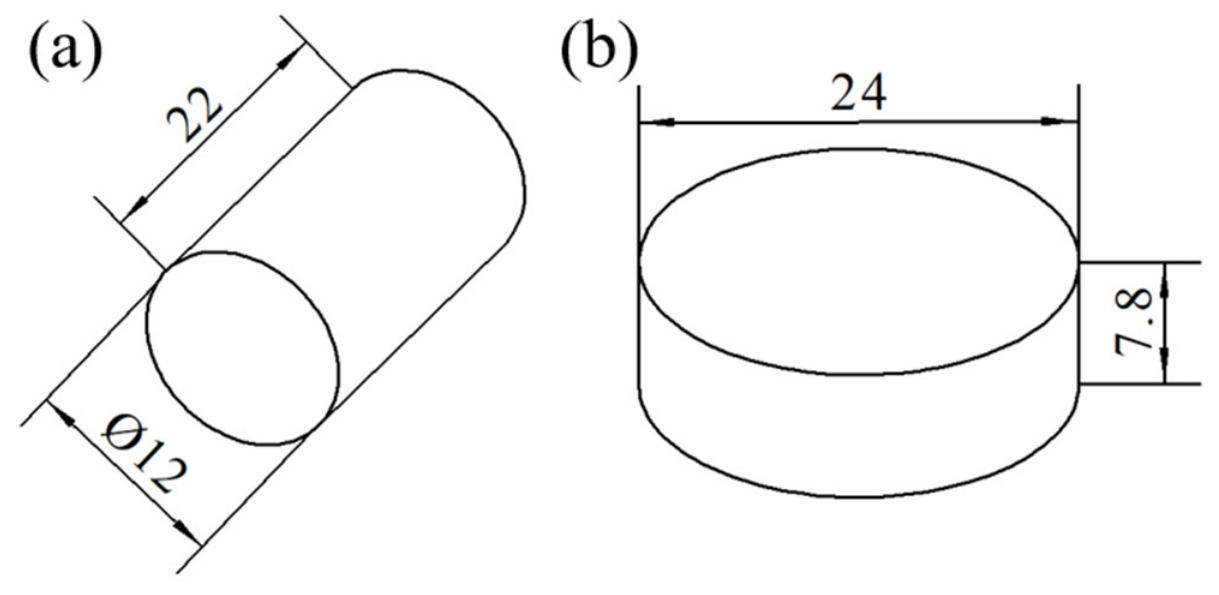
The specimen dimensions are shown in Figure 1. The lower specimen was a disk with a diameter of 24 mm and a thickness of 7.8 mm, and the upper specimen was a cylinder with a diameter of 12 mm and a length of 22 mm. During testing, the lower specimen was fixed, and the upper specimen was pressed against the lower specimen under a normal load to form a cylinder-on-disk line contact and was subjected to axial reciprocating fretting displacement. All specimens were fabricated by low-speed wire electrical discharge machining.
Figure 1.
Schematic diagram of fretting wear specimens (unit: mm): (a) upper specimen; (b) lower specimen.
To remove the recast layer, heat-affected zone, and residual stress left by wire electrical discharge machining on the wear contact surfaces, the contact surfaces of the specimens were ground and then polished using a polishing machine (Fpol 251A, Fematec, Suzhou, China). After polishing, the specimens were ultrasonically cleaned in anhydrous ethanol and blow-dried. After polishing, the surface roughness of the worn surfaces was measured using a laser confocal microscope (OLS5000, Evident, Tokyo, Japan); three measurement points were selected for each specimen, and the average value was taken. The initial surface roughness of the grade 3.5 specimen was Ra = 0.410 μm, and that of the grade 5 specimen was Ra = 0.445 μm.
2.2. Microstructural Characterization
Electron backscatter diffraction (EBSD, Oxford Instruments, Abingdon, UK) was used to characterize the microstructure of the initial 3.5-grade and 5-grade 2A70 forged aluminum specimens. After electrolytic polishing, data acquisition was performed on a field-emission scanning electron microscope equipped (Carl Zeiss, Oberkochen, Germany) with an EBSD detector (Oxford Instruments, Abingdon, UK). To ensure consistency of statistical standards, a scanning step size of 2 μm was used for specimens of both grain size grades. The scanning regions for the grade 3.5 and grade 5 specimens were 276 × 216 pixels and 273 × 214 pixels, respectively, corresponding to scanning areas of 238,464 μm2 and 233,688 μm2, respectively.
The EBSD characterization coordinate system is defined as follows: the X direction is the horizontal direction of the EBSD map, the Y direction is the vertical direction of the map, and the Z direction is the normal direction of the specimen surface. For the lower disk specimen, the Z direction coincides with the normal direction of the worn surface; the reciprocating sliding direction is along the X direction. The specimens with the two grain-size grades used the same coordinate system definition and wear direction to ensure a clear geometric correspondence among texture, grain morphology, and fretting wear behavior.
EBSD data were post-processed using AZtecCrystal (version 4.0). The analysis included equivalent circle diameter (ECD) distribution, fitted ellipse major-axis orientation (FEA), phase composition and second-phase distribution, inverse pole figure (IPF) and pole figure (PF), statistics of grain boundary types (low-angle grain boundaries, LAGBs, and high-angle grain boundaries, HAGBs), mean orientation spread within grains (MOS), maximum orientation spread (MaxOS), mean angular deviation (MAD), and geometrically necessary dislocation (GND) density [19,20,21,22]. Using the above parameters, the grain size concentration, microstructural homogeneity, texture intensity, grain-boundary strengthening potential, and intragranular strain distribution characteristics of the grade 3.5 and grade 5 specimens were compared, providing an initial microstructural basis for the subsequent analysis of fretting wear behavior.
2.3. Fretting Wear Tests
According to the actual service environment of the piston skirt-piston crown contact zone in a certain type of marine piston engine, fretting wear tests were conducted in dry air at 115 °C using a cylinder-on-disk line-contact reciprocating sliding mode. Under operating conditions, the contact pressure in this contact zone is approximately 80–100 MPa, and the piston motion frequency is 15 Hz. ABAQUS (version 2024) was used to calculate the contact stress of the cylinder-on-disk line contact. The extracted stress value was the peak contact pressure at the center of the contact zone. In the simulation, a temperature load of 115 °C was applied to the model to simulate the actual heating process. When loads of 90 N, 120 N, and 150 N were applied to the upper cylinder, the peak contact pressures in the contact zone were 76.53 MPa, 92.59 MPa, and 108.72 MPa, respectively.
For comparison, the theoretical peak pressures of the ideal Hertzian line-contact analytical solution under the above loads should be approximately 111.3 MPa, 128.5 MPa, and 143.6 MPa, respectively. The finite element results are lower than the theoretical values, and the increasing trend is slightly faster than the growth rate of the Hertzian analytical solution. This is mainly attributed to the following two points: first, the thermal expansion effect at 115 °C changes the contact geometry, resulting in broadening of the contact zone and a decrease in peak stress; second, the finite length edge effect of the cylinder in the three-dimensional finite element model, mesh discretization, and contact nonlinearity make the stress distribution smoother and deviate from the ideal two-dimensional analytical solution. Despite these slight deviations, this contact pressure range matches the actual operating conditions of the piston engine.
The test conditions for the fretting wear tests are listed in Table 3. For the 2A70 forged aluminum disks, grain size grades of 3.5 and 5 were selected. To compare the differences in fretting wear behavior among specimens with different grain-size grades under different wear severities, tests were conducted with displacement amplitudes of 40 and 240 μm, a number of cycles of 81,000, normal loads of 90, 120, and 150 N, and a frequency of 15 Hz. Moreover, under the real operating conditions of the piston engine, the service life usually reaches millions of cycles or even more. Since the focus of this paper is to compare the differences in wear behavior of specimens with the two grain-size grades under the same number of cycles rather than to predict the actual service life, and the test duration and cost of fully reproducing the actual service life are too high, 81,000 cycles were adopted as the accelerated test condition in this paper. At this number of cycles, measurable wear depths were obtained and a stable wear stage was reached at both displacement amplitudes of 40 μm and 240 μm, satisfying the purpose of the test.
Table 3.
Test conditions.
The target working condition of this paper is the piston crown–skirt connection interface, and under complex alternating loads, fretting damage occurs along the contact line direction at this interface. Therefore, in this paper, the fretting displacement load was applied along the axial direction of the cylinder so that the test setup is consistent with the engineering background. Moreover, for this form of fretting wear, the sliding direction covers a large number of grains, and the wear response exhibits a polycrystalline statistical average characteristic. Therefore, in the subsequent analysis, polycrystalline average parameters were selected as the main parameters affecting fretting wear for analysis.
Due to the limitations of test duration and cost, the fretting wear test under each condition in this paper was conducted only once, and no replicate tests were carried out. The analysis of the relevant wear mechanisms is mainly based on the macroscopic data and microstructural morphology characterization from a single test. During testing, tangential force and displacement signals were recorded to assist in confirming the test status. After testing, wear depth was measured using a laser scanning confocal microscope (OLS5000, Evident, Tokyo, Japan), and worn surface morphology, debris morphology, and other characteristics were observed using a field-emission scanning electron microscope (Carl Zeiss, Oberkochen, Germany).
3. Results and Discussion
3.1. Comparison of Microstructural Characteristics
3.1.1. Grain Morphology and Distribution Uniformity
Based on the EBSD measurement results, the equivalent circle diameter (ECD) distribution and fitted ellipse major-axis orientation (FEA) of the two grain size grades were statistically analyzed to evaluate grain size concentration, distribution uniformity, and morphological preferred orientation, and to determine microstructural fineness, uniformity, and texture intensity.
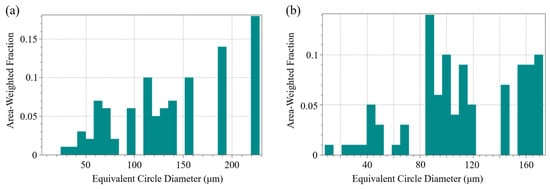
Figure 2 shows the ECD distribution histograms of the two specimens. The grade 3.5 and grade 5 classifications are macroscopic average grain size grades determined by the standard metallographic intercept method, whereas the equivalent circle diameter distributions in Figure 2 are microscopic statistical results for the two-dimensional sections of individual grains based on EBSD data. It can be found that there are obvious differences in grain morphology between the grade 3.5 and grade 5 2A70 forged aluminum specimens. As shown in Figure 2a, the grade 3.5 specimen exhibits multi-scale mixed characteristics. The main ECD peak is located near 224 μm, but its area fraction is only about 18%. The remaining grains are mainly dispersed in the range of 60–220 μm, with a small number of grains smaller than 60 μm. This indicates that coarse and fine grains coexist in the microstructure, the size distribution span is large, and there is no single dominant scale. Figure 2b shows the grade 5 specimen, whose main ECD peak is 87 μm, with an area fraction of about 14%. The main peak distribution interval is narrow, and there are no obvious abnormal grains. This indicates that the grain size is highly concentrated in a small-scale range, and the distribution curve is relatively flat, showing overall fine, dense, and uniform equiaxed grain characteristics. Its size uniformity is significantly better than that of the grade 3.5 specimen.
Figure 2.
ECD distribution histograms: (a) grain size grade 3.5; (b) grain size grade 5.
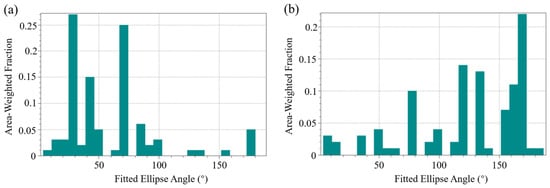
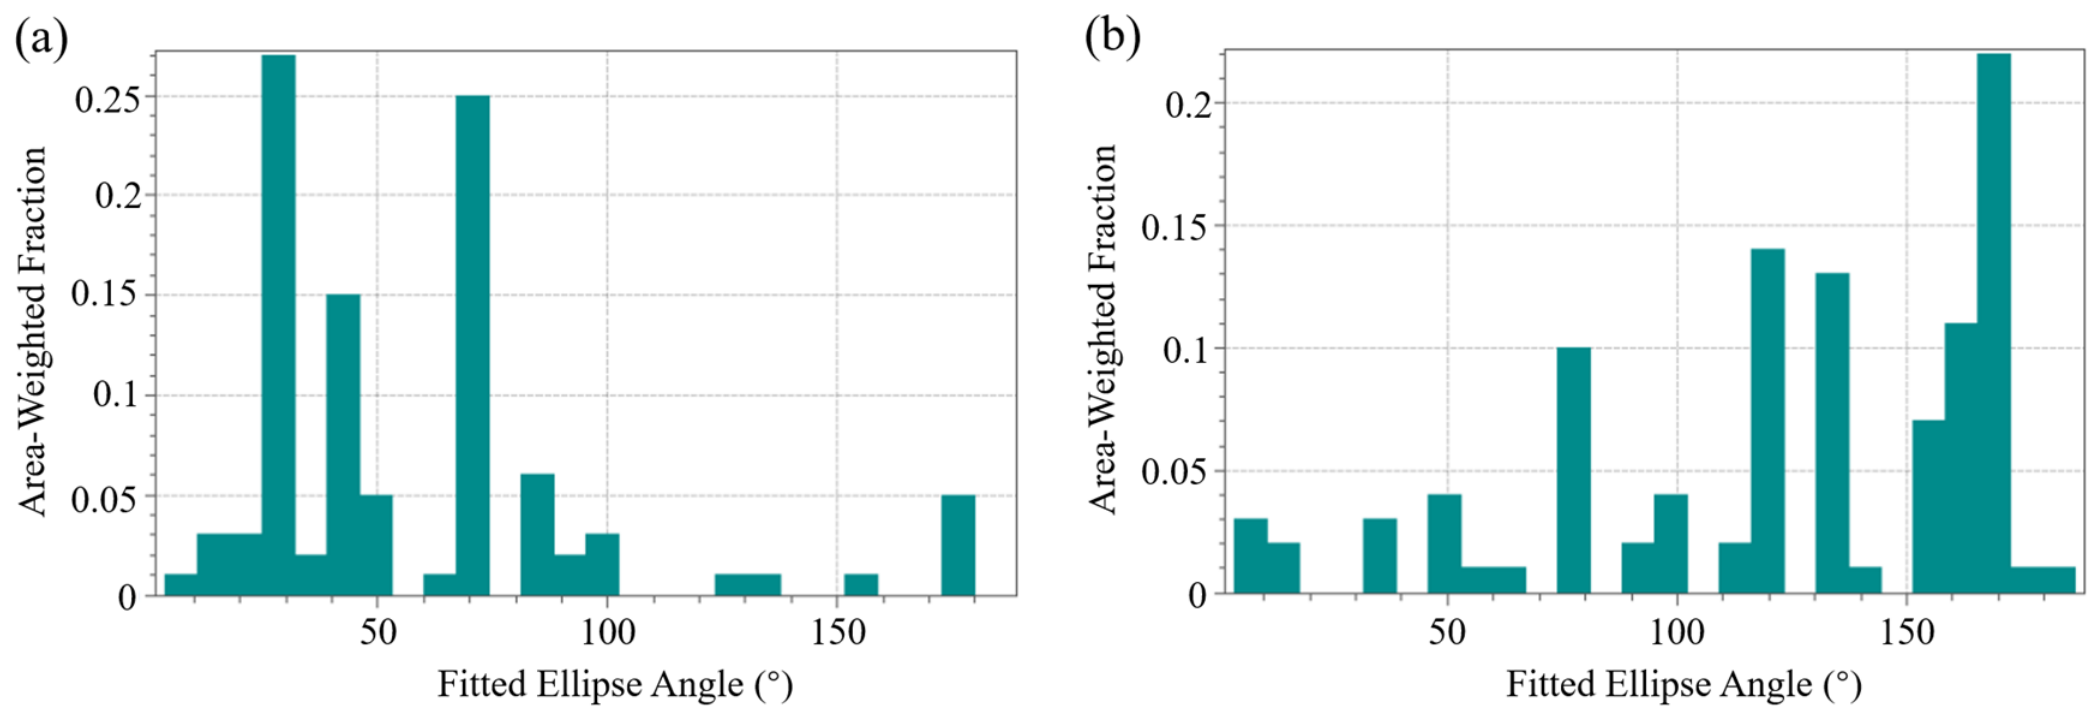
Figure 3 presents the fitted ellipse major-axis orientation (FEA) distribution histograms of the two specimens. As shown in Figure 3a, the grade 3.5 specimen exhibits multi-peak coexistence, with main peaks near 28°, 42°, and 69°, and area fractions of 27%, 15%, and 25%, respectively. The proportions of different orientations do not differ greatly, indicating that the long-axis directions of grains are highly random, the orientation distribution is relatively random, there is no obvious preferred arrangement, and the macroscopic anisotropy is weak. Figure 3b shows the grade 5 specimen, whose FEA exhibits a weak bimodal structure. The main peak is near 169°, and secondary peaks are near 137° and 124°. The intensities of all peaks are low and dispersed, and the orientation is still approximately random. The texture degree is low, which is favorable for isotropic deformation.
Figure 3.
FEA distribution histograms: (a) grain size grade 3.5; (b) grain size grade 5.
In summary, although the grade 3.5 specimen has no obvious preferred texture, its grain size distribution span is large, coarse and fine grains coexist, and the microstructural uniformity is insufficient. The size inhomogeneity may pose a potential impact on the stability of mechanical properties. In contrast, the grade 5 specimen has fine, dense, and uniform grains and strong orientation randomness. This means that the grade 5 microstructure maintains a low texture degree while ensuring size uniformity, which is beneficial to the balanced performance of the material in all directions. The grade 5 specimen is superior to the grade 3.5 specimen in both grain size uniformity and orientation randomness.
3.1.2. Phase Composition and Second-Phase Distribution
Before EBSD acquisition, the phase composition of the material must be calibrated. Based on the main phase composition of 2A70 aluminum alloy, the Al matrix, Al2CuMg (S phase), Mg2Si, Al2Cu (θ phase), and Al3Ni phase were selected as the EBSD measurement phases [23,24]. Based on EBSD phase identification and calibration quality analysis, the phase composition and second-phase content differ between the two grain size specimens, as shown in Table 4. It can be seen from the table that the Al matrix fraction of the grade 5 specimen reaches 95%, and the total second-phase content is only 1.28%. This indicates high matrix purity and few precipitates. The solution and aging treatments were sufficient, the alloying elements basically re-dissolved into the matrix, and the residual second phases were controlled at an extremely low level. The unindexed fraction is as low as 3.72%, meaning good lattice integrity without significant distortion or surface damage. In contrast, the Al matrix area fraction of the grade 3.5 specimen is 87.57%, and the total second-phase content is 1.63%. However, its unindexed fraction is as high as 10.79%, about 2.9 times that of the grade 5 specimen.
Table 4.
Phase composition and content of the two materials.
Unindexed regions indicate that clear Kikuchi patterns cannot be obtained at these positions. The Al9FeNi phase may also be one of the main constituent phases in the 2A70 alloy; however, because its Kikuchi pattern may exhibit pseudo-fivefold symmetry, indexing failure is likely to occur. To ensure the accuracy of the indexing results, this phase was not included in the EBSD phase library in this paper. The significantly higher unindexed fraction of the grade 3.5 specimen may partly originate from unindexed Al9FeNi particles and may also be related to polishing pits caused by the detachment of locally coarse second phases, dense precipitate regions, or localized micro-zone defects.
In terms of second-phase types, both specimens contain small amounts of Al2CuMg (S phase), Mg2Si, Al2Cu (θ phase), and Al3Ni phase. The Al2CuMg phase is the main strengthening phase of 2A70 aluminum alloy. When finely and dispersedly distributed, it can provide precipitation strengthening and has certain plasticity, and is not easily peeled directly from the matrix [25]. Mg2Si is a hard and brittle high-temperature phase [26]. When excessive or coarsened, it can disrupt the continuity of the matrix and easily become a crack initiation source; after detachment, it can also act as third-body abrasive particles and aggravate wear. The Al2Cu phase is also a strengthening phase, but its brittleness increases when coarse [27], and it may become a stress concentration site. A fine and dispersed distribution of the Al3Ni phase is beneficial to improving high-temperature performance, but excessive content may also impair toughness [28]. Overall, the total second-phase contents in both the grade 3.5 and grade 5 specimens are at a low level, and the matrix is relatively pure. A small amount of dispersed second phase can provide certain strengthening without significantly sacrificing plasticity, which helps avoid three-body abrasive wear caused by the detachment of large amounts of hard and brittle phases. Their characteristics in second-phase control provide a relatively favorable microstructural basis for the subsequent comparison of fretting wear behavior.
3.1.3. Texture Characteristics
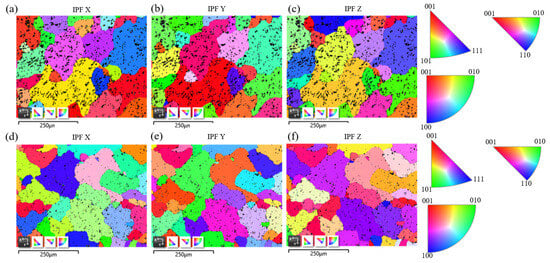
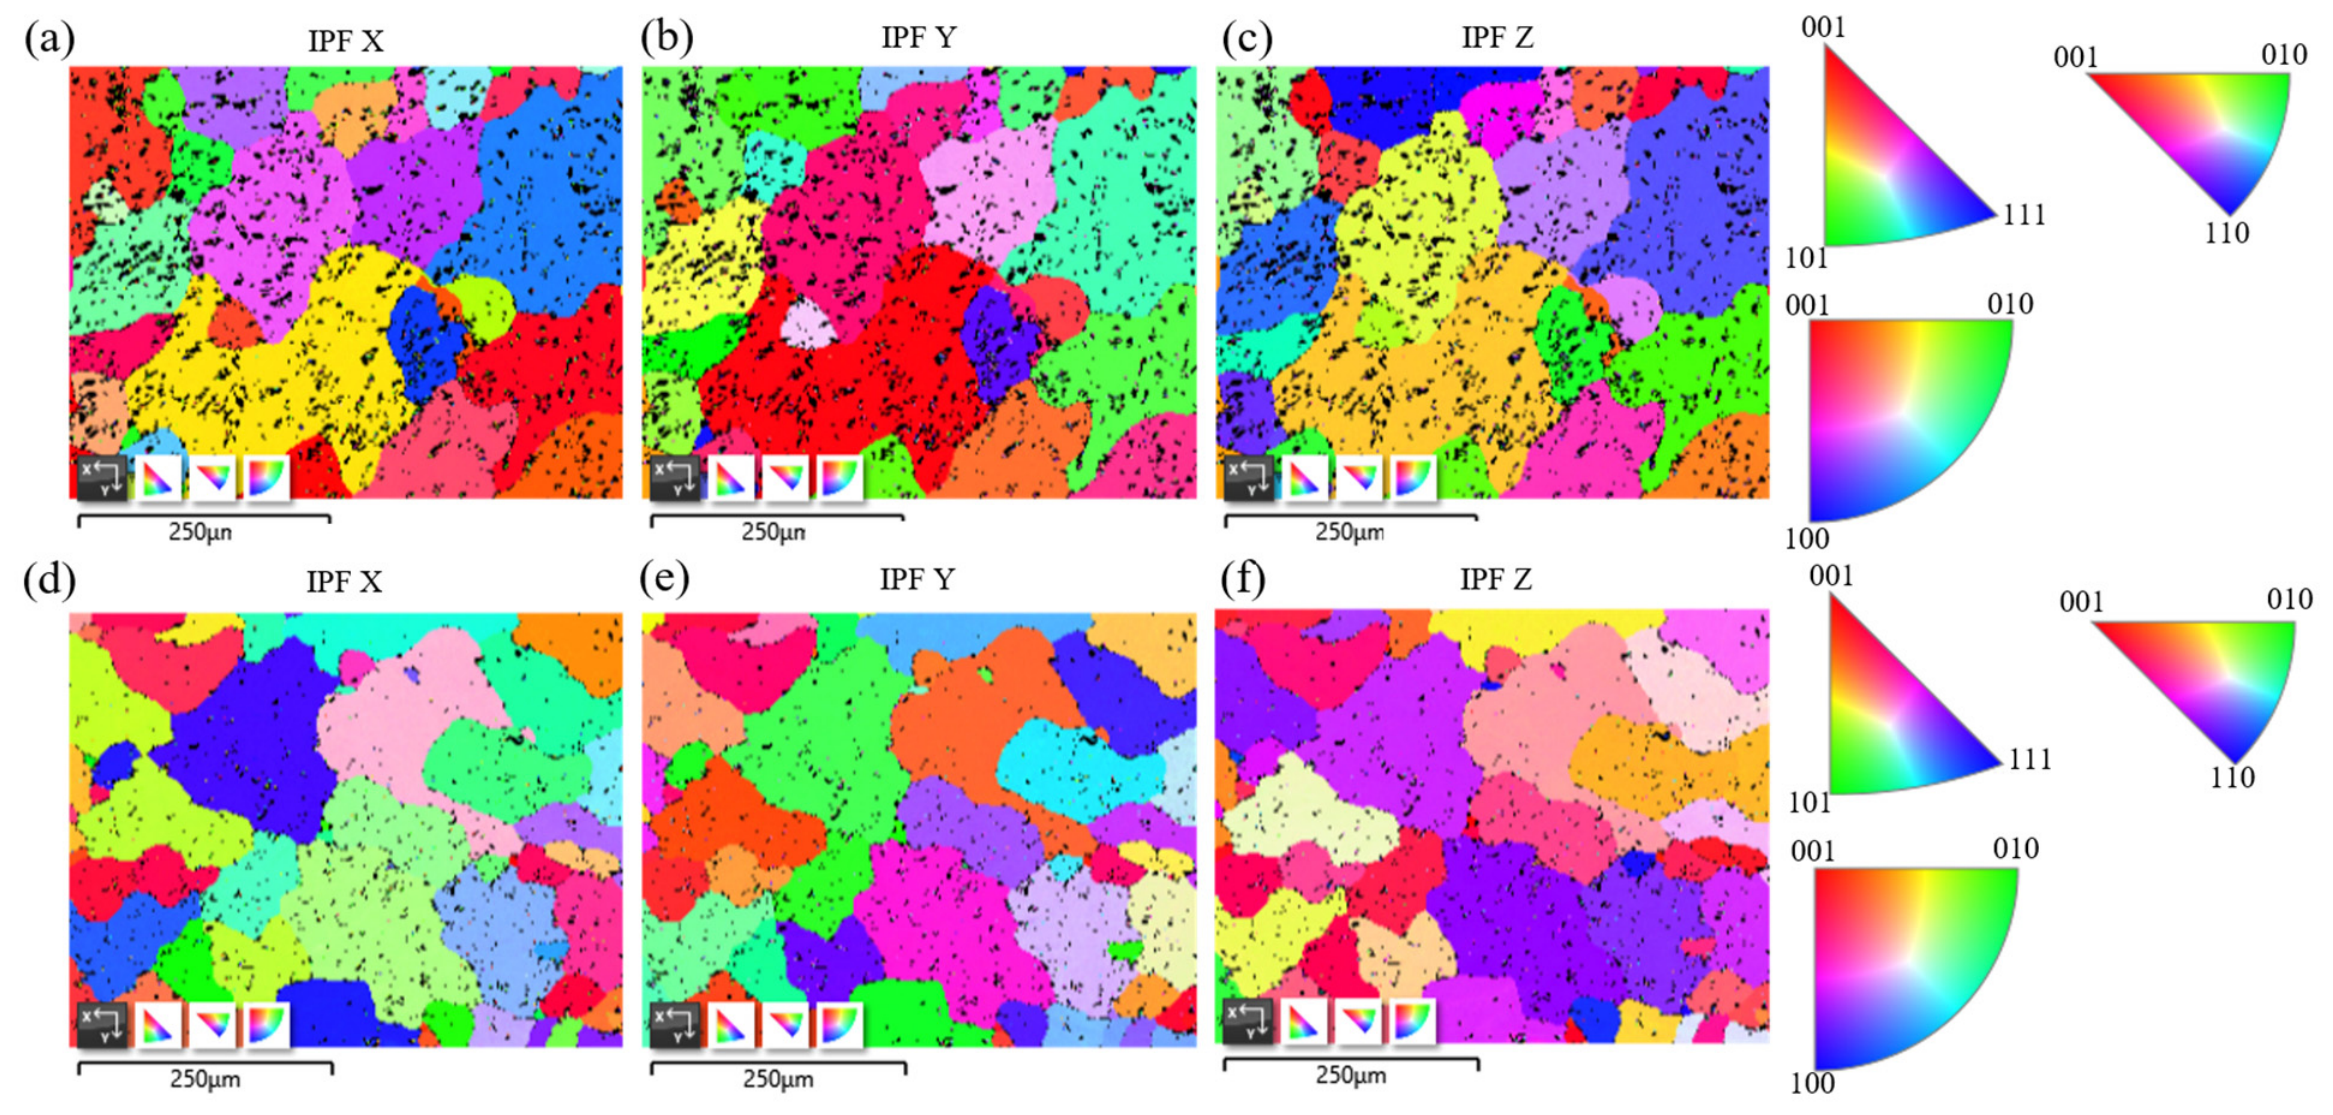
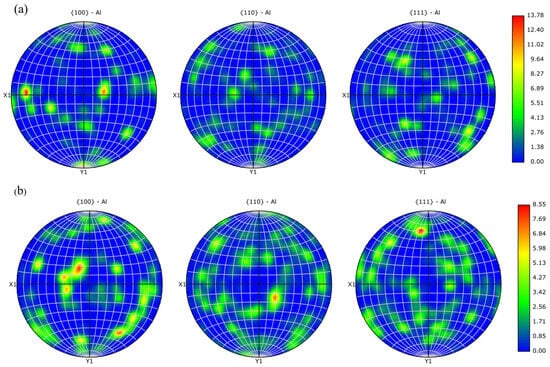
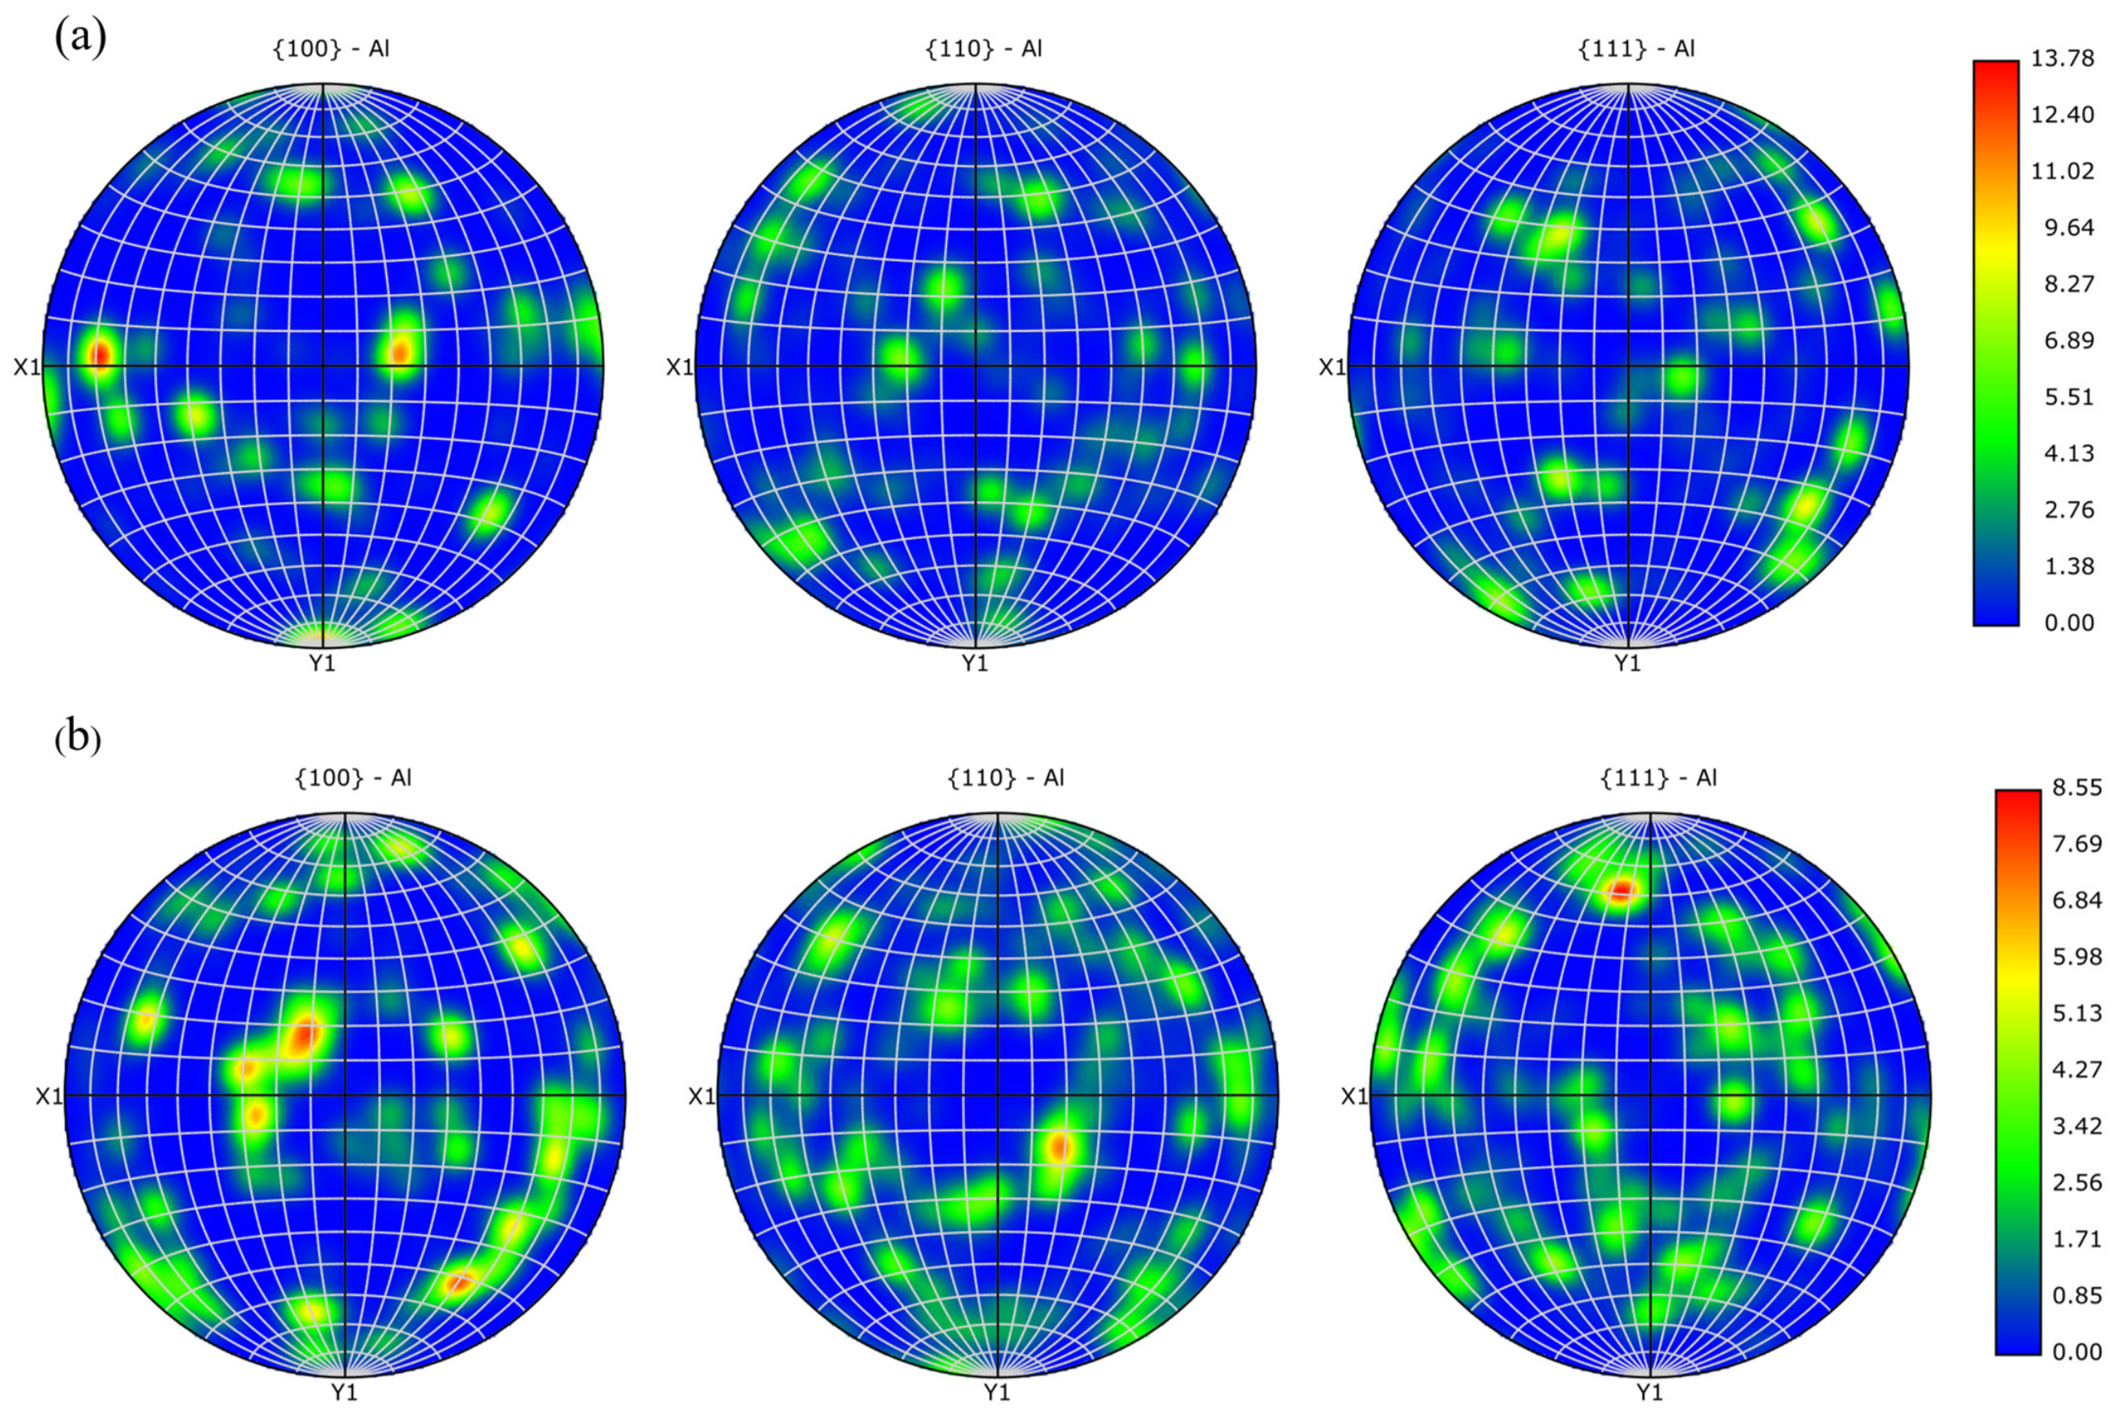
Texture is an important microstructural factor determining the mechanical property anisotropy and damage behavior of polycrystalline materials. Based on EBSD orientation imaging, the inverse pole figures (IPFs) and pole figures (PFs) of the grade 3.5 and grade 5 specimens in the X, Y, and Z directions were analyzed, as shown in Figure 4 and Figure 5, respectively.
Figure 4.
IPF inverse pole figures: (a) grade 3.5 specimen, X direction; (b) grade 3.5 specimen, Y direction; (c) grade 3.5 specimen, Z direction; (d) grade 5 specimen, X direction; (e) grade 5 specimen, Y direction; (f) grade 5 specimen, Z direction.
Figure 5.
Pole figures of Al {100}, {110}, and {111} orientations in samples with different grain sizes: (a) grade 3.5; (b) grade 5.
Figure 4 shows the IPFs of the two specimens. As shown in Figure 4a–c, the orientation distribution of the grade 3.5 specimen in the X direction is relatively diffuse; the IPF in the Y direction shows obvious [001] orientation concentration; and the color distribution in the Z direction is nearly random, and only slightly biased toward [111]. Overall, except for a certain texture in the Y direction, the orientation distribution of the grade 3.5 specimen in the other directions is relatively dispersed.
Figure 4d–f show the grade 5 specimen. The color distributions of the IPFs in the X, Y, and Z directions are relatively uniform, with no obvious orientation concentration regions, indicating that the grade 5 specimen has overall weak texture and strong orientation randomness.
Figure 5 further presents the {100}, {110}, and {111} pole figures of the two specimens. By comparison, the pole figure of the grade 3.5 specimen in the Y direction shows an obvious high-density region near [001], whereas the pole figure density distributions of the grade 5 specimen in all directions are relatively uniform, with no significant concentration. This difference is consistent with the IPF observations, further confirming that the grade 5 specimen has weaker texture and a higher degree of isotropy.
Because the number of coarse grains in the Grade 3.5 specimen is relatively small, its grain statistical data volume is limited. Therefore, although [001] orientation concentration is observed in the Y direction, this mainly reflects the orientation characteristics of local coarse grains and may have certain limitations in statistical significance. In contrast, the Grade 5 specimen has a large number of grains, and its texture statistical results have higher statistical reliability. Moreover, in this paper, the reciprocating sliding direction is along the X direction, which is approximately perpendicular to the [001] texture axis. This will cause non-uniform plastic deformation in the grade 3.5 specimen during sliding, with some grains undergoing preferential plastic flow, thereby affecting the mode of debris delamination and the uniformity of wear morphology. In contrast, the grade 5 specimen has weak texture in all directions and strong orientation randomness; the dispersion of Schmid factors among different grains along the sliding direction X is small, and plastic deformation tends to be more isotropic, which is favorable for uniform debris delamination and continuous formation of a compacted layer.
Combining the inverse pole figure and pole figure results, it can be seen that the texture of the grade 5 specimen is obviously weaker than that of the grade 3.5 specimen, indicating better microstructural uniformity and a higher degree of isotropy. Moreover, the sliding direction in this paper is along the axial direction of the cylinder, and a large number of grains are covered along the sliding direction, so that the EBSD texture statistics and the wear response have scale correspondence; the [001] orientation concentration in the Y direction of the grade 3.5 specimen indicates a certain directionality in the overall microstructure, and the sliding direction is along X and perpendicular to Y, so the Schmid factors of different grains are dispersed, which may lead to non-uniform plastic deformation.
3.1.4. Grain Boundary Characteristics
Grain boundary characteristics and dislocation distribution are key bridges linking microstructure and macroscopic mechanical properties. To comprehensively evaluate the grain-boundary strengthening potential, deformation coordination ability, and strain localization degree of the grade 3.5 and grade 5 specimens, statistics of grain boundary types, analysis of intragranular misorientation (MOS/MaxOS), and calculation of mean angular deviation (MAD) were performed. The quantitative results are shown in Table 5.
Table 5.
Grain boundary characteristic parameters.
To eliminate the influence of the EBSD scanning area on grain boundary statistics, the total grain boundary length and effective HAGB length were divided by the corresponding scanning area to obtain the total grain boundary density and effective HAGB density per unit area. The grade 5 specimen has a total grain boundary density of 0.0161 μm/μm2 and an effective HAGB density of 0.0157 μm/μm2, both the highest among the two specimens, with an HAGB fraction of 97.4%. The fine equiaxed microstructure and high proportion of high-angle grain boundaries not only provide significant grain-boundary strengthening through the Hall–Petch mechanism [29], but also help improve the toughness and fatigue resistance of the material due to the effective blocking of crack deflection and dislocation pile-up by high-angle grain boundaries. The grade 3.5 specimen has a total grain boundary density of 0.0104 μm/μm2 and an effective HAGB density of 0.0103 μm/μm2, directly reflecting the reduction in total grain boundary area caused by its coarse grain size. Although its HAGB fraction is as high as 99.35% and there are almost no low-angle grain boundaries or subgrain boundaries, the total amount of grain boundaries is insufficient, and it lacks subgrain walls or low-angle interfaces as a buffer network for plastic deformation. Under external load, because there is no subgrain structure to share local strain, the stress concentration generated by dislocation motion can only concentrate at a few coarse grain boundaries and is difficult to disperse through coordinated rotation between subgrain boundaries, resulting in a significantly increased risk of inhomogeneous deformation.
Based on the ECD main peaks (224 μm for grade 3.5 and 87 μm for grade 5), the theoretical grain boundary density ratio should be approximately 2.6. However, the measured density ratio in this paper is approximately 1.5. This is mainly because the grade 3.5 specimen exhibits a multi-scale bimodal distribution with coexisting coarse and fine grains; its ECD main peak represents only coarse grains with an area fraction of about 18%, and the presence of a large number of fine grains significantly increases its actual grain boundary density.
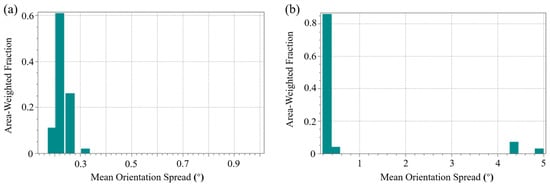
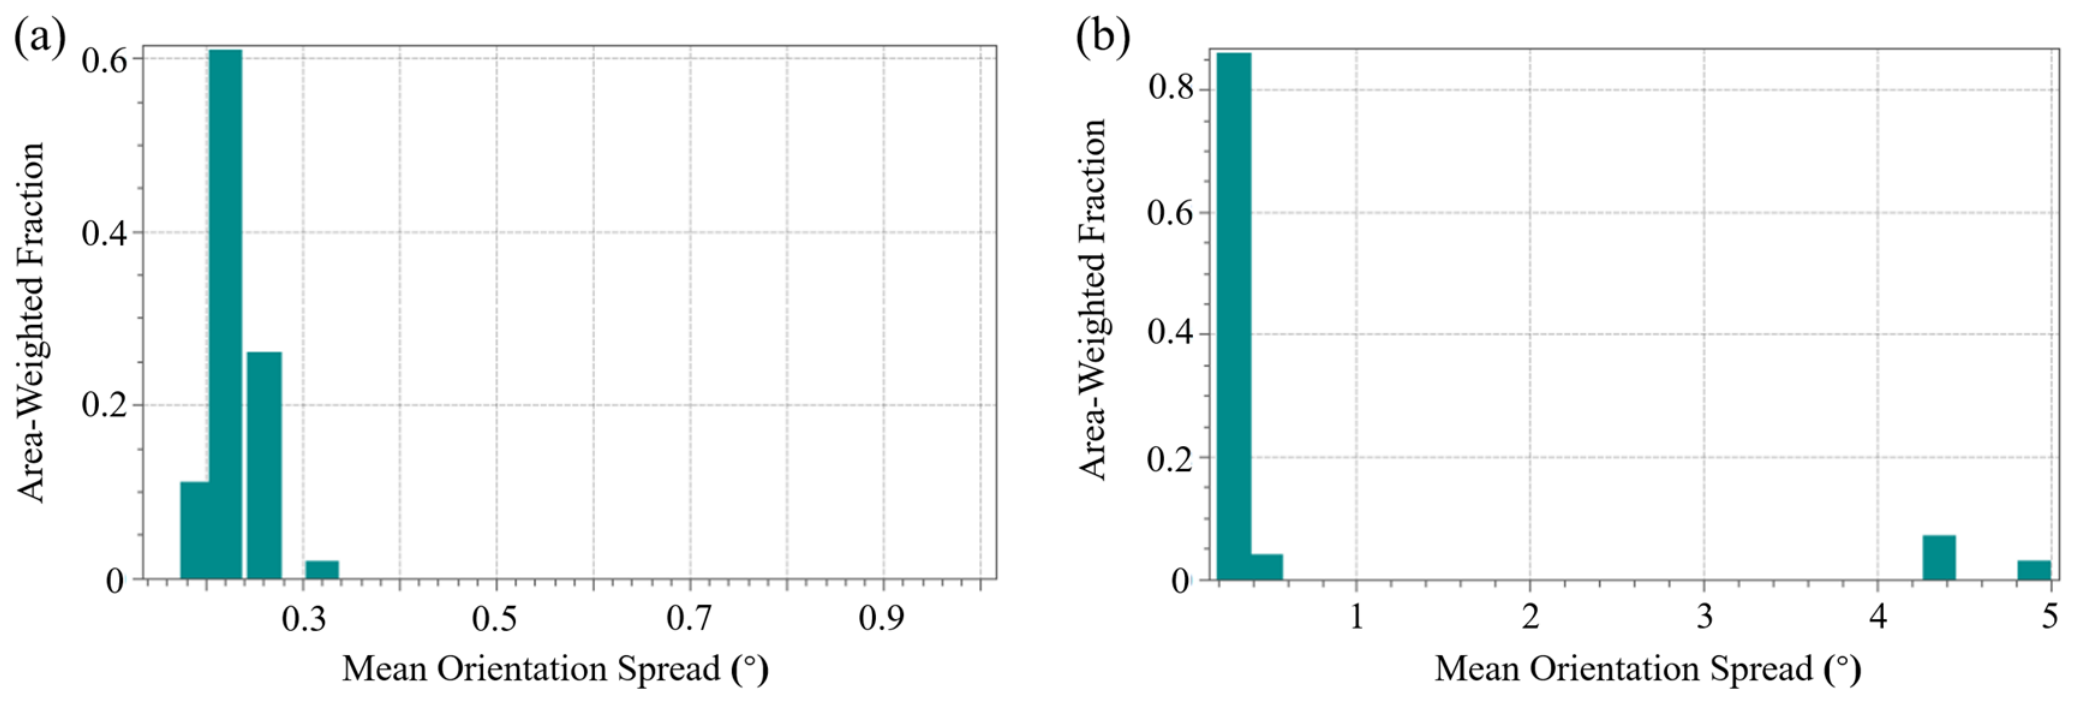
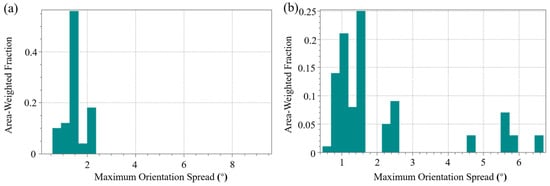
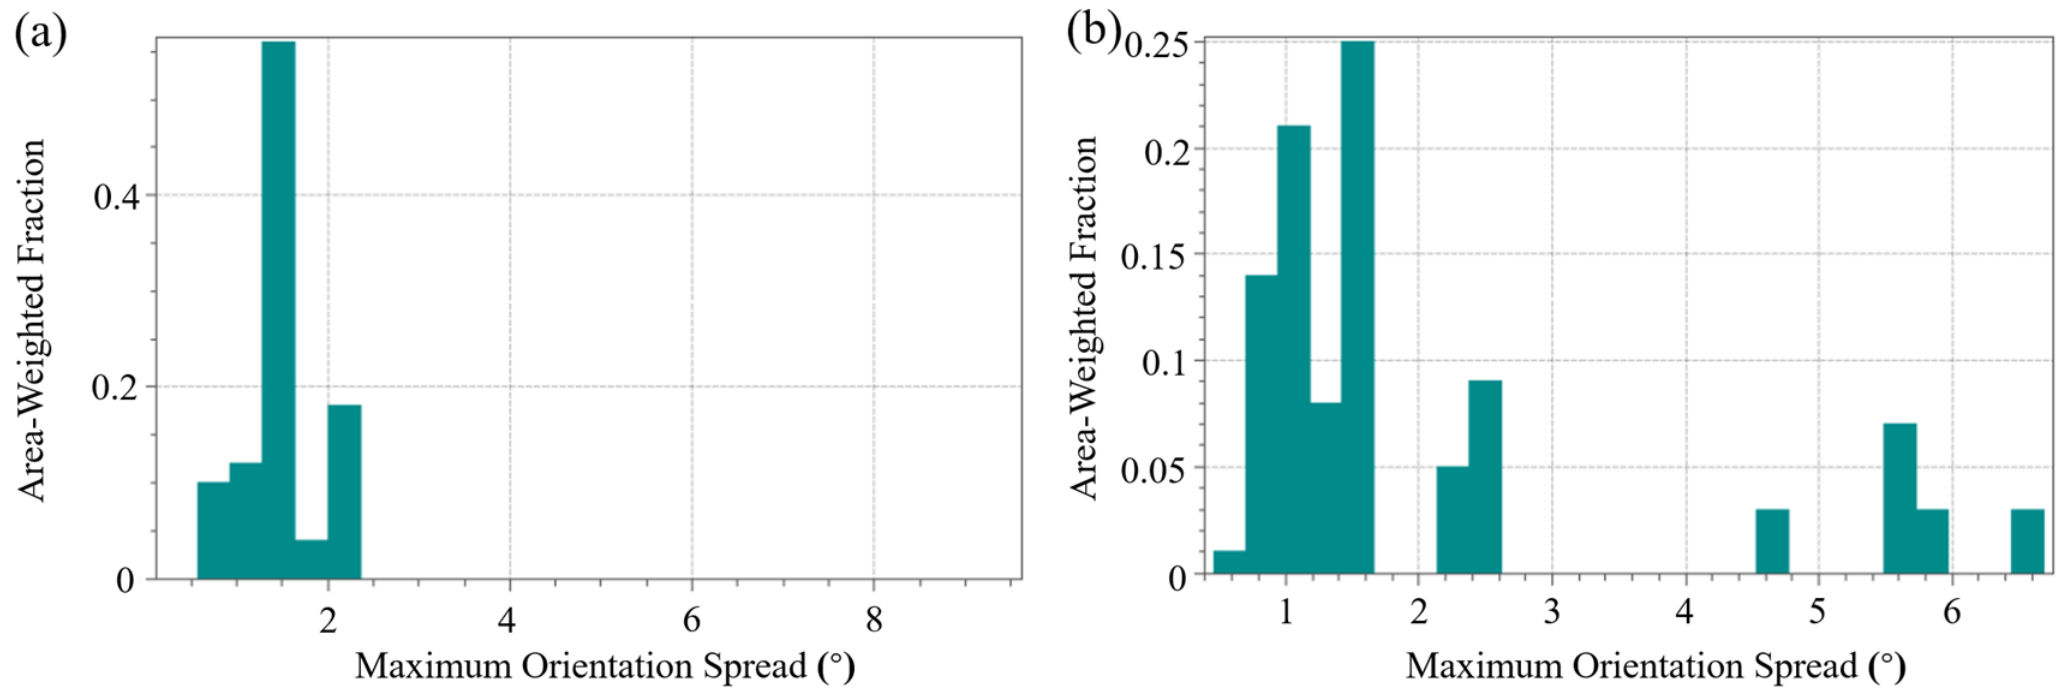
To further quantify the intragranular dislocation density and strain distribution characteristics, two parameters, mean orientation spread (MOS) and maximum orientation spread (MaxOS), were introduced. Figure 6 shows the MOS distribution histograms of the two specimens, and Figure 7 shows the MaxOS distribution histograms. As shown in Figure 6a, the MOS of the grade 3.5 specimen is mainly concentrated in the range of 0.2–0.3°, with a weighted MOS of 0.23°. The overall misorientation is low, indicating a low initial dislocation density and a relatively uniform intragranular strain distribution. Figure 6b shows the grade 5 specimen. Its MOS distribution is slightly wider, mainly concentrated in the range of 0.5–1.0°, with a weighted MOS of 0.73°, indicating a certain degree of intragranular orientation fluctuation, but overall still at a low level. In terms of MaxOS, the weighted MaxOS of the grade 3.5 specimen is 1.49°, and that of the grade 5 specimen is 2.13°. The grade 5 specimen is slightly higher, but both are at a low level, indicating that the intragranular misorientation of both specimens in the initial state is not significant.
Figure 6.
MOS histograms: (a) grade 3.5; (b) grade 5.
Figure 7.
MaxOS histograms: (a) grade 3.5; (b) grade 5.
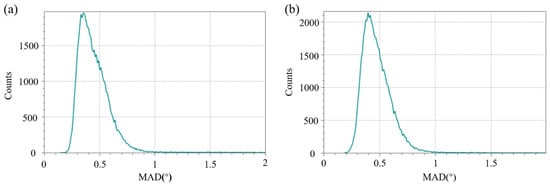
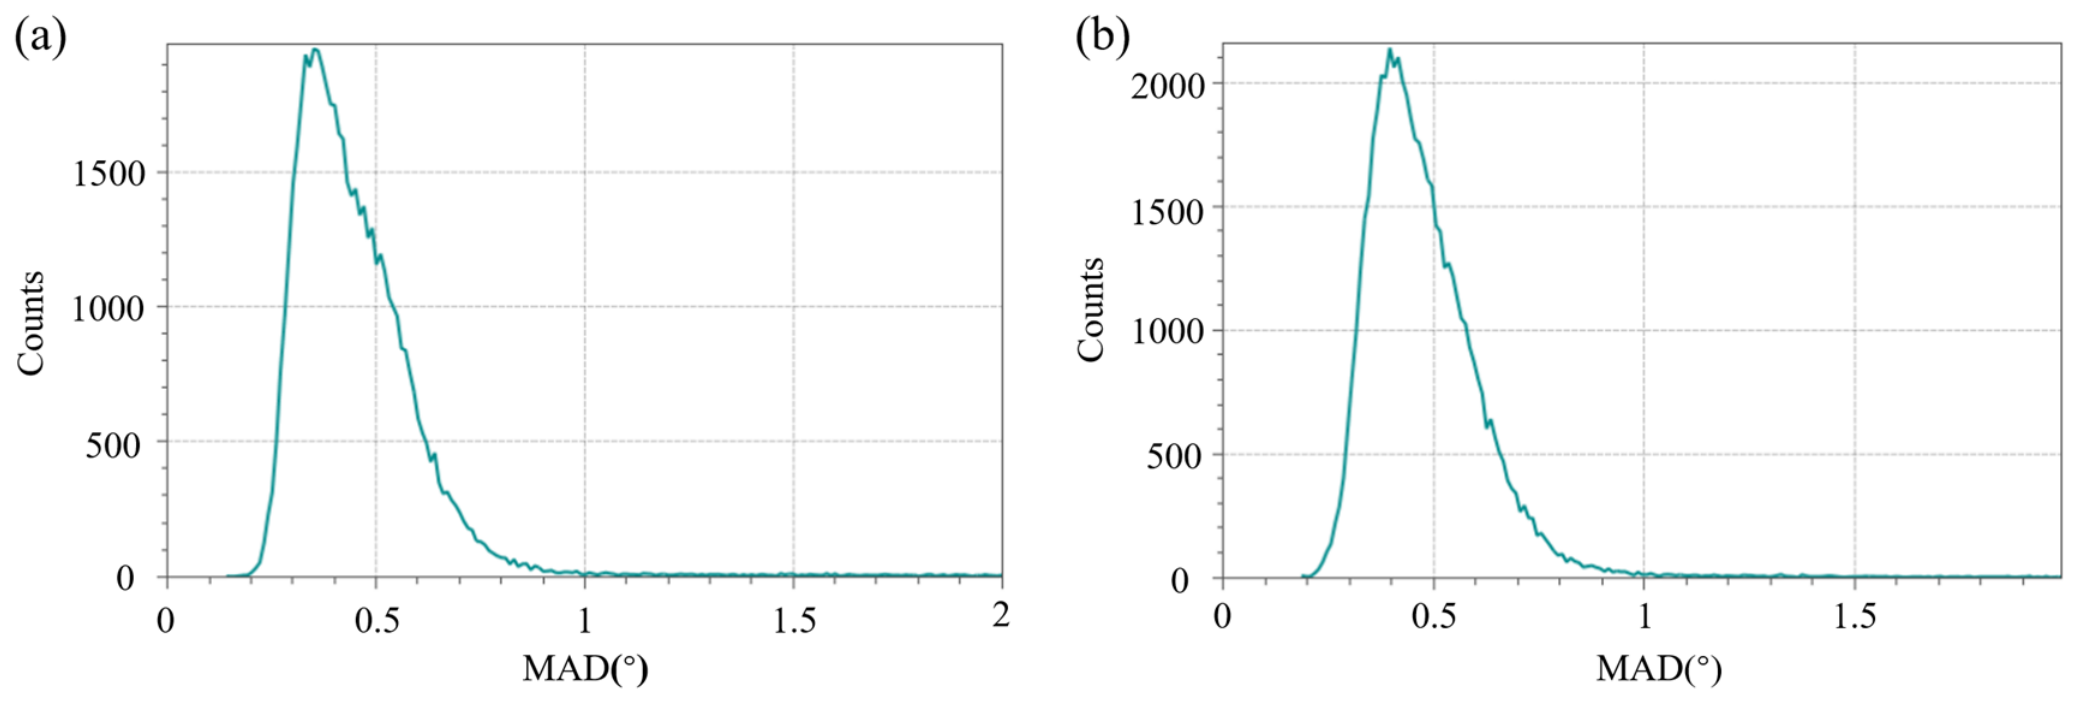
Figure 8 further shows the mean angular deviation (MAD) distributions of the two specimens. MAD is a fitting parameter of EBSD pattern calibration and reflects the degree of matching between the experimental Kikuchi pattern and the theoretically simulated pattern. The mean MAD of the grade 3.5 and grade 5 specimens is 0.44° and 0.47°, respectively; both are at a low level, indicating that the surface quality of the two specimens after electrolytic polishing is good, and the reliability of EBSD data acquisition and phase calibration is high, providing a guarantee for the accurate statistics of subsequent microstructural parameters.
Figure 8.
MAD distributions: (a) grade 3.5; (b) grade 5.
In summary, the grade 5 specimen has higher grain boundary density and more uniform distribution, and its effective HAGB density is much higher than that of the grade 3.5 specimen, giving it greater grain-boundary strengthening potential. Although its MOS and MaxOS are slightly higher than those of the grade 3.5 specimen, they remain at a relatively low level overall, and the high-density HAGB network can effectively disperse strain during deformation. For the grade 3.5 specimen, due to its lower grain boundary density, despite an extremely high HAGB fraction, it lacks a subgrain buffering mechanism. Under high load or complex stress states, local strain is difficult to fully disperse through the grain boundary network, making strain concentration more likely. The above differences in grain boundary characteristics provide a microstructural basis for the subsequent analysis of plastic deformation uniformity during fretting wear.
3.2. Fretting Wear Behavior
3.2.1. Tangential Force Response and Coefficient of Friction
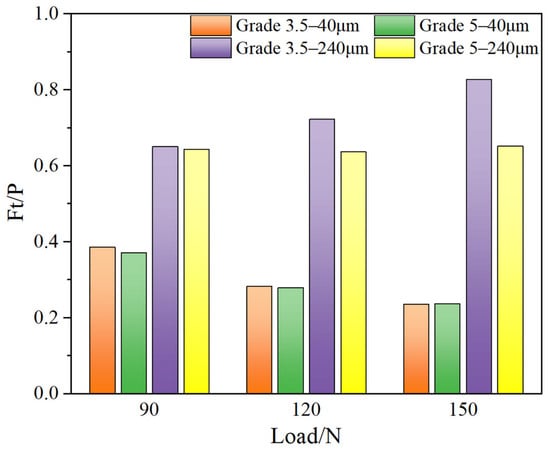
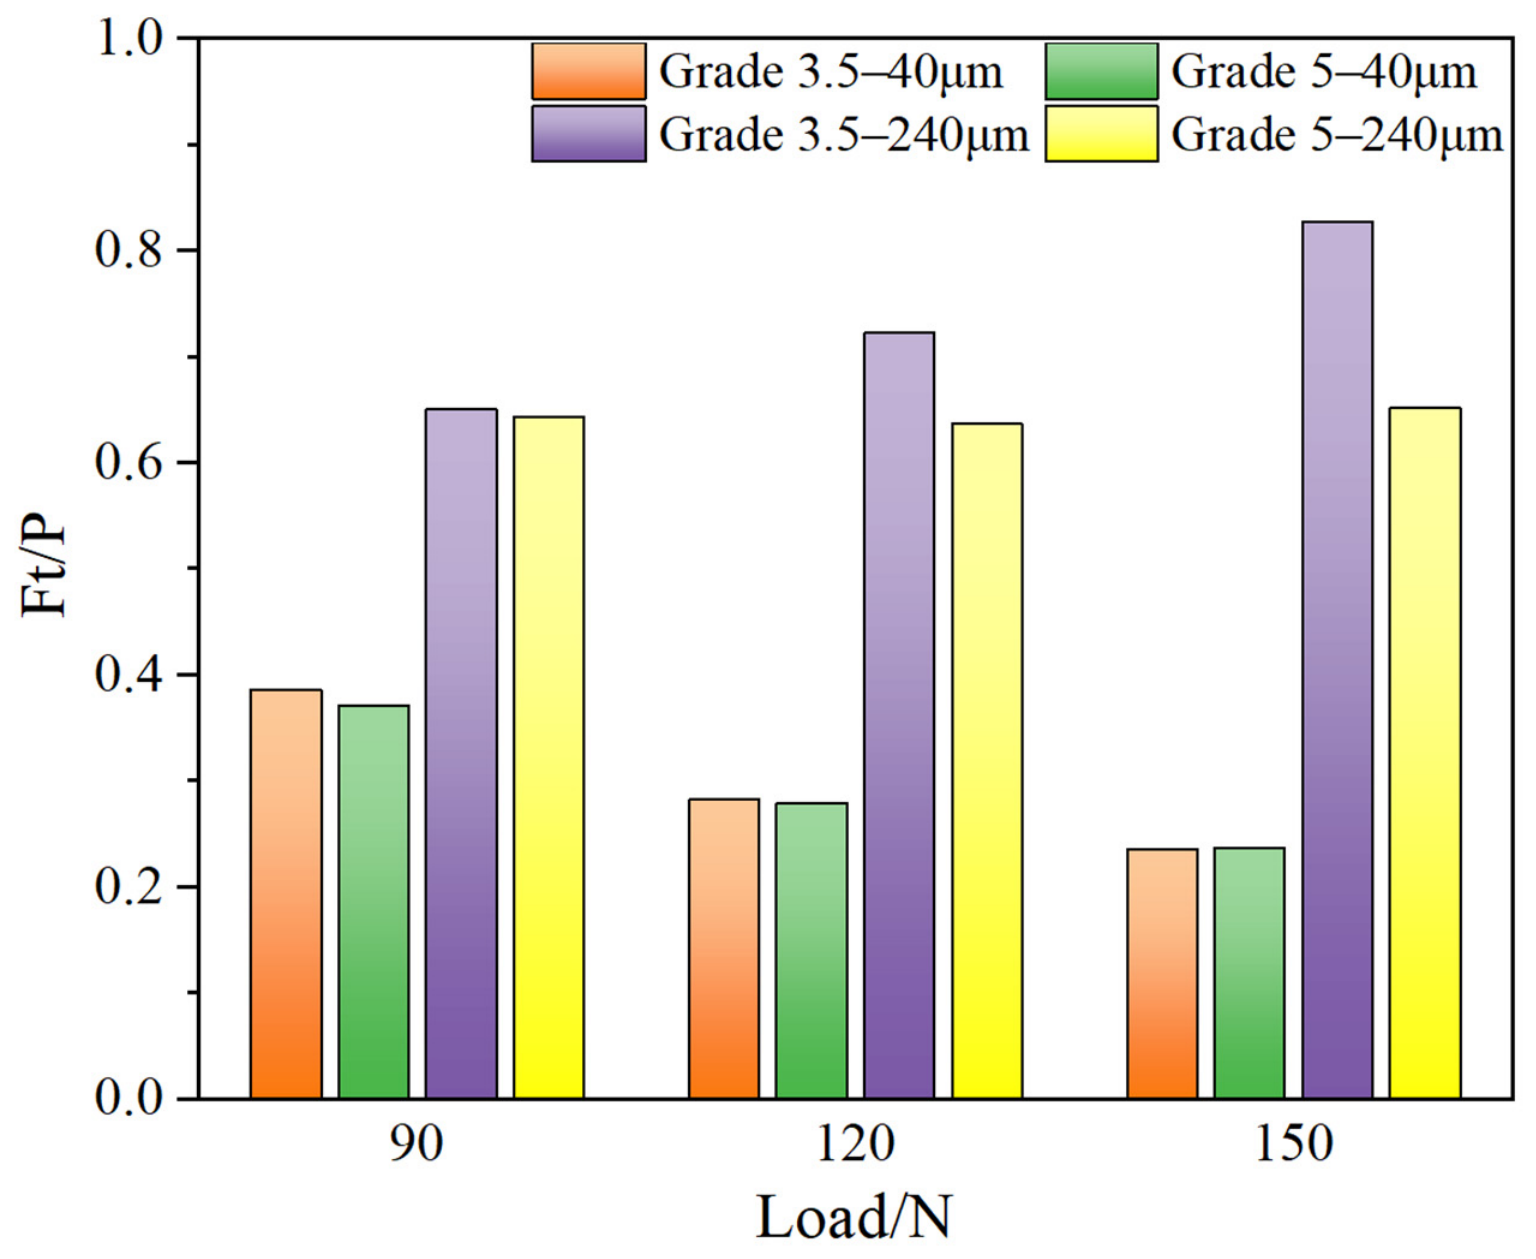
To compare the effect of microstructural characteristics on the frictional response during fretting wear, two typical displacement amplitudes, 40 μm and 240 μm, were selected, and the average Ft/P ratios at the stable stage of the Grade 3.5 and Grade 5 specimens under loads of 90, 120, and 150 N were compared, as shown in Figure 9.
Figure 9.
Average ratio of tangential force to normal force of Grade 3.5 and Grade 5 specimens at 40 μm and 240 μm.
Under the 40 μm condition, the contact zone is dominated by partial slip; the contact center is in a stick state, and relative sliding occurs only in the micro-slip zone at the contact edge. The Ft/P measured under this condition is the nominal tangential force coefficient. The Ft/P ratios of the Grade 3.5 and Grade 5 specimens show little difference, and both decrease slightly with increasing load. This decreasing trend can be explained by partial-slip contact mechanics: under partial-slip conditions, the tangential force is shared by the elastic deformation in the stick zone and the friction in the micro-slip zone; as the normal load increases, the contact zone tends to stick overall, the relative area of the micro-slip zone decreases, and the increase in tangential force is smaller than the increase in normal load; therefore, the Ft/P ratio decreases with increasing load.
Under the 240 μm condition, the contact zone is dominated by gross slip, and the Ft/P ratio can be approximately regarded as the coefficient of friction. The coefficients of friction of the two specimens show obvious differences. The average coefficient of friction of the Grade 3.5 specimen increases significantly with increasing load, whereas that of the Grade 5 specimen changes little under different loads and is overall lower than that of Grade 3.5.
3.2.2. Wear Depth
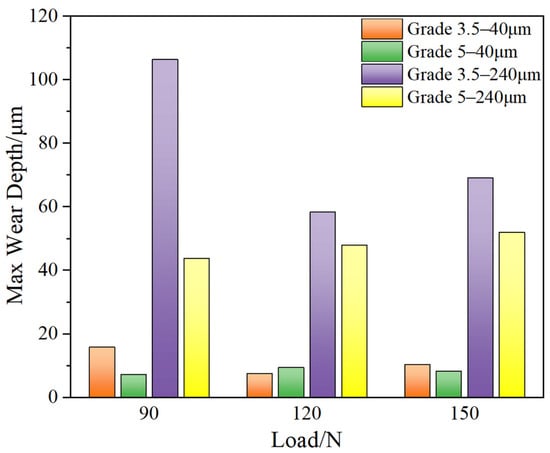
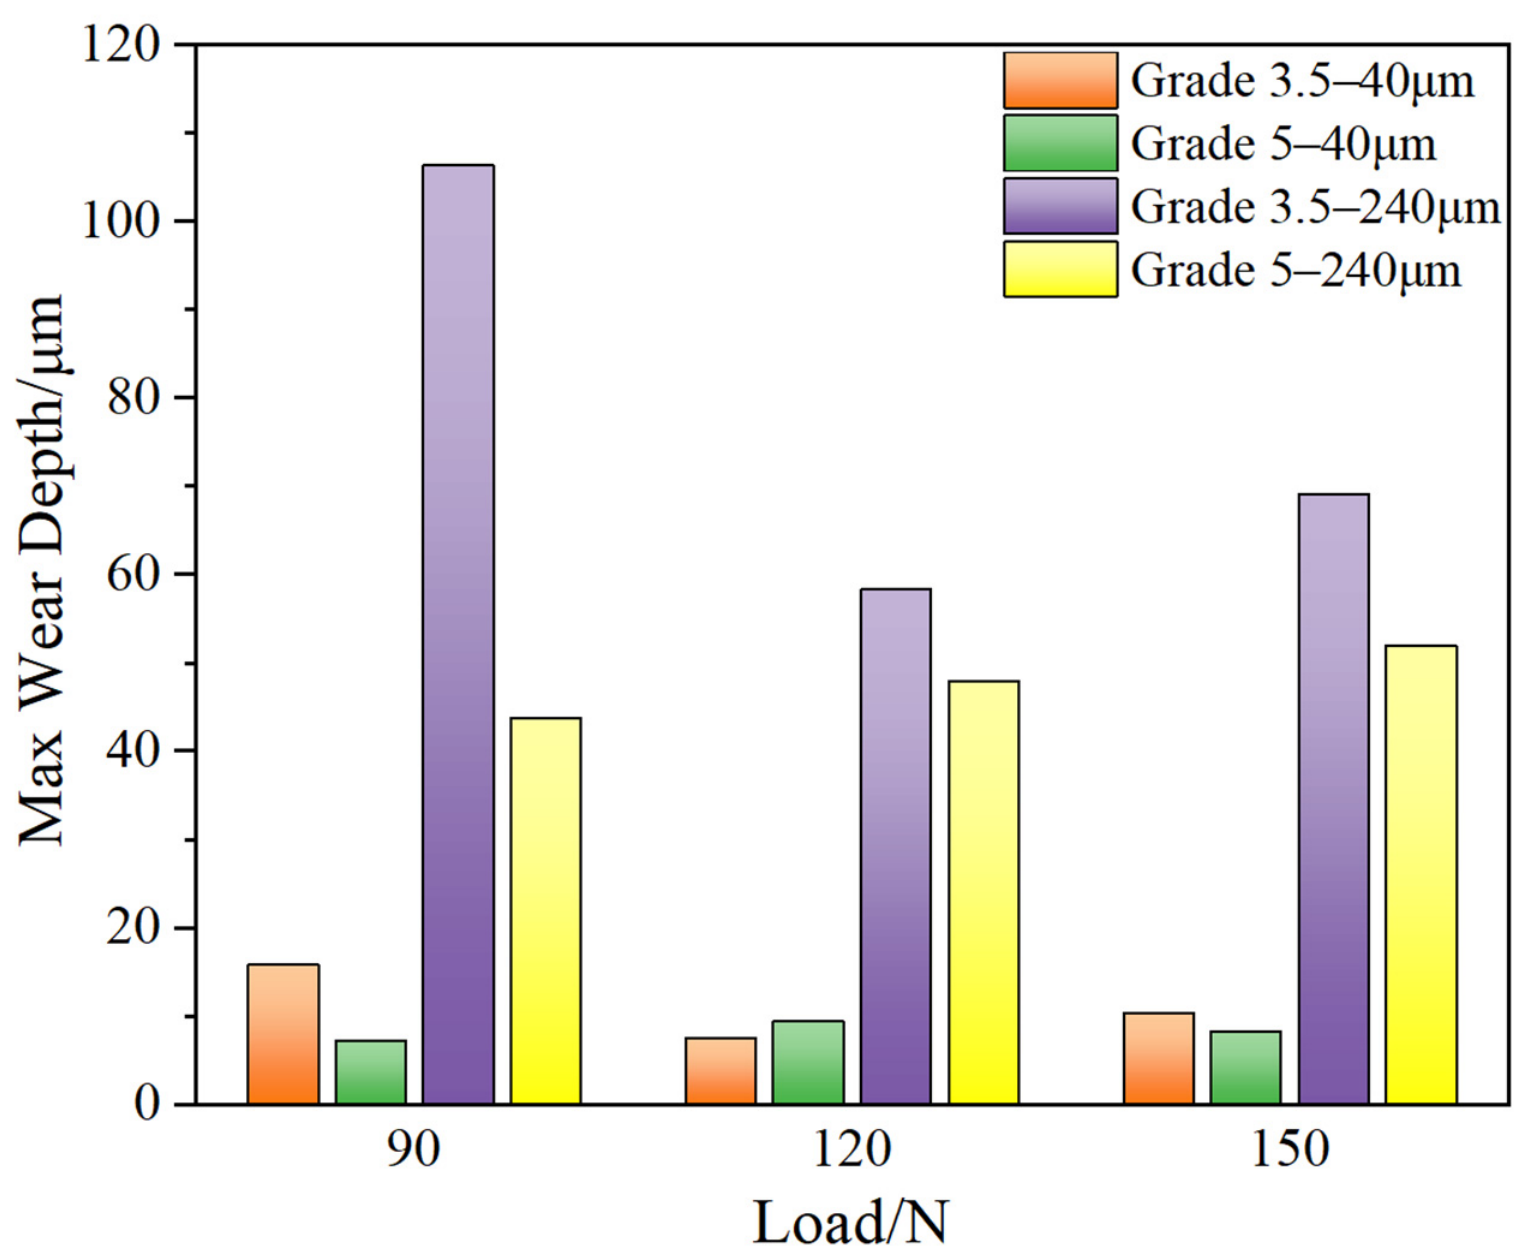
Figure 10 compares the maximum wear depths of the Grade 3.5 and Grade 5 specimens under displacement amplitudes of 40 μm and 240 μm and different loads. It can be seen that the effect of microstructural characteristics on wear depth exhibits different characteristics under the two displacement amplitudes.
Figure 10.
Maximum wear depth of Grade 3.5 and Grade 5 specimens at 40 μm and 240 μm.
At a displacement amplitude of 40 μm, the wear depths of the two specimens are both small and of the same order of magnitude. The wear depth of the Grade 3.5 specimen changes non-monotonically with increasing load, while that of the Grade 5 specimen fluctuates less and changes gently overall. The wear depths of the two specimens are relatively close, indicating that under this condition, the effect of microstructural characteristics on wear depth is limited.
This phenomenon can be explained by the contact state and wear mechanism. At a displacement amplitude of 40 μm, the central contact region is dominated by adhesion, and the actual relative slip is concentrated only in the micro-slip region at the contact edge. This micro-slip region is very small, the plastic strain is limited, and the constraint effect of grain boundaries on dislocation motion and plastic deformation cannot be fully exerted. Meanwhile, wear is dominated by adhesive smearing, the material removal rate is low, the amount of wear debris generated is small, and the wear depth itself is small. The influence of grain size difference is not easy to manifest under low wear loss conditions.
Under the 240 μm condition, the wear depths of the two specimens differ significantly. It is worth noting that the wear depth of the Grade 3.5 specimen shows a non-monotonic variation with increasing load and reaches its maximum at the lowest load, where the difference from the Grade 5 specimen is also the largest. This phenomenon, which deviates from the conventional positive load-wear correlation, is possibly attributed to the competition between the third-body abrasive particle effect of wear debris and the formation mechanism of the interfacial compacted layer. At the low load of 90 N, the contact stress is relatively low, and the relatively large wear debris generated by the coarse-grained microstructure of the Grade 3.5 specimen is difficult to crush and refine rapidly; these hardened large debris fragments act as third-body abrasive particles at the interface and produce a strong ploughing effect on the Grade 3.5 matrix with lower hardness, resulting in severe abrasive wear and a larger wear depth. Since this condition is based on a single test result, replicate tests and in situ observations can be added in future work to further verify this mechanism. As the load increases to 120 N and 150 N, the higher contact stress promotes the rapid fragmentation, refinement, and compaction of wear debris, forming a continuous and dense compacted layer at the contact interface. This compacted layer effectively isolates the counterpart from the fresh matrix and provides a significant friction-reducing and wear-resistant protective effect, so that the wear depth of the Grade 3.5 specimen instead decreases at medium and high loads. In contrast, because of its higher hardness and fine grains, the Grade 5 specimen has limited plastic deformation and naturally produces fine and uniform wear debris; even at low load, it can rapidly form effective compacted protection, so its wear depth shows a gently increasing trend with increasing load.
3.3. Analysis of Worn Surface Morphology
3.3.1. Worn Surface Morphology Under the 40 μm Condition
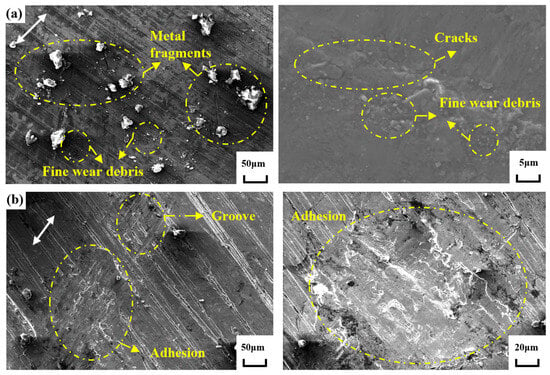
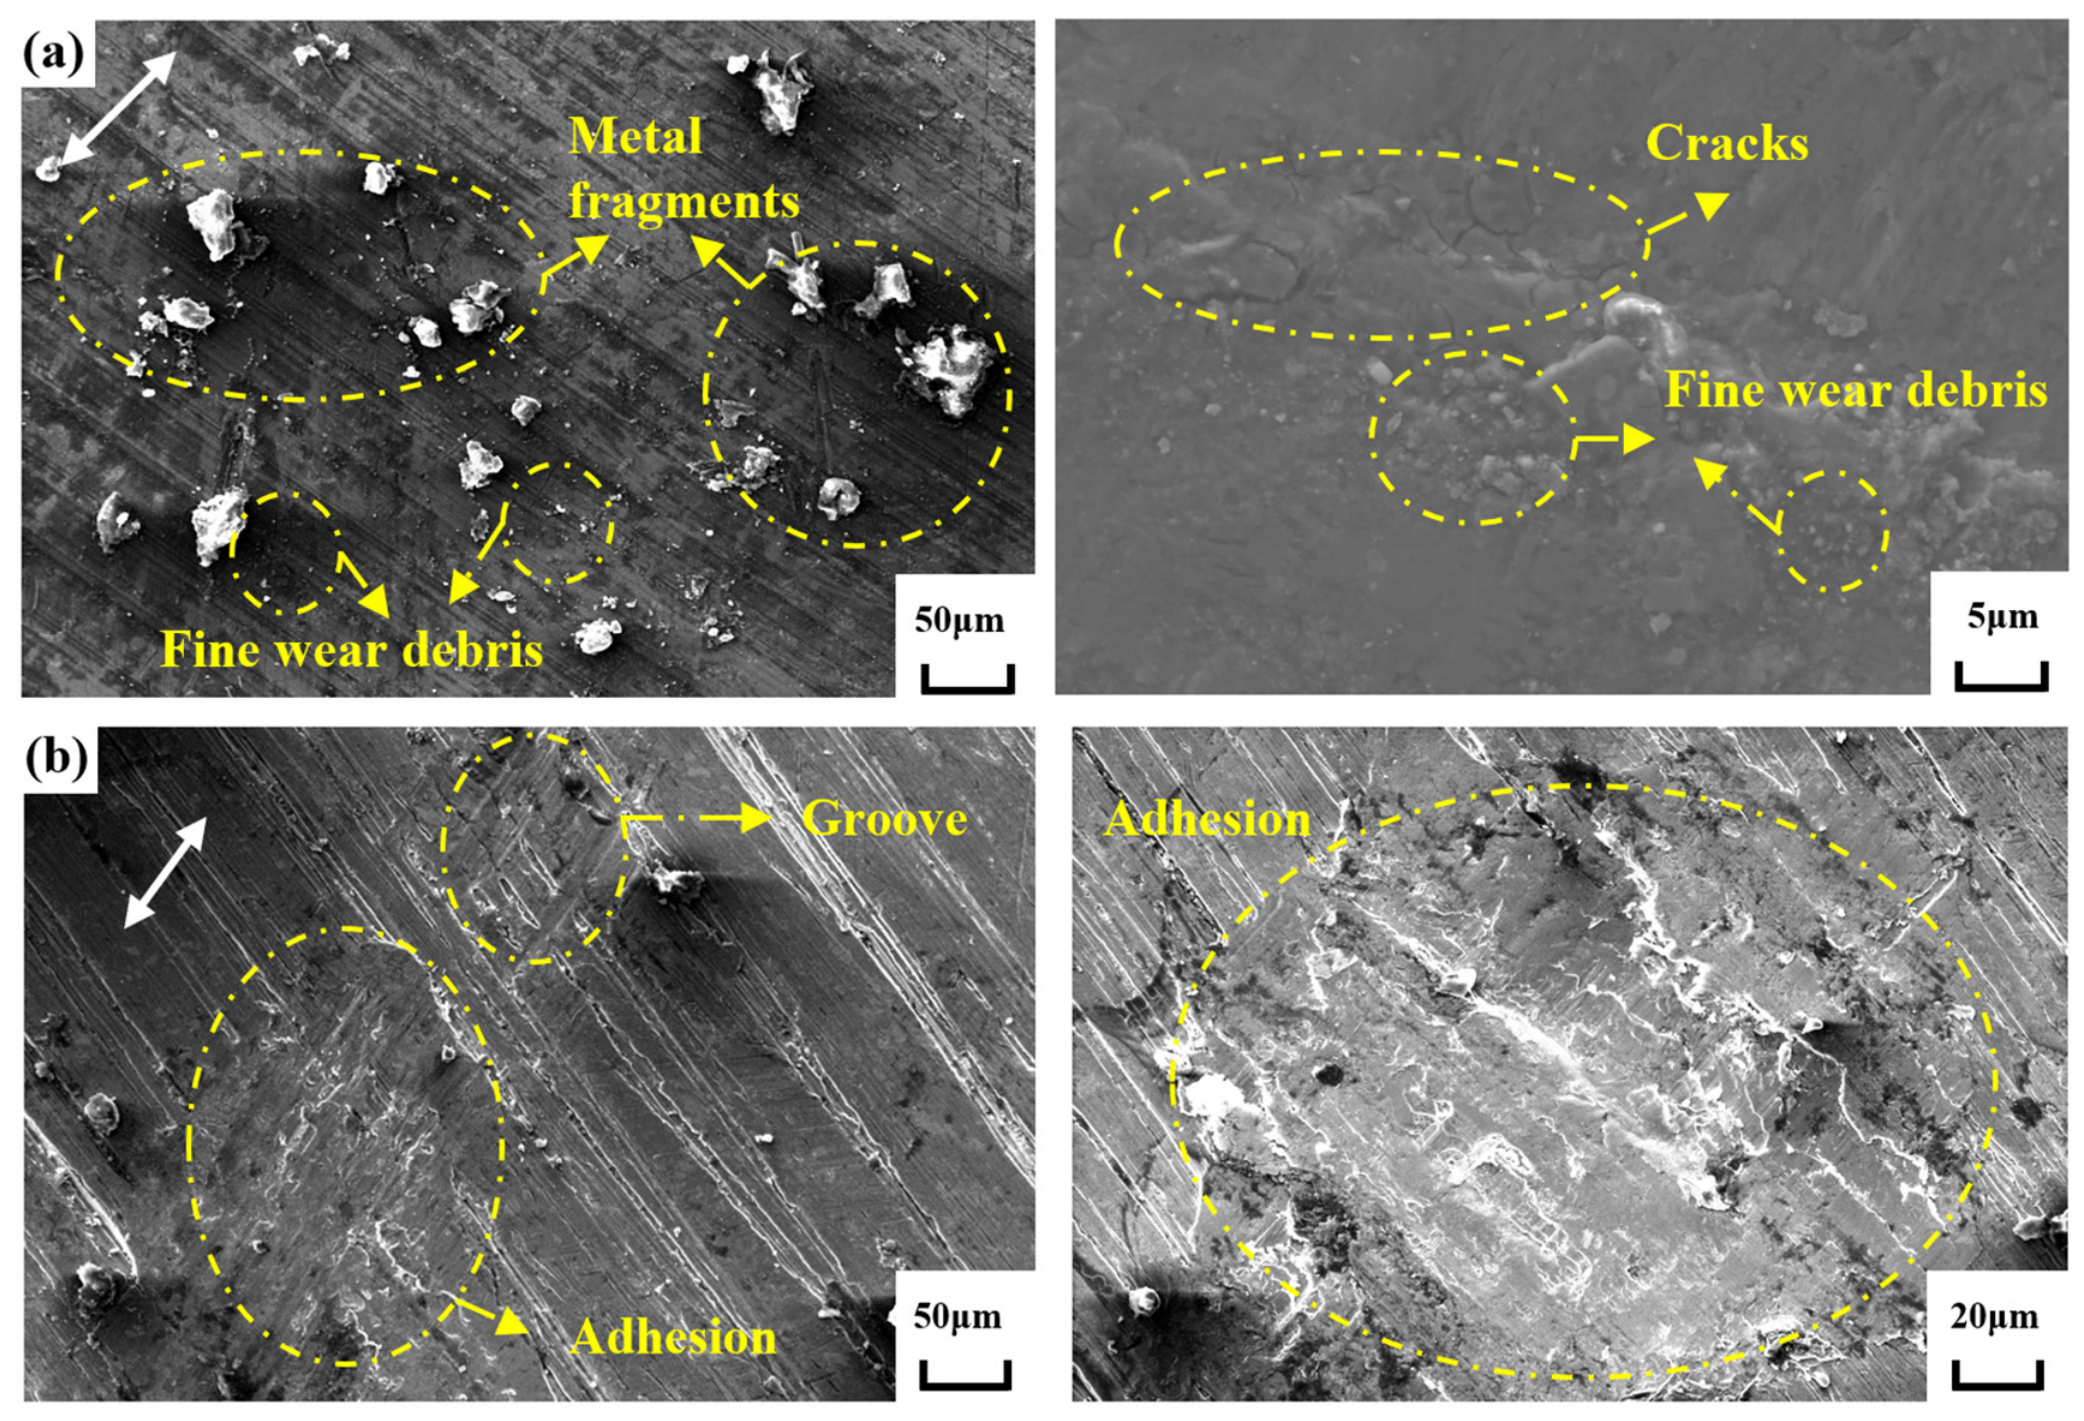
Taking the 40 μm–120 N condition as an example, the SEM morphology of the worn surfaces in the edge micro-slip region of the Grade 3.5 and Grade 5 specimens was captured, as shown in Figure 11. Figure 11a shows the Grade 3.5 specimen, and Figure 11b shows the Grade 5 specimen.
Figure 11.
SEM morphology of worn surfaces in the edge micro-slip region of Grade 3.5 and Grade 5 specimens under 40 μm–120 N: (a) Grade 3.5; (b) Grade 5. (The white arrows indicate the sliding direction).
As shown in Figure 11a, large metal fragments and fine wear debris are distributed on the surface of the edge micro-slip region of the Grade 3.5 specimen, and microcracks are locally visible. The metal fragments are irregular, blocky and relatively large in size, with obvious tearing traces at the edges. Plastic flow characteristics are visible on the surfaces of some fragments, indicating that severe adhesive tearing occurred in this region under cyclic tangential stress. Fine wear debris is scattered around the large fragments, with large size differences and non-uniform distribution; it may be formed by repeated rolling and crushing of adhesive tearing products in subsequent cycles. In addition, slender and meandering microcracks are visible in some regions, and the crack paths are relatively straight. The appearance of these microcracks indicates that under the 40 μm–120 N condition, the local plastic strain accumulation in the edge micro-slip region has reached a certain level, inducing early fatigue damage.
As shown in Figure 11b, the surface of the edge micro-slip region of the Grade 5 specimen is dominated by adhesive smearing, with slight grooves locally visible, and no obvious large metal fragments or microcracks are observed. The surface is generally relatively flat, and the damage degree is milder than that of the Grade 3.5 specimen. The adhesion regions are distributed in patches with obvious smearing traces, but the torn fragments are smaller in size. The fine wear debris is relatively uniformly distributed, and no aggregation of large fragments is observed. The grooves are relatively shallow and distributed along the sliding direction, indicating slight abrasive wear locally, but the extent is limited.
In summary, under the 40 μm–120 N condition, the edge micro-slip region of the Grade 3.5 specimen is dominated by adhesive tearing, accompanied by larger metal fragments, fine wear debris, and microcracks. In contrast, the Grade 5 specimen is dominated by adhesive smearing, with fine and uniform wear debris and mild and uniform damage.
3.3.2. Worn Surface Morphology Under the 240 μm Condition
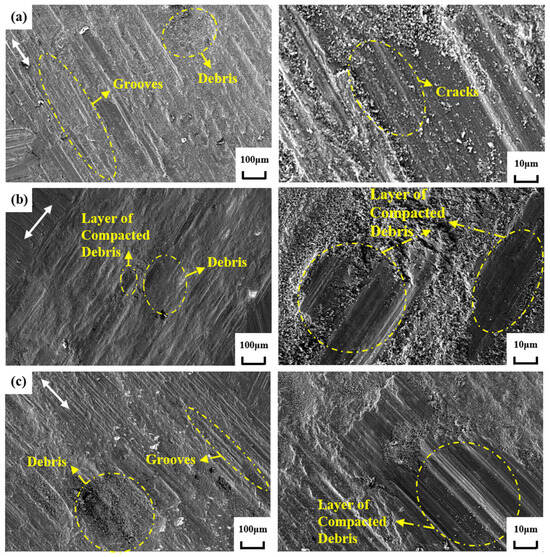
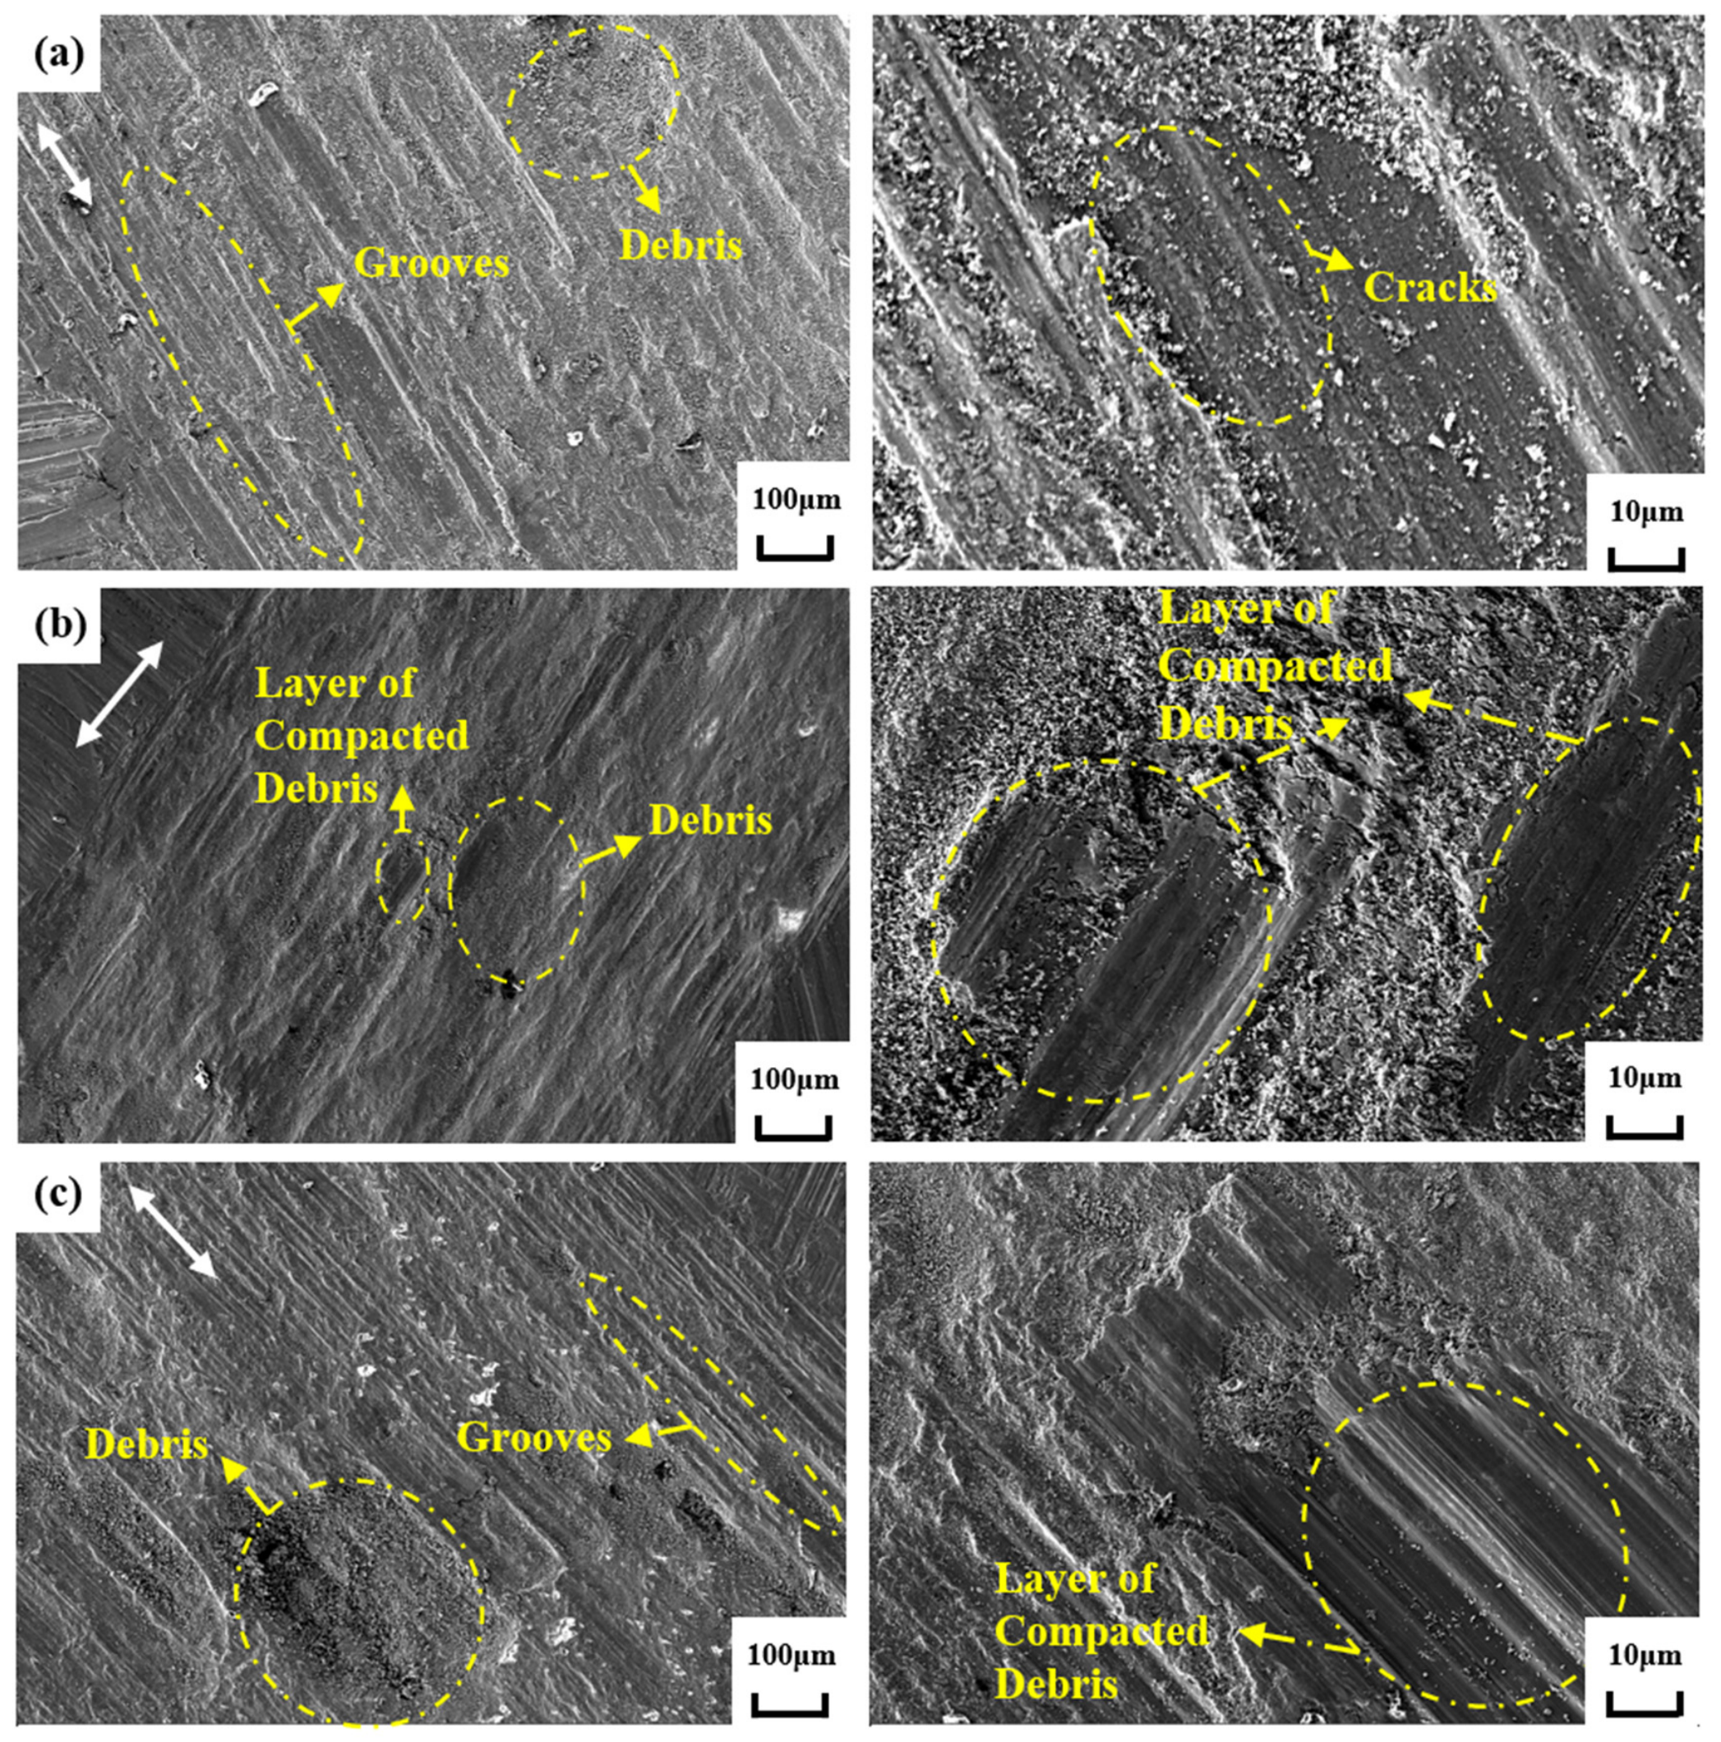
The SEM morphology of the worn surfaces of the Grade 5 specimen under a displacement amplitude of 240 μm and loads of 90, 120, and 150 N is shown in Figure 12. Under this condition, large relative sliding occurs in the contact region, and surface damage is significantly aggravated. As shown in Figure 12a, obvious spalling pits and torn layers have appeared on the surface of the Grade 5 specimen under a load of 90 N, and a layer of compacted debris and debris accumulation are visible in local regions. The edges of the spalling pits are irregular, and the torn layers exhibit obvious plastic flow characteristics, indicating that a combined effect of adhesive tearing and abrasive wear has already occurred at the contact interface under a relatively low load. The layer of compacted debris has a small coverage area and is locally distributed; the debris accumulation is relatively loose and the debris size is relatively fine, indicating that the wear degree is not yet severe.
Figure 12.
SEM morphology of worn surfaces of the Grade 5 specimen under 240 μm and different loads: (a) 90 N; (b) 120 N; (c) 150 N. (The white arrows indicate the sliding direction).
As the load increases to 120 N, Figure 12b shows that the coverage area of the layer of compacted debris on the surface of the Grade 5 specimen increases significantly, the debris accumulation becomes denser, and the surface coverage tends to be continuous. The compacted layer is distributed in patches, with multiple superimposed layers locally visible. The debris size is fine and uniformly distributed, and the torn and spalled regions are reduced. This indicates that under a medium load, the debris on the surface of the Grade 5 specimen can be rapidly refined and form a continuous and dense compacted layer, which provides good protection for the contact interface, and the wear behavior tends to be stable.
When the load is further increased to 150 N, Figure 12c shows that obvious grooves and debris accumulation appear on the surface of the Grade 5 specimen, and microcracks are locally visible. The grooves are distributed along the sliding direction, with relatively shallow depth and uniform distribution; no obvious long-range continuous deep grooves are observed. The debris accumulation is dense, and the compacted layer coverage is relatively complete, but microcracks appear in local regions, with tortuous crack paths and short propagation distances. This indicates that under a high load, although the wear degree of the Grade 5 specimen increases to some extent, the effects of debris refinement and compacted layer protection remain significant, and the propagation of microcracks after initiation is effectively suppressed.
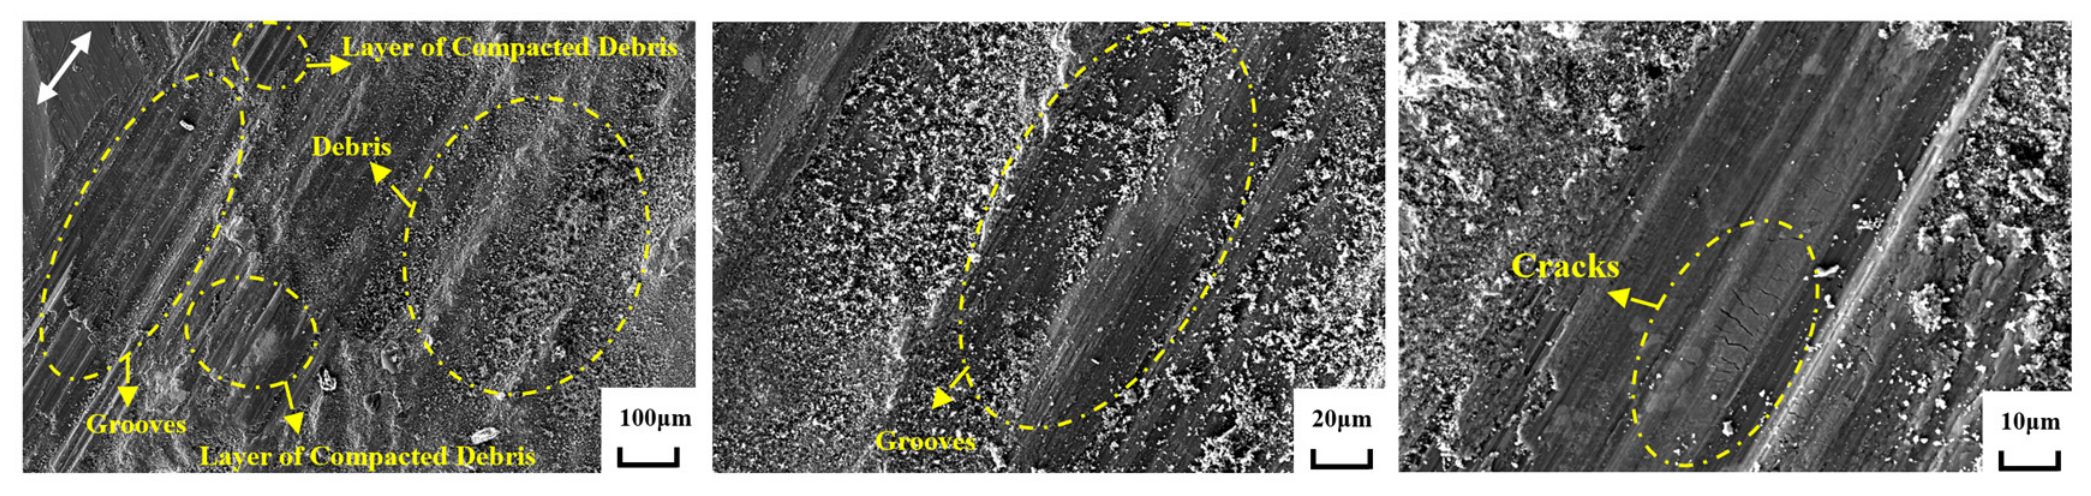
Figure 13 shows the SEM morphology of the worn surface of the Grade 3.5 specimen under the 240 μm–150 N condition. Compared with the Grade 5 specimen, the Grade 3.5 specimen exhibits significantly more severe damage characteristics. The surface of the Grade 3.5 specimen exhibits deep and long continuous grooves, and the wear debris is large in size and extremely non-uniformly distributed. Although a compacted debris layer is locally visible, it is overall fragmented and discontinuous and fails to provide effective protection for the matrix. Further observation at high magnification reveals that obvious microcracks appear on the surface of the Grade 3.5 specimen. These microcracks indicate that under the high-load gross-slip condition, severe local plastic strain accumulation occurs in the Grade 3.5 specimen.
Figure 13.
SEM morphology of the worn surface of the Grade 3.5 specimen under 240 μm–150 N. (The white arrows indicate the sliding direction).
In summary, under the 240 μm gross slip condition, the Grade 5 specimen exhibits lower wear depth, finer wear debris, a more continuous and dense compacted layer, and shorter and more tortuous microcracks, and its wear behavior is more stable than that of the Grade 3.5 specimen.
4. Mechanisms by Which Microstructural Characteristics Affect Fretting Wear Behavior and Analysis of Research Limitations
4.1. Mechanisms by Which Microstructural Characteristics Affect Fretting Wear Behavior
The difference in microstructural characteristics between the Grade 3.5 and Grade 5 specimens provides a basis for understanding the differences in fretting wear behavior. According to the ECD statistical results in Section 3.1.1, the main peak of the Grade 3.5 specimen is located near 224 μm, coarse and fine grains coexist, and the size distribution span is large; the main peak of the Grade 5 specimen is 87 μm, the distribution is concentrated, and the microstructure is fine, dense, and uniform. According to the grain boundary statistical results in Section 3.1.4, the effective HAGB density of the Grade 5 specimen is 0.0157 μm/μm2, with an HAGB fraction of 97.4%; the effective HAGB density of the Grade 3.5 specimen is only 0.0103 μm/μm2, and although its HAGB fraction is as high as 99.35%, its grain boundary density is lower. According to the phase analysis results in Section 3.1.2, the Al matrix area fraction of the Grade 5 specimen is 95%, the total second-phase content is only 1.28%, and the unindexed fraction is 3.72%; the Al matrix fraction of the Grade 3.5 specimen is 87.57%, the total second-phase content is 1.63%, but the unindexed fraction is as high as 10.79%, about 2.9 times that of the Grade 5 specimen. Both specimens contain small amounts of Al2CuMg, Mg2Si, Al2Cu, and Al3Ni phases, but their relative contents and distributions differ. According to the texture analysis results in Section 3.1.3, the Grade 3.5 specimen exhibits a certain degree of directionality, whereas the texture of the Grade 5 specimen is weak in all directions, with strong orientation randomness. The above parameters, including grain size, grain boundary density, second phase/unindexed regions, and texture, vary simultaneously in the two specimens. Therefore, based on the different microstructural characteristics, a comprehensive analysis of their effects on fretting wear behavior is carried out below.
Moreover, the mechanical properties of the two grain-size grade specimens at 115 °C also differ. As shown in Table 2, the hardness of the Grade 5 specimen is 144 HV, higher than 127 HV of the Grade 3.5 specimen; its tensile strength is 420 MPa, higher than 395 MPa of the Grade 3.5 specimen; however, their yield strengths are 314 MPa and 307 MPa, respectively, with a small difference. Hardness is the resistance to local plastic deformation and is more sensitive to grain boundary density and local microstructural uniformity; therefore, the higher effective HAGB density of the Grade 5 specimen is consistent with its higher hardness. The Archard-type wear model indicates that the wear volume is approximately inversely proportional to material hardness. The higher hardness of the Grade 5 specimen helps suppress the indentation depth of abrasive particles and the propagation of grooves, thereby reducing the wear depth. At the same time, the higher tensile strength and finer, denser microstructure of the Grade 5 specimen are favorable for hindering crack propagation and promoting debris refinement; its yield strength is close to that of the Grade 3.5 specimen, indicating that the contribution of grain-boundary strengthening to yield strength at 115 °C is partially weakened by high-temperature deformation mechanisms, but hardness can still reflect the local wear resistance. Hardness and strength are comprehensive responses to differences in microstructural characteristics; differences in microstructural characteristics directly affect the hardness and strength of the material and thereby affect fretting wear behavior.
From the perspective of plastic deformation and strain dispersion, the grain boundary area per unit volume is generally negatively correlated with the average grain size. Although the actual grain boundary density of the Grade 3.5 specimen is not reduced to the lowest value predicted by the ECD main peak due to the coexistence of coarse and fine grains, its normalized total grain boundary density and effective HAGB density are still significantly lower than those of the Grade 5 specimen. Grain boundaries are the main obstacles to dislocation motion, and their total area directly determines how dislocations are blocked during slip. In the Grade 3.5 specimen, the mean free path of dislocations is relatively large, and the frequency of encountering grain boundaries during slip is relatively low; plastic deformation is therefore more likely to accumulate continuously within a few coarse grains, forming local strain concentration. In the Grade 5 specimen, dense grain boundaries frequently impede dislocation motion, and plastic deformation is dispersed into more grains; the strain borne by an individual grain is smaller, and the overall deformation is more uniform. In this process, high-angle grain boundaries have the strongest hindering effect on dislocation motion: the high-density HAGB network in the Grade 5 specimen can effectively impede dislocation slip, causing dislocations to pile up at grain boundaries and form back stress, thereby increasing the yield strength of the near-surface material and suppressing the indentation depth of abrasive particles and the propagation of grooves; at the same time, the dense HAGB network disperses plastic strain into a large number of grains, avoiding local strain concentration, which is favorable for forming fine and uniform wear debris and a continuous and dense compacted layer. Although the Grade 3.5 specimen has an extremely high HAGB fraction, its effective HAGB density is lower, the grain boundary spacing is large, and there are insufficient interfaces to hinder dislocation motion. Under cyclic loading, the mean free path of dislocations increases, and plastic deformation is more likely to concentrate in a few coarse grains; at the same time, due to the lack of a buffering effect from subgrain boundaries or low-angle grain boundaries, stress concentration is difficult to disperse through grain boundary coordination, and microcracks are prone to initiate at grain boundary triple junctions or within coarse grains. This difference is consistent with the SEM observations in Section 3.3: more microcracks are visible in the edge micro-slip region of the Grade 3.5 specimen, whereas no obvious microcracks are observed in the Grade 5 specimen.
From the perspective of wear debris formation and compacted layer evolution, grain size and the related grain boundary density affect the formation mode of wear debris, while the second phase and texture further participate in the regulation. Under the 40 μm condition, Section 3.3.1 shows that large metal fragments are distributed in the edge micro-slip region of the Grade 3.5 specimen, with large size differences and non-uniform distribution, whereas the Grade 5 specimen is dominated by adhesive smearing, with smaller torn fragments and fine, uniform wear debris. Under the 240 μm condition, Section 3.3.2 further shows that the Grade 5 specimen can form fine and uniform wear debris and a continuous and dense compacted layer under different loads, whereas the Grade 3.5 specimen exhibits deep and long grooves, coarse wear debris, a discontinuous compacted layer, and accompanying microcracks. This difference in wear debris size and compacted layer state with load evolution directly determines the change in macroscopic wear depth. At low load, the Grade 3.5 specimen lacks sufficient stress to compact coarse wear debris, resulting in severe third-body abrasive wear and a sharp increase in wear depth; at high load, high pressure promotes the compaction of wear debris into a layer, and the wear mechanism shifts to mild fatigue delamination. This phenomenon is related to the dislocation slip free path: in coarse grains, the dislocation slip distance is long, and plastic deformation is concentrated in a few slip bands; when a slip band traverses a grain or intersects a grain boundary, it is prone to detach in the form of relatively large blocky fragments. In fine grains, dislocation slip is frequently interrupted by grain boundaries, plastic deformation is dispersed, the size of the detachment unit is small, and the wear debris is finer and more uniform. At the same time, the Grade 5 specimen has the lowest total second-phase content and the purest matrix, which reduces the risk of third-body abrasive wear caused by the detachment of hard particles and is favorable for forming fine and uniform wear debris and a continuous compacted layer. Although the total second-phase content of the Grade 3.5 specimen is not high, its unindexed regions increase significantly; combined with its relatively low MOS value, these unindexed regions may correspond to local Al9FeNi particle dense regions and micro-defects. These local non-uniform regions may become preferential sites for crack initiation under cyclic stress and aggravate local material removal.
In terms of texture, a weaker texture is favorable for the uniform spatial distribution of slip systems, making plastic deformation more isotropic. The Grade 5 specimen has weak texture, so debris detachment is more uniform and the compacted layer coverage is more continuous. The Grade 3.5 specimen has a certain orientation concentration, which is approximately perpendicular to the reciprocating sliding direction, resulting in non-uniform plastic deformation during sliding; some grains undergo preferential plastic flow, which in turn affects the mode of debris detachment and the uniformity of the wear morphology. In addition, high-density HAGBs frequently deflect crack propagation, which can extend the crack propagation path and consume energy, thereby improving the resistance to fretting damage; this is consistent with the phenomenon that the microcracks in the Grade 5 specimen have tortuous paths and short propagation distances.
It should be pointed out that in the dry air environment at 115 °C, the aluminum alloy wear debris inevitably undergoes a certain degree of oxidation, and a small amount of Fe from the 42CrMoA counterpart also transfers to the contact interface. These oxides and transferred Fe particles mix into the wear debris and change the hardness and tribological properties of the third body. However, since the two grain-size grade specimens in this paper were both tested against the same 42CrMoA counterpart in the same environment, the external chemical effects of oxidation and Fe transfer on the two specimens are equivalent. Therefore, the significant differences between the two specimens in coefficient of friction, wear depth, and compacted layer continuity still originate from the control of the initial microstructural characteristics over plastic deformation and debris detachment modes.
From the perspective of macroscopic wear behavior, the comprehensive influence of the above microstructural characteristics is evident under the 240 μm gross slip condition. According to the tangential force response results in Section 3.2.1, under the 240 μm gross slip condition, the coefficient of friction of the Grade 3.5 specimen increases significantly with increasing load and fluctuates considerably, whereas that of the Grade 5 specimen changes little, is overall lower, and remains stable. According to the wear depth results in Section 3.2.2, the wear depth of the Grade 3.5 specimen is overall higher than that of the Grade 5 specimen and varies non-monotonically with load, whereas that of the Grade 5 specimen increases slowly and changes gently. These macroscopic differences are closely related to the combined effects of grain size, grain boundary density, second phase/unindexed regions, and texture: the coarse-grained microstructure of the Grade 3.5 specimen causes plastic deformation to concentrate, and the real contact area of the contact interface increases significantly with increasing load, leading to increased shear resistance and a higher coefficient of friction; at the same time, affected by the competitive mechanism between third-body abrasive wear at low load and compacted layer protection at high load, its wear depth fluctuates considerably, and the local second-phase dense regions or micro-defects corresponding to the unindexed regions further aggravate its non-monotonic variation and morphological non-uniformity. The fine-grained microstructure of the Grade 5 specimen disperses plastic deformation uniformly, the real contact area changes little, the coefficient of friction is stable, its wear debris is naturally fine, and the wear depth is relatively low and increases gently with load; its weaker texture, lower unindexed fraction, and purer matrix are favorable for uniform debris detachment and continuous compacted layer formation, thereby further stabilizing the wear behavior.
In summary, microstructural parameters such as grain size, grain boundary type and density, second phase/unindexed regions, texture, and intragranular misorientation vary simultaneously and are coupled with each other in the two specimens; the differences in fretting wear behavior should be understood as the comprehensive influence of the above microstructural characteristics rather than the independent effect of a single parameter.
4.2. Research Limitations and Prospects
Moreover, this paper selects specimens with grain size grades 3.5 and 5 in two microstructural states and conducts fretting wear tests. The EBSD results show that the two specimens differ not only in grain size but also simultaneously in grain boundary density, texture intensity, phase composition and proportion, and intragranular misorientation. Therefore, this paper can only express the wear differences as the comprehensive microstructural influence corresponding to specimens with different grain-size grades, and cannot separate the independent contributions of grain size, grain boundary density, texture, or second phase. In addition, this paper does not analyze the elemental and oxidation states of the worn surfaces and wear debris, nor does it characterize the wear amount and surface morphology of the 42CrMoA counterpart. Therefore, the study mainly focuses on the influence of microstructural characteristics on fretting wear and cannot reflect the influence of material composition and counterpart selection. Moreover, limited by the EBSD scanning area and the size of coarse grains, the number of coarse grains contained in the Grade 3.5 specimen is relatively limited, which may to some extent limit the representativeness of its texture statistics.
Future work can be improved from the following aspects: preparing specimens with different grain-size grades and keeping microstructural parameters such as second phase, texture, and unindexed fraction as similar as possible through heat treatment and deformation processes, so as to achieve approximate univariate control of grain size; combining cross-sectional EBSD, TEM/EDS, and counterpart surface analysis to verify the formation of the compacted layer and the crack initiation mechanism, and to analyze the influence of material composition and counterpart selection on fretting wear; conducting macrotexture analysis, such as XRD macrotexture measurement, to verify the texture characteristics of the Grade 3.5 specimen; and extending the ranges of load, displacement amplitude, and environmental humidity, and considering lubrication or actual working conditions, to improve the engineering applicability of the conclusions.
5. Conclusions
This study focuses on 2A70 forged aluminum piston skirt material and selects specimens with grain size grades of 3.5 and 5 to conduct fretting wear tests in a dry air environment at 115 °C under displacement amplitudes of 40 μm and 240 μm and loads of 90–150 N. Combined with EBSD microstructural characterization, the mechanisms by which grain size and microstructural parameters affect fretting wear behavior were comparatively analyzed. The main conclusions are as follows:
- The Grade 3.5 specimen exhibits coexisting coarse and fine grains, with the main ECD peak located near 224 μm, a large size distribution span, and insufficient microstructural uniformity. The Grade 5 specimen exhibits fine, dense, and uniform equiaxed grains, with the main ECD peak at 87 μm and a concentrated distribution. The Grade 5 specimen has an Al matrix fraction of 95%, a total second-phase content of only 1.28%, and an unindexed fraction of 3.72%. The Grade 3.5 specimen has an Al matrix fraction of 87.57% and an unindexed fraction as high as 10.79%, which may reflect the presence of local Al9FeNi particle dense regions or micro-defects.
- In terms of grain boundary characteristics, the Grade 5 specimen has a total grain boundary density of 0.0161 μm/μm2, an effective HAGB density of 0.0157 μm/μm2, and an HAGB fraction of 97.4%. The Grade 3.5 specimen has a total grain boundary density of only 0.0104 μm/μm2 and an effective HAGB density of 0.0103 μm/μm2. Although its HAGB fraction is as high as 99.35%, its grain boundary density is lower, and it lacks a subgrain buffering mechanism.
- Under the 40 μm condition, the differences in friction coefficient and wear depth between the two specimens are small, indicating that under this condition, the effect of microstructural characteristics on fretting wear behavior is not significant. Under the 240 μm condition, the Grade 5 specimen has an overall lower friction coefficient that changes steadily with load, and its wear depth is significantly lower than that of the Grade 3.5 specimen and increases slowly with load. The friction coefficient of the Grade 3.5 specimen increases significantly with increasing load, and its wear depth is overall higher and exhibits non-monotonic variation; its anomalous wear behavior at low load is presumed to be related to third-body abrasive wear.
- SEM morphology shows that under the 40 μm condition, the edge micro-slip region of the Grade 3.5 specimen is dominated by adhesive tearing, accompanied by relatively large metal fragments and microcracks, whereas the Grade 5 specimen is dominated by adhesive smearing, with fine and uniform wear debris and mild damage. Under the 240 μm condition, the Grade 5 specimen can form fine and uniform wear debris and a continuous and dense compacted layer under different loads, and local microcracks have tortuous paths and short propagation distances. The Grade 3.5 specimen exhibits coarse wear debris, a discontinuous compacted layer, deep and long grooves, and more microcracks. The above morphological differences are consistent with the differences in microstructural characteristics between the two specimens.
- Mechanism analysis indicates that the differences in microstructural characteristics of specimens with different grain-size grades have a comprehensive influence on fretting wear behavior. The high-density effective HAGB network in the Grade 5 specimen can effectively hinder dislocation motion, disperse plastic strain, promote wear debris refinement, and suppress long-range crack propagation; its weaker texture and more uniform microstructure may be favorable for isotropic deformation and continuous compacted layer formation; and its lower unindexed fraction and purer matrix reduce the risk of crack initiation. Due to its lower grain boundary density, a coarse-grained microstructure, and local micro-defects, the Grade 3.5 specimen exhibits obvious local strain concentration and is more prone to large-scale material removal and microcrack initiation under high-load gross slip conditions. This paper investigates the influence of the comprehensive microstructural characteristics corresponding to specimens with different grain-size grades on fretting wear behavior, and subsequent work can be further analyzed by separating single variables such as grain size.
Author Contributions
Conceptualization, Y.X., W.Z., H.Z., S.G. and H.C.; Methodology, Y.X., Z.C. and H.Z.; Validation, C.X.; Formal analysis, W.Z. and Z.C.; Investigation, C.X., W.Z., Z.C., H.Z. and S.G.; Data curation, Y.X. and C.X.; Writing—original draft, Y.X. and Z.C.; Writing—review & editing, Y.X., H.Z., S.G. and H.C.; Visualization, Z.C. All authors have read and agreed to the published version of the manuscript.
Funding
This work was supported by National Key Laboratory of Marine Engine Science and Technology (LAB-2025-16-WD), National Natural Science Foundation of China (52575182) and the Research Fund of State Key Laboratory of Mechanics and Control for Aerospace Structures (Nanjing University of Aeronautics and Astronautics) (Grant No. MCAS-I-0325K01).
Data Availability Statement
The original contributions presented in this study are included in the article. Further inquiries can be directed to the corresponding authors.
Conflicts of Interest
The authors declare no conflicts of interest.
References
- Hills, D.A. Mechanics of fretting fatigue. Wear 1994, 175, 107–113. [Google Scholar] [CrossRef] [Scilit]
- Zhu, M.H.; Fan, X.Q.; Cai, Z.B.; Peng, J.F.; Sun, Q. Surface engineering design on alleviating fretting wear: A review. Surf. Sci. Technol. 2023, 1, 4. [Google Scholar] [CrossRef] [Scilit]
- Zhang, Y.; Chen, L.; Li, H.; Chen, Z. Finite element analysis of dovetail joint fretting wear considering glaze layer at high temperature. Tribol. Int. 2024, 193, 109353. [Google Scholar] [CrossRef] [Scilit]
- Suchý, L.; Knabner, D.; Hasse, A. Fretting fatigue of multiaxially loaded shrink-fit connections-the effect of material sensitivity on fatigue strength. Procedia Struct. Integr. 2022, 42, 1128–1136. [Google Scholar] [CrossRef] [Scilit]
- Parast, A.; Haji Esmaeili, M.H.; Azadi, M. Comparing bending fatigue and fretting fatigue properties in aluminum-silicon alloy under working conditions of engine piston-ring system. J. Solid Fluid Mech. 2021, 11, 157–174. [Google Scholar]
- Wang, Y.; Wu, L.; Liu, S.; Li, M.; Cui, Y. Fretting fatigue optimization of piston skirt top surface of marine diesel engine. Proc. Inst. Mech. Eng. Part C J. Mech. Eng. Sci. 2019, 233, 1453–1469. [Google Scholar] [CrossRef] [Scilit]
- Ozarde, A.P.; McNay, G.; Gautam, S.S. Fretting fatigue failures in internal combustion engine components: A review and future scope. SAE Int. J. Engines 2021, 14, 211–234. [Google Scholar] [CrossRef] [Scilit]
- Zhu, S.; Yuan, W.; Cong, J.; Guo, Q.; Chi, B.; Yu, J. Analysis of regional wear failure of crankshaft pair of heavy duty engine. Eng. Fail. Anal. 2023, 154, 107635. [Google Scholar] [CrossRef] [Scilit]
- Xu, L.; Shi, X.; Zhang, K.; Huang, Q.; Shu, J.; Tang, H. Effect of reciprocating wear frequency on tribological properties and friction-induced vibration and noise of 42CrMo-based hydraulic cylinder. J. Mater. Eng. Perform. 2024, 33, 9376–9395. [Google Scholar] [CrossRef] [Scilit]
- Zhang, H.; Ren, X.; Tong, Y.; Larson, E.A.; Adu-Gyamfi, S.; Wang, J.; Li, X. Surface integrity of 2A70 aluminum alloy processed by laser-induced peening and cavitation bubbles. Results Phys. 2019, 12, 1204–1211. [Google Scholar] [CrossRef] [Scilit]
- Lu, G.X.; Hao, L.J.; Liu, C.; Ye, F.X. Thermal analysis and failure behaviour of YSZ thermal barrier coatings on low heat rejection diesel engine piston. Mater. Sci. Technol. 2014, 30, 1273–1281. [Google Scholar] [CrossRef] [Scilit]
- Farhat, Z.N.; Ding, Y.; Northwood, D.O.; Alpas, A.T. Effect of grain size on friction and wear of nanocrystalline aluminum. Mater. Sci. Eng. A 1996, 206, 302–313. [Google Scholar] [CrossRef] [Scilit]
- Li, J.; Lu, Y.; Zhang, H.; Xin, L. Effect of grain size and hardness on fretting wear behavior of Inconel 600 alloys. Tribol. Int. 2015, 81, 215–222. [Google Scholar] [CrossRef] [Scilit]
- Rai, P.K.; Shekhar, S.; Mondal, K. Effects of grain size gradients on the fretting wear of a specially-processed low carbon steel against AISI E52100 bearing steel. Wear 2018, 412, 1–13. [Google Scholar] [CrossRef] [Scilit]
- Zhang, J.; Xia, D.; Zhang, H.; Misra, R.D.K.; Wang, S.; Cui, L.; Li, X. Mechanism of increased resistance to fretting wear of bearing steel achieved through multiscale microstructural control. Wear 2025, 587, 206486. [Google Scholar] [CrossRef] [Scilit]
- Yadav, P.C.; Gupta, G.; Gupta, R.; Nisar, A. Directional fretting wear behaviour of constrained groove pressed aluminium sheet. Mater. Today Commun. 2023, 35, 105669. [Google Scholar] [CrossRef] [Scilit]
- Xu, Y.; Wen, D.; Kong, B.; Ding, Y.; Lai, H.; Wang, J.; Gong, Z.; Yin, Z.; Wang, S. Fretting wear characteristics and microstructural evolution of 1420 Al-Li alloy extruded profiles. J. Mater. Sci. 2026, 61, 19015–19039. [Google Scholar] [CrossRef] [Scilit]
- Guo, X.; Lai, P.; Li, L.; Tang, L.; Zhang, L. Progress in studying the fretting wear/corrosion of nuclear steam generator tubes. Ann. Nucl. Energy 2020, 144, 107556. [Google Scholar] [CrossRef] [Scilit]
- Nagaya, T.; Wallis, S.R. The electron backscatter diffraction (EBSD) analysis procedure for crystal preferred orientations to reduce loss of EBSD map data: An example of antigorite. J. Mineral. Petrol. Sci. 2025, 120, 241210. [Google Scholar] [CrossRef] [Scilit]
- Heeb, J.; Healy, D.; Timms, N.E.; Gomez-Rivas, E. Grain boundary networks and shape preferred orientation-A fresh angle on pattern quantification with GBPaQ. Comput. Geosci. 2023, 174, 105311. [Google Scholar] [CrossRef] [Scilit]
- Liu, H.; Shao, X.; Tan, K.; Teng, Z.; Du, Y.; Li, L.; Wang, Q.; Chen, Q. Microstructural evolution and oxidation in α/β titanium alloy under fretting fatigue loading. Friction 2023, 11, 1906–1921. [Google Scholar] [CrossRef] [Scilit]
- Xue, X.; Xu, S.; Ma, X.; Han, J.; Zheng, W. Surface microstructure refinement and mechanical properties of GCr15 steels improved during ultrasonic surface rolling processing. Mater. Res. 2023, 26, e20220606. [Google Scholar] [CrossRef] [Scilit]
- Ren, X.; Zhang, J.; Wang, Z.; Liu, J.; Zhang, H.; Wang, X. Microstructure of as-cast billet and homogenization treatment of 2A70 heat-resistance aluminum alloy. Rare Met. Mater. Eng. 2016, 45, 3227–3232. [Google Scholar]
- Schuster, M.; De Luca, A.; Widmer, R.; Maeder, X.; Leinenbach, C. Processability, microstructure and precipitation of a Zr-modified 2618 aluminium alloy fabricated by laser powder bed fusion. J. Alloys Compd. 2022, 913, 165346. [Google Scholar] [CrossRef] [Scilit]
- Jia, Y.; Su, R.; Liao, H.; Li, G.; Qu, Y.; Li, R. Effect of retrogression and re-aging on microstructures and mechanical properties of an Al-Cu-Mg alloy. J. Mater. Eng. Perform. 2023, 32, 1423–1431. [Google Scholar] [CrossRef] [Scilit]
- Wu, X.F.; Zhang, G.G.; Wu, F.F. Microstructure and dry sliding wear behavior of cast Al-Mg2Si in-situ metal matrix composite modified by Nd. Rare Met. 2013, 32, 284–289. [Google Scholar] [CrossRef] [Scilit]
- El Chazly, N.M.; Farag, M.M. Inhomogeneity of plastic deformation and fracture modes in two-phase alloys. Mater. Sci. Eng. 1982, 55, 29–38. [Google Scholar] [CrossRef] [Scilit]
- Deng, B.Y.; Gong, Z.; Huang, F.H.; Yang, H.M.; Li, M.N. Optimization design of high-temperature resistant hypoeutectic Al7Si alloy via CALPHAD calculations and experimental validation. Mater. Charact. 2025, 229, 115607. [Google Scholar] [CrossRef] [Scilit]
- Hansen, N. Hall-Petch relation and boundary strengthening. Scr. Mater. 2004, 51, 801–806. [Google Scholar] [CrossRef] [Scilit]

Disclaimer/Publisher’s Note: The statements, opinions and data contained in all publications are solely those of the individual author(s) and contributor(s) and not of MDPI and/or the editor(s). MDPI and/or the editor(s) disclaim responsibility for any injury to people or property resulting from any ideas, methods, instructions or products referred to in the content. |
© 2026 by the authors. Licensee MDPI, Basel, Switzerland. This article is an open access article distributed under the terms and conditions of the Creative Commons Attribution (CC BY) license.