


Abstract
The laws of Coulomb and constant shear friction, with a constant friction coefficient and friction factor, respectively, are criticized by comparing experimental results with finite element (FE) predictions of a cold forward and backward extrusion process (or cold forging) of an A6061 alloy automobile part. It is experimentally and numerically shown that they have a clear limitation in predicting an acceptable deformed shape of the material during the process. It is emphasized that the tribological effect during a cold forward and backward extrusion process of the A6061 alloy is comparable to the effect of the material’s flow behavior since the material has a low strain-hardening capability. A technique for the simultaneous optimization of the friction condition and flow function in terms of the deformed shape is presented. An application to the process shows the strong dependence of the friction coefficient function on the lubrication-harmful effective strain of the material at the material–die interface. It is also shown that the A6061 material with an effective strain greater than the limit effective strain from the tensile test perspective behaves like a perfectly plastic material.
1. Introduction
Lubrication properties, along with the flow behaviors of the material, are critical factors determining both the macroscopic and microscopic phenomena of bulk metal-forming processes [1,2,3,4,5]. However, the tribological phenomena during bulk metal-forming processes have not been sufficiently elucidated because of their complexity and extreme working conditions, even though a few tribological test methods have been developed to better understand the friction and wear mechanisms [6,7,8,9].
Cold forging has long been performed on most aluminum alloys due to their good formability and considerable strength owing to forging [10,11]. These alloys include not only softer alloys like the A1000, 3000, and 6000 series but also harder alloys like the A2000, 5000, and 7000 series. Grease, oil, or zinc stearate can be used as the lubricant for the former, whereas phosphate, calcium aluminate, and aluminum fluoride coatings can be applied to the latter.
Many researchers [12,13,14,15,16] have experimentally and/or numerically studied ring compression tests to reveal the tribological phenomena. Among them, Tan et al. [12] intensively investigated the A6082 alloy. They introduced the absolute constant friction stress and obtained calibration curves with the friction coefficient and factor as parameters using FE analysis. Zhang et al. [3] studied the ring compression test to evaluate the friction coefficient and factor during plastic deformation of the aluminum alloy A5052.
However, ring compression is not suitable for evaluating the dependence of friction on the interfacial pressure since the pressure difference at the material–die interface during ring compression is not large compared with that in actual bulk metal-forming methods, including solid cylinder upsetting, forging, etc.
Many friction models have been utilized to describe the frictional stress at the material–die interface in metal forming. Traditionally, the laws of Coulomb and constant shear friction are prevalent [2]. Kim et al. [17] studied the ductile fracture of various aluminum alloys during simple upsetting and pin-shape cold forging using the viscoplastic finite element method (FEM) and constant shear friction law. Matsumoto et al. [18] proposed a method of maintaining lubrication during the forward and backward extrusion of an aluminum alloy. They predicted the punch wear using FEM with the constant shear friction law. Hu et al. [19] experimentally studied anisotropic friction. They conducted an FE analysis of the aluminum alloy cold forging process using the constant shear friction model to reveal the related phenomenon. Yahaya and Samion [20] experimentally and numerically studied the application of a bio-lubricant to aluminum alloy cold forging for green manufacturing using the constant shear friction model, revealing that the palm oil-based lubricant is less effective at reducing friction than the mineral oil-based lubricant. Aiman and Syahrullail [21] studied the relationship between Coulomb and constant shear friction using the ring compression test of an aluminum alloy. They found a relationship between them because the interfacial pressure does not change markedly.
Even though four and a half decades ago, Wilson [22] cynically criticized even the conventional Coulomb friction law with a constant friction coefficient in bulk metal forming, the literature survey shows that the majority of researchers employed the constant shear friction law, which is almost independent of the pressure at the material–die interface, especially for aluminum alloys. Wilson conducted a pioneering study on the lubrication regime change during bulk metal forming, progressing from a thick film lubrication regime to a boundary lubrication regime via thin film and mixed lubrication regimes. Wilson calculated the friction coefficient by linearly interpolating the friction coefficients in the thick lubrication and boundary lubrication regimes.
Few researchers have studied the non-constant friction coefficient during sheet or bulk metal forming. Leu [23] formulated the friction coefficient in dry friction as a function of the dimensionless stress ratio and contact area ratio and addressed the contradiction in the two-dimensional case in which the friction coefficient equals infinity in the sticking state. Hol et al. [24] developed a friction model to account for changes in the surface texture on the micro-scale and its influence on the friction behavior at the macro-scale. Their application to a full-scale sheet metal-forming simulation showed a realistic distribution of the coefficient of friction depending on the local process conditions. Hol et al. [25] presented the physics-based friction model to account for the change in surface topography and the evolution of friction in the boundary lubrication regime during sheet metal forming. They revealed that the friction coefficients vary in space and time and depend on local process conditions, such as the nominal contact pressure and plastic strain of the material. Wang et al. [26] presented a pressure-dependent variable friction model for a high-strength steel sheet sliding against the cold forming tool. They reported that they could obtain better results in terms of springback during U-shape bending under tension. Westeneng [27] presented a new plastic contact model for dealing with the friction of a boundary layer in the deep drawing processes depending on its chemical structure, thickness, pressure, temperature, and sliding speed. Shisode et al. [28] combined the flattening and asperity plowing models to present a new multi-scale boundary friction model for deep drawing processes. They determined the friction coefficient at each node based on the contact die surface, nodal contact pressure, and nodal effective strain.
Friction during bulk metal forming is more complicated than that during sheet metal forming. Pruncu et al. [7] presented the mechanisms of the adhesive layer during the cold forging of aluminum alloys, indicating that the hard contact between asperities at the material–die interface causes nucleation and formation of adhesive wear, leading to increased friction, a high wear rate, and irreversible damage to the material surface. They established the relationship among the plastic deformations, friction coefficients, and surface defects using FEM based on tribological tests. They showed that the lubricant can delay the above wear mechanism when the plastic deformation of the material is below the critical value. Lee et al. [29] emphasized the existence of the critical surface strain at which the friction drastically increased during the hot forging of an aluminum alloy piston from a round billet coated with the lubricant, which the work of Pruncu et al. can also explain. Recently, Hamid et al. [30] experimentally and numerically presented the tribological shifting phenomenon occurring during the automatic multistage cold forging of an aluminum steering yoke for automobile applications. They explained the phenomenon with a drastic change in the friction coefficient at the critical surface strain condition. Heo et al. [31] showed that the skin-shearing phenomenon during the round-to-half circle drawing of the SUS304 material is related to the accelerated increase in friction owing to friction heat at the material–die interface that drastically reduces the viscosity of the oily lubricant during drawing.
Cold forging of various aluminum alloys has been developed over a long period [32,33,34,35]. Because aluminum cold forging was applied in a limited way, detailed information about aluminum forging was insufficient compared with that about steel forging. Metallurgical advancements have recently been made in aluminum’s strength, wear resistance, and durability. Thus, efforts are underway to replace steel parts with aluminum parts to reduce the weight of automobiles. Because most aluminum alloys exhibit low strain-hardening both at room and elevated temperatures, the effect of friction inevitably becomes dominant [30], emphasizing the importance of a detailed understanding of the tribological phenomena. Few studies have been conducted to identify the flow behavior and tribological phenomena during metal forming using the simultaneous [36,37,38,39] and two-step [40,41] inverse analysis methods.
In this study, the traditional frictional law is critically examined using the friction-sensitive forward and backward extrusion (one of the cold forging stages) of the A6061 alloy automobile part. A surface strain-dependent friction model is used to express the experimental phenomena numerically. After precision flow characterization up to the limit effective strain from the tensile test perspective, the flow function for the effective strain greater than the limit effective strain is either assumed or optimized. The optimized friction coefficient function (FCF) and flow function are simultaneously calculated using a combined FE simulation and optimization method that serves as a practical simultaneous inverse analysis method. The metal forming simulation software AFDEX V24R02 (Altair APA) [42] and the optimization software HyperStudy 2024 [43] with the global response search method (GRSM) [44] are employed. This study emphasizes the significance of simultaneous optimization of the friction condition and flow function, especially in the case of the bulk metal forming of low-strain-hardening materials like the A6061 alloy.
2. Problem Description
2.1. Flow Characterization of A6061 Alloy for the Elastoplastic FE Analysis
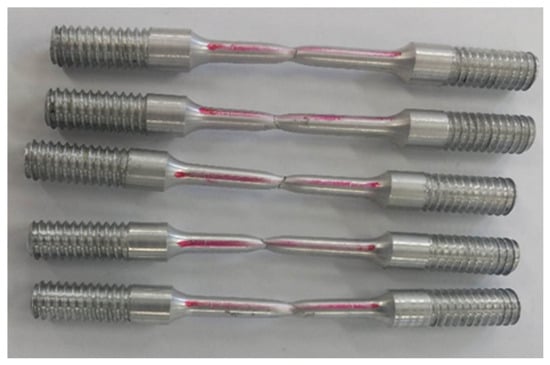
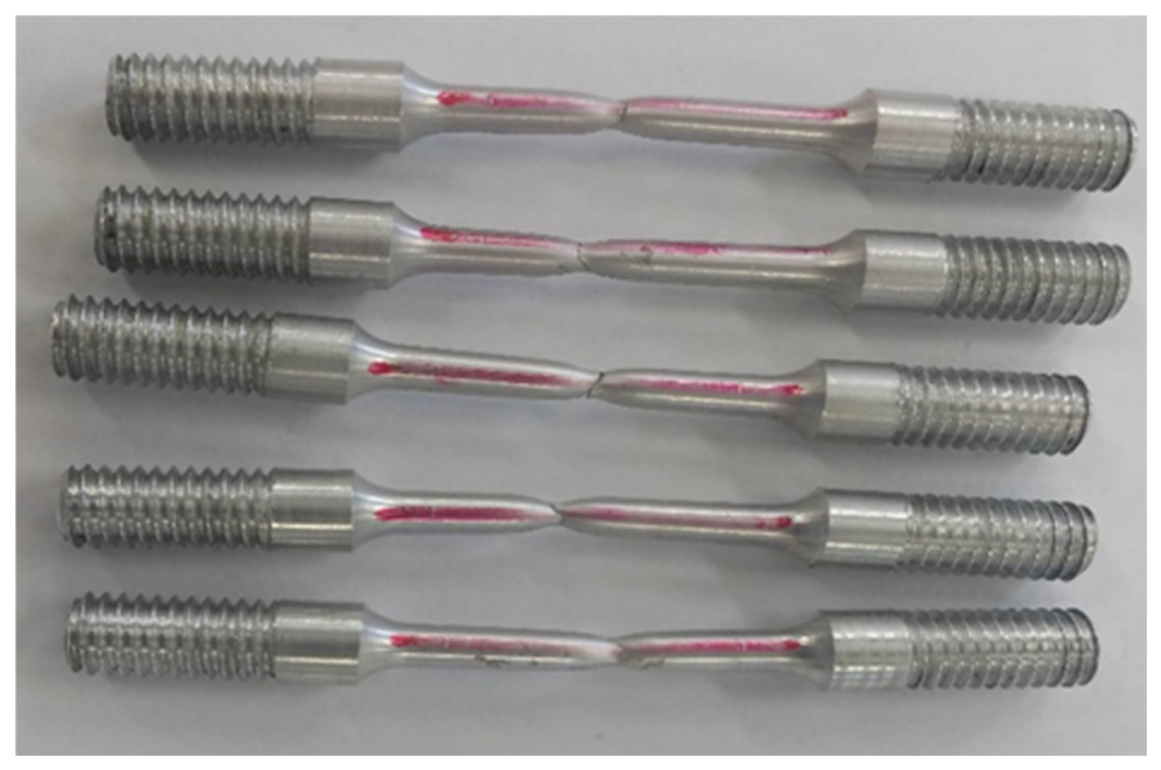
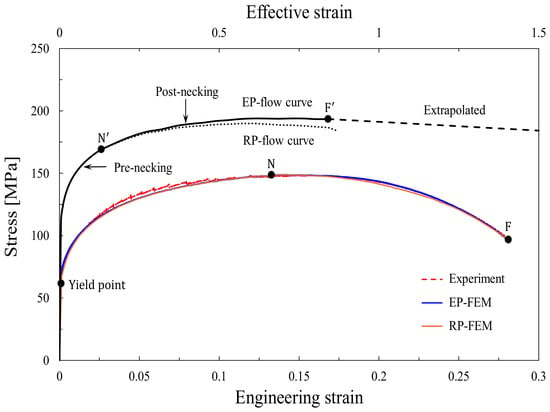
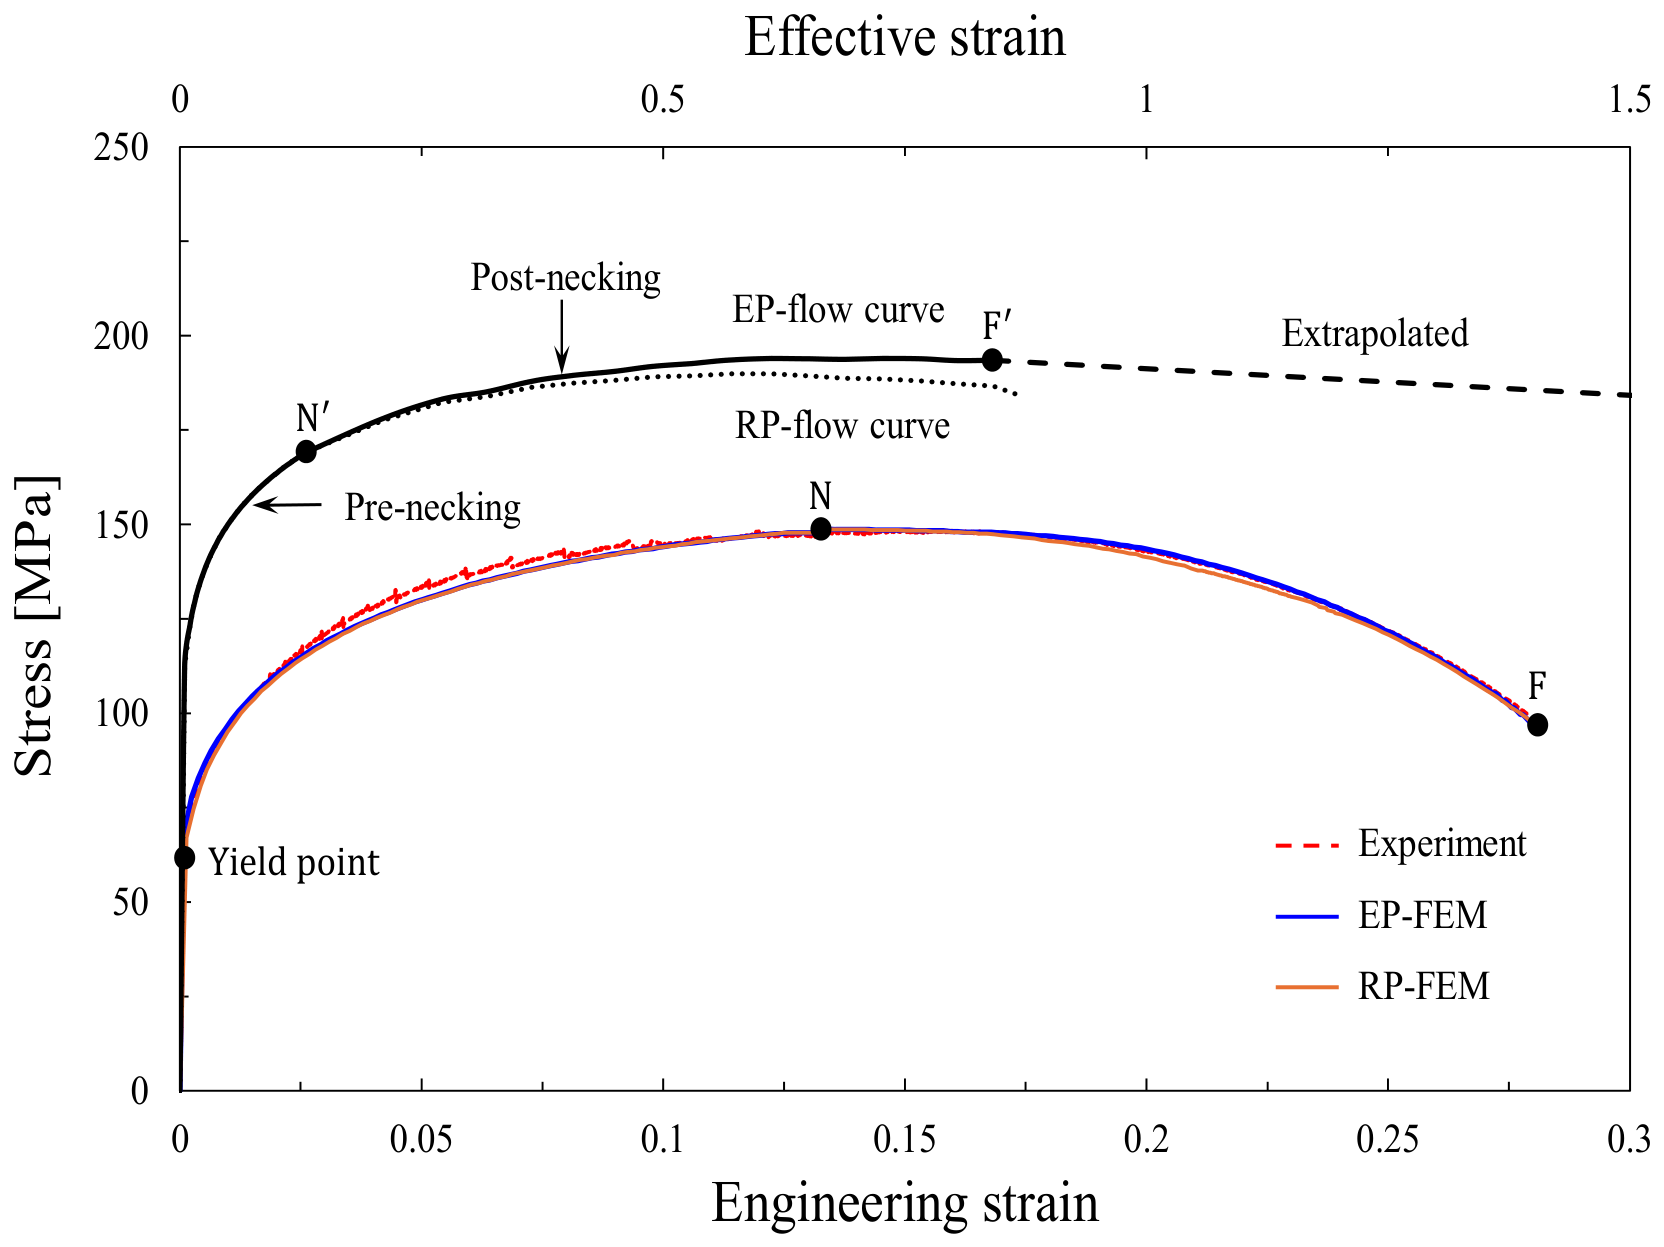
The material used in this study is an A6061 alloy heat-treated for forward and backward extrusion, which is one of the cold forging stages. It was assumed to be isotropic. Figure 1 shows the fractured tensile specimens of the A6061 alloy. Among the engineering stress–strain curves obtained from five tensile tests at room temperature, a representative curve was selected and is shown in the lower part of Figure 2 as the dashed line. The labels N and F in Figure 2 indicate the necking and fracture points, respectively. The yield strength , tensile strength, and elongation of the A6061 alloy are 61.5 MPa, 149 MPa, and 28%, respectively. The engineering strain at the necking point, denoted as , is 0.133. The A6061 alloy’s theoretical strain hardening exponent [45] of the Hollomon model calculated by the Considère condition , denoted as , is thus 0.124, which is similar to that of SCM435 (0.128), which is a typical forgeable alloy steel with considerable strain hardening capability [46].
Figure 1.
Fractured tensile specimens.
Figure 2.
Flow curve with its corresponding engineering strain-stress curves of A6061 alloy, experimental and predicted.
The dotted line of the flow curve of the A6061 alloy in the upper part of Figure 2 was obtained using the combined elastoplastic FEM [47] and tensile test method (EP-CFTM) for flow characterization at room temperature from tensile testing of cylindrical specimens [48]. In the EP-CFTM, the flow curve was described by the generalized Hollomon flow equation [45] as follows:
where is the engineering stress at the necking point, i.e., tensile strength.
The strength coefficient function is described by the unknown sample strength coefficients at the selected sample effective strains. Note that the flow characterization algorithm consists of two steps. In the first step, the near-optimal flow curve at effective strains in the post-necking strain hardening region is obtained using the combined rigid-plastic FEM [49] and tensile test method (RP-CFTM). In the second step, the RP-CFTM flow curve is improved by reflecting the elastic deformation effect of the material on the flow behavior during a cylindrical tensile test to yield the EP-CFTM flow curve. The dotted and solid lines in the upper part of Figure 2 show the RP-CFTM and EP-CFTM flow curves, respectively. The marks and on the EP-CFTM flow curve are associated with the experimental necking and fracture points denoted as N and F in the lower part of Figure 2, respectively.
In the lower part of Figure 2, the tensile test prediction obtained using the elastoplastic FEM with the EP-flow curve (denoted as EP-FEM in the figure) is compared with the experimental result. This comparison shows that they are very close to each other. The maximum error in the FE-predicted tensile load relative to the experimental result in the post-necking strain softening or hardening region is 0.37%. Note that this flow information, which is accurate for engineering purposes up to point F’, was used to decouple the effect of the flow behavior of the A6061 alloy on the macroscopic phenomenon from the material’s plastic deformation when conducting a parametric study of an unknown friction effect on it. Note that the RP-FEM curve in Figure 2 (obtained using the rigid-plastic FEM with the RP-flow curve) also matches the experiment.
As shown in Figure 2, the A6061 alloy, which initially shows high strain-hardening capability, rapidly loses it just after the necking point (true strain = 0.13, flow stress = 169 MPa). Notably, it loses the strain-hardening capability when its effective strain reaches 0.51. This explains why the effective strain of the A6061 alloy near the fracture point is small compared with that of other commercial materials, even though the effective strain at the necking point is not small compared with that of other forgeable materials [48], including SWCH10A, S25C, SWCH45F, SCM435, and the like.
Figure 2 emphasizes that the pre-necking strain hardening of the A6061 alloy is remarkable, whereas its post-necking strain hardening is very weak. Notably, strains less than the true strain at the necking point are not crucial in most cold bulk metal forming since significant plastic deformation occurs at strains greater than this value. The A6061 alloy is thus a typical low strain-hardening material from the standpoint of cold bulk metal forming experiencing large plastic deformation. The flow function at the large strain after in Figure 2 was geometrically extrapolated as indicated by the dashed line, which will be used to optimize only the friction condition in Section 3.1. However, it will be optimized along with the friction condition in Section 3.2 to achieve the best FE prediction in terms of the deformed shape of the material during the cold forward and backward extrusion.
Lee et al. [29] and Hamid et al. [30] studied the peculiar tribological phenomena occurring during the hot forging of an aluminum piston and the automatic multistage cold forging of an aluminum yoke, respectively. They revealed that the impact of friction is locally remarkable depending on the interfacial strain of the material, mainly when the material has low strain-hardening capability. According to their research on the sensitive dependence of friction on the plastic deformation of the material at the material–die interface, friction is likely to dominate the A6061 alloy during cold forward and backward extrusion because a large strain is inevitable. This leads to a significant difference in lubrication method and production speed compared with automatic multistage cold forging. However, no research has been conducted on the friction phenomenon during mechanical press forging at room temperature.
2.2. Problem Definition, Process Design, and Experiments
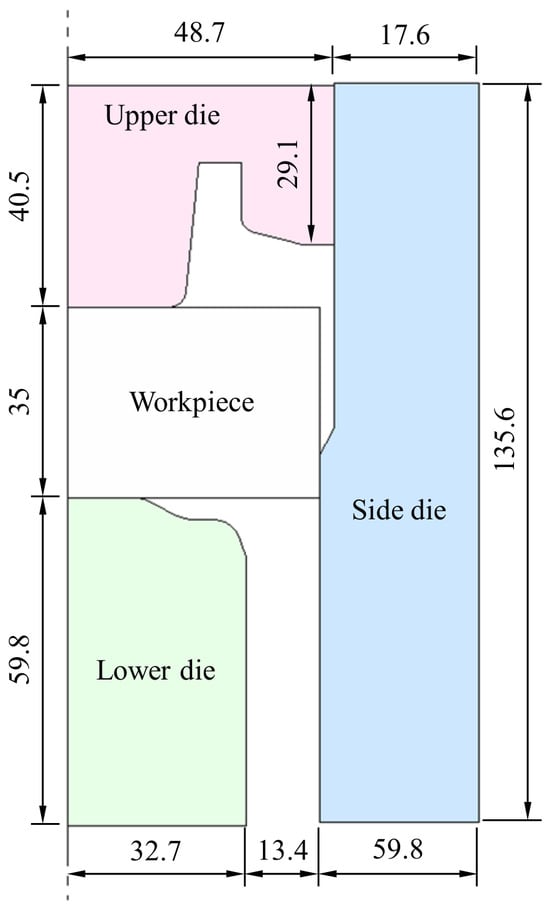
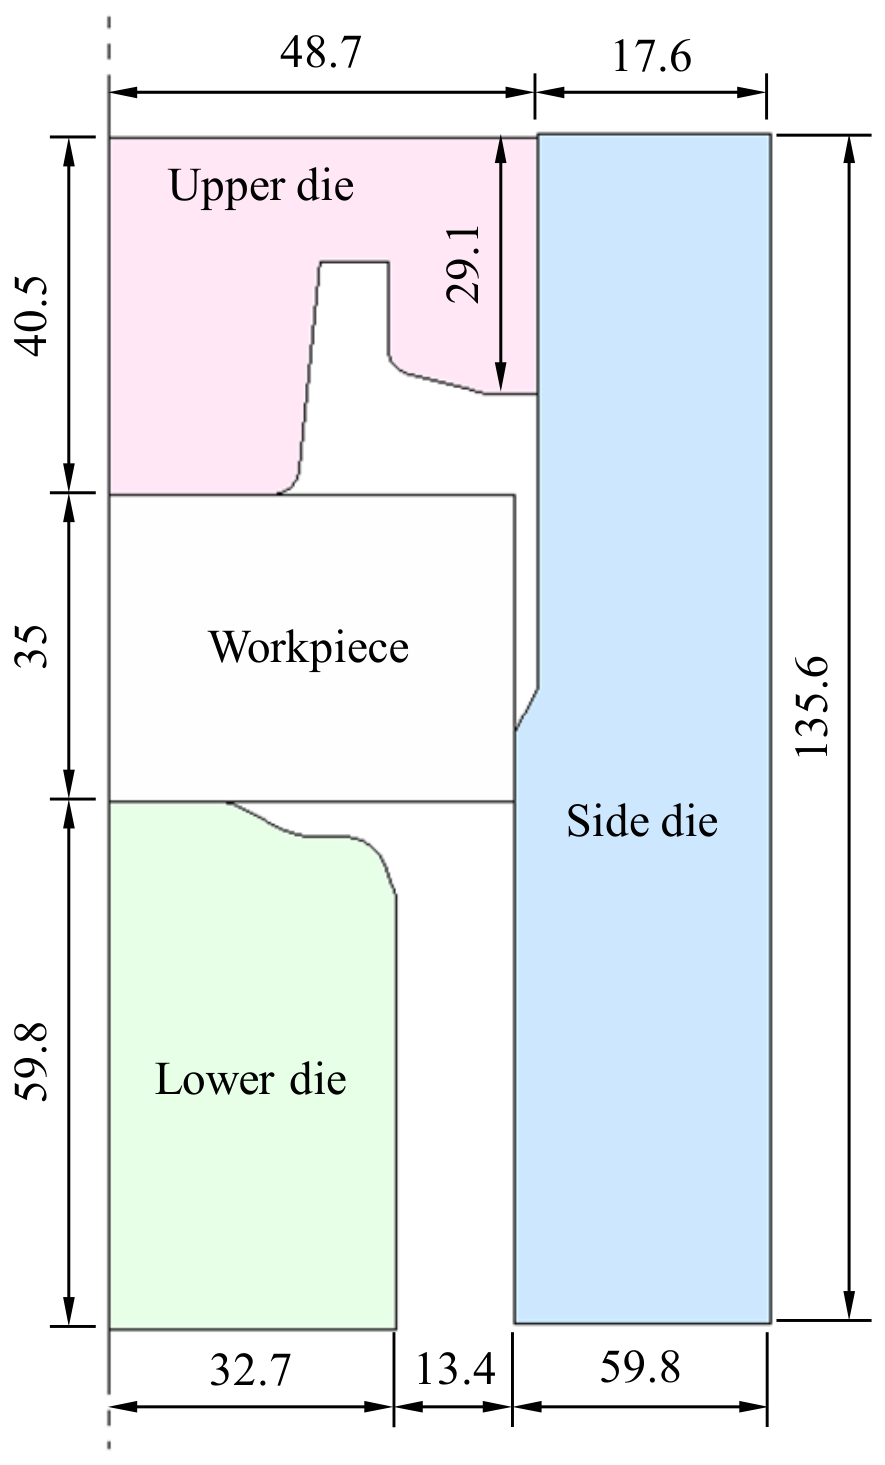
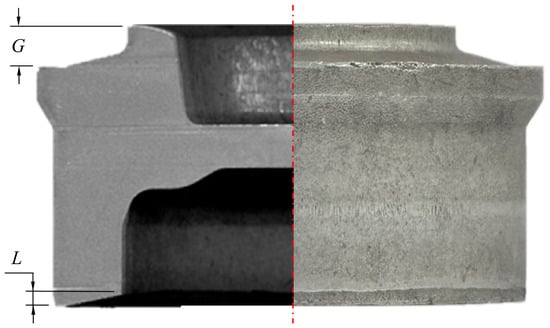
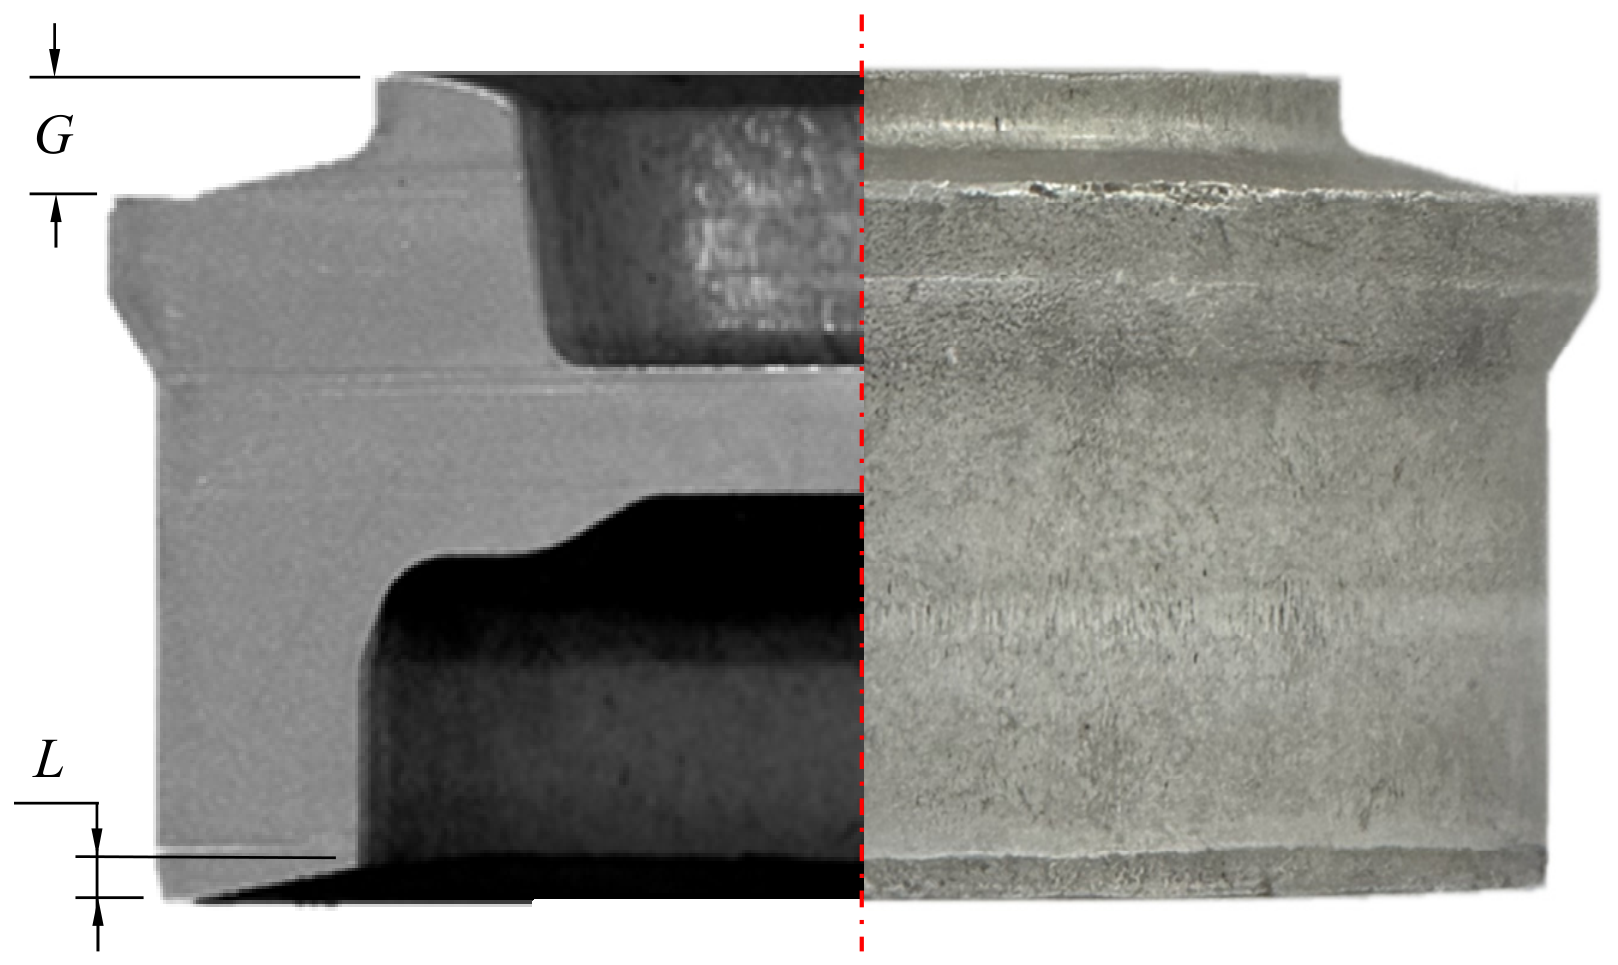
Figure 3 describes a test process design for cold forward and backward extrusion of an A6061 alloy preform, which is experimentally and numerically investigated in this study. Figure 4 shows the experimental cross-section [50], which is representative of pilot production trials using a mechanical cold forging press. Figure 4 also defines the relevant geometric dimensions of the cold forward and backward extrusion process, denoted as the geometric parameters G and L, which determine the global configuration of the upper side and tilt of the forged preform of the bottom side, respectively. They were experimentally measured as 7.7 mm and 2.5 mm, respectively, which are the target dimensions to be predicted by the metal-forming simulation using either the optimized friction condition or the optimized friction condition and flow function. Therefore, the quantities to be optimally determined are either the friction condition or the friction condition and flow function.
Figure 3.
Definition of the cold forward/backward extrusion process.
Figure 4.
Deformed shape of the preform at the final stroke. The dashed line means the central axis of the material.
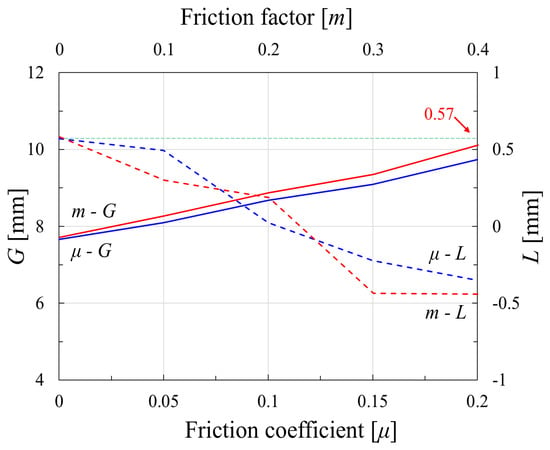
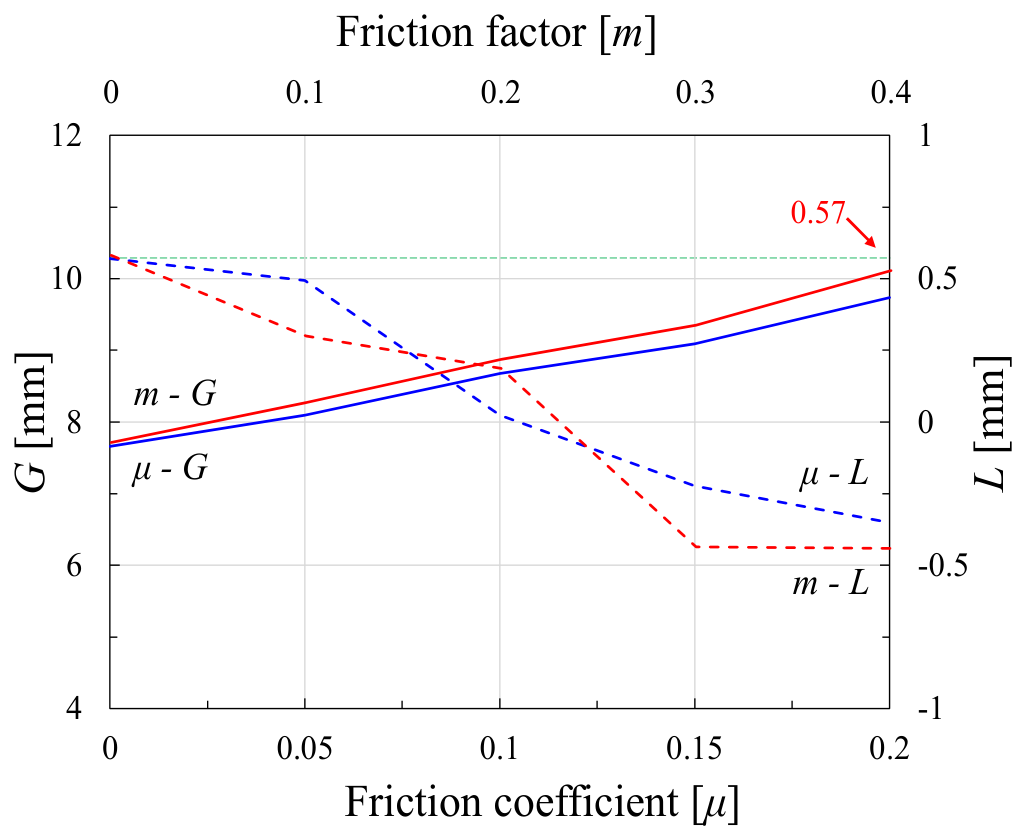
FE analyses of the test process in Figure 3 were conducted under various constant frictional conditions using the EP-CFTM flow curve in Figure 2. Notably, however, all the tested constant friction coefficients (= 0.0, 0.025, 0.05, 0.075, 0.1, 0.15, and 0.2) for the conventional Coulomb friction law and constant friction factors (m = 0.0, 0.05, 0.1, 0.15, 0.2, 0.3, and 0.4) for the constant shear friction law failed to predict acceptable parameters G and L. The -G, -L, m-G, and m-L curves are shown in Figure 5. Notably, the FE prediction of the parameter L using = 0.0 was the best () among all the FE predictions from the perspective of the target dimension of L ( = 2.5 mm).
Figure 5.
Predicted μ-G, μ-L, m-G, and m-L curves obtained using the flow curve of Case A.
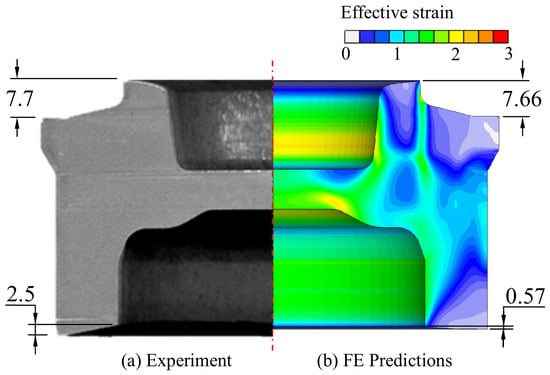
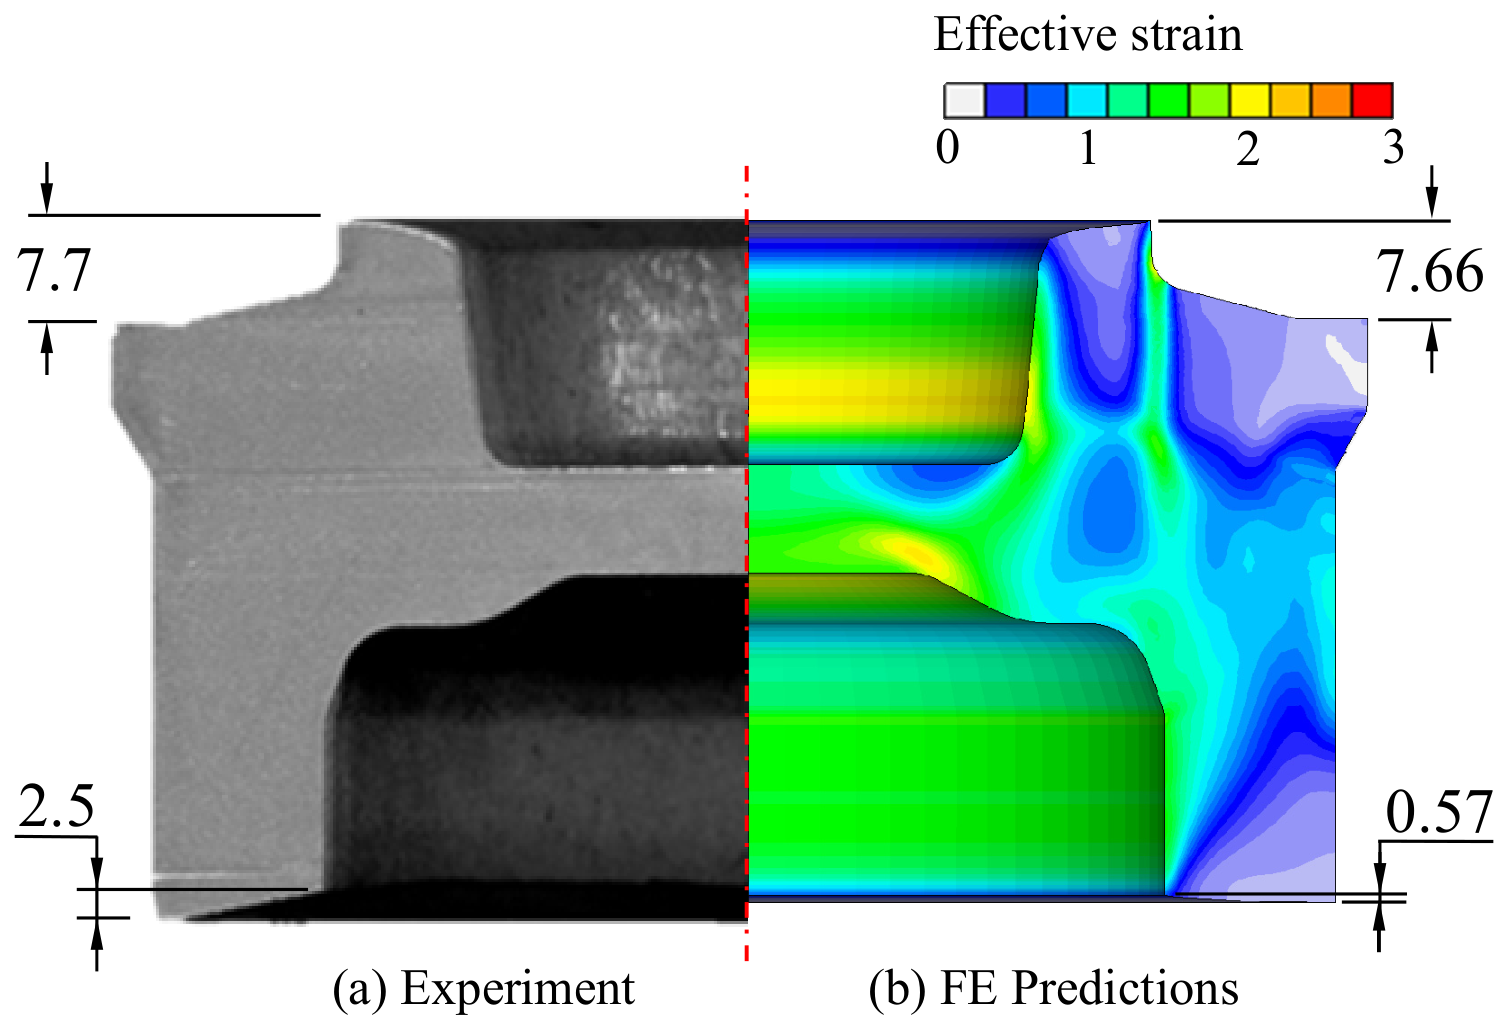
Figure 6 compares the FE prediction of the best case with the experiment, focusing on the deformed shape characterized by the parameters G and L, revealing that the FE prediction reflects the experiment well as a whole, even though the frictionless condition is unrealistic. However, there is a distinct difference in the parameters G and L between the best FE predictions and experiments. Under the assumption that the EP-CFTM flow curve in Figure 2 may be acceptable, this difference indicates that the assumed constant friction coefficient or friction factor was significantly inaccurate for this test process.
Figure 6.
Comparison of the experiments and the FE predictions obtained using the best constant friction condition (), focusing on the parameters G and L.
3. Optimization of Tribological Conditions and Flow Curve for the Forward and Backward Extrusion Process
3.1. Optimizing Only the Tribological Condition Using the Initial Flow Curve
A few researchers [7,25,27,28,29,30,31] revealed that the friction coefficient in the law of Coulomb friction varies considerably with the friction conditions due to the lubrication regime change [22], particularly in the metal forming of a low strain-hardening material. The varying friction coefficient should thus be used to resolve the clear discrepancy in the deformed shape between the experiment and FE prediction of the test process. Following the previous studies on cold or hot forging of aluminum alloys [29,30], the modified Coulomb friction law was employed in this study. The friction coefficient in this law was formulated as a function of effective strain at the material–die interface, called the friction coefficient function (FCF), denoted as as follows:
where , called the fixed friction constant, is fixed at 0.01 and is the friction weighting function (FWF) formulated as a piecewise linear function of the effective strain of the materials at the interface between the die and material.
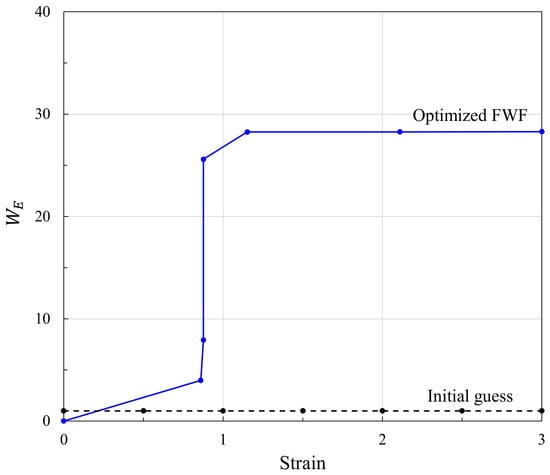
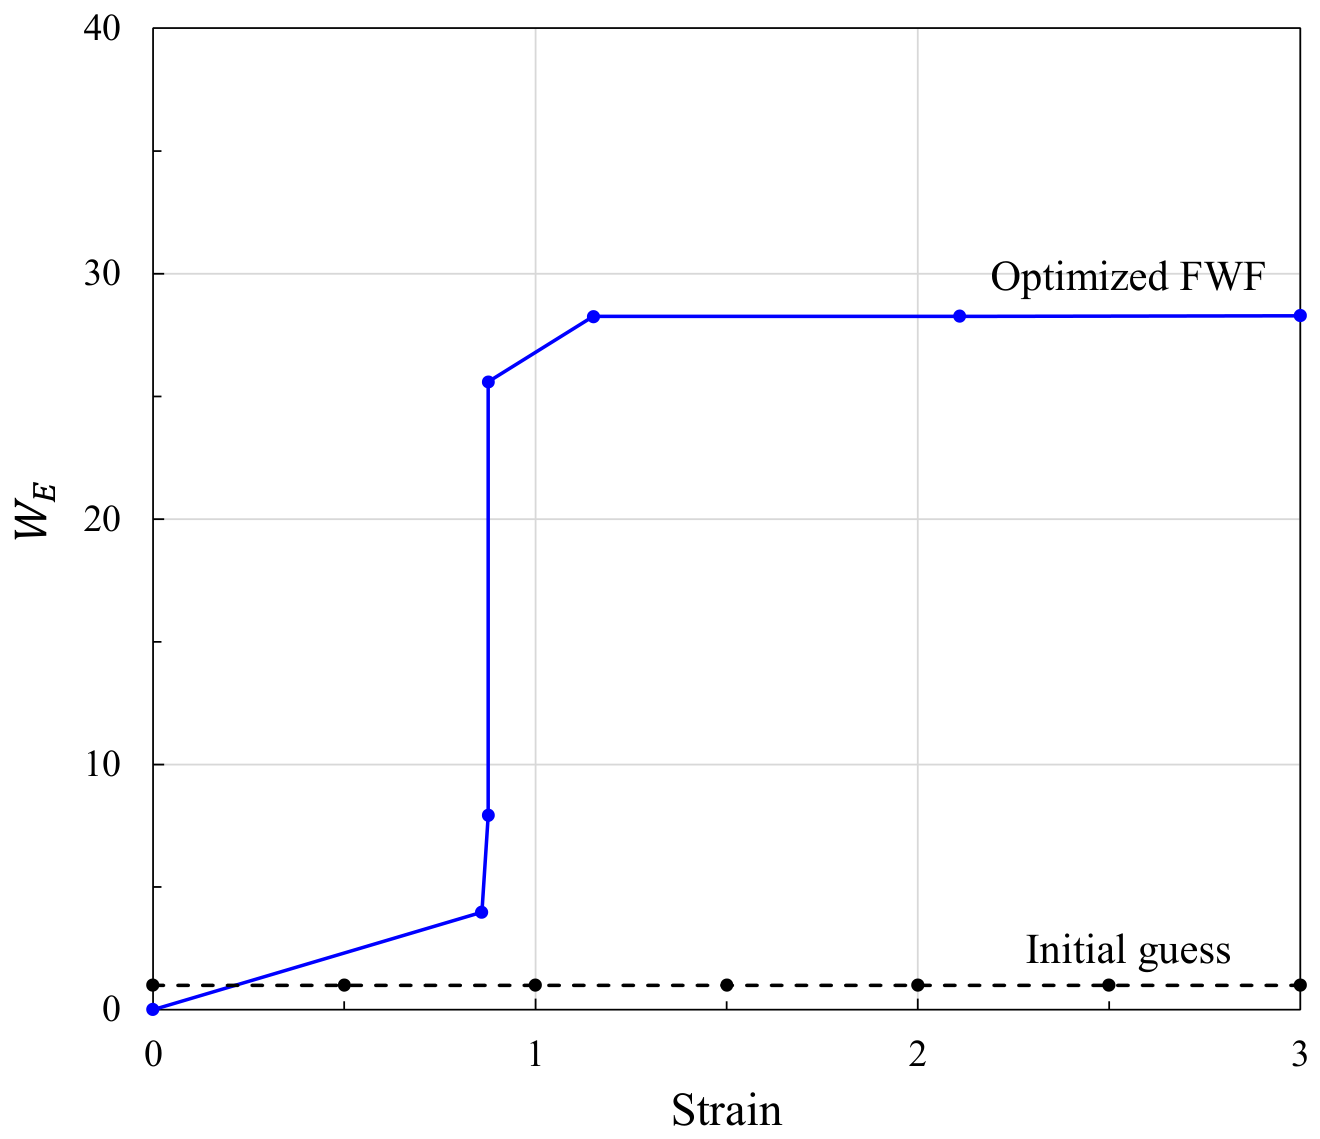
The FWF, which is to be optimally determined, is constructed from the line segments connecting the sample points of the effective strains (denoted as ) and friction weights (denoted as ), which belong to the set of design parameters. For example, in Figure 7, there are two FWFs described by seven sample points. One is the initial FWF, and the other is the optimized FWF (see Figure 7). The FWF’s initial sample points are (0.0, 1.0), (0.5, 1.0), (1.0, 1.0), (1.5, 1.0), (2.0, 1.0), (2.5, 1.0), and (3.0, 1.0). The design parameters of the friction condition optimization problem thus include and .
Figure 7.
Initial guess and optimized FWF.
The objective function was formulated as follows:
where = 2.5 mm and = 7.7 mm are the experimental values of L and G, respectively. The objective function represents the average relative error of the FE-predicted values of L and G relative to their experimental values. The weight of 1/2 used in Equation (4) means that the two dimensions are treated equally. However, in practical design, this weight can vary depending on the importance of the two dimensions or their tolerances.
Here, we conducted the optimization of only the friction condition using the fixed flow function in terms of the objective function of Equation (4). Table 1 summarizes the constraints on the design parameters depending on the upper bounds of the friction weight. The initial FWF, which differs considerably from the optimized FWF, is shown in Figure 7 and was deliberately selected to demonstrate the convergence performance.
Table 1.
Constraints and initial guesses of the design variables.
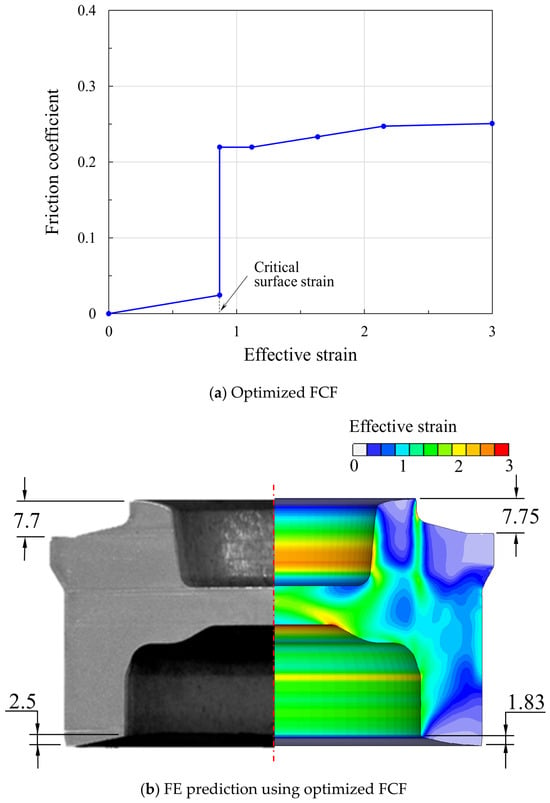
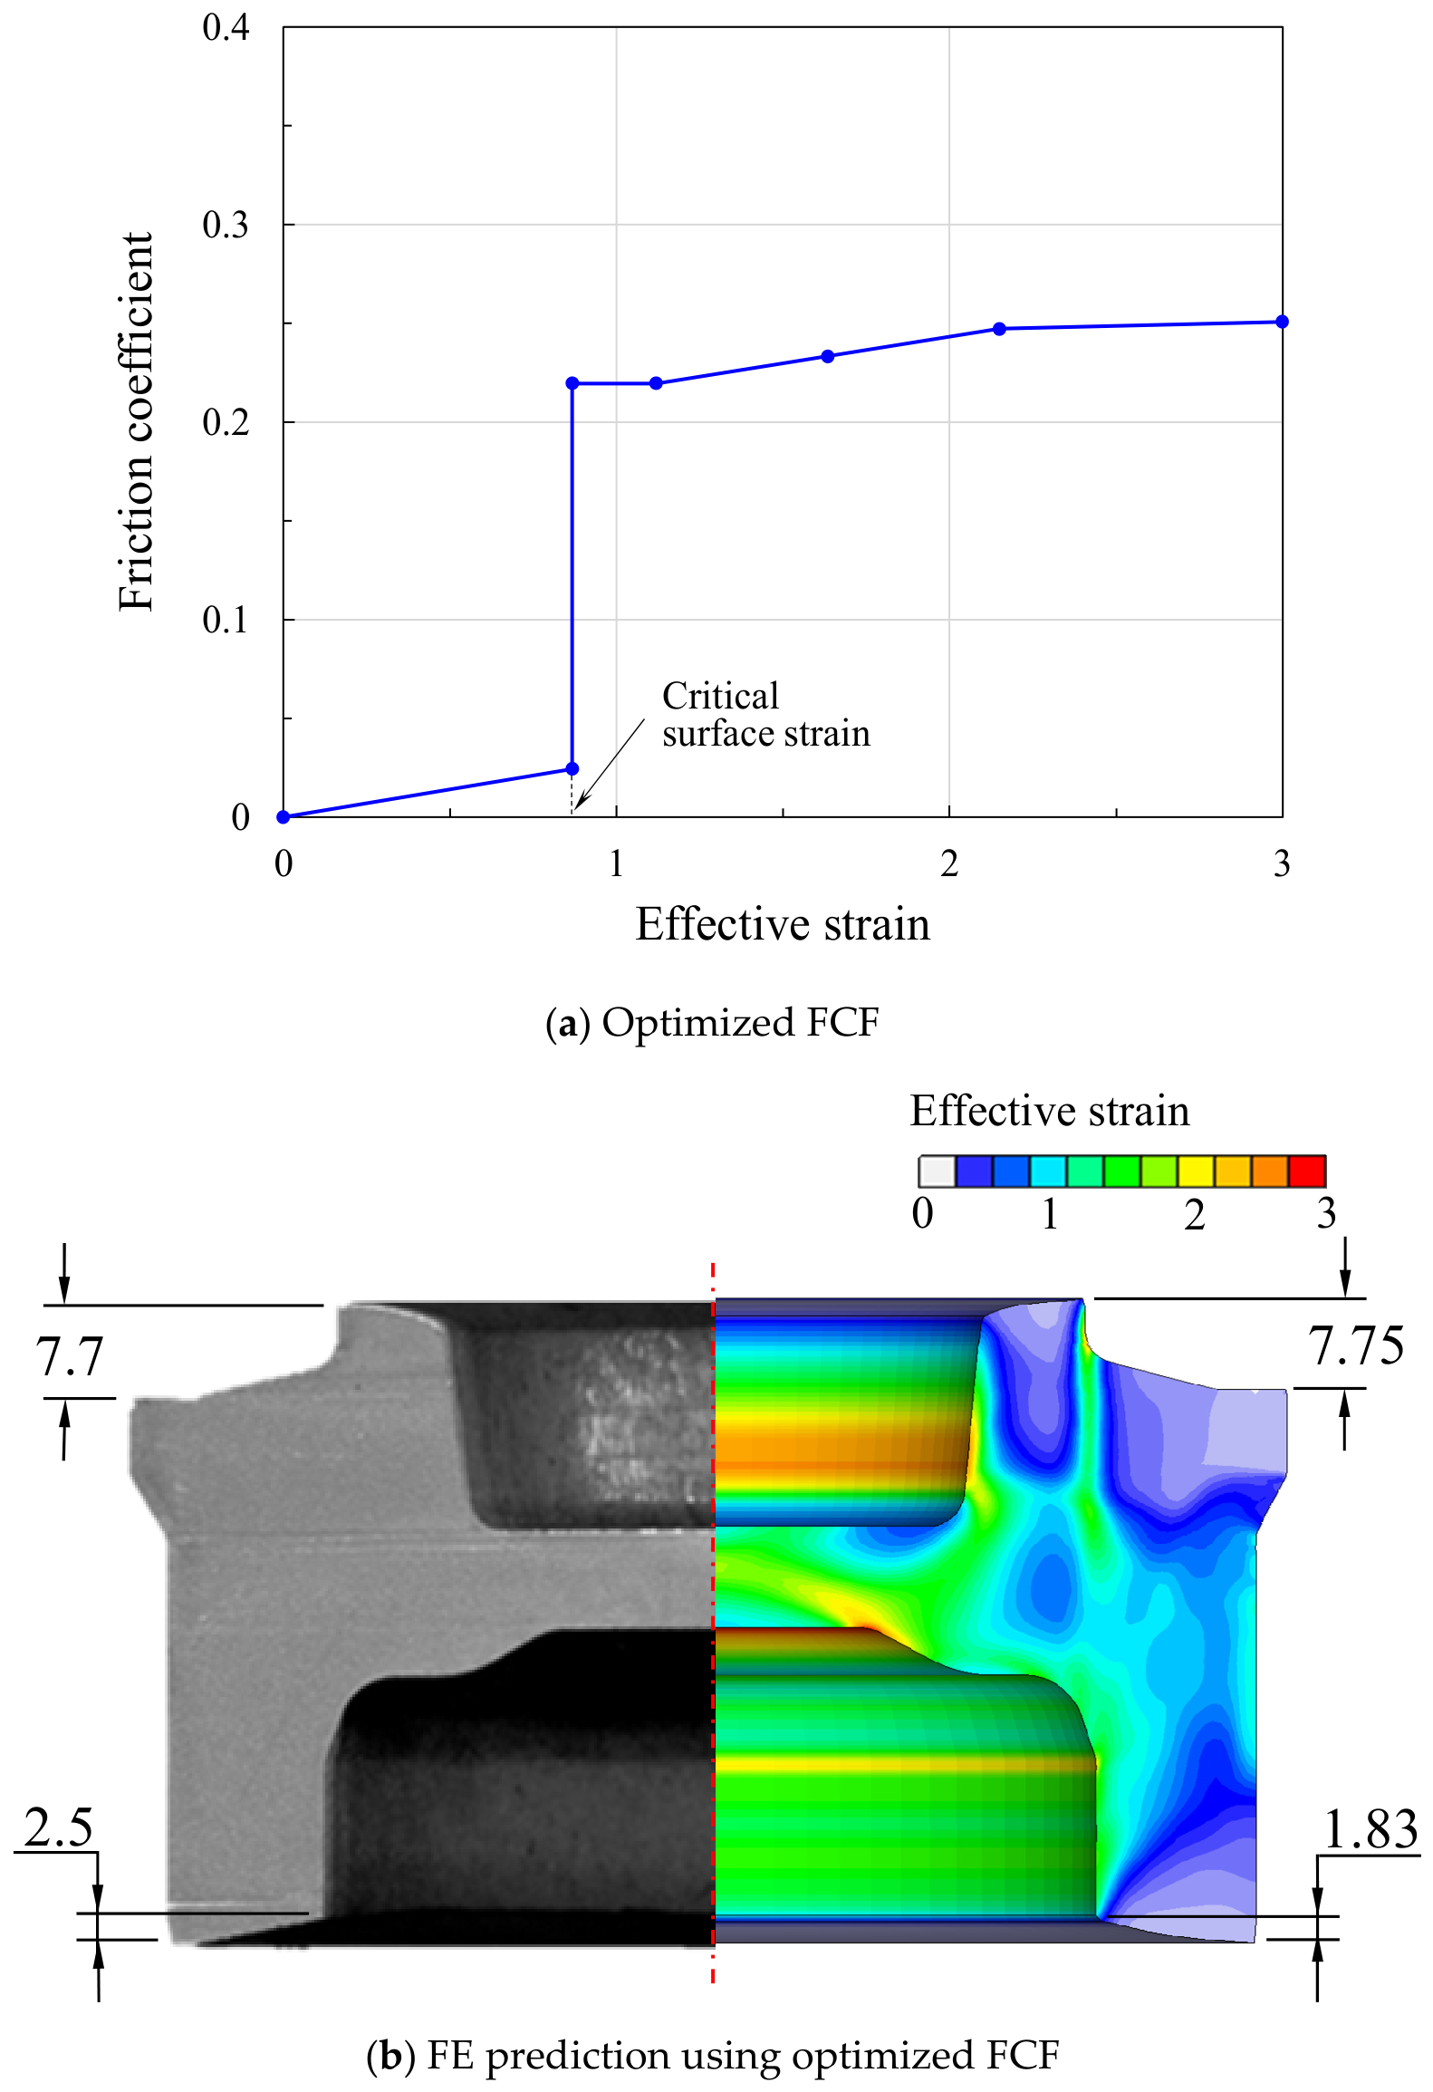
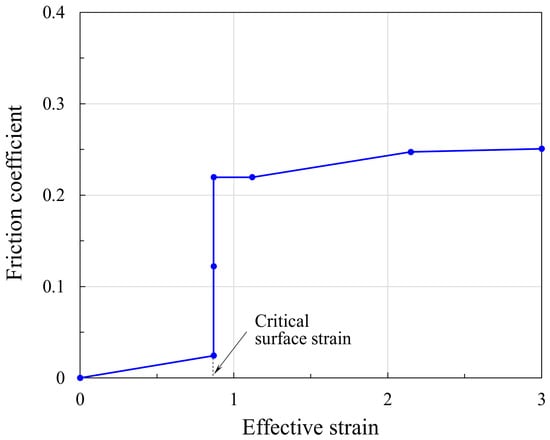
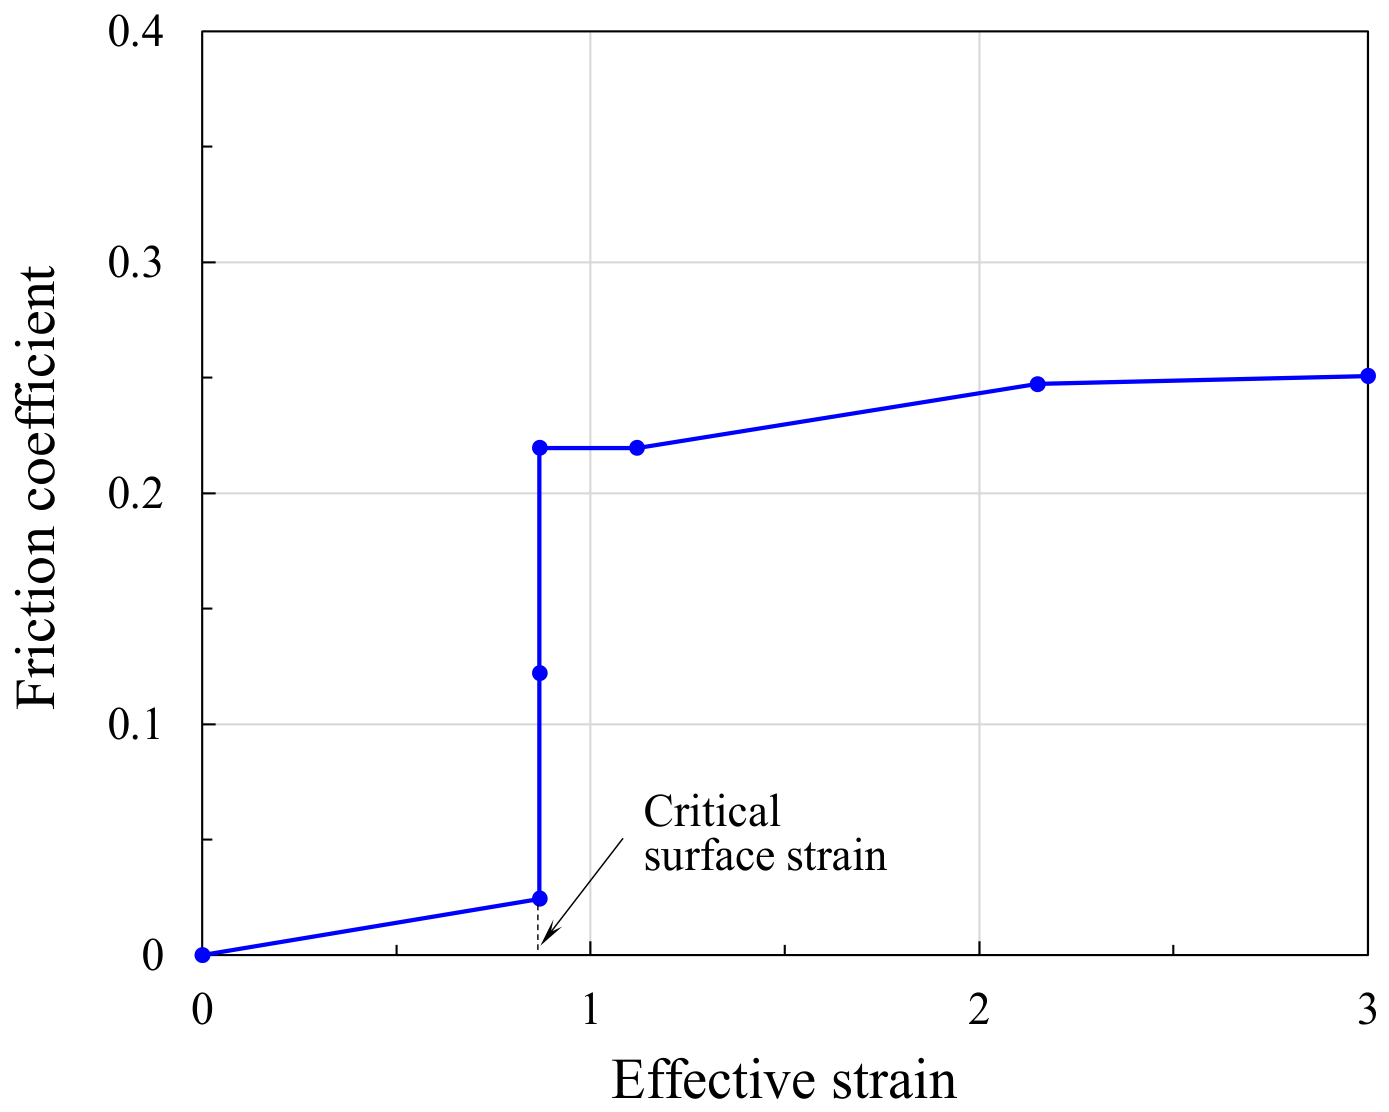
For friction condition optimization, AFDEX (Altair APA) and HyperSTUDY were employed for implicit elastoplastic finite element analysis of the process and the process design optimization, respectively. After 200 design iterations, the optimized tribological condition was achieved. The optimized FCF, i.e., the optimized FWF multiplied by the fixed friction constant , is shown in Figure 8a, exhibiting a typical lubrication regime change phenomenon, i.e., the drastic change in the friction coefficient near the effective strain of 0.8. The comparison of the optimized prediction with the experiment in Table 2 and Figure 8b shows that the G-value is acceptable, whereas the predicted tilt of the bottom side is still unsatisfactory compared with the experiment.
Figure 8.
Results of optimization through the fine search using the EP-flow curve geometrically extrapolated.
Table 2.
Results of the optimization with the assumed flow curve in Figure 2.
Notably, Figure 8a,b show the optimized FCF and its corresponding optimized deformation of the material predicted with the assumed extrapolated flow function. It should be emphasized here that the optimization formulation and FE simulation conditions are general, except for the flow function.
3.2. Optimizing Both the Tribological Condition and Flow Curve at Once
According to Lee et al. [29] and Hamid et al. [30], the low strain-hardening capability is an important factor affecting plastic deformation during the hot and cold forging processes of aluminum alloys, respectively. As shown in Figure 2, the strain softening behavior of the A6061 alloy is obvious at room temperature. Empirically, if there is no strain softening phenomenon, the highly inclined deformation shape on the bottom-left side of the experiment in Figure 8b cannot be predicted under any friction conditions.
The problem is that, as seen on the right side of Figure 8b, the effective strain of the material in the main deformation region exceeds the limit effective strain of 0.84 up to which reliable flow information can be acquired from the cylindrical tensile test. For this reason, the flow function for effective strains greater than the limit effective strain used in the previous subsection was assumed to be a straight line with the same slope based on the flow curve near the limit effective strain. A more flexible function with more unknown variables can be selected. However, for simplicity and computational efficiency, here, we selected the line function for the flow stress after the limit effective strain. To improve the prediction of the deformation shape, we need to find an appropriate flow function after the limit effective strain. In other words, we have to determine the flow stress at the fixed effective strain of 3.0.
Therefore, the friction condition and flow function (after the limit effective strain) that minimize the objective function were obtained simultaneously through optimization. After the limit effective strain, the flow function was also assumed to be a straight line; however, it was unfixed and unknown. The effective stress of the sample flow point at the fixed effective strain of 3 was thus added as a design parameter to the new optimization problem.
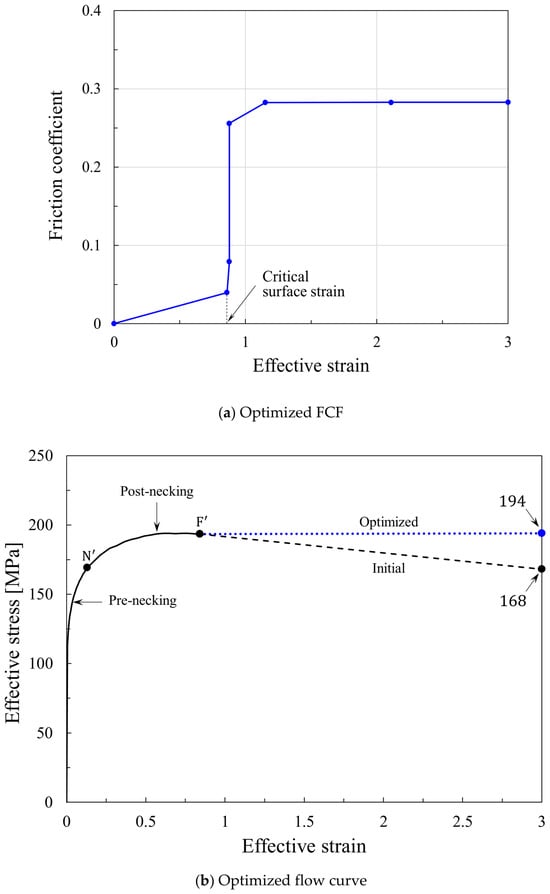
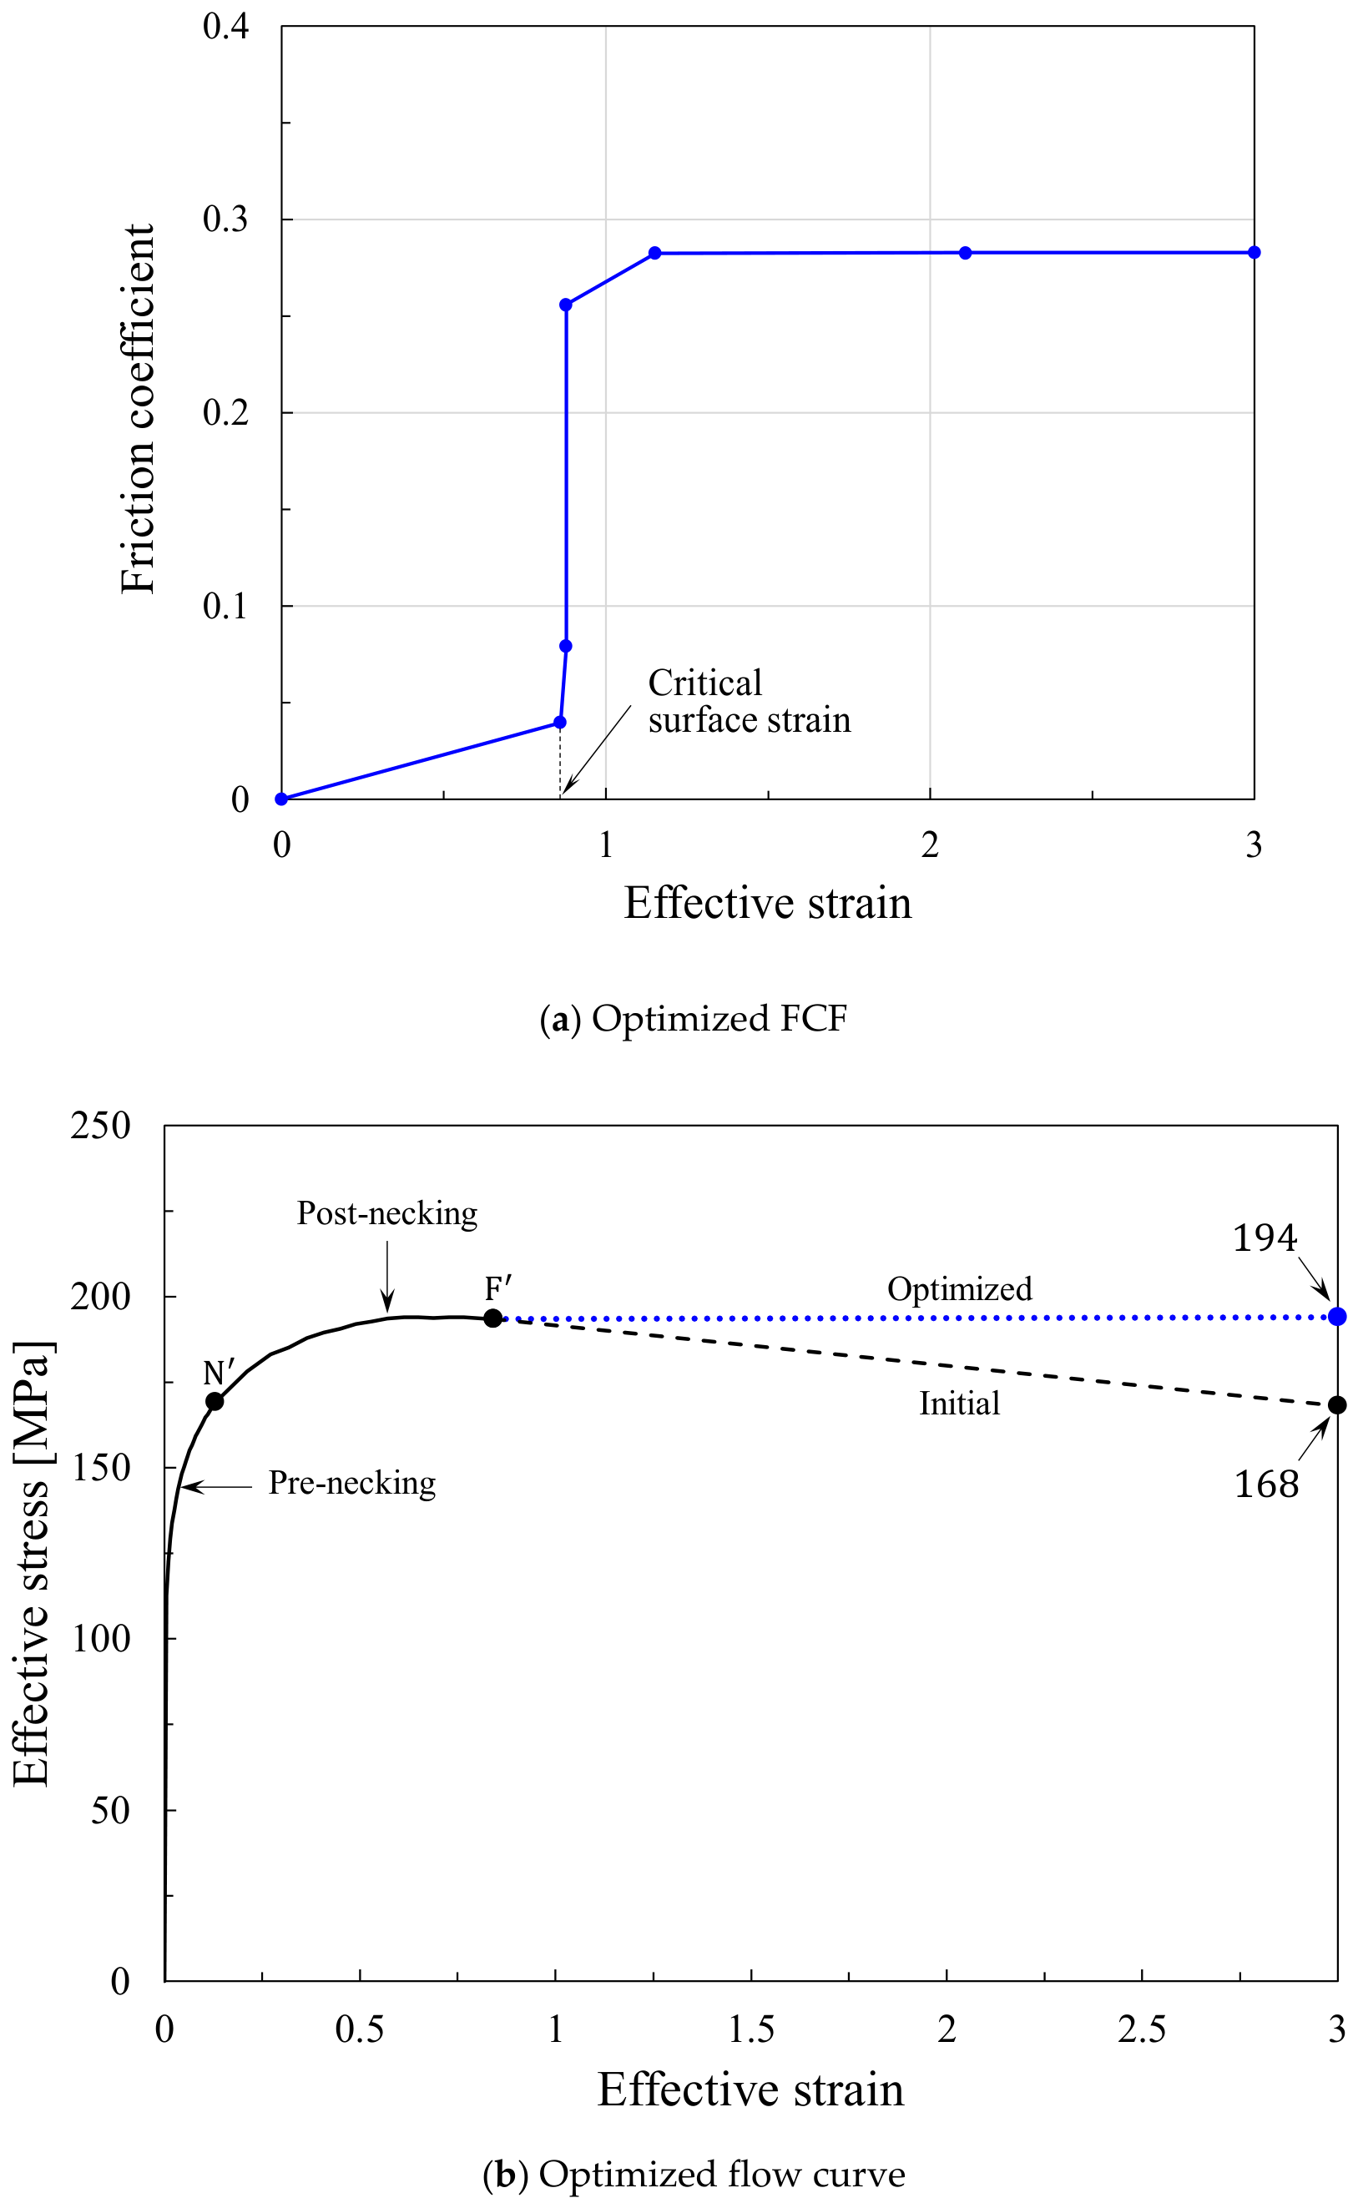
The previously optimized FCF in Figure 9, with the sample points slightly replaced, was used as the initial FCF for this optimization problem. A flow stress of 168 MPa at the last sample point was set as the initial guess for the new design parameter. This value was employed as the fixed, assumed flow stress at the effective strain of 3 in the previous subsection. The objective function in Equation (4) was used. The design constraints and initial guesses are presented in Table 3.
Figure 9.
The initial FCF.
Table 3.
Design variables, constraints, and initial guesses.
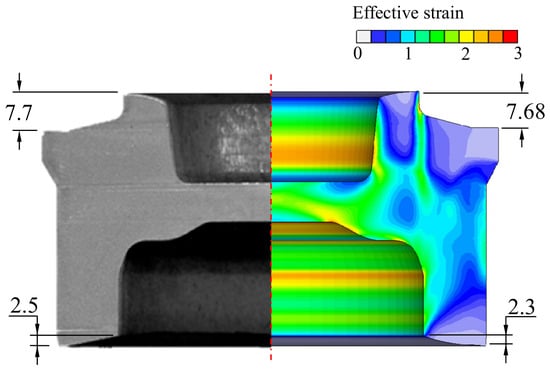
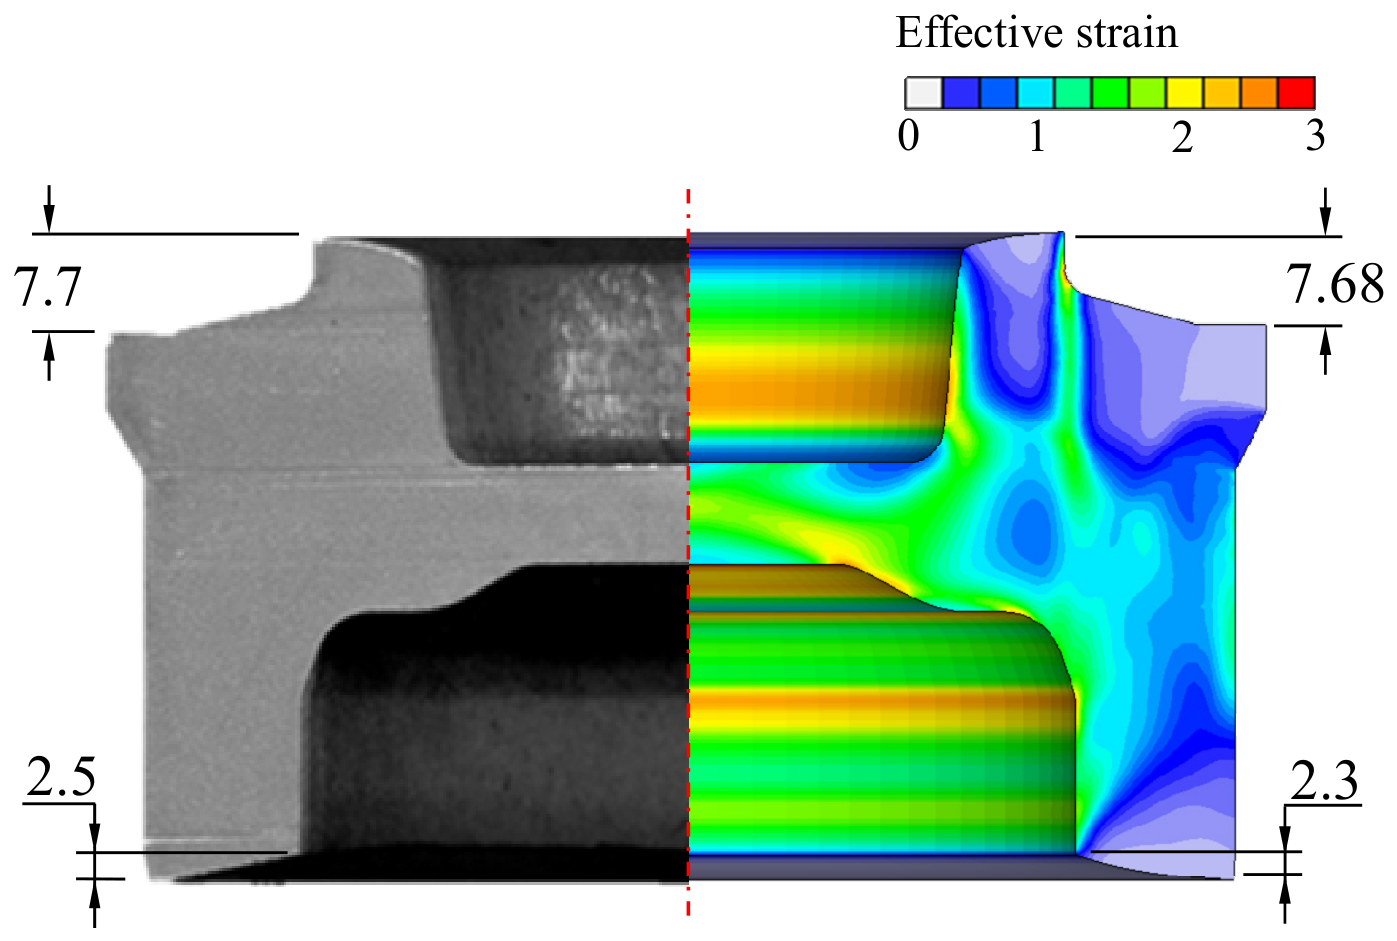
Figure 10a and Figure 10b show the optimized FCF and flow function, respectively. The FCF in Figure 10a is not significantly different from the initial FCF in Figure 9. The optimized flow stress at the effective strain of 3 is MPa. A comparison of the optimized FE prediction with the experiment is shown in Figure 11. The simultaneously optimized friction condition and flow function predicted 2.3 mm for L and 7.68 mm for G, which are more acceptable than the previous result in Figure 8b. The average relative error was reduced from 14% to 4% by the simultaneous optimization of the friction condition and flow function.
Figure 10.
Optimized FCF and flow curve derived from coupled optimization.
Figure 11.
Comparison of coupled optimization with experiment.
Understanding the flow behaviors at high strains is very important for material processing. The flow behaviors can be revealed up to relatively large strains through tensile tests [45,51]. Joun et al. obtained the flow stress at an effective strain of 1.6 for SCM435 [46]. Hering et al. [52] obtained the flow stress up to an effective strain of 1.7 through a combination of extrusion and tensile testing. Various methods have been studied to obtain flow stress at large strains by linking the finite element method with experimental auxiliary devices such as DIC, but they do not solve the fundamental problem. Therefore, most researchers have no choice but to ignore this problem or use an appropriate extrapolated flow function. From this perspective, the optimal determination of the flow function linked to the friction condition is important.
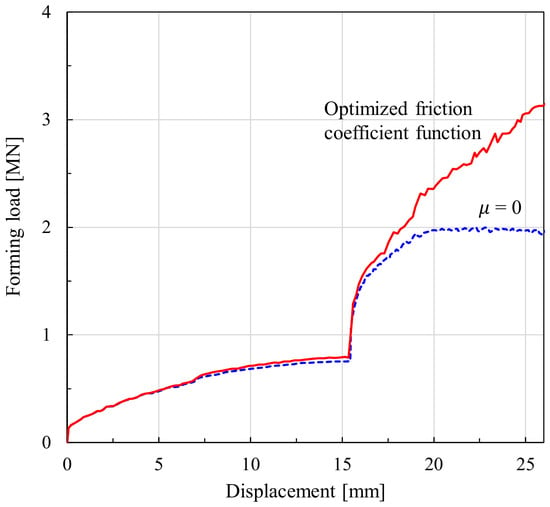
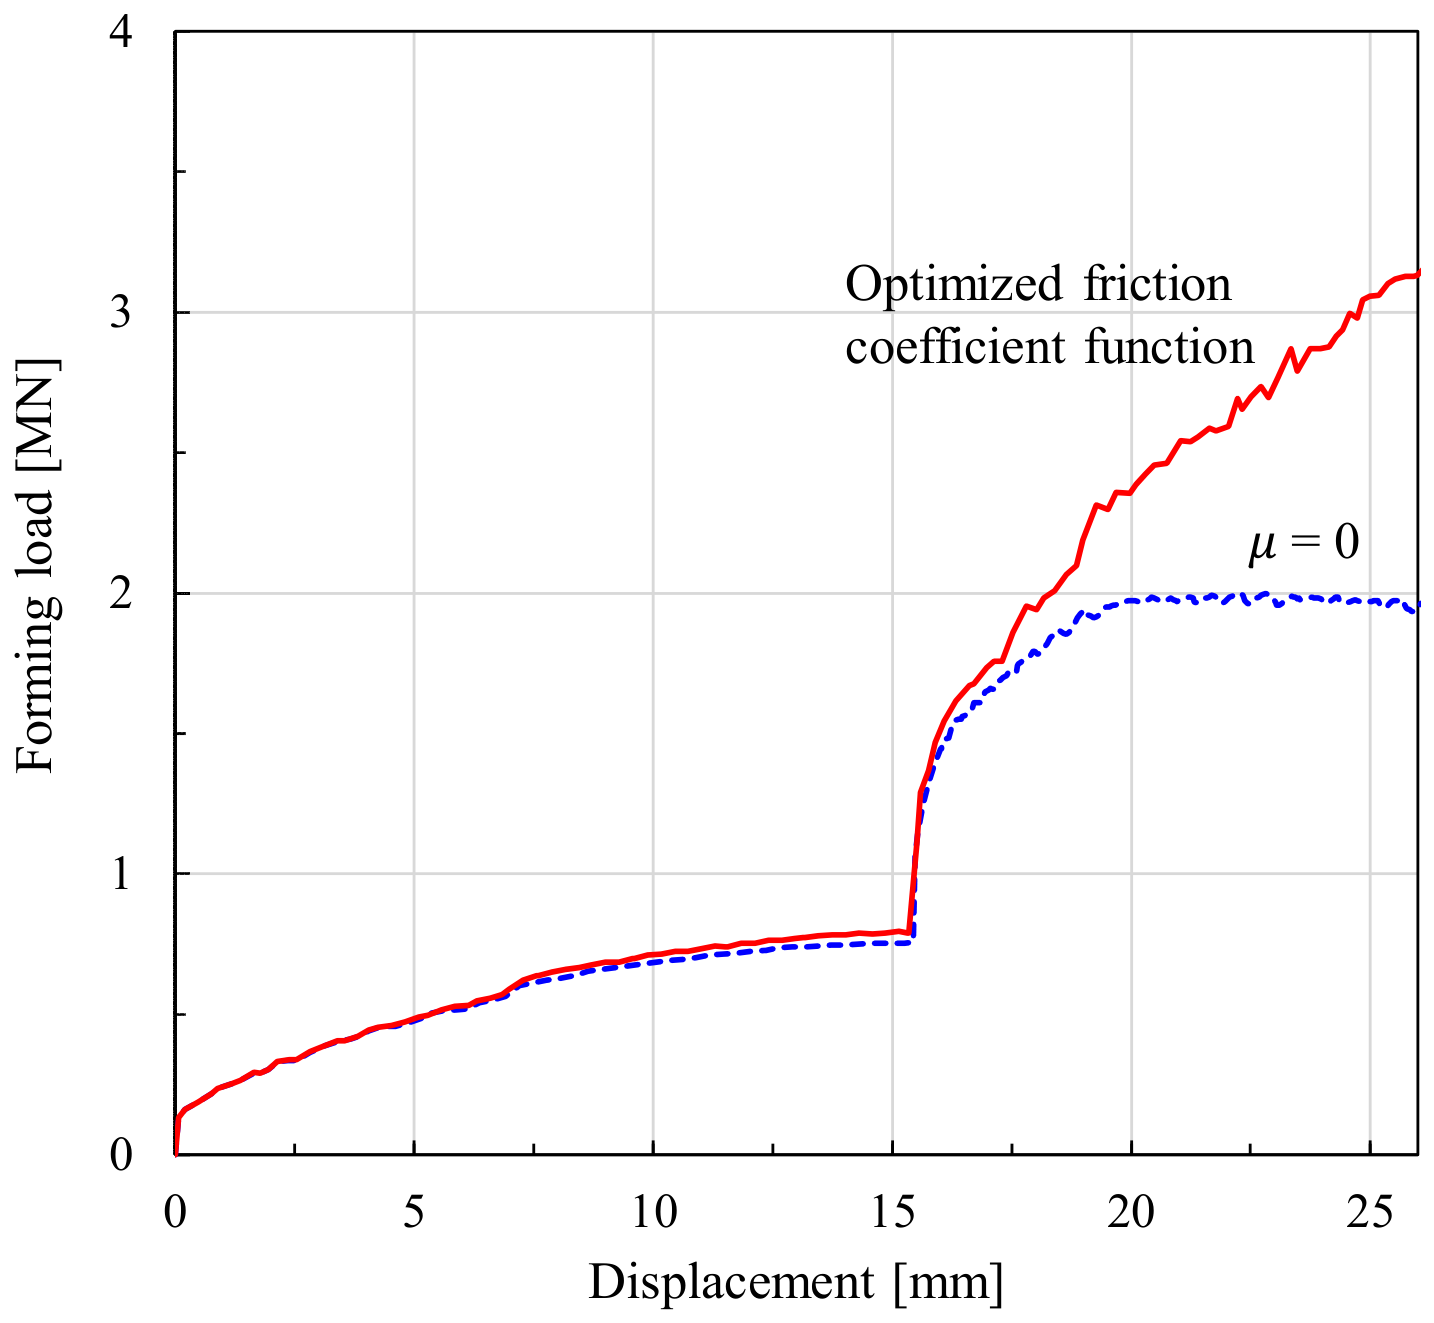
Figure 12 compares the displacement-forming loads for the frictionless condition (the best case in terms of the L-value for the conventional Coulomb friction) and the optimal friction coefficient function. The two displacement-forming load curves clearly highlight that the two processes are different. In other words, when the material’s strain-hardening capability is weak, these results suggest that friction dominates plastic deformation during metal forming.
Figure 12.
Comparison of displacement-forming load curves between the optimized friction coefficient function (solid line) and the frictionless case (dashed line).
4. Conclusions
A technique for the simultaneous optimization of the FCF and flow function in the forward and backward extrusion process of an aluminum alloy, which is greatly affected by friction due to the strain softening phenomenon, was presented. This technique consists of two steps: a coarse search and a fine search for design optimization.
In the coarse search, the FCF is determined by using the flow curve that provides accurate predictions up to the limit effective strain of the tensile test. The flow curve at strains larger than the limit effective strain is extrapolated considering its C1-continuity at the limit effective strain point. In contrast, in the fine search, the near-optimal FCF determined by the coarse search and the extrapolated flow function were used as initial guesses, and a sample flow point on the flow curve at the maximum allowable strain was included in the set of design parameters so that the FCF and the flow function could be optimized simultaneously.
The presented approach was applied to the cold forward and backward extrusion process of an aluminum alloy, and the optimal FCF and flow function were obtained in a stable manner. The finite element analysis using the obtained information predicted the key geometric dimensions of the experimental results with satisfactory accuracy. The main results are summarized as follows:
- In the metal-forming process of the test example, the Coulomb friction law with a constant friction coefficient or the constant shear friction law with a constant friction factor could not express the actual phenomenon globally and locally. The major reason lies in the lubrication regime change during the bulk metal-forming process.
- The flow curve that accurately represents the tensile test and the flow curve extrapolated from it, considering the C1-continuity for effective strains larger than the limit effective strain of the tensile test, could not be used to obtain an FCF that can express the unique plastic deformation phenomenon occurring in the metal-forming process of the test example.
- On the other hand, an accurate deformation shape could be predicted by the simultaneously optimized FCF and flow function. The optimal FCF for the test example showed a typical lubrication regime change phenomenon. That is, the friction coefficient increased rapidly when the surface strain reached around 0.8. It was also shown that the aluminum alloy exhibits perfectly plastic behavior after the limit effective strain.
This study showed the practical possibility of simultaneously obtaining not only the optimized FCF but also the optimized flow function above the limit effective strain of the tensile test, which are longstanding problems in both industry and academia. It was shown that the cold forward and backward extrusion process is useful for simultaneously obtaining not only the optimized FCF but also the optimized flow function above the limit effective strain of the tensile test.
Author Contributions
Conceptualization, M.S.J. and M.C.K.; methodology, Y.H. and M.C.K.; software, Y.H., H.K.M., M.C.K. and M.S.J.; validation, Y.H. and M.S.J.; formal analysis, Y.H., H.K.M., M.C.K.; investigation, Y.H.; resources, H.K.M.; data curation, Y.H. and M.C.K.; writing—original draft preparation, Y.H. and M.S.J.; writing—review and editing, M.S.J.; visualization, Y.H.; supervision, M.S.J.; project administration, M.S.J.; funding acquisition, M.S.J. All authors have read and agreed to the published version of the manuscript.
Funding
This work was supported by the Technology Development Program (RS-2024-00446241) funded by the Ministry of SMEs and Startups (MSS, Korea) and by the “Gyeongsangnam-do Regional Innovation System & Education (RISE)” Project, supported by the Ministry of Education and Gyeongsangnam-do. This research was also funded partially by the Research Sabbatical Grant for Research Professors from Gyeongsang National University in 2026, GNU-SGRP-0006.
Data Availability Statement
The original contributions presented in this study are included in the article. Further inquiries can be directed to the corresponding author.
Conflicts of Interest
Ho Keun Moon and Min Cheol Kim were employed by MFRC, Research and Development Center, Jinju 52818, Republic of Korea. The remaining authors declare that the research was conducted in the absence of any commercial or financial relationships that could be construed as a potential conflict of interest.
References
- Ebrahimi, R.; Najafizadeh, A. A new method for evaluation of friction in bulk metal forming. J. Mater. Process. Technol. 2004, 152, 136–143. [Google Scholar] [CrossRef] [Scilit]
- Joun, M.S.; Moon, H.G.; Choi, I.S.; Lee, M.C.; Jun, B.Y. Effects of friction laws on metal forming processes. Tribol. Int. 2009, 42, 311–319. [Google Scholar] [CrossRef] [Scilit]
- Zhang, D.; Yang, G.; Zhao, S. Frictional behavior during cold ring compression process of aluminum alloy 5052. Chin. J. Aeronaut. 2021, 34, 47–64. [Google Scholar] [CrossRef] [Scilit]
- Razali, M.K.; Kim, S.W.; Irani, M.; Kim, M.C.; Joun, M.S. Practical quantification of the effects of flow stress, friction, microstructural properties, and the tribological environment on macro- and micro-structure formation during hot forging. Tribol. Int. 2021, 164, 107226. [Google Scholar] [CrossRef] [Scilit]
- Alexandrov, S.; Jeng, Y.R.; Kuo, C.Y.; Chen, C.Y. Towards the theoretical/experimental description of the evolution of material properties at frictional interfaces in metal forming processes. Tribol. Int. 2022, 171, 107518. [Google Scholar] [CrossRef] [Scilit]
- Scherge, M.; Shakhvorostov, D.; Pöhlmann, K. Fundamental wear mechanism of metals. Wear 2003, 255, 395–400. [Google Scholar] [CrossRef] [Scilit]
- Pruncu, C.I.; Pham, T.T.; Dubois, A.; Dubar, M.; Dubar, L. Morphology of surface integrity as effect of cold forging of aluminum alloy. Tribol. Trans. 2018, 61, 632–639. [Google Scholar] [CrossRef] [Scilit]
- Domitner, J.; Silvayeh, Z.; Shafiee Sabet, A.; Öksüz, K.; Pelcastre, L.; Hardell, J. Characterization of wear and friction between tool steel and aluminum alloys in sheet forming at room temperature. J. Manuf. Process. 2021, 64, 774–784. [Google Scholar] [CrossRef] [Scilit]
- Devenport, T.M.; Griffin, J.M.; Rolfe, B.F.; Pereir, M.P. Friction and wear in stages of galling for sheet metal forming applications. Lubricants 2023, 11, 288. [Google Scholar] [CrossRef] [Scilit]
- Ray, N. The state of the art in cold forging lubrication. J. Mater. Process. Technol. 1994, 46, 19–40. [Google Scholar] [CrossRef] [Scilit]
- Kuhlman, G.W. Forging of aluminum alloys. In ASM Handbook: Bulk Metal Forming; Semiatin, S.L., Ed.; ASM International: Novelty, OH, USA, 2005; Volume 14, pp. 299–312. [Google Scholar] [CrossRef] [Scilit]
- Tan, X.; Martins, P.A.F.; Baya, N.; Zhang, W. Friction studies at different normal pressures with alternative ring-compression tests. J. Mater. Process. Technol. 1998, 80–81, 292–297. [Google Scholar] [CrossRef] [Scilit]
- Robinson, T.; Ou, H.; Armstrong, C.G. Study on ring compression test using physical modelling. J. Mater. Process. Technol. 2004, 153–154, 54–59. [Google Scholar] [CrossRef] [Scilit]
- Podgornik, B.; Hogmark, S.; Pezdirnik, J. Comparison between different test methods for evaluation of galling properties of surface engineered tool surfaces. Wear 2004, 257, 843–851. [Google Scholar] [CrossRef] [Scilit]
- Noh, J.H.; Min, K.H.; Hwang, B.B. Deformation characteristics at contact interface in ring compression. Tribol. Int. 2011, 44, 947–955. [Google Scholar] [CrossRef] [Scilit]
- Wang, Z.G.; Yoshikawa, Y.; Osakada, K. A new forming method of solid bosses on a cup made by deep drawing. CIRP Ann. 2013, 62, 291–294. [Google Scholar] [CrossRef] [Scilit]
- Kim, H.S.; Im, Y.T.; Geiger, M. Prediction of ductile fracture in cold forging of aluminum alloy. J. Manuf. Sci. Eng. 1999, 121, 336–344. [Google Scholar] [CrossRef] [Scilit]
- Matsumoto, R.; Hayashi, K.; Utsunomiya, H. Experimental and numerical analysis of friction in high aspect ratio combined forward-backward extrusion with retreat and advance pulse ram motion on a servo press. J. Mater. Process. Technol. 2014, 214, 936–944. [Google Scholar] [CrossRef] [Scilit]
- Hu, C.; Ding, T.; Ou, H.; Zhao, Z. Effect of tooling surface on friction conditions in cold forging of an aluminum alloy. Tribol. Int. 2019, 131, 353–362. [Google Scholar] [CrossRef] [Scilit]
- Yahaya, A.; Samion, S. Friction condition of aluminum alloy AA6061 lubricated with bio-lubricant in cold forging test. Ind. Lubr. Tribol. 2022, 74, 378–384. [Google Scholar] [CrossRef] [Scilit]
- Aiman, Y.; Syahrullail, S. Frictional and material deformation of aluminum alloy in cold forging test under different derivatives of palm oil lubrication condition. J. Braz. Soc. Mech. Sci. Eng. 2022, 44, 396. [Google Scholar] [CrossRef] [Scilit]
- Wilson, W.R.D. Friction and lubrication in bulk metal-forming processes. J. Appl. Metalwork. 1978, 1, 7–19. [Google Scholar] [CrossRef] [Scilit]
- Leu, D.K. A simple dry friction model for metal forming process. J. Mater. Process. Technol. 2009, 209, 2361–2368. [Google Scholar] [CrossRef] [Scilit]
- Hol, J.; Alfaro, M.V.C.; de Rooij, M.B.; Meinders, T. Advanced friction modeling for sheet metal forming. Wear 2012, 286–287, 66–78. [Google Scholar] [CrossRef] [Scilit]
- Hol, J.; Meinders, V.T.; de Rooij, M.B.; van den Boogaard, A.H. Multi-scale friction modeling for sheet metal forming: The boundary lubrication regime. Tribol. Int. 2015, 81, 112–128. [Google Scholar] [CrossRef] [Scilit]
- Wang, W.; Zhao, Y.; Wang, Z.; Hua, M.; Wei, X. A study on variable friction model in sheet metal forming with advanced high strength steels. Tribol. Int. 2016, 93, 17–28. [Google Scholar] [CrossRef] [Scilit]
- Westeneng, J.D. Modelling of Contact and Friction in Deep Drawing Processes. Ph.D. Thesis, University of Twente, Enschede, The Netherlands, 2001. Available online: https://research.utwente.nl/en/publications/modelling-of-contact-and-friction-in-deep-drawing-processes (accessed on 5 February 2023).
- Shisode, M.; Hazrati, J.; Mishra, T.; de Rooij, M.; ten Horn, C.; van Beeck, J.; van den Boogaard, T. Modeling boundary friction of coated sheets in sheet metal forming. Tribol. Int. 2021, 153, 106554. [Google Scholar] [CrossRef] [Scilit]
- Lee, S.W.; Lee, J.M.; Joun, M.S. On critical surface strain during hot forging of lubricated aluminum alloy. Tribol. Int. 2020, 141, 105855. [Google Scholar] [CrossRef] [Scilit]
- Abd Hamid, N.; Kim, K.M.; Hwang, T.M.; Choi, J.M.; Joun, M.S. Tribological shifting phenomena during automatic multistage cold forging of an automotive Al6082-T6 steering yoke. J. Manuf. Process. 2024, 114, 178–195. [Google Scholar] [CrossRef] [Scilit]
- Heo, Y.; Kim, N.Y.; Nam, J.W.; Chung, I.G.; Joun, M.S. Friction heat ball in round-to-half circle drawing and its effect on the material’s skin shearing. Tribol. Int. 2024, 197, 109755. [Google Scholar] [CrossRef] [Scilit]
- Buschhausen, A.; Weinmann, K.; Lee, J.Y.; Altan, T. Evaluation of lubrication and friction in cold forging using a double backward-extrusion process. J. Mater. Process. Technol. 1992, 33, 95–108. [Google Scholar] [CrossRef] [Scilit]
- Jensrud, O.; Pedersen, K. Cold forging of high strength aluminum alloys and the development of new thermomechanical processing. J. Mater. Process. Technol. 1998, 80–81, 156–160. [Google Scholar] [CrossRef] [Scilit]
- Yoshimura, H.; Tanaka, K. Precision forging of aluminum and steel. J. Mater. Process. Technol. 2000, 98, 196–204. [Google Scholar] [CrossRef] [Scilit]
- Joun, M.S.; Lee, M.C.; Park, J.M. Finite element analysis of prestressed die set in cold forging. Int. J. Mach. Tools Manuf. 2002, 42, 1213–1222. [Google Scholar] [CrossRef] [Scilit]
- Szeliga, D.; Gawad, J.; Pietrzyk, M. Inverse analysis for identification of rheological and friction models in metal forming. Comput. Methods Appl. Mech. Eng. 2006, 195, 6778–6798. [Google Scholar] [CrossRef] [Scilit]
- Cho, H.; Ngalle, G.; Altan, T. Simultaneous determination of flow stress and interface friction by finite element based inverse analysis technique. CIRP Ann. 2003, 52, 221–224. [Google Scholar] [CrossRef] [Scilit]
- Kim, N.S.; Choi, H.S. The prediction of deformation behavior and interfacial friction under hot working conditions using inverse analysis. J. Mater. Process. Technol. 2008, 208, 211–221. [Google Scholar] [CrossRef] [Scilit]
- Müller, M.; Steinboeck, A.; Prinz, K.; Kugi, A. Optimal parameter identification for a hydrodynamic roll gap model in hot strip rolling. IFAC-PapersOnLine 2018, 51, 195–200. [Google Scholar] [CrossRef] [Scilit]
- Gavrus, A.; Francillette, H.; Pham, D.T. A two-step inverse analysis approach used to identify the mechanical properties of metallic materials subjected to large plastic strains. Applications to local investigations of surface layer’s behaviour. Ann. “Dunarea de Jos” Univ. Galati Fascicle IX Metall. Mater. Sci. 2013, 36, 14–20. Available online: https://www.gup.ugal.ro/ugaljournals/index.php/mms/article/view/2738 (accessed on 13 May 2023).
- Chen, L.; Yuan, C.; Wu, R.; Jiao, W.; Jiang, H.; Zhou, X. The parameter identification of physical-based constitutive model by inverse analysis method for application in near-net shape forging of aluminum wheels. Metals 2023, 13, 700. [Google Scholar] [CrossRef] [Scilit]
- Joun, M.S.; Lee, M.C.; Eom, J.G. Intelligent metal-forming simulation. Int. Manuf. Sci. Eng. Conf. 2011, 1, 161–168. [Google Scholar] [CrossRef] [Scilit]
- Altair Engineering Inc. HyperStudy User Manual; Altair Engineering Inc.: Troy, MI, USA, 2009; Available online: https://altairone.com/ (accessed on 20 January 2020).
- Kleijnen, J.P.C. Response surface methodology for constrained simulation optimization: An overview. Simul. Model. Pract. Theory 2008, 16, 50–64. [Google Scholar] [CrossRef] [Scilit]
- Joun, M.S.; Eom, J.G.; Lee, M.C. A new method for acquiring true stress-strain curves over a large range of strains using a tensile test and finite element method. Mech. Mater. 2008, 40, 589–593. [Google Scholar] [CrossRef] [Scilit]
- Eom, J.G.; Son, Y.H.; Jeong, S.W.; Ahn, S.T.; Jang, S.M.; Yoon, D.J.; Joun, M.S. Effect of strain hardening capability on plastic deformation behaviors of material during metal forming. Mater. Des. 2014, 54, 1010–1018. [Google Scholar] [CrossRef] [Scilit]
- Razali, N.A.; Chung, S.H.; Chung, W.J.; Joun, M.S. Implicit elastoplastic finite element analysis of tube-bending with an emphasis on springback prediction. Int. J. Adv. Manuf. Technol. 2022, 120, 6377–6391. [Google Scholar] [CrossRef] [Scilit]
- Kim, N.Y.; Kim, N.H.; Razali, M.K.; Lee, H.M.; Joun, M.S. Analytical and numerical evaluation of the relationship between elongation calibration function and cyber standard tensile tests for ductile materials. Mater. Des. 2025, 253, 113851. [Google Scholar] [CrossRef] [Scilit]
- Lee, C.H.; Kobayashi, S. New solutions to rigid-plastic deformation problems using a matrix method. ASME. J. Eng. Ind. 1973, 95, 865–873. [Google Scholar] [CrossRef] [Scilit]
- Jin, H.T.; Choi, S.D.; Joun, M.S. Experimental and numerical studies on cold forging of an aluminum auto part. Proc. KSTP Fall Conf. 2015, 2015, 109–112. (In Korean) [Google Scholar]
- Shin, H.; Kim, S.; Choi, M.K.; Ju, Y. Extraction of equivalent stress versus equivalent plastic strain curve of necking material in tensile test without assuming constitutive model. J. Eng. Mater. Technol. 2024, 146, 021007. [Google Scholar] [CrossRef] [Scilit]
- Hering, O.; Kolpak, F.; Tekkaya, A.E. Flow curves up to high strains considering load reversal and damage. Int. J. Mater. Form. 2019, 12, 955–972. [Google Scholar] [CrossRef] [Scilit]

Disclaimer/Publisher’s Note: The statements, opinions and data contained in all publications are solely those of the individual author(s) and contributor(s) and not of MDPI and/or the editor(s). MDPI and/or the editor(s) disclaim responsibility for any injury to people or property resulting from any ideas, methods, instructions or products referred to in the content. |
© 2026 by the authors. Licensee MDPI, Basel, Switzerland. This article is an open access article distributed under the terms and conditions of the Creative Commons Attribution (CC BY) license.