


Abstract
Components loaded in cyclic torsion are often also subjected to a static compressive stress, but whether this stress extends or shortens the fatigue life is not resolved. Double-cone specimens of the nickel-free, nitrogen-alloyed austenitic stainless steel P558 were tested under angle-controlled cyclic torsion at (rotation ranges of 5–20°, and 22.5° in one test) with a superimposed static compressive stress of 0, 250 or 350 MPa, and were characterised by SEM, electron backscatter diffraction (EBSD), Taylor factor and hysteresis-energy analysis. Compression more than doubled the fatigue life at 5° but reduced it by up to 64% at larger rotation ranges; at 20°/350 MPa the test was stopped by axial ratcheting after 244 cycles. A repeat test and two tests at reproduced the lives within a factor of 1.25. The grain orientation spread (GOS) of the pure-torsion specimens remained at the level of the untested material, although the specimens at 10° and 15° were cycled plastically, and compression did not change it at 5°. At 10–22.5°, compression raised GOS to 2.4–4.4°, four to seven times the pure-torsion value, in line with the accumulated axial ratcheting strain (7–18%) rather than with the cyclic shear amplitude or the equivalent stress. The change in life followed the maximum principal stress: at 5°, compression lowered it by up to 47%, whereas at larger rotation ranges the compression-induced increase in the stabilised shear stress raised it by up to 79%. Whether superimposed compression is beneficial or detrimental therefore depends on the rotation range.
1. Introduction
Many load-bearing components are twisted cyclically while being held under axial compression: drive shafts and preloaded fasteners, axially pre-stressed tube and torsion springs, rolling-contact components loaded in combined compression and torsion, and orthopaedic fixation devices such as bone screws and intramedullary nails, which are loaded in torsion and compression both during insertion and in service. Nickel-free, nitrogen-alloyed austenitic stainless steels such as P558 were developed for the last of these applications [1]. For all such components, the designer needs to know whether the superimposed compression extends or shortens the torsional fatigue life, and for which loading amplitudes.
Design guidance on this question is inconsistent, and the outcome is generally regarded as context dependent [2,3,4,5]. Classical crack-closure reasoning says compression should always help, by holding a growing crack shut for a larger fraction of each cycle [6]. Yet reported outcomes for nominally similar torsion-plus-compression experiments range from a substantial improvement in life [5,7,8] to a marked reduction [9]; in a high-interstitial austenitic steel, raising the static compressive stress from 250 to 350 MPa shortened the life at the same rotation angle, e.g., from about 345,000 to 200,000 cycles at 7.5° [10], and the two outcomes can appear within a single test matrix once the strain amplitude [11] or, as shown in the present work, the twist angle is varied. This suggests that superimposed compression triggers at least two competing mechanisms, one operating at the scale of a growing crack [12] and the other at the scale of the grain [13,14], and that which mechanism dominates depends on how much cyclic shear plasticity is present.
At the crack-tip scale, a superimposed compressive stress reduces the effective normal stress acting on the plane a fatigue crack would otherwise open along, delaying crack opening and slowing early propagation [15,16]. This mechanism is well supported experimentally: torsion-plus-compression tests on aluminium alloys and copper- and beryllium-bearing alloys have reported increased low-cycle fatigue life under compressive stresses of several hundred megapascals [7], and comparable superimposed-compression tests on 304L and other stainless steels have reported life improvements ranging from roughly two-fold to more than an order of magnitude [17,18]. Taken in isolation, this body of evidence would suggest that compression is unambiguously protective.
At the grain scale, however, the same compressive stress raises the resolved shear stress available to drive slip, and can activate additional slip systems, particularly cross-slip and multiple-shear-system activity, thereby increasing the local density of geometrically necessary dislocations (GNDs) and the associated lattice rotation [13,14]. Where this second mechanism dominates, superimposed compression should accelerate, not delay, fatigue damage, because it feeds additional plastic strain into the material on every cycle rather than simply closing an existing crack. Evidence for this reversal exists as well: a static compressive stress superimposed on torsion in an aluminium alloy has been reported as beneficial at low strain amplitude but detrimental once the strain amplitude increased [8], and torsion combined with high contact pressure in bearing steels has been shown to reduce, rather than extend, high-cycle fatigue life [9]. Both mechanisms can act in the same test. Their relative weight is expected to depend on the amount of cyclic shear plasticity, which in the present work is set by the twist angle.
What is largely missing from this literature is direct crystallographic evidence for the grain-scale mechanism: studies of superimposed static or contact stress on multiaxial fatigue life are, with few exceptions, mechanical in character, reporting cycles to failure without a corresponding measurement of local misorientation, slip-system activation or dislocation density. Conversely, crystallographic studies of compressive deformation, whether in micropillars [14] or in slip-band interaction studies of stainless steels [13], are rarely connected to a fatigue-life outcome under multiaxial cyclic loading. Cyclic plastic deformation also dissipates heat at the slip bands that carry the fatigue damage [19], and the dissipated energy is an established marker of microstructural evolution [20,21]; in the present tests, it produced visible oxide tinting at the largest twist angles, which is used in Section 3.1 as a qualitative indicator of cyclic plastic dissipation.
Our earlier work on the high-nitrogen austenitic steel REX 734 (X4CrNiMoN21-9-4) under the same type of loading established the mechanical response (initial cyclic softening in shear, axial ratcheting increasing with rotation angle and compressive stress) and the crack morphology (axial surface cracks with branching) but without a pure-torsion baseline or crystallographic analysis [10]. A subsequent study on P558, using the same specimen geometry and test rig as the present work, focused on the constitutive modelling of three torsion–compression load cases with J2 and crystal-plasticity models, using three of the tests also evaluated here [22]. The present study adds three new elements: (i) a complete test matrix of four twist angles at three static compressive stresses, including a pure-torsion baseline, which spans the reversal from beneficial to detrimental compression; (ii) post mortem crystallographic (KAM, GOS, Taylor factor) and energy-dissipation measurements on the same specimens; and (iii) a stress analysis based on the measured stabilised stresses, which links the reversal to the maximum principal stress.
The aim of this paper is to identify the twist angle at which superimposed compression changes from extending to shortening the torsional fatigue life of P558, and to relate this change to microstructural measurements on the same specimens. To this end, P558 double-cone specimens were tested under angle-controlled cyclic torsion (5°, 10°, 15°, and 20°, with one additional test at 22.5°) combined with a superimposed static compressive stress of 0 (pure torsion), 250, or 350 MPa, and the specimens were characterised by macroscopic fractography and oxide-tinting patterns; scanning electron microscopy (SEM) of slip-line and crack-initiation morphology; EBSD-based inverse pole figure (IPF), kernel average misorientation (KAM), and grain orientation spread (GOS) mapping together with Taylor factor analysis; and stabilised hysteresis-loop energy dissipation and cyclic stress–life behaviour.
2. Materials and Methods
2.1. Material
The material investigated in this study is P558, the commercial designation of the nitrogen-alloyed austenitic stainless steel 1.3808, manufactured by voestalpine BÖHLER Edelstahl GmbH & Co KG (Kapfenberg, Austria). The alloy has a face-centred cubic (FCC) crystal structure, and its nickel-free composition confers an advantageous combination of high mechanical strength, superior corrosion resistance, and favourable biocompatibility. As is typical for this class of alloy, its comparatively low stacking fault energy (SFE) promotes planar slip, a characteristic that is central to the microstructural interpretation of the EBSD results presented in Section 3.
Table 1 gives the chemical composition of the material. Before testing, the material was solution-annealed at 1150 °C for 45 min and water-quenched. In this condition, the tensile strength was MPa and the yield strength MPa (mean ± standard deviation of six tensile tests with an extensometer, at crosshead speeds of 0.05 mm/s (two tests), 0.6 mm/s (two tests), 2.44 mm/s and 5.47 mm/s).
Table 1.
Chemical composition of P558 (wt.%).
The grain size was determined by EBSD on the 100× maps, using TSL OIM Analysis 7.3.1 (EDAX Inc., Mahwah, NJ, USA). Grains were reconstructed with a 5° misorientation threshold from points with CI ≥ 0.1. Without annealing twins as grain boundaries, the mean equivalent circle diameter (ECD) was µm (mean ± standard deviation of the grain-size distribution; individual grains between about 3 and 240 µm); counting the twins as separate grains, it was 34.7 µm. About half of all high-angle boundaries were twin boundaries. The specimen tested at 5°/350 MPa, which showed no measurable deformation-induced misorientation (Section 3.2), had the same microstructure: four transverse maps (1036 grains) gave µm with twins counted and µm without them (mean ± standard deviation between maps). In the most strongly deformed specimens (20°/350 and 22.5°/250 MPa), the ECD decreased to 16–19 µm, because deformation-induced boundaries above 5° subdivide the original grains. This reflects the deformation, not a different initial grain size.
2.2. Multiaxial Fatigue Tests
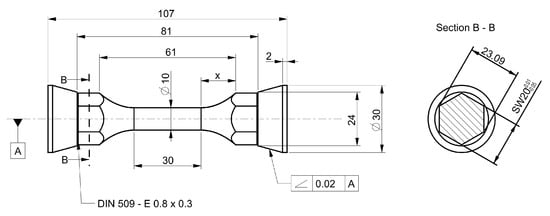
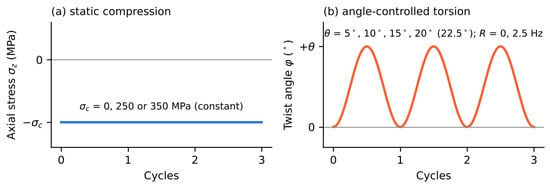
Multiaxial fatigue experiments were conducted on cylindrical double-cone specimens, shown in Figure 1, of the same geometry as in [22]. Before testing, the gauge section of all samples was ground with increasingly finer grades of sandpaper and polished with 1 µm diamond paste to remove turning marks. After polishing, the arithmetic mean surface roughness () was nm.
Figure 1.
Multiaxial fatigue sample geometry (dimensions in mm), showing the double-cone specimen with a ⌀ 10 mm gauge section and hexagonal-socket grip ends (Section B–B). The transition between the gauge section and the grip has a parabolic profile, , with x (in mm) measured from the end of the gauge section over –15.5 mm, i.e., from ⌀ 10 to ⌀ 23.09 mm; it is tangent to the gauge section, with a radius of curvature of 18.4 mm at the gauge end.
The thick gauge section (⌀ 10 mm) was chosen to exclude buckling. Treating, conservatively, the 61 mm free length as a uniform bar of the minimum diameter mm (radius of gyration mm) with pinned ends (column-length factor [23]), i.e., neglecting the stiffening effect of the cones and the clamped hexagonal grips, gives a slenderness . This is far below the transition slenderness between elastic (Euler) and inelastic buckling, for GPa and MPa [24]. The corresponding Johnson critical stress, MPa, is well above the maximum static compressive stress of 350 MPa, so buckling can be excluded.
so the column lies in the inelastic range, for which the Johnson parabola [24,25] gives a critical stress
which is 1.65 times the highest applied compressive stress (350 MPa). With clamped ends ( [23]), MPa . Global buckling is therefore excluded, and compressive yielding precedes any instability.
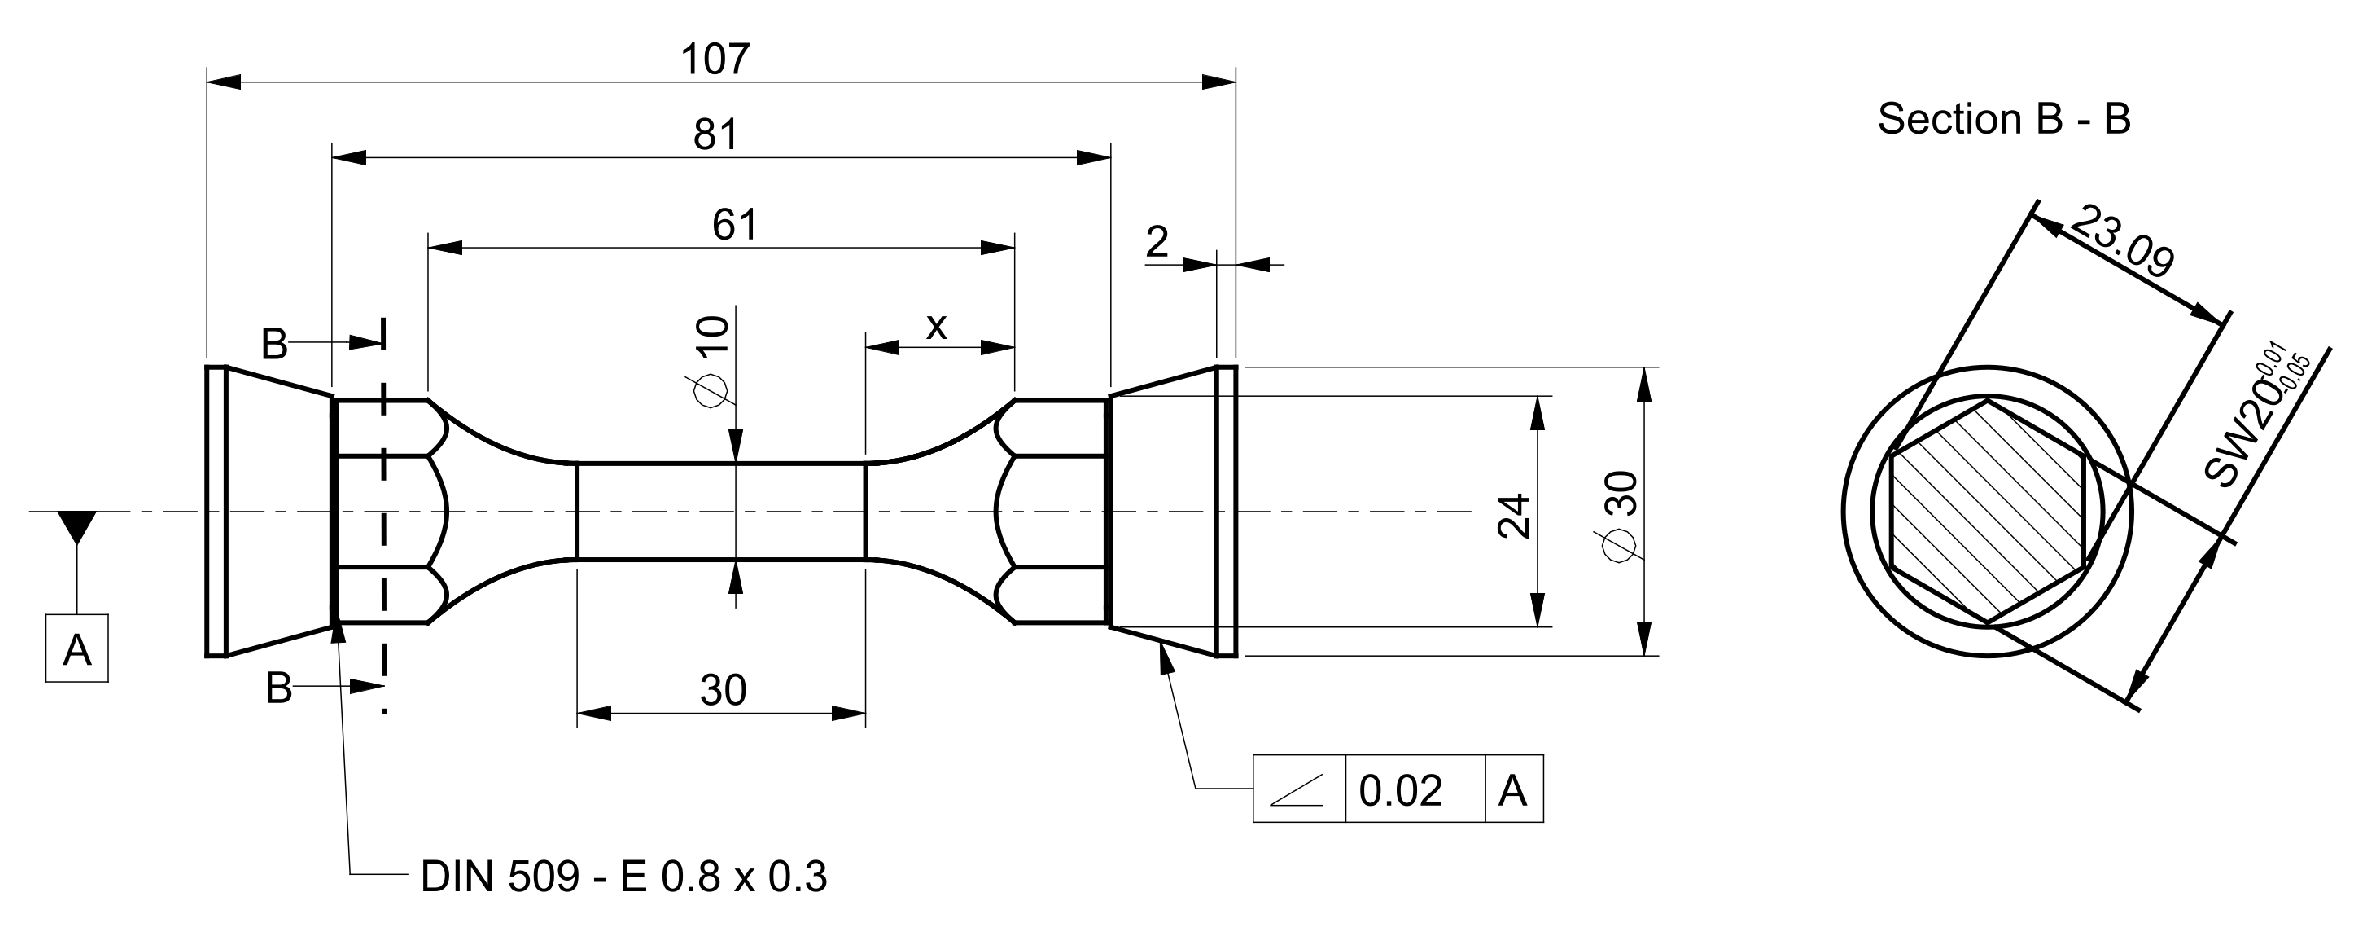
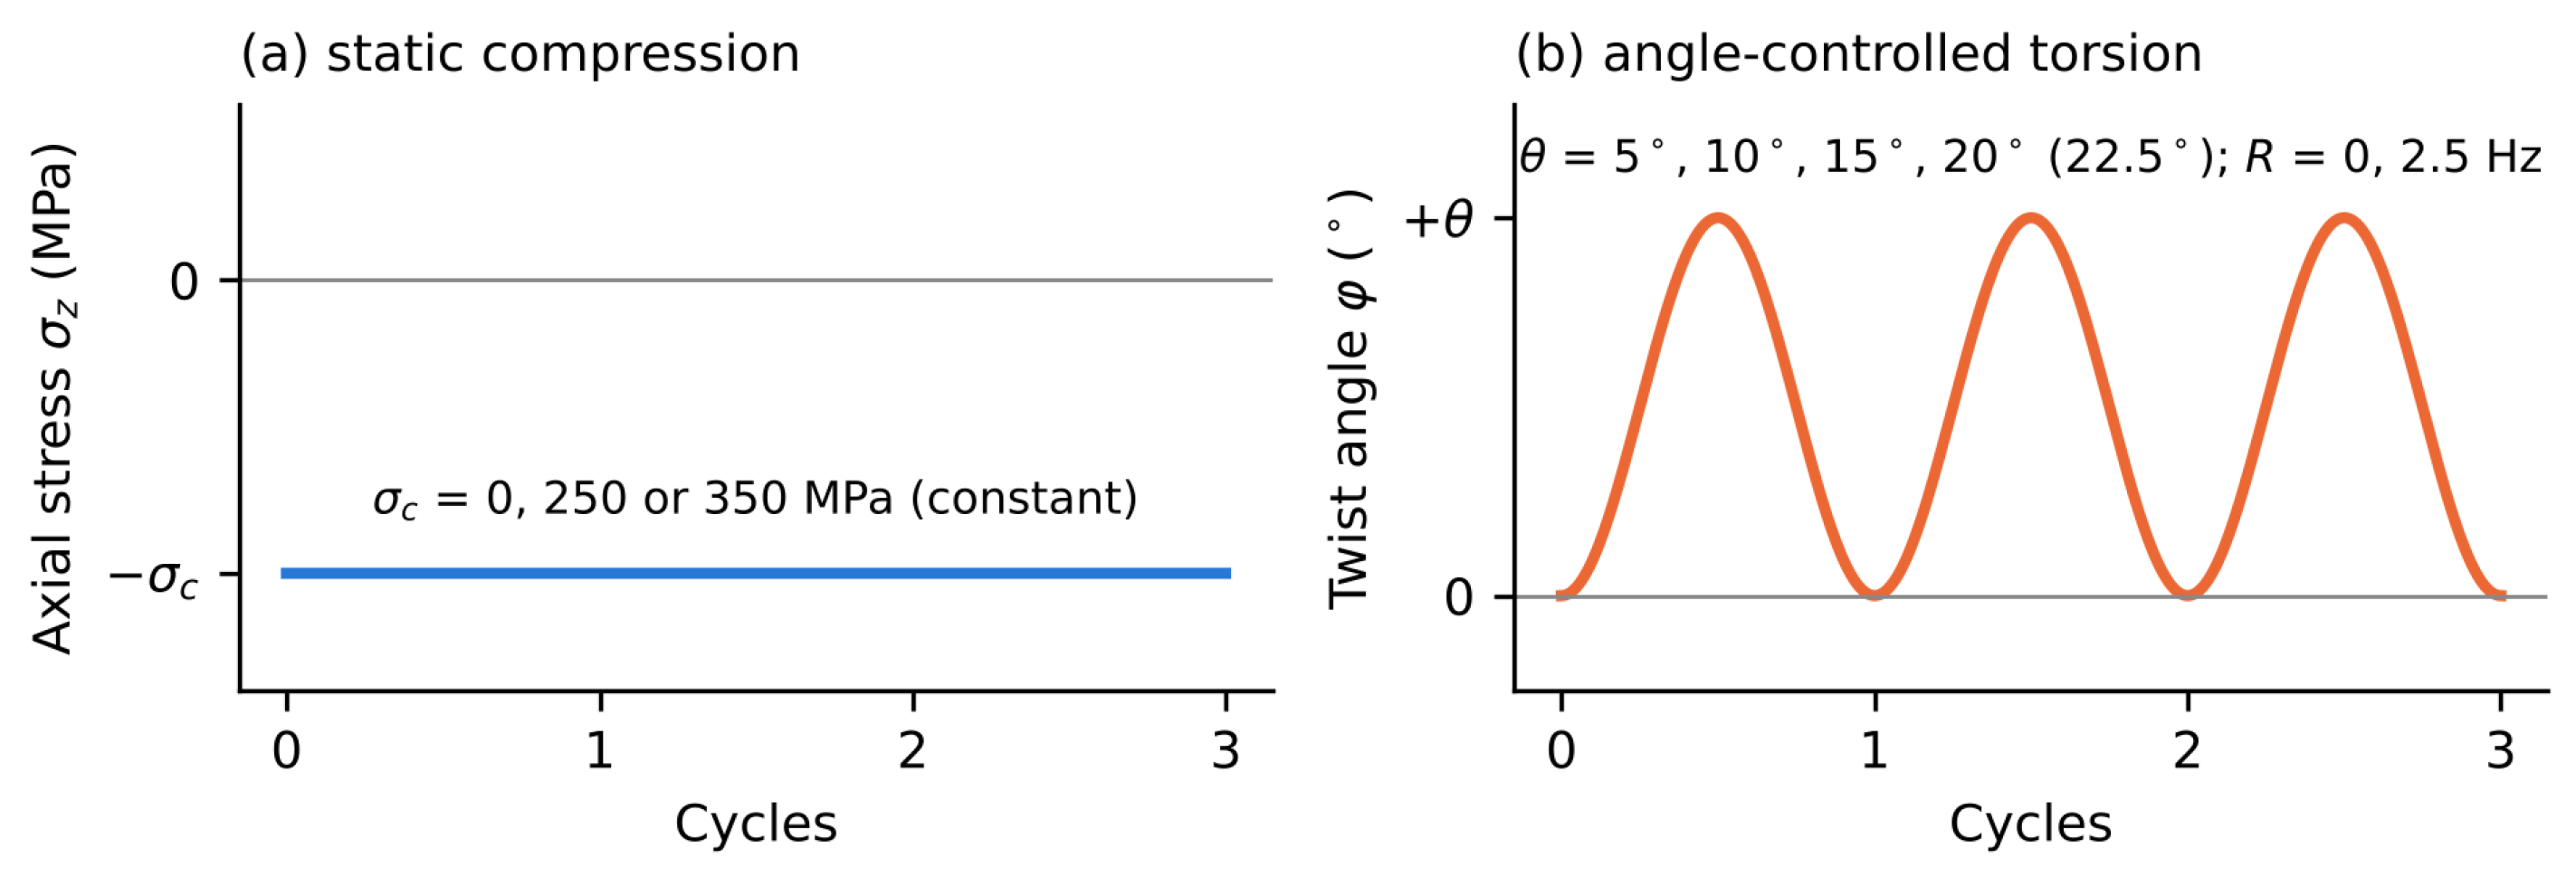
A Bionix 858 (MTS Corporation, Eden Prairie, MN, USA) servo-hydraulic universal testing machine was used for all fatigue tests, providing a maximum axial force of 50 kN and a maximum torque of 300 Nm. Each specimen was first loaded to a static compressive stress of 0 (pure torsion), 250 or 350 MPa, which was held constant throughout the test. Angle-controlled sinusoidal torsion at and a frequency of 2.5 Hz was then superimposed, i.e., the actuator rotation varied between 0 and , with = 5°, 10°, 15° and 20°, and 22.5° in one additional test at 250 MPa. The twist angle is therefore the total rotation range. To check the influence of the loading ratio, two additional tests at 250 MPa were run at with the same rotation range ( and ), and the condition 10°/250 MPa was repeated. Figure 2 illustrates the loading scheme. The axial force required for the nominal compressive stress, , was calculated from the smallest cross-section of each specimen, measured with a laser thickness gauge of 10 µm precision. In the stress analysis, compressive stress is taken as negative, .
Figure 2.
Multiaxial loading applied in the fatigue tests, shown over three cycles. (a) Axial stress : the blue line is the static compressive stress (, 250 or 350 MPa), held constant throughout the test. (b) Twist angle : the orange line is the angle-controlled sinusoidal torsion between 0 and (, 2.5 Hz), with , , or (one test at ). The thin grey lines mark zero stress and zero twist angle.
In the pure-torsion tests, the surface shear strain was measured directly on the reduced section with an axial–torsional extensometer (Model 3550, Epsilon Technology Corp., Jackson, WY, USA). In the combined tests, which involved large axial ratcheting strains (up to 18%) and surface temperatures of up to 340 °C, the extensometer was not used. There, the surface shear-strain range was obtained from the actuator rotation as , with mm. The effective length mm, which also accounts for the compliance of machine and grips, was calibrated in the pure-torsion tests, in which actuator rotation and extensometer strain were recorded simultaneously. This gives shear-strain ranges of , 1.08, 1.62 and 2.15% for = 5°, 10°, 15° and 20°. The shear stress was calculated from the measured torque T as , with d the initial minimum diameter, as in [10]. This elastic relation overestimates the surface shear stress once the cross-section deforms plastically, by up to 25% for a fully plastic section [26]; its effect on the conclusions is discussed in Section 3.3. The axial shortening was recorded continuously and converted into a compressive strain over the 30 mm reduced section. The surface temperature of the gauge section was measured with a probe (contact) thermometer as a single reading during each test; it was not logged continuously. Because a single contact reading may miss the peak temperature, these values are regarded as lower bounds.
In total, 16 tests were performed (Table 2). The mechanical data of three of them (10° and 15° at , and at , all at 250 MPa) were previously used for constitutive modelling in [22]; here they are evaluated together with the complete test matrix and the post mortem microstructural analysis. Each test was ended when one of the following conditions was met: (i) visible surface cracks appeared on the specimen or the specimen fractured, (ii) 2 million loading cycles were reached (run-out), or (iii) the axial shortening reached 5.5 mm, i.e., a compressive strain of 18.3% over the 30 mm reduced section (about 5% of the specimen length). Criterion (iii) is a safety limit that protects the load train; reaching it indicates progressive axial ratcheting, a failure mode distinct from fatigue cracking, and such tests are reported as ratcheting-limited stops rather than fatigue failures.
Table 2.
Test matrix: rotation range , loading ratio R, static compressive stress , cycles N, termination criterion ((i): surface crack or fracture; (ii): 5.5 mm axial shortening) and maximum measured surface temperature (single reading; –: not measured).
2.3. Metallography and Electron Backscatter Diffraction (EBSD)
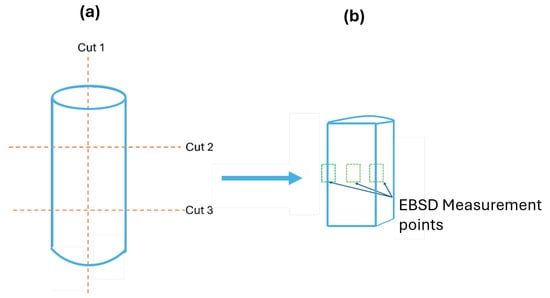
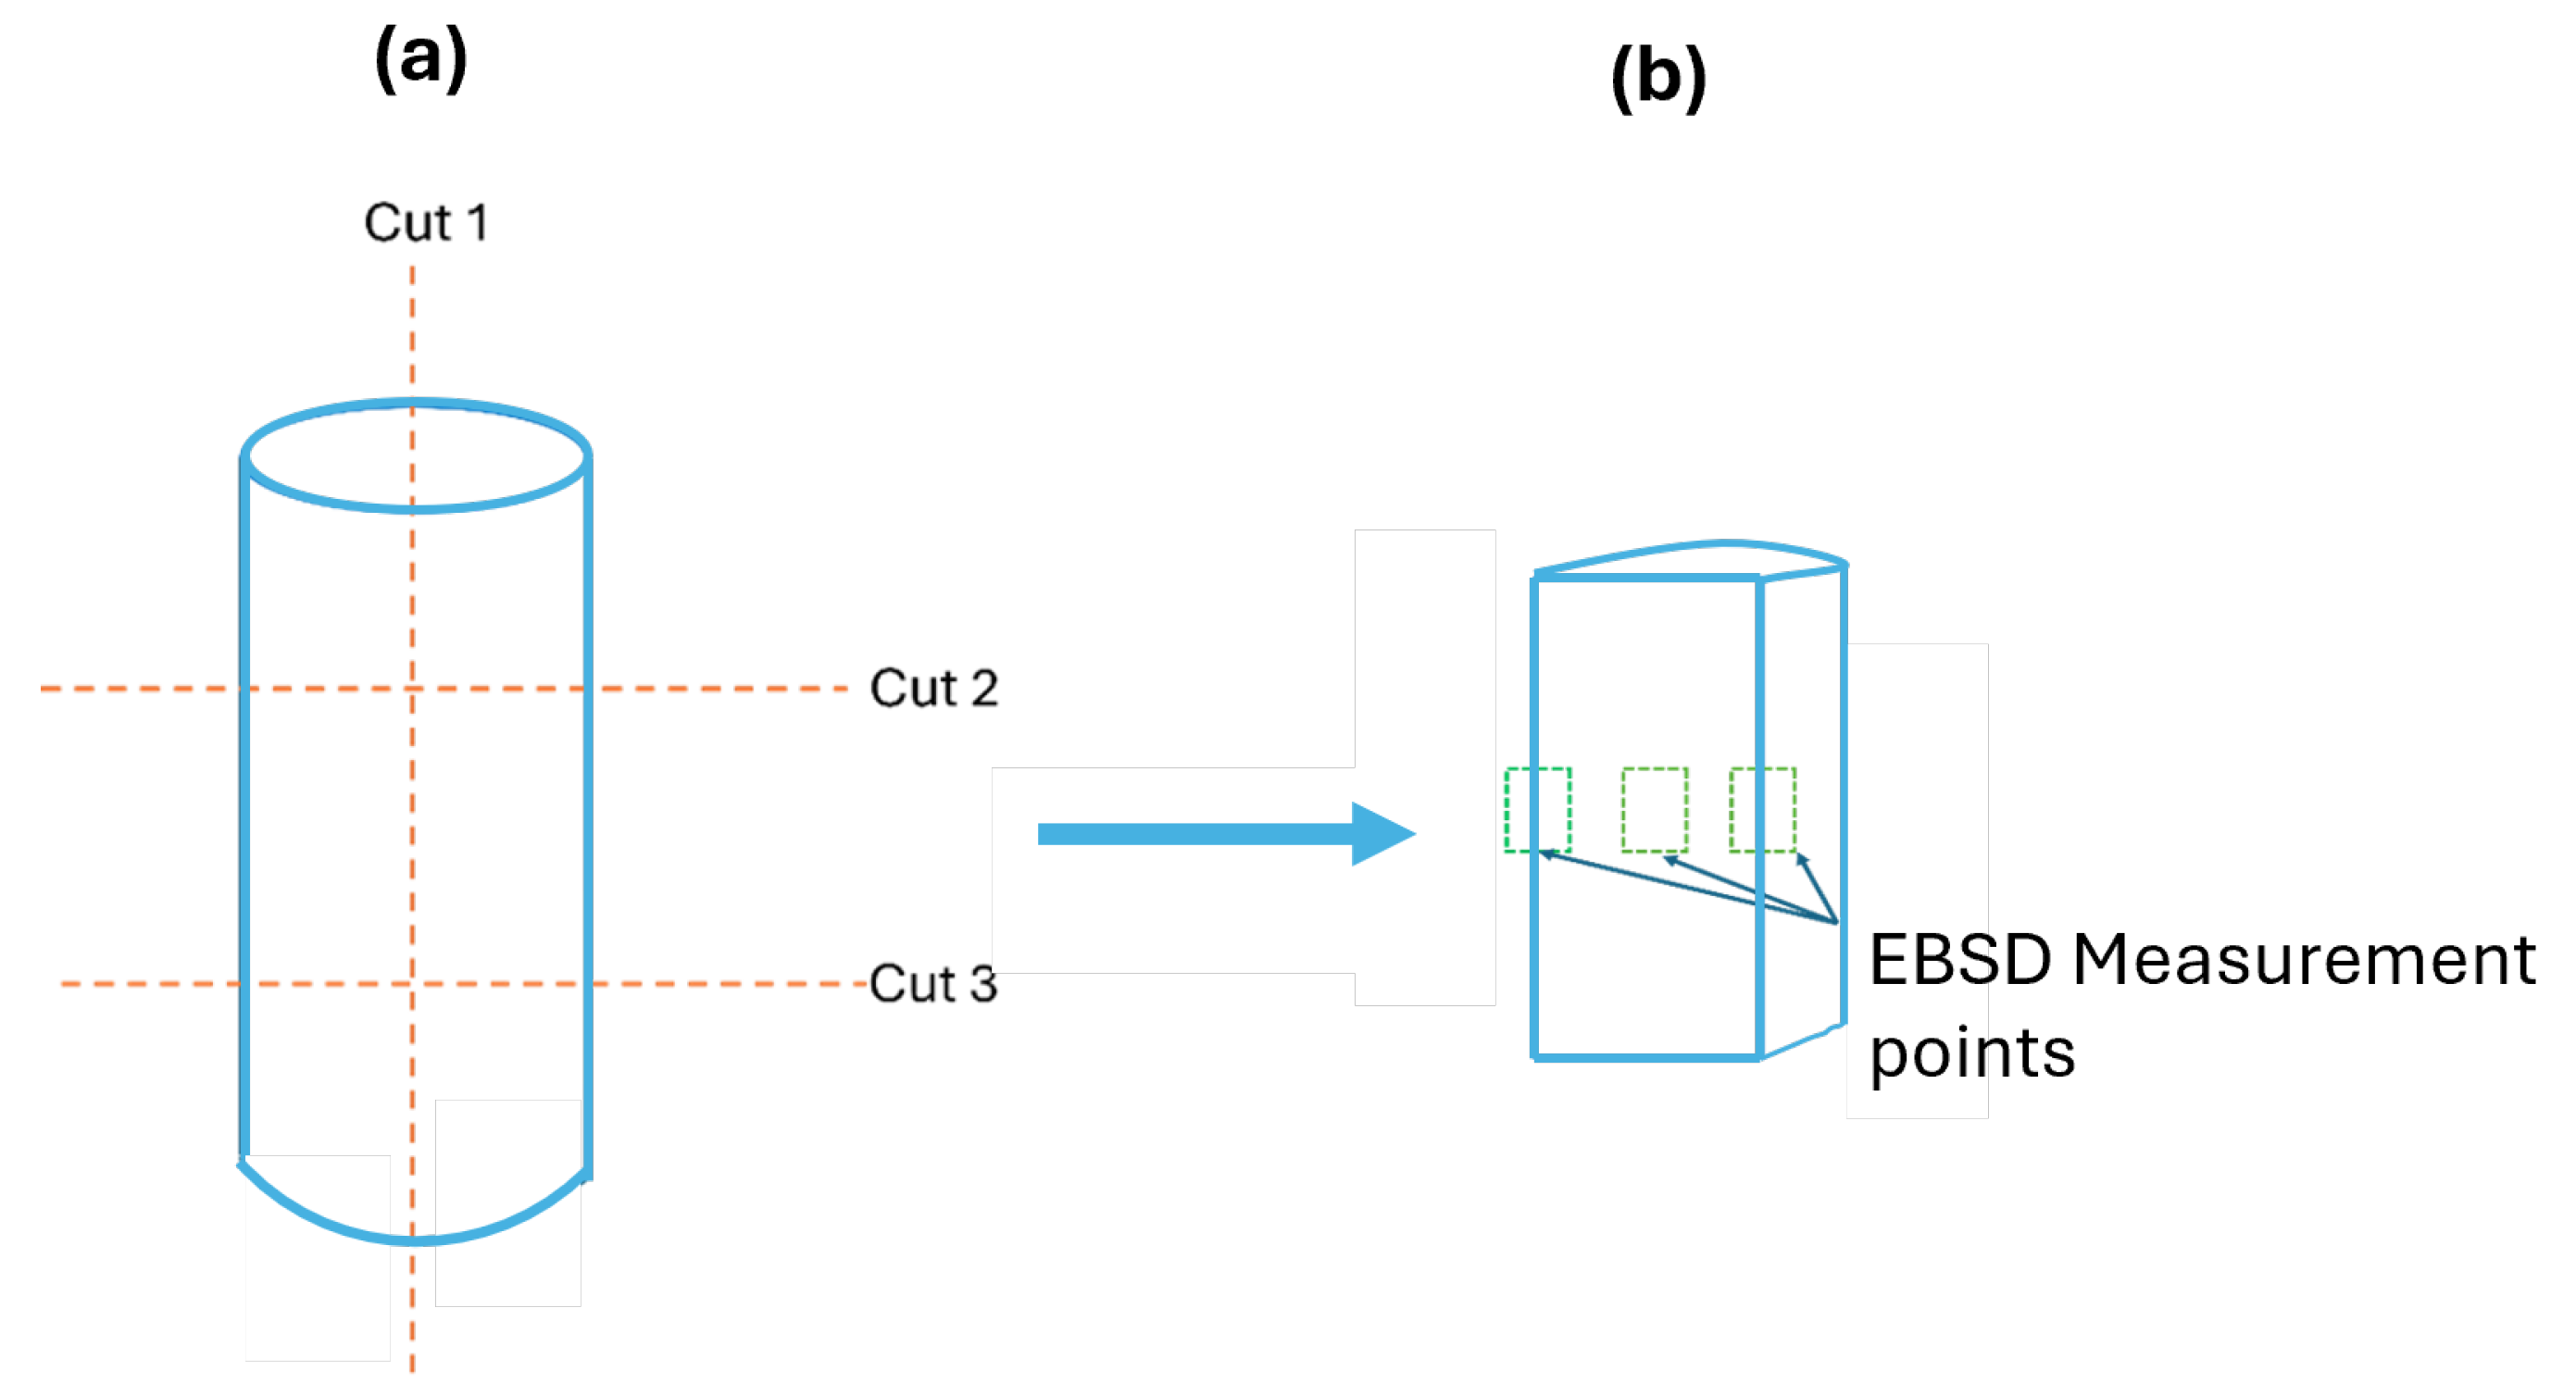
Following completion of the fatigue tests, the specimens were examined by electron backscatter diffraction. Samples were extracted from the middle (gauge-length) region of the tested specimens as illustrated in Figure 3. Longitudinal sections (containing the specimen axis) and transverse sections (normal to it) were examined; not every condition was available in both orientations (Section 3.2). One to six maps were recorded per section, at positions distributed over the exposed face; in the transverse sections of the pure-torsion specimens, one map was taken near the centre and one near the edge.
Figure 3.
EBSD sampling scheme. (a) Three transverse cuts (Cut 1–3) taken along the specimen’s longitudinal axis to extract the gauge-length sample. (b) Isometric view of the extracted longitudinal section, showing the EBSD measurement points. Transverse sections were taken from the same gauge region.
The preparation process for EBSD samples involved embedding and successive grinding using 220, 500, and 800 grit silicon carbide papers (each step lasting 2–6 min at 2 bar and 200 rpm). Specimens then underwent polishing with a 6 µm diamond suspension, followed by a 1 µm diamond suspension, and a final polishing step using a 1:1 suspension of deionised water and MasterMet2 (a colloidal silica suspension, particle size 0.02 µm; Buehler, Lake Bluff, IL, USA). In addition, samples underwent vibration polishing for four hours using the same 1:1 MasterMet2 suspension.
EBSD investigations were conducted using a field-emission-gun scanning electron microscope (LEO Gemini 1530, Carl Zeiss AG, Jena, Germany) operating at 20 kV, with a Digiview IV EBSD camera and OIM 6.2 data-collection software (EDAX Inc., Mahwah, NJ, USA).
Maps were recorded on a hexagonal grid at 100× (step size 2 µm, field mm), 250× (1 µm, mm), 500× (0.5 µm, mm) and 1000× (0.2–0.25 µm, mm). The pure-torsion specimens were mapped in a separate session at 250× (1 µm, mm).
KAM and GOS were evaluated from the raw data with MTEX 5.11.2 [27] in MATLAB R2024b (The MathWorks, Natick, MA, USA) and verified with an in-house Python 3.12.4 script (Python Software Foundation, Wilmington, DE, USA) using NumPy 2.5.4 and orix 0.15.0 Values per condition are given as mean ± standard deviation between maps.
Because KAM depends on step size, all KAM and GOS values reported in Section 3.2 refer to a common step size of 1 µm. The 250× maps were evaluated directly. Where no 250× map was available for a condition and section, 500× and 1000× maps were resampled to a 1 µm hexagonal grid by retaining every second (fourth, fifth) point in every second (fourth, fifth) row; this applies to the transverse sections at 10°/250 and 10°/350 MPa, to 22.5°/250 MPa and to one map at 5°/250 MPa. The procedure was checked on one position of the 10°/350 MPa specimen that had been mapped at 250×, 500× and 1000×. At the native step sizes of 1, 0.5 and 0.25 µm, the mean KAM was 0.99°, 0.62° and 0.48°; after resampling to 1 µm, it was 0.99°, 0.92° and 1.05°. The area-weighted GOS was 4.82°, 4.16° and 4.26° and is thus insensitive to the step size. The 100× maps were used for grain-size statistics only.
Map quality was assessed from the fraction of points with CI , the image quality (IQ) and the mean angular deviation (fit). Two longitudinal maps of the 5°/250 MPa specimen (CI for 66–82% of the points, median IQ about 40% of that of the other maps, fit 1.36°) and one map of the 20°/350 MPa specimen (CI for 36%, fit 1.96°; re-measured) were excluded. The maps of the pure-torsion specimens had a lower indexing rate (69–84%) and a higher fit (1.2–1.4°) than the other maps (88–99.7%, 0.5–0.8°), but a similar image quality (median IQ 83,000–104,000, compared with 97,000–111,000 for well-indexed maps of weakly deformed specimens; IQ decreases with lattice distortion). Because point-to-point orientation noise inflates KAM and fragments grains, only GOS is evaluated for these maps; such noise increases rather than decreases GOS, so their GOS values are upper bounds. The untested transverse reference maps were also of reduced quality (CI for 77–95%, misorientation peak shifted by 2–5°). Their mean KAM (0.67°) exceeds that of the transverse sections of the 5° specimens (0.34–0.43°); transverse values are therefore compared as absolute values, not as ratios to this reference.
Points with a confidence index (CI) below 0.1, unindexed points and points indexed as a phase other than austenite (mean CI 0.01–0.03, i.e., mis-indexed) were removed; no clean-up or orientation smoothing was applied. Grains were reconstructed with a misorientation threshold of 5° between neighbouring points, and grains with fewer than 10 points were excluded. KAM was calculated for each point as the mean misorientation to its first-order neighbours, excluding misorientations above 5°, and averaged over all points of the retained grains. GOS was calculated for each grain as the mean misorientation of its points from the grain mean orientation and averaged over the grains of a map (number-weighted). The 95th percentile (P95) of the point (KAM) or grain (GOS) distribution is reported as the upper value instead of the maximum, which depends on single grains. The grain size was determined as the equivalent circle diameter (ECD), both with annealing twins counted as separate grains and with boundaries merged (Brandon criterion, 8.66°). All misorientations were calculated with the full cubic crystal symmetry.
The Taylor factor M was computed with the full-constraint Taylor model using the twelve slip systems of the FCC lattice [28,29]. For each orientation, M is the minimum total slip required to accommodate an imposed strain increment, normalised by the equivalent strain increment,
where is the shear increment on slip system s and is the von Mises equivalent strain increment. The imposed strain increment was taken proportional to the deviatoric stress at the stabilised peak (J2 flow rule); it therefore combines the torsional shear with the axial compression in the ratio of the measured to (Section 3.3). For a random FCC orientation set, the implementation reproduces the mean Taylor factor in uniaxial deformation (; literature value: ) and in simple shear (; ). Because the torsional shear acts in the axial–circumferential plane, whose orientation in the map frame is known only for longitudinal sections (it is the section normal), M was evaluated for the longitudinal sections only, from 50,000 randomly selected points per map. A low local M indicates an orientation in which the imposed deformation is accommodated with less slip, i.e., with less externally applied stress. Because M depends only on orientation and on the imposed strain mode, its spatial variation partly reflects the same lattice rotations captured by KAM and GOS; it is therefore interpreted as complementary rather than independent evidence (Section 3.4).
2.4. Principal Stress and Equivalent Stress Calculation
To provide a mechanical basis for interpreting the EBSD results, the stress state under each combination of twist angle and compressive stress was quantified. The principal stresses were obtained by solving the general cubic stress equation for three-dimensional stress states:
For the present loading, with an axial stress , a shear stress and all other components zero, Equation (4) reduces to
Here, is the measured peak shear stress of the stabilised (half-life) hysteresis loop (Section 2.5) so that the analysis describes the cyclically stabilised state rather than an elastic estimate. Although the rotation was applied at , the shear stress became nearly symmetric within the first 10–20 cycles (Section 3.5), so the peak shear stress is close to the shear-stress amplitude. The stresses are nominal values based on the initial minimum cross-section; because the axial ratcheting strain (Section 3.6) enlarges the cross-section during the test, the true and at half-life are lower by up to about and , respectively. The associated maximum shear stresses were calculated as
Equivalent stresses were then computed using both the Tresca and the Huber–von Mises–Hencky (HMH) [30] criteria:
For the present stress state, Equations (7) and (8) reduce to and . In addition to the equivalent stresses, the maximum principal stress is reported; it is the largest tensile normal stress in the material and acts on the planes on which tensile (mode I) crack opening is promoted. The resulting stress states are presented as Mohr’s circles in Section 3.3.
2.5. Hysteresis-Loop Energy Dissipation Analysis
Cyclic hysteresis loops (shear stress–shear strain) were extracted at the half-life of each test, defined as the point at which cyclic softening or hardening had stabilised, for four representative twist angles (5°, 10°, 15°, and 20°) under the three loading conditions (pure torsion, torsion + 250 MPa, torsion + 350 MPa). The energy dissipated per cycle (the hysteresis-loop area) was computed as
where A is the plastic strain energy density dissipated per cycle (MJ m−3), the shear stress, the engineering shear strain, and the closed integral runs over one stabilised cycle [31,32]. For the N discrete data points recorded during one cycle and ordered along the loop, Equation (9) was evaluated with the trapezoidal rule,
using OriginPro 2025b software (OriginLab Corporation, Northampton, MA, USA). The resulting energy density values were normalised by the corresponding pure-torsion value at each twist angle, isolating the effect of static compression from twist-angle-dependent scaling.
3. Results
3.1. Macroscopic Observations and Scanning Electron Microscopy (SEM) Analysis
Macroscopic examination of the tested specimens revealed clear variations in surface morphology, fracture patterns, and evidence of thermo-mechanical effects as a function of the applied loading path and magnitude. Specimens tested under pure torsion (0 MPa static compressive stress) and low twist angle generally retained a relatively smooth surface finish, with minimal heat discolouration and fracture surfaces dominated by two sets of cracks inclined at 45° to the specimen axis, intersecting to form an “X” pattern. Under torsion, the 45° planes are the planes of maximum principal stress, whereas the planes of maximum shear stress are the transverse and longitudinal planes; this crack morphology is therefore typical of tensile (mode I) crack growth under torsion at long lives [33]. The absence of significant thermal tinting in these specimens suggests minimal heat accumulation during cycling, likely due to the limited plastic strain energy dissipated per cycle.
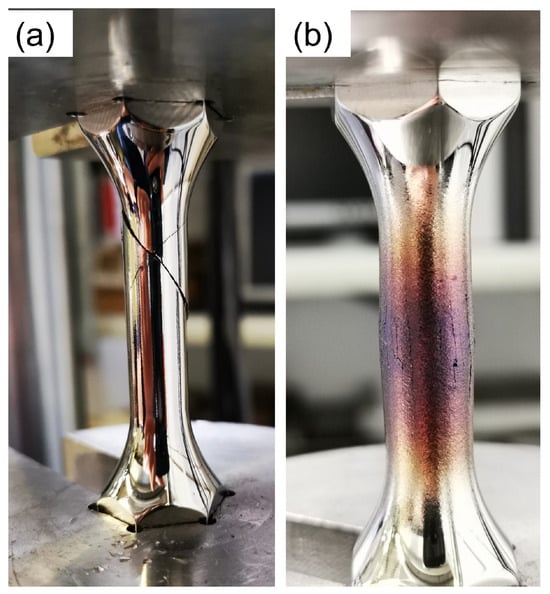
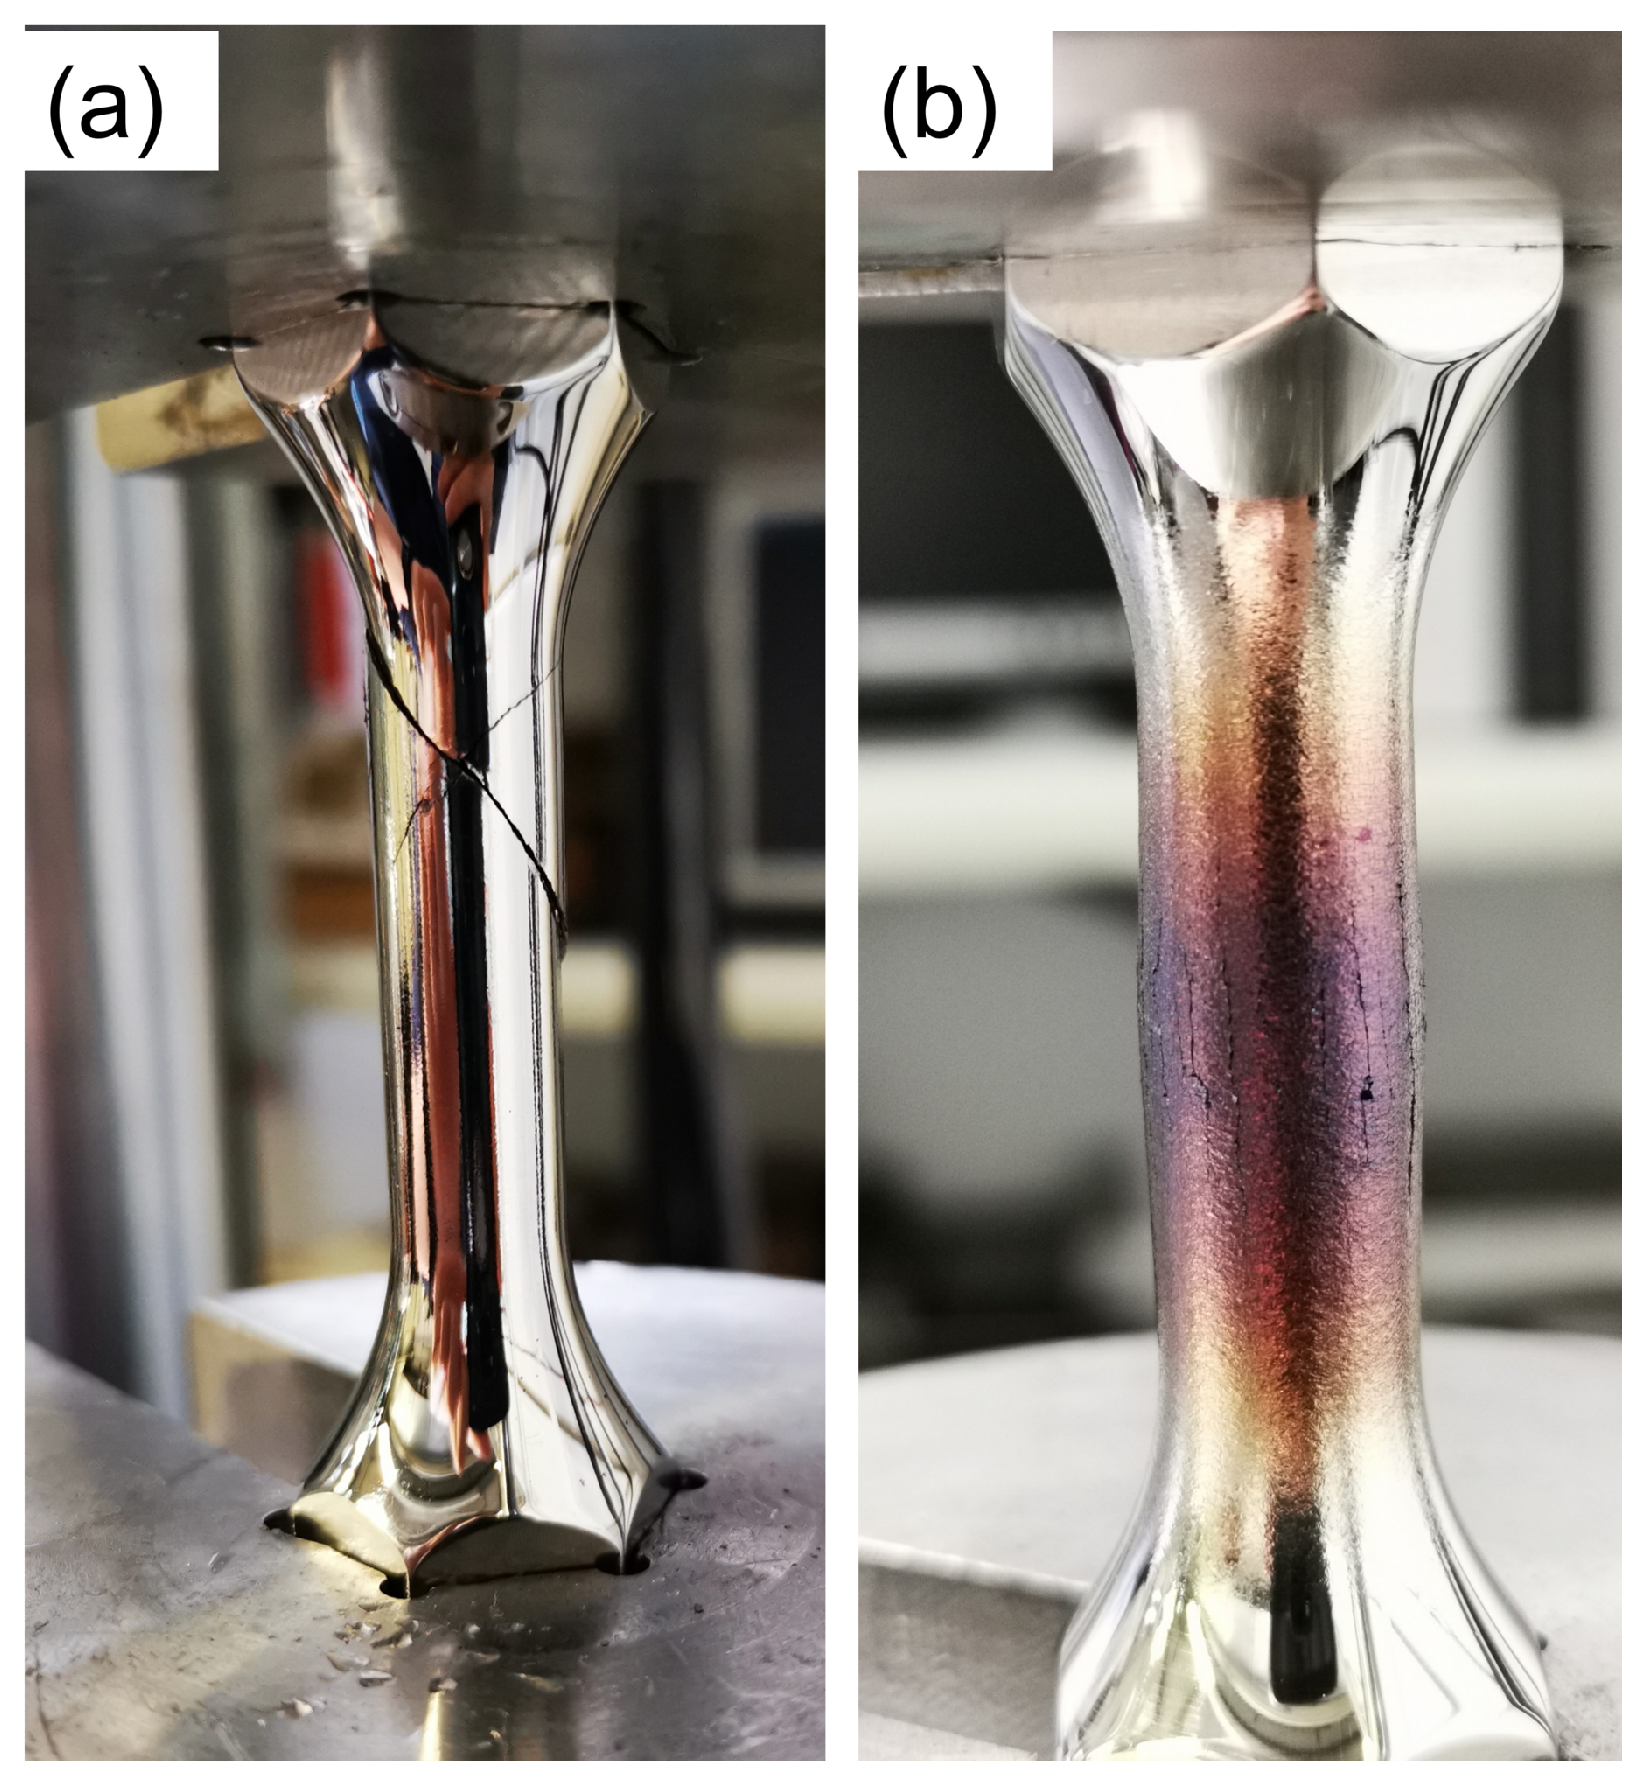
In contrast, specimens subjected to combined torsion and high static compressive stress exhibited markedly different macroscopic features, as shown in Figure 4. At higher twist angles (e.g., 20° and 22.5°) with superimposed compressive stress of 250–350 MPa, fracture surfaces transitioned to predominantly vertical crack orientations, aligned parallel to the specimen axis. These axial cracks cannot be explained by the rotation of the principal stresses alone (Section 4). For the measured stress states (Section 3.3), the plane normal to the maximum principal stress lies at 45° to the specimen axis under pure torsion and at 30–39° under combined loading; the rotation is smallest at the largest rotation ranges (38–39° at 20°), where the cracks were most nearly axial. They are consistent with shear on the longitudinal plane, which carries no compressive normal stress (Section 4), and with the explanation proposed for REX 734 under the same loading [10]: the axial ratcheting under static compression (Section 3.6) enlarges the cross-section and produces tensile circumferential stresses at the specimen surface, which open cracks along the specimen axis. In REX 734, branches of the axial cracks ran at 20–35° to the axis [10], close to the -normal orientation of 30–39° calculated here. At these high twist–compression conditions, extensive thermal discolouration was visible, with oxide tints ranging from straw-yellow to dark blue. The measured surface temperatures (Table 2) increased with rotation range, from 80–96 °C at 10° to 160 °C at 15°/350 MPa, 220 °C at 20°/250 MPa (240 °C in the test at ) and 340 °C at 22.5°/250 MPa, consistent with the observed tint colours. Such colouration, absent in pure torsion and low-twist-angle cases, points to significant cyclic plastic dissipation and thermo-mechanical coupling effects [20,21].
Figure 4.
Macroscopic fracture surfaces showing the effect of twist angle and static compressive stress. (a) Smooth surface without oxide colouration, 5°/0 MPa (pure torsion). (b) Heavily roughened, heat-tinted surface, 22.5°/250 MPa; the blue–brown oxide colouration is consistent with the measured surface temperature of 340 °C.
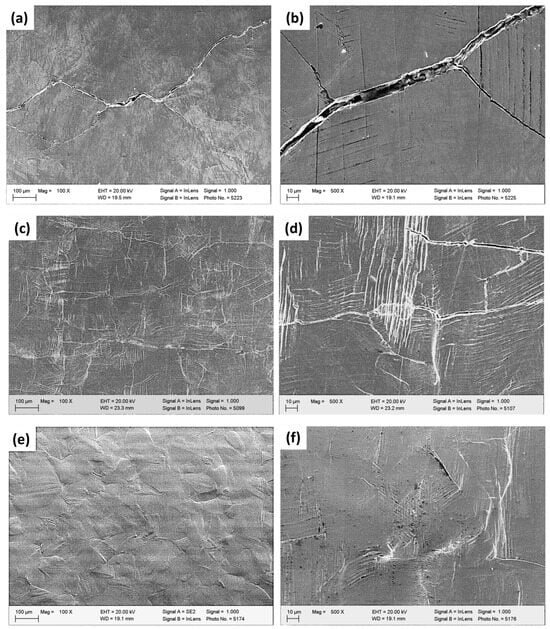
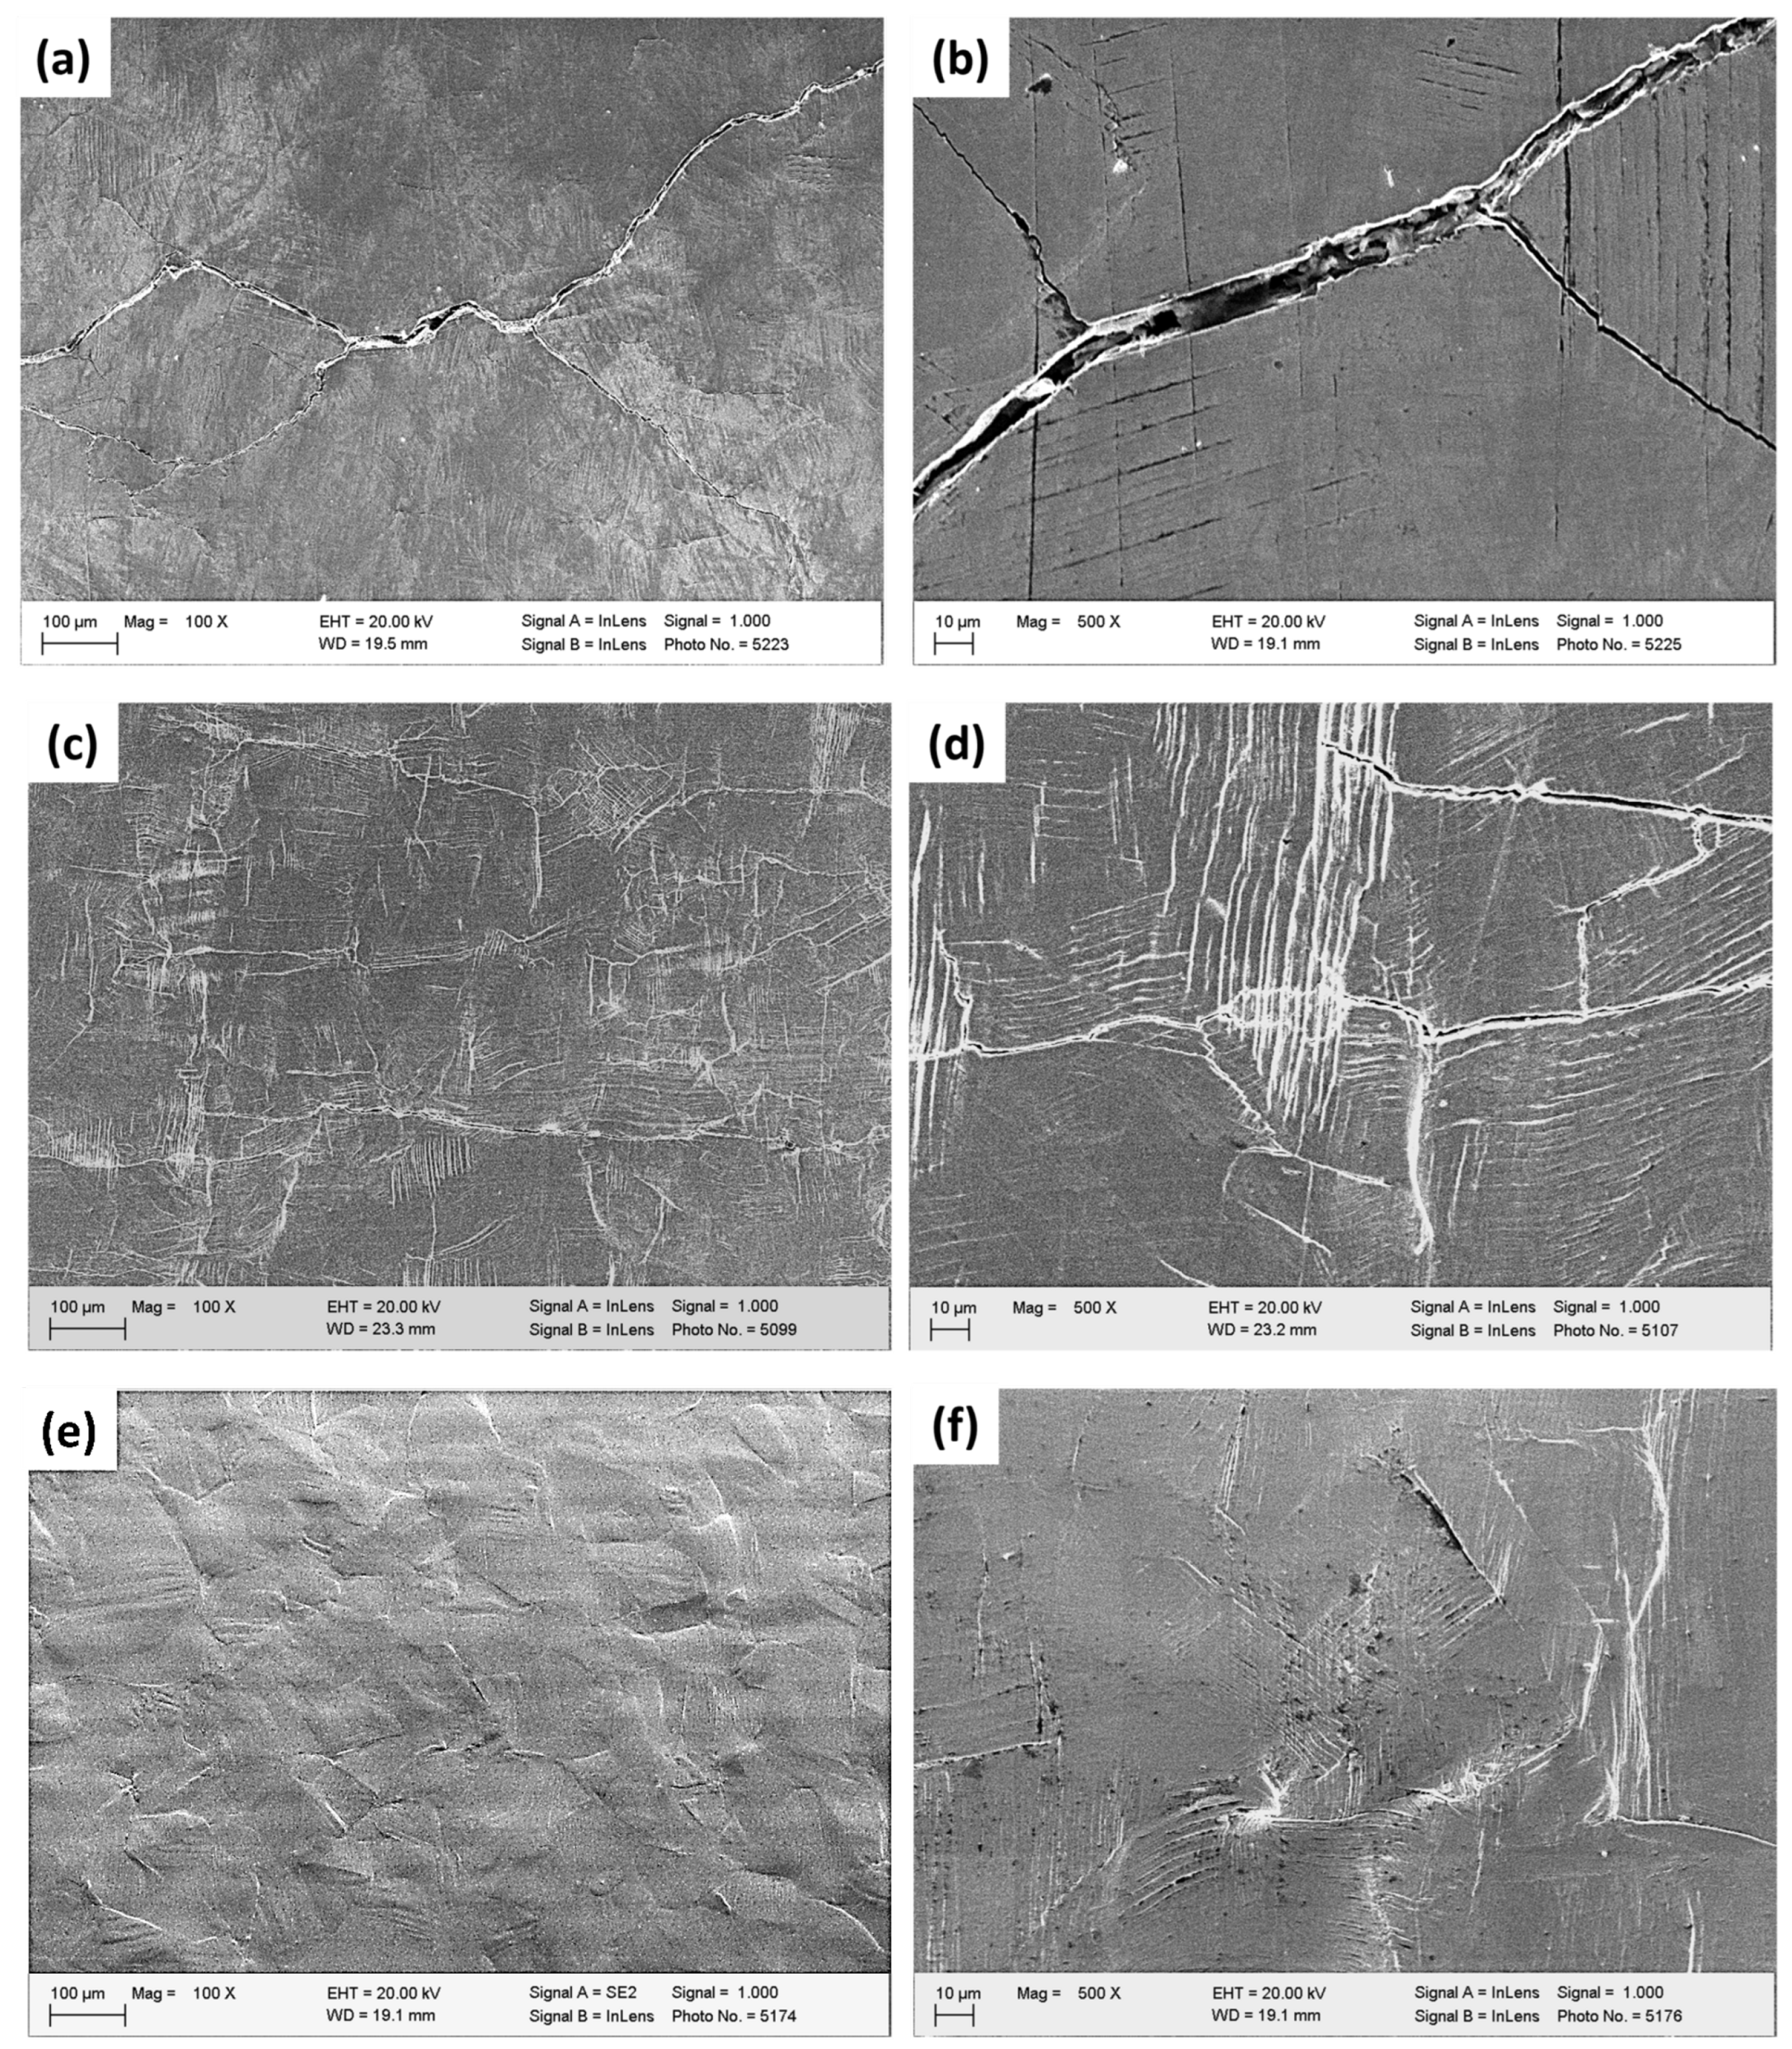
Figure 5 shows representative SEM micrographs at low and high magnification for the three conditions at 350 MPa superimposed compression (5°, 10° and 20° twist angle). At 5°/350 MPa, a few cracks were present. Most of them followed straight features that may be grain or twin boundaries, which cannot be distinguished at this magnification. The slip traces were faint, and most grains showed a single set of parallel traces, suggesting that mainly one slip system was active per grain. At 10°/350 MPa, the slip bands were denser and intersected frequently. Several microcracks followed slip traces through the grain interiors, i.e., they were transgranular; others followed straight features that may be grain or twin boundaries, which cannot be distinguished at this magnification. At the most severe condition examined, 20°/350 MPa, the specimen surfaces showed heavy slip relief: the slip bands were very dense, with features resembling extrusions and intrusions along them. Microcracks ran approximately parallel to the specimen axis and crossed regions with different slip-trace directions, i.e., they ran through several grains.
Figure 5.
SEM micrographs of surface morphology, slip-band, and cracking features under 350 MPa superimposed compressive stress. (a,b) 5°/350 MPa at 100× and 500× magnification, respectively, showing a few cracks and faint, mostly single sets of parallel slip traces. (c,d) 10°/350 MPa at 100× and 500×, showing denser, intersecting slip bands and microcracks along slip traces. (e,f) 20°/350 MPa at 100× and 500×, showing very dense slip bands and axial microcracks running through several grains. Imaging conditions: EHT = 20.00 kV, InLens detector (SE2 for panel (e)).
3.2. EBSD Analysis: Inverse Pole Figure, Kernel Average Misorientation, and Grain Orientation Spread Maps
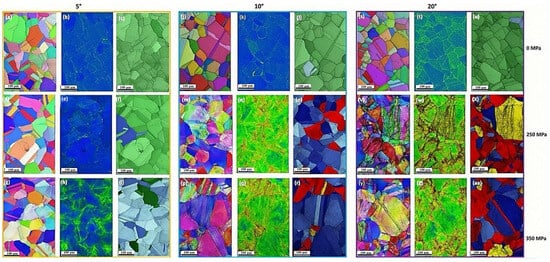
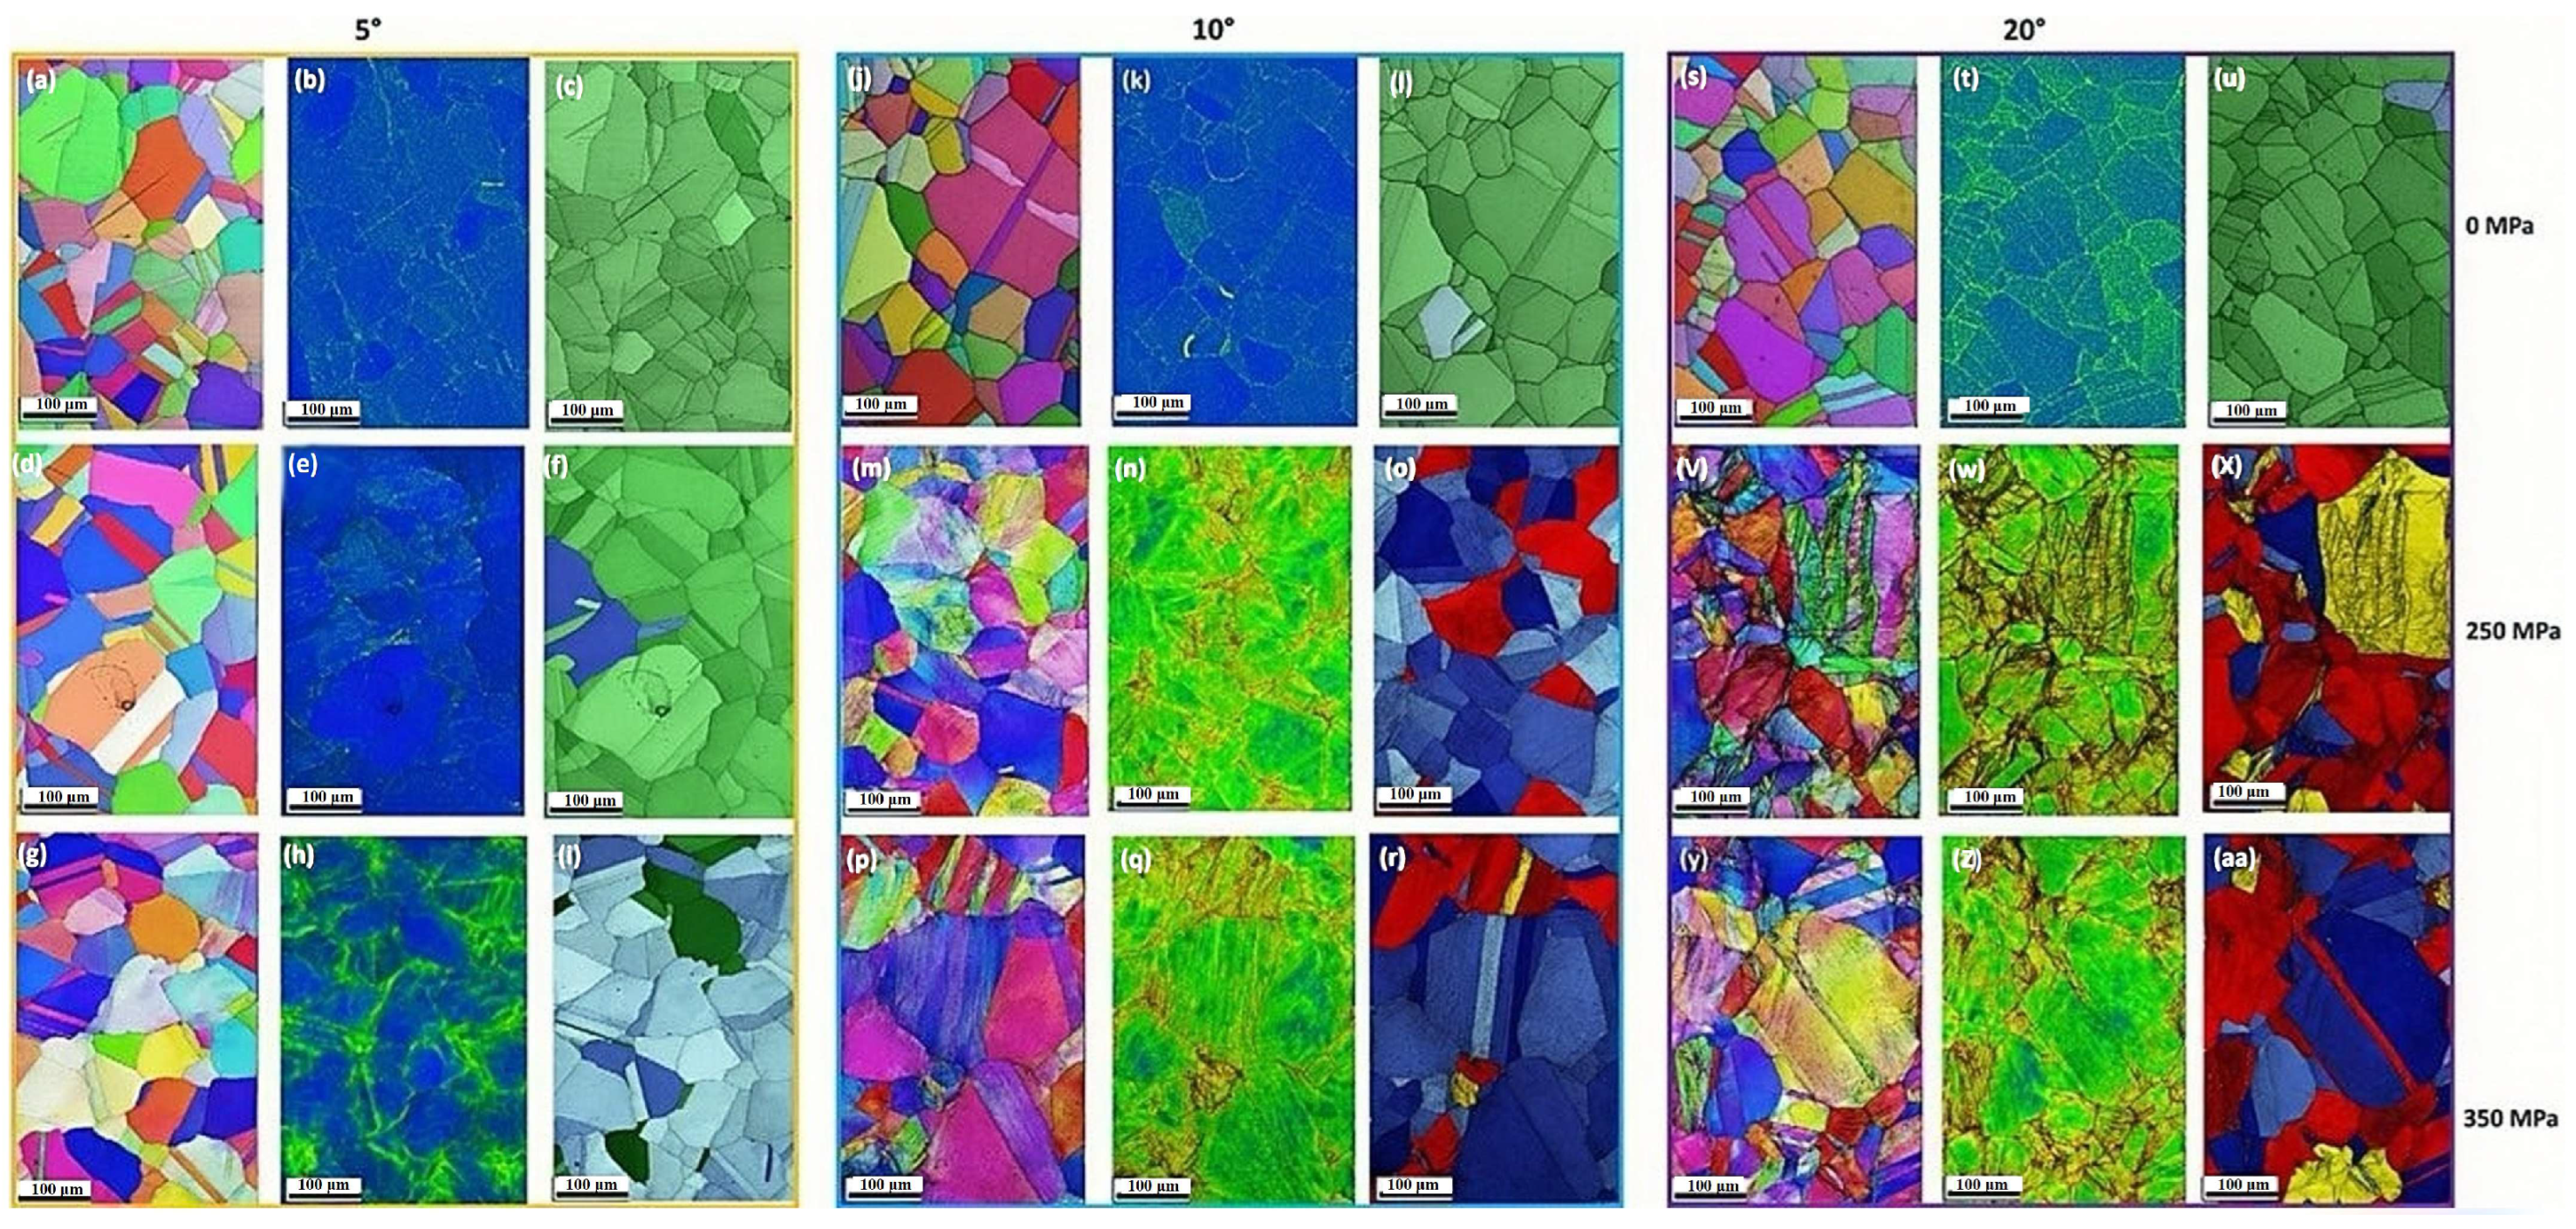
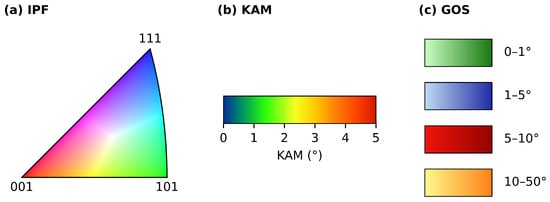
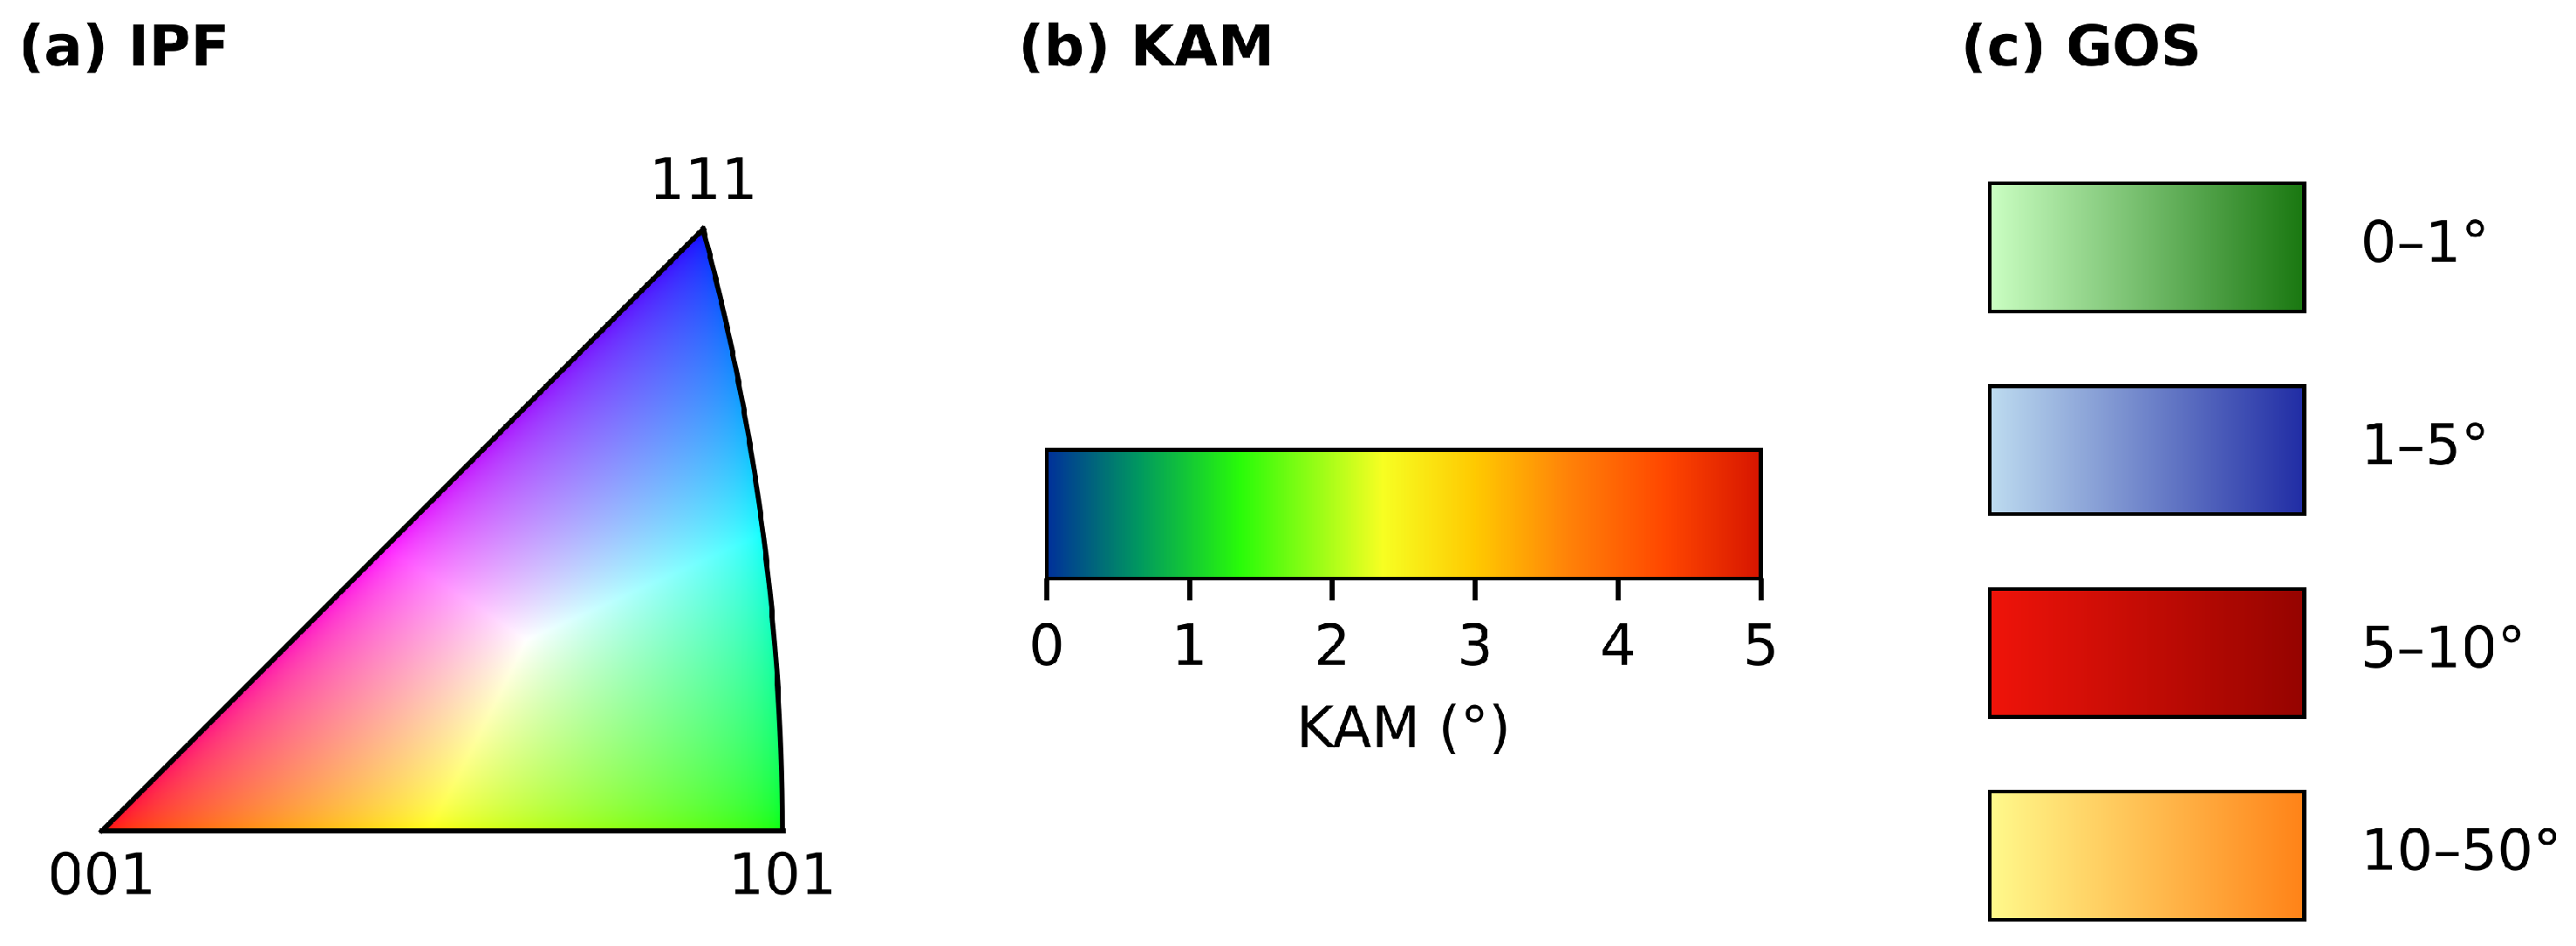
Figure 6 shows inverse pole figure (IPF), kernel average misorientation (KAM) and grain orientation spread (GOS) maps for the nine combinations of twist angle (5°, 10° and 20°) and static compressive stress (0, 250 and 350 MPa), with the colour scales in Figure 7; the values for all evaluated conditions are given in Table 3. GOS is used as the primary measure. It reflects the lattice rotation stored within grains, is insensitive to the step size (Section 2.3) and was reproducible: maps of the same specimen differed by standard deviations of 0.01–0.44°, and rescanning the same area changed the mean GOS by at most 0.1° (three areas of the 20°/250 MPa specimen). KAM, which reflects the misorientation between neighbouring points, depends on step size and pattern quality and did not rank the conditions consistently (e.g., 0.57° at 15°/250 MPa against 1.07° at 10°/250 MPa); it is reported for completeness.
Figure 6.
IPF (first column of each group), KAM (second column) and GOS (third column) maps for twist angles of 5° (a–i), 10° (j–r) and 20° (s–aa) at a superimposed static compressive stress of 0 MPa (top row), 250 MPa (middle row) and 350 MPa (bottom row). Colour scales are given in Figure 7. Scale bars: 100 µm.
Figure 7.
Colour scales for the maps in Figure 6. (a) IPF colour key: standard stereographic triangle of the cubic crystal system, with red, green and blue assigned to crystal directions parallel to , and , respectively. (b) KAM: continuous scale from blue (0°) through green and yellow to red (5°). (c) GOS: four bands, green (0–1°), blue (1–5°), red (5–10°) and yellow–orange (10–50°); the top band is much wider than the others.
Table 3.
KAM, GOS and grain size per condition at a common step size of 1 µm (Section 2.3): mean ± standard deviation between n maps, and 95th percentile (P95) of the point (KAM) or grain (GOS) distribution, averaged over the maps. L: longitudinal section; T: transverse section; ECD: mean equivalent circle diameter with twins counted as grains.
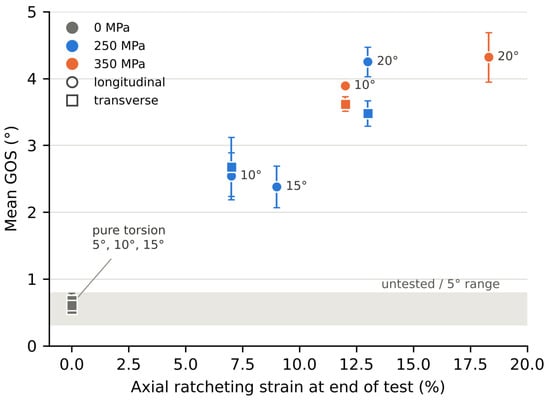
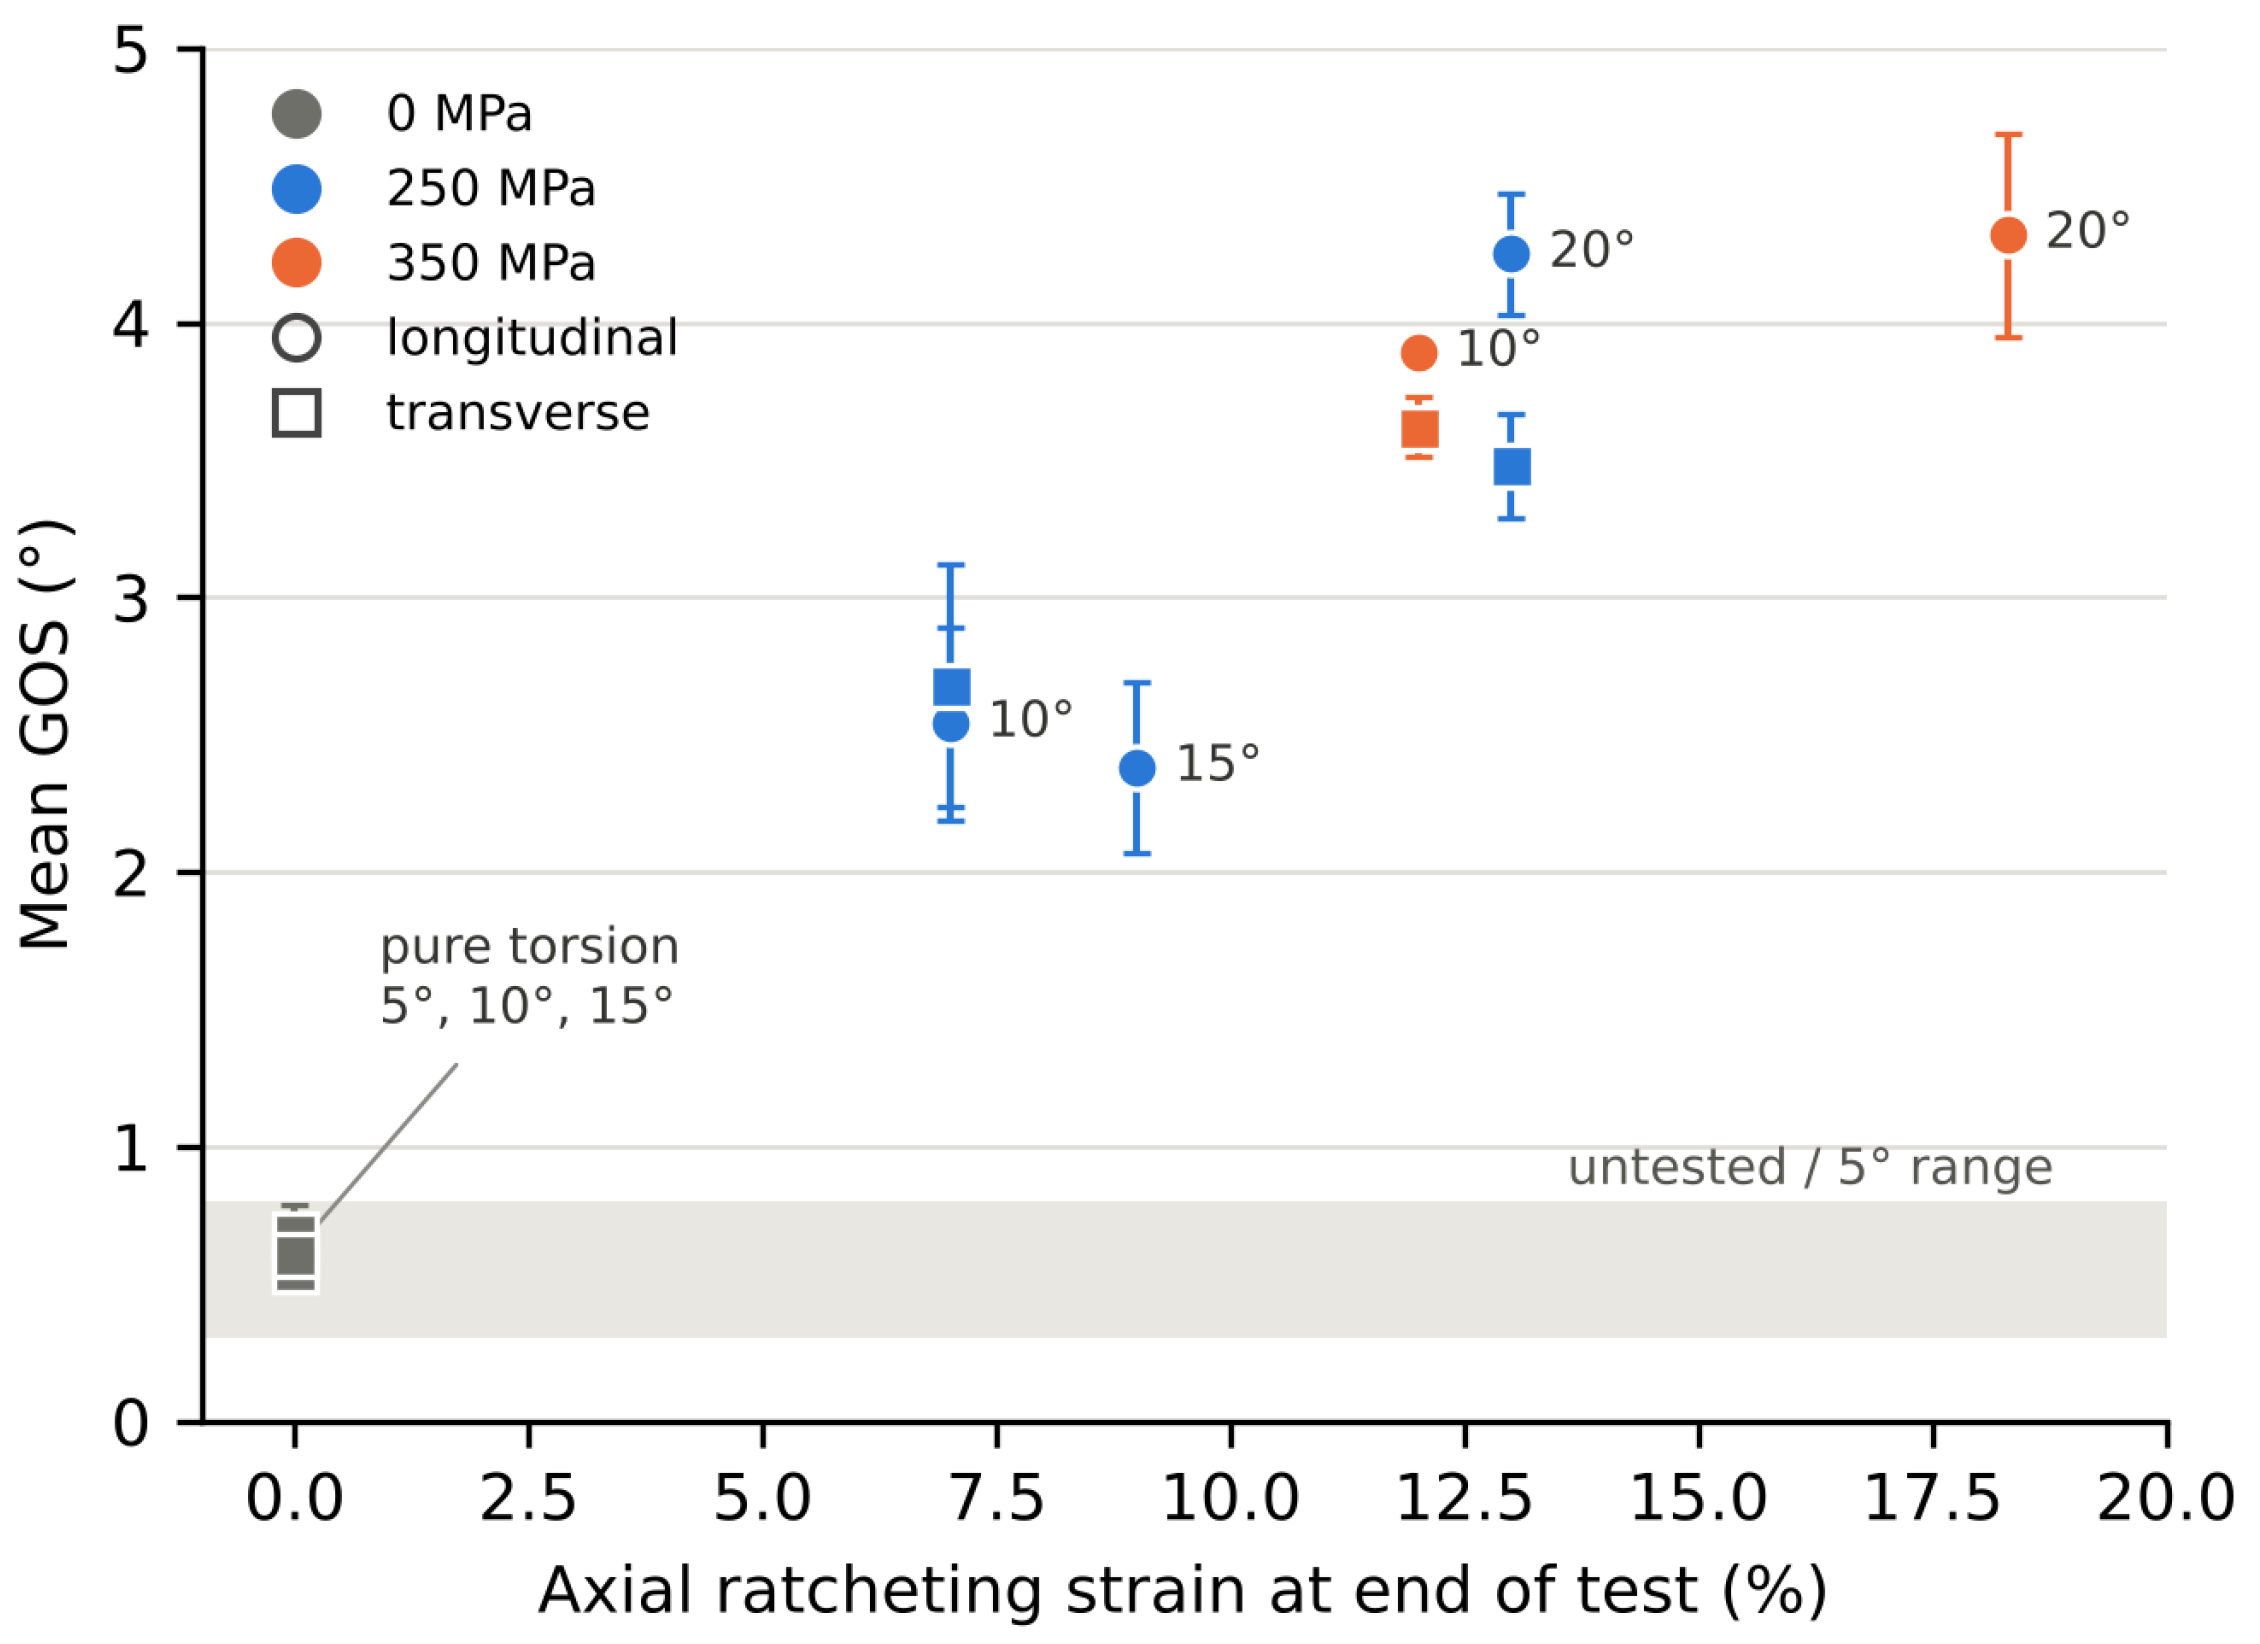
The main results are as follows. (i) Under pure torsion, GOS remained at the level of the untested material: 0.55–0.8° at 5–20°, compared with 0.76° for the untested transverse section, with P95 values (0.69–1.3°) in the same range. GOS did not increase from 5° to 15°, although the life decreased from 596,713 to 20,262 cycles. With the stabilised shear stresses (Section 3.3) and GPa, the elastic shear-strain range is about 0.65–0.7%. The imposed ranges at 10° and 15° (1.08% and 1.62%) exceed it, giving plastic shear-strain ranges of about 0.4% and 1.0%, consistent with the open hysteresis loops (Section 3.5); these specimens were cycled plastically but did not store lattice rotation. At 5°, the imposed range (0.54%) is comparable to the elastic range, so the cyclic plastic strain was small. (ii) At 5°, compression did not change GOS (0.70° at 250 MPa and 0.79° at 350 MPa). (iii) At 10° and 15°, GOS was four to seven times higher with compression than under pure torsion (2.4–2.7° at 250 MPa, 3.6–3.9° at 10°/350 MPa), and at 20° (4.3°) about five times the pure-torsion estimate; at 22.5°/250 MPa, for which no pure-torsion test exists, it reached 4.4°. The P95 values of these conditions were 4.4–8.1°. (iv) At 10°, raising the compressive stress from 250 to 350 MPa raised GOS by 53% in the longitudinal and 35% in the transverse section, whereas at 20° GOS hardly changed (4.25 and 4.32°) and only KAM increased (from 1.15 to 1.66°). Transverse sections gave the same ranking as longitudinal ones, with values mostly lower (by up to 18%), consistent with the lower shear strain at the smaller radii they sample. In the most strongly deformed specimens, the mean grain size decreased to 16–19 µm because deformation-induced boundaries above 5° subdivide the original grains (Section 2).
GOS thus did not follow the cyclic shear amplitude or the number of cycles, but the axial ratcheting strain (Figure 8). In the compressed tests at 10–20°, it increased from 2.4–2.7° at 7–9% ratcheting strain to 3.5–4.3° at 12–18%, and changed only slightly between 12% and 18%. At 20°, the deformation was also heterogeneous: the P95 of GOS (7.7–8.1°) was almost twice the mean (4.3°), and individual grains reached 14° (250 MPa) and 16° (350 MPa). Poole and Dunne [13] reported that, in a galling-resistant stainless steel, geometrically necessary dislocations accumulate where discrete slip bands intersect or are blocked by other bands, with densities at blocking sites at least three times those at simple crossing sites. Such interactions are a plausible explanation for the strongly rotated grains; at 20°/350 MPa they are consistent with the dense, intersecting slip bands observed by SEM (Section 3.1). The relation between GOS and ratcheting strain is interpreted in Section 4.
Figure 8.
Mean GOS (error bars: standard deviation between maps) versus the axial ratcheting strain at the end of the test. Grey band: GOS of the untested material and of the 5° specimens. Pure-torsion specimens have no axial ratcheting.
3.3. Stress State at the Stabilised Peak
The stress state at the stabilised peak of each test was obtained from the measured shear stress and the nominal static compressive stress using Equations (5)–(8) (Table 4, Figure 9). Under pure torsion, the HMH equivalent stress reached 71–91% of the yield strength and the Tresca equivalent stress 82–106%. Because the specimens at 10–20° were cycled plastically (see above), these values reflect the cyclic stress–strain response, not elastic behaviour. Superimposed compression raised the HMH equivalent stress to or above yield in every case, from 100% at 5°/250 MPa to 211% at 20°/350 MPa. The equivalent stresses therefore quantify the stress level of the cyclic plastic loading; they do not predict the stored lattice rotation, since at 5° compression raised the HMH stress from 91% to 100–102% of without changing GOS. Six equivalent stresses exceed the tensile strength of 934 MPa; these are cyclically hardened stresses at large strains, calculated with the elastic torsion formula, which overestimates the surface shear stress under plastic deformation (Section 2.2), and are compared with the monotonic engineering strength for orientation only.
Figure 9.
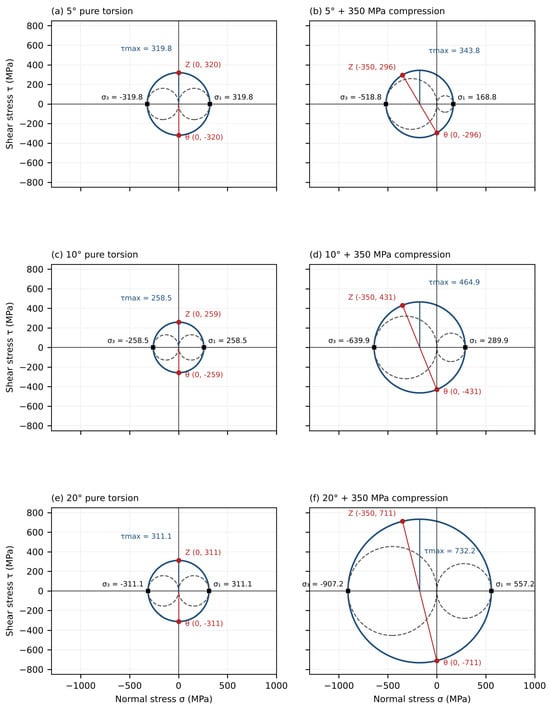
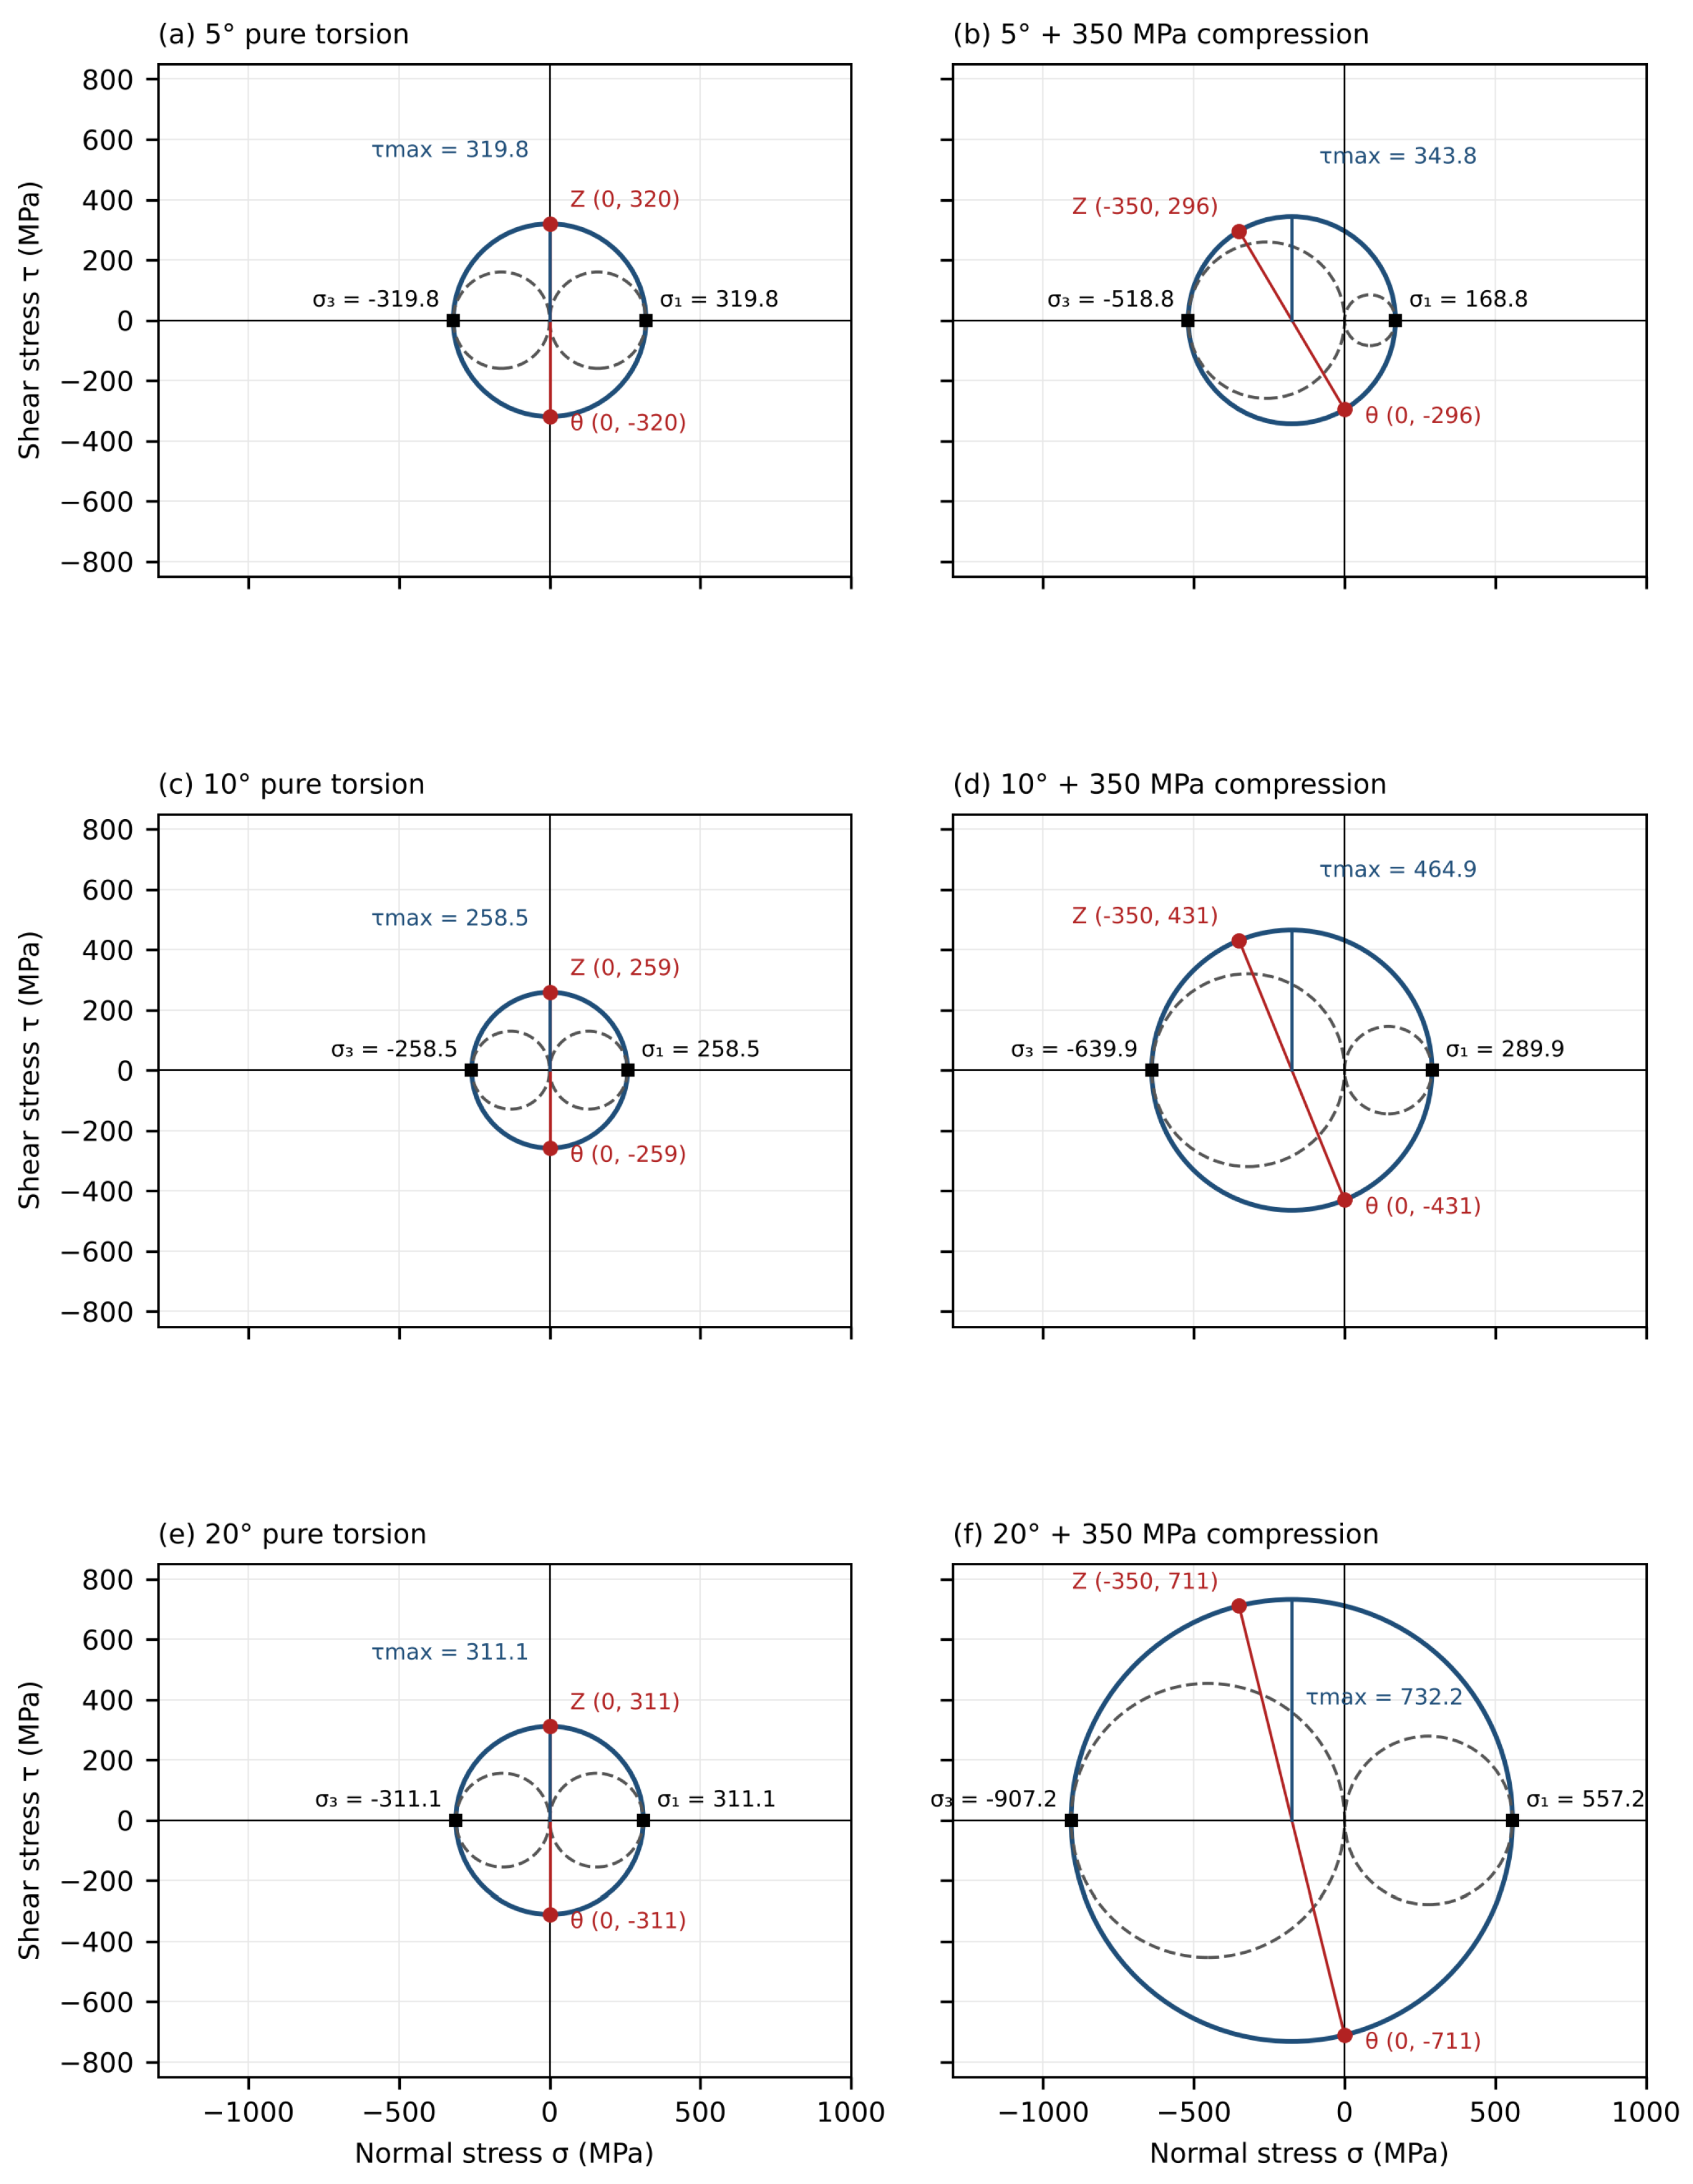
Mohr’s circles for the stabilised peak stress state under pure torsion (a,c,e) and with 350 MPa superimposed static compression (b,d,f) at twist angles of 5° (a,b), 10° (c,d) and 20° (e,f). Compressive stresses are negative; . Z and mark the stress states on the axial and circumferential planes. Solid circles: – (); dashed: – and –. All panels share the same axes.
The equivalent stresses alone cannot explain why compression extends the life at 5° but shortens it at larger twist angles: at 5° the HMH stress increases with compression, yet the life more than doubles (Section 3.6). The maximum principal stress does follow the life trend. At 5°, compression leaves the measured shear stress almost unchanged (318.1 and 295.9 MPa at 250 and 350 MPa, compared with 319.8 MPa). It therefore mainly shifts the Mohr circle towards negative normal stress (Figure 9a,b), and falls by 32% and 47%, to 216.7 and 168.8 MPa. This coincides with the more than two-fold increase in life (Section 3.6) and is consistent with a reduced crack-opening stress as assumed in crack-closure arguments.
At larger twist angles, compression raises the stabilised shear stress strongly (non-proportional hardening, Section 3.5), which enlarges the Mohr circle faster than the compression shifts it (Figure 9c–f). At 10°/250 MPa the two effects almost cancel: is unchanged (258.7 vs. 258.5 MPa), and the change in life () lies within typical fatigue scatter. At 10°/350 MPa, 15° and 20°, increases despite the superimposed compression, by 12% (10°/350 MPa), 25–51% (15°) and 52–79% (20°), and the life decreases by 38–64%. The reversal from beneficial to detrimental compression can thus be traced to a competition between two effects of the compressive stress: a shift of the Mohr circle towards compression, which lowers , and an enlargement of the circle through compression-enhanced cyclic hardening, which raises it. The shear stresses were calculated with the elastic torsion formula (Section 2.2), which overestimates the surface shear stress of a plastically deforming section by up to 25%. We therefore recalculated with the shear stresses at 10–20° reduced by 25%; at 5°, where the section remained nearly elastic, the values were kept. Compression still lowered at 5° and raised it at 15° (by 14–36%) and 20° (by 42–66%), but at 10° the change became negligible ( to ). Under this assumption, the link between and fatigue life is therefore retained at 5°, 15° and 20°, but not at 10°. At 10°, where the two effects of compression balance, does not explain the 64% shorter life at 350 MPa; this test is distinguished instead by a large ratcheting strain and a high GOS (Figure 8), as at 20°.
3.4. Taylor Factor Analysis
The Taylor factor was evaluated for the longitudinal sections as described in Section 2.3; the statistics are summarised in Table 5.
Table 5.
Full-constraint Taylor factor M of the longitudinal sections: mean ± standard deviation between n maps of the map mean, mean standard deviation within a map, and coefficient of variation (COV).
The mean Taylor factor was 2.91–3.05 for all conditions, close to the value for a random orientation distribution, and the COV was 0.14–0.18. The differences between conditions (at most 0.033 in COV) are comparable to the scatter between maps of the same specimen (up to 0.019), and the COV did not increase with rotation range or compressive stress: the highest value (0.176) was found at 20°/250 MPa and the lowest (0.143) at 10°/350 MPa. No pure-torsion condition could be evaluated because only transverse sections were available. The full-constraint Taylor factor therefore does not resolve the deformation differences between the conditions. This is expected: M depends only on the orientation, and lattice rotations of a few degrees (GOS 2.4–4.4°) change it little.
3.5. Hysteresis Loops and Energy Dissipation Analysis
Cyclic hysteresis-loop measurements provided direct insight into the deformation mechanics and energy-dissipation characteristics under varying twist angle and superimposed static compressive stress. Representative loops for four twist angles under the three loading conditions are shown in Figure 10.
Figure 10.
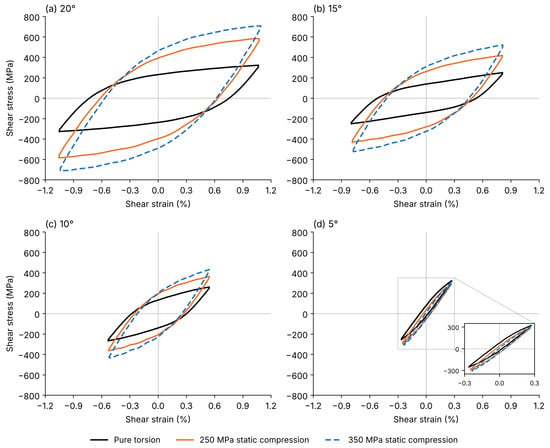
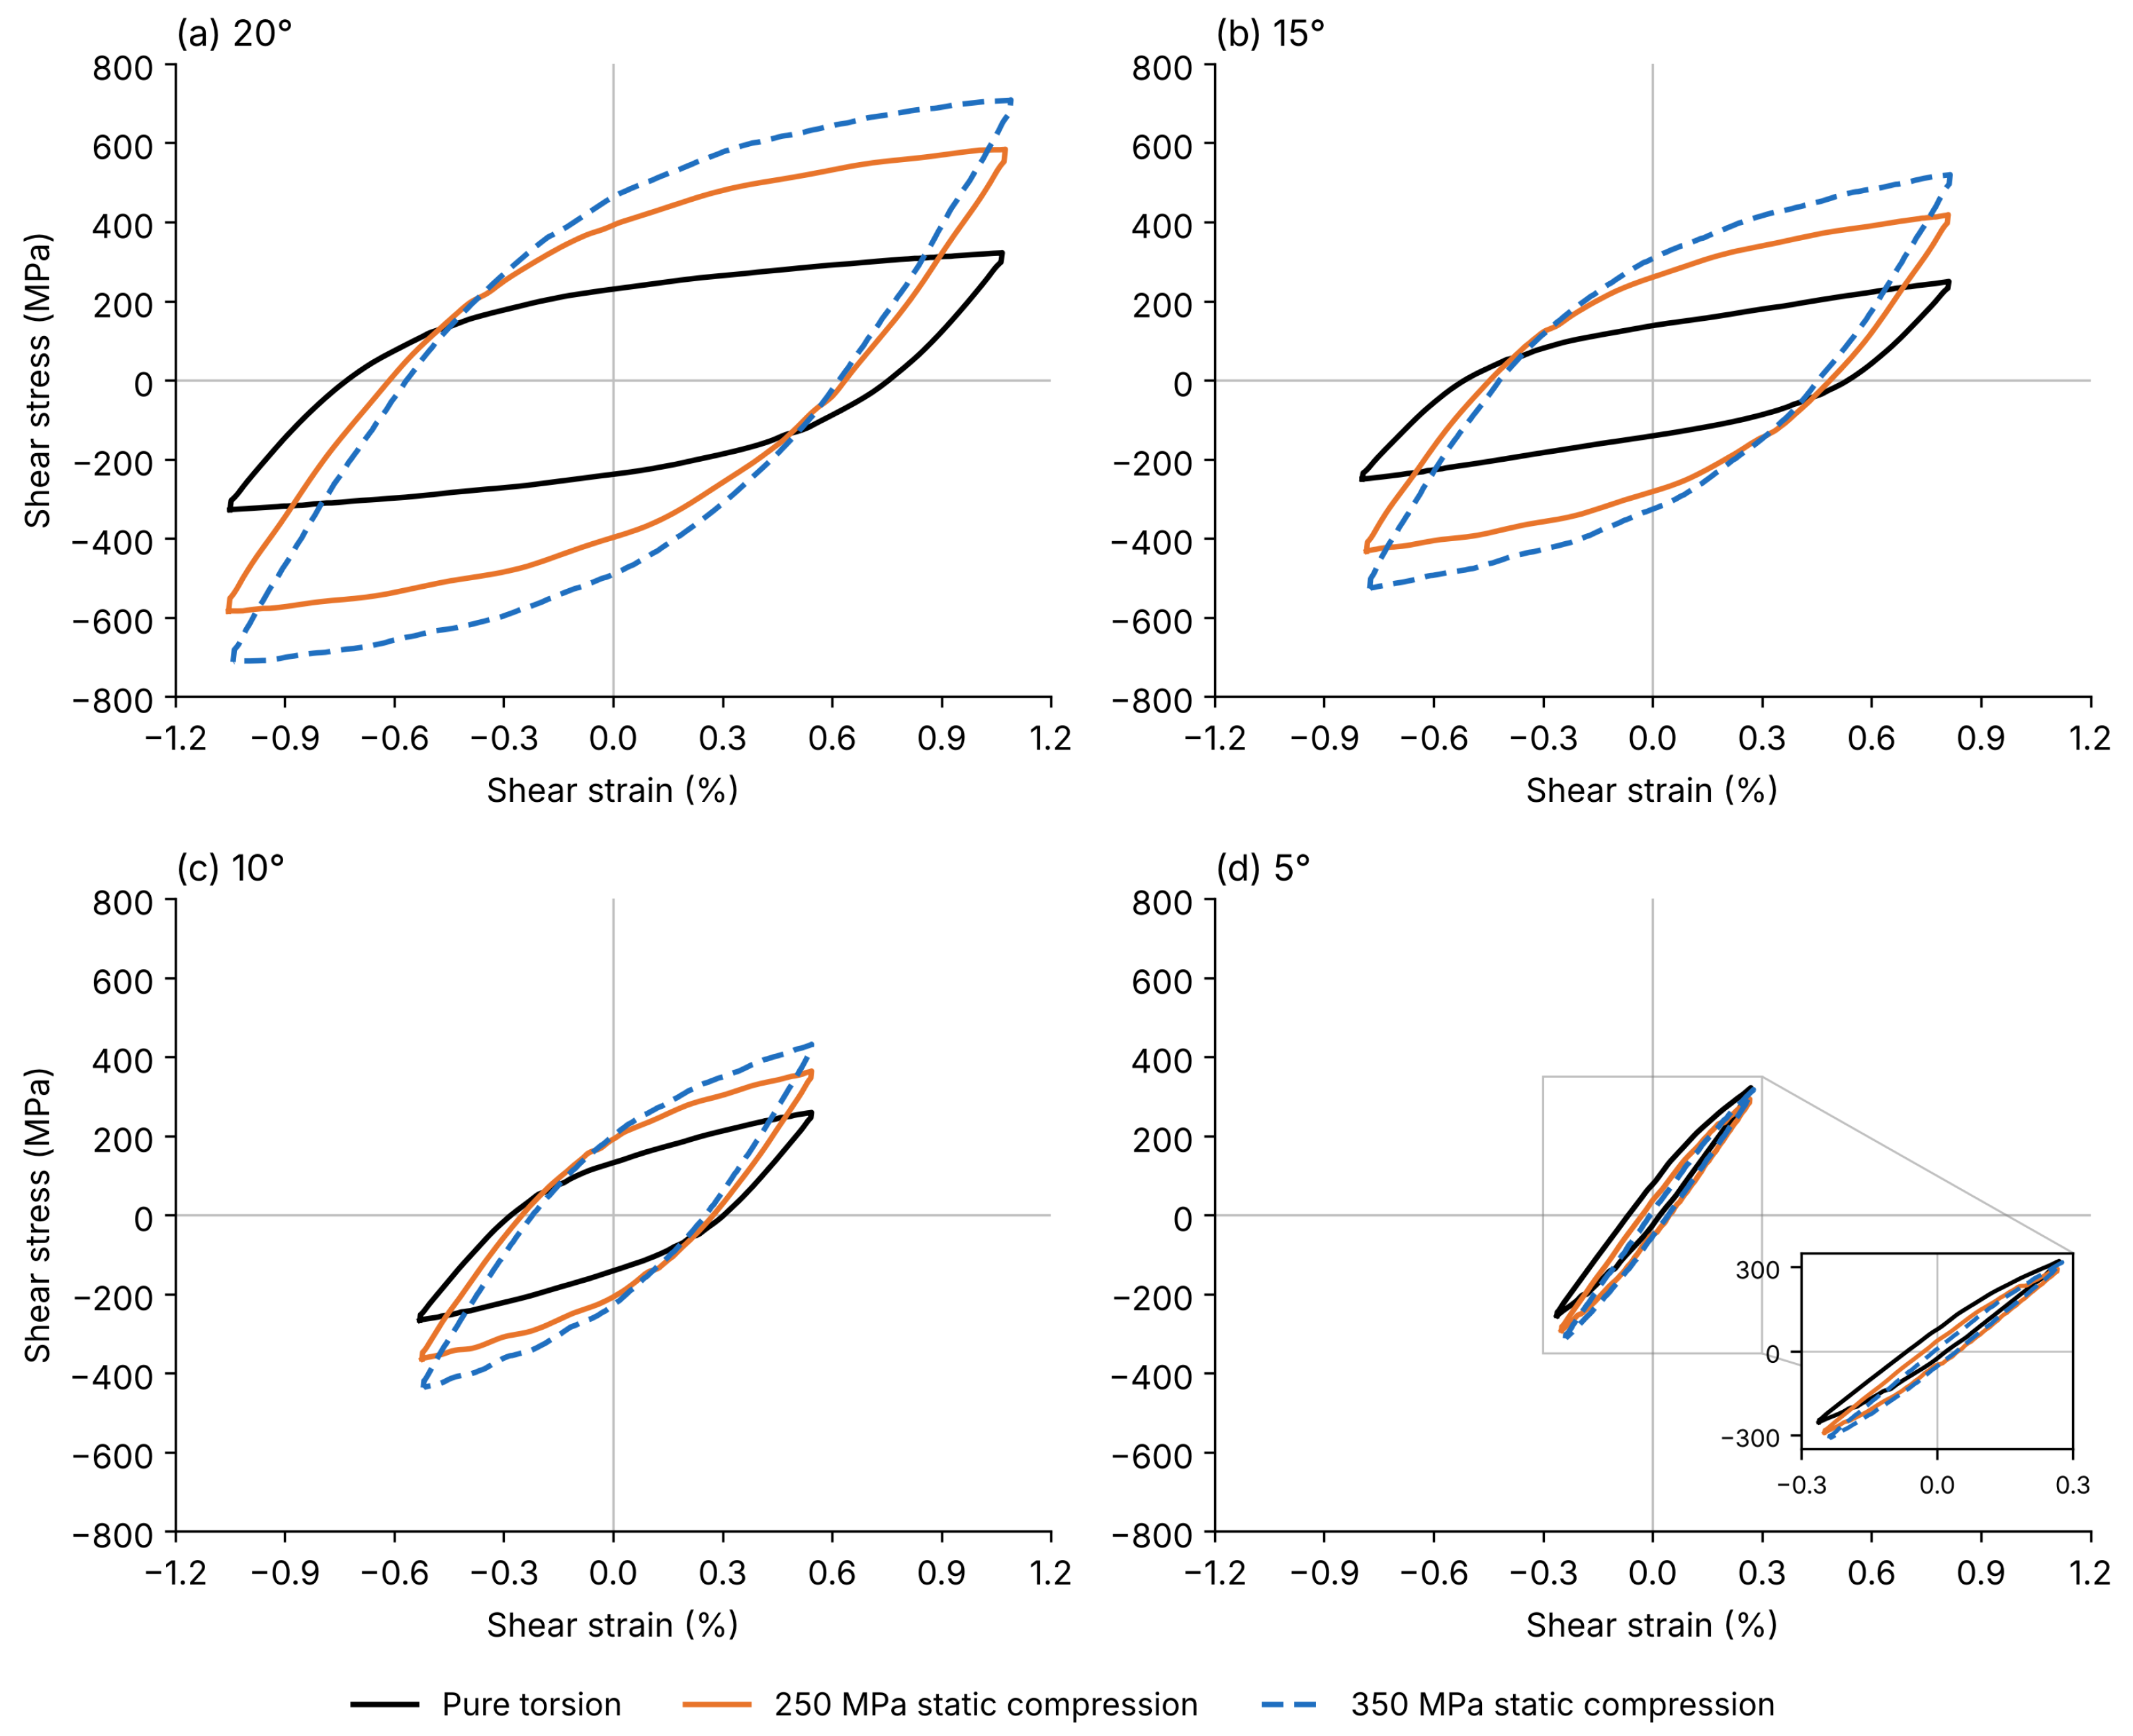
Representative hysteresis loops for (a) 20°, (b) 15°, (c) 10°, and (d) 5° twist angles, under pure torsion (black), torsion + 250 MPa compression (orange), and torsion + 350 MPa compression (blue dashed), plotted on common shear-stress and shear-strain axes. Because the 5° loops become very narrow on this scale, a magnified inset has been added to panel (d).
For pure torsion (black curves in Figure 10), the hysteresis loops remained comparatively narrow, particularly at 5°, indicating that although plastic deformation was activated, the elastic-strain contribution per cycle remained dominant relative to higher twist angles and combined torsion–compression loading. Although the rotation was applied at , the loops were nearly symmetric about the origin, i.e., the mean shear stress relaxed within the first 10–20 cycles, and energy dissipated per cycle was minimal; the low GOS of these specimens (Table 3) shows that this cyclic plastic strain left little stored lattice rotation. The normalised loop-area (energy density) values relative to the pure-torsion baseline at each twist angle are summarised in Table 6.
Table 6.
Normalised energy dissipated per cycle (loop area), relative to the pure-torsion baseline, for each twist angle and compressive stress.
When 250 MPa compressive stress was introduced (orange curves in Figure 10), the hysteresis loops became markedly wider and reached higher shear stresses, especially at higher twist angles. At 350 MPa (blue dashed curves), loops at larger twist angles (≥15°) exhibited noticeable widening and a slightly more rounded, elliptical shape, indicating increased cyclic plasticity. The associated rise in energy dissipation (up to approximately 2.62× the pure-torsion value at 20°/350 MPa) corresponds with the heat tinting and surface roughening observed macroscopically (Figure 4) and with the elevated intragranular misorientation measured by EBSD (Table 3).
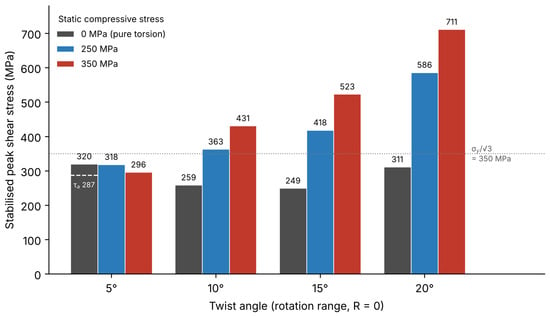
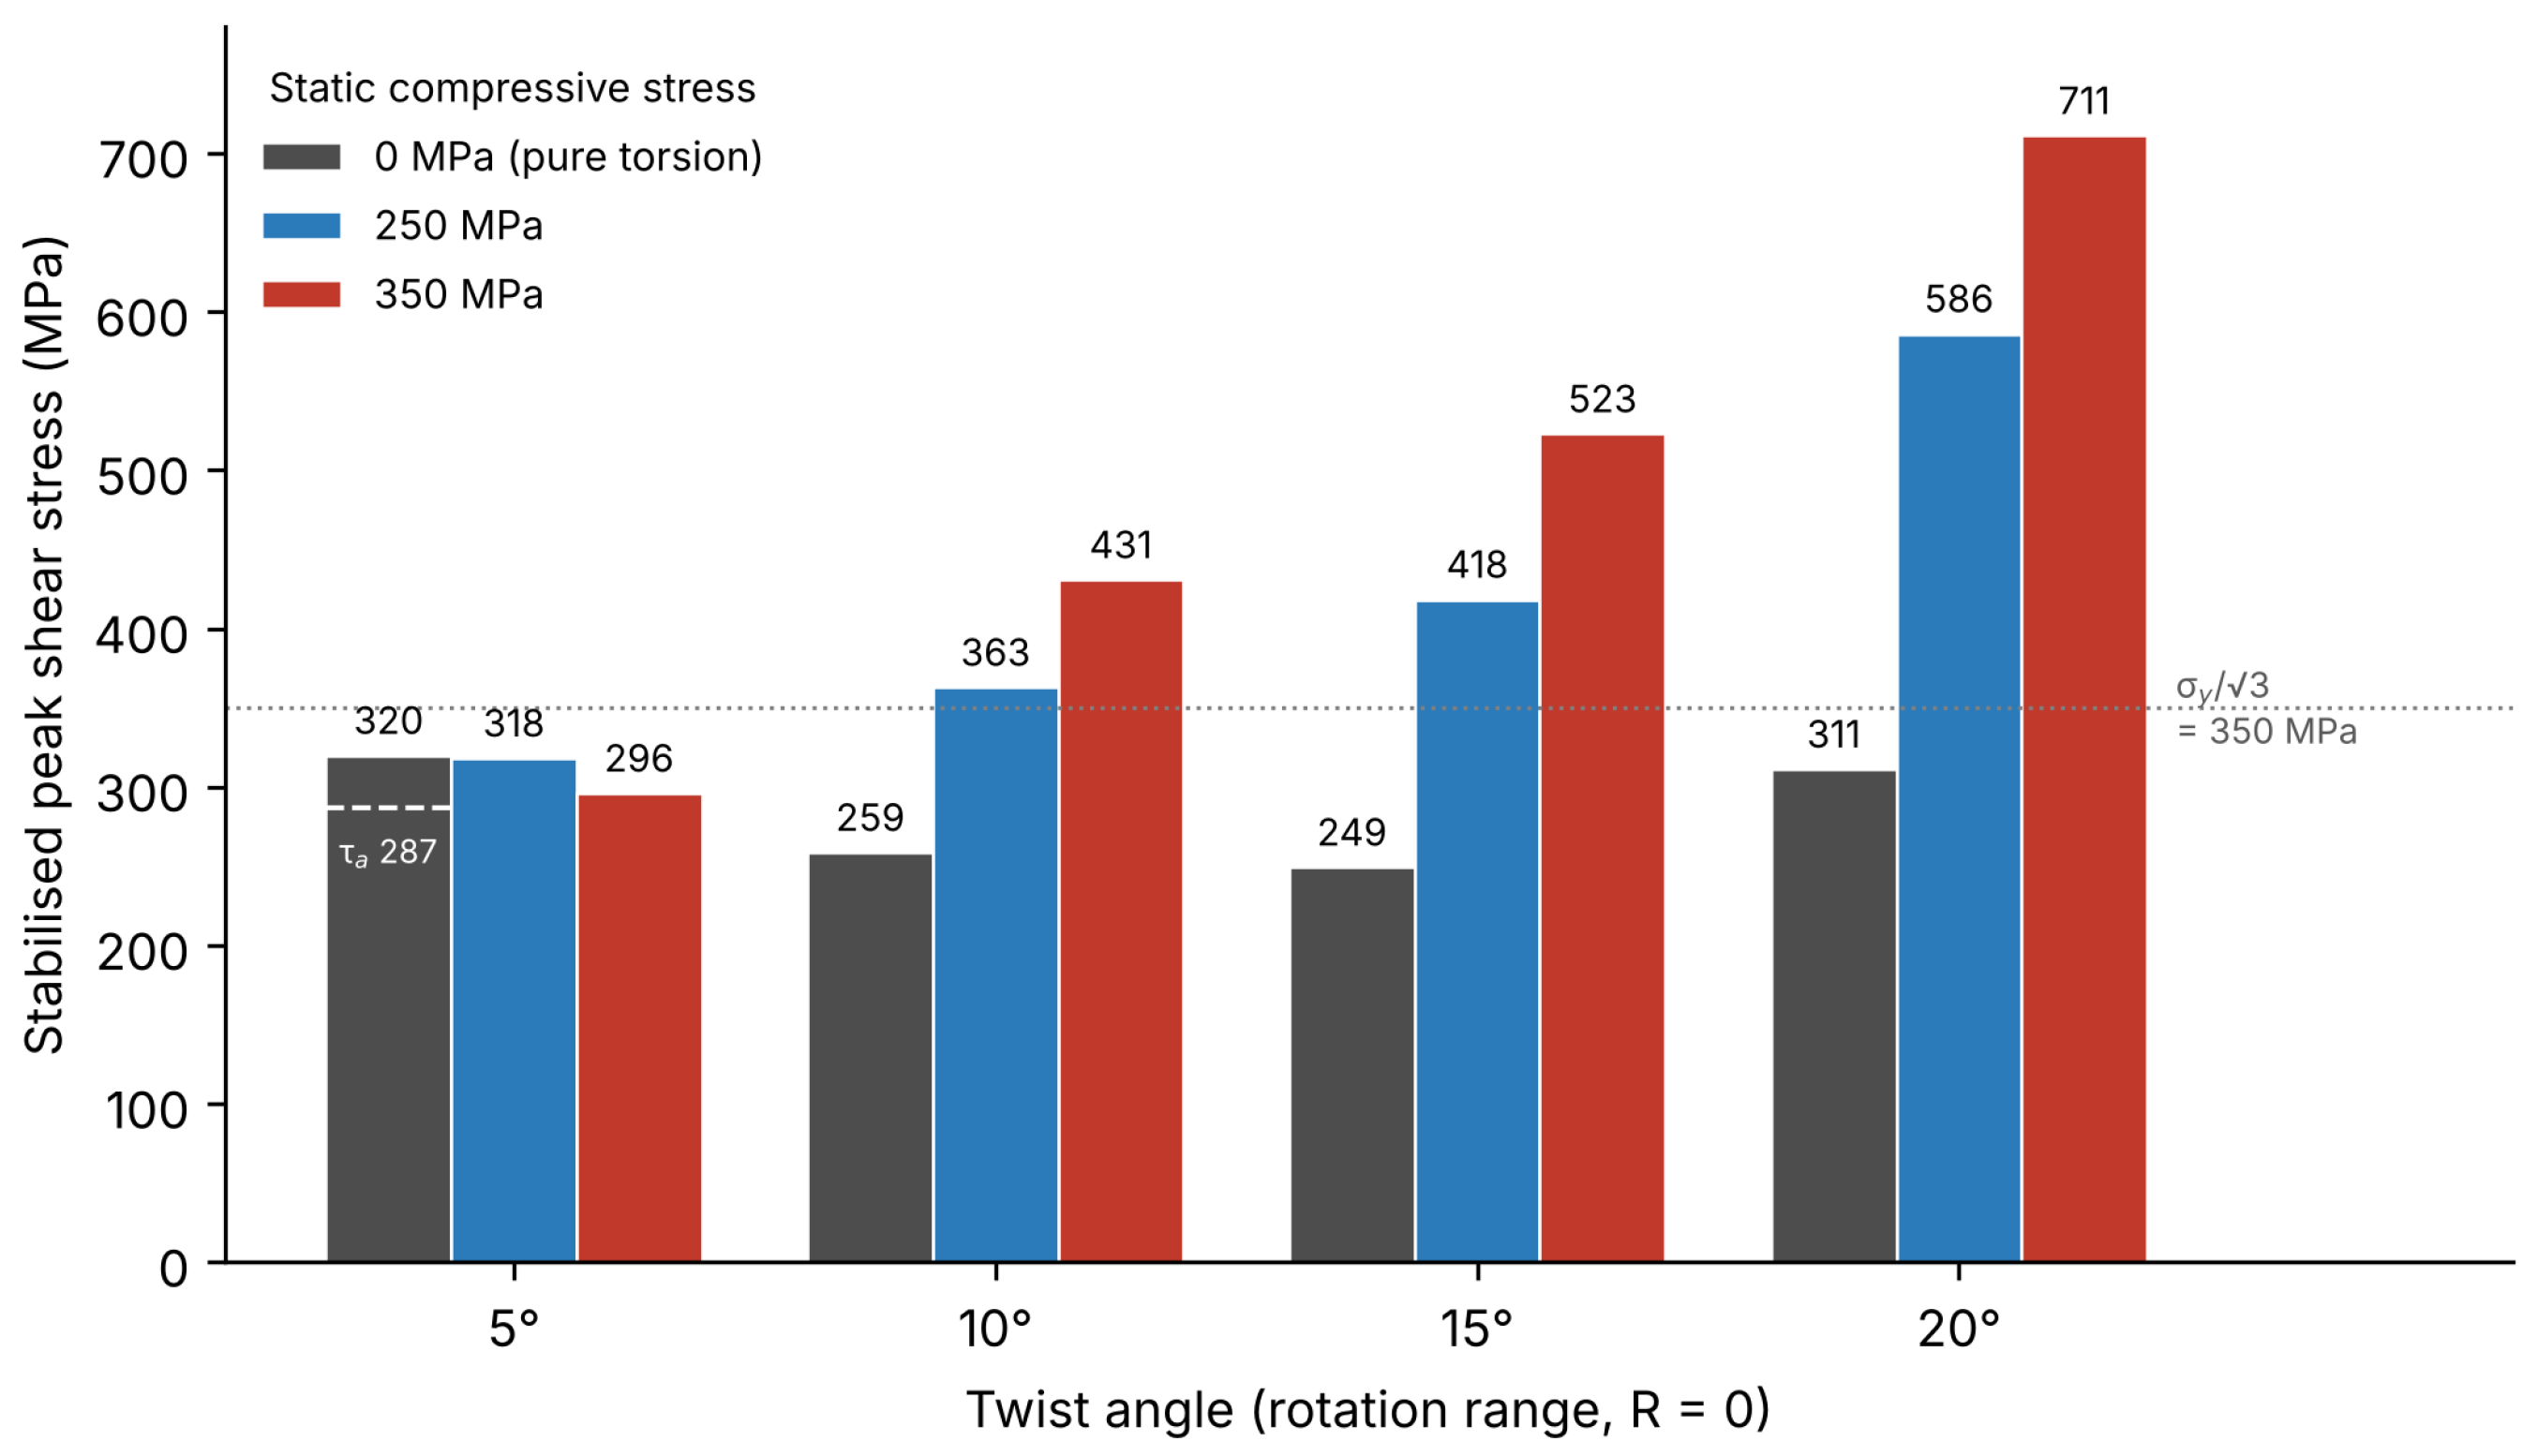
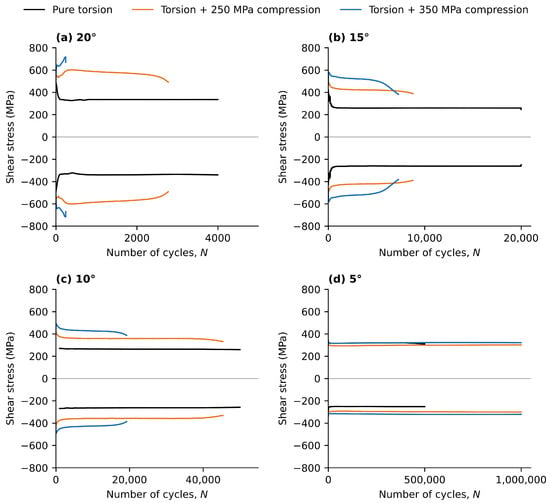
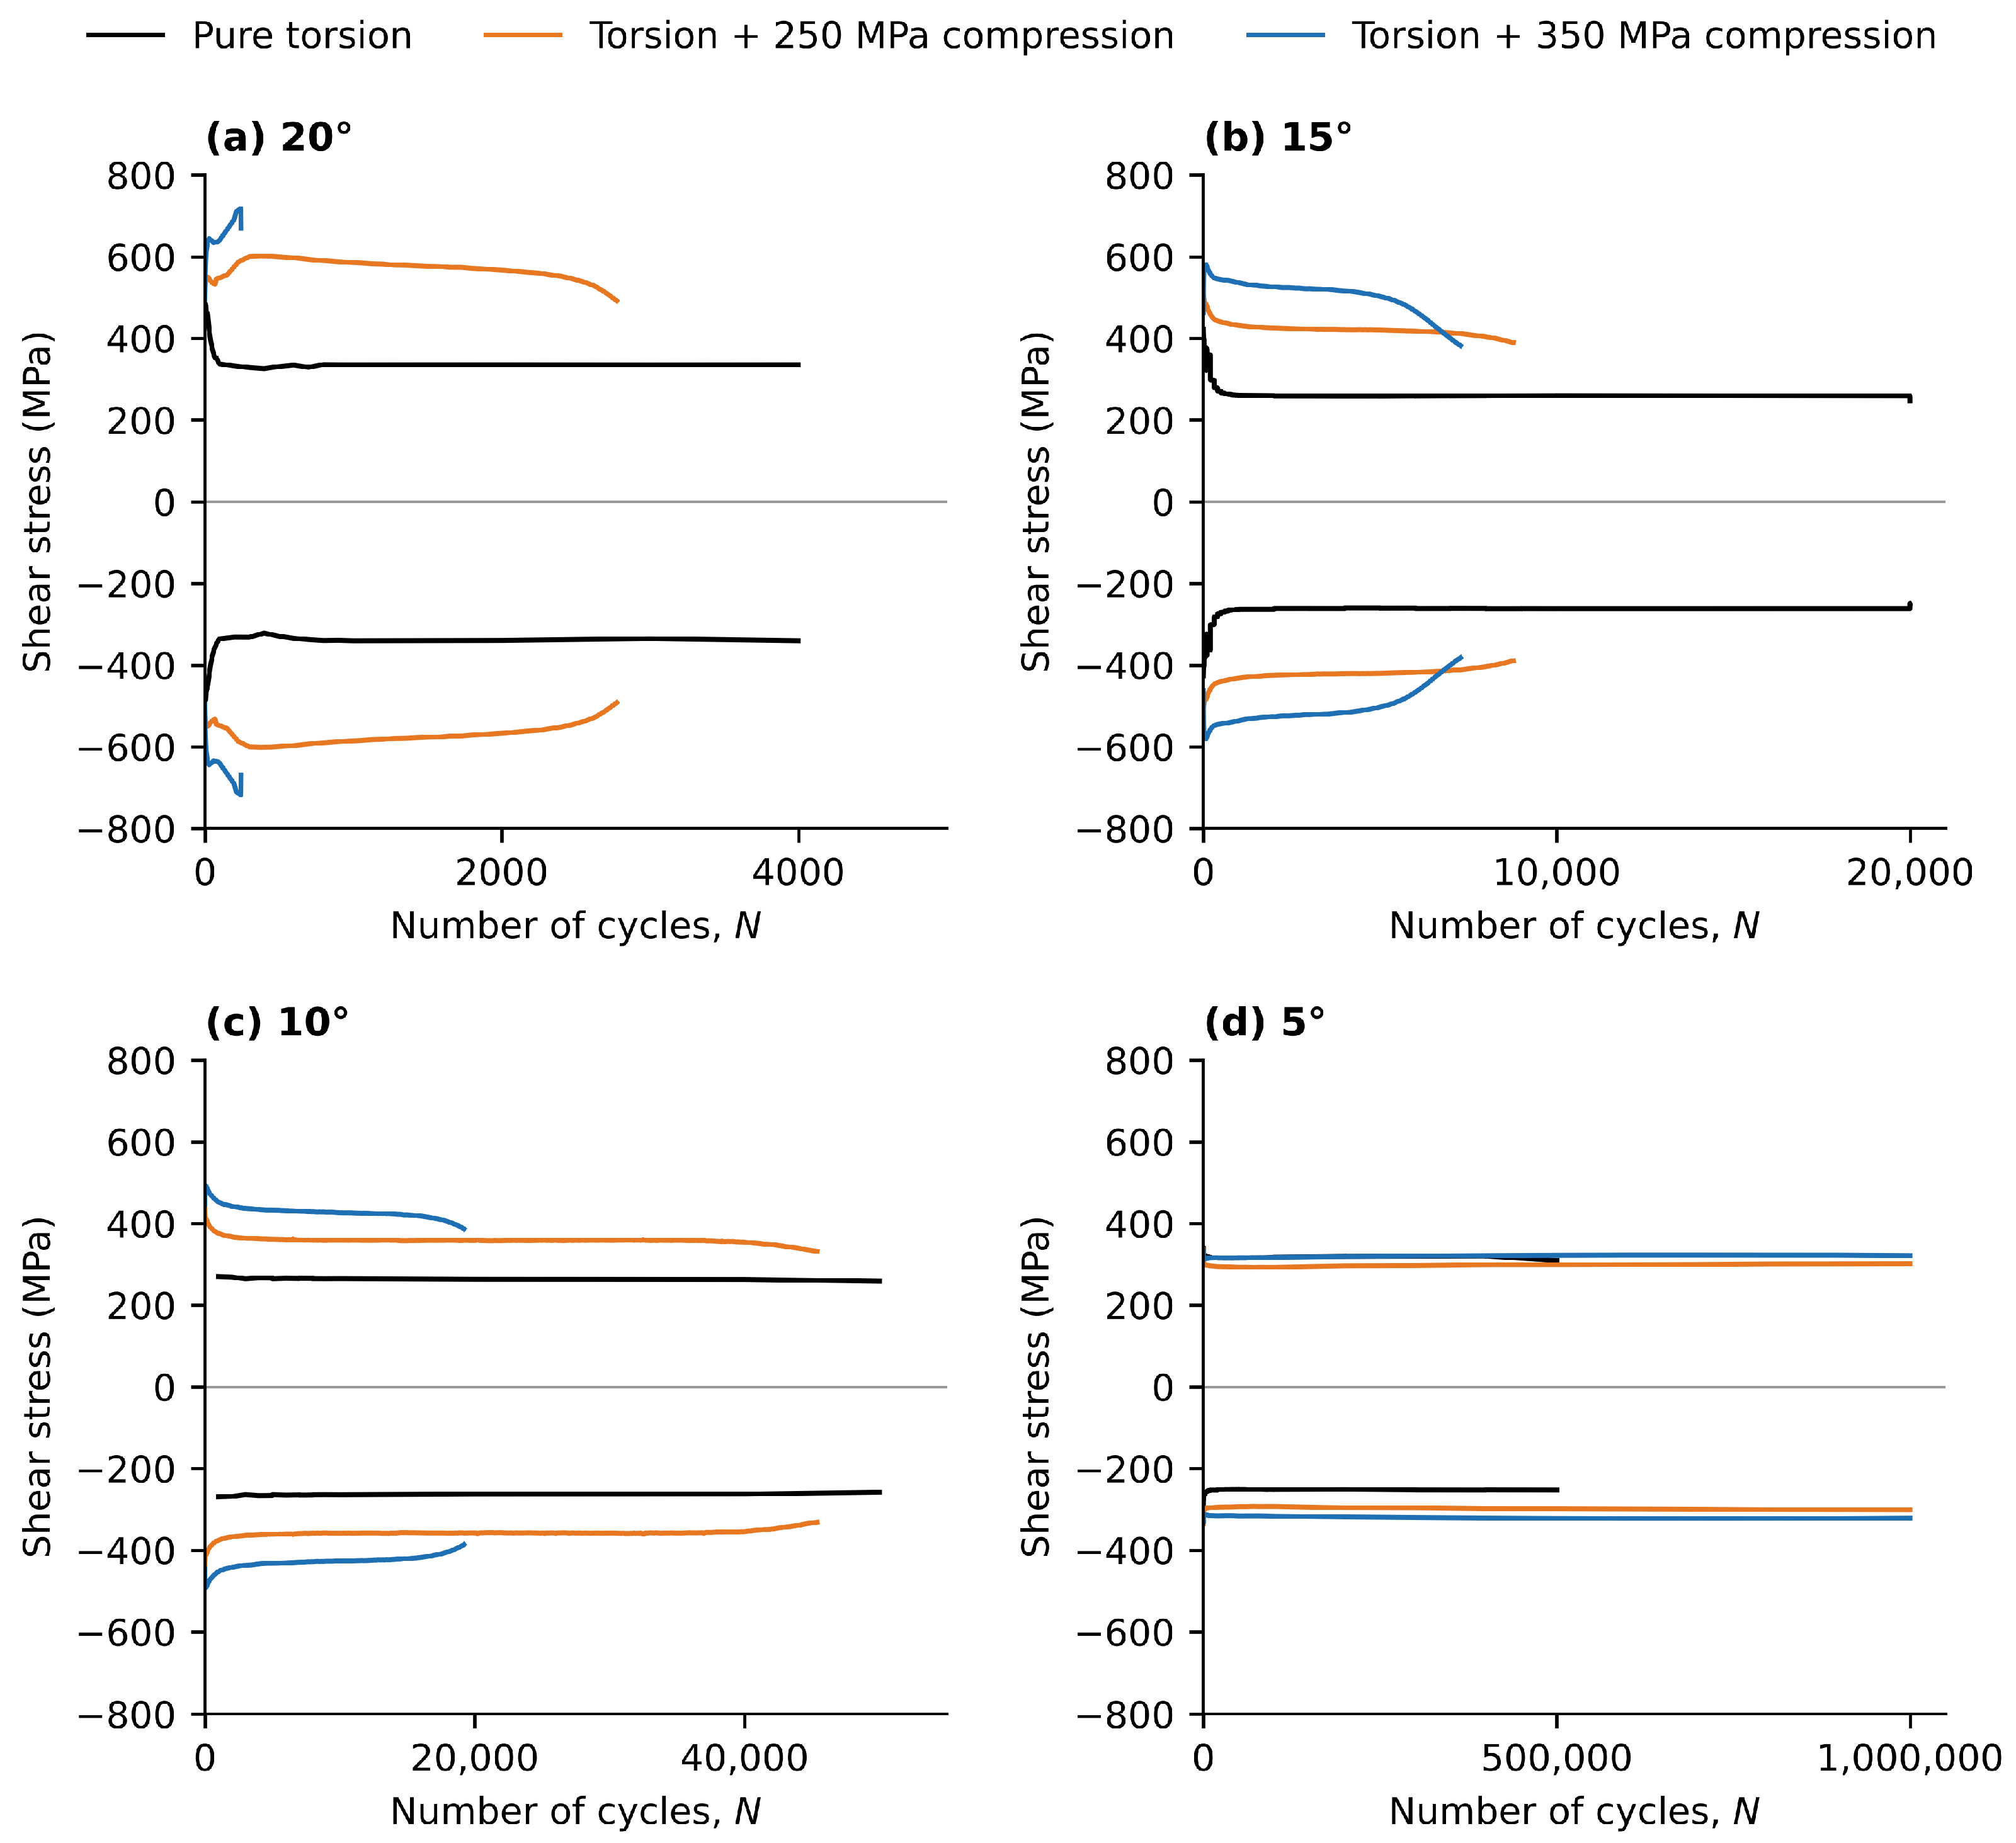
At 5°, asymmetry was only observed in the pure-torsion case, where peak shear stresses of MPa and MPa indicated incomplete mean-stress relaxation at this small rotation range; the same asymmetry (about and MPa) was observed at 5° in REX 734 under the same loading, where the mean shear stress was shifted by plastic flow (fast torsional ratcheting) but, unlike at larger angles, not completely to zero [10]. With static compression applied, the peak stresses became nearly symmetric, indicating that the imposed compressive stress homogenised slip behaviour. Figure 11 presents the stabilised peak shear stress at each rotation range, grouped by loading condition. These values describe the stabilised cyclic stress–strain response at different rotation ranges; they are not a measure of cyclic hardening or softening, which refer to the evolution of the stress within a test (Figure 12). Within each test, the shear stress passed through an initial phase of cyclic softening or hardening, depending on rotation range and compressive stress, before reaching a stable or slowly changing level (Figure 12); initial cyclic softening followed by stabilisation was also reported for REX 734 under the same loading [10]. With superimposed compression, the stabilised peak shear stress increased monotonically with rotation range, from 318.1 to 586.0 MPa at 250 MPa and from 295.9 to 711.0 MPa at 350 MPa, and at 10–20° it was 19–25% higher at 350 MPa than at 250 MPa; compression therefore raised the cyclic stress–strain response. Under pure torsion, by contrast, the stabilised peak shear stress decreased from 319.8 MPa at 5° to 249.2 MPa at 15° despite the larger strain range, before rising to 311.1 MPa at 20°. A stress that decreases with increasing strain range is unusual; at 5°, part of the difference arises from the incomplete mean-stress relaxation (the stress amplitude is 286.6 MPa rather than 319.8 MPa). The cause of the remaining trend could not be resolved from the present data.
Figure 11.
Stabilised (half-life) peak shear stress versus twist angle at a superimposed static compressive stress of 0, 250 and 350 MPa (one test per condition; common vertical axis). Dashed line in the 5° pure-torsion bar: stress amplitude (286.6 MPa), lower than the peak stress because of incomplete mean-stress relaxation. Dotted line: monotonic shear yield stress according to HMH, .
Figure 12.
Maximum and minimum shear stress per cycle versus number of cycles for twist angles of (a) 20°, (b) 15°, (c) 10° and (d) 5°, under pure torsion (black), torsion + 250 MPa static compression (orange) and torsion + 350 MPa static compression (blue). The 20°/350 MPa test was stopped by axial ratcheting after 244 cycles.
The higher stabilised shear stress under compression coincides with the increase in GOS. At 5°, where compression left the shear stress almost unchanged (319.8, 318.1 and 295.9 MPa), GOS was also unchanged (0.68–0.79°), whereas at 10° the shear stress rose from 258.5 to 362.8 and 430.7 MPa and GOS from 0.55° to 2.5–2.7° and 3.6–3.9° (Table 3). A likely origin of the higher shear stress is non-proportional hardening. Under pure torsion at , the principal stress directions remain fixed at 45° to the specimen axis whenever , so the loading is proportional. With a superimposed static compressive stress, the stress at is uniaxial compression along the axis, whereas at the peak shear stress the principal directions are rotated by 30–39° from the axis (Table 4); the principal directions therefore rotate in every cycle. Such rotation activates slip, including cross-slip, on additional systems and produces additional (non-proportional) cyclic hardening, which is particularly pronounced in austenitic steels with low stacking fault energy [10,34].
At 5°, the loop area changed little with compression (normalised values of 1.02 and 1.10 at 250 and 350 MPa; Table 6), consistent with the unchanged stabilised shear stress and the unchanged GOS at this rotation range. At larger twist angles, the loops widened markedly under compression.
3.6. Cyclic Stress–Life (S-N) Behaviour
The cyclic stress–life curves (Figure 12) provide a complementary view of the mechanical response, capturing the progressive stress degradation during fatigue cycling.
In pure torsion (black curves), all twist angles exhibited gradual stress-amplitude reduction, with the slope of the decay becoming steeper at higher twist angles due to increased shear strain-energy input. At 5°, stress decay was modest and the lives were long, while at 20°, rapid decay indicated severe cyclic damage accumulation. At the largest twist angles, the stress fluctuated during the first few hundred cycles before a steady cyclic response was reached. These fluctuations may be related to the initial cyclic softening or hardening and to the self-heating of the gauge section, which reached its highest temperatures at these rotation ranges (Table 2); the present data do not allow the two contributions to be separated.
The corresponding cycles to failure and the percentage change relative to pure torsion are summarised in Table 7.
Table 7.
Cycles to failure and relative change compared to pure torsion (; test details in Table 2).
The results in Table 7 show a strong dependence of fatigue life on both twist angle and superimposed compressive stress. Under pure torsion, cycles to failure decrease sharply with increasing twist angle, from nearly cycles at 5° to fewer than cycles at 20°, as expected from the larger plastic-strain amplitudes at higher twist angle. The tests were well reproducible. The repeat test at 10°/250 MPa reached 56,703 cycles compared with 45,450 cycles (a factor of 1.25), with almost identical shear-stress and compressive-strain curves. Tests at with the same rotation range gave nearly the same lives as those at : 8999 vs. 8814 cycles at 15° and 2635 vs. 2827 cycles at 20° (250 MPa), i.e., within 7%, so the loading ratio has no significant influence at these rotation ranges. Differences in life smaller than a factor of about 1.3 are therefore not interpreted; in particular, the change at 10°/250 MPa ( and for the two tests) is not significant.
All compressed tests showed progressive axial ratcheting, with most of the compressive strain accumulating in the first 500–2000 cycles. At the end of the tests, the compressive strain over the reduced section reached about 7%, 9% and 13% at 10°, 15° and 20° under 250 MPa, and about 12% and 17% at 10° and 15° under 350 MPa, and 18.3% at the stop of the 20°/350 MPa test. Ratcheting therefore accompanied fatigue damage in all compressed tests, and at 20°/350 MPa it governed the end of the test. Comparable behaviour was reported for REX 734 under the same loading, with ratcheting strains that increased approximately linearly with rotation angle and compressive stress, accumulated mainly in the initial phase, and reached 0.55% at 5°/250 MPa and 10.4% and 14.4% at 15° under 250 and 350 MPa [10], and for P558 under three of the present load cases [22].
At small twist angle (5°), adding compression markedly improves life: at 5/250 and 5/350, the specimens endure more than twice as many cycles as under pure torsion. This behaviour is consistent with crack-closure arguments, whereby superimposed compression lowers the effective normal stress on prospective crack planes, delaying crack opening and early propagation [15,16], and with the 32–47% lower maximum principal stress at this twist angle (Table 4); it may also stabilise the dislocation substructure and suppress early strain localisation.
At intermediate twist angles (10° and 15°), the effect of compression becomes detrimental. Relative to pure torsion, life is unchanged within scatter at 10°/250 MPa and for the two tests) but shorter at 15°/250 MPa (); raising compression to 350 MPa further shortens life at both angles. This trend suggests that any closure benefit is outweighed by accelerated damage accumulation driven by increased and more heterogeneous plastic strain: this is consistent with the four- to seven-fold higher GOS at 10° and 15° under compression (Section 3.2), with the near-doubling of normalised hysteresis energy dissipation at 10–15° under 350 MPa (Table 6), and with the increase in maximum principal stress under compression at these conditions (Table 4).
At the highest twist angle examined (20°), compression shortens the life by 38% at 250 MPa. At 350 MPa, the test was stopped after 244 cycles when the specimen height had decreased by more than 5%. This indicates progressive axial ratcheting, as previously observed for P558 under cyclic torsion with static compression [22], rather than fatigue failure; the result is therefore not included in the fatigue-life comparison. Ratcheting at this condition is consistent with an HMH equivalent stress of 211% of the yield strength (Table 4), and it is the condition with the highest mean KAM (1.66°) and the highest normalised loop area (2.62); its GOS (4.32°) was similar to that at 20°/250 MPa (4.25°).
4. Discussion
The results can be summarised by twist angle. In pure torsion, cracks form on 45° planes at long lives and the hysteresis loops are narrow; although the specimens at 10° and 15° were cycled plastically, GOS remains at the level of the untested material at 5–20°. At 5°, compression changes neither the cyclic shear stress nor GOS, and its dominant effect is an improvement in fatigue life, consistent with crack closure and reflected in a lower maximum principal stress (Section 3.3 and Section 3.6). At 10–15° with compression, GOS is four to seven times higher than under pure torsion, the hysteresis loops widen, the stabilised shear stress and the maximum principal stress rise, and the fatigue life decreases. At the highest twist angles with compression, axial cracking becomes dominant, GOS reaches 3.5–4.4° with individual grains rotated by up to 14–16°, hysteresis energy dissipation more than doubles relative to pure torsion, and at 350 MPa the test ends after 244 cycles by axial ratcheting.
The EBSD results identify what the superimposed compression changes at the grain scale. Under angle-controlled torsion at , the rotation is prescribed between fixed limits and the mean shear stress relaxes within 10–20 cycles (Section 3.5). The plastic shear imposed in the forward half-cycle is then reversed in the backward half-cycle, and the specimen cannot accumulate net plastic shear. The lattice rotations produced by forward slip are largely undone by reverse slip, which is favoured by the planar slip of this low-SFE steel, so that little rotation is stored even after – cycles. With a static compressive load, by contrast, the axial direction is load-controlled: in every cycle in which the combined stress state reaches yield, an increment of axial plastic shortening is added that is not reversed, i.e., the specimen ratchets (Section 3.6). This unidirectional plastic strain, 7–18% at the end of the tests, rotates the lattice in the same sense cycle after cycle, and this is the rotation that GOS measures. Three observations support this interpretation. First, GOS followed the ratcheting strain rather than the cyclic shear amplitude, the equivalent stress or the number of cycles (Figure 8); it remained at the untested level in all tests without ratcheting, including pure torsion at 15°. Second, at 5°, where compression did not raise the cyclic shear stress and where the ratcheting strain in REX 734 under the same loading was only 0.55% [10], compression did not change GOS. Third, EBSD misorientation is known to increase with monotonic plastic strain in austenitic stainless steels [35], whereas after low-cycle fatigue it is much smaller than the cumulative cyclic plastic strain would suggest [36], consistent with the reversibility of cyclic slip argued here. GOS changed only slightly above about 12% ratcheting strain, and at 20°/350 and 22.5°/250 MPa deformation-induced boundaries above 5° reduced the measured grain size to 16–19 µm; at the largest strains, further deformation is therefore accommodated increasingly by grain subdivision rather than by a further rise in GOS. With one specimen per condition, the relation between GOS and ratcheting strain is a correlation, not a calibration.
The same mechanism may explain why compression shortens the fatigue life at larger twist angles although it lowers the normal stress on the shear planes. Where it causes ratcheting, compression adds a unidirectional plastic strain to the cyclic one; this coincides with the higher cyclic shear stress (non-proportional hardening, Section 3.5) that raises (Section 3.3), and the ratcheting produces tensile circumferential surface stresses that open axial cracks [10]. At 5 °, where neither the shear stress nor the lattice rotation was changed, only the closure effect of compression remains, and the life more than doubles.
The crack orientations can be related to critical-plane parameters. Under torsion, the planes of maximum shear stress are the transverse and the longitudinal planes, and the 45° planes are those of maximum principal stress. The 45° cracks of the long-life pure-torsion specimens (Figure 4a) therefore correspond to tensile, -controlled crack growth, as described by normal-stress-based parameters [33]. Superimposed compression acts as a normal stress only on the transverse plane, whereas the longitudinal plane carries the same shear stress without a normal stress. Shear-based parameters that include the normal stress on the critical plane, such as those of Findley [37] and Fatemi and Socie [38], therefore favour the longitudinal plane once compression is applied, in agreement with the axial cracks at large rotation ranges with compression (Figure 4b). The tensile circumferential surface stresses produced by axial ratcheting, proposed for REX 734 [10], may additionally open these cracks. A quantitative critical-plane analysis using the measured stress states (Table 4) was outside the scope of the present microstructural study.
Several points remain open. Most conditions were tested once, so the life differences are interpreted only where they exceed the scatter of the repeat and tests (a factor of about 1.3). The relation between GOS and ratcheting strain rests on end-of-test strains of tests with different lives and on one to six maps per condition; whether lattice rotation and ratcheting strain develop together during a test was not measured. The pure-torsion maps were recorded in a separate session with a lower indexing rate, and the value for 20° pure torsion is an estimate from one map. The shear stresses were calculated with the elastic torsion formula, so the stress analysis is less certain at large twist angles (Section 3.3). Finally, the decrease in the stabilised shear stress under pure torsion from 5° to 15° is not explained. The companion study on cold-deformed P558 under the same loading will test whether prior plastic strain changes the response described here.
5. Conclusions
This study examined why a superimposed static compressive stress (0, 250 and 350 MPa) can either extend or shorten the torsional fatigue life of P558 austenitic stainless steel, at rotation ranges of 5–20° and, in one test, 22.5°. The main findings are:
- Fatigue life: compression more than doubled the life at 5°, but reduced it by 38–64% at 10°/350 MPa, 15° and 20°/250 MPa; at 10°/250 MPa the change () was within scatter, and at 20°/350 MPa the test was stopped by axial ratcheting after 244 cycles. A repeat test and two tests at reproduced the lives within a factor of 1.25.
- Surface damage: with increasing rotation range and compressive stress, cracking changed from cracks inclined at 45° under pure torsion to axial cracks with heavy oxide tinting and dense, intersecting slip bands at the largest rotation ranges with compression.
- Stored lattice rotation: GOS remained at the level of the untested material under pure torsion (0.55–0.68° at 5–15°, about 0.8° at 20°) and at 5° with compression (0.70–0.79°). With compression, it rose to 2.4–2.7° at 10–15°/250 MPa, 3.6–3.9° at 10°/350 MPa and 4.3–4.4° at 20–22.5°, i.e., four to seven times the pure-torsion value. GOS followed the axial ratcheting strain (7–18% at the end of the tests), not the cyclic shear amplitude or the equivalent stress; the pure-torsion specimens at 10° and 15° were cycled plastically without storing lattice rotation.
- The full-constraint Taylor factor of the longitudinal sections (mean 2.91–3.05) did not differ systematically between conditions.
- Stresses and energy: compression raised the stabilised peak shear stress at 10–20° (by 19–25% from 250 to 350 MPa) and the normalised hysteresis energy up to 2.62 times the pure-torsion value. The maximum principal stress changed in the opposite direction to the life: it fell by 32–47% at 5° and rose by 12–79% at 10°/350 MPa, 15° and 20°. At 10°, this relation is within the uncertainty of the elastic stress evaluation.
In these tests, superimposed compression was beneficial only where it caused little axial ratcheting; where it produced large ratcheting strains, the cyclic shear stress and the stored lattice rotation were higher and the life was shorter. Further work will address replicate tests with continuous thermography, crystal-plasticity simulations of these load cases [22] and, in a companion study, the effect of prior cold deformation.
Author Contributions
Conceptualisation, T.N.N. and S.H.; methodology, T.N.N.; software, T.N.N.; validation, T.N.N. and S.H.; formal analysis, T.N.N.; investigation, T.N.N.; resources, S.H.; data curation, T.N.N.; writing—original draft preparation, T.N.N.; writing—review and editing, S.H.; visualisation, T.N.N.; supervision, S.H.; project administration, S.H.; funding acquisition, S.H. All authors have read and agreed to the published version of the manuscript.
Funding
This research was funded by Deutsche Forschungsgemeinschaft (DFG, German Research Foundation) grant number 441180620.
Data Availability Statement
The data presented in this study are available on request from the corresponding author due to the size and complexity of the experimental and computational datasets.
Acknowledgments
We gratefully acknowledge voestalpine BÖHLER Edelstahl GmbH & Co. KG for providing the research material used in this study. We further acknowledge support by the Open Access Publication Fund of the University of Duisburg-Essen.
Conflicts of Interest
The authors declare no conflicts of interest.
Abbreviations
The following abbreviations are used in this manuscript:
| CI | Confidence index |
| COV | Coefficient of variation |
| ECD | Equivalent circle diameter |
| EBSD | Electron backscatter diffraction |
| FCC | Face-centred cubic |
| GND | Geometrically necessary dislocation(s) |
| GOS | Grain orientation spread |
| HMH | Huber–von Mises–Hencky (equivalent stress) |
| IPF | Inverse pole figure |
| IQ | Image quality |
| KAM | Kernel average misorientation |
| P95 | 95th percentile |
| SEM | Scanning electron microscopy |
| SFE | Stacking fault energy |
| S-N | Stress–life (cyclic stress amplitude versus cycles to failure) |
References
- Talha, M.; Behera, C.K.; Sinha, O.P. A review on nickel-free nitrogen containing austenitic stainless steels for biomedical applications. Mater. Sci. Eng. C 2013, 33, 3563–3575. [Google Scholar] [CrossRef] [Scilit] [PubMed]
- Marquis, G.B.; Socie, D.F. Long-life torsion fatigue with normal mean stresses. Fatigue Fract. Eng. Mater. Struct. 2000, 23, 293–300. [Google Scholar] [CrossRef] [Scilit]
- Shao, Z.; Zhu, Y.; Xu, Z.; Wang, B.; Gu, X.; Liu, H.; Wang, X.; Zhang, P.; Zhang, Z. Rolling Contact Fatigue Damage Mechanisms Under Non-Proportional Cyclic Compression–Torsion Loading: A Modified Multiaxial Fatigue Model for Bearing Steel. Adv. Eng. Mater. 2026, 28, e202502873. [Google Scholar] [CrossRef] [Scilit]
- Wildeis, A.; Lingnau, L.; Brandt, R.; Christ, H.J.; Walther, F. Torsional fatigue behaviour and damage mechanisms of martensitic spring steel in the HCF regime. Int. J. Fatigue 2024, 186, 108409. [Google Scholar] [CrossRef] [Scilit]
- Močilnik, V.; Gubeljak, N.; Predan, J.; Flašker, J. The influence of constant axial compression pre-stress on the fatigue failure of torsion loaded tube springs. Eng. Fract. Mech. 2010, 77, 3132–3142. [Google Scholar] [CrossRef] [Scilit]
- Pippan, R.; Hohenwarter, A. Fatigue crack closure: A review of the physical phenomena. Fatigue Fract. Eng. Mater. Struct. 2017, 40, 471–495. [Google Scholar] [CrossRef] [Scilit] [PubMed]
- Mazelsky, B.; Lin, T.H.; Lin, S.R.; Yu, C.K. Effect of Axial Compression on Low-Cycle Fatigue of Metals in Torsion. J. Basic Eng. 1969, 91, 780–784. [Google Scholar] [CrossRef] [Scilit]
- Meggiolaro, M.A.; de Castro, J.T.P.; Wu, H. Static axial tension or compression stress effects on shear cracks initiating under cyclic torsion loads in multiaxial fatigue tests. Int. J. Fatigue 2024, 179, 108021. [Google Scholar] [CrossRef] [Scilit]
- Mobasher Moghaddam, S.; Bomidi, J.A.; Sadeghi, F.; Weinzapfel, N.; Liebel, A. Effects of compressive stresses on torsional fatigue. Tribol. Int. 2014, 77, 196–210. [Google Scholar] [CrossRef] [Scilit]
- Ngeru, T.; Kurtulan, D.; Karkar, A.; Hanke, S. Mechanical Behaviour and Failure Mode of High Interstitially Alloyed Austenite under Combined Compression and Cyclic Torsion. Metals 2022, 12, 157. [Google Scholar] [CrossRef] [Scilit]
- Kitain, V.V.; Chaevskii, M.I. Effect of axial tension on the low-cycle torsion fatigue of steel. Strength Mater. 1974, 6, 805–809. [Google Scholar] [CrossRef] [Scilit]
- Bonniot, T.; Doquet, V.; Mai, S.H. Fatigue crack growth under non-proportional mixed-mode I + II. Role of compression while shearing. Int. J. Fatigue 2020, 134, 105513. [Google Scholar] [CrossRef] [Scilit]
- Poole, B.; Dunne, F.P.E. Slip Band Interactions and GND Latent Hardening in a Galling Resistant Stainless Steel. Mater. Sci. Eng. A 2021, 813, 141176. [Google Scholar] [CrossRef] [Scilit]
- Zoller, K.; Kalácska, S.; Ispánovity, P.D.; Schulz, K. Microstructure Evolution of Compressed Micropillars Investigated by In Situ HR-EBSD Analysis and Dislocation Density Simulations. Comptes Rendus. Phys. 2021, 22, 1–27. [Google Scholar] [CrossRef] [Scilit]
- Elber, W. The Significance of Fatigue Crack Closure. In Damage Tolerance in Aircraft Structures, ASTM STP 486; American Society for Testing and Materials: Philadelphia, PA, USA, 1971; pp. 230–242. [Google Scholar] [CrossRef] [Scilit]
- Suresh, S. Fatigue of Materials, 2nd ed.; Cambridge University Press: Cambridge, UK, 1998. [Google Scholar] [CrossRef] [Scilit]
- Bemfica, C.; Carneiro, L.; Mamiya, E.; Castro, F. Fatigue and cyclic plasticity of 304L stainless steel under axial-torsional loading at room temperature. Int. J. Fatigue 2019, 125, 349–361. [Google Scholar] [CrossRef] [Scilit]
- Zhang, W.; Akid, R. Mechanism and Fatigue Performance of Two Steels in Cyclic Torsion with Axial Static Tension/Compression. Fatigue Fract. Eng. Mater. Struct. 1997, 20, 547–557. [Google Scholar] [CrossRef] [Scilit]
- Teng, Z. Thermo-Based Fatigue Life Prediction: A Review. Fatigue Fract. Eng. Mater. Struct. 2023, 46, 3121–3144. [Google Scholar] [CrossRef] [Scilit]
- Connesson, N.; Maquin, F.; Pierron, F. Dissipated Energy Measurements as a Marker of Microstructural Evolution: 316L and DP600. Acta Mater. 2011, 59, 4100–4115. [Google Scholar] [CrossRef] [Scilit]
- Guo, Q.; Zaïri, F.; Yang, W. Evaluation of Intrinsic Dissipation Based on Self-Heating Effect in High-Cycle Metal Fatigue. Int. J. Fatigue 2020, 139, 105653. [Google Scholar] [CrossRef] [Scilit]
- Biswas, A.; Kurtulan, D.; Ngeru, T.; Azócar Guzmán, A.; Hanke, S.; Hartmaier, A. Mechanical Behavior of Austenitic Steel under Multi-Axial Cyclic Loading. Materials 2023, 16, 1367. [Google Scholar] [CrossRef] [Scilit] [PubMed]
- Timoshenko, S.P.; Gere, J.M. Theory of Elastic Stability, 2nd ed.; McGraw-Hill: New York, NY, USA, 1961. [Google Scholar]
- Budynas, R.G.; Nisbett, J.K. Shigley’s Mechanical Engineering Design, 10th ed.; McGraw-Hill Education: New York, NY, USA, 2015. [Google Scholar]
- Ziemian, R.D. (Ed.) Guide to Stability Design Criteria for Metal Structures, 6th ed.; John Wiley & Sons: Hoboken, NJ, USA, 2010. [Google Scholar]
- Facheris, G.; Janssens, K.G.F.; Foletti, S. Multiaxial fatigue behavior of AISI 316L subjected to strain-controlled and ratcheting paths. Int. J. Fatigue 2014, 68, 195–208. [Google Scholar] [CrossRef] [Scilit]
- Bachmann, F.; Hielscher, R.; Schaeben, H. Texture Analysis with MTEX – Free and Open Source Software Toolbox. Solid State Phenom. 2010, 160, 63–68. [Google Scholar] [CrossRef] [Scilit]
- Taylor, G.I. The Mechanism of Plastic Deformation of Crystals. Part I.—Theoretical. Proc. R. Soc. Lond. Ser. A Contain. Pap. Math. Phys. Character 1934, 145, 362–387. [Google Scholar] [CrossRef] [Scilit]
- Bishop, J.F.W.; Hill, R. A theory of the plastic distortion of a polycrystalline aggregate under combined stresses. Lond. Edinb. Dublin Philos. Mag. J. Sci. 1951, 42, 414–427. [Google Scholar] [CrossRef] [Scilit]
- Huber, M.T. Specific work of strain as a measure of material effort. Arch. Mech. 2004, 56, 173–190. [Google Scholar]
- Halford, G.R. The energy required for fatigue. J. Mater. 1966, 1, 3–18. [Google Scholar]
- Ellyin, F. Fatigue Damage, Crack Growth and Life Prediction; Chapman & Hall: London, UK, 1997. [Google Scholar]
- Socie, D.F.; Marquis, G.B. Multiaxial Fatigue; SAE International: Warrendale, PA, USA, 2000. [Google Scholar]
- Itoh, T.; Sakane, M.; Ohnami, M.; Socie, D.F. Nonproportional Low Cycle Fatigue Criterion for Type 304 Stainless Steel. J. Eng. Mater. Technol. 1995, 117, 285–292. [Google Scholar] [CrossRef] [Scilit]
- Kamaya, M.; Wilkinson, A.J.; Titchmarsh, J.M. Quantification of plastic strain of stainless steel and nickel alloy by electron backscatter diffraction. Acta Mater. 2006, 54, 539–548. [Google Scholar] [CrossRef] [Scilit]
- Kamaya, M. Characterization of microstructural damage due to low-cycle fatigue by EBSD observation. Mater. Charact. 2009, 60, 1454–1462. [Google Scholar] [CrossRef] [Scilit]
- Findley, W.N. A Theory for the Effect of Mean Stress on Fatigue of Metals Under Combined Torsion and Axial Load or Bending. J. Eng. Ind. 1959, 81, 301–305. [Google Scholar] [CrossRef] [Scilit]
- Fatemi, A.; Socie, D.F. A Critical Plane Approach to Multiaxial Fatigue Damage Including Out-of-phase Loading. Fatigue Fract. Eng. Mater. Struct. 1988, 11, 149–165. [Google Scholar] [CrossRef] [Scilit]

Disclaimer/Publisher’s Note: The statements, opinions and data contained in all publications are solely those of the individual author(s) and contributor(s) and not of MDPI and/or the editor(s). MDPI and/or the editor(s) disclaim responsibility for any injury to people or property resulting from any ideas, methods, instructions or products referred to in the content. |
© 2026 by the authors. Licensee MDPI, Basel, Switzerland. This article is an open access article distributed under the terms and conditions of the Creative Commons Attribution (CC BY) license.