


Abstract
Achieving strength–ductility synergy in immiscible Ti/Mg laminated composites remains challenging, owing to the absence of metallurgical bonding and the limited slip systems of their hexagonal close-packed (HCP) structures. This study aims to achieve a favorable strength–ductility balance in immiscible Ti/Mg laminated composite plates via low-temperature annealing after hot-roll bonding. The results show that after post-rolling annealing at 200 °C, the bonding strength of the Ti/Mg composite interface increased from 48.74 MPa to over 80 MPa without the formation of obvious intermetallic compounds. In the Mg layer, complete recrystallization eliminated the shear bands, and pyramidal <c + a> slip—exhibiting the highest Schmid factor—became the dominant strain-accommodation mode. In the Ti layer, recovery, rather than full recrystallization, prevailed. Concurrently, basal and pyramidal <c + a> slip were co-activated to enable multi-slip load bearing. These complementary deformation modes, coordinated through the strengthened interface, promoted compatible deformation between the layers, in which the plastic flow of the Mg layer relieved local strain concentration in the Ti layer, resulting in a more than twofold increase in elongation with minimal loss of strength. Annealing at 200 °C was identified as the preferred annealing temperature, offering a viable pathway to strength–ductility synergy in immiscible lightweight Ti/Mg laminated composite plates.
1. Introduction
Ti/Mg laminated composite plates offer a unique combination of properties: the high specific strength and excellent corrosion resistance of titanium [1], coupled with the ultra-low density of magnesium [2]. This makes them highly attractive for lightweight applications in aerospace [3], rail transportation, and biomedical engineering [4]. However, achieving effective bonding between titanium and magnesium presents considerable challenges. Firstly, the significant disparities in physical properties between titanium and magnesium [5,6], particularly in melting point, elastic modulus, plasticity, and hardness, result in poor deformation compatibility during both fabrication and subsequent service. Secondly, the absence of stable intermetallic compounds and the extremely low mutual solid solubility [7,8] make it difficult to achieve effective metallurgical bonding. Therefore, realizing high-quality metallurgical bonding between these two metals while optimizing their mechanical performance remains a key scientific challenge in this field.
In previous studies, Ti/Mg composites have been broadly classified into two categories: Ti/Mg laminated composite plates and titanium-reinforced magnesium materials prepared by powder metallurgy. Fabrication methods for the former include hot-roll bonding [9,10,11], hot pressing [5,7], solid–liquid compound casting [12,13], three-dimensional printing [14,15], and liquid metal dealloying [16,17]. The production of such composite plates often requires interlayers [18,19,20] to achieve effective Ti-Mg bonding. The latter category primarily involves powder metallurgy methods, utilizing titanium as a reinforcement phase to enhance various properties of magnesium alloys [21,22,23].
The preparation of Ti/Mg laminated composites by hot pressing, solid–liquid compound casting, and liquid metal dealloying suffers from long processing cycles, complicated procedures, and high costs. Moreover, most existing studies still rely on introducing a third element or a metallic interlayer to promote interfacial reactions and achieve Ti–Mg bonding. However, such interlayers usually form brittle intermetallic compounds, making it difficult to simultaneously achieve high bonding strength and good ductility. Hot-roll bonding is a commonly employed method for fabricating laminated composite plates due to its high efficiency, low cost, and suitability for large-scale industrial production. The subsequent annealing treatment is equally critical for regulating the microstructure and improving the mechanical properties [24,25], since the annealing temperature and time directly govern the interfacial diffusion, recrystallization, and crystallographic texture of bimetallic composites, thereby determining their strength, ductility, and anisotropy [26,27].
However, investigations into the effects of post-rolling annealing on the microstructural evolution of Ti/Mg laminated composite plates and the correlation between this evolution and the mechanical properties remain limited. Therefore, this study focuses on TA1/AZ31 laminated composite plates and investigates the effects of annealing temperature (200–400 °C) and duration (60–180 min) on their mechanical properties, aiming to identify an annealing temperature that provides a good strength–ductility balance. Within this annealing window, the temperature that achieves a favorable combination of interfacial bonding strength, tensile strength, and ductility is first determined, and the microstructural evolution is then studied at this temperature. Accordingly, the recrystallization behavior, texture, and Schmid factor distribution of the base metals under annealing at 200 °C are characterized by Electron Backscatter Diffraction(EBSD). Combined with the results of tensile–shear and uniaxial tensile tests, the intrinsic processing–microstructure–property relationship is elucidated, providing experimental evidence for achieving a good strength–ductility balance in Ti/Mg laminated composite plates.
2. Materials and Methods
The materials used in this study were commercially pure titanium (TA1, equivalent to ASTM Grade 1, purity ≥ 99.9%) and AZ31 Mg alloy plates, which were purchased from Jubao (Shenzhen) Intelligent Co., Ltd., Shenzhen, China.The chemical compositions of AZ31 are presented in Table 1.
Table 1.
Material Composition of AZ31 Mg/(wt.%).
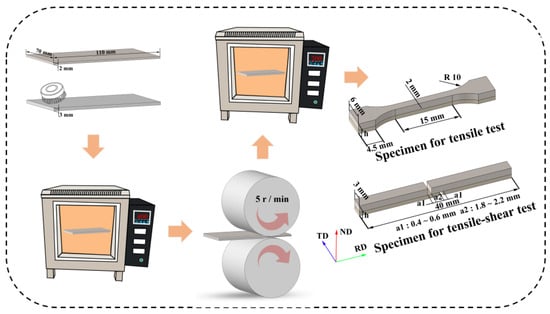
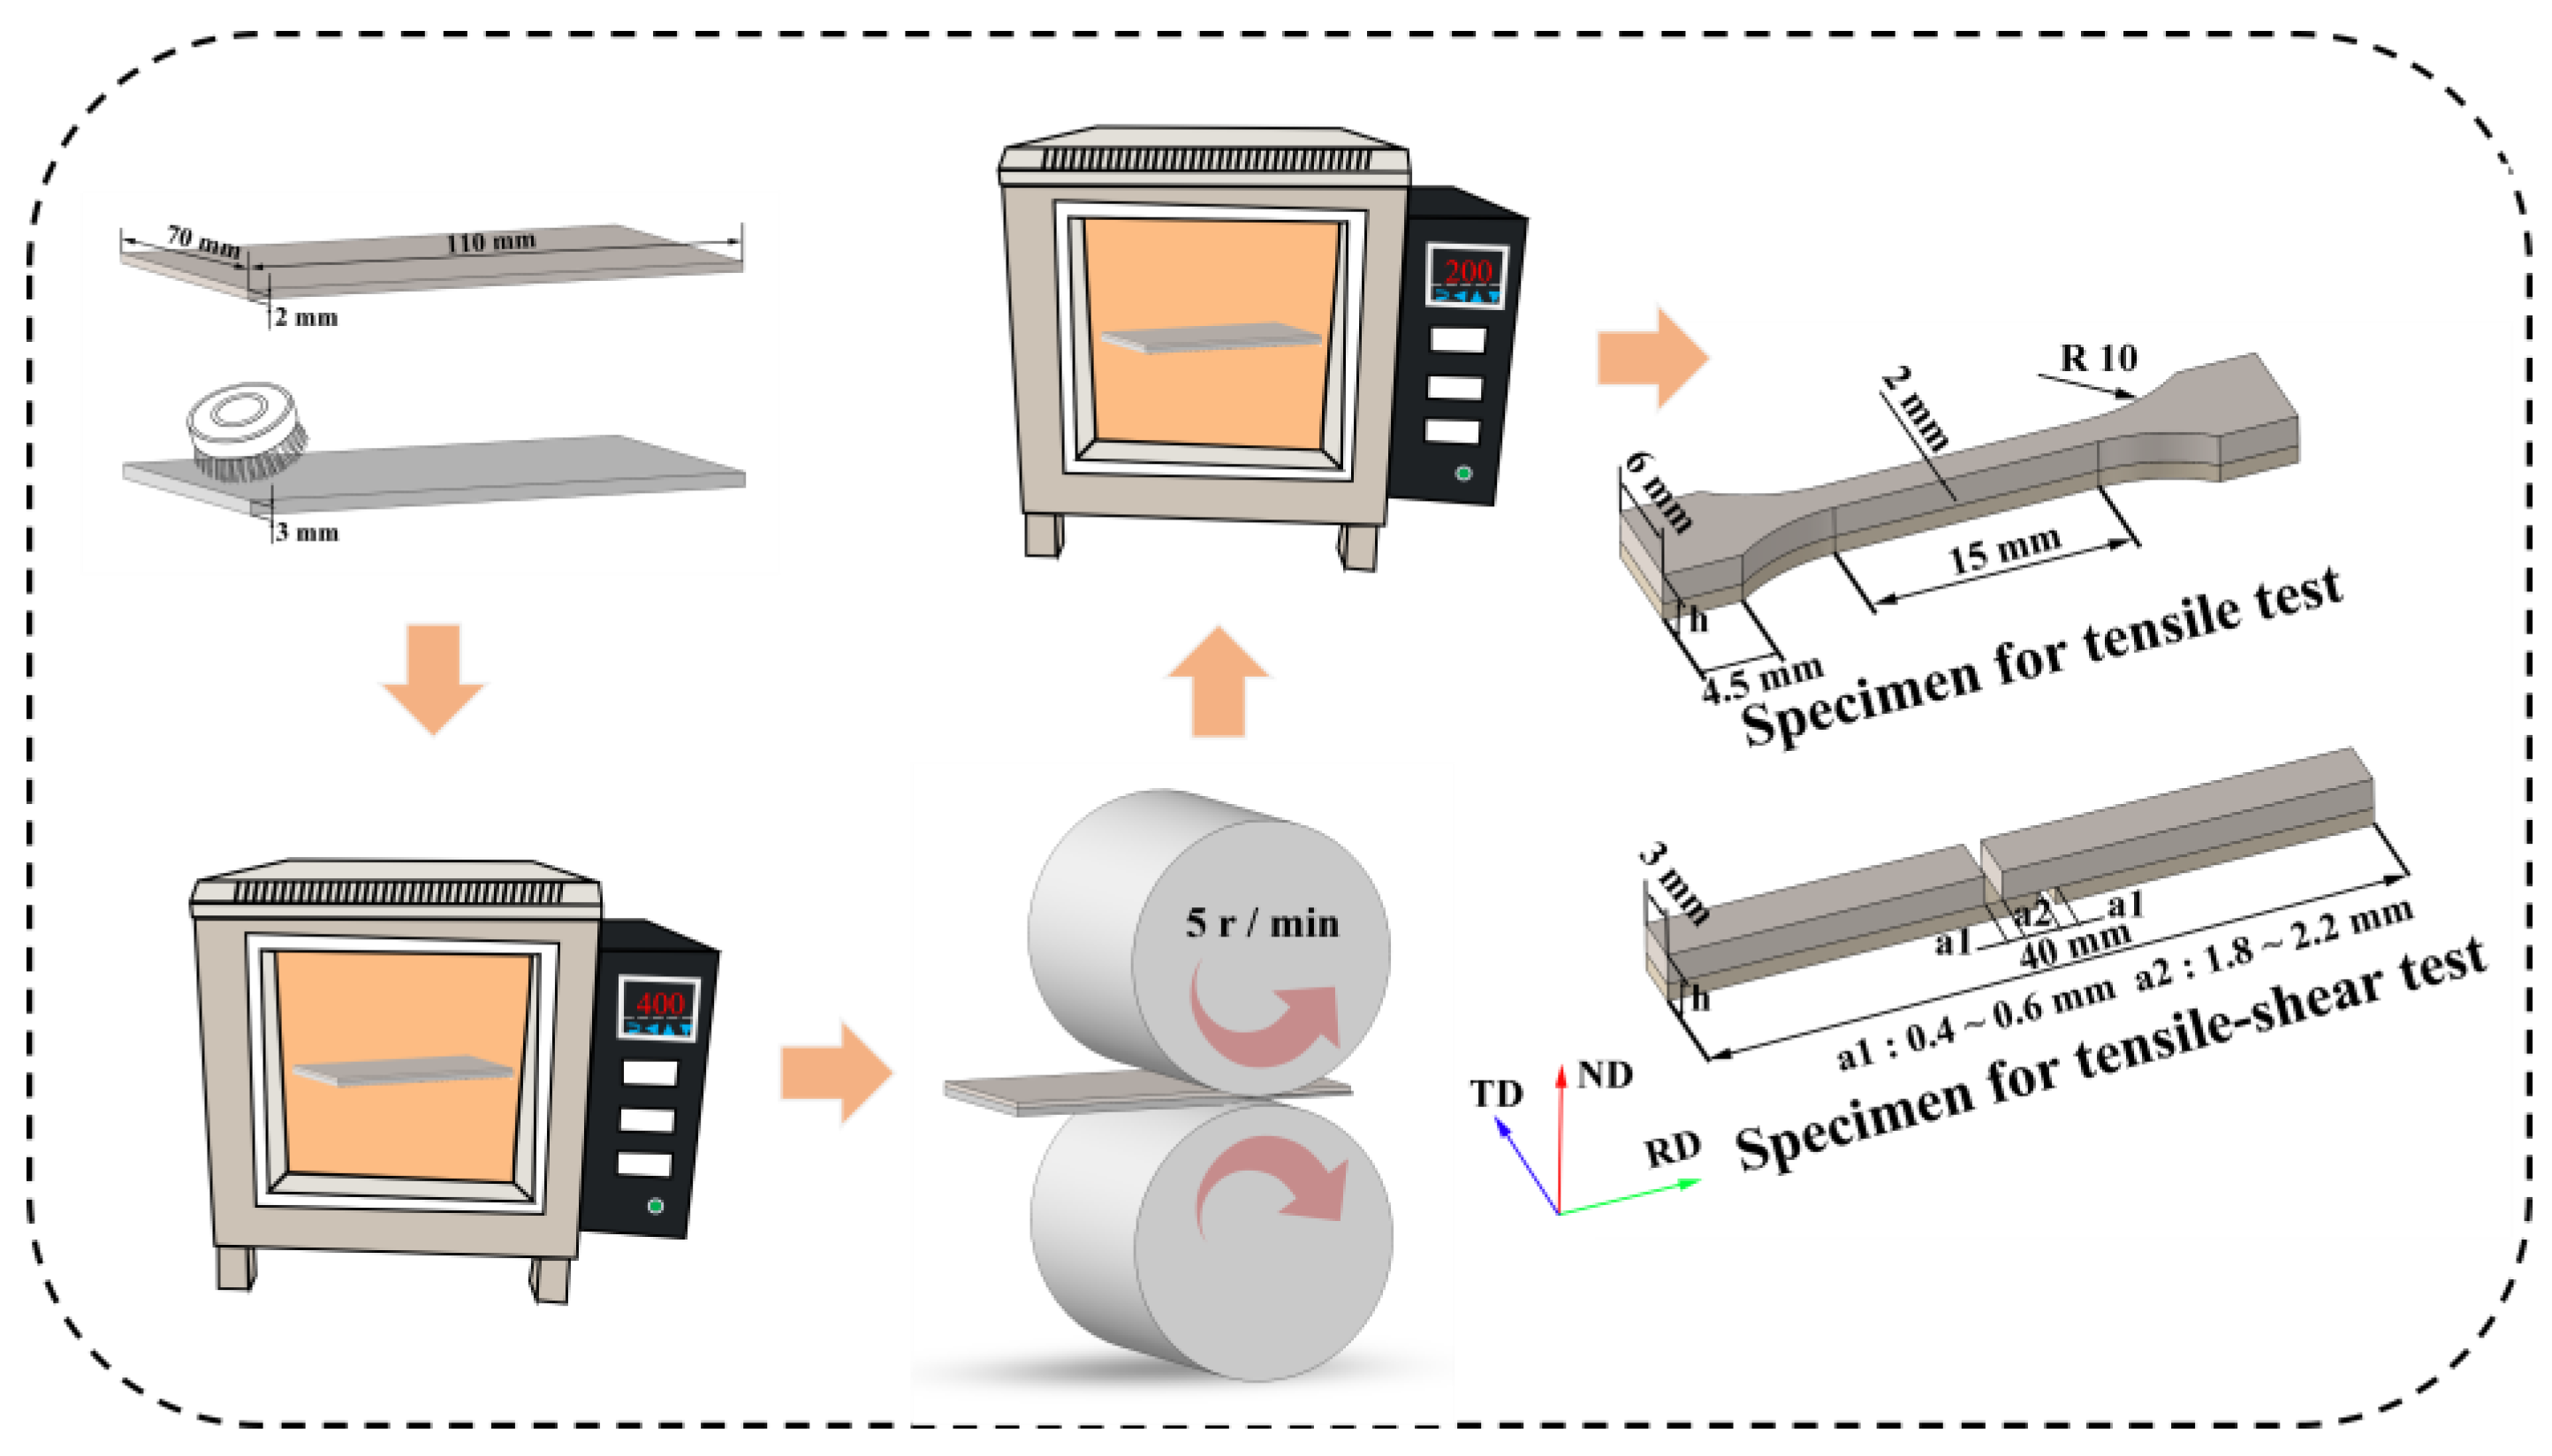
The TA1 titanium plates had dimensions of 2 × 70 × 110 mm3, and the AZ31 plates were of dimensions 3 × 70 × 110 mm3. The surfaces of the TA1 and AZ31 plates to be bonded were ground using a steel wire brush with a diameter of 0.3 mm until fresh metal was exposed, subsequently cleaned with alcohol and acetone, dried, and then stacked in the order of Ti/Mg. The stacked assembly was placed in a furnace preheated to 400 °C and held for 20 min, followed by immediate roll bonding to obtain the Ti/Mg laminated composite plates. The rolling reduction was 35%, the roll speed was 5 r/min, and the roll diameter was 150 mm. Since the melting point of magnesium is approximately 650 °C, while the recrystallization temperature of pure titanium is above 700 °C, and existing literature indicates that magnesium and its alloys can achieve a favorable recrystallized microstructure during low-temperature annealing. Therefore, in this study, composite plates were annealed for 60, 120, and 180 min at 200, 300, and 400 °C. Both the pre-rolling preheating and the post-rolling annealing were performed in a muffle furnace without vacuum or protective gas. Low-temperature annealing may achieve an excellent recrystallized microstructure in the magnesium alloy while preserving the load-bearing capacity of the titanium matrix, thereby enhancing the overall performance of the composite plates. Samples required for tensile–shear, and uniaxial tensile, as well as microstructural characterization, were cut from the as-rolled and annealed laminated composites using wire electrical discharge machining. The experimental procedure and the dimensions of the specimens used for mechanical property testing are shown in Figure 1, the orange arrows indicate the processing flow.
Figure 1.
The fabrication process of Ti/Mg laminated composite plates and the dimensions of the specimens used for mechanical property test.
The loading rates for both the tensile–shear and uniaxial tensile tests were 0.5 mm/min. To ensure the reproducibility of the experimental results, each test was repeated three times, and the final result was taken as the average value. The tensile–shear strength was calculated according to Equation (1):
where S is the bonded area of the lap joint, the microstructure of the Ti/Mg laminated composites was characterized using scanning electron microscopy equipped with energy-dispersive spectroscopy (SEM-EDS) and electron backscatter diffraction (EBSD), EBSD analysis was performed using OIM Analysis 7 (EDAX, Mahwah, NJ, USA).
3. Results
3.1. Composite Interface Structure
Figure 2 presents the composite interface of the Ti/Mg laminated composite plate in the as-rolled state and after annealing at 200, 300, and 400 °C for 60 min. Figure 3 shows the interface after annealing at 200 °C for 60, 120, and 180 min. All samples exhibit good interfacial bonding, characterized by a curved morphology. The TA1 matrix near the composite interface presents distinct jagged fissures, as shown in the dashed circles highlight serrated interface features. The composite interface shows no obvious defects such as voids or inclusions, indicating that good bonding has been achieved between TA1 and AZ31. Owing to the extremely low mutual solubility of Ti and Mg and the absence of stable Ti–Mg intermetallic compounds, no continuous intermetallic compound layer was observed at the TA1/AZ31 interface within the resolution of SEM-EDS, even after annealing.
Figure 2.
SEM images of the interface of Ti/Mg laminated composites annealed at different temperatures for 60 min. (a) As-rolled; (b) 200 °C; (c) 300 °C; (d) 400 °C.
Figure 3.
SEM images of the interface of Ti/Mg laminated composites annealed at 200 °C for different durations. (a) As-rolled; (b) 60 min; (c) 120 min; (d) 180 min.
3.2. Mechanical Property Testing and Fracture Morphology
3.2.1. Tensile–Shear Test Results
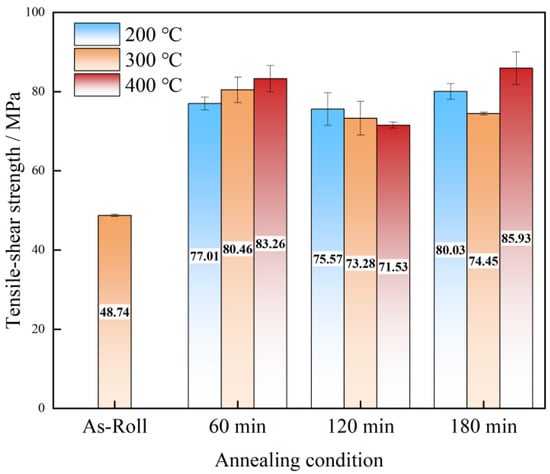
The tensile–shear test results are shown in Figure 4. The as-rolled composite plate exhibits a tensile–shear strength of only 48.74 MPa. Upon annealing at 200 °C, the bonding strength initially increases with annealing time and then decreases, reaching a maximum of 80.03 MPa. At 300 °C, the strength first increases slightly, then decreases modestly, and subsequently remains largely unchanged with prolonged annealing. At 400 °C, the strength shows a trend of initial increase, followed by a decrease, and then a final increase again. Under this condition, a bonding strength of 85.93 MPa is achieved after annealing for 180 min, representing an improvement of approximately 76.3% over the as-rolled sample. Clearly, annealing treatment can significantly enhance the interfacial bonding strength of the as-rolled Ti/Mg laminated composite plates. However, owing to the low mutual solid solubility and the absence of stable intermetallic compounds, the variation in bonding strength across the annealing conditions is relatively limited.
Figure 4.
Tensile–shear test results of Ti/Mg laminated composites under different annealing conditions.
3.2.2. Uniaxial Tensile Properties
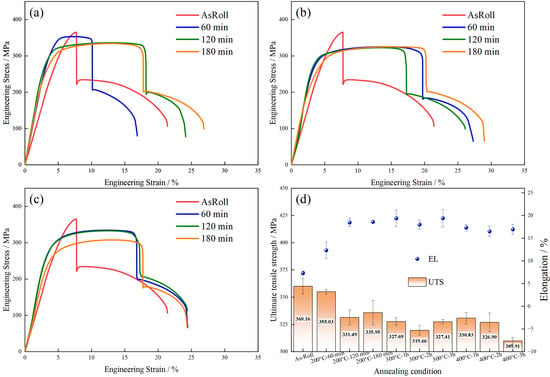
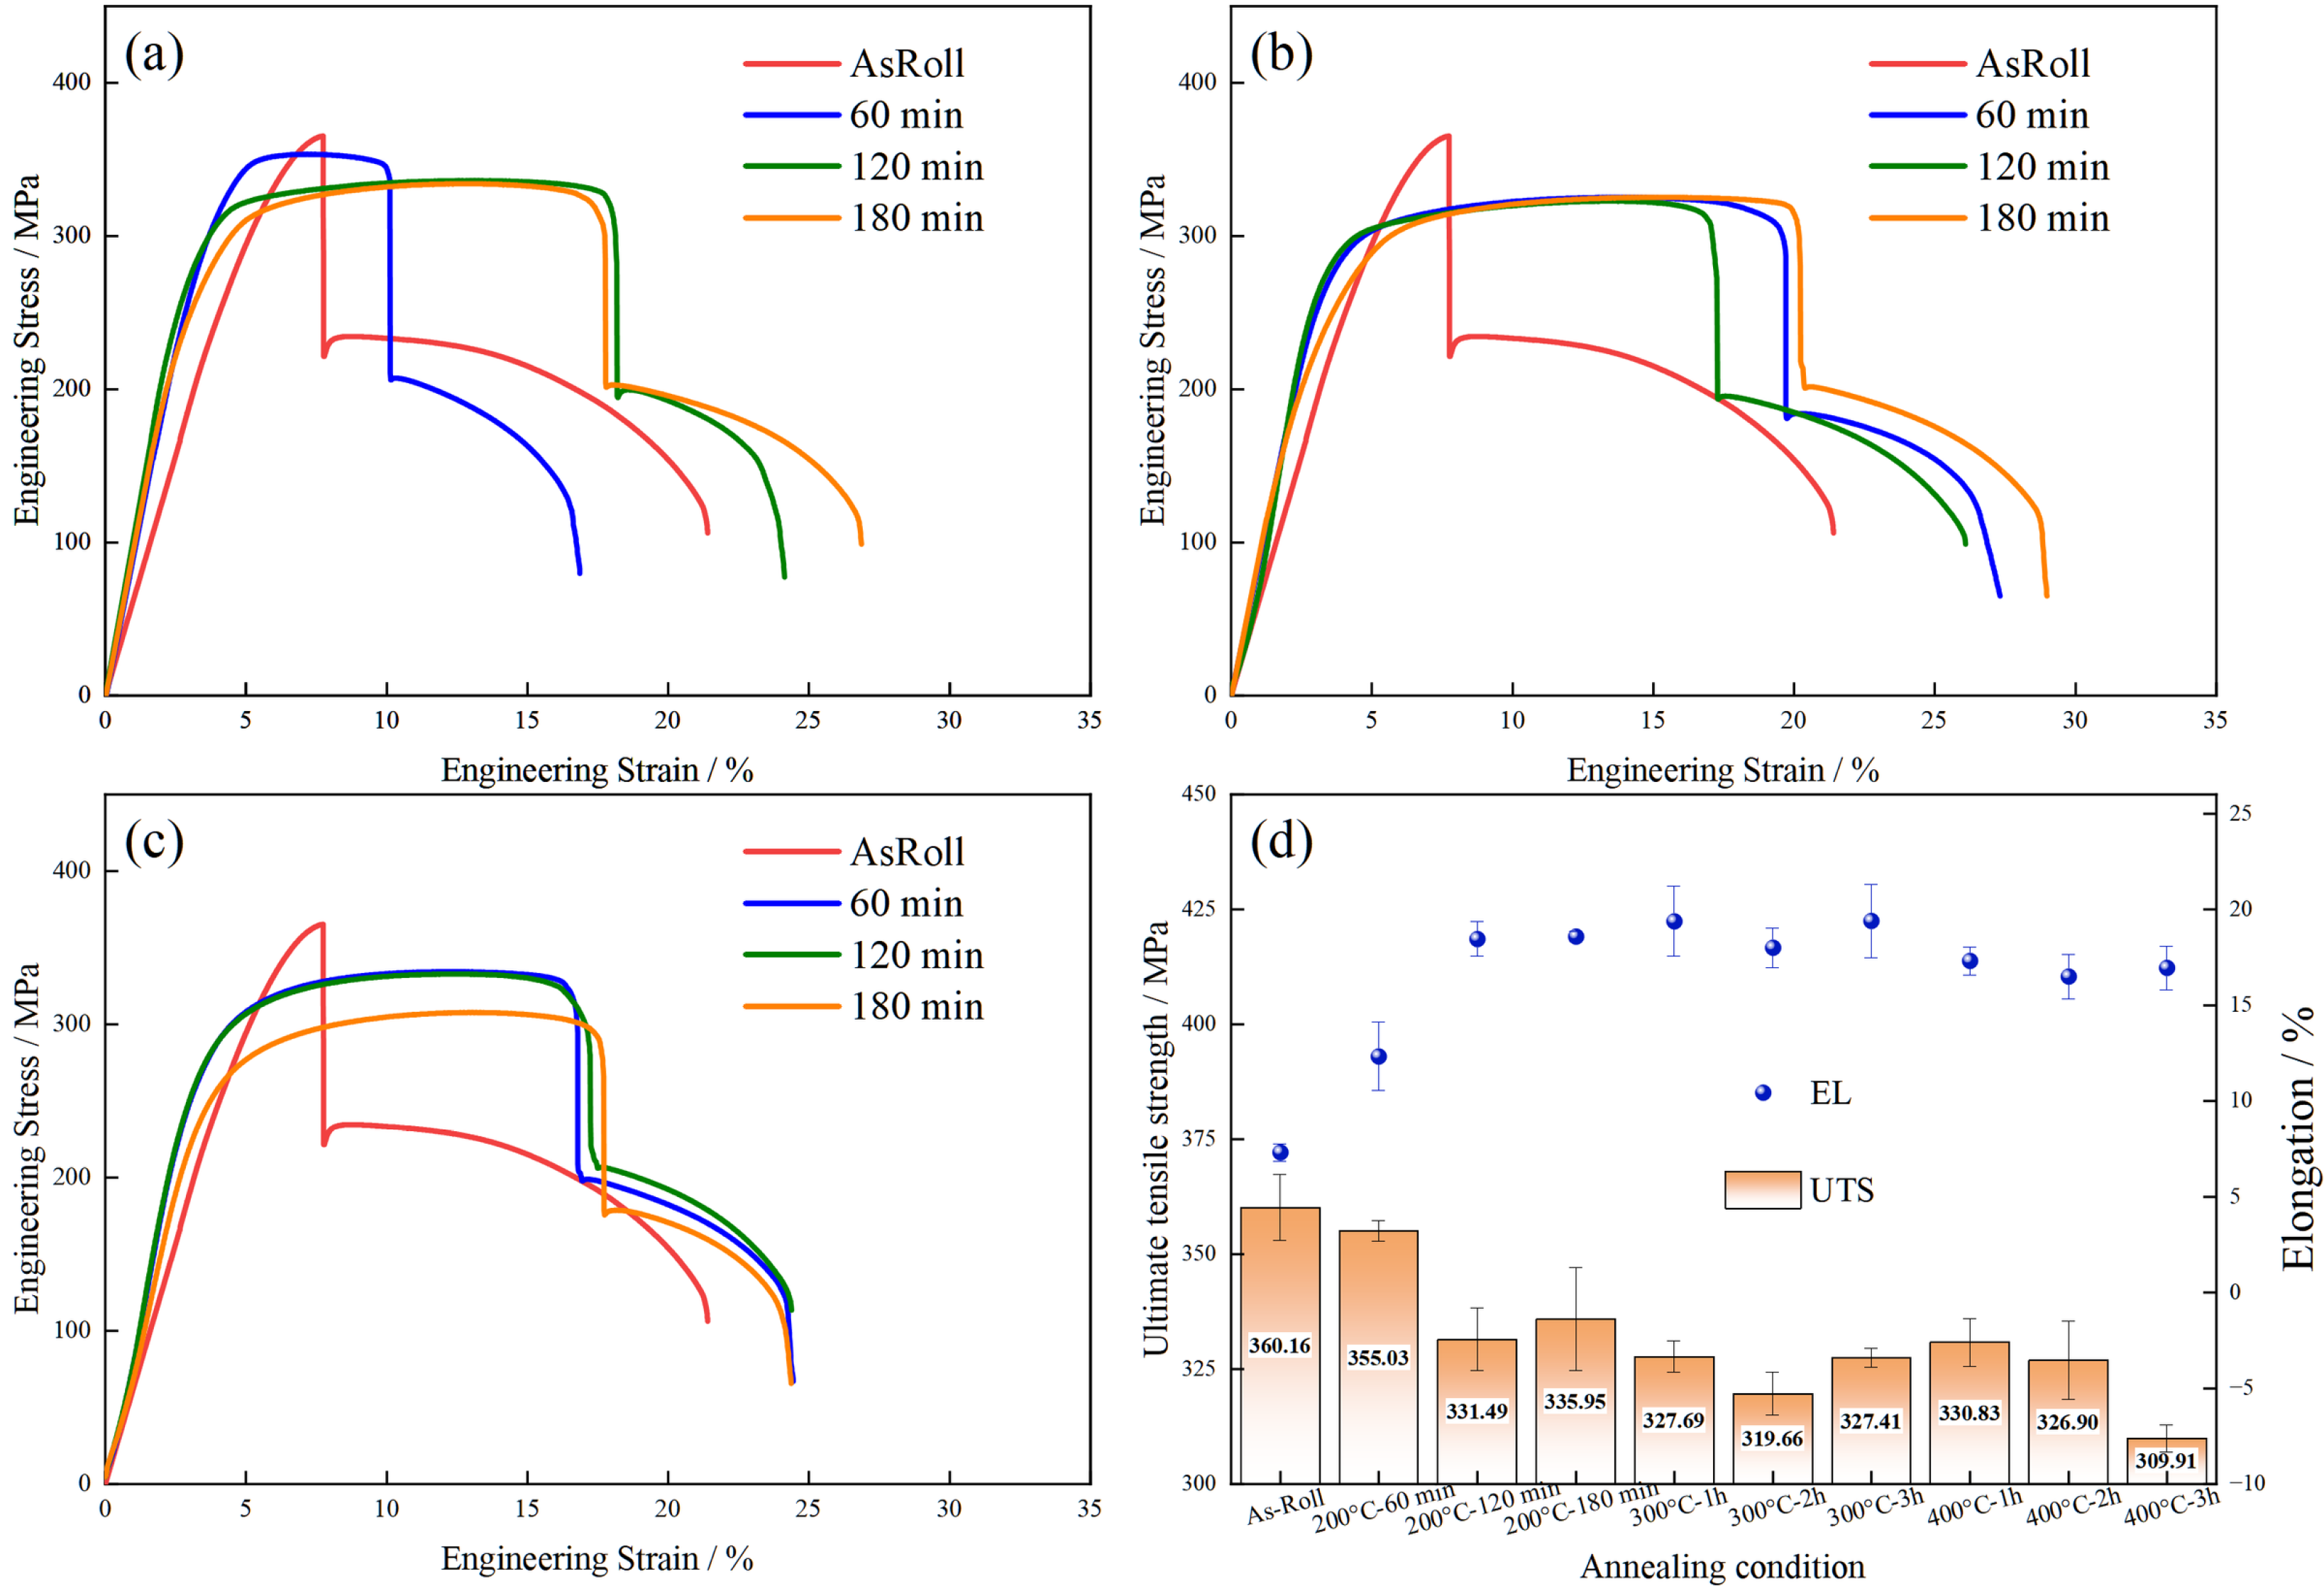
The uniaxial tensile test results are presented in Figure 5. The engineering stress–strain curves obtained from these tests are shown in Figure 5a–c. In this study, elongation (EL) is defined as the strain at the first sharp drop in the stress–strain curve, which corresponds to through-thickness fracture of the Mg layer. Meanwhile, localized interfacial delamination occurs at the fracture site, but it does not propagate along the interface. The peak stress in each curve is defined as the ultimate tensile strength (UTS) of the composite plate.
Figure 5.
Uniaxial tensile test results of the Ti/Mg laminated composites under different annealing temperatures: (a) engineering stress–strain curves at 200 °C, (b) at 300 °C, and (c) at 400 °C; (d) comparison of the ultimate tensile strength and elongation of the composite plates.
The as-rolled composite plate exhibits high strength and low elongation. After annealing, the strength decreases, whereas the elongation increases substantially. The ultimate tensile strength and elongation of the composite plates are summarized in Figure 5d. All statistical data in this study are presented as mean ± standard deviation (n = 3). The as-rolled composite plate exhibits the highest strength (360.16 MPa). After annealing, the UTS values generally fluctuate around 330 MPa, except for the sample annealed at 400 °C for 180 min, which shows 309.91 MPa. The elongation of the as-rolled sample is only 8.3%, whereas the annealed samples show significantly enhanced values. Specifically, after annealing at 200 °C for 60, 120, and 180 min, the plastic elongation increases to 12.23%, 18.46%, and 18.59%, respectively. It is worth noting that the latter two values (18.46 ± 0.91% and 18.59 ± 0.25%) are statistically indistinguishable, indicating that extending the annealing time from 120 min to 180 min does not further improve the elongation. At 300 °C, it increases to 19.38%, 17.99%, and 19.40%, respectively. At 400 °C, it increases to 17.31%, 16.49%, and 16.94%, respectively. Clearly, annealing at the lower temperature of 200 °C yields the preferred plastic elongation, which is approximately twice that of the as-rolled sample, while the tensile strength decreases only slightly and remains relatively stable.
3.2.3. Fracture Surface Morphologies
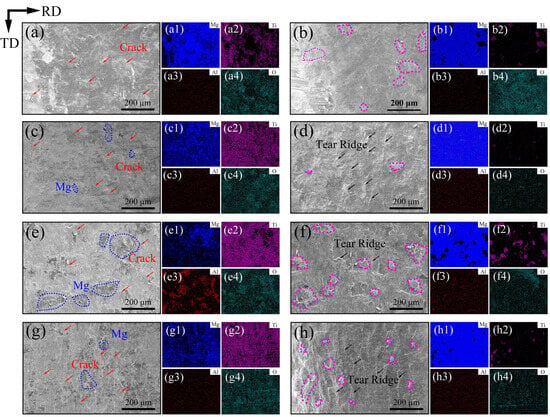
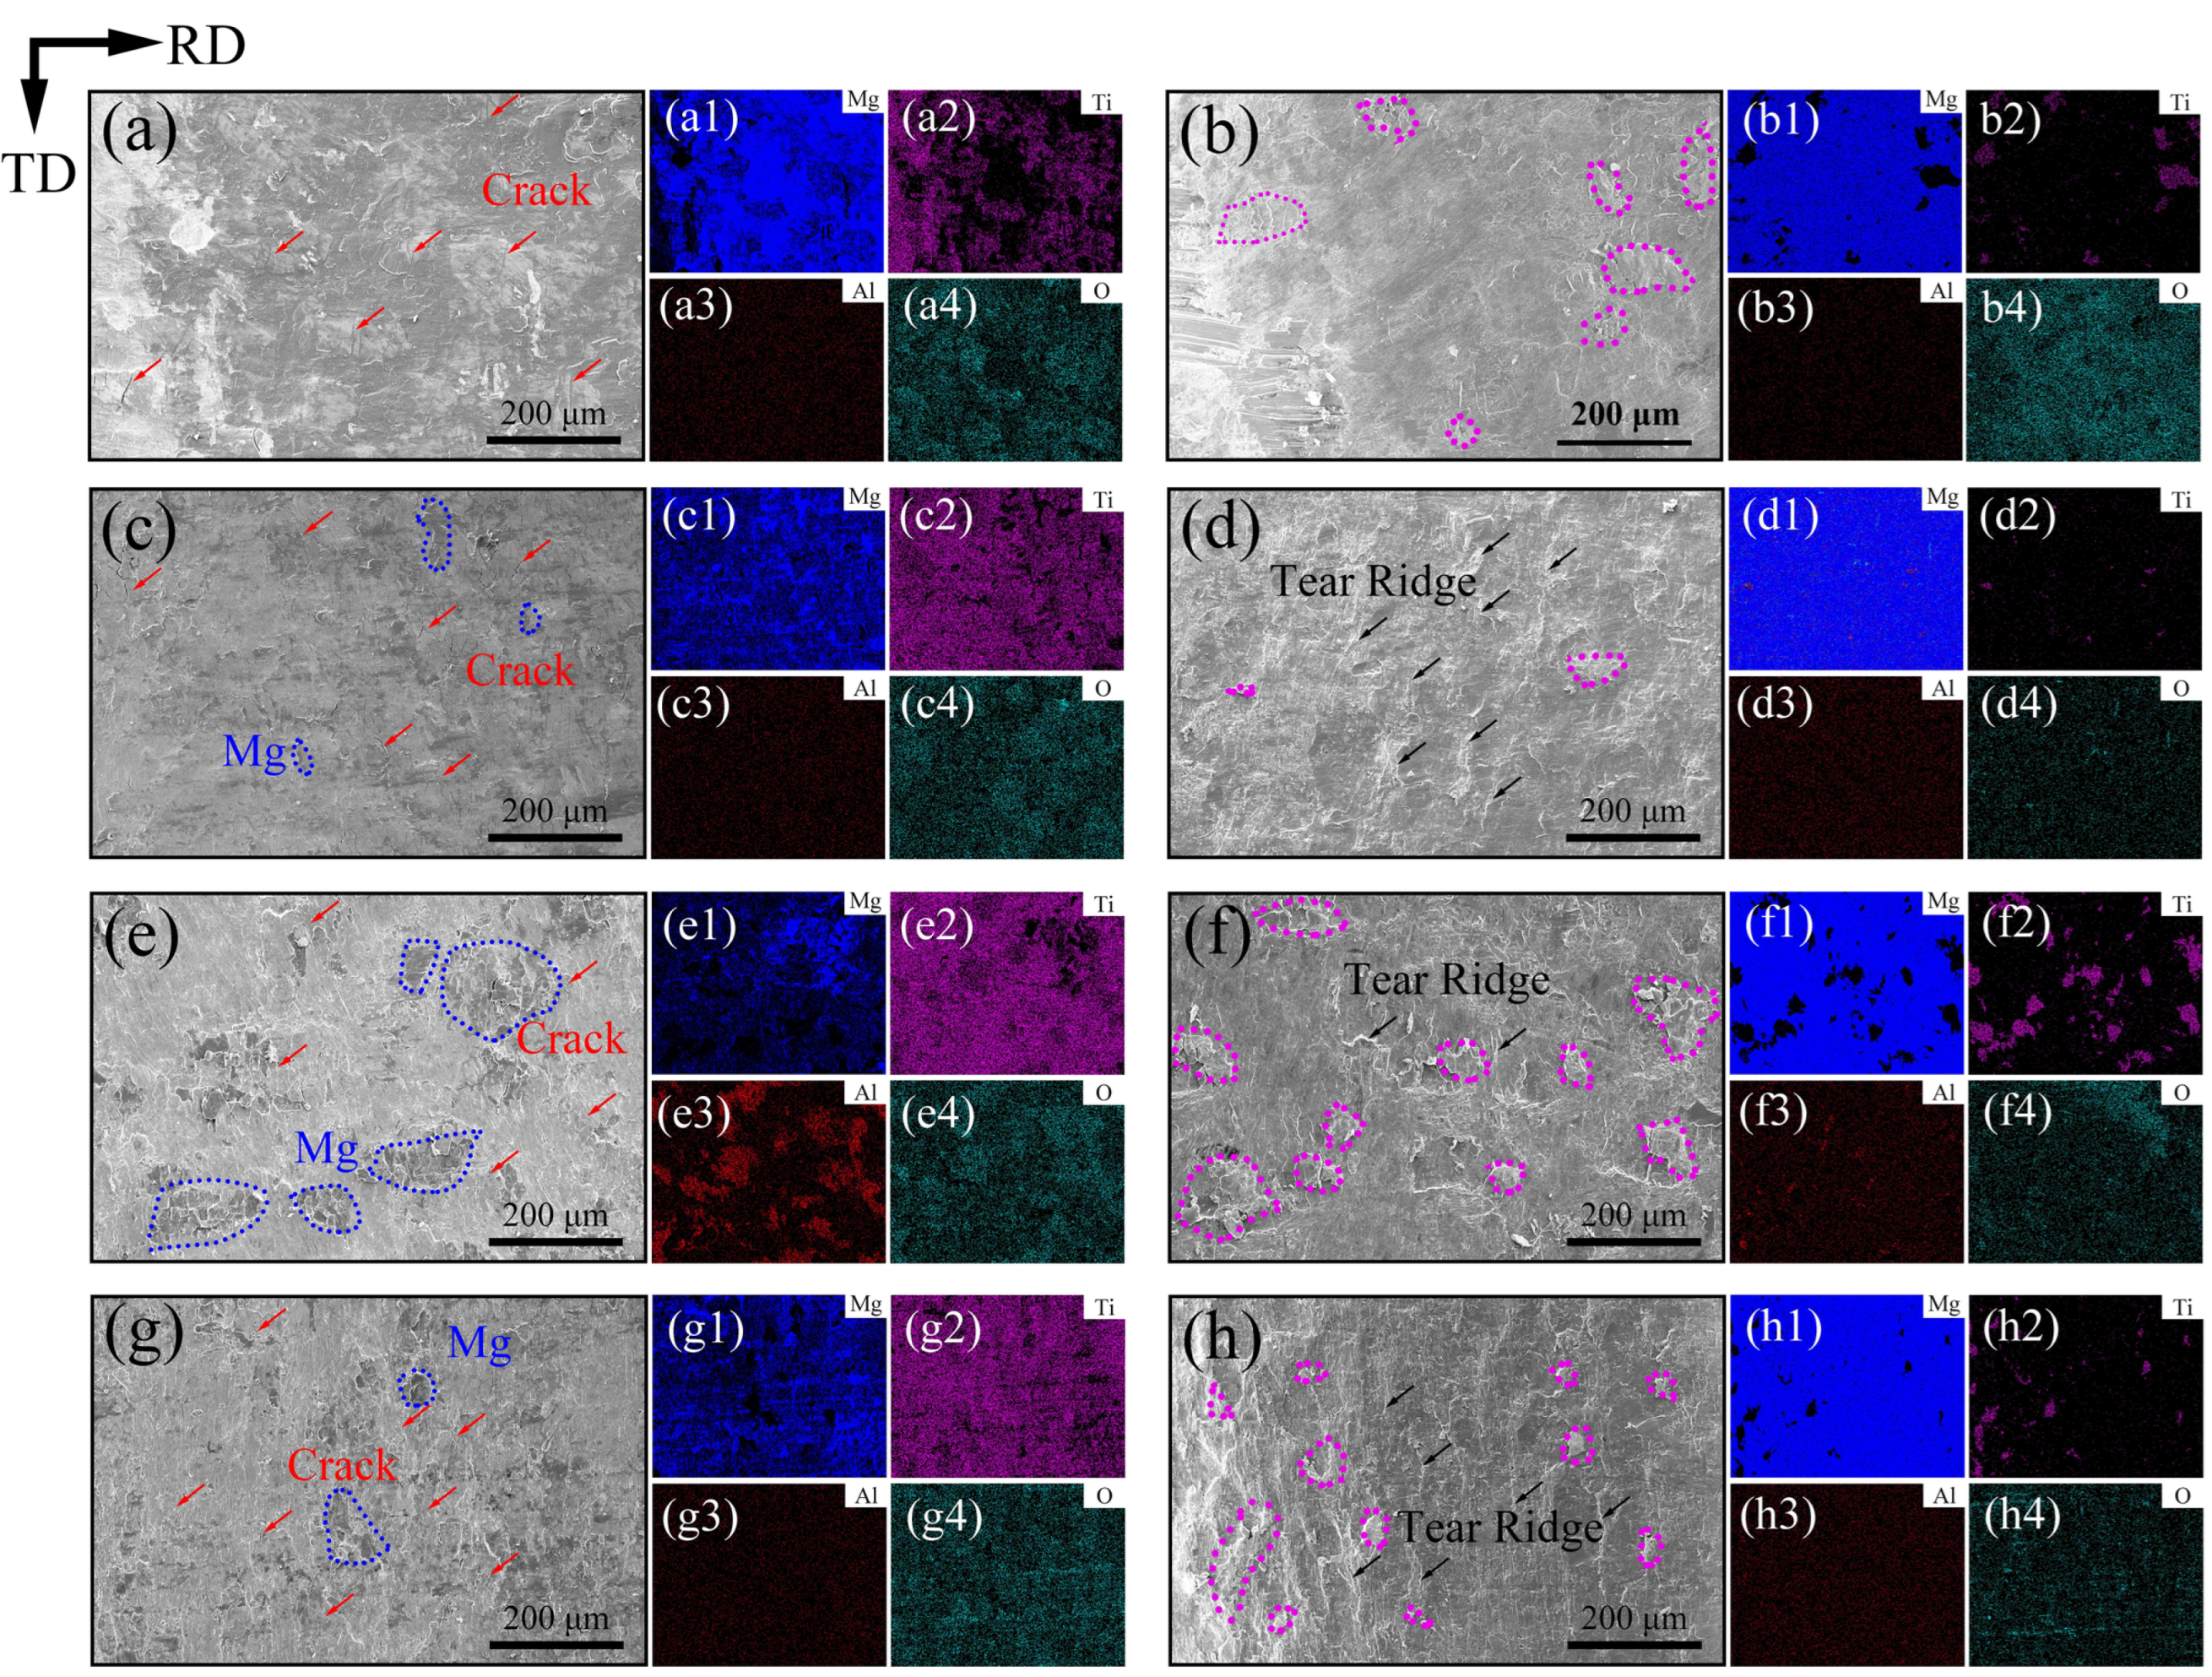
In this study, under the 200 °C annealing condition, the bonding strength, elongation, and ultimate tensile strength of the composite plates achieve a favorable combination. Therefore, subsequent microstructural characterization was focused on the 200 °C-annealed samples to establish the intrinsic correlation between annealing time and the mechanical properties/microstructural evolution of the composite plates. Figure 6 presents the tensile–shear fracture surface morphologies and corresponding elemental distribution maps of the Ti/Mg composite plates in the as-rolled state and after annealing at 200 °C for 60, 120, and 180 min. In Figure 6, the pink dashed circles mark Ti, the blue dashed circles mark Mg, the black arrows indicate tear ridges, and the red arrows indicate cracks. Mg element is distributed across the entire Ti-side fracture surface, indicating sufficient elemental diffusion between Ti and Mg. Discontinuous cracks are observed on the Ti side of all samples, matching the serrated interface morphology highlighted by the circles in Figure 2 and Figure 3. With increasing annealing time, pits resulting from TA1 tearing begin to appear on the Ti side. On the AZ31 side, typical tearing ridges are observed, attributed to fracture occurring in magnesium at regions with higher bonding strength or at matrix defects, owing to the significant disparity in mechanical properties between titanium and magnesium. In some samples (e.g., those annealed at 200 °C for 120 and 180 min), Ti distribution is observed on the Mg side. This phenomenon results from fragmentation of the hardened layer under shear stress produced by steel wire brush grinding during rolling, leading to lower strength at these locations and subsequent failure.
Figure 6.
Morphology and elemental distribution of the tensile-shear fracture surfaces. (a–a4) As-Rolled Ti side, (b–b4) As-Rolled, Mg side; (c–c4) 200 °C annealing 60 min, Ti side, (d–d4) 200 °C annealing 60 min, Mg side; (e–e4) 200 °C annealing 120 min Ti side, (f–f4) 200 °C annealing 120 min, Mg side; (g–g4) 200 °C annealing 180 min Ti side, (h–h4) 200 °C annealing 180 min, Mg side.
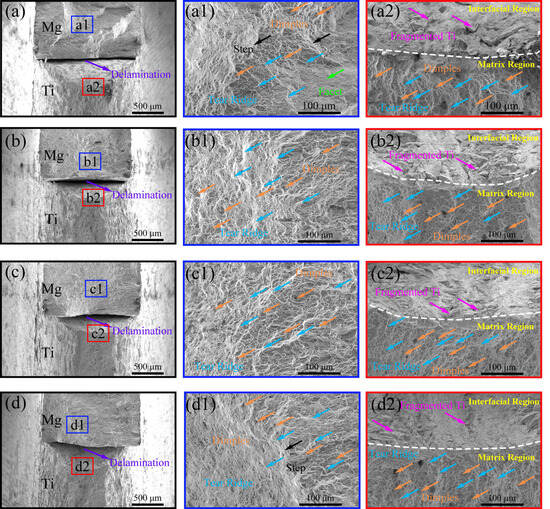
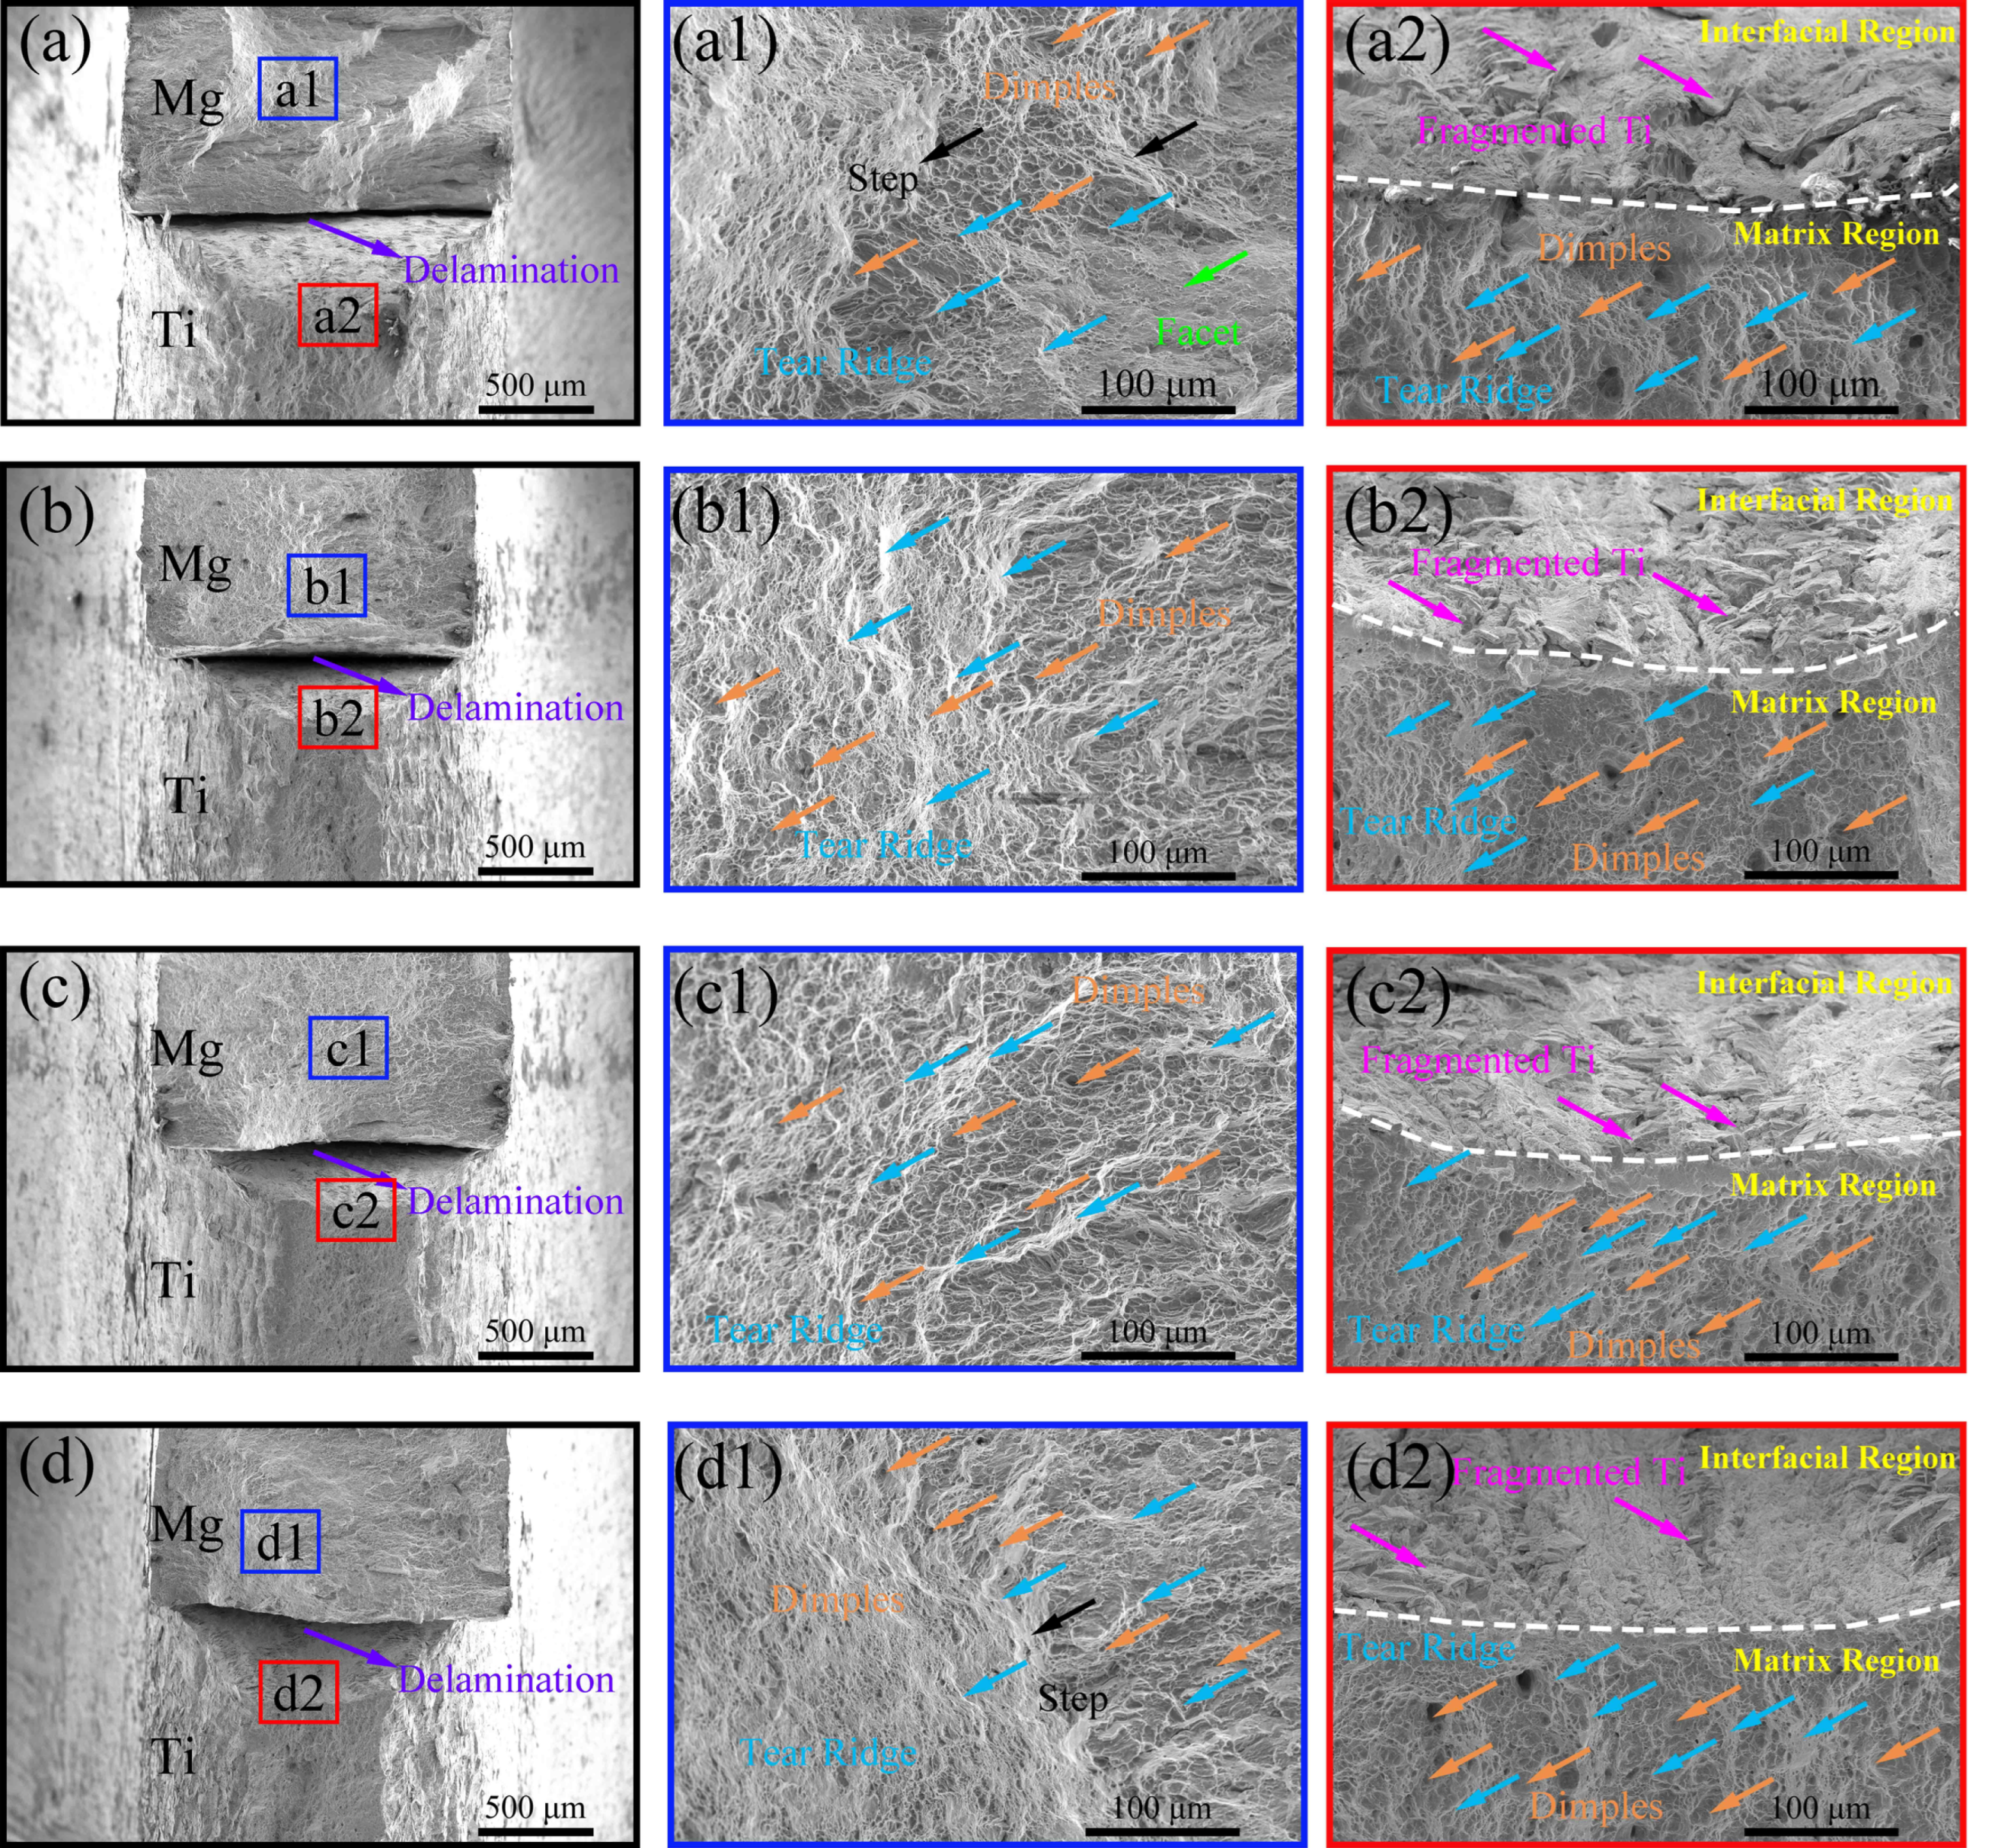
Figure 7 presents SEM images of the fracture surfaces of the as-rolled sample and samples annealed at 200 °C after uniaxial tensile testing. During the uniaxial tensile test process, fracture initiates first in the AZ31 layer, corresponding to the initial drop in the stress–strain curve. As loading continues, the TA1 layer begins to deform at the AZ31 fracture sites until final failure occurs. Interfacial delamination is observed on the fracture surfaces of all tested samples, but the delamination does not propagate along the interface.
Figure 7.
SEM images (overall and magnified views) of the fracture surfaces of the specimens after uniaxial tensile testing: (a–a2) as-rolled; (b–b3) annealed at 200 °C for 60 min; (c–c2) annealed at 200 °C for 120 min; (d–d2) annealed at 200 °C for 180 min.
The fracture surface of the as-rolled AZ31 matrix exhibits a stepped distribution, featuring both dimples and flat facets. This morphology results from the relatively inhomogeneous microstructure and pronounced work hardening of the AZ31 after rolling, indicating the need for further heat treatment to enhance plasticity. After annealing for 60, 120, and 180 min, the flat facets on the AZ31-side fracture surfaces diminish, and most regions are covered with dimples, demonstrating significantly improved plasticity.
On the TA1 side, white dotted lines mark the boundary between the composite interface and the matrix fracture, fragmented TA1 is observed at the Ti/Mg interface, and the fracture surfaces of the TA1 matrix are characterized by numerous dimples and tearing ridges resulting from matrix tearing, interspersed with a small number of voids. The fracture morphology of the as-rolled sample shows little difference from that of the annealed samples, primarily because the recrystallization temperature of titanium is considerably higher than the annealing temperature used, resulting in minimal recrystallization of TA1 under these conditions. Therefore, at an annealing temperature of 200 °C, the improvement in plasticity of the Ti/Mg laminated composites is primarily attributed to the AZ31 matrix.
3.3. Microstructural Evolution of the AZ31 and TA1 Matrices
To elucidate the microstructural evolution after annealing, EBSD characterization was performed on the as-rolled and 200 °C-annealed samples. The accelerating voltage was 20 kV with a tilt angle of 70°. The regions used for EBSD testing were selected near the Ti/Mg interface at positions with a high indexing rate. Due to the grain size difference between layers, the step size was 0.65 μm for the Ti side and 0.15 μm for the Mg side. All samples were prepared by argon ion polishing, and the observed plane was the RD–ND plane. Statistical data including grain orientation spread (GOS), kernel average misorientation (KAM), grain boundary (GB) characteristics, texture, and Schmid factor were collected, and the results are presented below.
3.3.1. Electron Backscatter Diffraction Analysis of AZ31 Matrix
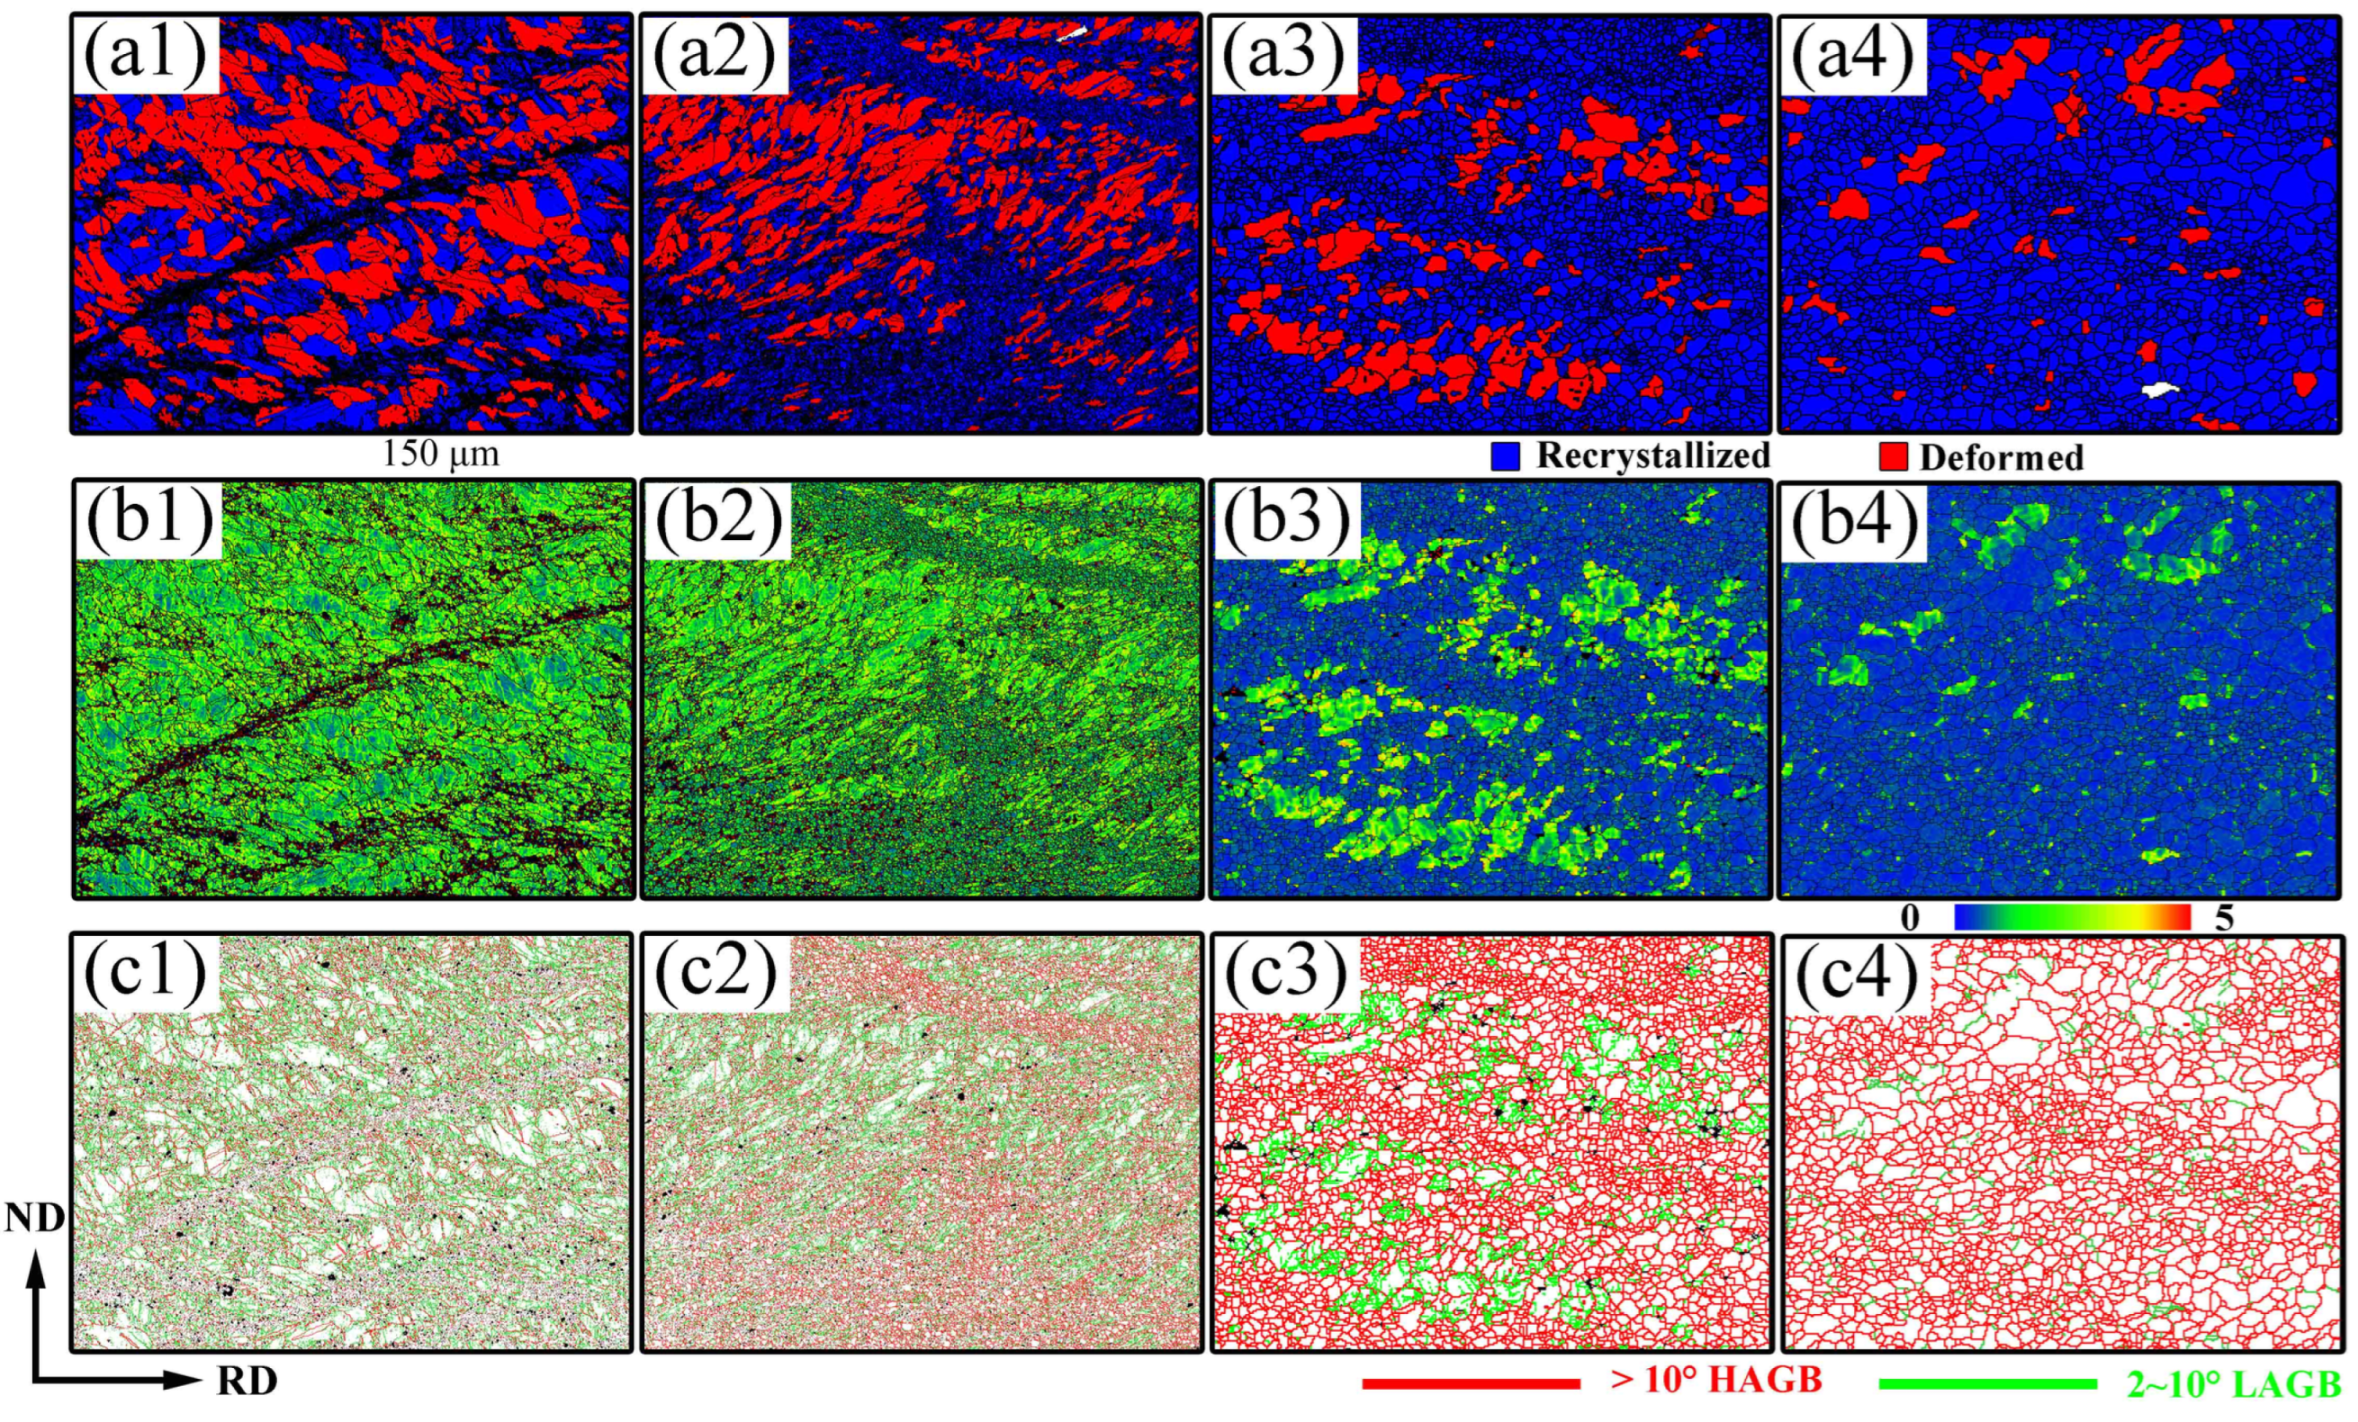
In some studies, the endpoint of the first peak in the GOS distribution is often used as a threshold to distinguish recrystallized grains from deformed grains. Here, GOS analysis is combined with KAM and grain boundary distribution to improve statistical reliability.
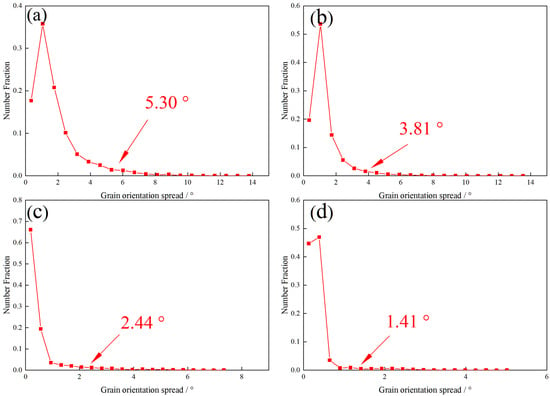
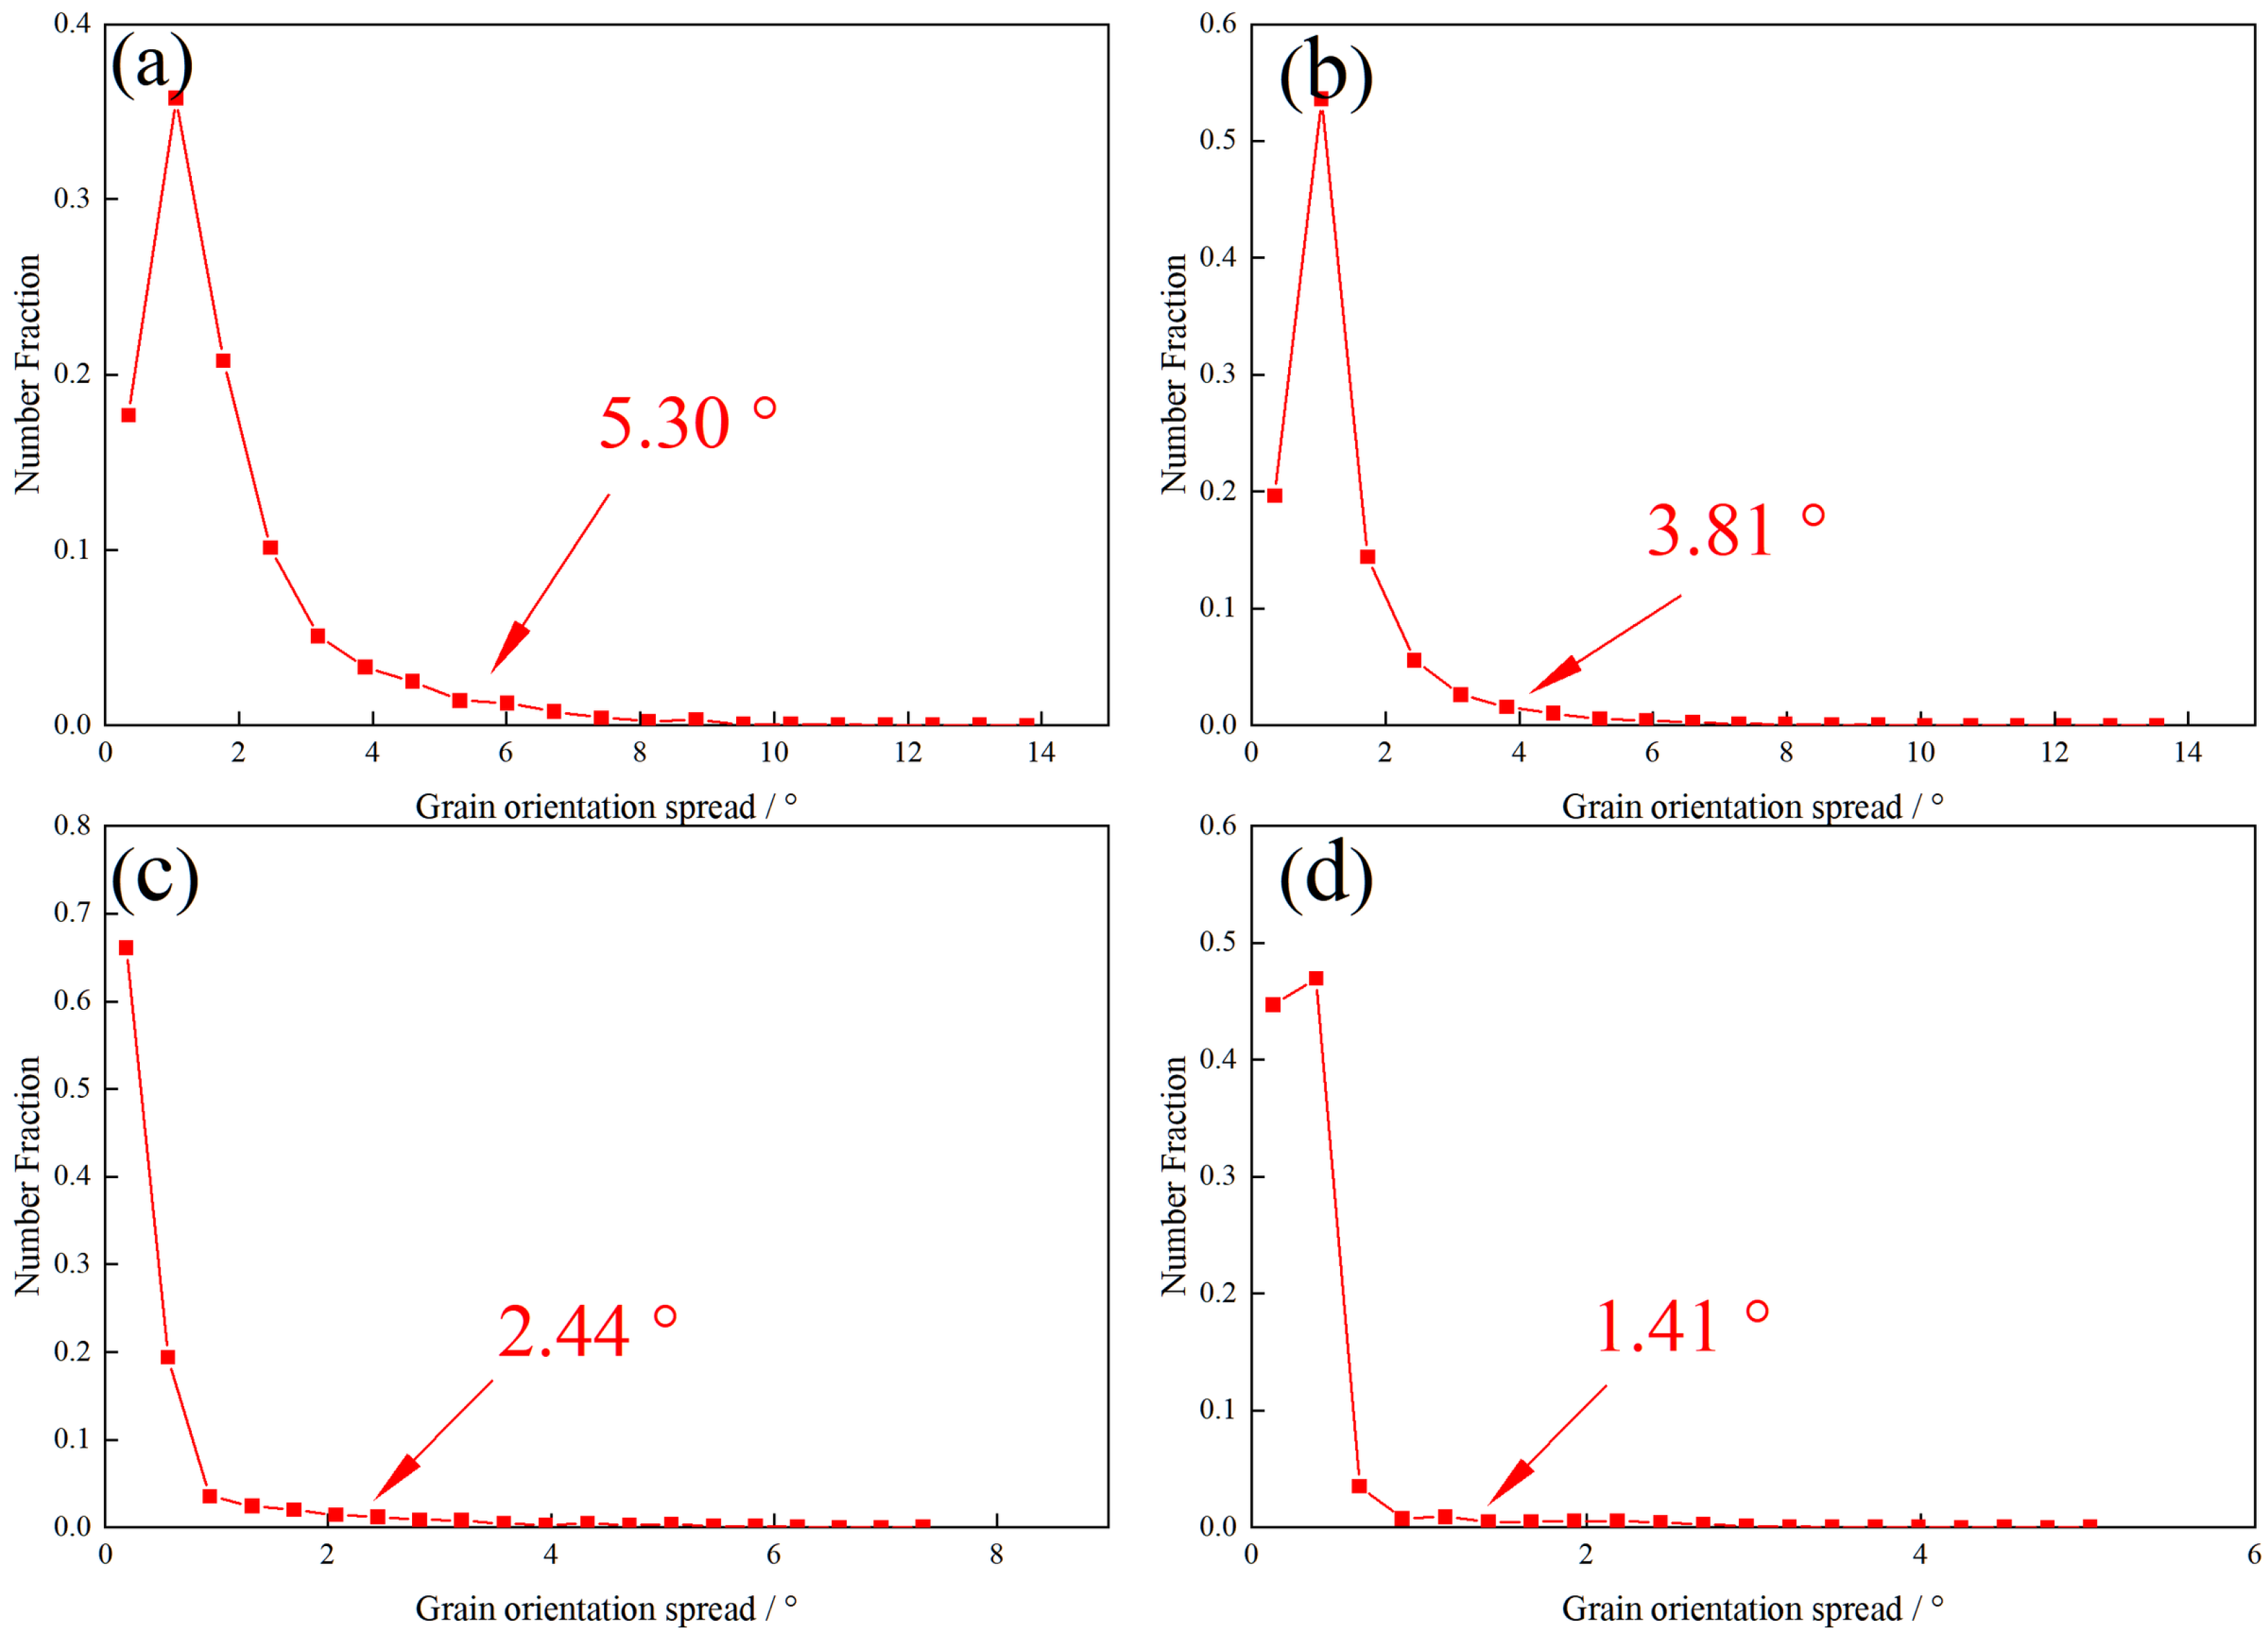
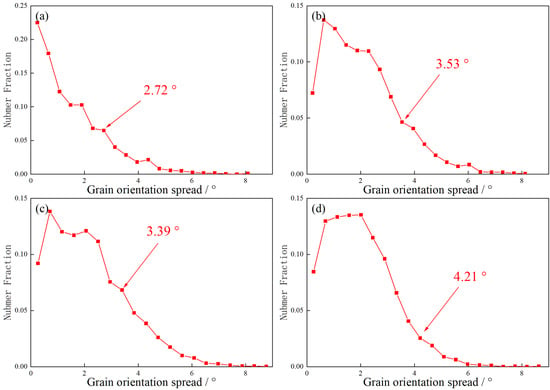
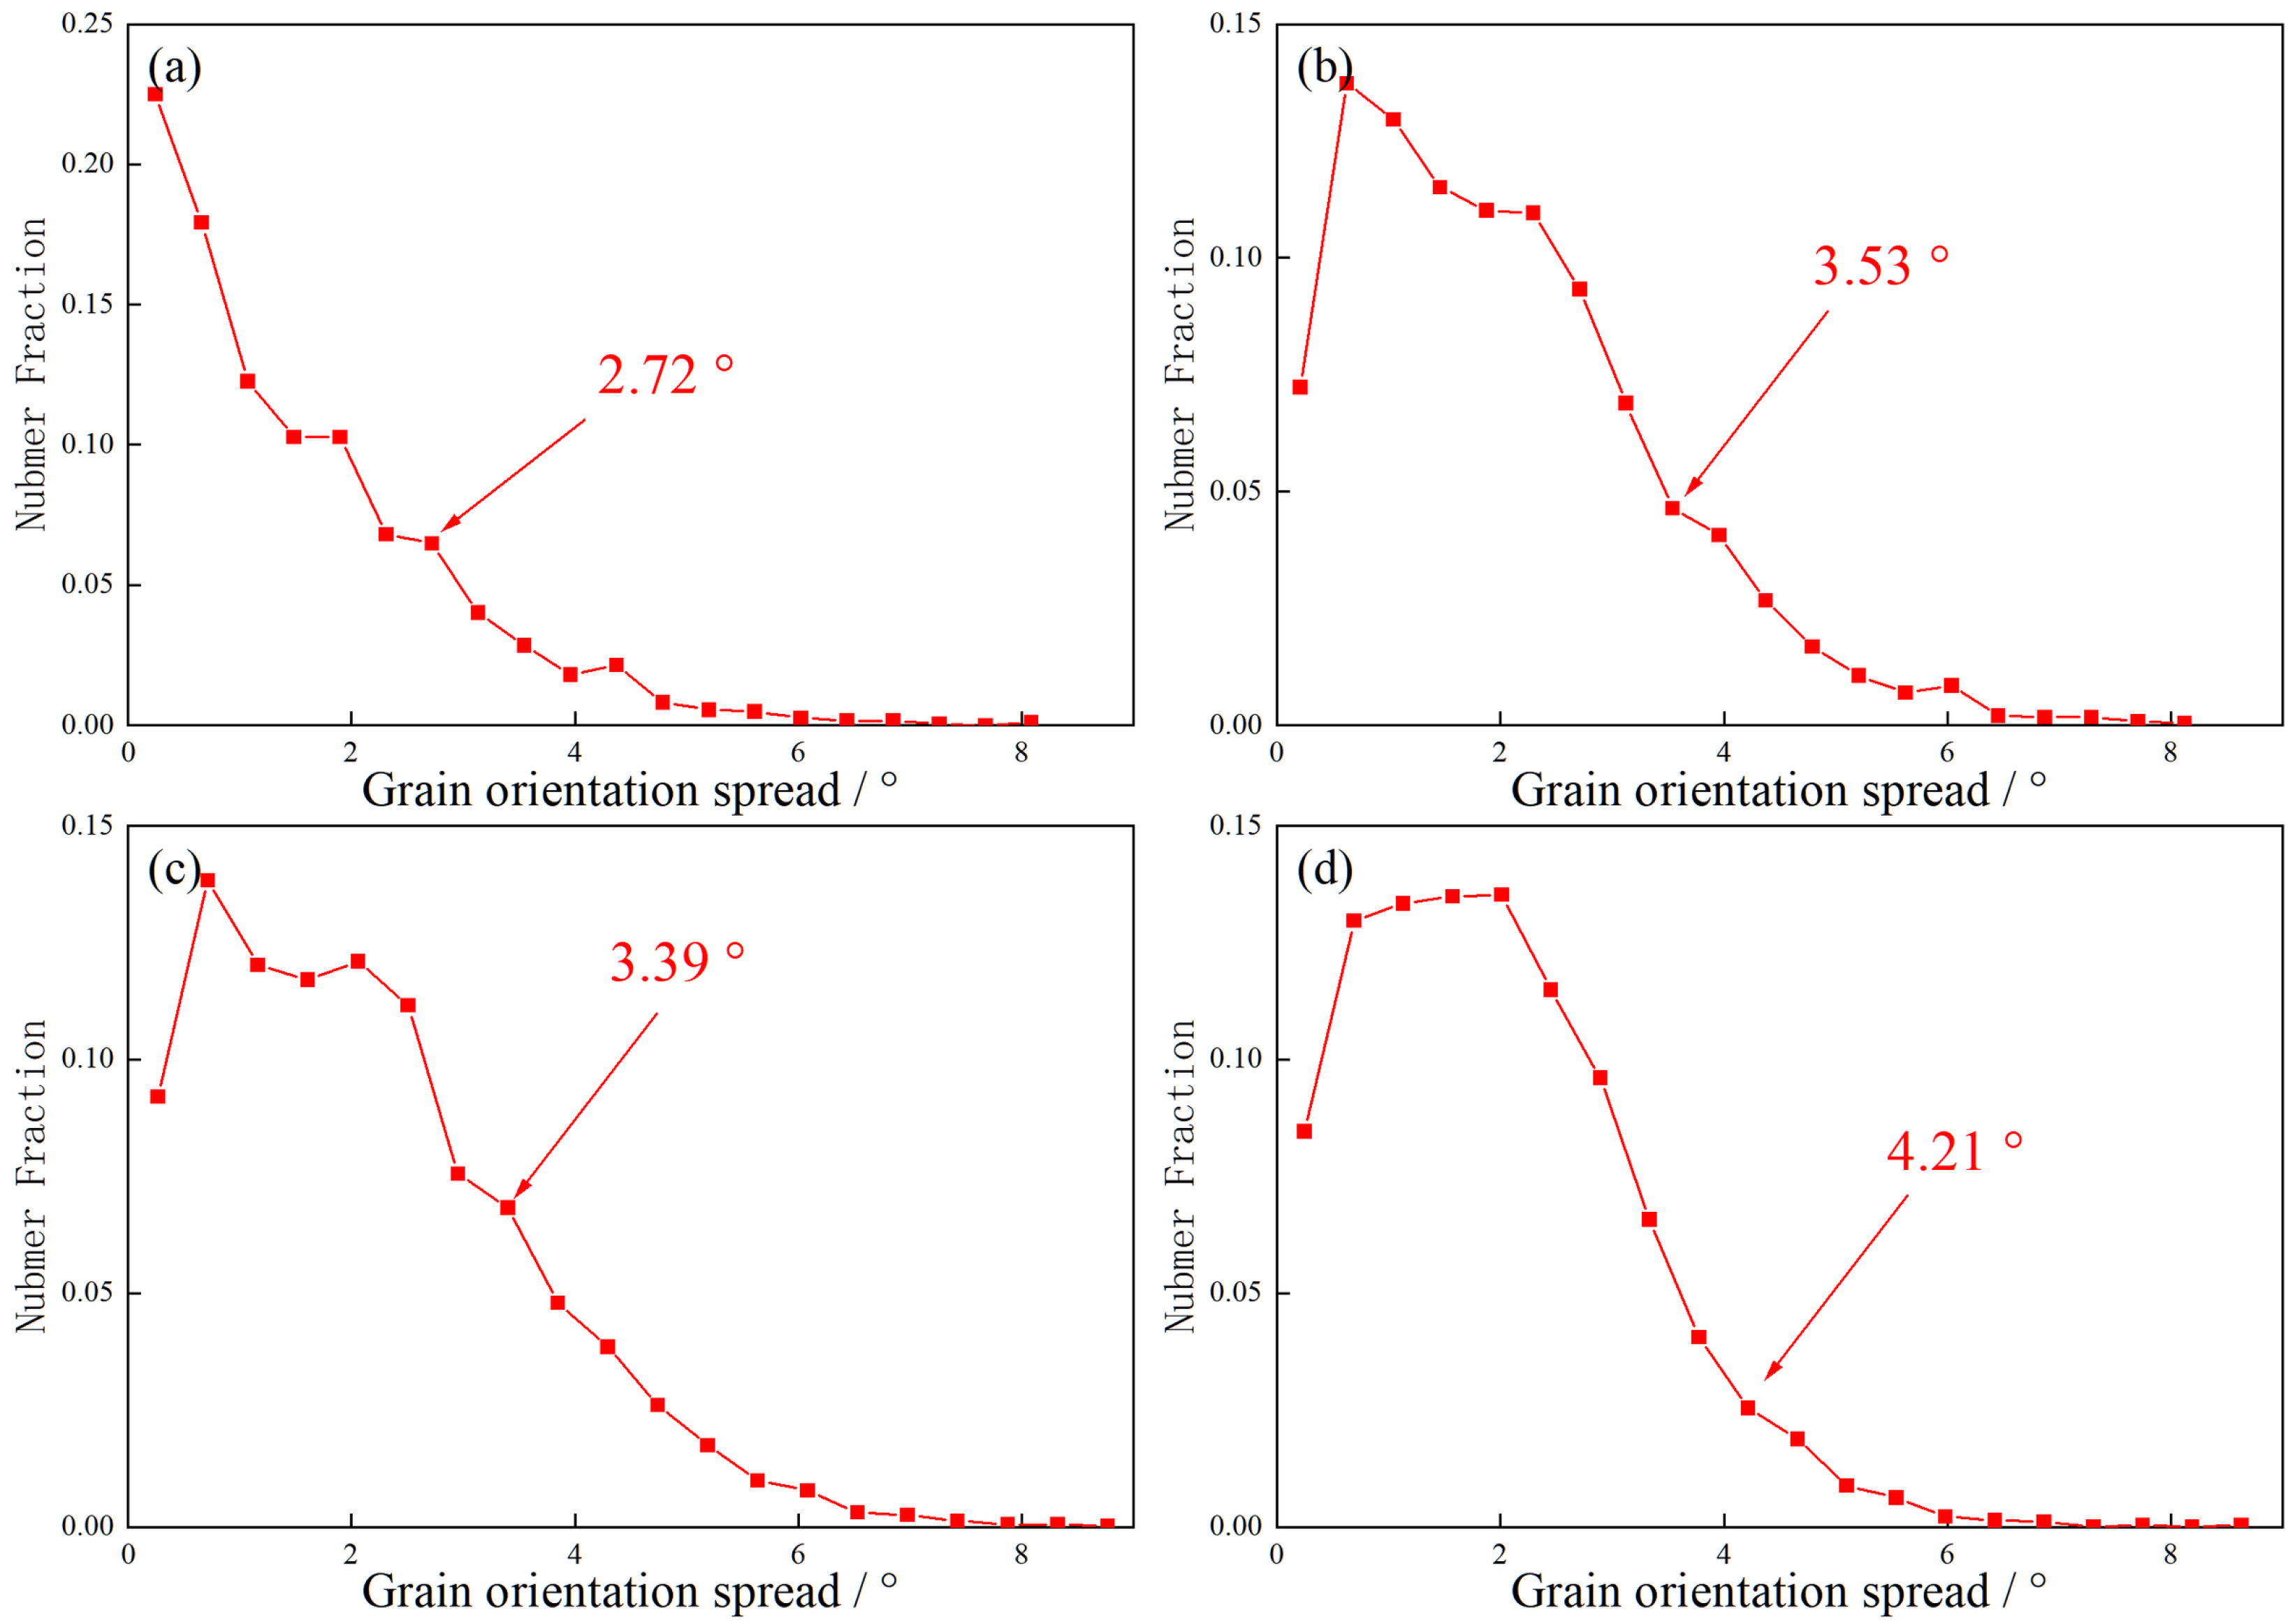
Figure 8a–d presents the GOS statistical data for the as-rolled condition and after annealing at 200 °C for 60, 120, and 180 min. According to the aforementioned criterion, the thresholds separating recrystallized from deformed grains are determined to be 5.30°, 3.81°, 2.44°, and 1.41°, respectively. Based on these thresholds, the recrystallized grain fractions under the respective conditions are 43.1%, 56.3%, 80.3%, and 90.3%, showing an increasing trend with annealing time.
Figure 8.
Grain orientation spread (GOS) statistical data of the AZ31 matrix: (a) as-rolled; (b) annealed at 200 °C for 60 min; (c) annealed at 200 °C for 120 min; (d) annealed at 200 °C for 180 min.
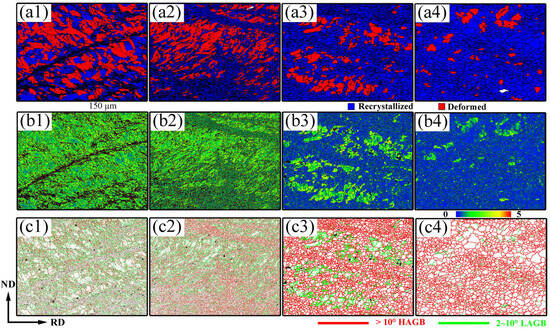
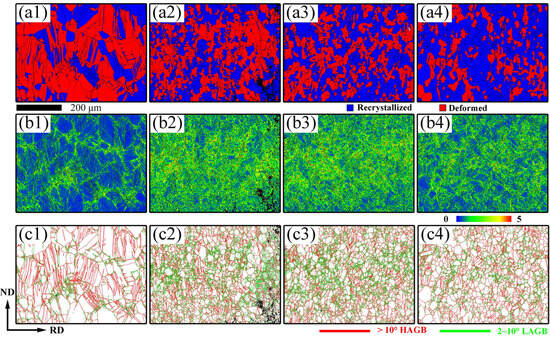
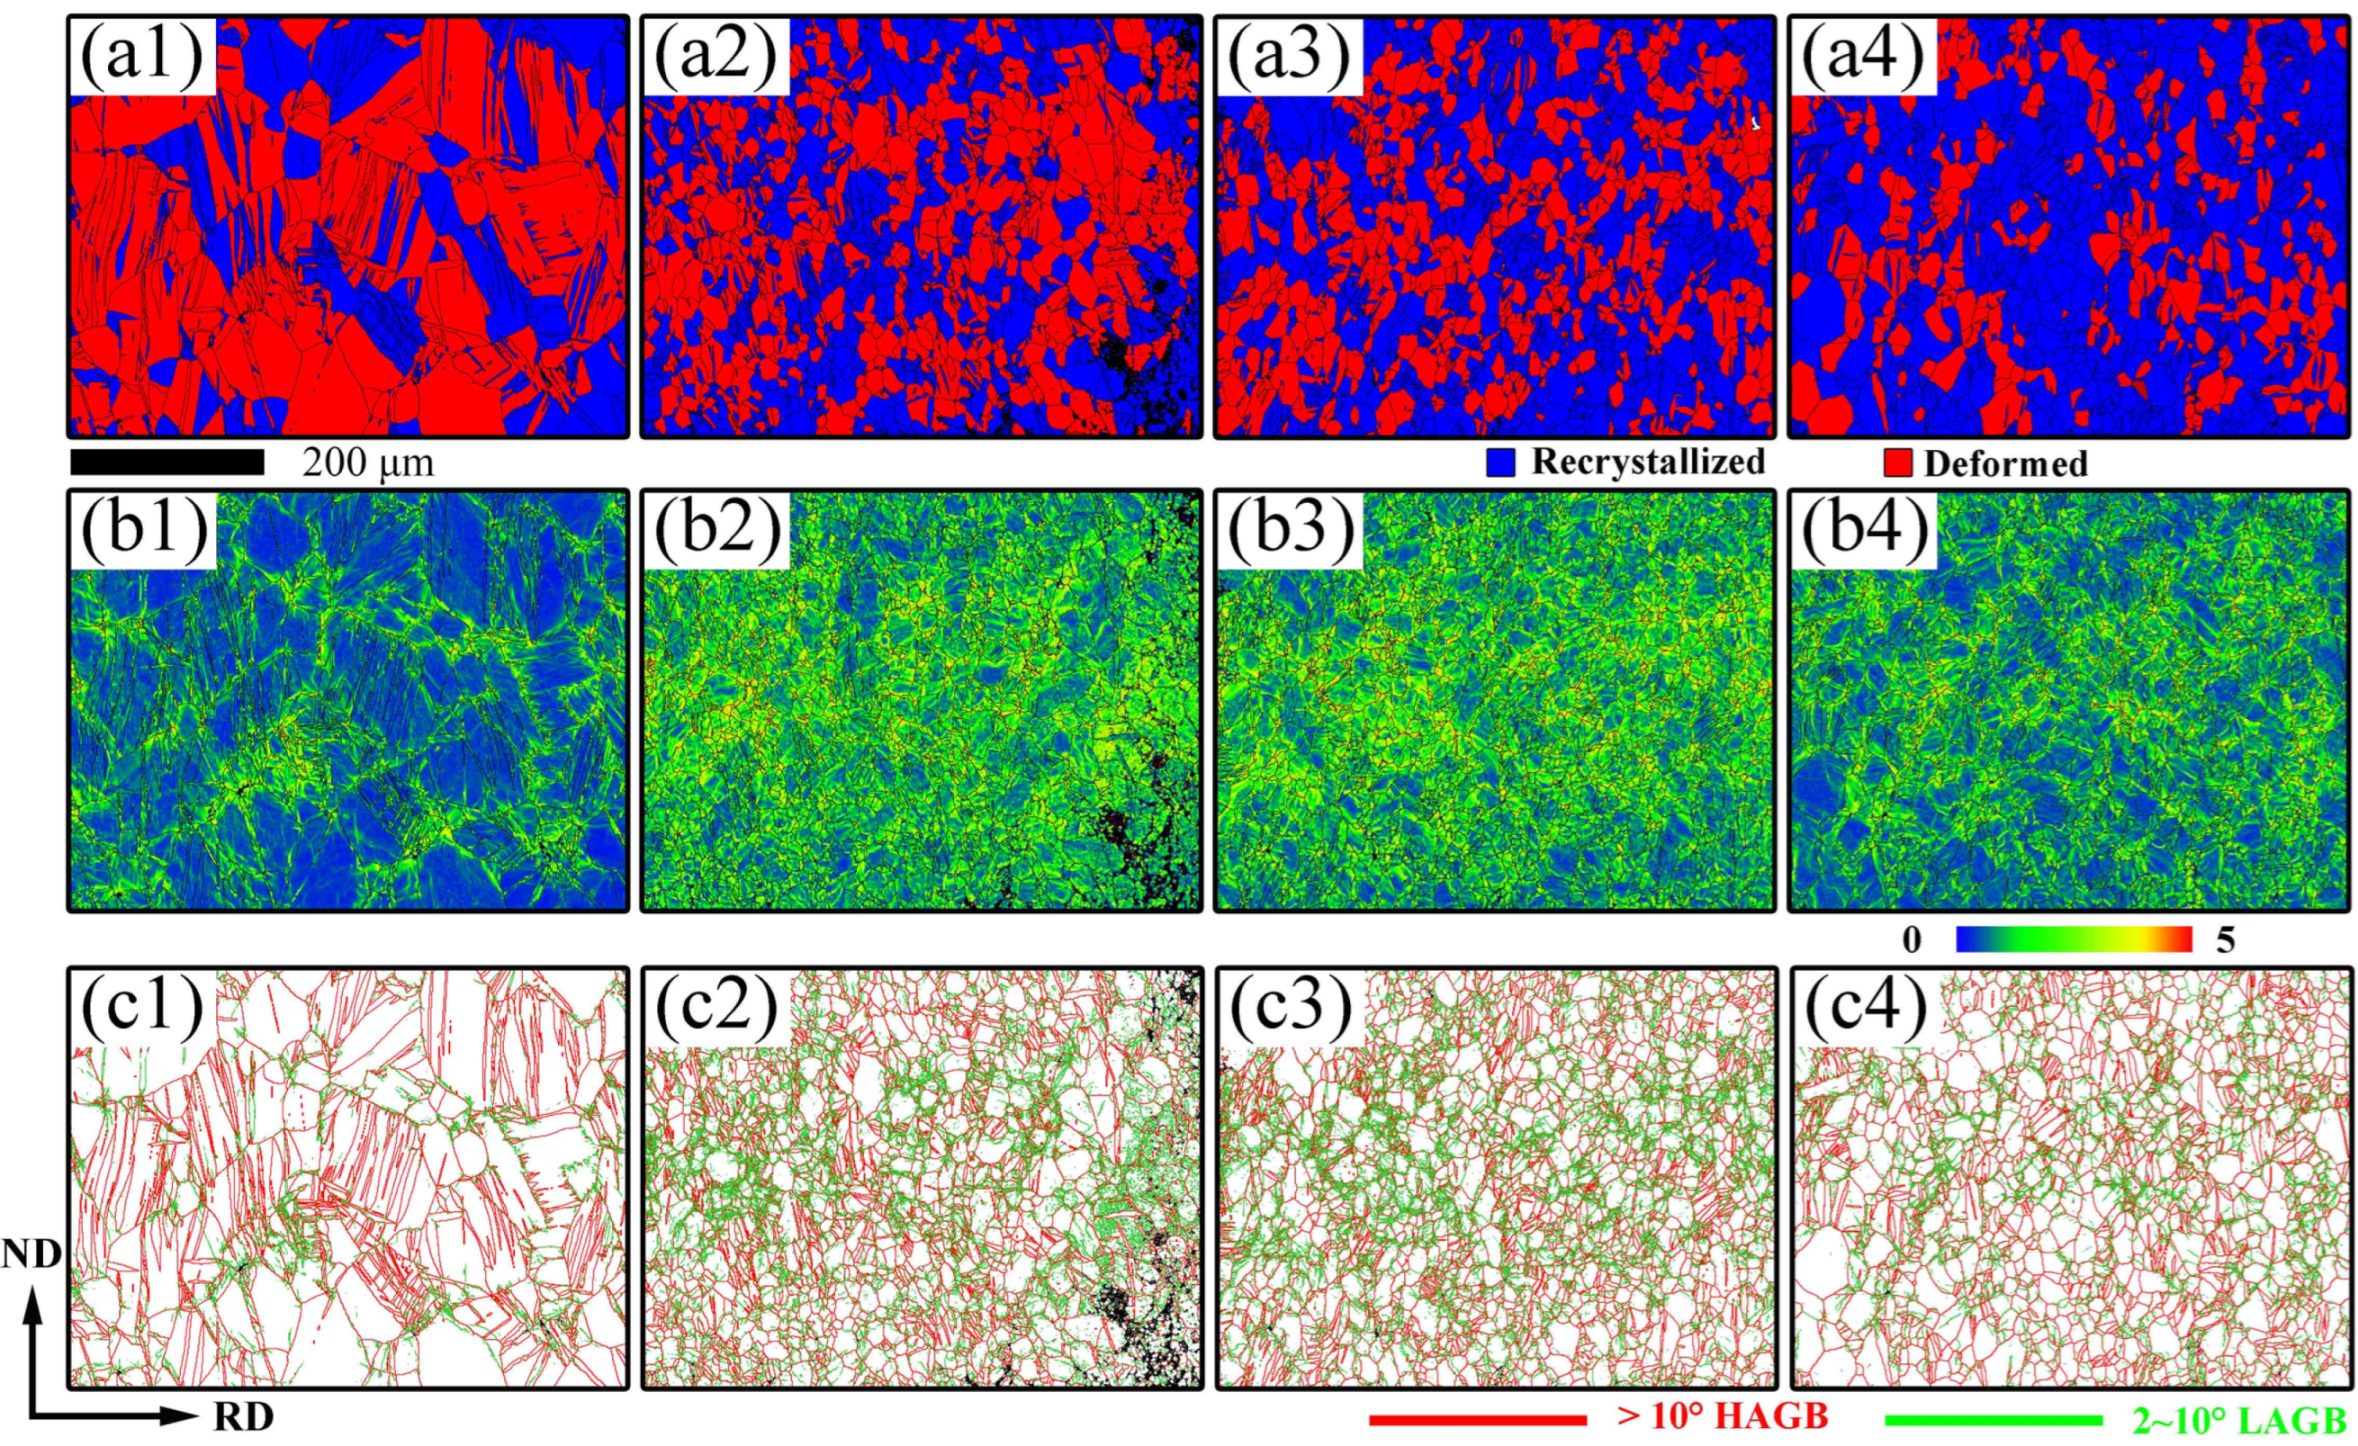
As shown in Figure 9(c1–c4), pronounced shear bands are observed in the as-rolled AZ31 matrix, consistent with findings by Wei et al. [11]. Within these regions, the degree of grain fragmentation is significantly higher than in other areas, and some elongated deformed grains are also present.
Figure 9.
Grain orientation spread (GOS), kernel average misorientation (KAM), and grain-boundary (GB) distribution maps of the AZ31 matrix for the as-rolled condition and after annealing at 200 °C for 60, 120, and 180 min: (a1–a4) GOS maps; (b1–b4) KAM maps; (c1–c4) grain-boundary maps.
As shown in Figure 9(a2), after annealing at 200 °C for 60 min, recrystallization occurs within the shear bands. The grain structure gradually recovers, forming fine-grained regions. Consequently, both fine and coarse grains coexist throughout the area; the recrystallized grain fraction increases to 56.3%, and the average KAM value decreases to 1.39°. After 120 min of annealing, recrystallization becomes more pronounced. The recrystallized grain fraction increases to 80.3%, and the average KAM value decreases to 0.64°. With the annealing time increased to 180 min, the recrystallized grain fraction increases to 90.3%, and the average KAM value decreases to 0.39°, as shown in Figure 10. The results shows that annealing treatment can effectively optimize the microstructure of AZ31.
Figure 10.
Statistical data of the grain orientation spread (GOS), kernel average misorientation (KAM), and grain-boundary (GB) fraction of the AZ31 matrix for the as-rolled condition and after annealing at 200 °C for 60, 120, and 180 min: (a–d) GOS distributions; (e–h) KAM distributions; (i–l) grain-boundary-fraction distributions.
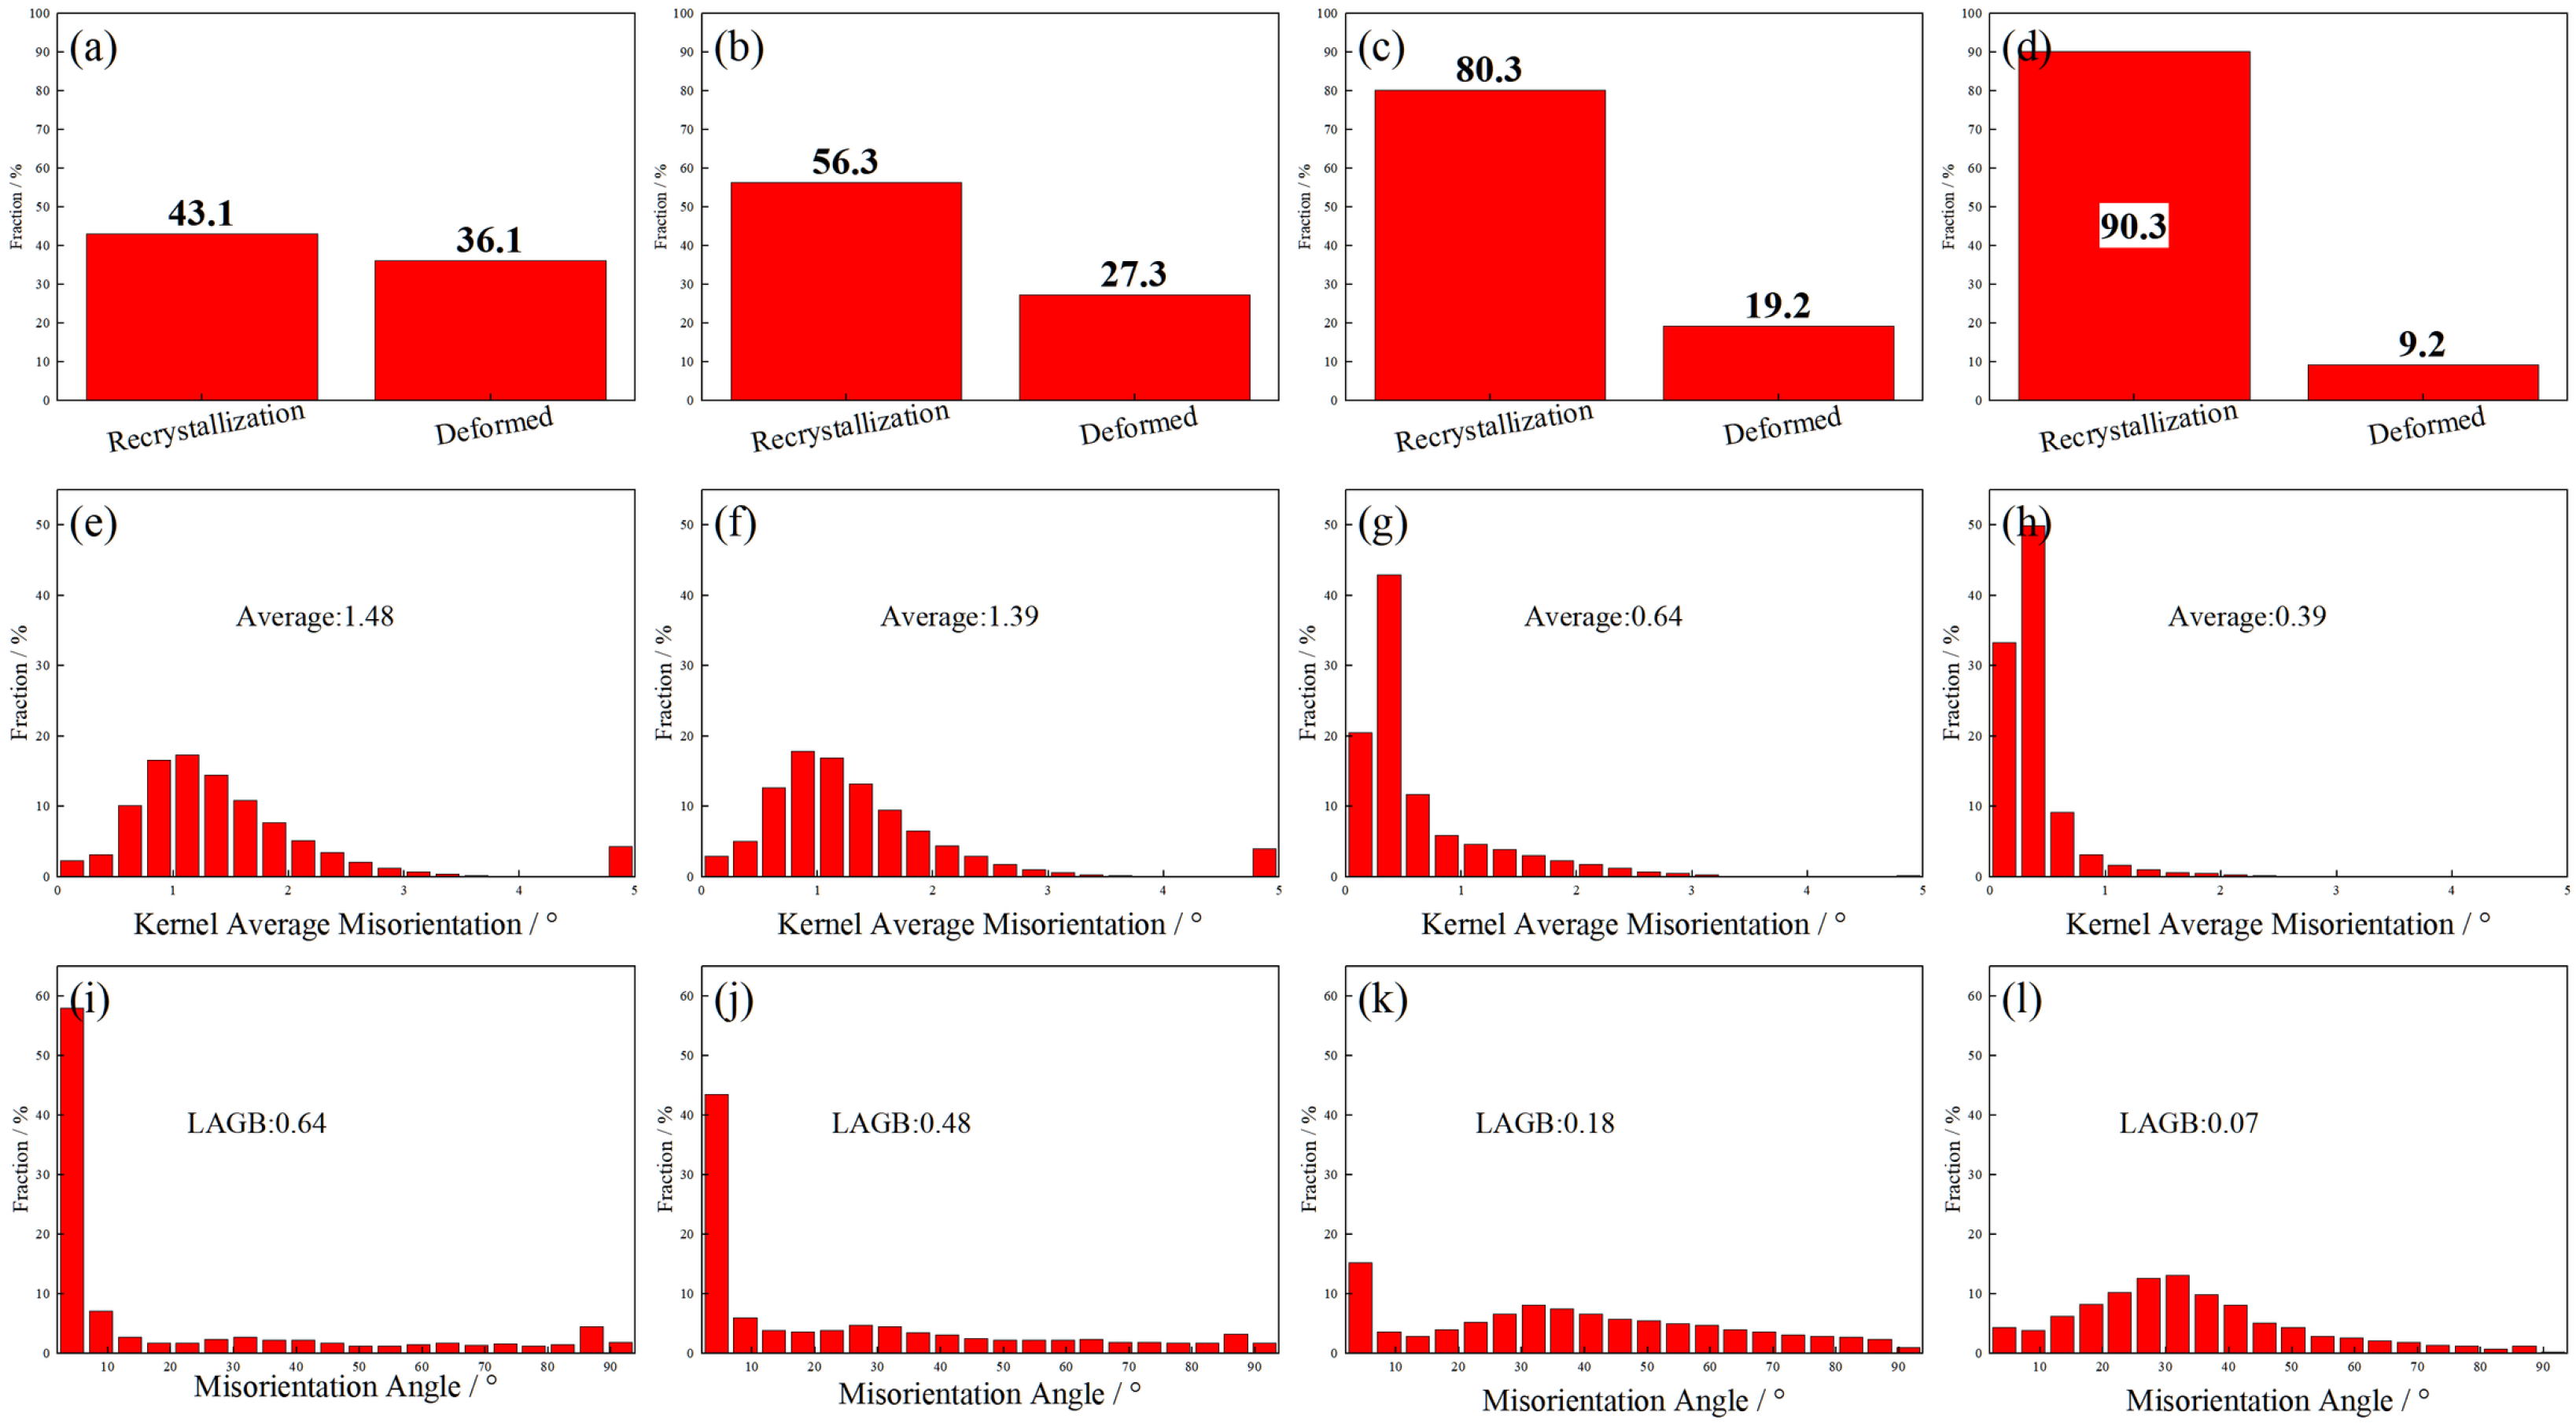
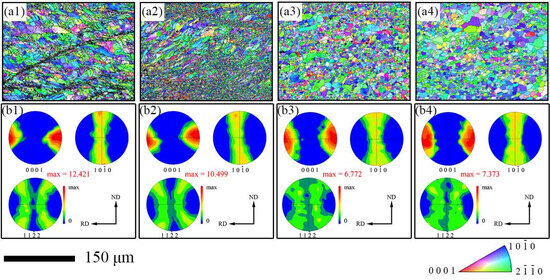
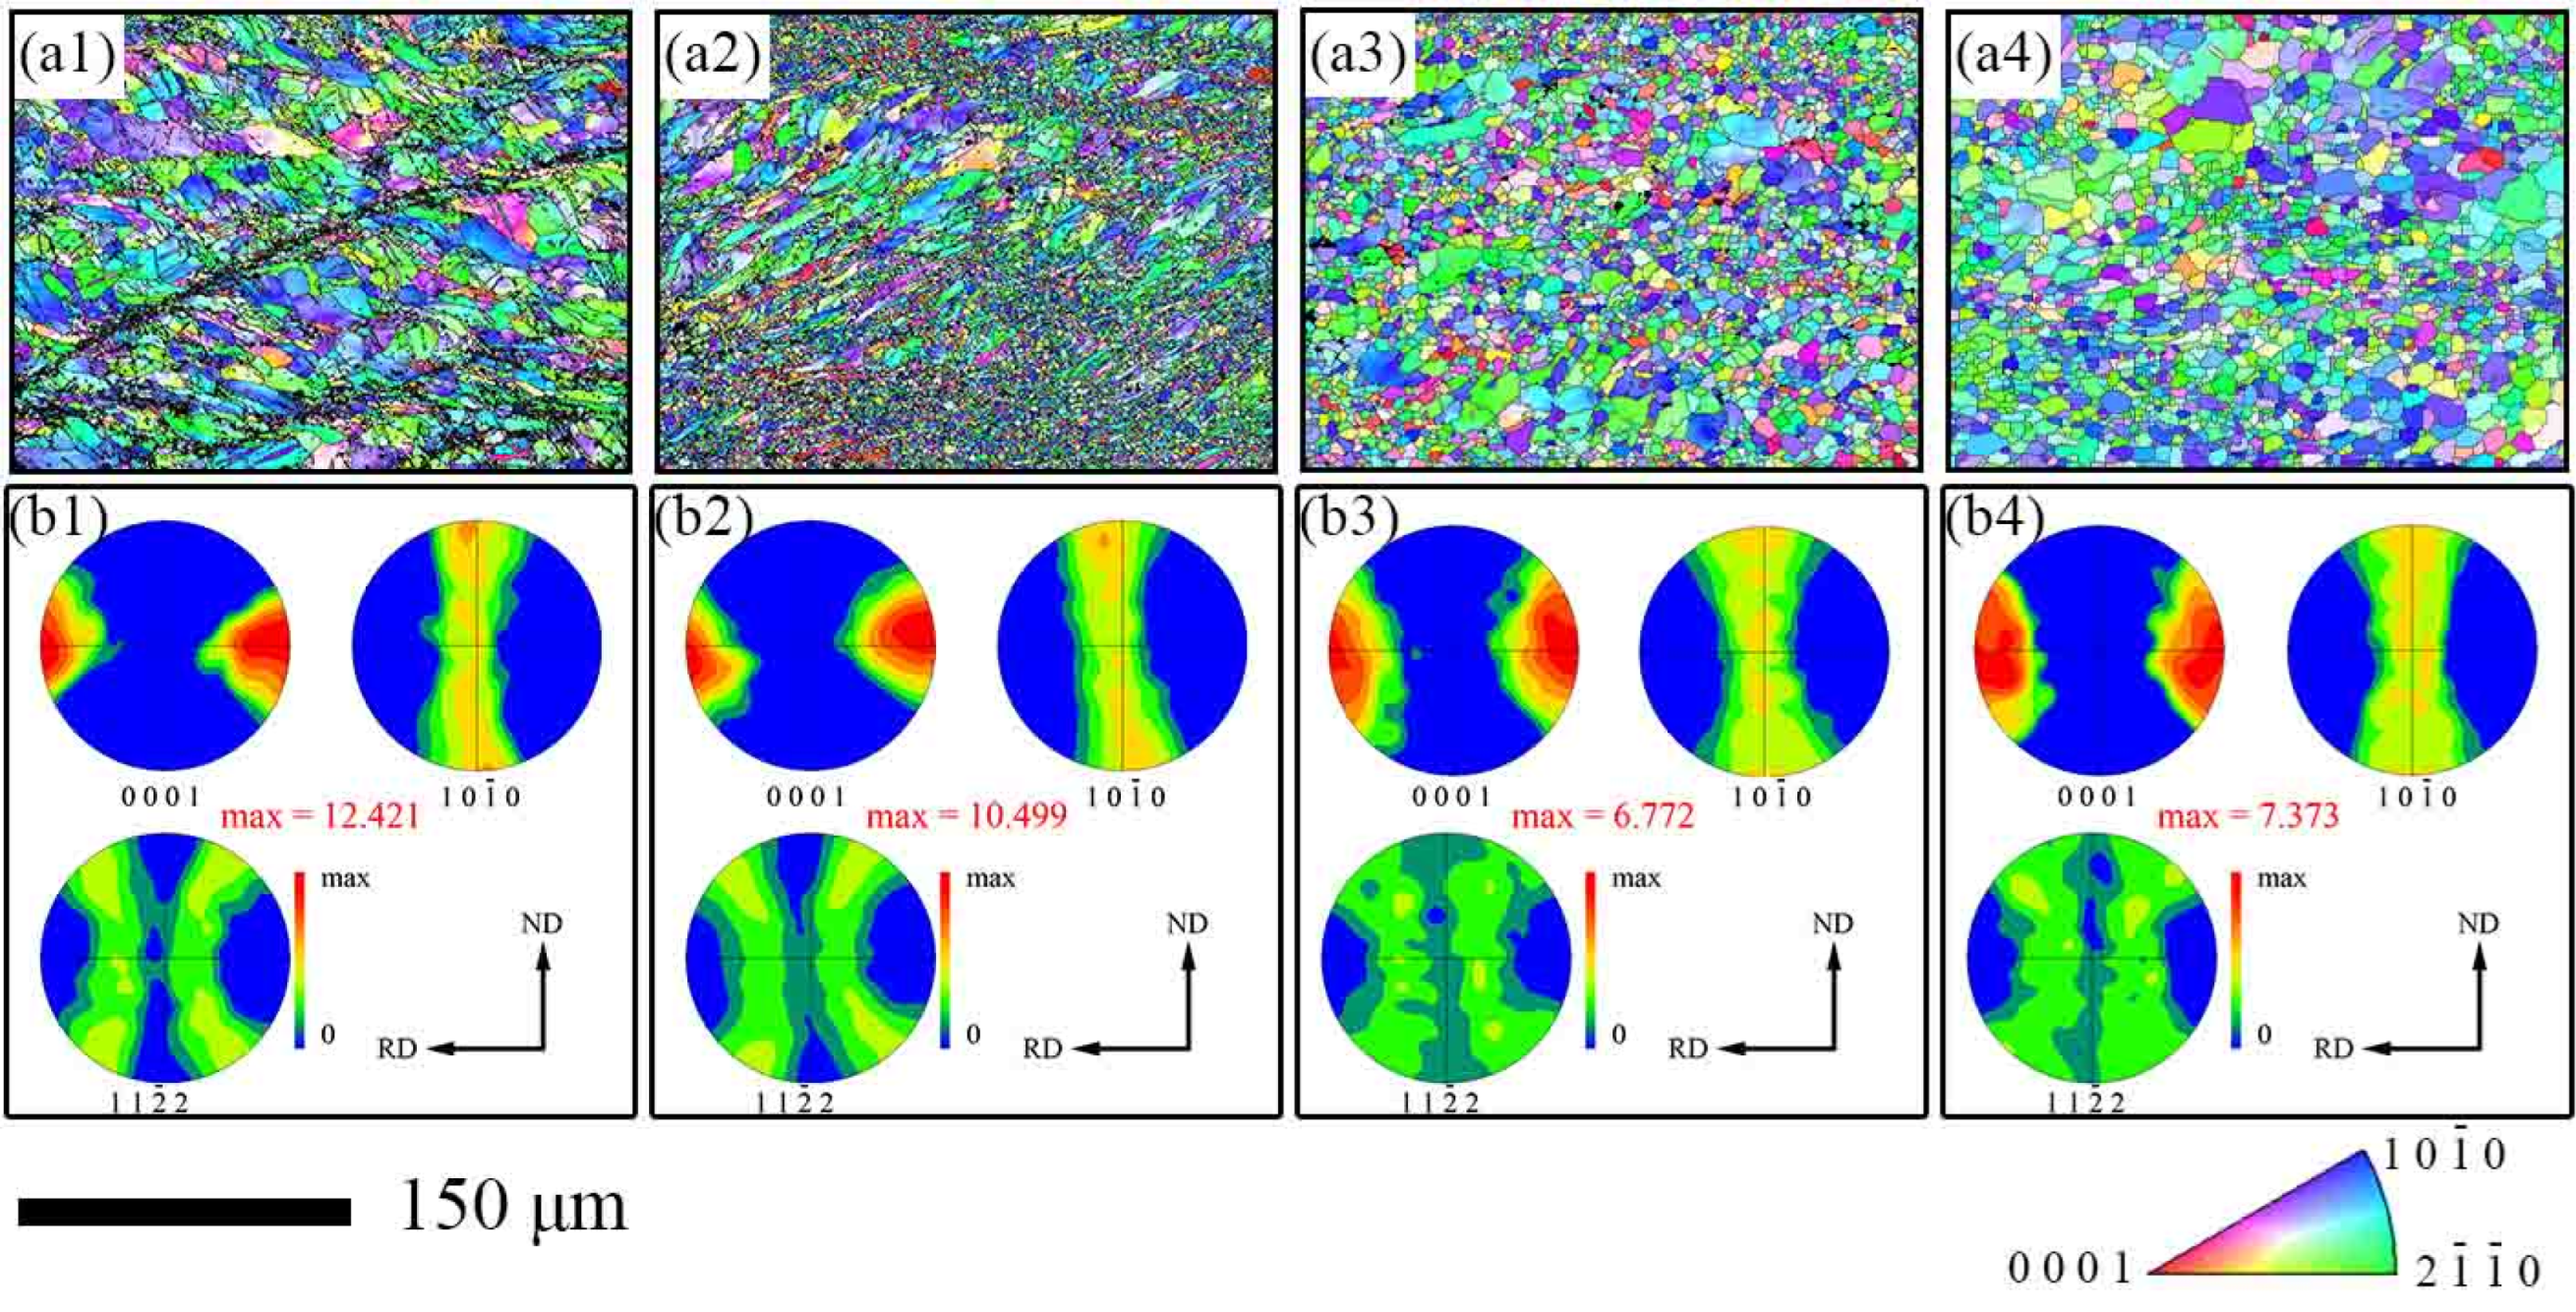
Figure 11 presents the pole figures and inverse pole figures of the AZ31 matrix under different annealing conditions. The number of indexed grains was 3191, 9482, 1514, and 1268 on the Mg side, for the as-rolled condition and after annealing at 200 °C for 60, 120, and 180 min, respectively. Figure 11(b1) shows that most grains exhibit their {0001} crystallographic planes parallel to the rolling direction, i.e., {0001} basal texture with the c-axis predominantly oriented close to the ND, with a slight deviation, characteristic of a typical basal texture. Figure 11(b2–b4) demonstrate that the same texture type is also generated in the annealed samples. With increasing annealing time, the texture intensity decreases from 12.421 in the as-rolled state to 10.499 after 60 min, further to 6.772 after 120 min, and then slightly increases to 7.373 after 180 min.
Figure 11.
Pole figures and inverse pole figures of the AZ31 matrix under different annealing conditions; (a1–a4) IPF distribution maps of AZ31 matrix for as-rolled and samples annealed for 60, 120, and 180 min, respectively; (b1–b4) PF maps of AZ31 matrix for as-rolled and samples annealed for 60, 120, and 180 min, respectively.
During the initial annealing stages (60 and 120 min), new grains nucleate preferentially at high-energy storage regions such as shear bands and grain boundaries. These nucleation sites exhibit relatively random orientations, weakening the original strong basal texture and consequently decreasing texture intensity. Under the 180 min condition, the material enters the grain growth stage, during which grain boundary migration rates exhibit strong orientation dependence. Grains with specific orientations grow preferentially, consuming grains with unfavorable orientations, leading to a rebound in texture intensity.
Notably, the final texture type remained unchanged, indicating that recrystallization did not randomize the orientation but rather selected and strengthened specific components of the deformation texture. Such textural evolution induces anisotropy in the mechanical properties of the metal. This occurs because when external forces are applied along different directions relative to the metal, the presence of preferred orientations leads to significant differences in plastic deformation behaviors, such as the activation of slip systems.
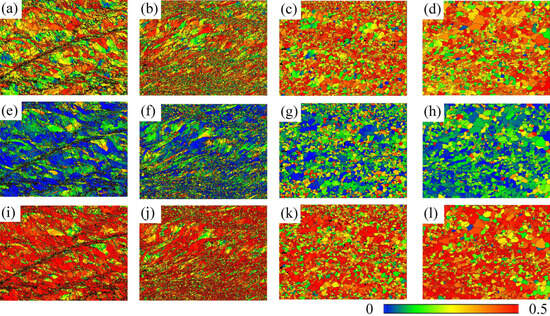
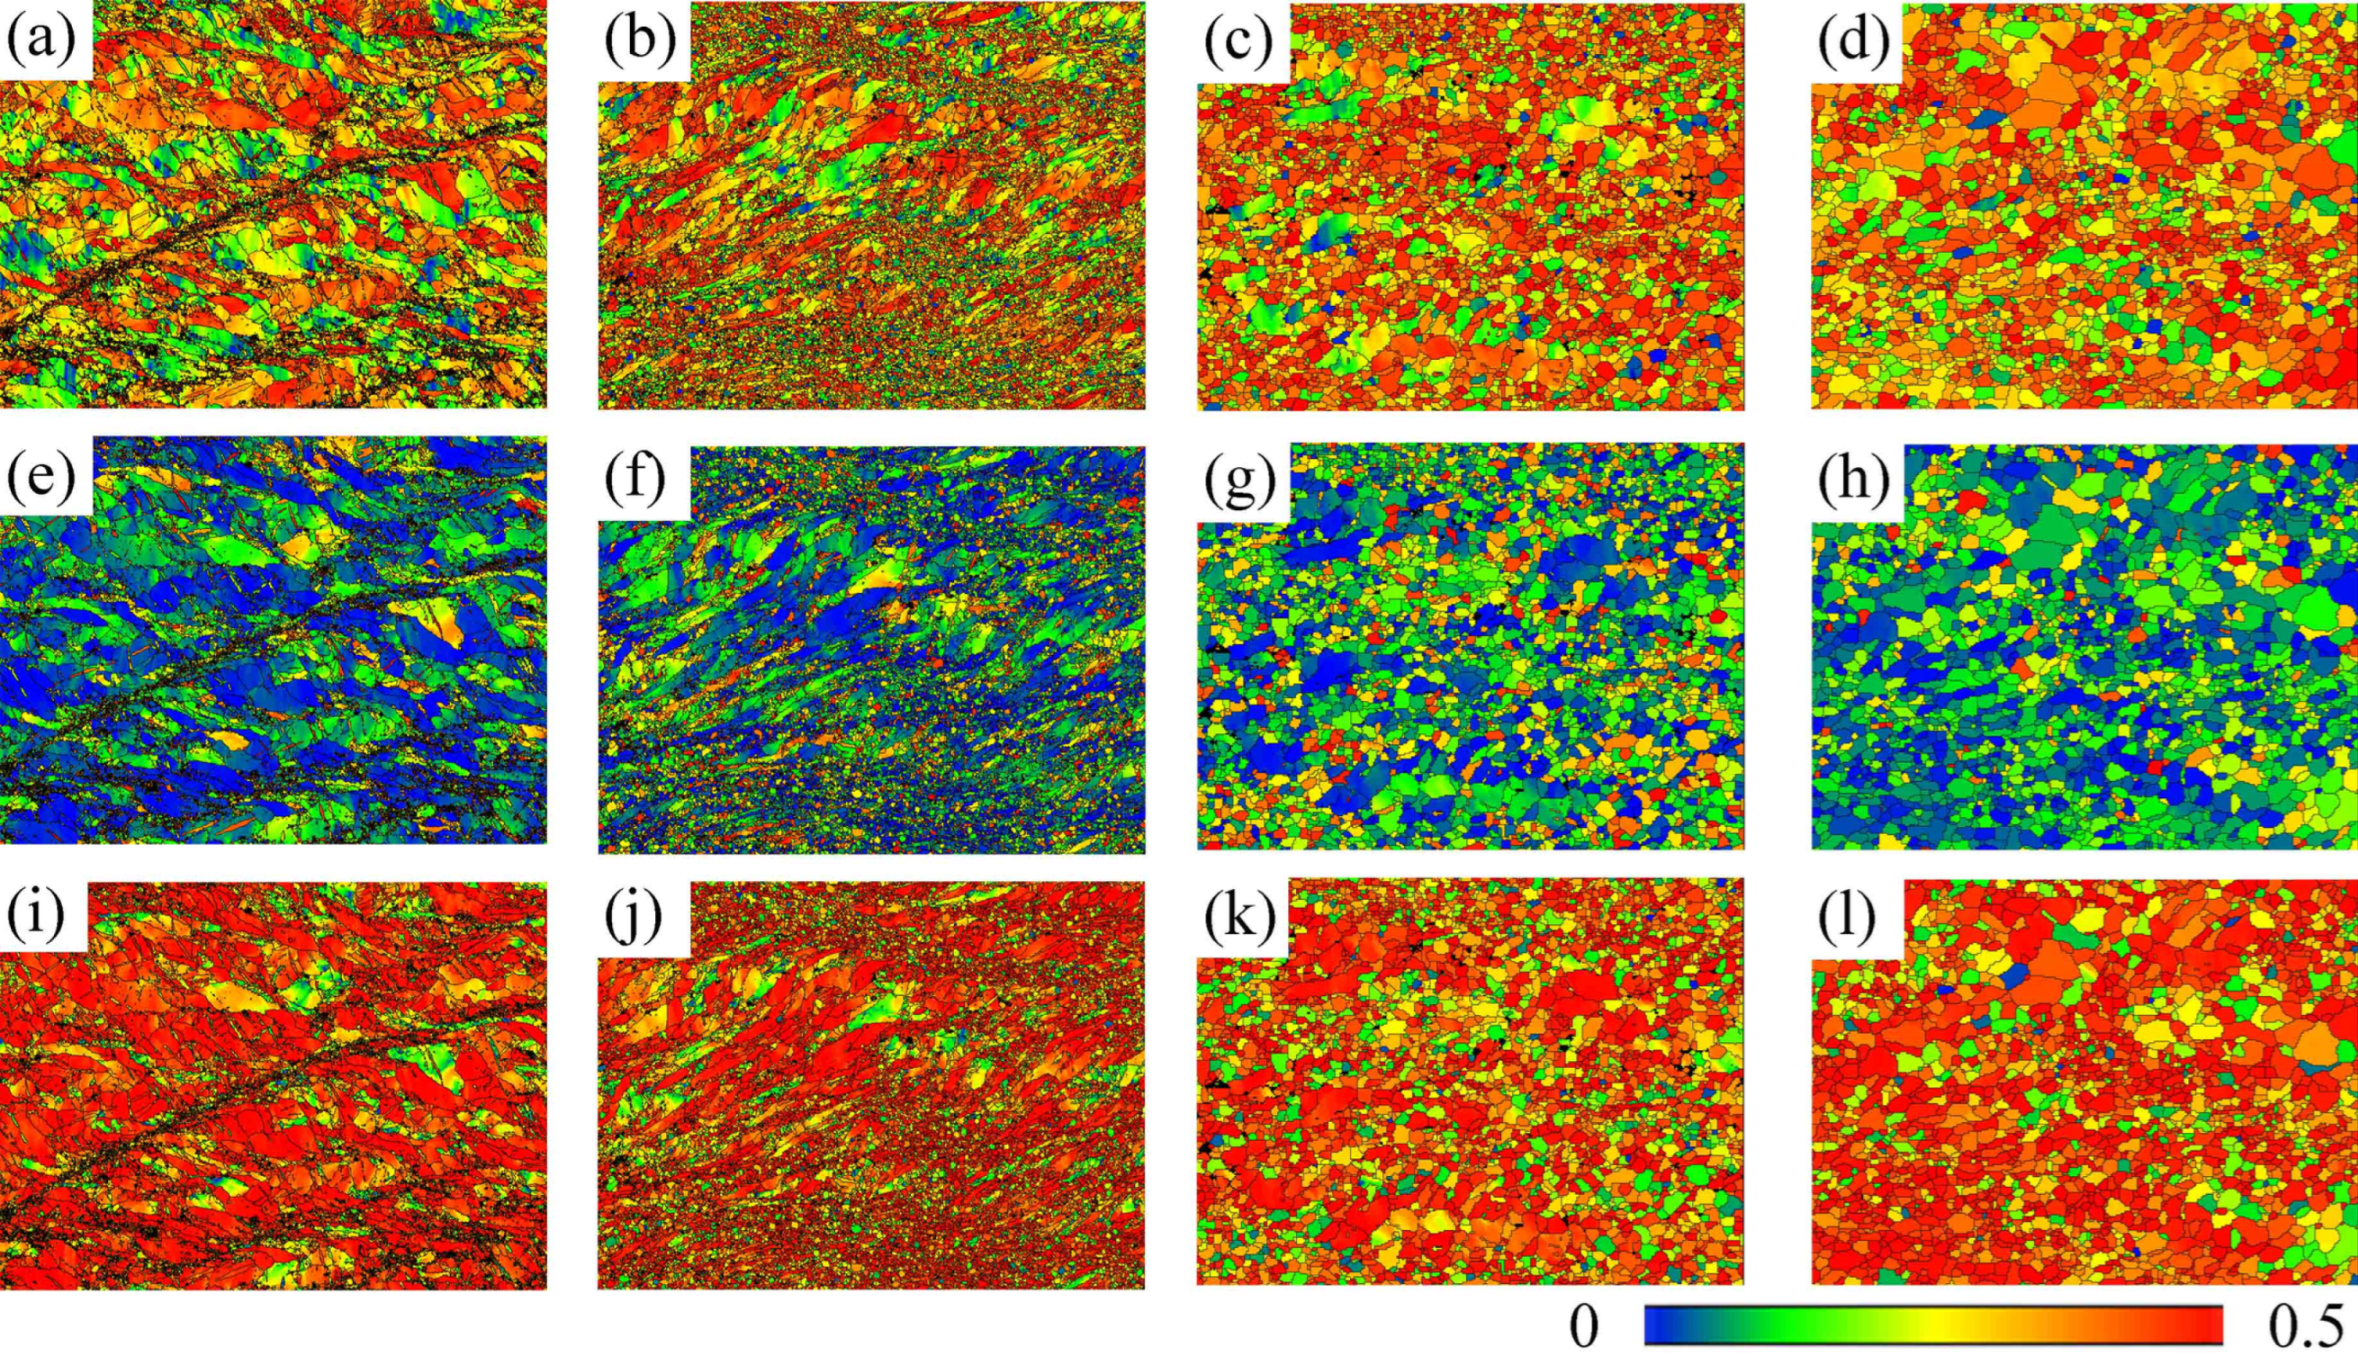
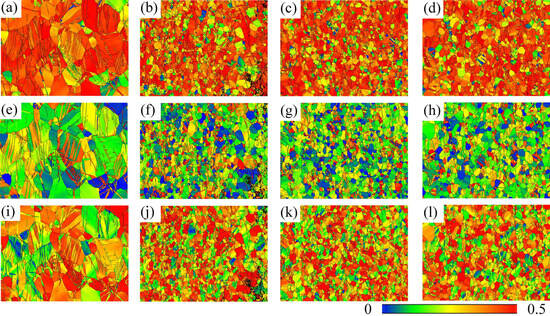
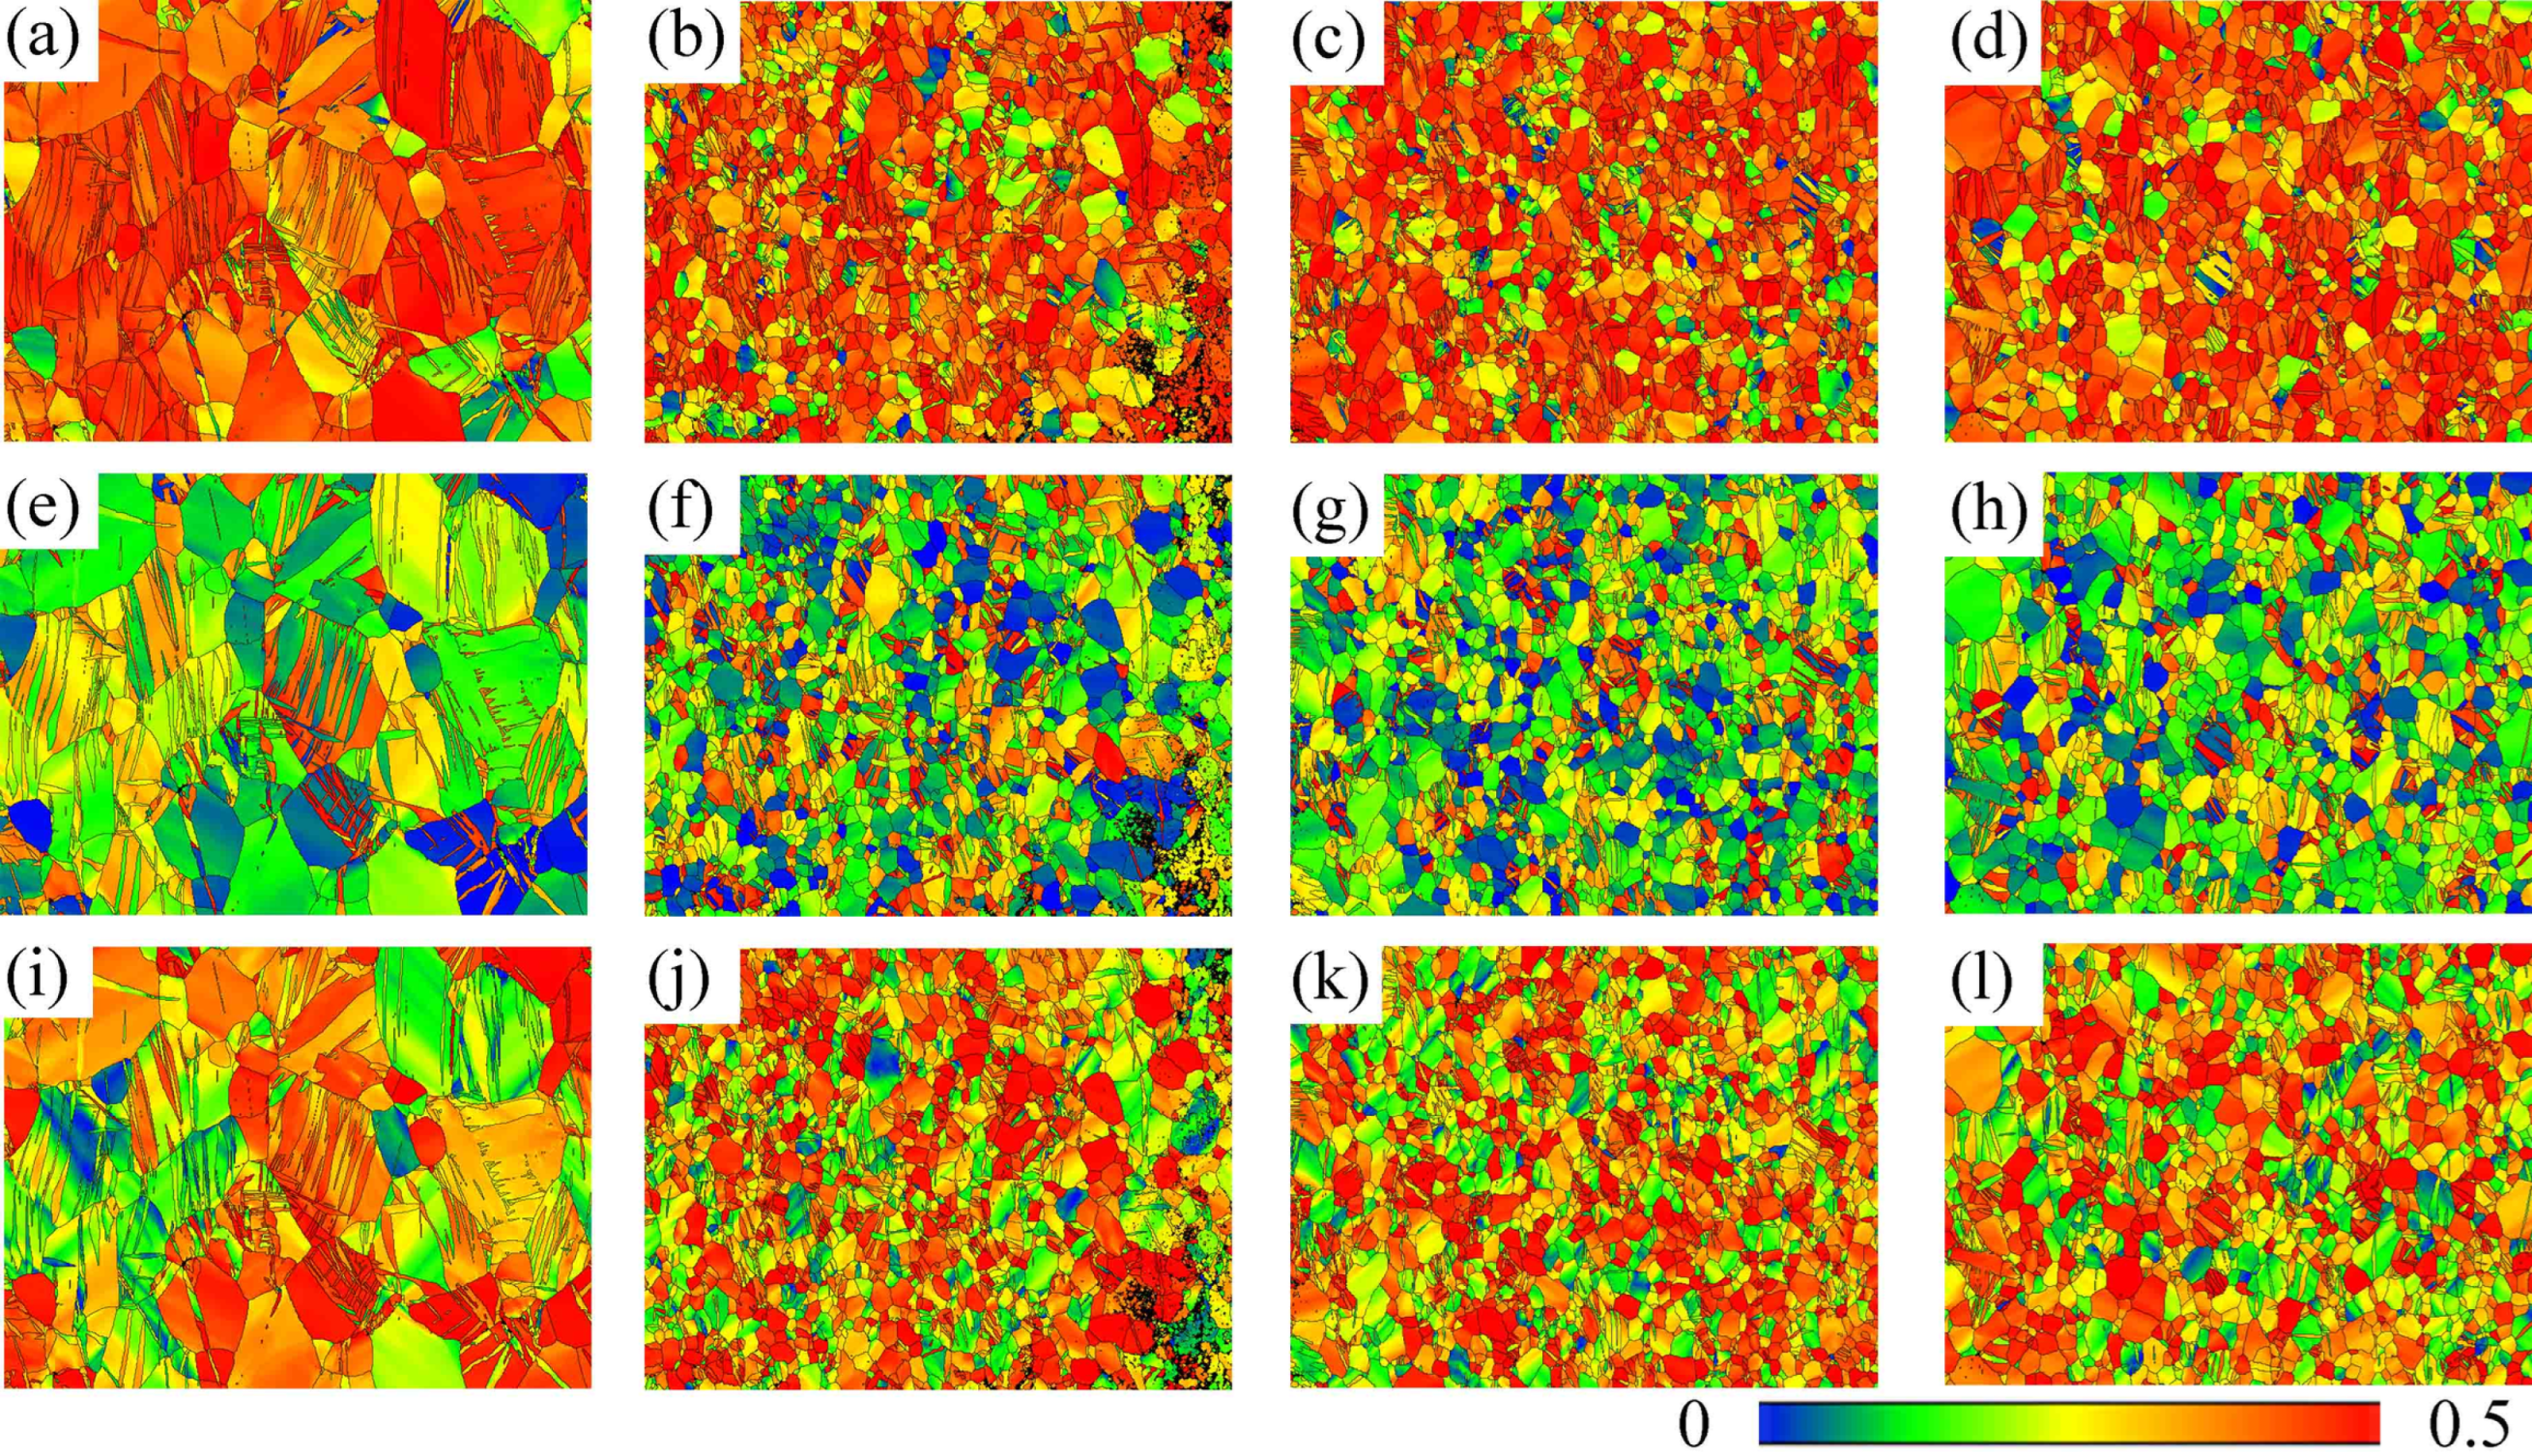
As shown in Figure 12 and Figure 13, the Schmid factors for basal <a> slip, prismatic <a> slip, and pyramidal <c + a> slip within the AZ31 matrix region, as well as the Schmid factor distribution maps for each slip system, were statistically analyzed under external loading applied along the rolling direction. It can be observed that the average Schmid factor for the basal <a> slip system gradually increased from 0.30 to 0.32 and then to 0.34. For the prismatic <a> slip system, the average Schmid factor initially increased from 0.11 to 0.14 and 0.15, subsequently decreasing to 0.11. The average Schmid factor for the pyramidal <c + a> slip system progressively changed from 0.45 to 0.43 and 0.42, before increasing to 0.43.
Figure 12.
Schmid factor statistical distribution of AZ31 matrix under different annealing conditions. (a) As-rolled; (b) Annealed at 200 °C for 60 min; (c) Annealed at 200 °C for 120 min; (d) Annealed at 200 °C for 180 min.
Figure 13.
Schmid factor distribution maps of the AZ31 matrix for the as-rolled condition and after annealing at 200 °C for 60, 120, and 180 min: (a–d) basal <a> slip; (e–h) prismatic <a> slip; (i–l) pyramidal <c + a> slip.
The prismatic <a> slip system exhibited the smallest Schmid factor among the three slip systems, while the pyramidal <c + a> slip system showed the highest average Schmid factor. According to Schmid’s law [28], the orientation factor for the prismatic slip system is extremely low. This indicates that regardless of how the microstructure is optimized through annealing, prismatic slip remains difficult to activate during tensile loading along the RD. Therefore, the plastic deformation of the AZ31 layer along the RD is primarily coordinated by the combined action of basal slip and pyramidal slip. Basal slip accommodates strain in the <a> direction, while pyramidal slip accommodates strain in the <c> direction.
3.3.2. Electron Backscatter Diffraction Analysis of the TA1 Matrix
The recrystallized fraction of the titanium matrix was calculated using the same method. The threshold values obtained under different annealing conditions are presented in Figure 14. Comparison of the classification results with the KAM maps and the distributions of low- and high-angle grain boundaries shows that the identified recrystallized grains correspond well to regions with high-angle grain boundaries and low dislocation density, confirming the validity of the classification.
Figure 14.
Grain orientation spread (GOS) statistical data of the TA1 matrix: (a) as-rolled; (b) annealed at 200 °C for 60 min; (c) annealed at 200 °C for 120 min; (d) annealed at 200 °C for 180 min.
As shown in Figure 15(a1–a4), the TA1 matrix in the as-rolled composite plate exhibits large, nearly equiaxed grains containing numerous twins. With progressive annealing, the TA1 grains initially refine and then coarsen. As shown in Figure 16, the low dislocation density grain fractions in the TA1 matrix under each condition are 33.8%, 46.2%, 56%, and 69.3%, respectively. These results indicate that the TA1 matrix undergoes a certain degree of recrystallization and recovery. As illustrated in Figure 15(b1–b4), dislocations in the as-rolled TA1 matrix are primarily distributed along grain boundaries, whereas in the annealed samples, dislocations are distributed within the grains and occupy most regions. The average KAM values are 0.66°, 1.14°, 1.13°, and 0.92°, respectively. Figure 15 reveals numerous twins in the as-rolled TA1 matrix. Relevant literature indicates that, under small deformations, the deformation mechanism of titanium is primarily twinning [29]. In the authors’ previous work [10], under the same rolling conditions, the thickness reduction in the TA1 layer was only 10–20%. The lower average KAM value of the as-rolled sample compared to the annealed samples may be attributed to its minor deformation, with twinning rather than slip serving as the primary deformation mechanism [30].
Figure 15.
Grain orientation spread (GOS), kernel average misorientation (KAM), and grain-boundary (GB) distribution maps of the TA1 matrix for the as-rolled condition and after annealing at 200 °C for 60, 120, and 180 min: (a1–a4) GOS maps; (b1–b4) KAM maps; (c1–c4) grain-boundary maps.
As shown in Figure 16i–l, the proportion of low-angle grain boundaries (LAGBs) in the as-rolled sample is relatively low but increases after annealing. Specifically, as illustrated in Figure 16i–l, the LAGB proportion varies from 0.28 in the as-rolled state to 0.47, 0.46, and 0.37 in the annealed states, further confirming the occurrence of recrystallization and recovery within the TA1 matrix.
Figure 17 presents the pole figures and inverse pole figures of the TA1 matrix under different annealing conditions. The number of indexed grains was 808, 2174, 2177, and 1666 on the Ti side, for the as-rolled condition and after annealing at 200 °C for 60, 120, and 180 min, respectively. Figure 17(b1) indicates a preferred orientation, with the c-axis of most grains inclined at approximately 45° or 30° relative to the rolling direction. Additionally, the {10-10} prismatic planes of many grains are approximately parallel to the RD–ND plane, indicating a plate texture in the TA1 matrix. Figure 17(b2–b4) show that samples annealed at 200 °C for 60, 120, and 180 min exhibit the same texture type. With increasing annealing time, the texture intensity decreases from 8.653 in the as-rolled state to 5.894 after 60 min, then increases to 6.945 after 120 min, and finally rises slightly to 7.250 after 180 min.
Figure 16.
Statistical data of the grain orientation spread (GOS), kernel average misorientation (KAM), and grain-boundary (GB) fraction of the TA1 matrix for the as-rolled condition and after annealing at 200 °C for 60, 120, and 180 min: (a–d) GOS distributions; (e–h) KAM distributions; (i–l) grain-boundary-fraction distributions.
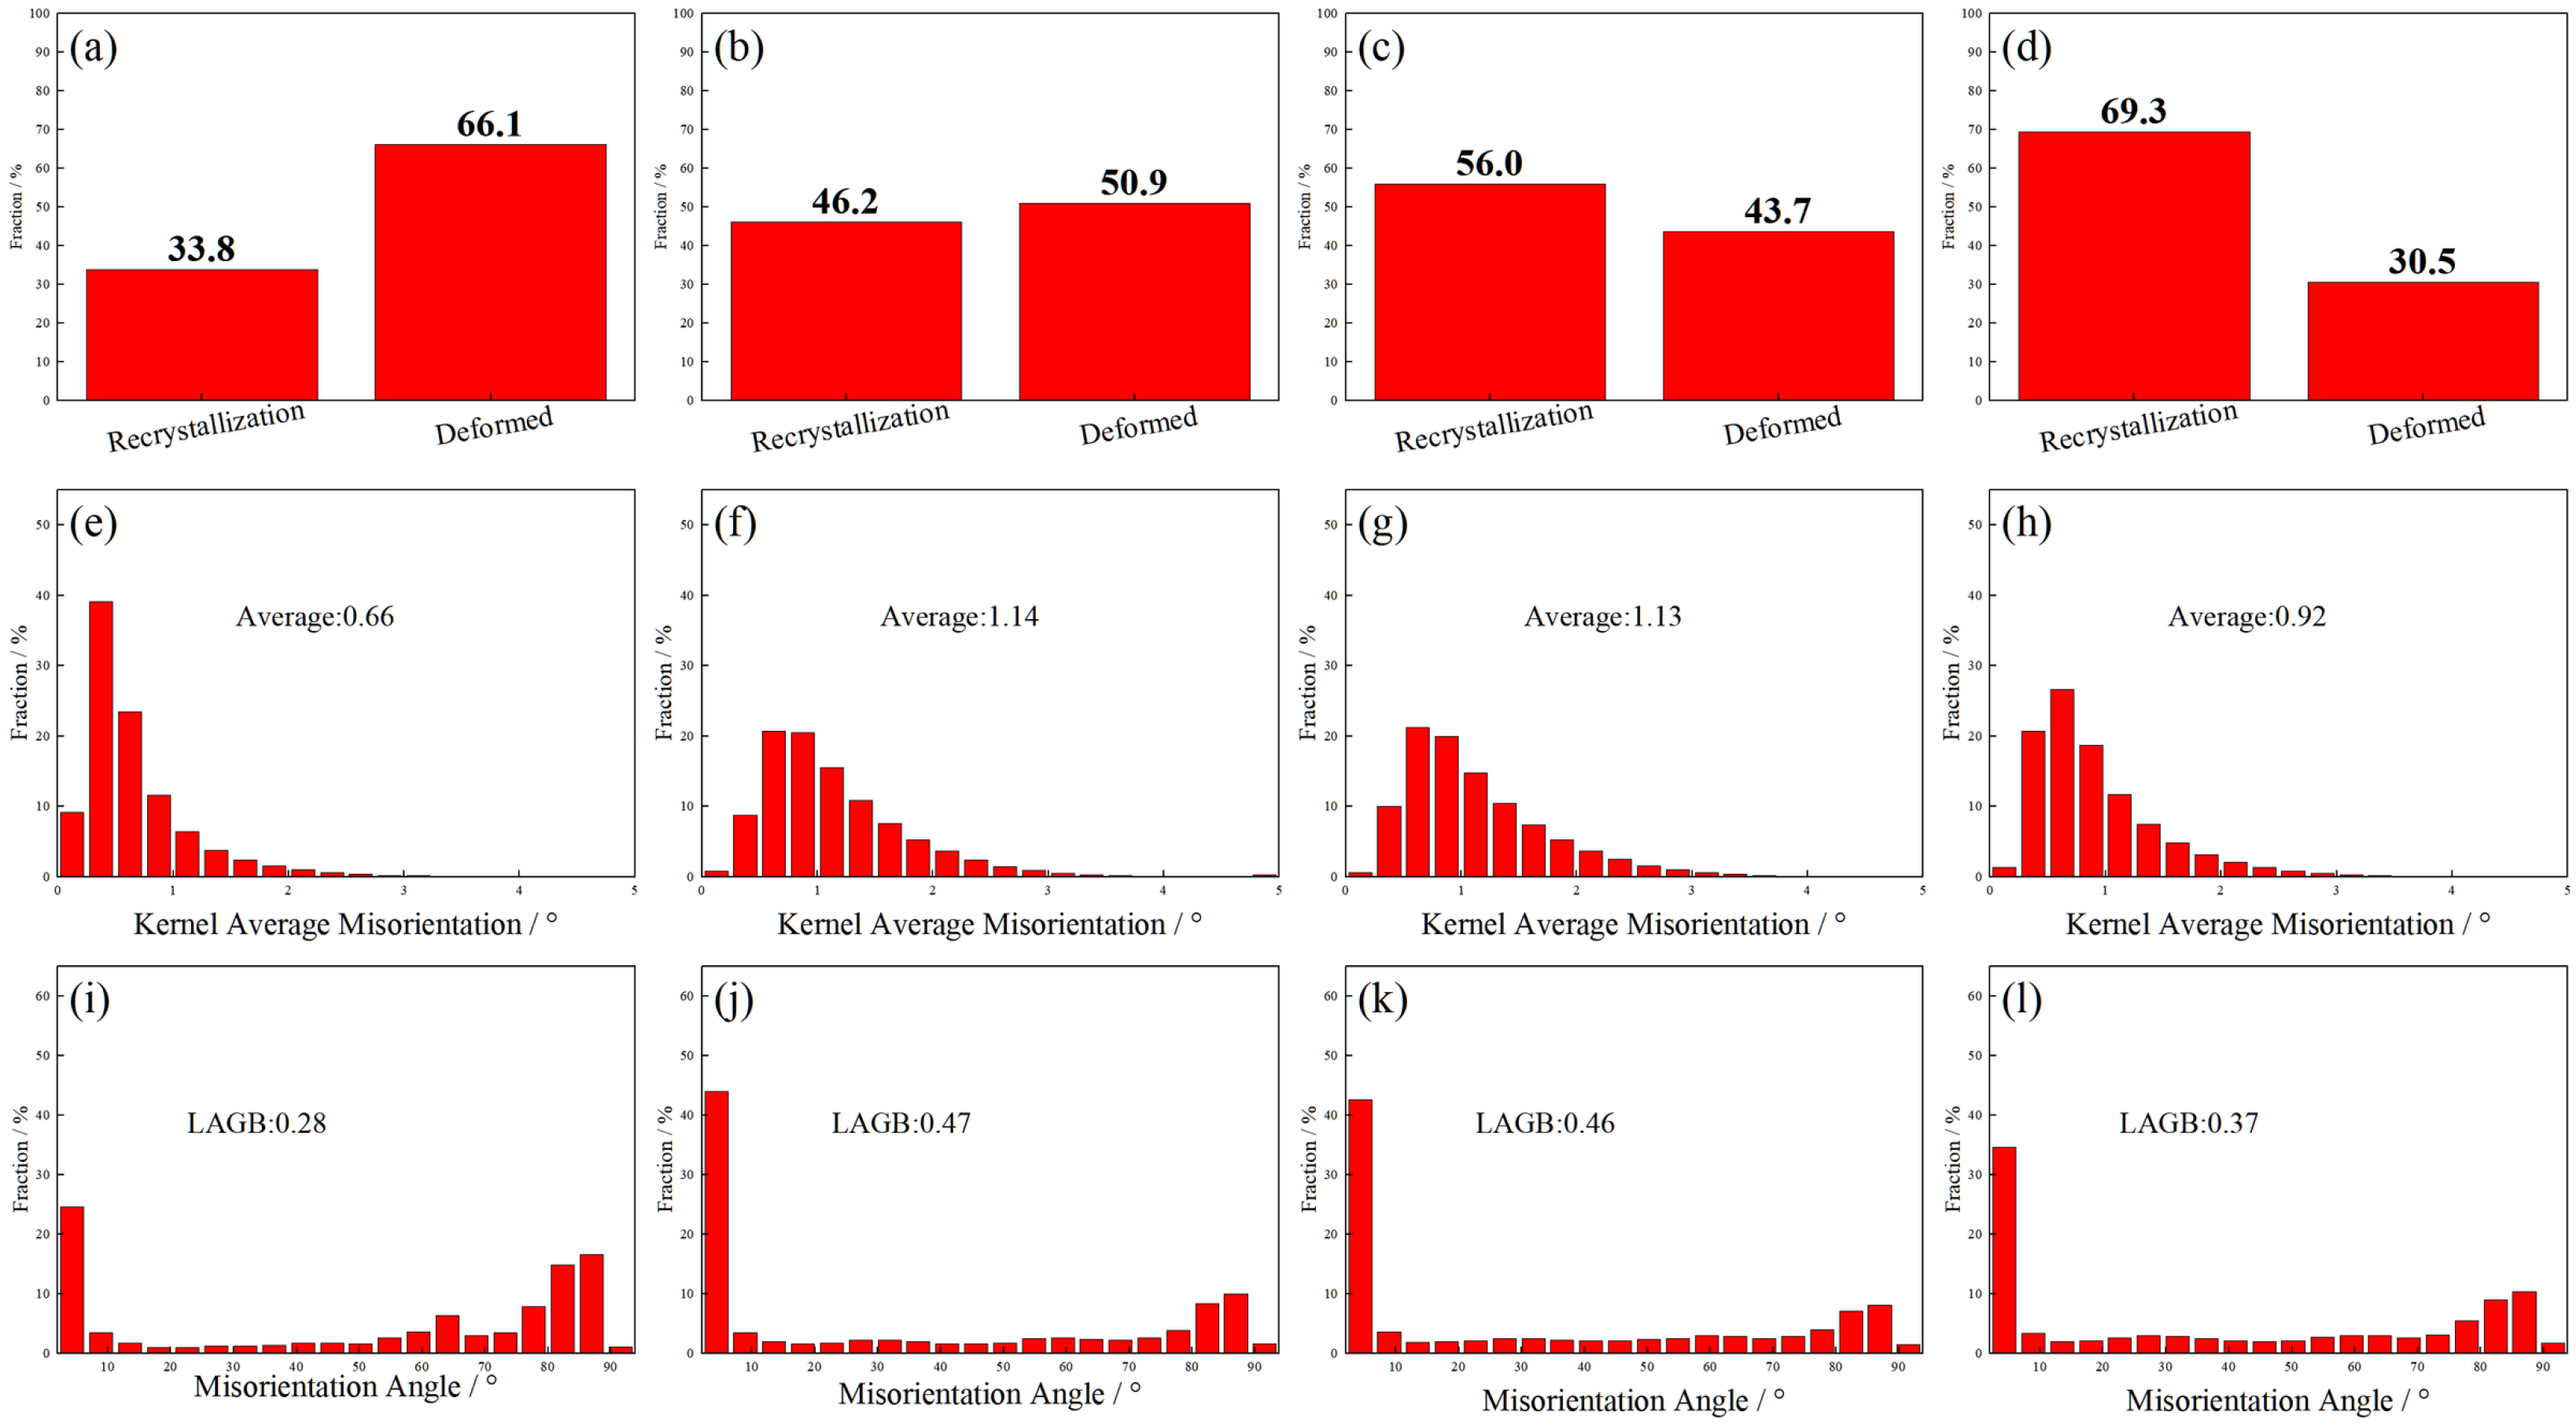
Figure 17.
Pole figures and inverse pole figures of the TA1 matrix under different annealing conditions; (a1–a4) IPF distribution maps of TA1 matrix for as-rolled and samples annealed for 60, 120, and 180 min, respectively; (b1–b4) PF maps of TA1 matrix for as-rolled and samples annealed for 60, 120, and 180 min, respectively.
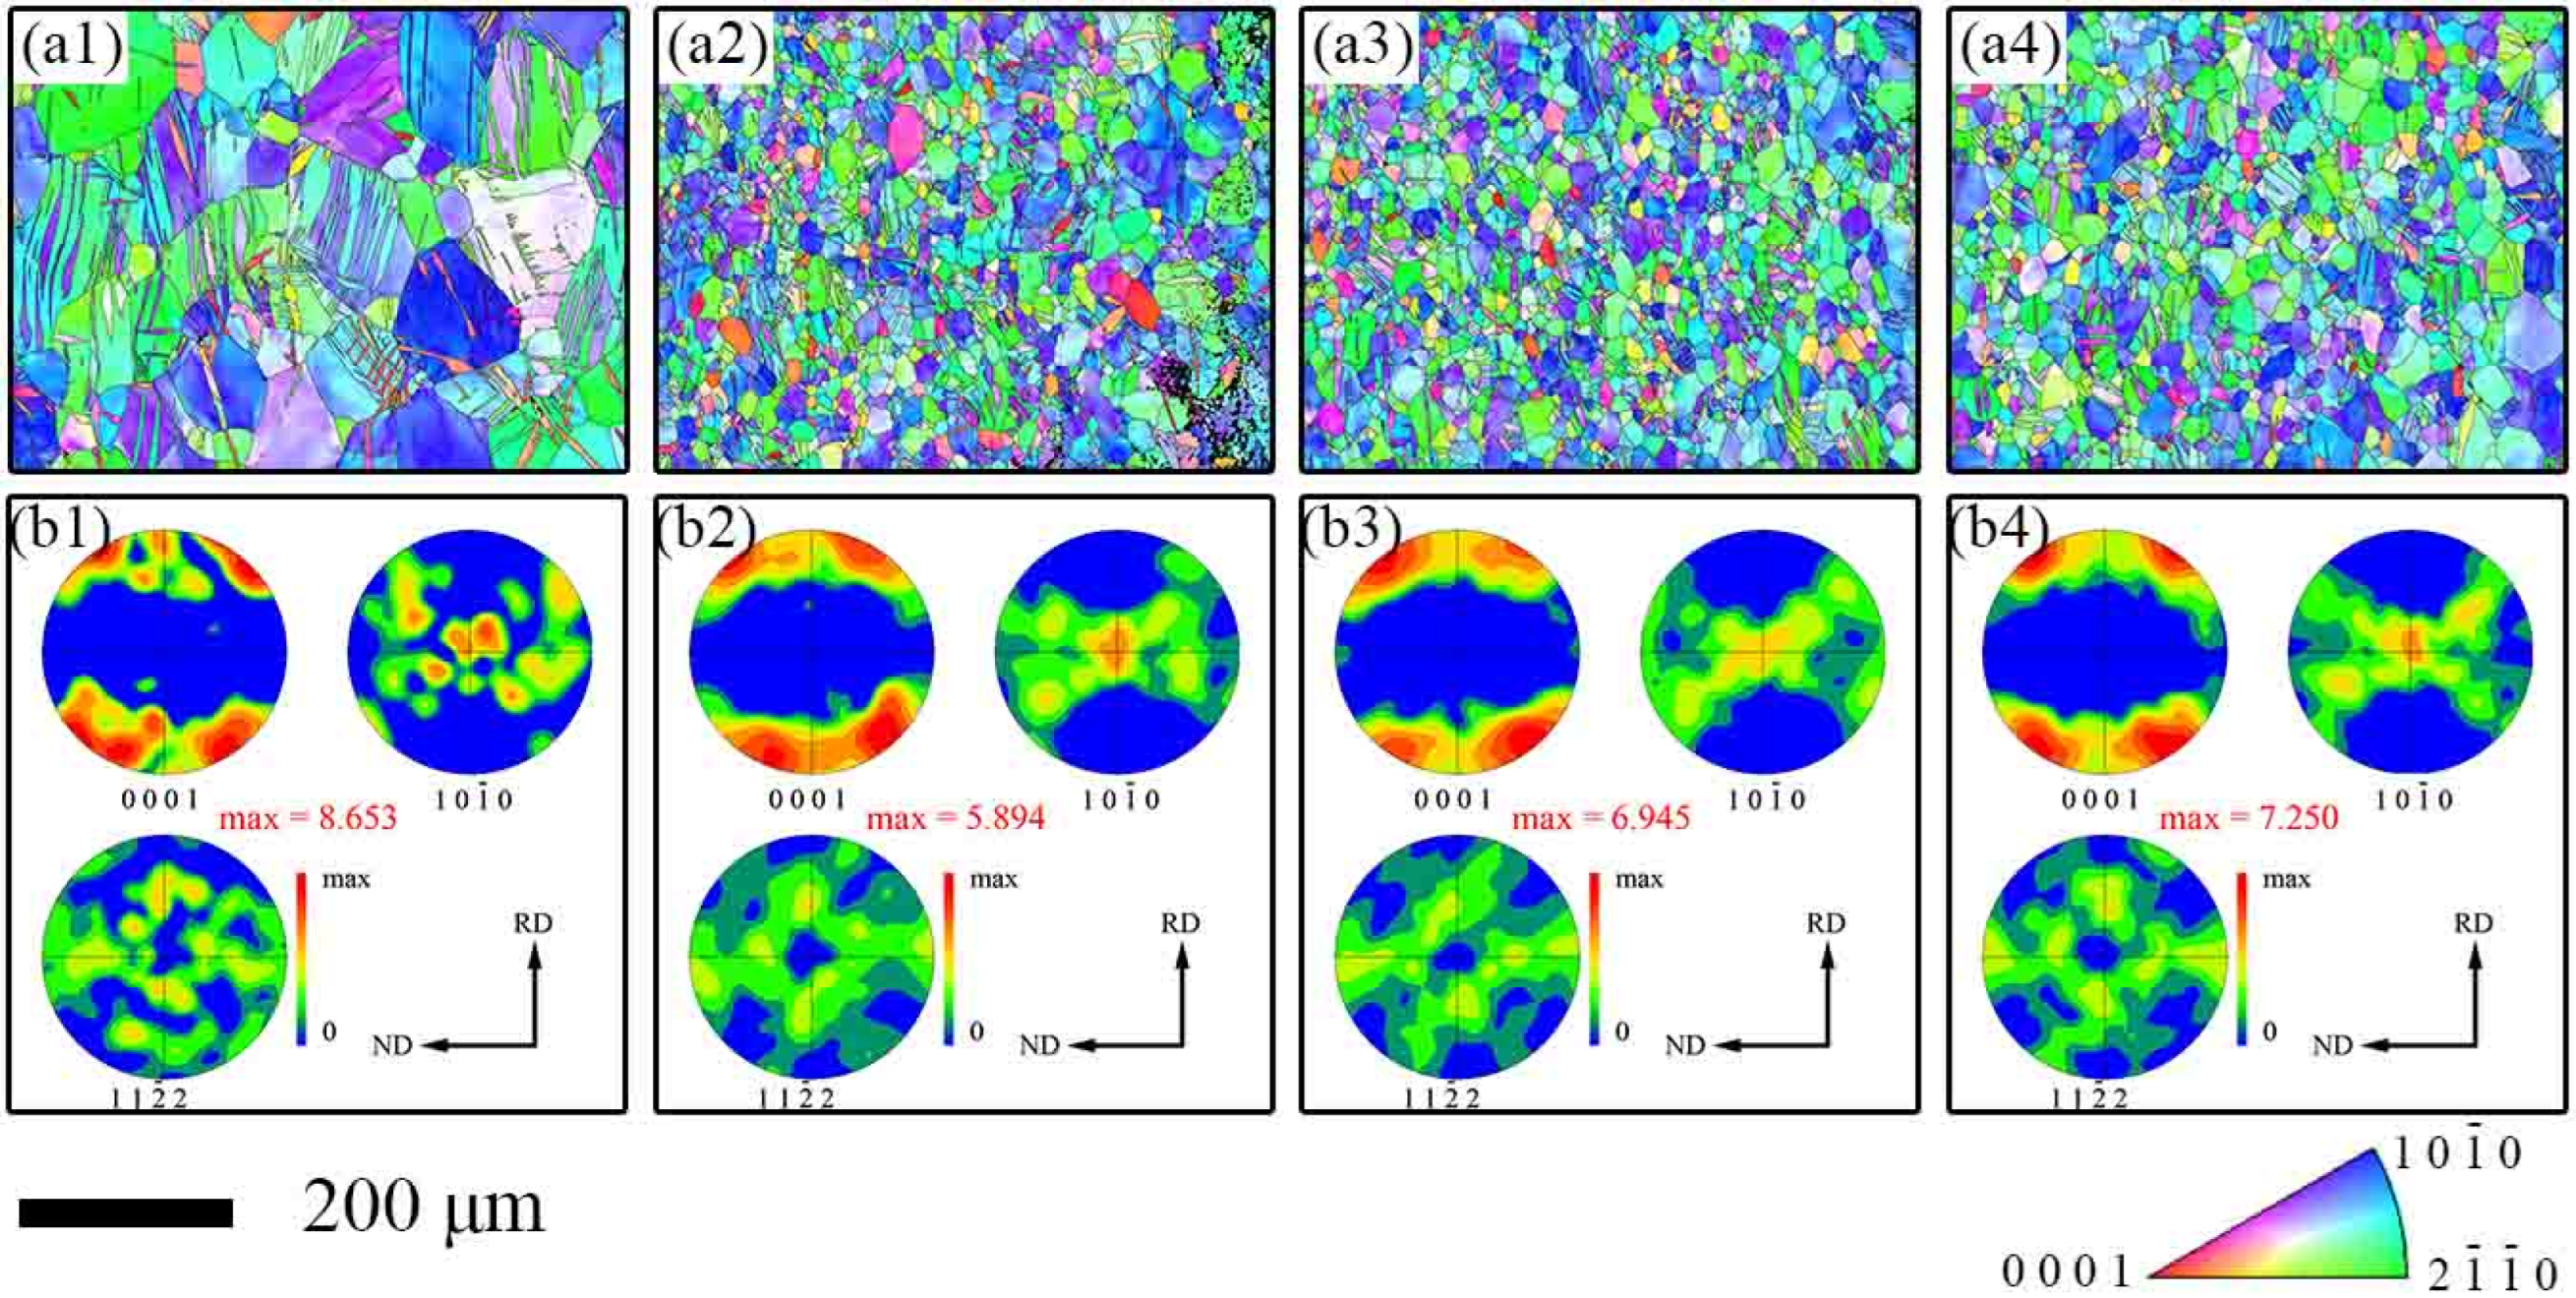
This evolution in texture intensity can be attributed to recovery behavior induced by annealing. The initial decrease in texture intensity resulted from orientation randomization during recovery and the early stages of recrystallization. The subsequent increase was associated with preferential growth of grains with specific orientations during later stages, leading to texture sharpening. Similar to the AZ31 layer, the presence of such texture induces significant anisotropy in various properties of the material.
Figure 18 and Figure 19 present the Schmid factors for basal <a> slip, prismatic <a> slip, and pyramidal <c + a> slip within the TA1 matrix, as well as the corresponding Schmid factor distribution maps, under external loading applied along the rolling direction. The average Schmid factor for the basal <a> slip system changes from 0.39 to 0.37 and then to 0.38. For the prismatic <a> slip system, it gradually increases from 0.19 to 0.20 and then decreases to 0.19. For pyramidal <c + a> slip, it changes from 0.38 to 0.39 and 0.39, before decreasing to 0.38.
Figure 18.
Schmid factor statistical distribution of TA1 matrix under different annealing conditions. (a) As-rolled; (b) Annealed at 200 °C for 60 min; (c) Annealed at 200 °C for 120 min; (d) Annealed at 200 °C for 180 min.
Figure 19.
Schmid factor distribution maps of the TA1 matrix for the as-rolled condition and after annealing at 200 °C for 60, 120, and 180 min: (a–d) basal <a> slip; (e–h) prismatic <a> slip; (i–l) pyramidal <c + a> slip.
The Schmid factor values for all three slip systems show minimal variation with increasing annealing time, indicating that low-temperature annealing at 200 °C does not activate additional slip systems in TA1. Notably, the prismatic <a> slip system exhibits the smallest Schmid factor, whereas the basal <a> and pyramidal <c + a> slip systems show comparable average Schmid factors of approximately 0.4. This suggests that both basal and pyramidal slip systems possess soft orientations under the applied loading, making them more readily activated to accommodate plastic deformation. It should be noted that Schmid factor analysis only provides a geometrical indication of slip-system favorability; the actual activation of pyramidal <c + a> slip also depends on the critical resolved shear stress, which is significantly higher than that of basal slip in Mg alloys. Therefore, the high Schmid factor of pyramidal <c + a> slip alone does not guarantee its dominant activation, but rather suggests its potential contribution to c-axis strain accommodation.
Based on the above microstructural and crystallographic data, the active deformation mechanisms in each layer and their contributions to the macroscopic mechanical response are discussed below.
4. Discussion
4.1. Bonding Strength of Ti/Mg Laminated Composite
According to classical bimetallic composite theory [31], the bonding strength of the Ti/Mg composite interface is governed by two mechanisms: mechanical interlocking and metallurgical diffusion. As shown in Figure 2a, TA1 exhibits a serrated morphology after rolling, with AZ31 filling the crevices. This macroscopic mechanical interlocking constitutes the primary source of bonding strength (48.74 MPa) for the as-rolled Ti/Mg composite plates. The formation of this morphology is associated with the differential plastic flow of the two materials at elevated temperatures: the harder TA1 underwent localized fracture under shear stress, while the softer AZ31 infiltrated the resulting cracks.
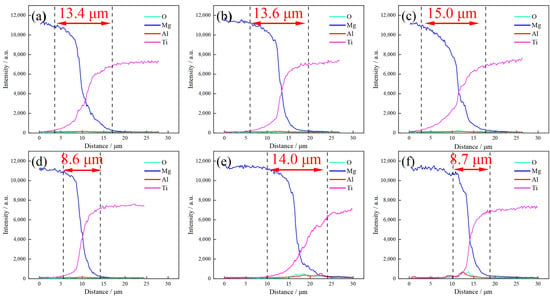
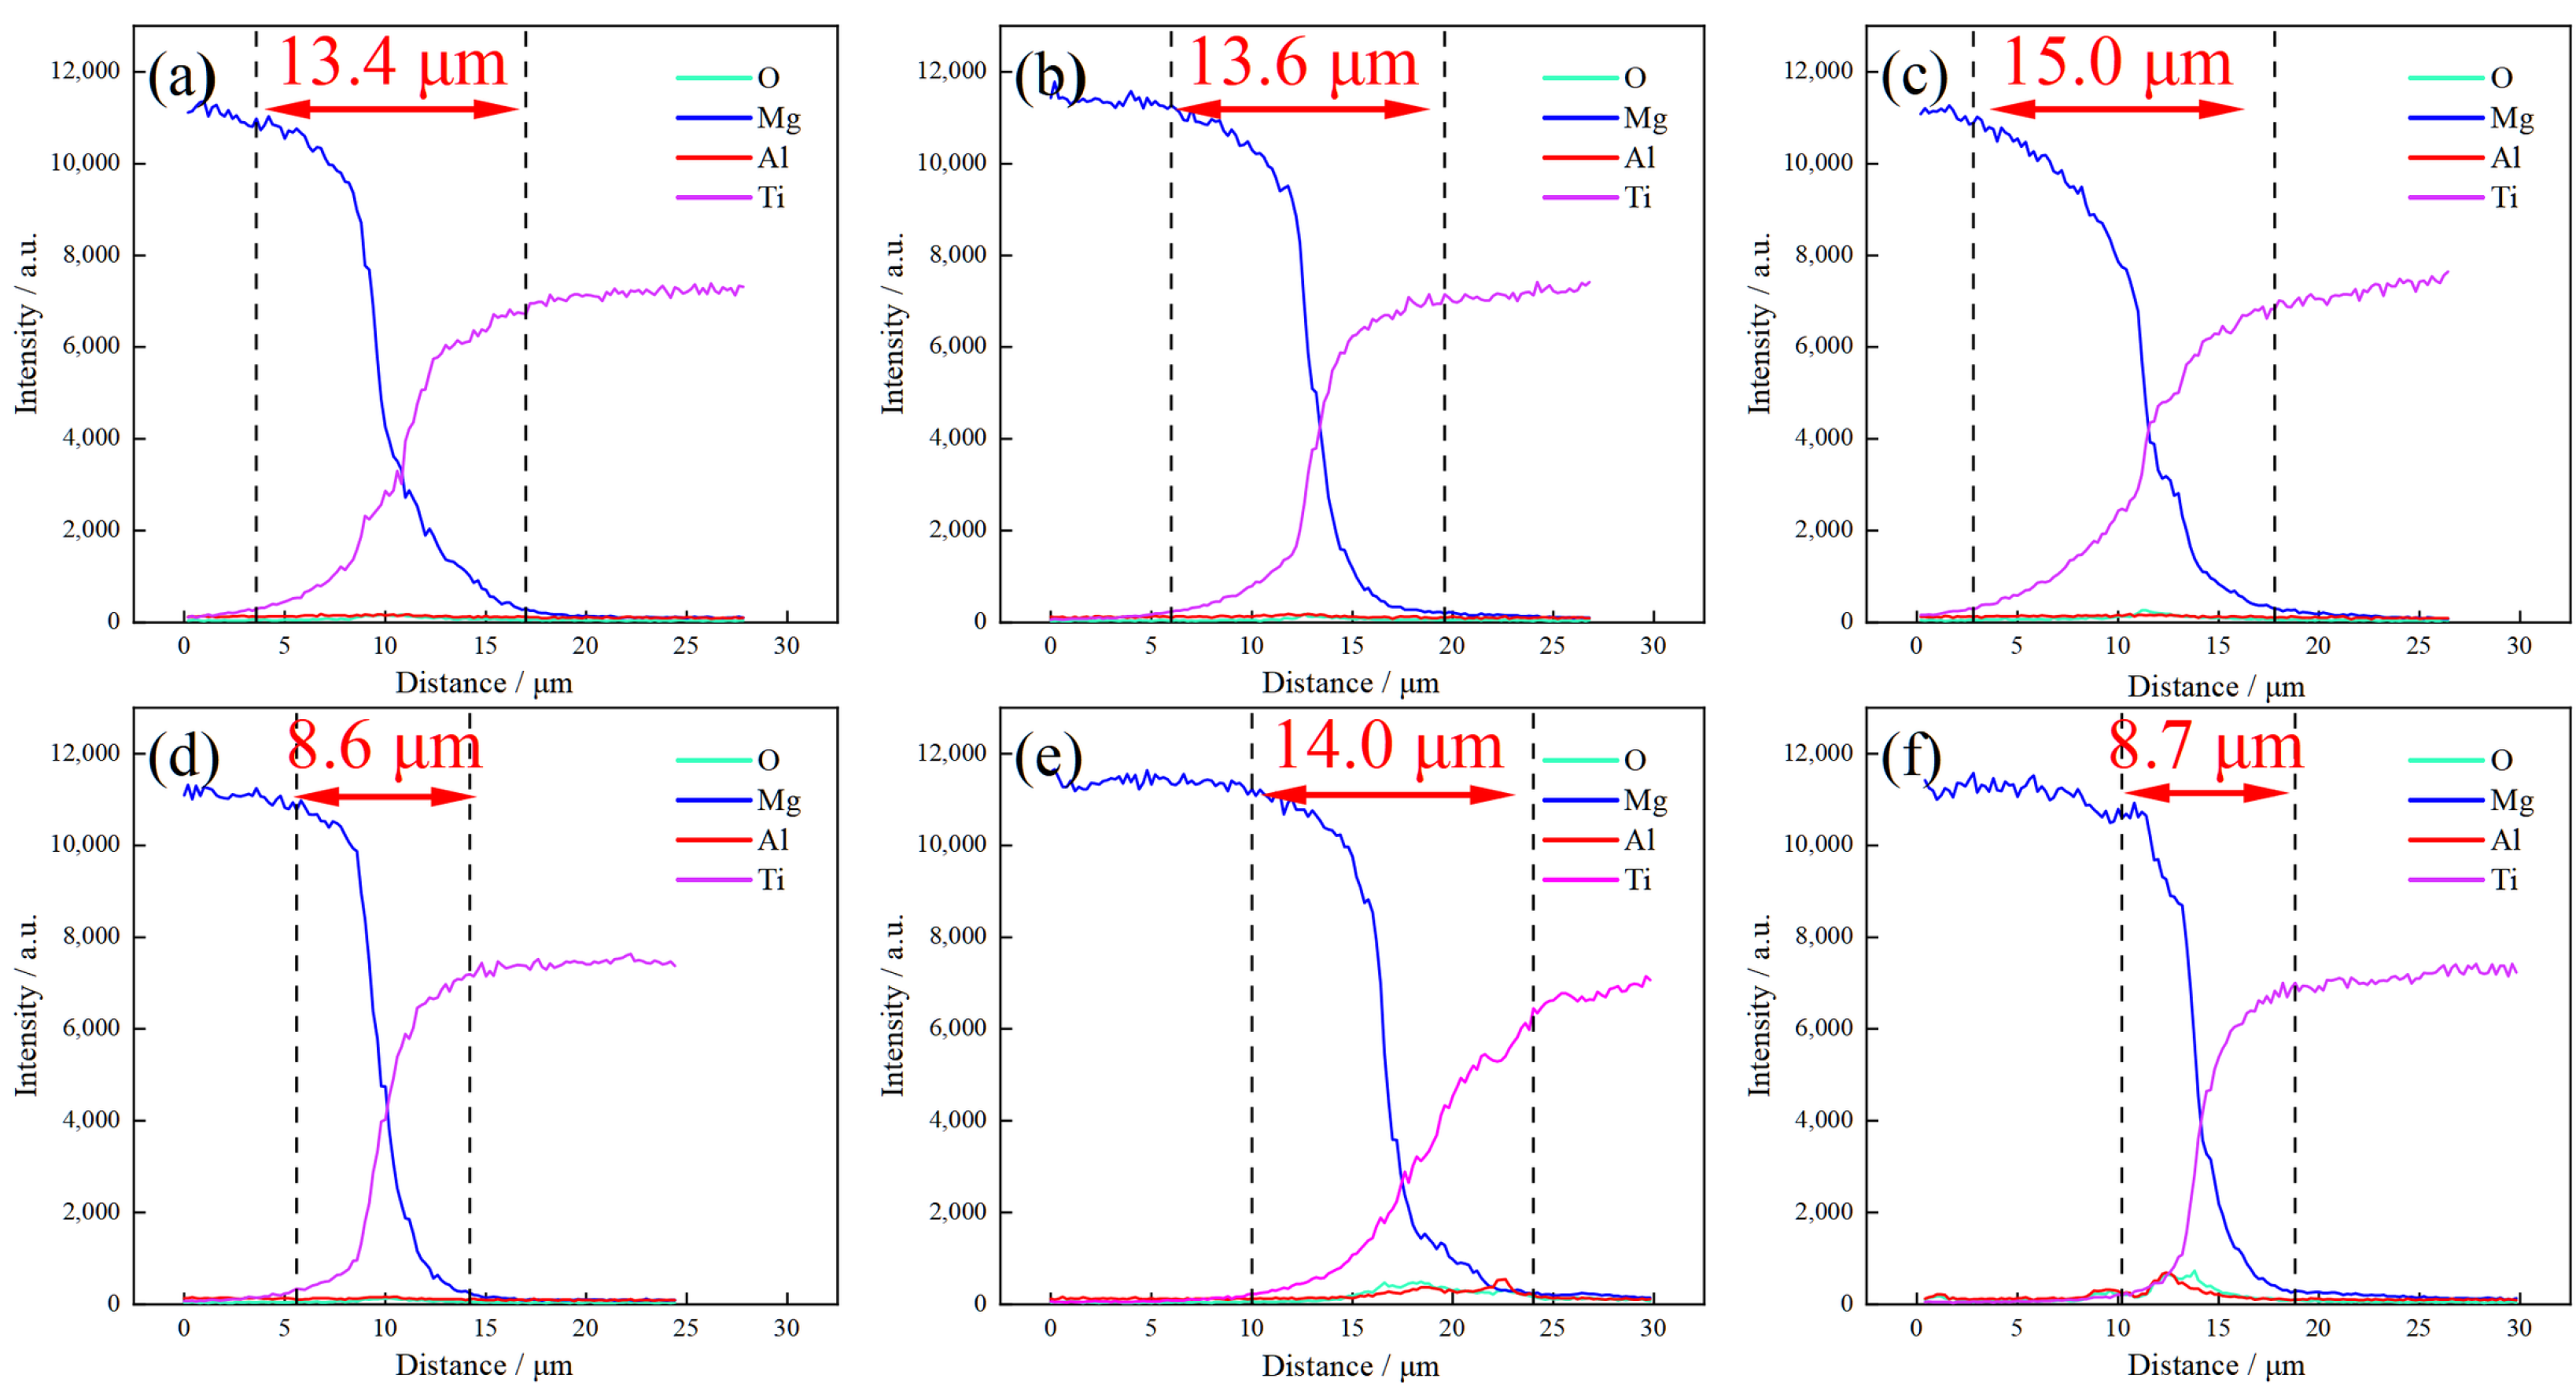
SEM-EDS was employed to characterize the diffusion behavior between Ti and Mg. Figure 20 shows the diffusion curves of Ti and Mg across the interface after annealing at 200 °C. The widths of the interdiffusion zone near the Ti/Mg interface are 13.4, 13.6, 15.0, and 8.6 μm for the as-rolled state and after annealing at 200 °C for 60, 120, and 180 min, respectively, and 14.0 and 8.7 μm after annealing at 300 °C and 400 °C for 60 min, respectively. During the early annealing stages (200 °C for 60 or 120 min, and 300 °C for 60 min), although the solid solubility between Ti and Mg is extremely low, atomic diffusion along short-circuit paths such as grain boundaries and dislocations can still occur, thereby enhancing interfacial bonding. However, the low mutual solubility limits the diffusion behavior of Ti and Mg atoms, ultimately resulting in insignificant differences in bonding strength among composite plates annealed at 200–400 °C. With further increases in annealing time or temperature (e.g., 200 °C for 180 min or 400 °C for 60 min), the bonding strength increases. Further inspection of the diffusion curve (Figure 20f) reveals enrichment of O and Al within the interdiffusion zone, attributable to the composition of AZ31 and the rolling process conducted in air. It should be noted that some nanoscale phases may exist at the interdiffusion zone. According to SEM–EDS analysis, these phases are likely to be MgO, TiO2, Al2O3, etc. However, such phases cannot be directly observed at the SEM scale and still require further precise characterization.
Figure 20.
The element diffusion curve of Ti/Mg laminated composite under different condition; (a) As-Rolled; (b) Annealed at 200 °C for 60 min; (c) Annealed at 200 °C for 120 min; (d) Annealed at 200 °C for 180 min; (e) Annealed at 300 °C for 60 min; (f) Annealed at 400 °C for 60 min.
In the as-rolled state, the interface is bonded mainly by mechanical interlocking, with a bonding strength of only 48.74 MPa. After early-stage annealing, the bonding mechanism changes to a combination of mechanical interlocking and metallurgical diffusion, leading to a rapid increase in bonding strength. With further annealing, although the apparent interdiffusion zone becomes narrower, atomic migration and reaction still occur at the interface, and the bonding strength increases slightly, indicating that interfacial bonding remains dominated by atomic diffusion.
These results indicate that the interdiffusion zone width measured by SEM–EDS cannot be used directly as a measure of the interfacial bonding strength. On the one hand, the bonding strength depends not only on the extent of elemental interdiffusion but also on the actual bonded area, the closure of interfacial voids and cracks, and the residual stress state near the interface. On the other hand, owing to the limited spatial resolution of EDS and the possible presence of nanoscale oxides (such as MgO, TiO2, and Al2O3) that cannot be resolved at the SEM scale, the measured width is subject to uncertainty and should be regarded only as a semi-quantitative indicator.
As annealing progresses, the fracture mode of the interface evolves. On the fracture surface of the as-rolled composite plate, only discontinuous cracks are observed on the TA1 side, while the AZ31 side exhibits flat tearing ridges. At this stage, fracture propagates along the interface, corresponding to low bonding strength, and interfacial failure is dominated by debonding. On the fracture surfaces of samples annealed for 60–120 min, tearing pits begin to appear on the TA1 side (Figure 6d), and dimples appear on the AZ31 side, indicating that the bonding strength in some regions has exceeded the shear strength of the AZ31 matrix. The fracture path alternates between the interface and the AZ31 matrix, corresponding to a mixed fracture mode. Subsequently, on the fracture surfaces of samples annealed for 180 min, titanium distribution is observed on the AZ31 side (Figure 6g,h), demonstrating that fracture occurs within the magnesium matrix or the hardened surface layer of TA1, while the interface itself has become sufficiently strong and tough. At this stage, the shear strength reaches saturation (~85 MPa), approaching the shear strength limit of the AZ31 magnesium alloy, and interfacial failure is dominated by matrix fracture.
4.2. Mechanical Properties and Microstructure of Ti/Mg Laminated Composite Plates
During uniaxial tensile process, the TA1 layer and AZ31 layer jointly bear the applied load, satisfying the rule of mixtures:
where fTi, fMg are the volume fractions of TA1 and AZ31, respectively, and are the strengths of the constituent TA1 and AZ31 layers in the composite plate. Under the present rolling conditions, the thickness ratio of the Ti layer to the Mg layer in the composite plate was approximately 1. Therefore, the overall tensile strength of the composite plate is determined by the properties of the TA1 and AZ31 layers.
After annealing at 200 °C, TA1 undergoes only recovery and partial recrystallization, with its KAM values higher than those of the as-rolled state. Under low-temperature annealing at 200 °C, the recrystallization degree in TA1 is considerably lower than that in AZ31. The recrystallized grain fraction implies that nearly half of the regions remain in a recovered state, retaining relatively high dislocation densities. Concurrently, owing to the significant disparity in thermal expansion coefficients between Ti and Mg, the AZ31 layer imposes stress on the TA1 layer during post-annealing cooling, potentially inducing new dislocation slip and enabling TA1 to retain a certain work-hardening capacity.
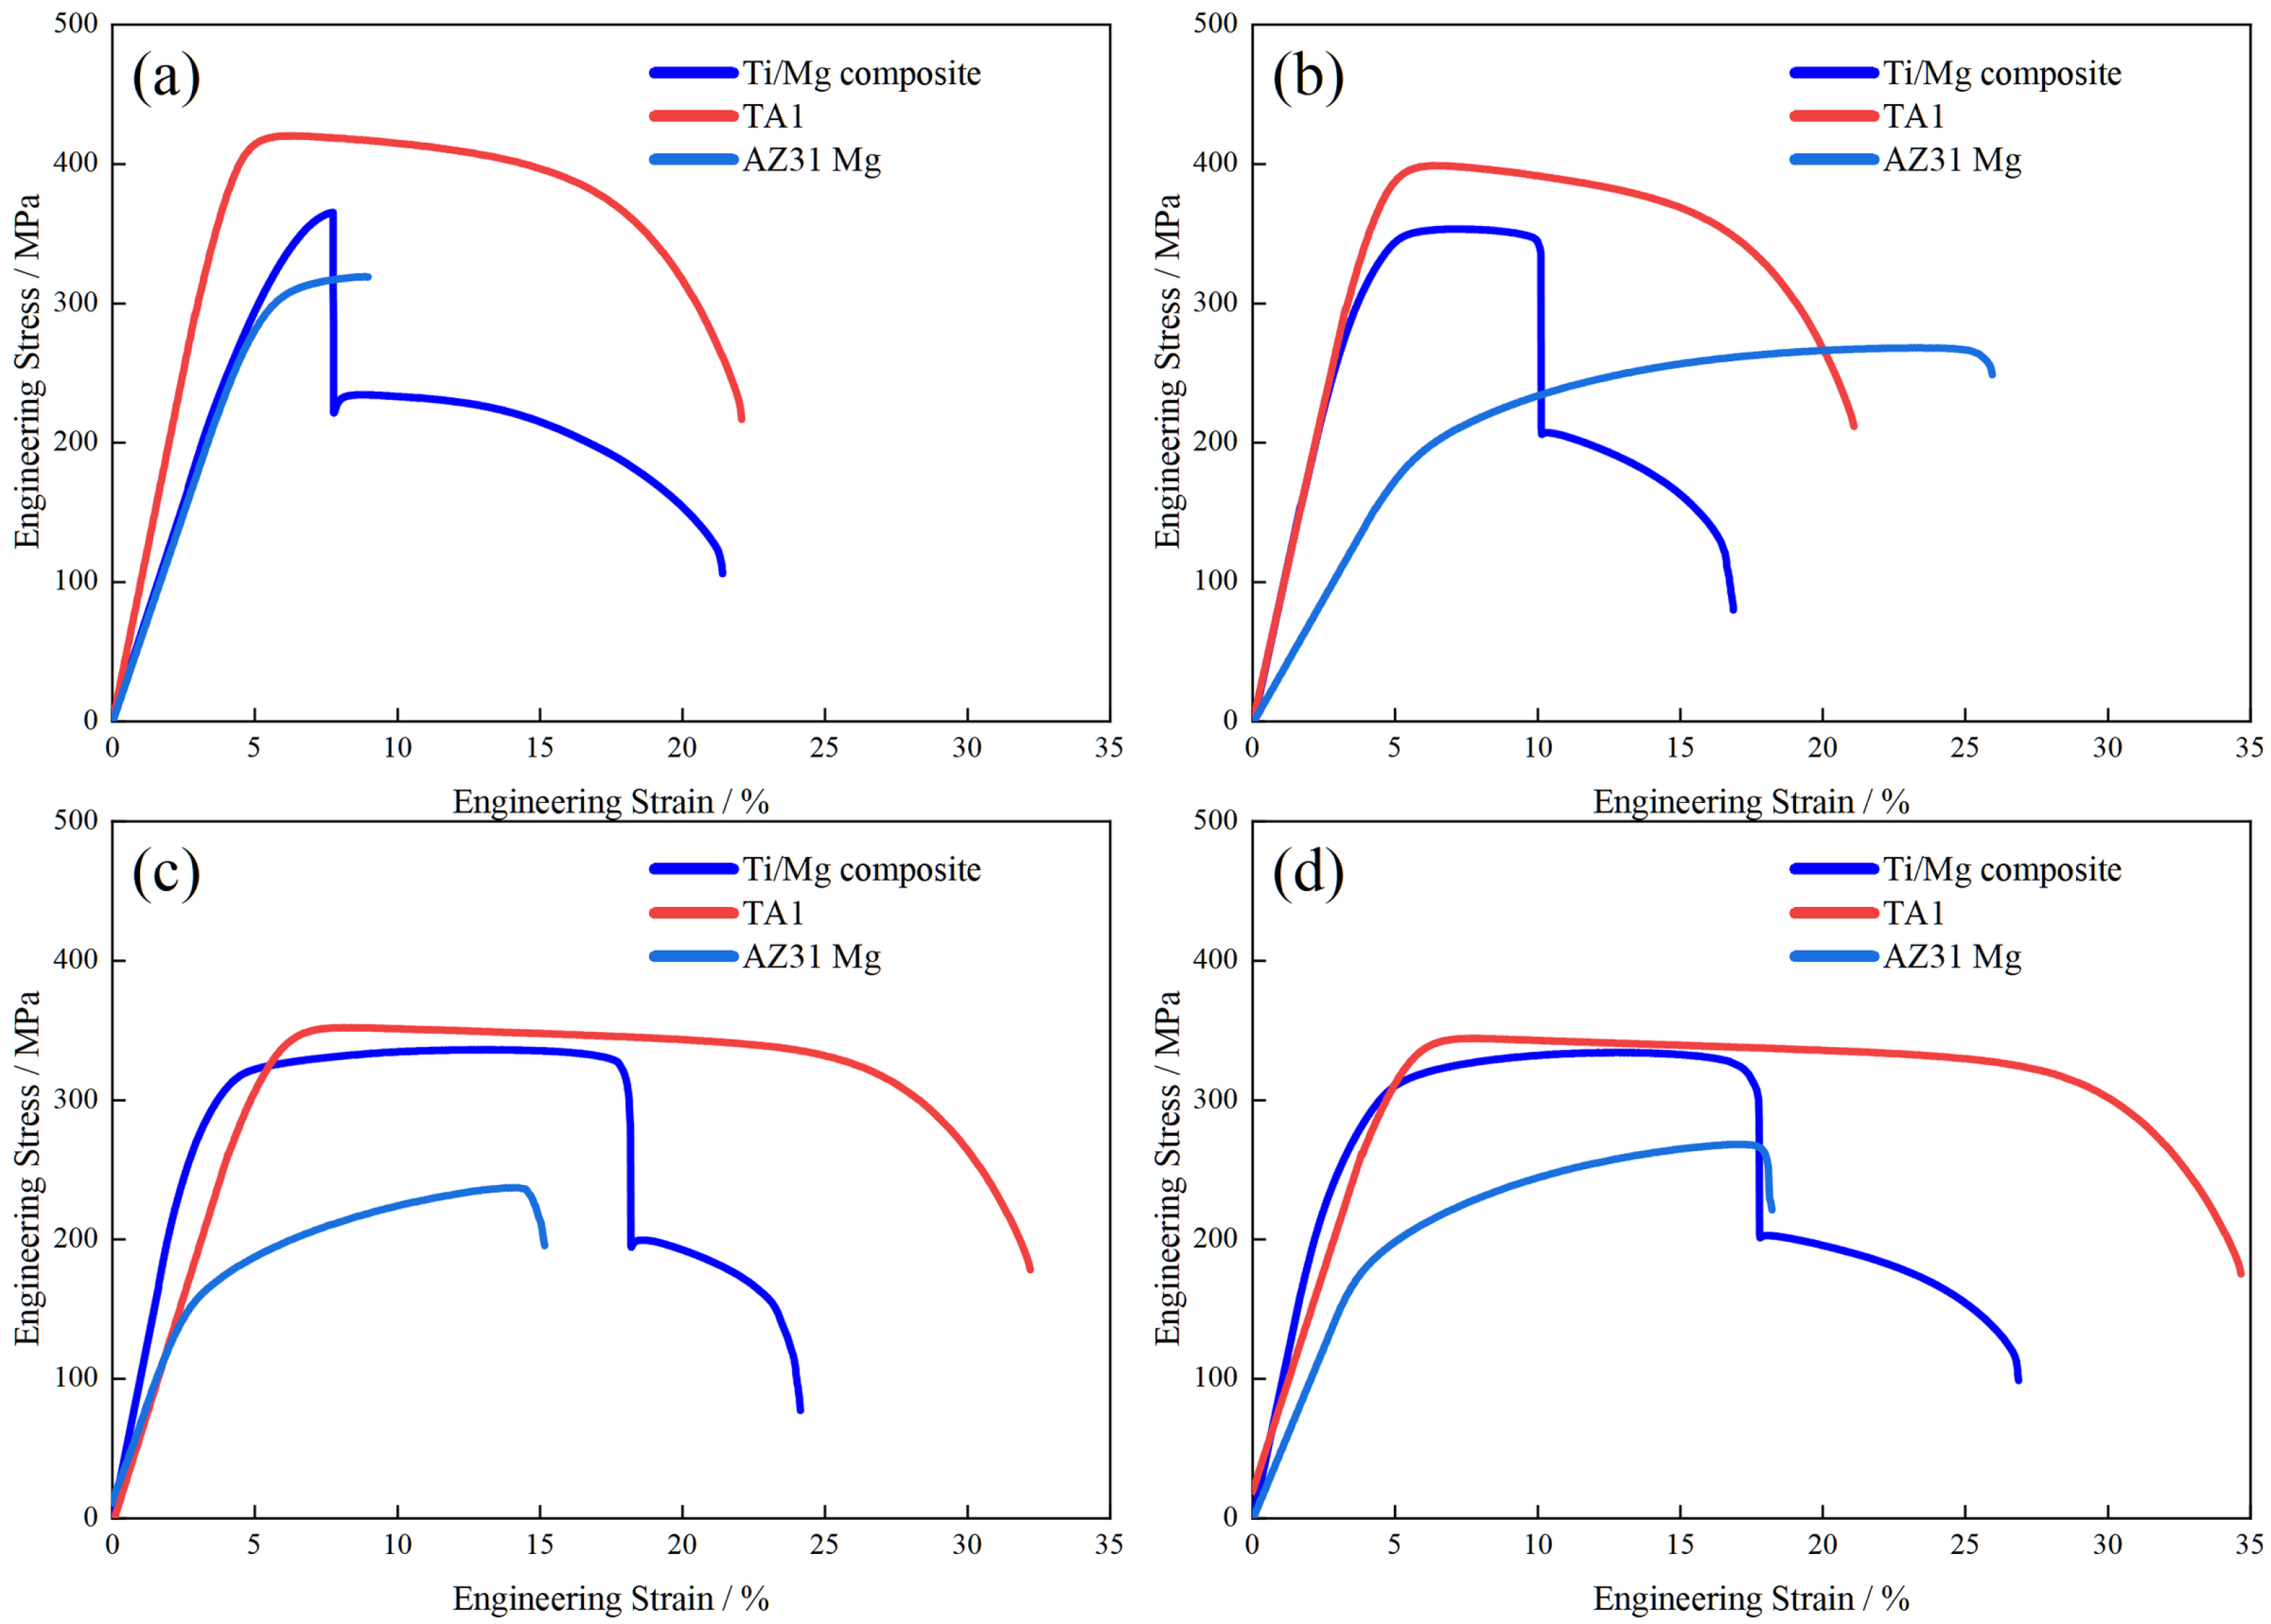
For AZ31, which undergoes a more complete recrystallization process, shear bands transform into fine-grained regions, resulting in a more uniform grain distribution. Dislocation density further decreases, and low-angle grain boundaries convert to high-angle grain boundaries. This leads to a reduced strain-hardening effect and diminished contributions from dislocation and grain-boundary strengthening, consequently decreasing the strength of the magnesium layer. As shown in Figure 21, the stress–strain curves of TA1 and AZ31 subjected to the same rolling and annealing treatments exhibit a similar trend: after annealing, the elongation of both layers improves significantly, while their strength decreases. The plasticity of AZ31 is markedly enhanced after complete recrystallization, consistent with the EBSD results. For TA1, under the 120 and 180 min annealing conditions, prolonged annealing reduces dislocation density and optimizes grain, resulting in a substantial increase in elongation accompanied by a decrease in strength. Overall, annealing optimizes the plasticity of the matrix layers. With the contribution of the composite interface, coordinated deformation between the two layers is achieved, thereby significantly improving the elongation of the composite plate. However, because recrystallization reduces the strength of the matrix layers, the overall strength of the composite plate also decreases according to the rule of mixtures.
Figure 21.
Comparison of the stress–strain curves of the composite plate and its constituent layers after annealing at 200 °C: (a) as-rolled; (b) annealed for 60 min; (c) annealed for 120 min; (d) annealed for 180 min.
The TA1 layer bears the primary load via multi-slip with sustained work-hardening, while the AZ31 layer accommodates strain through soft-oriented pyramidal <c + a> slip. The strengthened interface transmits shear stress between layers, so that when necking initiates in TA1, the adjacent AZ31 responds by plastic flow. This coordinated deformation across the interface achieves the synergistic optimization of strength and ductility.
The macroscopic plasticity of the composite is further governed by the interplay of grain boundaries, twinning, and crystallographic texture. In the AZ31 layer, complete recrystallization transforms the rolling-induced shear bands and deformed grains into fine, equiaxed grains bounded by high-angle grain boundaries, which promotes homogeneous deformation and delays strain localization, thereby contributing substantially to the improved elongation. Correspondingly, the prismatic <a> slip system exhibits the smallest Schmid factor (≈0.11), whereas the pyramidal <c + a> slip system shows the largest (≈0.45); the plastic deformation of the AZ31 layer along the RD is therefore accommodated mainly by basal <a> and pyramidal <c + a> slip, whose soft orientations, together with the recrystallized microstructure, enable the large elongation. In the TA1 layer, the basal <a> and pyramidal <c + a> slip systems both possess moderate Schmid factors (≈0.4) and are readily activated to accommodate c-axis strain, while the increased twin boundaries and low-angle grain boundaries impede dislocation motion and thereby preserve the strength of the TA1 layer. It should be noted that the Schmid factor provides only a geometrical indication of slip-system favorability, and the actual activation additionally depends on the critical resolved shear stress; nonetheless, the close correlation between the high Schmid factors and the enhanced ductility supports the slip-dominated deformation mechanism proposed here.
In summary, the reduction in strength of the Ti/Mg composite plate after annealing primarily originates from microstructural softening of AZ31 layer, while interface enhancement plays a critical role in ensuring coordinated interlayer deformation and enhancing overall ductility. The synergistic optimization of strength and ductility (exemplified by the 200 °C annealing process) results from the combined effects of matrix microstructure evolution and improved interfacial bonding: complete recrystallization of AZ31 layer provides high ductility, TA1 layer maintains relatively high strength as the load-bearing component, and the strengthened and toughened interface ensures cooperative deformation between the two layers, ultimately achieving preferred mechanical performance matching.
5. Conclusions
In this study, Ti/Mg laminated composite plates were successfully fabricated by hot rolling followed by post-rolling annealing. The relationship between microstructural evolution and uniaxial tensile properties of Ti/Mg laminated composite was systematically investigated. The main conclusions are as follows:
- (1)
- Low-temperature annealing at 200 °C effectively enhances the interfacial bonding strength from 48.74 MPa to over 80 MPa, while the absence of intermetallic compounds ensures interfacial stability. The fracture mode transitions from interfacial debonding to matrix fracture, indicating that the strengthened interface can reliably transfer load between layers.
- (2)
- The significant improvement in ductility originates primarily from recrystallization in the AZ31 layer. Annealing at 200 °C induces complete recrystallization, which eliminates rolling-induced shear bands and high-dislocation-density regions, substantially reducing dislocation density. This microstructural restoration suppresses premature shear localization and enables more homogeneous plastic deformation across the Mg layer, delaying crack initiation and leading to a more than twofold increase in elongation.
- (3)
- In the TA1 layer, 200 °C annealing induces recovery rather than full recrystallization, preserving a stable dislocation substructure that retains work-hardening capacity. The TA1 layer serves as the primary load-bearing component, while the strengthened interface ensures effective load transfer between layers. The complementary deformation behavior—strength from the TA1 layer and ductility from the recrystallized AZ31 layer—enables a favorable strength–ductility matching. Annealing at 200 °C is identified as the preferred regime, yielding the best combination of mechanical properties within the examined process window.
Author Contributions
Conceptualization, B.Y. and H.X.; methodology, B.Y., Y.G. and S.L.; software, Y.G.; validation, B.Y. and C.L.; formal analysis, B.Y. and Y.G.; investigation, B.Y., S.L. and C.Y.; resources, H.X., S.B. and C.M.; data curation, B.Y., Y.G. and M.B.; writing—original draft preparation, B.Y.; writing—review and editing, H.X., S.B., A.G. and C.M.; visualization, B.Y., Y.G. and S.L.; supervision, H.X. and C.Y.; project administration, H.X. and S.B.; funding acquisition, H.X. All authors have read and agreed to the published version of the manuscript.
Funding
This work was funded by National Natural Science Foundation of China (52674516, 52075472).
Data Availability Statement
The original contributions presented in this study are included in the article material. Further inquiries can be directed to the corresponding author.
Conflicts of Interest
The authors declare no conflicts of interest.
References
- Cui, C.; Hu, B.; Zhao, L.; Liu, S. Titanium Alloy Production Technology, Market Prospects and Industry Development. Mater. Des. 2011, 32, 1684–1691. [Google Scholar] [CrossRef] [Scilit]
- Prasad, S.V.S.; Prasad, S.B.; Verma, K.; Mishra, R.K.; Kumar, V.; Singh, S. The Role and Significance of Magnesium in Modern Day Research—A Review. J. Magnes. Alloys 2022, 10, 1–61. [Google Scholar] [CrossRef] [Scilit]
- Li, S.; Luo, C.; Bashir, M.; Jia, Y.; Han, J.; Wang, T. Interface Structures and Mechanical Properties of Corrugated + Flat Rolled and Traditional Rolled Mg/Al Clad Plates. Rare Met. 2021, 40, 2947–2955. [Google Scholar] [CrossRef] [Scilit]
- Lai, T.; Xu, J.L.; Huang, J.; Wang, Q.; Zhang, J.P.; Luo, J.M. Partially Biodegradable Ti Mg Composites Prepared by Microwave Sintering for Biomedical Application. Mater. Charact. 2022, 185, 111748. [Google Scholar] [CrossRef] [Scilit]
- Yao, F.; You, G.; Wang, L.; Li, Q.; Zeng, S.; Ming, Y. Design, Fabrication, Microstructure, and Mechanical Properties of Interlayer-Free Vacuum Diffusion Bonding Mg/Ti Composites. Vacuum 2022, 199, 110947. [Google Scholar] [CrossRef] [Scilit]
- Zhuo, X.; Yao, H.; Chen, K.; Kondoh, K.; Wang, M.; Hua, X.; Shan, A. Friction Stir Lap Welding of AZ31 and TC4: Mechanical Properties and Bonding Mechanism. Mater. Charact. 2023, 195, 112507. [Google Scholar] [CrossRef] [Scilit]
- Jiang, F.; Li, X.; Wang, Z.; Guo, C.; Wang, J. Interfacial Characteristics and Bending Properties of a Ti6Al4V-Mg3AlZn Laminate Metal Composite. J. Alloys Compd. 2020, 843, 156065. [Google Scholar] [CrossRef] [Scilit]
- Ren, D.; Zhao, K.; Pan, M.; Chang, Y.; Gang, S.; Zhao, D. Ultrasonic Spot Welding of Magnesium Alloy to Titanium Alloy. Scr. Mater. 2017, 126, 58–62. [Google Scholar] [CrossRef] [Scilit]
- Feng, Y.; Tang, Y.; Chen, W.; He, W.; Jiang, B.; Pan, F. Fabrication of Mg/Ti Composite with Excellent Strength and Ductility by Hot Rolling. Mater. Sci. Eng. A 2023, 888, 145783. [Google Scholar] [CrossRef] [Scilit]
- Yang, B.; Xiao, H. Synergistic Control of Microstructure and Plasticity in Hot-Rolled Ti/Mg Laminated Composite Plates by Matrix Composition and Interfacial Oxidation. J. Mater. Res. Technol. 2026, 41, 3765–3779. [Google Scholar] [CrossRef] [Scilit]
- Wei, J.; Han, J.; Jia, Y.; Wang, T.; Huang, Q. Evolution of Multiscale Heterostructures and Comprehensive Properties Improvement in the Large Thickness Ratio Ti/Al/Mg Clad Plates under Heterothermal Rolling. J. Magnes. Alloys 2026, 18, 101863. [Google Scholar] [CrossRef] [Scilit]
- Shangguan, J.; Zhao, J.; Shi, Y.; Gu, C.; Jin, B.; Cheng, J.; Guo, Y. Effects of Zn Interlayer on Microstructures and Mechanical Properties of TC4/AZ91D Bimetal via Solid–Liquid Compound Casting Process. Int. J. Met. 2022, 16, 419–434. [Google Scholar] [CrossRef] [Scilit]
- Zhao, J.; Shangguan, J.; Gu, C.; Jin, B.; Shi, Y. Microstructures and Mechanical Properties of TC4/AZ91D Bimetal Prepared by Solid–Liquid Compound Casting Combined with Zn/Al Composite Interlayer. Trans. Nonferrous Met. Soc. China 2022, 32, 1144–1158. [Google Scholar] [CrossRef] [Scilit]
- Wu, Y.; Zhao, J.; Wei, C.; Gu, C.; Wang, Y. Fabrication of Ti/Mg Bimetal Composite in Ti−6Al−4V Pyramidal Lattice Structure via AZ91D Melt Infiltration. Trans. Nonferrous Met. Soc. China 2025, 35, 2572–2585. [Google Scholar] [CrossRef] [Scilit]
- Yang, L.; Wang, W.; Ma, Y.; Liu, W.; Li, Z. High-Strength Ti-Mg Interface with 3D Interlocking Structure via Ti Mesh Interlayer: Fabrication, Microstructure, and Mechanical Properties. J. Mater. Process. Technol. 2025, 343, 118979. [Google Scholar] [CrossRef] [Scilit]
- Ohashi, Y.; Kato, H. Mechanical Properties of Ti/Mg Bicontinuous Composite by Liquid Metal Replacement. Scr. Mater. 2025, 256, 116413. [Google Scholar] [CrossRef] [Scilit]
- Ohashi, Y.; Kurabayashi, K.; Wada, T.; Kato, H. Ti/Mg Dissimilar Joining by Eutectic-Melting-Induced Liquid Metal Dealloying. Mater. Des. 2024, 244, 113095. [Google Scholar] [CrossRef] [Scilit]
- Zang, C.; Liu, J.; Tan, C.; Zhang, K.; Song, X.; Chen, B.; Li, L.; Feng, J. Laser Conduction Welding Characteristics of Dissimilar Metals Mg/Ti with Al Interlayer. J. Manuf. Process. 2018, 32, 595–605. [Google Scholar] [CrossRef] [Scilit]
- Wang, P.; Chen, Z.; Huang, H.; Lin, J.; Li, B.; Liu, Q. Fabrication of Ti/Al/Mg Laminated Composites by Hot Roll Bonding and Their Microstructures and Mechanical Properties. Chin. J. Aeronaut. 2021, 34, 192–201. [Google Scholar] [CrossRef] [Scilit]
- Nie, H.; Hao, X.; Chen, H.; Kang, X.; Wang, T.; Mi, Y.; Liang, W. Effect of Twins and Dynamic Recrystallization on the Microstructures and Mechanical Properties of Ti/al/Mg Laminates. Mater. Des. 2019, 181, 107948. [Google Scholar] [CrossRef] [Scilit]
- Zhou, R.; Zhang, C.; Zhang, X.; Mao, S.; Li, X.; Feng, B.; Zheng, K.; Pan, F. Effects of Ti Reinforced Particles on Mechanical Properties and Wear Properties of Mg-9Gd-4Y-2Mn-1Zn Composites. J. Magnes. Alloys 2026, 14, 101811. [Google Scholar] [CrossRef] [Scilit]
- Fan, J.; Sun, Y.; Yang, H.; Xie, W.; Tan, Z.; Chen, G.; Zhou, Y.; Zheng, K.; Xu, J.; Tan, J.; et al. Influence of Ti Particles on Nanocrystallization and Mechanical Properties of Ti/Mg-Gd-Y-Zn-Zr Composites during Rotary Swaging. J. Alloys Compd. 2025, 1040, 183599. [Google Scholar] [CrossRef] [Scilit]
- Fan, J.; Yang, H.; Chen, G.; Sun, Y.; Zheng, K.; Xu, J.; Tan, J.; Chen, X.; Pan, F. Achieving Enhanced Strength-Ductility Synergy in Mg-6Zn-1Mn Alloy by Introducing Deformable Ti Particles. Mater. Sci. Eng. A 2024, 917, 147412. [Google Scholar] [CrossRef] [Scilit]
- Peng, Y.; Liang, S.; Liu, C.; Barella, S.; Guo, S.; Gruttadauria, A.; Belfi, M.; Liu, Y.; Qu, X.; Mapelli, C. Dynamic Recrystallization Behavior Under Inhomogeneous Thermomechanical Deformation State. Steel Res. Int. 2023, 94, 2200574. [Google Scholar] [CrossRef] [Scilit]
- Liu, C.; Liang, S.; Guo, S.; Li, R.; Barella, S.; Peng, Y.; Gruttadauria, A.; Belfi, M.; Li, W.; Yuan, C.; et al. Static Softening Behavior of 316L Stainless Steel under Flexible Rolling Process. J. Mater. Res. Technol. 2023, 26, 3332–3352. [Google Scholar] [CrossRef] [Scilit]
- Chen, X.; Liu, Y.; Shi, Q.; Zhang, J.; He, C.; Zhao, Q.; Wang, S.; Shen, Y.; Tan, S.; Wang, L. Annealing-Induced Strengthening in Hetero-Structured Mg Alloy Laminates with Gradient Al Content. J. Magnes. Alloys 2025, 13, 5369–5376. [Google Scholar] [CrossRef] [Scilit]
- Yuan, T.; Wang, Y.; Du, W.; Zeng, C.; Sun, Z.; Peng, W.; Liu, Y.; Hu, H.; Zeng, Z. Influence of Annealing on the Interfacial Structure, Recrystallization Behaviour, and Texture Evolution of Hot Extruded Mg/Al Laminated Composites. Mater. Today Commun. 2024, 40, 110132. [Google Scholar] [CrossRef] [Scilit]
- Lei, Y.; Zhan, M.; Xin, H.; Zhao, P.; Wang, Y.; Tuo, L.; Zheng, Z. Plastic Deformation and Microstructural Evolution in Rolled Mg/Al Laminated Composites During Tension: Roles of Slip, Twinning, and Interface Effects. Mater. Sci. Eng. A 2026, 949, 149424. [Google Scholar] [CrossRef] [Scilit]
- Yue, X.; Chen, W.; Li, K.; Zhou, J.; Sun, N.; Li, K.; Ye, H. Cold Rolling Deformation Mechanism of TA1 Pure Titanium. J. Plast. Eng. 2023, 30, 186–194. [Google Scholar]
- Meng, L.; Lin, P.; Zhao, Z.; Wei, Q. Microstructure Evolution and Grain Fragmentation Induced by the Co-Activation of Slip and () Nanotwin during Cryo-Forging of a Ti-6Al-4V Alloy. Mater. Sci. Eng. A 2023, 886, 145685. [Google Scholar] [CrossRef] [Scilit]
- Wang, T.; Qi, Y.Y.; Liu, J.L.; Han, J.C.; Ren, Z.K.; Huang, Q.X. Research Progress of Metal Laminates Roll Bonding Process at Home and Abroad. J. Harbin Inst. Technol. 2020, 52, 42–56. [Google Scholar]









Disclaimer/Publisher’s Note: The statements, opinions and data contained in all publications are solely those of the individual author(s) and contributor(s) and not of MDPI and/or the editor(s). MDPI and/or the editor(s) disclaim responsibility for any injury to people or property resulting from any ideas, methods, instructions or products referred to in the content. |
© 2026 by the authors. Licensee MDPI, Basel, Switzerland. This article is an open access article distributed under the terms and conditions of the Creative Commons Attribution (CC BY) license.