


Abstract
The cold creep of titanium alloy sheets has long been a critical issue for marine equipment. So far, the orientation dependence of such behavior remains far from understood, threatening the dimensional stability and service safety of long-term load-bearing structures. In this study, the early-stage room-temperature creep behavior of a near-α Ti6321 (Ti80) alloy sheet was systematically investigated along the rolling direction (RD), 45-degree direction, transverse direction (TD), and normal direction (ND). The sheet exhibited pronounced room-temperature creep anisotropy among the four orientations. The creep strain was highest in the RD specimen, followed in descending order by the ND, TD, and 45-degree specimens, and the creep rate followed the same ranking, clearly confirming the existence of creep anisotropy. Slip-system analysis was conducted to clarify the deformation mechanism. Basal and prismatic slip were readily activated in the RD and ND specimens and provided the principal contributions to creep strain. In contrast, prismatic slip was more difficult to activate in the 45-degree and TD specimens, where pyramidal slip accounted for a larger fraction. The lower creep strains in these orientations resulted from impeded slip transfer and dislocation transmission across grain boundaries. The origin of the creep anisotropy was attributed to the distinct activation of dislocations owing to the varied orientation. The principal mechanisms responsible for the differences in creep rate among specimens with different orientations are also discussed. The correlation between creep anisotropy and the actual dislocation motion as well as the dynamic variation in true stress is established, which benefits the accurate dimension controlling of titanium components.
1. Introduction
Near-α titanium alloys have attracted extensive attention in structural engineering applications, including the marine industry and deep-sea pressure hulls, because of their high specific strength, excellent corrosion resistance, and good weldability [1,2,3]. In various complex service environments, these alloys are often subjected to sustained mechanical stresses for long periods and can undergo appreciable creep even at room temperature (<0.25 Tm, where Tm is the melting temperature) [4,5,6,7,8,9]. Previous studies have shown that, even under stresses below the yield strength, creep strain can lead to the continuous accumulation of localized plastic damage; once the damage exceeds an allowable limit, material failure occurs [10,11,12]. Accordingly, extensive research has been devoted to this issue.
Previous studies have shown that creep properties are directly affected by the stress state, microstructure, and crystallographic texture. For example, Suryawanshi et al. [13] reported pronounced tension-compression asymmetry in the creep rates of several titanium alloys. Similarly, Guo et al. [14] found that the tensile creep strain of Ti-6Al-3Nb-2Zr-1Mo was approximately twice its compressive creep strain. Neeraj et al. [15] reported that the tensile creep strain of a near-α Ti-6Al alloy was approximately 5–6 times its compressive creep strain. This behavior is generally attributed to the high sensitivity of dislocation slip to the stress state, while the formation of a high dislocation density can produce a higher creep rate [16,17,18]. Dislocation glide and transmission are also strongly influenced by the microstructure. For instance, Sahoo et al. [19] found in Ti-6Al-4V that dislocations were more prone to pile-up in lamellar microstructures, which exhibited a higher damage-tolerance factor than bimodal and equiaxed microstructures. Likewise, Colla et al. [20] showed that interactions between dislocations and nanotwins in nanostructured metals produce incoherent twin-boundary effects, substantially increasing the stored dislocation energy density and thereby resulting in a high creep rate at room temperature. The influence of microstructure on creep properties is also manifested at the macroscopic texture level.
Studies have shown that creep anisotropy in rolled alloy sheets generally originates from the crystallographic orientation dependence of dislocation slip [21,22]. For example, Rahman et al. [23] found significant anisotropy in creep rate and creep-strain accumulation in hot-rolled commercially pure titanium sheets with different texture components. Similarly, Yazar et al. [24] reported that, in commercially pure titanium sheets with a cold-rolling texture, specimens loaded in the transverse direction exhibited a greater degree of grain-boundary slip transfer, resulting in a larger strain gradient than that of specimens loaded in the rolling direction. In Ti6321 alloy sheets with a T-type texture, Zhang et al. [25] found that variations in the overall Schmid factor caused by microtexture resulted in a creep strain in the 45-degree direction approximately three times that in the transverse direction, indicating pronounced creep anisotropy. Li et al. [26] found that Ti60 sheets with a strong T-type texture contained a higher fraction of hard-oriented grains in the transverse direction, which affected dislocation activation and transmission and led to a lower creep rate. Similarly, Zhang et al. [27] concluded that the orientation anisotropy of Ti65 sheets with a T-type texture originated from the fraction of hard-oriented grains and produced different creep mechanisms in the rolling and transverse directions.
The early-stage room-temperature creep of titanium alloys is generally dominated by dislocation slip, and the magnitude of creep deformation is closely related to the activation and transmission of dislocations [28,29]. For example, Dichtl et al. [30] found that basal slip dominated the early creep of the near-α TIMETAL ® 834 alloy, whereas the fraction of prismatic slip gradually increased with increasing stress. Guo et al. [31] reported that the long dislocation lines formed during tensile deformation of TC4 ELI titanium alloy were more likely to traverse multiple grains and produced a larger creep strain. Xu et al. [32] likewise showed that early creep in a nickel-based superalloy was dominated by dislocation glide within the gamma matrix, accompanied by a continuous increase in dislocation density in the gamma phase. Most previous studies have focused on the mechanisms of anisotropy in tensile creep. Unfortunately, systematic and in-depth understanding of the mechanisms governing orientation-dependent room-temperature compressive creep remains lacking.
In this study, room-temperature uniaxial compressive creep tests were conducted under multiple stress levels (0.7YS, 0.8YS, and 0.9YS). Combined with EBSD and TEM characterization, slip trace statistics, and dislocation mechanism analysis, the room-temperature creep anisotropy mechanism of rolled near-α Ti6321(Ti80) alloy for deep-sea engineering was systematically investigated for specimens with different orientations. Pronounced basal texture was present in the RD, 45-degree, and TD orientations. Room-temperature compressive creep tests were performed on hot-rolled Ti6321 alloy sheets along the RD, 45-degree, TD, and ND orientations. By combining the differences in creep strain and creep rate, the creep deformation behavior in the four orientations was systematically analyzed and interpreted. The intrinsic relationships among texture, deformation mechanisms, and creep properties were revealed, providing a theoretical basis for understanding texture-induced anisotropy in room-temperature compressive creep.
2. Materials and Methods
2.1. Materials and Specimens
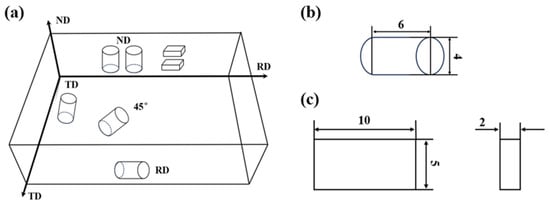
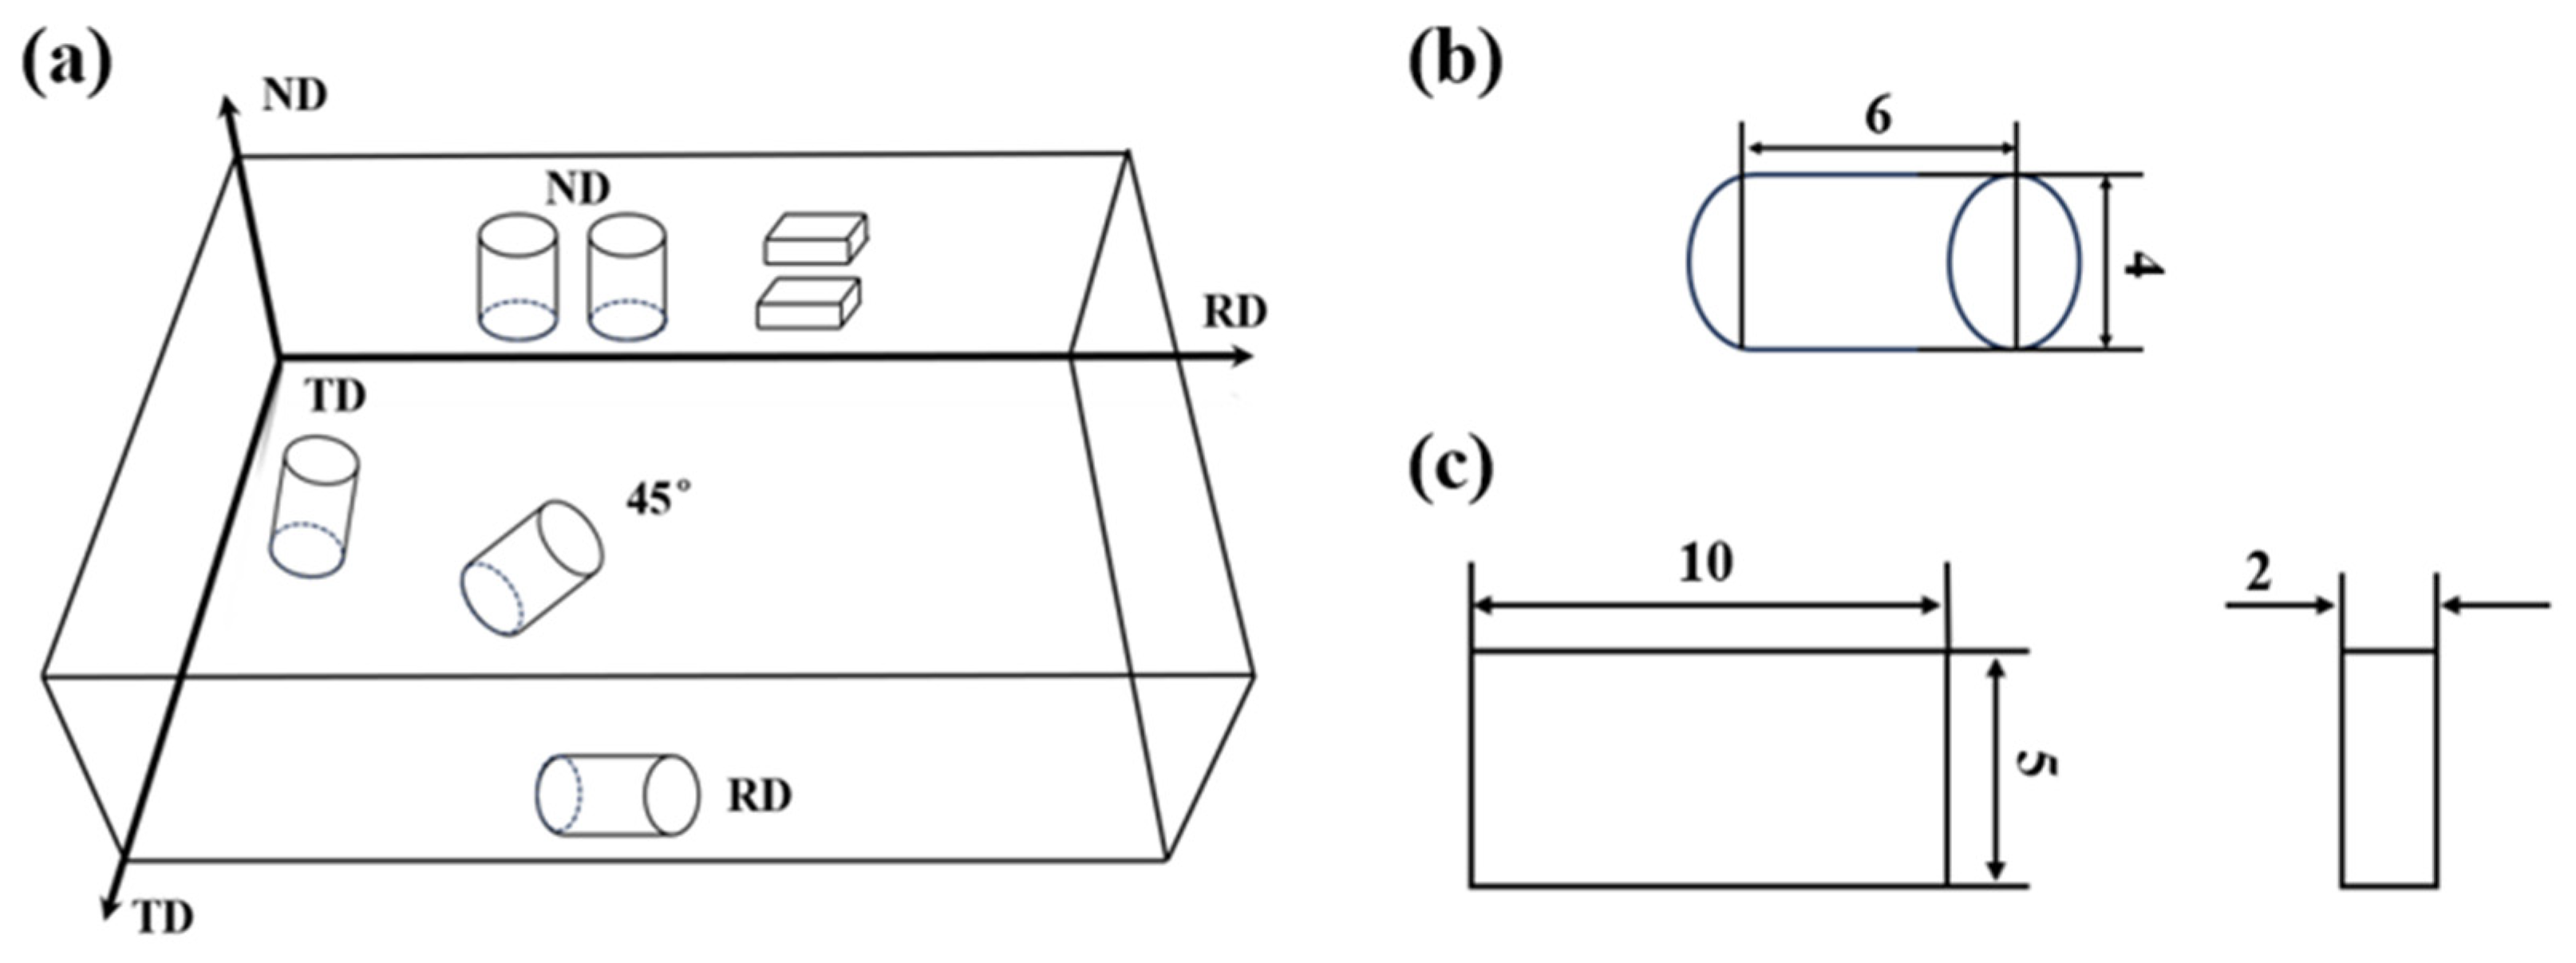
A Ti6321 alloy sheet with a bimodal microstructure was used in this study. The chemical composition of the alloy is listed in Table 1. The rolled sheet exhibited a strong texture. As shown in Figure 1, two types of specimens were prepared. First, cylindrical specimens with a diameter of 4 mm and a height of 6 mm were machined along four different directions of the plate (Figure 1b) based on the creep testing requirements from Gleeble 3500 thermomechanical simulator (Dynamic Systems Inc., Poestenkill, NY, USA). The specimen orientations were parallel or perpendicular to the rolling direction–transverse direction (RD–TD) plane of the plate. Second, bulk specimens measuring 10 mm × 5 mm × 2 mm were prepared (Figure 1c) for direct characterization of the rolled microstructure. To reveal the true microstructure, the specimens were sequentially ground with 220-grit, 800-grit, 1000-grit, and 2000-grit SiC papers and then electropolished in an electrolyte containing 60% methanol, 35% n-butanol, and 5% perchloric acid to remove the machining-affected layer and residual stresses.
Table 1.
Chemical composition of Ti6321 alloy.
Figure 1.
(a) Schematic diagram of the specimen orientation in the plate; (b) Cylindrical creep specimen; (c) Bulk sample.
2.2. Room-Temperature Creep Test
The mechanical properties of the Ti6321 sheet in different orientations were first measured by compression testing of cylindrical specimens, and the resulting yield-strength (YS) data are listed in Table 2. To evaluate the macroscopic creep properties of the sheet along different orientations, tests were conducted at room temperature (25 °C) using a DSI-Gleeble 3500 thermomechanical simulator (Dynamic Systems Inc., Poestenkill, NY, USA) at a loading rate of 0.001 mm/s. Constant compressive loads corresponding to 70%, 80%, and 90% of the orientation-specific yield strength were applied, with a hold time of 10 min. All the above test parameters were determined based on the actual in-service stress state of deep-sea Ti6321 alloy components, which ensures that the experimental results possess favorable engineering application value. The heights of the cylindrical specimens were measured before and after testing to verify the final strain calculated from the acquired data.
Table 2.
Yield strength of Ti6321 alloy plate along different directions of the plate.
2.3. Microstructure Characterization
Secondary-electron imaging and electron backscatter diffraction (EBSD) were performed on the bulk specimens using a AMBER focused ion beam/scanning electron microscope (TESCAN, Brno, Czech Republic) equipped with an EBSD detector and the Aztec online acquisition software (Version 2.1.2). The specimens were tilted by 70 degrees, and EBSD patterns were acquired at an accelerating voltage of 20 kV, a working distance of approximately 12 mm, and a step size of 0.3 micrometers. Based on the grayscale contrast between the α and β phases, image-segmentation algorithms were used to determine the mean size and mean thickness of the two phases. The slip systems activated inside α grains during creep were identified by trace analysis. The ideal hexagonal lattice parameters a = 0.295 nm and c = 0.468 nm were used in all calculations [33,34,35].
In addition, transmission electron microscopy (TEM) was performed before and after compression using a double Cs-corrected Themis Z TEM (Thermo Fisher Scientific, Waltham, MA, USA) operated at an accelerating voltage of 200 kV. TEM foils were prepared from sections normal to the loading plane, taken from the as-received material and from specimens subjected to 10 min of creep. The specimens were prepared according to a standard procedure: they were ground to a thickness of approximately 50 micrometers using SiC paper, punched into 3 mm discs with a dimpling tool, and then ion-milled to obtain electron-transparent regions. Bright-field, dark-field, and weak-beam TEM images were acquired under two-beam diffraction conditions using different diffraction vectors g to characterize the dislocation-line morphologies.
3. Results
3.1. Initial Microstructure of Ti6321 Alloy Plate
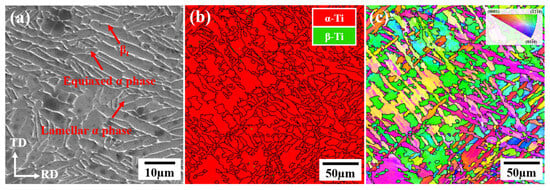
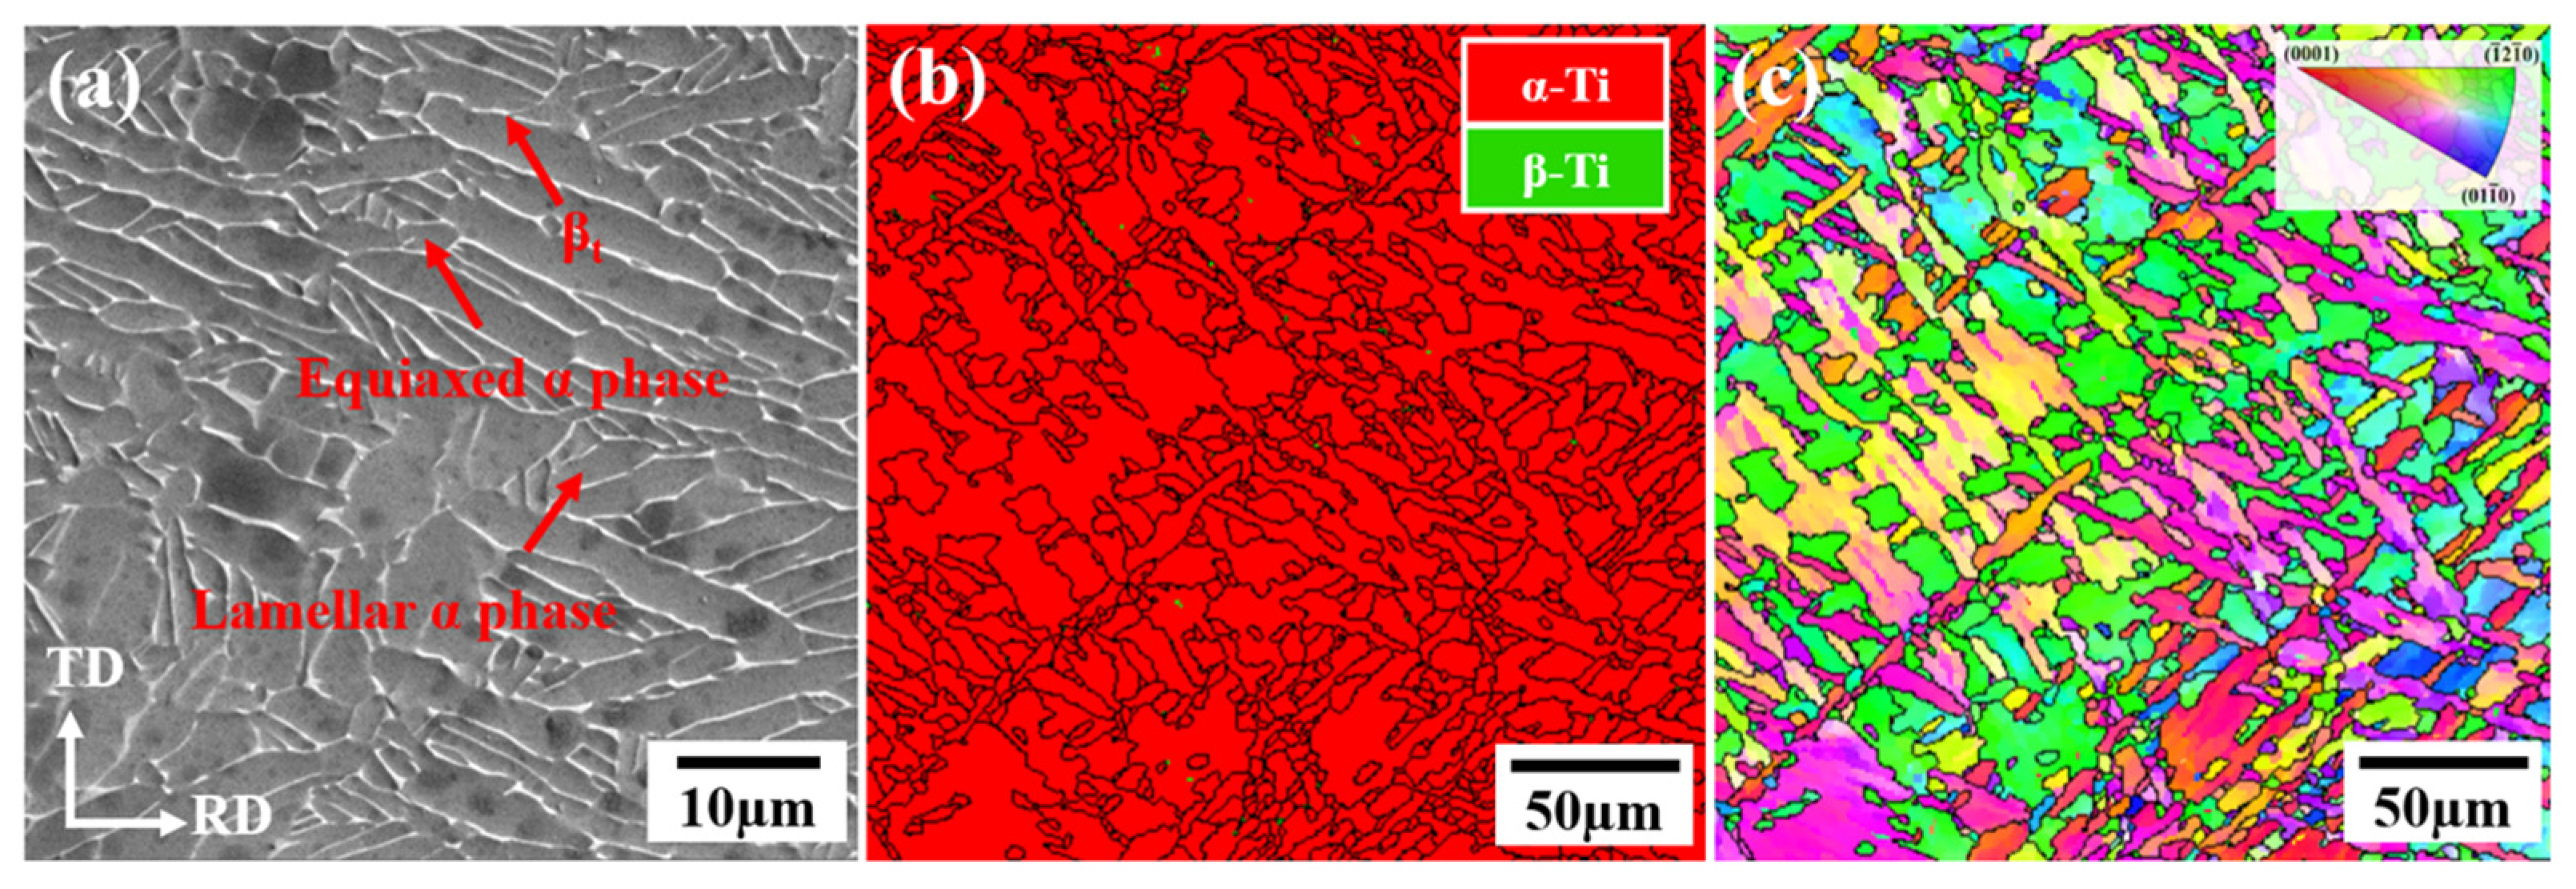
Figure 2a shows a representative secondary-electron scanning electron microscopy (SEM) image of the rolled Ti6321 alloy sheet. The microstructure is a homogeneous dual-phase structure composed of hexagonal close-packed (HCP) α phase and β phase. The average equivalent diameter of the α phase is approximately 4.62 µm, and the average thickness of the β phase is about 0.72 µm. As shown in Figure 2b, the body-centered-cubic (bcc) β phase is dispersed along the α-phase grain boundaries. Because its area fraction is negligible (approximately 0.3%), the β phase is considered to have little influence on the creep deformation of the alloy. Figure 2c presents a low-magnification EBSD orientation map. Because of the low β-phase content, only the dominant α phase was indexed.
Figure 2.
(a) Secondary electron SEM microstructure image of the rolled Ti6321 alloy; (b) EBSD phase map of the initial microstructure; (c) EBSD orientation distribution map of the initial microstructure.
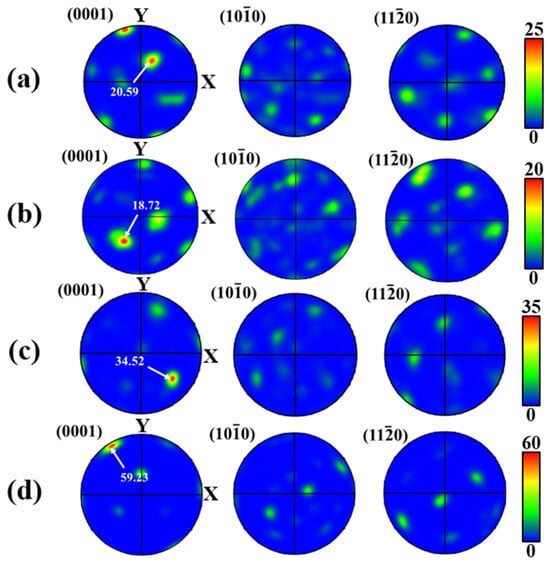
The texture characteristics of the specimens were characterized using (0001), (10-10), and (11-20) pole figures, as shown in Figure 3. The results indicate that the Ti6321 alloy sheet developed a strong basal texture in the different sampling orientations. In the (0001) pole figure of the RD specimen, an intensity peak appeared near the TD, with a maximum intensity of approximately 20.59 (Figure 3a). Similarly, the (0001) pole figure of the TD specimen exhibited the highest basal-texture intensity among all specimens along the 45-degree direction, with a maximum intensity of approximately 34.52 (Figure 3c). In the (0001) pole figure of the 45-degree specimen, the maximum basal-texture intensity near the RD reached 18.72 (Figure 3b). These results show that pronounced basal textures were present in the RD, TD, and 45-degree orientations, although the texture intensity in the RD specimen was lower than those in the 45-degree and TD specimens. A strong basal texture was also observed in the (0001) pole figure of the ND specimen, with a maximum intensity of 59.23 (Figure 3d). However, this texture was not aligned with the ND of the sheet. Therefore, unlike the other three orientations within the rolling plane, the ND specimen did not exhibit a pronounced basal-texture characteristic.
Figure 3.
Pole figures of Ti6321 alloy sheet with different sampling directions: (a) Rolling direction (RD); (b) 45° direction; (c) Transverse direction (TD); (d) Normal direction (ND). The horizontal x-axis corresponds to the rolling direction, the direction 45° to the rolling direction, the transverse direction, and the direction normal to the rolling plane, respectively. The maximum texture intensity values are marked in each figure.
It is worth noting that the specimen along the normal direction (ND) exhibits the lowest yield strength in the compression test. Compared with the other three directions, the ND sample does not show obvious basal texture characteristics. According to the findings reported by Rahman et al. [22] on hot-rolled commercially pure titanium sheets, grains with the c-axis approximately parallel to the loading axis belong to hard orientations and tend to form deformation twins. Therefore, it is inferred that the low yield strength of the ND specimen is closely related to the crystallographic texture.
3.2. Room-Temperature Compressive Creep Behavior
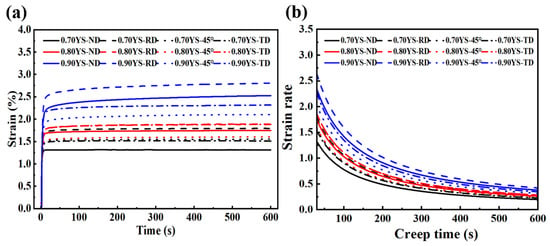
The macroscopic strain-time curves obtained from the cylindrical specimens are shown in Figure 4a. At a given orientation, the creep strain increased with increasing stress level. The creep strain here refers only to the strain accumulated during the constant-load holding stage, excluding the strain generated in the loading process. At 0.9 YS, the RD specimen exhibited the greatest creep deformation among all orientations, and the orientation dependence was particularly pronounced. For example, the creep strain of the normal direction (ND) specimen reaches nearly 2.49%, second only to that of the rolling direction (RD) specimen (approximately 2.75%). In comparison, the transverse direction (TD) specimen exhibits a lower creep strain of about 2.29%, while the specimen along the 45° direction shows the minimum creep strain of only around 2.09%. Thus, the material displayed pronounced creep anisotropy under different loading orientations, especially at high stress levels. Notably, most of the creep strain accumulated during the first 20 s, after which the creep deformation gradually leveled off.
Figure 4.
(a) Strain-time curves of creep tests for Ti6321 alloy at different stress levels and in different directions of the plate; (b) Strain rate-time curves.
As the stress level decreased, the RD specimen consistently maintained the largest creep deformation, whereas the creep deformation of the ND specimen gradually decreased and became the lowest at 0.7 YS. Because the creep strains at 0.8 YS were small (1.89%, 1.87%, 1.59%, and 1.74% for the RD, 45-degree, TD, and ND orientations, respectively) and all were below 2.0%, the creep deformation at this lower stress level was not considered to provide a reliable representation of the creep-anisotropy trend.
Figure 4b presents the corresponding creep strain-rate versus time curves at the different stress levels. Creep is conventionally divided into three stages: primary (decelerating), secondary (steady-state), and tertiary (accelerating) creep [4,5]. All specimens in the present experiments remained in the primary stage, as indicated by the continuously decreasing strain rate; even after 600 s, none had entered the steady-state stage. At high stress levels, the RD specimen had the highest creep strain rate, followed by the ND specimen, whereas the 45-degree specimen had the lowest rate. This sequence was consistent with the ranking of the creep strains.
3.3. Microstructural Characteristics During RT-Creep
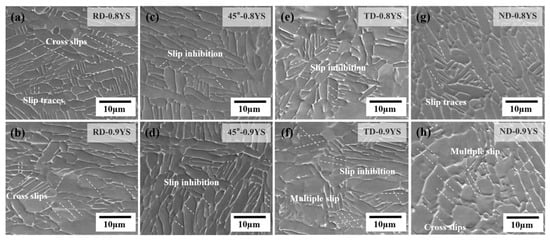
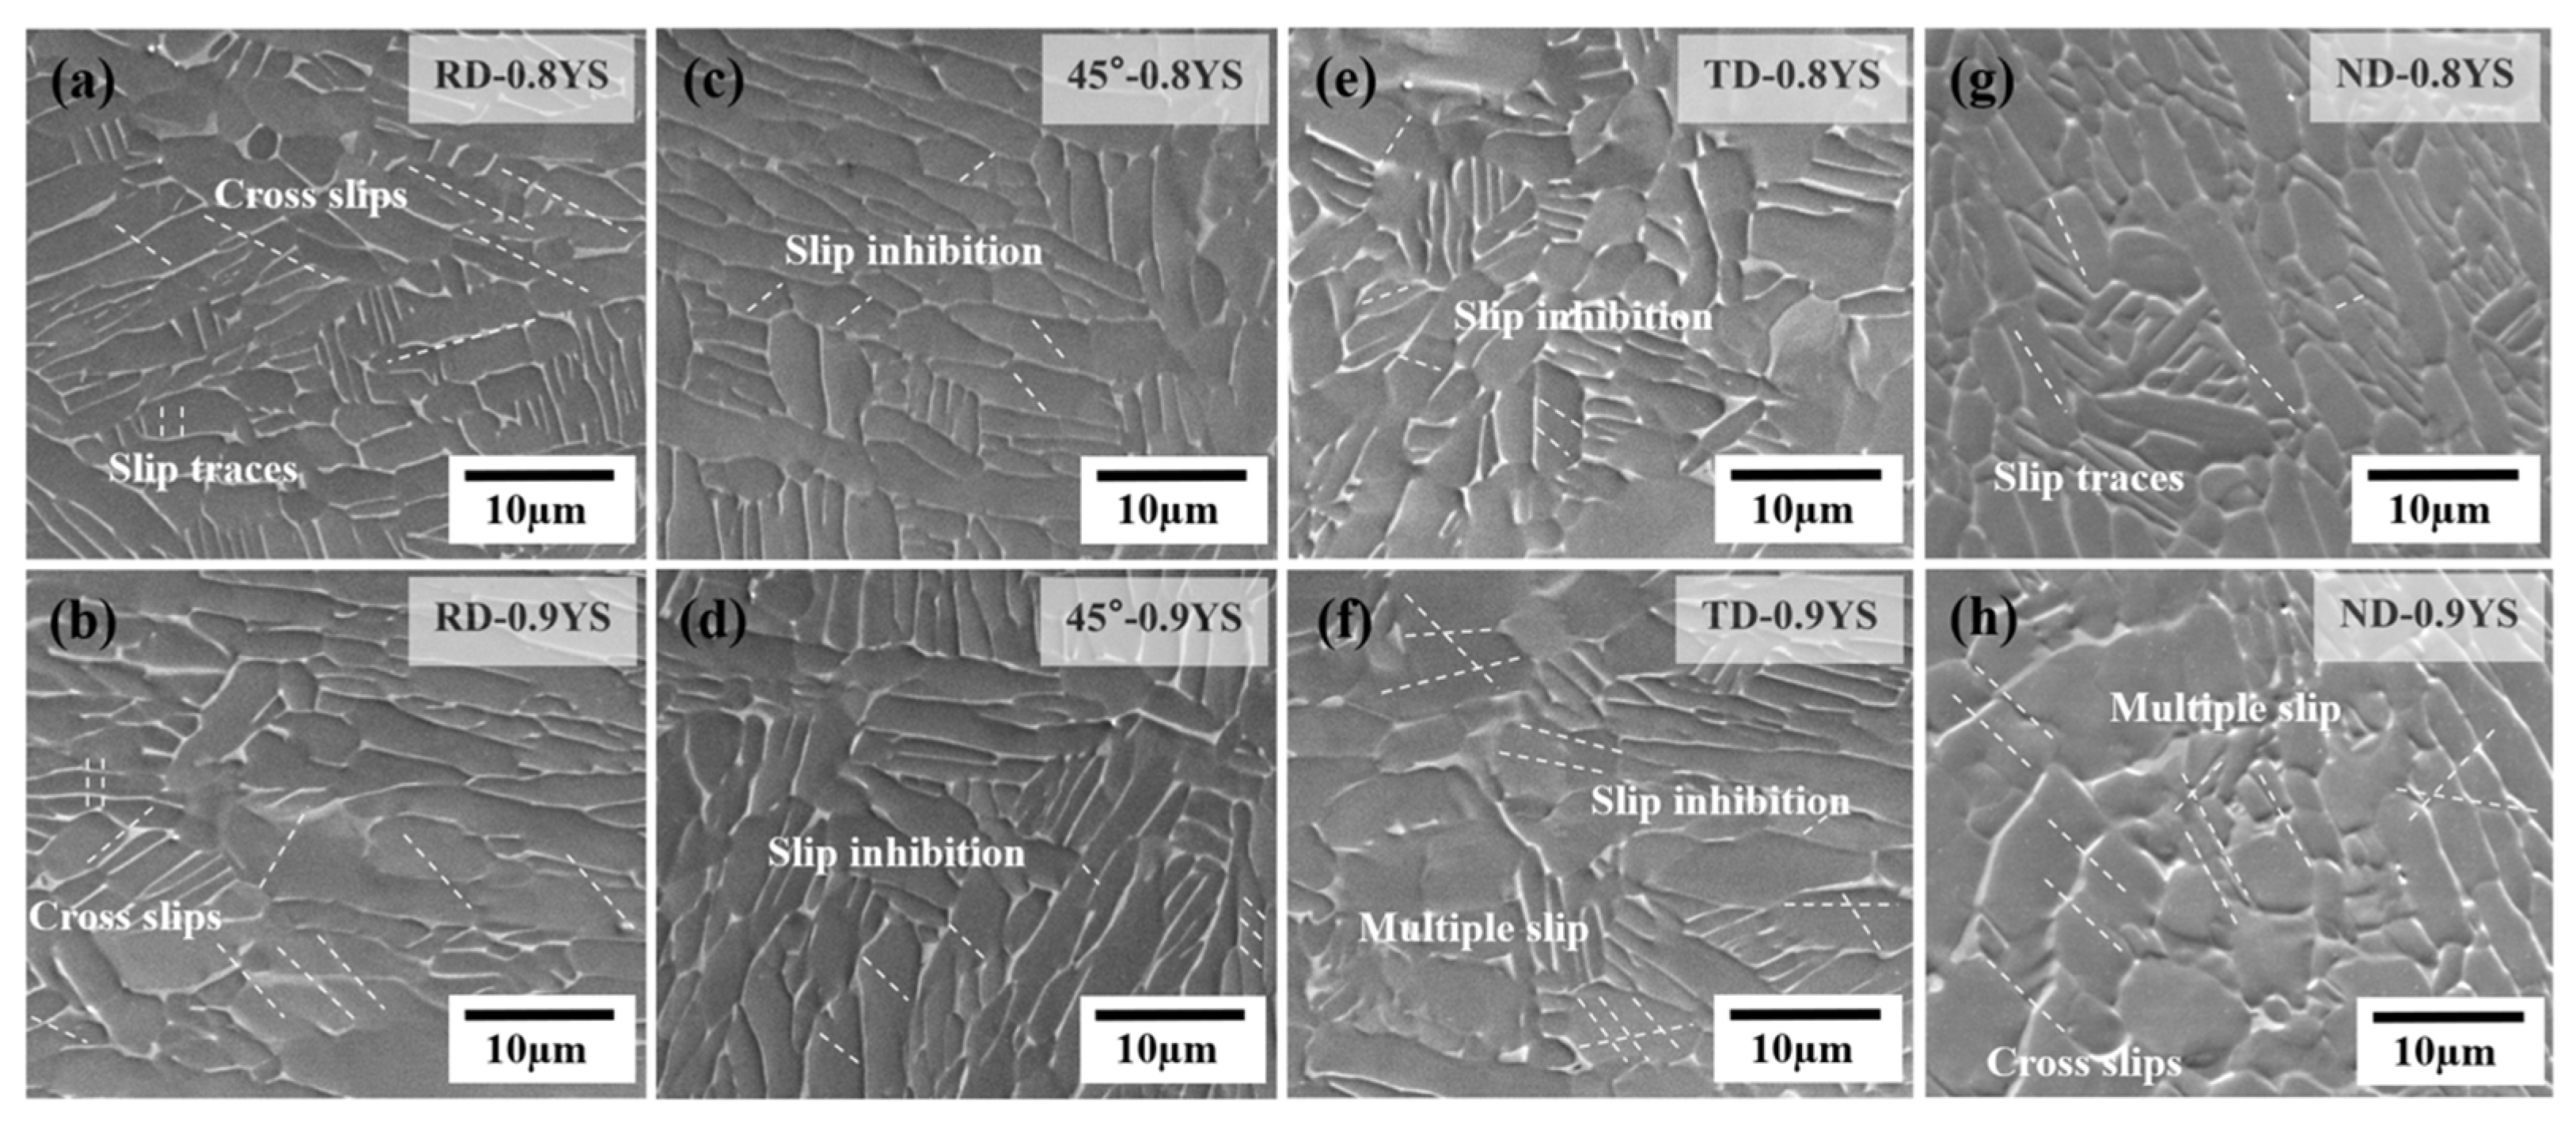
Figure 5a and Figure 5b show the microstructures of the RD specimens after 10 min of creep loading at 0.8 YS and 0.9 YS, respectively. The slip traces mainly appeared as sets of parallel straight lines, and multiple trace orientations were present within individual α grains (Figure 5b). Increasing the stress level caused more severe plastic-strain accumulation during creep and a transition from single slip to multiple slip inside α grains. This observation confirms that dislocation slip was the dominant deformation mechanism during compressive creep of the Ti6321 alloy. The higher stress level also activated dislocation slip in more grains and produced more slip traces crossing α/β phase boundaries, as indicated by the dashed lines in Figure 5b.
Figure 5.
Microstructures of specimens with different orientations after creep loading for 10 min under different loads: (a) Rolling direction (RD), 0.8YS; (b) Rolling direction (RD), 0.9YS; (c) 45° direction, 0.8YS; (d) 45° direction, 0.9YS; (e) Transverse direction (TD), 0.8YS; (f) Transverse direction (TD), 0.9YS; (g) Normal direction (ND), 0.8YS; (h) Normal direction (ND), 0.9YS.
Figure 5c and Figure 5d show the microstructures of the 45-degree specimens after 10 min of creep loading at 0.8 YS and 0.9 YS, respectively. Unlike the RD specimens, most slip traces in Figure 5c were confined within α grains, and very few crossed α/β boundaries. At 0.9 YS (Figure 5d), more slip traces were observed but remained confined within α grains, which may explain the lower creep strain in this orientation. The microstructures of the TD specimens after 10 min at 0.8 YS and 0.9 YS are shown in Figure 5e and Figure 5f, respectively. At 0.8 YS, some slip traces were confined within α grains, similar to the 45-degree specimens. With increasing creep load, more traces and cross-slip traces appeared inside the α grains of the 0.9 YS specimen. As shown in Figure 5f, pronounced traces did not appear in every grain but were concentrated in selected α grains, indicating heterogeneous dislocation nucleation. The microstructures of the ND specimens after 10 min at 0.8 YS and 0.9 YS are shown in Figure 5g and Figure 5h, respectively. At 0.8 YS, a small number of parallel slip traces appeared inside α grains, without clear evidence of grain-boundary crossing. When the stress was increased to 0.9 YS, clear cross-boundary slip traces and a small number of cross-slip traces were observed (Figure 5h).
The observations above show that slip traces appeared in both the α and β phases in nearly all creep tests, although most were concentrated within the α phase and relatively few occurred in the β phase. This indicates that room-temperature creep of Ti6321 was dominated by planar slip within the α phase. As the stress level increased, the 0.9 YS specimens generally exhibited a higher density of slip traces than the 0.8 YS specimens in all orientations. In most cases, dislocation transmission was impeded by phase boundaries, so that slip occurred only within individual α grains. This finding indicates that α/β interfaces act as barriers to dislocation motion, consistent with observations in near-α TC4 ELI titanium alloys [31]. Owing to the Burgers orientation relationship between the α and β phases (<11-20>α//<111>β and (0001)α//(110)β) [2,7] and the small β-lamella thickness (less than 1 micrometer), slip-system transmission across the interface could nevertheless occur in many cases, allowing dislocations to pass through the phase boundary. In addition, some cross-slip traces were observed in the TD and ND specimens at 0.9 YS, but not in the specimens tested at 0.8 YS.
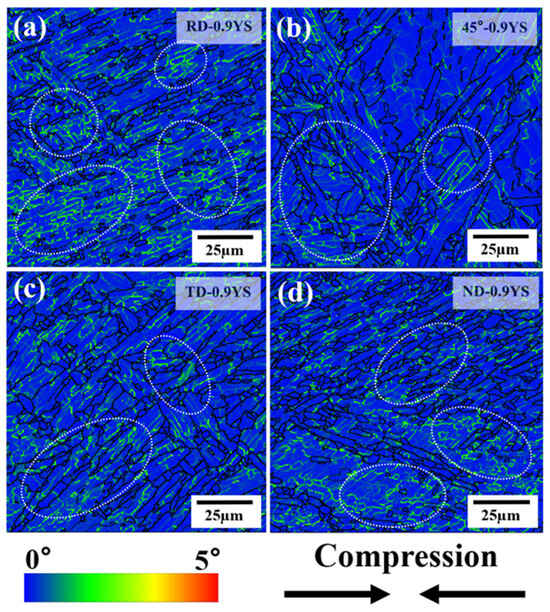
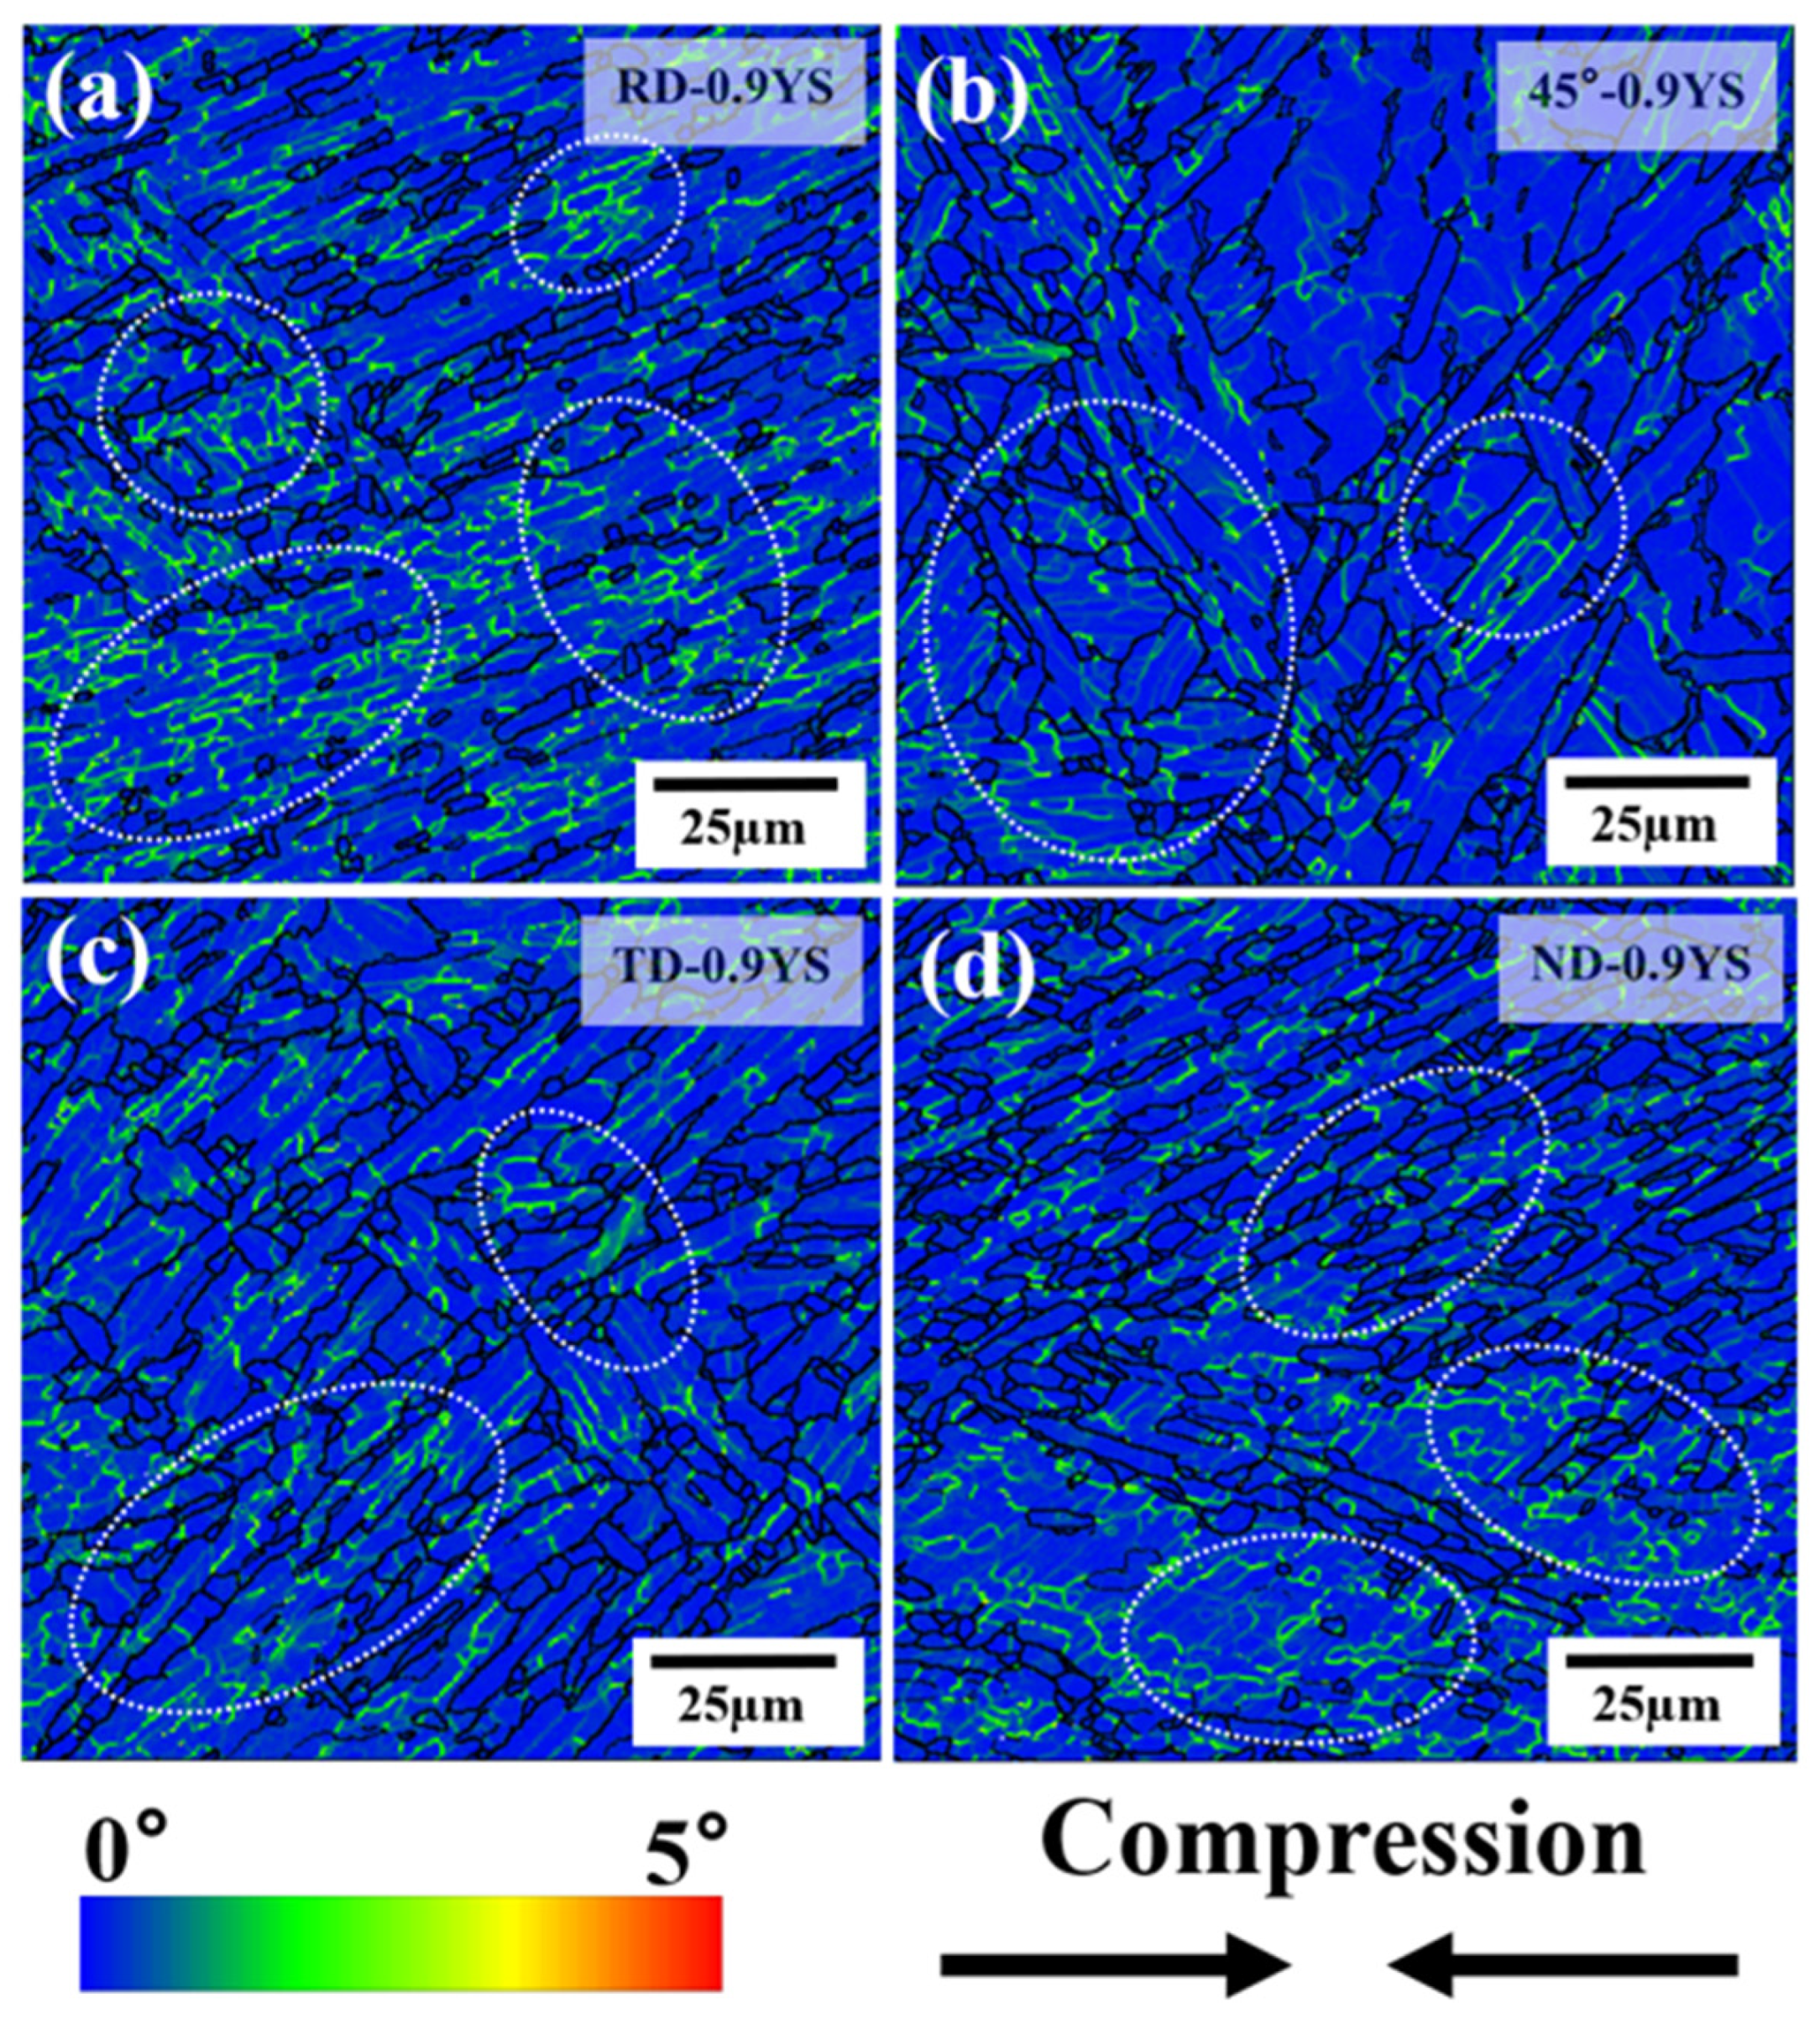
Because the creep strain rate and the number of slip traces were low at 0.8 YS, the local misorientation distributions of specimens with different orientations were mainly analyzed at 0.9 YS. Figure 6 presents the EBSD results for specimens with different orientations after compressive creep. Supplementary Figure S1 shows the inverse pole figure (IPF) orientation maps after creep, and Figure 6a–d shows the corresponding kernel average misorientation (KAM) maps. All orientations exhibited pronounced grain-scale local deformation, as confirmed by the elevated KAM values. The dashed lines in Figure 6a–d indicate that the number of localized dislocation-accumulation regions varied with orientation. The RD specimen contained the largest number of such regions, followed by the ND and TD specimens, whereas the 45-degree specimen contained the fewest.
Figure 6.
Kernel Average Misorientation (KAM) maps of specimens with different orientations under 0.9 times yield strength: (a) Rolling direction (RD); (b) 45° direction; (c) Transverse direction (TD); (d) Normal direction (ND).
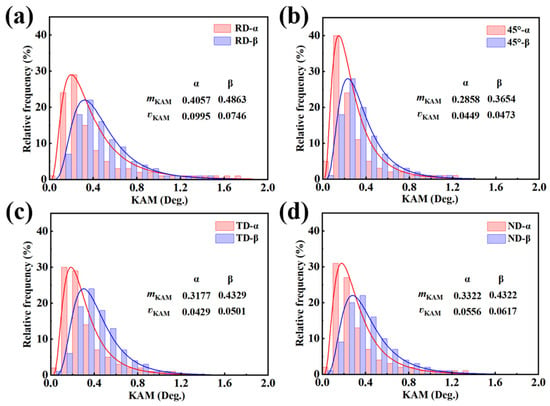
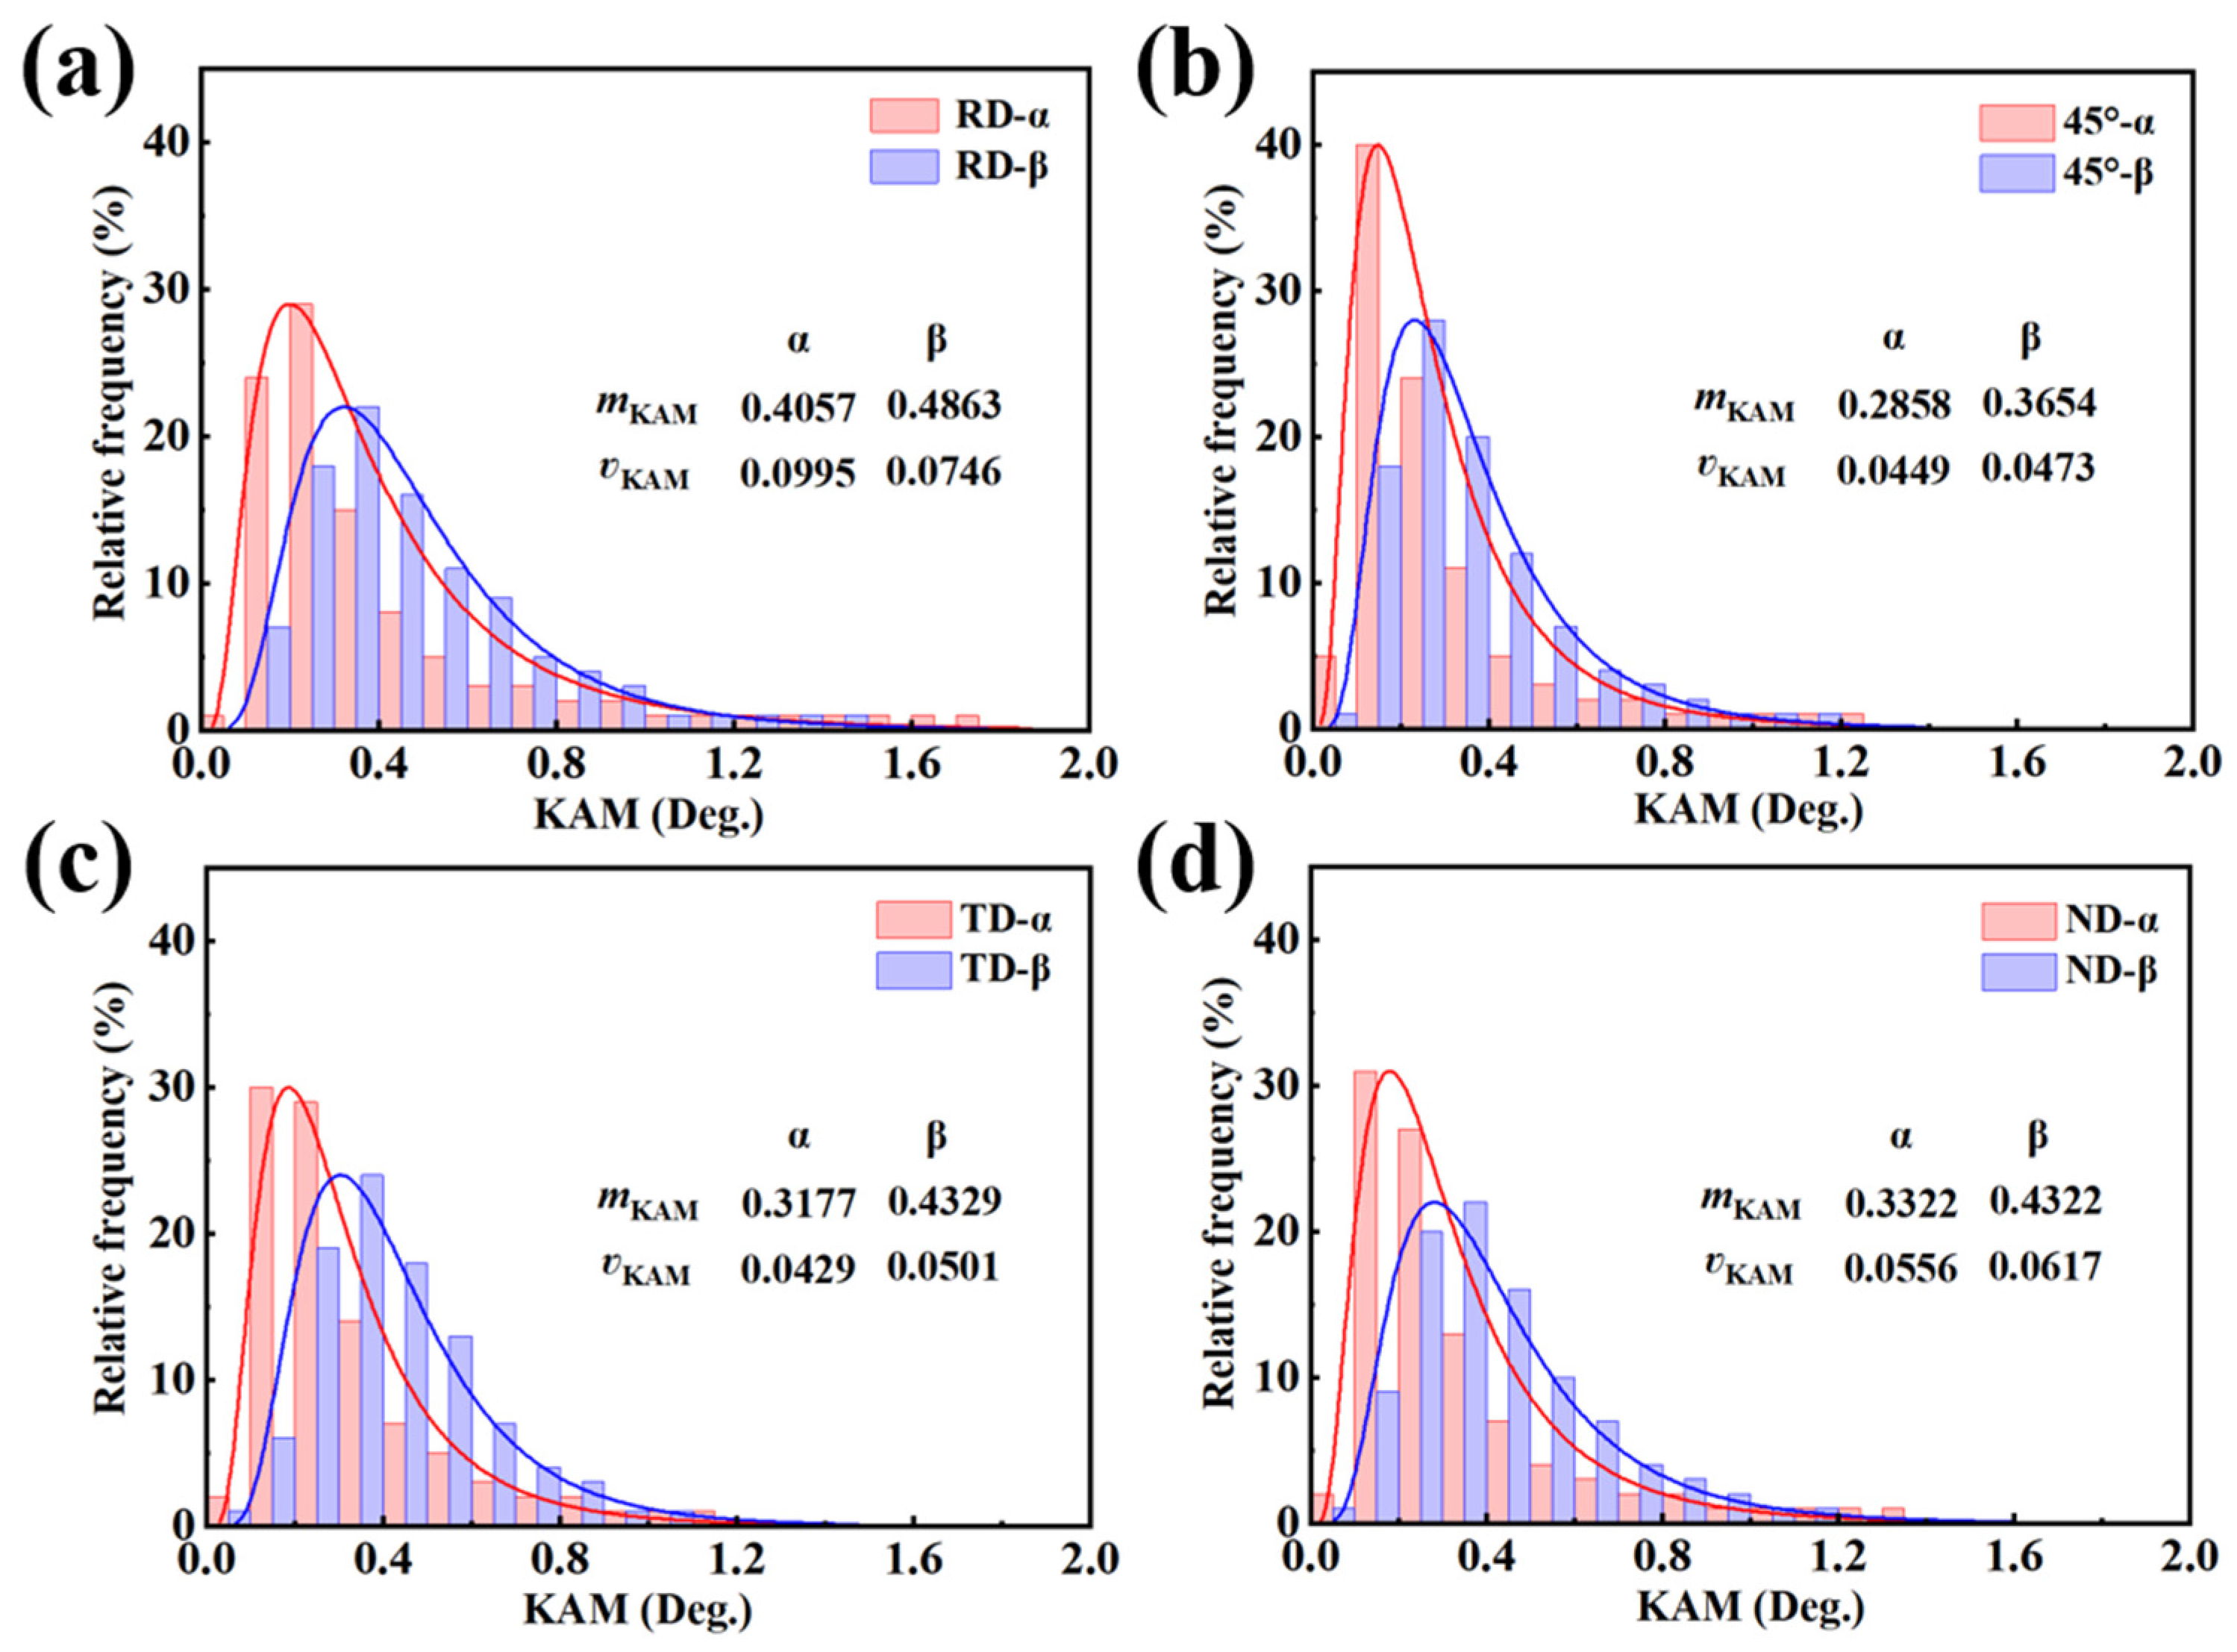
To quantitatively evaluate the accumulated creep damage in the microstructure, histograms of the local misorientation distributions were obtained for the specimens with different orientations and fitted using a log-normal distribution. Statistical analysis showed that the KAM values followed the log-normal distribution f(KAM) closely:
This distribution is defined by a scale parameter μ and a shape parameter σ. The mean (mKAM) and variance (ʋKAM) of the KAM values for the log-normal distribution are defined as follows:
The mean (mKAM) and variance (ʋKAM) of KAM can be used to characterize the degree of plastic-strain accumulation during creep and the degree of strain localization at the microscale, respectively. The mKAM and ʋKAM values of the α and β phases in all orientations were obtained from the log-normal fits (Figure 7). The mKAM and ʋKAM values of the dominant α phase show that the RD specimen had the largest and most highly localized plastic strain, followed by the ND and TD specimens, whereas the 45-degree specimen exhibited the smallest and least localized plastic strain. These results agree with the observations in Figure 6. The greater accumulation of KAM in the RD specimen is also an important manifestation of its more pronounced localized slip deformation, consistent with its larger creep strain.
Figure 7.
Kernel Average Misorientation (KAM) histograms and log-normal fitting curves of α-phase and β-phase for specimens with different orientations: (a) Rolling direction (RD); (b) 45° direction; (c) Transverse direction (TD); (d) Normal direction (ND).
4. Discussion
4.1. Effect of Basal Texture on Slip System Activation Behavior
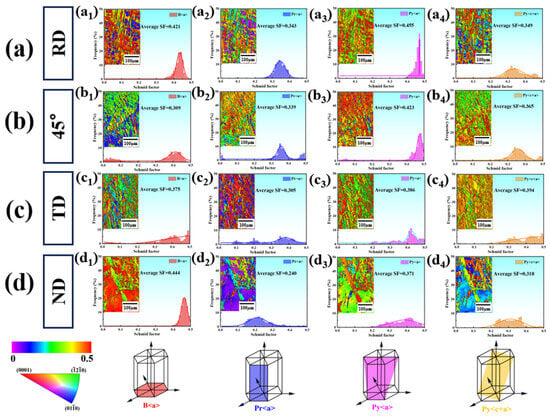
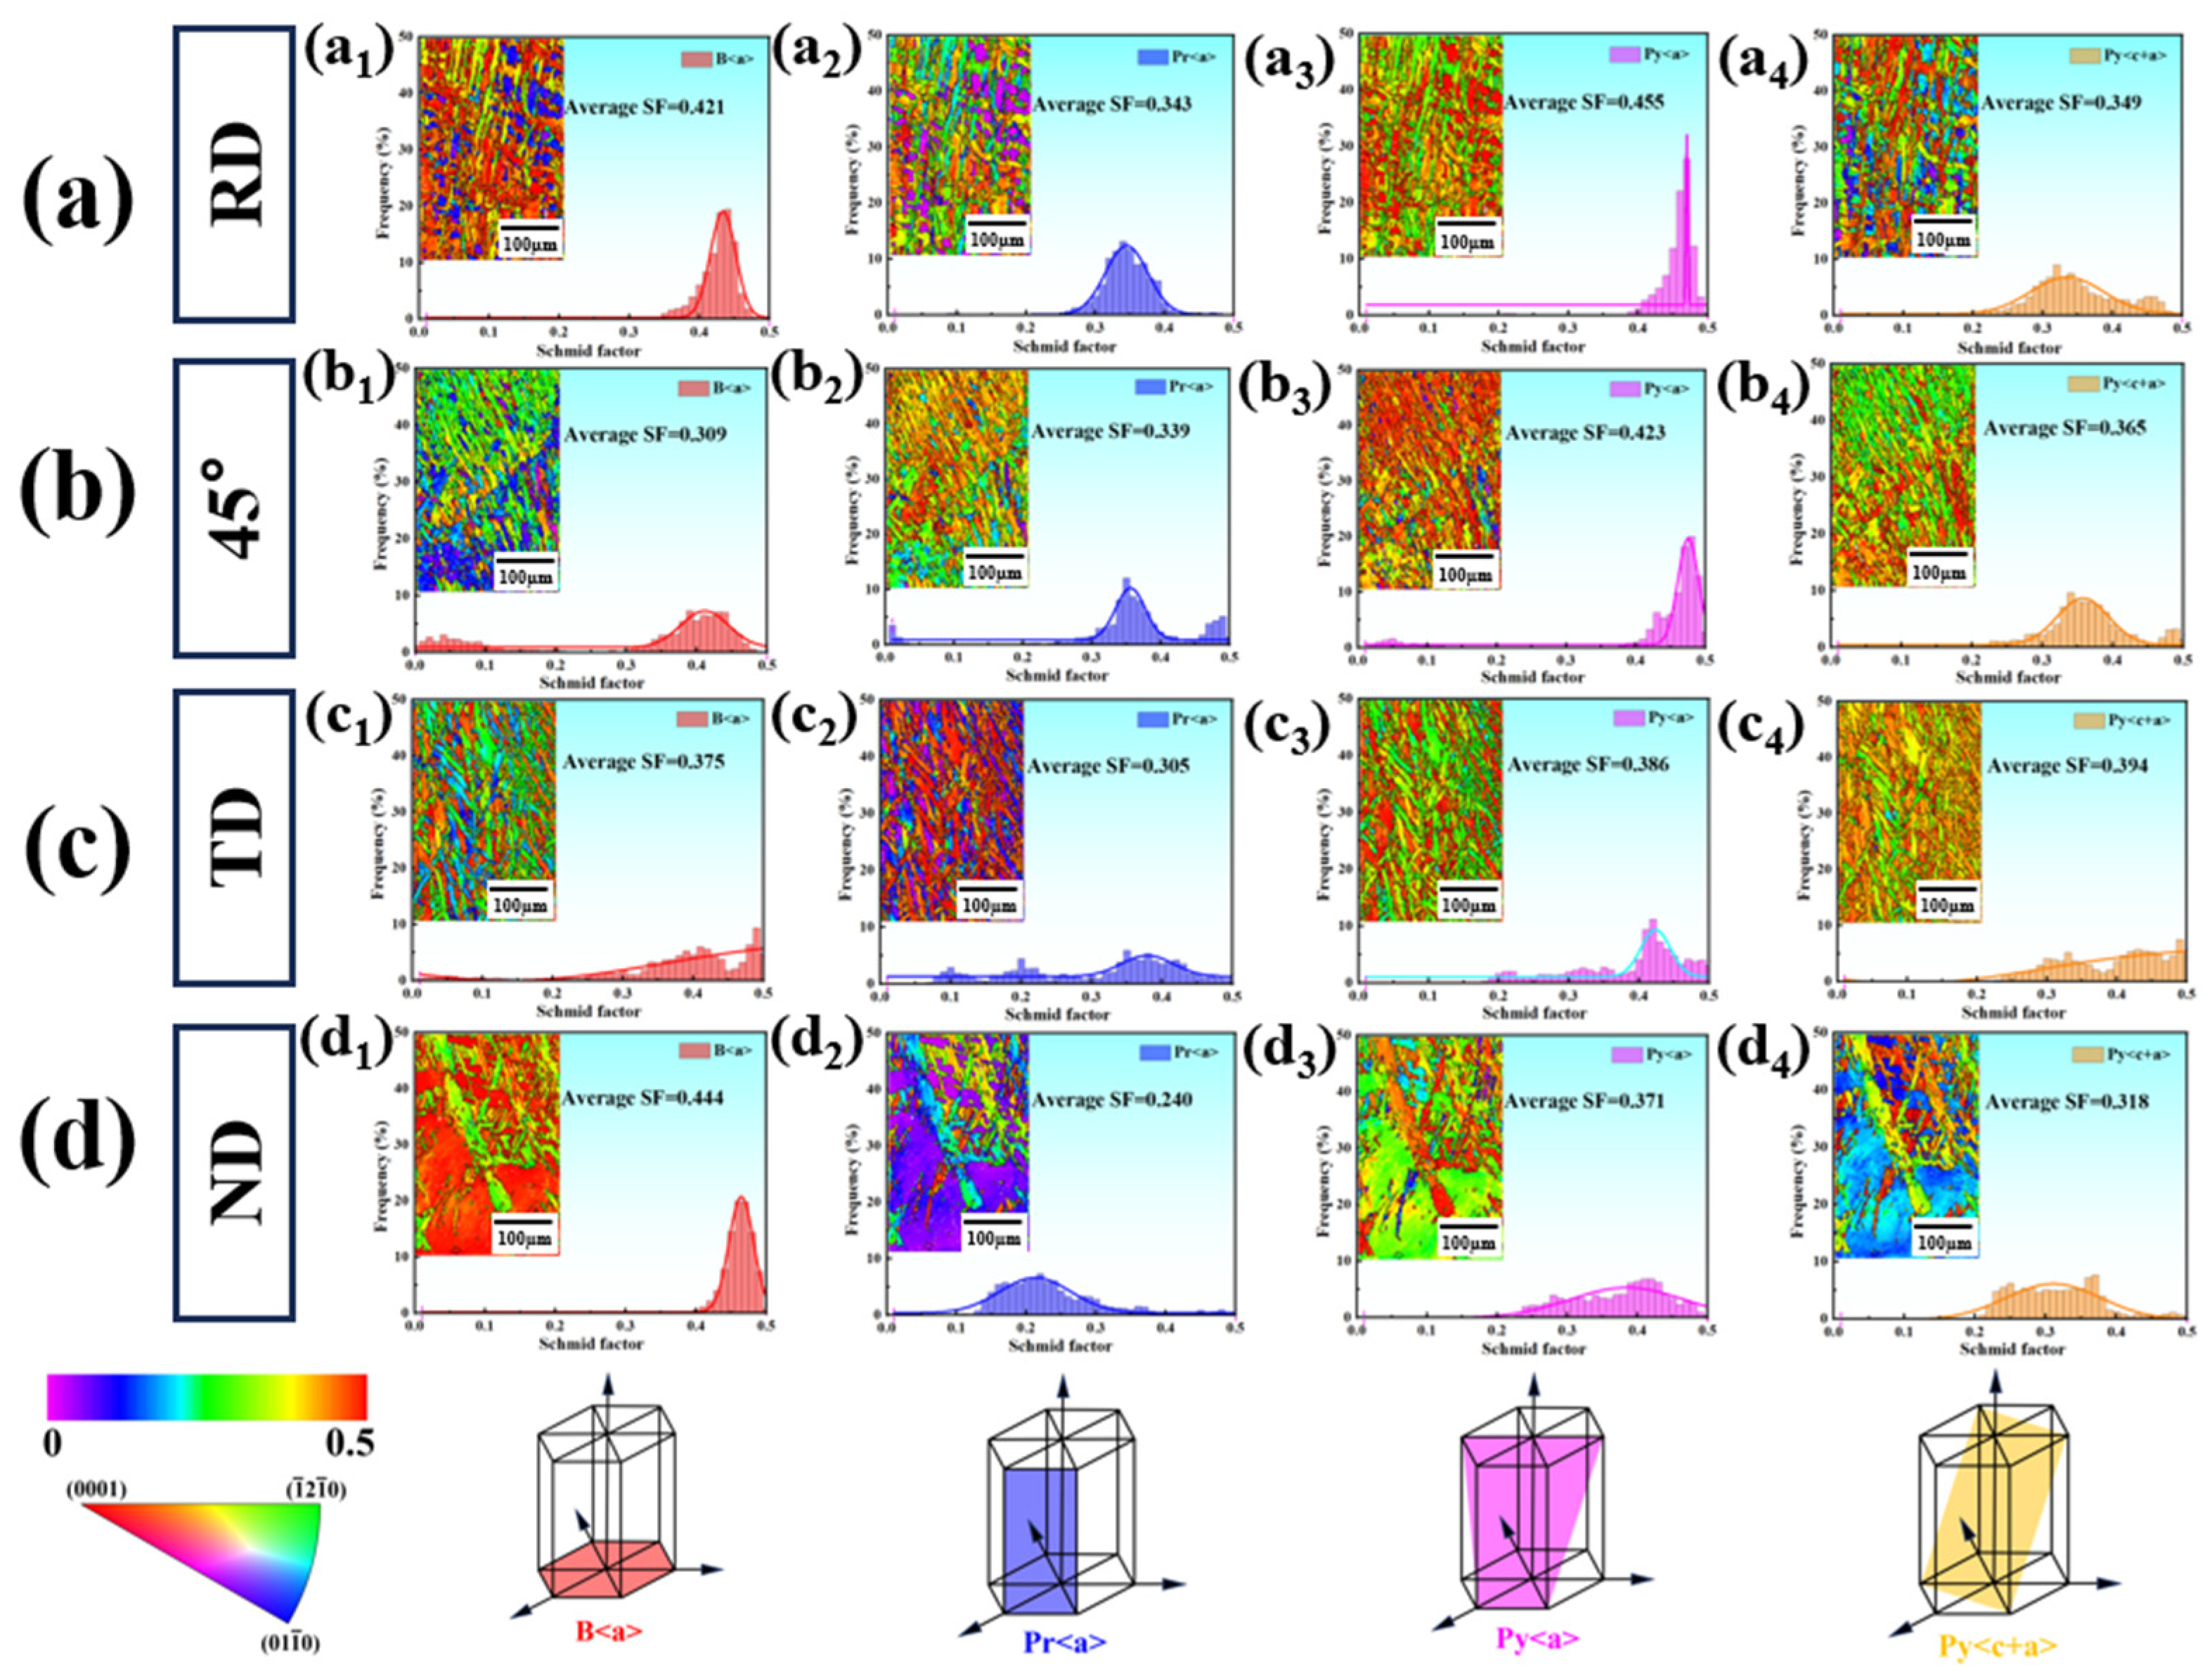
As shown in Figure 3, pronounced basal textures were present in the RD, 45-degree, and TD orientations of the Ti6321 sheet. Due to the hard orientation of grains, prismatic slip was difficult to activate, as previously reported for commercially pure titanium and Ti6321 alloys [22,28]. The ND specimen, in contrast, did not exhibit a pronounced basal texture. Since the intensity of creep strain at 0.8 YS was not sufficient to reflect the creep anisotropy clearly between differently oriented samples, the following discussion focuses on and compares slip-system activation in the basal-textured RD, 45-degree, and TD specimens and the ND specimen without a pronounced basal texture at 0.9 YS. Figure 8 and Figure 9 present the global Schmid-factor (SF) distributions calculated for the polycrystalline α grains and the statistical fractions of the experimentally activated slip systems, respectively.
Figure 8.
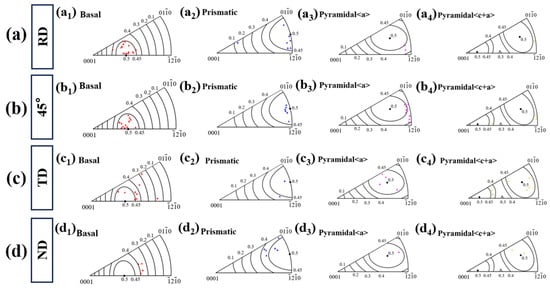
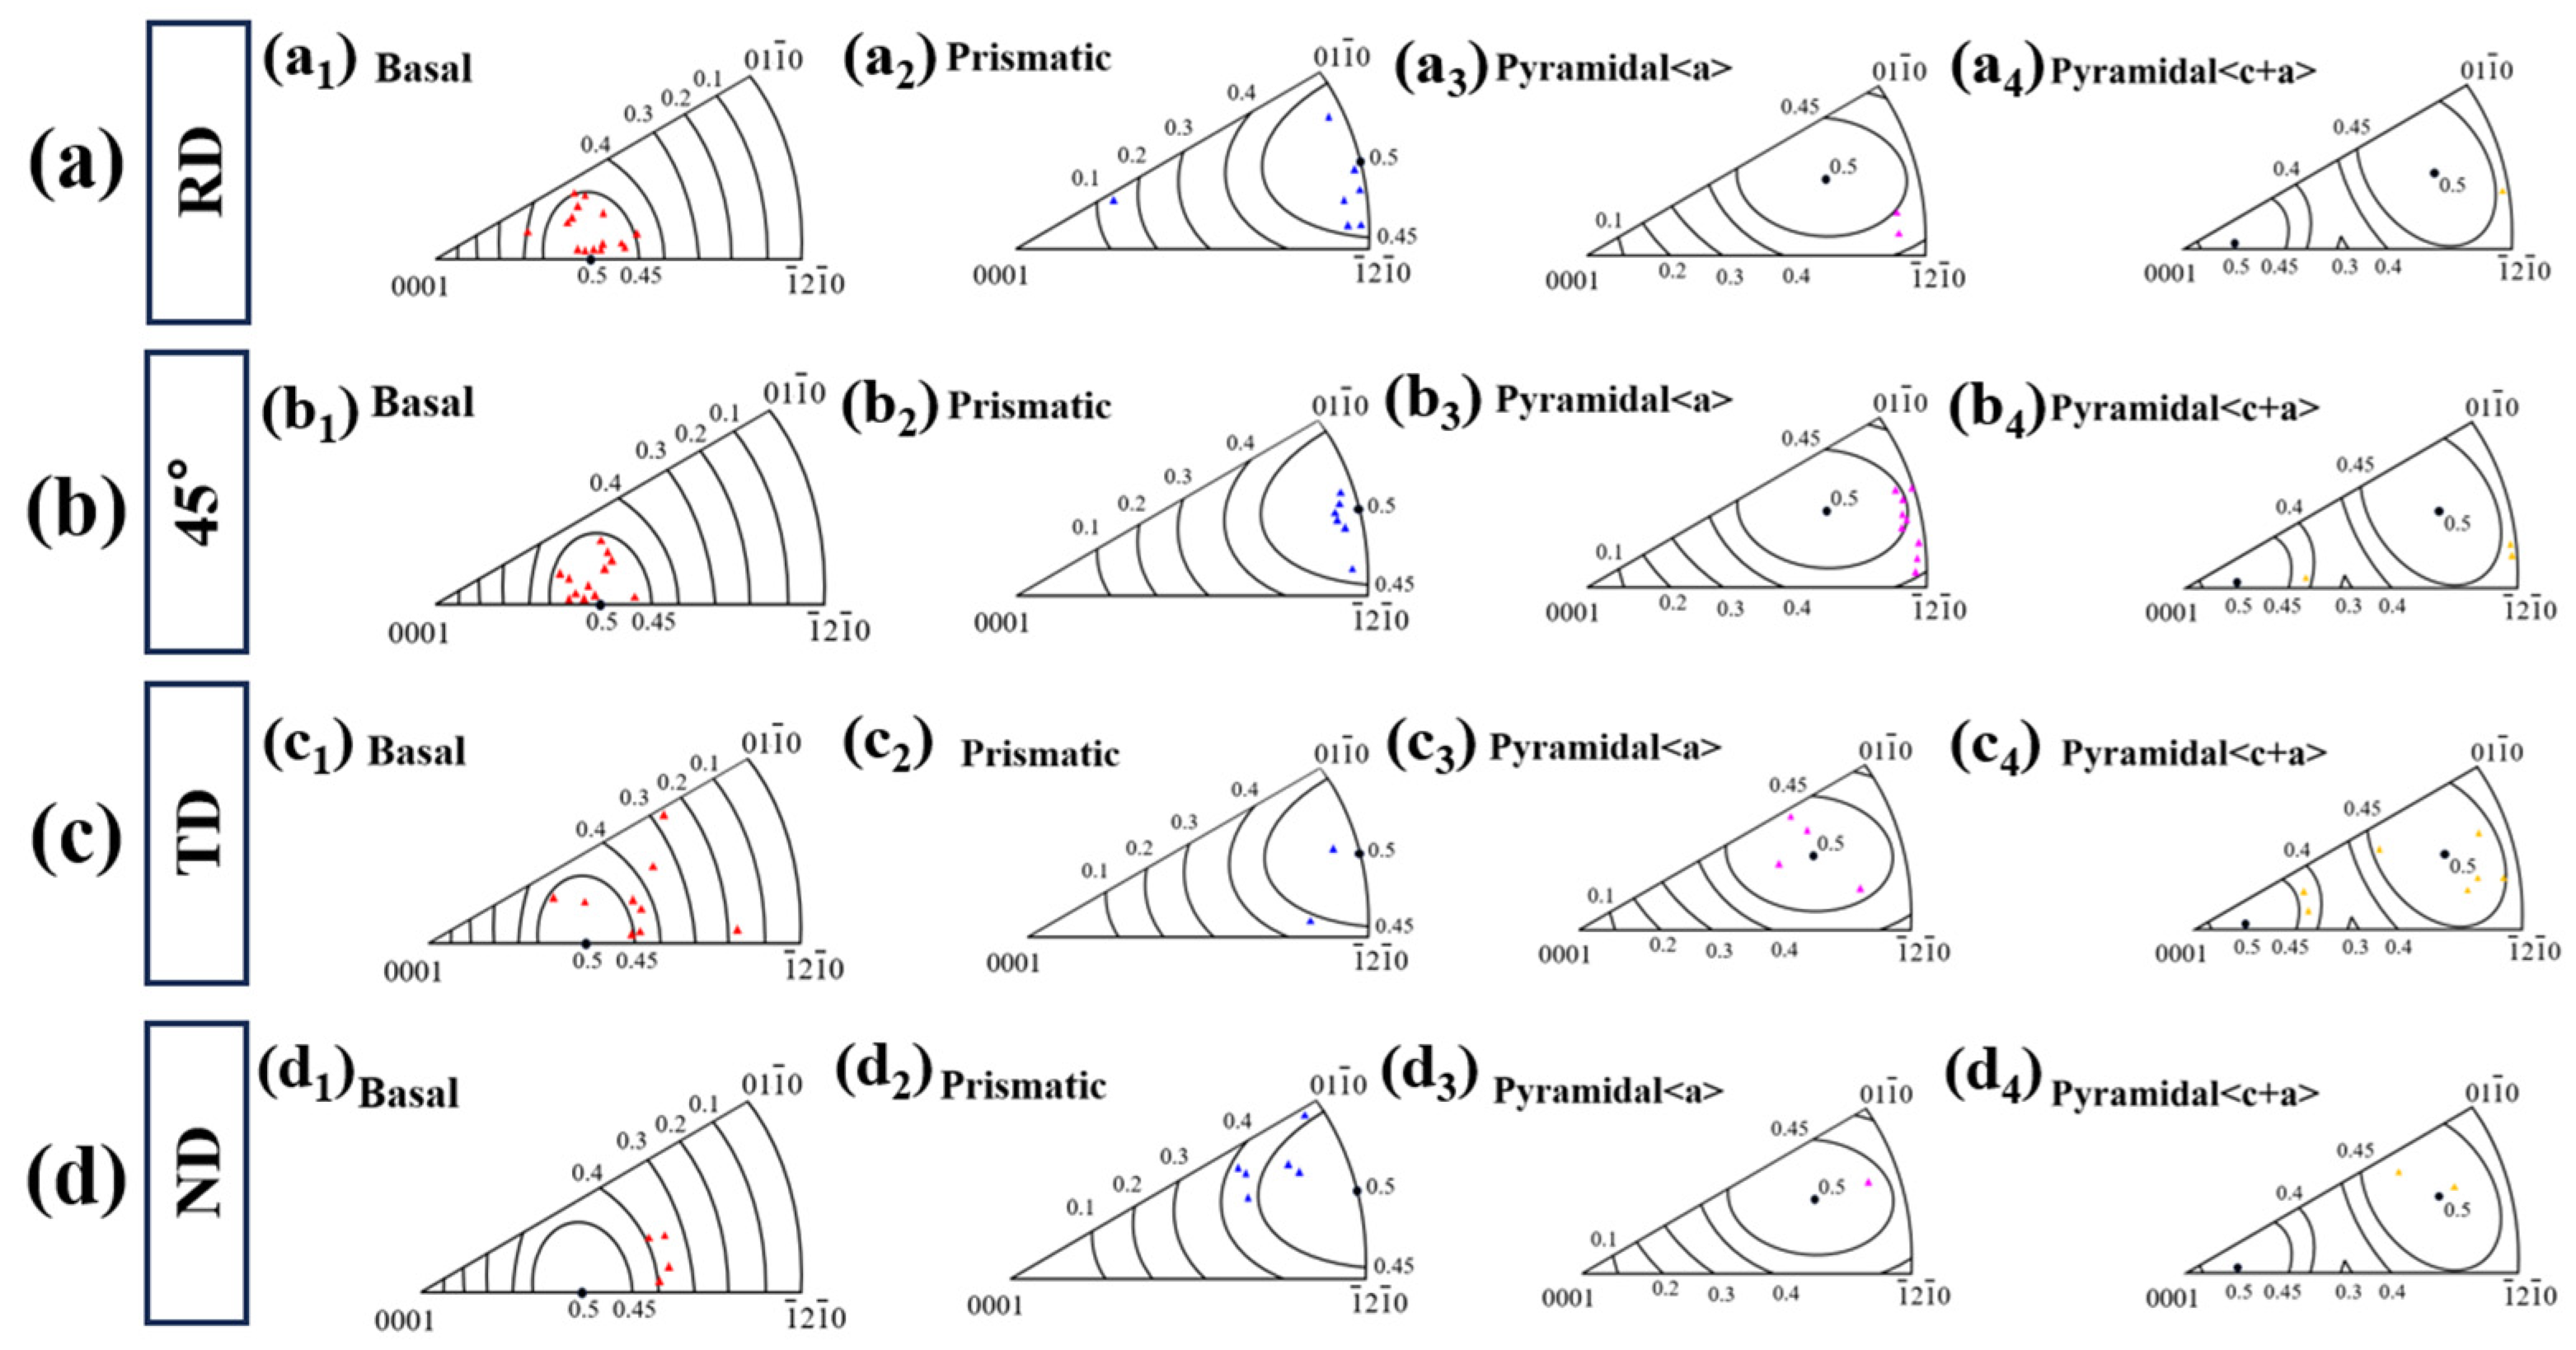
Histograms of basal (B), prismatic (Pr), pyramidal (Py), and pyramidal (Py<c+a>) slip systems for specimens with different orientations: (a) Rolling direction (RD); (b) 45° direction; (c) Transverse direction (TD); (d) Normal direction (ND). (a1,b1,c1,d1) correspond to the basal (B) slip system; (a2,b2,c2,d2) correspond to the prismatic (Pr) slip system; (a3,b3,c3,d3) correspond to the pyramidal (Py) slip system; (a4,b4,c4,d4) correspond to the pyramidal ⟨c+a⟩ slip system.
Figure 9.
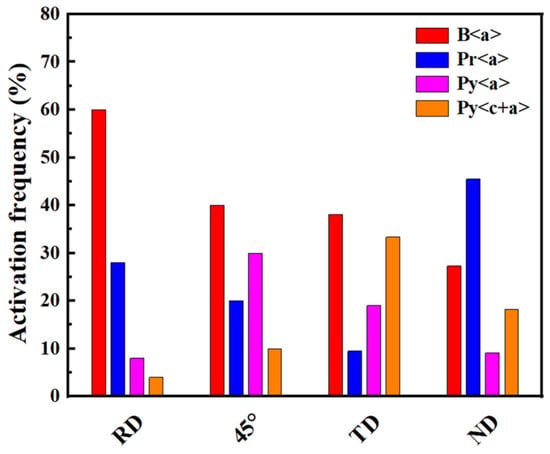
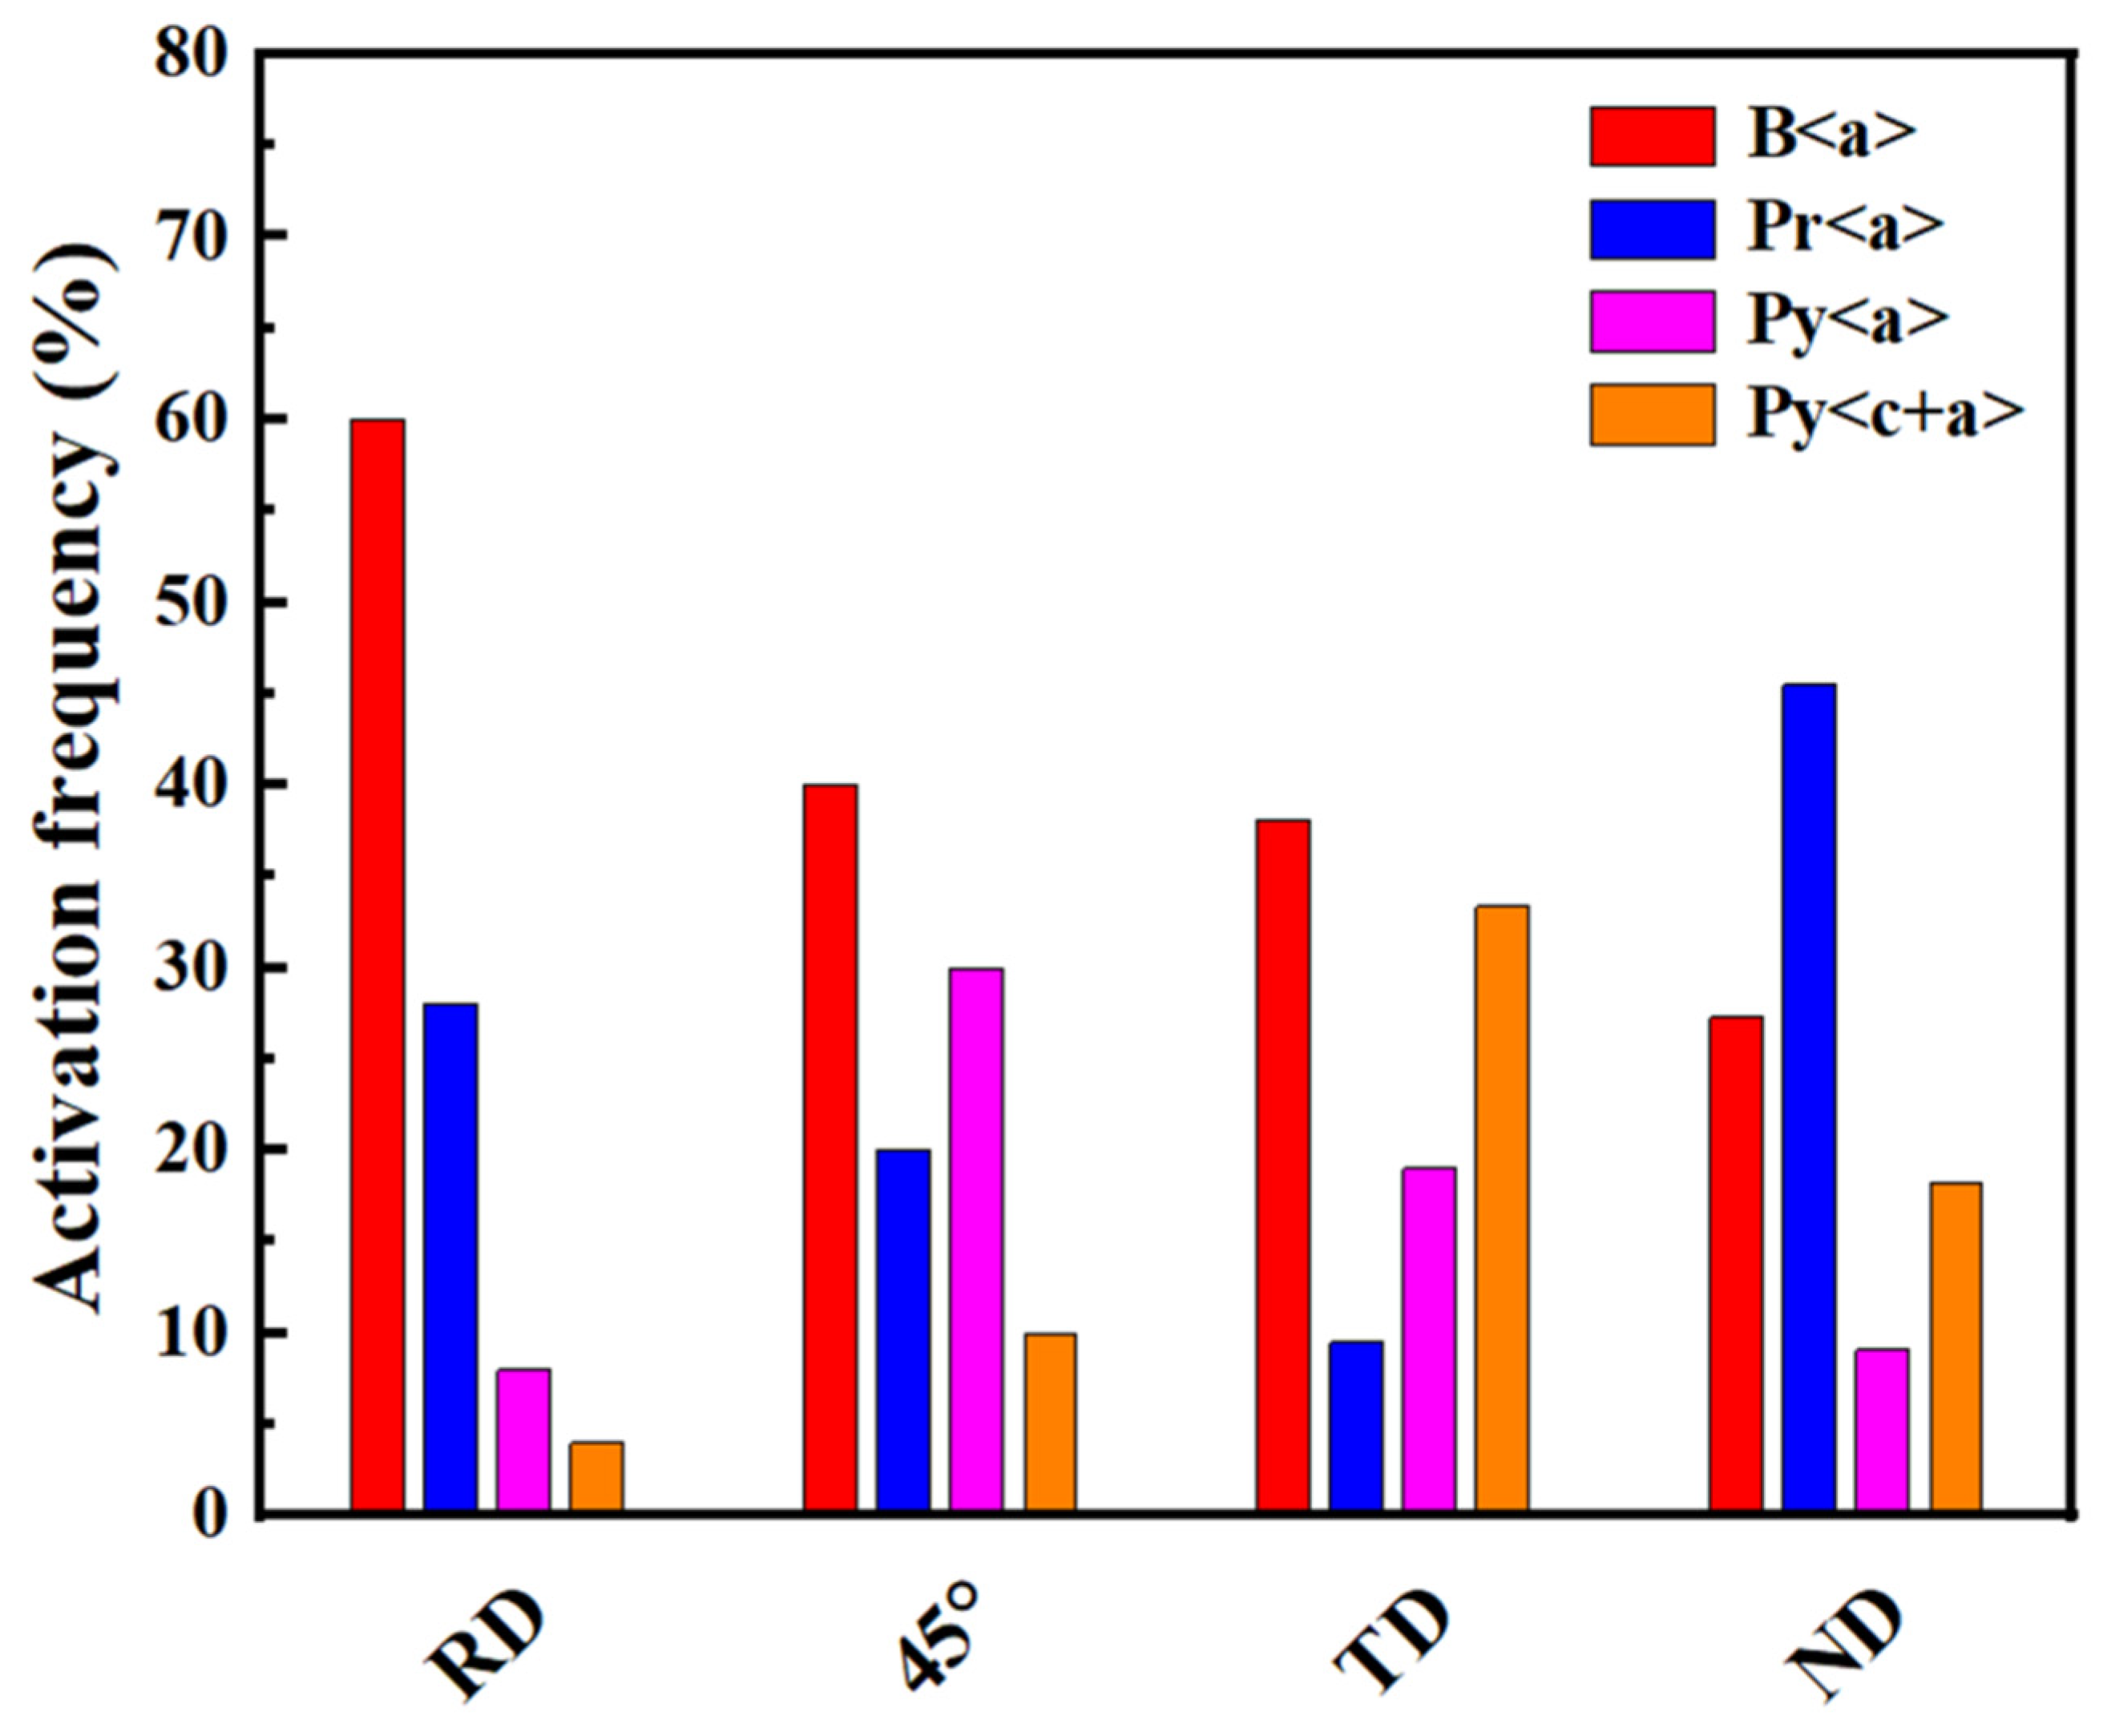
Activation frequencies of various slip systems in differently oriented specimens under 0.9 times yield strength characterized by EBSD.
Figure 8 was extracted from the initial EBSD data of the uncompressed specimens (Supplementary Figure S2) and was used to assess the activation tendency of basal, prismatic, and pyramidal slip systems. The SF distributions differed markedly among the orientations, indicating their significantly distinct stress resolution characteristics during loading. In the RD specimen (Figure 8a), the mean SFs for basal slip and 10-11<a> pyramidal slip were similarly high, 0.421 and 0.455, respectively, whereas those for 11-22<c+a> pyramidal slip and prismatic slip were relatively lower, approximately 0.34. Thus, the higher SFs for pyramidal and basal slip indicate that, under comparable critical resolved shear stresses, basal slip and 10-11<a> pyramidal slip in the RD specimen obtained high amounts of resolved stress for activation. Similarly, in the 45-degree specimen (Figure 8b), 10-11<a> pyramidal slip had the highest mean SF (0.423), followed by 11-22<c+a> pyramidal slip (0.365) and prismatic slip (0.339), whereas basal slip had the lowest mean SF (0.309). In the TD specimen (Figure 8c), the two pyramidal slip systems had similarly mean SFs of approximately 0.39, followed by basal slip (0.375), while prismatic slip had the lowest mean SF. In contrast, basal slip had the highest mean SF in the ND specimen (Figure 8d), 0.444, followed by pyramidal slip, while prismatic slip again had the lowest mean SF, only 0.209. These SF distributions demonstrate the physical basis for the preferred activation of slip systems varied with loading orientation in the Ti6321 sheet.
However, the global Schmid factors of a polycrystal cannot account for the effects of local stress [31]. The actual activation of slip systems is determined not only by the mean Schmid factor but also by the local shear strain required for strain accommodation within individual grains. Lunt et al. [36] suggested that local texture and interactions between neighboring grains significantly affect slip-system activation inside Ti-6Al-4V grains. As shown in Figure 5f, multiple slip-trace orientations were observed within some grains, mainly because of stress concentration at phase interfaces and local strain incompatibility.
To investigate the effect of local stress concentration on the actual operation of slip systems, slip-trace analysis was performed using EBSD data from the effective observation regions of specimens crept along the RD, 45-degree, TD, and ND orientations. The actual slip-system activity in each orientation was determined, and the statistical results at 0.9 YS are shown in Figure 9. More than 100 grains were counted for specimens of each orientation. Affected by the clarity of slip traces at the early strain stage and the applied stress level, a total of 56, 44, 62 and 49 slip traces were identified for the crept specimens with four orientations (rolling direction (RD), 45° direction, transverse direction (TD) and normal direction (ND)) under the stress of 0.9 times the yield strength. The trace analysis method was adopted to quantify the fraction of different active slip systems. The angular deviation between measured and theoretical slip traces was restricted within 5°. When multiple slip systems satisfied the 5° tolerance simultaneously, the slip system with the maximum Schmid factor was identified as the activated one. Basal slip was the dominant system in the RD specimen, accounting for approximately 60%, consistent with its high basal-slip SF in Figure 8. Prismatic slip accounted for approximately 28%, second only to basal slip; this is considered to reflect the influence of local internal stresses. Similarly, basal slip accounted for approximately 40% of the activity in the 45-degree specimen, comparable to the combined fraction of the two pyramidal systems with high SFs. In the ND specimen, the mean SF for prismatic slip was only 0.240, yet the statistical analysis showed that prismatic slip accounted for approximately 45% of the activity. These deviations are attributed to the high local stress states. The variances of the KAM distributions (ʋKAM) for the dominant α phase in the RD, 45-degree, and ND specimens were 0.0995, 0.0449, and 0.0556, respectively, as calculated in Figure 7. Because the TD specimen had the lowest ʋKAM (0.0429), its slip-system activation was least affected by local stress, and its experimentally measured slip fractions agreed most closely with the mean-SF predictions.
Figure 10 presents inverse pole figure (IPF) maps overlaid with Schmid-factor contours for the microstructures of the RD, 45-degree, TD, and ND specimens after creep at 0.9 YS. The distinct activities of basal, prismatic, pyramidal <a>, and pyramidal <c+a> slip within grains of the differently oriented specimens are shown. Basal slip dominated in the RD and 45-degree specimens, consistent with the high SFs observed in most grains (Figure 10(a1,b1)). Pyramidal slip and prismatic slip dominated in the TD and ND specimens, respectively, also consistent with the observations in Figure 10(c1,d1). Most grains fell within the high-SF range of 0.4–0.5.
Figure 10.
Inverse pole figure maps of basal, prismatic and pyramidal slip activation inside grains of differently oriented specimens after creep under 0.9 yield strength: (a) Rolling direction (RD); (b) 45° direction; (c) Transverse direction (TD); (d) Normal direction (ND). Schmid factor (SF) contour lines are overlaid on the maps.
It is noteworthy that Table 1 shows the ND specimen to have the lowest yield strength, whereas the RD specimen had the second-highest yield strength after the TD specimen, followed by the 45-degree specimen. Previous studies have shown that, in hexagonal α-Ti, the critical resolved shear stress follows the order pyramidal slip > basal slip > prismatic slip [37,38]. This explains why the TD specimen, dominated by pyramidal slip, had the highest yield strength, followed by the RD and 45-degree specimens, in which basal slip dominated. Their yield strengths were similar, 876 MPa and 870 MPa, respectively, whereas the ND specimen, dominated by prismatic slip, had the lowest yield strength.
4.2. Dislocation Activity Mechanism for Creep at Room Temperature
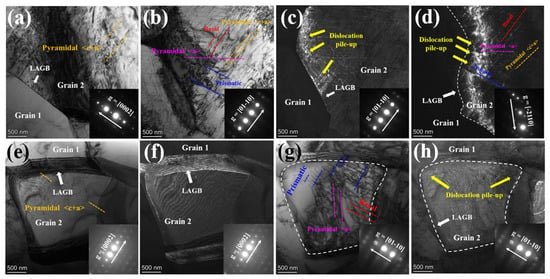
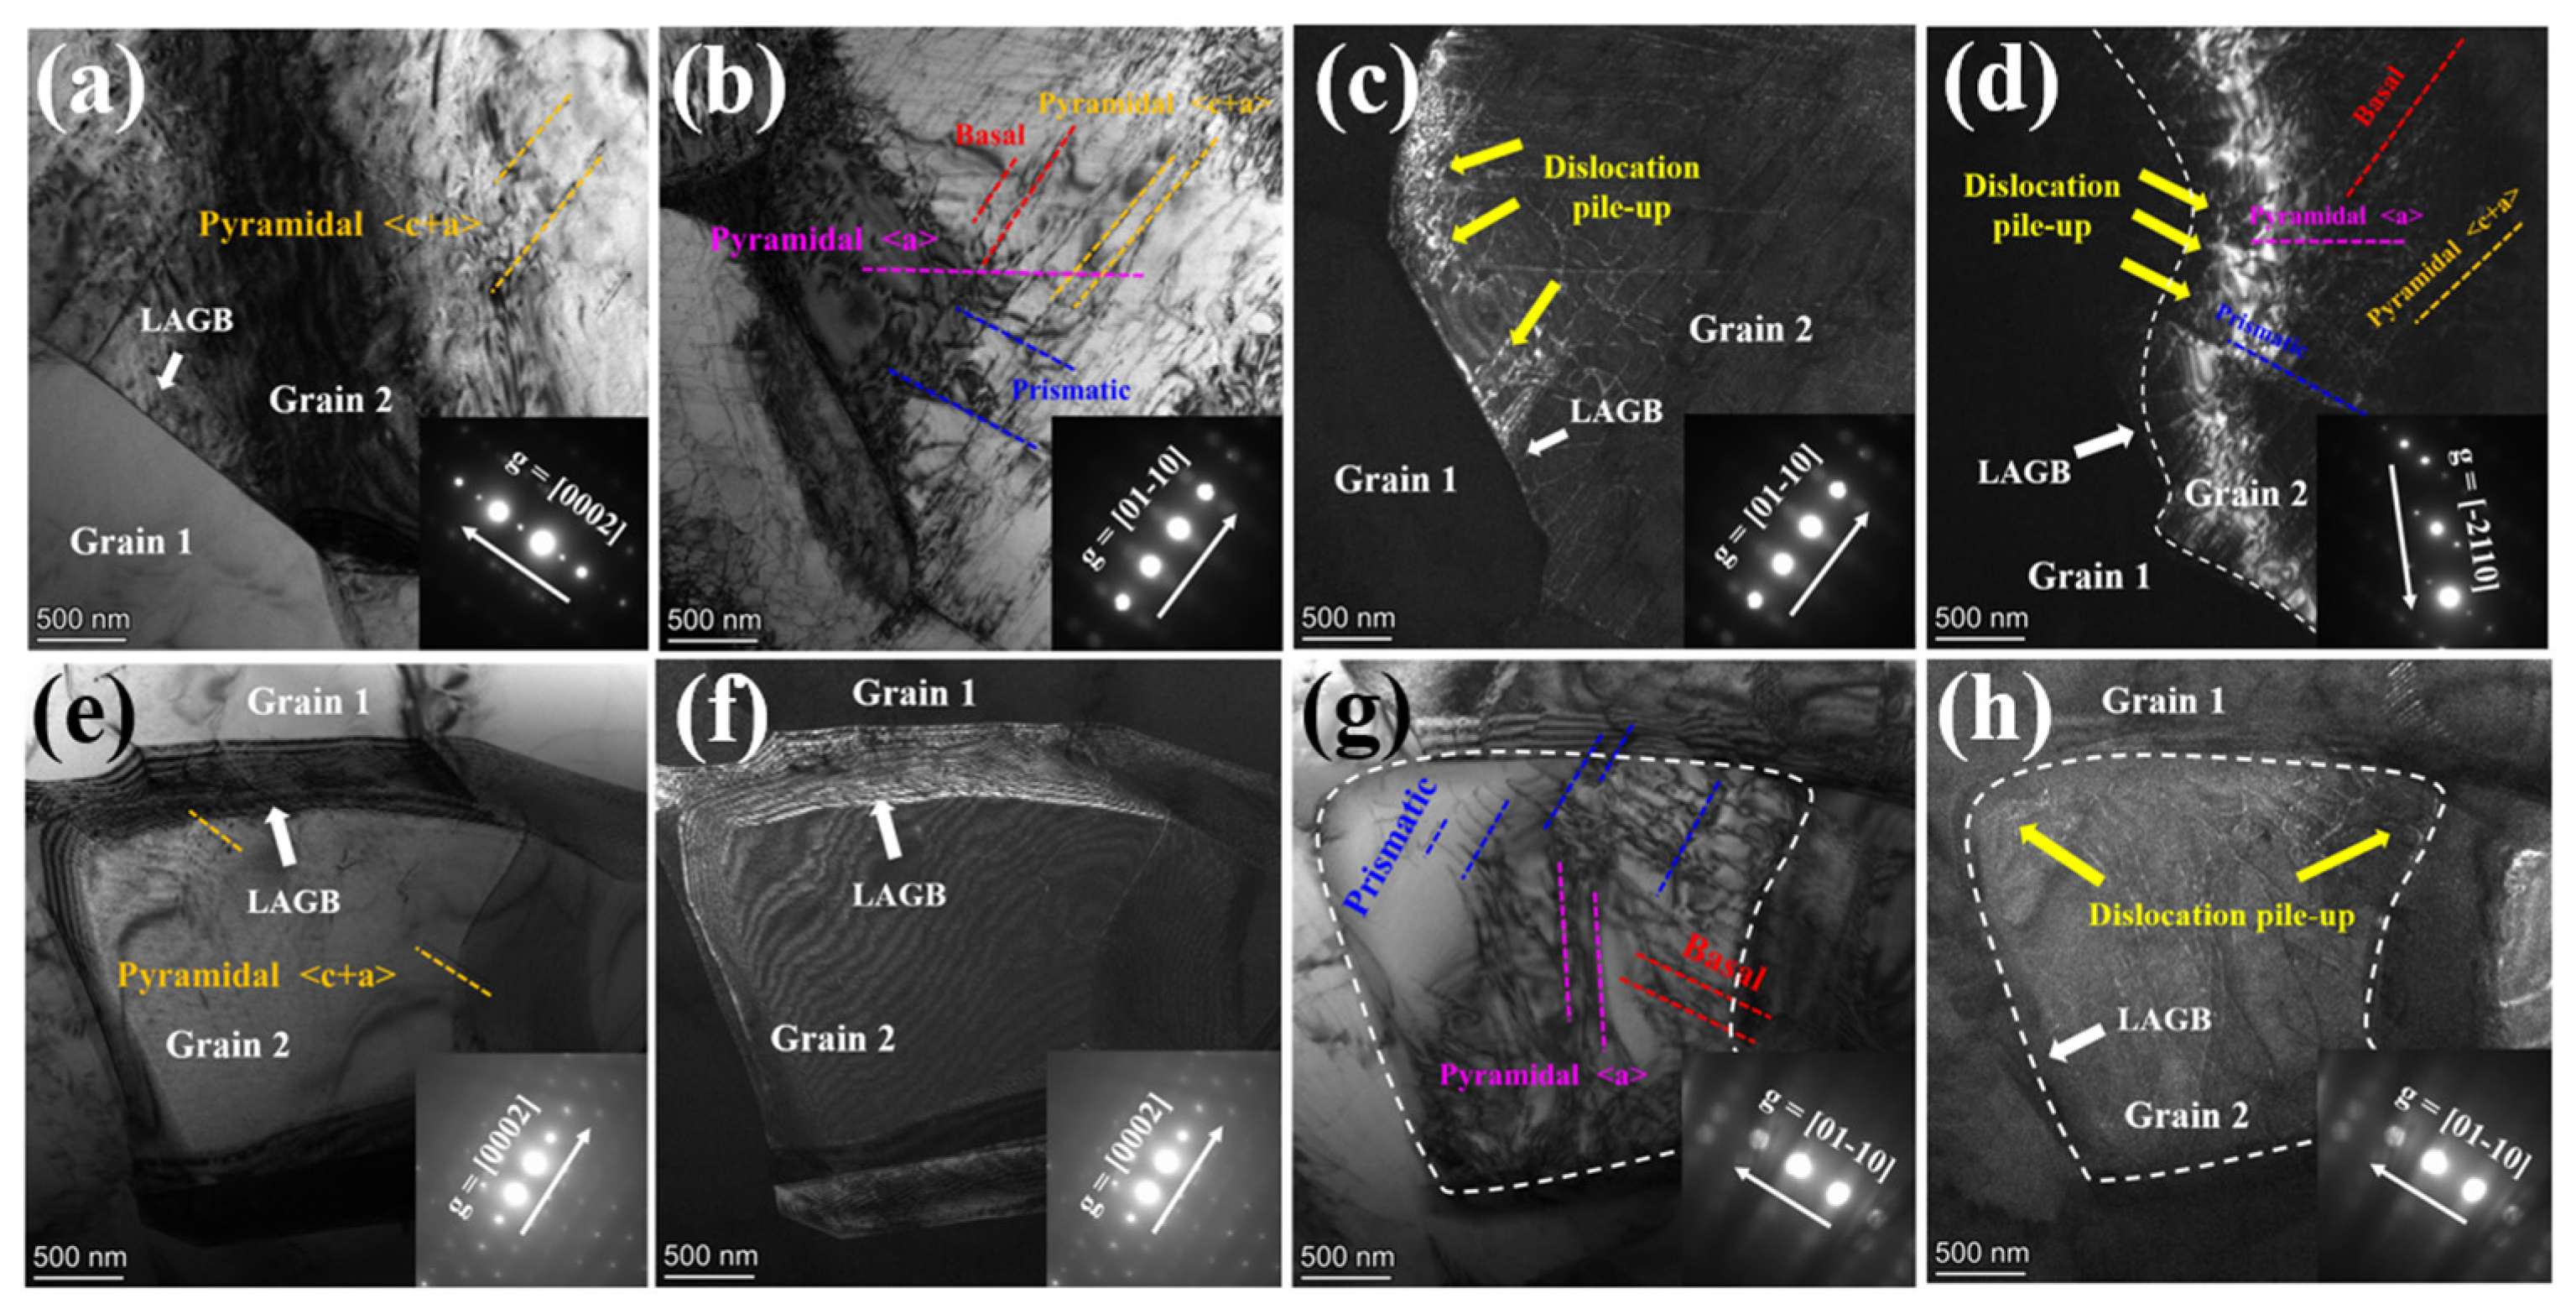
Previous studies have shown that primary α/α grain boundaries, primary α/β grain boundaries, and primary α/colony interfaces can impede effective dislocation transmission [33,39]. The blocked dislocations generate a large local misorientation at grain boundaries (Figure 6). Guo et al. [31] proposed that slip transfer at a grain boundary is triggered when the local inelastic stored-energy density caused by dislocation pile-up reaches equilibrium with the α/β interfacial energy. The slip traces in the RD and ND specimens clearly crossed grain boundaries in Figure 5, which rationalizes their higher creep strains. This behavior is mainly attributed to the Burgers orientation relationship between the α and β phases and the increase in local inelastic stored-energy density caused by dislocation pile-ups. To verify this interpretation, TEM observations were further performed to investigate dislocation configurations in the α phase with different loading conditions. Figure 11 shows the dislocation types directly observed after 10 min of creep using TEM two-beam g.b analysis. According to the g.b = 0 invisibility criterion, only dislocations containing a <c> component are visible with the reciprocal-lattice vector g = [0002]; only dislocations containing an <a> component are visible with g = [−2110] and g = [01-10]. In particular, <c+a> dislocations are visible under both of the latter two-beam conditions.
Figure 11.
TEM images of specimens with different orientations after creep deformation at 0.9 yield strength. (a–d) Rolling direction (RD); (e–h) Normal direction (ND). All images were acquired from approximately identical regions. The diffraction vectors used for imaging are marked in the figures, and the electron beam incidence direction is approximately <11-20>α.
Figure 11 shows representative TEM images of the RD and ND specimens after 10 min of creep at 0.9 YS, acquired under different two-beam conditions. Most dislocation lines were clearly visible. In the bright-field image acquired with g = [0002] (Figure 11a), clear long <c+a>-type pyramidal dislocations were observed. In the bright-field image acquired with g = [01-10] (Figure 11b), some basal and prismatic dislocations were found to pile up near grain boundaries. Different dislocation types are indicated by dashed lines of different colors. Basal, prismatic, and pyramidal dislocations were simultaneously activated in this specimen, with basal slip being dominant. Figure 11c and Figure 11d show dark-field images of the same region acquired with g = [01-10] and g = [−2110], respectively, revealing pronounced dislocation pile-ups at grain boundaries, which explains the increase in local inelastic stored-energy density. Figure 11e–f show TEM images of the ND specimen, in which multiple dislocation types were also activated and prismatic slip was dominant. Some pyramidal <c+a>, basal, and prismatic dislocations were observed to cross the boundary between grains 1 and 2 (Figure 11e,g), again owing to the increase in inelastic stored-energy density and the characteristic Burgers orientation relationship between the α and β phases. Figure 11h is a dark-field image of the ND specimen acquired with g = [01-10] and shows extensive dislocation pile-up at the grain boundary. These observations demonstrate that, after deformation, the RD and ND specimens developed a large number of dislocations inside α grains and pronounced dislocation pile-ups at α/β interfaces, accounting for their higher creep strains.
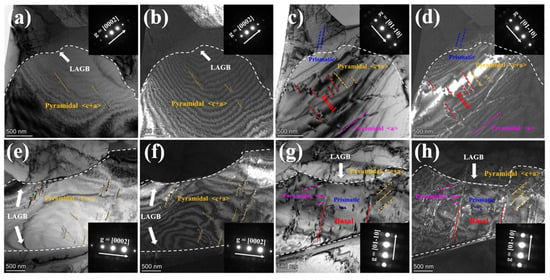
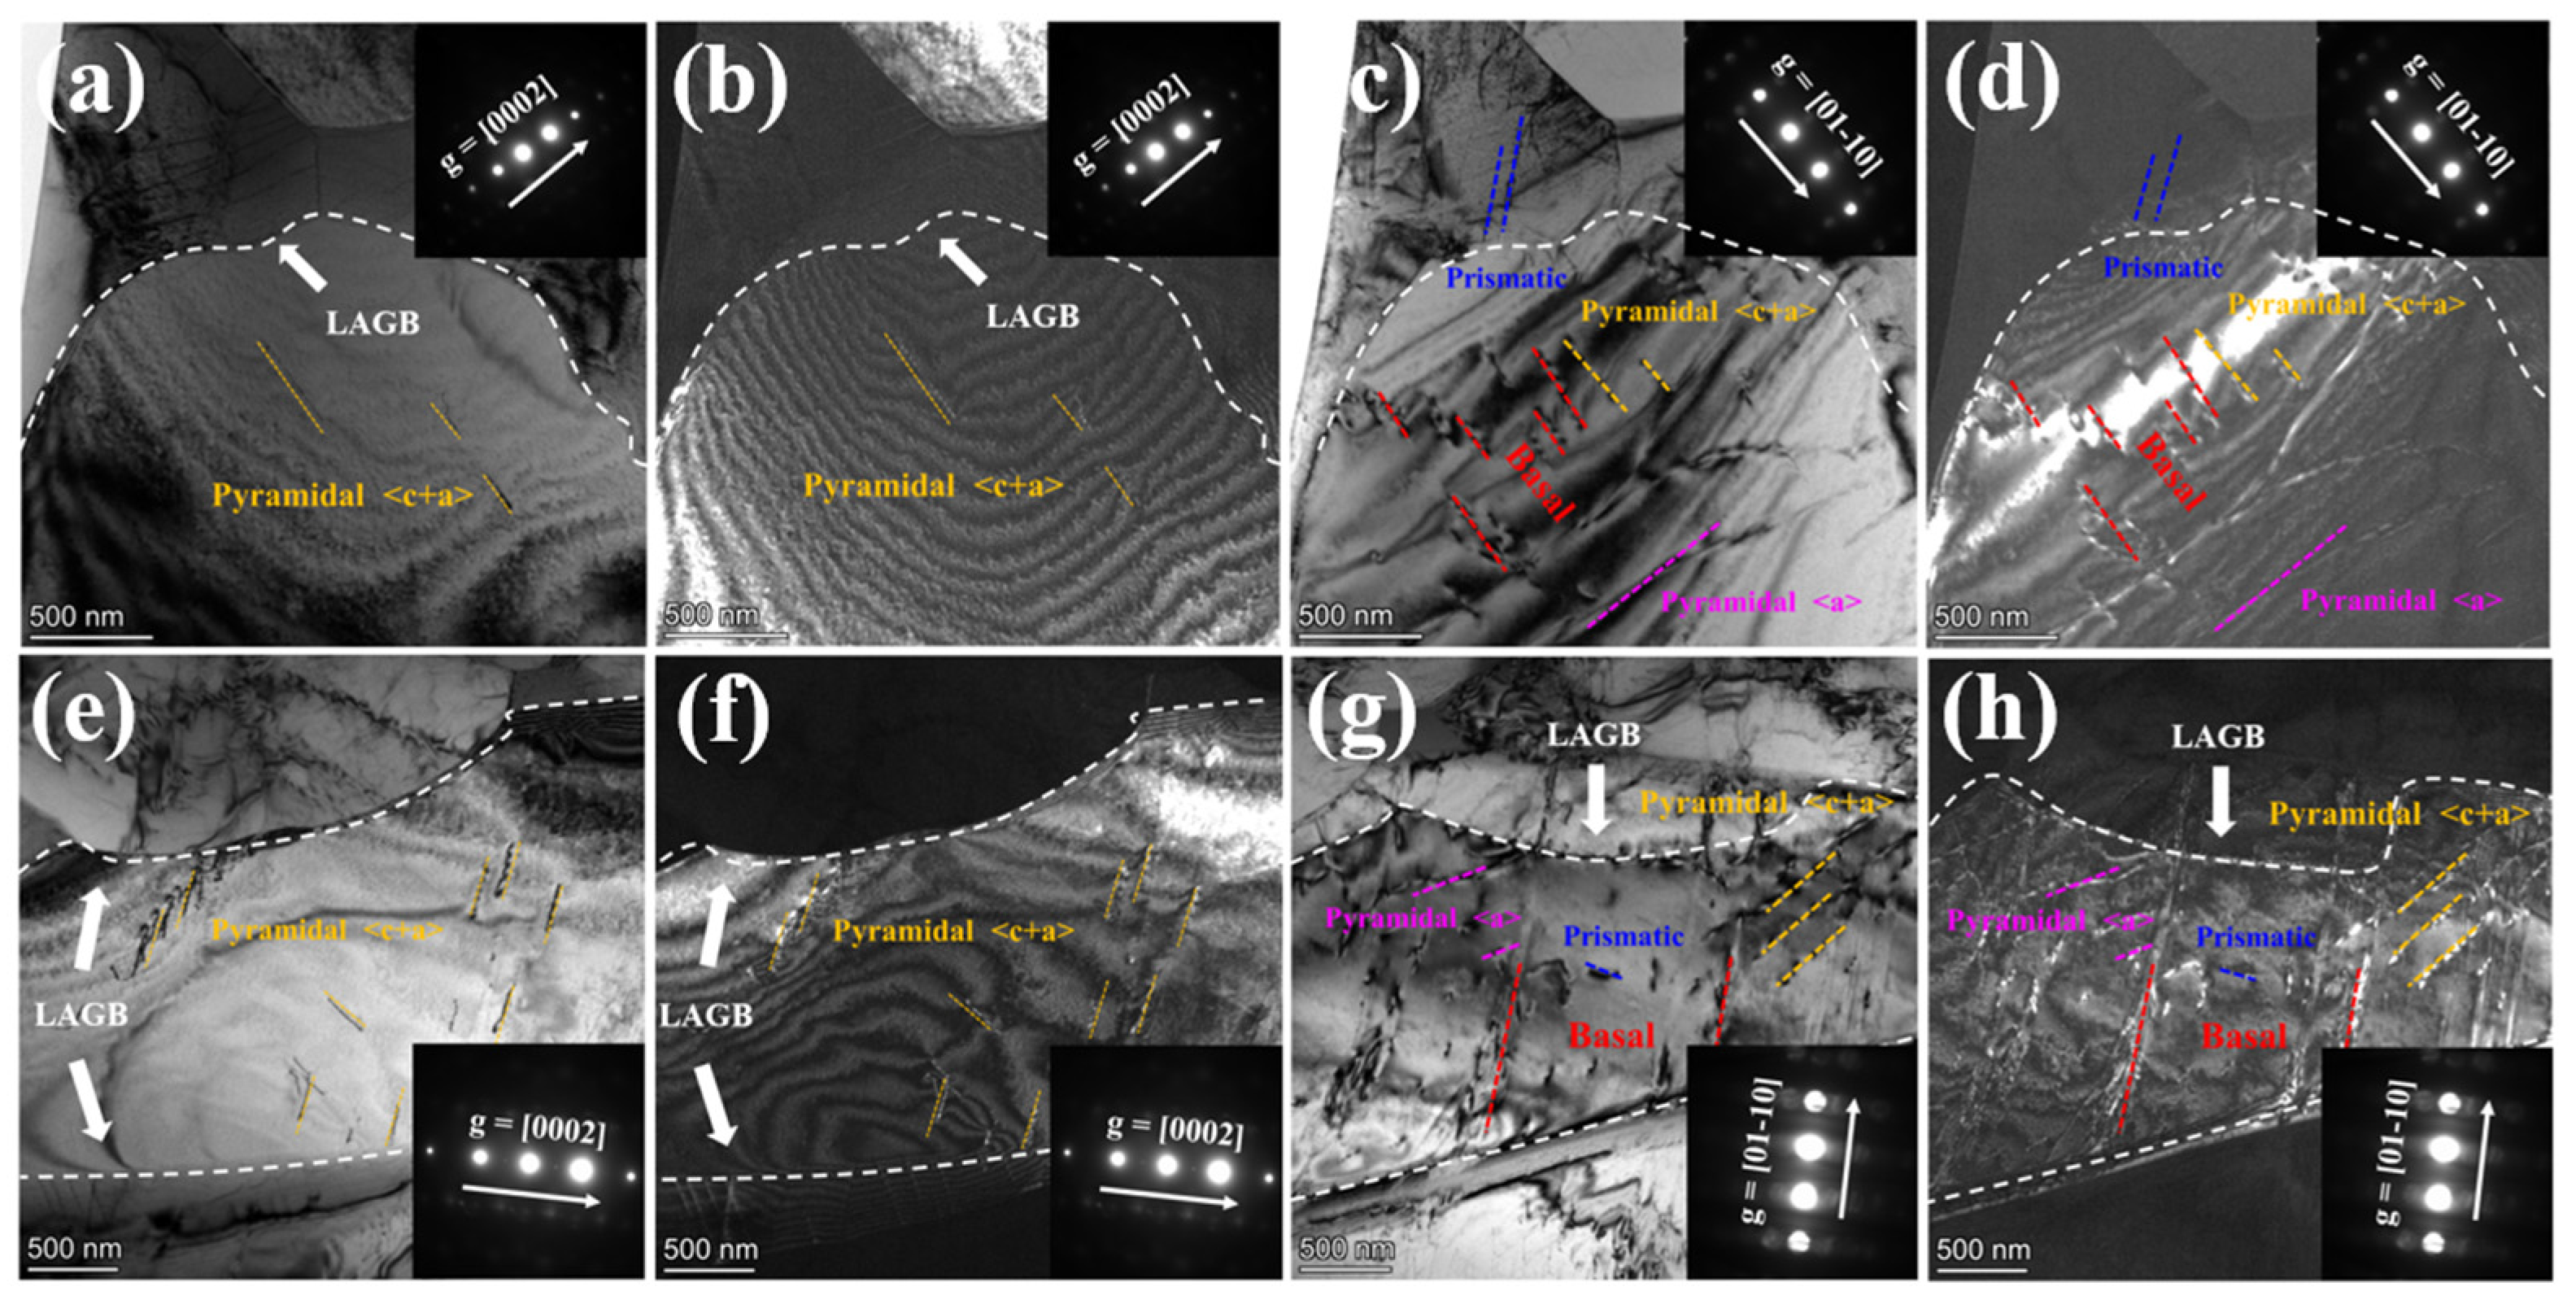
Figure 12 shows the TEM observations of dislocation characteristics in the 45-degree and TD specimens after creep at 0.9 YS. Figure 12a–d show the 45-degree specimen, and Figure 12e–h show the TD specimen. Multiple slip systems, including basal, prismatic, and pyramidal slip, were activated in both orientations. A large number of basal dislocations were observed in the 45-degree specimen under g = [01-10] (Figure 12c,d), whereas the TD specimen activated more pyramidal <c+a> slip, consistent with the actual slip-system activity obtained from the EBSD statistics in Figure 9. The activation of pyramidal dislocations is also evidenced by Xu [40]. Compared with the RD and ND specimens, these two orientations contained fewer and shorter dislocations, resulting in lower dislocation mobility and preventing long-range motion through the microstructure. Consequently, most dislocations were confined within individual grains, and no dislocation transmission across grain boundaries was observed. Unlike the RD and ND specimens, pronounced dislocation pile-ups were not observed at grain boundaries in these two orientations. Their local inelastic stored-energy density was therefore lower and did not reach equilibrium with the grain-boundary energy, preventing extensive cross-boundary dislocation transmission. This explains the lower creep strains of the 45-degree and TD specimens compared with the RD and ND specimens.
Figure 12.
TEM images of specimens with different orientations after creep deformation at 0.9 yield strength. (a–d) 45° direction; (e–h) Transverse direction (TD);. All images were acquired from approximately identical regions. The diffraction vectors used for imaging are marked in the figures, and the electron beam incidence direction is approximately <11-20>α.
4.3. Analysis of Creep Anisotropy Mechanism
As shown in Section 4.1 and Section 4.2, the activated slip systems differed remarkably in these textured specimens. The RD specimen activated relatively large fractions of basal and prismatic slip, whereas prismatic slip dominated in the ND specimen. The dislocations activated in both orientations were relatively long and readily propagated. However, the RD specimen accumulated more plastic strain and therefore exhibited higher creep strain and creep strain rate. Basal slip and pyramidal slip dominated in the 45-degree and TD specimens, respectively; the dislocations in these specimens were shorter and more difficult to extend. Their plastic-strain accumulation was lower than that in the RD and ND specimens, indicating weaker dislocation pile-up, a local inelastic stored-energy density below the interfacial energy, and impeded dislocation propagation. Consequently, their creep strains and creep rates were lower. Because plastic-strain accumulation in the TD specimen was greater than that in the 45-degree specimen, its creep strain and creep rate were consistently higher.
To quantitatively describe the driving force for dislocation motion and the creep rate in specimens with different orientations, the evolution of the true stress state during creep and a uniaxial microstructural creep-rate model are considered. To account for the Poisson effect during compression, an equivalent-stress coefficient eta was used to describe the evolution of equivalent stress during creep in the different orientations, as follows [31]:
Here, σ′eq and σeq represent the true equivalent stress and engineering equivalent stress during creep, respectively. They can be calculated using Equation (5), based on the von Mises yield criterion, proposed by Guo et al. [31] from tensile, compressive, and torsional tests, as follows:
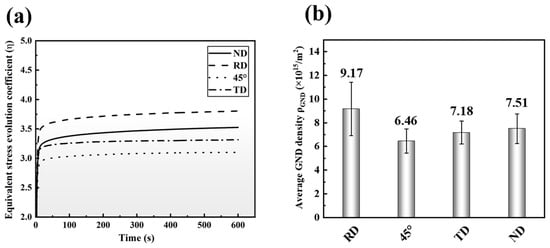
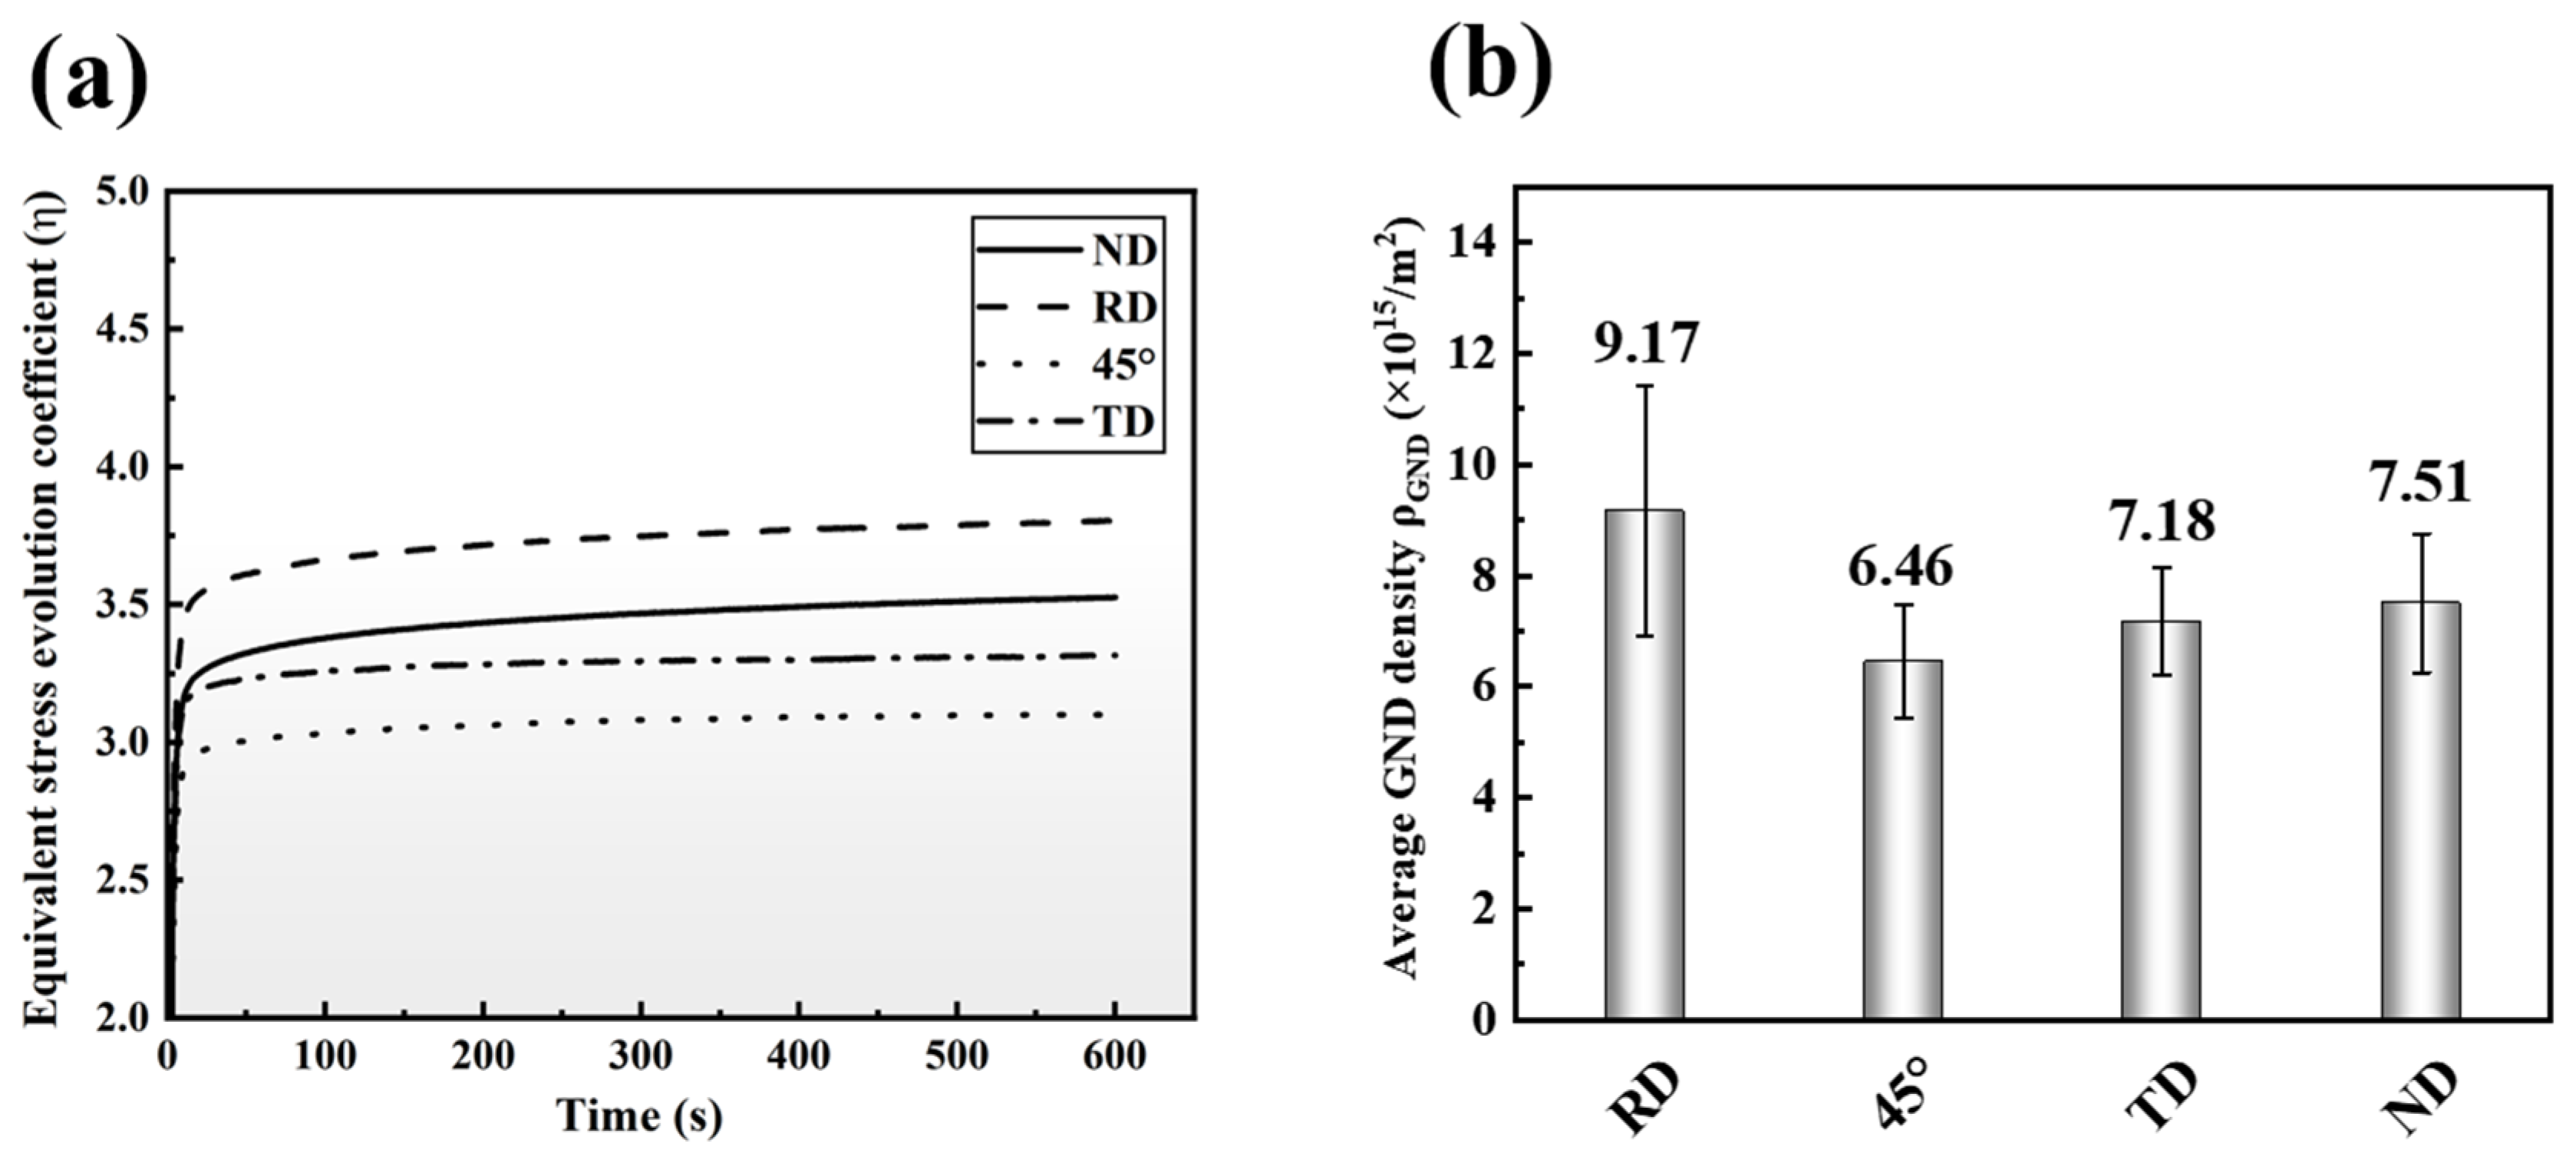
Here, σ0 is the engineering stress during creep, and represents the shear stress (0 MPa in the present study). Figure 13a shows the variation in eta with time for the ND, RD, 45-degree, and TD specimens at 0.9 YS. As creep strain continuously increased, the true compressive stress increased in all specimens by the end of the 600 s creep test. The increase was largest in the RD specimen, approximately 490 MPa, followed by the ND specimen at approximately 420 MPa, the TD specimen at approximately 280 MPa, and the 45-degree specimen at only approximately 170 MPa. Thus, the driving force for dislocation motion followed the order RD > ND > TD > 45-degree, consistent with the ranking of creep strain. Previous studies have shown that a microstructural constitutive creep model developed for single-peak precipitation-strengthened alloys can simulate the effect of internal stress on compressive creep behavior, as expressed below [41]:
Figure 13.
(a) Variation curves of η value with time t for specimens of different orientations at 0.9 yield strength; (b) Calculated average geometrically necessary dislocation (GND) density.
Here, Q is the activation energy for dislocation motion; R is the ideal gas constant; T is the thermodynamic temperature; σeq,t is the true equivalent stress during creep; σeq.0t is the creep strength of the alloy; ε·0′ is a variable rate parameter that is positively correlated with the mobile dislocation density; and σeq,t and σeq.0t are approximately equal at the initial time. Guo et al. found that the hyperbolic sine function varies slightly during the early creep stage at room temperature (60 h), which can be approximately regarded as a constant value of 1 [31]. Because all orientations were tested at room temperature, the mobile dislocation density became the key factor controlling the creep rate. Comparison of the four orientations shows that the KAM of the RD specimen was greater than that of the ND specimen, followed by the TD and 45-degree specimens (Figure 7). A larger KAM is generally associated with a higher geometrically necessary dislocation (GND) density. The GND density was calculated using the following expression (Figure 13b):
Here, l is the EBSD scan step size and b is the magnitude of the Burgers vector of the dislocation type with the largest fraction in each orientation. The geometrically necessary dislocation (GND) density of specimens under compressive creep follows the order: rolling direction (RD, 9.17 × 10¹⁵/m2) > normal direction (ND, 7.51 × 10¹⁵/m2) > transverse direction (TD, 7.18 × 10¹⁵/m2) > 45° direction (45, 6.46 × 10¹⁵/m2). EBSD and TEM observations reveal that no extensive dislocation tangles or low-angle grain boundaries (LAGBs) form in Ti6321 specimens with different orientations at an early creep stage when the creep strain is less than 5%. According to Guo [31], the enhanced GND density implies more significant activation of mobile dislocations during creep. Therefore, it can be inferred that the mobile dislocation density follows the sequence: RD specimen > ND specimen > TD specimen > 45° specimen. Equation (6) therefore predicts a creep-rate sequence of RD > ND > TD > 45°. The above-mentioned analysis quantitatively characterizes the evolution of true stress related to the driving force for dislocation motion, as well as the magnitude of geometrically necessary dislocation density governing the creep rate. It reveals the intrinsic mechanism of creep anisotropy for specimens with different orientations of rolled Ti6321 alloy plate from the microscopic perspective.
5. Conclusions
This study investigated the anisotropic creep behaviors of a rolled near-α Ti6321 alloy at room temperature along the rolling direction (RD), the direction 45 degrees to the RD, the transverse direction (TD), and the normal direction (ND). The dependence of creep strain and creep rate on loading orientation was analyzed. By combining the evolution of the microstructure and activated dislocations, the room-temperature creep mechanism and its anisotropic characteristics were clarified. The main conclusions are as follows.
- (1)
- The rolled Ti6321 alloy exhibited an anisotropic creep tendency. The RD and ND specimens possessed higher creep strain compared with the TD and 45-degree ones. Although all systems, i.e., basal, prismatic, and pyramidal slip systems, could be detected in all orientated specimens, the dislocation activity and pile-ups in RD and ND cases were more significant.
- (2)
- In the RD, 45-degree, and ND specimens, the local stress generated by accumulated misorientation in the α phase caused the experimentally activated slip systems to deviate from Schmid’s law. As the TD specimen had the lowest local stress (ʋKAM = 0.0429), its experimentally observed slip-system activation agreed most closely with Schmid’s law.
- (3)
- The dislocation mechanisms of anisotropic creep strain and creep rate of investigated Ti6321 alloy were unveiled. The dislocations propagating more readily along grain boundaries in RD and ND cases facilitated the strain accumulation. The true stress and mobile dislocation density, following the RD > ND > TD > 45° sequence, determined the creep rate.
Supplementary Materials
The following supporting information can be downloaded at https://www.mdpi.com/article/10.3390/met16101145/s1, Figure S1: EBSD orientation distribution maps of specimens with different orientations after 10 min of creep; Figure S2: EBSD orientation distribution maps of initial microstructure of rolled specimens with different orientations.
Author Contributions
P.C.: Conceptualization, Investigation, Writing—Original Draft Preparation, Project Administration, Funding Acquisition. C.W.: Conceptualization, Resources, Writing—Review and Editing, Project Administration, Funding Acquisition. L.C.: Methodology, Resources, Writing—Review and Editing, Funding Acquisition. H.Z.: Methodology, Investigation, Writing—Original Draft Preparation. S.L.: Investigation, Writing—Original Draft Preparation. All authors have read and agreed to the published version of the manuscript.
Funding
This research was funded by the Research Fund of State Key Laboratory of Marine Corrosion and Protection of Luoyang Ship Material Research Institute under the contract No. GJK2404.
Data Availability Statement
The original contributions presented in this study are included in the article/Supplementary Materials. Further inquiries can be directed to the corresponding author.
Acknowledgments
The authors thank Y. Man and D. Feng from Shaanxi Materials Analysis and Research Center and Analytical & Testing center of Northwestern Polytechnical University, respectively, for technical assistance with the microstructure characterization.
Conflicts of Interest
Pei Chen was employed by the State Key Laboratory of Marine Corrosion and Protection, Luoyang Ship Material Research Institute, Luoyang 471023, China. The remaining authors declare that the research was conducted in the absence of any commercial or financial relationships that could be construed as a potential conflict of interest.
References
- Zhang, B.; Wan, Z. Fracture mechanism and failure strain of TA31 titanium alloy for deep-sea pressure hulls based on continuum damage mechanics. Front. Mater. 2023, 10, 1117520. [Google Scholar] [CrossRef] [Scilit]
- Zhang, S.; Cong, B.; Zeng, Z.; Liu, Y.; Chai, L. Tailoring weldability for microstructures in laser-welded near-α titanium alloy: Insights on mechanical properties. Metals 2024, 14, 690. [Google Scholar] [CrossRef] [Scilit]
- Huang, F.; Zhu, Y.; Yu, M.; Wen, L.; Jin, Y. Synergistic Effects of Hydrostatic Pressure and Dissolved Oxygen on the SCC Behavior of Hydrogenated Ti6Al4V Alloy in Deep-Sea Environment. Metals 2023, 13, 449. [Google Scholar] [CrossRef] [Scilit]
- Peng, J.; Zhou, C.Y.; Dai, Q.; He, X.H. The temperature and stress dependent primary creep of CP-Ti at low and intermediate temperature. Mater. Sci. Eng. A 2014, 611, 123–135. [Google Scholar] [CrossRef] [Scilit]
- Sun, C.; Li, Y.; Xu, K.; Xu, B. Effects of intermittent loading time and stress ratio on dwell fatigue behavior of titanium alloy Ti-6Al-4V ELI used in deep-sea submersibles. J. Mater. Sci. Technol. 2021, 77, 223–236. [Google Scholar] [CrossRef] [Scilit]
- Zhang, W.; Liu, Y.; Wu, H.; Lan, X.D.; Qiu, J.; Hu, T.; Tang, H.P. Room temperature creep behavior of Ti-Nb-Ta-Zr-O alloy. Mater. Charact. 2016, 118, 29–36. [Google Scholar] [CrossRef] [Scilit]
- Neeraj, T.; Hou, D.H.; Daehn, G.S.; Mills, M. Phenomenological and microstructural analysis of room temperature creep in titanium alloys. Acta Mater. 2000, 48, 1225–1238. [Google Scholar] [CrossRef] [Scilit]
- Thompson, A.W.; Odegard, B.C. The influence of microstructure on low temperature creep of ti-5 al-2.5 sn. Metall. Trans. 1973, 4, 899–908. [Google Scholar] [CrossRef] [Scilit]
- Imam, M.A.; Gilmore, C.M. Room temperature creep of Ti-6AI-4V. Metall. Trans. A 1979, 10, 419–425. [Google Scholar] [CrossRef] [Scilit]
- Zhang, M.; Qiu, J.; Fang, C.; Zhang, M.; Yang, Z.; Lei, J. Effect of texture on the room temperature tensile and creep properties of Ti-6Al-4V plate with large thickness. J. Mater. Res. Technol. 2024, 30, 2311–2321. [Google Scholar] [CrossRef] [Scilit]
- Arohi, A.C.; Shekhar, S.; Sen, I. Microstructural effects on the ambient temperature indentation creep behavior of metastable β Ti-5Al-5V-5Mo-3Cr alloy. Mater. Today Commun. 2024, 38, 107834. [Google Scholar] [CrossRef] [Scilit]
- Yu, X.; Xuan, W.; Zhang, C.; Zhang, X.; Wang, X.; Zhao, Y.; Wang, B.; Li, H.; Bao, J.; Ren, Z. An insight into the creep failure mechanism of sliver defect in the second-generation nickel-based single crystal superalloy CMSX-4. Eng. Fract. Mech. 2024, 307, 110307. [Google Scholar] [CrossRef] [Scilit]
- Suryawanshi, J.; Singh, G.; Msolli, S.; Jhon, M.H.; Ramamurty, U. Tension-compression asymmetry and shear strength of titanium alloys. Acta Mater. 2021, 221, 117392. [Google Scholar] [CrossRef] [Scilit]
- Guo, Y.; Liu, G.; Song, Y. Creep behavior of titanium alloy used in deep-sea pressure shell considering tensile/compressive asymmetry: Experiments and numerical modeling. Ocean Eng. 2023, 288, 116095. [Google Scholar] [CrossRef] [Scilit]
- Neeraj, T.; Savage, M.F.; Tatalovich, J.; Kovarik, L.; Hayes, R.; Mills, M. Observation of tension–compression asymmetry in α and titanium alloys. Philos. Mag. 2005, 85, 279–295. [Google Scholar] [CrossRef] [Scilit]
- Kassner, M.E. Taylor hardening in five-power-law creep of metals and Class M alloys. Acta Mater. 2004, 52, 1–9. [Google Scholar] [CrossRef] [Scilit]
- Wang, X.G.; Liu, J.L.; Jin, T.; Sun, X.; Hu, Z.; Do, J.; Choi, B.; Kim, I.; Jo, C. Dislocation motion during high-temperature low-stress creep in Ru-free and Ru-containing single-crystal superalloys. Mater. Des. 2015, 67, 543–551. [Google Scholar] [CrossRef] [Scilit]
- Zhou, C.; Zhan, L.; Liu, C.; Huang, M. Dislocation density-mediated creep ageing behavior of an Al-Cu-Li alloy. J. Mater. Sci. Technol. 2024, 174, 204–217. [Google Scholar] [CrossRef] [Scilit]
- Sahoo, R.; Jha, B.B.; Sahoo, T.K. Effect of microstructure on the creep properties of Ti–6Al–4V alloys: An analysis. Trans. Indian Inst. Met. 2018, 71, 1573–1582. [Google Scholar] [CrossRef] [Scilit]
- Colla, M.S.; Amin-Ahmadi, B.; Idrissi, H.; Malet, L.; Godet, S.; Raskin, J.-P.; Schryvers, D.; Pardoen, T. Dislocation-mediated relaxation in nanograined columnar palladium films revealed by on-chip time-resolved HRTEM testing. Nat. Commun. 2015, 6, 5922. [Google Scholar] [CrossRef] [Scilit] [PubMed]
- Li, C.; Sun, J.; Feng, A.; Wang, H.; Zhang, X.; Zhang, C.; Zhao, F.; Cao, G.; Qu, S.; Chen, D. Active slip mode analysis of an additively manufactured Ti-6Al-4V alloy via in-grain misorientation axis distribution. Metals 2022, 12, 532. [Google Scholar] [CrossRef] [Scilit]
- Bache, M.R.; Evans, W.J. Impact of texture on mechanical properties in an advanced titanium alloy. Mater. Sci. Eng. A 2001, 319, 409–414. [Google Scholar] [CrossRef] [Scilit]
- Rahman, S.A.; Sisodia, S.; Kumar, S.; Prakash, O.; Chauhan, A. Room-temperature creep anisotropy in hot-rolled commercially pure titanium plate. Philos. Mag. 2025, 105, 376–395. [Google Scholar] [CrossRef] [Scilit]
- Yazar, K.U.; Shamitha, M.; Suwas, S. Texture-dependent dwell fatigue response of titanium. Philos. Mag. 2021, 101, 1443–1470. [Google Scholar] [CrossRef] [Scilit]
- Zhang, W.; Fan, J.; Huang, H.; Xue, X.; Wang, Y.; Zhang, B.; Jiang, P.; Wang, C.; Kou, H.; Li, J. Creep anisotropy characteristics and microstructural crystallography of marine engineering titanium alloy Ti6321 plate at room temperature. Mater. Sci. Eng. A 2022, 854, 143728. [Google Scholar] [CrossRef] [Scilit]
- Li, W.; Chen, Z.; Liu, J.; Wang, Q.; Sui, G. Effect of texture on anisotropy at 600° C in a near-α titanium alloy Ti60 plate. Mater. Sci. Eng. A 2017, 688, 322–329. [Google Scholar] [CrossRef] [Scilit]
- Zhang, Z.; Fan, J.; Li, R.; Kou, H.; Chen, Z.; Wang, Q.; Zhang, H.; Wang, J.; Gao, Q.; Li, J. Orientation dependent behavior of tensile-creep deformation of hot rolled Ti65 titanium alloy sheet. J. Mater. Sci. Technol. 2021, 75, 265–275. [Google Scholar] [CrossRef] [Scilit]
- Yan, S.C.; Wu, Y.K.; Shang, L.; Ren, J.; Zhang, Y.; Xin, C.; Wang, Q.; Ai, T. Compressive creep damage of Ti–6Al–4V ELI alloy with bimodal structure at room temperature. J. Mater. Res. Technol. 2024, 33, 4899–4907. [Google Scholar] [CrossRef] [Scilit]
- Sathe, A.K.; Kumar, D.A.; Mehta, K.; Saxena, A.K.; Barnwal, V.K.; Reddy, S.T.; Suwas, S.; Choi, S.-H.; Yazar, K. Mitigating room-temperature tensile and creep anisotropy in laser powder bed fusion processed Ti6Al4V by modulating slip activity and intervariant boundary distribution through post-printing heat treatment. Acta Mater. 2025, 299, 121454. [Google Scholar] [CrossRef] [Scilit]
- Dichtl, C.; Lunt, D.; Atkinson, M.; Thomas, R.; Plowman, A.; Barzdajn, B.; Sandala, R.; da Fonseca, J.Q.; Preuss, M. Slip activity during low-stress cold creep deformation in a near-α titanium alloy. Acta Mater. 2022, 229, 117691. [Google Scholar] [CrossRef] [Scilit]
- Guo, Y.; Zhang, B.; Zhou, L.; Li, J. Creep strain and stress state-dependent creep asymmetry during early-stage room-temperature creep in a titanium alloy. J. Mater. Sci. Technol. 2026, 243, 1–14. [Google Scholar] [CrossRef] [Scilit]
- Xu, R.; Li, Y.; Yu, H. Microstructure evolution and dislocation mechanism of a Third-Generation single-crystal Ni-based superalloy during creep at 1170 °C. Materials 2023, 16, 5166. [Google Scholar] [CrossRef] [Scilit] [PubMed]
- Sahoo, R.; Jha, B.B.; Sahoo, T.K. Effect of primary alpha phase variation on mechanical behaviour of Ti–6Al–4V alloy. Mater. Sci. Technol. 2015, 31, 1486–1494. [Google Scholar] [CrossRef] [Scilit]
- Lu, L.; Zhang, Y.; Song, K.; Guo, X.; Li, Y.; Li, S.; Zhou, F. Structural characterization and nanoscale strain field analysis of α/β interface layer of a near α titanium alloy. Nanotechnol. Rev. 2021, 10, 1197–1207. [Google Scholar] [CrossRef] [Scilit]
- Hu, Y.; Shi, M.; Lian, S.; Ma, Y.; Wang, J.; Li, S.; Yuan, F.; Li, N.; Yue, Z. Deformation Mechanisms Study of Heterostructured Ti-80 Alloy Based on Crystal Plasticity Theory. J. Mater. Res. Technol. 2026, 41, 1654–1670. [Google Scholar] [CrossRef] [Scilit]
- Lunt, D.; Thomas, R.; Atkinson, M.D.; Smith, A.; Sandala, R.; da Fonseca, J.Q.; Preuss, M. Understanding the role of local texture variation on slip activity in a two-phase titanium alloy. Acta Mater. 2021, 216, 117111. [Google Scholar] [CrossRef] [Scilit]
- Wang, L.; Zheng, Z.; Phukan, H.; Kenesei, P.; Park, J.-S.; Lind, J.; Suter, R.; Bieler, T. Direct measurement of critical resolved shear stress of prismatic and basal slip in polycrystalline Ti using high energy X-ray diffraction microscopy. Acta Mater. 2017, 132, 598–610. [Google Scholar] [CrossRef] [Scilit]
- Ma, Z.C.; Tang, X.Z.; Mao, Y.; Guo, Y.-F. The plastic deformation mechanisms of hcp single crystals with different orientations: Molecular dynamics simulations. Materials 2021, 14, 733. [Google Scholar] [CrossRef] [Scilit] [PubMed]
- Zhou, Y.; Wang, K.; Yan, Z.; Xin, R.; Wei, S.; Wang, X.; Liu, Q. Ex-situ study on mechanical properties and deformation mechanism of three typical microstructures in TA19 titanium alloy. Mater. Charact. 2020, 167, 110521. [Google Scholar] [CrossRef] [Scilit]
- Xu, L.; Wang, Y.; Wang, Q.; Jiang, P.; Liao, Z. Study on compressive creep behavior at room temperature and dislocation type of Ti-6Al-3Nb-2Zr-1Mo alloy. Dev. Appl. Mater. 2021, 36, 17–23. [Google Scholar]
- Sondhi, S.K.; Dyson, B.F.; McLean, M. Tension–compression creep asymmetry in a turbine disc superalloy: Roles of internal stress and thermal ageing. Acta Mater. 2004, 52, 1761–1772. [Google Scholar] [CrossRef] [Scilit]

Disclaimer/Publisher’s Note: The statements, opinions and data contained in all publications are solely those of the individual author(s) and contributor(s) and not of MDPI and/or the editor(s). MDPI and/or the editor(s) disclaim responsibility for any injury to people or property resulting from any ideas, methods, instructions or products referred to in the content. |
© 2026 by the authors. Licensee MDPI, Basel, Switzerland. This article is an open access article distributed under the terms and conditions of the Creative Commons Attribution (CC BY) license.