


Abstract
The evolution of mold flux performance in the mold induced by tundish flux drainage is important for understanding mold flux failure, yet few studies address this issue. This study systematically investigates and elucidates the relationship between tundish flux drainage and mold flux performance in the mold. As the drainage ratio increases from 0 to 1.25, the mold flux viscosity at 1300 °C rises from 0.4 to above 1.0 Pa·s, impairing lubrication. Meanwhile, the average heat flux density decreases from 0.973 to 0.682 MW/m2, resulting in a thinner initial solidified shell. The crystallization temperature increases from 994 to 1340 °C, reducing the liquid slag film thickness. The primary crystalline phase changes from Ca4Si2F2O7 to Ca2Al2SiO7 and Na2CaAl4O8, both of which have high melting temperatures. These changes in lubrication, heat transfer, and crystallization behavior significantly increase the frictional force acting on the initial solidified shell and reduce its resistance to tearing, thereby promoting breakouts.
1. Introduction
Mold flux is closely linked to the smooth operation of continuous casting processes and enhancing the quality of cast slabs through providing lubrication, controlling heat transfer, etc. The lubrication and heat transfer performance in the mold are strongly associated with the viscosity and crystallization properties of the mold flux [1,2]. Although different steel grades, casting speeds, and cross-sections of slabs have different requirements for viscosity, crystallization and heat transfer, the excessive change in these properties inevitably cause the mold flux to deviate from its designed optimal performance, resulting cracking and breakout, thereby degrading the surface quality of cast products and casting process.
Many factors affect the in-mold performance of mold flux. These factors can be divided into two categories, one involves the influence of chemical composition, including the composition control in the mold flux’s design itself [3,4,5,6], as well as changes in composition resulting from slag-steel reactions and inclusion absorption during the continuous casting of steel grades with high aluminum [7,8], high manganese [9,10], high titanium [11] and high rare earth content, etc. [12]. The second category involves external field effects, such as the thermal history (temperature field) experienced by the mold flux in the gap between the mold and the solidified shell [8,13], as well as the effects of electric fields [14,15], magnetic fields [15], and electrical pulses [16,17] used to control molten steel flow and solidification. Extensive research has been conducted to elucidate the effects of these factors on mold flux performance.
In addition to these studies, drainage of tundish flux into the mold will also cause significant compositional change in mold flux. The instability of tundish bath level control during continuous casting is a primary factor causing the drainage of tundish flux into mold flux. Tundish always act as a reservoir and distributor during continuous casting. Under normal conditions, tundish flux uniformly spreads on the molten steel surface, stabilizing the continuous casting process through functions like inclusion absorption, oxidation prevention, and temperature maintenance. In actual continuous casting, sometimes the tundish bath level continuously drops below a critical threshold, molten steel can generate a vortex effect during tundish change for long sequence casting or late stage of tundish pouring [18]. It is especially frequently accompanied by the operation of reducing residual steel in tundish as much as possible. This phenomenon disrupts the interfacial stability between tundish flux and steel, forcing tundish flux to breach equilibrium and become entrained into the mold. Much attention has been paid to the effect of tundish flux drainage on cleanliness of liquid steel. Occurrence of breakouts is usually attributed to great level fluctuation during the process. The effect of tundish flux drainage on mold flux is ignored.
Typically, tundish flux has a different chemical composition from mold flux, especially high-basicity tundish flux. The quantity of mold flux on molten steel surface is about 10~20 kg. Once tundish flux drainage occurs, the quantity is often greater than that of mold flux in the mold. Mixture of tundish flux and mold flux will introduce a holistic compositional perturbation into the mold flux, inevitably alters the mold flux composition and performance simultaneously. Although previous studies have mainly examined the effects of single or dual components on the physicochemical properties of mold flux [3,4,5,6,7,8,9,10,11,12], such a compositional footprint differs substantially from the isolated component variations considered in most previous studies, and its effects on in-mold performance of mold flux have not yet been fully quantified.
Against this backdrop, the present work pays attention to the tundish flux drainage-induced in-mold performance evolution of mold flux, investigating the effects of tundish flux drainage on the viscosity, heat transfer and crystallization performance of mold flux. Rotating spindle viscometer, heat transfer experiments, DSC, micro-XRD and SEM–EDS were combined to clarify the relationship between tundish flux drainage ratio, compositional variation, and in-mold performance of mold flux. Combined with the property evolution of mold flux, the breakouts mechanism was clarified through introducing the established relationship. The results provide deep insights into understanding mold flux deterioration caused by tundish flux drainage, and update the traditional understanding of how tundish flux drainage cause breakouts.
2. Experiment
2.1. Sample Preparation
The experimental samples are designed as mixtures of mold flux and tundish flux. According to industrial practice, the samples considering varying drainage of tundish flux was designed through mixing mold flux of 36%CaO–40%SiO2–5%Al2O3–10%Na2O–9%F and strongly basic tundish flux of 50%CaO–42%Al2O3–5%SiO2–3%MgO. The designed compositions of mold flux with increasing drainage of tundish flux are shown in Table 1. A drainage ratio (shortened to be TF/MF) was defined to be the mass ratio of drainage amount of tundish flux to mold flux in the mold. It should be understood that the quantity of tundish flux in the tundish is greater than mold flux in the mold. The tundish flux drainage amount is not fixed but depends on the critical level control. Three drainage ratios of 0, 0.75 and 1.25 representing the increasing contamination levels were designed to clarify the effect of tundish flux entrainment on the in-mold performance of mold flux. These laboratory mixtures evaluate compositional effects without completely reproducing transient industrial entrainment and mixing or implying typical industrial drainage ratios. All samples were synthesized using reagent-grade chemicals CaO, SiO2, Al2O3, Na2CO3, MgO and CaF2 according to designed compositions through pre-melting and quenching them onto a copper plate.
Table 1.
Compositions of experimental mold fluxes (in mass pct).
2.2. Viscosity Measurement
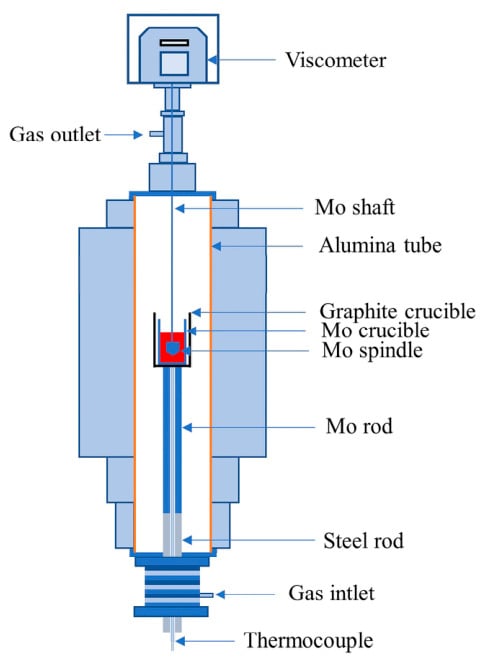
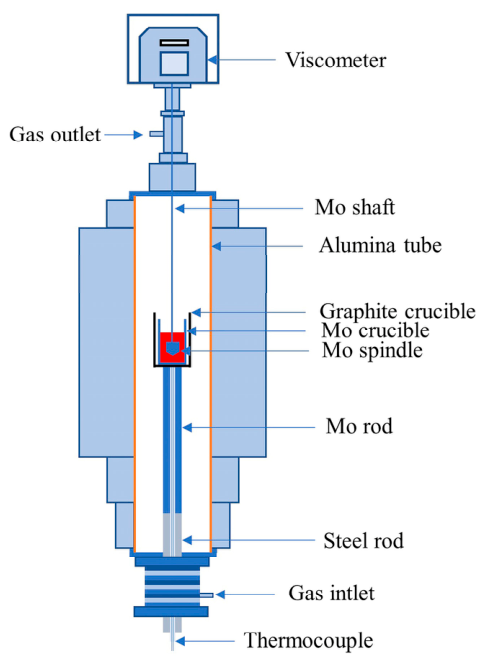
Viscosity of mold flux was measured using a rotating spindle viscometer (DV2T, AMETEK Brookfield, Middleboro, MA, USA). The equipment apparatus used in this measurement is shown in Figure 1, which is consisted of three parts including the measurement system, the rotation system and the heating system. Before viscosity measurement, the viscometer was calibrated with standard silicone oils with a known viscosity of 4.95 dPa·s at room temperature 298 K. Additionally, the control software requires a spindle multiplier constant (SMC) to calculate and collected viscosity data. The parameter was determined using standard silicone oil by Equation (1).
where η is viscosity in dPa·s, TK is a torque constant, which is 0.09373 for the present viscometer, SMC is spindle multiplier constant and the value is 41.75, RPM refers to rotation speed per minute of spindle, Torque represents the torque-% reading at the selected rotation speed.
Figure 1.
Experimental apparatus for viscosity measurement.
About 140 g samples were pressed into the Mo crucible embedded in a graphite crucible, and then the crucible was put into the constant temperature zone of a vertical resistance furnace. Mold fluxes were heated in a vertical resistance furnace that can be controlled to move up and down and performed using Mo spindles and crucibles. A mixed gas of H2 and Ar (20 vol % H2 + 80 vol % Ar) with a flow rate of 0.1 L/min was injected into the experimental apparatus, the vertical resistance furnace, to prevent oxidation. The sample was heated to 1425 °C and held for 30 min to achieve a homogeneity. After that, the furnace was lifted slowly to immerse the spindle into the molten slag, then the furnace temperature was decreased from 1425 °C to the different target temperatures by an interval of 25 °C with a cooling rate of 5 °C /min. When the temperature reached the target value, the slag melt was held for 20 min to reach thermal equilibrium to measure the viscosity; 60 viscosity values were yielded within 5 min. The average value was calculated as the viscosity at the temperature. Then the temperature was decreased for next measurement cycle until the viscosity is close to or exceeds 1.0 Pa·s. The time duration is 30 min from one to another temperature. The temperature was controlled using a proportional integral derivative (PID) controller with an accuracy of ±1 °C. The viscosity measurement error range is ±1% for the employed Brookfield DV2T viscometer (AMETEK Brookfield, Middleboro, MA, USA).
2.3. Heat Transfer Experiments
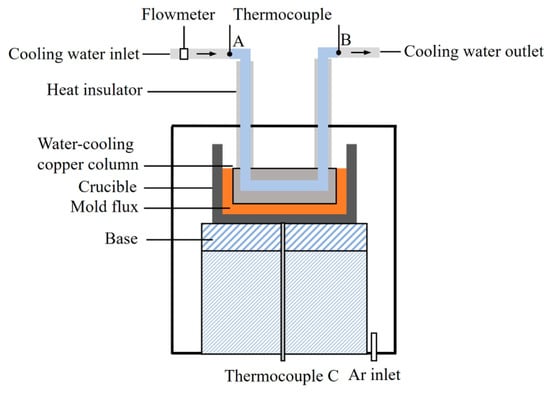
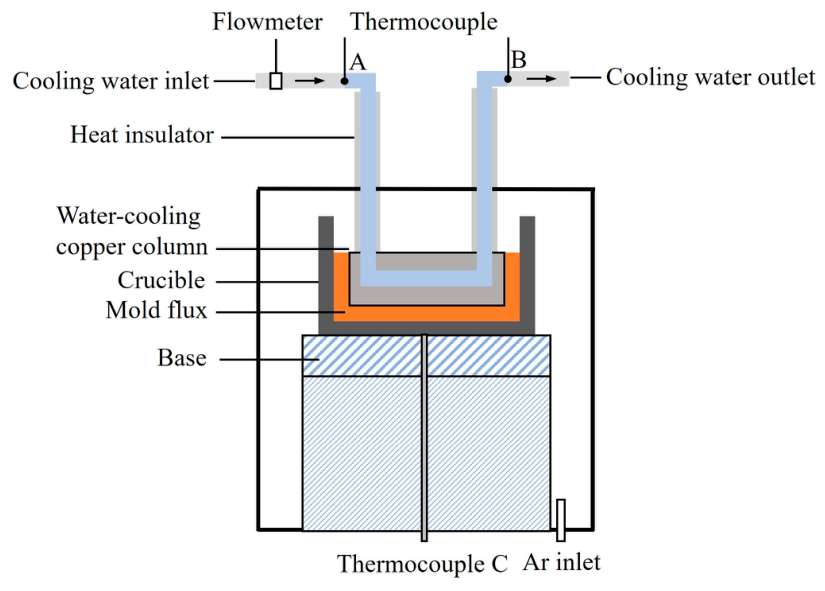
The vertical resistance furnace was employed to carry out heat transfer experiments. The schematic diagram of the apparatus is shown in Figure 2. The apparatus is mainly made up of the heating unit, crucible, water-cooling copper column, and the temperature measurement system. The casting slab shell and water-cooling copper wall were modeled using the crucible and the water-cooling copper column, respectively. The distance between the crucible and the water-cooling copper column was controlled through a laser rangefinder. K-type thermocouple A and B were employed to measure the water temperature at the inlet and outlet; the measurement error is ±0.4%. B-type thermocouple C was adopted to measure the temperature of the crucible; the measurement error is ±0.25%. To eliminate the effect of radiation heat transfer as much as possible, the crucible was placed in the upper region of the constant temperature zone, and the cooling water tube for the copper column was wrapped by heat insulating material.
Figure 2.
Schematic diagram of heat transfer experiment apparatus.
At the beginning of the experiment, high-purity argon gas (99.99% purity) was injected as protecting gas with a flow rate of 0.3 L/min, mold fluxes were fed into the crucible when the temperature of thermocouple C held at 1400 °C. After approximately 30 min, when the mold fluxes were fully molten and the temperature at position C stabilized at 1400 °C again, the water-cooled copper column was inserted into the molten flux for 45 s. The cooling water flow rate was maintained at 3.8 L/min throughout all experiments. Thermocouples A and B continuously recorded the cooling water temperature TA and TB at inlet and outlet, respectively. The instantaneous heat flux density across the flux film was calculated according to Equation (2).
where qw is mass flow rate of cooling water, kg/s; Cw is heat capacity of cooling water, J/(kg·°C); TA and TB are cooling water temperature of inlet and outlet, °C; S is effective contact area of water-cooling copper column and mold flux, m2.
q = qw∙Cw∙(TB − TA)/S
2.4. Crystallization Analysis
Differential scanning calorimetry (DSC, STA 449 F5, NETZSCH-Gerätebau GmbH, Selb, Germany) was used to measure the non-isothermal crystallization characteristics of the mixtures. The DSC instrument error is within ±0.25% for temperature measurement. About 15 mg of quenched mold fluxes were placed into a platinum crucible and heated to 1450 °C at a rate of 20 °C/min, and then held for 3 min to eliminate the bubbles and homogenize the compositions. Finally, the samples were cooled at a rate of 10 °C/min to room temperature. The samples after DSC measurement were separated out, mounted and polished, then characterized by micromorphology and phase composition using a scanning electron microscope (Gemini 300 SEM, Carl Zeiss Microscopy GmbH, Jena, Germany) equipped with energy dispersive X-ray spectroscopy (EDS). In the meantime, the crystalline phases in samples after DSC measurement was identified by micro-area X-ray diffraction (D8 Discover, Bruker AXS GmbH, Karlsruhe, Germany) using Cu-Kα radiation. The measurements were performed in the 2θ scanning range between 10° and 90°.
3. Results and Discussion
3.1. Viscosity Evolution Induced by Tundish Flux Drainage
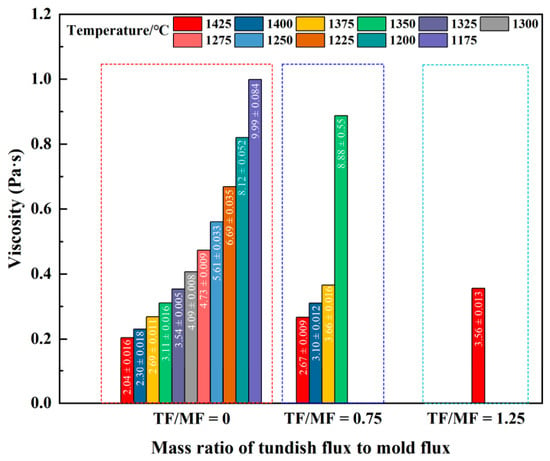
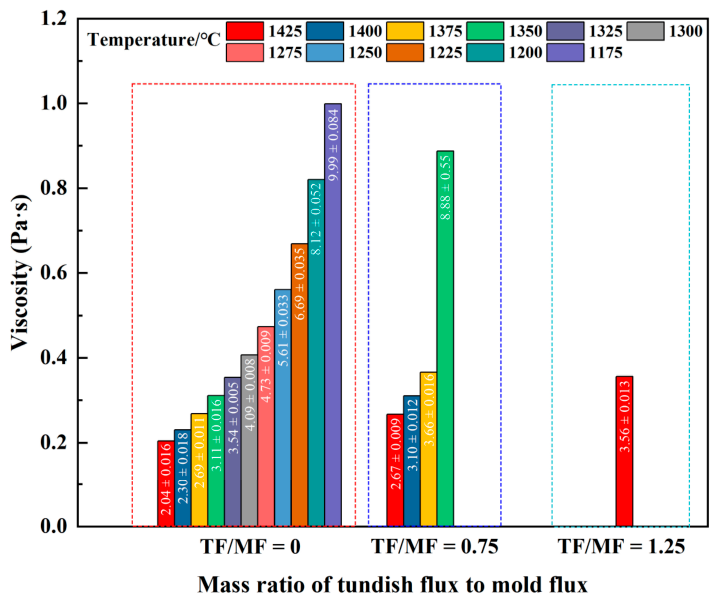
Figure 3 exhibits the viscosity of mold fluxes with increasing tundish flux drainage ratio. The viscosity was measured with an interval of 25 °C from 1425 °C. The measurement was stopped once the viscosity exceeds 1.0 Pa·s, which indicates reaching a very high viscosity for mold flux. It can be observed that the measurement number of original mold flux is more in the wide temperature range of 1175–1425 °C, the viscosity increases up to 0.99 Pa·s at 1175 °C. However, the number reduces with the increased drainage ratio, only one viscosity at 1425 °C was obtained for flux with drainage ratio of 1.25. This is because the viscosity at 1400 °C exceeds 1.0 Pa·s, the measurement was stopped. This change suggests the drainage of tundish flux significantly increases mold flux viscosity. When the drainage ratio is not high (0.75), the viscosity begins to increase rapidly at 1350 °C; however, as the drainage ratio increases to 1.25, the viscosity starts to rise sharply at 1400 °C, exceeding 1.0 Pa·s. The error of viscosity at each temperature was also presented in Figure 3. It can be seen that the standard deviations are small in all cases except for the viscosity of sample with TF/MF = 0.75 at 1350 °C. The value of ±0.55 Pa·s does not reflect the actual standard deviation of this case. This is because the sample with TF/MF = 0.75 at 1350 °C has become a non-Newtonian fluid; the precipitation of crystals over time contributes to an increase in viscosity even though the temperature remains constant. Nevertheless, the measured viscosity of the Newtonian fluid at other temperatures indicates that the standard deviation is small. The high viscosity induced by tundish flux drainage indicates the flowability and lubricating ability of mold flux deteriorate; continuous casting is exposed to a significant risk of sticking.
Figure 3.
Viscosity of mold fluxes with TF/MF = 0, 0.75, and 1.25 at different measurement temperatures.
Evolution of mold flux viscosity with tundish flux drainage is related to complex composition and subsequent structure change. Tundish flux contains high CaO and Al2O3 contents, drainage of tundish flux into mold flux will seriously change the initial mold flux compositions as a result of an increase in CaO and Al2O3 contents and dilution of SiO2, Na2O and F contents. To further elucidate the effect of compositional variations on mold flux viscosity, the non-bridging oxygen to tetrahedrally coordinated cation ratio (NBO/Tcn) was calculated from the bulk chemical composition, where NBO denotes non-bridging oxygen and Tcn denotes tetrahedrally coordinated network-forming cations. A higher NBO/Tcn value corresponds to abundant non-bridging oxygen (NBO) and a highly depolymerized network framework, while a lower NBO/Tcn signifies a more polymerized network structure [19]. For the present mold flux system, the NBO/Tcn was computed via Equation (3) [20].
where Xi denotes the molar amount of each oxide constituent. Within this formula, CaO, Na2O and CaF2 are classified as network-modifying oxides, whereas SiO2 and Al2O3 serve as network formers. MgO is included in the numerator if its content is less than 7% and in the denominator when it exceeds the value. It is obvious that MgO should be included in the numerator for the present system because of its small content. The negative term associated with accounts for the consumption of charge-compensating cations upon the incorporation of Al3+ into tetrahedral aluminosilicate networks. As reported by Mills et al. [21], Al3+ that integrates into silicate lattices requires charge-balancing modifier cations, which are consequently no longer available to break Si–O–Si linkages.
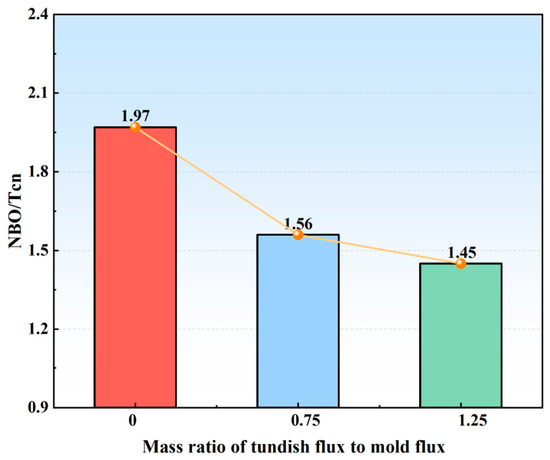
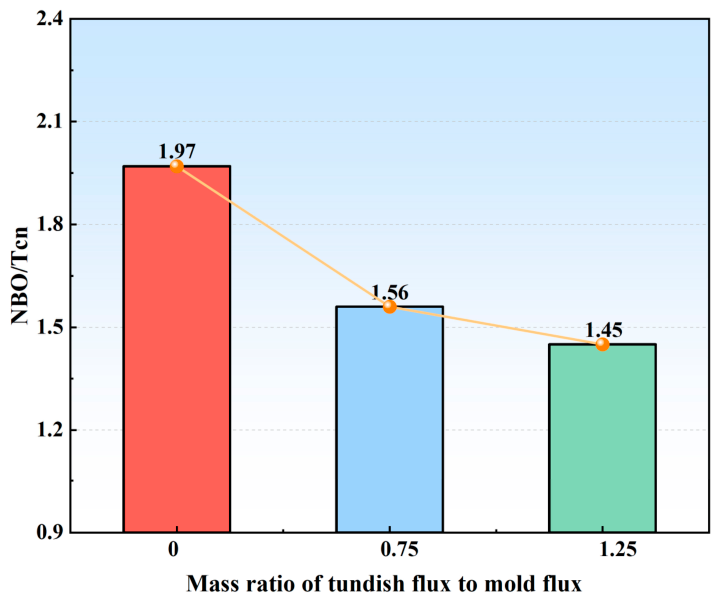
As shown in Figure 4, NBO/Tcn decreases with increasing drainage ratio of tundish flux, indicating that the oxide network becomes progressively more polymerized, which is consistent with the increase in viscosity. This tendency is mainly attributed to the increase in Al2O3/SiO2 ratio and decrease in Na2O, which reduces the amount of effective network modifiers that deploy the network structures, thus promoting the formation of complex aluminosilicate structural units. It should be noted that the NBO/Tcn calculated from bulk composition only semi-quantitatively describe the actual oxygen speciation in the melt. Previous studies based on Raman spectra have shown that calculated NBO/Tcn may deviate from measured NBO/Tcn to some extent in Al2O3-containing slags because the calculation assumes that Al2O3 mainly acts as a network former under sufficient charge compensation, whereas a part of Al2O3 may behave as a network modifier or exist in cation-deficient local environments [22]. Therefore, in this work, the theoretical NBO/Tcn is used as a semi-quantitative indicator to evaluate the compositional tendency of melt network polymerization. However, it cannot be denied that compositional changes in mold flux induced by drainage of tundish flux trigger structural changes, which in turn lead to great changes in the mold flux viscosity.
Figure 4.
Variation in NBO/Tcn among different drainage mass ratios of tundish flux to mold flux. The columns represent the NBO/Tcn values, while the dots and connecting line indicate the variation trend.
3.2. Heat Transfer Evolution Induced by Tundish Flux Drainage
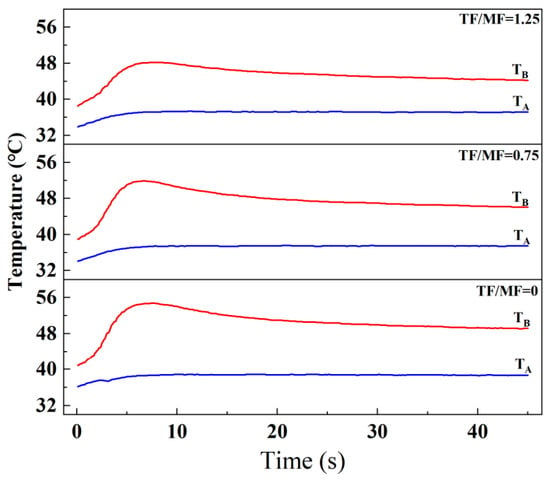
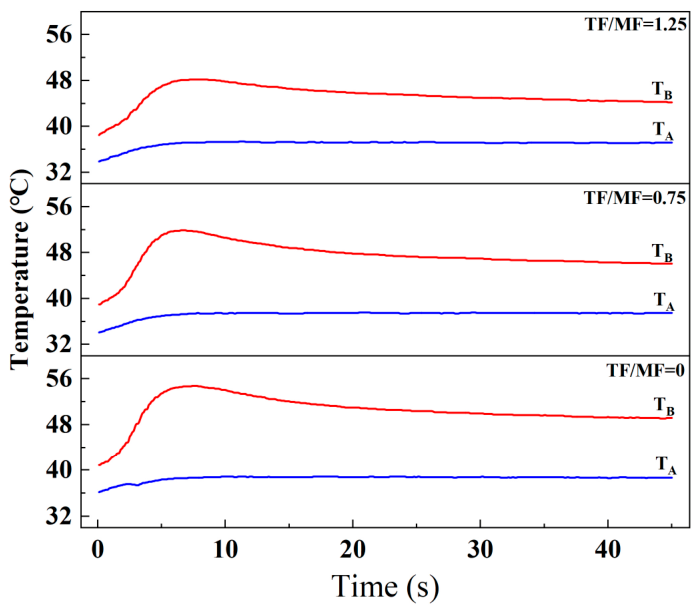
Figure 5 displays the measured TA and TB profiles for TF/MF = 0, 0.75, and 1.25 during heat transfer. It can be seen the cooling water inlet temperature TA is relatively flat, whereas cooling water outlet temperature TB first rises rapidly then drops, and finally levels off, indicating the change in heat absorption of the colling water with testing time. All these profiles of the cooling water outlet temperature TB agree well with the simulated and measured temperature profiles of the continuous casting mold [23], which suggests the cooling water outlet temperature TB could reflect the mold temperature. It can also be found that the magnitude of the changes in TB has decreased with increasing TF/MF, indicating the effect of tundish flux drainage ratio on heat transfer.
Figure 5.
Evolution of the measured cooling water temperatures during the heat transfer experiments for mold fluxes with TF/MF = 0, 0.75, and 1.25.
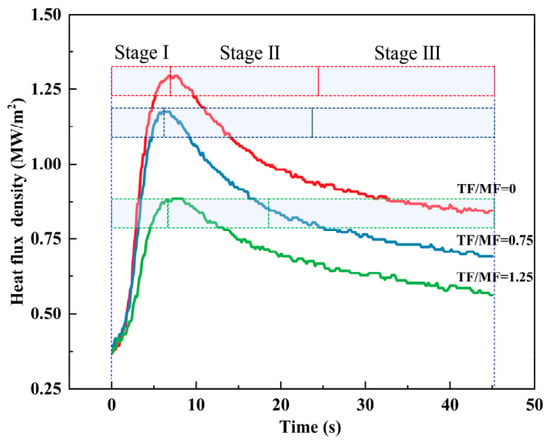
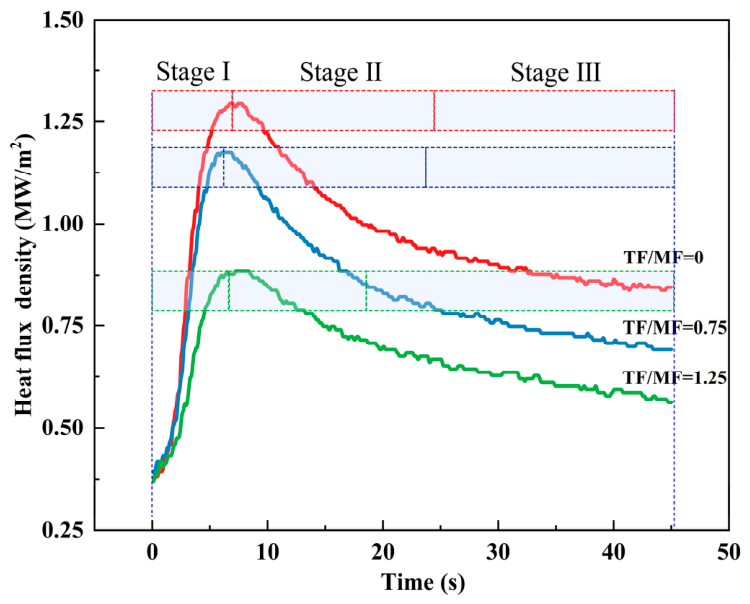
According to the cooling water temperature profiles and Equation (2) above, the heat flux density profiles of mold fluxes with a drainage ratio of 0, 0.75, and 1.25, as a function of experimental time, were obtained and presented in Figure 6. It can be observed that all three samples exhibit a consistent temporal behavior, which could be divided into three stages, (I) the ascent stage of heat flux density from 0 to t1 (peak time), (II) the rapid descent stage from t1 to t2 (turning time from fast decrease to slow decrease), and (III) the slow descent stage toward stable stage (t2 to t3). Mahapatra et al. [24] have reported many heat flux profiles obtained at the center plane of the mold narrow and broad faces during continuous casting with varying steel grades, casting speeds and SEN depths. Although the heat flux magnitude varies with time under different continuous-casting conditions, the overall profile of the heat flux curve remains essentially the same. The heat flux increases rapidly at first, then decreases, and subsequently approaches a relatively steady state. The shape of the heat flux curve obtained in the present study is consistent with that of industrially measured heat flux curves reported in the literature above, indicating that the present method can reasonably reproduce the temporal variation in heat flux in the continuous casting mold.
Figure 6.
Relationship between time and heat flux of different mold fluxes.
The ascent stage I reflects the heat flux density change between the copper column and molten fluxes referring to actual in-mold performance; therefore, the heat flux density reaches the maximum. The rapid descent stage II reflects the formation process of solid slag film and air gap; therefore, the heat flux density rapidly decreases with the formation and crystallization of solid slag film. Eventually, the solid slag film formed and the heat flux density decreases slowly toward stable heat transfer (stage III). In the division of stages, the turning time t2 from fast decrease to slow decrease could be calculated through fitting the heat flux density–time curve in stage II and III then making its first derivative equal to −1. According to the heat transfer characteristics, three parameters including the maximum heat flux density, the average heat flux density from the peak time t1 to the measurement end t3, and the heat flux density at measurement end t3 are adopted to characterize the heat transfer characteristics.
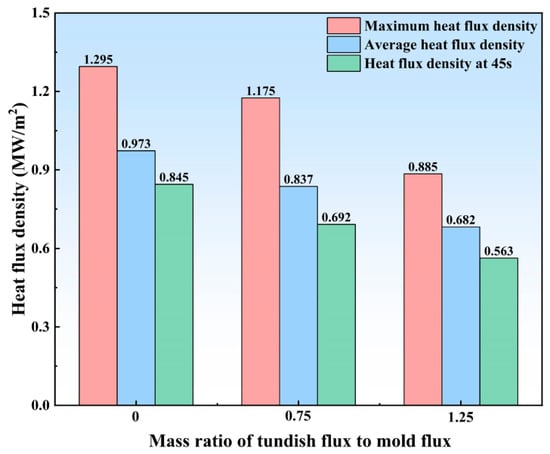
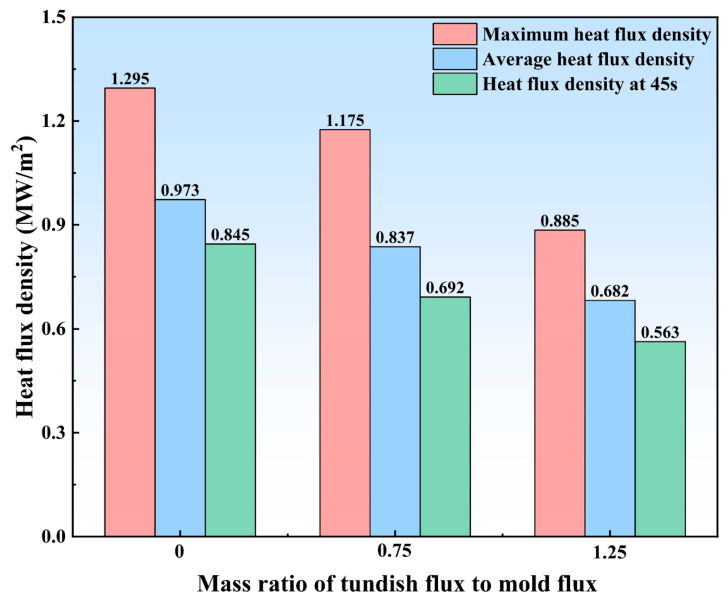
With increasing drainage ratio TF/MF from 0 to 1.25, the heat flux density decreases systematically across the entire measurement period. The quantitative parameters presented in Figure 7 confirm this trend. The maximum heat flux, which reflects the instantaneous heat transfer capability of the liquid slag layer [12], decreases from 1.295 MW/m2 (TF/MF = 0) to 1.175 MW/m2 (TF/MF = 0.75) and 0.885 MW/m2 (TF/MF = 1.25), corresponding to reductions of approximately 9.3% and 31.7% relative to mold flux without tundish flux drainage, respectively. The average heat flux, regarded as a key indicator of the overall heat transfer performance of the mold flux in the mold, decreases from 0.973 MW/m2 (TF/MF = 0) to 0.837 MW/m2 (TF/MF = 0.75) and 0.682 MW/m2 (TF/MF = 1.25), representing reductions of approximately 14.0% and 29.9%, respectively. The progressive decrease in all three heat flux parameters indicates a continuous increase in the bulk thermal resistance of the slag film with increasing drainage of tundish flux, significantly suppressing interfacial heat transfer. Although the cooling water temperatures were not repeatedly measured to calculate the heat flux, the results of repeated measurements conducted with the same apparatus in previous study have shown that all the errors in the heat flux are less than 1.5%, which is relatively small [25]. Therefore, it can be concluded that the error of 1.5% obtained based on the same equipment and method also applies to the present results.
Figure 7.
Specific heat flux parameters of different mold fluxes.
Few studies have reported the effect of mold flux compositional change on heat transfer under conditions comparable to those considered in the present work. This is mainly because the investigated slag systems were produced by mixing mold flux and tundish flux in different ratios, resulting in simultaneous and substantial changes in all compositional parameters, including basicity and the contents of Al2O3, Na2O, MgO, and F. Consequently, the observed change in heat transfer behavior should be regarded as the combined response to multiple compositional changes rather than the effect of any single component. Most previous studies have focused on the influence of an individual constituent on mold flux heat transfer while keeping the other compositional variables relatively unchanged [26,27,28,29,30]. Although such studies provide useful insights into the roles of specific components, the mechanisms proposed on the basis of single component variable experiments cannot be directly applied to the present multicomponent system. In particular, possible interactions among changes in basicity, network-forming species, fluxing agents, and crystallization related components may alter both the structure and phase evolution of the slag film, thereby affecting the overall heat transfer behavior. Therefore, the present results cannot be interpreted solely in terms of previously reported single component effects. Further systematic investigation is required to clarify the coupled compositional effects and the underlying heat-transfer mechanisms.
In the heat flux-time relationship curves, the time for rapid descent stage from t1 to t2 was characterized as characteristic time (t2 − t1), which reflects the formation time of air gap. Since the formation time is closely related to crystallization of mold flux, it can be used to represent its crystallization capability. According to the heat flux density–time curve in stage II and III, the characteristic time of mold flux with TF/MF = 0, TF/MF = 0.75 and TF/MF = 1.25 could be obtained as 17.5 s, 16.7 s and 12.1 s. The decreased characteristic time indicates the mold flux with more tundish flux drainage needs a shorter time to achieve rapid decrease in heat transfer density, suggesting a stronger formation ability of air gap and solid flux film. Crystallization of mold flux is known to be the primary mechanism controlling interfacial heat transfer in continuous casting [27]. The compositional changes caused by tundish flux drainage may alter the crystallization behavior, including the crystallization temperature and the crystalline phase constitution, thereby modifying the overall heat transfer characteristics of the flux film. The influence of tundish flux drainage ratio on the crystallization behavior of mold flux will be examined and discussed in detail in the subsequent section.
3.3. Crystallization Evolution Induced by Tundish Flux Drainage
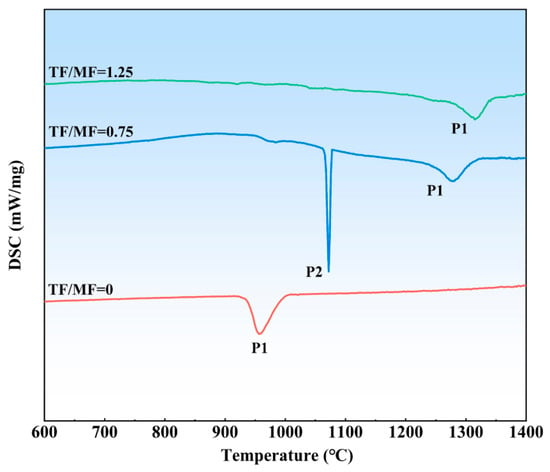
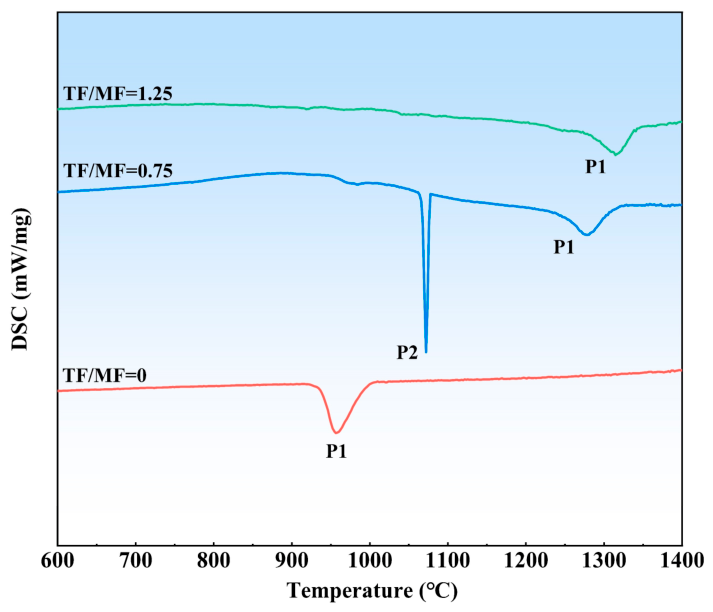
Differential scanning calorimetry (DSC) was carried out to evaluate the effect of tundish flux drainage on the crystallization temperature of mold flux. The measured DSC curves are shown in Figure 8, and the corresponding crystallization parameters Tc,onset (onset temperature), Tc,peak (peak temperature), and Tc,end (end temperature) are summarized in Table 2. Following the DSC analysis framework adopted in previous studies of mold flux [5,31], these parameters denote the onset, peak exothermic heat flow, and termination of the corresponding crystallization event. The temperatures reported herein were extracted from individual DSC cooling curve acquired at a cooling rate of 10 °C/min. The temperature measurement error of the DSC instrument is ±0.25% of the temperature reading in °C. The corresponding error ranges are included in Table 2 for the crystallization onset, peak, and end temperatures.
Figure 8.
DSC curves of mold fluxes with different TF/MF.
Table 2.
Crystallization temperature parameters of mold fluxes.
For mold flux without tundish flux drainage (TF/MF = 0), the single exothermic peak P1 appears in the low-temperature region with onset temperatures of 994 °C indicates that the mold flux without tundish flux drainage undergoes a relatively simple crystallization process. After drainage of tundish flux, the DSC curve of mold flux with a drainage ratio of 0.75 changes markedly. Two exothermic peaks are observed at 1315 °C and 1079 °C, indicating a multi-stage crystallization process. The high temperature peak starting at 1315 °C corresponds to the earlier precipitation of crystalline phases during cooling, while the sharp peak starting at 1079 °C indicates a subsequent crystallization event. For mold flux with a drainage ratio of 1.25, only one distinct exothermic peak is observed in the high-temperature region. The crystallization onset temperature of this mold flux increases to 1340 °C, which is higher than the crystallization onset temperatures of 994 °C and 1315 °C for mold fluxes with drainage ratio of 0 and 0.75.
Moreover, the liquidus temperature was calculated with FactSage 8.3 software to generate the undercooling degree through the difference in liquidus temperature and onset crystallization of first peak. Seo et al. [31,32] demonstrated that undercooling is closely associated with nucleation-controlled crystallization in CaO–SiO2–CaF2-based fluxes. Lower undercooling generates smaller thermodynamic driving force for nucleation; formation of a large number of crystals is not expected. As shown in Table 2, the undercooling degree decreases sharply with an increase in drainage ratio from 0 to 0.75 and 1.25. The mold flux with a drainage ratio of 0.75 and 1.25 receives a similar undercooling degree, indicating the mold flux with tundish flux drainage needs a small drive force to achieve crystallization. These comprehensive characteristics indicate that crystallization is triggered more readily at higher temperature when the tundish flux drainage ratio is further increased. Overall, increasing the tundish flux drainage ratio shifts the mold flux crystallization toward a higher temperature and modifies the crystallization pathway.
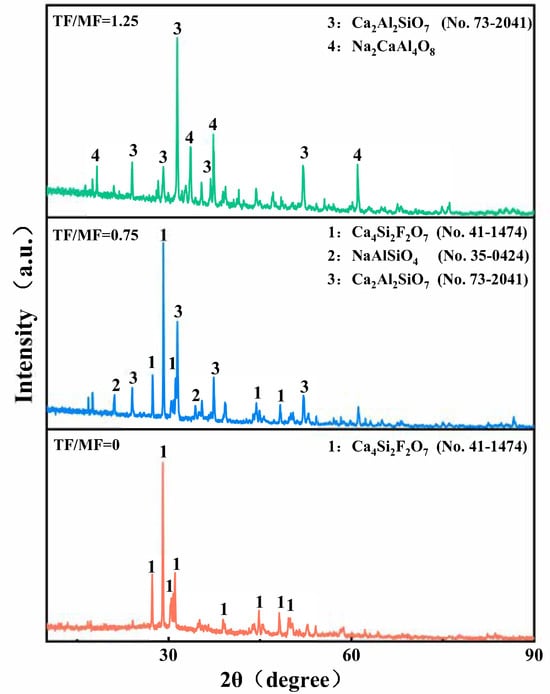
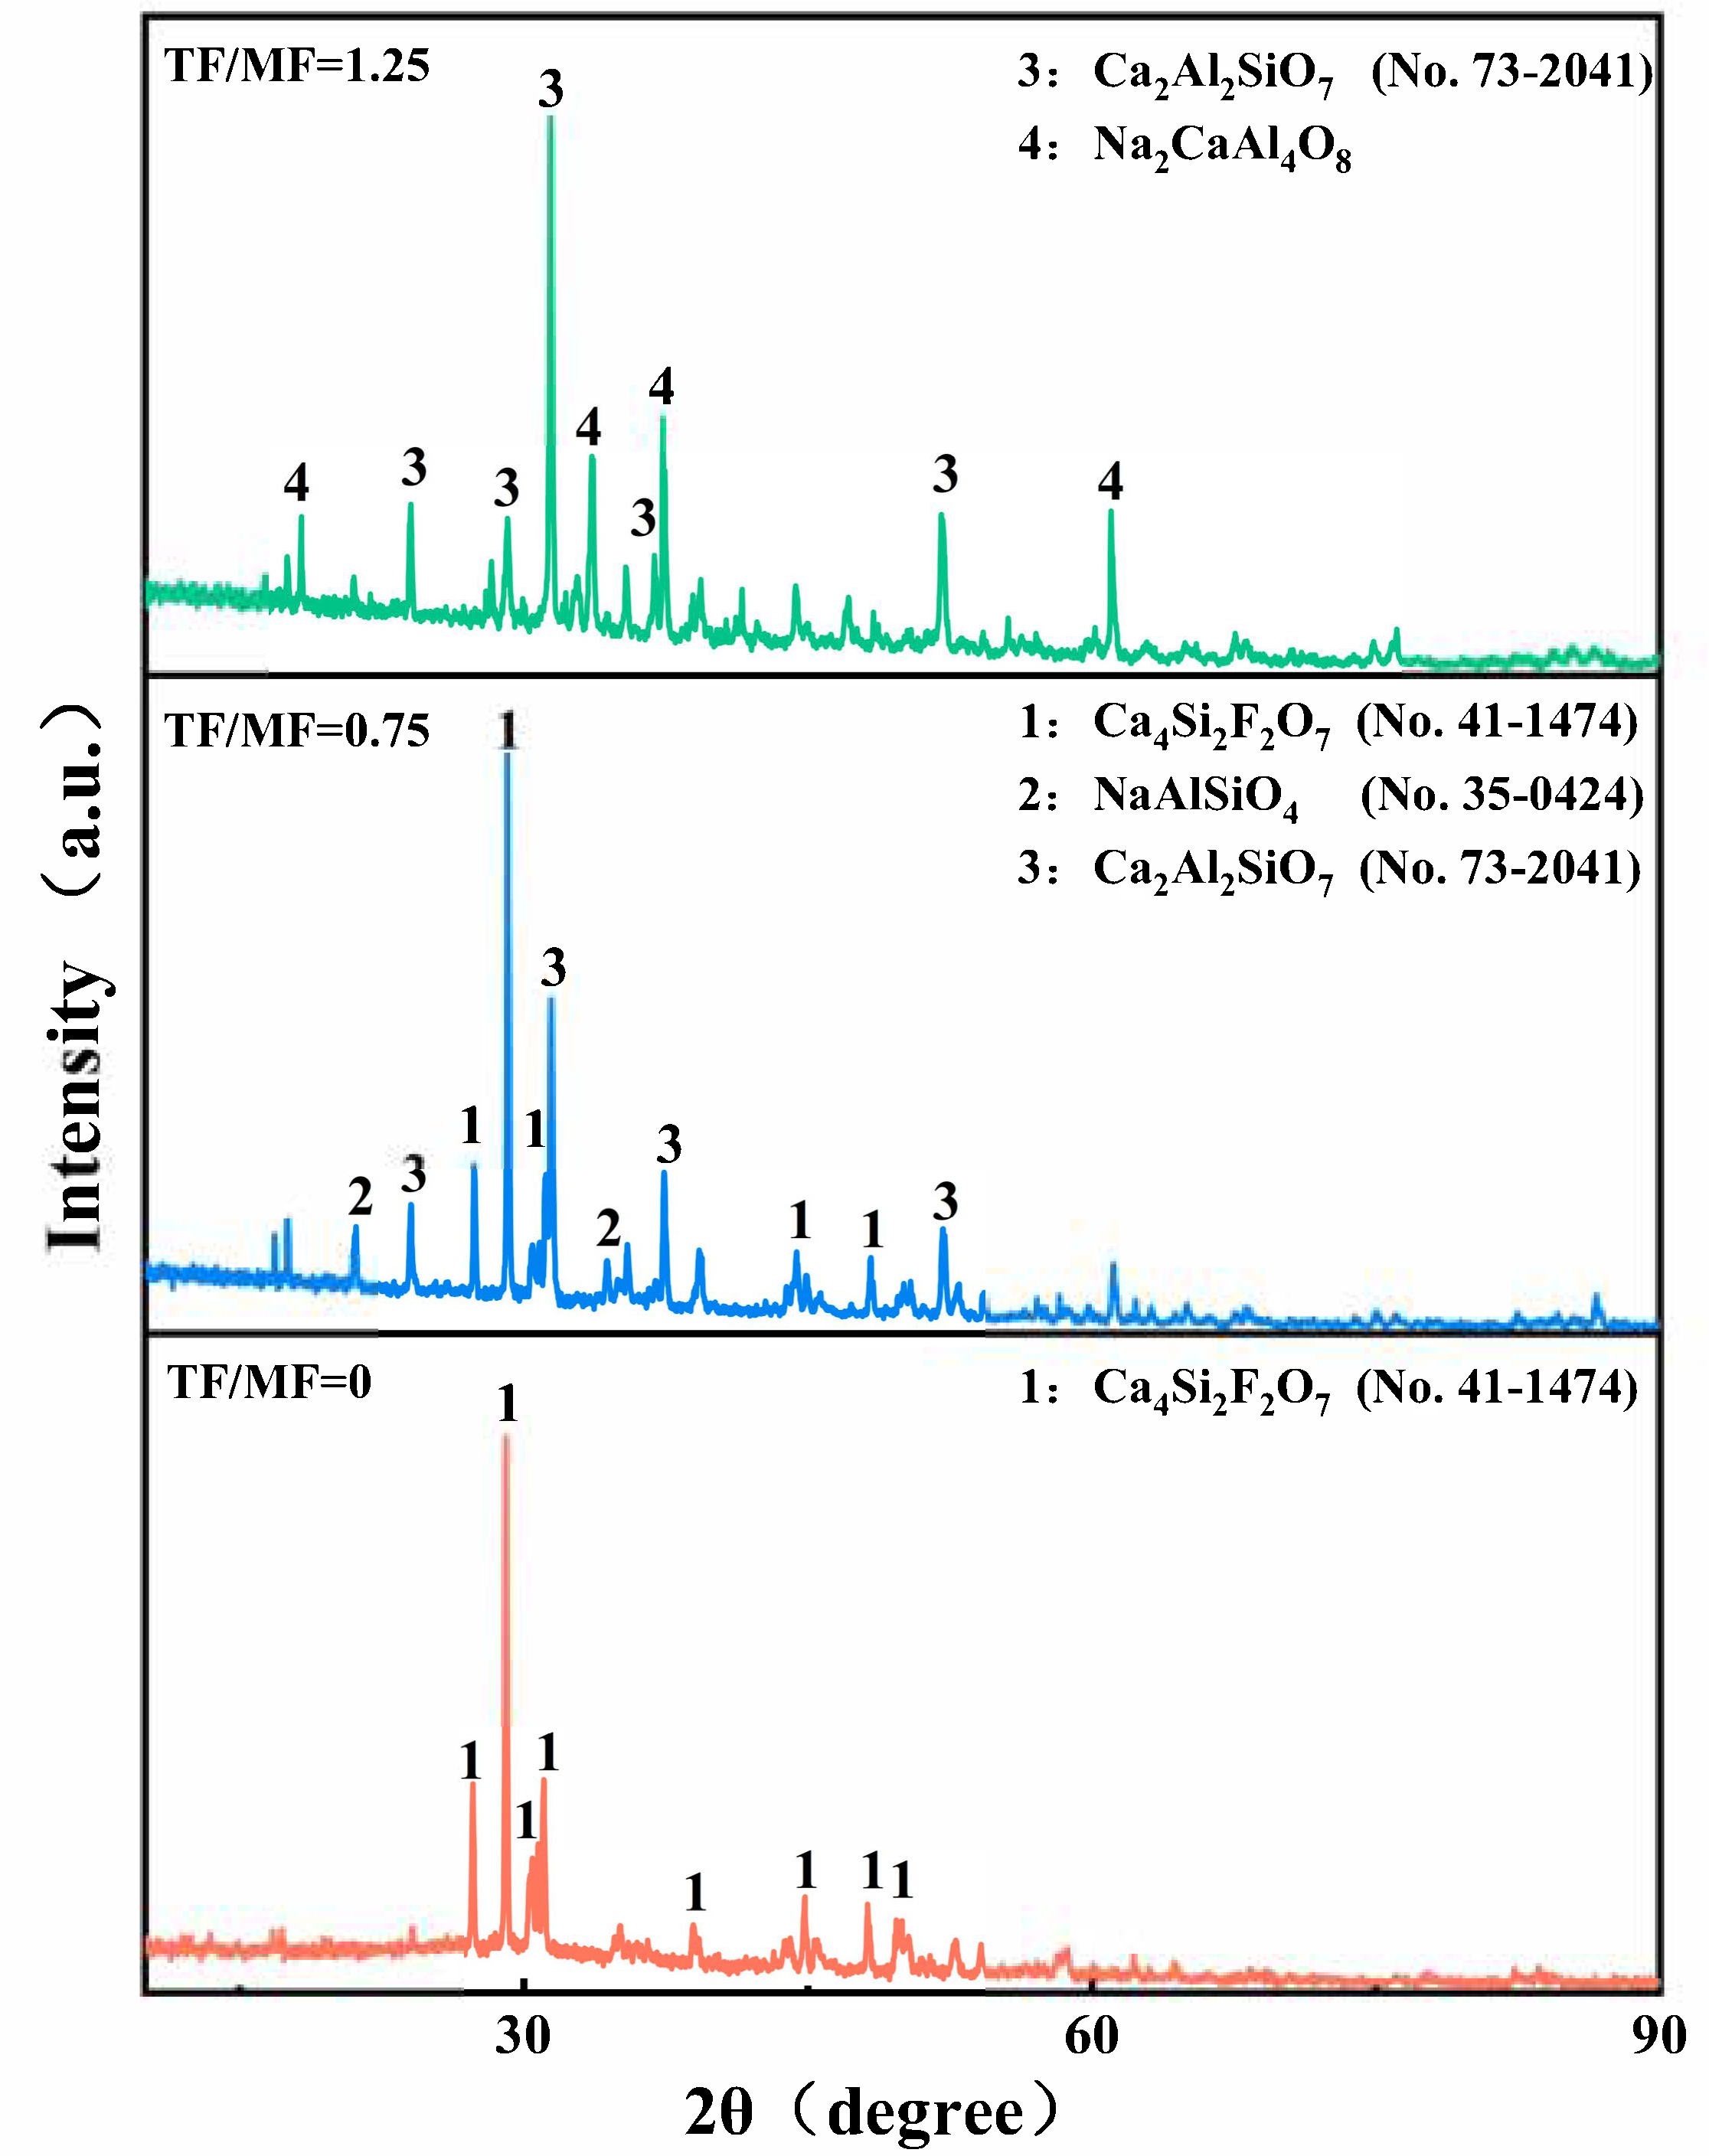
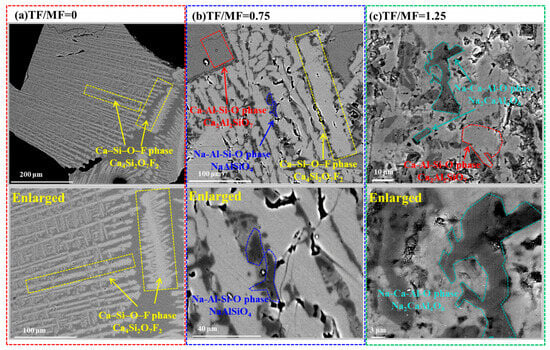
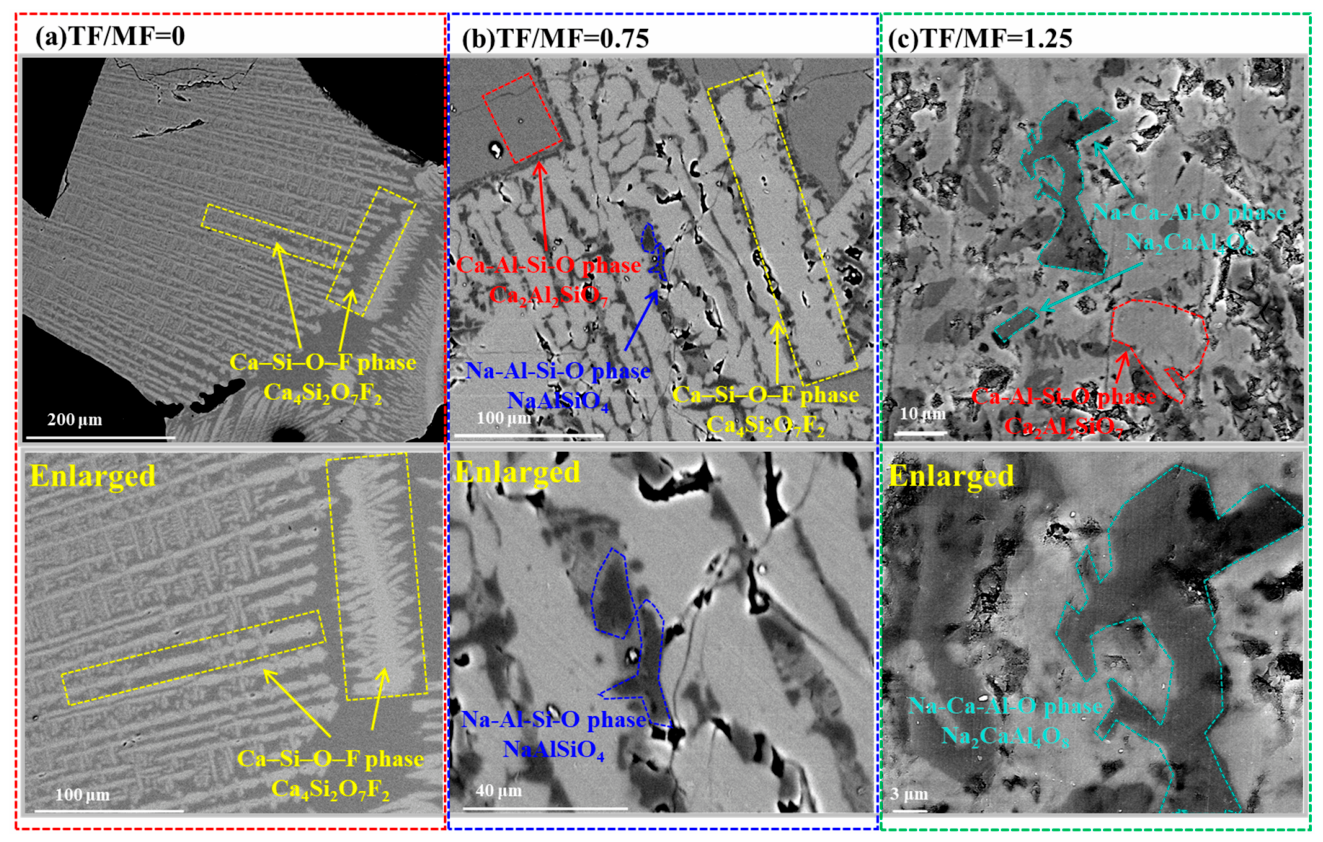
Figure 9 and Figure 10 display the XRD patterns and SEM–EDS results for the mold fluxes with an increasing tundish flux drainage ratio after DSC measurements, respectively. The images in the lower part of Figure 10 are the high-magnification images of the upper images. The XRD pattern confirms that the only detectable crystalline phase in mold flux with TF/MF = 0 is cuspidine (Ca4Si2F2O7), a primary phase in conventional mold flux. The SEM–EDS result in Figure 10 is consistent with this identification. As shown in the figure, spear-shaped and dendritic crystals are observed in the matrix, and the selected regions are enriched in Ca, Si, F and O. These characteristics correspond well to cuspidine phase [5,31]. Therefore, the exothermic peak of mold flux with TF/MF = 0 can be assigned to the precipitation of cuspidine (Ca4Si2F2O7). The agreement between DSC, XRD and SEM–EDS indicates that mold flux without tundish flux drainage (TF/MF = 0) follows a single-phase-dominated crystallization route.
Figure 9.
XRD results of mold fluxes with different TF/MF.
Figure 10.
Crystalline phase structures of mold fluxes with different TF/MF. (a) Ca4Si2F2O7 phase (marked in yellow) in mold flux with TF/MF = 0; (b) Ca4Si2F2O7 phase (marked in yellow), Ca2Al2SiO7 phase (marked in red) and NaAlSiO4 phase (marked in blue) in mold flux with TF/MF = 0.75; (c) Ca2Al2SiO7 phase (marked in red) and Na2CaAl4O8 phase (marked in cyan) in mold flux with TF/MF = 1.25.
The DSC curve of mold flux with TF/MF = 0.75 in the aforementioned Figure 8 is more complex than that of mold flux without tundish flux drainage (TF/MF = 0). The first exothermic signal becomes broader and asymmetric, and then a sharp thermal response is observed within the crystallization interval. This behavior suggests that crystallization in mold flux with TF/MF = 0.75 may not be controlled by an isolated phase transformation. Instead, several crystalline phases precipitate over close or partially overlapping temperature ranges. Therefore, the DSC signal of mold flux with TF/MF = 0.75 should be considered as a combined thermal response of multiphase crystallization, rather than as a single crystallization peak assigned to one phase. This interpretation is supported by the XRD result, which shows that mold flux with TF/MF = 0.75 after DSC measurement contains Ca4Si2F2O7, NaAlSiO4 and Ca2Al2SiO7. The SEM–EDS observations further confirm the coexistence of these phases. The elongated yellow regions are assigned to cuspidine. The red regions correspond to gehlenite (Ca2Al2SiO7). The blue regions are associated with nepheline (NaAlSiO4). Thus, the crystallization of mold flux with TF/MF = 0.75 represents a transition from the cuspidine-dominated precipitation in mold flux with TF/MF = 0 to a multiphase competitive crystallization process. The formation of these phases is closely related to the entire composition change in mold flux. The formation of these phases is closely related to the entire composition change in mold flux. The coexistence of cuspidine and gehlenite observed in the present study is consistent with the results reported by Wang et al. [33], who identified only cuspidine in one flux but both phases in another flux with higher basicity and Al2O3 content. Similarly, Zhou et al. [27] reported that the crystalline products changed with increasing Al2O3 content, involving cuspidine, NaAlSiO4, and gehlenite. In this study, with increasing Al2O3/SiO2 ratio, more Al3+ enters the silicate network and forms Al–O tetrahedral units. Ca2+ can then participate in Ca–Al–Si–O structural units, promoting the precipitation of Ca2Al2SiO7. At the same time, Na+ acts as a charge-compensating cation for the aluminosilicate framework and favors the formation of NaAlSiO4. A portion of Ca, Si, F and O remains available to form Ca4Si2F2O7. Consequently, the thermal signal recorded by DSC results from the coupled precipitation of cuspidine, gehlenite and nepheline. The overlap of these crystallization events explains why the DSC curve does not show completely separated exothermic peaks for the three phases.
When the TF/MF is further increased to 1.25, the DSC curve exhibits a broader high-temperature crystallization peak, indicating that further enrichment of CaO and Al2O3 promotes the earlier precipitation. The XRD pattern reveals the disappearance of diffraction peaks for Ca4Si2F2O7 and NaAlSiO4 phase, while Ca2Al2SiO7 and Na2CaAl4O8 phase become the dominant crystalline phases. It should be noted that although the Na2CaAl4O8 phase has been reported and confirmed in several previous studies [34,35,36,37], it has not yet been assigned a reference number in commonly used crystallographic diffraction databases. Cantaluppi et al. have successfully synthesized Na2CaAl4O8 and characterized the phase by X-ray diffraction, providing a reference XRD pattern for phase identification [34]. In the present study, Na2CaAl4O8 was identified through a combined analysis of SEM–EDS results and comparison of the measured XRD pattern with the diffraction data reported by Cantaluppi et al. However, because no corresponding PDF reference number is currently available for this phase, no PDF number is provided for it in Figure 9. This phase transition reflects a shift in the crystallization path from Ca–Si–F–O and Na–Al–Si–O phases to Ca–Al–Si–O and Na–Ca–Al–O phases. A similar compositional dependence was reported by Wang et al. [38], who found that increasing the Al2O3/SiO2 ratio shifted the crystalline assemblage from cuspidine-containing phases to gehlenite, with other Al-bearing phases forming at still higher ratios. The SEM–EDS characterizations for mold flux with TF/MF = 1.25 are consistent with the XRD phase identification. The plate-shaped crystals rich in Ca, Al, Si, and O are identified as gehlenite (Ca2Al2SiO7), while the fine and dark regions rich in Na, Ca, Al, and O correspond to Na2CaAl4O8. The absence of cuspidine suggests that the formation of Ca–Si–F–O crystalline units is suppressed at a higher CaO and Al2O3/SiO2 ratio, and lower F. Under these conditions, Ca2+ is preferentially incorporated into Ca–Al–Si–O crystals and then Na–Al–O, and Na2O is consumed through the formation of the complex aluminate Na2CaAl4O8. Compared with NaAlSiO4, Na2CaAl4O8 is richer in Al, indicating that the crystallization pathway further evolves from aluminosilicate precipitation to complex aluminate precipitation. These high-melting temperature phases increase the crystallization temperature.
The above discussion has provided a qualitative analysis of the evolution of phase composition. Quantitative phase fractions would be helpful for a deeper understanding of the structural constituents; however, for the multicomponent mixture samples of tundish flux and mold flux investigated in this work, the cooled samples contain several crystalline phases together with a certain amount of amorphous material. Although it is possible to distinguish between different phases to some extent using grayscale, the area of a phase observed on the surface does not represent its accurate content in the entire sample. In addition, some phases like NaAlSiO4 may occur only in relatively small amounts. Under such circumstances, determining the absolute fraction of each phase solely from the present BSE and XRD results may involve considerable uncertainty arising from the contribution of amorphous phases, and the specific analysis and fitting procedures. Therefore, the present SEM and XRD results are insufficient to provide sufficiently accurate and reproducible phase fractions. To avoid introducing potentially misleading quantitative results, the BSE and XRD analyses in this study were primarily used to identify the phase types in the samples and to discuss their crystallization behavior and formation mechanism under different drainage ratios of tundish fluxes.
3.4. Breakout Mechanism Induced by Tundish Flux Drainage
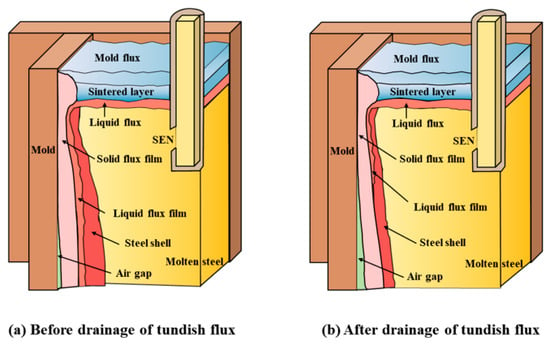
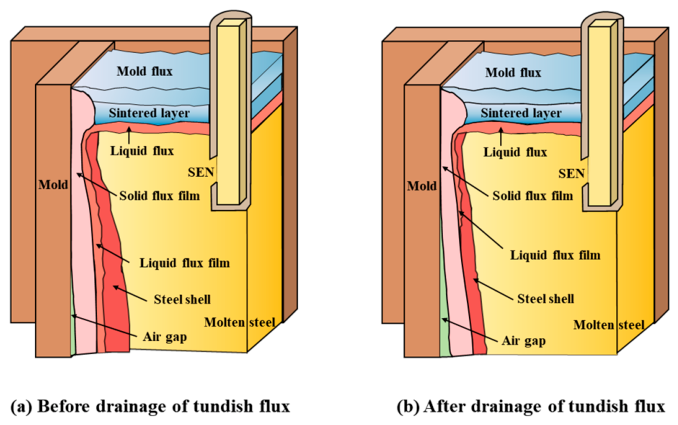
The aforementioned study clearly demonstrates that tundish flux drainage simultaneously increases viscosity, enhances crystallization, and inhibits heat transfer. These changes will directly affect the in-mold performance of mold flux. As depicted in Figure 11, the mold flux film structure between the mold and initial steel shell before and after tundish flux drainage is presented schematically. As can be seen in Figure 11a, the mold flux maintains its original viscosity, crystallization, and heat transfer properties prior to tundish flux drainage. The mold flux film structure formed under the initially designed properties meets the continuous casting requirements for the steel grade, providing effective lubrication and heat transfer performance to ensure smooth continuous casting. As can be seen in Figure 11b, the crystallization temperature of mold flux increases significantly after tundish flux drainage. Under this condition, the liquid flux film partially solidifies to form a slag flux film, resulting in a thickness reduction in the liquid flux film and a thickness increase in the solid flux film, particularly in the upper and middle regions of the mold near the meniscus. At the same time, the gas gap widens and the surface of slag film close to the mold becomes rougher due to enhanced crystallization, which increases the interfacial thermal resistance. The fraction of crystalline phases in solid flux film also increases with higher crystallization temperature, which will suppress the radiative heat transfer across the film. Combination of all these behaviors strongly inhibits horizontal heat transfer, causing the initial solidified shell to become thinner.
Figure 11.
Schematic of mold flux film structure before and after the drainage of tundish flux.
The newly formed solidified shell is lubricated as it progresses down the mold by liquid mold flux film infiltrated from the liquid slag pool in Figure 11. This flow of liquid mold flux film helps to reduce the frictional force acting on the solidified shell. The liquid frictional force Fl can be calculated by Equation (4) [2].
where A is active surface area of the mold, η is mold flux viscosity, Vm is oscillation velocity of the mold, Vc is casting speed, and dl is the liquid flux film thickness.
Fl = A∙η∙(Vm − Vc)/dl
As studied above, the mold flux viscosity increases and the liquid flux film thickness decreases significantly due to the drainage of tundish flux, the liquid frictional force expressed by Equation (4) correspondingly increases. For example, the viscosity at 1400 °C for mold flux with drainage ratio of 1.25 is already five times the initial viscosity of mold flux without tundish flux drainage. This suggests that the increase in viscosity alone has increased the frictional force to five times its original value. When combined with the action of reduced liquid flux film thickness, the frictional force will increase further. In addition, the ability of the initial solidified shell to resist frictional tearing is also significantly reduced due to the thinner initial shell in the condition of decreased heat flux density. Under the combined effect of these factors, the relationship between tundish flux drainage and in-mold performance of mold flux can be clarified. Drainage of tundish flux induces higher viscosity, weak heat transfer and stronger crystallization of mold flux, which make the liquid mold flux film and the initial solidified shell become thinner, causing higher frictional force acting on initial shell and smaller tearing resistance of the shell. Ultimately, sticking breakouts occurs.
4. Conclusions
To summarize, the tundish flux drainage-induced in-mold performance evolution of mold flux including viscosity, heat transfer and crystallization characteristics have been investigated. The drainage of tundish flux significantly modifies the mold flux compositions, consequently altering the viscosity. As drainage of tundish flux increases, the viscosity at 1300 °C of mold flux with drainage ratio 0.75 and 1.25 increases to more than 1.0 Pa·s. The structural change representing by decrease in non-bridging oxygen and crystal precipitation are responsible for this. With increased drainage ratio of tundish flux from 0 to 1.25, the average heat transfer density of mold flux decreases from 0.973 MW/m2 to 0.682 MW/m2, and crystallization temperature rises sharply from 994 °C to 1340 °C. The primary crystalline phase transitions from conventional Ca4Si2F2O7 to Ca2Al2SiO7 and Na2CaAl4O8 as the drainage ratio of tundish flux increases to 1.25. Insights into the breakout mechanism of tundish flux with drainage was derived, drainage of tundish flux induced a higher frictional force acting on the shell and a smaller tearing resistance of the initial shell due to deterioration of lubrication, crystallization, and heat transfer.
Author Contributions
Conceptualization, R.Z., C.P., W.Y. and C.S.; methodology, R.Z., C.P., S.C., W.Y. and C.S.; validation, R.Z.; formal analysis, R.Z., C.P. and S.C.; investigation, R.Z., C.P., S.C. and W.Y.; resources, R.Z. and S.C.; data curation, R.Z., C.P. and S.C.; writing—original draft preparation, R.Z.; writing—review and editing, W.Y. and C.S.; visualization, R.Z. and C.P.; supervision, W.Y. and C.S.; project administration, W.Y.; funding acquisition, W.Y. and S.C. All authors have read and agreed to the published version of the manuscript.
Funding
This research was funded by the National Natural Science Foundation of China (Grant No. 52374317), the Independent R&D Funds of State Key Laboratory of Advanced Metallurgy (41626024) and the Outstanding Engineer Fostering Program of Henan Province (Grant No. 2026OEFP018).
Data Availability Statement
The original contributions presented in this study are included in the article. Further inquiries can be directed to the corresponding author.
Conflicts of Interest
Author Shoujie Chen is employed by Henan Tongyu Metallurgy Materials Group Co., Ltd. The remaining authors declare no conflicts of interest. The employer had no role in the design of the study; in the collection, analyses, or interpretation of data; in the writing of the manuscript; or in the decision to publish the results.
References
- Mills, K.C.; Fox, A.B. The Role of Mould Fluxes in Continuous Casting—So Simple Yet So Complex. ISIJ Int. 2003, 43, 1479–1486. [Google Scholar] [CrossRef] [Scilit]
- Mills, K.C.; Fox, A.B.; Li, Z.; Thackray, R.P. Performance and Properties of Mould Fluxes. Ironmak. Steelmak. 2005, 32, 26–34. [Google Scholar] [CrossRef] [Scilit]
- Li, J.; Yan, B.; Shu, Q.; Chou, K. Structure and Crystallization Kinetics of Glassy CaO-Al2O3-SiO2-CaF2-Na2O Mold Fluxes with Varying Basicity. Metall. Mater. Trans. B 2015, 46, 2458–2469. [Google Scholar] [CrossRef] [Scilit]
- Yan, W.; Hao, Z.; Chen, W.; Li, J. Mixing Effect of Slag Compositions and Additives on Crystallization Characteristic of TiO2-Bearing Mold Flux. J. Mater. Res. Technol. 2021, 10, 882–894. [Google Scholar] [CrossRef] [Scilit]
- Seo, M.-D.; Shi, C.-B.; Cho, J.-W.; Kim, S.-H. Crystallization Behaviors of CaO-SiO2-Al2O3-Na2O-CaF2-(Li2O-B2O3) Mold Fluxes. Metall. Mater. Trans. B 2014, 45, 1874–1886. [Google Scholar] [CrossRef] [Scilit]
- Zhou, L.; Luo, H.; Wang, W.; Yan, X.; Wu, H. Effect of Al2O3/Na2O Ratio and MnO on High-Temperature Properties of Mold Flux for Casting Peritectic Steel. J. Iron Steel Res. Int. 2022, 29, 53–60. [Google Scholar] [CrossRef] [Scilit]
- Li, Z.R.; Jia, B.R.; Zhang, Y.B.; He, S.P.; Wang, Q.Q.; Wang, Q. Dissolution Behaviour of Al2O3 in Mould Fluxes with Low SiO2 Content. Ceram. Int. 2019, 45, 4035–4042. [Google Scholar] [CrossRef] [Scilit]
- Yan, W.; Chen, W.; Yang, Y.; Lippold, C.; McLean, A. Effect of Slag Compositions and Additive on Heat Transfer and Crystallization of Mold Fluxes for High-Al Non-Magnetic Steel. ISIJ Int. 2015, 55, 1000–1009. [Google Scholar] [CrossRef] [Scilit]
- Shen, Y.; Liu, X.; Chen, S.; Wang, Y.; Yan, W.; Li, J. Unveiling the Effect of MnO/SiO2 Ratios on the Viscosity and Structure of Mold Fluxes for High-Mn Cryogenic Steels. Ceram. Int. 2023, 49, 29308–29316. [Google Scholar] [CrossRef] [Scilit]
- Yang, J.; Zhu, M. Evolution of Compositions and Properties of CaO–SiO2 Based Mold Flux for Continuous Casting High Mn Steel. ISIJ Int. 2016, 56, 2191–2198. [Google Scholar] [CrossRef] [Scilit]
- Jin, H.; Peng, X.; Wang, Q.; He, S.; Zhang, X.; Zhang, Y. Performance Evolution of Mold Slag in the Continuous Casting Process of High-Titanium Wear-Resistant Steel. Steel Res. Int. 2025, 96, 368. [Google Scholar] [CrossRef] [Scilit]
- Qi, J.; Liu, C.; Liu, H.; Li, C.; Jiang, M. Effect of Rare Earth Oxide on the Crystallization Behavior of CaO-Al2O3-Based Mold Flux for Rare Earth Heat-Resistant Steel Continuous Casting. J. Non-Cryst. Solids 2021, 559, 120681. [Google Scholar] [CrossRef] [Scilit]
- Zhang, L.; Wang, W.; Sohn, I. Crystallization Behavior and Structure Analysis for Molten CaO-SiO2-B2O3 Based Fluorine-Free Mold Fluxes. J. Non-Cryst. Solids 2019, 511, 41–49. [Google Scholar] [CrossRef] [Scilit]
- Hou, Z.; Xia, W.; Bao, G.; Li, X.; Wu, T.; Lei, J. Effects of Direct Current Electric Field on Interfacial Reactions Between CaO–SiO2 Slag and Al-Containing Steel. Metall. Mater. Trans. B 2025, 56, 6470. [Google Scholar] [CrossRef] [Scilit]
- Xiao, P.-C.; Liu, X.Y.; Wang, X.L.; Zhu, L.G. Effect of Different Temperatures on Isothermal Crystallization Kinetics, Internal Composition and Structure of Mold Flux under Static Magnetic Field Regulation. Mater. Sci. Technol. 2026, 02670836261443605. [Google Scholar] [CrossRef] [Scilit]
- Wang, W.; Yan, X.; Zhou, L.; Wu, H.; Zhong, X. Crystallization Behavior of Calcium Silicate-Based Mold Flux under Electropulsing Treatment with Different Pulse Duty Cycles. JOM 2023, 75, 5141–5148. [Google Scholar] [CrossRef] [Scilit]
- Ying, G.; Wang, W.; Zhang, H.; Zeng, J.; Zhou, L. Influence of Electropulsing Treatment on the Solidification and Heat Transfer Behavior of Mold Flux. ISIJ Int. 2019, 59, 450–458. [Google Scholar] [CrossRef] [Scilit]
- Pirker, S.; Lechner, M.; Ernst, G. Numerical Simulation and Experimental Validation of Slag Entrainment during Tundish Draining. Int. J. Cast Met. Res. 2009, 22, 244–247. [Google Scholar] [CrossRef] [Scilit]
- Mills, K.C.; Yuan, L.; Jones, R.T. Estimating the Physical Properties of Slags. J. South. Afr. Inst. Min. Metall. 2011, 111, 649–658. [Google Scholar]
- Li, Z.; Thackray, R.P.; Mills, K.C. A Test to Determine Crystallinity of Mould Fluxes. In Proceedings of the VII International Conference on Molten Slags, Fluxes and Salts, Cape Town, South Africa, January 2004; The South African Institute of Mining and Metallurgy: Johannesburg, South Africa, 2004; pp. 813–819. [Google Scholar]
- Mills, K.C. The Influence of Structure on the Physico-Chemical Properties of Slags. ISIJ Int. 1993, 33, 148–156. [Google Scholar] [CrossRef] [Scilit]
- Haghdani, S.; Tangstad, M.; Einarsrud, K.E. Studying the Structure and Viscosity of MnO-SiO2-CaO-Al2O3-MgO Slag System. Materials 2024, 17, 3789. [Google Scholar] [CrossRef] [Scilit] [PubMed]
- Meng, Y.; Thomas, B.G. Heat-Transfer and Solidification Model of Continuous Slab Casting: CON1D. Metall. Mater. Trans. B 2003, 34, 685–705. [Google Scholar] [CrossRef] [Scilit]
- Mahapatra, R.B.; Brimacombe, J.K.; Samarasekera, I.V. Mold Behavior andIts Influence on Quality in the Continuous Casting of Steel Slabs: Part II. Mold Heat Transfer, Mold Flux Behavior, Formation of Oscillation Marks, Longitudinal Off-corner Depressions, and Subsurface Cracks. Metall. Mater. Trans. B 1991, 22, 875–888. [Google Scholar] [CrossRef] [Scilit]
- Ba, J.T.; Wen, G.H.; Tang, P. Investigation on the Measuring Method to Horizontal Heat Transfer of Mold Slag Film. (In Chinese). In Proceedings of the 4th International Conference on Continuous Casting of Steel in Developing Countries, Beijing, China, November 2008; The Chinese Society of Metals: Beijing, China, 2008; pp. 698–702. [Google Scholar]
- Gu, K.Z.; Wang, W.L.; Zhou, L.J.; Ma, F.J.; Huang, D.Y. The Effect of Basicity on the Radiative Heat Transfer and Interfacial Thermal Resistance in Continuous Casting. Metall. Mater. Trans. B 2012, 43, 937–945. [Google Scholar] [CrossRef] [Scilit]
- Zhou, L.J.; Wang, W.L.; Zhou, K.C. A Study of the Heat Transfer Behavior of Mold Fluxes with Different Amounts of Al2O3. Metals 2016, 6, 139. [Google Scholar] [CrossRef] [Scilit]
- Yang, J.; Zhang, J.Q.; Sasaki, Y.; Ostrovski, O.; Zhang, C.; Cai, D.X.; Kashiwaya, Y. Crystallization Behavior and Heat Transfer of Fluorine-Free Mold Fluxes with Different Na2O Concentration. Metall. Mater. Trans. B 2016, 47, 2447–2458. [Google Scholar] [CrossRef] [Scilit]
- Yang, J.; Zhang, J.Q.; Sasaki, Y.; Ostrovski, O.; Zhang, C.; Cai, D.X.; Kashiwaya, Y. Effect of MgO on Crystallization and Heat Transfer of Fluoride-Free Mold Fluxes. Metall. Mater. Trans. B 2018, 49, 3097–3106. [Google Scholar] [CrossRef] [Scilit]
- Yang, J.; Zhang, J.Q.; Ostrovski, O.; Zhang, C.; Cai, D.X. Effects of Fluorine on Solidification, Viscosity, Structure, and Heat Transfer of CaO-Al2O3-Based Mold Fluxes. Metall. Mater. Trans. B 2019, 50, 1766–1772. [Google Scholar] [CrossRef] [Scilit]
- Seo, M.D.; Shi, C.B.; Wang, H.; Cho, J.W.; Kim, S.-H. Non-isothermal Melt Crystallization of Cuspidine in CaO–SiO2–CaF2 based Glasses. J. Non-Cryst. Solids 2015, 412, 58–65. [Google Scholar] [CrossRef] [Scilit]
- Seo, M.D.; Shi, C.B.; Baek, J.Y.; Cho, J.W.; Kim, S.H. Kinetics of Isothermal Melt Crystallization in CaO–SiO2–CaF2-Based Mold Fluxes. Metall. Mater. Trans. B 2015, 46, 2374–2383. [Google Scholar] [CrossRef] [Scilit]
- Wang, W.; Gu, K.; Zhou, L.; Ma, F.; Sohn, I.; Min, D.J.; Matsuura, H.; Tsukihashi, F. Radiative Heat Transfer Behavior of Mold Fluxes for Casting Low and Medium Carbon Steels. ISIJ Int. 2011, 51, 1838–1845. [Google Scholar] [CrossRef] [Scilit]
- Cantaluppi, M.; Cámara, F. The crystal structure of Na2CaAl4O8 and its hydration behaviour. J. Solid State Chem. 2021, 303, 122478. [Google Scholar] [CrossRef] [Scilit]
- Ostrowski, C.; Żelazny, J. Solid Solutions of Calcium Aluminates C3A, C12A7 and CA with Sodium Oxide. J. Therm. Anal. Calorim. 2004, 75, 867–885. [Google Scholar] [CrossRef] [Scilit]
- Verweij, H.; Saris, C.M.P.M. Phase Formation in the System Na2O∙Al2O3-CaO∙A12O3-Al2O3 at 1200 °C in Air. J. Am. Ceram. Soc. 1986, 69, 94–98. [Google Scholar] [CrossRef] [Scilit]
- Yu, H.; Pan, X.; Tian, Y.; Tu, G. Mineral Transition and Formation Mechanism of Calcium Aluminate Compounds in CaO-Al2O3-Na2O System during High-Temperature Sintering. Int. J. Miner. Metall. Mater. 2020, 27, 924–932. [Google Scholar] [CrossRef] [Scilit]
- Wang, Q.; Zhang, J.; Ostrovski, O.; Zhang, C.; Cai, D. Effect of Al2O3/SiO2 Ratio on Structure and Properties of Mold Flux for High-Al Steel Continuous Casting. J. Sustain. Metall. 2025, 11, 877–887. [Google Scholar] [CrossRef] [Scilit]

Disclaimer/Publisher’s Note: The statements, opinions and data contained in all publications are solely those of the individual author(s) and contributor(s) and not of MDPI and/or the editor(s). MDPI and/or the editor(s) disclaim responsibility for any injury to people or property resulting from any ideas, methods, instructions or products referred to in the content. |
© 2026 by the authors. Licensee MDPI, Basel, Switzerland. This article is an open access article distributed under the terms and conditions of the Creative Commons Attribution (CC BY) license.