


Abstract
The present study compares the effects of temperature, holding time, and nominal carbon excess on the pre-reduction of Donskoy chromite pellets with semi-coke. FactSage equilibrium calculations were interpreted alongside three laboratory series with different baselines. At 180 min with activated bentonite and 25% carbon excess, chromium metallization increased from 58.5% at 1350 °C to 87.0% at 1500 °C. At 1400 °C with attapulgite and 10% excess, extending holding time from 195 to 210 min increased chromium metallization from 70.6% to 82.8%, while residual carbon decreased from 4.96 to 4.00 wt.%. At 1500 °C and 180 min with activated bentonite, increasing excess from 15% to 25% increased chromium metallization from 68.9% to 87.0% and residual carbon from 2.30 to 4.74 wt.%. These condition-specific endpoints do not establish factor interactions, an optimum regime, or a kinetic mechanism. Unavailable uncertainty estimates limit quantitative interpretation. Equilibrium predictions and elemental maps do not independently verify the experimental phase sequence. Any industrial benefits, including chromium recovery, energy consumption, and continuous-process performance, require further validation.
1. Introduction
High-carbon ferrochrome production requires the reduction of chromium- and iron-bearing oxides at high temperature. Pellet pre-reduction transfers part of this reduction duty to a pretreatment stage. The PREMUS process provides an industrial example of this approach [1]. Its performance motivates laboratory investigation, but does not establish the energy consumption or chromium recovery of the present experiments.
Pelletized chromite pre-reduction depends on the characteristics of the ore, reductant, and binder. Binder selection can affect pellet behavior [2,3], while the carbonaceous reductant influences both pre-reduction and cured pellet strength [4]. These variables must be controlled when comparing temperature or holding time effects.
Pre-oxidation is another established research direction. Studies have investigated its influence on subsequent chromite pre-reduction and its techno-economic feasibility [5,6]. At kiln scale, partial pellet melting and accretion formation introduce additional constraints [7]. Thus, a laboratory metallization endpoint is only one of the quantities needed to evaluate an industrial process.
Alternative reduction routes include hydrogen-containing atmospheres [8,9,10] and microwave heating with biochar [11]. These studies address different reductants and heating conditions; their results cannot be transferred directly to conventional semi-coke pellets. SEM image processing has also been evaluated as an alternative method for quantifying chromite pre-reduction [12], and image and Rietveld analyses have been compared for metallization assessment [13]. Elemental maps alone do not provide equivalent phase identification.
Taken together, previous studies show that chromite pellet pre-reduction has been investigated through industrial pre-reduction practice, binder and reductant selection, pre-oxidation, kiln-accretion behavior, alternative reducing atmospheres, microwave heating, and metallization-assessment methods [1,2,3,4,5,6,7,8,9,10,11,12,13]. However, these studies differ in raw materials, reductants, binders, atmospheres, heating methods, and evaluation techniques. Therefore, their results cannot be used directly to rank the effects of temperature, holding time, and nominal carbon excess in the present semi-coke pellet system.
The present work does not use a crossed or full factorial experimental design. It compares three reported laboratory series for Donskoy chromite concentrate: temperature variation, holding time variation, and nominal carbon excess variation. Residual carbon content is treated as a measured response variable. Pellet strength data were not retained for interpretation because the reported values for the same nominal condition could not be verified. Pellet size, binder type, and gas atmosphere were not systematically varied within a common design and are therefore not evaluated as independent effects.
The aim of this study is to describe the observed changes in chromium and iron metallization within each reported series and to distinguish experimental observations from thermodynamic interpretations. Because the series use different binders, temperatures, and carbon additions, the data do not quantify interactions or rank the importance of the factors.
The objectives are to compare the reported temperature endpoints; evaluate the two holding time and two carbon excess endpoints; examine accompanying residual carbon changes as response data; and assess the limits of the equilibrium and SEM–EDS interpretations. Establishing cross-factor interactions, the effect of pellet size, the effect of reducing atmosphere, or a comprehensive process model is outside the scope of the present dataset.
2. Materials and Methods
The experimental work comprised raw material characterization, equilibrium calculations, pellet preparation, heat treatment, and product analysis. These series do not constitute a full factorial design.
Chromite concentrate from the Donskoy Mining and Processing Plant was used with semi-coke. Activated bentonite was used in the temperature and carbon excess series, and attapulgite in the holding time series. Table 1, Table 2 and Table 3 reproduce the reported material characterization; non-activated bentonite is listed only as a characterized material, with no separate reduction results analyzed here.
Table 1.
Chemical composition of chromite raw material from the Donskoy Mining and Processing Plant.
Table 2.
Physicochemical characteristics of semi-coke.
Table 3.
Chemical composition of binder materials.
The investigated raw material (Table 1) was characterized by a high Cr2O3 content and an elevated Cr/Fe ratio, which is favorable for producing a high-chromium alloy. At the same time, the SiO2 content was 9.00 wt.%; therefore, when interpreting the results, the possible influence of the silica-containing component on phase formation, pellet strength, and accretion formation during subsequent implementation of the process in a rotary kiln was taken into account.
Table 2 reports fixed carbon of 87.50 wt.%, volatile matter of 5.76 wt.%, and ash of 6.76 wt.%. These values total 100.02 wt.% due to rounding and are treated as the dry-basis proximate composition of semi-coke. The moisture value of 19.90 wt.% is reported separately and was not added to the dry-basis proximate components when calculating the reductant basis.
Table 3 lists the reported binder compositions. No independent effect of binder composition on reduction is inferred from these data.
The reported material compositions were used for preliminary equilibrium assessment and charge preparation. Equilibrium phase stability was compared qualitatively with the experimental endpoints.
Equilibrium calculations were performed using FactSage 8.4, Equilib module, at 1 atm over the temperature range of 200–1500 °C. The input system was defined as Cr–Fe–O–C–Si–Mg–Al–Ca, corresponding to the chromite concentrate, semi-coke, and binder components used in the experiments. The FactPS and FToxid databases were used for the calculations.
The equilibrium calculation was normalized to the dry charge basis used for the temperature series baseline. The input consisted of chromite concentrate, semi-coke, and activated bentonite. The chemical composition of the chromite concentrate was taken from Table 1, the semi-coke composition from Table 2, and the activated-bentonite composition from Table 3. Semi-coke was added on a fixed-carbon basis according to the nominal carbon excess calculation described below.
The calculations describe equilibrium phase stability as a function of temperature. They do not account for heating rate, gas transport, reaction rates, pellet-scale gradients, or the temporal sequence of phase formation. Therefore, the calculated phase fields are used only as qualitative thermodynamic context and are not treated as direct predictions of the experimentally determined metallization values.
Charge preparation followed the preliminary thermodynamic assessment. The chromite concentrate, semi-coke, and binder materials were preliminarily dried in an industrial laboratory Grieve drying oven at 140 °C until the residual moisture content was below 1 wt.%. Moisture content was monitored using an A&D MX-50 moisture analyzer. After drying, the components were dosed according to the calculated charge composition and ground in a laboratory Herzog disk mill. The target particle-size distribution corresponded to at least 94% of particles finer than 75 µm. The selected degree of grinding increased the contact area between chromite grains and the carbonaceous reductant, thereby promoting the intensification of high-temperature reduction reactions.
The reductant addition was calculated on a fixed-carbon basis using the dry-basis fixed-carbon content of semi-coke, 87.50 wt.%. The nominal stoichiometric carbon requirement was calculated for the reduction of FeO and Cr2O3 to Fe and Cr with CO as the gaseous product: FeO + C → Fe + CO and Cr2O3 + 3C → 2Cr + 3CO. Therefore, the stoichiometric carbon amount was calculated as Cst = MC (nFeO + 3nCr2O3), where MC is the molar mass of carbon and nFeO and nCr2O3 are the mole amounts of FeO and Cr2O3 in the chromite concentrate. The semi-coke addition was then calculated as msemi-coke = Cst (1 + E/100)/0.875, where E is the nominal carbon excess, %. Nominal excess levels in the analyzed series were 10%, 15%, and 25%. The calculation does not include carbon consumed by carbide formation, gasification side reactions, volatile release, or reduction of minor oxide components; therefore, carbon excess is treated as a nominal charge parameter. After dry mixing, distilled water was added to obtain approximately 10 wt.% moisture.
The described preparation procedures included cylindrical pressed specimens of 13 mm diameter, formed under a load of 750–900 N, and spherical pellets of 20 ± 3 mm diameter. Samples were placed in ceramic crucibles of 40 mm internal diameter and 45 mm height. The available series descriptions do not assign these geometries to individual measurements; no geometry effect is inferred.
The heat treatment included drying, preheating, and high-temperature reduction stages. Preheating was carried out in a CM Rapid-Temp laboratory muffle furnace, whose temperature profile ensured the sequential removal of free moisture, dehydration of the binder, and strengthening of the pellet structure. In the standard mode, the temperature was increased from 25 to 280 °C over 8 min, then from 280 to 320 °C over another 8 min, followed by heating to 950 °C over 30 min. To reduce cracking, an additional mode with a lower heating rate at the initial stages was applied, in which the heating time was increased to 16 min for each of the first two temperature intervals.
After preheating to 950 °C, samples underwent high-temperature treatment at the conditions summarized in Table 4 and were subsequently furnace-cooled under nitrogen for approximately 3 h. The available experimental description mentions limited air access and nitrogen cooling, but does not provide oxygen partial pressure, gas flow rate, nitrogen purity, or a separate atmosphere assignment for each experimental series. Nitrogen cooling was intended to limit secondary oxidation; however, its effectiveness was not quantified. Because reactions may continue during the high-temperature part of cooling, the reported metallization and residual carbon values are interpreted as final endpoint values after the complete heat treatment cycle, rather than as results of the nominal isothermal holding period alone.
Table 4.
Conditions of the three analyzed experimental series.
The comparisons in this study are based only on the three experimental series listed in Table 4. Within each series, the comparison was made between the reported endpoint conditions for the variable specified in that series, while the remaining preparation and heat treatment steps were kept within the same procedural route. Pellet geometry and atmosphere were not included as independent variables in the analyzed experimental design. The preparation procedure included cylindrical pressed specimens of 13 mm diameter and spherical pellets of 20 ± 3 mm diameter; these geometries are therefore reported as part of specimen preparation, but no separate geometry effect is evaluated. High-temperature treatment was performed under limited air access followed by furnace cooling under nitrogen; the atmosphere was not varied as a separate factor. Chromium and iron metallization and residual carbon are reported as endpoint determinations on the prepared reduced material after grinding. The reported values are therefore used as endpoint values rather than statistical averages with replicate uncertainty.
For chemical analysis after cooling, reduced material was ground in a laboratory disk mill and subjected to comprehensive chemical analysis. For each determination, a 1.0000 ± 0.0002 g sample was taken and dissolved in a mixture of phosphoric and sulfuric acids at approximately 120 °C, followed by dilution and filtration. The contents of reduced forms of chromium and iron were determined by titration using standardized potassium dichromate and ferrous ammonium salt solutions. For the determination of soluble chromium, preliminary oxidation with potassium permanganate was applied, whereas soluble iron was determined by direct titration of the prepared solution. The residual carbon content was measured using an ELTRA CS-2000 analyzer by high-temperature combustion in an oxygen flow with infrared detection of the released carbon dioxide.
The degree of metallization of chromium and iron was calculated as an operational wet-chemical index:
where Mi is the degree of metallization of element i, %; Ci,red is the content of element i determined by the applied wet-chemical procedure as the reduced form, wt.%; and Ci,tot is the total content of the corresponding element i in the sample, wt.%. In this notation, “reduced form” is an analytical term rather than a phase-specific assignment. The selectivity of the dissolution and titration procedure for metallic alloy, carbides, and lower-oxide species was not established in the present study. Consequently, the reported metallization values should not be interpreted as phase-resolved metallic alloy fractions.
To ensure the reproducibility of the experiments, the main laboratory equipment used for charge preparation, pellet forming, heat treatment, and analytical control is summarized in Table 5. This equipment covers all key stages of the study, including weighing of the initial materials, drying, grinding, sample forming, reduction roasting, and determination of residual carbon content.
Table 5.
Main laboratory equipment.
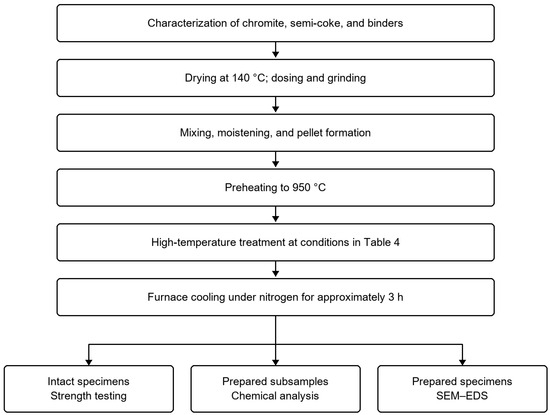
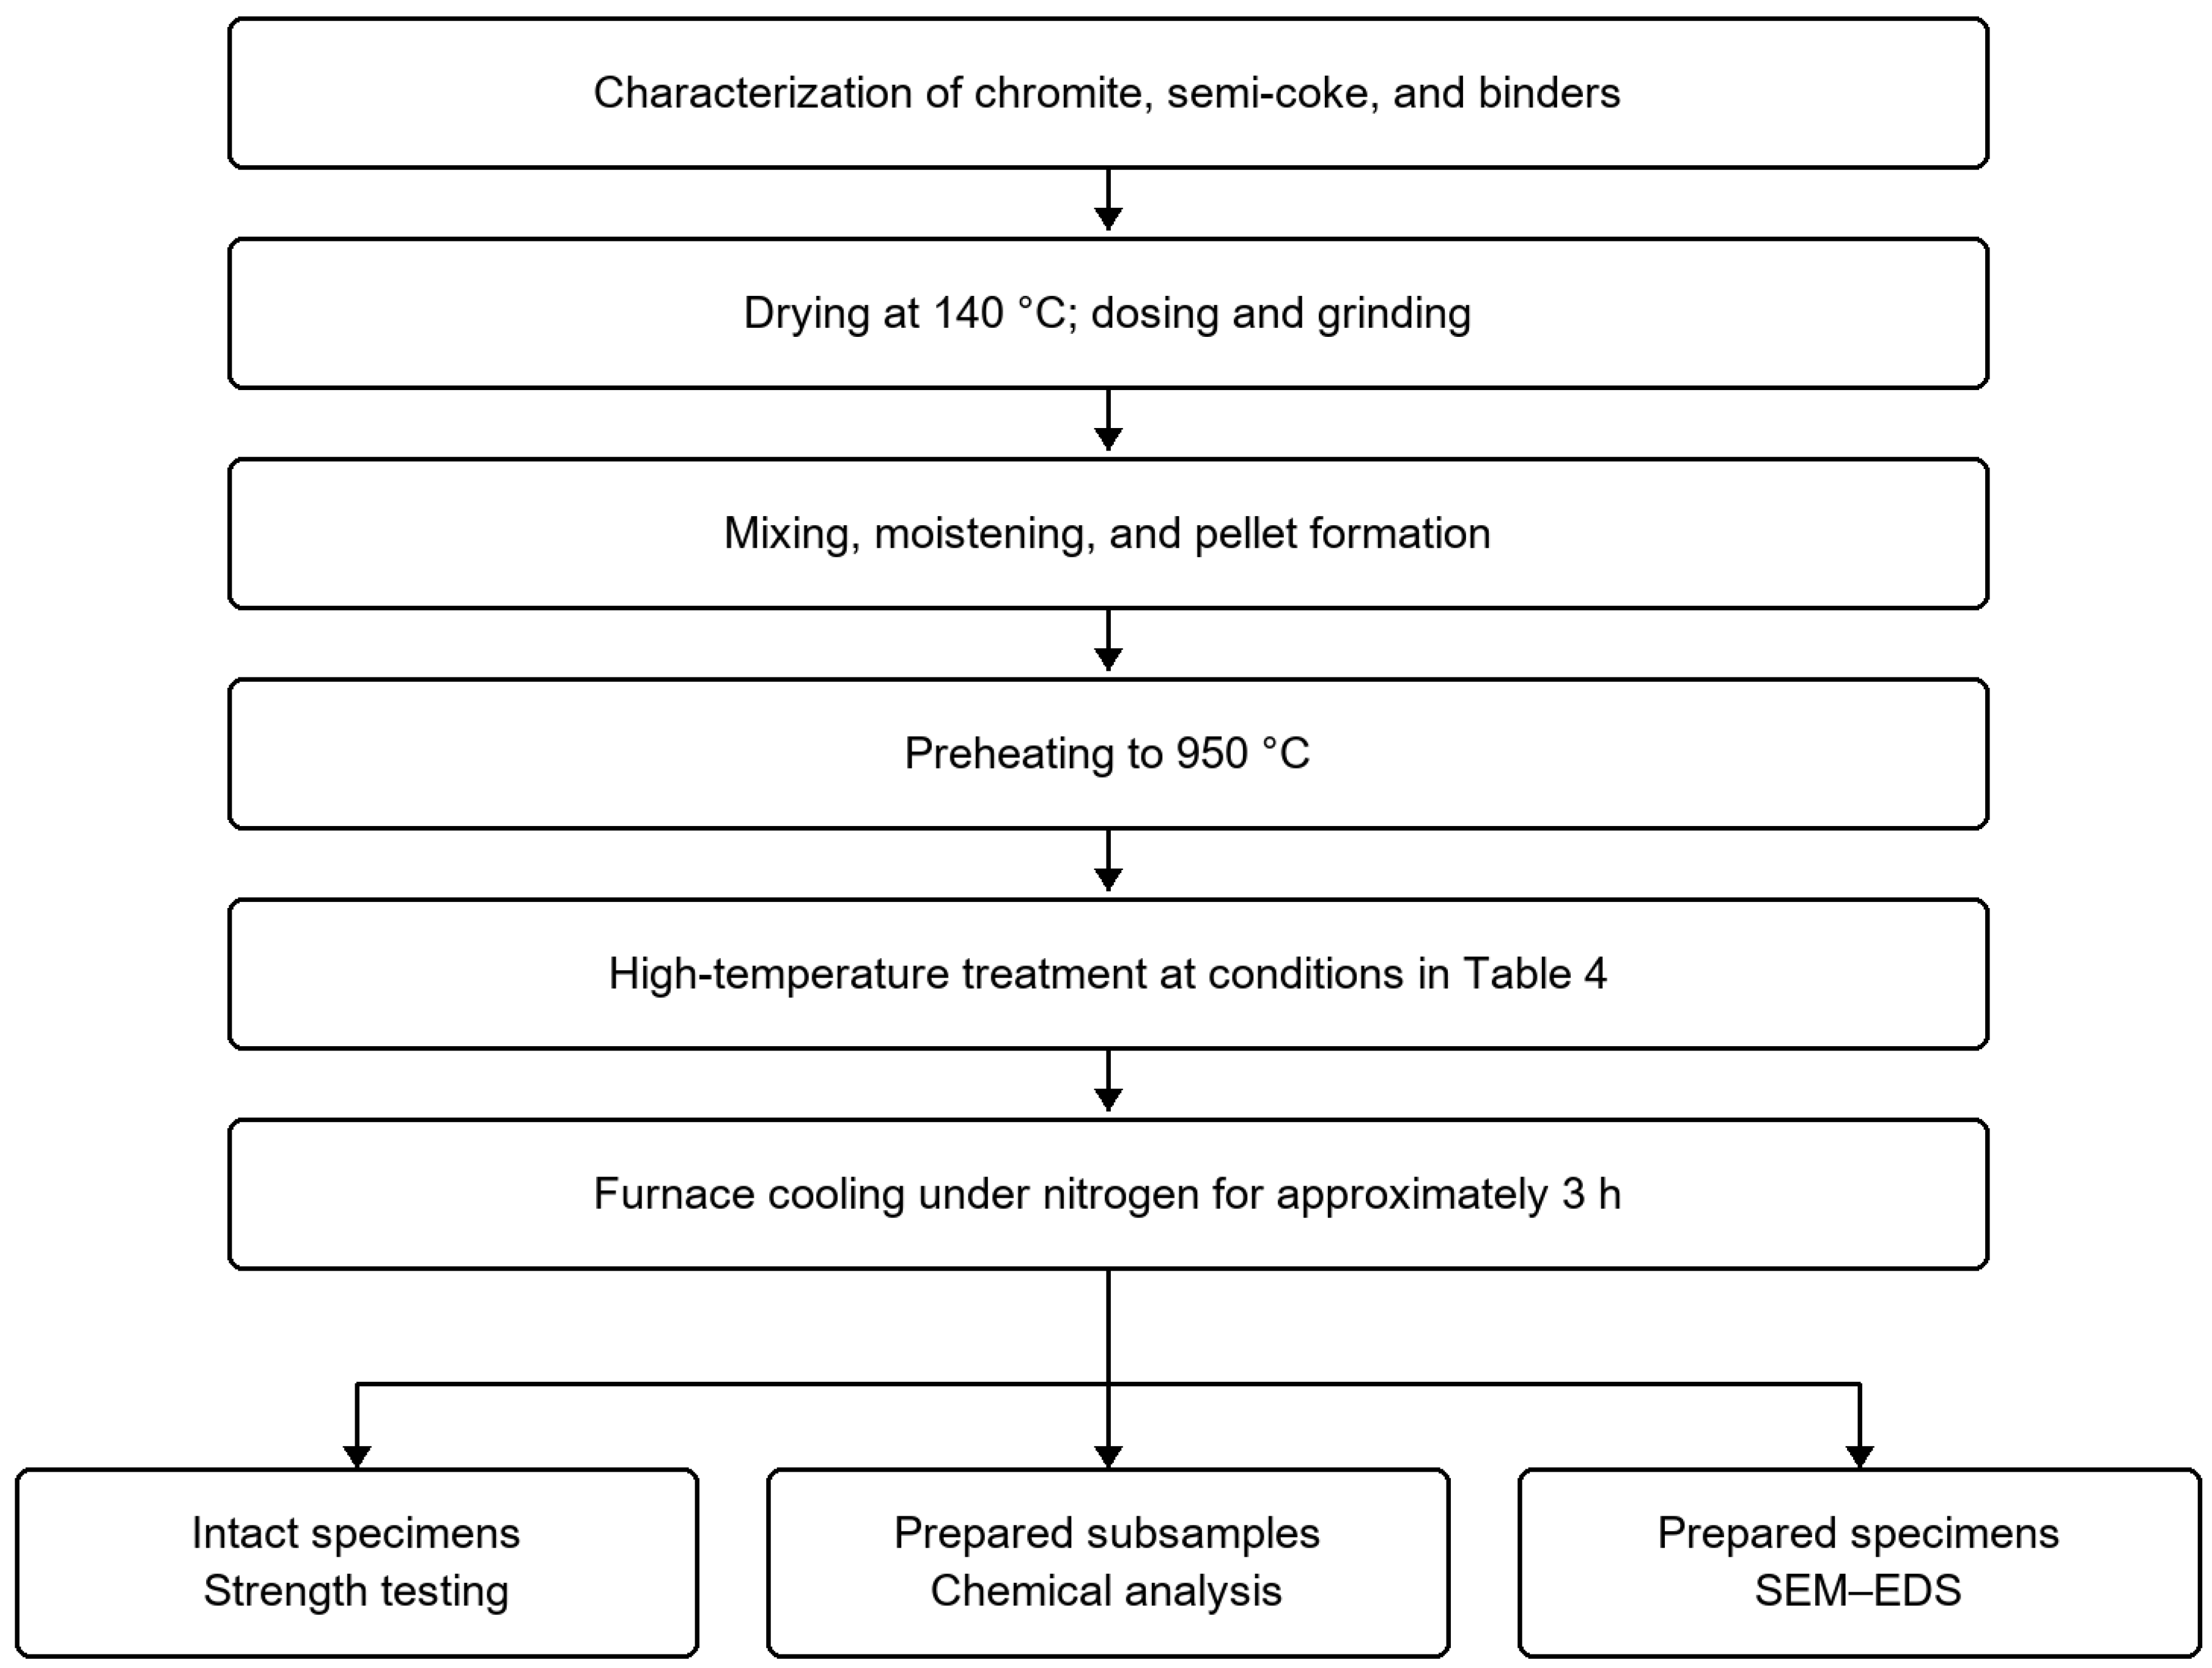
The experimental sequence is summarized in Figure 1. Chemical analysis and strength testing require separate specimen allocation; the grinding step applies to the chemical-analysis portion.
Figure 1.
Workflow for chromite pellet pre-reduction and product characterization. Analytical and mechanical measurements require separate specimen allocation.
The redesigned workflow in Figure 1 summarizes material preparation, heat treatment, and product characterization.
Mechanical testing applies to intact specimens, whereas chemical and microscopy analyses require appropriate sample preparation. The specimen allocation must be documented in the experimental protocol.
Figure 1 summarizes the reported preparation and treatment sequence. The assignment of specimens to analytical and mechanical measurements must be specified when documenting the complete experimental protocol.
3. Results and Discussion
3.1. Thermodynamic Modeling of the Pre-Reduction Process
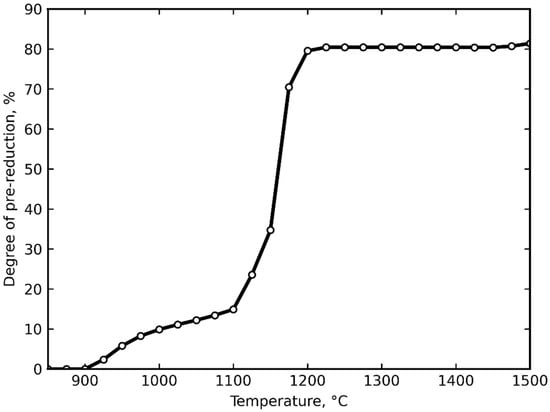
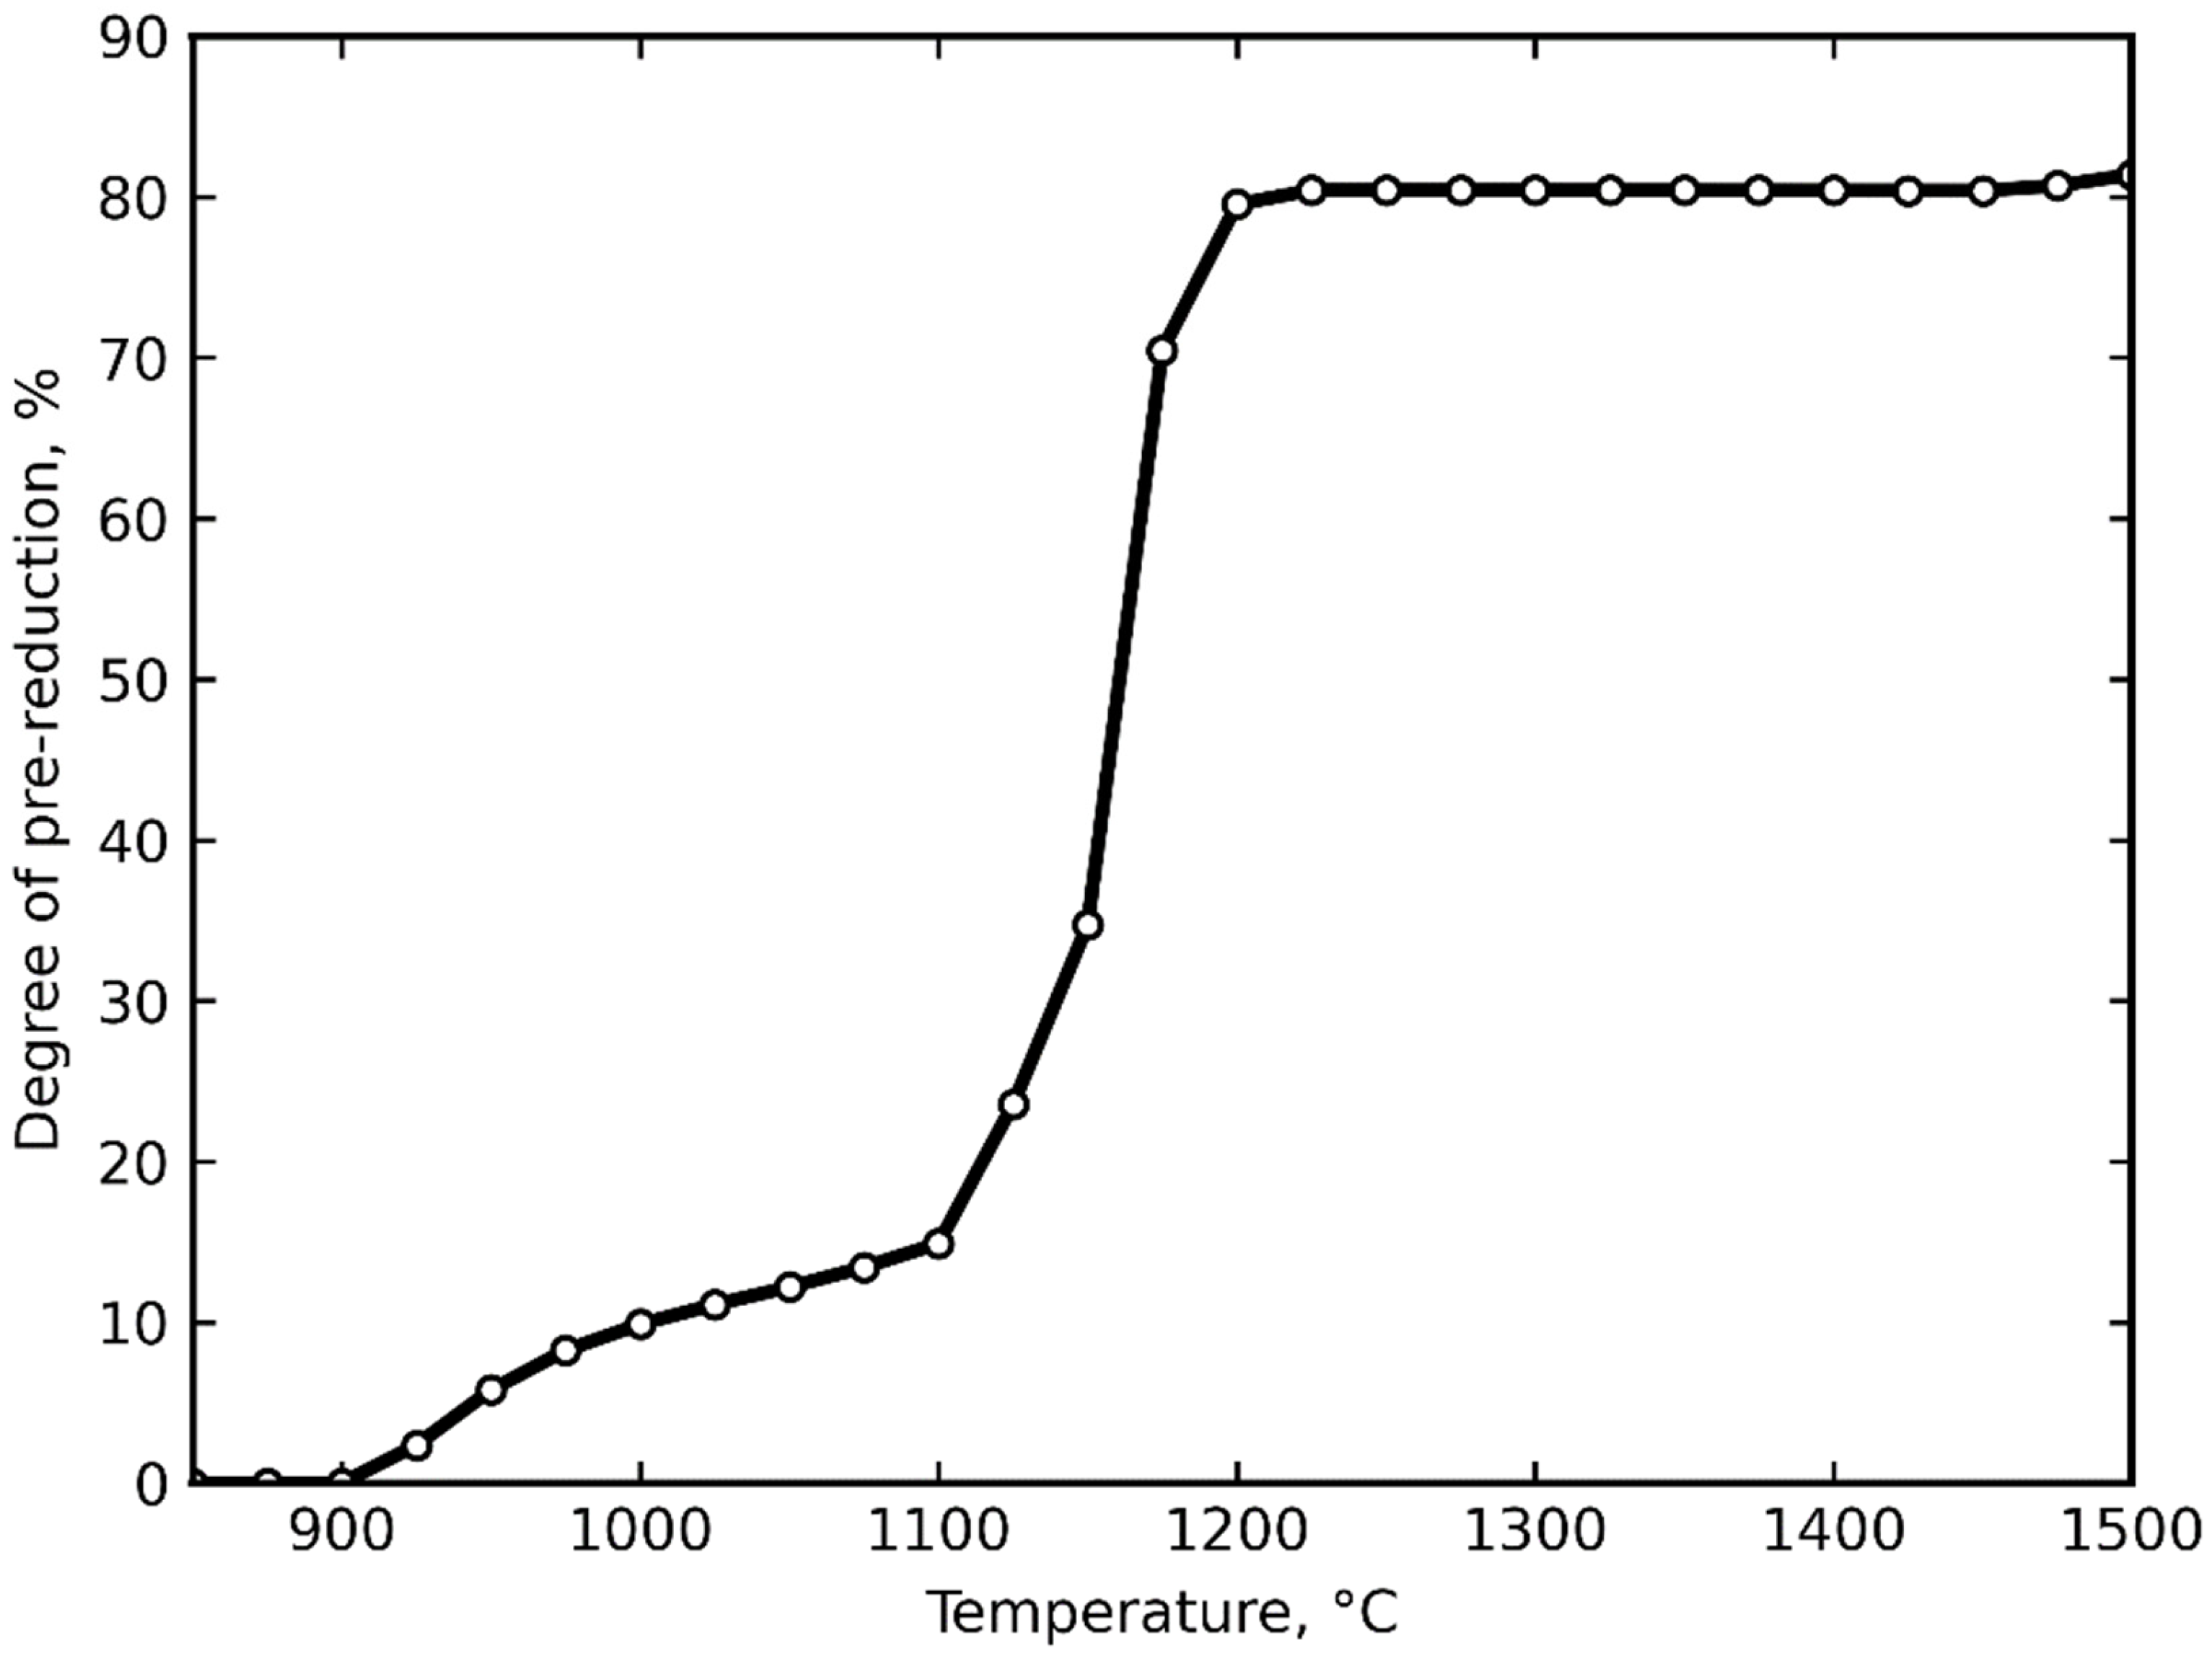
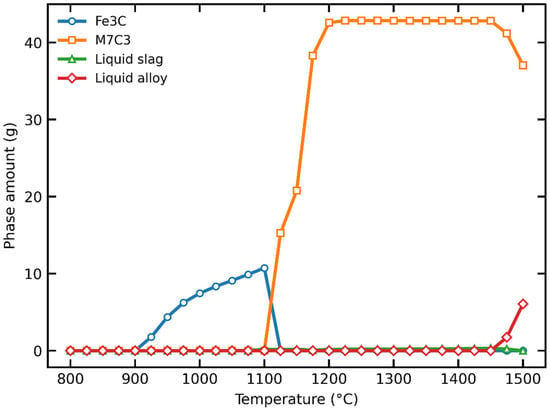
Figure 2 and Figure 3 show the reported equilibrium calculations for the Cr–Fe–O–C–Si–Mg–Al–Ca input system. They are interpreted as equilibrium trends, not as reaction progress with time.
Figure 2.
Calculated equilibrium pre-reduction index of the chromite concentrate versus temperature according to FactSage thermodynamic modeling. The index is calculated as the fraction of total Cr and Fe assigned by the equilibrium calculation to reduced condensed phases, including Fe3C, M7C3-type carbide, and liquid alloy, relative to the total Cr and Fe introduced into the calculation.
Figure 3.
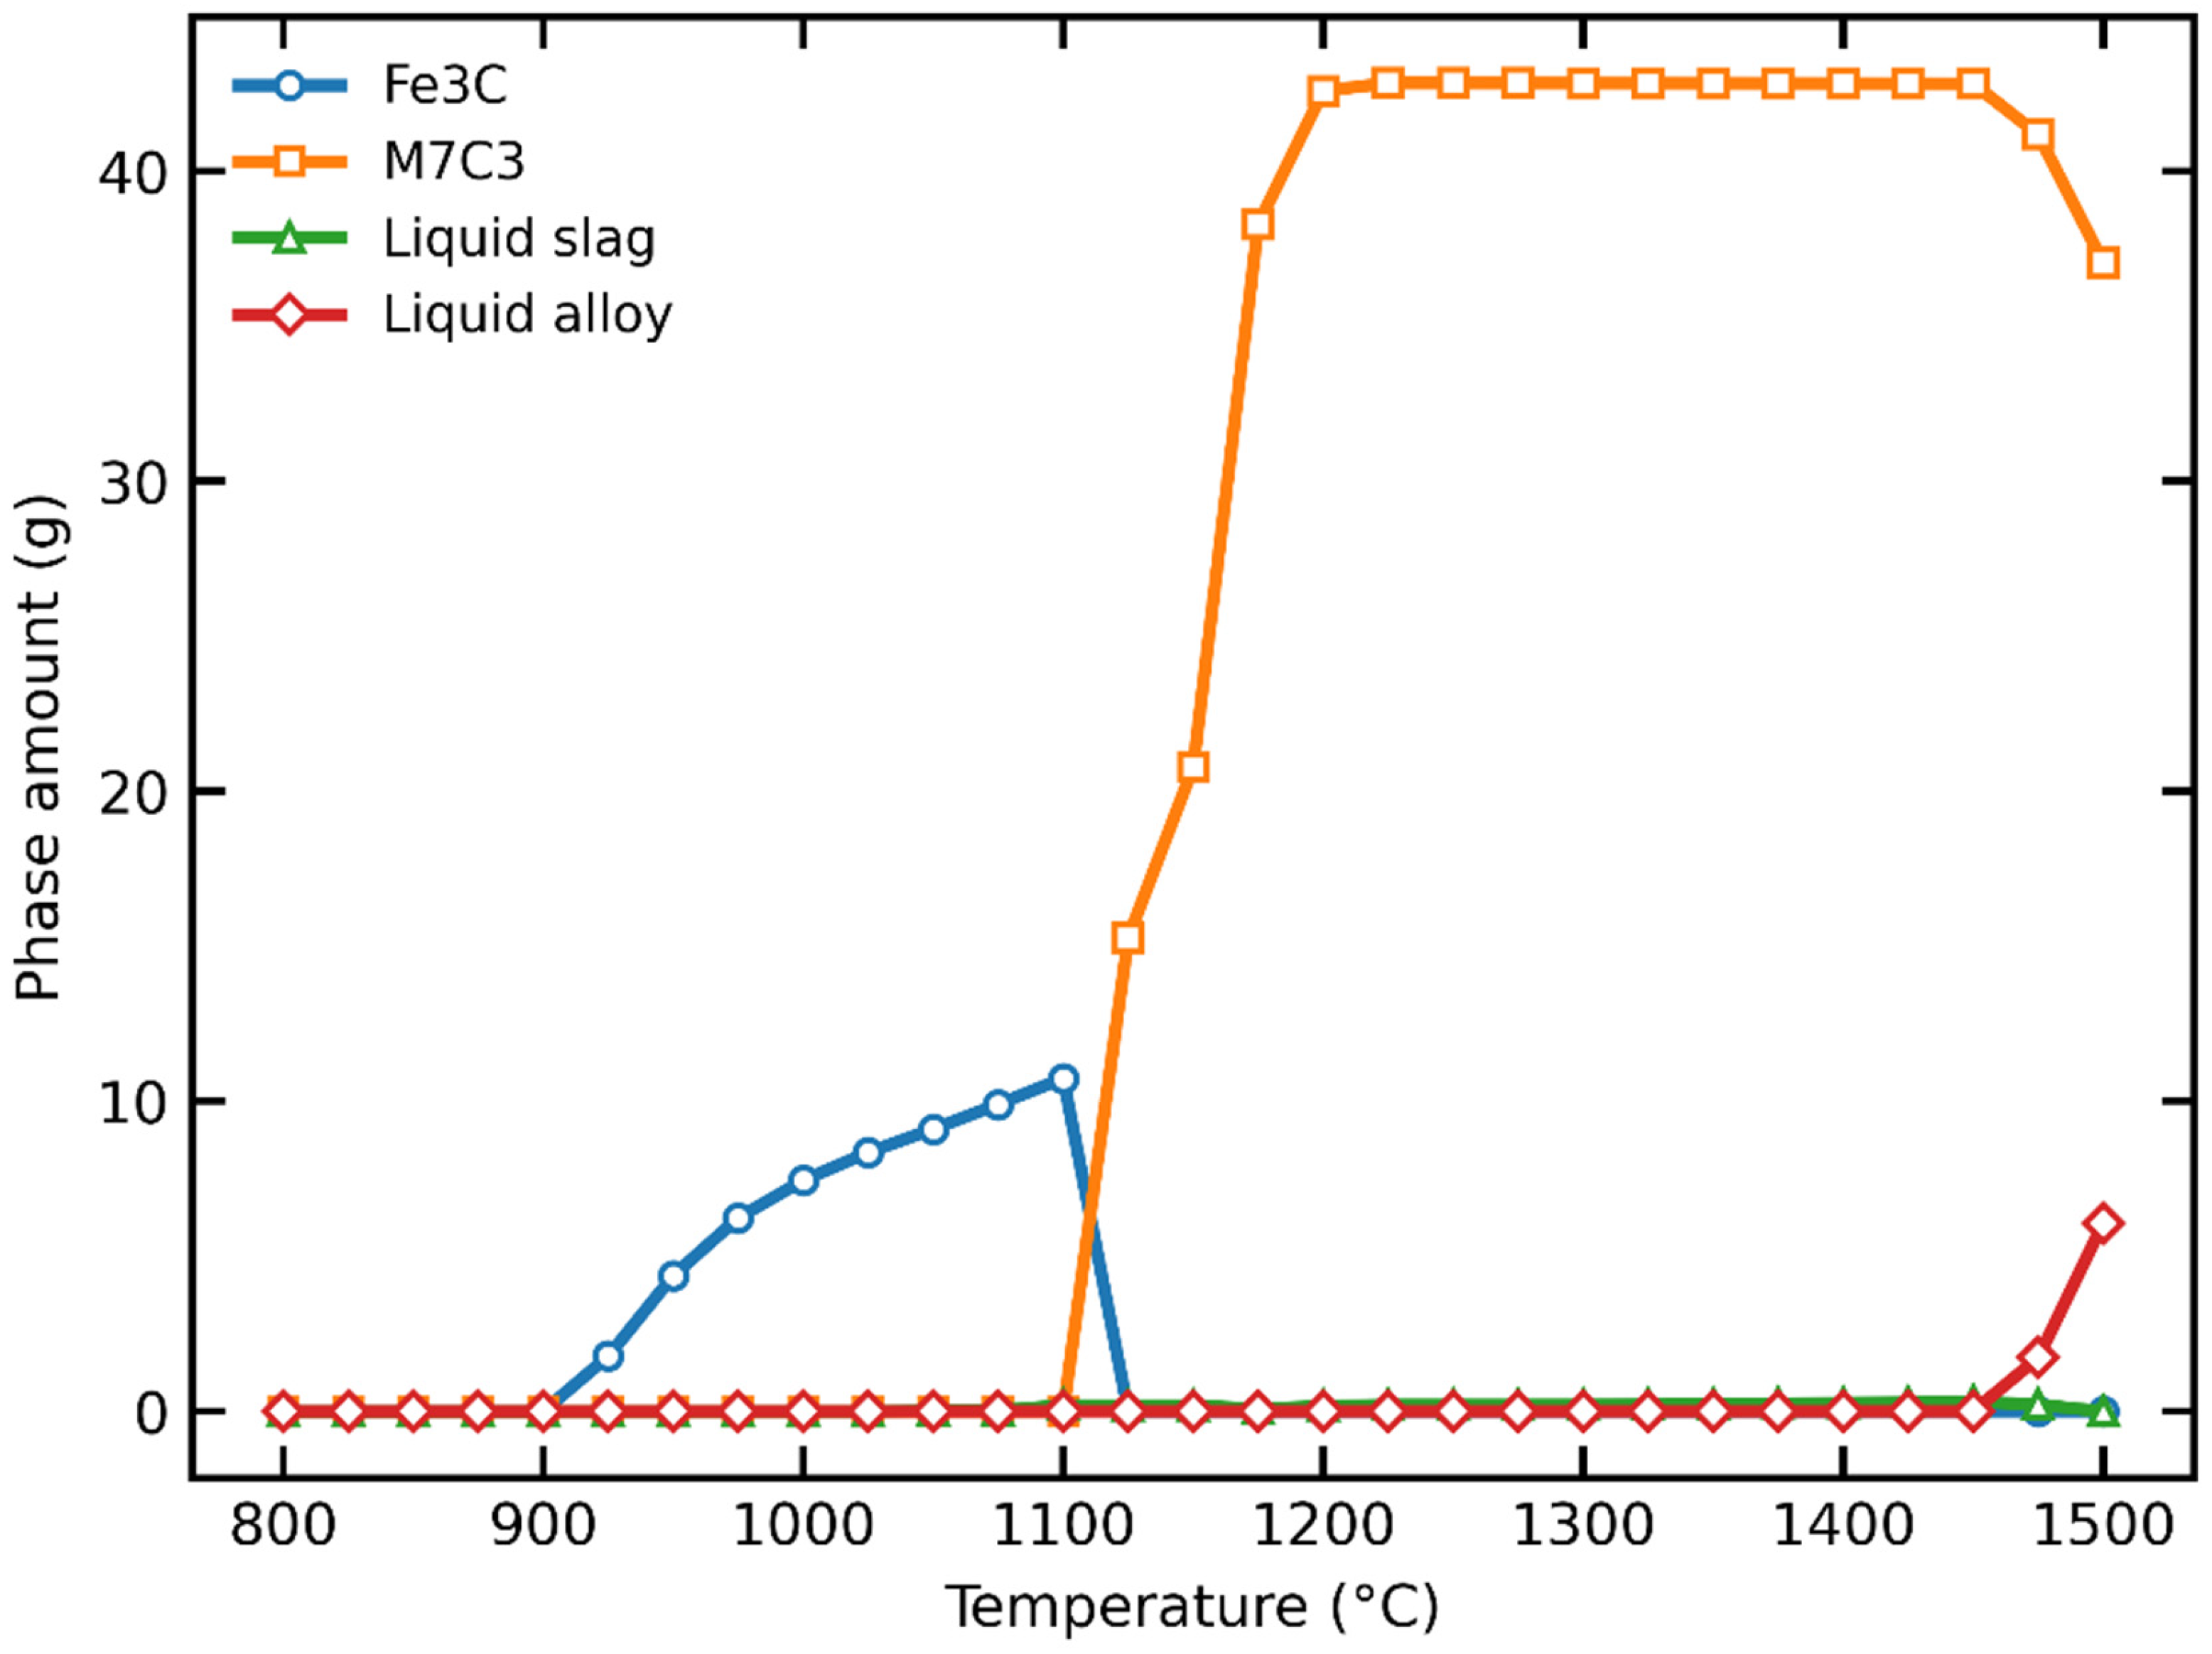
Reported equilibrium phase amounts versus temperature for the Cr–Fe–O–C–Si–Mg–Al–Ca input system.
No kinetic model was fitted because the dataset does not include time-resolved sampling, intermediate phase measurements, gas composition data, or replicate measurements required for estimating rate constants, activation energy, or diffusion parameters. Therefore, the model–experiment comparison is limited to qualitative thermodynamic consistency with the reported endpoint metallization values.
The calculated index in Figure 2 is defined as follows:
where nCrred and nFered are the amounts of chromium and iron assigned in the equilibrium output to reduced condensed phases, including Fe3C, M7C3-type carbide, and liquid alloy. The denominator represents the total amounts of chromium and iron introduced into the calculation through the chromite concentrate. Chromium- and iron-bearing oxide or spinel phases are included in the denominator but not in the numerator. Gas species are not included in this index.
IPR = [(nCrred + nFered)/(nCrtotal + nFetotal)] × 100%,
The calculated index remains low below approximately 1100 °C, rises steeply between about 1100 and 1200 °C, and approaches a plateau near 80%. These approximate intervals are read from the plotted curve. Because the index combines Cr and Fe and includes carbide phases as reduced phases, it should not be interpreted as experimentally determined chromium metallization. It is used only as a qualitative equilibrium indicator of the transfer of Cr and Fe from oxide/spinel phases to reduced condensed phases. The equilibrium curve cannot determine the time required to approach any predicted state.
The experimental temperature series spans 1350–1500 °C. This interval is described as the tested experimental range, rather than as a thermodynamic threshold derived from Figure 2.
Figure 3 provides further information on the temperature dependence of the calculated equilibrium phases.
3.2. Changes in the Equilibrium Phase Composition
The reported equilibrium phase amounts are shown in Figure 3 for the Cr–Fe–O–C–Si–Mg–Al–Ca system. Temperature-dependent stability fields are not a time-resolved transformation sequence.
Figure 3 predicts Fe3C over an intermediate temperature interval and an M7C3-type carbide at higher temperatures. The labels refer to calculated phases, not phases independently identified in the experimental specimens.
The change from Fe3C to M7C3 stability with increasing calculation temperature is consistent with a thermodynamic interpretation involving Cr-bearing carbides. It does not establish Fe3C as an experimentally observed intermediate or determine the order of reactions during heating.
Figure 3 predicts a nonzero liquid alloy amount near 1500 °C. Therefore, the calculation does not support an entirely solid-state description throughout the tested range. At 1500 °C, the plotted liquid alloy amount was approximately 6 g. This value was read from the reported phase-amount curve and is used only to place the calculated liquid alloy formation in context. Because the available plot shows selected equilibrium phases rather than the complete equilibrium output for all condensed phases, the liquid alloy amount was not converted into a mass fraction of the total condensed material.
Possible partial melting is relevant to pellet integrity and kiln accretion, but these industrial consequences were not measured in the present experiments [7].
The equilibrium results provide qualitative context for phase stability. They do not establish an optimum experimental temperature, a minimum temperature for practical reduction, or the presence of the calculated phases in the cooled specimens.
3.3. Effect of Reduction Temperature on the Degree of Metallization of Chromite Pellets
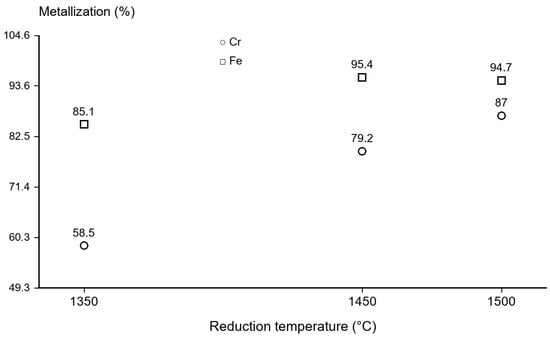
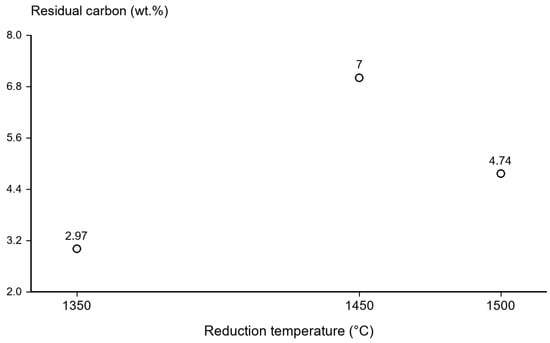
The temperature series used a nominal holding time of 180 min, semi-coke, activated bentonite, and 25% nominal carbon excess. Reported metallization and residual carbon endpoints are shown in Figure 4 and Figure 5.
Figure 4.
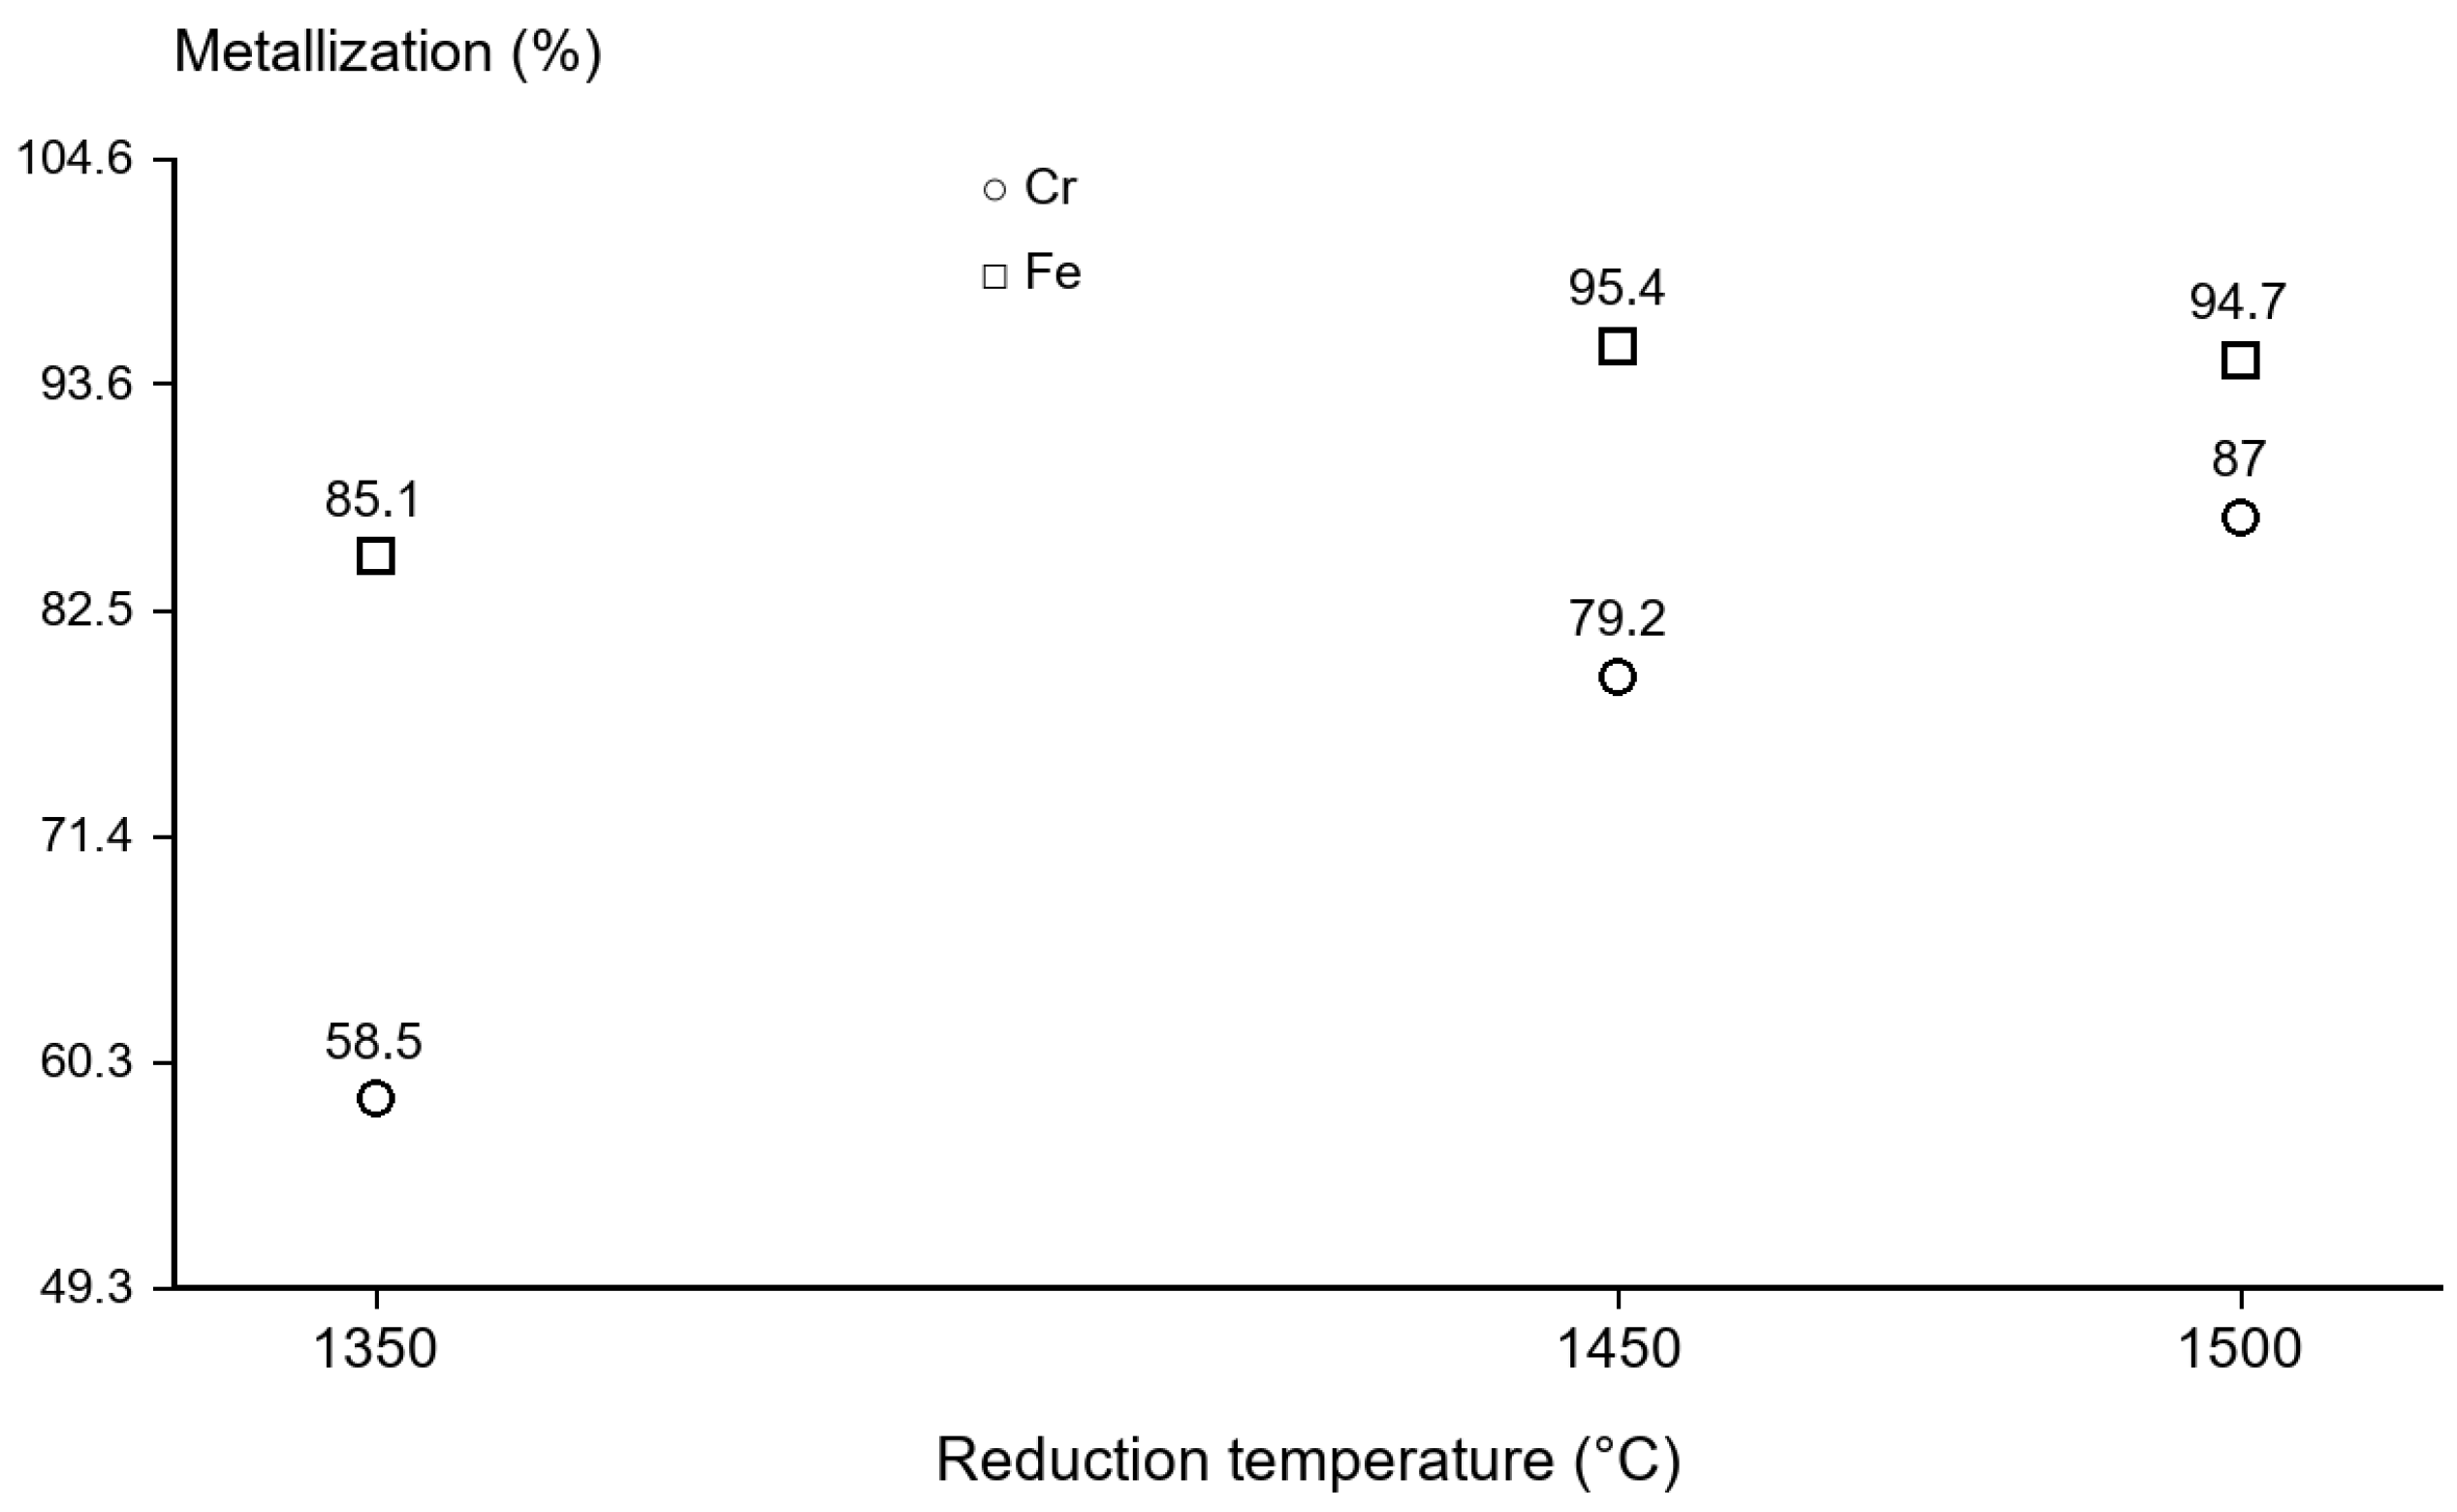
Reported Cr and Fe metallization versus temperature. Markers show available endpoints; replicate counts and uncertainty are unavailable.
Figure 5.
Reported residual carbon versus temperature. Markers show available endpoints; replicate counts and uncertainty are unavailable.
As shown in Figure 4, reported chromium metallization was 58.5% at 1350 °C, 79.2% at 1450 °C, and 87.0% at 1500 °C. The total increase was 28.5 percentage points. Statistical significance cannot be assessed without independent replication and uncertainty.
Iron metallization was 85.1%, 95.4%, and 94.7% at 1350, 1450, and 1500 °C, respectively. The 0.7 percentage point difference between the last two endpoints cannot be judged against experimental error because uncertainty estimates are unavailable.
The increase in chromium metallization is qualitatively compatible with more favorable reduction conditions at higher temperature. Changes in gasification, gas composition, transport, and phase formation remain possible explanations; the present measurements do not separate their contributions.
Residual carbon was 2.97, 7.00, and 4.74 wt.% at 1350, 1450, and 1500 °C, respectively (Figure 5). These concentration changes do not constitute a carbon balance: reduction, gasification, oxidation, and changes in the product mass can all influence residual carbon. No off-gas balance is available to distinguish these contributions.
Among the tested temperatures, the reported chromium metallization was 79.2–87.0% at 1450–1500 °C. This identifies the higher reported endpoints, not an optimum temperature range considering strength, energy, or productivity.
For chromium, the endpoint increase is 20.7 percentage points over 1350–1450 °C and 7.8 percentage points over 1450–1500 °C. Dividing by the respective temperature intervals gives descriptive secant slopes of 0.207 and 0.156 percentage points per °C. These are differences between measured endpoints, not kinetic constants or a validated predictive function. Three temperatures without uncertainty do not establish curvature, justify extrapolation, or provide a general relationship between process temperature and chromium metallization. Therefore, the temperature dependence is described only within the tested interval of 1350–1500 °C and should not be used to predict chromium metallization outside the measured conditions.
Taken together, Figure 4 and Figure 5 show that the highest reported chromium metallization in the temperature series was obtained at 1500 °C, whereas residual carbon did not change monotonically over the same temperature interval. Therefore, residual carbon is interpreted only as an endpoint concentration and not as a direct measure of carbon utilization, reaction completeness, or process efficiency. Because off-gas composition and product mass balance were not measured, the temperature series is discussed as endpoint data rather than as a kinetic or carbon-balance assessment.
3.4. Effect of Holding Time on the Degree of Pre-Reduction of Chromite Pellets
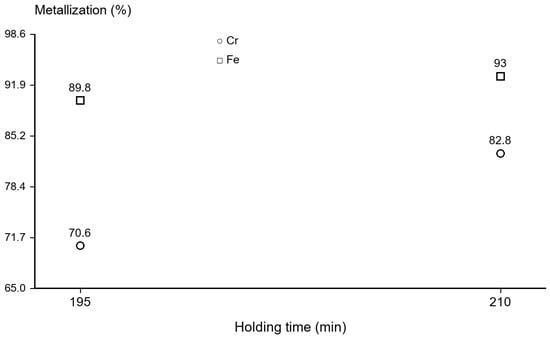
The holding time series was used to compare two reported endpoint conditions at the same baseline. Experiments were carried out at 1400 °C using semi-coke as the reductant, attapulgite as the binder, and 10% nominal carbon excess. Within this series, the nominal holding time was varied from 195 to 210 min, while the temperature, binder, and nominal carbon excess were fixed at 1400 °C, attapulgite, and 10%, respectively. The results are presented in Figure 6. Increasing the nominal holding time from 195 to 210 min was accompanied by an increase in the reported metallization of both chromium and iron. Chromium metallization increased from 70.6 to 82.8%, whereas iron metallization increased from 89.8 to 93.0%. The larger chromium change indicates a stronger endpoint difference for chromium under this baseline, but the two-point comparison does not establish a kinetic trend, diffusion control, or a rate-controlling mechanism.
Figure 6.
Reported Cr and Fe metallization versus holding time. Markers show available endpoints; replicate counts and uncertainty are unavailable.
The two holding time endpoints show a higher final metallization after the longer treatment. They do not provide a time-resolved reaction rate, identify a rate-controlling step, or demonstrate diffusion control. Additional time points and independent kinetic evidence would be required.
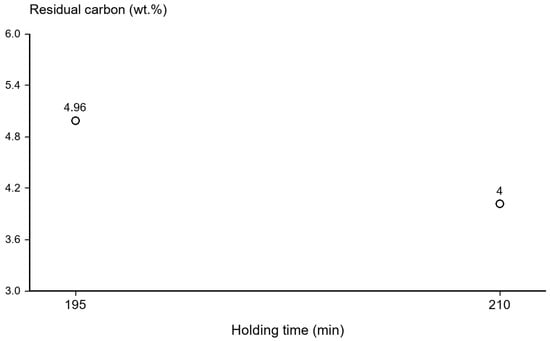
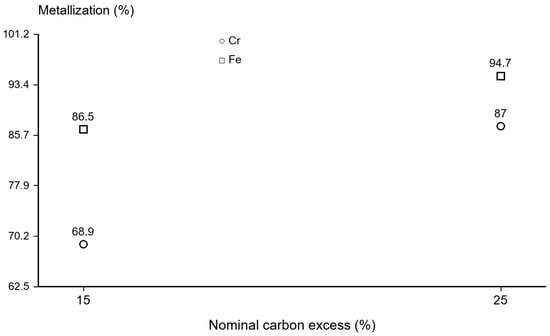
Residual carbon decreased from 4.96 to 4.00 wt.% as nominal holding time increased from 195 to 210 min (Figure 7). Its decrease alongside increased metallization is consistent with continued reaction, but carbon utilization efficiency cannot be calculated without a carbon and product mass balance.
Figure 7.
Reported residual carbon versus holding time. Markers show available endpoints; replicate counts and uncertainty are unavailable.
Table 6 summarizes the two available holding time endpoints at the 1400 °C, attapulgite, and 10% nominal carbon excess baseline. Because replicate counts, individual measurements, and standard deviations are unavailable, the values are reported as endpoint entries rather than statistical means.
Table 6.
Reported holding time endpoints at 1400 °C with attapulgite and 10% nominal carbon excess.
Chromium metallization increased by 12.2 percentage points between the two holding time conditions. Neither 195 nor 210 min can be identified as an optimum from these two endpoints. The 180 min conditions reported in the temperature and carbon excess series used different temperatures, carbon additions, and, in the holding time comparison, a different binder; therefore, they cannot serve as additional time points at the same baseline. Productivity and energy consequences were not quantified.
3.5. Effect of Carbon Excess on the Degree of Pre-Reduction of Chromite Pellets
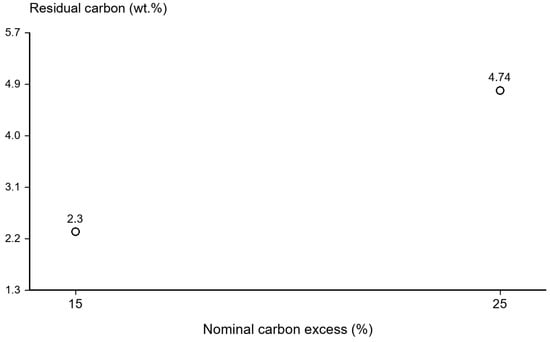
The carbon excess series was used to compare two reported endpoint conditions at the same temperature, holding time, and binder baseline. The series was carried out at 1500 °C with a nominal holding time of 180 min, using semi-coke as the reductant and activated bentonite as the binder. Within this series, the nominal carbon excess was varied from 15 to 25%, while the temperature, nominal holding time, and binder were fixed.
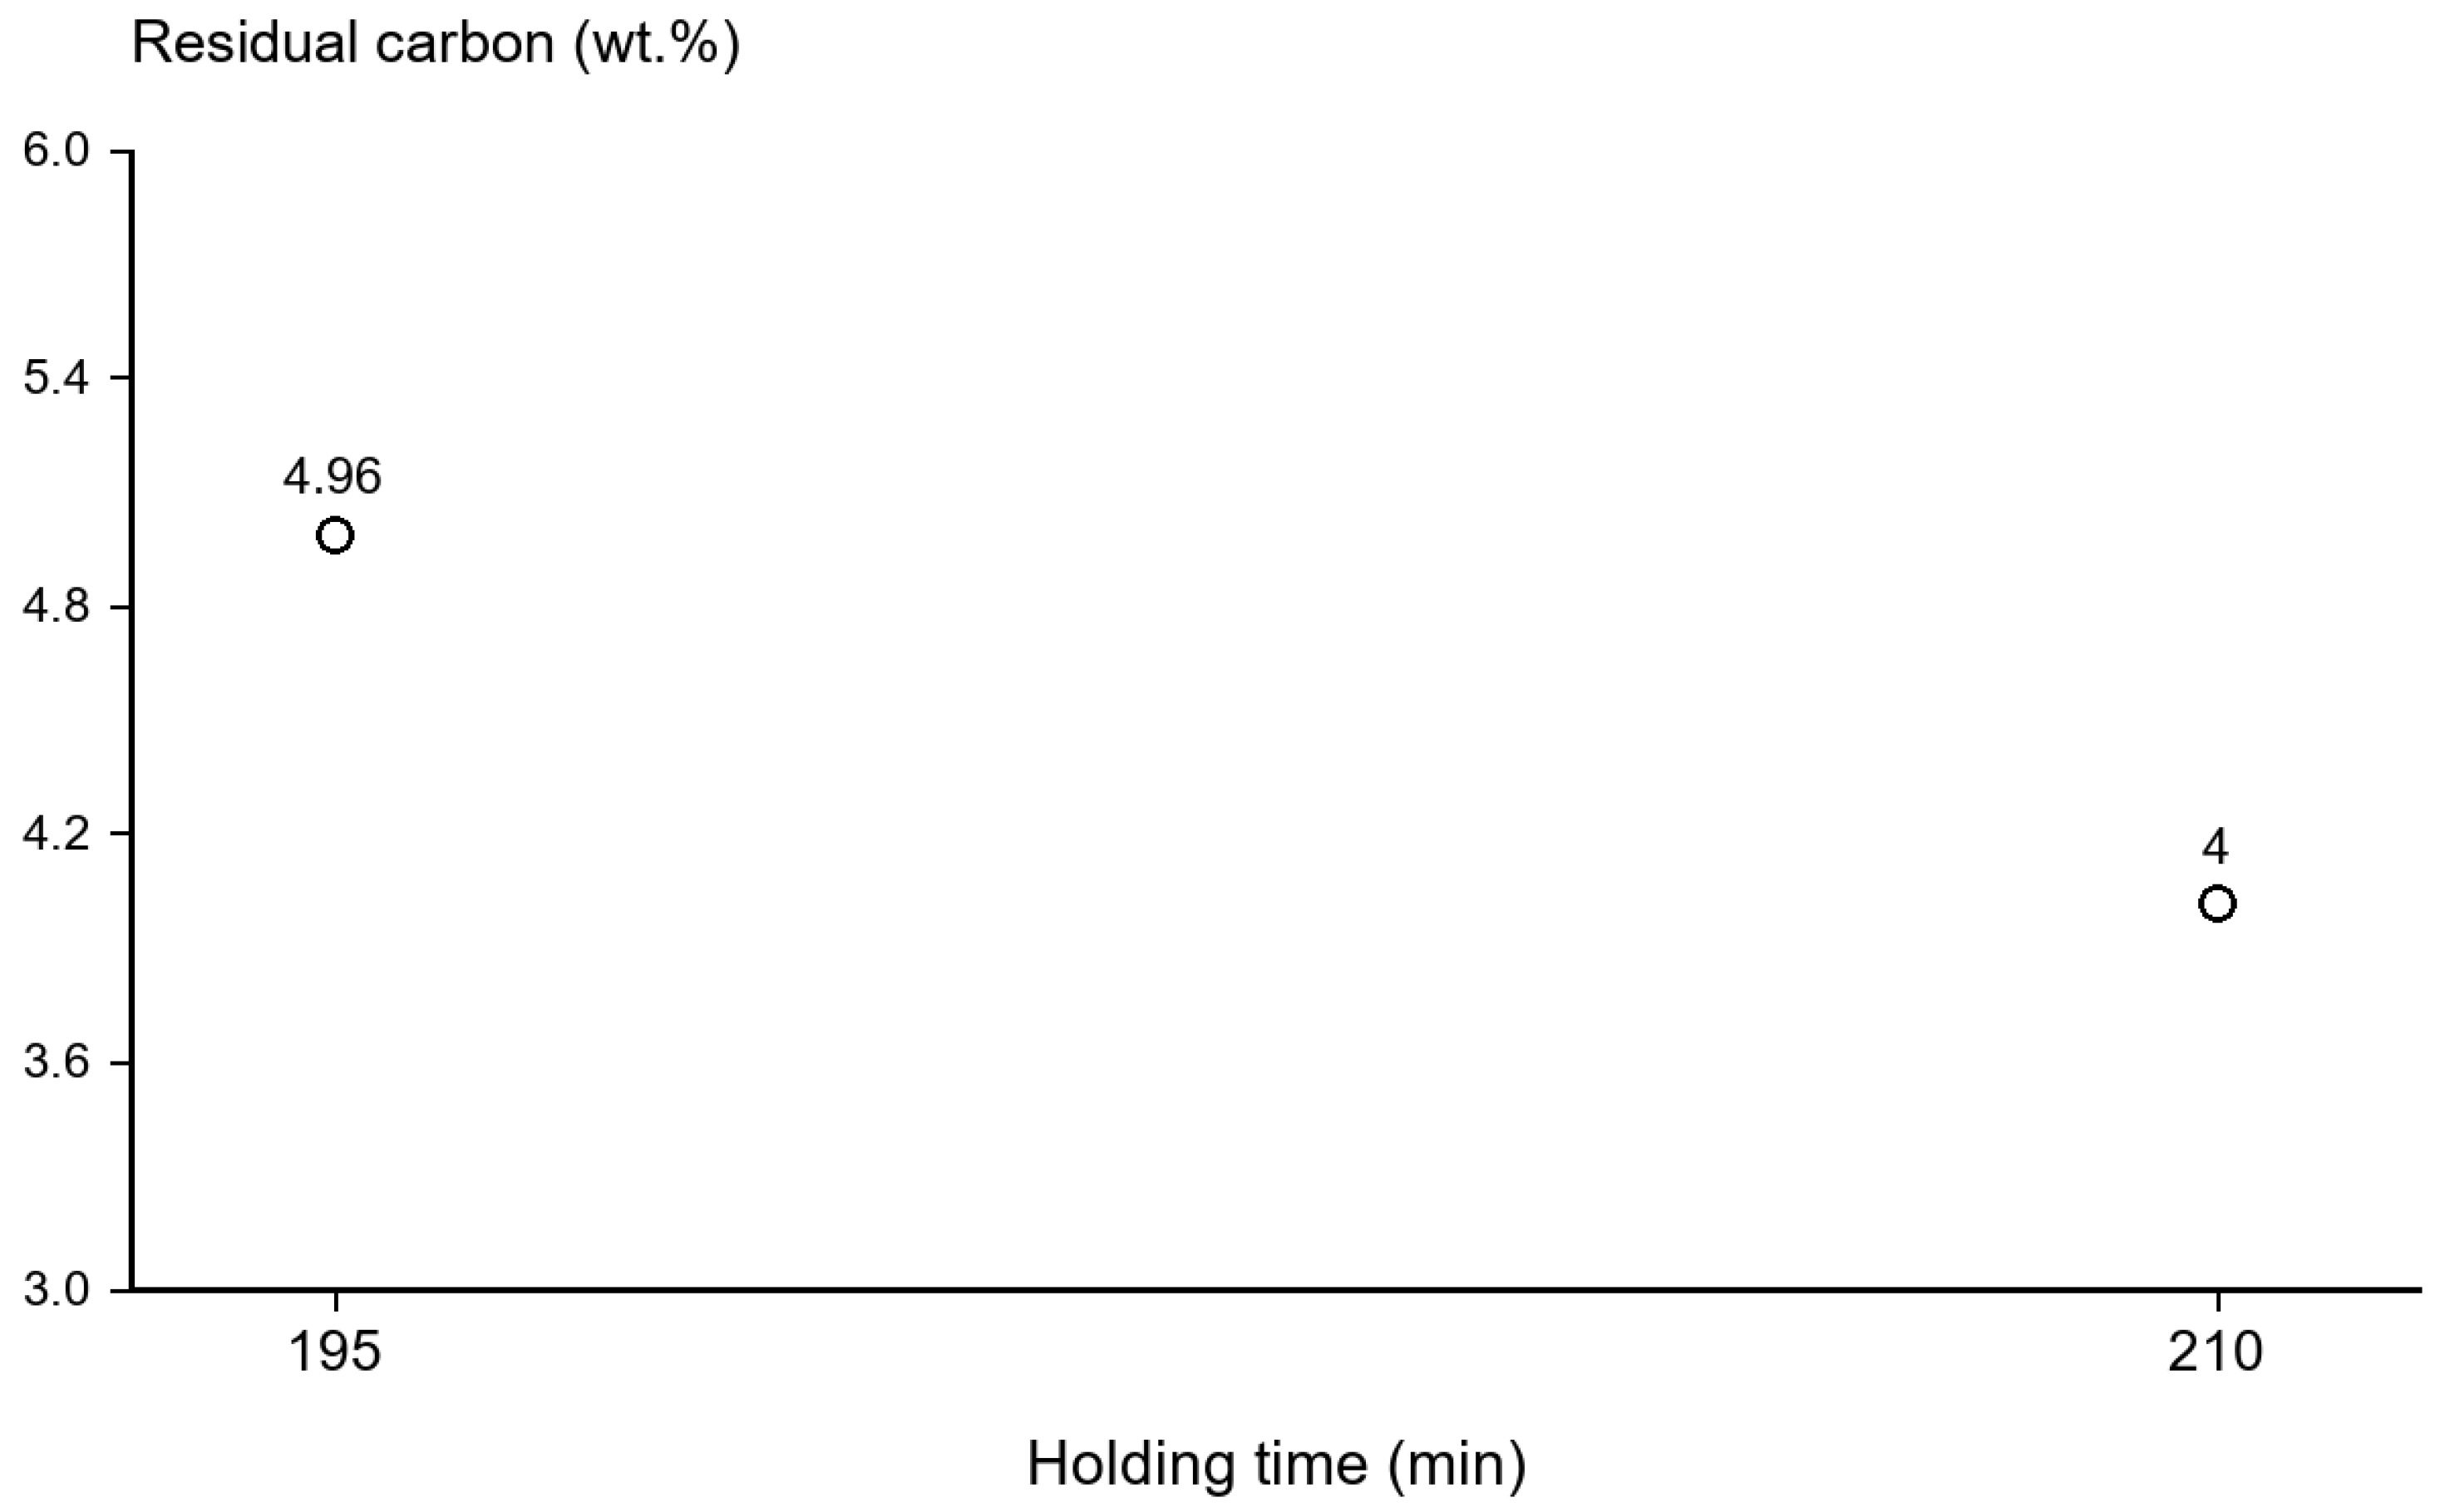
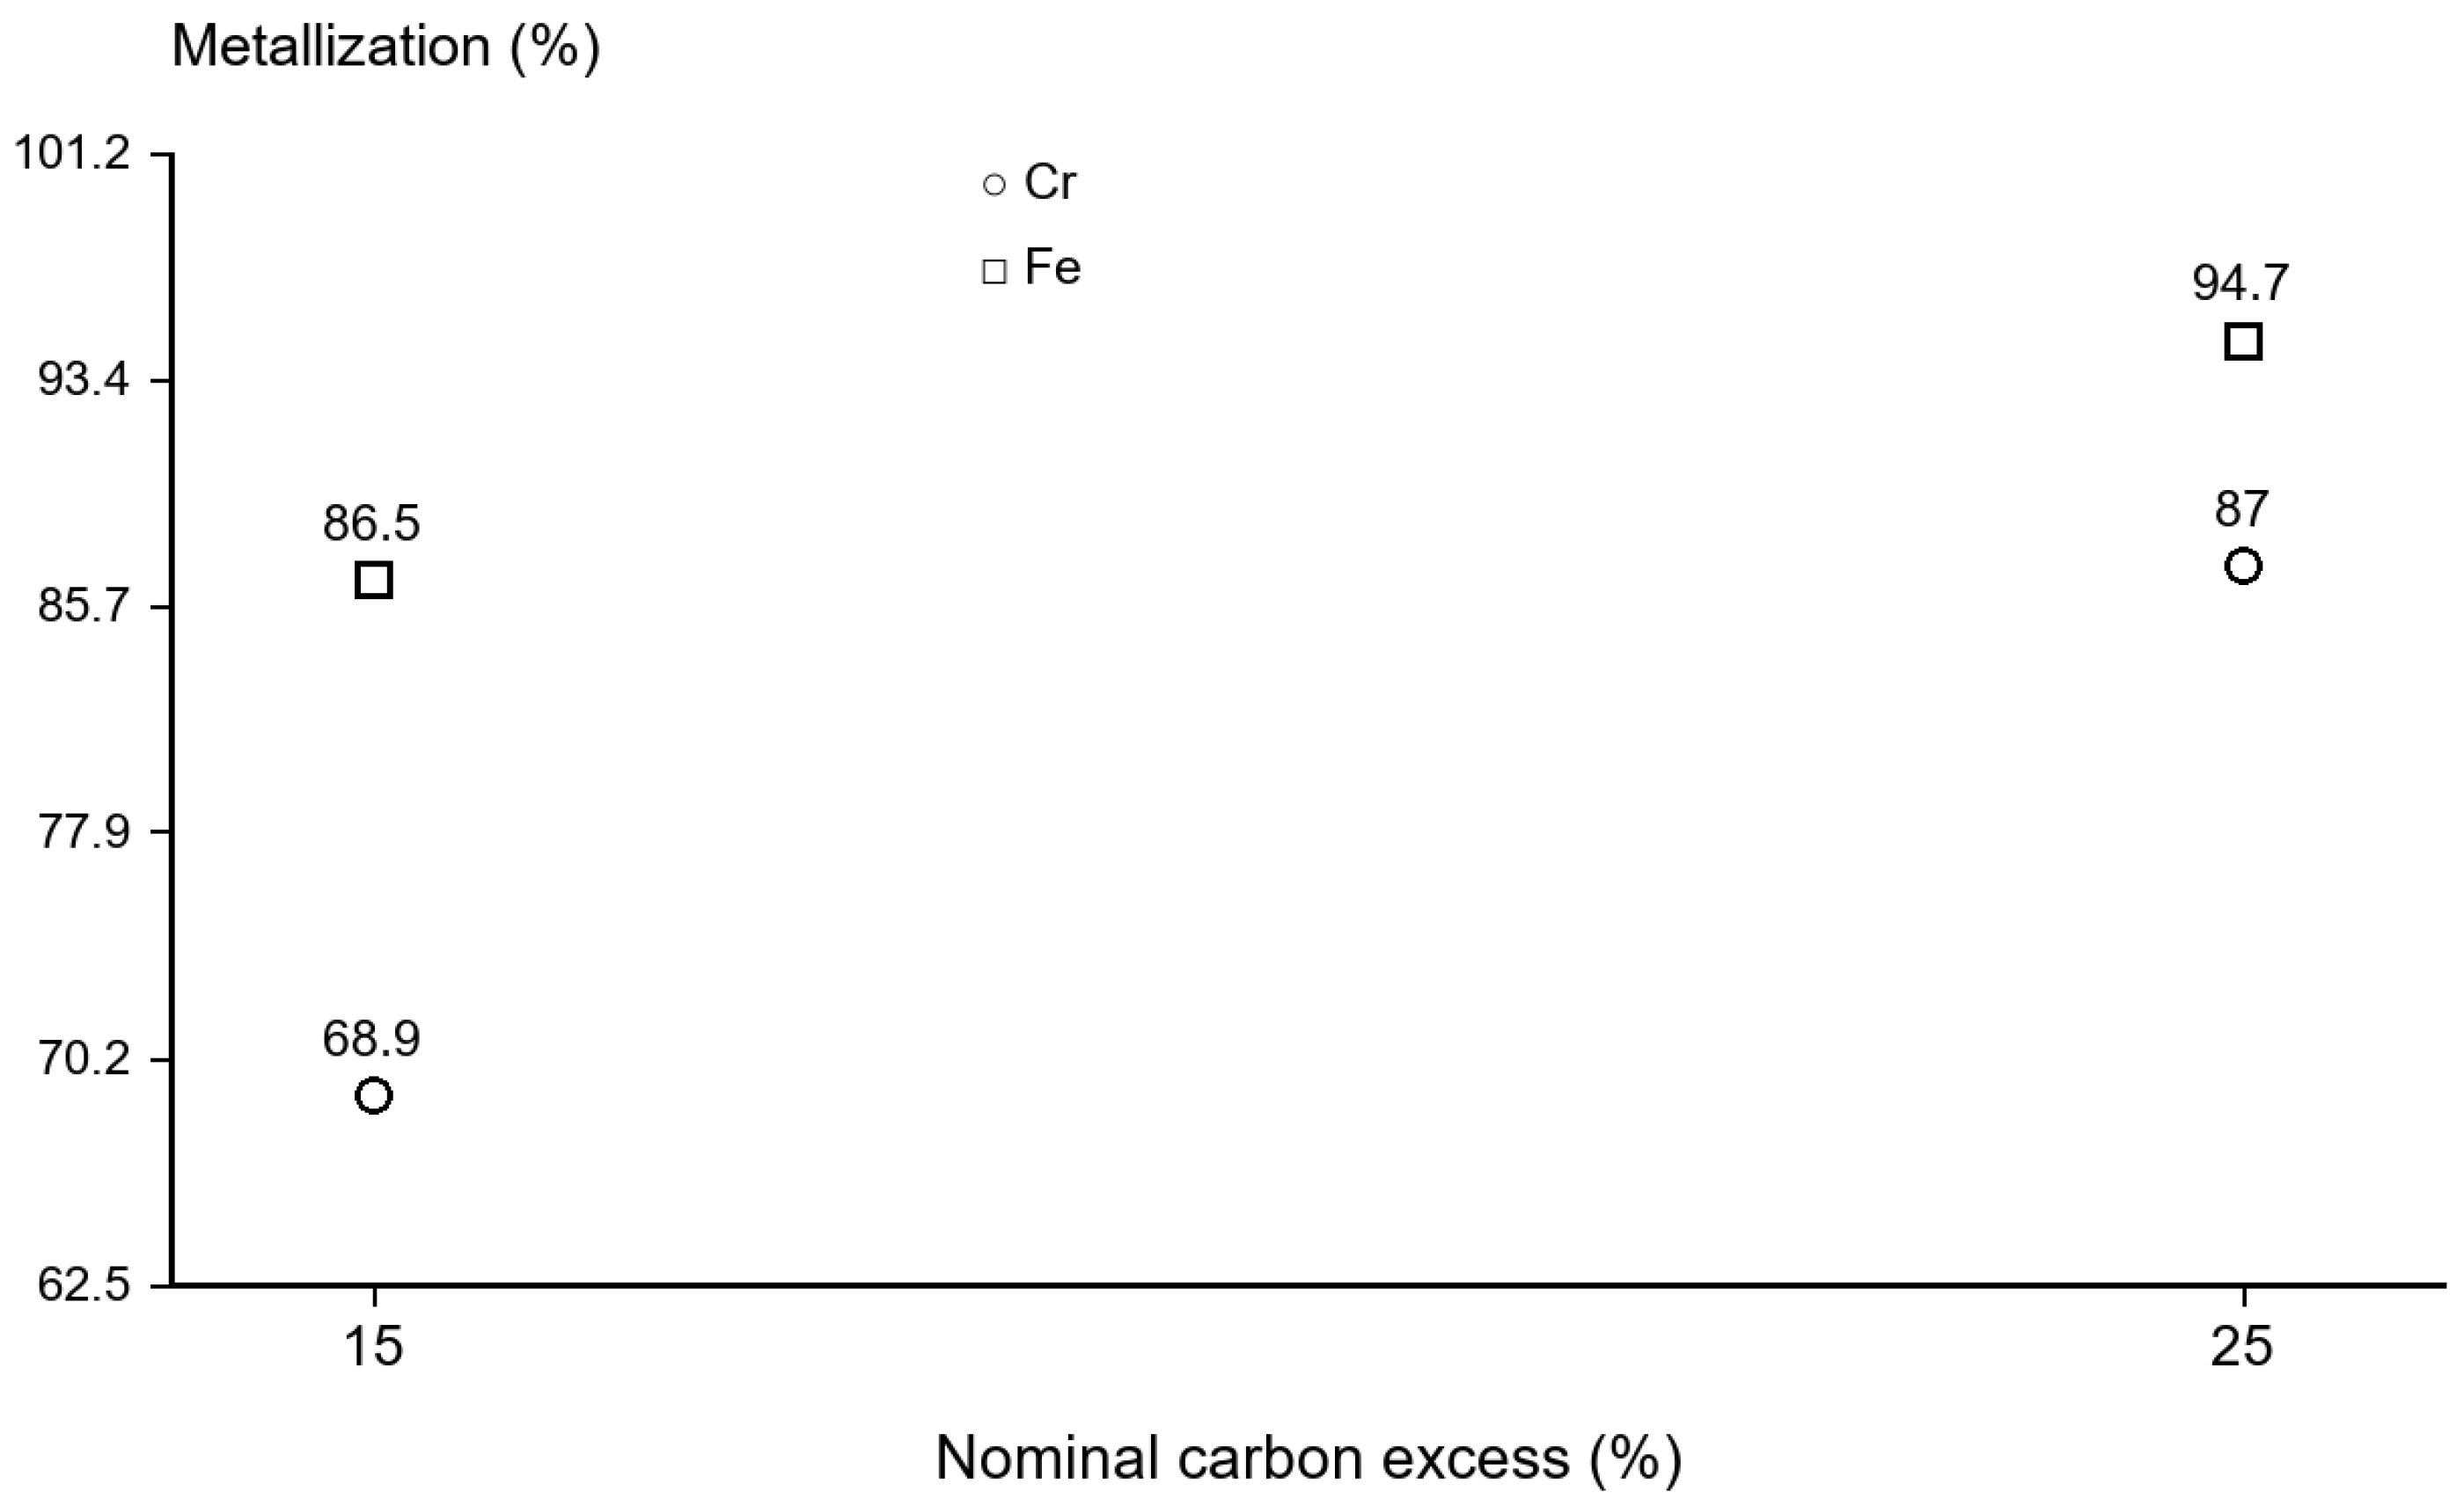
Increasing nominal carbon excess from 15% to 25% was accompanied by an increase in chromium metallization from 68.9% to 87.0% and iron metallization from 86.5% to 94.7% (Figure 8). These changes are consistent with a response to reductant addition under this baseline. However, gas composition, off-gas evolution, reaction rates, and product mass changes were not measured; therefore, the data do not establish a carbon utilization efficiency or a gas phase mechanism.
Figure 8.
Reported Cr and Fe metallization versus nominal carbon excess. Markers show available endpoints; replicate counts and uncertainty are unavailable.
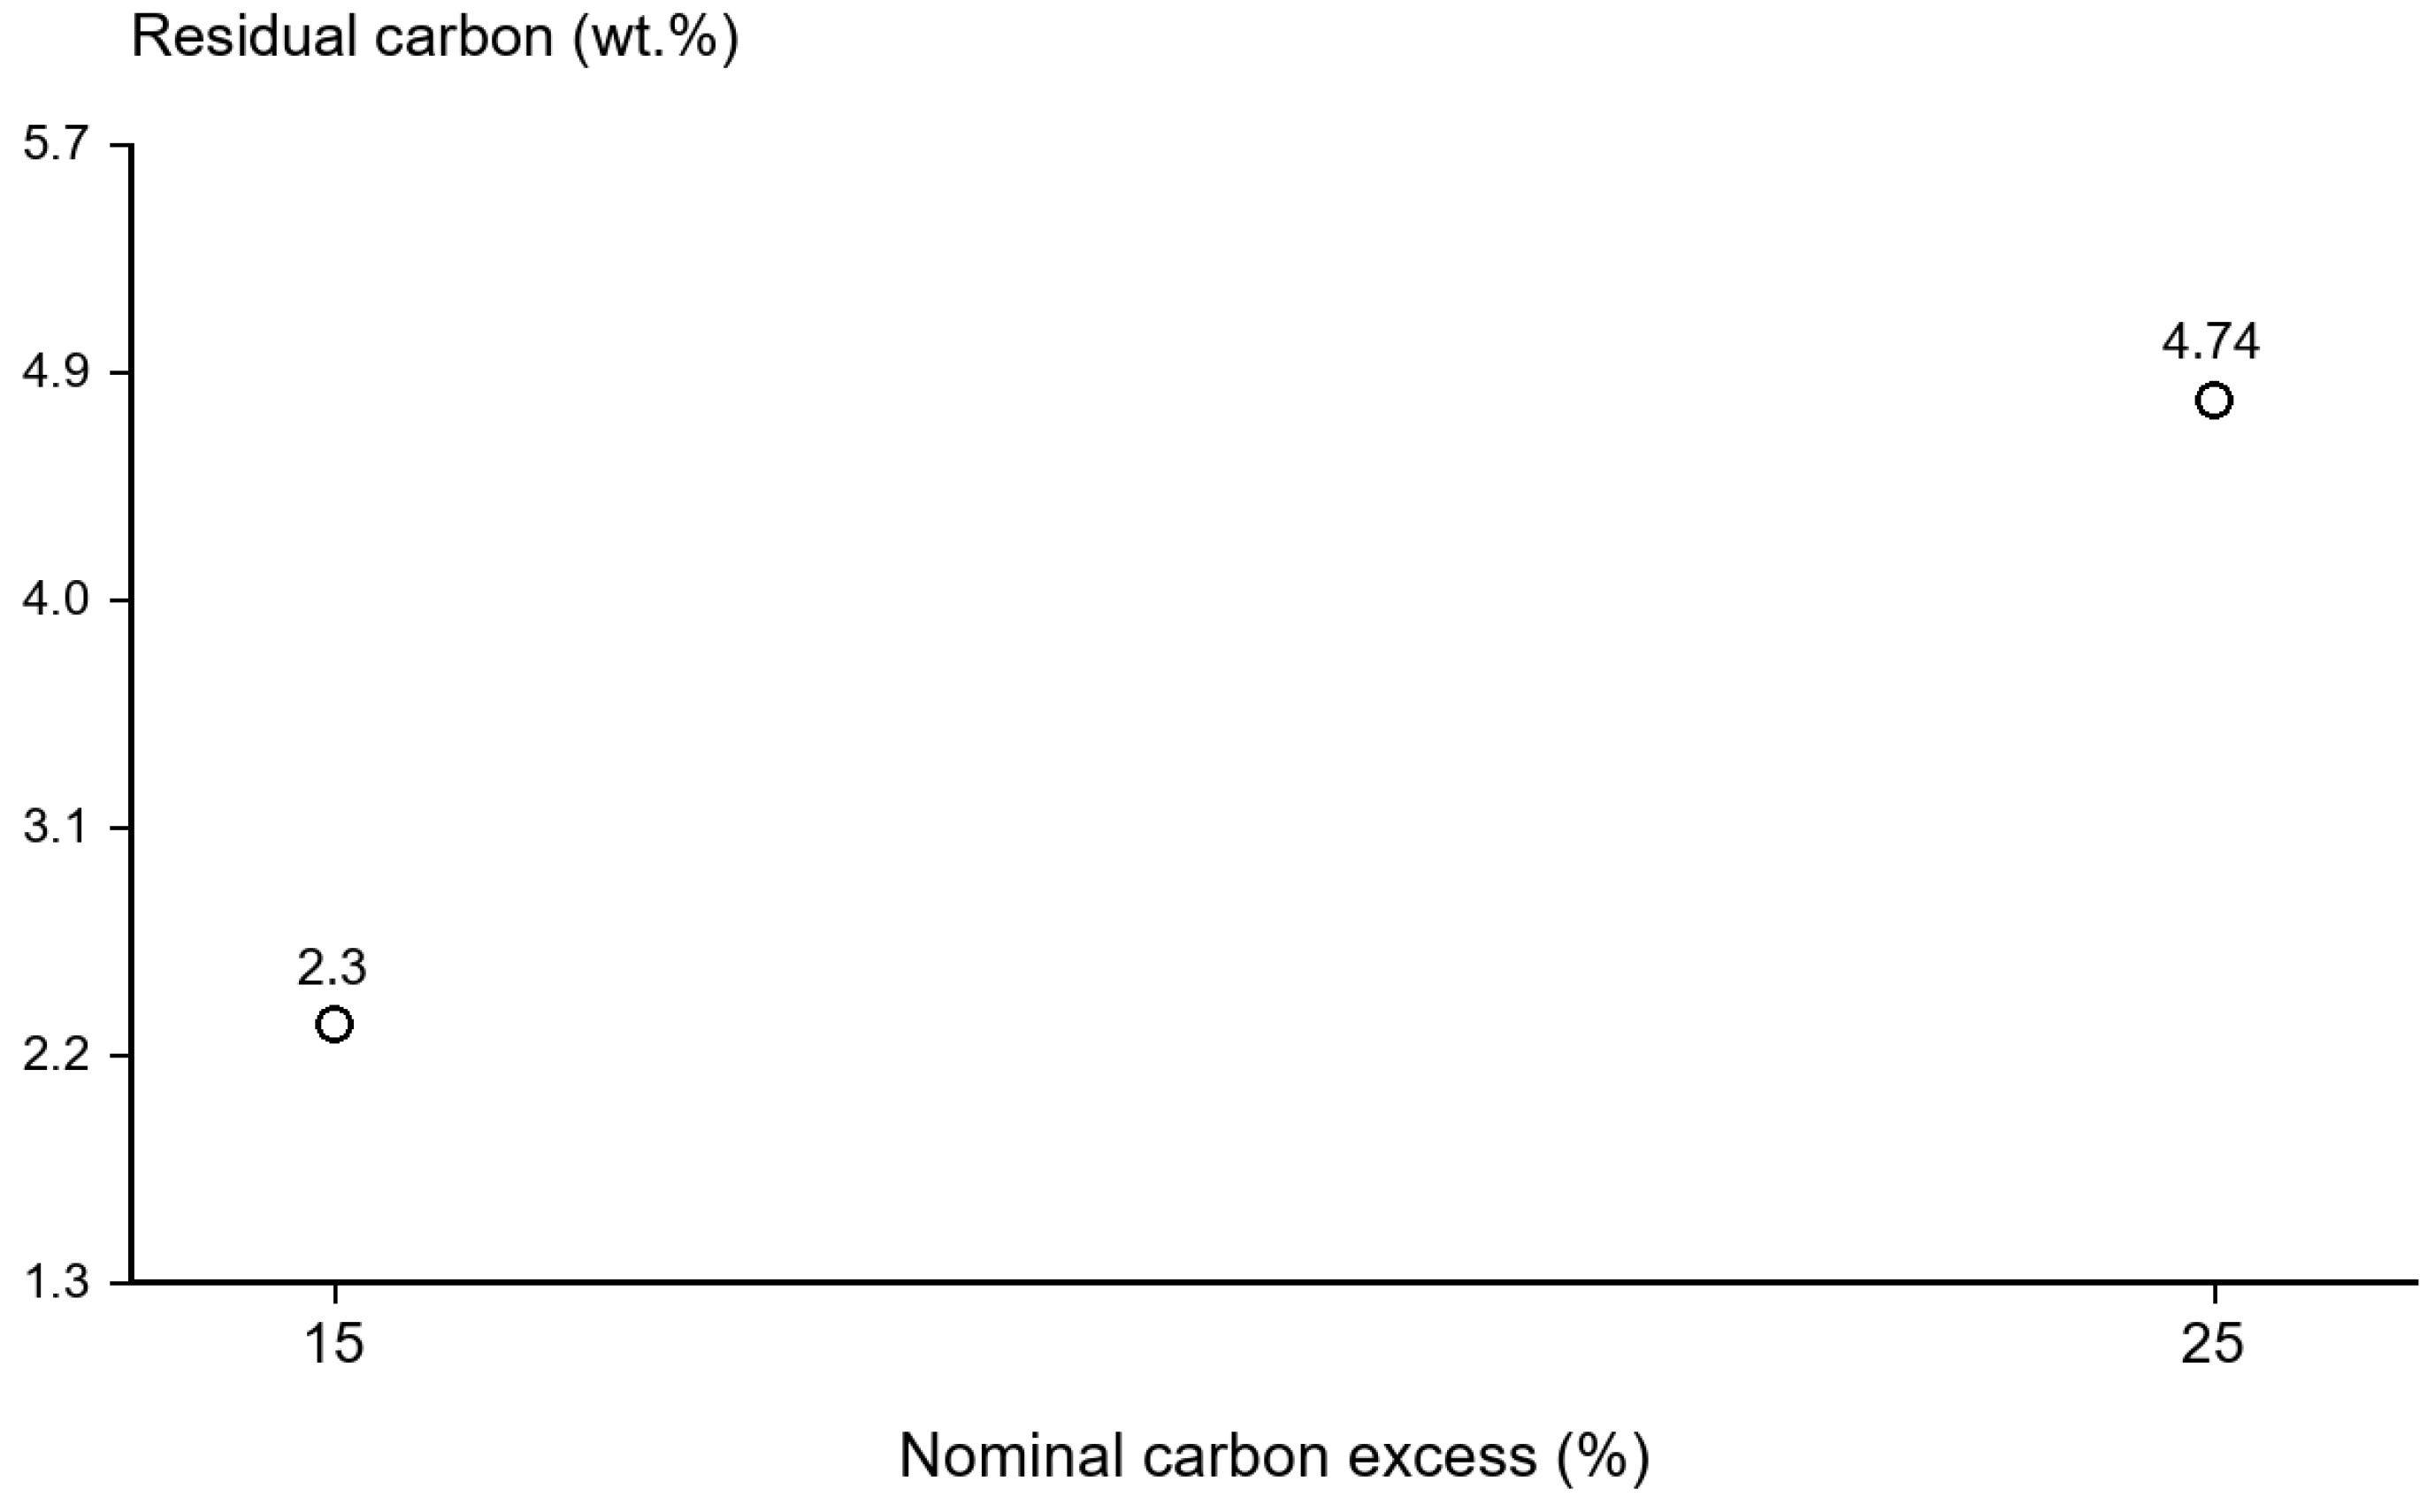
Residual carbon increased from 2.30 to 4.74 wt.% (Figure 9). This concentration change does not constitute a carbon balance because carbon consumption, gasification, volatile release, oxidation, and product mass changes were not quantified.
Figure 9.
Reported residual carbon versus nominal carbon excess. Markers show endpoint values; replicate uncertainty is unavailable.
The higher chromium endpoint at greater carbon addition is qualitatively consistent with the importance of reductant characteristics reported in previous work [4]. It does not establish the gas phase mechanism or the optimum amount of reductant.
The highest chromium metallization reported in this series was 87.0% at 25% nominal carbon excess. A practical carbon regime cannot be selected from these endpoints alone because carbon consumption, uncertainty, downstream requirements, and industrial validation were not quantified.
The carbon excess series provides two condition-specific endpoints. It cannot quantify interaction with temperature or holding time because those factors were not crossed within a common experimental design.
3.6. Microstructure and Elemental Distribution
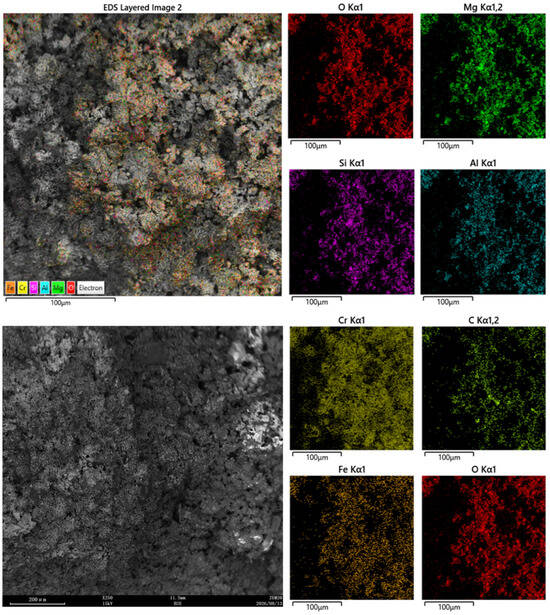
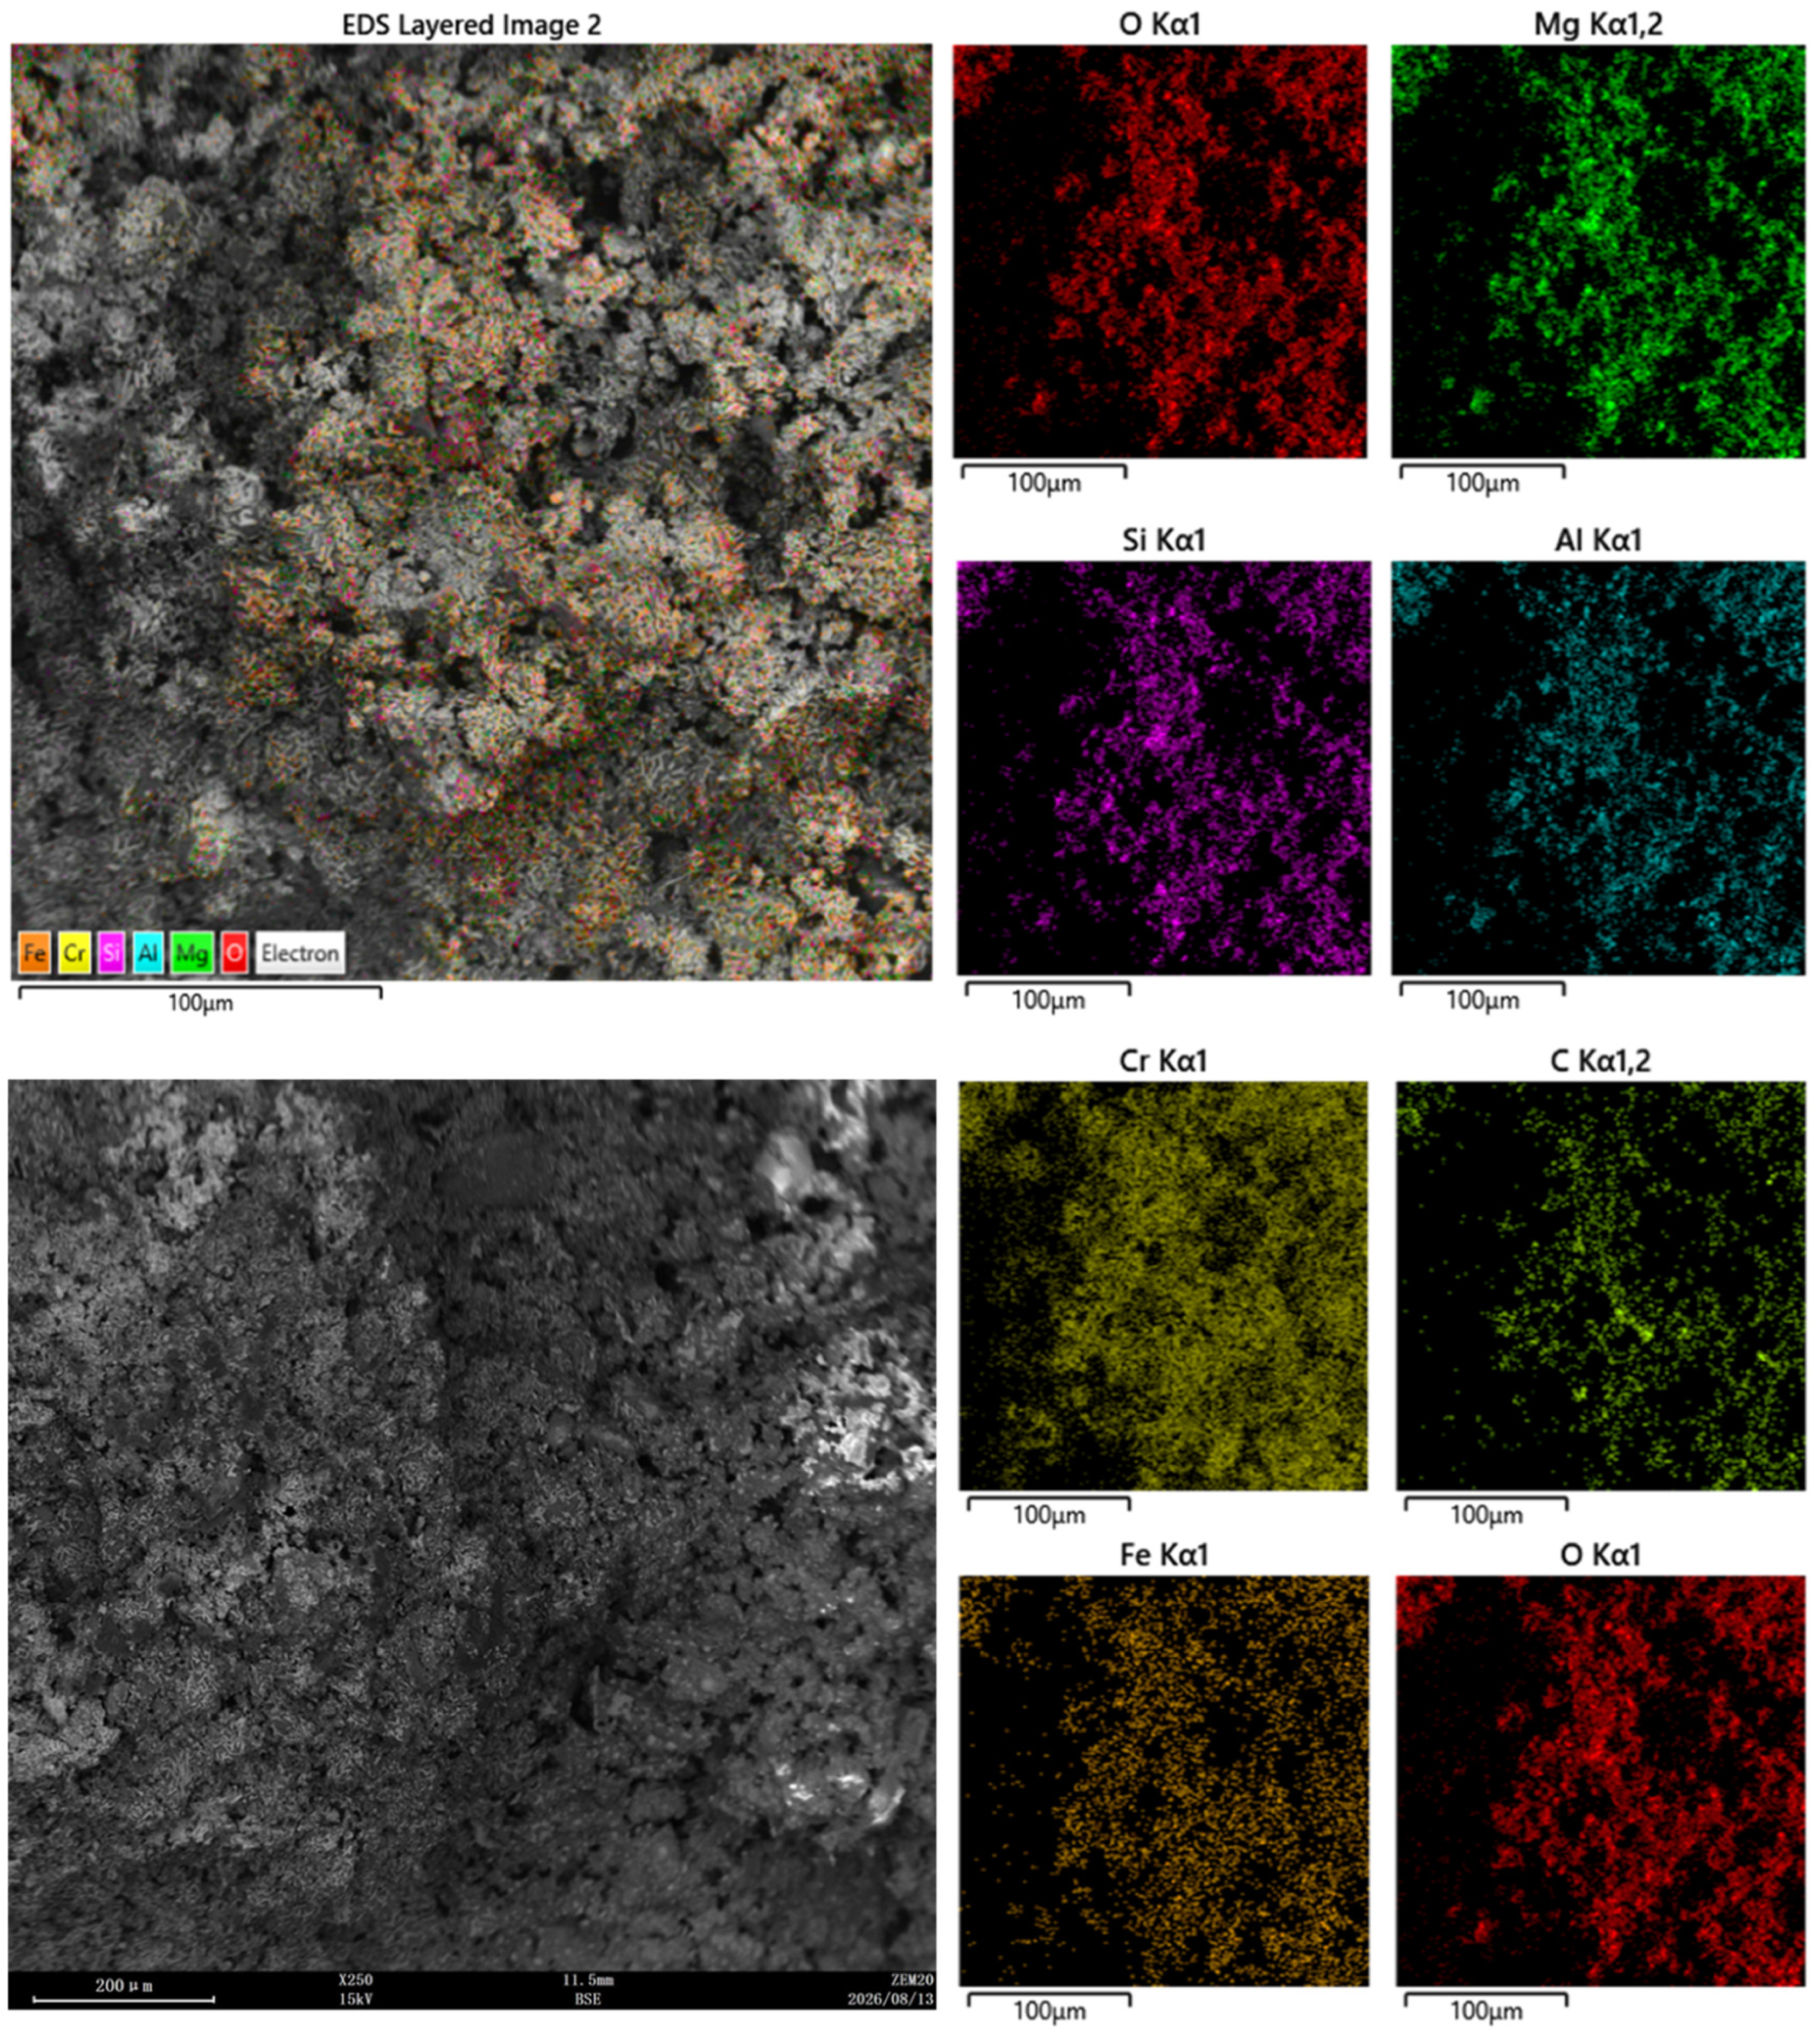
SEM–EDS analysis was performed on a reduced pellet specimen obtained at 1500 °C for 180 min using activated bentonite and 25% nominal carbon excess. This condition corresponded to the highest reported chromium metallization in the analyzed dataset. A fragment of the cooled reduced pellet was mounted in epoxy resin, polished, and carbon-coated before SEM–EDS examination. The two fields shown in Figure 10 were taken from different areas of the same mounted specimen. They are used only to illustrate local elemental heterogeneity and are not treated as replicate measurements or as representative bulk composition.
Figure 10.
SEM–EDS images and elemental maps of a reduced pellet specimen obtained at 1500 °C for 180 min using activated bentonite and 25% nominal carbon excess. The two fields were taken from different areas of the same mounted specimen and are used only for qualitative elemental-distribution assessment. They are not used for quantitative phase identification, oxidation-state determination, or bulk metallization assessment.
Figure 10 presents two SEM–EDS fields with different displayed elemental maps. They show spatially heterogeneous elemental distributions. Co-location of Cr and Fe is not sufficient to distinguish alloy from oxides or carbides; a carbon signal near these elements does not identify Fe3C or M7C3.
O-, Mg-, Si-, and Al-bearing regions are compatible with an oxide-rich component. However, elemental maps alone do not quantify phase fractions or determine the oxidation state of Cr and Fe. Carbon map interpretation was treated with caution because carbon signals can be affected by specimen preparation and possible contamination. Therefore, the SEM–EDS maps were not used to identify carbides or to quantify phase fractions.
Without independent phase identification, these observations cannot confirm spinel decomposition, Fe–Cr alloy formation, or specific carbides. They also do not identify a rate-controlling mechanism. X-ray diffraction with appropriate phase analysis would be needed to test the proposed phase assignments.
The micrographs therefore provide qualitative evidence of elemental heterogeneity and cannot validate a temporal reduction sequence.
3.7. Scope and Limitations of the Combined Discussion
The three series demonstrate changes in reported endpoints only within their respective baselines. The temperature series was conducted at 180 min with activated bentonite and 25% nominal carbon excess; the holding time series was conducted at 1400 °C with attapulgite and 10% nominal carbon excess; and the carbon excess series was conducted at 1500 °C and 180 min with activated bentonite. Because these baselines differ, the present design does not isolate cross-factor interactions and does not allow direct comparison of the absolute effect size of temperature, holding time, and carbon excess.
For descriptive purposes, the observed chromium metallization changes were +28.5 percentage points over the temperature interval, +12.2 percentage points over the holding time interval, and +18.1 percentage points over the carbon excess interval. These values quantify only within-series endpoint changes. Because the intervals and baselines are different, they are not used to rank factor importance or to claim a combined influence.
Independent replication, documented analytical selectivity, documented specimen allocation by geometry, and a factorial design would be required for quantitative optimization. Equilibrium calculations provide thermodynamic context, while the present endpoint data do not establish kinetics. Because pellet geometry was not systematically assigned to the reported endpoint measurements, pellet-size effects are not evaluated in this study.
A detailed mechanistic sequence cannot be validated by these endpoint measurements.
Potential application to ferrochrome production requires smelting trials, chromium-recovery measurements, energy balances, and assessment of continuous-kiln behavior. None of these industrial outcomes are demonstrated by the present laboratory endpoints.
4. Conclusions
The following conclusions are limited to the reported experimental endpoints and qualitative equilibrium interpretation.
- The equilibrium plots predict temperature-dependent carbide stability and nonzero liquid alloy near 1500 °C. They do not establish reaction rates, an experimentally verified phase sequence, or an entirely solid-state process over the full interval.
- At 180 min with activated bentonite and 25% nominal carbon excess, reported chromium metallization increased from 58.5% at 1350 °C to 87.0% at 1500 °C. Iron endpoints were 85.1%, 95.4%, and 94.7% at 1350, 1450, and 1500 °C, respectively. No uncertainty-based distinction between the last two values is available.
- At 1400 °C with attapulgite and 10% nominal carbon excess, extending holding time from 195 to 210 min increased reported chromium metallization from 70.6% to 82.8% and decreased residual carbon from 4.96 to 4.00 wt.%. The two endpoints do not establish diffusion control.
- At 1500 °C and 180 min with activated bentonite, increasing nominal carbon excess from 15% to 25% increased chromium metallization from 68.9% to 87.0% and residual carbon from 2.30 to 4.74 wt.%.
- The differing experimental baselines prevent direct ranking of the effects of temperature, holding time, and carbon excess and do not allow quantification of their interactions. The reported changes should therefore be interpreted as condition-specific endpoint observations within each series.
- The results do not establish an optimum operating regime. Complete experimental documentation, including specimen allocation by geometry, independent replication, and targeted phase and kinetic measurements, is required for stronger conclusions. Pellet-size effects were not evaluated in the present dataset.
- Industrial applicability remains a subject for future validation through smelting, recovery, energy, and continuous-process studies.
This research was conducted within the framework of grant BR24993020 of the Science Committee of the Ministry of Science and Higher Education of the Republic of Kazakhstan, “Development and implementation of a technology for producing complex-alloyed steels with a homogeneous structure through the synergy of effects on the melt.”
Author Contributions
Conceptualization, A.I. and Y.M.; Methodology, A.A., A.M. and Y.M.; Software, S.S. and D.A.; Validation, S.S., D.A. and Y.M.; Formal analysis, A.A., A.M. and Y.M.; Investigation, A.A., D.A., A.M. and Y.M.; Resources, A.I., S.S. and Y.M.; Data curation, A.A., D.A. and A.M.; Writing—original draft, A.A. and A.M.; Writing—review & editing, A.I., S.S., D.I. and Y.M.; Visualization, A.A., D.A. and D.I.; Supervision, A.I., D.A. and Y.M.; Project administration, A.I., S.S. and Y.M.; Funding acquisition, A.I. and S.S. All authors have read and agreed to the published version of the manuscript.
Funding
This research was funded by Ministry of Science and Higher Education of the Republic of Kazakhstan grant number BR24993020.
Data Availability Statement
The original contributions presented in this study are included in the article. Further inquiries can be directed to the corresponding authors.
Conflicts of Interest
The authors declare no conflict of interest.
References
- Naiker, O. The Development and Advantages of Xstrata’s Premus Process. In Proceedings of the 11th International Ferroalloys Congress, INFACON XI, New Delhi, India, 18–21 February 2007. [Google Scholar]
- Kleynhans, E.L.J.; Beukes, J.P.; van Zyl, P.G.; Kestens, P.H.I.; Langa, J.M. Unique challenges of clay binders in a pelletised chromite pre-reduction process. Miner. Eng. 2012, 34, 55–62. [Google Scholar] [CrossRef] [Scilit]
- Beukes, J.P.; van Zyl, P.G.; Neizel, B.W. The effects of CaCO3 addition and clay binder selection on pelletised chromite pre-reduction. In Proceedings of the INFACON XIII, Almaty, Kazakhstan, 9–12 June 2013. [Google Scholar]
- Kleynhans, E.L.J.; Beukes, J.P.; van Zyl, P.G.; Bunt, J.R.; Nkosi, N.S.B.; Venter, M. The effect of carbonaceous reductant selection on chromite pre-reduction. Metall. Mater. Trans. B 2017, 48, 827–840. [Google Scholar] [CrossRef] [Scilit]
- Kleynhans, E.L.J.; Beukes, J.P.; van Zyl, P.G.; Fick, J.I.J. Techno-economic feasibility of a pre-oxidation process to enhance prereduction of chromite. J. South. Afr. Inst. Min. Metall. 2017, 117, 457–468. [Google Scholar] [CrossRef] [Scilit]
- Kleynhans, E.L.J.; Neizel, B.W.; Beukes, J.P.; van Zyl, P.G. Utilisation of pre-oxidised ore in the pelletised chromite pre-reduction process. Miner. Eng. 2016, 92, 114–124. [Google Scholar] [CrossRef] [Scilit]
- van Staden, Y.; Beukes, J.P.; van Zyl, P.G.; Ringdalen, E.; Tangstad, M.; Kleynhans, E.L.J.; Bunt, J.R. Damring formation during rotary kiln chromite pre-reduction: Effects of pulverized carbonaceous fuel selection and partial pellet melting. Metall. Mater. Trans. B 2018, 49, 2721–2738. [Google Scholar] [CrossRef] [Scilit]
- Wu, S.; Zhang, Y.; Li, H.; Zhang, S.; Kasai, E.; Wang, C. Hydrogen-based pre-reduction of chromite: Reduction and consolidation mechanisms. Int. J. Hydrogen Energy 2024, 50, 397–410. [Google Scholar] [CrossRef] [Scilit]
- Wu, S.; Feng, X.; Zhang, Y.; Ma, L.; Li, Y. Methane–Hydrogen-Based Pre-reduction Chromite: Reduction Behavior and Pellet Compressive Strength. JOM 2024, 76, 4858–4872. [Google Scholar] [CrossRef] [Scilit]
- Ma, L.; Zhang, Y.; Wu, S.; Li, Y.; Zhu, K.; Li, H. Research on pre-reduction behavior of chromite pellets in CH4–H2 atmosphere: Reduction mechanisms and energy consumption assessments. Int. J. Hydrogen Energy 2025, 191, 152245. [Google Scholar] [CrossRef] [Scilit]
- Ye, L.; Peng, Z.; Tian, R.; Tang, H.; Anzulevich, A.; Rao, M.; Li, G. Efficient pre-reduction of chromite ore with biochar under microwave irradiation. Sustain. Mater. Technol. 2023, 37, e00644. [Google Scholar] [CrossRef] [Scilit]
- Mohale, G.T.M.; Beukes, J.P.; Kleynhans, E.L.J.; van Zyl, P.G.; Bunt, J.R.; Tiedt, L.R.; Venter, A.D.; Jordaan, A. SEM image processing as an alternative method to determine chromite pre-reduction. J. South. Afr. Inst. Min. Metall. 2017, 117, 1045–1052. [Google Scholar] [CrossRef] [Scilit]
- Ringdalen, E.; Tangstad, M.; Safarian, J. Determination of metallization degree of pre-reduced chromite with image and Rietveld analysis. Metalurgija 2016, 55, 397–400. [Google Scholar]

Disclaimer/Publisher’s Note: The statements, opinions and data contained in all publications are solely those of the individual author(s) and contributor(s) and not of MDPI and/or the editor(s). MDPI and/or the editor(s) disclaim responsibility for any injury to people or property resulting from any ideas, methods, instructions or products referred to in the content. |
© 2026 by the authors. Licensee MDPI, Basel, Switzerland. This article is an open access article distributed under the terms and conditions of the Creative Commons Attribution (CC BY) license.